POLISH INFORMATION AND FOREIGN INVESTMENT AGENCY Iwona Chojnowska Director Foreign Investment Department Warsaw, February 7, 2013 Doing Business in Poland

Welcome message from author
This document is posted to help you gain knowledge. Please leave a comment to let me know what you think about it! Share it to your friends and learn new things together.
Transcript

POLISH INFORMATION
AND FOREIGN INVESTMENT AGENCY
Iwona Chojnowska
Director
Foreign Investment Department
Warsaw, February 7, 2013
Doing Business in Poland

Poland - Key Facts
Area: 312 700 sq km – 6th in European Union
Population: 38.5 million – 6th in European Union
Currency: Polish Zloty (1 USD ~ 3.1 PLN, 1 EUR ~ 4.2 PLN)
GDP: USD 771.015 billion (PPP, 2011) – IMF data
USD 801,974 billion (PPP, 2012) – IMF estimates
GDP per capita: USD 20,183 (PPP, 2011) – IMF data
USD 20,976 (PPP, 2012) – IMF estimates
GDP growth: 1.6% (2009), 3.9% (2010), 4.3% (2011), 2.0% (2012),
1.8% (2013, EC forecast), 2.6% (2014, EC forecast)
Membership: EU, NATO, OECD, WTO, Schengen Zone
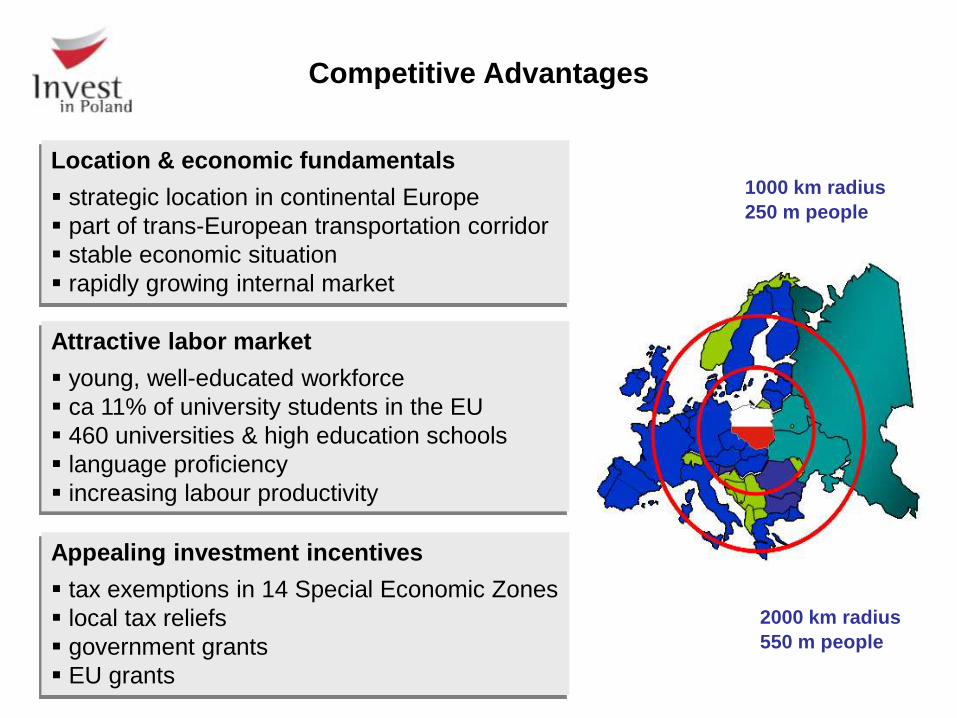
Competitive Advantages
Location & economic fundamentals
strategic location in continental Europe
part of trans-European transportation corridor
stable economic situation
rapidly growing internal market
Appealing investment incentives
tax exemptions in 14 Special Economic Zones
local tax reliefs
government grants
EU grants
Attractive labor market
young, well-educated workforce
ca 11% of university students in the EU
460 universities & high education schools
language proficiency
increasing labour productivity
1000 km radius
250 m people
2000 km radius
550 m people
ES 0,4%
PT
-1,6%
FR 1,7%
BE 1,8%
NL 1,0%
DE 3,0%
EE 8,3%
LV 5,5%
LT 5,9%
IT
0,4%
TR
8,5%
HU 1,6% AT 2,7% RO 2,2%
SK 3,2%
FI 2,8% SE
3,7%
UK
0,9%
GR
-7,1%
DK
1,1%
BG 1,7%
IR
1,4%
CZ 1,9%
NO
1,2%
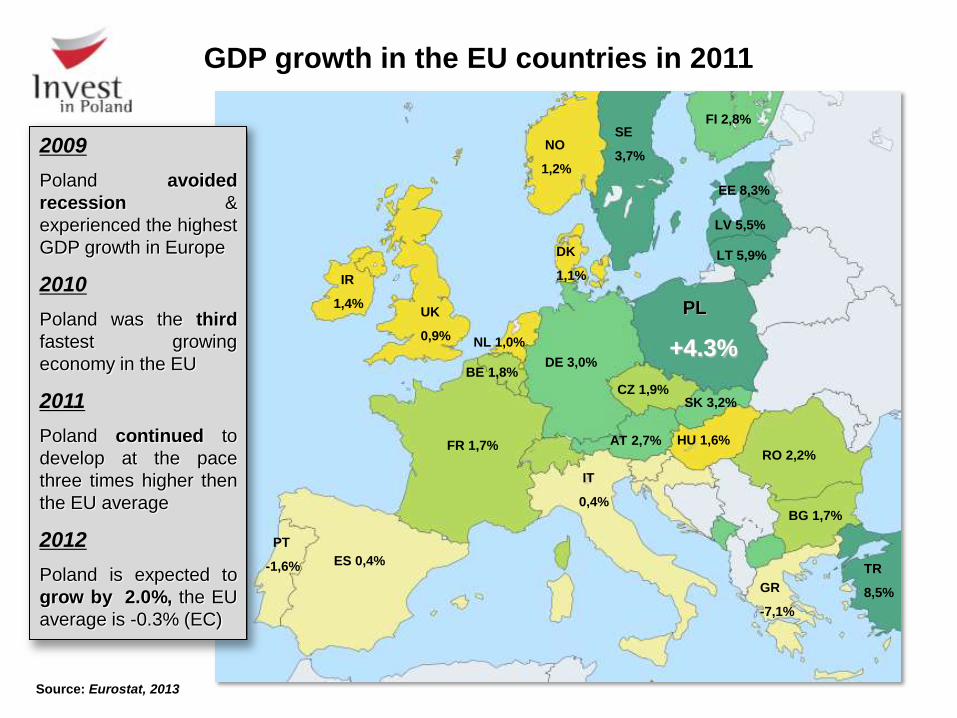
PL
+4.3%
Source: Eurostat, 2013
2009
Poland avoided
recession &
experienced the highest
GDP growth in Europe
2010
Poland was the third
fastest growing
economy in the EU
2011
Poland continued to
develop at the pace
three times higher then
the EU average
2012
Poland is expected to
grow by 2.0%, the EU
average is -0.3% (EC)
GDP growth in the EU countries in 2011

European Commission Economic Forecast
Autumn 2012
Source: European Commission, November 2012.
Real GDP growth (%)
2012 2013 2014
EU27 -0.3 0.4 1.6
Eurozone -0.4 0.1 1.4
Germany 0.8 0.8 2.0
Poland 2.4 1.8 2.6
Czech Republic -1.3 0.8 2.0
Slovak Republic 2.6 2.0 3.0
Hungary -1.2 0.3 1.3
Bulgaria 0.8 1.4 2.0
Romania 0.8 2.2 2.7
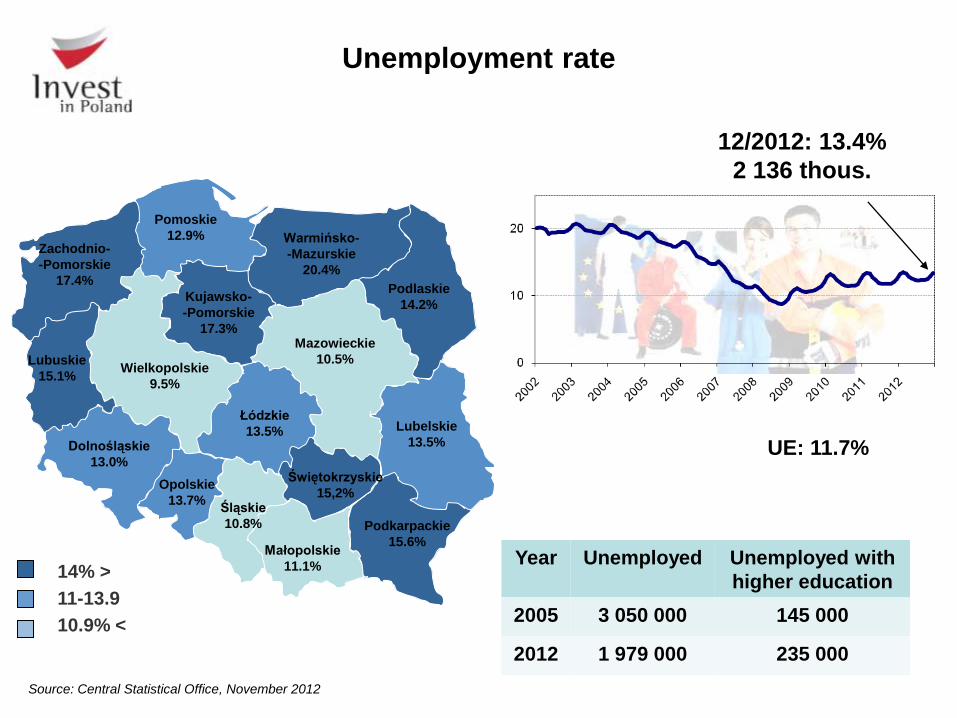
Unemployment rate
Mazowieckie
10.5%
Podlaskie
14.2%
Lubelskie
13.5%
Podkarpackie
15.6% Małopolskie
11.1%
Śląskie
10.8%
Opolskie
13.7%
Dolnośląskie
13.0%
Lubuskie
15.1%
Świętokrzyskie
15,2%
Łódzkie
13.5%
Wielkopolskie
9.5%
Warmińsko-
-Mazurskie
20.4%
Pomoskie
12.9%
Kujawsko-
-Pomorskie
17.3%
Zachodnio-
-Pomorskie
17.4%
14% >
11-13.9
10.9% <
Source: Central Statistical Office, November 2012
12/2012: 13.4%
2 136 thous.
Year Unemployed Unemployed with
higher education
2005 3 050 000 145 000
2012 1 979 000 235 000
UE: 11.7%

• Talent shortage
problem in Poland does
not exist: only 4% of
employers have trouble
filling vacancies
• Poland ranks 1st among
39 countries surveyed
by Manpower
Talent shortage problem by country
Source: Manpower 2011 Talent Shortage Survey

Source: Eurostat, March 2012
* data available only for 2010
Hourly labour costs in the business economy
in 2011 (in EUR)

Source: Eurostat, January 2013
Hourly labour costs growth in Q3 2011 and Q3 2012
(in %, Q-o-Q)
3,9
3,3
1,8
0,3
0,5
2,4
7,1
6,5
5,1
4
6,8
4,4
-2 -1 0 1 2 3 4 5 6 7 8 9 10 11 12
Germany
Ireland
United Kingdom
Slovenia
Czech Republic
Slovakia
Poland
Hungary
Latvia
Lithuania
Romania
Bulgaria
EU
O3 2011
O2 2012
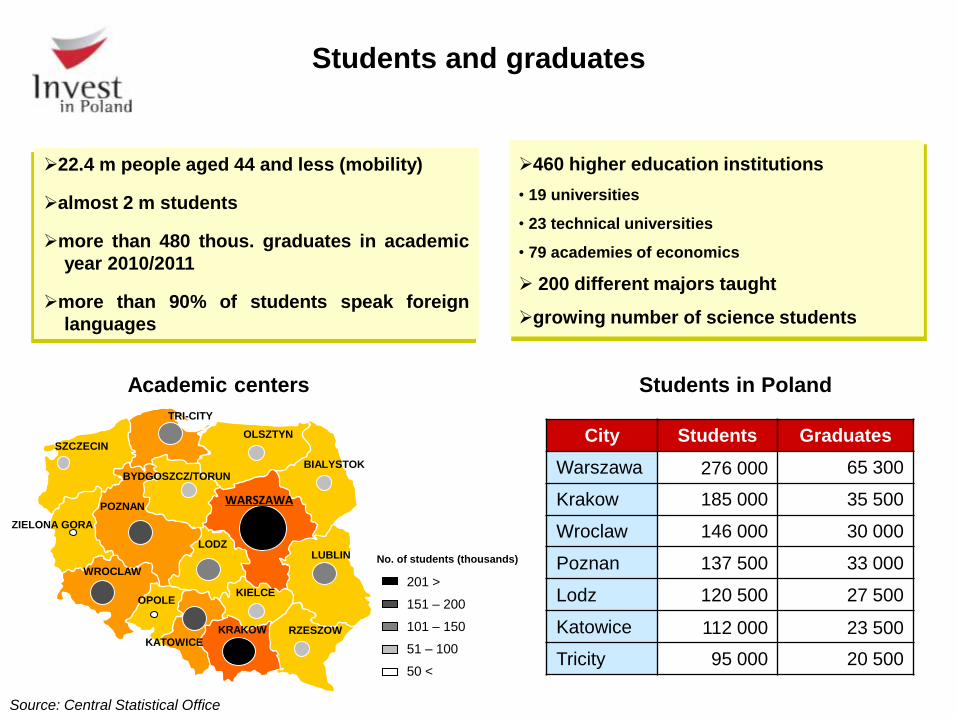
22.4 m people aged 44 and less (mobility)
almost 2 m students
more than 480 thous. graduates in academic
year 2010/2011
more than 90% of students speak foreign
languages
460 higher education institutions
• 19 universities
• 23 technical universities
• 79 academies of economics
200 different majors taught
growing number of science students
Students and graduates
Source: Central Statistical Office
Academic centers
POZNAN
WROCLAW
WARSZAWA
KRAKOW
LODZ
SZCZECIN
TRI-CITY
KATOWICE
BYDGOSZCZ/TORUN BIALYSTOK
OLSZTYN
ZIELONA GORA
OPOLE KIELCE
LUBLIN
RZESZOW
201 >
151 – 200
101 – 150
51 – 100
50 <
No. of students (thousands)
City Students Graduates
Warszawa 276 000 65 300
Krakow 185 000 35 500
Wroclaw 146 000 30 000
Poznan 137 500 33 000
Lodz 120 500 27 500
Katowice 112 000 23 500
Tricity 95 000 20 500
Students in Poland

Number of students in 2010 (in thous.)
20 428
19 847
3 836
2 556
2 479
2 245
2 149
1 980
1 879
1 000
651
455
445
437
389
384
350
287
241
235
USA
EU 27
Japan
Germany
UK
France
Poland
Italy
Spain
Romania
Netherlands
Sweden
Belgium
Czech Rep.
Hungary
Portugal
Austria
Bulgaria
Denmark
SlovakiaSource: Eurostat, November 2012
• 11% of EU students come from Poland
• Italy and Spain, having larger populations than
Poland, educate fewer students

Imagine Cup is a global competition focused on finding IT solutions to real
world issues
In 2012 students from Technical University in Gdansk and Adam Mickiewicz
University in Poznan took the 2nd and 3rd place respectively.
Students and graduates – achievements
Source: www.microsoft.com, www.us.edu.pl
2011: Polish team from University of Silesia is a special winner of Samsung
Application Contest
Every third student doing internship in Microsoft HQs in Redmond (USA)
comes from Poland
The winners of the International Olympiad in Informatics (IOI) belong to the best
young computer scientists in the world
In 2008 Polish team took 1st place ex-aequo with Chinese one. The third place
individually was won by Pole, too
ACN International Collegiate Programming Contest is an annual multi-tiered
competitive programming competition among the universities of the world. The
contest is sponsored by IBM.
2012 held in Poland, Team from University of Warsaw took 2nd place beatting
110 teams

Average annual hours actually worked
(per person in total employment in 2011)
2 250
2 193
2 047
2 032
1 981
1 980
1 937
1 877
1 793
1 787
1 774
1 774
1 728
1690
1 684
1 644
1 625
1 522
1 475
1 413
1 379
Mexico
Korea*
Chile
Greece
Russian Fed.
Hungary
Poland
Turkey
Slovakia
USA
Czech Rep.
Italy
Japan
Spain
Finland
Sweden
UK
Denmark
France
Germany
Netherlands
Source: OECD Employment Outlook 2012
OECD average: 1 775 hrs
Poles are the 7th hardest
working nation in OECD
*data for 2010

Trade union density in OECD countries
in 2011 (in %)
70
68,8
67,7
54,6
52
35,1
35,6
28,1
25,8
24
18,2
19,3
18,5
19
17,5
17,3
17,2
16,8
15,9
15
11,39,7
Finland*
Denmark**
Sweden
Norway*
Belgium**
Italy*
Ireland
Austria*
UK
Greece***
The Netherlands
Portugal*
Germany*
Japan
OECD area
Czech Rep.**
Slovakia***
Hungary***
Spain**
Poland*
USA
Korea*
Source: OECD, Online OECD Employment database, 2013
Poland has one of the lowest trade
union memberships among OECD
countries
* data for 2010
** data for 2009
*** data for 2008

Modernisation of roads and railroads network
Source: GDDKiA, MT
Till 2006
2007-2013
2014 – 2020
New constructions
After 2020
Railroads Highways and expressways:
existing
under construction
planned

Passengers served by Polish airports (in millions)
Source: The Civil Aviation Office, 2012
Air transport
Direct flights to major European cities
London Warsaw, Gdańsk, Wrocław, Kraków, Rzeszów,
Szczecin, Bydgoszcz, Katowice, Poznan, Łódź
Frankfurt Warsaw, Gdańsk, Wrocław, Poznań, Kraków,
Katowice, Rzeszów
Munich Warsaw, Gdańsk, Wrocław, Kraków, Poznań
Paris Warsaw, Katowice, Kraków, Wroclaw, Poznań,
Gdańsk
Dublin Warsaw, Wrocław, Katowice, Kraków, Poznan,
Gdansk, Bydgoszcz, Szczecin, Łódź, Rzeszów
Oslo Warsaw, Katowice, Kraków, Wroclaw, Poznań,
Gdańsk, Szczecin
Milan Warsaw, Katowice, Kraków
Dortmund Warsaw, Katowice, Wroclaw, Kraków, Poznan,
Łódź
Brussels Warsaw, Katowice, Kraków, Wrocław
Location of main Polish airports
European flights
Domestic flights
Overseas flights
WARSZAWA
SZCZECIN
ZIELONA GÓRA
BYDGOSZCZ
ŁÓDŹ
RZESZÓW
WROCŁAW
KATOWICE
KRAKÓW
GDAŃSK
POZNAŃ
Airports under construction Q
Q
Q
Q Q
Q Q
Q
Q
MODLIN
LUBLIN
KILECE

Corporate Income Tax (CIT) rate: 19%
Personal Income Tax (PIT) rate: 18% and
32%
Value added tax (VAT):
• basic rate: 23%
• reduced rates: 8%, 5%
• export rate: 0%
Social Security Tax paid by employer:
between 19.48% and 22.67%
Tax rates

Source: http://www.worldwide-tax.com/
Entrepreneurs in Poland
pay one of the lowest CIT
in Europe
Corporate income tax rates across Europe

FDI stock in Poland
Geographical sources of FDI
Source: National Bank of Poland, 2012
Cumulative value of FDI (in EUR bn)
82,9 91,3107,0
124,2 134,3 143,7 150,4 153,4
2004 2005 2006 2007 2008 2009 2010 2011
26,8
20,418,7
13,1
10,59,3
5,8 5,6 5,65,3
5,0 3,9 3,7 3,31,3 1,3 1,2
0
5
10
15
20
25
30
Neth
erla
nds
Ger
man
y
France
Luxem
bourg Italy
USA
Switz
erland
Unite
d Kin
gdom
Austr
ia
Swed
en
Spai
n
Irel
and
Belg
ium
Cypru
s
Port
ugal
Finland
Japa
n
Major FDI investors in Poland
(FDI stock as of the end of 2010, in bn EUR)

FDI in Poland
Source: National Bank of Poland, 2012
10,3
6,4
4,4 4,1
10,28,3
15,717,2
10,19,34
10,47
13,6
2000 2001 2002 2003 2004 2005 2006 2007 2008 2009 2010 2011
FDI flow into Poland in years 2000 - 2011 (in EUR bn)

Wrocław
AUTOMOTIVE
Source: PAIiIZ compilation, 2012
ELECTRONICS
Services and Manufacturing Hubs in Poland
Gliwice, Tychy Wrocław, Jelcz Laskowice, Wałbrzych Poznań
Other Manufactures
Gorzów Wielkopolski Tczew, Kwidzyn
Other Manufactures
HOUSEHOLD APPLIANCES
Łódź, Radomsko Wrocław, Kobierzyce
Other Manufactures
Wronki
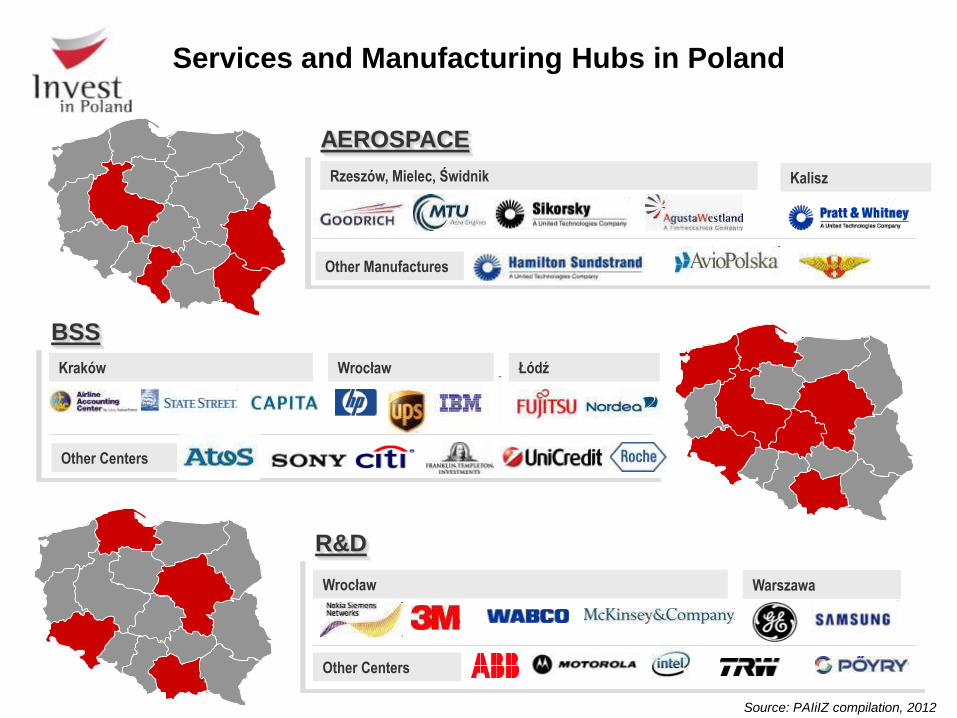
BSS
Wrocław
AEROSPACE
R&D
Rzeszów, Mielec, Świdnik Kalisz
Other Manufactures
Kraków
Other Centers
Wrocław Warszawa
Other Centers
Source: PAIiIZ compilation, 2012
Services and Manufacturing Hubs in Poland
Wrocław Łódź

Sectors of opportunities
• Extraction: shale gas
• Energy: nuclear power plant
• Renewable energy
• Infrastructure
• Food Industry
• Tourism
• Construction
• Research & Development
•

Energy investments
PLN 60 bn for energy investments:
• construction of new power blocks
in Turow, Kozienice, Opole,
Pulawy, Blachownia, Stalowa
Wola, Jaworzno, Wloclawek
• construction of LPG terminal in
Swinoujscie in progress
• construction of new gas pipelines
and magazines
• extension of oil terminal in
Gdansk

Seaport investments
Projects:
sea port Szczecin – Świnoujście
(EUR 530 mn)
sea port Gdynia (EUR 467 mn),
sea port Gdańsk (EUR 270 mn)
EUR 1,3 bn for sea ports infrastructure in years 2013 – 2020
Source: The Ministry of Transport, Construction and Maritime Economy

Road & highway investments
Projects:
ringroad of Poznan,
highways: A1 Tuszyn-
Pyrzowice,
S19 Rzeszow-Lublin,
S7 Gdansk-Warsaw,
S5 Wroclaw-Poznan and
Warsaw-Krakow
PLN 43 bn for roads and highways in years 2012 – 2015
Source: The Ministry of Transport, Construction and Maritime Economy

Source: The Civil Aviation Office, The Ministry of Transport, Construction and Maritime Economy
Location of main Polish airports
European flights
Domestic flights
Overseas flights
WARSZAWA
SZCZECIN
ZIELONA GÓRA
BYDGOSZCZ
ŁÓDŹ
RZESZÓW
WROCŁAW
KATOWICE
KRAKÓW
GDAŃSK
POZNAŃ
Airports under construction Q
Q
Q
Q Q
Q Q
Q
Q
MODLIN
LUBLIN
KILECE
GDYNIA
Airport investments
Planned investments in
modernisation, development
of passenger terminals and
airport infrastructure at
following Polish airports:
Gdańsk,
Kraków,
Katowice,
Poznań,
Wrocław
Rzeszów
Łódź
Szczecin
Bydgoszcz
Zielona Góra

Railway investments
PLN 30 bn for railways in years 2013-2015 (including
new trains purchase)
PKP Polskie Linie Kolejowe S.A. is a company of the
PKP Group and is responsible for maintenance of
railway lines (19 276 km), railway traffic management,
construction of timetables and management of railway
properties
General assessment of the
technical condition of
railway lines
Source: PKP PLK

RAILWAY LINE C-E 59
section Wrocław – Kostrzyn – Szczecin
30
The most important data on railway line C-E 59 section
Wrocław – Kostrzyn – Szczecin:
Total length: 355,6 km railway lines;
Modernization or revitalization of 46 stations;
355,6 km railway lines,
Railway line is fully electrified;
Single-track
from 0,306 km to 2,200 km;
from 348,721 km to 350,355 km;
Double-track
from 2,200 km to 348,721 km;
from 350,355 km to 355,904 km.
Modernization or revitalization of line C-E 59 will increase
the accessibility to Szczecin and Świnoujście Seaport
Szczecin and
Świnoujście
Seaport

Polish investment abroad
29
42
53
45
316
31
16
-90
230
305
955
3392
9168
5664
4613
4562
7484
7335
-4000
-2000
0
2000
4000
6000
8000
10000
Source: PAIiIZ, NBP, 2013
The value of Polish FDI abroad at the end of
2011 amounted to USD 49.6 bn

32 Source: UNCTAD, World Investment Prospects Survey 2009-2011, World Investment Report 2012.
Main advantages of Poland
• Stable economic situation
• Market growth
• Size of internal market
• Access to regional markets
• Cooperation with suppliers and
business
• System of investment incentives
Poland is among 15 most attractive investment locations in the world
World Investment Report UNCTAD

Source: Bloomberg Rankings - Jan 22, 2013
• Poland as best-performing CEE
country
• Factors taken into consideration: - degree of economic integration,
- cost of setting up business,
- cost of labour and material,
- cost of moving goods,
- less tangible costs,
- readiness of the local consumer base.
Best countries for doing business 2013

E&Y 2012 European Attractiveness Survey
Source: Ernst & Young, 2012 European Attractiveness Survey, 2012
According to investors surveyed by E&Y
the strengths of Poland are:
• large domestic market,
• well-qualified and productive workforce,
• stable macroeconomic situation in difficult
times,
• relatively low level of public debt comparing
to Western European countries,
• transparent tax and legal systems,
• favorable conditions both for manufacturing
and services investments
35%
10%
8%
7%
4%
3%
3%
2%
2%
2%
2%
2%
2%
Germany
Poland
UK
Russia
France
Romania
Czech Rep.
Turkey
Switzerland
Netherlands
Italy
Spain
Sweden
What are the most attractive countries for FDI in the next 3 years?

„Poland is already the champion of
Europe - in terms of economic
growth. An estimated GDP growth
for 2011 was revised upwards by
Brussels (to 4.3%) and is nearly
three times bigger than the average
of 27 (1.5 %).
What saved the Polish growth
during the 2009 crisis is that it is
driven by strong domestic demand
(population of 38 million).”
Le Figaro (March 2012) La Pologne, championne
européenne de la croissance
„Poland is the South Korea
of Europe – its economy
moves faster than the
German locomotive.”
La Repubblica (June 2012)
„Poland remains, despite the
crisis, the champion of
economic growth. The state
budget has doubled in the
last decade, the country was
well governed.”
Die Welt (June 2012), Wunderkind Polen
Media about Poland

Tax breaks
CIT exemption in Special Economic Zone
Real estate tax exemption
Cash support
Government grants
Cash grants available through EU Funds
Forms of regional aid

Special Economic Zones
Definition
• a special economic zone (SEZ) is a designated
area in which manufacturing or distribution
activities can be conducted on preferential
terms
• 14 SEZ in Poland, with several subzones
The purpose
• support regional development
Total area
• up to 20 000 hectares
Time of operation
• 31st December 2020
Permits to conduct activities in SEZ
• issued by the authorities of each SEZ
Benefits from obtaining a permit to conduct activities in SEZ :
• eligibility for income tax exemption
• plot of land prepared for an investment project
• free assistance in dealing with formalities relating to the investment project

Production
- automotive
- electronics
- aviation
- biotechnology
- „big investment” in other sectors
Modern
services
- ICT
- SSC
- BPO
- R&D activity
Program of support of investments of considerable importance
for Polish economy
Government grants
Purpose of support
development of innovativeness and competitiveness of Polish economy
Result of support
53 programmes of total amount PLN 900 m (since 2004)
18.9 thous. of new jobs
Source: PAIiIZ, Ministry of Economy
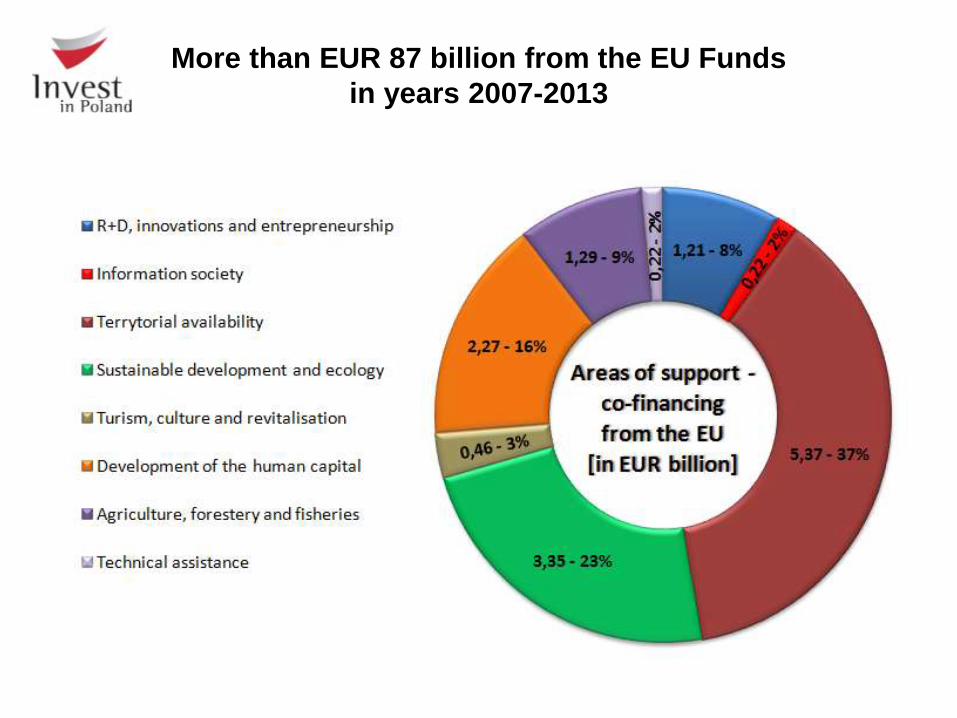
More than EUR 87 billion from the EU Funds
in years 2007-2013

Why Poland? Summary
Availability of skilled human resources
Economic and political stability
Effective incentives system
Strategic location – gateway to the EU
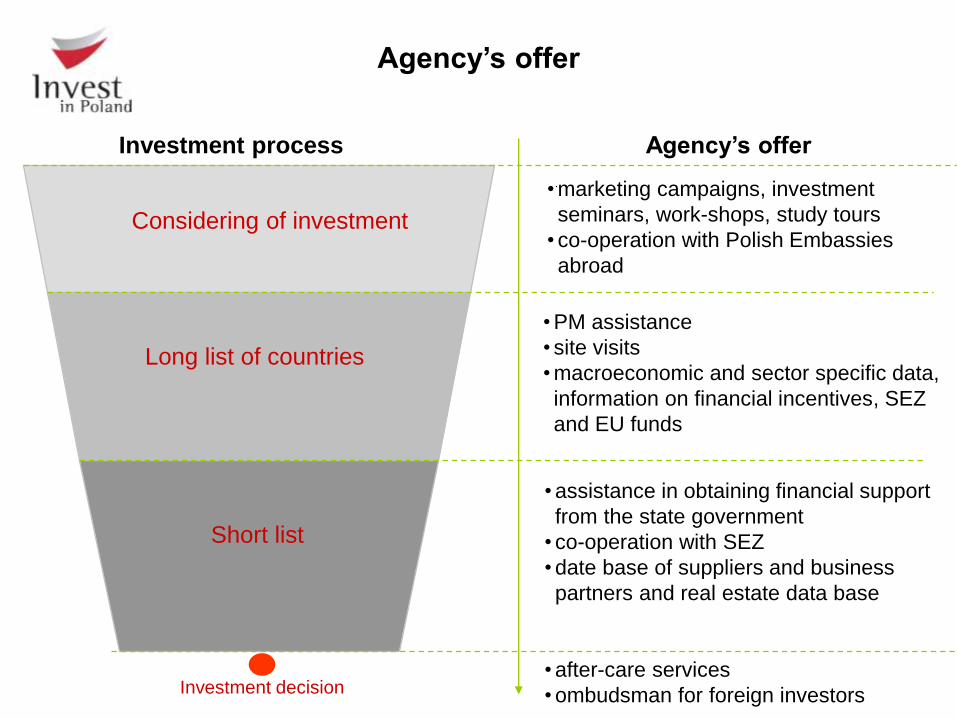
Short list
Investment decision
Long list of countries
Considering of investment
• PM assistance
• site visits
• macroeconomic and sector specific data,
information on financial incentives, SEZ
and EU funds
• assistance in obtaining financial support
from the state government
• co-operation with SEZ
• date base of suppliers and business
partners and real estate data base
• after-care services
• ombudsman for foreign investors
• marketing campaigns, investment
seminars, work-shops, study tours
• co-operation with Polish Embassies
abroad
Investment process Agency’s offer
Agency’s offer

Projekty zakończone pozytywną decyzją inwestycyjną
w 2012 r.
Investments by country of origin
3
4
4
4
4
2
1
2
1 1
2
1
53 INVESTMENT
PROJECTS
The largest investors from the point of view of invested capital
1 236 thousand EUR of investment
The largest investors from the point of wiec of the number of job plces created
9 996 NEW WORK PLACES

Active projects serviced by PAIIIZ
(as of end of January 2013)
PAIIIZ has in the project pipeline 152 potential investments
• Value of investment: EUR 3.8 bn
• Number of new job places: 26 902
• Main sectors:
• modern services (40)
• automotive (23)
• R&D (15)
• machinery (11)
• Major countries-investors:
• USA (45)
• Germany (17)
• China (12)
• Great Britain (12)

Thank you for your attention
00-585 Warszawa, ul. Bagatela 12
tel. (+48 22) 334 98 00, fax (+48 22) 334 99 99
e-mail: [email protected]
Related Documents