Policy Deliberation and Voting Behavior: Evidence from a Campaign Experiment in Benin ⇤ Leonard Wantchekon Princeton University March 17, 2013 Abstract This paper provides experimental evidence on the effect of town hall meetings on voting behavior. The experiment took place during the March 2011 elections in Benin and involved 150 randomly selected villages. In the treatment group, candidates staged town hall meetings where voters deliberated over electoral platforms. In the control group, candidates ran standard campaign rallies, featuring one-way communication of the platform by himself or his local broker. We find that the treatment has a positive effect on measures of turnout and voting for the treatment candidate. Surprisingly, the effects do not vary by gender, education or income. Finally, the results suggest that the positive treatment effect on vote shares is driven in large part by those who attended the meetings actively sharing information with others who did not. JEL Codes: D72. C93, O55. ⇤ I would like to thank Chris Blattman, Oeindrila Dube, Markus Goldstein, Kosuke Imai, Christian Moser, Tobias Pfutze, Marc Ratkovic, Jean-Marc Robin, Jan Torell, and Christopher Udry, as well as conference or seminar participants at EGAP, Juan March Institute, Columbia University, Sciences Po Paris, Stanford Graduate School of Business, and Southern Methodist University for comments and suggestions. I would like to thank the research staff of the IERPE (Benin), and the campaign management teams of President Yayi Boni, Mr. Houngbedji and Mr. Bio Tchane for helping implement the experiment. Alex Bolton, Jenny Guardado and Pedro Silva provided excellent research assistance. Funding for the project was provided by the International Development Research Centre (Canada) under the Think Tank Initiative. The usual caveat applies. 1

Welcome message from author
This document is posted to help you gain knowledge. Please leave a comment to let me know what you think about it! Share it to your friends and learn new things together.
Transcript

Policy Deliberation and Voting Behavior: Evidence
from a Campaign Experiment in Benin
⇤
Leonard Wantchekon
Princeton University
March 17, 2013
Abstract
This paper provides experimental evidence on the effect of town hall meetings on
voting behavior. The experiment took place during the March 2011 elections in Benin
and involved 150 randomly selected villages. In the treatment group, candidates staged
town hall meetings where voters deliberated over electoral platforms. In the control
group, candidates ran standard campaign rallies, featuring one-way communication of
the platform by himself or his local broker. We find that the treatment has a positive
effect on measures of turnout and voting for the treatment candidate. Surprisingly,
the effects do not vary by gender, education or income. Finally, the results suggest
that the positive treatment effect on vote shares is driven in large part by those who
attended the meetings actively sharing information with others who did not.
JEL Codes: D72. C93, O55.
⇤I would like to thank Chris Blattman, Oeindrila Dube, Markus Goldstein, Kosuke Imai, Christian Moser,
Tobias Pfutze, Marc Ratkovic, Jean-Marc Robin, Jan Torell, and Christopher Udry, as well as conference
or seminar participants at EGAP, Juan March Institute, Columbia University, Sciences Po Paris, Stanford
Graduate School of Business, and Southern Methodist University for comments and suggestions. I would
like to thank the research staff of the IERPE (Benin), and the campaign management teams of President
Yayi Boni, Mr. Houngbedji and Mr. Bio Tchane for helping implement the experiment. Alex Bolton, Jenny
Guardado and Pedro Silva provided excellent research assistance. Funding for the project was provided by
the International Development Research Centre (Canada) under the Think Tank Initiative. The usual caveat
applies.
1

1 INTRODUCTION
There is a growing consensus among economists and political scientists that targeted
redistribution and clientelism have adverse effects on governance and development.1Under
clientelist political systems, politicians tend to use state resources for short-term electoral
gains, and voters tend to base their decisions on immediate material benefits rather than
policy considerations. As such, clientelism profoundly shapes the conduct of elections and
government policies and is at the heart of current studies of democratic governance in de-
veloping countries.2
The literature has focused primarily on uncovering the structural causes of clientelism
and on measuring its effects, but it has not provided much insight into institutional reforms
that would facilitate the emergence of efficient and “universalistic” redistribution. Two
structural factors that have been identified as possible "remedies" to clientelism are economic
development and the rise of mass communication. The literature does not, however, provide
direct evidence for the mechanisms linking either of these forces to changes in voters’ political
behavior and candidates’ campaign strategies.
There are several plausible avenues through which development and decreasing costs
of communication could reduce clientelism and its effects. Economic development may make
voters more likely to value growth-promoting policies that promise further development,
over short-term material goods in exchange for votes. Additionally, decreasing costs of mass
communication may lessen the need for electoral intermediaries between politicians and the
public, allowing politicians to appeal directly to national constituencies and integrating oth-
erwise fragmented local political markets.3 Bypassing the intermediary and taking messages
directly to voters may also reduce incentives for electoral corruption because it eliminates
the need for an up-front payment to the intermediary and the need to promise patronage
appointments after the election in exchange for getting voters to the polls. Directly taking1See Acemoglu and Robinson (2001), Dixit and Londregan (1996), and Keefer and Khemani (2005) among
others.2Throughout the paper, we use the terms "targeted redistribution" and "clientelism" interchangeably.3See Stokes et al. (2011)
2

messages to voters may enable politicians to design more informed, specific and, as a result,
transparent electoral platforms.
Following from these ideas, platform transparency may be a key mechanism that could
make voters more receptive to universalistic appeals. For instance, transparent and specific
platforms may allow voters to better understand the positive benefits and externalities that
could be realized through the broad provision of public goods. Furthermore, if this is
the case, then it may also be in candidates’ best interests to develop and disseminate such
platforms. Policy deliberation in the context of town hall meetings might be an effective
strategy for achieving platform transparency and, hence, electoral support for universalistic
policies.
To see why this could be the case, consider the following example. Suppose there
are two districts with unequal populations. In the district with the greater population and,
hence, the majority of voters (District A), a market needs to be renovated. In the less-
populous district (District B), a bridge needs to be repaired. All voters would be better
off if the bridge were repaired and less money spent on renovations because of the positive
externalities associated with the repair of the bridge (for example, the people of District B
could travel to District A’s market). Our hypothetical candidate knows this. However, this
information is partly technical, and most voters in District A would be unable to evaluate
the indirect benefit to District A of an investment in District B. As a result, there is no
equilibrium in which our candidate wins by promising to spend part of the budget on the
bridge. This is because other candidates could simply promise to spend all of the money
renovating the market and win the election, since District A has the majority of voters.
Alternatively, assume that our candidate could hire a team of experts and develop a
specific platform, detailing the positive benefits that would accrue to all voters if the bridge
were repaired and less money was spent on renovating the market. Policy deliberation could
then be used to disseminate the details of the platform.
Due to the institutional innovation, this could become a winning strategy for the
candidate for the following reason: she would be no less likely to receive votes from District
A (because deliberation allows voters to see that they are better off with the bridge being
repaired), and she would also gain votes from District B for implementing the desired policy.
Furthermore, in addition to the realization that they will receive greater benefits from the
repair of the bridge, voters, armed with information, may be more willing to recruit marginal
3

voters in their social networks to also vote for the candidate. Thus, there are two ways policy
deliberation might affect voters. First, undecided voters in District A, learning the extra
benefits that will come from repairing the bridge, will vote for the candidate. Second, those
already supporting her will have much clearer reasons for doing so, reasons they are more
likely to share with others.4
In this paper, we provide a randomized evaluation of the effects of policy deliberation
and test the mechanisms for those effects. The experiment took place during the March
2011 presidential election campaign in Benin and involved 150 villages randomly selected
from 30 of the country’s 77 districts. Voters from 60 villages (the treatment group) attended
town hall meetings staged by one of the presidential candidates and deliberated over his
policy platforms, while voters in 90 control villages, attended rallies organized by the same
(and possibly other) candidates. We find that town hall meetings have a positive effect on
measures of turnout, and electoral support for the candidate running the experiment. The
effect is stronger on those who did attend the meetings. Examining the causal mechanisms,
we show that much of the impact of the meetings is through active information sharing by
those who attended.
1.1 Contributions to the literature
The results reported here contribute broadly to literatures on deliberation, the effects
of information on voting behavior, and clientelism. The paper uses theoretical insights from
all of these literatures to generate empirical results that provide practical guidance on how to
overcome clientelism and other political obstacles to policy making in developing countries.4The question arising from this theoretical argument is as follows: if policy deliberation is effective, why
are candidates not currently opting for it?
There are two potential explanations. The first is that the initial fixed cost of getting voters to deliberate is
too high. This is not plausible since rallies appear to be at least seven times more expensive than deliberation.
The second is that policy deliberation is too risky, i.e. politicians are unsure whether deliberation would
convince voters that repairing the bridge is optimal. If there is a high enough chance that voters would not
update their beliefs about the optimality of the repairing the bridge, then politicians would stick to status
quo allocation. The experiment described in this paper gives politicians the opportunity to learn about the
effectiveness of policy deliberation and adopt more universalistic policy platforms in future elections. Note
that if the candidate has "special" dispositions towards rallies, or if learning is slow, he or she might stick
with the status quo.
4
Studies of deliberation have investigated the ways in which public debates and how
group interaction affect collective choice. The literature spans from ethnographic stud-
ies of town hall meetings (à la Mansbridge [1983]) to deliberative polls (Fishkin [1997])
to laboratory experiments (e.g. Goeree and Yariv [2011]) to normative political theory of
participatory democracy (Gutmann and Thompson [1996]; Rawls [1997]; Macedo [2010]).
Normative descriptions of deliberation suggest that it can lead to revelatory discussion and
legitimate, efficient collective choices. Empirical findings have been more mixed. While
some studies have concluded that deliberation does in fact produce these outcomes (Fishkin
[1997]) others are more pessimistic. For example, Mansbridge (1983) and Mendelberg et
al. (2011) find that deliberation and the outcomes of the deliberative process may simply
reflect preferences of the power structure that exists outside of the deliberative venue. Fur-
thermore, Mutz (2006) provides evidence that the potential for conflict in discussion with
others may actually demobilize voters even if they are more informed. This paper shows
that deliberation can be a tool for persuasion and mobilization of support for universalistic
policy. It does so by uncovering common interests among voters and making policy exter-
nalities between political constituencies clear. Furthermore, enlightened participants in the
deliberative process may be willing to share newfound policy knowledge with others.
There is a vast literature on how information and deliberation affect political behav-
ior. Theoretical studies (e.g. Austen-Smith and Feddersen [2006]; Meirowitz [2006]) suggest
that deliberation may be a way through which voters can coordinate their voting behavior
and individuals can reveal private policy information prior to collective decision-making.
Experimental work has demonstrated that this is indeed possible (e.g. Goeree and Yariv
[2011]). Other empirical studies have investigated the extent to which policy information,
such as crime rates, foreign aid, and public spending, can affect opinions and political behav-
ior (see Banerjee et al. [2011], Chong et al. [2011], Gilens [2001]). This paper demonstrates
that the town hall meeting setting enhances the mobilizing effect of policy information by
allowing for voter coordination.
Lastly, the paper contributes to the broader literature on transitioning from targeted
to universalistic redistribution. The literature uses historical evidence to show the way in
which economic growth and demographic shifts, a meritocratic civil service, the introduc-
tion of the secret ballot, and the shrinking costs of mass communication contribute to the
breakdown of patronage politics and clientelist networks. There has been no discussion in
5
the literature of the impact of changes in campaign strategies or shifts in the levels of pol-
icy information. This paper focuses on a specific (and feasibly implemented) institutional
intervention and examines its effects on political behavior.
This paper is the third in a series of electoral experiments conducted in Benin aimed at
investigating the determinants of clientelism and proposing institutional remedies. The first
took place during the 2001 elections in Benin and tested the effectiveness of clientelist versus
unaversalistic or programmatic electoral campaigns on voting. We found that a clientelist
treatment has a positive effect on electoral support whereas a programmatic treatment cost
candidates votes. However, the conditional treatment effect of a programmatic campaign was
positive for women, more informed voters, and co-ethnics (Wantchekon [2003]). The question
arising from this experiment was whether one could refine the programmatic treatment to
make it as effective as the clientelist treatment. This issue was addressed by a follow-
up experiment in 2006, which found that programmatic platforms might be at least as
effective as clientelist ones in mobilizing turnout and votes if they are informed by research.
However, the experiment had a relatively small sample size and limited regional coverage
(Wantchekon [2008], Fujiwara and Wantchekon [2012]). In addition, due to data limitations,
it was not possible to uncover the causal mechanism whereby town hall meetings improve
electoral support. In response to these limitations, the 2011 experiment analyzed in this
paper included districts from all 12 provinces in the country and involved the top three
candidates in the election. We also collected detailed information on the conduct of the
town hall meetings, which enabled us to identify mediating variables and the channel of
causality.
The rest of the paper is organized as follows. The next section presents the context in
which the experiment took place. Section 3 discusses the experimental design, and Section
4 the data and the main results. Section 5 concludes.
2 CONTEXT
The experiment took place in Benin (formerly Dahomey). The country is among the
top ten most democratic countries in Africa, but only 31st in terms of human development,
and 18th in economic governance.5 Despite being far more democratic and politically stable,5See the Mo Ibrahim Foundation report on governance, www.moibrahimfoundation.org
6
Benin attracted five times less foreign direct investment than Cote d’Ivoire and ten times
less than Burkina Faso.6
Several analysts blame the poor economic performance in Benin on clientelism and
patronage politics.7 Indeed, before the 2011 presidential elections, the incumbent party
was accused of electoral corruption and extreme politicization of public administration. An
estimated $45 million out of $50 million was spent during the campaigns on cash distribution,
gifts and gadgets, and payment to local brokers. In all likelihood, the bill was picked up by
local or foreign "electoral investors" in return for various forms of favors.
The elections were the second since 1990 without the traditional “big men” Kerekou
and Soglo in the running. The top three candidates were Yayi Boni, a former President of the
West African Development Bank running as the incumbent candidate from the Force Cowrie
for Emerging Benin (FCBE), Adrien Houngbedji, a former cabinet member in Kerekou’s
government and the candidate of the Party for Democratic Renewal (PRD), and Abdoulaye
Bio Tchane (ABT), an economist and former Director of the Africa Department at the IMF.
The campaign started on February 10 and ended on March 12, 2011. In the end, Boni, the
incumbent, won in the first round by 53.16%. Houngbedji received 35.66 % of the vote and
ABT took 6.29%.
3 EXPERIMENTAL DESIGN
The experimental process started with a policy conference that took place on February
5, 2011. The goal was to promote policy debates involving candidates and academics and
build trust between the experimental team and the candidates. The conference covered
five policy issues: mathematics education, emergency healthcare, youth employment, rural
infrastructure, and corruption. There were about 70 participants and five reports were
generated. There were also representatives of the three main candidates, members of the
National Assembly, Development Agencies, NGOs and a large number of academics including
the Dean for Research at the University of Abomey Calavi, an academic institution in Benin.8
The experiment followed a randomized, geographically blocked design with treatment
being assigned to 60 randomly selected subunits (villages) in 30 randomly chosen units6See Jeune Afrique, Hors Serie, No 27 (Etat de l’Afrique).7Jeune Afrique, No 27, 2011.8A media report of the conference can be seen in an online video: http://vimeo.com/20972062
7

(electoral districts). In each district, we selected two treatment villages and three control
villages. The country has 77 districts (or communes) across 12 provinces. There is an average
of 52 villages per district and six districts per province.9 The sampling procedure was as
follows: first, we excluded the city of Cotonou because of its high population density and
therefore the high risk of contamination between treatment and control groups. Second, with
the exception of the mountainous Atakora department (the Beninese term for province), we
used a simple proportionality rule to determine the number of districts to be selected in
each of the 10 remaining departments. Using a random number generator, we selected two
treatment districts in Alibori, the department with the smallest number of districts, and
four from Zou, the one with the highest. Then we used the same procedure to select five
villages in each district, and assigned two to the treatment and three to the control group.
Finally, we assigned the 30 districts to the three candidates participating in the experiment,
four districts were assigned to the ABT party, eighteen districts to the PRD party, and eight
districts to the incumbent candidate Yayi Boni. Hence, a candidate running the experiment
in a particular district staged town hall meetings in the two treatment villages and organized
rallies in the three control villages, while the remaining candidates only used rallies as a
campaign strategy. For the post-election survey, we interviewed a representative sample of
30 households from every village.10 A map of treatment and control villages and districts
can be seen in the appendix.
Treatment: A team of one research assistant from the Institute of Empirical Re-
search in Political Economy (IERPE) and one activist working for the candidate organized
three meetings in each of their two assigned treatment villages. Every villager was informed
of the date and the agenda by a village crier. The typical meeting was attended by about
70 individuals, which is about 10% of the population of an average treatment village. At-
tendees were relatively diverse, in terms of gender, income, and profession. For instance,
on average about 60% of the villagers in attendance were men. The agenda was education
and healthcare for the first meeting, rural infrastructure and employment for the second,
and youth unemployment for the third. Between 50 and 80% of individuals attended all9Similar field experiments tend to be regionally focused (e.g. Banerjee et al. [2011] in urban areas,
Gerber and Green [2001] in New Haven, Wantchekon [2003], [2010]), making the nationwide scope itself an
improvement over previous work.10A sample of 30 districts, 150 villages and 30 households per village would generate a treatment effect of
0.20 at power of 0.80.
8

three meetings. The research team introduced the topics in light of the proceedings of
the February 5 conference. Villagers debated the policy proposals among themselves and
with the representatives. In some cases, groups of villagers, especially women, caucused
prior to the Town Hall meeting to discuss the relevant issues and choose a representative
to speak on their behalf at the actual meeting. Furthermore, attendees contributed ideas
for new proposals and made suggestions for improving the existing proposals, particularly
to suit them to the village’s local context. For instance, during the meeting on healthcare,
representatives spoke about the candidate’s commitment to improving emergency services.
Some villages suggested that emergency care would be improved by focusing on prenatal care
while others argued for a focus on snake bites. The team then summarized the main points
raised during the meetings in a written report to be transmitted to the candidate via his
campaign manager. Each meeting lasted about 90 minutes. There was no cash distribution
and neither the candidate nor any other major political figure (such the local mayor or MP)
was in the audience.
Control: A local mayor, MP, or a political figure (the local broker) organized two
to three rallies, sometimes in the presence of the candidate himself. A typical rally began
with 30 minutes of music, followed by a 10-minute introduction. The speaker – either the
candidate’s representative or the candidate himself – then discussed a policy agenda proposal
for about a half hour. In one village, the president spent 30 minutes outlining his education
policy, particularly his plan to build new classrooms and educational infrastructure across
the country. After the speech there was another 30 minutes of dancing and music before the
rally ended. There was no debate or audience participation, but instead a festive atmosphere
of celebration with drinks, music, and sometimes cash and gadget distribution. Participants
came from several villages and attendance varied from 800 to 3000 or more. The rallies lasted
about two hours. Thus, rallies are a type of one-way communication strategy of platforms
combining programmatic and other, in some cases clientelist, campaign promises.
Remark: Town hall meetings are different from rallies in at least four ways. (1)
In contrast to rallies, that are one-way communications from candidates to voters, town
hall meetings are two-way communications.11 Participants are introduced to the candidate’s11Note that Wantchekon (2003) evaluated the effect of one-way communication of a programmatic platform
and found that it had a negative effect on the treatment candidate’s vote share. The goal of this experiment
is to investigate whether a two-way programmatic communication has different effects.
9

platform, ask clarifying questions, and provide input to adapt and amend the platform based
on local conditions. (2) A rally draws far more people than a town hall meeting. (3) While
town hall meetings cost about $2 per participant, a rally costs at least $15 per participant
(based on our estimates). (4) Every rally is run by a local or national celebrity (the mayor,
MP or a broker) with the candidate sometimes present, and involves some form of cash or
gift distribution.12 While the first two differences are essential elements of the treatment,
the last two work against finding a positive treatment effect.13
4 DATA
Our empirical analysis uses a wide range of datasets. First, during the week preced-
ing the town hall meetings, we surveyed a sample of prospective voters in all 60 treatment
villages and 90 control villages and collected pre-treatment demographic, political, and eco-
nomic information, such as age, gender, ethnicity, education level, assets, as well as political
preferences and knowledge. Second, we collected detailed information on the conduct and
the outcomes of the town hall meetings including participation by gender, age, economic
status, issues raised, duration, perception of the candidate and his platform, and partici-
pants’ social networks. Finally, we collected two types of data on election outcomes. First,
as soon as the polls were closed, the research teams went to the relevant polling stations to
record turnout and electoral support for the candidates involved in the experiment in all 30
communes and 150 villages, generating village-level measures of electoral outcomes.
We also conducted a number of surveys before and after the election that covered,
among other things, standard demographic and economic variables in addition to self-
reported voting behavior, meeting attendance, and civic education.
Figures 1 through 3 present the official results of the election in the treatment and
control villages. Figures 1 and 2 show the distribution of turnout and total number of
voters. Figure 1 shows that turnout was higher for treatment districts and villages. Almost12By not getting the local broker directly involved in the town hall meetings and not distributing cash
and/or gadgets to participants, we were in fact working against a positive treatment. The presence of the
mayor, the MP or a candidate himself would probably have boosted the audience, and gifts to the participants
would likely not have turned them against the candidate.13A video presenting the project can be seen at: http://www.youtube.com/watch?v=rjAlnp4Iq58
10
all of the treatment villages had over 80% turnout, whereas a substantial number of control
villages had turnout rates between 40% and 60%. Figure 2 demonstrates that the villages
in the treatment and control groups generally had similar distributions of the number of
individuals that voted in the election (although it appears that the control group had more
villages in the 1500-2000 range). Differences arise in Figure 3 where we observe a larger
number of treatment villages with a relatively small number of registered voters, with a
greater proportion of treatment villages below 1000 registered voters than control villages.
Interestingly, turnout tended to be very high – greater than 80% in most villages.14 There
was even 100% turnout in 12 of the 150 villages.
Insert Figures 1, 2, 3
One immediate concern arising from the data is whether there are systematic dif-
ferences between the official election returns and self-reported voting behavior, and, more
importantly, if these differences are affected by treatment status. Table 1A addresses these
concerns by checking if the differences in turnout and vote shares reported in the post-
electoral survey and official statistics vary according to the treatment status. We find that
although differences in both sources of information exist, these do not vary with the treat-
ment assignment.
Insert Table 1A
Another concern is covariate imbalance between treatment and control groups. In-
deed, because the randomization is implemented at the commune and village level, it is quite
possible that there could be heterogeneity between the treatment and control groups that
could confound results. It is especially necessary in such a context to check whether the
treatment and control groups are balanced on pre-treatment covariates. More precisely,
we test the null hypothesis of no significant difference between the means of pre-treatment
variables in the treatment and control groups. We look at a wide range of demographic,
political and socioeconomic variables including gender, income, education level, and age,
political knowledge and participation.
Table 1B shows the descriptive statistics of key demographic, political and economic
variables in treatment and control groups from data collected prior to the implementation14This is turnout rate is comparable to that of the 2006 elections, which was about 88%.
11

of the experiment. Regarding demographic variables, the means indicate that number of
spoken languages is higher in treatment villages, which reflect a certain ethnic heterogeneity
not captured in the ethnicity variable. In contrast, the mean of the political variable of vote
intention appears to be slightly higher in control villages than in treatment villages. Be-
cause the treatment is intended to increase turnout (among other outcomes), such difference
would run against finding any result. Finally, the number of individuals who report to be
employed appears to be higher in treatment villages. Interestingly, there are no differences
among treatment and control villages in the level of political informedness measured by the
knowledge of the Mayor’s name, and the extent to which the incumbent president (Yayi) is
known among Beninese voters. Similarly, there are no differences in intention to vote for the
strongest candidate (the incumbent, Yayi).
Insert Table 1B
One question that arises in the analysis is which dataset best measures the two main
dependent variables, turnout and vote choice. We opt for the official results for the analysis
of turnout, and survey data for vote choice. Self-reports of turnout are notoriously inaccurate
(see Burden [2000] among others). We would expect this to be the case in Benin, since up
to 98% of voters in the pre-election survey indicated an intention to vote. This suggests
a strong desirability bias in favor of reporting that a respondent voted. As can be seen in
Figure 4, there is almost no correlation between reported and official turnout results.
Insert Figure 4
Regarding vote choice we opt to use the post-election survey results because of high
suspicion of electoral fraud. Indeed, several reports indicated instances of ballot boxes being
stuffed with pre-stamped ballots. Figure 5 shows the correlation between survey reports
of voting and the official election results. While it appears that they are positively corre-
lated, we nonetheless take the survey results as the more accurate measure in light of these
allegations.15
Insert Figure 515See Afrol News story, "Benin opposition denounces election fraud," March 15, 2011:
http://www.ocnus.net/artman2/publish/Africa_8/Benin-Opposition-Denounces-Election-Fraud.shtml
12

5 RESULTS
The first dependent variable is turnout. This is a fundamental variable of interest in
the study of democracy, and has generated a great deal of interest in experimental political
science. Gerber and Green (2000) and (2003) found that canvassing and face-to-face voter
mobilization stimulates turnout in various types of elections.16 Additionally, voters in Benin
seem to have a clear understanding of the meaning of democracy and the importance of voting
and competition for the maintenance of a healthy democratic system. The majority of voters
identified democracy as being associated with alternation of power and the freedom to express
true preferences.17 This was true in both treatment and control villages. Similarly, the
vast majority of voters (70% or more) were willing to accept candidates from any region
and religion despite elite debates centered on regional and religious cleavages. This suggests
that voters value and understand democracy and that turnout and voting decisions are not
mechanical acts based on region, ethnicity, or religion.
Even if the treatment improves turnout, it is unlikely to be adopted unless it improves
the electoral prospects for the treatment candidates. This is particularly true if they believe,
as the some of the literature suggests, that voters do not care about policy (e.g. Keefer
and Khemani [2007]). Therefore, our second dependent variable of interest is vote share for
the treatment candidate. We will also disaggregate the voting results in samples where the
treated candidate is either the incumbent or opposition candidate. As discussed earlier, we
use official tabulations of voter turnout and self-reported vote choices from the post-election
survey.
The main independent variable is treatment status. As in the 2001 experiment, we
investigate the relative effectiveness of the treatment on women and on those with more16The conventional wisdom in comparative politics is that clientelism and vote-buying are the most reliable
way to drive voters to the polls (Brusco, Nazareno and Stokes [2004]; Nichter, [2008]). We intend to evaluate
alternative campaign strategy, namely "policy deliberation."17In the post-election survey, respondents were given the following scenario: "Assume John is in a country
where there is one dominant party and several small parties. Individuals are free to vote for whomever
they want, but most elections are won by candidates from the dominant party." 70% of the respondents
indicated that this was a "democracy with a major problem" or "not a democracy." Respondents were also
given the scenario, "Assume Benoit is in a country where there are many parties with alternation in power
and individuals are free to vote for whom they want." 70% of respondents indicated that this was a full
democracy.
13

schooling, by introducing gender and education as our other two independent variables and
examining their interactions with treatment status.
In order to investigate the mechanism of the treatment effect, we will consider two
possible mediating variables: platform transparency (i.e. learning about and participating in
creating the platform) and active information sharing with other voters (i.e. increasing the
motivation of voters to work on behalf of the candidate). Presumably, participants at town
hall meetings might turn out at higher rates and vote for the treated candidate because the
meetings enable a better understanding of the candidate’s platform or generate a willingness
to actively campaign on his behalf. The active information sharing contributes to discussions
in the literature about the "swing voter’s curse" (e.g. Feddersen and Pesendorfer [1996]).
Here, informed voters become strategic actors and may take actions to persuade marginal
uninformed voters with their newfound information so that they can realize the potential
gains from their preferred candidate winning the election. Town hall meetings might play
a role in motivating informed voters to take these actions. We will estimate the relative
contribution of both mechanisms to the treatment effect.
Finally, we investigate vote buying and how it might affect our estimate of the treat-
ment effect. We compare the role of money in both the treatment and control groups by
comparing the electoral behavior of those who received it and those who did not.
5.1 Turnout
We first evaluate the effect of the treatment on measures of political participation
using the village-level outcomes collected on election day. We estimate the linear model:
Yjc = ↵c + �1Tjc + �2Zjc + ujc (1)
where Yjc is the village j turnout of commune c and Zjc is a vector of village-level
covariates. We include commune/district fixed effects ↵c to account for stratification. The
key independent variable is Tjc, the treatment, which takes value one if the village is in the
treatment group and zero if it is in the control group.
In Table 2 Panel A, we present the OLS estimates of the treatment effect on turnout
as measured by official statistics. Robust standard errors are clustered at the village level.
Column headers indicate whether we are referring to the entire sample (Overall), to a sample
14

where an opposition candidate was the treatment candidate (Opposition), or to communes
where Yayi (the incumbent) was the treated candidate. In Table 2 Panel A we can see
how the treatment variable indicator (whether a village was assigned to town hall meetings
or not) has a positive and significant effect (at the 5% level) in the turnout levels of all
villages included as measured by official statistics. In Panel B, we also report the effect of
the treatment on the self-reported measures of turnout, as expected, we find a null result in
such cases.
Our measure of turnout is the proportion of registered voters casting a vote, hence,
the results presented in the Overall column suggests that turnout is approximately 3.3%
higher in treatment villages than in control villages. This is slightly smaller in Opposition
communes, which exhibit a 2.65% increase in turnout in contrast to their control counterpart.
In particular, turnout was much higher in villages where the opposition parties (ABT or UN)
were using such campaign strategies, not shown. There are no differences for communes
in which the incumbent (Yayi) adopted town hall meetings as a campaign strategy. The
coefficients imply that the effects are not negligible. For example, the coefficient of 0.033 in
the Overall column suggests that turnout is approximately 3.3% higher in treatment villages
than in control villages.18
Insert Table 2
5.2 Voting
Does increased turnout as a result of the treatment translate into higher electoral
returns for the treated candidates? We address this question by estimating the treatment
effect on voting. Using data from the post-election survey for vote choice, as discussed above,
Table 3 assesses the effect of town hall meetings on votes for the “treatment” candidate.
Specifically we estimate:
Yijc = ↵c + �1Tij + �2Zijc + �2Zijc ⇥ Tjc + uijc (2)
where Yijc is individual’s i vote choice from village j and commune c. Zijc is a vector
of individual-level covariates. We include commune/district fixed effects ↵c to account for18This result is consistent with Fujiwara and Wantchekon (2012), which finds a moderate effect of the
treatment on turnout in the 2006 experiment.
15

stratification. Again, the key independent variable is Tjc, the treatment, which takes value
one if the village is in the treatment group and zero if it is in the control group.
As shown in Table 3, vote choice exhibits a positive and significant effect, especially
for opposition candidates. In this case, we can rule out any social desirability bias effect
(wherein voters report that they voted for the winning candidate) given that it was the
incumbent, Yayi, who actually won the election, not the opposition.
For example, the coefficient of 0.059 in the Overall column suggests that the presence
of town hall meetings increased the vote by approximately 6% for the candidate campaigning
using them relative to the control.19 However, unlike the case of turnout, such effect is mostly
driven by the Opposition communes which exhibit an 8.6% increase in self-reported votes.
This effect is not observed for the incumbent (Yayi) who, despite using town hall meetings,
received no increase in the official and self-reported vote shares. As mentioned earlier, the
non-result for the incumbent candidate (Yayi) rules out the possibility of biased reported
measures in this post-electoral survey which would favor the actual election winner (Yayi).
Overall, these results demonstrate that the treatment increases the competitiveness of the
elections by increasing the vote share of the opposition.20 In addition, Panel B shows that
the treatment is also related to an increase in the perception of treated candidates being
perceived as the "best." Finally, Panel C shows how village-level official results, measured in
percentage, are not different from treatment in control for the opposition or the incumbent.
Insert Table 3
5.3 Heterogeneous Treatment Effects: Gender, Education, Poverty
In Table 4.1 Panel A, we control for a host of individual-level characteristics that
may indicate the presence of heterogeneous treatment effects. We only look at outcomes for
which there is a treatment effect and use individual-level characteristics obtained from the
post-electoral survey. We estimate the following model:19In terms of interpretation, vote choice is measured in a zero to one scale, where one indicates whether
the reported chosen candidate is a "treated" candidate or not.20Fujiwara and Wantchekon (2012) also find a similar positive effect for the opposition candidates. But in
this case, the incumbent did not lose votes as result of the experiment.
16
Yijc = ↵c + �1Tjc + �2Zijc + �2Zijc ⇥ Tjc + uijc (3)
where Yijc measures the vote choice of individual i from village j and commune c,
Zijc is a vector of individual-level covariates, Zjic ⇥ Tic the interaction effects between the
treatment indicator and the covariates (education, income, and gender).
Table 4.1 Panel A looks at turnout and shows no variation in the effect of the treat-
ment according to particular traits such as gender and education. The negative coefficient on
the interaction term between education and the treatment suggests that the treatment might
have had a smaller effect among those with higher education, yet the result is not consistent
across different samples. Similarly, Panel B looks at vote shares and shows no heterogeneous
treatment effects by gender or education. However, the coefficient of the treatment variable
indicator appears slightly smaller once we control for such covariates. This lack of heteroge-
neous effect is also exhibited in Table 4.2 when we include the poverty indicator. The only
exception is the slightly smaller effect of the treatment on turnout among those who are less
deprived in "Overall" and Opposition communes. Otherwise, the effect of the treatment is
positive and statistically different conditioning on these controls.
The lack of differential effects among different groups contributes to the literature on
deliberation, suggesting that the deliberative procedure can lead to convergence in actions
temporally removed from the actual meeting.21 Furthermore, men and women and individ-
uals with different levels of education and income were equally affected by the treatment.
Insert Tables 4.1, 4.2 here
6 CAUSAL MECHANISMS
Our town hall meeting experiment is part of a recent trend in experimental research
interested in the rigorous evaluation of institutions and decision-making processes, such
as community deliberation (Fearon et al. [2009], Casey et al. [2012]), plebiscites (Olken21Previous literature (e.g. Fishkin [1997]) has primarily focused on the immediate effects of deliberation.
17
[2010]), campaign strategies (Fujiwara and Wantchekon [2012]), and school-based manage-
ment (Blimpo and Evans [2011]), to name a few. The distinctive feature of experiments is
that subjects are randomly assigned to decision-making processes that endogenously gener-
ate a policy or a platform, which ultimately affects the final outcome of interest, e.g. student
learning, turnout, child mortality rate. As discussed in Atchade and Wantchekon (2009),
process-experiments present the following challenge: how does one disentangle the intrinsic
institutional effects from the policy effects? In order to accomplish this, the authors suggest
that we deal more broadly with the issue of causal mechanisms. We need to explain how
some intervening variables produced the observed outcome.
One simple way to estimate causal mechanisms is to control for possible mediating
variables when estimating the effect of the treatment. We will consider two causal mech-
anisms and, hence, two mediating variables: "audience" and "active information-sharing."
Indeed, town hall meetings could enable voters to have better information about the can-
didate platforms and help candidates to develop stronger connections with voters. In ad-
dition, better-informed voters could be more motivated to "volunteer" to mobilize other
less-informed voters on behalf of the candidate.22
The coefficients of the mediating variables help evaluate the contribution of each
of these variables to the observed final outcome. An alternative strategy is to estimate
the average treatment effect (ATE) in the presence of specific mediator variables (See Imai
et al. [2011]). The authors propose a methodology that helps to quantify the effect of
a treatment on an outcome by holding the treatment constant and varying the levels of
mediating variables. More specifically, we estimate the following model:
Mij = �i + �1Ti + �2Zij + ✏ij (5)
Yij = ↵i + �1Mij + �2Zij + uij
22An alternative mechanism is "credibility of electoral promises." Indeed, Keefer and Vlacu, (2008) argue
that voters tend to more supportive of clientelist platforms than they are of policy platforms because the
former is more credible than the later. We assume that our "information sharing" variable captures the
spirit of the credibility argument. It is a direct and practical measure of the extent to which a voter finds
the electoral platform of a candidate credible.
18

where Mij is the mediating variable of interest.
The mediation effects is defined as
Yij (t,Mij(1))� Yij (t,Mij(0)) (6)
where t denotes treatment status.
Following the standard strategy, we contrast the effect of "active information sharing"
with that of "audience." We construct the "active information sharing" variable from the
response to the survey question: "Did you share the results of the town hall meetings with
other members of the communities? Who were they?" The "audience" variable is derived
from the question: “How do you think the meetings influence your vote? (1) they help learn
who other villagers will vote for [voter coordination]? (2) they help learn more about the
candidate policy agenda [platform transparency] (3) they show that the candidate is willing
to listen to voters [attentive candidate].” We then constructed a simple average of these
factors under the name "audience."
Table 5 explores in depth the channels of causality for why town hall meetings would
have an effect on turnout and vote outcomes. Since turnout does not vary at the individual
level, we will limit ourselves to the study of vote decisions. Future research should be
conducted testing whether the hypothesized channels affect turnout. We hypothesize that the
relevant channels are those of information sharing and audience effects, which are measured
as discussed above. As shown in Table 7 Panel B, the largest effects for vote shares are those
observed by changes in overall information sharing and, to a lesser extent, audience effects.
Such findings are corroborated in Table 7 Panel A, where we use mediation analysis to look
at the effect of information sharing and audience effects on overall vote shares. As shown
in the first two columns, the effect of the treatment on vote outcomes that is explained by
sharing information (8.85) is around half of the overall treatment effect (16.35). In contrast,
the treatment effect that goes through audience effects (.24) is less than 2%.
While we cannot carry out a similar analysis at the village level, information sharing
at the individual level may help to explain those results. Based on the attendance data and
the post-election data, in a typical village there were 70 attendees at a town hall meeting.
About 35 to 40 of them indicated that they shared information from the meeting with 5-10
19

villagers. This means that in a typical village with 700 registered voters, up to 400 may
have received indirect information about the candidate platform debated at the town hall
meeting. If those 400 mentioned the meeting to one additional individual, the whole village
may have received the information. This communication may be facilitated by the clarity
and specificity of the candidate policy proposals discussed at the town hall meeting. Thus,
this individual-level mechanism of information sharing may help to explain the aggregate
village-level spillover effects that are observed.23
Insert Table 5
6.1 MONEY AND VOTES
Is the observed effect driven or influenced by cash distribution? The data suggest this
is highly unlikely. Figure 6 shows the distribution of turnout among voters in control villages
who received money versus those who did not. Since we are looking at control villages, we
can be assured that the treatment is not driving differences in turnout. The distribution of
turnout looks similar in both groups, although it appears that turnout among those receiving
money was slightly larger in the highest turnout villages.
In terms of the distribution of opposition votes, Figure 7 shows that money distribu-
tion was most prevalent in villages with middling opposition vote shares (between 20 and
60 percent). A similar pattern is exhibited in Figure 8 which shows that the villages with
the most individuals reporting having received money from the incumbent were those with
mid-levels of vote share for the incumbent (between 30% and 70%). These results raise a
number of possibilities. For instance, it is possible that in places with mid-level vote shares
for both opposition and incumbent, more money is distributed. If so, this would increase
the likelihood of individuals receiving money from numerous sources, thus making it difficult
to assess the effect of payments on vote choice. These results are interesting by themselves
and will be further explored in future research.23As we mentioned earlier, in the treatment villages, even those who did not attend the meetings are
more likely to vote for the treatment candidate than voters in the control villages. The results bear some
similarities with the "ground work by activists" that is at the core of Obama 2008 and 2012 presidential
campaigns.
20
Insert Figures 6, 7 and 8 here
Table 6 examines whether the treatment had heterogeneous effects among those who
received money and those who did not. The results show that money had no effect on turnout
at the village level and negative effect on vote choice at the individual level. Table 7A
displays data on money distribution by treatment and control group and Table 7C displays
the attendance distribution by whether or not the respondent received money. A simple
t-test among those who were subjected to the treatment and those who were in the control
group shows that there were no differences in the proportion of those who received money
(Table 7B). Similar results are shown among those who attended the meetings. The difference
is not statistically significant at conventional levels (t = 1.03) (Table 7D). Thus, the presence
of money was not beneficial for any party in particular. This is a rather stunning result, given
that an estimated $50 million was spent by the treatment candidates during the election.
Insert Table 6, 7A, 7B, 7C, and 7D here
7 CONCLUDING REMARKS
A field experiment was conducted in Benin to investigate the effect of a deliberative
campaign on political behavior. We find that, compared to status quo rallies, town hall
meetings featuring deliberation have a positive effect on measures of turnout and voting for
the candidate whose campaign conducted them. Moreover, these effects are substantively
large and all segments of the population are affected more or less equally. Furthermore, we
demonstrate that the key mechanism underlying these effects is one of motivated individuals
actively sharing information gained at the meetings with others in their social networks.
We believe that this paper is an important contribution to the extant literature on
transitions from targeted to universalistic redistribution. While most studies have focused
on the structural factors facilitating the transition away from clientelism, such as economic
development and the rise of mass communication, this paper focuses on specific campaign
institutions and their ability to limit the electoral appeal of clientelism. More specifically, we
study the effects of a campaign meeting where the candidate or his representative presented
the platform for approximately 10 minutes and received extensive feedback for 60 minutes
(two-way communication) versus another one in which the candidate presented his platform
21

for 60 minutes with 10 minutes of feedback (one-way communication). We find that these
seemingly minor differences matter for electoral support for universalistic policies. The
results lend some support to our earlier claim that clientelism may be driven in part by
the nature of political institutions. More specifically, a two-way communication strategy
may help voters learn of cross-district externalities and, as a result, support broad public
goods platforms. In turn, this may induce candidates to switch from platforms of targeted
redistribution to more efficient, universalistic redistribution.
There are several directions for future research. In terms of the role of institutions in
promoting universalistic policies to overcome clientelism, future work could focus on three
factors. First, we could study improvements in post-election policy outcomes by having
delegates from town hall meetings lobby the winner of the election. Such research could de-
termine whether delegates, armed with the specific campaign promises of the candidates, can
effectively influence implementation decisions of the promised policies. Second, to enhance
the effectiveness of policy deliberation, debates could be broadcast on radio or television.
With a much larger audience involved, the electoral outcome for the candidates may be better
and the post-election lobbying more effective. Finally, in the experiment described in this
paper, investment in optimal universalistic policy development was exogenous. The policies
were designed by a research center and communicated to candidates at the policy conference
described above. As suggested by Buisseret and Wantchekon (2012), institutions such as
primary elections could induce candidates to endogenously invest in developing specific and
transparent platforms. With better candidate involvement in the design of electoral plat-
forms, policy deliberations might be more effective and the implementation of the promised
policies more likely.
REFERENCES
Acemoglu, Daron, and James A. Robinson. 2001. Inefficient Redistribution. The Ameri-
can Political Science Review, Vol. 95, No. 3, 649-661
Alesina, Alberto, and Dani Rodrik. 1994. Distributive Politics and Economic Growth.
Quarterly Journal of Economics, 109: 465-490.
Amuwo, Kunle. 2003. State and Politics of Democratic Consolidation in Benin, 1990-1999,
22

in Julius Ibonvbere and John Mbaku, eds., Political Liberalization and Democratization
in Africa: Lessons from Country Experiences. Westport, CT: Praeger.
Atchade, F. Yves, and Leonard Wantchekon. 2009. Randomized Evaluation of Institutions:
Theory with Applications to Voting and Deliberation Experiments. Working Paper,
New York University.
Austen-Smith, David, and Timothy Feddersen. 2006. Deliberation, Preference Uncer-
tainty and Voting Rules. American Political Science Review, Vol. 100. No 2, 209-217.
Banegas, Richard. 1998. “Bouffer l’Argent, Politique du Ventre, Democratie et Clien-
telisme au Benin” in Jean-Louis Briquet et Frederic Sawicki, eds., Clientelisme Poli-
tique dans les Societes Contemporaines. Paris: Presses Universitaires de France.
Banerjee, Abhijit V., Selvan Kumar, Rohini Pande and Felix Su. 2011. Do Informed
Voters Make Better Choices? Experimental Evidence from Urban India. Working
Paper, Harvard University.
Bardhan, Pranab. 2002. Decentralization of Governance and Development. The Journal
of Economic Perspectives, Vol. 4, No. 3, 3-7.
Bartels, Larry. 1996. Uninformed Votes: Information Effects in Presidential Elections.
American Journal of Political Science 40(1):194-230.
Blimpo, Moussa, and David Evans. 2011. School Based Management, Local Capacity,
and Educational Outcomes: Lessons from a Randomized Field Experiment. Working
Paper, Stanford University.
Brady, Sidney Verba, and Kay Lehman Schlozman. 1995. Beyond SES: A Resource Model
of Political Participation. American Political Science Review, Vol. 89, No. 2, 271-294.
Brusco, Valeria, Marcelo Nazareno, and Susan Stokes. 2004. Vote Buying in Argentina.
Latin American Research Review, 39(2):66-88.
Buisseret, Peter, and Leonard Wantchekon. 2012. Party Primaries and Transition from
Clientelism. Working Paper, Princeton University.
23
Burden, Barry. 2000. Turnout and National Election Studies. Political Analysis 8(4):
389-398.
Casey, Katherine, Rachel Glennerster and Edward Miguel. 2012. Reshaping Institutions:
Evidence on Aid Impacts Using a Pre-Analysis Plan. Quarterly Journal of Economics,
forthcoming.
Chong, Alberto, Ana de la O, Dean Karlan and Leonard Wantchekon. 2011. Looking
Beyond the Incumbent: The Effect of Exposing Corruption on Electoral Outcomes.
NBER Working Paper 17679.
Delli Carpini, Michael X., and Scott Keeter. 1996. What Americans Know about Politics
and Why it Matters. New Haven, CT: Yale University Press.
Dixit, Avinash, and John Londegran. 1996. The Determinants of Success of Special Interest
in Redistributive Politics. Journal of Politics, Vol. 58, 1132-1155.
Easterly, William, and Ross Levine. 1997. Africa Growth Tragedy: Policies and Ethnic
Divisions. Quarterly Journal of Economics, 112, 1203-1250.
Fearon, James, Macartan Humphreys, and Jeremy M. Weinstein. 2009. Can Development
Aid Contribute to Social Cohesion after Civil War? Evidence from a Field Experiment
in Post-Conflict Liberia. American Economic Review: Papers & Proceedings 2009,
99(2): 287-291.
Feddersen, Timothy, and Wolfgang Pesendorfer. 1996. The Swing Voter’s Curse, American
Economic Review, Vol. 86, No. 3.
Feddersen, Timothy, and Alvaro Sandroni. 2006. A Theory of Participation in Elections.
American Economic Review, 96(4): 1271-1282.
Fishkin, James. 1997. The Voice of the People: Public Opinion and Democracy. New
Haven, CT: Yale University Press.
Fujiwara, Thomas, and Leonard Wantchekon. 2012. Can Informed Deliberation Overcome
Clientelism? Experimental Evidence from Benin. Working Paper, Princeton Univer-
sity.
24

Gerber, Alan, and Donald P. Green and David Nickerson. 2003. Getting out the Vote in
Local Elections: Results from Six Canvassing Experiments. The Journal of Politics,
Vol. 65, No. 4, 1083-1096,
Gerber, Alan, and Donald P. Green. 2000. The Effects of Canvassing, Phone Calls, and
Direct Mail on Voter Turnout: A Field Experiment. American Political Science Review,
Vol. 94, No. 3, 653-663.
Gilens, Martin. 2001. “Political Ignorance and Collective Policy Preferences.” American
Political Science Review 95(2):379-396.
Gisselquist, Rachel. 2006. Benin’s 2006 Presidential Elections. Working Paper, MIT.
Goeree, Jakob K., and Leeat Yariv. 2011. An Experimental Study of Collective Delibera-
tion. Econometrica, 79(3): 893-921.
Gutman, Amy, and Dennis Frank Thompson. 1996. Democracy and Disagreement: Why
moral conflict cannot be avoided in politics. Cambridge, MA: Harvard University
Press.
Habermas, Jurgen. 1996. Between Facts and Norms: Contributions to a Discourse Theory
of Law and Democracy. Cambridge, MA: MIT Press.
Howitt, Peter. 2005. Health, Human Capital and Economic Growth: A Shumpterian Per-
spective. In Health and Economic Growth: Findings and Policy Implications, Guillem
Lopez-Casasnovas, Berta Rivera and Luis Currais, eds. Cambridge, MA: MIT Press,
19-40.
Imai, Kosuke, Luke Keele, Dustin Tingley, and Teppei Yamamoto. 2011. Unpacking the
Black Box of Causality: Learning about Causal Mechanisms from Experimental and
Observational Studies.” American Political Science Review, Vol. 105, No. 4, 765-789.
Jeune Afrique . 2011. Etat de l’Afrique. Hors Serie, No 27.
Keefer, Philip, and Stuti Khemani. 2005. Democracy, Public Expenditures, and the Poor:
Understanding Political Incentives for Providing Public Services. World Bank Research
Observer Vol. 20, 1-27.
25
Keefer, Philip, and Razvan Vlaicu. 2008. Democracy, Credibility, and Clientelism. Journal
of Law, Economics, and Organization, 24(2): 371-406.
Kitschelt, Herbert, and Steven Wilkinson (eds.). 2007. Patrons or Policies? Patterns of
Democratic Accountability and Political Competition. New York: Cambridge Univer-
sity Press.
Lemarchand, René. 1972. Political Clientelism and Ethnicity in Tropical Africa: Compet-
ing Solidarities in Nation-Building. American Political Science Review, 66.
Lindbeck, Assar, and Jurgen Weibull. 1987. Balanced-Budget Redistribution as the Out-
come of Political Competition. Public Choice, Vol. 52, 273-297.
Lizzeri, Alessandro, and Nicola Persico. 2001. The Provision of Public Goods under Al-
ternative Electoral Incentives. American Economic Review, Vol. 91, No.1, 225-239.
Lizzeri, Alessandro, and Nicola Persico. 2004. Why Did the Elites Extend the Suffrage?
Democracy and the Scope of Government, With an Application to Britain’s "Age of
Reform." Quarterly Journal of Economics, Vol. 119, No. 2, 707-765.
Lopez-Casasnovas, Guillem, Berta Rivera and Luis Currais (eds). 2005. Health and Eco-
nomic Growth: Findings and Policy Implications. Cambridge, MA: MIT Press.
Lupia, Arthur. 2002. Deliberation Disconnected: What it Takes to Improve Civic Compe-
tence. Law and Contemporary Problems 65: 133-150.
Lupia, Arthur. 2008. Beyond Facts and Norms: Contributions of Social Science to Delib-
erative Legitimacy. Working Paper, University of Michigan.
Luskin, R.C., J. Fishkin and R. Jowell. 2002. Considered opinions: Deliberative polling in
Britain. British Journal of Political Science 32: 455-487.
Macedo, Stephen. 2010. Why Public Reason? Citizens’ Reasons and the Constitution of
the Public Sphere. Working Paper, Princeton University.
Mansbridge, Jane. 1983. Beyond Adversary Democracy. Chicago: University of Chicago
Press.
26

Meirowitz, Adam. 2006. “Designing institutions to aggregate private beliefs and values”
Quarterly Journal of Political Science, 1(4):373-392.
Mendelberg, Tali, Nicholas Goedert and Christopher Karpowitz. 2011. “Does Descriptive
Representation Encourage Women to Deliberate with a Distinctive Voice?” Working
Paper, Princeton University.
Mo Ibrahim Foundation. The Ibrahim Index 2011. http://www.moibrahimfoundation.org
Mutz, Diana. 2006. Hearing the Other Side: Deliberative versus Participatory Democracy.
New York: Cambridge University Press.
Nichter, Simeon. 2008. Vote Buying or Turnout Buying? Machine Politics and the Secret
Ballot. American Political Science Review, 102:19-31.
Olken, Benjamin. 2010. Direct Democracy and Local Public Goods: Evidence from a Field
Experiment in Indonesia. American Political Science Review 104 (2) 243-267.
Rawls, John. 1997. "The Idea of Public Reason Revisited" The University of Chicago Law
Review, Vol. 64, No. 3, 765-807
Reinnika, Ritva, and Jakob Svensson. 2005. Fighting Corruption to Improve Schooling:
Evidence from a Newspaper Campaign in Uganda. The Journal of the European Eco-
nomic Association. Vol. 3, No. 2-3, 259-267.
Riker, Wlliam, and Peter C. Ordeshook. 1968. A Theory of the Calculus of Voting. Amer-
ican Political Science Review, 62 (March): 25-42.
Saint Paul, Gilles, and Thierry Verdier. 1993. Education, Democracy and Growth. Jour-
nal of Development Economics, 42, 399-407.
Sala-i-Martin, Xavier. 2002. Poor People are Unhealthy People...and Vice Versa. Pro-
ceedings of the International Meeting of Health Economics, Paris 2002.
Stokes, Susan, Thad Dunning, Marcelo Nazareno, and Valeria Brusco. 2011. Buying Votes:
Distributive Politics in Democracies. Manuscript, Yale University.
Van de Walle, Nicolas. 2003. Presidentialism and Clientelism in Africa’s Emerging Party
Systems. Journal of Modern African Studies, Vol. 41, no. 2, 297-321.
27

Van de Walle, Nicolas. 2007. Meet the New Boss, Same as the Old Boss? The Evolution
of Political Clientelism in Africa. In Herbert Kitschelt and Steven Wilkinson, eds.,
Patrons, Clients, and Policies: Patterns of Democratic Accountability and Political
Competition, pp. 112-149. New York: Cambridge University Press.
Vicente, Pedro, and Leonard Wantchekon. 2009. Clientelism and Vote-Buying: Lessons
from Field Experiments in West Africa. Oxford Review of Economic Policy, 25(2):192-
305.
Wantchekon, Leonard. 2003. Clientelism and Voting Behavior: Evidence from a Field
Experiment in Benin. World Politics, Vol. 55, No. 3, 399-422.
Wantchekon, Leonard. 2008. Expert Information, Public Deliberation and Electoral Sup-
port for Good Governance: Experimental Evidence from Benin. Working Paper, New
York University.
World Bank. 2008. Benin Country Memorandum. Draft.
28

MAP OF TREATMENT AND CONTROL VILLAGES.

FIGURE 1. DISTRIBUTION OF TURNOUT BY TREATMENT STATUS.
FIGURE 2. DISTRIBUTION OF TOTAL VOTERS BY TREATMENT STATUS.

FIGURE 3. DISTRIBUTION OF REGISTERED VOTERS BY TREATMENT STATUS.
TABLE 1A: DIFFERENCES IN OFFICIAL AND SELF-REPORTED VOTING BEHAVIOR
Panel A: O�cial Turnout-Self Reported Turnout
Overall Opposition Yayi
Treatvil 2.452 1.548 4.924(1.584) (1.581) (4.051)
Constant -15.20*** -5.520*** -16.37***(3.726) (1.573) (4.148)
N 5113 3744 1369
Panel B: O�cial Vote Outcomes-Self-Reported VoteOverall Opposition Yayi
Treatvil -0.248 -0.0928 -0.672(1.878) (2.224) (3.535)
Constant 78.46*** 18.46*** 78.66***(5.503) (2.525) (5.387)
N 5113 3744 1369
Standard errors in parentheses clustered at the village level. Commune fixed e↵ects included
*p < 0.05, **p < 0.01, ***p < 0.001
DV in Panel A: O�cial Turnout - Self Reported Turnout (mean village level)
DV in Panel B: O�cial Vote - Self Reported Vote for treated candidate (mean village level)
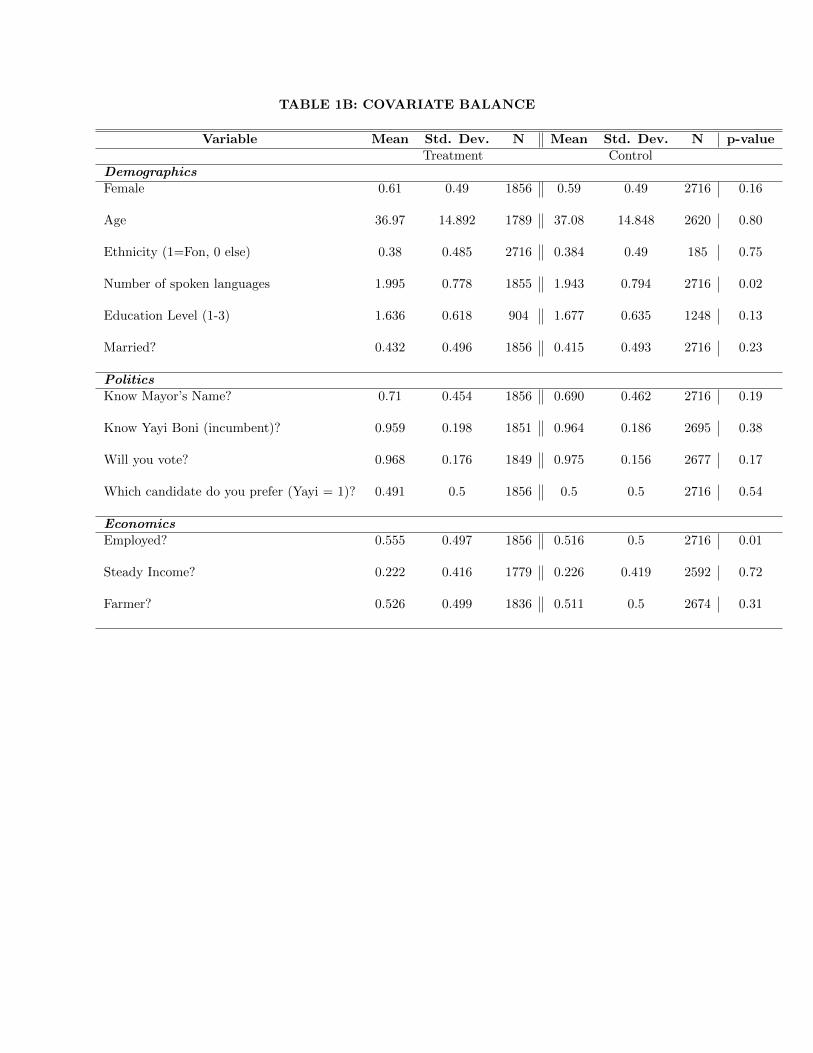
TABLE 1B: COVARIATE BALANCE
Variable Mean Std. Dev. N Mean Std. Dev. N p-valueTreatment Control
Demographics
Female 0.61 0.49 1856 0.59 0.49 2716 0.16
Age 36.97 14.892 1789 37.08 14.848 2620 0.80
Ethnicity (1=Fon, 0 else) 0.38 0.485 2716 0.384 0.49 185 0.75
Number of spoken languages 1.995 0.778 1855 1.943 0.794 2716 0.02
Education Level (1-3) 1.636 0.618 904 1.677 0.635 1248 0.13
Married? 0.432 0.496 1856 0.415 0.493 2716 0.23
Politics
Know Mayor’s Name? 0.71 0.454 1856 0.690 0.462 2716 0.19
Know Yayi Boni (incumbent)? 0.959 0.198 1851 0.964 0.186 2695 0.38
Will you vote? 0.968 0.176 1849 0.975 0.156 2677 0.17
Which candidate do you prefer (Yayi = 1)? 0.491 0.5 1856 0.5 0.5 2716 0.54
Economics
Employed? 0.555 0.497 1856 0.516 0.5 2716 0.01
Steady Income? 0.222 0.416 1779 0.226 0.419 2592 0.72
Farmer? 0.526 0.499 1836 0.511 0.5 2674 0.31
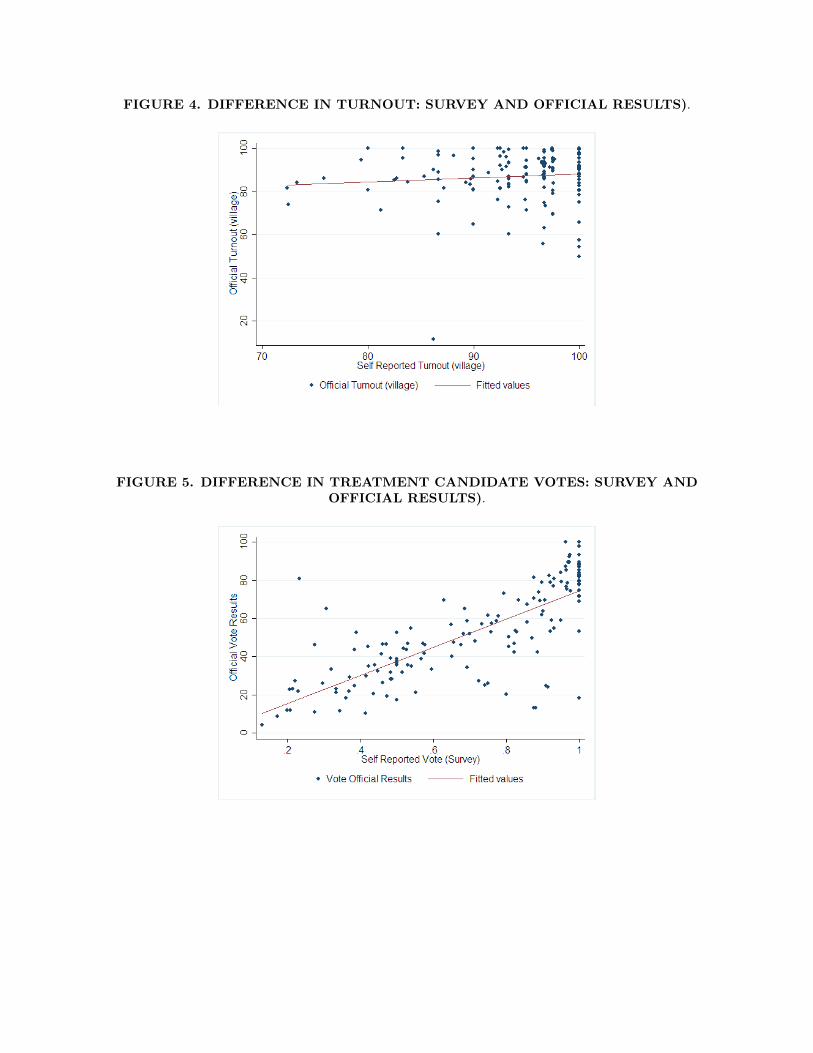
FIGURE 4. DIFFERENCE IN TURNOUT: SURVEY AND OFFICIAL RESULTS).
FIGURE 5. DIFFERENCE IN TREATMENT CANDIDATE VOTES: SURVEY ANDOFFICIAL RESULTS).
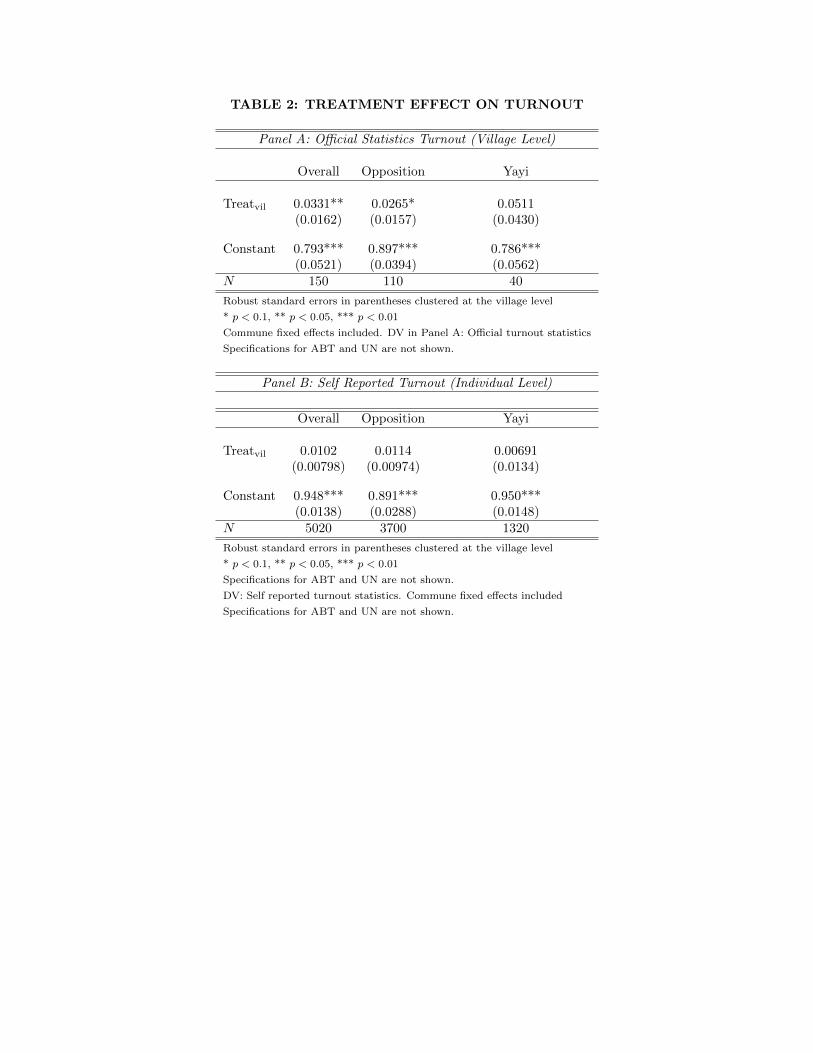
TABLE 2: TREATMENT EFFECT ON TURNOUT
Panel A: O�cial Statistics Turnout (Village Level)
Overall Opposition Yayi
Treatvil 0.0331** 0.0265* 0.0511(0.0162) (0.0157) (0.0430)
Constant 0.793*** 0.897*** 0.786***(0.0521) (0.0394) (0.0562)
N 150 110 40
Robust standard errors in parentheses clustered at the village level
* p < 0.1, ** p < 0.05, *** p < 0.01
Commune fixed e↵ects included. DV in Panel A: O�cial turnout statistics
Specifications for ABT and UN are not shown.
Panel B: Self Reported Turnout (Individual Level)
Overall Opposition Yayi
Treatvil 0.0102 0.0114 0.00691(0.00798) (0.00974) (0.0134)
Constant 0.948*** 0.891*** 0.950***(0.0138) (0.0288) (0.0148)
N 5020 3700 1320
Robust standard errors in parentheses clustered at the village level
* p < 0.1, ** p < 0.05, *** p < 0.01
Specifications for ABT and UN are not shown.
DV: Self reported turnout statistics. Commune fixed e↵ects included
Specifications for ABT and UN are not shown.

TABLE 3: TREATMENT EFFECT ON VOTES
Panel A: Self Reported Vote Outcomes
Overall Opposition Yayi
Treatvil 0.0599*** 0.0864*** -0.0101(0.0206) (0.0275) (0.0156)
Constant 0.959*** 0.570*** 0.992***(0.0235) (0.0974) (0.0112)
N 4529 3285 1244
Panel B: Self Reported Candidate PreferenceOverall Opposition Yayi
Treatvil 0.0663*** 0.0999*** -0.0256(0.0212) (0.0270) (0.0227)
Constant 0.910*** 0.770*** 0.953***(0.0222) (0.0572) (0.0162)
N 5113 3744 1369
Panel C: O�cial Vote Results
Overall Opposition Yayi
Treatvil -0.00522 -0.000479 -0.0183(0.0217) (0.0251) (0.0433)
Constant 0.809*** 0.346*** 0.814***(0.0561) (0.0278) (0.0533)
N 150 110 40
Robust standard Errors in parentheses clustered at the village level
Commune fixed e↵ects included
* p < 0.1, ** p < 0.05, *** p < 0.01
Specifications for ABT and UN are not shown for reasons of space.
DV Panel A: Self reported vote choice for ”treated” candidate
DV Panel B: Self reported preference (e.g. ”Best candidate”) for ”treated” candidate
DV Panel C: Village level o�cial vote result for the ”treated” candidate
Treatvil refers to villages assigned to the treatment
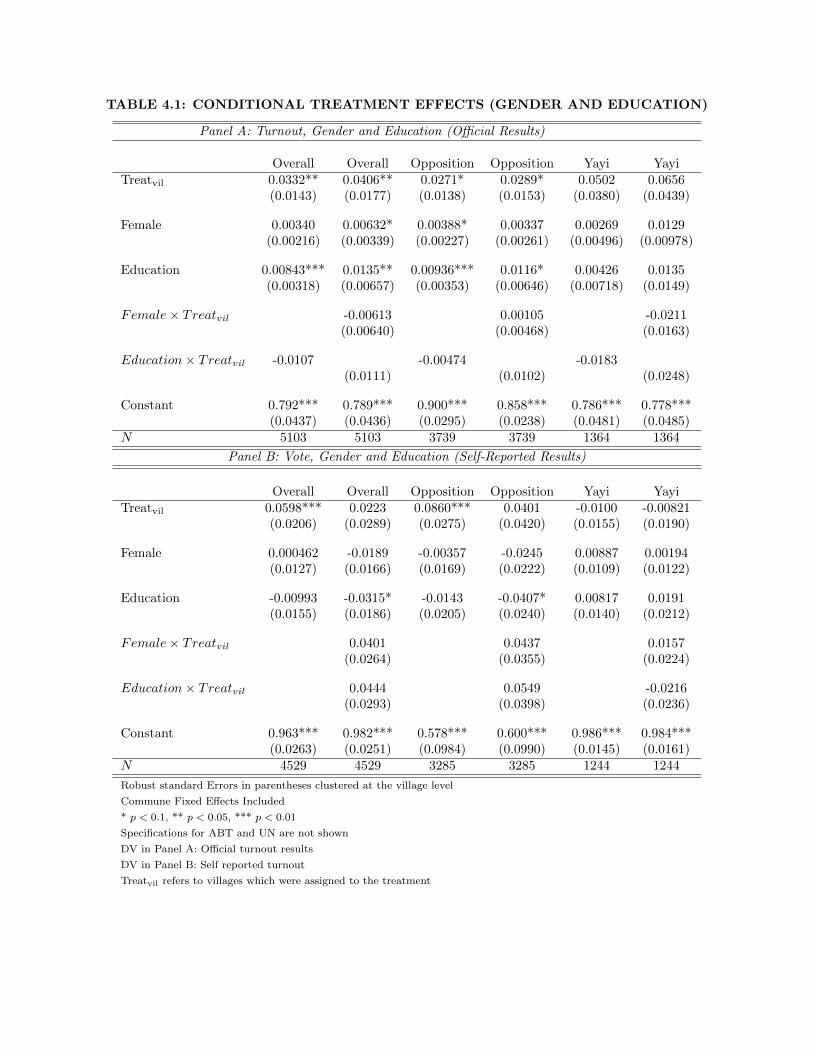
TABLE 4.1: CONDITIONAL TREATMENT EFFECTS (GENDER AND EDUCATION)
Panel A: Turnout, Gender and Education (O�cial Results)
Overall Overall Opposition Opposition Yayi YayiTreatvil 0.0332** 0.0406** 0.0271* 0.0289* 0.0502 0.0656
(0.0143) (0.0177) (0.0138) (0.0153) (0.0380) (0.0439)
Female 0.00340 0.00632* 0.00388* 0.00337 0.00269 0.0129(0.00216) (0.00339) (0.00227) (0.00261) (0.00496) (0.00978)
Education 0.00843*** 0.0135** 0.00936*** 0.0116* 0.00426 0.0135(0.00318) (0.00657) (0.00353) (0.00646) (0.00718) (0.0149)
Female⇥ Treatvil -0.00613 0.00105 -0.0211(0.00640) (0.00468) (0.0163)
Education⇥ Treatvil -0.0107 -0.00474 -0.0183(0.0111) (0.0102) (0.0248)
Constant 0.792*** 0.789*** 0.900*** 0.858*** 0.786*** 0.778***(0.0437) (0.0436) (0.0295) (0.0238) (0.0481) (0.0485)
N 5103 5103 3739 3739 1364 1364
Panel B: Vote, Gender and Education (Self-Reported Results)
Overall Overall Opposition Opposition Yayi YayiTreatvil 0.0598*** 0.0223 0.0860*** 0.0401 -0.0100 -0.00821
(0.0206) (0.0289) (0.0275) (0.0420) (0.0155) (0.0190)
Female 0.000462 -0.0189 -0.00357 -0.0245 0.00887 0.00194(0.0127) (0.0166) (0.0169) (0.0222) (0.0109) (0.0122)
Education -0.00993 -0.0315* -0.0143 -0.0407* 0.00817 0.0191(0.0155) (0.0186) (0.0205) (0.0240) (0.0140) (0.0212)
Female⇥ Treatvil 0.0401 0.0437 0.0157(0.0264) (0.0355) (0.0224)
Education⇥ Treatvil 0.0444 0.0549 -0.0216(0.0293) (0.0398) (0.0236)
Constant 0.963*** 0.982*** 0.578*** 0.600*** 0.986*** 0.984***(0.0263) (0.0251) (0.0984) (0.0990) (0.0145) (0.0161)
N 4529 4529 3285 3285 1244 1244
Robust standard Errors in parentheses clustered at the village level
Commune Fixed E↵ects Included
* p < 0.1, ** p < 0.05, *** p < 0.01
Specifications for ABT and UN are not shown
DV in Panel A: O�cial turnout results
DV in Panel B: Self reported turnout
Treatvil refers to villages which were assigned to the treatment
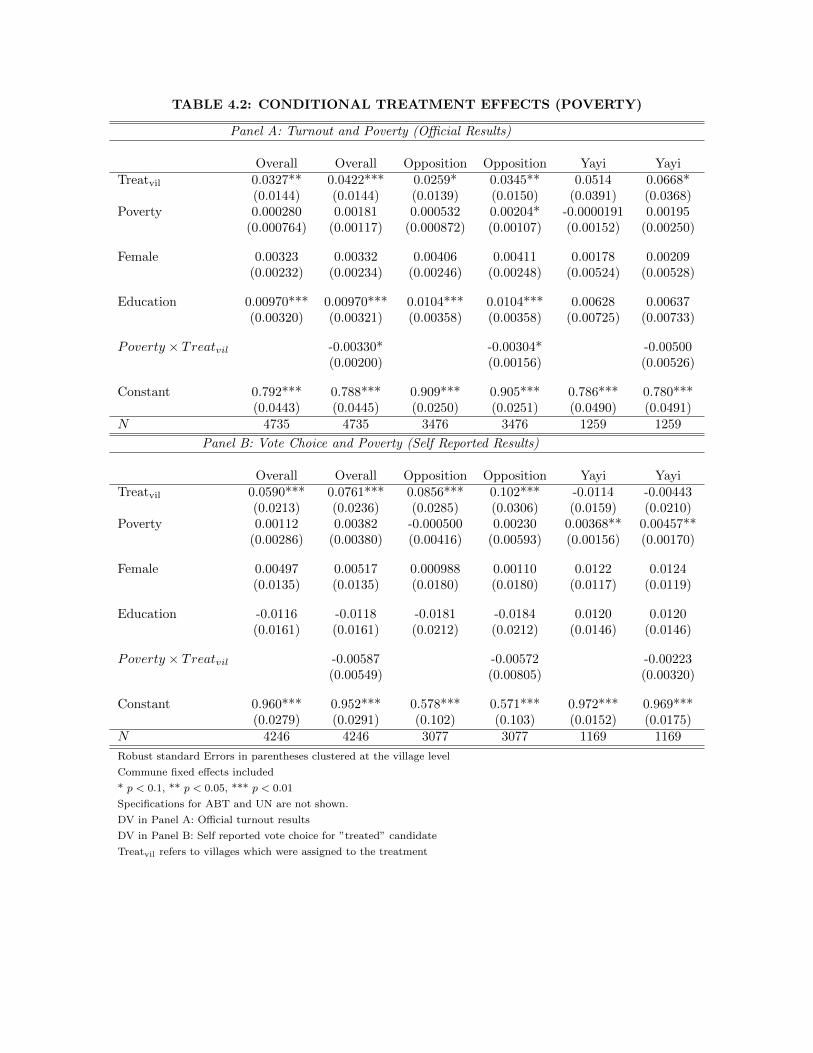
TABLE 4.2: CONDITIONAL TREATMENT EFFECTS (POVERTY)
Panel A: Turnout and Poverty (O�cial Results)
Overall Overall Opposition Opposition Yayi YayiTreatvil 0.0327** 0.0422*** 0.0259* 0.0345** 0.0514 0.0668*
(0.0144) (0.0144) (0.0139) (0.0150) (0.0391) (0.0368)Poverty 0.000280 0.00181 0.000532 0.00204* -0.0000191 0.00195
(0.000764) (0.00117) (0.000872) (0.00107) (0.00152) (0.00250)
Female 0.00323 0.00332 0.00406 0.00411 0.00178 0.00209(0.00232) (0.00234) (0.00246) (0.00248) (0.00524) (0.00528)
Education 0.00970*** 0.00970*** 0.0104*** 0.0104*** 0.00628 0.00637(0.00320) (0.00321) (0.00358) (0.00358) (0.00725) (0.00733)
Poverty ⇥ Treatvil -0.00330* -0.00304* -0.00500(0.00200) (0.00156) (0.00526)
Constant 0.792*** 0.788*** 0.909*** 0.905*** 0.786*** 0.780***(0.0443) (0.0445) (0.0250) (0.0251) (0.0490) (0.0491)
N 4735 4735 3476 3476 1259 1259
Panel B: Vote Choice and Poverty (Self Reported Results)
Overall Overall Opposition Opposition Yayi YayiTreatvil 0.0590*** 0.0761*** 0.0856*** 0.102*** -0.0114 -0.00443
(0.0213) (0.0236) (0.0285) (0.0306) (0.0159) (0.0210)Poverty 0.00112 0.00382 -0.000500 0.00230 0.00368** 0.00457**
(0.00286) (0.00380) (0.00416) (0.00593) (0.00156) (0.00170)
Female 0.00497 0.00517 0.000988 0.00110 0.0122 0.0124(0.0135) (0.0135) (0.0180) (0.0180) (0.0117) (0.0119)
Education -0.0116 -0.0118 -0.0181 -0.0184 0.0120 0.0120(0.0161) (0.0161) (0.0212) (0.0212) (0.0146) (0.0146)
Poverty ⇥ Treatvil -0.00587 -0.00572 -0.00223(0.00549) (0.00805) (0.00320)
Constant 0.960*** 0.952*** 0.578*** 0.571*** 0.972*** 0.969***(0.0279) (0.0291) (0.102) (0.103) (0.0152) (0.0175)
N 4246 4246 3077 3077 1169 1169
Robust standard Errors in parentheses clustered at the village level
Commune fixed e↵ects included
* p < 0.1, ** p < 0.05, *** p < 0.01
Specifications for ABT and UN are not shown.
DV in Panel A: O�cial turnout results
DV in Panel B: Self reported vote choice for ”treated” candidate
Treatvil refers to villages which were assigned to the treatment

TABLE 5 CHANNELS OF CAUSALITY: INFORMATION SHARING AND AUDIENCEEFFECTS (MEDIATION ANALYSIS)
PANEL A: MEDIATION ANALYSISVotes Votes
Treatvil 6.003 16.20(9.306) (11.35)
Share Information 21.49***(3.785)
Audience E↵ects 2.799**(1.167)
Constant 61.97*** 70.67***(9.700) (11.63)
Observations 1,170 704R-squared 0.091 0.035
PANEL B: RESULTS
ACME1 8.85 .24ACME0 8.85 .24DirectE↵ect1 6.13 16.35DirectE↵ect0 6.13 16.35TotalE↵ect 14.98 16.60CI Zero No No
Robust standard errors clustered at the village level in parentheses
* p < 0.1, ** p < 0.05, *** p < 0.01
Treatvil refers to villages which were assigned to the treatment
Includes controls for age, education and gender
Share Information: Did you share information about the meeting with other people?
Audience: (1) The meeting help you know what other villagers think
Audience: (2) You get to know the candidate better after the meeting
Audience: (2) You felt listened after the meeting

FIGURE 6. DISTRIBUTION OF TURNOUT BY MONEY STATUS IN CONTROLVILLAGES).
FIGURE 7. DISTRIBUTION OF OPPOSITION VOTES BY MONEY STATUS INCONTROL VILLAGES).

FIGURE 8. DISTRIBUTION OF INCUMBENT VOTES BY MONEY STATUS INCONTROL VILLAGES).

TABLE 6. TREATMENT EFFECTS BY MONEY STATUS
Turnout VotesAll VotesAll2 VotesOpp VotesYayiTreatvil 3.101** 9.061*** 12.73*** 0.778
(1.544) (2.180) (3.008) (1.191)
Money 0.154 0.931 -2.630 3.015 -3.173(0.844) (2.277) (1.956) (2.831) (3.001)
Money ⇥ Treatvil 0.425 -9.524** -11.72** -6.910(1.350) (3.111) (3.786) (4.822)
Treatind (Attendance) 17.48***(2.451)
Money ⇥ Treatind -4.099(3.298)
Constant 79.60*** 96.15*** 95.91*** 55.20*** 100.9***(4.333) (2.156) (2.457) (9.357) (1.019)
N 4987 4466 4460 3251 1215
Standard errors clustered at the village level in parentheses
Commune fixed e↵ects included
* p<0.1, ** p<0.05, *** p<0.01
Treatind refers to individuals who received the treatment (town-hall meetings)
Treatvil refers to villages which were assigned to the treatment

TABLE 7A: MONEY DISTRIBUTION BY TREATMENT STATUS
Control Treatment Total
No Money 1835 1666 350170.20 70.21 70.20
Money 779 707 148629.80 29.79 29.80
Total 2614 2373 4987100 100 100
TABLE 7B: TWO-SAMPLE T TEST.
Group Observations Mean Std. Err.
Control 2614 .298 .008Treatment 2373 .297 .009
Ho: di↵ = 0t = .0058
TABLE 7C: ATTENDANCE DISTRIBUTION BY MONEY STATUS
No Money Money Total
No Attend 2608 1087 369574.6 73.2 74.18
Attend 888 398 128625.4 26.8 25.82
Total 3496 1485 4981100 100 100

TABLE 7D: TWO-SAMPLE T TEST.
Group Observations Mean Std. Err.
No Attend 3496 .254 .007Attend 1485 .268 .011
Ho: di↵ = 0t = -1.033
Related Documents