Report No. 40193 Policy Challenges for Education and Economic Growth in the Slovak Republic June 27, 2007 Human Development Sector Unit Europe and Central Asia Region Document of the World Bank

Welcome message from author
This document is posted to help you gain knowledge. Please leave a comment to let me know what you think about it! Share it to your friends and learn new things together.
Transcript
Report No. 40193 Policy Challenges for Education and Economic Growth in the Slovak Republic June 27, 2007 Human Development Sector Unit Europe and Central Asia Region
Document of the World Bank
ii
TABLE OF CONTENTS Preface ................................................................................................................................................1
The Role of Education in Supporting Economic Growth...................................................................2
A. Educational Threats to Continued Growth ...................................................................................3
Low Coverage of Secondary and Higher Education ......................................................................3
Deteriorating Learning Achievement .............................................................................................9
Skills Mismatch............................................................................................................................10
B. The Sources of Unsatisfactory Education Performance..............................................................21
Low Coverage of Secondary and Higher Education ....................................................................21
Deteriorating Learning Achievement ...........................................................................................25
Skills Mismatch............................................................................................................................31
C. Reform Options............................................................................................................................32
Limited Coverage of Secondary and Higher Education...............................................................32
Deteriorating Learning Achievement ...........................................................................................35
Skills Mismatch............................................................................................................................36
LIST OF TABLES Table 1: The Role of Education in the Stages of Economic Development.........................................3
Table 2: Educational Attainment of Out-of-School Roma Population by Age Group, 2006 .............8
Table 3: TIMSS Grade 8 Student Assessment Results for Science and Math for Countries Participating in the 1995, 1999, and 2003 Surveys ..........................................................................10
Table 4: Evolution of Secondary Enrollments by Type, 2000-2004 ................................................15
Table 5: Employers’ Perceptions on Skill Requirements .................................................................17
Table 6: Country Rankings and Mean Scores of 15-Year Old Students ..........................................18
Table 7: Growth of New Enrollments in Higher Education .............................................................22
Table 8: Projected Change in Slovakia’s School-Age Population, 2005-2025 (in thousands).........23
Table 9: Higher Education Enrollments and Projected Additional Resource Requirements under Alternative Expansion Scenarios, 2005-2025...................................................................................23
Table 10: Public Expenditures as a Percentage of GDP and Total Public Expenditures, Slovakia and other New Member States, 2003................................................................................................27
Table 11: Decomposition of Variation in PISA 2003 Results ..........................................................29
Table 12: Average Teacher Salary, Expressed as a Ratio of Per-Capita GDP, ................................30
Table 13: PISA 2000 Results: Mean Mathematical Literacy Scores,..............................................31
Table 14: Financing Normatives for Primary and Secondary Schools, 2004 (in current SK)..........37

iii
LIST OF FIGURES Figure 1: Gross Enrollment Ratios (in %), Slovakia and other OECD Countries 2002/03 ................4
Figure 2: Indicators of Education Coverage, 2004 .............................................................................5
Figure 3: Attainment of Higher Education among the Adult Population (in %), ...............................6
Figure 4: Growth in Higher Education Attainment by Cohort, Slovakia and OECD Comparator Countries.............................................................................................................................................6
Figure 5: Unemployment Rates by Educational Attainment for EU-10 Countries, 2006 ..................8
Figure 6: Unemployment Rates for the 15-24 Year Cohort in OECD Countries, 2005 ...................11
Figure 7: Proportion of Secondary Enrollments in Vocational Specializations in EU 10 Countries, 1998 and 2004...................................................................................................................................12
Figure 8: Unemployment Rates by Educational Attainment (first quarter, 2006)............................14
Figure 9: Average Earnings by Educational Attainment, 2005 ........................................................15
Figure 10: Lifelong Learning: the Percentage of Adult Population..................................................20
Figure 11: Public and Private Expenditure per Student on Education by Level,.............................26
Figure 12: Regional Averages in TIMSS Primary-School Math Scores, 1999 ................................28
LIST OF BOXES Box 1: Adapting VET to Evolving Skill Needs:...............................................................................13
Box 2: Factors Affecting Learning Achievement: The International Evidence ...............................25
Box 3: A Special Dimension of Education Coverage:......................................................................34

Preface This Education Policy Note was prepared by Michael Mertaugh, Lead Education Economist in the World Bank’s Europe and Central Asia Human Development Sector Unit, based on information provided by the Ministry of Education and Science and other sources cited in the Policy Note. Valuable background papers were prepared by Mr. Andrej Salner, consultant. Two staff of the World Bank’s Slovakia Country Office played a key role in organizing the background meetings and participated in discussion of the findings and recommendations of the Policy Note: Ingrid Brockova, Senior Country Program Officer, and Petra Vehovska, Operations Analyst. The counterpart team in the Ministry of Education and Science was led by Mr. František Schlosser, Head of Administration for the Ministry. Peer reviewers were Roger Grawe (consultant, former Country Director) and Jamil Salmi (Lead Education Specialist in the World Bank’s Education Department). The management team overseeing the study comprised Mamta Murti, Education Sector Manager for the World Bank’s Europe and Central Asia Region, and Suman Mehra, Country Program Coordinator and Acting Country Director.
2
The Role of Education in Supporting Economic Growth
1. Slovakia’s GDP grew at 6.0 % in 2005 and 6.6% in the second quarter of 2006, situating it among the fastest growing economies of the EU and OECD. The recent OECD Country Survey for the Slovak Republic1 documents Slovakia’s impressive economic performance over the past five years, and attributes this performance largely to sound macroeconomic policy and a major infusion of foreign direct investment (FDI):
In the last five years, Slovakia has introduced far-reaching macroeconomic and structural reforms and has become one of the fastest-growing OECD economies. It is now increasingly recognized as a model case of how macroeconomic stabilization, together with product, capital and labour market liberalization can help a country accelerate its catching-up process. The credibility of the new policies was supported by Slovakia’s accession to the European Union in May 2004. In this context, growth responded rapidly to the reforms, with a substantial contribution coming from the EU in the form of growing FDI and trade flows.2
2. Clearly, human capital development also played an important role in supporting this impressive economic performance. The OECD Economic Survey emphasizes the important role of foreign direct investment in bringing higher technology to the sectors – such as automobile assembly -- which have attracted the bulk of FDI. FDI firms are more productive than domestic firms; they also invest more heavily in their human and physical capita. But FDI will not continue as the major engine of growth indefinitely. Increasingly, the stimulus for growth will need to come from productivity improvements within existing firms. Slovakia’s success in maintaining its impressive recent growth performance will partly depend upon how effectively the productivity and management innovations of the FDI firms spill over to the rest of the economy. This, in turn, will depend largely upon the skills and the adaptability of Slovakia’s labor force. Education will need to play a critical role in building the skills and innovation-receptivity that are necessary to support the spill-over of FDI-led innovations to the rest of the economy. 3. A World Economic Forum study of global competitiveness3 identifies three successive stages of economic development—factor-driven growth, investment-driven growth, and innovation-driven growth—and characterizes the role of education in each of those stages (Table 1). Together with supportive macroeconomic and financial policy and infrastructure investments, education plays a key role in developing the necessary human capital to maintain competitiveness at each of these successive stages of development. By the coverage indicators in Table 1, Slovakia appears to have met most of the educational requirements for innovation-driven growth, the highest tier of economic performance. Is it, then, safe to assume that Slovakia’s education system will play a strong supporting role in maintaining the impressive record in economic growth? This policy note examines this question. It begins by describing several features of the education system that constitute a potential threat to continued economic growth. Next it identifies some of the factors contributing to suboptimal education performance. It concludes with a number of reform options for policy actions to ensure that education plays a positive role in supporting strong economic growth in the future.
1 OECD Economic Surveys: Slovak Republic, OECD, 2005. 2 Ibid, page 20. 3 Klaus Schwab, Michael Porter, and Jeffrey Sachs, eds, The Global Competitiveness Report, 2001/2002, Geneva, The World Economic Forum, 2001.

3
Table 1: The Role of Education in the Stages of Economic Development
Development
stage Key economic
challenges Focus of economic
production Education and labor-market
requirements Factor-driven growth
Get factor markets working properly to mobilize land, labor, and capital.
Natural resource extraction, assembly, labor-intensive manufacturing. Primary sector is dominant.
Basic education, low-level skills, disciplined work habits.
Investment- driven growth
Attract FDI and imported technology to exploit land, labor, and capital and begin to link the national economy with the global economy.
Manufacturing and outsourced service exports. Secondary sector is dominant.
Universal secondary education, improved secondary vocational and technical education, life-long learning to retool and update skills, flexible labor markets (easy entry, easy exit).
Innovation- driven growth
Generate high rate of innovation, and adaptation and commercialization of new technologies.
Innovative products and services at the global technology frontier. Tertiary sector is dominant.
Highly developed higher education, especially in science and engineering specializations; high rates of social learning, especially science-based learning; dynamic R&D sector linking higher education programs and innovating firms.
Source: Adapted from Klaus Schwab, Michael Porter, and Jeffrey Sachs, eds, The Global Competitiveness Report, 2001/2002, Geneva, The World Economic Forum, 2001. A. Educational Threats to Continued Growth 4. There are three educational threats to continued strong economic growth in Slovakia. These are a) : low coverage of secondary and higher education by comparison to competitor countries, b) declining quality of education as measured by international assessment of student achievement, and c) a mismatch between the skills provided in the education and training system and the skills required for continued strong economic growth. The first two are counterintuitive because educational coverage and quality are usually seen as strengths of Slovakia’s education system, not weaknesses. Their impacts are long term, and the interventions to address them also tend to be long-term in nature. The third threat – mismatch of skills -- presents the most immediate threat to continued growth and social stability. This section describes each of these educational threats in turn. Low Coverage of Secondary and Higher Education 5. It is widely recognized that educational attainment at the country level is an important contributor to economic growth4 and at an individual level is an important determinant of lifetime earnings. Regression analysis of 1999 and 2003 household survey data for Slovakia confirms the
4 There is an extensive research literature on the sources of growth in general, and on the role of human capital investments in particular, using both macro-level data and micro-level data on rates of return to education. See, for example., Robert J. Barro and Xavier Sala-i-Martin, Economic Growth, 2nd Edition, MIT Press, 2003; Erik A. Hanushek and Dennis D. Kimko, “Schooling, Labor-Force Quality and the Growth of Nations” American Economic Review, Vol. 90, No. 5, 2000; and Mark Bils and Peter J. Klenow, “Does Schooling Cause Growth?” American Economic Review, Vol. 90, No. 5, 2000. A recent summary piece focusing on the contribution of educational attainment to productivity and economic growth in the OECD countries is Andreas Schleicher’s “The Economics of Knowledge: Why Education is Key for Europe’s Success”, Lisbon Council Policy Brief, 2006.

4
progressive effect of education on individual earnings. Compared to individuals who have completed only basic education, completion of apprenticeship raises earnings by an average of 16 %; completion of secondary education raises earnings by an average of 32 %; and completion of higher education raises earnings by an average of 116 %.5
Figure 1: Gross Enrollment Ratios (in %), Slovakia and other OECD Countries 2002/03
0 50 100 150 200
AustraliaAustria
BelgiumCanada
Czech RepublicDenmark
FinlandFrance
GermanyGreece
HungaryIreland
ItalyJapanKorea
MexicoNetherlands
New ZealandNorwayPoland
PortugalSlovakia
SpainSweden
SwitzerlandTurkey
United KingdomUnited States
HigherSecondary
Source: World Development Indicators, 2005 The World Bank, 2005. Gross enrollment ratios may exceed 100% because the denominator is limited to population in the normal age group for each level of education, whereas the numerator may include enrollments above and below that age range. 6. Although coverage in upper secondary education and higher education in Slovakia is increasing, it remains below the levels in the OECD (Figure 1) and all of the EU members except Romania and Bulgaria (Figure 2). Higher education enrollments have grown quite rapidly during the past five years: full-time enrollments have grown by 3.9% per year since 2000, and part-time enrollments by 11.8% per year.6 Over the same period, the gross enrollment ratio in higher
5 The Quest for Equitable Growth in the Slovak Republic, A Two-Edged Sword: Competitiveness and Labor Market Polarization in the Slovak Republic, Report No. 32433-SK, The World Bank, September 19, 2005. 6 www.statistics.sk

5
education increased steadily from 13.4% in 1998 to 36.3%.7 Nevertheless, recent enrollment increases have not brought Slovakia up to the higher education coverage levels of most OECD and EU countries. The low coverage of higher education is evident in the very low proportion of the adult population with any higher education exposure (Figure 3). While Slovakia has made progress in raising the proportion of population with higher education attainment, other OECD countries have made more rapid progress. Slovakia’s ranking in higher education attainment of the adult population has fallen from 19th among 24 OECD comparator countries for the 1940-1949 cohort to 23rd of 24 OECD countries for the 1970-1979 cohort (Figure 4). This slippage implies a weakening of Slovakia’s human capital in relation to its major competitors in the region.
Figure 2: Indicators of Education Coverage, 2004
30
40
50
60
70
80
90
Bulgari
a
Czech
Rep
ublic
Estonia
Hunga
ryLa
tvia
Lithu
ania
Poland
Roman
ia
Slovak
ia
Sloven
iaEU 15
Perc
enta
ge o
f Tot
al
14
15
16
17
18
19
Year
s
Enrolled Percentage of 15–24 Year Old Cohort
Higher Education GrossEnrollment Ratio (%)
Expected Duration ofSchool Attendance (inyears)
Source: Eurostat database for enrolled percentage of 15-24 year old cohort and expected duration of school attendance; UNICEF Innocenti Center TRANSMONEE database for higher education gross enrollment ratio.
7 UNICEF Innocenti Center TRANSMONEE database.

6
Figure 3: Attainment of Higher Education among the Adult Population (in %),
Source: Figure 4.1, OECD Economic Surveys: Slovak Republic, OECD, 2005.
Figure 4: Growth in Higher Education Attainment by Cohort, Slovakia and OECD
Comparator Countries
Source: Andreas Schleicher, “Investing in Youth: Relevance of Youth for Future Generations”, Powerpoint Presentation at the Third Annual Education Conference for the Europe and Central Asia Region, World Bank and Russian Ministry of Education, St. Petersburg, October 4-6, 2006.
7 7 7 7 7 7
0
10
20
30
United States Netherlands Denmark Norway Canada Sweden IcelandAustralia SwitzerlandUnited KingdomFinlandGermanyJapan1France IrelandSpainNew Zealand Luxembourg Slovak Republic KoreaGreece Belgium Mexico Austria OECD averageEU19 average
1940-49 1950-59 1960-69 1970-79
Growth in university - level qualifications Approximated by the percentage of persons with ISCED 5A/6 qualfication
born in the period shown below (2004)
+2.9 +3.5 +3.7
7
7. Although most young people in Slovakia complete secondary education, a significant number of young people fail to do so – either not starting secondary school at all, or dropping out before completion. This group faces a very high risk of unemployment – by far the highest in the region (Figure 5) – as well as lifelong poverty. Recent longitudinal analysis of household survey data in Slovakia documents the multiple disadvantages faced by the individuals with low educational attainment, and reports a worsening trend for most of them.8 Non-completion of secondary education is a problem of national concern because it implies high social and budget costs for social assistance, as well as foregone contribution to national economic output. 8. Early school dropout is a particular problem for Roma children, who often do not continue schooling beyond basic education, with all of the negative economic consequences that that implies. The 2001 census found that 48% of Roma aged 15 and above had no education beyond the primary level. Moreover, of the few Roma children who do continue to secondary school, most attend special vocational schools which do not allow access to higher education and offer limited employment prospects. In 2001, only 0.3% of adult Roma had completed a full secondary education and started higher education, versus 10.8% for Slovak adults.9 As shown in Table 2, the educational attainment is slightly better for younger cohorts of Roma than older cohorts, but remains very high in absolute terms. Over 25% of out-of-school Roma aged 15-29 have not completed primary school, and only 22 % had ever completed secondary school.10 Low educational attainment contributes to the very high unemployment rate – about 80%11 -- for adult Roma. Although the Roma population currently accounts for a small share of Slovakia’s total population,12 unemployment among the Roma is responsible for about 30% of total unemployment.13 Since the Roma population is growing, and is expected to constitute 11% of the population by 2035,14 low educational attainment and high unemployment among the Roma population could derail future economic growth. Unless decisive actions are taken to address the Roma unemployment problem by raising educational attainment among young Roma and providing training and job assistance to Roma adults, high unemployment among the Roma will become a serious impediment to continued economic growth – both through increased social outlays and through foregone contributions to economic production.15
8 The Quest for Equitable Growth in the Slovak Republic, A Two-Edged Sword: Competitiveness and Labor Market Polarization in the Slovak Republic, Report No. 32433-SK, The World Bank, September 19, 2005. 9 2001 census figures are from Slovak Republic: Needs Assessment Study for the Roma Education Fund, Background Paper, December, 2004. 10 Source: Table 5.6, Jarmila Filadelfiová, Daniel Gerbery, and Daniel Škobla, Report on Living Conditions of Roma in Slovakia, UNDP, Bratislava, 2007. 11 OECD Economic Surveys: Slovak Republic, OECD, 2005. 12 Although the proportion of the population identifying themselves as Roma in the 2001 census was just 1.7%, this figure is undoubtedly an underestimate. Estimates by professional demographers put the number of Roma as high as 379,000 in 2001, or 7.1 % of the total population. (B. Vano, Demografická charackteristika rómskej populácie v SR, VDC-INFOSTAT, Bratislava, 2001.) The Center for Demographic Research projects that the Roma population will grow to about 520,000 by 2025, and will constitute about 11% of the population by 2035. (INFOSTAT-VDC, Prognózya vyova rómshenko obyvatelstva v SR do roku 2025, Bratislava, November, 2002.) 13 Ibid. 14 INFOSTAT–VDC, Prognózya vyova rómshenko obyvatelstva v SR do roku 2025, Bratislava, November, 2002. 15 Several examples of promising approaches to reduce early school drop-out are cited in the Roma Needs Assessment cited above, including targeted preschool programs, special language programs, interventions to address demand-side constraints, student scholarships, and normative financing.

8
Table 2: Educational Attainment of Out-of-School Roma Population by Age Group, 2006 (in Percent)
Source: Table 5.6, Jarmila Filadelfiová, Daniel Gerbery, and Daniel Škobla, Report on Living Conditions of Roma in Slovakia, UNDP, Bratislava, 2007.
Figure 5: Unemployment Rates by Educational Attainment for EU-10 Countries, 2006
0.0
5.0
10.0
15.0
20.0
25.0
30.0
35.0
40.0
45.0
Bulgari
a
Czech
Rep
ublic
Estonia
Hunga
ryLa
tvia
Lithu
ania
Poland
Roman
ia
Slovak
Rep
ublic
Sloven
ia
Basic Upper SecondaryUniversity
Source: EUROSTAT database
9
Deteriorating Learning Achievement 9. Although education quantity in terms of years of completed schooling has an important impact on economic growth and individual earnings, education quality in terms of learning achievement scores has been found to have an even stronger effect on economic growth and individual earnings.16 Recent analysis of the economic growth performance of countries participating in OECD’s PISA17 assessment finds that a 47-point improvement in mean mathematics score would bring about a one percentage point higher rate of GDP growth.18 10. As measured by international student assessment, learning achievement levels have historically been quite high in Slovakia. But recent results show a sharp fall in math and science achievement scores in both absolute and relative terms. The TIMSS19 international student assessment provides the most comprehensive international comparison of student learning achievement in grade 8 math and science. Although Slovakia’s average scores on the TIMSS math and science survey were comfortably above the international average in 1995 and 1999, they fell sharply in the most recent (2003) survey to a level well below the international average, and far below the average scores of the highest-performing Asian countries (Table 3). Slovakia’s decline in average math and science performance in 2003 was the second most precipitous decline in performance among the twenty countries participating in the TIMSS surveys.20 This decline stands in sharp contrast to the improvement in performance in Latvia, Lithuania, and Hungary, not to mention the improvements recorded in several already high-performing countries, such as Hong Kong, Japan, and Korea. Math and science education have traditionally been seen as an area of particular strength in Slovakia’s education system. Slovakia’s deteriorating performance in these areas as other competitors improve their performance is a warning signal that Slovakia’s labor force may be about to lose its competitive edge unless decisive actions are taken to reverse this trend. Section B of this Note summarizes the evidence on the causes of deteriorating learning achievement. Section C recommends a number of measures to reverse this trend.
16 Eric A. Hanushek and Ludger Wößmann,”The Role of Education Quality in Economic Growth,” World Bank Policy Research Working Paper, February, 2007. 17 Programme for International Student Assessment 18 Eric A. Hanushek and Dennis D. Kimko, “Schooling, Labor-Force Quality, and the Growth of Nations”, American Economic Review, 90, No. 5, December, 2000. 19 TIMSS is an abbreviation for the Trends in International Mathematics and Science Study, organized by the International Association for the Evaluation of Educational Achievement. 20 Only Bulgaria recorded a greater decline – attributable in part to the extremely low level of budgetary support for education. (Michael Mertaugh and Eric Hanushek, “Education and Training”, in Labor Markets and Social Policy in Central and Eastern Europe: The Accession and Beyond. Nicholas Barr, editor. The World Bank, 2005.)

10
Table 3: TIMSS Grade 8 Student Assessment Results for Science and Math for Countries
Participating in the 1995, 1999, and 2003 Surveys Mathematics mean score Science mean score 1995 1999 2003 1995 1999 2003 Belguim (Flemish) 550 558 537 533 535 516 Bulgaria 527 511 476 545 518 479 Canada (Ontario Province) 501 517 521 496 518 533 Canada (Quebec Province) 556 566 543 510 540 531 Cyprus 468 476 459 452 460 441 England 498 496 498 533 538 544 Hong Kong 581 587 589 510 530 556 Hungary 527 532 529 537 552 543 Iran 418 422 411 463 448 453 Japan 570 579 581 554 550 552 Korea 581 587 589 546 549 558 Latvia 488 505 505 476 503 513 Lithuania 472 482 502 464 488 519 Netherlands 529 540 536 541 545 536 New Zealand 501 491 494 511 510 520 Romania 474 472 475 471 472 470 Russian Federation 524 526 508 523 529 514 Singapore 609 604 605 580 568 578 Slovak Republic 534 534 508 532 535 517 United States 492 502 504 513 515 527 International average 520 529 518 515 520 522
Source: Table 1.3 in International Association for the Evaluation of Educational Achievement, TIMSS 2003 International Mathematics Report: Findings from IEA’s Trends in International Mathematics and Science Study at the Fourth and Eighth Grades, and Table 1.3, TIMSS 2003 International Science Report: Findings from IEA’s Trends in International Mathematics and Science Study at the Fourth and Eighth Grade, 2004.
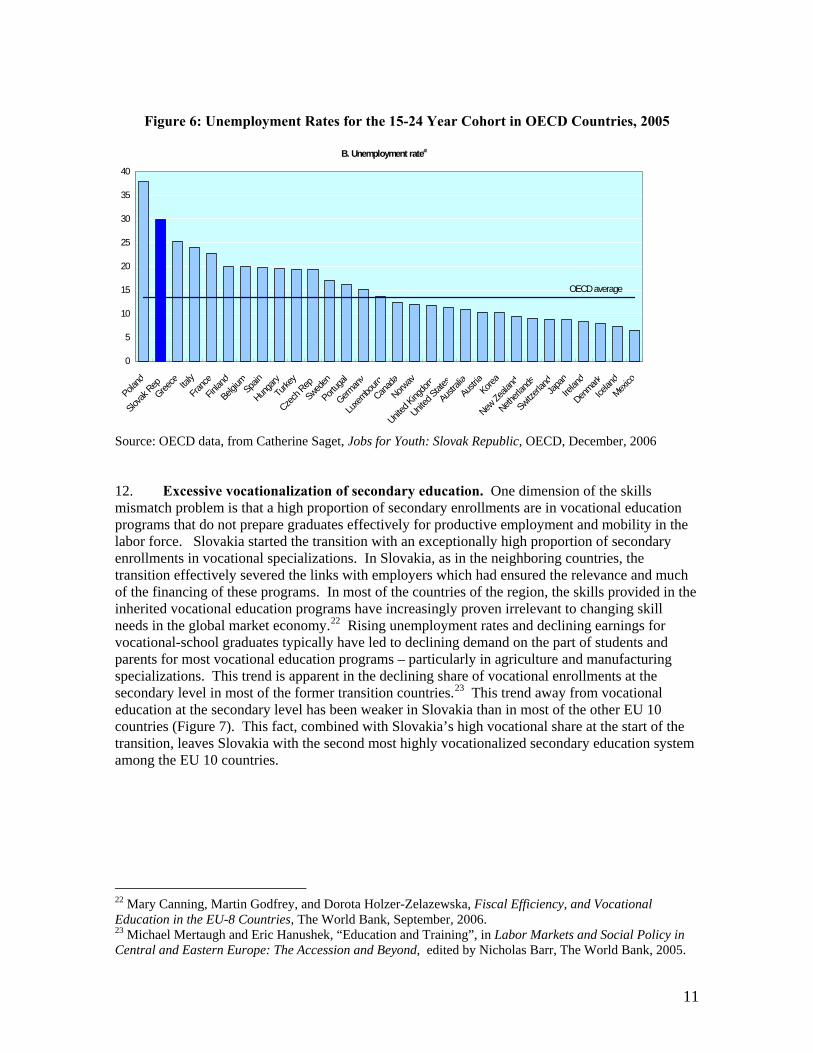
Skills Mismatch 11. An important summary indicator of how well the education system is responding to needs of the economy is youth unemployment. As shown in Figure 6, the rate of youth unemployment in Slovakia is more than twice the OECD average, and the second highest among the OECD countries. Yet in spite of the high youth unemployment, there are numerous unfilled vacancies. In June, 2006, for example, Volkswagen Slovakia had 1,500 unfilled vacancies, and was beginning to recruit workers from Poland because of the lack of Slovak candidates with adequate qualifications.21 Such high youth unemployment at a time of buoyant economic growth, numerous unfilled vacancies, and a shrinking cohort of new entrants to the labor market is a clear signal that the education system is not providing young people with the skills they need to contribute productively to economic growth. As described below, the skills mismatch problem has several dimensions.
21 Catherine Saget, Jobs for Youth: Slovak Republic, OECD, December, 2006.
11
Figure 6: Unemployment Rates for the 15-24 Year Cohort in OECD Countries, 2005
B. Unemployment ratea
0
5
10
15
20
25
30
35
40
Poland
Slovak
RepGree
ce Italy
France
Finlan
d
BelgiumSpa
in
Hunga
ryTu
rkey
Czech
RepSwed
en
Portug
al
German
y
Luxe
mbourg
Canad
a
Norway
United
Kingdo
m
United
States
Austra
liaAus
triaKore
a
New Ze
aland
Netherl
ands
Switzerla
ndJa
panIre
land
Denmark
Icelan
dMex
ico
OECD average
Source: OECD data, from Catherine Saget, Jobs for Youth: Slovak Republic, OECD, December, 2006 12. Excessive vocationalization of secondary education. One dimension of the skills mismatch problem is that a high proportion of secondary enrollments are in vocational education programs that do not prepare graduates effectively for productive employment and mobility in the labor force. Slovakia started the transition with an exceptionally high proportion of secondary enrollments in vocational specializations. In Slovakia, as in the neighboring countries, the transition effectively severed the links with employers which had ensured the relevance and much of the financing of these programs. In most of the countries of the region, the skills provided in the inherited vocational education programs have increasingly proven irrelevant to changing skill needs in the global market economy.22 Rising unemployment rates and declining earnings for vocational-school graduates typically have led to declining demand on the part of students and parents for most vocational education programs – particularly in agriculture and manufacturing specializations. This trend is apparent in the declining share of vocational enrollments at the secondary level in most of the former transition countries.23 This trend away from vocational education at the secondary level has been weaker in Slovakia than in most of the other EU 10 countries (Figure 7). This fact, combined with Slovakia’s high vocational share at the start of the transition, leaves Slovakia with the second most highly vocationalized secondary education system among the EU 10 countries.
22 Mary Canning, Martin Godfrey, and Dorota Holzer-Zelazewska, Fiscal Efficiency, and Vocational Education in the EU-8 Countries, The World Bank, September, 2006. 23 Michael Mertaugh and Eric Hanushek, “Education and Training”, in Labor Markets and Social Policy in Central and Eastern Europe: The Accession and Beyond, edited by Nicholas Barr, The World Bank, 2005.

12
Figure 7: Proportion of Secondary Enrollments in Vocational Specializations in EU 10 Countries, 1998 and 2004
0.0
10.0
20.0
30.0
40.0
50.0
60.0
70.0
80.0
90.0
Bulgari
a
Czech
Rep
ublic
Estonia
Hungary
Latvi
a
Lithu
ania
Poland
Romania
Slovak R
epub
lic
Slovenia
19982004
Source: EUROSTAT (all countries except Hungary. Hungary data from UNICEF Innocenti Center TRANSMONEE database.)
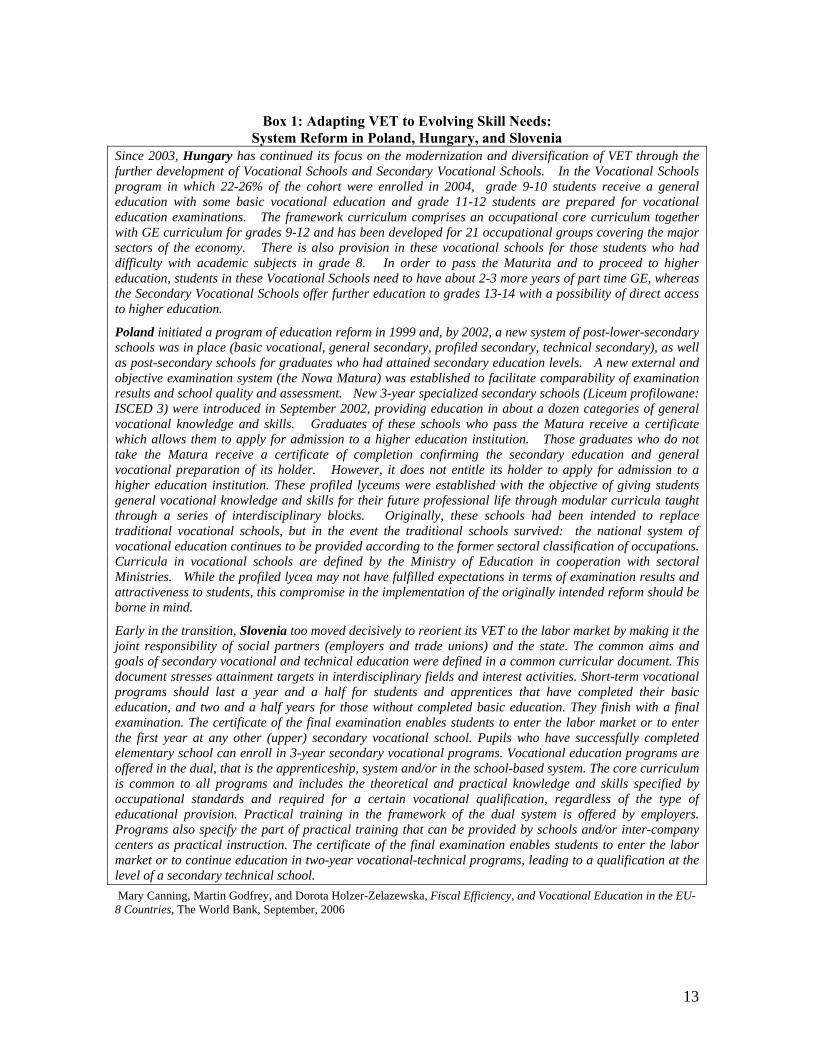
13. The high share of secondary vocational students in Slovakia is a cause for concern for several reasons: First, unlike the vocational education and training (VET) systems in Poland, Hungary, and Slovenia (Box 1), Slovakia’s VET system has not been reformed to address to the new pattern of skill needs in the market economy. Vocational education in Slovakia often leads to higher unemployment for graduates than general education. As shown in figure 8, unemployment rates for secondary vocational completers in non-diploma programs are higher than for secondary general education graduates who enter the labor market without further education, and much higher than for secondary education graduates who go on to pursue university education. These findings relate to all adult workers. For recent completers of non-diploma secondary vocational programs, the risk of unemployment is more acute. For the less-than-25-year age group, the unemployment rate for of non-diploma secondary vocational graduates is 37%,24 versus 13.8% for all age groups.25 Vocational education graduates face similar unemployment prospects in other EU 10 countries.26
24 Catherine Saget, Jobs for Youth: Slovak Republic, OECD, December, 2006. 25 Household labor-force survey data, 1st quarter of 2006. 26 Mary Canning, Martin Godfrey, and Dorota Holzer-Zelazewska, Fiscal Efficiency, and Vocational Education in the EU-8 Countries, The World Bank, September, 2006.
13
Box 1: Adapting VET to Evolving Skill Needs:
System Reform in Poland, Hungary, and Slovenia Since 2003, Hungary has continued its focus on the modernization and diversification of VET through the further development of Vocational Schools and Secondary Vocational Schools. In the Vocational Schools program in which 22-26% of the cohort were enrolled in 2004, grade 9-10 students receive a general education with some basic vocational education and grade 11-12 students are prepared for vocational education examinations. The framework curriculum comprises an occupational core curriculum together with GE curriculum for grades 9-12 and has been developed for 21 occupational groups covering the major sectors of the economy. There is also provision in these vocational schools for those students who had difficulty with academic subjects in grade 8. In order to pass the Maturita and to proceed to higher education, students in these Vocational Schools need to have about 2-3 more years of part time GE, whereas the Secondary Vocational Schools offer further education to grades 13-14 with a possibility of direct access to higher education.
Poland initiated a program of education reform in 1999 and, by 2002, a new system of post-lower-secondary schools was in place (basic vocational, general secondary, profiled secondary, technical secondary), as well as post-secondary schools for graduates who had attained secondary education levels. A new external and objective examination system (the Nowa Matura) was established to facilitate comparability of examination results and school quality and assessment. New 3-year specialized secondary schools (Liceum profilowane: ISCED 3) were introduced in September 2002, providing education in about a dozen categories of general vocational knowledge and skills. Graduates of these schools who pass the Matura receive a certificate which allows them to apply for admission to a higher education institution. Those graduates who do not take the Matura receive a certificate of completion confirming the secondary education and general vocational preparation of its holder. However, it does not entitle its holder to apply for admission to a higher education institution. These profiled lyceums were established with the objective of giving students general vocational knowledge and skills for their future professional life through modular curricula taught through a series of interdisciplinary blocks. Originally, these schools had been intended to replace traditional vocational schools, but in the event the traditional schools survived: the national system of vocational education continues to be provided according to the former sectoral classification of occupations. Curricula in vocational schools are defined by the Ministry of Education in cooperation with sectoral Ministries. While the profiled lycea may not have fulfilled expectations in terms of examination results and attractiveness to students, this compromise in the implementation of the originally intended reform should be borne in mind.
Early in the transition, Slovenia too moved decisively to reorient its VET to the labor market by making it the joint responsibility of social partners (employers and trade unions) and the state. The common aims and goals of secondary vocational and technical education were defined in a common curricular document. This document stresses attainment targets in interdisciplinary fields and interest activities. Short-term vocational programs should last a year and a half for students and apprentices that have completed their basic education, and two and a half years for those without completed basic education. They finish with a final examination. The certificate of the final examination enables students to enter the labor market or to enter the first year at any other (upper) secondary vocational school. Pupils who have successfully completed elementary school can enroll in 3-year secondary vocational programs. Vocational education programs are offered in the dual, that is the apprenticeship, system and/or in the school-based system. The core curriculum is common to all programs and includes the theoretical and practical knowledge and skills specified by occupational standards and required for a certain vocational qualification, regardless of the type of educational provision. Practical training in the framework of the dual system is offered by employers. Programs also specify the part of practical training that can be provided by schools and/or inter-company centers as practical instruction. The certificate of the final examination enables students to enter the labor market or to continue education in two-year vocational-technical programs, leading to a qualification at the level of a secondary technical school. Mary Canning, Martin Godfrey, and Dorota Holzer-Zelazewska, Fiscal Efficiency, and Vocational Education in the EU-8 Countries, The World Bank, September, 2006

14
Figure 8: Unemployment Rates by Educational Attainment (first quarter, 2006)
0.0 10.0 20.0 30.0 40.0 50.0 60.0
Basic (grades 1-9)
Apprenticeship
Secondary without exam
Apprenticeship with exam
Full secondary general
Full secondary vocational
Higher
Bachelor
Source: Slovakia Household Labor Force Survey, 1st quarter, 2006
14. Other causes for concern over the high share of vocational enrollments in secondary education are that:
• The unit costs of secondary vocational education are much higher than for secondary general education. Average unit costs of secondary vocational education are $3,063 (converted to US dollars based on purchasing power parity), versus $1,983 for general secondary education.27 Thus, in many cases, vocational education is not a cost-effective preparation for a productive role in the labor market.
• As shown in Figure 9, non-diploma, terminal courses of vocational education lead to lower average earnings for graduates than general education and diploma-granting specialized education. (Average earnings of general education graduates in Figure 8 significantly understate the average earnings of all secondary general education graduates because many go on to higher education and the much higher average earnings that that entails.) Although the number of students in non-diploma secondary vocational programs is declining, over 45,000 students remain enrolled in these programs (Table 4).
• The orientation of many young people into terminal programs of secondary education when they complete basic schooling limits the options for expansion of higher education.
• The narrowness of skills provided within each of the more than 200 occupational specializations offered in secondary vocational education limits the flexibility of graduates to adapt to changing technology within their current jobs, as well as their flexibility to move to new jobs in kindred occupations. Continuous job destruction and job creation is characteristic of the most productive economies,28 and is a major feature of Slovakia’s
27 Table B1.1b, Education at a Glance: OECD Indicators, 2006, OECD, 2006 28 Enhancing Job Opportunities: Eastern Europe and the Former Soviet Union, The World Bank, 2006.

15
recent labor-market performance.29 By limiting job mobility, the excessive narrowness of skill training is likely to dampen future growth and productivity.
Figure 9: Average Earnings by Educational Attainment, 2005
(expressed as a percentage of overall average earnings)
0
20
40
60
80
100
120
140
160
180
Bas
ic (g
rade
s1-
9)
Sec
onda
ryvo
catio
nal
with
out e
xam
Sec
onda
ryvo
catio
nal
with
exa
m
Sec
onda
rysp
ecia
lized
w/ e
xam
Sec
onda
ryge
nera
l
Bac
helo
r
Mas
ter
PhD
Source: Survey of Income and Living Conditions, 2005
Table 4: Evolution of Secondary Enrollments by Type, 2000-2004
2000 2001 2002 2003 2004grammar school 80,615 86,239 91,661 100,057 99,738 specialized secondary school 98,362 101,204 92,138 93,353 87,533 vocational secondary school 105,838 106,775 89,137 80,153 73,525 apprenticeship 74,595 74,695 59,569 49,139 45,286 diploma programs 31,243 32,080 29,568 31,014 28,239 associated secondary school 34,590 52,953 64,738 total vocational 204,200 207,979 215,865 226,459 225,796 total secondary 284,815 294,218 307,526 326,516 325,534
source: www.statistics.sk 15. Weak performance in providing “new skills” for the global economy. Another dimension of the skills mismatch problem is that the education system is not effective in providing the skills which are in greatest demand in the global economy. Paragraph 10 summarized the evidence on Slovakia’s loss of leadership in learning achievement in its traditional areas of greatest strength – math and sciences. In other subject areas, there is evidence that Slovakia is at even greater risk of being outperformed by its competition. This is particularly true in the “new skills”
29 The Quest for Equitable Growth in the Slovak Republic, A Two-Edged Sword: Competitiveness and Labor Market Polarization in the Slovak Republic, Report No. 32433-SK, The World Bank, September 19, 2005.
16
for which demand is growing most rapidly in the global economy. A presentation to the OECD Governing Board described the nature of those skills.30 Remaining productive in the global economy requires a number of application skills which go beyond mastery of factual information. Critically, it includes:
• meta-cognitive abilities and skills -- thinking about how to think and learning how to learn, • the ability to integrate formal and informal learning, declarative knowledge (or knowing
that) and procedural knowledge (or knowing how), • the ability to access, select and evaluate knowledge in an information-rich world, • the ability to develop and apply diverse forms of intelligence, • the ability to learn and work effectively in teams, • the ability to create, transpose, and apply knowledge across disciplinary boundaries • the ability to cope with ambiguous situations, unpredictable problems, and unforeseen
circumstances, • the ability to cope with multiple careers – learning how to “redesign” oneself, locate
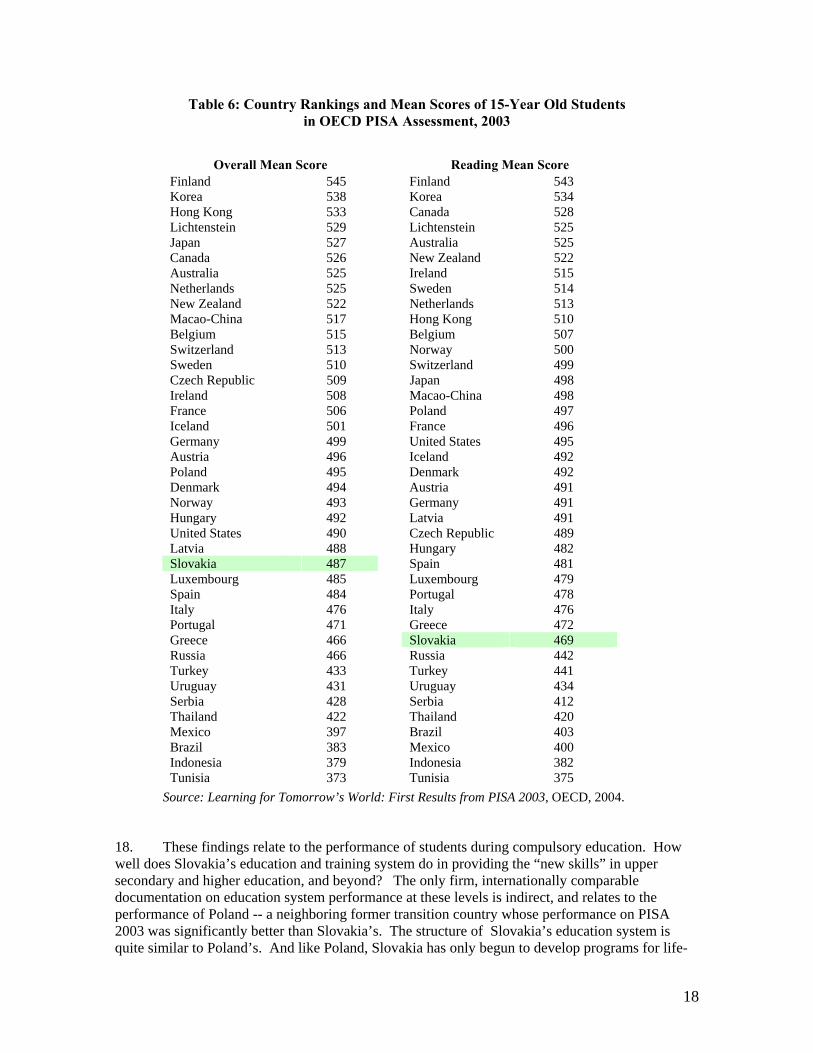
oneself in a job market, and choose and fashion the relevant education and training.31 This list of key aptitudes is consistent with the findings from other, country-specific studies.32 16. Table 5 reports the findings of a 2001 survey, carried out by the Slovak State Vocational Education Institute, on employers’ perceptions of unmet skill gaps in the labor force. These findings confirm the importance to Slovak employers of skills that go beyond the accumulation of factual knowledge – including skills in processing, synthesizing, and using knowledge in unfamiliar applications, in communication , in teamwork, and in adapting to changing work requirements. 17. The TIMSS student assessment described in paragraph 10 tests students’ mastery of the formal curriculum. Test questions follow the material as it is typically presented in class. In this limited application, the discipline and pedagogy of Slovakia’s education programs leads to impressive results – or at least it did so prior to the decline in performance which was recorded in 2003. But another international student assessment, PISA,33 developed by the OECD, is specifically designed to test student’s abilities in the “new skills” including synthesizing knowledge across disciplinary boundaries, integrating uncertainty into analysis, monitoring their own learning progress, and knowing where to access relevant information. These are exactly the types of skills which are needed for many of the fastest growing jobs in the global economy, as revealed by the experience of the OECD and EU countries.34 Slovakia participated in the PISA assessment for the first time in 2003. The results of that survey are summarized in Table 6. In overall score, Slovakia ranked 26th of the 40 participating countries in the survey – well below most of the EU countries. In reading, Slovakia ranked 31st – below all of the participating European and East Asian countries except Russia and Serbia. A clear message of this survey is that Slovakia’s education system needs to do a much better job in developing higher-order skills of synthesis,
30 Presentation by Professor David Hargreaves, Cambridge University, to the OECD CERI Governing Board, March 24, 2000. 31 Ibid. 32 An example is a recent report which documents education-growth linkages for the US economy: Ray Uhalde and Jeff Strohl, “America in the Global Economy: a Background Paper for the New Commission on the Skills of the American Workforce”, National Center on Education and the Economy, 2006. 33 Programme for International Student Assessment 34 Literacy in the Information Age, OECD and Statistics Canada, Paris and Ottawa, 2000, and Lifelong Learning in the Global Knowledge Economy: Challenges for Developing Countries. Toby Linden at al., the World Bank, 2002.

17
problem solving, application, and “thinking outside the box” if Slovakia is to remain competitive with the higher-performing countries in Europe and East Asia.
Table 5: Employers’ Perceptions on Skill Requirements
and the Implications for Education Programs
Which skills and competences do school leavers lack?1. Ability to sustain stress and work under pressure2. Communication skills, client service3. Inventiveness4. Empathy
Which skills and competences will grow in importance?1. Language skills2. Computer skills3. Ability to handle information 4. Adaptability and flexibility
1. Linking the supply of education to labour market demand2. Linking theory with practice3. Updating curricula4. Providing tax cuts for employing graduates or training them during studies
What are the priorities for reforming the education system?
By decreasing order of importance, From the 2001 survey, “What do Employers Need?” carried out by the Slovak State Vocational Education Institute. As reported in Catherine Saget, Jobs for Youth: Slovak Republic, OECD, December, 2006.
18
Table 6: Country Rankings and Mean Scores of 15-Year Old Students in OECD PISA Assessment, 2003
Overall Mean Score Reading Mean Score
Finland 545 Finland 543 Korea 538 Korea 534 Hong Kong 533 Canada 528 Lichtenstein 529 Lichtenstein 525 Japan 527 Australia 525 Canada 526 New Zealand 522 Australia 525 Ireland 515 Netherlands 525 Sweden 514 New Zealand 522 Netherlands 513 Macao-China 517 Hong Kong 510 Belgium 515 Belgium 507 Switzerland 513 Norway 500 Sweden 510 Switzerland 499 Czech Republic 509 Japan 498 Ireland 508 Macao-China 498 France 506 Poland 497 Iceland 501 France 496 Germany 499 United States 495 Austria 496 Iceland 492 Poland 495 Denmark 492 Denmark 494 Austria 491 Norway 493 Germany 491 Hungary 492 Latvia 491 United States 490 Czech Republic 489 Latvia 488 Hungary 482 Slovakia 487 Spain 481 Luxembourg 485 Luxembourg 479 Spain 484 Portugal 478 Italy 476 Italy 476 Portugal 471 Greece 472 Greece 466 Slovakia 469 Russia 466 Russia 442 Turkey 433 Turkey 441 Uruguay 431 Uruguay 434 Serbia 428 Serbia 412 Thailand 422 Thailand 420 Mexico 397 Brazil 403 Brazil 383 Mexico 400 Indonesia 379 Indonesia 382 Tunisia 373
Tunisia 375 Source: Learning for Tomorrow’s World: First Results from PISA 2003, OECD, 2004.
18. These findings relate to the performance of students during compulsory education. How well does Slovakia’s education and training system do in providing the “new skills” in upper secondary and higher education, and beyond? The only firm, internationally comparable documentation on education system performance at these levels is indirect, and relates to the performance of Poland -- a neighboring former transition country whose performance on PISA 2003 was significantly better than Slovakia’s. The structure of Slovakia’s education system is quite similar to Poland’s. And like Poland, Slovakia has only begun to develop programs for life-
19
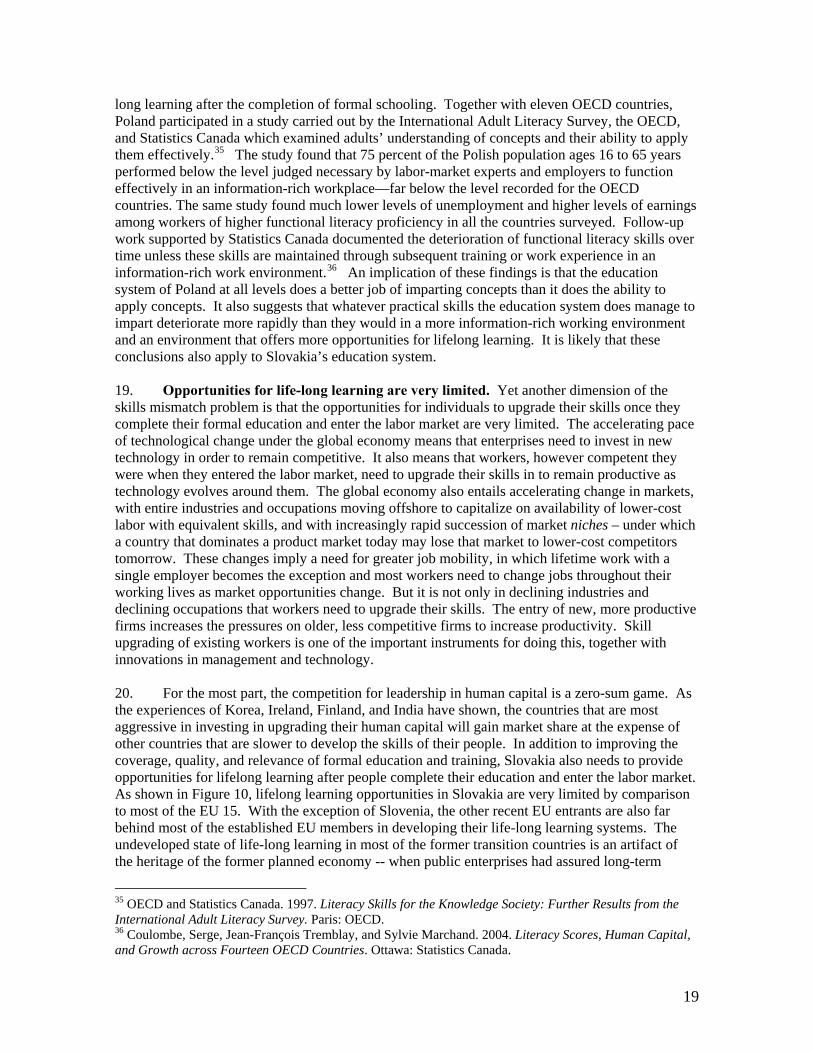
long learning after the completion of formal schooling. Together with eleven OECD countries, Poland participated in a study carried out by the International Adult Literacy Survey, the OECD, and Statistics Canada which examined adults’ understanding of concepts and their ability to apply them effectively.35 The study found that 75 percent of the Polish population ages 16 to 65 years performed below the level judged necessary by labor-market experts and employers to function effectively in an information-rich workplace—far below the level recorded for the OECD countries. The same study found much lower levels of unemployment and higher levels of earnings among workers of higher functional literacy proficiency in all the countries surveyed. Follow-up work supported by Statistics Canada documented the deterioration of functional literacy skills over time unless these skills are maintained through subsequent training or work experience in an information-rich work environment.36 An implication of these findings is that the education system of Poland at all levels does a better job of imparting concepts than it does the ability to apply concepts. It also suggests that whatever practical skills the education system does manage to impart deteriorate more rapidly than they would in a more information-rich working environment and an environment that offers more opportunities for lifelong learning. It is likely that these conclusions also apply to Slovakia’s education system. 19. Opportunities for life-long learning are very limited. Yet another dimension of the skills mismatch problem is that the opportunities for individuals to upgrade their skills once they complete their formal education and enter the labor market are very limited. The accelerating pace of technological change under the global economy means that enterprises need to invest in new technology in order to remain competitive. It also means that workers, however competent they were when they entered the labor market, need to upgrade their skills in to remain productive as technology evolves around them. The global economy also entails accelerating change in markets, with entire industries and occupations moving offshore to capitalize on availability of lower-cost labor with equivalent skills, and with increasingly rapid succession of market niches – under which a country that dominates a product market today may lose that market to lower-cost competitors tomorrow. These changes imply a need for greater job mobility, in which lifetime work with a single employer becomes the exception and most workers need to change jobs throughout their working lives as market opportunities change. But it is not only in declining industries and declining occupations that workers need to upgrade their skills. The entry of new, more productive firms increases the pressures on older, less competitive firms to increase productivity. Skill upgrading of existing workers is one of the important instruments for doing this, together with innovations in management and technology.
20. For the most part, the competition for leadership in human capital is a zero-sum game. As the experiences of Korea, Ireland, Finland, and India have shown, the countries that are most aggressive in investing in upgrading their human capital will gain market share at the expense of other countries that are slower to develop the skills of their people. In addition to improving the coverage, quality, and relevance of formal education and training, Slovakia also needs to provide opportunities for lifelong learning after people complete their education and enter the labor market. As shown in Figure 10, lifelong learning opportunities in Slovakia are very limited by comparison to most of the EU 15. With the exception of Slovenia, the other recent EU entrants are also far behind most of the established EU members in developing their life-long learning systems. The undeveloped state of life-long learning in most of the former transition countries is an artifact of the heritage of the former planned economy -- when public enterprises had assured long-term
35 OECD and Statistics Canada. 1997. Literacy Skills for the Knowledge Society: Further Results from the International Adult Literacy Survey. Paris: OECD. 36 Coulombe, Serge, Jean-François Tremblay, and Sylvie Marchand. 2004. Literacy Scores, Human Capital, and Growth across Fourteen OECD Countries. Ottawa: Statistics Canada.

20
markets, when technology changed slowly, when vocational training institutions had close links with enterprises, and when most graduates of vocational education programs were assured of jobs which they typically held throughout their working lives. In that setting, lifelong was not necessary for the survival of most enterprises and most individuals. Today, school graduates face an entirely different job situation The availability of high quality lifelong learning opportunities will increasingly determine whether they are able to find productive and remunerative jobs. At the aggregate level, it will increasingly determine which countries get ahead and stay ahead, and which countries fall behind. As Slovakia develops its lifelong learning opportunities to respond to that challenge, this change will also transform the role of formal education – both general and vocational education. Instead of providing specific job skills which are expected to remain in use throughout a worker’s life, formal education will need to provide a sound base of generic skills – such as knowing how to communicate effectively, how to work effectively in teams, and how to process and apply information – on which subsequent lifelong learning and job experience can develop job-specific skills.
Figure 10: Lifelong Learning: the Percentage of Adult Population Participating in Education and Training, 2005
% of Adult Population Participating in Education and Training
0.0
5.0
10.0
15.0
20.0
25.0
30.0
35.0
Aus
tria
Bel
gium
Bul
garia
Cze
ch R
epub
licD
enm
ark
Est
onia
Finl
and
Fran
ceG
erm
any
Hun
gary
Irela
ndLa
tvia
Lith
uani
aN
ethe
rland
sN
orw
ayP
olan
dR
oman
iaS
lova
kia
Slo
veni
aS
wed
enS
witz
erla
ndU
nite
d K
ingd
om% of AdultPopulationParticipating inEducation andTraining
Source: EUROSTAT database 21. Slovakia’s negative population growth and aging population structure imply slower growth of the labor force in the future, especially of the labor-market entry cohort. A recent World Bank study on the effects of aging in the region estimates that the 15-39 year cohort in Slovakia will decline by over 360,000 between 2005 and 2020.37 If Slovakia is to maintain the impressive economic growth of the recent past, it will need to find ways to compensate for this shrinkage in the number of new entrants to the labor force. The options for doing this are few, involving immigration, later retirement, and attracting retired people to re-enter the labor market. At least for the latter option, and probably for the others as well, lifelong learning will need to play an
37 “Demographic Change and Labor Markets,” in The Third Transition: Exploring the Impact of Changing Demographic Structures in Eastern Europe and the Former Soviet Union, The World Bank, in process.
21
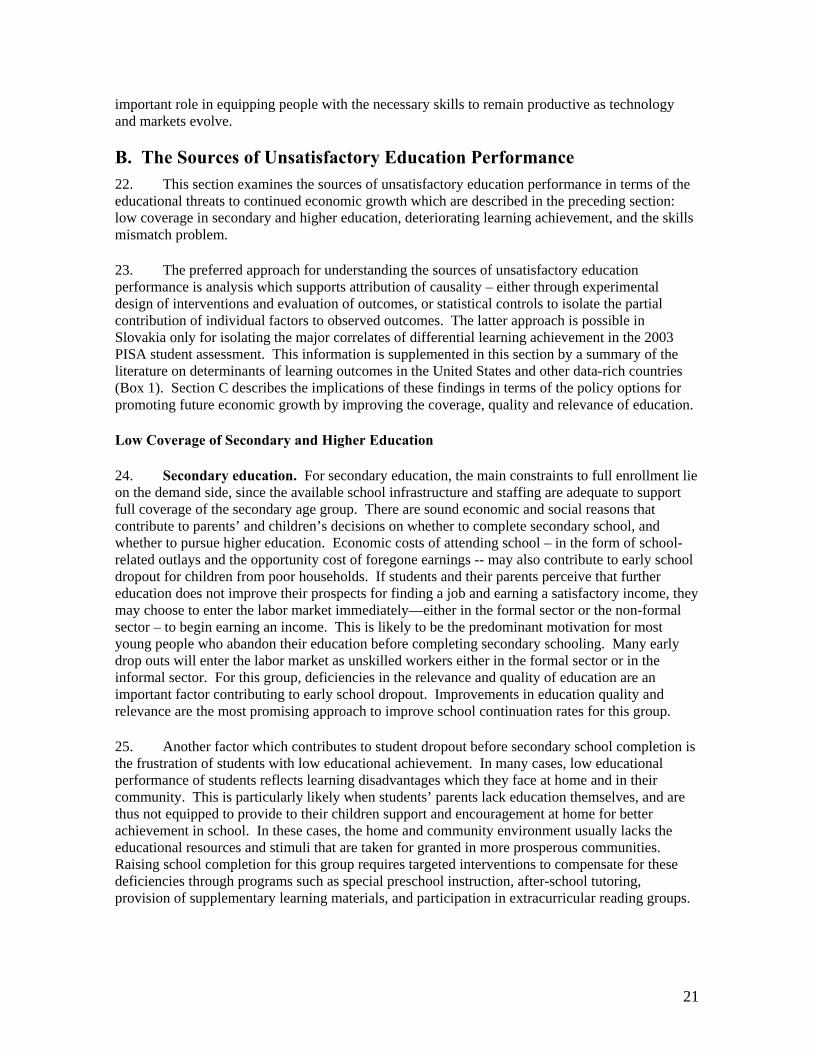
important role in equipping people with the necessary skills to remain productive as technology and markets evolve. B. The Sources of Unsatisfactory Education Performance 22. This section examines the sources of unsatisfactory education performance in terms of the educational threats to continued economic growth which are described in the preceding section: low coverage in secondary and higher education, deteriorating learning achievement, and the skills mismatch problem.
23. The preferred approach for understanding the sources of unsatisfactory education performance is analysis which supports attribution of causality – either through experimental design of interventions and evaluation of outcomes, or statistical controls to isolate the partial contribution of individual factors to observed outcomes. The latter approach is possible in Slovakia only for isolating the major correlates of differential learning achievement in the 2003 PISA student assessment. This information is supplemented in this section by a summary of the literature on determinants of learning outcomes in the United States and other data-rich countries (Box 1). Section C describes the implications of these findings in terms of the policy options for promoting future economic growth by improving the coverage, quality and relevance of education.
Low Coverage of Secondary and Higher Education
24. Secondary education. For secondary education, the main constraints to full enrollment lie on the demand side, since the available school infrastructure and staffing are adequate to support full coverage of the secondary age group. There are sound economic and social reasons that contribute to parents’ and children’s decisions on whether to complete secondary school, and whether to pursue higher education. Economic costs of attending school – in the form of school-related outlays and the opportunity cost of foregone earnings -- may also contribute to early school dropout for children from poor households. If students and their parents perceive that further education does not improve their prospects for finding a job and earning a satisfactory income, they may choose to enter the labor market immediately—either in the formal sector or the non-formal sector – to begin earning an income. This is likely to be the predominant motivation for most young people who abandon their education before completing secondary schooling. Many early drop outs will enter the labor market as unskilled workers either in the formal sector or in the informal sector. For this group, deficiencies in the relevance and quality of education are an important factor contributing to early school dropout. Improvements in education quality and relevance are the most promising approach to improve school continuation rates for this group.
25. Another factor which contributes to student dropout before secondary school completion is the frustration of students with low educational achievement. In many cases, low educational performance of students reflects learning disadvantages which they face at home and in their community. This is particularly likely when students’ parents lack education themselves, and are thus not equipped to provide to their children support and encouragement at home for better achievement in school. In these cases, the home and community environment usually lacks the educational resources and stimuli that are taken for granted in more prosperous communities. Raising school completion for this group requires targeted interventions to compensate for these deficiencies through programs such as special preschool instruction, after-school tutoring, provision of supplementary learning materials, and participation in extracurricular reading groups.

22
26. Higher education. Slovakia’s situation in higher education coverage is in transition. The small fraction of the adult population with higher education attainment (paragraph 6) largely reflects the legacy of the planned economy, in which access to higher education was strictly controlled. (In 1989, only 13.4 % of the 18-22 age group was enrolled in higher education.38) But higher education enrollments have expanded progressively and substantially since the start of the transition. Full-time enrollments now cover 31.4 % of the age group, and part-time enrollments cover an additional 15.3%.39 As shown in Table 7, the pattern of expanding enrollments has changed. Over the period 1995-2003, the bulk of the increase in new enrollments in higher education occurred in part-time programs of study. New enrollments in these programs increased at an average rate of 16.9% over the period, versus a modest growth of 1.9% per year in full-time higher education programs. In part, this rapid growth in part-time enrollments reflected the eagerness of universities to admit part-time students because of the fee income opportunities that they provide (paragraph 27). Since 2003, however, the growth of new enrollments in part-time programs has subsided, while new enrollments in full-time programs of higher education have grown sharply -- by an average of 19.3% per year. These increases enrollments in higher education imply a large increase in the progression rate from secondary to higher education. In the latest year for which data are available (2004), 62% of the graduates of secondary diploma programs went on to enroll in full-time higher education, and another 30% enrolled in part-time higher education programs.40 These sizeable improvements in the proportion of secondary-school graduates continuing to higher education imply that the educational attainment of the working-age population is improving and will continue to improve as long as the higher progression rates are maintained.
Table 7: Growth of New Enrollments in Higher Education 1990 1995 2000 2001 2002 2003 2004 2005 New enrollments in full-time programs
13,404 20,809 24,279 24,270 26,974 24,150 32,488 35,542
Total enrollments in full-time programs
92,823 94,684 99.994 99,929 108,608
New enrollments in part-time programs
1,868 3,881 9,665 12,763 8,057 15,057 15,718 17,254
Total enrollments in part-time programs
33,037 38,980 39,042 45,192 53,018
Total 15,272 24,690 33,944 37,033 35,031 39,207 48,206 52,796 Source: New enrollments from “Funding Systems and their Effects on Higher Education Systems: Country Study – Slovakia,” Ministry of Education, August, 2006. Total enrollments from Ministry of Education Website.
27. Higher education budgets have increased significantly to accommodate the increases in enrollments since 2000 -- at 8.9 % per year in real terms since 2000.41 But raising the coverage of higher education to OECD and EU levels will require major further funding. A crucial question for the country is where this financing will come from. In 2002, the Ministry of Education enacted a number of reforms in higher education finance and management that make it easier for universities to mobilize financing from other sources such as rental of premises, provision of paid consulting services, and collection of fees from “non-regular” (part-time) students. (A proposal to introduce fees for full-time students was rejected by the Parliament last year.) These measures have helped
38 UNICEF Innocenti Center TRANSMONEE database. 39 Ministry of Education and UN Population Division data. 40 Ministry of Education data. 41 Peter Mederly, “Funding Systems and their Effects on Higher Education Systems: Country Study – Slovakia,” Ministry of Education, August, 2006.

23
universities mobilize funds to supplement budget finance, but the additional resources fall far short of the needs to move more quickly to OECD and EU coverage levels.
28. Further expansion of higher education coverage will require sizeable additional expenditures. As shown below, demographic trends could help to absorb some of those costs, but these changes will also necessitate increased outlays in pensions and other areas. School-age cohorts for all levels of education will shrink significantly over the next two decades (Table 8). The largest shrinkage is projected for the higher education cohort (aged 18-21), which is expected to contract by 22% by 2015 and 40% by 2025.42 Table 9 simulates the improvement in higher education coverage and additional resource costs under alternative expansion scenarios, assuming no improvements in quality. The potential demographic windfall is significant, but at best would cover only a fraction of the costs of the needed expansion. The savings from this source would also not occur spontaneously, but would require a major strengthening of the incentives for rationalization of the school network and redeployment of teaching and non-teaching staff. Demographic changes are also likely to increase the claim on budget resources for pensions and other elderly-related expenditures. In order to reach by 2025 the current coverage rates of the United States, Finland, and Korea, expenditures on staff and facilities expansion would need to increase by at least Sk. 1.7 billion per year, increasing to Sk. 2.3 billion by the end of the period
Table 8: Projected Change in Slovakia’s School-Age Population, 2005-2025 (in thousands)
Year/age group Basic 6--14
Secondary 15--17
Higher 18--21
2005 594 239 346 2010 495 208 314 2015 458 167 270 2020 451 152 220 2025 440 152 203
Δ 2005-2025 -154 -87 -143 % Δ 2005-2025 -25.9% -36.4% -41.2%
Source: UN Population Division
Table 9: Higher Education Enrollments and Projected Additional Resource Requirements under Alternative Expansion Scenarios, 2005-2025
No Expansion Modest Expansion
(1% per year) Rapid Expansion
(2% per year) 2005
Enrollments 108,608 108,608 108,608 Cohort size 346,000 346,000 346,000 Enrollment Ratio 31.4% 31.4% 31.4% Additional Resources* 0 0 0
2010 Enrollments 108,608 114,176 120,030 Cohort size 314,000 314,000 314,000 Enrollment Ratio 34.6% 36.4% 38.2% Additional Resources* 0 Sk 835 million Sk 1,713 million
2015 Enrollments 108,608 120,030 132,654
42 The projection for the higher education cohort involves a very small margin of error, since most of the population in question is already born, and since mortality patterns typically change very slowly.

24
Cohort size 270,000 270,000 270,000 Enrollment Ratio 40.2% 44.5% 49.1% Additional Resources* 0 Sk 878 million Sk 1,893 million
2020 Enrollments 108,608 126,184 146,605 Cohort size 220,000 220,000 220,000 Enrollment Ratio 49.8% 57.3% 66.6% Additional Resources* 0 Sk 923 million Sk 2,093 million
2025 Enrollments 108,608 132,654 162,024 Cohort size 203,000 203,000 203,000 Enrollment Ratio 53.5% 65.3% 79.8% Additional Resources* 0 Sk 971 million Sk 2,313 million * Estimated incremental annual budget cost by comparison to preceding five-year period, recurrent plus annualized investment cost, in millions of 2005 SK. Source: Tables 6 and 7, and unit cost data from “Funding Systems and their Effects on Higher Education Systems: Country Study – Slovakia,” Ministry of Education, August, 2006. 29. There are two important points for the Government to consider in contemplating the options for expansion of higher education coverage in Slovakia:
• All of the other countries in the region will also benefit from the same demographic windfall and some will inevitably use the opportunity to move ahead quickly in expanding higher education. As a result, the competitive bar is rising whether or not Slovakia decides to push ahead with aggressive efforts to raise higher education coverage,
• As coverage rates converge to essentially complete higher education coverage, the competitive frontier will increasingly involve the dimensions of quality and relevance of higher education, including the development of stronger links between industry and higher education institutions.
30. The recent expansion of higher education and the coverage boost provided by the demographic windfall are essentially positive developments, but there are two important caveats. The first is that the recent unprecedentedly rapid growth in higher education enrollments has imposed severe pressure on the existing higher education institutions, and has contributed to a substantial increase in student failure. Among full-time higher education students in technical specializations, the percentage of students who failed to complete the year successfully increased from 15.5% in the 2001/02 academic year to 19.5% in 2004/05. For part-time students, the increase was even greater -- from 8.0% to 21.7%.43 The increase in failure rates is consistent with the widespread public perception of declining quality of higher education. Reversing this decline and raising the quality of higher education in the future will require additional resources in the short term to relieve crowding of facilities and overstretched faculty, and to undertake other actions to raise higher education quality.
31. A second caveat is that the shrinkage of school-age population is part of a broader trend of demographic contraction which also lead to slower labor-force growth, increasing dependency, and potentially increased outlays for health, pensions, and other safety-net programs.44 Continued high
43 “Funding Systems and their Effects on Higher Education Systems: Country Study – Slovakia,” Ministry of Education, August, 2006. 44 These are examined in Chapter 6, “Education”, in The Impact of Ageing on Public Expenditure: Projections for the EU 25 Member States on Pensions, Health Care, Education, and Unemployment Transfers (2004-2050). Economic Policy Committee, European Commission Directorate General for
25
economic growth may require an expanding labor force, as well as a highly qualified labor force.45 This concern may necessitate deliberate efforts to raise the participation of working-age adults who are not currently in the labor market, and to encourage the labor-market re-entry by retired adults.
Deteriorating Learning Achievement
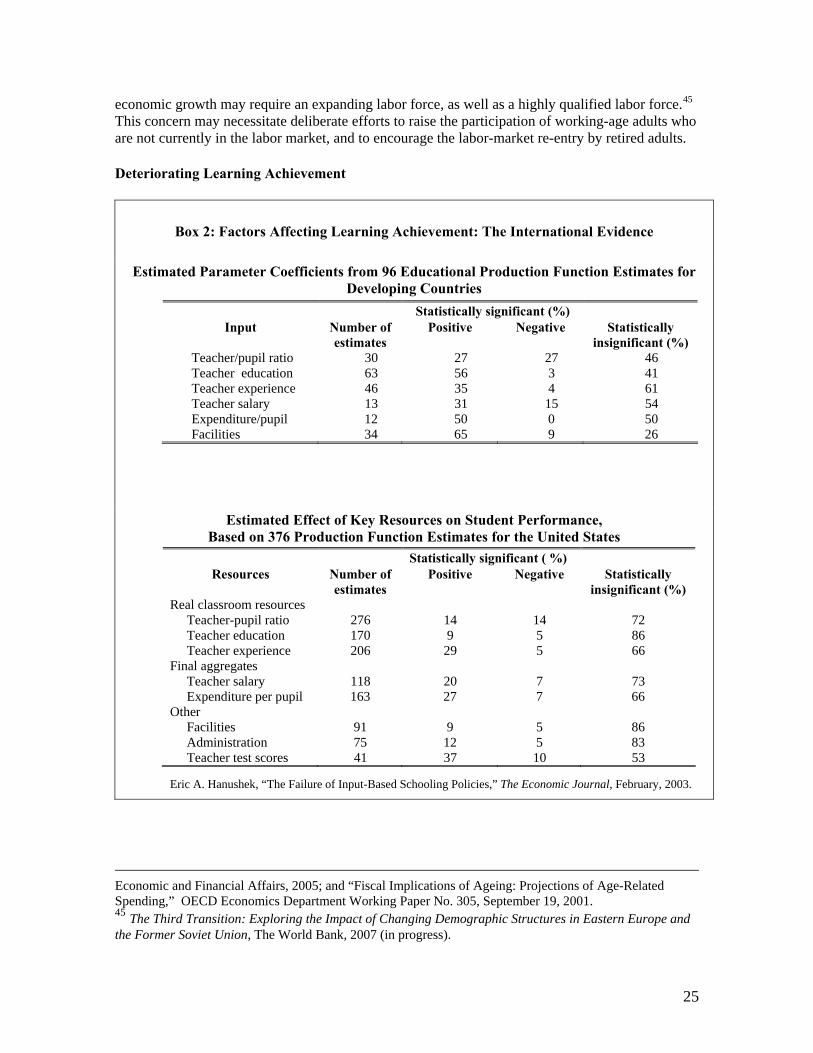
Box 2: Factors Affecting Learning Achievement: The International Evidence
Estimated Parameter Coefficients from 96 Educational Production Function Estimates for Developing Countries
Statistically significant (%) Input Number of
estimates Positive Negative Statistically
insignificant (%) Teacher/pupil ratio 30 27 27 46 Teacher education 63 56 3 41 Teacher experience 46 35 4 61 Teacher salary 13 31 15 54 Expenditure/pupil 12 50 0 50 Facilities 34 65 9 26
Estimated Effect of Key Resources on Student Performance, Based on 376 Production Function Estimates for the United States
Statistically significant ( %) Resources Number of
estimates Positive Negative Statistically
insignificant (%) Real classroom resources
Teacher-pupil ratio 276 14 14 72 Teacher education 170 9 5 86 Teacher experience 206 29 5 66
Final aggregates Teacher salary 118 20 7 73 Expenditure per pupil 163 27 7 66
Other Facilities 91 9 5 86 Administration 75 12 5 83 Teacher test scores 41 37 10 53
Eric A. Hanushek, “The Failure of Input-Based Schooling Policies,” The Economic Journal, February, 2003.
Economic and Financial Affairs, 2005; and “Fiscal Implications of Ageing: Projections of Age-Related Spending,” OECD Economics Department Working Paper No. 305, September 19, 2001. 45 The Third Transition: Exploring the Impact of Changing Demographic Structures in Eastern Europe and the Former Soviet Union, The World Bank, 2007 (in progress).

26
32. It is more difficult to document and infer causality for low learning achievement than it is for incomplete school attendance. There is widespread debate about the factors affecting learning achievement, and there have many statistical attempts to identify the critical factors that lead to successful learning achievement (Box 2). Few of these have found robust links, which suggests that education is largely context-specific. Among the most consistent findings in the research literature are that learning outcomes are better when teachers are well educated and experienced, and when teachers are adequately paid. The level of expenditures per student often is positively related to learning outcomes, although the mechanism through which it affects learning undoubtedly differs, depending on the situation.
Figure 11: Public and Private Expenditure per Student on Education by Level, Expressed as a Percentage of Per-Capita GDP, OECD Countries, 2003
Source: OECD Education at a Glance, 2006, Chart B2.2
27
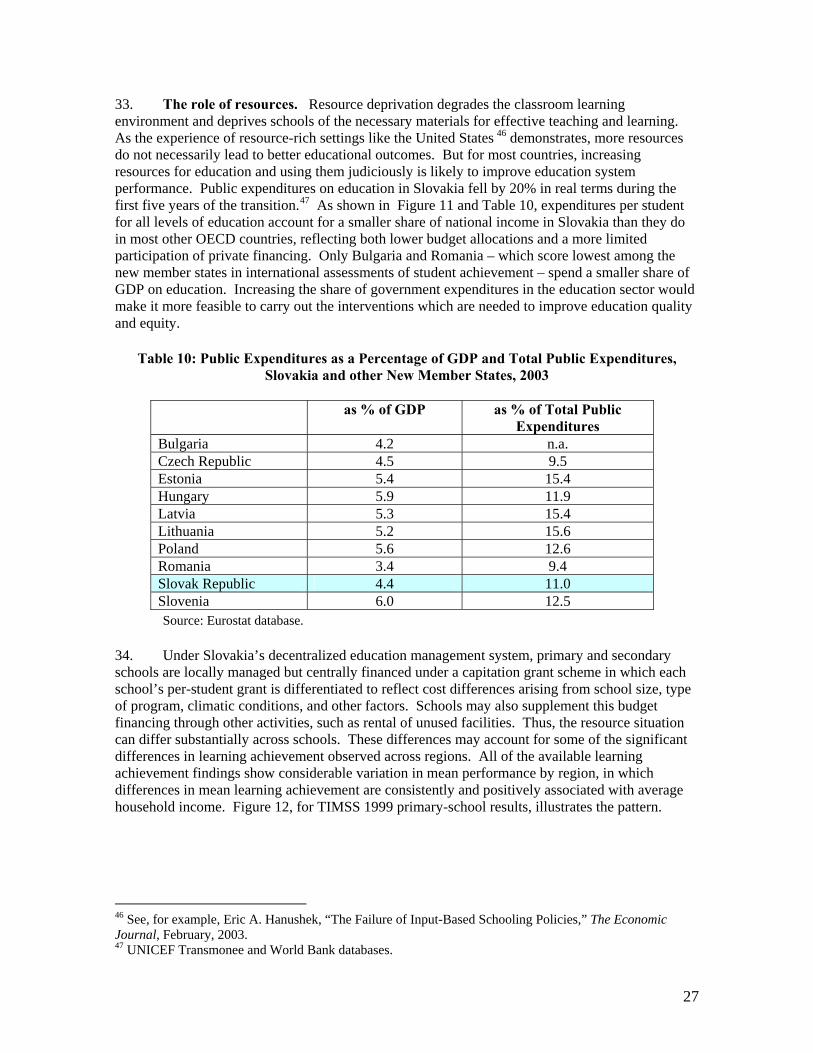
33. The role of resources. Resource deprivation degrades the classroom learning environment and deprives schools of the necessary materials for effective teaching and learning. As the experience of resource-rich settings like the United States 46 demonstrates, more resources do not necessarily lead to better educational outcomes. But for most countries, increasing resources for education and using them judiciously is likely to improve education system performance. Public expenditures on education in Slovakia fell by 20% in real terms during the first five years of the transition.47 As shown in Figure 11 and Table 10, expenditures per student for all levels of education account for a smaller share of national income in Slovakia than they do in most other OECD countries, reflecting both lower budget allocations and a more limited participation of private financing. Only Bulgaria and Romania – which score lowest among the new member states in international assessments of student achievement – spend a smaller share of GDP on education. Increasing the share of government expenditures in the education sector would make it more feasible to carry out the interventions which are needed to improve education quality and equity.
Table 10: Public Expenditures as a Percentage of GDP and Total Public Expenditures, Slovakia and other New Member States, 2003
as % of GDP as % of Total Public
Expenditures Bulgaria 4.2 n.a. Czech Republic 4.5 9.5 Estonia 5.4 15.4 Hungary 5.9 11.9 Latvia 5.3 15.4 Lithuania 5.2 15.6 Poland 5.6 12.6 Romania 3.4 9.4 Slovak Republic 4.4 11.0 Slovenia 6.0 12.5 Source: Eurostat database.
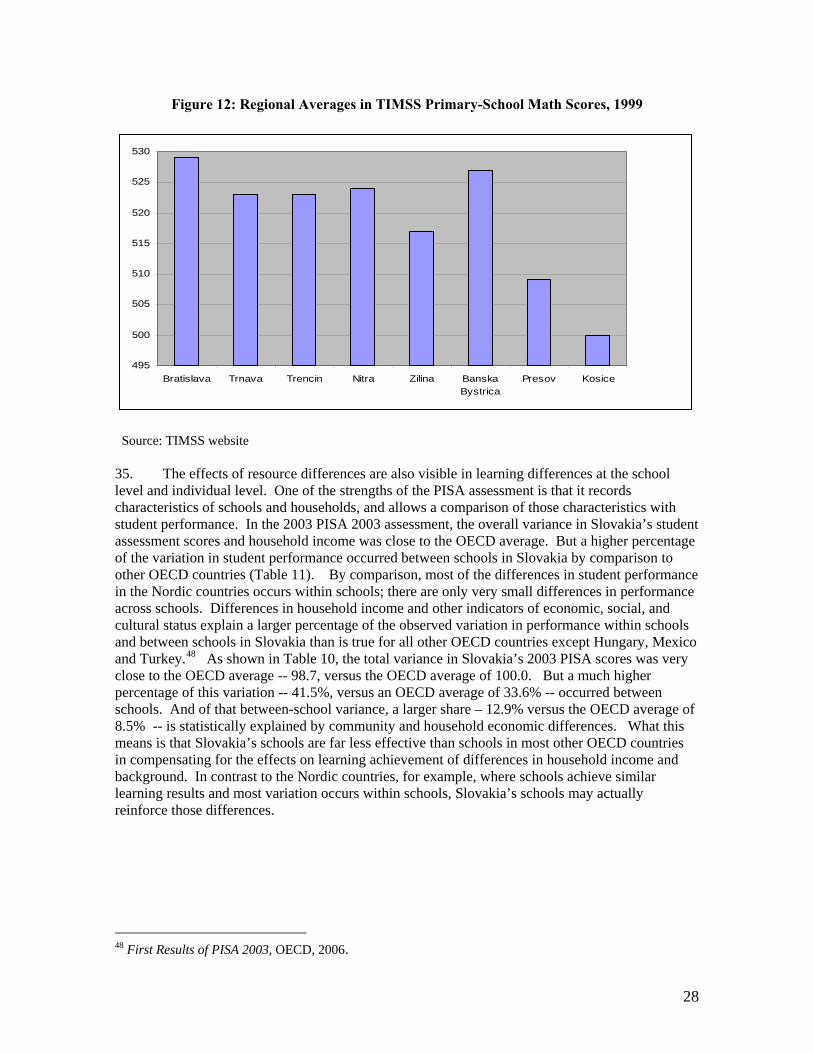
34. Under Slovakia’s decentralized education management system, primary and secondary schools are locally managed but centrally financed under a capitation grant scheme in which each school’s per-student grant is differentiated to reflect cost differences arising from school size, type of program, climatic conditions, and other factors. Schools may also supplement this budget financing through other activities, such as rental of unused facilities. Thus, the resource situation can differ substantially across schools. These differences may account for some of the significant differences in learning achievement observed across regions. All of the available learning achievement findings show considerable variation in mean performance by region, in which differences in mean learning achievement are consistently and positively associated with average household income. Figure 12, for TIMSS 1999 primary-school results, illustrates the pattern.
46 See, for example, Eric A. Hanushek, “The Failure of Input-Based Schooling Policies,” The Economic Journal, February, 2003. 47 UNICEF Transmonee and World Bank databases.
28
Figure 12: Regional Averages in TIMSS Primary-School Math Scores, 1999
495
500
505
510
515
520
525
530
Bratislava Trnava Trencin Nitra Zilina BanskaBystrica
Presov Kosice
Source: TIMSS website 35. The effects of resource differences are also visible in learning differences at the school level and individual level. One of the strengths of the PISA assessment is that it records characteristics of schools and households, and allows a comparison of those characteristics with student performance. In the 2003 PISA 2003 assessment, the overall variance in Slovakia’s student assessment scores and household income was close to the OECD average. But a higher percentage of the variation in student performance occurred between schools in Slovakia by comparison to other OECD countries (Table 11). By comparison, most of the differences in student performance in the Nordic countries occurs within schools; there are only very small differences in performance across schools. Differences in household income and other indicators of economic, social, and cultural status explain a larger percentage of the observed variation in performance within schools and between schools in Slovakia than is true for all other OECD countries except Hungary, Mexico and Turkey.48 As shown in Table 10, the total variance in Slovakia’s 2003 PISA scores was very close to the OECD average -- 98.7, versus the OECD average of 100.0. But a much higher percentage of this variation -- 41.5%, versus an OECD average of 33.6% -- occurred between schools. And of that between-school variance, a larger share – 12.9% versus the OECD average of 8.5% -- is statistically explained by community and household economic differences. What this means is that Slovakia’s schools are far less effective than schools in most other OECD countries in compensating for the effects on learning achievement of differences in household income and background. In contrast to the Nordic countries, for example, where schools achieve similar learning results and most variation occurs within schools, Slovakia’s schools may actually reinforce those differences.
48 First Results of PISA 2003, OECD, 2006.

29
Table 11: Decomposition of Variation in PISA 2003 Results
Source: Table 4.1a, First Results of PISA 2003, OECD, 2006
36 . Low teacher salaries. Teacher salaries are an important expenditure item which is not subject to variation across schools and regions. Teacher salaries in Slovakia currently average SK18,200 per month, or 1.27 times per-capita GDP.49 This is a very low level of remuneration by comparison to the OECD average (Table 12). Persistently low teacher salaries compromise learning achievement by eroding the motivation of current teachers and failing to attract highly
49 Ministry of Education
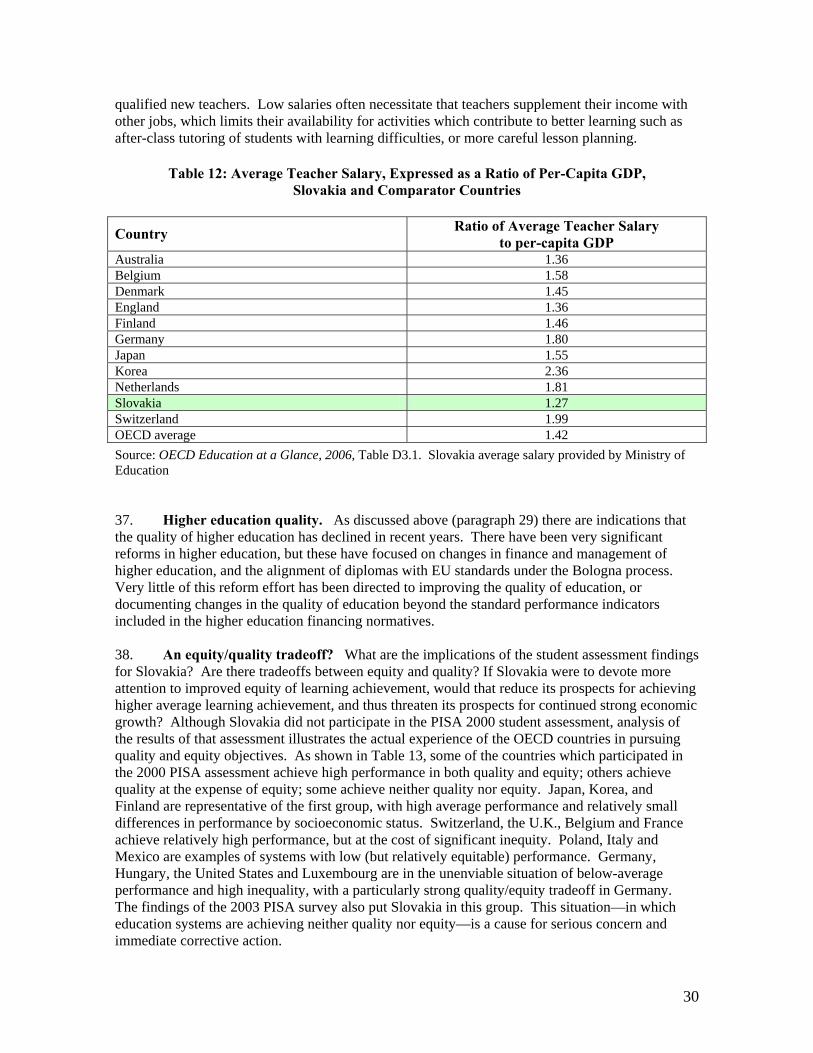
30
qualified new teachers. Low salaries often necessitate that teachers supplement their income with other jobs, which limits their availability for activities which contribute to better learning such as after-class tutoring of students with learning difficulties, or more careful lesson planning.
Table 12: Average Teacher Salary, Expressed as a Ratio of Per-Capita GDP, Slovakia and Comparator Countries
Country Ratio of Average Teacher Salary
to per-capita GDP Australia 1.36 Belgium 1.58 Denmark 1.45 England 1.36 Finland 1.46 Germany 1.80 Japan 1.55 Korea 2.36 Netherlands 1.81 Slovakia 1.27 Switzerland 1.99 OECD average 1.42 Source: OECD Education at a Glance, 2006, Table D3.1. Slovakia average salary provided by Ministry of Education 37. Higher education quality. As discussed above (paragraph 29) there are indications that the quality of higher education has declined in recent years. There have been very significant reforms in higher education, but these have focused on changes in finance and management of higher education, and the alignment of diplomas with EU standards under the Bologna process. Very little of this reform effort has been directed to improving the quality of education, or documenting changes in the quality of education beyond the standard performance indicators included in the higher education financing normatives. 38. An equity/quality tradeoff? What are the implications of the student assessment findings for Slovakia? Are there tradeoffs between equity and quality? If Slovakia were to devote more attention to improved equity of learning achievement, would that reduce its prospects for achieving higher average learning achievement, and thus threaten its prospects for continued strong economic growth? Although Slovakia did not participate in the PISA 2000 student assessment, analysis of the results of that assessment illustrates the actual experience of the OECD countries in pursuing quality and equity objectives. As shown in Table 13, some of the countries which participated in the 2000 PISA assessment achieve high performance in both quality and equity; others achieve quality at the expense of equity; some achieve neither quality nor equity. Japan, Korea, and Finland are representative of the first group, with high average performance and relatively small differences in performance by socioeconomic status. Switzerland, the U.K., Belgium and France achieve relatively high performance, but at the cost of significant inequity. Poland, Italy and Mexico are examples of systems with low (but relatively equitable) performance. Germany, Hungary, the United States and Luxembourg are in the unenviable situation of below-average performance and high inequality, with a particularly strong quality/equity tradeoff in Germany. The findings of the 2003 PISA survey also put Slovakia in this group. This situation—in which education systems are achieving neither quality nor equity—is a cause for serious concern and immediate corrective action.

31
Table 13: PISA 2000 Results: Mean Mathematical Literacy Scores,
and Score Gradient Attributable to Difference in Socio-Economic Status
Country Mean score in mathematical literacy
Score gradienta
Japan 557 24 Korea 547 23 New Zealand 537 45 Finland 536 30 Australia 533 46 Canada 533 37 Switzerland 529 49 United Kingdom 529 49 Belgium 520 48 France 517 48 Austria 515 41 Denmark 514 42 Iceland 514 24 Sweden 510 36 Ireland 503 38 OECD Average 500 41 Norway 499 42 Czech Republic 498 49 United States 493 48 Germany 490 60 Hungary 488 54 Spain 476 32 Poland 470 38 Italy 457 32 Portugal 454 41 Greece 447 38 Luxembourg 446 46 Mexico 387 35 a. score difference associated with a one unit increase in socio-economic status (on a six-point scale) Source: OECD Messages from PISA 2000 Skills Mismatch 39. The persistence of unemployment and unfilled job vacancies signals a disconnect between the demanders of skills (employers) and suppliers of skills (the authorities responsible for structure and content of education and training programs.) As noted above, part of the problem consists of a suboptimal mix of enrollments by specialization, with too many students enrolled in programs which neither prepare for higher education nor for productive employment. Another aspect of the problem is that education programs at all levels do not prepare students adequately in the new skills for which demand is growing most rapidly in the global economy. A third dimension of the skills mismatch problem is the non-involvement of employers in the design of training curricula. Although the link between employers and training institutions which was disrupted by the transition has been restored for some of the large, new enterprises – especially in the assembly of automobiles – it remains very limited for most smaller enterprises:

32
While the automotive industry is recruiting workers with short-term tertiary education, human resource directors are complaining about the disaffection of young people for technical schools, especially at higher levels. To overcome this problem, more and more big firms are developing partnerships with vocational schools. By providing the workshop equipments to schools, they ensure that students are familiar with their production techniques. However, training takes time and firms have not been able to cover all their recruitment needs through partnerships. In addition, this kind of ad-hoc partnership, which is subject to the short-term needs of companies, might not be a viable strategy to strengthen collaboration between schools and firms. It might stop as soon as recruitment difficulties are eased. Furthermore, small firms cannot afford such arrangements and remain excluded.50
40. In general, the problem of skills mismatch reflects a lack of information and incentives – a lack of information on the part of students and parents about current skill requirements in the labor market and the employment and earnings prospects associated with alternative education choices, and a lack of incentives on the part of managers of education and training programs to modify the content, structure, and pedagogical approach of existing education and training programs to better respond to evolving skill needs and to create new life-long learning opportunities to help meet these needs. Extensive work is ongoing on the changing skill requirements in the global economy.51 The findings of this work needs to be made more readily accessible to parents, students, and managers of education and training programs to help inform their choices. Means and incentives also need to be strengthened for improving the content and structure of education and training programs – including the expansion of life-long learning opportunities – and involving employers more closely in the development of those programs. C. Reform Options
41. This section presents a number of reform options to address the threats to continued growth that are described in Section A: low coverage of secondary and higher education, deteriorating learning achievement, and skills mismatch. For each of these areas, reform options are offered as alternative approaches for addressing the issues described above. Where there is interest in further elaboration of these options, additional detail and examples can be provided.
Limited Coverage of Secondary and Higher Education
42. Expanded social support. For students who do not complete secondary school because of perceived low quality and low job relevance, the options described below for improving education quality and relevance should help to improve secondary completion rates. For students from very poor families, the cost of school-related expenditures such as school materials and student transport may reduce school attendance. Expanded social support targeted to children from very poor households is the most promising approach for raising school attendance among this group. The Ministry of Education introduced social scholarships for needy secondary school students in 2004. This is an appropriate intervention for raising completion rates, but the coverage of the scholarships falls far short of needs. Social scholarships for secondary school students currently cover less than one-quarter of eligible students.52
50 Page 38, Catherine Saget, Jobs for Youth: Slovak Republic, OECD, December, 2006. 51 References to work by OECD, CEDEFOP, World Economic Forum, World Bank, etc. 52 Estimates provided by Ministry of Social Affairs.
33
43. Raising the performance of low-achieving students. For students who discontinue their secondary education over frustration with low educational achievement, efforts to improve performance through extracurricular tutoring and summer-school courses and other actions targeted to students with substandard performance should help to increase secondary school completion. Early detection of learning deficiencies and early intervention to address them are vital to the success of such efforts. An effective strategy to address sub-standard performance needs to include three elements:
• Clear standards and benchmarks for learning achievement against which individual student performance can readily be compared,
• Instruments – tests and other diagnostic tools -- for measuring individual student performance against these benchmarks, and
• Incentives for teachers to identify students who are not meeting learning benchmarks, and to work with them to bring their performance up to learning standards.
44. Incentives are a crucial part of this formula. Incentives are especially important in view of the former emphasis on high-performing students, and the past tendency to direct low-performing students to special schools for children with learning disabilities and schools offering terminal vocational instruction. Adopting an approach that focuses on raising the performance of low-aching students would involve a paradigm shift for teachers and the public. In order for that to happen, there would need to be a clear and consistent message from senior levels of Government that such a change is desired and needed. In order to motivate these changes at the school level and in local governments, there would also need to be incentives for teachers, school principals, and education managers to focus on raising the performance of substandard schools and students. Teacher salaries need to be increased, but the quid pro quo for increased salaries should be strengthened performance incentives introduced as part of new professional development standards for teachers and focusing on improved performance of low-achieving students. 45. There are a number of examples in the region of interventions which are designed to raise the performance of students with sub-standard achievement and schools with sub-standard performance. These include improved performance management systems for teachers and principals with associated salary and professional development incentives, implementation of school development plans and school report cards which include specific goals for raising the performance of low-achieving students, improvement of the school environment through the provision of teaching and learning materials and improvements to school facilities, and financial incentives for more highly qualified teachers to serve in rural schools (where learning problems are often concentrated). All of these are options for consideration in Slovakia. 46. Problems in learning achievement often start long before children begin formal schooling. Preschool interventions can help bring about lasting improvements in school performance on the part of children at risk of low performance once they start school. But preschool currently reaches very few such children in Slovakia. In order for preschool education to perform this remedial role, there would need to be a deliberate policy to develop preschools in areas where at-risk students are concentrated, and outreach efforts to motivate those children to attend. 47. Roma children face the most conspicuous risks of not completing secondary school. Promising approaches for improving school performance and school continuation among the Roma are described in Box 3.

34
Box 3: A Special Dimension of Education Coverage:
An important dimension of the problem of education coverage in Slovakia is the phenomenon of low school attendance among Roma children. Most Roma children start school, but many drop out when – or even before -- they complete the required minimum 10 years of instruction. Language is one of the problems that Roma children face in school. Although Slovakia offers minority-language instruction for other ethnic groups, Roma students do not benefit from these programs because there is no consensus on an appropriate version of the Romany language. In addition to the linguistic problem that Roma children face in school, there are other handicaps of Roma families that contribute to low school attendance.53 Parents are often illiterate and do not appreciate the importance of education. Low income makes it difficult for most Roma households to purchase the textbooks and other school supplies that parents are expected to provide. Roma children often work in the informal sector to supplement meager family income. Many Roma children do not have a reasonable command of any of the languages of instruction in schools. Many Roma families lack legal status and are therefore denied access to schools, health care, and other services. Roma often marry and start childbearing as early as age 12. Another problem is that Roma children who do attend primary school are often stigmatized by being assigned to schools for the handicapped, because of their lack of command of the national language and other educational handicaps resulting from their environment. A number of approaches to improving the educational performance of Roma children and other at-risk groups have proven successful in the region, including preschool education in the Romany language or in a multilingual environment, parental education, assistance in legal registration, and assistance in job placement or self employment at completion of schooling. The experience with Roma-targeted programs in the region shows that an inclusive approach that combines these dimensions of support offers the best prospects for raising school participation and school performance among the Roma population—especially when it involves child-centered learning methodologies and the commitment of the Roma community. Other successful measures to improve Roma school attendance and educational performance include provision of financial incentives to schools that attract and retain Roma students, provision of catch-up classes for Roma drop-outs and tutoring for Roma students, special training for teachers of Roma children and provision of linguistic and cultural mediators in schools with Roma students, and offering of optional Romany language and culture classes. Special resources are available under the Roma Educational Fund (http://www.romaeducationfund.org/) to support initiatives to improve school performance of the Roma. 48. Expanding higher education. For higher education, significant further increases in coverage will require investments to expand facilities and staffing. There are three main financing options:
• further significant budget increases, • the imposition of fees for full-time students in public universities, and • expanded enrollments in private, fee-paid universities.
Cost recovery through student fees in public and private universities would help to emphasize the investment nature of university studies (since there are high private returns to university completion), and would promote better efficiency in terms of student flows. On the other hand, there appears to be “room” for increased budget outlays for higher education (as well as for secondary education). Slovakia spends a significantly smaller share of GDP on education – both in
53 The challenges for integration of the Roma population in education and some of the successful approaches for doing so are summarized in Dena Ringold, Mitchell A. Orenstein, and Erika Wilkens. 2003. Roma in an Expanding Europe: Breaking the Poverty Cycle. Washington, DC: World Bank..
35
terms of budget outlays and, especially, private outlays -- than most other OECD countries (Figure 11). 49. One of the factors which has slowed the growth of private universities in other countries the region has been the concern that private universities will offer education of inferior quality. The most common response to this concern has been to require Government certification – usually, by the Ministry of Education or Ministry of Higher Education – for purposes of quality assurance. This approach has proven ineffective: The certification process has hindered the growth of private higher education, has proven vulnerable to corruption, and has not been effective in assuring consistently high quality standards. An alternative approach which has proven effective in a number of OECD countries puts the onus on higher education institutions for quality assurance, and relies on private, self-regulating accreditation bodies to set and monitor quality standards. This system provides strong incentives for universities themselves to maintain standards in order to attract students. Under this system, private universities typically occupy the quality extremes – offering the best and the worst quality education available in the country. This system has the advantage of providing high transparency and strong internal incentives for compliance with quality standards.
50. Clearly, the pursuit of any of the options for financing expanded higher education coverage would require a major political commitment. But the importance of the objective of expanded higher education coverage merits decisive action. The alternative would be to allow continued growth of higher education enrollments without a corresponding increase in resources. As other countries have learned by experience, this default option leads to rapid degradation of the higher education system, with disastrous long-term consequences for the country.
Deteriorating Learning Achievement 51. The role of standards, instruments, and incentives. Improving learning achievement requires, first, raising national expectations about learning achievement, and, second, providing the resources and incentives necessary to achieve them. Any effective strategy to raise learning achievement will need to include the elements described in the preceding section for raising the performance of low-achieving students:
• Clear standards and benchmarks for learning achievement against which performance can readily be compared,
• Instruments – tests and other diagnostic tools -- for measuring performance against these benchmarks, and
• Incentives to identify substandard performance, and work to raise it to system-wide learning standards.
One difference here is that the diagnosis of system – as opposed to individual -- performance should be based on information gathered at the school level, and interventions to address learning deficiencies should be undertaken at the school level. Formative assessment is a crucial diagnostic tool for determining how well the education system as a whole is meeting national learning objectives, and for highlighting areas of lagging performance that need corrective action. For example, assessment can identify concepts or learning areas which students consistently have difficulty mastering, thereby indicating a need for improved curriculum. teaching materials or special attention in in-service teacher training. At the school-level, too, assessment can identify schools in which students are not meeting learning standards and in need of remedial attention. Slovakia takes assessment seriously, as its participation in the PISA, TIMSS, and PIRLS international student assessments indicates. But there is a need to develop stronger incentives for
36
teachers to focus on learning achievement of their students, and to acquire the additional training and support that they may need in order to teach more effectively.
52. Resource needs. A strategy to raise national learning achievement is likely to require significant additional resources, especially since the areas with lowest performance also tend to be the areas with lowest incomes (and thus the most limited capacity to finance interventions to improve learning performance.) Additional resources are needed to bring teaching and learning conditions in poorly equipped schools up to the standards in the high-performing schools. Additional resources are also crucially needed in order to raise teacher salaries – preferably, in conjunction with new teacher development standards which give greater attention to improvement in student learning. Increased budget financing at all levels of education is one option – and one for which there appears to be fiscal “room” (Figure 11). Another potential source is budget savings from school consolidation and rationalized teacher deployment as school-age cohorts continue to shrink. As shown in Table 7, school-age-population is expected to shrink by one-third during the next two decades, implying considerable budget savings that could be used for improved quality and coverage. But these savings will not occur automatically. The means and incentives for school consolidation – including the normatives in the capitation financing formula (paragraph 56) – would need to be strengthened to provide additional impetus for school consolidation and teacher redeployment. 53. The task of directing resources where they are most needed to improve learning achievement may be more complicated under the decentralized management and financing of education in Slovakia. But intervention to improve learning achievement is possible even in highly decentralized education systems, as the experience of the No Child Left Behind program in the United States illustrates.54 Normative financing should be one of the instruments for allocating resources for performance improvement. But financing mechanisms for remedial interventions in schools with lagging performance need to be designed carefully to avoid the problem of moral hazard: If the financing formula provides additional funds for remedial programs in schools with persistent low performance, schools may be motivated to maintain substandard performance in order to continue receiving the remedial funds. A judicious balancing of performance-related incentives (carrots) and sanctions (sticks) can minimize this problem. Skills Mismatch 54. Changing the content of education programs. The content and structure of education and training also needs to change to become more responsive to evolving needs of the economy. Several types of change are called for. The growing demand for skills in areas such as foreign languages and computer applications means that the traditional distinction between academic and vocational or technical specializations is increasingly obsolete, because many of the most highly demanded skills in labor markets are typically offered in structured academic programs. The streaming or tracking of students into specialized vocational and technical programs and the highly selective admission into higher education need to be softened and made less ultimate. To the extent that specialized programs of vocational and technical education are offered in secondary and higher education, they need to be developed in ways that provide generalizable skills—skills that will not become obsolete immediately with changes in technology and industrial structure. The transition of the educational structure will be facilitated by providing better information to parents and students about the career implications of alternative educational choices and by promoting more student involvement in decisions about the changing structure of education and training programs. 54 http://www.ed.gov/nclb/landing.jhtml?src=pb

37
55. Streamlining the structure of education programs. The findings on performance/equity tradeoffs described above suggest that reforms in education structure could help to reduce performance differences in education. One of the implications of the strong quality-equity trade-off in Slovakia is that education tends to perpetuate and reinforce socioeconomic differences rather than mitigate them. In part, this outcome reflects the early streaming of students into academic and vocational programs. International evidence suggests that early tracking in schools not only generally leads to wider variation in student outcomes, but also does not offer clear gains in terms of the overall level of achievement. 55 Poland provides a good example of how national policy can affect a country’s equity/quality performance. After the 2000 survey, Poland took deliberate actions to improve its overall performance and reduce the differentials in learning achievement – including curriculum change to integrate education programs and delayed differentiation of content until after the age of 15.56 In the 2003 PISA assessment, Poland improved its average mathematics literacy score by 20 points (to 490), and very significantly reduced the SES gradient associated with its mathematics literacy scores. Later selection of students, as Poland has done, is one options for improving equity and performance of education. Another approach would be to gradually move away from current system of early selection of students into a segmented system of secondary grammar schools, specialized schools, vocational schools, associated schools, and secondary schools, toward a more integrated approach to secondary education. As described below, this might also help to address the problem of skills mismatch. Table 14: Financing Normatives for Primary and Secondary Schools, 2004 (in current SK)
Type of school or educational establishment Minimum Maximum
Primary schools with merged classes and primary schools under 150 pupils providing the only instruction in a particular teaching language 30,802 31,666
Primary schools without merged classes and primary schools with 151- 200 pupils providing the only instruction in a particular teaching language 25,758 26,622
Other primary schools 20,876 21,740 Secondary grammar schools 24,294 25,158 Sports secondary grammar schools 36,021 36,885 Secondary trade schools 32,360 33,224 Secondary art schools and nursing colleges 36,971 37,835 Conservatories 75,392 76,256 Secondary vocational schools and educational establishments 35,700 36,564 Practical training centres 16,689 17,553 Special primary schools 73,432 74,296 Special secondary schools 49,357 50,221 Primary art schools 8,503 9,028 Kindergartens 20,932 21,457 Youth hostels 22,650 23,175 Special kindergartens 50,358 50,883 Source: Ministry of Education
55 Eric A. Hanushek and Ludger Wößmann, "Does Educational Tracking Affect Performance and Inequality? Differences-in-Differences Evidence across Countries." Working Paper No. 11124, National Bureau of Economic Research , February, 2005. 56 Learning for Tomorrow’s World: First Results of PISA 2003, OECD, 2004, http://www.pisa.oecd.org/document/55/0,2340,en_32252351_32236173_33917303_1_1_1_1,00.html

38
56. The education reforms in Hungary, Poland, and Slovenia provide useful lessons about how these changes can be introduced (Box 1). The current system of capitation financing for primary and secondary schools discourages the move toward integration because it maintains current unit-cost differences across the various levels and types of schools (Table 14). Phasing out these differentials would provide an incentive for local authorities to consider carefully whether vocational schools are providing good value in equipping young people with relevant skills for productive employment, and encourage the transition to more integrated secondary education programs. 57. Language of Instruction. Slovakia’s policy of maintaining a complete program of minority-language schools through the secondary level adds to the cost of provision, and restricts the employment and further education options for the graduates of these programs who lack proficiency in the Slovak language. An alternative which would address these concerns and which many countries use to integrate students from other language backgrounds is to provide mother-tongue instruction as a transition to instruction in the majority language. 58. Lifelong learning. Specialized training programs also need to be developed to provide relevant adult training opportunities for people in and out of the labor market. Adult training and continuing education are important for four reasons: to upgrade skills to keep workers competitive in occupations with changing technology, to provide occupational mobility by equipping workers with new skills to change occupations, to update skills of retired workers who re-enter the labor force, and for personal enrichment. In view of the nonexistence of such programs under the inherited system, responding to this need constitutes a major challenge. 59. Developing the country’s lifelong learning capacity is not so much a matter of providing financing or incentives for adult training as it is of providing a supportive legal and regulatory framework. The higher education reforms which Slovakia adopted in 2002 provide higher education institutions the flexibility to offer short courses of training which are tailored to the local needs of employers and individuals. This is a very constructive approach for encouraging the involvement of higher education institutions in lifelong learning. The effort to promote the development of private capacity for job-specific training should involve a similar, indirect role of creating a supportive enabling environment for the spontaneous creation of training providers. In a liberal economy, firm-specific productivity gains should motivate employers to finance training, while earnings gains from the acquisition of more broadly applicable skills should motivate individuals to acquire and finance training. A constructive role for governments is to enable and encourage this process of life-long learning to occur spontaneously, without legal or other impediments. A less desirable approach is for governments to try to force the development of lifelong learning – for example, by taxing enterprises to meet the cost of training and providing tax credits for firms that provide approved training. Such levies are used in some EU countries, but have proven to be a costly instrument for promoting training. This approach adds significantly to the cost of employment and thereby discourages job creation and worker mobility. Training credits are also a blunt instrument for motivating employers to provide training that is relevant to their employees’ long-term training needs. Instead, training credits provide an incentive for employers to provide job-specific training that reduces rather than enhances their workers’ mobility. Finally, it is questionable whether they lead to workers receiving more training. In the presence of minimal public incentives for training,57 employers in the United States provide far more training to their employees than employers in countries with vocational training levies.
57 Employers in the United States can deduct training costs as a business cost—a far milder incentive than a tax-cum-tax-credit for training.
Related Documents