Poison frog warning signals: From the rainforest to the genome and back again by Adam Michael Murray Stuckert June, 2018 Director of Dissertation: Dr. Kyle Summers Major Department: Biology Signal communication is pervasive in nature and is used to convey information to both conspecifics and heterospecifics. Aposematic species use warning signals (e.g. bright coloration) to alert predators to the presence of a secondary defense (e.g., spines, toxins, etc). The presence of a conspicuous signal in combination with a secondary defense is thought to increase the efficiency of learned avoidance by predators and may prevent attacks altogether. Aposematism is widespread both geographically and taxonomically, and aposematic species are seen across the tree of life (including nudibranchs, invertebrates, and vertebrates). There are three main requirements for aposematism to function effectively. First, aposematic species must be able to produce a pattern that contrasts the environmental background (typically via chromatophores and pigments). Second, predators must be able to receive and learn to avoid preying upon aposematic individuals based on the signal. And finally, aposematism must confer a fitness benefit to the population of an aposematic species. In this dissertation I examine both the information that aposematic species convey and how the aposematic signal itself is produced. First, I examine whether the aposematic signal conveys detailed information to visual predators regarding an individual’s specific level of toxicity—a key, but contentious, hypothesis of aposematic theory. Second, I test whether the aposematic signal is multimodal in vertebrates by determining whether they present non-visual

Welcome message from author
This document is posted to help you gain knowledge. Please leave a comment to let me know what you think about it! Share it to your friends and learn new things together.
Transcript
Poison frog warning signals: From the rainforest to the genome and back again
by
Adam Michael Murray Stuckert
June, 2018
Director of Dissertation: Dr. Kyle Summers
Major Department: Biology
Signal communication is pervasive in nature and is used to convey information to both
conspecifics and heterospecifics. Aposematic species use warning signals (e.g. bright coloration)
to alert predators to the presence of a secondary defense (e.g., spines, toxins, etc). The presence
of a conspicuous signal in combination with a secondary defense is thought to increase the
efficiency of learned avoidance by predators and may prevent attacks altogether. Aposematism is
widespread both geographically and taxonomically, and aposematic species are seen across the
tree of life (including nudibranchs, invertebrates, and vertebrates). There are three main
requirements for aposematism to function effectively. First, aposematic species must be able to
produce a pattern that contrasts the environmental background (typically via chromatophores and
pigments). Second, predators must be able to receive and learn to avoid preying upon aposematic
individuals based on the signal. And finally, aposematism must confer a fitness benefit to the
population of an aposematic species.
In this dissertation I examine both the information that aposematic species convey and
how the aposematic signal itself is produced. First, I examine whether the aposematic signal
conveys detailed information to visual predators regarding an individual’s specific level of
toxicity—a key, but contentious, hypothesis of aposematic theory. Second, I test whether the
aposematic signal is multimodal in vertebrates by determining whether they present non-visual

predators with an olfactory cue/signal that contains sufficient information to indicate the
possession of toxins and thus decrease the likelihood of attack. Additionally, I use gene
expression data across multiple color morphs of an aposematic frog species to look at candidate
color genes and how they influence coloration. Finally, I examine gene expression during
developmental time periods that correlate with color deposition to examine how candidate color
genes influence color production over developmental time and across multiple color morphs.

Poison frog warning signals: From the rainforest to the genome and back again
A Dissertation
Presented To the Faculty of the Department of Biology
East Carolina University
In Partial Fulfillment of the Requirements for the Degree
Doctor of Philosophy in Biology
By
Adam Michael Murray Stuckert
June, 2018

Copyright Adam Stuckert, 2018

Poison frog warning signals: From the rainforest to the genome and back
by
Adam Michael Murray Stuckert
APPROVED BY:
DIRECTOR OF DISSERTATION: ______________________________________________________________________ Kyle Summers, PhD COMMITTEE MEMBER: ________________________________________________________________ Krista McCoy, PhD COMMITTEE MEMBER: ________________________________________________________________ Michael McCoy, PhD COMMITTEE MEMBER: ________________________________________________________________ Susan McRae, PhD COMMITTEE MEMBER: ________________________________________________________________ Ralph Saporito, PhD CHAIR OF THE DEPARTMENT OF BIOLOGY: ________________________________________________________________________ Jeffery McKinnon, PhD DEAN OF THE GRADUATE SCHOOL: __________________________________________________________________ Paul J. Gemperline, PhD

ACKNOWLEDGMENTS
Everyone has heard the common idiom that “it takes a village.” This is certainly true of a
dissertation. This document would not be here without the help and support of a huge number of
people. First and foremost, I have to acknowledge my PhD supervisor Dr. Summers, who took a
chance on me and has supported me every step of the way. My committee (Dr. Krista McCoy,
Dr. Michael McCoy, Dr. Susan McRae, and Dr. Ralph Saporito) have also been immensely
helpful, providing both the help I knew I needed, and some of the metaphorical ass-kicking I
didn’t know I needed. Dr. Rachel Page and Dr. John Christy at STRI also provided critical
intellectual support and help setting up an experiment in Panama. The faculty, students, and
administrative staff in the Biology department at East Carolina University have all been critically
important as well. Further, I’d like to thank a suite of undergraduates who have worked in the lab
during my tenure here, and specifically thank Casey Meeks, Chris Thaxton, Mikayla Johnson,
and Laura Bauza-Davila for their help in either the field or the lab; this work would not have
been possible without their help. The work herein was funded by grants from the North Carolina
Herpetological Society, ECU Biology, the Smithsonian Tropical Research Institute, National
Geographic, and the National Science Foundation.
Finally, and most importantly, I’d like to thank my wife Molly for her continual support
throughout this endeavor. Her support and belief in me has been a critical and undeniable part of
this.

TABLE OF CONTENTS
LIST OF TABLES ....................................................................................................................... viii
LIST OF FIGURES ....................................................................................................................... ix
LIST OF ABBREVIATIONS ......................................................................................................... x
I. INTRODUCTION ....................................................................................................................... 1
What does a signal tell predators? .............................................................................................. 1
Signal production ........................................................................................................................ 4
Conclusion ................................................................................................................................... 6
Literature Cited: ....................................................................................................................... 7
II. AN EMPIRICAL TEST INDICATES ONLY QUALITATIVELY HONEST APOSEMATIC
SIGNALING WITHIN A POPULATION OF VERTEBRATES ................................................ 12
Abstract: ................................................................................................................................... 12
Introductions: .......................................................................................................................... 13
Methods .................................................................................................................................... 16
Field work: ............................................................................................................................ 16
Spectral measurements: ......................................................................................................... 18
Alkaloid identification: .......................................................................................................... 20
Statistical analyses: ............................................................................................................... 20
Results ...................................................................................................................................... 21
Discussion ................................................................................................................................. 24
Predation release: ................................................................................................................. 27
Concluding remarks: ............................................................................................................. 27
Acknowledgements .................................................................................................................. 28
Literature Cited ....................................................................................................................... 29
III. IDENTIFYING SIGNAL MODALITIES OF APOSEMATISM IN A POISON FROG ...... 37
Abstract: ................................................................................................................................... 37
Introduction: ............................................................................................................................ 37
Methods: ................................................................................................................................... 40
Statistical analyses: ............................................................................................................... 43
Results: ..................................................................................................................................... 43
Discussion:................................................................................................................................ 45
Acknowledgements: ................................................................................................................ 48
Literature cited:....................................................................................................................... 49
IV. SKIN TRANSCRIPTOMICE ASSEMBLY AND DIFFERENTIAL GENE EXPRESSION
ACROSS DISTINCT COLOR PATTERN MORPHS OF A POISON FROG ............................ 53
Abstract: ................................................................................................................................... 53
Introduction: ............................................................................................................................ 54
Methods: ................................................................................................................................... 57
Color morphs:........................................................................................................................ 57
Sample collection: ................................................................................................................. 58
Transcriptome assembly: ....................................................................................................... 59
Downstream analyses: ........................................................................................................... 60
Results: ..................................................................................................................................... 61
Transcriptome assembly: ....................................................................................................... 61
Differential expression and pathways: .................................................................................. 63
Discussion:................................................................................................................................ 70
Melanin-related gene expression: ......................................................................................... 71
Purine synthesis and iridophore genes: ................................................................................ 77
Pteridine synthesis:................................................................................................................ 78
Novel candidate genes for coloration: .................................................................................. 79
Differentially expressed genes unrelated to color: ................................................................ 80
Conclusion: ............................................................................................................................ 81
Acknowledgements: ................................................................................................................ 81
Literature cited:....................................................................................................................... 83
V. TRANSCRIPTOMICS OF AN ONTOGENETIC SERIES PROVIDES INSIGHTS INTO
COLOR AND PATTERN DEVELOPMENT IN DIVERGENT COLOR MORPHS OFA
MIMETIC POISON FROG .......................................................................................................... 96
Abstract: ................................................................................................................................... 96
Introduction: ............................................................................................................................ 97
Methods: ................................................................................................................................... 99
Tadpole collection: ................................................................................................................ 99
Transcriptome assembly: ..................................................................................................... 101
Downstream analyses: ......................................................................................................... 102
Results: ................................................................................................................................... 103
Transcriptome assembly: ..................................................................................................... 103
Differential expression: ....................................................................................................... 104

Gene Ontology analyses: ..................................................................................................... 104
Discussion:.............................................................................................................................. 111
Melanophores and melanin: ................................................................................................ 111
Iridophores and purines: ..................................................................................................... 115
Xanthophores and pteridine synthesis:................................................................................ 117
Conclusions: ........................................................................................................................ 119
Acknowledgements: .............................................................................................................. 119
Literature Cited: ................................................................................................................... 121
VI. CONCLUSION..................................................................................................................... 131
APPENDIX: INSTITUTIONAL APPROVAL .......................................................................... 134

LIST OF TABLES
Table IV.1 .................................................................................................................................................... 62
Table IV.2 .................................................................................................................................................... 65

LIST OF FIGURES
Fig. II.1.......................................................................................................................................... 17
Fig. II.2.......................................................................................................................................... 23
Fig. II.3 ......................................................................................................................................... 23
Figure III.1 .................................................................................................................................... 44
Figure III.2 .................................................................................................................................... 45
Figure IV.1 .................................................................................................................................... 58
Figure IV.2 .................................................................................................................................... 62
Figure IV.3 .................................................................................................................................... 66
Figure IV.4 .................................................................................................................................... 66
Figure IV.5 .................................................................................................................................... 67
Figure IV.6 .................................................................................................................................... 67
Figure IV.7 .................................................................................................................................... 68
Figure IV.8 .................................................................................................................................... 69
Figure V.2 ................................................................................................................................... 106
Figure V.3 ................................................................................................................................... 107
Figure V.4 ................................................................................................................................... 107
Figure V.7 ................................................................................................................................... 110
Figure VI.1 .................................................................................................................................. 133
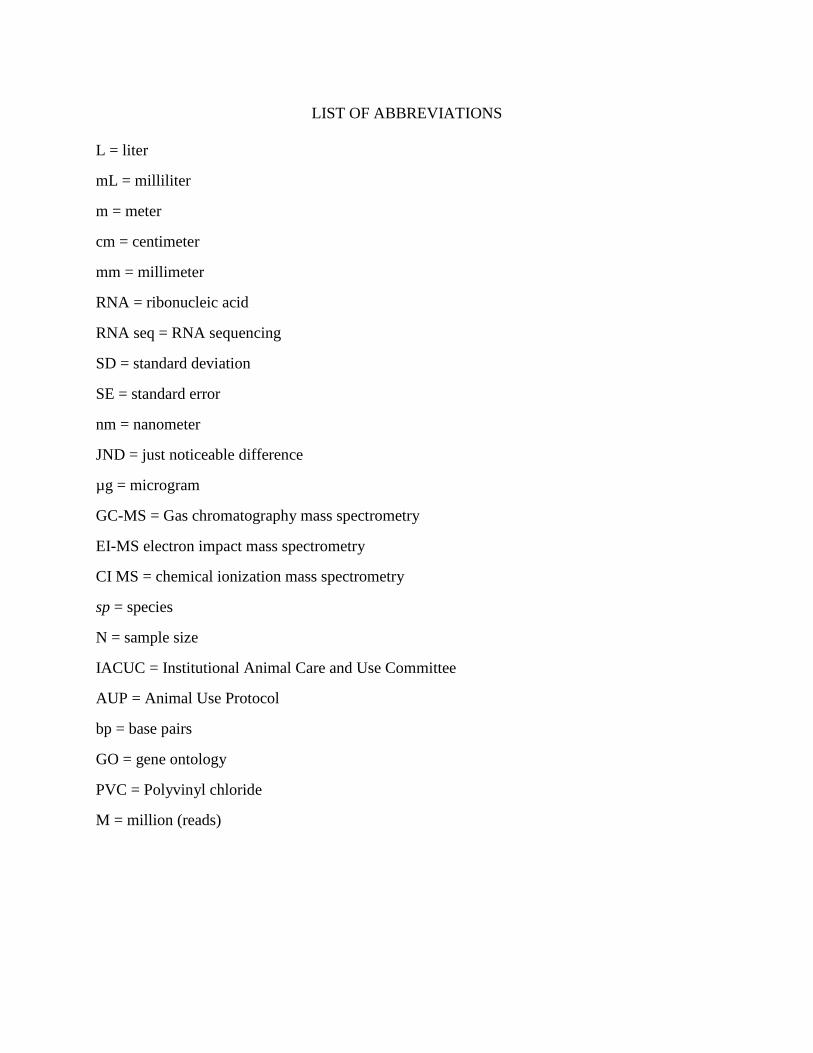
LIST OF ABBREVIATIONS
L = liter
mL = milliliter
m = meter
cm = centimeter
mm = millimeter
RNA = ribonucleic acid
RNA seq = RNA sequencing
SD = standard deviation
SE = standard error
nm = nanometer
JND = just noticeable difference
µg = microgram
GC-MS = Gas chromatography mass spectrometry
EI-MS electron impact mass spectrometry
CI MS = chemical ionization mass spectrometry
sp = species
N = sample size
IACUC = Institutional Animal Care and Use Committee
AUP = Animal Use Protocol
bp = base pairs
GO = gene ontology
PVC = Polyvinyl chloride
M = million (reads)
I. INTRODUCTION
Aposematism is an antipredator strategy in which an organism combines a conspicuous
appearance and a secondary defense (e.g., venom, toxicity, spines, etc.), advertising to predators
that they are dangerous (Poulton 1890). Studying aposematic species has been a fruitful avenue
of inquiry for over a century, in fact long before Poulton first coined the term. One of the
appealing characteristics of studying aposematism is that the visible phenotype is obviously tied
to the likelihood of survival and persistence, since predators generally exert positive frequency
dependent selection on aposematic forms (Müller 1879; Ruxton et al. 2004; Sherratt 2008).
Aposematism is a widespread antipredator strategy, both geographically and taxonomically
(Ruxton et al. 2004; Briolat et al. in press). Although aposematic organisms are frequently
studied, there are many critical gaps in our understanding of aposemes and their primary
antipredator strategy. Prominent amongst these is what information, specifically, they are
conveying to predators and how the signal is produced. In this dissertation, I will focus on these
two aspects of aposematism as an antipredator defense.
What does a signal tell predators?
Aposematic species are primarily defined by their conspicuous phenotype, a phenotype
which often involves bright colors that stand out from the background environment or pattern
elements that increase internal contrast (e.g., light stripes juxtaposed with dark stripes; Ruxton et
al. 2004). Given the nature of the aposematic signal, it is generally assumed that visual predators
are the primary selective agents acting on aposematic species. Indeed, there is a plethora of
studies examining how visual predators, particularly birds, play a role in the evolution and
maintenance of aposematic phenotypes (Smith 1975; Saporito et al. 2007; Chouteau and Angers
2
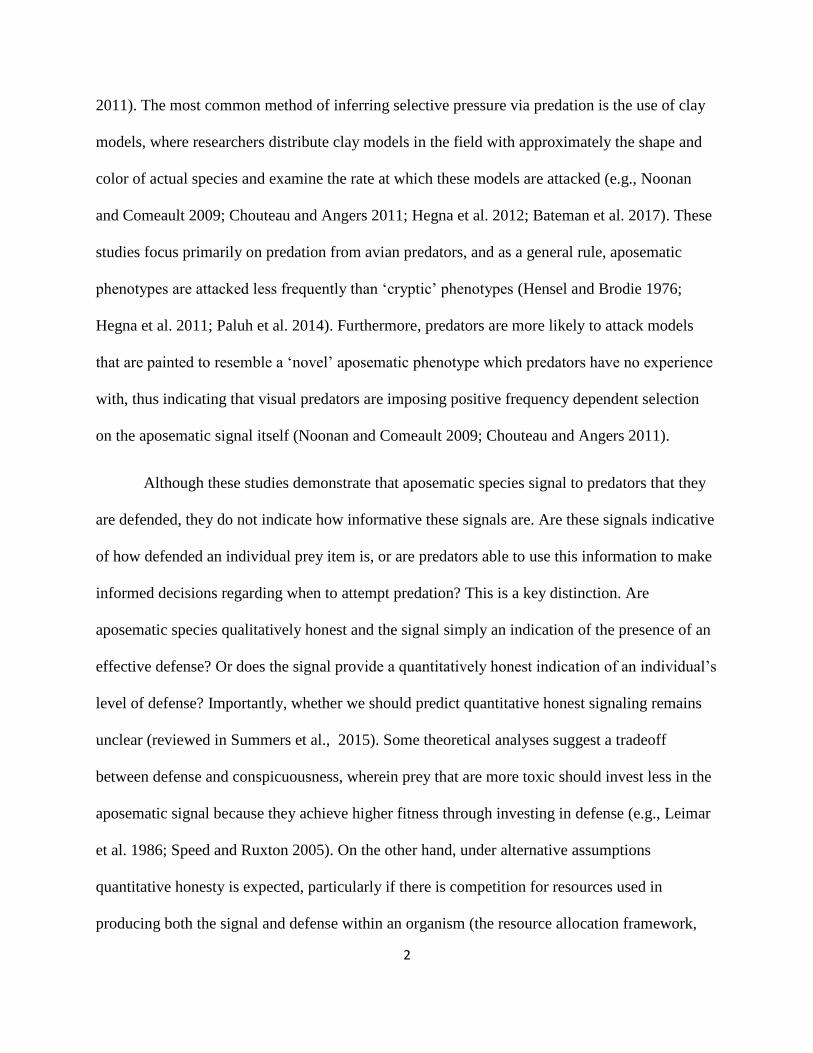
2011). The most common method of inferring selective pressure via predation is the use of clay
models, where researchers distribute clay models in the field with approximately the shape and
color of actual species and examine the rate at which these models are attacked (e.g., Noonan
and Comeault 2009; Chouteau and Angers 2011; Hegna et al. 2012; Bateman et al. 2017). These
studies focus primarily on predation from avian predators, and as a general rule, aposematic
phenotypes are attacked less frequently than ‘cryptic’ phenotypes (Hensel and Brodie 1976;
Hegna et al. 2011; Paluh et al. 2014). Furthermore, predators are more likely to attack models
that are painted to resemble a ‘novel’ aposematic phenotype which predators have no experience
with, thus indicating that visual predators are imposing positive frequency dependent selection
on the aposematic signal itself (Noonan and Comeault 2009; Chouteau and Angers 2011).
Although these studies demonstrate that aposematic species signal to predators that they
are defended, they do not indicate how informative these signals are. Are these signals indicative
of how defended an individual prey item is, or are predators able to use this information to make
informed decisions regarding when to attempt predation? This is a key distinction. Are
aposematic species qualitatively honest and the signal simply an indication of the presence of an
effective defense? Or does the signal provide a quantitatively honest indication of an individual’s
level of defense? Importantly, whether we should predict quantitative honest signaling remains
unclear (reviewed in Summers et al., 2015). Some theoretical analyses suggest a tradeoff
between defense and conspicuousness, wherein prey that are more toxic should invest less in the
aposematic signal because they achieve higher fitness through investing in defense (e.g., Leimar
et al. 1986; Speed and Ruxton 2005). On the other hand, under alternative assumptions
quantitative honesty is expected, particularly if there is competition for resources used in
producing both the signal and defense within an organism (the resource allocation framework,
3
Blount et al. 2009) or if there is a tradeoff with future fecundity (Holen and Svennungsen 2012).
Few empirical tests have been conducted in vertebrates (particularly within populations), but
there has been substantial work on invertebrates. In chapter two of this dissertation, I test the
hypothesis of quantitative honesty in a vertebrate population. Specifically, I test whether the
level of the aposematic signal (as perceived by avian predators) is correlated with an individual’s
level of defense.
However, while birds have received the most attention as predators of aposematic species
they are not the only potential predators that aposematic species will encounter. While birds
(particularly jacamars) are thought to be the primary predators of the Neotropical Heliconius
butterflies (Mallet and Barton 1989; Langham 2004), the primary predators of other aposematic
species are unclear. Evidence indicates that the primary predator of the Asian newt Cynops
pyrroghaster varies throughout the species’ range; mammals are the main predators on the
mainland whereas birds are the primary predators in island populations (Mochida 2011). The
primary predators of the Neotropical poison frogs remain unclear. Although clay model studies
(Noonan and Comeault 2009; Chouteau and Angers 2011; Hegna et al. 2011; Paluh et al. 2014)
indicate that birds are a primary selective force, and often a source of purifying selection towards
a single local aposematic phenotype, there is only direct observational evidence for attacks by
one specific avian predator (Master 1999; Alvarado et al. 2013), whereas multiple other predator
guilds have been observed preying on dendrobatids (e.g., Myers et al. 1978; Summers 1999;
Lenger et al. 2014). One clay model study placed camera traps on a small subset of their clay
models and found that most predation events were not by birds but rather by a suite of other
predators (Willink et al. 2014). Further, they found that predation events by different predator
guilds often impose a different selective regime on these clay models than birds.
4
This suite of evidence indicates that, perhaps, we need to consider the influence that other
predator guilds have on aposematic species. Although birds are well-equipped to see
conspicuous colors and glean information from that, it is unclear how many other predators
respond to aposematic species. Of particular interest are the additional antipredator strategies that
aposematic species may have evolved to deal with non-visual predators. For example, recent
evidence in aposematic insects indicates that there is an olfactory component to aposematism
that contributes to learned predator avoidance (Rowe and Halpin 2013). A fundamental question
is whether this olfactory component of aposematism is a widely-evolved trait of aposematic
species, or whether it is more ‘restricted’ to invertebrates. In chapter three of this dissertation I
use non-visual predators to examine whether aposematic species provide sufficient information
to potential non-visual predators to make informed decisions regarding predation. I also attempt
to elucidate whether this is a mere byproduct of aposematism itself, or whether this is a
specifically evolved signal.
Signal production
According to classical theory aposematic species should face purifying selection towards
a single phenotype. This, however, is not true within species or even populations. In fact,
variability of the warning signal very much seems to be the norm (reviewed in Briolat et al. in
press). How is all of this variability produced?
Given that the underlying cellular mechanisms that produce aposematic signals are
important, I focused on two highly variable groups of poison frogs to investigate the mechanisms
by which they produce color at the cellular level. First, I examined differences in gene
expression near the completion of metamorphosis in four color morphs of the poison frog
5
Dendrobates auratus. This species exhibits a remarkable variety of colors and patterns across its
range, and thus are a functional model for examining the genomic influence of coloration within
a species.
Second, I examined gene expression across color morphs and throughout development in
a different species, Ranitomeya imitator. This species is particularly interesting for this type of
analysis as it is a Mullerian mimicry system in which all species are toxic and defended by
predators (Stuckert et al. 2014a,b). In this system, one species (Ranitomeya imitator) has evolved
to mimic the appearance of three different congeners in four geographically distinct areas (R.
fantastica, R. summersi, and two geographically separated morphs of R. variabilis; (Symula et al.
2001, 2003).
The genetics of color and pattern in aposematic species is particularly interesting given
just how variable color patterns are, and how little geographic distance often separates
completely different color patterns (Ruxton et al. 2004, Briolat et al. in press). Determining the
underlying genetic architecture of these changes has been a primary thrust of recent decades as
well. Researchers have been able to identify some key elements in Heliconius butterfly mimicry
systems (e.g., WntA (Martin et al. 2012) and optix (Reed et al. 2011; Supple et al. 2013)), though
there are many others likely involved as well (reviewed in Kronforst and Papa 2015).
Interestingly, it seems that only a handful of loci control the different phenotypes produced in
certain mimetic complexes and that supergenes may be critically important in the diversity of
mimetic phenotypes we see in nature in Mullerian mimicry in Heliconius and Batesian mimicry
in Papilio butterflies (Kunte et al. 2014; Kronforst and Papa 2015; Nishikawa et al. 2015).
However, this is one system and its general applicability remains unclear. Preliminary evidence
suggests that this may be a common pattern, as color and pattern in the analogous mimicry
6
system also appear to be controlled by a few genes, at least in one admixture zone (Vestergaard
et al. 2015).
I aim to identify genes important in color and pattern production in four separate morphs
of the above-mentioned mimetic poison frog Ranitomeya imitator. Furthermore, I aim to
determine when color and pattern-specific genes are expressed during development. I examine
gene expression using RNA sequencing from four different mimetic color populations of R.
imitator, each from four different time points during early development. First, I consider overall
gene expression patterns during development and across populations. Then I examine expression
and timing of candidate color genes compiled from other taxa. These results will provide
valuable insight into the genes that are controlling color and pattern elements both across
populations and through development.
Conclusion
In this dissertation, I will examine critical elements of the production of the aposematic
signal, as well as the information that the aposematic signal contains for potential predators.
These investigations will provide key insights into the basic functioning of aposematism.

7
Literature Cited:
Alvarado, J. B., A. Alvarez, and R. A. Saporito. 2013. Oophaga pumilio (Strawberry poison
frog). Predation. Herpetol. Rev. 44:298.
Bateman, P. W., P. A. Fleming, and A. K. Wolfe. 2017. A different kind of ecological
modelling: the use of clay model organisms to explore predator–prey interactions in
vertebrates. J. Zool. 301:251–262.
Blount, J. D., M. P. Speed, G. D. Ruxton, and P. A. Stephens. 2009. Warning displays may
function as honest signals of toxicity. Proc. R. Soc. Biol. Sci. 276:871–877.
Chouteau, M., and B. Angers. 2011. The role of predators in maintaining the geographic
organization of aposematic signals. Am. Nat. 178:810–817.
Hegna, R. H., R. A. Saporito, and M. A. Donnelly. 2013. Not all colors are equal: predation and
color polytypism in the aposematic poison frog Oophaga pumilio. Evol. Ecol. 27:831–845.
Hegna, R. H., R. A. Saporito, K. G. Gerow, and M. A. Donnelly. 2011. Contrasting colors of an
aposematic poison frog do not affect predation. Ann. Zool. Fennici 48:29–38.
Hensel, J. L. J., and E. D. J. Brodie. 1976. An experimental study of aposematic coloration in the
salamander Plethodon jordani. Copeia 59–65.
Holen, Ø. H., and T. O. Svennungsen. 2012. Aposematism and the handicap principle. Am. Nat.
180:629–641.
Kronforst, M. R., and R. Papa. 2015. The functional basis of wing patterning in Heliconius
butterflies: The molecules behind mimicry. Genetics 200:1–19.
Kunte, K., W. Zhang, A. Tenger-Trolander, D. H. Palmer, A. Martin, R. D. Reed, S. P. Mullen,
8
and M. R. Kronforst. 2014. doublesex is a mimicry supergene. Nature 507:229–232.
Langham, G. M. 2004. Specialized avian predators repeatedly attack novel color morphs of
Heliconius butterflies. Evolution (N. Y). 58:2783–2787.
Leimar, O., M. Enquist, and B. Sillen-tullberg. 1986. Evolutionary stability of aposematic
coloration and prey unprofitability: A theoretical analysis. Am. Nat. 128:469–490.
Lenger, D. R., J. K. Berkey, and M. B. Dugas. 2014. Predation on the toxic Oophaga pumilio
(Anura:Dendrobatidae) by Rhadinaea decorata (Squamata:Colubridae). Herpetol. Notes
7:83–84.
Mallet, J., and N. H. Barton. 1989. Strong natural selection in a warning-color hybrid zone.
Evolution (N. Y). 43:421–431.
Martin, A., R. Papa, N. J. Nadeau, R. I. Hill, B. A. Counterman, G. Halder, C. D. Jiggins, M. R.
Kronforst, A. D. Long, W. O. McMillan, and R. D. Reed. 2012. Diversification of complex
butterfly wing patterns by repeated regulatory evolution of a Wnt ligand. Proc. Natl. Acad.
Sci. 109:12632–12637.
Master, T. L. 1999. Predation by rufous motmot on black-and-green poison dart frog. Wilson
Bull. 111:439–440.
Mochida, K. 2011. Combination of local selection pressures drives diversity in aposematic
signals. Evol. Ecol. 25:1017–1028.
Müller, F. 1879. Ituna and Thyridia: a remarkable case of mimicry in butterflies. Proc. Entomol.
Soc. London XX--XXIX.
Myers, C. W., J. W. Daly, and B. Malkin. 1978. A dangerously toxic new frog (Phyllobates)
9
used by Emberá indians of Western Colombia, with discussion of blowgun fabrication and
dart poisoning. Bull. Am. Museum Nat. Hist. 161:307–366.
Nishikawa, H., T. Iijima, R. Kajitani, J. Yamaguchi, T. Ando, Y. Suzuki, S. Sugano, A.
Fujiyama, S. Kosugi, H. Hirakawa, S. Tabata, K. Ozaki, H. Morimoto, K. Ihara, M. Obara,
H. Hori, T. Itoh, and H. Fujiwara. 2015. A genetic mechanism for female-limited Batesian
mimicry in Papilio butterfly. Nat. Genet. 47:405–409. Nature Publishing Group.
Noonan, B. P., and A. a Comeault. 2009. The role of predator selection on polymorphic
aposematic poison frogs. Biol. Lett. 5:51–4.
Paluh, D. J., M. M. Hantak, and R. A. Saporito. 2014. A test of aposematism in the dendrobatid
poison frog Oophaga pumilio: The importance of movement in clay model experiments. J.
Herpetol. 48:249–254.
Poulton, E. 1890. The colours of animals: Their meaning and use especially considered in the
case of insects. P. in K. Paul, ed. The International Scientific Series. Trench Trubner & Co
Ltd, London.
Reed, R. D., R. Papa, A. Martin, H. M. Hines, M. R. Kronforst, R. Chen, G. Halder, H. F.
Nijhout, and W. O. Mcmillan. 2011. optix drives the repeated convergent evolution of
butterfly wing pattern mimicry. Science (80-. ). 333:1137–1141.
Rowe, C., and C. Halpin. 2013. Why are warning displays multimodal? Behav. Ecol. Sociobiol.
67:1425–1439.
Ruxton, G. D., T. N. Sherratt, and M. P. Speed. 2004. Avoiding attack: The evolutionary ecology
of crypsis, warning signals and mimicry.
10
Saporito, R. A., M. A. Donnelly, P. Jain, H. Martin Garraffo, T. F. Spande, and J. W. Daly. 2007.
Spatial and temporal patterns of alkaloid variation in the poison frog Oophaga pumilio in
Costa Rica and Panama over 30 years. Toxicon 50:757–78.
Sherratt, T. N. 2008. The evolution of Müllerian mimicry. Naturwissenschaften 95:681–95.
Smith, S. M. 1975. Innate recognition of coral snake pattern by a possible avian predator.
Science (80-. ). 187:759–760.
Speed, M. P., and G. D. Ruxton. 2005. Warning displays in spiny animals: One (more)
evolutionary route to aposematism. Evolution (N. Y). 59:2499–2508.
Stuckert, A. M. M., R. A. Saporito, P. J. Venegas, and K. Summers. 2014a. Alkaloid defenses of
co-mimics in a putative Müllerian mimetic radiation. BMC Evol. Biol. 14:1–8.
Stuckert, A. M. M., P. J. Venegas, and K. Summers. 2014b. Experimental evidence for predator
learning and Müllerian mimicry in Peruvian poison frogs (Ranitomeya, Dendrobatidae).
Evol. Ecol. 28:413–426.
Summers, K. 1999. Predation on Dendrobates auratus, the green poison frog, by spiders on
Taboga Island, in Panama. Herpetol. Rev. 30:91.
Summers, K., M. P. Speed, J. D. Blount, and A. M. M. Stuckert. 2015. Are aposematic signals
honest? A review. J. Evol. Biol. 28:1583–1599.
Supple, M. a, H. M. Hines, K. K. Dasmahapatra, J. J. Lewis, D. M. Nielsen, C. Lavoie, D. a Ray,
C. Salazar, W. O. Mcmillan, and B. a Counterman. 2013. Genomic architecture of adaptive
color pattern divergence and convergence in Heliconius butterflies. Genome Res. 23:1248–
1257.
11
Symula, R., R. Schulte, and K. Summers. 2001. Molecular phylogenetic evidence for a mimetic
radiation in Peruvian poison frogs supports a Müllerian mimicry hypothesis. Proc. R. Soc. B
Biol. Sci. 268:2415–21.
Symula, R., R. Schulte, and K. Summers. 2003. Molecular systematics and phylogeography of
Amazonian poison frogs of the genus Dendrobates. Mol. Phylogenet. Evol. 26:452–475.
Vestergaard, J. S., E. Twomey, R. Larsen, K. Summers, and R. Nielsen. 2015. Number of genes
controlling a quantitative trait in a hybrid zone of the aposematic frog Ranitomeya imitator.
Proc. R. Soc. B 282:20141950.
Willink, B., A. García-rodríguez, F. Bolaños, H. Pröhl, and C. Rica. 2014. The interplay between
multiple predators and prey colour divergence. 580–589.
II. AN EMPIRICAL TEST INDICATES ONLY QUALITATIVELY HONEST APOSEMATIC
SIGNALING WITHIN A POPULATION OF VERTEBRATES
Adam M M Stuckert*1, Ralph A Saporito2, and Kyle Summers1
1Department of Biology, East Carolina University, Greenville, NC 27858, USA
2Department of Biology, John Carroll University, University Heights, Ohio 44118, USA
Abstract:
Signaling is an important part of intraspecific and interspecific interactions. Theoretical work
examining honest signaling in aposematic species (e.g., those with conspicuous colors and
secondary defenses) has focused primarily on discerning the patterns between conspicuousness
and defense within populations. Most empirical work, however, has investigated these patterns
across populations or species. Here, we test for honest signaling across individuals within a
population of the aposematic poison frog, Ranitomeya imitator. We find no evidence that
increasing levels of the aposematic signal are correlated with increasing levels of defense in this
species, indicating that our study population does not signal in a quantitatively honest manner
but rather that the signal is qualitatively honest. Additionally, we found no evidence that frogs
with higher levels of defense behave more boldly as a result of the presumed increased
ecological release from predation, an expected outcome in a qualitatively honest system. We
discuss our findings in light of the ecology and evolution of R. imitator, and suggest mechanisms
that may explain the absence of a relationship between toxicity and the aposematic signal.

13
Introductions:
Communication via signals is common in the animal kingdom, and signals are used to
convey information to both conspecifics and heterospecifics. In some cases, interests align
between the signaler and receiver, which can result in mutually beneficial communication
(Weldon and Burghardt, 2015). While signals are generally considered reliable, individuals may
profit by ‘cheating’ in order to gain a fitness reward (e.g., access to mates, food, etc.). Hence, a
central question in animal behavior is whether the signals individuals produce are honest
indicators of the information being conveyed to receivers (e.g., Zahavi 1975, 1977; Dawkins and
Guilford, 1991).
Honest signaling has often been investigated in the context of sexual selection (e.g.,
Velando et al., 2006; Vanpé et al., 2007; Emlen et al., 2012; Giery and Layman, 2015), but less
frequently in the context of natural selection. Certain species signal directly to predators via traits
that increase their probability of being detected. These aposematic species combine conspicuous
signals with the presence of a secondary defense (e.g., venoms, poisons, spines, etc.), which are
generally thought to be honest (barring cheaters, such as Batesian mimics) in the sense that they
advertise the presence of a defense (qualitative honesty: reviewed in Summers et al., 2015).
Perhaps more intriguing is whether a species is characterized by quantitative honesty: more
specifically, is there a correlation between signal level and strength of defense (for example,
increasing brightness or color saturation with increasing toxicity) that has evolved to accurately
communicate level of defense to predators? This question has been the increasing focus of both
theoretical and empirical works over the last couple of decades (reviewed in Summers et al.,
2015).
14
Importantly, whether we should predict quantitatively honest signaling remains unclear.
Some theoretical analyses have suggested a tradeoff between defense and conspicuousness,
wherein prey that are more toxic should invest less in the aposematic signal because they achieve
higher fitness through investing in defense (e.g., Leimar et al., 1986; Speed and Ruxton, 2005).
On the other hand, under alternative assumptions quantitative honesty is expected, particularly if
there is competition for resources used in producing both the signal and defense within an
organism (the resource allocation framework, Blount et al. (2009)) or if there is a tradeoff with
future fecundity (Holen and Svennungsen, 2012). Few empirical tests have been conducted
(particularly within populations), except in invertebrates. These empirical tests have found a
positive correlation between: brightness and poison gland size in Spanish papers wasps (Polistes
dominula; Vidal-Cordero et al., 2012), elytra color and chemical defense in the Asian ladybird
(Harmonia axyridis; Bezzerides et al., 2007), and color saturation and toxicity within ladybird
species (Arenas et al., 2015). Those studies that have attempted to elucidate the mechanism
underlying the production of quantitatively honest signaling provide support for the resource
allocation hypothesis (Bezzerides et al., 2007; Blount et al., 2012). Although these studies
provide evidence that quantitative honesty exists within populations of insects, this relationship
may depend on what aspect of the signal is considered (e.g., Winters et al., 2014). Additionally,
whether quantitative honesty is generally applicable to other taxa is unclear. Studies
investigating the relationship between signal level and toxicity across populations have found
mixed results (e.g., Daly and Myers 1967; Wang 2011; Maan and Cummings 2012; Arenas et al.
2015), while there seems to be a more consistent positive relationship between signal and
toxicity across species (e.g., Summers and Clough 2001; Cortesi and Cheney 2010; Arenas et al.
2015). The only test of quantitative honesty within a vertebrate population found no evidence of
15
quantitative honesty in aposematic newts (Mochida et al., 2013). Thus, the issue of within-
population relationships is particularly pertinent because many insects (e.g., lepidopterans)
acquire their toxicity as larvae before metamorphosing into adults (Duffey 1980), whereas in
many vertebrate aposemes, defense is acquired either during development and/or throughout
later life (e.g., dendrobatid poison frogs: Daly et al., 1994; other poison frogs: Jeckel et al., 2015;
newts: Hanifin and Brodie, 2002; snakes: McCue, 2006; mammals: Newman et al., 2005;
Hunter, 2009). As a result, it is critical to test basic hypotheses in a variety of taxa that have
different life histories to better determine if quantitative honesty is a general trend or if it only
occurs because of specific life histories.
Aposematism comes with a putative release from predation pressure, which may allow
aposematic species to use novel habitats or gain unique foraging opportunities (Santos and
Cannatella, 2011; Cummings and Crothers, 2013). Since defended individuals are not relying on
stationary crypsis to avoid the attention of predators, aposematic individuals are free to move
throughout the landscape and actively forage and attract mates. Under quantitative honesty, we
would expect aposematic individuals to be bolder, and further we hypothesize that the most toxic
(i.e., most chemically defended) individuals will be the boldest within a population. Given the
relationship between toxicity and the aposematic signal, predators would then be expected to
avoid the brightest individuals because they are also likely to be the most toxic. This potential
predation release for brighter and/or more toxic individuals would likely have a positive impact
on their foraging success, mate acquisition, or overall fitness. However, in systems with purely
qualitative honesty we may not expect the same degree of ecological release from predation
pressure for more toxic and/or brighter individuals if predators are merely concerned with the
presence of toxins, and not the level of toxicity per se. Therefore, under the alternative
16
hypothesis of qualitative honesty we would not expect a positive relationship between toxicity
and behavioral boldness. Thus, by testing for increased boldness we can investigate specific
potential benefits conferred via aposematism within a population.
In this paper, we test the hypothesis of quantitative honesty and examine the relationship
between conspicuousness and toxicity within an aposematic vertebrate, Ranitomeya imitator, a
Peruvian poison frog (Dendrobatidae) that possesses alkaloid defenses (Stuckert et al. 2014a,b).
We measure the conspicuousness of the visual signal using two different methods. First, we use
receiver-independent measures of total spectral brightness and second, we use receiver-
dependent visual models of both chromatic and achromatic contrast. Both of these measurements
are important, as receiver-independent honesty may indicate a resource allocation tradeoff, while
predator visual models may indicate that predators enforce quantitative honesty. We then
compare both measures of conspicuousness to total alkaloid content (a measure of toxicity) from
10 individual males that held contiguous territories within a single population. Lastly, we test the
hypothesis that brighter or more toxic individuals may benefit more from predation release and
look at individual boldness by examining male calling behavior within our focal population of R.
imitator to determine if highly toxic individuals are released from predation pressure.
Methods
Field work:
Territories of 10 male Ranitomeya imitator were identified near Tarapoto, San Martin,
Peru over a period of a two weeks (see Figure II.1). Although both males and females in this
population have a yellow-green spotted aposematic phenotype, males are more engaged in
territorial behavior, and thus are likely the most visible to predators and researchers (Brown et
17
al., 2008a), a trait common amongst dendrobatids (Pröhl, 2005). Many male behaviors, such as
territory maintenance via calling, also reveal a male’s location to potential predators.
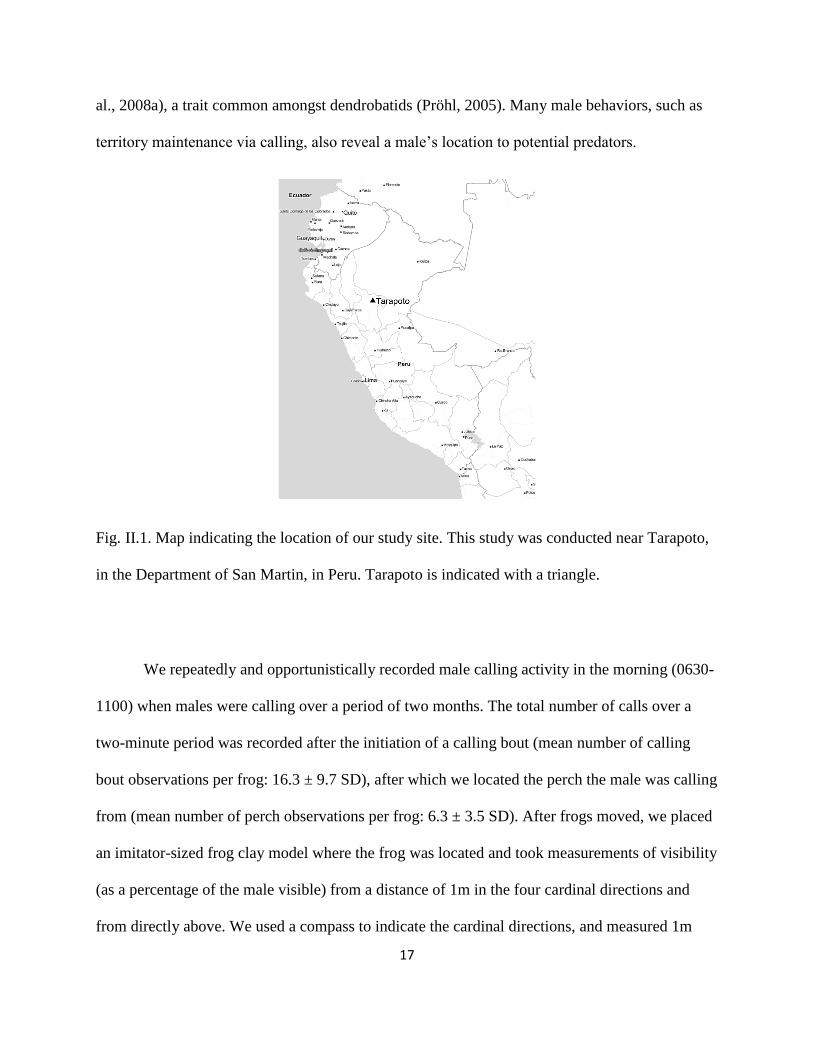
Fig. II.1. Map indicating the location of our study site. This study was conducted near Tarapoto,
in the Department of San Martin, in Peru. Tarapoto is indicated with a triangle.
We repeatedly and opportunistically recorded male calling activity in the morning (0630-
1100) when males were calling over a period of two months. The total number of calls over a
two-minute period was recorded after the initiation of a calling bout (mean number of calling
bout observations per frog: 16.3 ± 9.7 SD), after which we located the perch the male was calling
from (mean number of perch observations per frog: 6.3 ± 3.5 SD). After frogs moved, we placed
an imitator-sized frog clay model where the frog was located and took measurements of visibility
(as a percentage of the male visible) from a distance of 1m in the four cardinal directions and
from directly above. We used a compass to indicate the cardinal directions, and measured 1m
18
distances using a tape measure. Visibility of the clay model was determined from the height of
the frog’s perch. These were then averaged to give us a measurement of perch visibility, which
we used as a proxy for visibility to predators. This is similar to work done by Willink et al.
(2013), and functionally tests the hypothesis that better defended males use more open territories
and sites to advertise. An early pilot study indicated that observing male activity directly was not
feasible. Due to the structure of the forest, observing males from >5m is impossible due to
physical barriers blocking views of the male. Further, observations from distances <5m yielded
noticeable behavioral differences (such as a hunkering down), presumably caused by the
proximity of the observer.
Spectral measurements:
Spectral reflectance was measured using an Ocean Optics (Largo, Florida, United States
of America) USB4000 spectrometer with an LS-1 tungsten–halogen light source and Ocean
Optics SpectraSuite software. A 45° angled tip was used on the probe, standardizing distance and
angle to frog skin. Ocean Optics WS-1-SL white standards were used between every frog
measured to account for lamp drift. Spectral data were recorded from each frog on a total of 8
spots on the dorsum and were processed from 450-700nm in R version 3.2 (R Core Team, 2015)
in the package “pavo” (Maia et al., 2013). Data were initially imported from 400-700nm, but
data below 450nm proved to be too noisy for use. A subsample of the individual spectra were
smoothed using a loess smoothing function at various levels and visualized; we then used the
lowest smoothing span that produced a smooth curve (span = 0.2) for all spectra. Spectra were
then aggregated into a single mean spectrum for each frog, after which we recorded mean
brightness of each individual’s spectrum. We chose a priori to use mean brightness (receiver-

19
independent) as opposed to intensity (maximum reflectance value) because both are sensitive to
noise and slight changes in lamp alignment (Montgomerie, 2006; Maia et al., 2013); however,
we subsequently compared median brightness, which did not produce qualitatively different
results. Additionally, results using total brightness and intensity yielded qualitatively similar
results during visual data exploration. We ignored measures of coloration for this particular
receiver-independent analysis, as interpretation of color largely depends on psychophysical
parameters, and we therefore consider coloration per se only in the context of predator vision.
The primary predators of poison frogs remain unclear. Although there is growing
evidence of predation by many taxa (see Discussion), evidence from anecdotal studies (Master,
1999; Alvarado et al., 2013) and clay model studies (e.g., Noonan and Comeault, 2009;
Chouteau and Angers, 2011; Hegna et al.. 2011; Paluh et al., 2014) indicate that birds are a
primary selective force, and often a source of purifying selection towards a single local
aposematic phenotype. As a result, we analyzed receiver-dependent measures of brightness from
the average violet-sensitive avian visual perception from multiple species of birds with known
visual acuities (Hart, 2001) and using the visual model function provided in the pavo package
(Vorobyev et al., 1998) against the average reflectance of three Dieffenbachia leaves taken in the
field. We chose to use Dieffenbachia reflectance because R. imitator frequently breeds in
Dieffenbachia (Brown et al., 2008b) and all males were seen on these plants during this study.
The visual model function is based on stimulation of different cone types, and assumes that color
discrimination is in large part limited by receptor noise (Vorobyev et al., 1998). This calculation
allows us to examine both chromatic (dS, color-based) and achromatic (dL, luminance or
brightness) contrast to the background in units of just noticeable differences (JNDs), a unit of
differentiation in which JND = 1 indicates a difference that is at the threshold of discrimination
20
for a viewer (derived from Vorobyev et al., 1998). We used the average avian visual system and
ideal, white illumination in our visual model (data provided within pavo).
Alkaloid identification:
Alkaloids from individual frogs were extracted using the methodology presented in
Stuckert et al. (2014b). Frogs were euthanized and skins were placed into 4 mL, Teflon-lined
glass vials containing 100% methanol to extract alkaloids. An internal 10 µg nicotine standard ((-
)-nicotine ≥99%, Sigma-Aldrich, Milwaukee, Wisconsin) was added to samples, which were
then fractionated to isolate alkaloids. Gas chromatography–mass spectrometry (GC-MS) analysis
was performed in electron impact (EI MS) and chemical ionization (CI MS) mode on a Varian
Saturn (Ringoes, New Jersey, United States of America) 2100T ion trap MS instrument coupled
to a Varian 3900 GC with a 30 m x 0.25 mm i.d. Varian Factor Four VF-5ms fused silica
column. Alkaloids were identified using MS peaks and GC retention times in combination with
previously published anuran alkaloids (Daly et al., 2005). Quantities of alkaloids were
determined by comparing individual alkaloid peaks to that of the internal nicotine standard;
alkaloids under 0.5 μg were not included due to the unreliability of identification and
quantification of these trace alkaloids.
Statistical analyses:
Following alkaloid identification and quantification, data were visually inspected for
deviations from normality. As there were none, we ran linear regressions comparing the receiver-
independent brightness of each individual to the total quantity of alkaloids each frog possessed
(adjusted for frog mass). Similarly, we ran a linear regression with the results from the average
21
avian visual system and alkaloid content. We ran linear mixed effects models using the package
“lmer4” to compare calling behavior to brightness and alkaloid content with individual frogs as a
random effect because we repeatedly recorded calling behavior from males (Bates et al., 2014).
Degrees of freedom for this test were calculated based on Satterthwaite approximation for
denominator degrees of freedom in the R package “lmerTest” (Kuznetsova et al. 2017). We ran
two, independent models fitted with restricted maximum likelihood, one with number of calls
over a two-minute period and another using perch visibility. The linear mixed effects model for
receiver-independent brightness had a singularity in the estimate of the random effect, so we
collapsed the model to a single measure of mean perch visibility and ran a simple linear model.
We also ran both of these models with receiver dependent measures of chromatic and achromatic
contrast relative to a Dieffenbachia leaf background.
Results
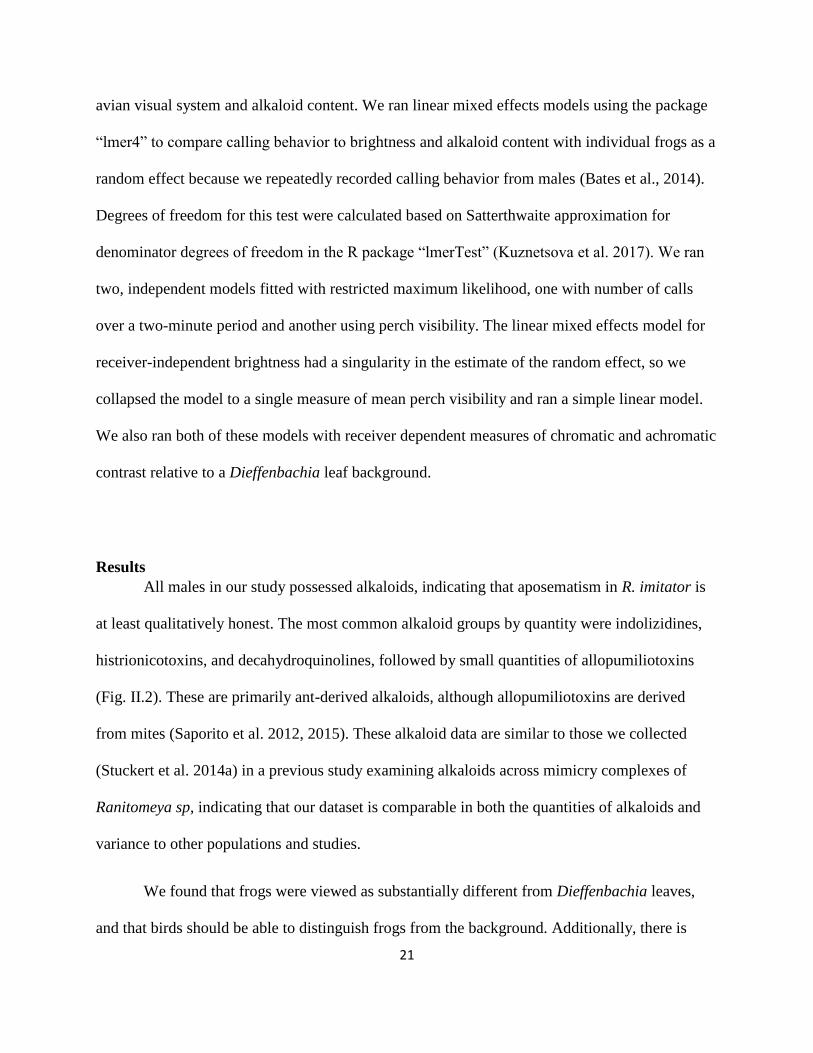
All males in our study possessed alkaloids, indicating that aposematism in R. imitator is
at least qualitatively honest. The most common alkaloid groups by quantity were indolizidines,
histrionicotoxins, and decahydroquinolines, followed by small quantities of allopumiliotoxins
(Fig. II.2). These are primarily ant-derived alkaloids, although allopumiliotoxins are derived
from mites (Saporito et al. 2012, 2015). These alkaloid data are similar to those we collected
(Stuckert et al. 2014a) in a previous study examining alkaloids across mimicry complexes of
Ranitomeya sp, indicating that our dataset is comparable in both the quantities of alkaloids and
variance to other populations and studies.
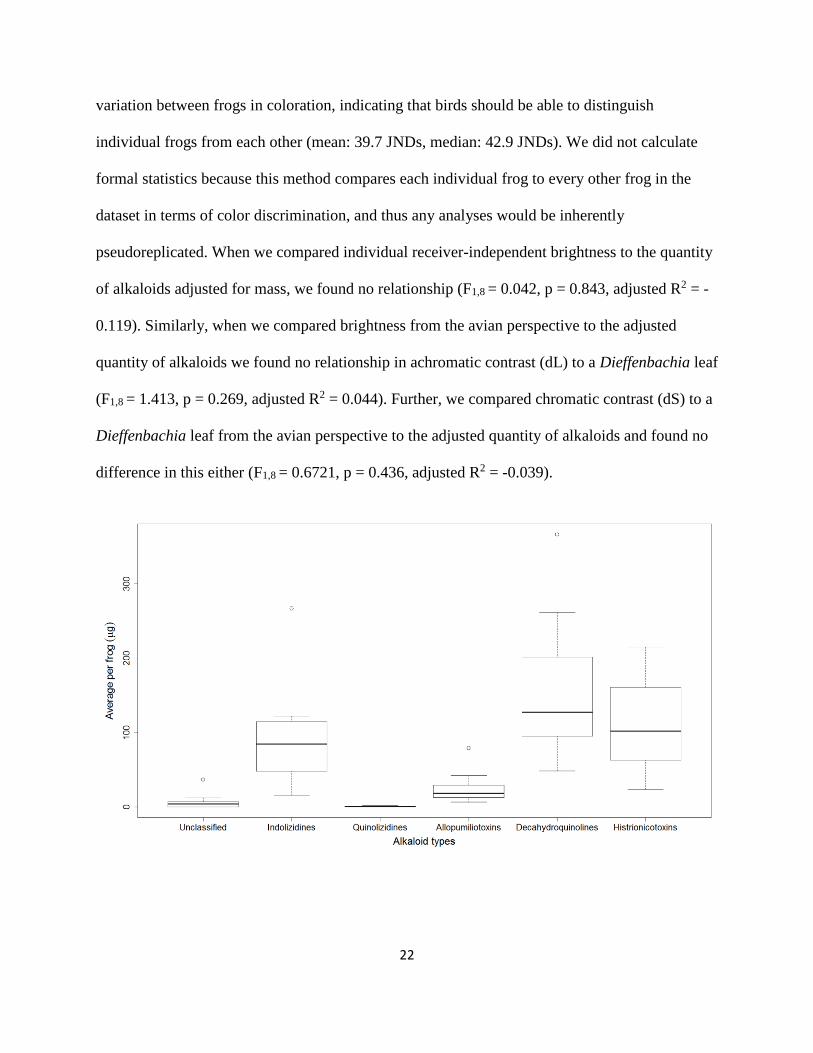
We found that frogs were viewed as substantially different from Dieffenbachia leaves,
and that birds should be able to distinguish frogs from the background. Additionally, there is
22
variation between frogs in coloration, indicating that birds should be able to distinguish
individual frogs from each other (mean: 39.7 JNDs, median: 42.9 JNDs). We did not calculate
formal statistics because this method compares each individual frog to every other frog in the
dataset in terms of color discrimination, and thus any analyses would be inherently
pseudoreplicated. When we compared individual receiver-independent brightness to the quantity
of alkaloids adjusted for mass, we found no relationship (F1,8 = 0.042, p = 0.843, adjusted R2 = -
0.119). Similarly, when we compared brightness from the avian perspective to the adjusted
quantity of alkaloids we found no relationship in achromatic contrast (dL) to a Dieffenbachia leaf
(F1,8 = 1.413, p = 0.269, adjusted R2 = 0.044). Further, we compared chromatic contrast (dS) to a
Dieffenbachia leaf from the avian perspective to the adjusted quantity of alkaloids and found no
difference in this either (F1,8 = 0.6721, p = 0.436, adjusted R2 = -0.039).
23
Fig. II.2. Box and whisker plot of quantities of alkaloids based on group classification. The box
represents the first and third quartile, the horizontal line is the median, and open circles represent
outliers.
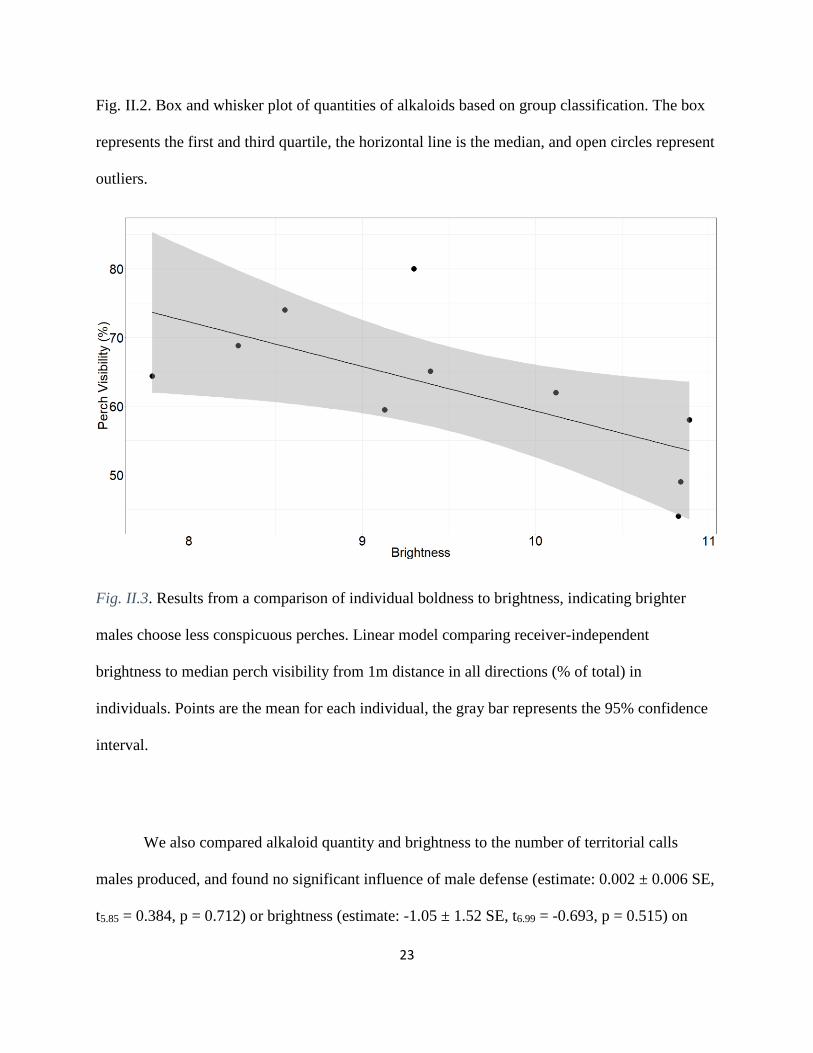
Fig. II.3. Results from a comparison of individual boldness to brightness, indicating brighter
males choose less conspicuous perches. Linear model comparing receiver-independent
brightness to median perch visibility from 1m distance in all directions (% of total) in
individuals. Points are the mean for each individual, the gray bar represents the 95% confidence
interval.
We also compared alkaloid quantity and brightness to the number of territorial calls
males produced, and found no significant influence of male defense (estimate: 0.002 ± 0.006 SE,
t5.85 = 0.384, p = 0.712) or brightness (estimate: -1.05 ± 1.52 SE, t6.99 = -0.693, p = 0.515) on
24
boldness via calls. Running the same comparison using chromatic and achromatic contrast from
the avian visual perspective produced similar results. We found that brighter males called from
perches that are less visible from 1m away (Fig. II.3; estimate: -6.25 ± 2.39 SE, t7 = -2.626, p =
0.034), but there was no effect of alkaloid quantity (estimate: -0.012 ± 0.0.0092 SE, t7 = -1.354,
p = 0.218). However, when we analyzed this data from the perspective of avian viewers, we
found no effect of alkaloid quantity (estimate: -0.015 ± 0.015 SE, t6 = -1.03, p = 0.343),
chromatic contrast (dS, estimate: 0.043 ± 0.18 SE, t6 = 0.234, p = 0.823), or achromatic contrast
(dL, estimate: 0.208± 0.65 SE, t6 = 0.32, p = 0.758).
Discussion
In this study, we investigated whether the aposematic signal is quantitatively honest
within a population of the poison frog Ranitomeya imitator, a key prediction of aposematic
theory. Furthermore, a key benefit posited for aposematism is ecological release from predation
pressure; more toxic or brighter individuals should have more freedom to conduct daily activities
due to a decreased likelihood of predation. Hence, we tested for increased behavioral boldness in
more toxic or brighter individuals by examining territorial calling activity. All individuals
sampled in this study possessed defensive alkaloids, but we found no relationship between the
level of the defense and the level of the aposematic signal. Further, we did not find any evidence
that individuals with higher levels of chemical defense behaved more boldly, as more toxic
males did not call more or from more obvious perches. We did, however, find that that brighter
males called from perches that were less open than more dull males. The findings of our study
indicate that males in this population of R. imitator have a qualitatively honest aposematic signal,
but do not signal in a quantitatively honest manner. Although our sample size is small, we view
25
this is an ecologically relevant sample size, as it is unlikely that predators sample many poison
frogs before they have learned avoidance (e.g., in lab experiments model predators learn to avoid
poison frogs rapidly, Darst and Cummings, 2006; Stuckert et al., 2014a). Thus, it is apparent that
predators are not using frog brightness as an indication of toxicity in order to adjust their attack
probability. This is similar to newts (Cynops pyrrhogaster), which do not signal honestly within
populations (Mochida et al., 2013). Thus, while evidence suggests that there is generally
quantitative honesty across vertebrate species (e.g., Summers and Clough 2001), quantitative
honesty likely does not occur within populations, and likely varies extensively across
populations (Daly and Myers. 1967; Wang 2011; Maan and Cummings, 2012).
This seems to be a departure from similar invertebrate systems, which generally indicate
quantitative honesty across and within populations (Bezzerides et al., 2007; Blount et al., 2012;
Vidal-Cordero et al., 2012; Arenas et al., 2015). Therefore, insect systems appear to have
proximate mechanisms that maintain quantitative honesty, whereas our data indicate that in this
population of poison frogs we find no evidence for quantitative honesty. However, whether this
is generally true in vertebrates is unclear, and should be viewed with some skepticism in light of
our small sample size. In insects, some evidence indicates that there is a tradeoff between
production of the aposematic signal and toxins (the resource allocation framework, Blount et al.,
2009, 2012). Additionally, predators are not only able to discern differences in the aposematic
signal, but they pay attention to the level of the signal produced by insects and use that
information to determine whether to attack (Arenas et al., 2015). This unifying selective force is
surprising because evidence indicates that a predator’s decision on whether or not to attack is
highly nuanced and that predators continually reassess based on their own toxin loads, hunger,
availability of other prey, etc. (Skelhorn et al., 2016). In fact, Flores et al. (2015), found that the
26
attack rate on clay models that resemble the aposematic poison frog Dendrobates auratus are not
dependent on model brightness (note, however, that this study used clay models of juvenile size).
There are several alternative explanations that may potentially explain why we see
qualitative, but not quantitative, honesty in Ranitomeya imitator. First, unlike in invertebrates,
which generally sequester all their toxins at the larval stage, there is likely an ontogenetic
disconnect between color production and toxicity in many vertebrate species (dendrobatids: Daly
et al., 1994, other poison frogs: Jeckel et al., 2015, newts: Hanifin et al., 2002, aposematic
snakes: McCue, 2006). Together, these examples likely indicate a substantial difference from
examined insect cases in which the resource allocation framework is more plausible. Thus,
although the resource allocation hypothesis has some support in invertebrate systems, this
proximate mechanism does not appear to be ecologically relevant in many vertebrate systems.
Second, predator avoidance may be independent of the quantity of alkaloids as long as they are
present in amounts sufficient to make them unpalatable and thus typically avoided by potential
predators (e.g., Speed et al., 2012). Therefore, a threshold level of defense may very well be
predator dependent (e.g., birds, arthropods, snakes), above which quantitative honesty is
uninformative and therefore not selected by predators. Further, we might predict different
selective pressures from non-avian predators. Anecdotal evidence of predation on dendrobatids
corroborates this, as only one bird species has been observed preying on poison frogs (Master,
1999; Alvarado et al., 2013) while multiple other predator guilds have been observed preying on
dendrobatids (e.g., Myers et al., 1978; Summers 1999; Lenger et al., 2014). In fact, there is
evidence that certain arthropod predators (bullet ants and banana spiders) impose different
selective pressures on the dendrobatid frog O. pumilio in Costa Rica based on different
thresholds of defense (Murray et al., 2016).

27
Predation release:
In addition to testing quantitative honesty within a population, we also tested the
prediction that increased toxicity and brightness is correlated with an increase in behavioral
boldness, using the number of calls males gave in a two-minute period as well as the visibility of
the perch that males called from as a proxy for boldness. We found no evidence that there was an
increase in boldness with increasing chemical defense. We did find evidence that brighter males
are more likely to call from less visible perches. However, and importantly, we did not see the
same relationship when examining chromatic and achromatic contrast from the avian visual
perspective against a host plant leaf, and thus the ecological significance is unclear. This may be
an example of bet-hedging (Slatkin, 1974), in which duller males of potentially lower quality
attempt to stand out by using conspicuous perches, simultaneously entailing an increased risk of
predation. Brighter males on the other hand may be of higher quality, and thus gain little by
choosing a more conspicuous perch relative to the increased risk of predation. This is largely
speculative, however, and some work in a related species O. pumilio has shown either the
opposite relationship, that more conspicuous morphs are bolder (O. pumilio: Pröhl and
Ostrowski, 2011; O. granulifera: Willink et al., 2013), or no relationship at all (Dugas et al.,
2015).
Concluding remarks:
In this study, we tested the hypothesis that quantitative honest signaling exists within a
population of Ranitomeya imitator, a key prediction of a substantial body of theoretical work on
signaling. We found that adult males within a population of R. imitator all possess alkaloids and
28
thus their aposematic signal is qualitatively honest. However, we found no evidence for
quantitative honesty, a corresponding increase in the level of the signal with the level of the
defense. Additionally, we tested the hypothesis that an increase in toxicity yields an increase in
boldness due to ecological niche release. We found no evidence that more toxic males behaved
more boldly using our metrics. We did however find that brighter males call from less visible
perches, suggesting that males may be pursuing a bet-hedging strategy with respect to calling
behavior. We suggest that alternative mechanisms are acting on the variation in the intensity of
the aposematic signal. We view the ontogenetic disconnect between toxin sequestration and the
setting of coloration to be a plausible hypothesis in many vertebrate taxa, and a crucial difference
with respect to invertebrate systems (and with respect to the assumptions of many theoretical
models).
Acknowledgements
We would like to thank M Albecker, K McCoy, M McCoy, and S McRae for helpful
comments during the development of this project, C Meeks for help conducting fieldwork, and N
Spies for assistance with labwork. We would also like to thank anonymous reviewers that helped
to greatly improve this manuscript. Experimental design was approved by East Carolina
University’s IACUC (AUP #D303) and the Peruvian ministry (Resolución Directoral 0331-
2011-AG-DGFFS-DGEFFS). Research was funded by a National Geographic grant (8571-10) to
KS and a Thomas Harriot College of Arts and Sciences Advancement Council Distinguished
Professorship to KS. We declare no conflict of interest.
29
Literature Cited
Alvarado, J. B., A. Alvarez, and R. A. Saporito. 2013. Oophaga pumilio (Strawberry poison
frog). Predation. Herpetological Review 44:298.
Arenas, L. M., D. Walter, and M. Stevens. 2015. Signal honesty and predation risk among a
closely related group of aposematic species. Scientific Reports 5:11021.
Bates, D., M. Mächler, B. Bolker, and S. Walker. 2014. Fitting Linear Mixed-Effects Models
using lme4. Journal of Statistical Software 67:1-48.
Bezzerides, A. L., K. J. McGraw, R. S. Parker, and J. Husseini. 2007. Elytra color as a signal of
chemical defense in the Asian ladybird beetle Harmonia axyridis. Behavioral Ecology
and Sociobiology 61:1401–1408.
Blount, J. D., H. M. Rowland, F. P. Drijfhout, J. A. Endler, R. Inger, J. J. Sloggett, G. D. D.
Hurst, et al. 2012. How the ladybird got its spots: effects of resource limitation on the
honesty of aposematic signals. Functional Ecology 26:334–342.
Blount, J. D., M. P. Speed, G. D. Ruxton, and P. A. Stephens. 2009. Warning displays may
function as honest signals of toxicity. Proceedings of the Royal Society of Biological
Sciences 276:871–877.
Brown, J. L., V. Morales, and K. Summers. 2008a. Divergence in parental care, habitat
selection and larval life history between two species of Peruvian poison frogs: an
experimental analysis. Journal of evolutionary biology 21:1534–43.
Brown, J. L., E. Twomey, V. Morales, and K. Summers. 2008b. Phytotelm size in relation to
parental care and mating strategies in two species of Peruvian poison frogs. Behaviour
145:1139–1165.
30
Chouteau, M., and B. Angers. 2011. The role of predators in maintaining the geographic
organization of aposematic signals. The American naturalist 178:810–7.
Cortesi, F. and K. L. Cheney. 2010. Conspicuousness is correlated with toxicity in marine
opisthobranchs. Journal of Evolutionary Biology 23:1509–1518.
Cummings, M. E., and L. R. Crothers. 2013. Interacting selection diversifies warning signals in
a polytypic frog: An examination with the strawberry poison frog. Evolutionary
Ecology 27:693–710.
Daly, J. W., and C. W. Myers. 1967. Toxicity of Panamanian poison frogs (Dendrobates):
some biological and chemical aspects. Science, 156:970–973.
Daly, J. W., S. I. Secunda, H. M. Garraffo, T. F. Spande, A. Wisnieski, and J. F. Cover Jr.
1994. An uptake system for dietary alkaloids in poison frogs (Dendrobatidae). Toxicon
32:657–663.
Daly, J. W., T. F. Spande, and H. M. Garraffo. 2005. Alkaloids from amphibian skin: a
tabulation of over eight-hundred compounds. Journal of Natural Products 68:1556–75.
Darst, C.R. and Cummings, M.E., 2006. Predator learning favours mimicry of a less-toxic
model in poison frogs. Nature 440:208–211.
Dawkins, M. S., and T. I. M. Guilford. 1991. The corruption of honest signalling 865–873.
Duffey, S. S. 1980. Sequestration of plant natural products by insects. Annual Review of
Entomology 25:447–477.
Dugas, M. B., S. R. Halbrook, A. M. Killius, J. F. Sol, and C. L. Richards‐Zawacki. 2015.
Colour and escape behaviour in polymorphic populations of an aposematic poison frog.
31
Ethology 121:813–822.
Emlen, D. J., I. A. Warren, A. Johns, I. Dworkin, and L. C. Lavine. 2012. A mechanism of
Extreme Growth and reliable signaling in sexually selected ornaments and weapons.
Science. 337:860-864.
Flores, E. E., M. Stevens, A. J. Moore, H. M. Rowland, and J. D. Blount. 2015. Body size but
not warning signal luminance influences predation risk in recently metamorphosed
poison frogs. Ecology and Evolution 5:4603-4616.
Giery, S. T., and C. A. Layman. 2015. Interpopulation Variation in a Condition-Dependent
Signal: Predation Regime Affects Signal Intensity and Reliability. The American
Naturalist 186:187–195.
Hanifin, C. T., and E. D. Brodie. 2002. Tetrodotoxin levels of the rough-skin newt, Taricha
granulosa, increase in long-term captivity. Toxicon : official journal of the International
Society on Toxinology 40:1149–153.
Hart N. S. 2001. The visual ecology of avian photoreceptors. Progress in Retinal and Eye
Research 20: 675–703.
Hegna, R. H., R. a. Saporito, K. G. Gerow, and M. a. Donnelly. 2011. Contrasting colors of an
aposematic poison frog do not affect predation. Annales Zoologici Fennici 48:29–38.
Holen, Ø. H., and T. O. Svennungsen. 2012. Aposematism and the handicap principle. The
American Naturalist 180:629–641.
Hunter, J. 2009. Familiarity breeds contempt: Effects of striped skunk color, shape, and
abundance on wild carnivore behavior. Behavioral Ecology 20:1315–1322.
32
Jeckel, A. M., T. Grant, and R. A. Saporito. 2015. Sequestered and synthesized chemical
defenses in the poison frog Melanophryniscus moreirae. Journal of Chemical Ecology
41:505–512.
Kuznetsova, A., P. B. Brockhoff, and R. H. B. Christensen. 2017. lmerTest Package: Tests in
Linear Mixed Effects Models. Journal of Statistical Software. 82:1–26.
Leimar, O., M. Enquist, and B. Sillen-tullberg. 1986. Evolutionary stability of aposematic
coloration and prey unprofitability: A theoretical analysis. The American naturalist
128:469–490.
Lenger, D. R., J. K. Berkey, and M. B. Dugas. 2014. Predation on the toxic Oophaga pumilio
(Anura:Dendrobatidae) by Rhadinaea decorata (Squamata:Collubridae) 7:83–84.
Maia, R., C. M. Eliason, P. P. Bitton, S. M. Doucet, and M. D. Shawkey. 2013. pavo: An R
package for the analysis, visualization and organization of spectral data. Methods in
Ecology and Evolution 4:906–913.
Maan, M. E., and M. E. Cummings. 2012. Poison frog colors are honest signals of toxicity,
particularly for bird predators. The American Naturalist 179:E1–E14.
Master, T. L. 1999. Predation by rufous motmot on black-and-green poison dart frog. Wilson
Bulletin 111:439–440.
McCue, M. D. 2006. Cost of producing venom in three North American pitviper species.
Copeia 2006:818–825.
Mochida, K., Kitada, M., Ikeda, K., Toda, M., Takatani, T., and O. Arakawa. 2013. Spatial and
temporal instability of local biotic community mediate a form of aposematic defense in
33
newts, consisting of carotenoid-based coloration and Tetrodotoxin. Journal of Chemical
Ecology 39:1186-1192.
Montgomerie, R. 2006. Analyzing Colors. Pages 90–147 in G. E. Hill and K. J. McGraw (eds)
Bird Coloration. Harvard University Press, USA.
Murray, E. M., S. K. Bolton, T. Berg, and R. A. Saporito. 2016. Arthropod predation in a
dendrobatid poison frog: Does frog life stage matter? Zoology 119:169–174.
Myers, C. W., J. W. Daly, and B. Malkin. 1978. A dangerously toxic new frog (Phyllobates)
used by Emberá indians of Western Colombia, with discussion of blowgun fabrication
and dart poisoning. Bulletin of the American Museum of Natural History 161:307–366.
Newman, C., C. D. Buesching, and J. O. Wolff. 2005. The function of facial masks in
“midguild” carnivores. Oikos 108:623–633.
Noonan, B. P., and A. a Comeault. 2009. The role of predator selection on polymorphic
aposematic poison frogs. Biology letters 5:51–54.
Paluh, D. J., M. M. Hantak, and R. A. Saporito. 2014. A test of aposematism in the dendrobatid
poison frog Oophaga pumilio: The importance of movement in clay model experiments.
Journal of Herpetology 48:249–254.
Pröhl, H. 2005. Territorial behavior in dendrobatid frogs. Journal of Herpetology 39:354–365.
Pröhl, H., and T. Ostrowski. 2011. Behavioural elements reflect phenotypic colour divergence
in a poison frog. Evolutionary Ecology 25:993–1015.
R Core Team. 2015. R: A language and environment for statistical computing. R Foundation
for Statistical Computing, Vienna, Austria. https://www.R-project.org/.
34
Santos, J. C., and D. C. Cannatella. 2011. Phenotypic integration emerges from aposematism
and scale in poison frogs. Proceedings of the National Academy of Sciences of the
United States of America 108:6175–80.
Saporito, R. A., M. A. Donnelly, T. F. Spande, and H. M. Garraffo. 2012. A review of chemical
ecology in poison frogs. Chemoecology 22:159–168.
Saporito, R. A., R. A. Norton, M. H. Garraffo, and T. F. Spande. 2015. Taxonomic distribution
of defensive alkaloids in Nearctic oribatid mites (Acari, Oribatida). Experimental and
Applied Acarology 67:317–333.
Skelhorn, J., C. G. Halpin, and C. Rowe. 2016. Learning about aposematic prey. Behavioural
Ecology 27:955–964.
Slatkin, M. 1974. Hedging one’s evolutionary bets. Nature 704–705.
Speed, M. P., and G. D. Ruxton. 2005. Warning displays in spiny animals: One (more)
evolutionary route to aposematism. Evolution 59:2499–2508.
Speed, M. P., G. D. Ruxton, J. Mappes, and T. N. Sherratt. 2012. Why are defensive toxins so
variable? An evolutionary perspective. Biological reviews of the Cambridge
Philosophical Society 87:874–84.
Stuckert, A. M. M., P. J. Venegas, and K. Summers. 2014a. Experimental evidence for predator
learning and Mullerian mimicry in Peruvian poison frogs (Ranitomeya, Dendrobatidae).
Evolutionary Ecology 28:413-426.
Stuckert, A. M., R. A. Saporito, P. J. Venegas, and K. Summers. 2014b. Alkaloid defenses of
co-mimics in a putative Müllerian mimetic radiation. BMC Evolutionary Biology 14:1-
35
8.
Summers, K. 1999. Predation on Dendrobates auratus, the green poison frog, by spiders on
Taboga Island, in Panama. Herpetological Review 30:91.
Summers, K. and M. E. Clough. 2001. The evolution of coloration and toxicity in the poison
frog family (Dendrobatidae). Proceedings of the National Academy of Sciences,
98:6227–6232.
Summers, K., M. P. Speed, J. D. Blount, and A. M. M. Stuckert. 2015. Are aposematic signals
honest? A review. Journal of Evolutionary Biology 28:1583–1599.
Vanpé, C., J.-M. Gaillard, P. Kjellander, A. Mysterud, P. Magnien, D. Delorme, G. Van Laere,
et al. 2007. Antler size provides an honest signal of male phenotypic quality in roe deer.
The American naturalist 169:481–493.
Velando, A., R. Beamonte-Barrientos, and R. Torres. 2006. Pigment-based skin colour in the
blue-footed booby: An honest signal of current condition used by females to adjust
reproductive investment. Oecologia 149:535–542.
Vidal-Cordero, J. M., G. Moreno-Rueda, A. López-Orta, C. Marfil-Daza, J. L. Ros-Santaella,
and F. J. Ortiz-Sánchez. 2012. Brighter-colored paper wasps (Polistes dominula) have
larger poison glands. Frontiers in Zoology 9:1-5.
Vorobyev, M., D. Osorio, A. T. D. Bennett, N. J. Marshall, and I. C. Cuthill. 1998.
Tetrachromacy, oil droplets and bird plumage colours. Journal of Comparative
Physiology 183:621–633.
Wang, I. J. 2011. Inversely related aposematic traits: reduced conspicuousness evolves with

36
increased toxicity in a polymorphic poison‐dart frog. Evolution 65:1637–1649.
Weldon, P. J., and G. M. Burghardt. 2015. Evolving detente: The origin of warning signals via
concurrent reciprocal selection. Biological Journal of the Linnean Society 116:239–246.
Willink, B., E. Brenes-Mora, F. Bolaños, and H. Pröhl. 2013. Not everything is black and
white: Color and behavioral variation reveal a continuum between cryptic and
aposematic strategies in a polymorphic poison frog. Evolution 67:2783-2794.
Winters, A. E., Stevens, M., Mitchell, C., Blomberg, S. P., and J. D. Blount. 2014. Maternal
effects and warning signal honesty in eggs and offspring of an aposematic ladybird
beetle. Functional Ecology, 28:1187-1196.
Zahavi, A. 1975. Mate selection-a selection for a handicap. Journal of theoretical biology
53:205–214.
Zahavi, A. 1977. The cost of honesty (further remarks on the handicap principle). Journal of
theoretical biology 67:603–605.
III. IDENTIFYING SIGNAL MODALITIES OF APOSEMATISM IN A POISON FROG
Adam M. M. Stuckert and Kyle Summers
Abstract:
Heterogenous predation regimes can produce varied selective forces on potential prey.
This, in theory, should produce a variety of evolutionary adaptations to predation. Aposematic
species combine a conspicuous signal with a secondary defense, the majority of which are
studied in the context of a visual signal. Even in species with an obvious visual signal this focus
does not tell the whole evolutionary story. Although multimodality appears to be common in
invertebrate species, we know extremely little about the presence or absence of multimodality in
vertebrates. Here we examine the possibility of multimodality of aposematism in the green and
black poison frog, Dendrobates auratus. Using a non-visual predator (the cat-eyed snake,
Leptodeira annulata) we test whether there is sufficient non-visual information for predators to
avoid this aposematic species without using their vision. Further, we test whether this is a
byproduct of the presence of toxins, or a specifically evolved signal. We found that predators are
able to avoid this species by olfactory cues alone, and that this is likely a learned avoidance.
Introduction:
Aposematism is an antipredator strategy that combines conspicuous colors and patterns
with a secondary defense (e.g., venom, toxicity, spines, fighting ability, etc.). In essence, these
species have a phenotype that “shouts” to predators that they are dangerous (Poulton 1890).
Aposematism is widespread, both geographically and taxonomically. Notably, studies have
repeatedly demonstrated the role of natural selection in the evolution of color and patterns in

38
aposematic species (e.g., Smith 1975; Saporito et al. 2007). It is generally hypothesized that this
occurs because visual predators, primarily birds, are able to easily learn to avoid the colors and
patterns presented by aposematic species or avoid them entirely, thus decreasing the likelihood
of attacking these species and their overall survival (Ruxton et al. 2004). Therefore, the field has
focused heavily on the selective force enacted by visual predators and on the visual signal itself.
However, many predators utilize non-visual cues to locate prey, and therefore our
understanding of aposematic signals may be biased and incomplete. Recent evidence indicates
that we need to consider that aposematic signals may be transmitted via multiple modalities. For
example, unpalatable species may use auditory signals (e.g., moths: Hristov and Conner 2005;
Dunning et al. 2016 or odors (e.g., skunks: Cott 1940). In these cases, aposematism is
multimodal because there are evolved signals that warn predators in numerous sensory modes.
Further, it is conceivable that aposematism could occur entirely without a visual signal (e.g.,
auditory and venom in a camouflaged species), or without a visual signal that humans can detect.
Our understanding of non-visual signals in aposematic species is probably the most extensive for
insects, where they appear to be quite common (see a compiled list in Rowe and Halpin 2013).
Importantly, many insects possess an aposematic signal that is not just visual in nature, but is
also multimodal (Rowe and Halpin 2013). For example, the chemical pyrazine has a distinctive
odor which can help in learned predator avoidance but is not a toxin or a deterrent itself
(Rothschild et al. 1984; Lindström et al. 2001). In this example, the signal seems to be an
adaptation to predators. However, in other cases an odor or a sound may merely be the byproduct
of defense (for example if it is the smell of the defense itself), and therefore a ‘cue’ as opposed to
a signal (Rowe and Halpin 2013).
39
It is unclear if aposematic signals are generally multimodal in other taxa. However,
evidence indicates that non-visual predators are likely important predators in many taxa. Poison
frogs (family Dendrobatidae) are defended by toxic alkaloids in the skin which are sequestered
from the diet (Daly et al. 1994). Despite being the best characterized group of non-insect
aposematic species, empirical data on poison frog predators are extremely limited. Clay model
studies indicate that birds are likely an important source of selection, and likely exert purifying
selection (e.g., Noonan and Comeault 2009; Chouteau and Angers 2011; Dreher 2014; Paluh et
al. 2014; Rojas et al. 2015). Note however, that these results may provide a biased perspective,
as many clay model studies are designed specifically for visual predators like birds and largely
ignore non-avian attack marks. Despite a number of studies that examine avian predation
pressure on dendrobatid frogs using clay models, there is only a single bird species actually
known to sample or prey upon poison frogs (Master 1999; Alvarado et al. 2013). Furthermore, an
analysis of avian gut contents from Panama found a wide variety of prey in the diet, but not a
single aposematic dendrobatid (Poulin et al. 2001).
While avian predation on dendrobatids has been seen only rarely, observations of
predation by other species are far more common (e.g., Myers et al. 1978; Summers 1999; Gray
and Christy 2000; Lenger et al. 2014). The empirical data dominated by non-avian predators of
poison frogs indicates that we should be concerned with predation that does not currently fit the
primary understanding of visual predators driving aposematic selection. The research that has
been conducted outside this central, limited paradigm hints that predators in different guilds may
make different choices regarding predation (Willink et al. 2014; Murray et al. 2016).
Additionally, while conspicuousness of the visual signal is correlated with toxicity to certain
potential predators of aposematic species (but not all, see Stuckert et al. 2018), snakes do not

40
possess the necessary visual acuity to pick up the information contained in this visual signal
(Maan and Cummings 2012). Hence, we need to begin considering aposematic prey from
alternative perspectives. To truly understand aposematic signaling we need to examine how
potential predators from multiple guilds actually act when exposed to aposematic species.
Here we test the response of non-visual predators to assess whether predators can detect
and avoid poison frogs via olfaction. We used a snake (Leptodeira annulata) as a predator and a
sympatric species of poison frog (Dendrobates auratus) in our experimental trials. We compared
snake preference for poison frog odors to that of a non-toxic sympatric species the tungara frog
(Engystomops pustulosus). However, with these results alone we would be unable to say whether
this was merely a cue (e.g., fatty acids in the skin or the alkaloids themselves) or a specifically
evolved signal used to deter predators. As a result, we conducted two additional sets of trials.
One compared frog odors extracted with methanol from wild Dendrobates auratus to extracts
from the palatable E. pustulosus. The other compared snake responses to extracts from captive-
bred D. auratus which lack alkaloids to that of the palatable E. pustulosus in order to test
whether the putative odor is a cue, or conversely an evolved signal. Finally, we did a dyadic trial
with live frogs, but using completely naïve juvenile snakes which we knew had never been
exposed to either species of frogs to examine the response of naïve predators to that of
experienced predators.
Methods:
Snakes (Leptodeira annulata) were collected from the forests surrounding Gamboa,
Panama. Each snake was housed individually in a 62.5 L plastic container with a leaf litter
substrate, a branch, and a bromeliad for the duration of the study. Snake habitats were hand
41
misted daily, and snakes had continuous access to a small water dish. After initial capture, snakes
were kept in captivity for a minimum of 2 nights to acclimate them to their tanks. We then
offered snakes a tungara frog (E. pustulosus; collected from outside of Gamboa), a known prey
species, to verify that snakes were sufficiently comfortable and would act as natural predators.
Although these cat-eyed snakes and poison frogs are sympatric, we cannot know their history of
predator-prey interactions and therefore cannot determine whether these individual snakes have
experience with poison frogs. Therefore, the night after introduction of the tungara frog we
introduced the snakes to a poison frog for approximately 90 minutes. All snakes were moving
within their cages (not hiding) when we conducted the initial introduction. As a result, we can
say with certainty that the specific snakes used in our study have experience with both tungara
frogs and the poison frog species used in our study. All snakes used in this study (N = 10)
consumed the tungara frog; no snakes consumed the poison frog although it was evident that
snakes were still foraging during these introductions.
We then dyadic trials involving live D. auratus and P. pustulosus. In these trials, we put
these frogs into small plastic containers (7x7x4.5 cm). Frogs were placed on either side of the
snake cages, and placement was randomly determined. To remove visual cues, we spray painted
the exterior of the containers and replaced the top with fiberglass screening. This setup
eliminated visual cues, but allowed the diffusion of olfactory cues from within the containers.
Trials were conducted at night, and were video recorded from above using Sony Handycams
(DCR-SR 45, DCR-SR85). The night shot plus infared mode was engaged on these camcorders
and the setups were additionally lit with an external infared light source. These experiments were
conducted on three consecutive nights with each individual snake. We subsequently conducted
the extract experiments (described below) three nights each, randomizing the order of
42
presentation of the captive extracts and the wild frog extracts. Additionally, we randomized the
placement of the containers with methanol extracts.
In addition to trials with the live frogs, we conducted two other types of trials to examine
whether or not snakes were using the presence of the alkaloids themselves in order to avoid
poison frogs and this is merely a cue, or whether there is some other component to the smell of
the aposematic frogs that might be an evolved signal. We compared skin extracts from wild-
caught D. auratus to that of wild E. pustulosus, we refer to these as wild extracts. The other trial
compared skin extracts from captive D. auratus to that of wild E. pustulosus, we refer to these as
captive extracts. The animals used to produce captive extracts were sacrificed for a different
experiment (approved under ECU IACUC AUP D288), and GC-MS analyses indicated that they
had no alkaloids. Therefore, the primary difference between the wild and captive extract trials
should be the presence of defensive alkaloid toxins. For these trials, we used 100% methanol to
extract chemicals found on the skin. We pipetted 1/8th of the extract (0.5 mL) into the same type
of container from above, and placed them on opposite sides of snake cages for experiments.
In addition to our experiments using wild snakes found foraging in the forest, we
conducted a similar experiment using two naïve juvenile Leptodeira annulata. These snakes (N =
2) were found as eggs and hatched in captivity. As a result, we know that they have never
experienced either tungara frogs or poison frogs. We exposed these young snakes to only the live
frog experiment, but in a much smaller container because of their size. We did not pre-expose
them to either the tungara frogs or the poison frogs; we therefore view their responses as those of
an unexperienced potential predator. This comparison will allow us to examine the importance of
learned avoidance in this system, albeit with a small inference due to our small sample size.
43
We collected two measures that we identified prior to conducting statistical analyses.
These were: 1) the first container the snake investigated and 2) the proportion of time the snake
spent with each member of the dyad relative to total interaction time in our ~50 min video trials.
In all cases we counted it as an interaction when the snake was within 8 cm of the container and
directed towards it.
Statistical analyses:
We analyzed the first container that snakes investigated, as well as the proportion of
interaction time per trial that was directed towards the poison frog or poison frog extract relative
to the total interaction time (for both the first 50 minutes and the first 2.5 hours). Initial analyses
indicated that they met the assumptions of a binomial distribution. Therefore, all analyses were
done in a mixed effects model using the package “lme4” (Bates et al. 2014) in R v 3.2 (R Core
Team 2017) with a binomial error distribution. Trial type (with live frogs, comparing extract
from wild frogs, comparing extract from captive frogs, or juvenile snakes with live frogs) was
included as a fixed effect, and snake identity was a random effect. Since “lme4” does not
produce p values, we estimated p values using the R package “lmerTest” which uses a
Satterthwaite approximation of degrees of freedom to produce p values. Estimates and
confidence intervals were extracted from the results of the linear models and visualized.
Results:
When we analyzed the first frog that the snakes investigated, we found that adult snakes
generally investigated the tungara frog first (z = -1.790, p = 0. 0735, Fig. III.1). There was no
clear trend in which extract the adult frogs first investigated in either the wild extract comparison
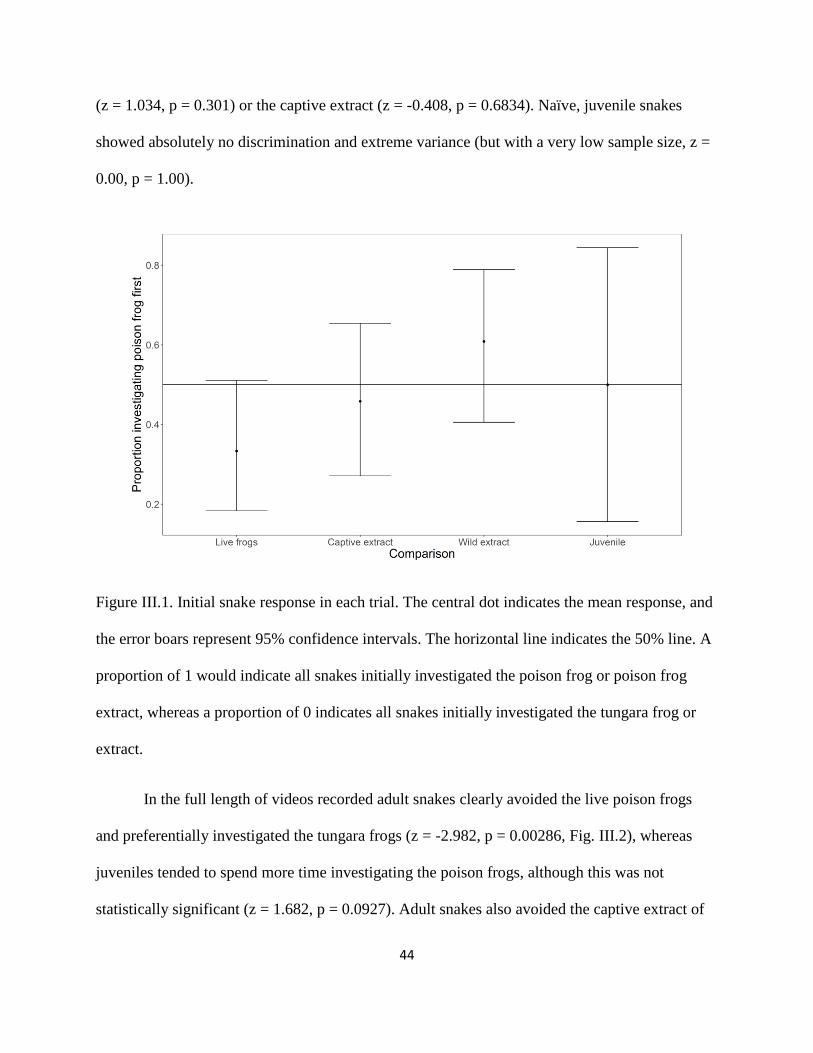
44
(z = 1.034, p = 0.301) or the captive extract (z = -0.408, p = 0.6834). Naïve, juvenile snakes
showed absolutely no discrimination and extreme variance (but with a very low sample size, z =
0.00, p = 1.00).
Figure III.1. Initial snake response in each trial. The central dot indicates the mean response, and
the error boars represent 95% confidence intervals. The horizontal line indicates the 50% line. A
proportion of 1 would indicate all snakes initially investigated the poison frog or poison frog
extract, whereas a proportion of 0 indicates all snakes initially investigated the tungara frog or
extract.
In the full length of videos recorded adult snakes clearly avoided the live poison frogs
and preferentially investigated the tungara frogs (z = -2.982, p = 0.00286, Fig. III.2), whereas
juveniles tended to spend more time investigating the poison frogs, although this was not
statistically significant (z = 1.682, p = 0.0927). Adult snakes also avoided the captive extract of
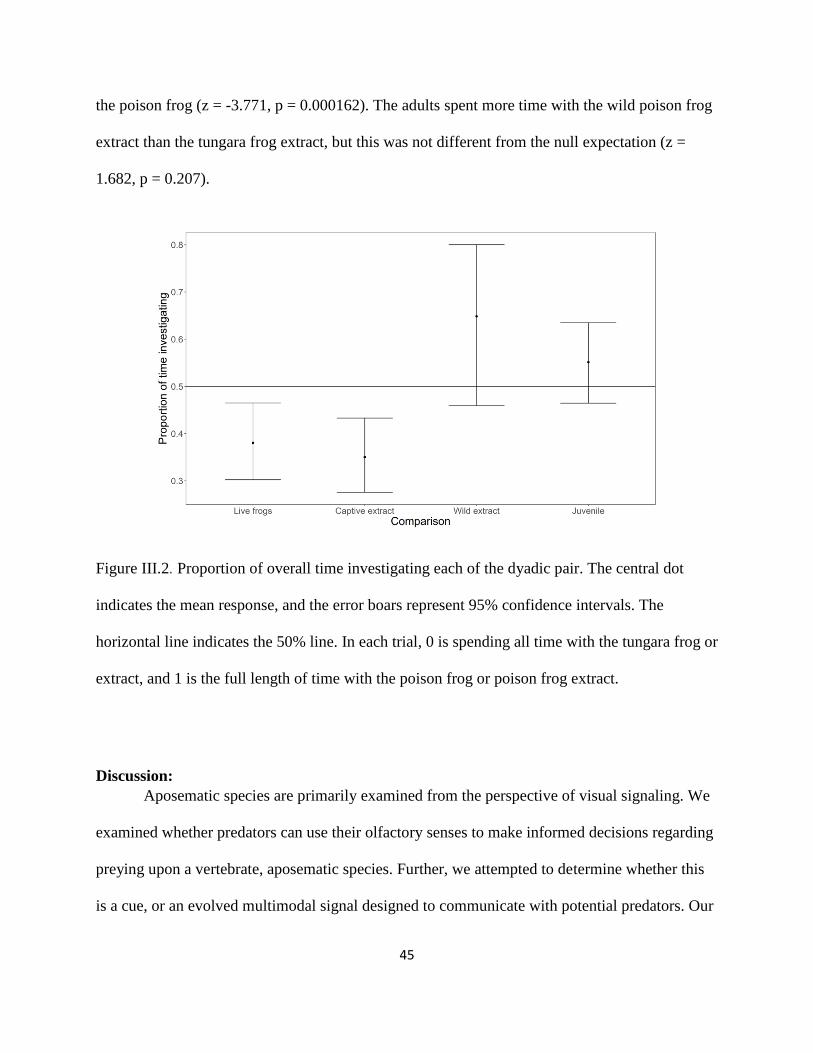
45
the poison frog (z = -3.771, p = 0.000162). The adults spent more time with the wild poison frog
extract than the tungara frog extract, but this was not different from the null expectation (z =
1.682, p = 0.207).
Figure III.2. Proportion of overall time investigating each of the dyadic pair. The central dot
indicates the mean response, and the error boars represent 95% confidence intervals. The
horizontal line indicates the 50% line. In each trial, 0 is spending all time with the tungara frog or
extract, and 1 is the full length of time with the poison frog or poison frog extract.
Discussion:
Aposematic species are primarily examined from the perspective of visual signaling. We
examined whether predators can use their olfactory senses to make informed decisions regarding
preying upon a vertebrate, aposematic species. Further, we attempted to determine whether this
is a cue, or an evolved multimodal signal designed to communicate with potential predators. Our
46
results indicate that experienced snakes avoided the aposematic frog D. auratus and exhibited a
preference for inspecting and interacting with the non-toxic tungara frog in these dyadic trials.
Thus, olfactory cues contain sufficient information to make decisions regarding predation on
aposematic species of poison frogs. However, we found that the juvenile snakes with no prior
exposure to these frogs exhibited no preference for either frog species, and their behaviors had a
high variance. We found that snakes snakes exhibited no preference in the first interaction in
either wild or captive extracts, but that they did avoid the captive extract of the poison frog.
Given that the olfactory component appears to contain enough information for predators
to avoid it, this indicates multimodality of aposematism. The apparent multimodality of
aposematism in this system is important, as it represents an underappreciated possible
mechanism of communication on which predators can exert selective pressures. Predation
regimes are almost certainly heterogenous, a fact which has been known and yet under-
appreciated for a long time (Nokelainen et al. 2014; Murray et al. 2016, Briolat et al. in press).
This study indicates a plausible mechanism by which predators that utilize non-visual senses to
forage can avoid aposematic species. This is important, especially because there is evidence that
certain predators may completely ignore the visual signal of an aposematic species, or even use it
to find prey that most predators avoid (e.g., Alvarado et al. 2013; Willink et al. 2014).
While predators can avoid this aposematic species based on olfaction alone, the specific
cue they are using in this instance is not clear, but the data suggest that is a non-alkaloid
compound as the snakes were attracted to the wild-frog extract. This seems plausible, especially
because captive-reared, alkaloid-free poison frogs have a distinctive, metallic odor similar to
United States pennies as well (Schulte et al. 2017; AMMS pers. obs.). If this is the case, it would
indicate that examinations of the other components of the olfactory component are worthwhile. If
47
this is the case, then it is possible that the actual alkaloids somewhat confound this cue, and thus
the wild extract treatment is being interpreted as a novel, intriguing smell. In this case, snakes
might have spent more time with the wild poison frog extract in order to ascertain what this sent
was. It is plausible, but extremely unlikely, that this is an artifact of our experimental design, as
the methanol used in extracting volatile compounds may have interfered with the snakes’ ability
to properly distinguish between scents. Perhaps the interaction of the solvent and alkaloids
created a scent that snakes were unaccustomed to and therefore increased their interaction time in
the trials with the wild frog extract. However, this is unlikely as 1) such a small quantity of
methanol evaporated very quickly and 2) the two types of extract trials exhibited different
predator responses.
Snakes in our experiment that had a previous experience with the two frog species and
those that were naïve, juvenile predators exhibited a remarkably divergent behavioral response.
Snakes with prior experience generally avoided the live poison frogs, whereas the naïve snakes
had no preference at all. This result suggests that snakes learn to avoid poison frogs and do not
show innate avoidance. While certain species have an innate avoidance of aposematic species
(Smith 1975, 1977), this may be predicated on the presence of a deadly secondary defense. Since
naïve snakes exhibited a different response than experienced predators it is likely that learned
avoidance is critical in this system. Learned avoidance of chemical cues is important in the
evolution and maintenance of aposematic species. This would indicate the possibility of evolved
non-visual signals. Although our sample size with juveniles is very low, our data suggest that
non-visual cues could be important for predator learned avoidance even in visual predators, as
this may increase the speed of learned avoidance or the retention of learned avoidance (Rowe
and Halpin 2013; Tseng et al. 2014).
48
Overall, we found that snakes are able to distinguish live defended aposematic prey from
undefended prey via olfaction indicating aposematism in this species is likely multimodal.
Further, this seems to be a learned response in this species and that these snakes do not have an
innate avoidance of poison frog smells. While the specific cue these predators are using in this
instance is not clear, our data suggest that is a non-alkaloid compound the predators used. Given
the abundance of non-visual predators in the wild, investigating non-visual components of
aposematism in aposematic species is likely to bear fruit.
Acknowledgements:
We are grateful to J. Christy, K. McCoy, M. McCoy, S. McRae, R. Page, and R. Saporito
for their comments on experimental design. We are grateful to R. Page for providing cameras
and IR lights. Work was funded by a Smithsonian Tropical Research Institute Stan Rand Short-
Term Fellowship to AS. This work was approved by the East Carolina University IACUC (AUP
#D303), the STRI IACUC (2015-0920-2018), and the Panamanian government S/C A-33-15.
49
Literature cited:
Alvarado, J. B., A. Alvarez, and R. A. Saporito. 2013. Oophaga pumilio (Strawberry poison
frog). Predation. Herpetol. Rev. 44:298.
Bates, D., M. Mächler, B. Bolker, and S. Walker. 2014. Fitting Linear Mixed-Effects Models
using lme4. J. Stat. Softw. 67:1–48.
Chouteau, M., and B. Angers. 2011. The role of predators in maintaining the geographic
organization of aposematic signals. Am. Nat. 178:810–817.
Cott, H. B. 1940. Adaptive Coloration in Animals. Methuen, London 1–602.
Dreher, C. E. 2014. Multiple sexual signals: calls over colors for mate attraction in an
aposematic, color-diverse poison frog. Front. Ecol. Evol. 2:1–10.
Dunning, D. C., and M. Kruger. 2016. Aposematic sounds in african moths. Biotropica 27:227–
231.
Gray, H., and J. Christy. 2000. Predation y the grapsid crab, Armases angustum (Smith, 1870),
on tadpoles of the green poison frog, Dendrobates auratus Girard, 1855. Crustaceana
73:1023–1025.
Hristov, N. I., and W. E. Conner. 2005. Sound strategy: Acoustic aposematism in the bat-tiger
moth arms race. Naturwissenschaften 92:164–169.
Lenger, D. R., J. K. Berkey, and M. B. Dugas. 2014. Predation on the toxic Oophaga pumilio
(Anura:Dendrobatidae) by Rhadinaea decorata (Squamata:Colubridae). Herpetol. Notes
7:83–84.
Lindström, L., C. Rowe, and T. Guilford. 2001. Pyrazine odour makes visually conspicuous prey
50
aversive. Proc. Biol. Sci. 268:159–162.
Maan, M. E., and M. E. Cummings. 2012. Poison frog colors are honest signals of toxicity,
particularly for bird predators. Am. Nat. 179:E1-14.
Master, T. L. 1999. Predation by rufous motmot on black-and-green poison dart frog. Wilson
Bull. 111:439–440.
Murray, E. M., S. K. Bolton, T. Berg, and R. A. Saporito. 2016. Arthropod predation in a
dendrobatid poison frog: Does frog life stage matter? Zoology 119:169–174.
Myers, C. W., J. W. Daly, and B. Malkin. 1978. A dangerously toxic new frog (Phyllobates)
used by Emberá indians of Western Colombia, with discussion of blowgun fabrication and
dart poisoning. Bull. Am. Museum Nat. Hist. 161:307–366.
Nokelainen, O., J. Valkonen, C. Lindstedt, and J. Mappes. 2014. Changes in predator community
structure shifts the efficacy of two warning signals in Arctiid moths. J. Anim. Ecol. 598–
605.
Noonan, B. P., and A. a Comeault. 2009. The role of predator selection on polymorphic
aposematic poison frogs. Biol. Lett. 5:51–54.
Paluh, D. J., M. M. Hantak, and R. A. Saporito. 2014. A test of aposematism in the dendrobatid
poison frog Oophaga pumilio: The importance of movement in clay model experiments. J.
Herpetol. 48:249–254.
Poulin, B., G. Lefebvre, R. Ibanez, C. Jaramillo, C. Hernandes, and A. S. Rand. 2001. Avian
predation upon lizards and frogs in a neotropical forest understorey. J. Trop. Ecol. 17:21–
40.
51
Poulton, E. 1890. The colours of animals: Their meaning and use especially considered in the
case of insects. P. in K. Paul, ed. The International Scientific Series. Trench Trubner & Co
Ltd, London.
Rojas, D. P., A. Stow, A. Amézquita, P. I. Simoes, and A. P. Lima. 2015. No predatory bias with
respect to colour familiarity for the aposematic Adelphobates galactonotus
(Anura:Dendrobatidae). Behaviour 152:1637–1657.
Rothschild, M., B. P. Moore, and W. V. Brown. 1984. Pyrazines as warning odour components
in the Monarch butterfly, Danaus plexippus, and in moths of the genera Zygaena and Amata
(Lepidoptera). Biol. J. Linn. Soc. 23:375–380.
Rowe, C., and C. Halpin. 2013. Why are warning displays multimodal? Behav. Ecol. Sociobiol.
67:1425–1439.
Ruxton, G. D., T. N. Sherratt, and M. P. Speed. 2004. Avoiding attack: The evolutionary ecology
of crypsis, warning signals and mimicry.
Saporito, R. A., R. Zuercher, M. Roberts, K. G. Gerow, and M. A. Donnelly. 2007. Experimental
evidence for aposematism in the dendrobatid poison frog Oophaga pumilio. Copeia 4:1006–
1011.
Schulte, L. M., R. A. Saporito, I. Davison, and K. Summers. 2017. The palatability of
Neotropical poison frogs in predator-prey systems : do alkaloids make the difference ?
49:23–26.
Smith, S. M. 1977. Coral-snake pattern recognition and stimulus generalisation by naive great
kiskadees (Aves: Tyrannidae). Nature 265:535–536.

52
Smith, S. M. 1975. Innate recognition of coral snake pattern by a possible avian predator.
Science (80-. ). 187:759–760.
Stuckert, A. M. M., R. A. Saporito, and K. Summers. 2018. An empirical test indicates only
qualitatively honest aposematic signaling within a population of vertebrates. J. h 52:201–
208.
Summers, K. 1999. Predation on Dendrobates auratus, the green poison frog, by spiders on
Taboga Island, in Panama. Herpetol. Rev. 30:91.
Team, R. C. 2017. R Development Core Team.
Tseng, H. Y., C. P. Lin, J. Y. Hsu, D. A. Pike, and W. S. Huang. 2014. The functional
significance of aposematic signals: Geographic variation in the responses of widespread
lizard predators to colourful invertebrate prey. PLoS One 9.
Willink, B., A. García-rodríguez, F. Bolaños, and H. Pröhl. 2014. The interplay between multiple
predators and prey colour divergence. Biol. J. Linn. Soc. 113:580–589.
IV. SKIN TRANSCRIPTOMICE ASSEMBLY AND DIFFERENTIAL GENE EXPRESSION
ACROSS DISTINCT COLOR PATTERN MORPHS OF A POISON FROG
Adam M M Stuckert*1, Emily Moore2, Kaitlin P. Coyle2, Ian Davison1, Matthew D. MacManes3,
Reade Roberts2, Kyle Summers1
1Department of Biology, East Carolina University
2Department of Biological Sciences, North Carolina State University
3Department of Molecular, Cellular & Biomedical Sciences, University of New Hampshire
Abstract:
Color and pattern phenotypes have clear implications to survival and reproduction in
many species. However, the mechanisms that produce this coloration are still poorly
characterized, especially at the genomic level. Here we have taken a transcriptomics-based
approach to elucidating the underlying genetic mechanisms affecting color and pattern in a
highly polytypic poison frog. We produced a transcriptome from four different color morphs
during the final stage of metamorphosis when coloration is still being developed. We then
investigated differential gene expression of candidate color genes from studies in other taxa.
Overall, we found differential expression of a suite of genes that control melanogenesis,
melanocyte differentiation, and melanocyte proliferation as well as a series of differentially
expressed genes involved in purine synthesis and iridophore development. Our results provide
clear evidence that a variety of melanophore and iridophore genes play a role in color and pattern
variation in this species of poison frog. This should provide the basis for further investigations
into the underlying molecular, cellular and physiological mechanisms determining color pattern
in these brightly colored amphibians.
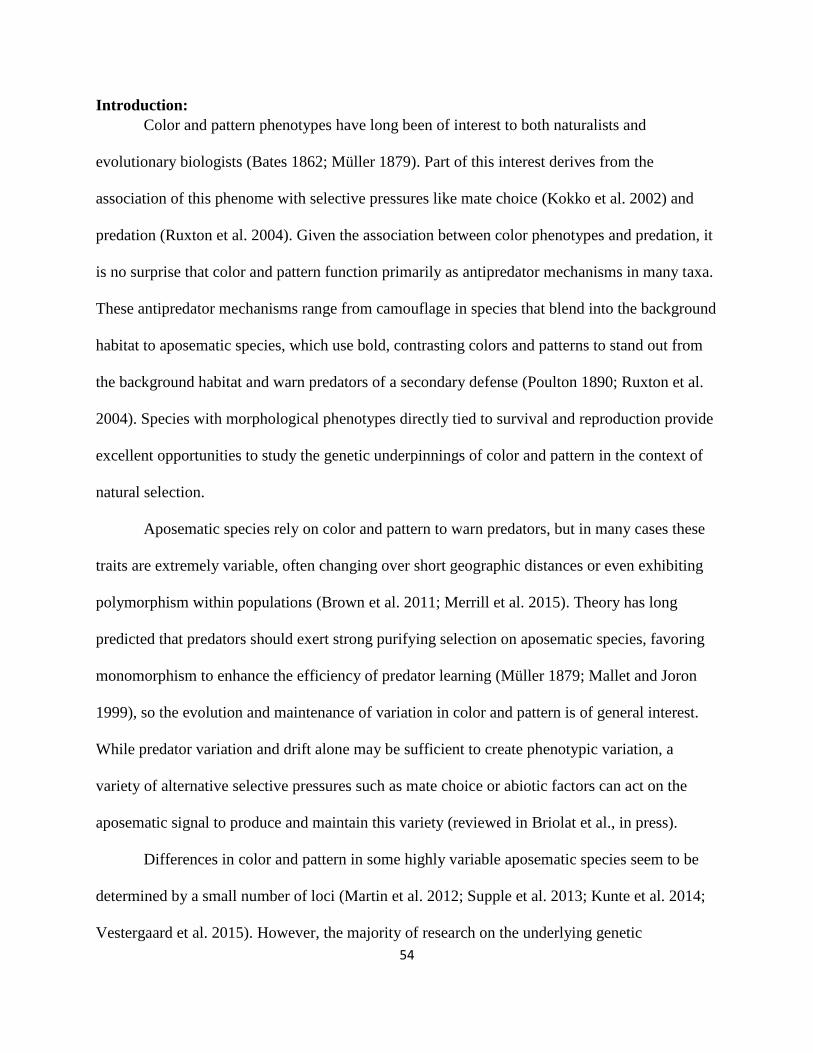
54
Introduction:
Color and pattern phenotypes have long been of interest to both naturalists and
evolutionary biologists (Bates 1862; Müller 1879). Part of this interest derives from the
association of this phenome with selective pressures like mate choice (Kokko et al. 2002) and
predation (Ruxton et al. 2004). Given the association between color phenotypes and predation, it
is no surprise that color and pattern function primarily as antipredator mechanisms in many taxa.
These antipredator mechanisms range from camouflage in species that blend into the background
habitat to aposematic species, which use bold, contrasting colors and patterns to stand out from
the background habitat and warn predators of a secondary defense (Poulton 1890; Ruxton et al.
2004). Species with morphological phenotypes directly tied to survival and reproduction provide
excellent opportunities to study the genetic underpinnings of color and pattern in the context of
natural selection.
Aposematic species rely on color and pattern to warn predators, but in many cases these
traits are extremely variable, often changing over short geographic distances or even exhibiting
polymorphism within populations (Brown et al. 2011; Merrill et al. 2015). Theory has long
predicted that predators should exert strong purifying selection on aposematic species, favoring
monomorphism to enhance the efficiency of predator learning (Müller 1879; Mallet and Joron
1999), so the evolution and maintenance of variation in color and pattern is of general interest.
While predator variation and drift alone may be sufficient to create phenotypic variation, a
variety of alternative selective pressures such as mate choice or abiotic factors can act on the
aposematic signal to produce and maintain this variety (reviewed in Briolat et al., in press).
Differences in color and pattern in some highly variable aposematic species seem to be
determined by a small number of loci (Martin et al. 2012; Supple et al. 2013; Kunte et al. 2014;
Vestergaard et al. 2015). However, the majority of research on the underlying genetic
55
architecture associated with varied color and patterns has been done in the Neotropical butterflies
of the genus Heliconius. This work has been highly informative in that variability in aposematic
species seems to be dependent on few loci, but it remains unclear whether these trends largely
from Heliconius butterflies are generally applicable to other systems. Furthermore, research on
the production of color and pattern early in life in polytypic species (those that vary in discrete
phenotypes over geographical space) has been extremely limited.
Many of the Neotropical poison frogs (family Dendrobatidae) exhibit substantial
polytypism throughout their range (Summers et al. 2003; Brown et al. 2011). Despite being one
of the better characterized groups of aposematic species, our knowledge of the mechanisms of
color production in this family is quite limited. In addition, there is limited information on the
genetics of color pattern in amphibians generally. Modern genomic approaches (especially high-
throughput sequencing) have recently provided extensive insights into the genes underlying color
pattern variation in fish (Diepeveen and Salzburger 2011; Ahi and Sefc 2017), reptiles (Saenko
et al. 2013), birds (Ekblom et al. 2012) and mammals (Gene et al. 2001; Bennett and Lamoreux
2003; Bauer et al. 2009). However, there have been few genomic studies of the genetic basis of
color patterns in amphibians, a group for which we have few genetic tools. Therefore,
amphibians are an important gap in our knowledge of the genomics of color and pattern
evolution.
Ectothermic vertebrates (fish, reptiles and amphibians) generate a diversity of different
colors in their skin through several different mechanisms, involving interactions between
pigment-containing chromatophores (xanthophores and melanophores) and the arrangement of
structural elements such as guanine crystals in iridophores (Mills & Patterson 2009). Black and
brown coloration is produced primarily via the melanophores and is dependent on the melanin
56
pigments eumelanin and pheomelanin (Videira et al. 2013). Blue and green coloration in
amphibians is generally produced by reflectance from structural elements in iridophores, which
are a form of chromatophore (Bagnara et al. 2007). Iridophores contain guanine crystals arranged
into platelets that reflect particular wavelengths of light, depending on platelet size, shape,
orientation and distribution (Ziegler 2003; Bagnara et al. 2007; Saenko et al. 2013). Generally
speaking, thicker and more dispersed platelets reflect longer wavelengths of light (Saenko et al.
2013). Combinations of iridophores and xanthophores or erythropores containing carotenoids or
pteridines (respectively) can produce a wide diversity of colors (Saenko et al. 2013). In
Phelsuma geckos, the platelets reflecting blue or green wavelengths are arranged in parallel to
the skin but are arranged at random in skin displaying red or white coloration. Hence, the random
arrangement of iridophores reflects all wavelengths (white). Red coloration is produced by the
addition of red pigment containing erythropores in the dermal layer. The actual color of the skin
in Phelsuma geckos depends on the precise co-localization of the iridophores (and their guanine
platelets) with chromatophores containing red and yellow pigments (Saenko et al. 2013). The
bright coloration of D. auratus is usually confined to the green-blue part of the visual spectrum
(with the exception of some brownish-white varieties), and iridophores are likely to play a role in
the color variation displayed across different populations of this species.
In order to better understand the genetic mechanisms affecting the development of color
and pattern, we examined four different captive bred color morphs of the green-and-black poison
frog (Dendrobates auratus). We used an RNA sequencing (RNA seq) approach to examine gene
expression and characterize the skin transcriptome of this species. In addition to assembling a
skin transcriptome of a species from a group with few genomic resources, we compared
differential gene expression between color morphs. We focused in particular on differential gene

57
expression in a set of a priori candidate genes that are known to affect color and pattern in a
variety of different taxa. Finally, we examined gene ontology and gene enrichment of our
dataset. These analyses will provide useful genomic and candidate gene resources to the
community, as well as a starting point for other genomic studies in both amphibians and other
aposematic species.
Methods:
Color morphs:
Captive bred Dendrobates auratus were obtained from Understory Enterprises, LLC. The San
Felix morph has a brown dorsum, with green spotting. The super blue morph also has a brown
dorsum with light blue markings (often circular in shape), sporadically distributed across the
dorsum. The microspot morph has a greenish-blue dorsum with small brownish-black splotches
across the dorsum. Finally, the blue-black morph has a dark black dorsum with blue markings
scattered across the dorsum that are typically long and almost linear (Figure IV.1). We note that
the breeding stock of these different morphs, while originally derived from different populations,
generally of unknown origin in Central America, have been bred in captivity for many
generations. As a result, it is possible that color pattern differences between these morphs in
captivity are even more pronounced than those generally found in the original populations where
these animals were collected from due to isolation and inbreeding. Nevertheless, the differences
between these morphs are well within the range of variation in this highly variable, polytypic
species which ranges from Eastern Panama to Nicaragua.
58
Figure IV.1. Normative morphological phenotypes of the four captive morphs used in this study.
Color morphs clockwise from top left: microspot, super blue, blue and black, San Felix.
Microspot and super blue photographs courtesy of ID, blue-black and San Felix photos were
graciously provided by Mark Pepper at Understory Enterprises, LLC.
Sample collection:
Frogs were maintained in pairs in 10 gallon tanks with coconut shell hides. Petri dishes
were placed under the coconut hides to provide a location for females to oviposit. Eggs were
pulled just prior to hatching and tadpoles were individually raised in ~100 mL of water. Tadpoles
were fed fish flakes three times a week, and their water was changed twice a week. Froglets were
sacrificed during the final stages of aquatic life (Gosner stages 41-43; Gosner 1960)). At this
point, froglets had both hind limbs and at least one forelimb exposed. These froglets had color
and pattern elements at this time, but pattern differentiation and color production is still actively
occurring during metamorphosis and afterwards. Whole specimens were placed in RNAlater
(Qiagen) for 24 hours, prior to storage in liquid nitrogen. We then did a dorsal bisection of each
59
frog’s skin, both halves contained all elements of skin patterning. We then prepared one half of
the skin from each of the four morphs of captive-bred D. auratus (N = 3 per morph).
RNA was extracted from each bisected dorsal skin sample using a hybrid Trizol
(Ambion) and RNeasy spin column (Qiagen) method. Before preparing the sequencing libraries,
we used a Bioanalyzer (Agilent) to assess RNA quality. We used the lack of a smearing pattern
(typical of degraded samples) to confirm quality instead of the RNA integrity number (RIN), as
we suspect that natural variation in the pattern of ribosomal RNA prevented the RIN from being
informative. Messenger RNA (mRNA) was isolated from total RNA with Dynabeads
Oligo(dT)25 (Ambion) for use in the preparation of barcoded, strand-specific directional
sequencing libraries with a 500bp insert size (NEBNext Ultra Directional RNA Library Prep Kit
for Illumina, New England Biosystems). These libraries were placed into a single pool for 300
bp, paired end sequencing on the Illumina MiSeq.
Transcriptome assembly:
Given the low sequence coverage for each technical replicate, and further that the
preliminary transcriptome assemblies were of poor quality, we concatenated both technical
replicates per sample into a single replicate. These merged replicates yielded larger, but still
relatively small, samples (forward and reverse reads ranged from 2-5.8 million reads per sample
in the samples used to build transcriptomes). We randomly chose one sample per morph type and
assembled the transcriptome from this combined dataset using the Oyster River Protocol version
1.1.1 (MacManes 2017). We aggressively removed adaptors and did a gentle quality trimming
using trimmomatic version 0.36 (Bolger et al. 2014), then implemented error correction using
RCorrector version 1.01 (Song and Florea 2015), as aggressive quality trimming decreases
60
assembly completeness (MacManes 2014). The Oyster River Protocol (MacManes 2017)
assembles a transcriptome with a series of different transcriptome assemblers and also multiple
kmer lengths, ultimately merging them into a single transcriptome. Transcriptomes were
assembled using Trinity version 2.4.0 (Haas et al. 2014), two independent runs of SPAdes
assembler version 3.11 with kmer lengths of 55 and 75 (Bankevich et al. 2012), and lastly
Shannon version 0.0.2 (Kannan et al. 2016). The four transcriptomes were then merged together
using OrthoFuser (MacManes 2017). Transcriptome quality was assessed using BUSCO version
3.0.1 against the eukaryote database (Simão et al. 2015) and TransRate 1.0.3 (Smith-Unna et al.
2016). We then compared the assembled, merged transcriptome to the full dataset by using
BUSCO and TransRate. BUSCO evaluates the genic content of the assembly by comparing the
transcriptome to a database of highly conserved genes. Transrate contig scores evaluate the
structural integrity of the assembly, and provide a metric of how accurate, complete, and non-
redundant the transcriptome is. TransRate scores were improved by using the TransRate
optimized assembly which includes only transcripts that are highly supported, which had little
influence on the BUSCO score. Therefore, we used this optimized transcriptome for downstream
analyses.
Downstream analyses:
We annotated our transcriptome using the peptide databases corresponding to frog
genomes for Xenopus tropicalis (NCBI Resource Coordinators 2016), Nanorana parkeri (Sun et
al. 2015), and Rana catesbeiana (Hammond et al. 2017) as well as the UniRef90 database
(Bateman et al. 2017) using Diamond version 0.9.10 (Buchfink et al. 2015). We then pseudo-
aligned reads from each sample using Kallisto version 0.43.0 (Bray et al. 2016) and examined
61
differential expression of transcripts in R version 3.4.2 (R Core Team 2017) using Sleuth version
0.29.0 (Pimentel et al. 2017). Differential expression was analyzed by performing a likelihood
ratio test comparing a model with color morph as a factor to a simplified, null model of the
overall data. In addition to examining overall differential expression between morphs, we
examined differential expression in an a priori group of candidate color genes. We used
PANTHER (Mi et al. 2017) to quantify the distribution of differentially expressed genes
annotated to Xenopus tropicalis into biological processes, molecular functions, and cellular
components.
Results:
Transcriptome assembly:
After conducting the Oyster River Protocol for one random individual per color morph
and merging them together, we were left with a large transcriptome containing 597,697
transcripts. We examined the BUSCO and transrate scores for each morph’s transcriptome, as
well as for the transcriptome created by orthomerging these four assemblies (Table IV.1).
BUSCO and transrate scores were computed using the full, cleaned dataset from all samples.
Given the poor transrate score of our final, merged assembly we selected and used the good
contigs from transrate (i.e., those that are accurate, complete, and non-redundant), which had a
minimal effect on our overall BUSCO score. In total, our assembly from the good contigs
represents 160,613 individual transcripts (the “full assembly” in Table IV.1). Overall, our
annotation to the combined Xenopus, Nanorana, Rana, and UniRef90 peptide databases yielded
76,432 annotated transcripts (47.5% of our transcriptome).

62
Transrate
score
Transrate optimal
score
BUSCO
score
Blue-black 0.05446 0.40487 96.3%
Microspot 0.04833 0.35907 94.0%
San Felix 0.0556 0.35718 88.1%
Super blue 0.0521 0.38094 96.0%
Full assembly 0.01701 0.13712 95.8%
Table IV.1. Assembly metrics for each of our assembled transcriptomes. Metrics for the full
assembly were calculated using the full, cleaned dataset. BUSCO scores represent the percent
complete (i.e., 100% is an entirely complete transcriptome).
Figure IV.2. Principal component analysis indicating general within-morph similarity in
transcript abundance within our dataset. PCA computation was normalized as transcripts per
63
million. Each dot indicates one individual and the percentage of variation explained by the axes
are presented.
Differential expression and pathways:
Our results indicate that there are likely distinct differences in expression between color
morphs. Principal component 1 (37.3% of variation explained) and principal component 2
(21.0% of variation explained) both seem to be related to color morph (Figure IV.2). When we
tested for differential expression we found a total of 2,845 transcripts (1.77% of our
transcriptome) that were better explained by the inclusion of color morph of D. auratus than just
the null, intercept model. Those transcripts are thus better explained by the inclusion of color
morph as an explanatory variable and as a result should be considered differentially expressed
between color morphs. From our list of candidate color genes, we found 58 transcripts better
explained by our model including color morph (q value < 0.05) associated with 41 candidate
color genes in total (see Table IV.2 and Figures IV.6, IV.7, and IV.8). In our analyses of gene
function using all differentially expressed genes in PANTHER, we found that most of these
genes were associated with either metabolic or cellular processes (Figure IV.3). Similarly, most
of these genes contributed to either cell part or organelle cellular components (Figure IV.4). The
molecular function was heavily skewed towards catalytic activity and binding, both of which are
likely a result of the huge developmental reorganization involved in metamorphosis (Figure
IV.5).
Gene symbol q value Pathway Citation
adam17 (2)
0.0163;
0.0469
Melanocyte development Bennett and Lamoreux 2003
arfgap1 (2)
0.00362;
0.0267
Putative guanine synthesis in
iridophores Higdon et al. 2013
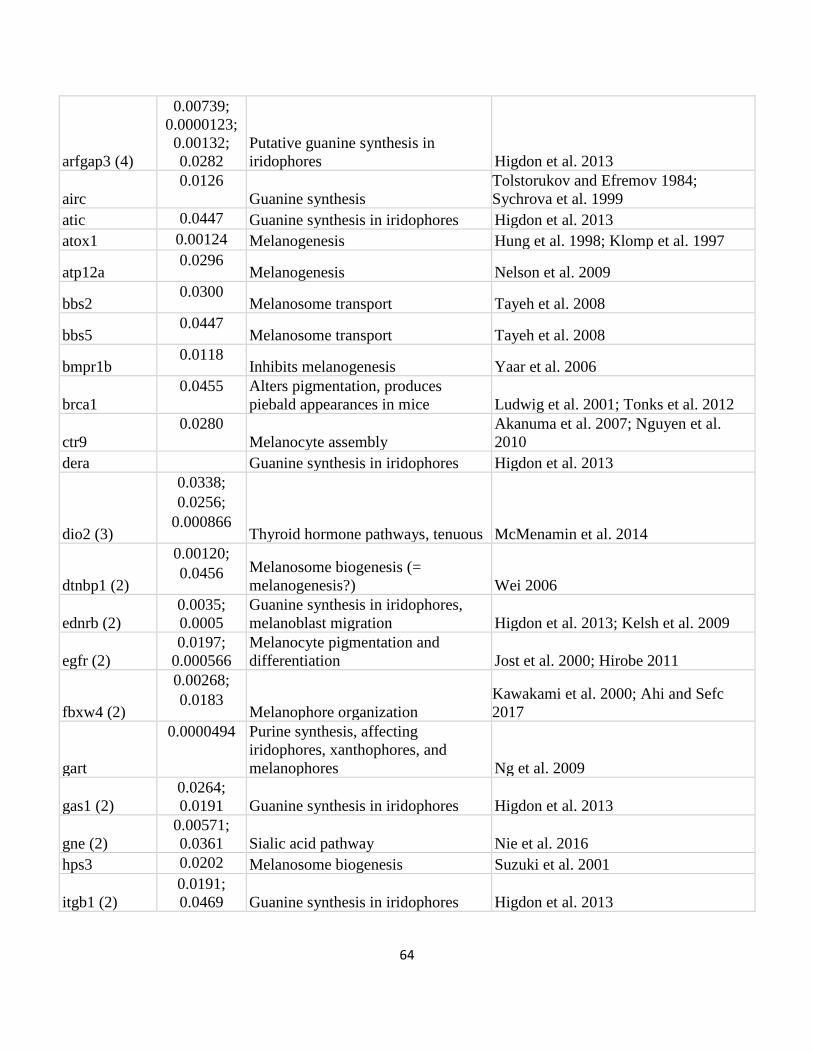
64
arfgap3 (4)
0.00739;
0.0000123;
0.00132;
0.0282
Putative guanine synthesis in
iridophores Higdon et al. 2013
airc
0.0126
Guanine synthesis
Tolstorukov and Efremov 1984;
Sychrova et al. 1999
atic 0.0447 Guanine synthesis in iridophores Higdon et al. 2013
atox1 0.00124 Melanogenesis Hung et al. 1998; Klomp et al. 1997
atp12a 0.0296
Melanogenesis Nelson et al. 2009
bbs2 0.0300
Melanosome transport Tayeh et al. 2008
bbs5 0.0447
Melanosome transport Tayeh et al. 2008
bmpr1b 0.0118
Inhibits melanogenesis Yaar et al. 2006
brca1
0.0455 Alters pigmentation, produces
piebald appearances in mice Ludwig et al. 2001; Tonks et al. 2012
ctr9
0.0280
Melanocyte assembly
Akanuma et al. 2007; Nguyen et al.
2010
dera Guanine synthesis in iridophores Higdon et al. 2013
dio2 (3)
0.0338;
0.0256;
0.000866 Thyroid hormone pathways, tenuous McMenamin et al. 2014
dtnbp1 (2)
0.00120;
0.0456 Melanosome biogenesis (=
melanogenesis?) Wei 2006
ednrb (2)
0.0035;
0.0005
Guanine synthesis in iridophores,
melanoblast migration Higdon et al. 2013; Kelsh et al. 2009
egfr (2)
0.0197;
0.000566
Melanocyte pigmentation and
differentiation Jost et al. 2000; Hirobe 2011
fbxw4 (2)
0.00268;
0.0183 Melanophore organization
Kawakami et al. 2000; Ahi and Sefc
2017
gart
0.0000494 Purine synthesis, affecting
iridophores, xanthophores, and
melanophores Ng et al. 2009
gas1 (2)
0.0264;
0.0191 Guanine synthesis in iridophores Higdon et al. 2013
gne (2)
0.00571;
0.0361 Sialic acid pathway Nie et al. 2016
hps3 0.0202 Melanosome biogenesis Suzuki et al. 2001
itgb1 (2)
0.0191;
0.0469 Guanine synthesis in iridophores Higdon et al. 2013
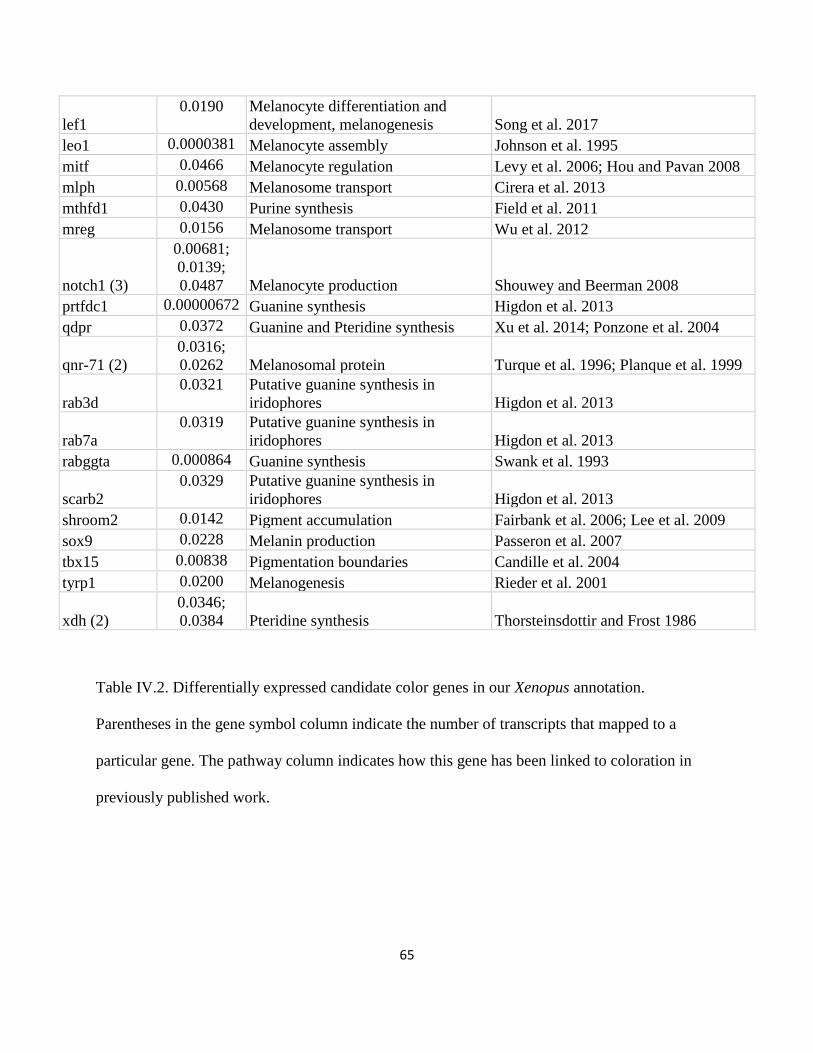
65
lef1
0.0190 Melanocyte differentiation and
development, melanogenesis Song et al. 2017
leo1 0.0000381 Melanocyte assembly Johnson et al. 1995
mitf 0.0466 Melanocyte regulation Levy et al. 2006; Hou and Pavan 2008
mlph 0.00568 Melanosome transport Cirera et al. 2013
mthfd1 0.0430 Purine synthesis Field et al. 2011
mreg 0.0156 Melanosome transport Wu et al. 2012
notch1 (3)
0.00681;
0.0139;
0.0487 Melanocyte production Shouwey and Beerman 2008
prtfdc1 0.00000672 Guanine synthesis Higdon et al. 2013
qdpr 0.0372 Guanine and Pteridine synthesis Xu et al. 2014; Ponzone et al. 2004
qnr-71 (2)
0.0316;
0.0262 Melanosomal protein Turque et al. 1996; Planque et al. 1999
rab3d
0.0321 Putative guanine synthesis in
iridophores Higdon et al. 2013
rab7a
0.0319 Putative guanine synthesis in
iridophores Higdon et al. 2013
rabggta 0.000864 Guanine synthesis Swank et al. 1993
scarb2
0.0329 Putative guanine synthesis in
iridophores Higdon et al. 2013
shroom2 0.0142 Pigment accumulation Fairbank et al. 2006; Lee et al. 2009
sox9 0.0228 Melanin production Passeron et al. 2007
tbx15 0.00838 Pigmentation boundaries Candille et al. 2004
tyrp1 0.0200 Melanogenesis Rieder et al. 2001
xdh (2)
0.0346;
0.0384 Pteridine synthesis Thorsteinsdottir and Frost 1986
Table IV.2. Differentially expressed candidate color genes in our Xenopus annotation.
Parentheses in the gene symbol column indicate the number of transcripts that mapped to a
particular gene. The pathway column indicates how this gene has been linked to coloration in
previously published work.
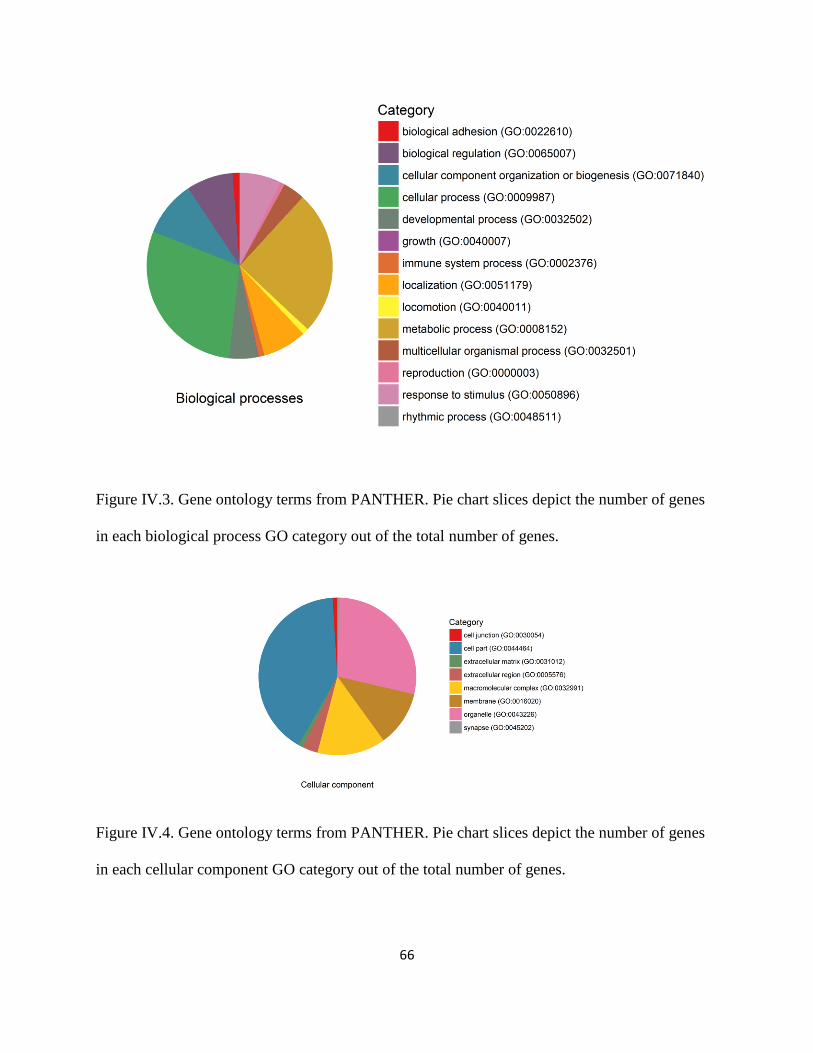
66
Figure IV.3. Gene ontology terms from PANTHER. Pie chart slices depict the number of genes
in each biological process GO category out of the total number of genes.
Figure IV.4. Gene ontology terms from PANTHER. Pie chart slices depict the number of genes
in each cellular component GO category out of the total number of genes.
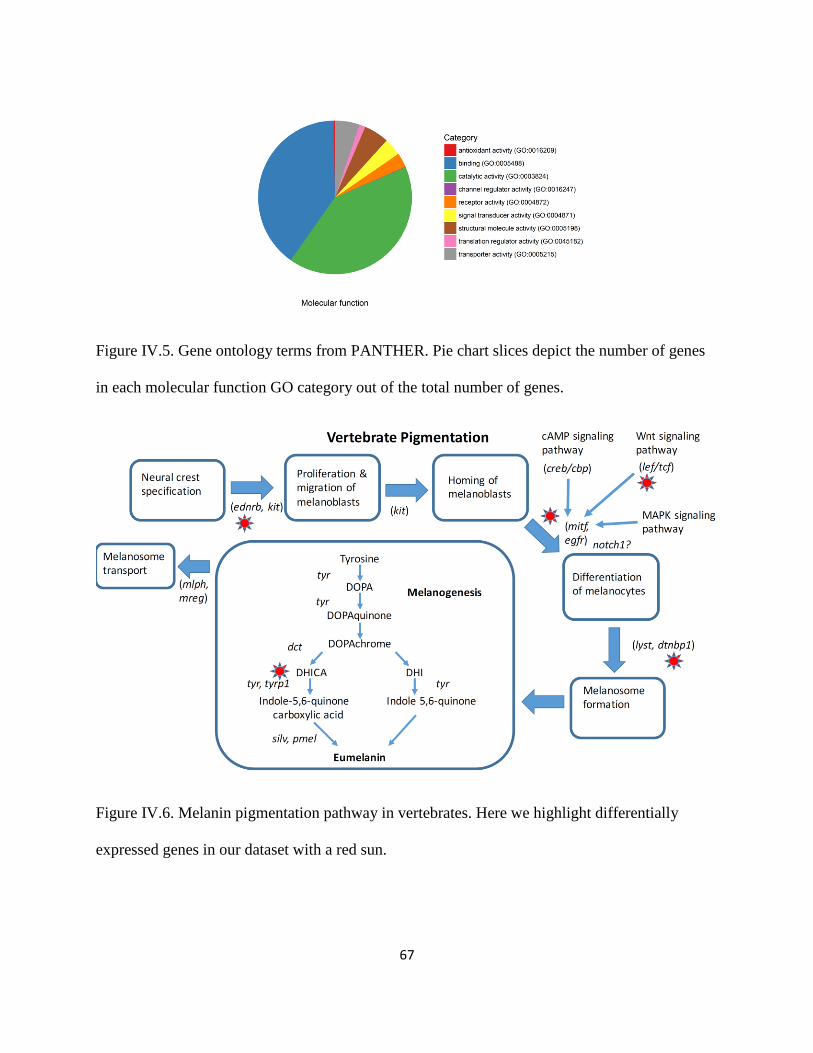
67
Figure IV.5. Gene ontology terms from PANTHER. Pie chart slices depict the number of genes
in each molecular function GO category out of the total number of genes.
Figure IV.6. Melanin pigmentation pathway in vertebrates. Here we highlight differentially
expressed genes in our dataset with a red sun.
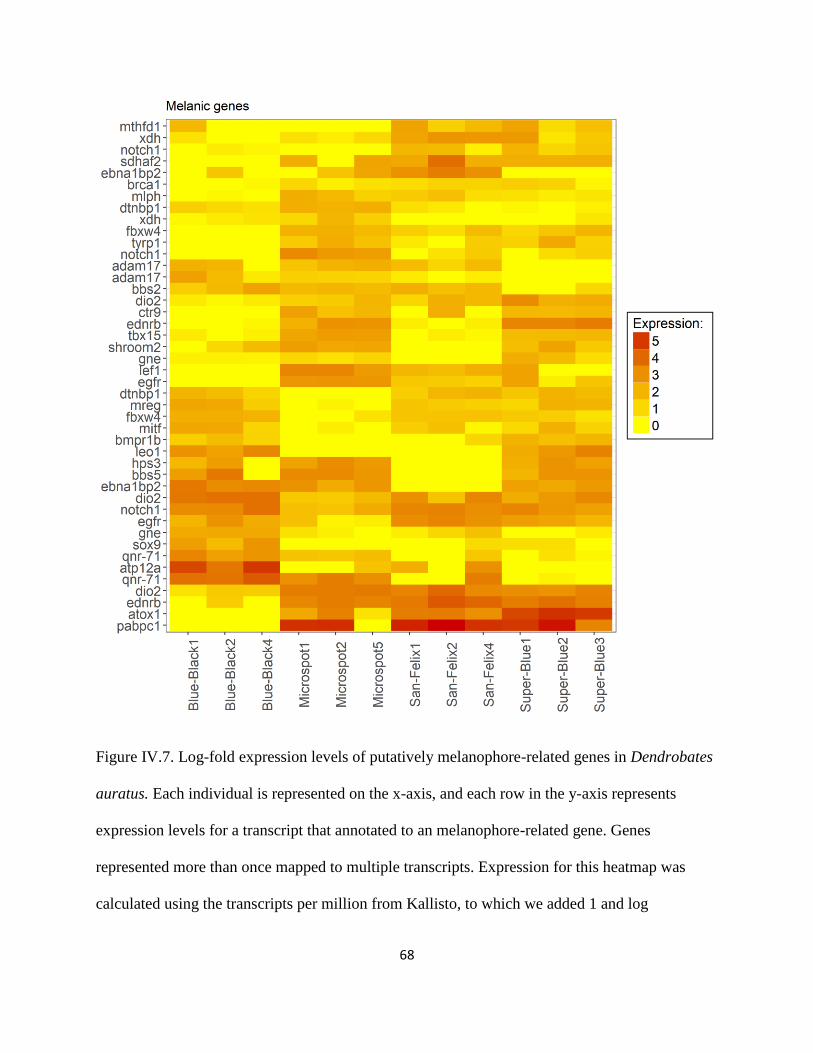
68
Figure IV.7. Log-fold expression levels of putatively melanophore-related genes in Dendrobates
auratus. Each individual is represented on the x-axis, and each row in the y-axis represents
expression levels for a transcript that annotated to an melanophore-related gene. Genes
represented more than once mapped to multiple transcripts. Expression for this heatmap was
calculated using the transcripts per million from Kallisto, to which we added 1 and log
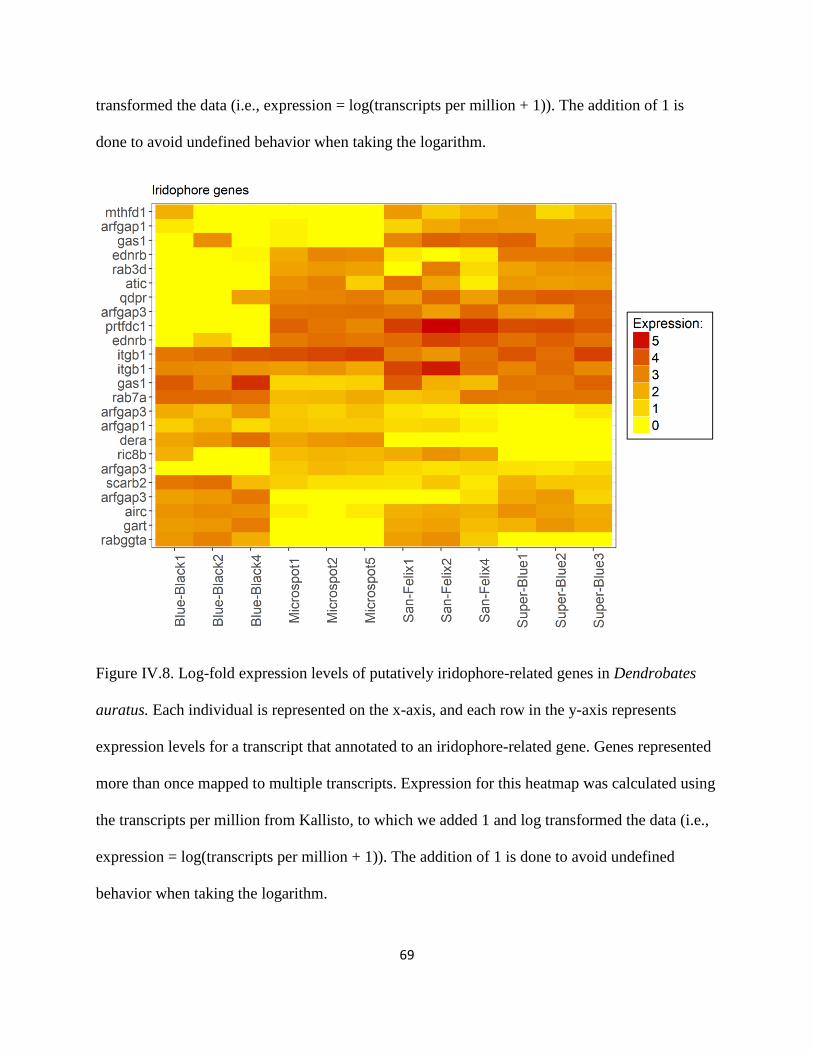
69
transformed the data (i.e., expression = log(transcripts per million + 1)). The addition of 1 is
done to avoid undefined behavior when taking the logarithm.
Figure IV.8. Log-fold expression levels of putatively iridophore-related genes in Dendrobates
auratus. Each individual is represented on the x-axis, and each row in the y-axis represents
expression levels for a transcript that annotated to an iridophore-related gene. Genes represented
more than once mapped to multiple transcripts. Expression for this heatmap was calculated using
the transcripts per million from Kallisto, to which we added 1 and log transformed the data (i.e.,
expression = log(transcripts per million + 1)). The addition of 1 is done to avoid undefined
behavior when taking the logarithm.
70
Discussion:
The genetic mechanisms of color production are poorly known, particularly in
amphibians. Here, we address this deficiency by providing some of the first genomic data
relevant to color-production in amphibians, with a focus on gene expression in the skin during
development. This allows us to pick out important genes likely to regulate color and pattern
elements across different morphs of a highly variable species. By combining analyses of
differential expression with a targeted search based on an extensive list of candidate genes for
developmental control of coloration (approximately 500 genes), we identified multiple genes that
have been demonstrated to play important roles in the production of color and color variation in
vertebrate systems. These genes were differentially expressed between morphs in our dataset.
The results of our genomic analyses provide further information that will contribute to our
general understanding of the biochemical, physiological and morphological bases of coloration
in amphibians generally, and poison frogs in particular.
We found differential expression of multiple genes in two major suites of color genes,
those that influence melanic coloration (black, brown, and grey) and iridophore genes (blue and
green coloration). . Additionally, we found a few key pteridine pigment genes that are known to
influence primarily yellow amphibian coloration that were differentially expressed between
morphs. Given that our color morphs had a black versus brown color coupled with either blue or
green pattern elements on top of the background, these results seem biologically relevant and
indicative of genes that actually control color and pattern in Dendrobates auratus. As a result,
we divide our discussion into three main parts, first we discuss the genes that influence dark
background coloration before moving on to those that influence purine synthesis and iridophores.
71
We then discuss a few genes that are part of other pathways (e.g. pteridine synthesis), before
proposing genes that have yet to be implicated in the production of color but are plausible
candidate genes.
Melanin-related gene expression:
Our study frogs have skin with either a black or brown background, both of which are
forms of melanic coloration, which provides the basis for contrasting patterns in many
vertebrates as well as non-vertebrate taxa (Sköld et al. 2016). Melanin is synthesized from
tyrosine in vertebrates, via the action of a set of key enzymes (e.g., tyrosinase, tyrosinase-like
protein 1 and 2). This takes place in melanosomes, which are a type of organelle found in a form
of chromatophore called a melanophore (or a melanocyte). Melanophores are derived from the
neural crest, as are other types of chromatophores (Park et al. 2009). We identified a suite of
differentially expressed genes that are involved in the production of melanophores and melanin
in this study (Figure IV.6 and IV.7), many of which have been tied to the production of relatively
lighter phenotypes in previous studies.
For example, many of the differentially expressed color genes in our dataset are active
contributors to the tyrosinase pathway (tyrp1, mitf, sox9, lef1, mlph, leo1, adam17, egfr, ednrb).
This pathway, enzymatically regulated by tyrosinase and other enzymes and cofactors, is key to
the production of melanin and similar compounds. The tyrp1 enzyme catalyzes several key steps
in the melanogenesis pathway in melanosomes (and melanocytes). This protein has been shown
to affect coloration in a wide variety of vertebrates (Murisier and Beermann 2006; Braasch et al.
2009) and is important for maintaining the integrity of the melanocytes (Gola et al. 2012). In
some mammals tyrp1 has been shown to change the relative abundances of the pigments
72
pheomelanin and eumelanin, thereby producing an overall lighter phenotype (Videira et al.
2013), a pattern which our data mimic as tryp1 is not expressed in the blue-black morph, and
only expressed at low levels in some San Felix individuals. Pheomelanin has only been identified
in the skin of one species of frog (Wolnicka-Glubisz et al. 2012), and it is unclear whether
pheomelanin is generally present in ectotherms. Further, mutations in tyrp1 change melanic
phenotypes through different mechanisms in fish (and possibly other ectotherms) than in
mammals (Braasch et al. 2009; Cal et al. 2017), and the mechanisms by which tyrp1 one affects
pigmentation in amphibians are still being elucidated.
The mitf (microphthalmia-associated transcription factor) locus codes for a transcription
factor that plays a dominant role in melanogenesis, and has been called the “master regulator” of
melanogenesis (Kawakami and Fisher 2017). In our study, mitf expression was lowest in the
microspot population that appears visually to have the least melanic coloration, and mitf was
most highly expressed in the blue-black morph. This transcription factor regulates several key
enzymes in the melanogenesis pathway, including tyr, tyrp1, dct and pmel (D’Mello et al. 2016).
The mitf locus is, itself, targeted by a suite of transcriptional factors including two which were
differentially expressed in our dataset: sox9 and lef1. The sox9 gene is upregulated during
melanocyte differentiation, is capable of promoting melanocyte differentiation by itself, and has
been demonstrated to be an important melanocytic transcription factor (Cheung and Briscoe
2003). Further, sox9 is up-regulated in human skin after UVB exposure and has been
demonstrated to increase pigmentation. The asip gene, one of the most prominent color genes,
actually downregulates sox9 expression and decreases pigmentation (Passeron et al. 2007). Sox9
was not expressed in the microspot morph and was only expressed (at a low level) in one San
Felix individual.
73
The lymphoid enhancer-binding factor locus (lef1) is a transcription factor that mediates
Wnt signaling in the context of melanocyte differentiation and development, with important
effects on melanogenesis (Song et al. 2017). Upregulation of this gene has been found to reduce
synthesis of the darkest melanic pigment eumelanin, resulting in lighter coloration in mink and
other vertebrates (Song et al. 2017). In this study, lef1 showed very low expression in the blue
and black morph, compared to the other three morphs. Comparing the photos of the four morphs
(Fig. 1), it can readily be seen that blue and black morph has substantially darker (black)
background coloration, compared to the other three, which all have a lighter, brownish
background coloration indicating that lef1 is a likely contributor to the background dorsal
coloration between color morphs in Dendrobates auratus.
Just as mitf is a target of the transcription factors lef1 and sox9, mitf targets endothelin
receptors, a type of G Protein Coupled Receptor (Braasch and Schartl 2014). Endothelin
receptors mediate several crucial developmental processes, particularly the development of
neural crest cell populations (Braasch and Schartl 2014). Three paralogous families of these
receptors have been identified in vertebrates: endothelin receptor B1 (ednrb1), endothelin
receptor B2 (ednrb2), and endothelin receptor A (ednra). Ednrb is involved in producing the
different male color morphs of the Ruff (a sandpiper), and it is only expressed in black males
(Ekblom et al. 2012). In our study, ednrb is not expressed in the blue-black morph, and only one
of the ednrb transcripts is expressed in the San Felix morph. Mutations in ednrb1 and ednrb2
have been found to affect pigment cell development (especially melanocytes and iridophores) in
a variety of vertebrate species (Braasch and Schartl 2014). These receptors show divergent
patterns of evolution in the ligand-binding region in African lake cichlids, and appear to have
evolved divergently in association with adaptive radiations in this group (Diepeveen and
74
Salzburger 2011). The ednrb2 (endothelin receptor B2) locus encodes a transmembrane receptor
that plays a key role in melanoblast (a precursor cell of the melanocyte) migration (Kelsh et al.
2009). This receptor interacts with the edn3 ligand. Mutations affecting this ligand/receptor
system in Xenopus affect pigment cell development (Kawasaki-Nishihara et al. 2011).
Melanophore-based coloration is also influenced by mutations in the hps3 (Hermansky-
Pudlak Syndrome 3) locus; mutations at this locus are associated with a subtype of the
Hermansky-Pudlak Syndrome (which generally results in decreased pigmentation). The HPS3
protein mediates trafficking of key melanogenesis enzymes into melanocytes, and variants of this
protein with reduced activity result in inefficient trafficking, reduction in the delivery of key
enzymes (e.g. tyrosinase) to melanosomes, and hypopigmentation (Boissy et al. 2005). Hps3 is
not expressed in the San Felix population, which only exhibits brown and not black color.
Similarly, mutations in a closely related gene (hps5) in Xenopus causes the “no privacy”
phenotype, in which both melanophores and iridophores are missing, resulting in a transparent
body phenotype (Nakayama et al. 2017). The dtnbp1 (dystrobrevin binding protein 1) locus is
involved in melanosome biogenesis, and defects in this gene can also cause a subtype of the
Hermansky-Pudlak syndrome, again associated with hypopigmentation (Wei 2006). We have
two differentially expressed dtnbp1 transcripts that have near-opposite expression. It is possible
that these two transcripts are components of different alternatively spliced transcript isoforms
from the same gene which are contributing to different functions between color morphs, but
without better genomic resources we would be unable to determine if these are isoforms,
sequencing error, or result from the specific algorithms of our assemblers.
75
The F-box and WD repeat domain containing 4 locus (fbxw4), known as the hagoromo
locus after a mutant zebrafish line, is an F-Box protein that affects stripe formation in zebrafish,
through effects on melanophores (Kawakami et al. 2000). Variation in the expression of this
gene has been implicated in variation in the orientation and density of stripes with respect to the
body axis across different species of cichlids (Ahi and Sefc 2017) and is also associated with
divergence in color pattern across East African cichlids (Terai et al. 2002, 2003). We have two
differentially expressed transcripts that map to fbwx4, neither of which are very highly expressed
although there are subtly different expression patterns between these transcripts. The leo1 (LEO1
Homolog) and ctr9 (CTR9 Homolog) loci are both components of the yeast polymerase-
associated factor 1 (Paf1) complex, which affects the development of the heart, ears and neural
crest cells in zebrafish, with dramatic downstream effects on pigment cells and pigmentation,
and on the Notch signaling pathway (Akanuma et al. 2007; Nguyen et al. 2010). Perhaps
unsurprisingly then, we found that notch1, a well-known member of the Notch Signaling
Pathway, was differentially expressed between color morphs. Mutations in this gene are known
to affect skin, hair and eye pigmentation in humans through effects on melanocyte stem cells
(Schouwey and Beermann 2008). The gne (glucosamine (UDP-N-acetyl)-2-epimerase/N-
acetylmannosamine kinase) locus (also differentially expressed) likely contributes to red versus
white coloration in the skin of chickens (Nie et al. 2016).
A number of other melanogenesis-related genes were found to be differentially expressed
between morphs, such as brca1. Mice with a homozygous mutation of the tumor suppressing
brca1 gene show altered coat coloration, often producing a piebald appearance (Ludwig et al.
2001). The precise mechanism behind this is not clear, and it may involve either mitf or p53
(Beuret et al. 2011; Tonks et al. 2012). Bmpr1b is a bone morphogenic protein which is known to
76
inhibit melanogenesis; when bmpr1b is downregulated via UV exposure it enhances melanin
production and leads to darker pigmentation (Yaar et al. 2006). Some of the other genes (e.g.
mlph, or melanophilin) show the same pattern of expression across morphs as lef1, suggesting
that multiple genes may contribute to the difference between lighter and darker background
coloration in this species. The product of the melanophilin gene forms a complex that combines
with two other proteins and binds melanosomes to the cell cytoskeleton, facilitating melanosome
transport within the cell. Variants of this gene are associated with “diluted”, or lighter-colored,
melanism in a number of vertebrates (Cirera et al. 2013). Similarly, the mreg (melanoregulin)
gene product functions in melanosome transport and hence is intimately involved in
pigmentation (Wu et al. 2012). Mutations at this locus cause “dilute” pigmentation phenotypes in
mice. The egfr (epidermal growth factor receptor) locus is a type-1 tyrosine kinase receptor
involved in skin and retinal pigmentation, and has been under positive selection in some human
populations (Quillen et al. 2012; Hider et al. 2013). This gene influences the proliferation and
differentiation of melanocytes through indirect mechanisms (Hirobe 2011).
In summary, we have found a number of differentially expressed genes that influence
melanic coloration which seem to be important between color morphs with a true, black
background pattern versus those with a more dilute, brown colored background pattern. This
result parallels similar findings in Oophaga histrionica, a species of poison frog in which
mutations in the mc1r gene affecting melanogenesis have produced a lighter, more brownish
background in some populations (Posso-Terranova and Andrés 2017). Although mc1r is not
differentially expressed in our dataset (or even identified in our assembled transcriptome), our
results show gene expression patterns of many genes which are ultimately influenced by mc1r
activity. We find that poison frogs can achieve the same color pattern differences expressed by a
77
mutation in mc1r by up or down regulating other genes that contribute to melanogenesis,
melanocyte proliferation, and melanocyte differentiation. It is possible that allelic variants of
mc1r between our color populations could produce the gene expression patterns we have seen
here.
Purine synthesis and iridophore genes:
Higdon et al. (2013) identified a variety of genes that are components of the guanine
synthesis pathway and show enriched expression in zebrafish iridophores. A number of these
genes (hprt1, ak5, dera, ednrb2, gas1, ikpkg, atic, airc, prtfdc1) were differentially expressed
between the different morphs of D. auratus investigated here (Figure 8). The gart gene codes for
phosphoribosylglycinamide formyltransferase, phosphoribosylglycinamide synthetase,
phosphoribosylaminoimidazole synthetase, a tri-function enzyme that catalyzes three key steps
in the de novo purine synthesis pathway (Ng et al. 2009). This locus has been associated with
critical mutations affecting all three types of chromatophores in zebrafish, through effects on the
synthesis of guanine (iridophores), sepiapterin (xanthophores) and melanin (melanocytes)(Ng et
al. 2009). Zebrafish mutants at this locus can show dramatically reduced numbers of iridophores,
resulting in a lighter, or less saturated color phenotype. Similarly, the airc gene plays a critical
role in guanine synthesis, and yeast with mutations in this gene leading to aberrant forms of the
transcribed protein are unable to synthesize adenine and accumulate a visible red pigment
(Tolstorukov and Efremov 1984; Sychrova et al. 1999). Both airc and gart had similar
expression patterns and were very lowly expressed in the mostly green microspot population.
The mthfd (methylenetetrahydrofolate dehydrogenase, cyclohydrolase and
formyltetrahydrofolate synthetase 1) gene also affects the de novo purine synthesis pathway
78
(Christensen et al. 2013). The gene prtfdc1 is highly expressed in iridophores, and encodes an
enzyme which catalyzes the final step of guanine synthesis (Higdon et al. 2013); prtfdc1 was not
expressed in the dark blue-black morph, but was highly expressed in the San Felix and super
blue morphs, both of which have visible ‘sparkles’ on the skin which likely come from
iridophores. These genes are likely candidates to affect coloration in Dendrobates auratus given
that both the green and blue pattern elements are probably iridophore-dependent colors.
How the guanine platelets are formed in iridophores remains an open question. Higdon et
al. (2013) proposed that ADP Ribosylation Factors (ARFs) and Rab GTPases are likely to play
crucial roles in this context. ARFs are a family of ras-related GTPases that control transport
through membranes and organelle structure. We identified one ARF protein (arf6) and two ARF
activating proteins (arfgap1 and arfgap2) that were differentially expressed across the D. auratus
morphs. We also identified four different Rab GTPases as differentially expressed (rab1a, rab3c,
rab3d, rab7a). Mutations at the rabggta (Rab geranylgeranyl transferase, a subunit) locus cause
abnormal pigment phenotypes in mice (e.g. “gunmetal”), are known to affect the guanine
synthesis pathway (Gene et al. 2001), and are similarly differentially expressed between color
morphs in our dataset.
Pteridine synthesis:
A number of the genes identified as differentially expressed are involved in copper
metabolism (sdhaf2, atox1, atp7b). Copper serves as a key cofactor for tyrosinase in the
melanogenesis pathway and defects in copper transport profoundly affect pigmentation (Setty et
al. 2008). Another gene, the xanthine hydrogenase (xdh) locus, was also found to be
79
differentially expressed between morphs, and this gene, which is involved in the oxidative
metabolism of purines, affects both the guanine and pteridine synthesis pathways. Additionally,
it has been shown to be critically important in the production of color morphs in the axolotl.
When xdh was experimentally inhibited axolotls had reduced quantities of a number of pterins,
and also had a dramatic difference in color phenotype with xdh-inhibited individuals showing a
‘melanoid’ (black) appearance (Thorsteinsdottir and Frost 1986). Furthermore, xdh deficient
frogs show a blue coloration in typically green species (Frost 1978; Frost and Bagnara 1979). We
note here that one xdh transcript showed little (one individual) or no (2 individuals) expression in
the bluest morph (blue-black). Similarly, when pigments contained in the xanthophores that
absorb blue light are removed, this can lead to blue skin (Bagnara et al. 2007). Another gene
involved in pteridine synthesis is qdpr (quinoid dihydropteridine reductase), which is only
expressed in the populations with a lighter blue or green coloration. Mutations in this gene result
in altered patterns of pteridine (e.g. sepiapterin) accumulation (Ponzone et al. 2004).
Novel candidate genes for coloration:
In addition to those genes that have previously been linked to coloration which we have
identified in our study, we would like to propose some other genes based on their expression
patterns in our data. Although most research on blue coloration focuses on Tyndall scattering
from iridophores, this has generally not been explicitly tested and there is some evidence that
blue colors may arise through different mechanisms (reviewed in (Bagnara et al. 2007). In
particular, there is evidence that blue in amphibians can come from the collagen matrix in the
skin, as grafts in which chromatophores failed to thrive show a blue coloration (Bagnara et al.
80
2007). Furthermore, keratinocytes surround melanocytes, and they play a key role in
melanosome transfer (Ando et al. 2012). In light of this evidence, we propose a number of
keratinocyte and collagen genes which are differentially expressed in our dataset as further
candidate genes for coloration. Amongst these are krt12 (two differentially expressed transcripts)
and krt18, col1a1 (six transcripts), col5a1 (five transcripts), and col14a1 (two transcripts). These
genes, and those like them, may be playing a critical role in coloration in these frogs.
Differentially expressed genes unrelated to color:
Metamorphosis is a taxing time for species which undergo this developmental change.
Since we collected samples at the end of metamorphosis during tail resorption, we would expect
many of the genes being expressed at this time are associated with these developmental
processes. Indeed, many of the most highly expressed and most highly differentially expressed
genes are related to metamorphic processes. Many of these genes are highly expressed during
metamorphosis in a number of examined amphibian species (e.g., aebp1, ddx5, krt17, mmp2;
data in Sanchez et al. 2018). For example, two of the top 20 rank order genes annotate to matrix
metallopeptidase 2 (mmp2), which likely plays a role in the process of tail resorption (Sanchez et
al. 2018). Other genes (krt17, col5a2, lamc2) play various roles in the organization of
intermediate filaments and the skin, so these may either play a role in skin changes during
metamorphosis, the production of colors, or both (Bateman et al. 2017). The protein
dipeptidylpeptidase 3 (dpp3), has been shown to be important in the regeneration of limbs in
Xenopus laevis, a process which mimics metamorphic processes (King et al. 2009). Annexin A6
(anxa6) was also differentially expressed between color morphs, anxa6 has also been
81
upregulated in other amphibian species reaching metamorphosis (Sanchez et al. 2018). We also
found two transcripts in the top 20 differentially expressed genes which mapped to the mtDNA,
cytochrome c oxidase subunit I and III, and these may also be as a direct result of the challenges
of metamorphosis.
Conclusion:
The mechanisms that produce coloration in both amphibians and aposematic species are
poorly characterized. Here we have taken a transcriptomics-based approach to elucidating the
genetic mechanisms underlying color and pattern development in a poison frog. We produced the
first skin transcriptome of Dendrobates auratus and examined expression patterns of candidate
color genes in different color morphs. Unlike other studies investigating color variation in
aposematic species, we found that many loci that appear to play a role in coloration in this
system. We found a suite of differentially expressed color genes that are involved in melanic
coloration, as well as a group of genes involved in guanine synthesis and iridophore development
that were differentially expressed between morphs. These results make sense in the context of
the overall color and pattern of these frogs, and provide a number of promising starting points for
future investigations of the molecular, cellular and physiological mechanisms underlying
coloration in amphibians.
Acknowledgements:
Animal care and use for this research was approved by East Carolina University’s IACUC (AUP
#D281). Funding for this project was provided by NSF DEB 165536 and an East Carolina

82
University Thomas Harriot College of Arts and Sciences Advancement Council Distinguished
Professorship to K Summers.
83
Literature cited:
Ahi, E. P., and K. M. Sefc. 2017. Anterior-posterior gene expression differences in three Lake
Malawi cichlid fishes with variation in body stripe orientation. PeerJ e4080.
Akanuma, T., S. Koshida, A. Kawamura, Y. Kishimoto, and S. Takada. 2007. Paf1 complex
homologues are required for Notch-regulated transcription during somite segmentation.
EMBO Rep. 8:858–863.
Ando, H., Y. Niki, M. Ito, K. Akiyama, M. S. Matsui, D. B. Yarosh, and M. Ichihashi. 2012.
Melanosomes are transferred from melanocytes to keratinocytes through the processes of
packaging, release, uptake, and dispersion. J. Invest. Dermatol. 132:1222–1229. Elsevier
Masson SAS.
Bagnara, J. T., P. J. Fernandez, and R. Fujii. 2007. On the blue coloration of vertebrates. Pigment
Cell Res. 20:14–26.
Bankevich, A., S. Nurk, D. Antipov, A. A. Gurevich, M. Dvorkin, A. S. Kulikov, V. M. Lesin, S.
I. Nikolenko, S. Pham, A. D. Prjibelski, A. V. Pyshkin, A. V. Sirotkin, N. Vyahhi, G.
Tesler, M. A. Alekseyev, and P. A. Pevzner. 2012. SPAdes: A new genome assembly
algorithm and its applications to single-cell sequencing. J. Comput. Biol. 19:455–477.
Bateman, A., M. J. Martin, C. O’Donovan, M. Magrane, E. Alpi, R. Antunes, B. Bely, M.
Bingley, C. Bonilla, R. Britto, B. Bursteinas, H. Bye-AJee, A. Cowley, A. Da Silva, M. De
Giorgi, T. Dogan, F. Fazzini, L. G. Castro, L. Figueira, P. Garmiri, G. Georghiou, D.
Gonzalez, E. Hatton-Ellis, W. Li, W. Liu, R. Lopez, J. Luo, Y. Lussi, A. MacDougall, A.
Nightingale, B. Palka, K. Pichler, D. Poggioli, S. Pundir, L. Pureza, G. Qi, S. Rosanoff, R.
Saidi, T. Sawford, A. Shypitsyna, E. Speretta, E. Turner, N. Tyagi, V. Volynkin, T.
84
Wardell, K. Warner, X. Watkins, R. Zaru, H. Zellner, I. Xenarios, L. Bougueleret, A.
Bridge, S. Poux, N. Redaschi, L. Aimo, G. ArgoudPuy, A. Auchincloss, K. Axelsen, P.
Bansal, D. Baratin, M. C. Blatter, B. Boeckmann, J. Bolleman, E. Boutet, L. Breuza, C.
Casal-Casas, E. De Castro, E. Coudert, B. Cuche, M. Doche, D. Dornevil, S. Duvaud, A.
Estreicher, L. Famiglietti, M. Feuermann, E. Gasteiger, S. Gehant, V. Gerritsen, A. Gos, N.
Gruaz-Gumowski, U. Hinz, C. Hulo, F. Jungo, G. Keller, V. Lara, P. Lemercier, D.
Lieberherr, T. Lombardot, X. Martin, P. Masson, A. Morgat, T. Neto, N. Nouspikel, S.
Paesano, I. Pedruzzi, S. Pilbout, M. Pozzato, M. Pruess, C. Rivoire, B. Roechert, M.
Schneider, C. Sigrist, K. Sonesson, S. Staehli, A. Stutz, S. Sundaram, M. Tognolli, L.
Verbregue, A. L. Veuthey, C. H. Wu, C. N. Arighi, L. Arminski, C. Chen, Y. Chen, J. S.
Garavelli, H. Huang, K. Laiho, P. McGarvey, D. A. Natale, K. Ross, C. R. Vinayaka, Q.
Wang, Y. Wang, L. S. Yeh, and J. Zhang. 2017. UniProt: The universal protein
knowledgebase. Nucleic Acids Res. 45:D158–D169. Oxford University Press.
Bates, H. 1862. Contributions to an insect fauna of the Amazon valley (Lepidoptera:
Heliconidae). Biol. J. Linn. Soc. 23:495–566.
Bauer, G. L., C. Praetorius, A. Schepsky, D. A. Swing, T. N. O. Sullivan, N. G. Copeland, and
N. A. Jenkins. 2009. The role of MITF phosphorylation sites during coat color and eye
development in mice analyzed by bacterial artificial chromosome transgene rescue.
Genetics 594:581–594.
Bennett, D. C., and M. L. Lamoreux. 2003. The color loci of mice – A genetic century. Pigment
Cell Res. 16:333–344.
Beuret, L., M. Ohanna, T. Strub, M. Allegra, I. Davidson, C. Bertolotto, and R. Ballotti. 2011.
85
BRCA1 is a new MITF target gene. Pigment Cell Melanoma Res. 24:725–727.
Boissy, R. E., B. Richmond, M. Huizing, A. Helip-Wooley, Y. Zhao, A. Koshoffer, and W. A.
Gahl. 2005. Melanocyte-specific proteins are aberrantly trafficked in melanocytes of
Hermansky-Pudlak syndrome-type 3. Am. J. Pathol. 166:231–240. American Society for
Investigative Pathology.
Bolger, A. M., M. Lohse, and B. Usadel. 2014. Trimmomatic: A flexible trimmer for Illumina
sequence data. Bioinformatics 30:2114–2120.
Braasch, I., D. Liedtke, J. N. Volff, and M. Schartl. 2009. Pigmentary function and evolution of
tyrp1 gene duplicates in fish. Pigment Cell Melanoma Res. 22:839–850.
Braasch, I., and M. Schartl. 2014. Evolution of endothelin receptors in vertebrates. Gen. Comp.
Endocrinol. 209:21–34. Elsevier Inc.
Bray, N. L., H. Pimentel, P. Melsted, and L. Pachter. 2016. Near-optimal probabilistic RNA-seq
quantification. Nat. Biotechnol. 34:525–527.
Brown, J. L., E. Twomey, A. Amezquita, M. B. DeSouza, J. Caldwell, S. Lötters, R. Von May,
P. R. Melo-sampaio, D. Mejía-vargas, P. Perez-peña, M. Pepper, E. H. Poelman, M.
Sanchez-rodriguez, and K. Summers. 2011. A taxonomic revision of the Neotropical poison
frog genus Ranitomeya (Amphibia: Dendrobatidae). Zootaxa 3083:1–120.
Buchfink, B., C. Xie, and D. H. Huson. 2015. Fast and sensitive protein alignment using
DIAMOND. Nat. Methods 12:59–60.
Cal, L., P. Suarez-Bregua, J. M. Cerdá-Reverter, I. Braasch, and J. Rotllant. 2017. Fish
pigmentation and the melanocortin system. Comp. Biochem. Physiol. -Part A Mol. Integr.
86
Physiol. 211:26–33. Elsevier.
Cheung, M., and J. Briscoe. 2003. Neural crest development is regulated by the transcription
factor Sox9. Development 130:5681–5693.
Christensen, K. E., L. Deng, K. Y. Leung, E. Arning, T. Bottiglieri, O. V. Malysheva, M. A.
Caudill, N. I. Krupenko, N. D. Greene, L. Jerome-Majewska, R. E. MacKenzie, and R.
Rozen. 2013. A novel mouse model for genetic variation in 10-formyltetrahydrofolate
synthetase exhibits disturbed purine synthesis with impacts on pregnancy and embryonic
development. Hum. Mol. Genet. 22:3705–3719.
Cirera, S., M. N. Markakis, K. Christensen, and R. Anistoroaei. 2013. New insights into the
melanophilin (MLPH) gene controlling coat color phenotypes in American mink. Gene
527:48–54. Elsevier B.V.
Coordinators, N. R. 2016. Database resources of the National Center for Biotechnology
Information. Nucleic Acids Res. 44:7–19.
D’Mello, S. A. N., G. J. Finlay, B. C. Baguley, and M. E. Askarian-Amiri. 2016. Signaling
pathways in melanogenesis. Int. J. Mol. Sci. 17:1–18.
Diepeveen, E. T., and W. Salzburger. 2011. Molecular characterization of two endothelin
pathways in east african cichlid fishes. J. Mol. Evol. 73:355–368.
Ekblom, R., L. L. Farrell, D. B. Lank, and T. Burke. 2012. Gene expression divergence and
nucleotide differentiation between males of different color morphs and mating strategies in
the ruff. Ecol. Evol. 2:2485–2505.
Frost, S. K. 1978. Developmental aspects of pigmentation in the Mexican leaf frog,
87
Pachymedusa dacnicolor.
Frost, S. K., and J. T. Bagnara. 1979. Allopurinol-Induced Melanism In The Tiger Salamander
(Ambystoma iigrinum nebulosum). J. Exp. Zool. 209:455–465.
Gene, H. P. S.-, T. Suzuki, W. Li, Q. Zhang, E. K. Novak, E. V Sviderskaya, A. Wilson, D. C.
Bennett, B. A. Roe, R. T. Swank, and R. A. Spritz. 2001. The gene mutated in cocoa mice,
carrying a defect of organelle biogenesis, is a homologue of the human Hermansky-Pudlak
Syndrom-3 gene. Genomics 78:30–37.
Gola, M., R. Czajkowski, A. Bajek, A. Dura, and T. Drewa. 2012. Melanocyte stem cells:
Biology and current aspects. Med. Sci. Monit. 18:RA155-RA159.
Gosner, K. L. 1960. A simplified table for staging anuran embryos and larvae with notes on
identification. Herpetologica 16:183–190.
Haas, B. J., A. Papanicolaou, M. Yassour, M. Grabherr, D. Philip, J. Bowden, M. B. Couger, D.
Eccles, B. Li, M. D. Macmanes, M. Ott, J. Orvis, and N. Pochet. 2014. De novo transcript
sequence reconstruction from RNA-Seq: reference generation and analysis with Trinity.
Nat. Protoc. 8:1–43.
Hammond, S. A., R. L. Warren, B. P. Vandervalk, E. Kucuk, H. Khan, E. A. Gibb, P. Pandoh, H.
Kirk, Y. Zhao, M. Jones, A. J. Mungall, R. Coope, S. Pleasance, R. A. Moore, R. A. Holt, J.
M. Round, S. Ohora, B. V. Walle, N. Veldhoen, C. C. Helbing, and I. Birol. 2017. The
North American bullfrog draft genome provides insight into hormonal regulation of long
noncoding RNA. Nat. Commun. 8:1–8. Springer US.
Hider, J. L., R. M. Gittelman, T. Shah, M. Edwards, A. Rosenbloom, J. M. Akey, and E. J. Parra.
88
2013. Exploring signatures of positive selection in pigmentation candidate genes in
populations of East Asian ancestry. BMC Evol. Biol. 13.
Higdon, C. W., R. D. Mitra, and S. L. Johnson. 2013. Gene expression analysis of zebrafish
melanocytes, iridophores, and retinal pigmented epithelium reveals indicators of biological
function and developmental origin. PLoS One 8:e67801.
Hirobe, T. 2011. How are proliferation and differentiation of melanocytes regulated? Pigment
Cell Melanoma Res. 24:462–478.
Kannan, S., J. Hui, and K. Mazooji. 2016. Shannon: An information-optimal de novo RNA-Seq
assembler. 1–14.
Kawakami, A., and D. E. Fisher. 2017. The master role of microphthalmia-associated
transcription factor in melanocyte and melanoma biology. Lab. Investig. 97:649–656.
Nature Publishing Group.
Kawakami, K., A. Amsterdam, N. Shimoda, T. Becker, J. Mugg, A. Shima, and N. Hopkins.
2000. Proviral insertions in the zebrafish hagoromo gene , encoding an F-box / WD40-
repeat protein , cause stripe pattern anomalies. Curr. Biol. 10:463–466.
Kawasaki-Nishihara, A., D. Nishihara, H. Nakamura, and H. Yamamoto. 2011. ET3/Ednrb2
signaling is critically involved in regulating melanophore migration in Xenopus. Dev. Dyn.
240:1454–1466.
Kelsh, R. N., M. L. Harris, S. Colanesi, and C. a Erickson. 2009. Stripes and belly-spots – a
review of pigment cell morphogenesis in vertebrates. Semin. Cell Dev. Biol. 20:90–104.
King, M. W., A. W. Neff, and A. L. Mescher. 2009. Proteomics analysis of regenerating
89
amphibian limbs: Changes during the onset of regeneration. Int. J. Dev. Biol. 53:955–969.
Kokko, H., R. Brooks, J. M. McNamara, and A. I. Houston. 2002. The sexual selection
continuum. Proc. Biol. Sci. 269:1331–1340.
Kunte, K., W. Zhang, A. Tenger-Trolander, D. H. Palmer, A. Martin, R. D. Reed, S. P. Mullen,
and M. R. Kronforst. 2014. doublesex is a mimicry supergene. Nature 507:229–232.
Ludwig, T., P. Fisher, S. Ganesan, and A. Efstratiadis. 2001. Tumorigenesis in mice carrying a
truncating Brca1 mutation. Genes Dev. 1188–1193.
MacManes, M. D. 2014. On the optimal trimming of high-throughput mRNA sequence data.
Front. Genet. 5:1–7.
MacManes, M. D. 2017. The Oyster River Protocol: A multi assembler and kmer approach for
de novo transcriptome assembly. Doi.Org 177253.
Mallet, J., and M. Joron. 1999. Evolution of diversity in warning color and mimicry:
polymorphisms, shifting balance, and speciation. Annu. Rev. Ecol. Syst. 30:201–233.
Martin, A., R. Papa, N. J. Nadeau, R. I. Hill, B. A. Counterman, G. Halder, C. D. Jiggins, M. R.
Kronforst, A. D. Long, W. O. McMillan, and R. D. Reed. 2012. Diversification of complex
butterfly wing patterns by repeated regulatory evolution of a Wnt ligand. Proc. Natl. Acad.
Sci. 109:12632–12637.
Merrill, R. M., K. K. Dasmahapatra, J. W. Davey, D. D. Dell’Aglio, J. J. Hanly, B. Huber, C. D.
Jiggins, M. Joron, K. M. Kozak, V. Llaurens, S. H. Martin, S. H. Montgomery, J. Morris, N.
J. Nadeau, A. L. Pinharanda, N. Rosser, M. J. Thompson, S. Vanjari, R. W. R. Wallbank,
and Q. Yu. 2015. The diversification of Heliconius butterflies: What have we learned in 150
90
years? J. Evol. Biol. 28:1417–1438.
Mi, H., X. Huang, A. Muruganujan, H. Tang, C. Mills, D. Kang, and P. D. Thomas. 2017.
PANTHER version 11: Expanded annotation data from Gene Ontology and Reactome
pathways, and data analysis tool enhancements. Nucleic Acids Res. 45:D183–D189.
Müller, F. 1879. Ituna and Thyridia: a remarkable case of mimicry in butterflies. Proc. Entomol.
Soc. London XX--XXIX.
Murisier, F., and F. Beermann. 2006. Genetics of pigment cells: Lessons from the tyrosinase
gene family. Histol. Histopathol. 21:567–578.
Nakayama, T., K. Nakajima, A. Cox, M. Fisher, M. Howell, M. B. Fish, Y. Yaoita, and R. M.
Grainger. 2017. no privacy, a Xenopus tropicalis mutant, is a model of human Hermansky-
Pudlak Syndrome and allows visualization of internal organogenesis during tadpole
development. Dev. Biol. 426:472–486. Elsevier Inc.
Ng, A., R. A. Uribe, L. Yieh, R. Nuckels, and J. M. Gross. 2009. Zebrafish mutations in gart and
paics identify crucial roles for de novo purine synthesis in vertebrate pigmentation and
ocular development. Development 136:2601–2611.
Nguyen, C. T., A. Langenbacher, M. Hsieh, and J. N. O. Chen. 2010. The PAF1 complex
component Leo1 is essential for cardiac and neural crest development in zebrafish. Dev.
Biol. 341:167–175. Elsevier Inc.
Nie, C., Z. Zhang, J. Zheng, H. Sun, Z. Ning, and G. Xu. 2016. Genome-wide association study
revealed genomic regions related to white / red earlobe color trait in the Rhode Island Red
chickens. BMC Genet. 1–7. BMC Genetics.
91
Park, H. Y., M. Kosmadaki, M. Yaar, and B. A. Gilchrest. 2009. Cellular mechanisms regulating
human melanogenesis. Cell. Mol. Life Sci. 66:1493–1506.
Passeron, T., J. C. Valencia, C. Bertolotto, T. Hoashi, E. Le Pape, K. Takahashi, R. Ballotti, and
V. J. Hearing. 2007. SOX9 is a key player in ultraviolet B-induced melanocyte
differentiation and pigmentation.
Pimentel, H., N. L. Bray, S. Puente, P. Melsted, and L. Pachter. 2017. Differential analysis of
RNA-seq incorporating quantification uncertainty. Nat. Methods 14:687–690.
Ponzone, A., M. Spada, S. Ferraris, I. Dianzani, and L. De Sanctis. 2004. Dihydropteridine
reductase deficiency in man: From biology to treatment. Med. Res. Rev. 24:127–150.
Posso-Terranova, A., and J. Andrés. 2017. Diversification and convergence of aposematic
phenotypes: truncated receptors and cellular arrangements mediate rapid evolution of
coloration in harlequin poison frogs. Evolution (N. Y). 71:2677–2692.
Poulton, E. 1890. The colours of animals: Their meaning and use especially considered in the
case of insects. P. in K. Paul, ed. The International Scientific Series. Trench Trubner & Co
Ltd, London.
Quillen, E. E., M. Bauchet, and A. W. Bigham. 2012. OPRM1 and EGFR contribute to skin
pigmentation differences between Indigenous Americans and Europeans. 1073–1080.
Ruxton, G. D., T. N. Sherratt, and M. P. Speed. 2004. Avoiding attack: The evolutionary ecology
of crypsis, warning signals and mimicry.
Saenko, S. V., J. Teyssier, D. van der Marel, and M. C. Milinkovitch. 2013. Precise
colocalization of interacting structural and pigmentary elements generates extensive color
92
pattern variation in Phelsuma lizards. BMC Biol. 11:105.
Sanchez, E., E. Küpfer, D. J. Goedbloed, A. W. Nolte, T. Lüddecke, S. Schulz, M. Vences, and
S. Steinfartz. 2018. Morphological and transcriptomic analyses reveal three discrete primary
stages of postembryonic development in the common fire salamander, Salamandra
salamandra. J. Exp. Zool. Part B Mol. Dev. Evol. 330:96–108.
Schouwey, K., and F. Beermann. 2008. The Notch pathway: Hair graying and pigment cell
homeostasis. Histol. Histopathol. 23:609–616.
Setty, S. R. G., D. Tenza, E. V. Sviderskaya, D. C. Bennett, G. Raposo, and M. S. Marks. 2008.
Cell-specific ATP7A transport sustains copper-dependent tyrosinase activity in
melanosomes. Nature 454:1142–1146.
Simão, F. A., R. M. Waterhouse, P. Ioannidis, E. V. Kriventseva, and E. M. Zdobnov. 2015.
BUSCO: Assessing genome assembly and annotation completeness with single-copy
orthologs. Bioinformatics 31:3210–3212.
Sköld, H. N., S. Aspengren, K. L. Cheney, and M. Wallin. 2016. Fish Chromatophores-From
Molecular Motors to Animal Behavior. Int. Rev. Cell Mol. Biol. 321:171–219. Elsevier Inc.
Smith-Unna, R., C. Boursnell, R. Patro, J. M. Hibberd, and S. Kelly. 2016. TransRate:
Reference-free quality assessment of de novo transcriptome assemblies. Genome Res.
26:1134–1144.
Song, L., and L. Florea. 2015. Rcorrector: efficient and accurate error correction for Illumina
RNA-seq reads. Gigascience 4:48. GigaScience.
Song, X., C. Xu, Z. Liu, Z. Yue, L. Liu, T. Yang, B. Cong, and F. Yang. 2017. Comparative

93
transcriptome analysis of mink (Neovison vison) skin reveals the key genes involved in the
melanogenesis of black and white coat colour. Sci. Rep. 7:1–11. Springer US.
Summers, K., T. W. Cronin, and T. Kennedy. 2003. Variation in spectral reflectance among
populations of Dendrobates pumilio, the strawberry poison frog, in the Bocas del Toro
Archipelago, Panama. J. Biogeogr. 30:35–53.
Sun, Y.-B., Z.-J. Xiong, X.-Y. Xiang, S.-P. Liu, W.-W. Zhou, X.-L. Tu, L. Zhong, L. Wang, D.-
D. Wu, B.-L. Zhang, C.-L. Zhu, M.-M. Yang, H.-M. Chen, F. Li, L. Zhou, S.-H. Feng, C.
Huang, G.-J. Zhang, D. Irwin, D. M. Hillis, R. W. Murphy, H.-M. Yang, J. Che, J. Wang,
and Y.-P. Zhang. 2015. Whole-genome sequence of the Tibetan frog Nanorana parkeri and
the comparative evolution of tetrapod genomes. Proc. Natl. Acad. Sci. 112:E1257–E1262.
Supple, M. a, H. M. Hines, K. K. Dasmahapatra, J. J. Lewis, D. M. Nielsen, C. Lavoie, D. a Ray,
C. Salazar, W. O. Mcmillan, and B. a Counterman. 2013. Genomic architecture of adaptive
color pattern divergence and convergence in Heliconius butterflies. Genome Res. 23:1248–
1257.
Sychrova, H., V. Braun, and J. Souciet. 1999. Molecular cloning and sequence analysis of
Zygosaccharomyces rouxii ADE2 gene encoding a phosphoribosyl-aminoimidazole
carboxylase. Yeast 15:1399–1402.
Team, R. C. 2017. R Development Core Team.
Terai, Y., N. Morikawa, K. Kawakami, and N. Okada. 2002. Accelerated evolution of the surface
amino acids in the WD-Repeat domain encoded by the hagoromo gene in an explosively
speciated lineage of East African cichlid fishes. Mol. Biol. Evol. 19:574–578.
94
Terai, Y., N. Morikawa, K. Kawakami, and N. Okada. 2003. The complexity of alternative
splicing of hagoromo mRNAs is increased in an explosively speciated lineage in East
African cichlids. Proc. Natl. Acad. Sci. 100:12798–12803.
Thorsteinsdottir, S., and S. K. Frost. 1986. Pigment cell differentiation: The relationship between
pterin content, allopurinol treatment, and the melanoid gene in axolotls. Cell Differ.
19:161–172.
Tolstorukov, I. I., and B. D. Efremov. 1984. Genetic mapping of the yeast Pichia pinus Mapping
by the tetrad analysis. Genetika 20:1099–1107.
Tonks, I. D., G. J. Walker, A. W. Mould, B. Ferguson, P. Keith, N. K. Hayward, and G. F. Kay.
2012. Brca1 is involved in establishing murine pigmentation in a p53 and developmentally
specific manner. Pigment Cell Melanoma Res. 25:530–532.
Vestergaard, J. S., E. Twomey, R. Larsen, K. Summers, and R. Nielsen. 2015. Number of genes
controlling a quantitative trait in a hybrid zone of the aposematic frog Ranitomeya imitator.
Proc. R. Soc. B 282:20141950.
Videira, I. F. D. S., D. F. L. Moura, and S. Magina. 2013. Mechanisms regulating
melanogenesis. An. Bras. Dermatol. 88:76–83.
Wei, M. L. 2006. Hermansky-Pudlak syndrome: A disease of protein trafficking and organelle
function. Pigment Cell Res. 19:19–42.
Wolnicka-Glubisz, A., A. Pecio, D. Podkowa, L. M. Kolodziejczyk, and P. M. Plonka. 2012.
Pheomelanin in the skin of Hymenochirus boettgeri (Amphibia: Anura: Pipidae). Exp.
Dermatol. 21:537–540.
95
Wu, X. S., J. A. Martina, and J. A. Hammer. 2012. Melanoregulin is stably targeted to the
melanosome membrane by palmitoylation. Biochem. Biophys. Res. Commun. 426:209–
214. Elsevier Inc.
Yaar, M., C. Wu, H. Y. Park, I. Panova, G. Schutz, and B. A. Gilchrest. 2006. Bone
morphogenetic protein-4, a novel modulator of melanogenesis. J. Biol. Chem. 281:25307–
25314.
Ziegler, I. 2003. The pteridine pathway in zebrafish: Regulation and specification during the
determination of neural crest cell-fate. Pigment Cell Res. 16:172–182.
V. TRANSCRIPTOMICS OF AN ONTOGENETIC SERIES PROVIDES INSIGHTS INTO
COLOR AND PATTERN DEVELOPMENT IN DIVERGENT COLOR MORPHS OFA
MIMETIC POISON FROG
Adam M M Stuckert1, Tyler Linderoth2, Matthew D MacManes3, Rasmus Nielsen2, Kyle
Summers1
1Department of Biology, East Carolina University
2Department of Integrative Biology, University of California Berkeley
3Department of Molecular, Cellular & Biomedical Sciences, University of New Hampshire
Abstract:
Evolutionary biologists have long investigated the ecological and mechanistic factors that
produce the diversity of animal coloration we see in the natural world. In aposematic species,
color and pattern is directly tied to survival and understanding the origin of the phenotype has
been a focus of both theoretical an empirical inquiry. Counterintuitively, phenotypes in
aposematic species are highly diverse, both within and between populations. In order to better
understand this diversity, we examined gene expression in skin tissue during development in four
different color morphs of the aposematic mimic poison frog, Ranitomeya imitator. In addition to
overall differences in expression, we looked at a suite of a priori color-related genes and
identified both the pattern of expression in these genes over time as well as differences between
these morphs. We identified a set of candidate color genes that are differentially expressed over
time or across populations. Most of these contribute to the better known melanophore-based
pigmentation, but we also identify genes that are involved in iridophore and xanthophore-based
pigmentation.
97
Introduction:
The diversity of animal coloration in the natural world has long been a focus of
investigation in evolutionary biology. Color phenotypes are profoundly impacted by both natural
and sexual selection, and color phenotypes are often under selection from multiple different
biotic and abiotic sources (Rudh and Qvarnström 2013). For example, in some species color
pattern has evolved in the context of both predator avoidance and thermoregulation (Hegna et al.
2013). The underlying mechanisms behind color and pattern phenotypes are of general interest,
particularly in systems in which color phenotypes are varied and yet likely to be under intense
selection.
One such example is adaptive radiation, in which a species or group of species has
undergone rapid phenotypic diversification under selection. There are well-documented
examples of this, for example, in sticklebacks (Schluter 1995), cichlid fishes (Seehausen 2006),
and Hawaiian spiders (Gillespie 2004). Adaptive radiations can be driven by various factors,
including strong, frequency dependent selection imposed by predation (Nosil and Crespi 2006).
The dendrobatid poison frog Ranitomeya imitator underwent a rapid adaptive radiation to mimic
multiple established congeneric poison frogs and gain protection from predators—a case of
Mullerian mimicry (Symula et al. 2001, 2003, Stuckert et al. 2014a,b). For these frogs and other
species that exhibit Mullerian mimicry, it is clear that the comimetic species involved experience
strong selection to maintain local color phenotypes, for example, in Heliconius butterflies
(Mallet and Barton 1989), velvet ants (Wilson et al. 2015), and millipedes (Marek and Bond
2009). Although it is historically predicted that mimicry (and aposematism in general) should be
locally monomorphic, geographic variation in color and pattern appear to be the norm in both
aposematic and mimetic species (Joron and Mallet 1998).
98
This kind of variation has long been a focus of scientific interest, both at the proximate
and ultimate level. Several experiments have revealed that local predators exert purifying
selection (Hensel and Brodie 1976; Hegna et al. 2011; Paluh et al. 2014). However, over
geographic distances genetic drift and heterogeneity in local predator communities are likely to
be sufficient to produce the geographical mosaics in color and pattern seen in many aposematic
and mimetic species (Ruxton et al. 2004; Sherratt 2006; Nokelainen et al. 2012). Determining the
underlying genetic architecture of these changes has been a primary thrust in recent decades.
Researchers have been able to pin down some key genetic loci in Heliconius butterfly mimicry
systems e.g., WntA (Martin et al. 2012) and optix (Reed et al. 2011; Supple et al. 2013), though
there are many others likely involved as well (Kronforst and Papa 2015). Interestingly, it seems
that only a handful of loci control the different phenotypes produced in certain mimetic
complexes, and that supergenes may be critically important in the diversity of mimetic
phenotypes we see in nature in Mullerian mimicry in Heliconius and Batesian mimicry in Papilio
butterflies (Kunte et al. 2014; Kronforst and Papa 2015; Nishikawa et al. 2015). However, the
general applicability of this trend remains unclear. Preliminary evidence indicates that this may
be a common pattern, as color and pattern in the analogous poison frog mimicry system also
appear to be controlled by a small number of genes, at least in one admixture zone between
mimetic morphs (Vestergaard et al. 2015).
Here we attempt to characterize the genetic architecture of coloration in this mimetic
system by examining gene expression and its timing across a developmental time series of the
skin of the Peruvian poison frog Ranitomeya imitator. This is a polytypic species which exhibits
substantial geographic phenotypic variation and convergence on the appearance of sympatric,
previously established congeners (Symula et al. 2001, 2003). Thus, this species provides a good
99
opportunity to examine gene expression as it relates to color and pattern in an adaptive radiation.
Color in this species develops early in life as a tadpole, which is consistent with observations that
chromatophores develop early in embryonic life from the neural crest (DuShane 1935). We
examine gene expression using RNA sequencing from four different mimetic color populations
of R. imitator (Figure V.1), each from four different time points during early development. These
different populations represent a variety of both colors and patterns, providing a good
opportunity to examine the underlying genetic basis of these traits. First, we consider overall
gene expression patterns during development and across color morphs. Then we examine
expression, timing, and morph-based differences of candidate color genes compiled from other
taxa. Our results provide insight into the genetic architecture of color and pattern in amphibians,
and our data provide a key repository for examining gene expression during development—in
and of itself a highly valuable resource.
Methods:
Tadpole collection:
The initial breeding stock of Ranitomeya imitator were purchased from Understory
Enterprises, LLC (Chatham, Canada). Frogs used in this project are captive bred from the
following populations: Baja Huallaga (yellow-striped), Sauce (orange-banded), Tarapoto (green-
spotted), and Varadero (red-headed; see Figure 1). Frogs were placed in breeding pairs in 5-
gallon terraria that had small, approximately 13 cm PVC pipes filled halfway with water. We
removed tadpoles from the tanks to hand rear after the male transported them into the pools of
water. Although in the wild Ranitomeya imitator feeds unfertilized eggs to tadpoles, they are
facultative egg feeders and tadpoles can survive and thrive on other food items (Brown et al.
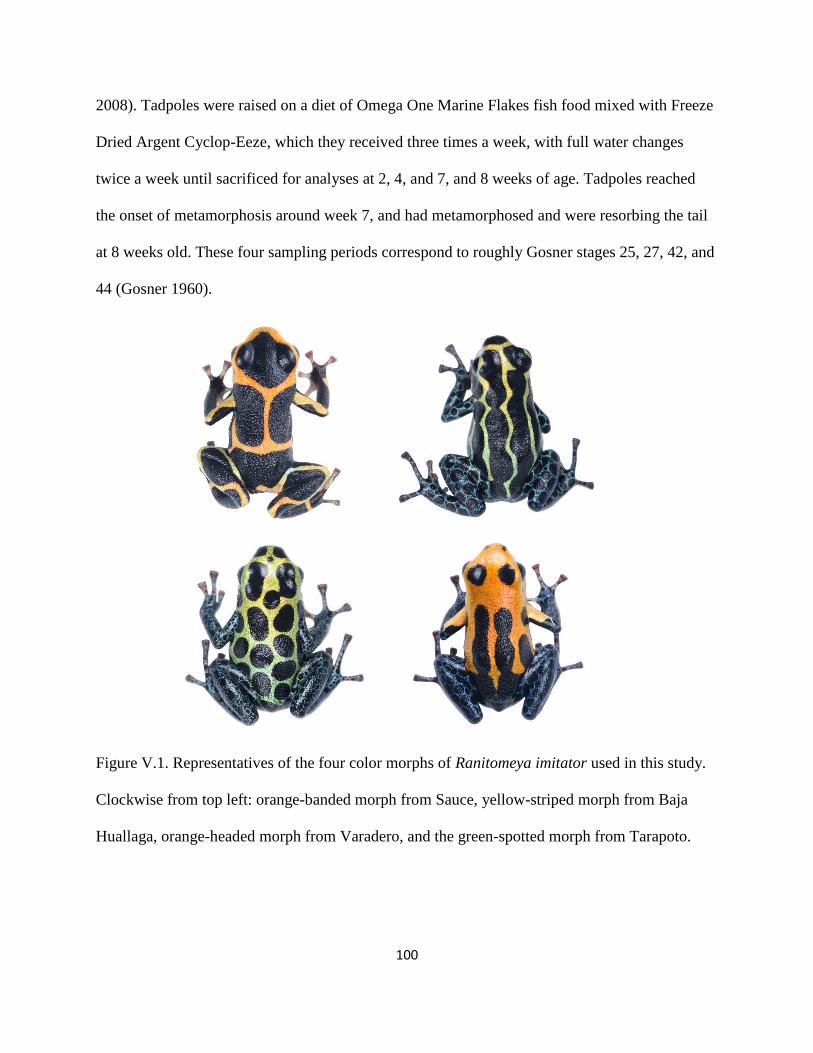
100
2008). Tadpoles were raised on a diet of Omega One Marine Flakes fish food mixed with Freeze
Dried Argent Cyclop-Eeze, which they received three times a week, with full water changes
twice a week until sacrificed for analyses at 2, 4, and 7, and 8 weeks of age. Tadpoles reached
the onset of metamorphosis around week 7, and had metamorphosed and were resorbing the tail
at 8 weeks old. These four sampling periods correspond to roughly Gosner stages 25, 27, 42, and
44 (Gosner 1960).
Figure V.1. Representatives of the four color morphs of Ranitomeya imitator used in this study.
Clockwise from top left: orange-banded morph from Sauce, yellow-striped morph from Baja
Huallaga, orange-headed morph from Varadero, and the green-spotted morph from Tarapoto.
101
Tadpoles were anesthetized with Orajel (20% benzocaine), then sacrificed via pithing.
The entirety of the skin was removed, put into RNA later, and stored at -20° C until RNA
extraction. RNA was extracted from the whole skin using a standardized Trizol protocol, cleaned
with DNAse and RNAsin, and purified using a Qiagen RNEasy mini kit. Libraries were prepared
using standard poly-A tail purification, prepared using Illumina primers, and individually
barcoded using a New England Biolabs Ultra Directional kit. Individually barcoded samples
were pooled and sequenced on an Illumina HiSeq 2500 at the New York Genome Center. Reads
were paired end and 50 base pairs in length and sequenced to a mean depth of 24.45M reads ±
8.6M sd (range: 10.1-64.M).
Transcriptome assembly:
Choosing a single individual or treatment to assemble a transcriptome could plausibly
influence the quality of our transcriptome and bias our results. Evidence indicates that there is a
substantial diminishment of returns in terms of transcriptome assembly quality over 20-30
million reads (MacManes 2017). Therefore, we concatenated all reads into a single forward and a
single reverse read and then randomly subsampled 40 million reads from both the forward and
reverse reads using seqtk (https://github.com/lh3/seqtk). We assembled our transcriptome from
this subsampled data using the Oyster River Protocol version 1.1.1 (MacManes 2017). Initial
error correction was done using RCorrector 1.01 (Song and Florea 2015), followed by an
aggressive adaptor removal and gentle quality trimming using trimmomatic version 0.36 at a
Phred score of ≤ 3 (Bolger et al. 2014) as aggressive quality trimming decreases assembly
completeness (MacManes 2014). The Oyster River Protocol (MacManes 2017) assembles a
transcriptome by using a series of different transcriptome assemblers and also multiple kmer
102
lengths, merging them into a single transcriptome. Assemblies were conducted using Trinity
version 2.4.0 (Grabherr et al. 2011), Shannon version 0.0.2 (Kannan et al. 2016), and SPAdes
assembler version 3.11 with a kmer length of 35 (Bankevich et al. 2012). This is slightly
different than the published Oyster River Protocol as it specifies kmer lengths of 55 and 75, but
our sequences are 50 base pairs long and thus the larger kmer lengths would be inappropriate.
These individually built transcriptomes were then merged together using OrthoFuser (MacManes
2017). Finally, transcriptome quality was assessed using BUSCO version 3.0.1 (Simão et al.
2015) and TransRate 1.0.3 (Smith-Unna et al. 2016).
Downstream analyses:
We annotated our transcriptome using the peptide databases corresponding to frog
genomes for Xenopus tropicalis (NCBI Resource Coordinators 2016), Nanorana parkeri (Sun et
al. 2015), and Rana catesbeiana (Hammond et al. 2017) as well as the UniRef90 database
(Bateman et al. 2017) using Diamond version 0.9.10 (Buchfink et al. 2015). We then pseudo-
quantified alignments for each sample and technical replicate using Kallisto version 0.43.0 (Bray
et al. 2016) and examined differential expression of transcripts in R version 3.4.2 (Team 2017)
using Sleuth version 0.29.0 (Pimentel et al. 2017). Since we sequenced samples on three separate
lanes of the HiSeq2500, we accounted for this using the lane each sample was sequenced on as a
fixed effect in our subsequent models. We analyzed changes in gene expression over the course
of development with a likelihood ratio test comparing tadpole age and sequencing lane as fixed
effects to a simplified, null model of the overall data with only lane as a fixed effect. In addition
to examining overall differential expression between morphs, we examined differential
expression in an a priori group of candidate color genes. To examine genes differentially
103
expressed between color morphs, we built a model with color morph and lane as a fixed effect,
and conducted a likelihood ratio test comparing this to a simplified model with just the lane to
control for batch effects. Further, we built a model comparison similar to both of the above, but
including an interaction effect between population and tadpole age. Unfortunately, because the
interaction represents 16 different groups, we lacked statistical power to make inferences from
this model and these results are not included. In addition, we used PANTHER (Mi et al. 2017) to
quantify the distribution of differentially expressed genes annotated to Xenopus tropicalis into
biological processes, molecular functions, and cellular components. We also used PANTHER
(Mi et al. 2017) to test for overrepresentation of genes and pathways. Tests were conducted using
Fisher’s exact test, and corrected for multiple comparisons by using False Discovery Rate.
Results:
Transcriptome assembly:
After conducting the Oyster River Protocol (MacManes 2017), we had a transcriptome
containing 87,691 total transcripts. Our BUSCO score was 92.7%, indicating that our dataset
contains the majority of conserved genes that we would expect to see in a eukaryote. We
additionally calculated the transrate score, which is an assessment of whether contigs are
accurate, complete, and non-redundant. Although our transrate score was good (0.32867),
transrate also provides an optimal score of “good” contigs which are well supported by the data.
Given that our optimal score was much higher (0.50121), we examined the completeness of
those genes, and found an overall minimal effect on our BUSCO scores (89.8%). Therefore, we
chose to do all downstream analyses with the “good” contigs from transrate, yielding a total of
48,920 transcripts. Using our frog genome peptide databases (Xenopus tropicalis (NCBI
104
Resource Coordinators 2016), Nanorana parkeri (Sun et al. 2015), and Rana catesbeiana
(Hammond et al. 2017)) and the UniRef90 database (Bateman et al. 2017), we successfully
annotated 25,612 transcripts (52.3% of our total transcriptome).
Differential expression:
We found a total of 11,646 transcripts differentially expressed during different time points in
development. Of these, we found 148 transcripts mapping to 109 color genes that were in our a
priori color gene list. Further, we found 8,744 transcripts differentially expressed between
populations of Ranitomeya imitator. Of these, we found 97 transcripts mapping to 81 color genes
that were in our a priori color gene list. Despite the number of candidate color genes which were
differentially expressed either throughout time or between populations, only eight were in
common between the two (dtnbp1, elovl3, ift27, phactr4, qdpr, trim33, tyrp1, slc31a1).
Gene Ontology analyses:
Overall, we found relatively similar gene ontology (GO) results to Xenopus tropicalis,
especially for our analysis of genes differentially expressed over time. Therefore, results
presented here are limited to GO terms for genes differentially expressed between populations. In
the analysis of statistical overrepresentation of GO terms associated with cellular components
(Figure V.2), nothing obviously color-related is statistically significant. When we examined
molecular function (Figure V.3), we found guanyl-nucleotide exchange factor activity
(GO:0005085, qvalue = 0.0317), GTPase activity (GO:0003924, qvalue = 0.0000302), small
GTPase regulator activity (GO:0005083, qvalue = 0.0122), oxidoreductase activity
(GO:0016491, qvalue = 0.000000422), G-protein coupled receptor activity (GO:0004930, qvalue
105
= 1.74E-28), and glutamate receptor activity (GO:0008066, qvalue = 0.0195). Furthermore, we
found a number of molecular function terms which may be related to toxin sequestration between
populations; these include ion channel activity (GO:0005216, qvalue = 0.00538), ligand-gated
ion channel activity (GO:0015276, qvalue = 0.00939), and voltage-gated potassium channel
activity (GO:0005249, qvalue = 0.0106). There are also a number of putatively color-related GO
terms in the biological processes analyses (Figure V.4). Among these are the pteridine-
containing compound metabolic process (GO:0042558, qvalue = 0.00906), nucleobase-
containing compound transport (GO:0015931, qvalue = 0.00699), nucleobase-containing
compound metabolic process (GO:0006139, qvalue = 1.40E-20), cellular component
organization or biogenesis (GO:0071840, qvalue = 2.74E-16), cytoskeleton organization
(GO:0007010, qvalue = 0.00486), and the G-protein coupled receptor signaling pathway
(GO:0007186 qvalue = 0.0000223).

106
Figure V.2. Gene ontology terms from PANTHER. Pie chart slices depict the number of genes in
each cellular component GO category out of the total number of genes.
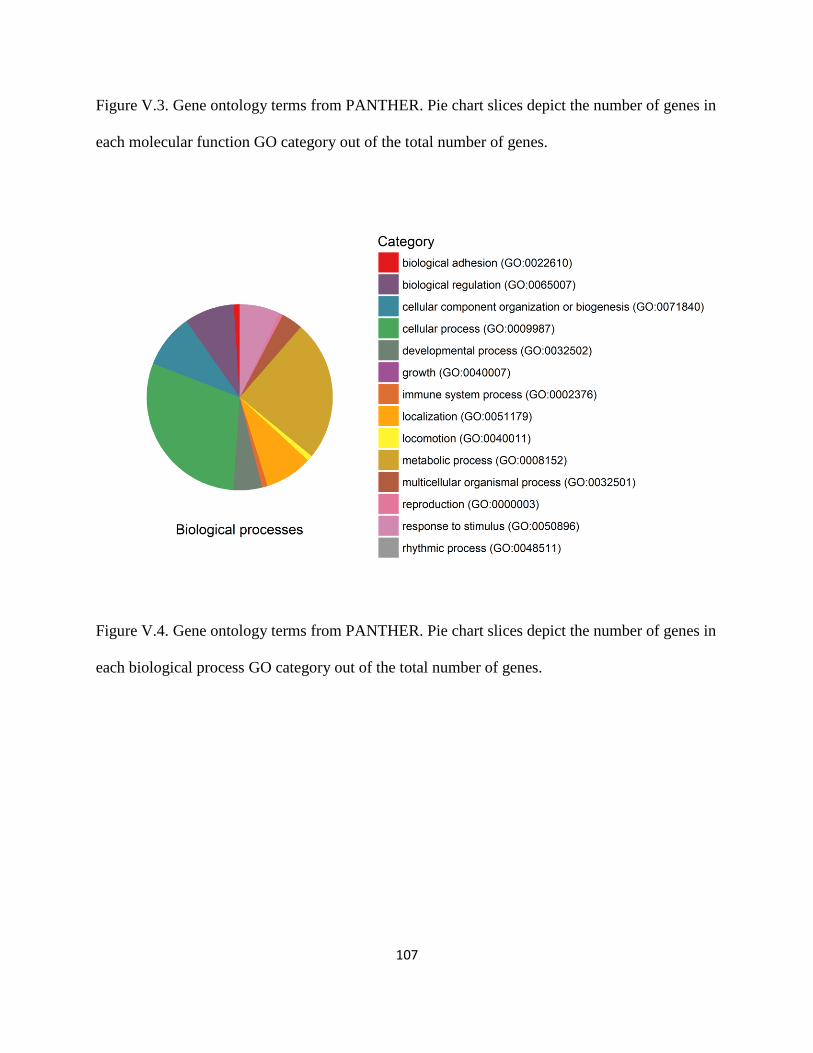
107
Figure V.3. Gene ontology terms from PANTHER. Pie chart slices depict the number of genes in
each molecular function GO category out of the total number of genes.
Figure V.4. Gene ontology terms from PANTHER. Pie chart slices depict the number of genes in
each biological process GO category out of the total number of genes.
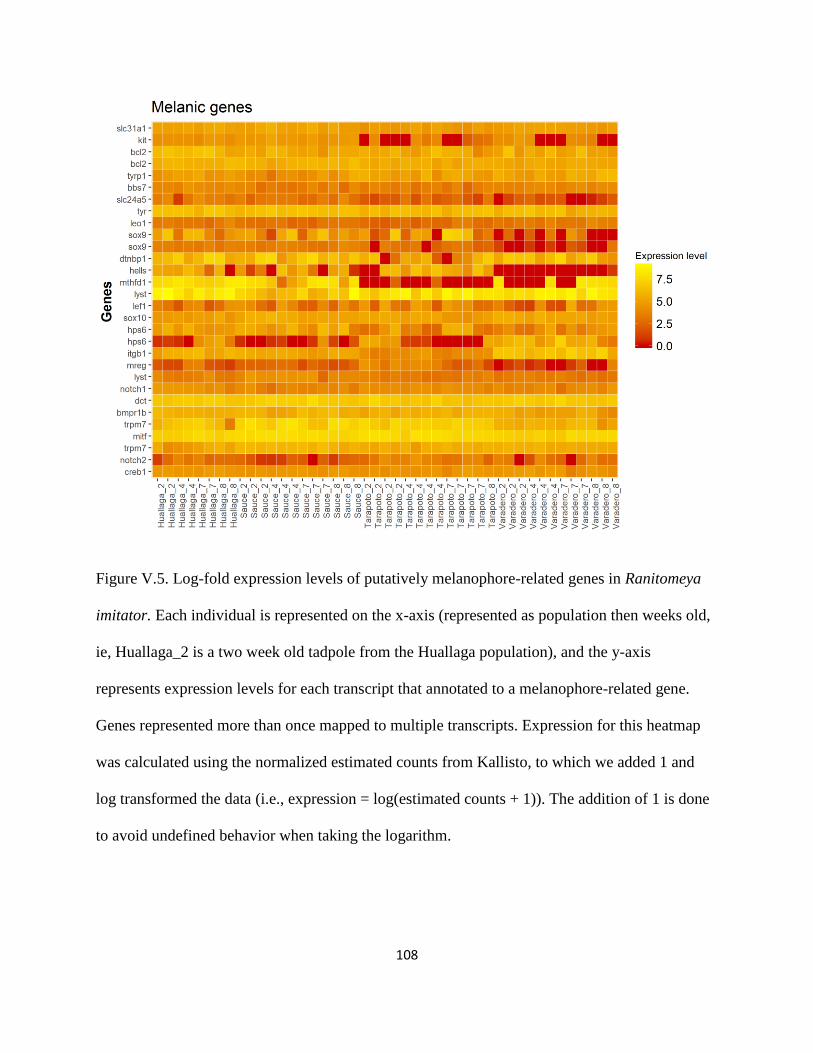
108
Figure V.5. Log-fold expression levels of putatively melanophore-related genes in Ranitomeya
imitator. Each individual is represented on the x-axis (represented as population then weeks old,
ie, Huallaga_2 is a two week old tadpole from the Huallaga population), and the y-axis
represents expression levels for each transcript that annotated to a melanophore-related gene.
Genes represented more than once mapped to multiple transcripts. Expression for this heatmap
was calculated using the normalized estimated counts from Kallisto, to which we added 1 and
log transformed the data (i.e., expression = log(estimated counts + 1)). The addition of 1 is done
to avoid undefined behavior when taking the logarithm.
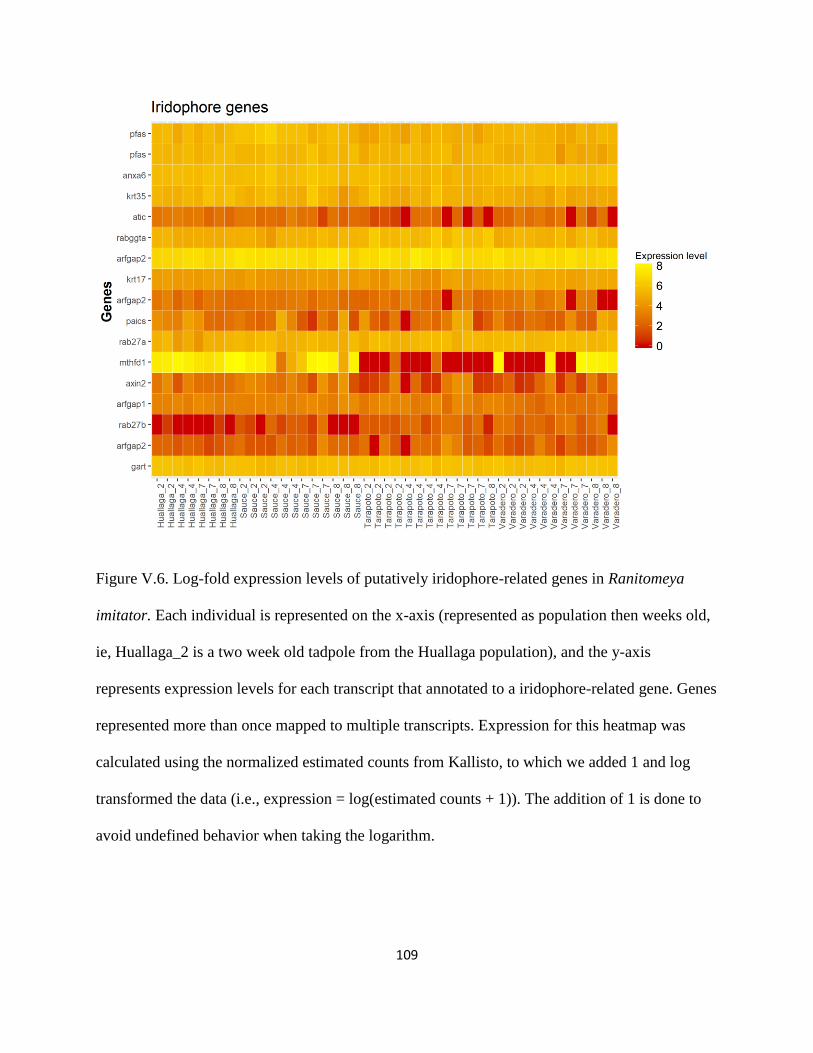
109
Figure V.6. Log-fold expression levels of putatively iridophore-related genes in Ranitomeya
imitator. Each individual is represented on the x-axis (represented as population then weeks old,
ie, Huallaga_2 is a two week old tadpole from the Huallaga population), and the y-axis
represents expression levels for each transcript that annotated to a iridophore-related gene. Genes
represented more than once mapped to multiple transcripts. Expression for this heatmap was
calculated using the normalized estimated counts from Kallisto, to which we added 1 and log
transformed the data (i.e., expression = log(estimated counts + 1)). The addition of 1 is done to
avoid undefined behavior when taking the logarithm.
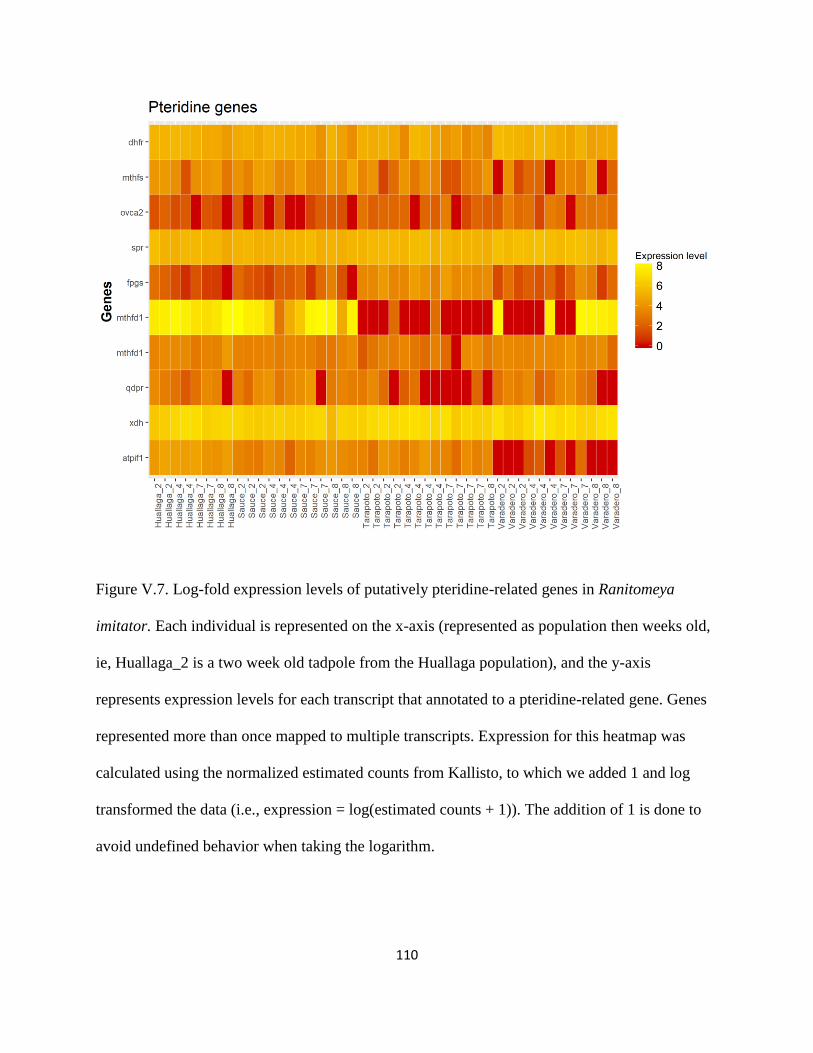
110
Figure V.7. Log-fold expression levels of putatively pteridine-related genes in Ranitomeya
imitator. Each individual is represented on the x-axis (represented as population then weeks old,
ie, Huallaga_2 is a two week old tadpole from the Huallaga population), and the y-axis
represents expression levels for each transcript that annotated to a pteridine-related gene. Genes
represented more than once mapped to multiple transcripts. Expression for this heatmap was
calculated using the normalized estimated counts from Kallisto, to which we added 1 and log
transformed the data (i.e., expression = log(estimated counts + 1)). The addition of 1 is done to
avoid undefined behavior when taking the logarithm.

111
Discussion:
The genetic, biochemical, cellular, physiological and morphological mechanisms that
control coloration in adaptive radiations are of interest because of the obvious implications for
survival and selection. Further, these mechanisms in amphibians are poorly characterized,
particularly compared to better known groups like mammals and fish. Here we provide data and
analyses that facilitate inferences concerning the genes contributing to different color phenotypes
between populations in a highly variable, polytypic poison frog. Further, we provide evidence for
the timing of expression for many candidate color genes, indicating when these genes are
contributing to color and pattern development.
Vertebrate ectotherms (fish, amphibians, and reptiles) exhibit a vast variety of colors and
patterns. This variability is largely driven by the interaction of the three structural chromatophore
types (melanophores, iridophores, and xanthophores) and the pigments and structural elements
found within them (e.g. melanins, pteridines and guanine platelets; Mills & Patterson 2009). Our
discussion is structured so that we move from the genes contributing to the most basal layer
(melanophores and melanin) through to those genes likely influencing the outermost layer of
chromatophores (xanthophores). Although we cannot discuss all of the differentially expressed
candidate color genes, we highlight those that seem most important based on previous research
in other taxa.
Melanophores and melanin:
The four morphs of Ranitomeya imitator used in this study have pattern elements on top
of a generally black dorsum and legs. In vertebrates, black coloration is caused by light
absorption by melanin in melanophores or (in mammals and birds) in the epidermis (Sköld et al.

112
2016). Melanophores (and the other chromatophores) originate from populations of cells in the
neural crest early in development (Park et al. 2009). Given the timing of melanin synthesis and
our sampling scheme, it is unsurprising that many of our differentially expressed candidate genes
are in this pathway. Melanin is synthesized from tyrosine, and this synthesis is influenced by a
variety of different signaling pathways (e.g., Wnt, cAMP, and MAPK), many of which influence
mitf (microphthalmia-associated transcription factor, known as the “master regulator gene” of
melanogenesis), a gene which encodes the melanogenesis associated transcription factor (Videira
et al. 2013; D’Mello et al. 2016). It is therefore unsurprising that mitf is constitutively expressed
across populations and time in our study. The gene creb1 (cAMP responsive element binding
protein 1) is a binding protein in the cAMP pathway, which ultimately influences the
transcriptional factor mitf, and the expression of this gene increases dramatically over time in R.
imitator tadpoles as they show increasing pigmentation. The upregulation of creb1 causes mitf to
increase melanin synthesis (D’Mello et al. 2016). Intriguingly, frogs from the Varadero
population typically have the lowest amount of black overall (see Figure 1), and they also exhibit
the lowest level of mitf expression. This, coupled with evidence that mitf plays a role in the
production of black versus brown coloration in the poison frog Dendrobates auratus (Stuckert et
al., Chapter 4), indicates that this gene likely plays a critical role in melanin synthesis and the
relative darkness of pigmentation in amphibians generally. This is not surprising, as mitf is
highly conserved throughout vertebrates (Lister et al. 1999).
The melanogenesis transcription factor increases melanin synthesis through an interaction
with the enzymes tyrosinase (tyr), tyrosinase-like protein 1 (tyrp1) and dopachrome tautomerase
(dct), which are key elements in melanin biosynthesis (Park et al. 2009). Although tyr is
expressed even in our youngest tadpoles, there is a dramatic increase in tyr expression over the
113
course of development. During this time, tadpoles go from a very light, almost transparent gray
color to a much darker background color with red, orange, yellow or green colored regions
overlaying this black color. The phenotype and correlated expression of tyr indicate that
tyrosinase is likely a key component of melanin biosynthesis in poison frogs. Furthermore,
expression of dopachrome tautomerase follows this same expression pattern, as it rapidly
increases during development. While both dct and tyr expression increased over time in our
study, tyrp1 expression substantially decreased over time. Although we cannot say why this is
with certainty, it may be because tyrp1 seems to play a role in switching melanin synthesis from
the production of eumelanin to pheomelanin. This has been shown to play a role in producing an
overall lighter phenotype (Murisier and Beermann 2006; Videira et al. 2013). Similarly, tyrp1 is
differentially expressed between color morphs of another poison frog (Stuckert et al., Chapter 4),
providing some evidence that the decrease in expression of tyrp1 may be related to the
production of eumelanin over pheomelanin. However, this is speculative, as to date pheomelanin
has only been identified in one species of frog, Pachymedusa dacnicolor (Wolnicka-Glubisz et
al. 2012). One alternative explanation for the expression of tyrp1 over time is its expression
pattern in the Varadero population relative to the others. The two-week old Varadero tadpoles
had very high expression of tyrp1, which may be driving the temporal pattern. Given that tyrp1
has been associated with pheomelanin and red-brown colors, its expression in the red-headed
Varadero population indicates that pheomelanin may be contributing to red coloration in this
population. Curiously, the gene slc24a5 (sodium/potassium/calcium exchanger 5) is
differentially expressed between populations, and expression was nearly absent in the Varadero
tadpoles. A non-synonymous mutation of this gene is known to produce lighter pigmentation in
human populations (Basu Mallick et al. 2013), and the “golden” zebrafish is caused by a
114
mutation in the slc24a5 gene which produces an abnormally pink-tinged fish (Lamason et al.
2005). The low-level of slc24a5 expression may play a similar role in producing variant melanin
expression in the red portions of skin in the Varadero population.
Similar to tyrp1, expression of lef1 (lymphoid enhancer binding factor 1) is associated
with the production of pheomelanin, a pigment associated with lighter color phenotypes (Song et
al., 2017, Stuckert et al., Chapter 4). We see early expression of lef1 which rapidly drops off
until there is functionally no expression by the end of development when melanic coloration
becomes most obvious in tadpoles. The gene sox9 (sex determining region Y – box 9) also
influences the transcription factor mitf. However, unlike lef1 which leads to lighter pigmentation,
sox9 is upregulated during melanocyte differentiation and can be activated by UVB exposure
(Cheung and Briscoe 2003). Our dataset contains two differentially expressed transcripts that
annotated to sox9, one of which showed almost no expression in the Varadero population, and
consistently high expression in our two populations with the highest proportion of black skin
(Sauce and Huallaga), indicating that this gene may play a large role in R. imitator color pattern
determination. Further, sox9 is expressed in higher levels in darker color morphs of other frog
species (Stuckert et al., Chapter 4). Just as sox9 is expressed most intensely in the populations
with the most black skin, we see the same pattern in kit (KIT proto-oncogene receptor tyrosine
kinase), a membrane receptor that is involved in one of the earliest steps of the melanogenesis
pathway (D’Mello et al. 2016). Ultimately this path influences the same transcription factor as
sox9 (mitf), so these may be complementary genetic mechanisms that produce similar effects.
115
Iridophores and purines:
Iridophores are thought to play a primary role in blue coloration in amphibians, and to
play a critical role in the production of green colors in combination with overlying xanthophores
and the pigments they contain (Bagnara et al. 2007). Iridophores contain guanine crystal platelets
arranged in specific patterns; although fairly poorly characterized, the size, number, orientation
and distribution of these platelets determine the specific wavelengths of light reflected back to
viewers (Bagnara et al. 2007; Saenko et al. 2013). In fact, while iridophores are best known for
blue/green coloration, they are also responsible (in combination with xanthophores) for red and
white patches in Phelsuma geckos (Saenko et al. 2013). While melanophore and melanin
synthesis genes are comparatively well understood, the genes that control iridophore (and
xanthophore) development, and the size, shape, orientation and distribution of structural
elements such as the guanine platelets, are more poorly characterized.
The de novo synthesis of purines is likely an important characteristic of iridophores,
given that purines are deposited in the iridophores. Higdon et al. (2013) reported a number of
genes in this pathway which are differentially expressed in iridophores relative to other
chromatophores and body tissues. Amongst these are gart (phosphoribosylglycinamide
formyltransferase, phosphoribosylglycinamide synthetase, phosphoribosylaminoimidazole
synthetase) and paics (phosphoribosylaminoimidazole carboxylase and
phosphoribosylaminoimidazolesuccinocarboxamide synthase), which combined account for five
enzymatic steps in the purine synthesis pathway. Zebrafish with abnormal mutations in these
genes express almost no iridophore (or xanthophore) based pigmentation, indicating they play
important roles in production of the associated colors (Ng et al. 2009). Furthermore, these two
genes are differentially expressed between green and blue color morphs of the poison frog
116
Dendrobates auratus (Stuckert et al., Chapter 4). Expression in both gart and paics declines
during development, and paics expression approaches zero by the point of metamorphosis. An
additional gene in this pathway, pfas (phosphoribosylformylglycinamidine synthase) was
annotated to two transcripts in our dataset that were differentially expressed between
populations, indicating it likely plays a role in between population color differences. This gene
plays a key role in the purine synthesis pathway, catalyzing a step in the synthesis of inosine
monophosphate (Baresova et al. 2016). Furthermore, mthfd1 (methylenetetrahydrofolate
dehydrogenase, cyclohydrolase and formyltetrahydrofolate synthetase 1) is strongly
differentially expressed between populations. This gene also contributes to de novo purine
synthesis, and mutations can lead to insufficient purines for normal fetal development
(Christensen et al. 2013). Mutations in mthfd1 can influence melanophores and xanthophores, as
it plays a role in early neural crest differentiation as well (Christensen et al. 2013).
In addition to these genes, ADP ribosylation (ARFs) and Rab GTPases have been
hypothesized to play critical roles in the production of guanine platelets within iridophores
(Higdon et al. 2013). We had three transcripts that annotated to arfgap2 (ATP ribosylation factor
GTPase activating protein 2), which were differentially expressed over time, and 11 which
mapped to a rab gene. Further, arfgap1 was expressed in very low levels in the Varadero
population, much lower than the other populations. With the exception of blue reticulation of the
hind legs and in some individuals minimal blue creeping up on to the dorsum, we would not
expect any of the coloration in this morph to be iridophore-dependent. Somewhat counter to our
predictions, the atic (5-aminoimidazole-4-carboxamide ribonucleotide formyltransferase/IMP
cyclohydrolase) gene shows the lowest expression levels in the yellow-green Tarapoto morph.
Since green is generally produced by a combination of iridophores and pigments in the
117
xanthophores (Duellman and Trueb 1986; Bagnara et al. 2007), we would have thought that
genes in the purine synthesis pathway like atic would play more of a role.
While most research indicates that blue colors are produced by light scattering produced
by iridophores, there is also evidence that the collagen matrix itself may produce blue coloration
(reviewed in Bagnara et al., 2007). Although the role of collagen in amphibian coloration is
currently poorly understood, there is one example of collagen-produced blue coloration in
amphibians. Experimental skin grafts in the frog Pachymedusa dacnicolor were unable to
transfer the xanthophores and iridophores to the graft’s new host. However, the collagen matrix
remained, and the grafted skin patch possessed a distinct blue coloration (Bagnara et al., 2007).
As such, collagen matrix and keratinocyte genes may be more important than we recognize,
particularly in the production of blue coloration. In a similar vein, Stuckert et al. (Chapter 4)
discussed a number of putative collagen and keratinocyte genes that may influence blue
coloration in amphibians. We note that the keratin gene krt17 increases over time during
development, and that one of the two krt17 transcripts shows the lowest expression levels in the
Varadero population. In contrast, the other krt17 annotated transcript is most highly expressed in
the Varadero population. Currently, we have no satisfactory explanation for this. The keratin
gene krt35 is also differentially expressed between populations and shows the lowest expression
in the Varadero population.
Xanthophores and pteridine synthesis:
Xanthophores are the outermost layer of chromatophores in the skin, and are thought to
contribute to orange, red, yellow, and even green coloration in amphibians (Duellman and Trueb
1986). The xanthine hydrogenase gene (xdh) gene was differentially expressed between
118
populations in our study, although it was relatively highly expressed in general it showed lower
expression in Varadero tadpoles. This gene is involved in the production of the pigment
pteridine, which is deposited into the xanthophores and absorbs yellow light. Previous work has
demonstrated that deficiencies in the xdh gene or the removal of the pteridine product from the
skin can change skin coloration from green to blue (Frost 1978; Frost and Bagnara 1979;
Bagnara et al. 2007). Furthermore, transcriptomic work examining the genes which contribute to
different colors in amphibians has proposed that xdh is a key determinant in skin color,
particularly yellows and greens (Sanchez et al., 2018; Stuckert et al, in prep). We note that xdh is
expressed in the highest levels in the two populations with the greatest overall proportion of skin
which should possess xanthophores (Varadero and Tarapoto), thus providing further (indirect)
evidence that xdh plays an important role in amphibian skin coloration. Other pteridine-related
genes are likely to play a role as well. For example, quinoid dihydropteridine reductase (qdpr) is
involved in this pathway as well, and we found that this gene was also differentially expressed
across populations in another species of poison frog (Stuckert et al., Chapter 4), and showed the
highest expression levels in the red, orange, and yellow morphs. Qdpr also shows increasing
expression throughout development in our study. Sepiapterin reductase (spr) is expressed
primarily in the xanthophores (Negishi et al. 2003) and has been shown to only be expressed in
late stages of the fire salamander tadpoles when yellowish color begins to appear (Sanchez et al.
2018). However, although this gene was differentially expressed between populations in our
study, it was largely constitutively expressed across time and populations. This may be in part
because of its important role in the synthesis of neurotransmitters (Kaurman and Fisher 1974).
Atpif was not expressed in Varadero tadpoles, but was in the other color morphs.
119
Conclusions:
The genomics of adaptive radiations are of interest because of the obvious selection
imposed on phenotypes in these radiations. Further, both the specific mechanisms of color
production and their genomic architecture have been poorly characterized in many groups of
animals, particularly amphibians. We have produced a high-quality transcriptome for the
polytypic poison frog Ranitomeya imitator which underwent a rapid mimetic radiation, and we
used this transcriptome to characterize color gene expression patterns across color morphs and
throughout development. We found a number of candidate color genes to be differentially
expressed over the course of development and between populations with divergent color pattern
phenotypes, particularly those associated with melanogenesis. We also identified a number of
iridophore and xanthophore-related genes likely to affect the differences between color morphs
in this study. These data will provide both genomic resources for future studies of the
development and the production of color and can inspire future investigations into the specific
impacts that these genes have across other taxa.
Acknowledgements:
Animal use and research comply with East Carolina University’s IACUC (AUP #D281).
Funding for this project was provided by NSF DEB 165536 and an East Carolina University
Thomas Harriot College of Arts and Sciences Advancement Council Distinguished Professorship
to K Summers. We are grateful to many individuals for their help with frog husbandry in the lab,
including but not limited to M Yoshioka, C Meeks, A Sorokin, K Weinfurther, R Sen, N
Davison, M Johnson, M Pahl, N Aramburu. We are also grateful to Laura Bauza-Davila for her

120
work doing RNA extractions, and Andrew Lang for guidance converting RNA to cDNA and
preparing samples for sequencing.
121
Literature Cited:
Bagnara, J. T., P. J. Fernandez, and R. Fujii. 2007. On the blue coloration of vertebrates. Pigment
Cell Res. 20:14–26.
Bankevich, A., S. Nurk, D. Antipov, A. A. Gurevich, M. Dvorkin, A. S. Kulikov, V. M. Lesin, S.
I. Nikolenko, S. Pham, A. D. Prjibelski, A. V. Pyshkin, A. V. Sirotkin, N. Vyahhi, G.
Tesler, M. A. Alekseyev, and P. A. Pevzner. 2012. SPAdes: A new genome assembly
algorithm and its applications to single-cell sequencing. J. Comput. Biol. 19:455–477.
Baresova, V., M. Krijt, V. Skopova, O. Souckova, S. Kmoch, and M. Zikanova. 2016. CRISPR-
Cas9 induced mutations along de novo purine synthesis in HeLa cells result in accumulation
of individual enzyme substrates and affect purinosome formation. Mol. Genet. Metab.
119:270–277. Elsevier Inc.
Basu Mallick, C., F. M. Iliescu, M. Möls, S. Hill, R. Tamang, G. Chaubey, R. Goto, S. Y. W.
Ho, I. Gallego Romero, F. Crivellaro, G. Hudjashov, N. Rai, M. Metspalu, C. G. N. Mascie-
Taylor, R. Pitchappan, L. Singh, M. Mirazon-Lahr, K. Thangaraj, R. Villems, and T.
Kivisild. 2013. The Light Skin Allele of SLC24A5 in South Asians and Europeans Shares
Identity by Descent. PLoS Genet. 9.
Bateman, A., M. J. Martin, C. O’Donovan, M. Magrane, E. Alpi, R. Antunes, B. Bely, M.
Bingley, C. Bonilla, R. Britto, B. Bursteinas, H. Bye-AJee, A. Cowley, A. Da Silva, M. De
Giorgi, T. Dogan, F. Fazzini, L. G. Castro, L. Figueira, P. Garmiri, G. Georghiou, D.
Gonzalez, E. Hatton-Ellis, W. Li, W. Liu, R. Lopez, J. Luo, Y. Lussi, A. MacDougall, A.
Nightingale, B. Palka, K. Pichler, D. Poggioli, S. Pundir, L. Pureza, G. Qi, S. Rosanoff, R.
Saidi, T. Sawford, A. Shypitsyna, E. Speretta, E. Turner, N. Tyagi, V. Volynkin, T.
122
Wardell, K. Warner, X. Watkins, R. Zaru, H. Zellner, I. Xenarios, L. Bougueleret, A.
Bridge, S. Poux, N. Redaschi, L. Aimo, G. ArgoudPuy, A. Auchincloss, K. Axelsen, P.
Bansal, D. Baratin, M. C. Blatter, B. Boeckmann, J. Bolleman, E. Boutet, L. Breuza, C.
Casal-Casas, E. De Castro, E. Coudert, B. Cuche, M. Doche, D. Dornevil, S. Duvaud, A.
Estreicher, L. Famiglietti, M. Feuermann, E. Gasteiger, S. Gehant, V. Gerritsen, A. Gos, N.
Gruaz-Gumowski, U. Hinz, C. Hulo, F. Jungo, G. Keller, V. Lara, P. Lemercier, D.
Lieberherr, T. Lombardot, X. Martin, P. Masson, A. Morgat, T. Neto, N. Nouspikel, S.
Paesano, I. Pedruzzi, S. Pilbout, M. Pozzato, M. Pruess, C. Rivoire, B. Roechert, M.
Schneider, C. Sigrist, K. Sonesson, S. Staehli, A. Stutz, S. Sundaram, M. Tognolli, L.
Verbregue, A. L. Veuthey, C. H. Wu, C. N. Arighi, L. Arminski, C. Chen, Y. Chen, J. S.
Garavelli, H. Huang, K. Laiho, P. McGarvey, D. A. Natale, K. Ross, C. R. Vinayaka, Q.
Wang, Y. Wang, L. S. Yeh, and J. Zhang. 2017. UniProt: The universal protein
knowledgebase. Nucleic Acids Res. 45:D158–D169. Oxford University Press.
Bolger, A. M., M. Lohse, and B. Usadel. 2014. Trimmomatic: A flexible trimmer for Illumina
sequence data. Bioinformatics 30:2114–2120.
Bray, N. L., H. Pimentel, P. Melsted, and L. Pachter. 2016. Near-optimal probabilistic RNA-seq
quantification. Nat. Biotechnol. 34:525–527.
Brown, J. L., V. Morales, and K. Summers. 2008. Divergence in parental care, habitat selection
and larval life history between two species of Peruvian poison frogs: an experimental
analysis. J. Evol. Biol. 21:1534–43.
Buchfink, B., C. Xie, and D. H. Huson. 2015. Fast and sensitive protein alignment using
DIAMOND. Nat. Methods 12:59–60.
123
Cheung, M., and J. Briscoe. 2003. Neural crest development is regulated by the transcription
factor Sox9. Development 130:5681–5693.
Christensen, K. E., L. Deng, K. Y. Leung, E. Arning, T. Bottiglieri, O. V. Malysheva, M. A.
Caudill, N. I. Krupenko, N. D. Greene, L. Jerome-Majewska, R. E. MacKenzie, and R.
Rozen. 2013. A novel mouse model for genetic variation in 10-formyltetrahydrofolate
synthetase exhibits disturbed purine synthesis with impacts on pregnancy and embryonic
development. Hum. Mol. Genet. 22:3705–3719.
Coordinators, N. R. 2016. Database resources of the National Center for Biotechnology
Information. Nucleic Acids Res. 44:7–19.
D’Mello, S. A. N., G. J. Finlay, B. C. Baguley, and M. E. Askarian-Amiri. 2016. Signaling
pathways in melanogenesis. Int. J. Mol. Sci. 17:1–18.
Duellman, W. E., and L. Trueb. 1986. Biology of Amphibians. The John Hopkins University
Press, Baltimore.
DuShane, G. P. 1935. An experimental study of the origin of pigment cells in Amphibia. J. Exp.
Zool. 72:1–31.
Frost, S. K. 1978. Developmental aspects of pigmentation in the Mexican leaf frog,
Pachymedusa dacnicolor.
Frost, S. K., and J. T. Bagnara. 1979. Allopurinol-Induced Melanism In The Tiger Salamander
(Ambystoma iigrinum nebulosum). J. Exp. Zool. 209:455–465.
Gillespie, R. 2004. Community Assembly Through Adaptive Radiation in Hawaiian Spiders.
Science (80-. ). 303:356–359.
124
Gosner, K. L. 1960. A simplified table for staging anuran embryos and larvae with notes on
identification. Herpetologica 16:183–190.
Grabherr, M. G., B. J. Haas, M. Yassour, J. Z. Levin, D. A. Thompson, I. Amit, X. Adiconis, L.
Fan, R. Raychowdhury, Q. Zeng, Z. Chen, E. Mauceli, N. Hacohen, A. Gnirke, N. Rhind, F.
Di Palma, B. W. Birren, C. Nusbaum, K. Lindblad-Toh, N. Friedman, and A. Regev. 2011.
Full-length transcriptome assembly from RNA-Seq data without a reference genome. Nat.
Biotechnol. 29:644–652.
Hammond, S. A., R. L. Warren, B. P. Vandervalk, E. Kucuk, H. Khan, E. A. Gibb, P. Pandoh, H.
Kirk, Y. Zhao, M. Jones, A. J. Mungall, R. Coope, S. Pleasance, R. A. Moore, R. A. Holt, J.
M. Round, S. Ohora, B. V. Walle, N. Veldhoen, C. C. Helbing, and I. Birol. 2017. The
North American bullfrog draft genome provides insight into hormonal regulation of long
noncoding RNA. Nat. Commun. 8:1–8. Springer US.
Hegna, R. H., O. Nokelainen, J. R. Hegna, and J. Mappes. 2013. To quiver or to shiver:
increased melanization benefits thermoregulation, but reduces warning signal efficacy in the
wood tiger moth. Proc. R. Soc. B Biol. Sci. 280:20122812–20122812.
Hegna, R. H., R. A. Saporito, K. G. Gerow, and M. A. Donnelly. 2011. Contrasting colors of an
aposematic poison frog do not affect predation. Ann. Zool. Fennici 48:29–38.
Hensel, J. L. J., and E. D. J. Brodie. 1976. An experimental study of aposematic coloration in the
salamander Plethodon jordani. Copeia 59–65.
Higdon, C. W., R. D. Mitra, and S. L. Johnson. 2013. Gene expression analysis of zebrafish
melanocytes, iridophores, and retinal pigmented epithelium reveals indicators of biological
125
function and developmental origin. PLoS One 8:e67801.
Joron, M., and J. L. B. Mallet. 1998. Diversity in mimicry: Paradox or paradigm?
Kannan, S., J. Hui, and K. Mazooji. 2016. Shannon: An information-optimal de novo RNA-Seq
assembler. 1–14.
Kaurman, S., and B. Fisher. 1974. Pterin-requiring aromatic amino acidhydroxylase. Pp. 285–
369 in Molecular Mechanism of Oxygen Activation.
Kronforst, M. R., and R. Papa. 2015. The functional basis of wing patterning in Heliconius
butterflies: The molecules behind mimicry. Genetics 200:1–19.
Kunte, K., W. Zhang, A. Tenger-Trolander, D. H. Palmer, A. Martin, R. D. Reed, S. P. Mullen,
and M. R. Kronforst. 2014. doublesex is a mimicry supergene. Nature 507:229–232.
Lamason, R. L., M. P. K. Mohideen, J. R. Mest, A. C. Wong, H. L. Norton, M. C. Aros, M. J.
Jurynec, X. Mao, V. R. Humphreville, J. E. Humbert, S. Sinha, J. L. Moore, P.
Jagadeeswaran, W. Zhao, G. Ning, I. Makalowska, P. M. Mckeigue, D. O. Donnell, R.
Kittles, E. J. Parra, N. J. Mangini, D. J. Grunwald, M. D. Shriver, V. A. Canfield, and K. C.
Cheng. 2005. SLC24A5, a Putative Cation Exchanger, Affects Pigmentation in Zebrafish
and Humans. Science (80-. ). 310:1782–1787.
Lister, J., C. Robertson, T. Lepage, S. Johnson, and D. Raible. 1999. Nacre Encodes a Zebrafish
Microphthalmia-Related Protein That Regulates Neural-Crest-Derived Pigment Cell Fate.
Development 126:3757–3767.
MacManes, M. D. 2014. On the optimal trimming of high-throughput mRNA sequence data.
Front. Genet. 5:1–7.
126
MacManes, M. D. 2017. The Oyster River Protocol: A multi assembler and kmer approach for
de novo transcriptome assembly. Doi.Org 177253.
Mallet, J., and N. H. Barton. 1989. Strong natural selection in a warning-color hybrid zone.
Evolution (N. Y). 43:421–431.
Marek, P. E., and J. E. Bond. 2009. A Müllerian mimicry ring in Appalachian millipedes. Proc.
Natl. Acad. Sci. U. S. A. 106:9755–60.
Martin, A., R. Papa, N. J. Nadeau, R. I. Hill, B. A. Counterman, G. Halder, C. D. Jiggins, M. R.
Kronforst, A. D. Long, W. O. McMillan, and R. D. Reed. 2012. Diversification of complex
butterfly wing patterns by repeated regulatory evolution of a Wnt ligand. Proc. Natl. Acad.
Sci. 109:12632–12637.
Mi, H., X. Huang, A. Muruganujan, H. Tang, C. Mills, D. Kang, and P. D. Thomas. 2017.
PANTHER version 11: Expanded annotation data from Gene Ontology and Reactome
pathways, and data analysis tool enhancements. Nucleic Acids Res. 45:D183–D189.
Murisier, F., and F. Beermann. 2006. Genetics of pigment cells: Lessons from the tyrosinase
gene family. Histol. Histopathol. 21:567–578.
Negishi, S., K. Fujimoto, and S. Katoh. 2003. Localization of sepiapterin reductase in pigment
cells of Oryzias latipes. Pigment Cell Res. 16:501–503.
Ng, A., R. A. Uribe, L. Yieh, R. Nuckels, and J. M. Gross. 2009. Zebrafish mutations in gart and
paics identify crucial roles for de novo purine synthesis in vertebrate pigmentation and
ocular development. Development 136:2601–2611.
Nishikawa, H., T. Iijima, R. Kajitani, J. Yamaguchi, T. Ando, Y. Suzuki, S. Sugano, A.
127
Fujiyama, S. Kosugi, H. Hirakawa, S. Tabata, K. Ozaki, H. Morimoto, K. Ihara, M. Obara,
H. Hori, T. Itoh, and H. Fujiwara. 2015. A genetic mechanism for female-limited Batesian
mimicry in Papilio butterfly. Nat. Genet. 47:405–409. Nature Publishing Group.
Nokelainen, O., R. H. Hegna, J. H. Reudler, C. Lindstedt, and J. Mappes. 2012. Trade-off
between warning signal efficacy and mating success in the wood tiger moth. Proc. Biol. Sci.
279:257–65.
Nosil, P., and B. J. Crespi. 2006. Experimental evidence that predation promotes divergence in
adaptive radiation. Proc. Natl. Acad. Sci. 103:9090–9095.
Paluh, D. J., M. M. Hantak, and R. A. Saporito. 2014. A test of aposematism in the dendrobatid
poison frog Oophaga pumilio: The importance of movement in clay model experiments. J.
Herpetol. 48:249–254.
Park, H. Y., M. Kosmadaki, M. Yaar, and B. A. Gilchrest. 2009. Cellular mechanisms regulating
human melanogenesis. Cell. Mol. Life Sci. 66:1493–1506.
Pimentel, H., N. L. Bray, S. Puente, P. Melsted, and L. Pachter. 2017. Differential analysis of
RNA-seq incorporating quantification uncertainty. Nat. Methods 14:687–690.
Reed, R. D., R. Papa, A. Martin, H. M. Hines, M. R. Kronforst, R. Chen, G. Halder, H. F.
Nijhout, and W. O. Mcmillan. 2011. optix drives the repeated convergent evolution of
butterfly wing pattern mimicry. Science (80-. ). 333:1137–1141.
Rudh, A., and A. Qvarnström. 2013. Adaptive colouration in amphibians. Semin. Cell Dev. Biol.
24:553–561. Elsevier Ltd.
Ruxton, G. D., T. N. Sherratt, and M. P. Speed. 2004. Avoiding attack: The evolutionary ecology
128
of crypsis, warning signals and mimicry.
Saenko, S. V., J. Teyssier, D. van der Marel, and M. C. Milinkovitch. 2013. Precise
colocalization of interacting structural and pigmentary elements generates extensive color
pattern variation in Phelsuma lizards. BMC Biol. 11:105.
Sanchez, E., E. Küpfer, D. J. Goedbloed, A. W. Nolte, T. Lüddecke, S. Schulz, M. Vences, and
S. Steinfartz. 2018. Morphological and transcriptomic analyses reveal three discrete primary
stages of postembryonic development in the common fire salamander, Salamandra
salamandra. J. Exp. Zool. Part B Mol. Dev. Evol. 330:96–108.
Schluter, D. 1995. Adaptive radiation in sticklebacks: Trade-offs in feeding performance and
growth. Ecology 76:82–90.
Seehausen, O. 2006. African cichlid fish: a model system in adaptive radiation research. Proc.
Biol. Sci. 273:1987–1998.
Sherratt, T. N. 2006. Spatial mosaic formation through frequency-dependent selection in
M??llerian mimicry complexes. J. Theor. Biol. 240:165–174.
Simão, F. A., R. M. Waterhouse, P. Ioannidis, E. V. Kriventseva, and E. M. Zdobnov. 2015.
BUSCO: Assessing genome assembly and annotation completeness with single-copy
orthologs. Bioinformatics 31:3210–3212.
Sköld, H. N., S. Aspengren, K. L. Cheney, and M. Wallin. 2016. Fish Chromatophores-From
Molecular Motors to Animal Behavior. Int. Rev. Cell Mol. Biol. 321:171–219. Elsevier Inc.
Smith-Unna, R., C. Boursnell, R. Patro, J. M. Hibberd, and S. Kelly. 2016. TransRate:
Reference-free quality assessment of de novo transcriptome assemblies. Genome Res.
129
26:1134–1144.
Song, L., and L. Florea. 2015. Rcorrector: efficient and accurate error correction for Illumina
RNA-seq reads. Gigascience 4:48. GigaScience.
Song, X., C. Xu, Z. Liu, Z. Yue, L. Liu, T. Yang, B. Cong, and F. Yang. 2017. Comparative
transcriptome analysis of mink (Neovison vison) skin reveals the key genes involved in the
melanogenesis of black and white coat colour. Sci. Rep. 7:1–11. Springer US.
Stuckert, A. M. M., R. A. Saporito, P. J. Venegas, and K. Summers. 2014a. Alkaloid defenses of
co-mimics in a putative Müllerian mimetic radiation. BMC Evol. Biol. 14:1–8.
Stuckert, A. M. M., P. J. Venegas, and K. Summers. 2014b. Experimental evidence for predator
learning and Mullerian mimicry in Peruvian poison frogs (Ranitomeya, Dendrobatidae).
Evol. Ecol. 28:413–426.
Sun, Y.-B., Z.-J. Xiong, X.-Y. Xiang, S.-P. Liu, W.-W. Zhou, X.-L. Tu, L. Zhong, L. Wang, D.-
D. Wu, B.-L. Zhang, C.-L. Zhu, M.-M. Yang, H.-M. Chen, F. Li, L. Zhou, S.-H. Feng, C.
Huang, G.-J. Zhang, D. Irwin, D. M. Hillis, R. W. Murphy, H.-M. Yang, J. Che, J. Wang,
and Y.-P. Zhang. 2015. Whole-genome sequence of the Tibetan frog Nanorana parkeri and
the comparative evolution of tetrapod genomes. Proc. Natl. Acad. Sci. 112:E1257–E1262.
Supple, M. a, H. M. Hines, K. K. Dasmahapatra, J. J. Lewis, D. M. Nielsen, C. Lavoie, D. a Ray,
C. Salazar, W. O. Mcmillan, and B. a Counterman. 2013. Genomic architecture of adaptive
color pattern divergence and convergence in Heliconius butterflies. Genome Res. 23:1248–
1257.
Symula, R., R. Schulte, and K. Summers. 2001. Molecular phylogenetic evidence for a mimetic
130
radiation in Peruvian poison frogs supports a Müllerian mimicry hypothesis. Proc. R. Soc. B
Biol. Sci. 268:2415–21.
Symula, R., R. Schulte, and K. Summers. 2003. Molecular systematics and phylogeography of
Amazonian poison frogs of the genus Dendrobates. Mol. Phylogenet. Evol. 26:452–475.
Team, R. C. 2017. R Development Core Team.
Vestergaard, J. S., E. Twomey, R. Larsen, K. Summers, and R. Nielsen. 2015. Number of genes
controlling a quantitative trait in a hybrid zone of the aposematic frog Ranitomeya imitator.
Proc. R. Soc. B 282:20141950.
Videira, I. F. D. S., D. F. L. Moura, and S. Magina. 2013. Mechanisms regulating
melanogenesis. An. Bras. Dermatol. 88:76–83.
Wilson, J. S., J. P. Jahner, M. L. Forister, E. S. Sheehan, K. A. Williams, and J. P. Pitts. 2015.
North American velvet ants form one of the world’s largest known Müllerian mimicry
complexes. Curr. Biol. 25:R704–R706. Elsevier.
Wolnicka-Glubisz, A., A. Pecio, D. Podkowa, L. M. Kolodziejczyk, and P. M. Plonka. 2012.
Pheomelanin in the skin of Hymenochirus boettgeri (Amphibia: Anura: Pipidae). Exp.
Dermatol. 21:537–540.
VI. CONCLUSION
Signal communication is pervasive in nature and is used to convey information to both
conspecifics and heterospecifics. Aposematic species use warning signals (e.g. bright coloration)
to alert predators to the presence of a secondary defense (e.g., spines, toxins, etc). The presence
of a conspicuous signal in combination with a secondary defense is thought to increase the
efficiency of learned avoidance by predators and may prevent attacks altogether. Aposematism is
widespread both geographically and taxonomically, and aposematic species are seen across the
tree of life (including nudibranchs, invertebrates, and vertebrates). There are three main
requirements for aposematism to function effectively. First, aposematic species must be able to
produce a pattern that contrasts the environmental background (typically via chromatophores and
pigments). Second, predators must be able to receive and learn to avoid preying upon aposematic
individuals based on the signal. And finally, aposematism must confer a fitness benefit to the
population of an aposematic species. In this dissertation, I asked a series of questions regarding
aposematism. These questions were:
1. Does the aposematic signal contain sufficient visual information to convey the level of
toxicity?
2. Can nonvisual predators use olfactory signals or cues to make informed decisions about
preying upon aposematic species.
3. How is the aposematic signal produced, specifically how does gene expression contribute
to the production of different color morphs of aposematic species?
4. What genes contribute to the production of different color morphs in another aposematic
species, and what are their temporal pattern of expression?
132
Overall, I found that within a population of the poison frog Ranitomeya imitator, the visual
signal contains enough information to convey that the frog is toxic, but not enough to indicate
the frog’s overall level of chemical defense to predators (i.e., qualitative honesty of the
aposematic signal, but not quantitative honesty). Further, I found that there is enough olfactory
information conveyed to predators to make an informed decision regarding predation. However,
I was unable to determine whether this is an evolved signal, or a byproduct of the chemical
defense itself.
I then investigated how gene expression between color morphs contributes to the production
of coloration in a polytypic species (Dendrobates auratus). I identified a number of genes related
to melanophores/melanogenesis and iridophores/guanine synthesis which are differentially
expressed. Given that the color morphs in this study have different background colorations
(black, brown, or gray), and green or blue pattern elements standing out from that background,
these genes seem like very plausible candidates for producing these colors. Further, I then
examined the expression of color genes between color morphs of a different polytypic species
(Ranitomeya imitator), while also looking at their expression patterns throughout development.
As expected, I identified differentially expressed genes over time or between populations that
contribute to the production of melanophores, iridophores, and xanthophores. These genes
should be viewed as candidates for production of color in this species.
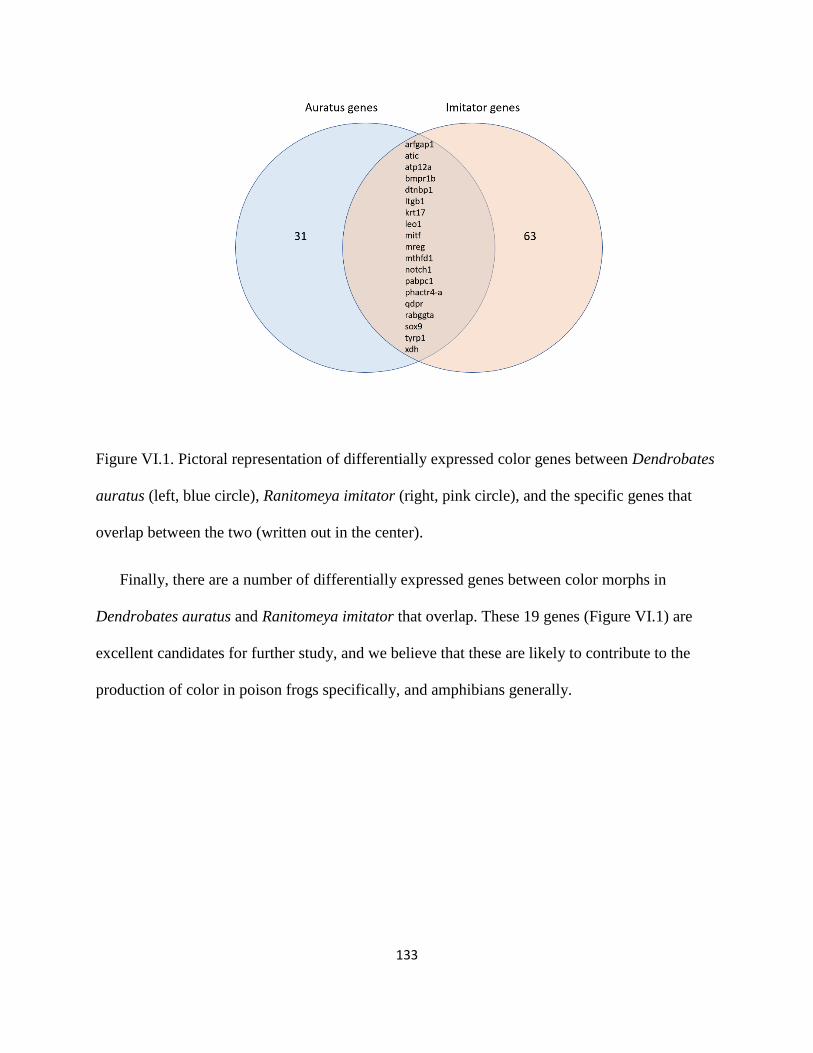
133
Figure VI.1. Pictoral representation of differentially expressed color genes between Dendrobates
auratus (left, blue circle), Ranitomeya imitator (right, pink circle), and the specific genes that
overlap between the two (written out in the center).
Finally, there are a number of differentially expressed genes between color morphs in
Dendrobates auratus and Ranitomeya imitator that overlap. These 19 genes (Figure VI.1) are
excellent candidates for further study, and we believe that these are likely to contribute to the
production of color in poison frogs specifically, and amphibians generally.

APPENDIX: INSTITUTIONAL APPROVAL

135
136

137

138

139
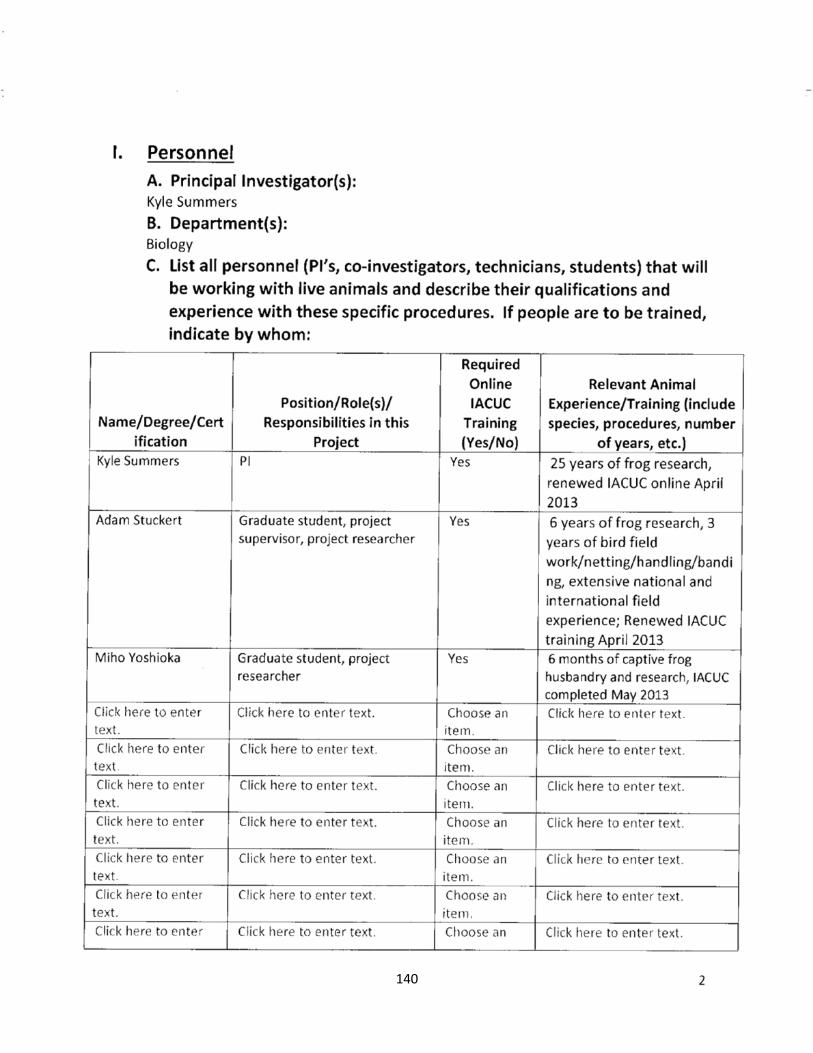
140

Related Documents