Shristi Infrastructure Development Corporation Ltd DPSC Building ,1st Floor, Sector-V, Plot-X, 1, 2 & 3, Block-EP, Salt Lake, Kolkata

Welcome message from author
This document is posted to help you gain knowledge. Please leave a comment to let me know what you think about it! Share it to your friends and learn new things together.
Transcript

Shristi Infrastructure Development Corporation Ltd DPSC Building ,1st Floor, Sector-V, Plot-X, 1, 2 & 3, Block-EP, Salt Lake, Kolkata
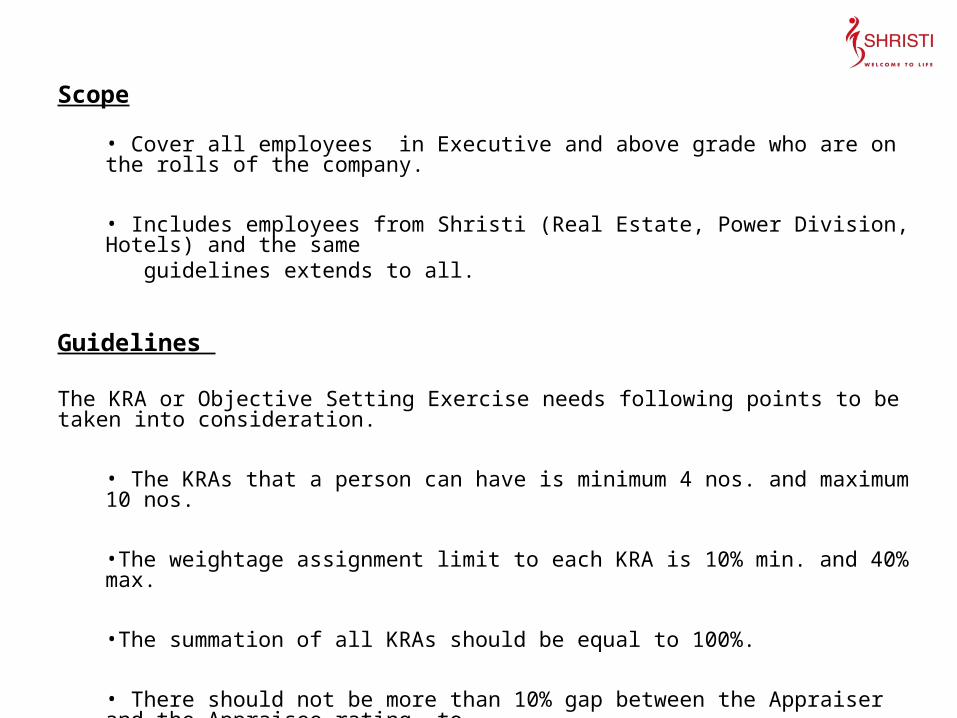
Scope
• Cover all employees in Executive and above grade who are on the rolls of the company.
• Includes employees from Shristi (Real Estate, Power Division, Hotels) and the same guidelines extends to all.
Guidelines
The KRA or Objective Setting Exercise needs following points to be taken into consideration.
• The KRAs that a person can have is minimum 4 nos. and maximum 10 nos.
•The weightage assignment limit to each KRA is 10% min. and 40% max.
•The summation of all KRAs should be equal to 100%.
• There should not be more than 10% gap between the Appraiser and the Appraisee rating, to avoid biasness.
•Reviewer remarks should be compulsory in the PMS form
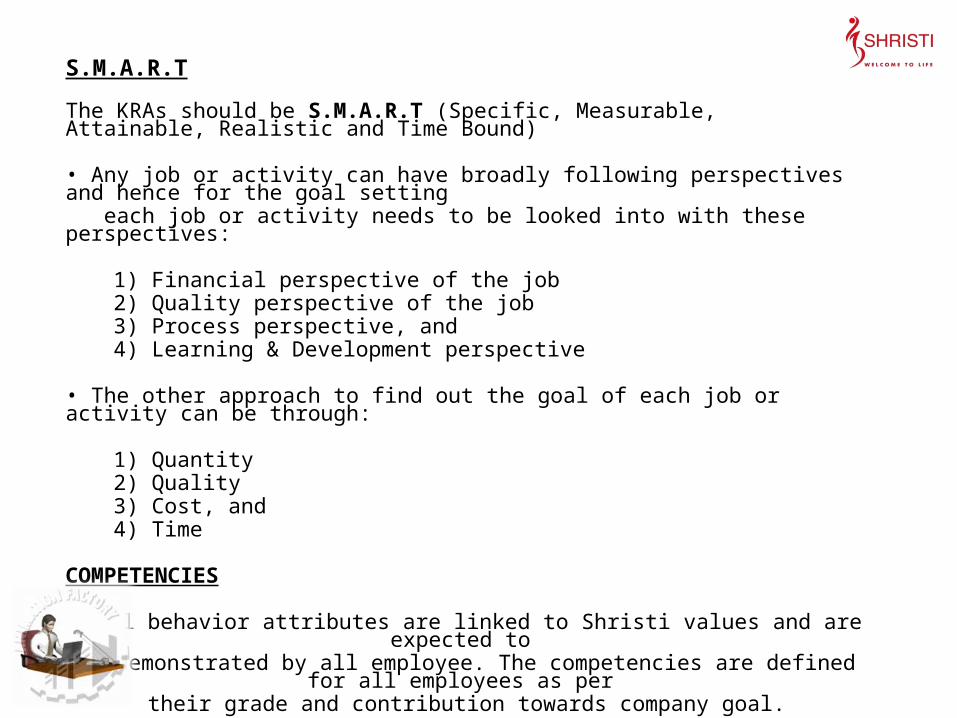
S.M.A.R.T
The KRAs should be S.M.A.R.T (Specific, Measurable, Attainable, Realistic and Time Bound)
• Any job or activity can have broadly following perspectives and hence for the goal setting each job or activity needs to be looked into with these perspectives:
1) Financial perspective of the job 2) Quality perspective of the job 3) Process perspective, and 4) Learning & Development perspective
• The other approach to find out the goal of each job or activity can be through:
1) Quantity 2) Quality 3) Cost, and 4) Time
COMPETENCIES
Ideal behavior attributes are linked to Shristi values and are expected to be demonstrated by all employee. The competencies are defined for all employees as per
their grade and contribution towards company goal.
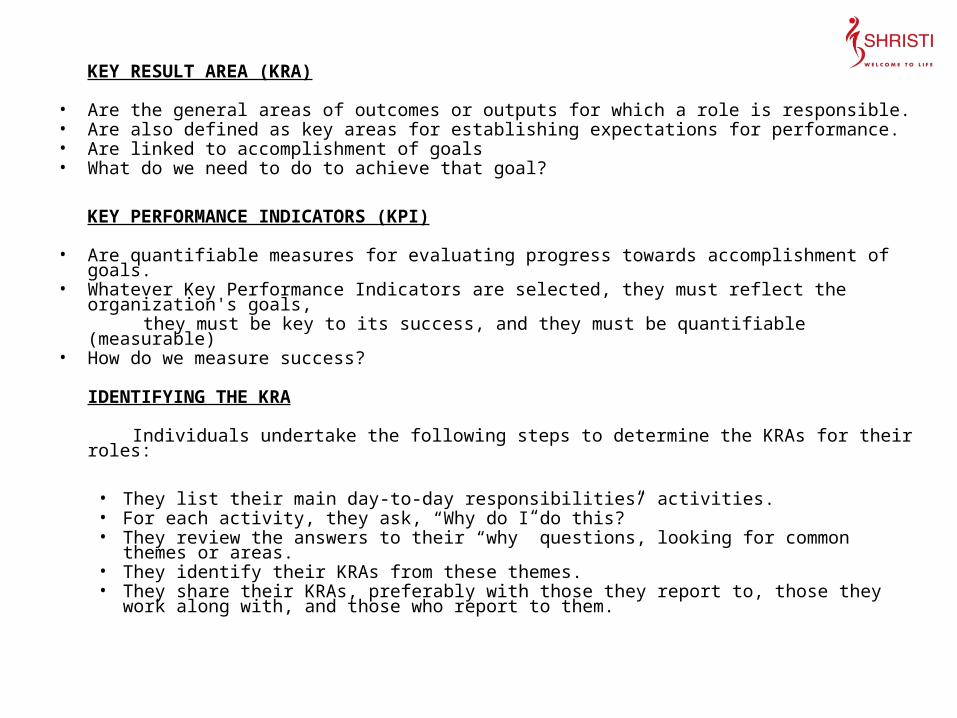
KEY RESULT AREA (KRA)
• Are the general areas of outcomes or outputs for which a role is responsible.• Are also defined as key areas for establishing expectations for performance.• Are linked to accomplishment of goals• What do we need to do to achieve that goal?
KEY PERFORMANCE INDICATORS (KPI)
• Are quantifiable measures for evaluating progress towards accomplishment of goals.• Whatever Key Performance Indicators are selected, they must reflect the organization's goals, they must be key to its success, and they must be quantifiable (measurable)• How do we measure success?
IDENTIFYING THE KRA
Individuals undertake the following steps to determine the KRAs for their roles:
• They list their main day-to-day responsibilities/ activities.• For each activity, they ask, “Why do I do this?”• They review the answers to their “why” questions, looking for common themes or areas.• They identify their KRAs from these themes.• They share their KRAs, preferably with those they report to, those they work along with,
and those who report to them.
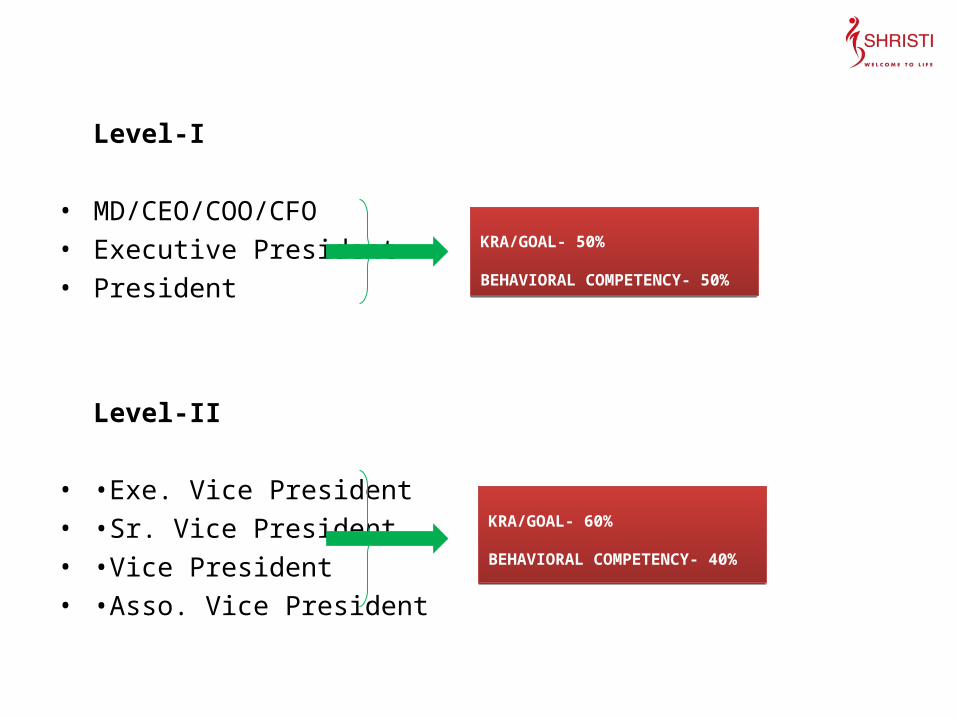
Level-I
• MD/CEO/COO/CFO• Executive President• President
Level-II
• •Exe. Vice President• •Sr. Vice President• •Vice President• •Asso. Vice President
KRA/GOAL- 50%
BEHAVIORAL COMPETENCY- 50%
KRA/GOAL- 50%
BEHAVIORAL COMPETENCY- 50%
KRA/GOAL- 60%
BEHAVIORAL COMPETENCY- 40%
KRA/GOAL- 60%
BEHAVIORAL COMPETENCY- 40%

Level-III
• Sr. GM• General Manager• Sr. DGM• D.G.M.• A.G.M.
Level-IV
• Sr. Manager• Manager
KRA/GOAL- 70%
BEHAVIORAL COMPETENCY- 30%
KRA/GOAL- 70%
BEHAVIORAL COMPETENCY- 30%
KRA/GOAL- 75%
BEHAVIORAL COMPETENCY- 25%
KRA/GOAL- 75%
BEHAVIORAL COMPETENCY- 25%
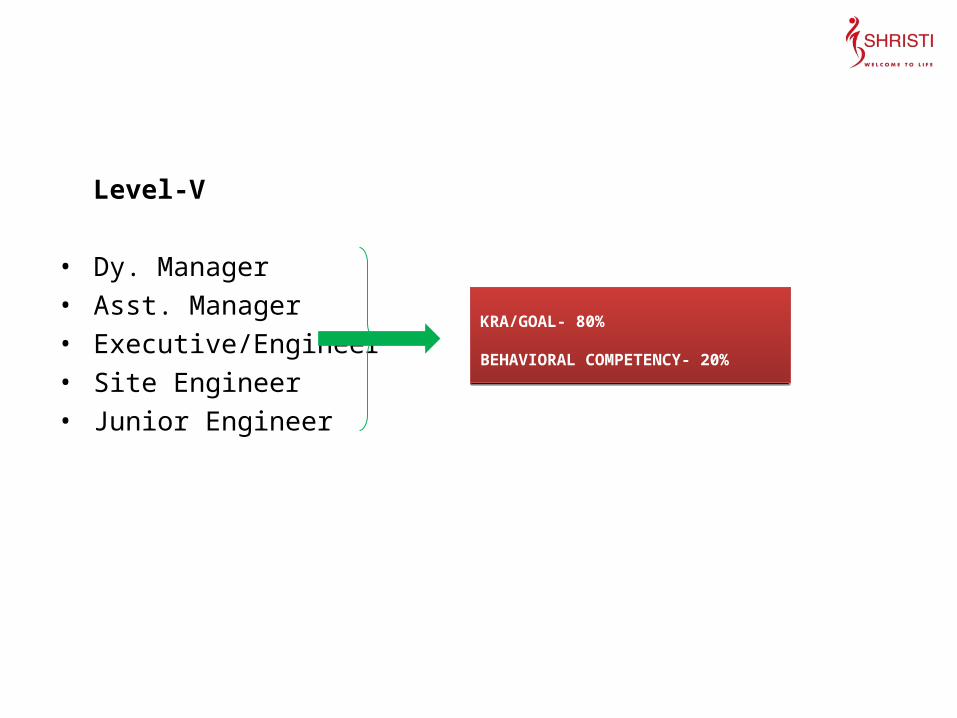
Level-V
• Dy. Manager• Asst. Manager• Executive/Engineer• Site Engineer• Junior Engineer
KRA/GOAL- 80%
BEHAVIORAL COMPETENCY- 20%
KRA/GOAL- 80%
BEHAVIORAL COMPETENCY- 20%

Goals Weightage Self Rating
Out of 5
Appraiser Rating
Out of 5
Weighted Score
Avg.of Both the rating* Weightage Score
Goal-1 10% 5 5 5 x 0.1= 0.5
Goal-2 40% 4 4 4 x 0.4 = 1.6
Goal-3 10% 5 4 4.5 x 0.1 = 0.45
Goal-4 15% 3 3 3 x 0.15 = 0.45
Goal-5 15% 4 5 4.5 x 0.15 = 0.67
Goal-6 10% 4 5 4.5 x 0.1 = 0.45
Total 100% 4.12
Step-1

Goals Self Rating
Out of 5
Appraiser Rating
Out of 5
Weighted Score
Avg.of Both the rating
BC-1 5 5 5
BC-2 4 4 4
BC-3 5 4 4.5
BC-4 4 5 4.5
BC-5 5 5 5
BC-6 3 4 3.5
BC-7 4 4 4
BC-8 5 3 4
BC-9 4 5 4.5
Total Avg. Rating 4.3
Step-2
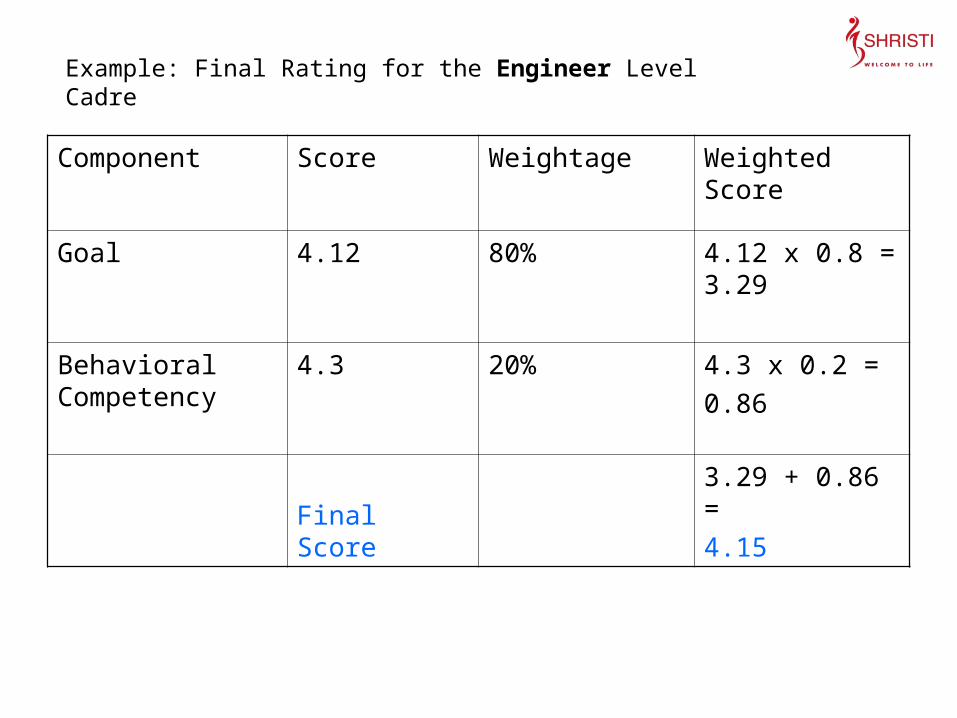
Component Score Weightage Weighted Score
Goal 4.12 80% 4.12 x 0.8 = 3.29
Behavioral Competency
4.3 20% 4.3 x 0.2 =
0.86
Final Score
3.29 + 0.86 =
4.15
Example: Final Rating for the Engineer Level Cadre
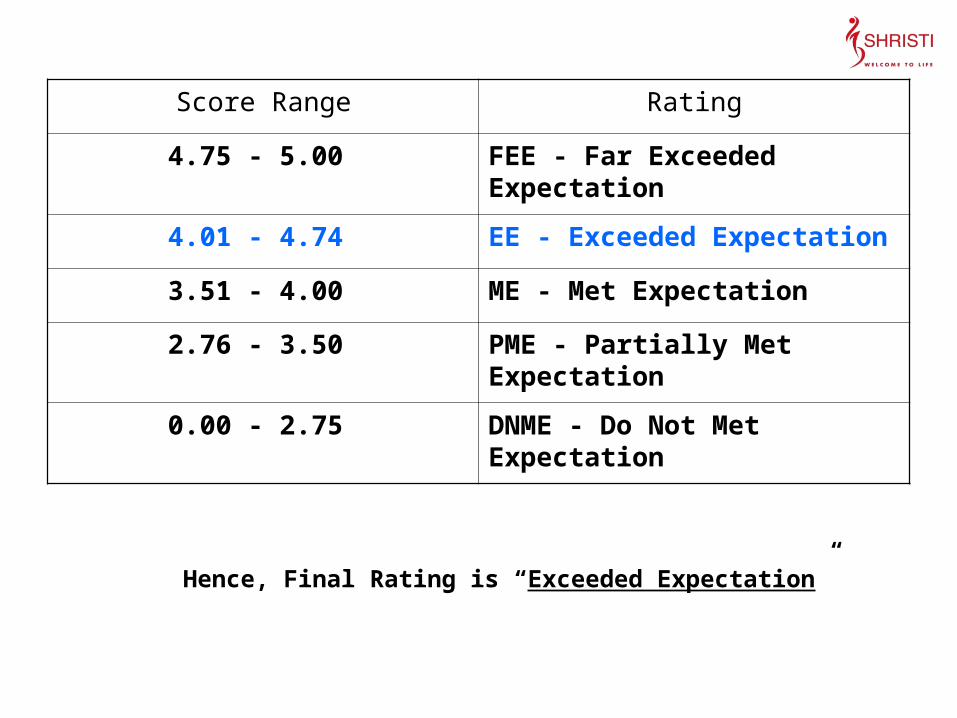
Score Range Rating
4.75 - 5.00 FEE - Far Exceeded Expectation
4.01 - 4.74 EE - Exceeded Expectation
3.51 - 4.00 ME - Met Expectation
2.76 - 3.50 PME - Partially Met Expectation
0.00 - 2.75 DNME - Do Not Met Expectation
Hence, Final Rating is “Exceeded Expectation”
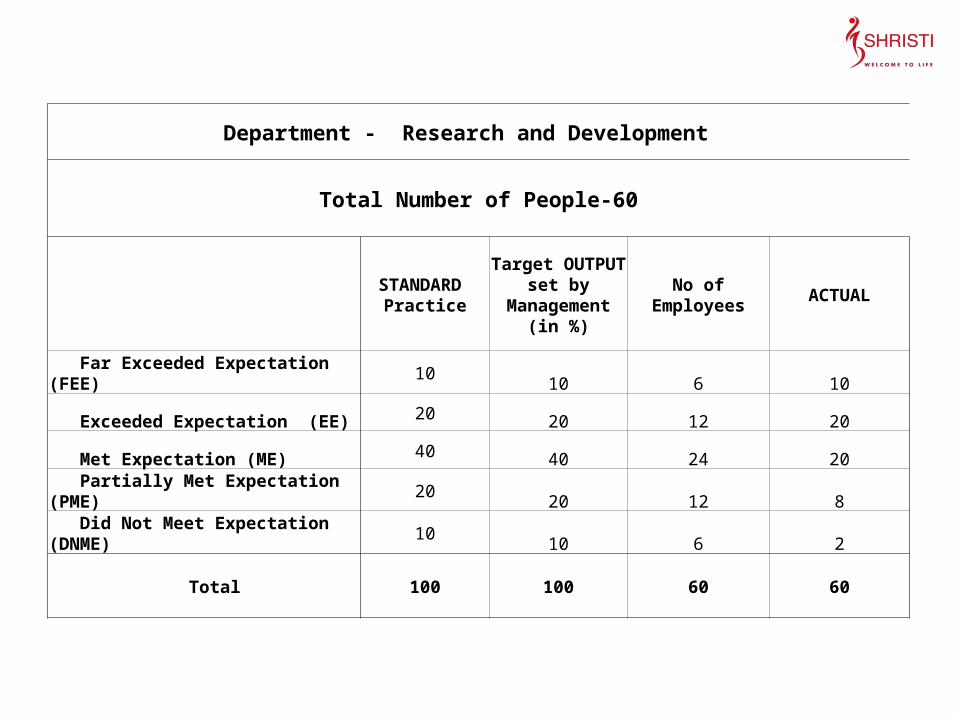
Department - Research and Development
Total Number of People-60
STANDARD Practice
Target OUTPUTset by
Management(in %)
No of Employees ACTUAL
Far Exceeded Expectation (FEE) 10 10 6 10
Exceeded Expectation (EE) 20 20 12 20
Met Expectation (ME) 40 40 24 20
Partially Met Expectation (PME) 20 20 12 8
Did Not Meet Expectation (DNME) 10 10 6 2
Total 100 100 60 60
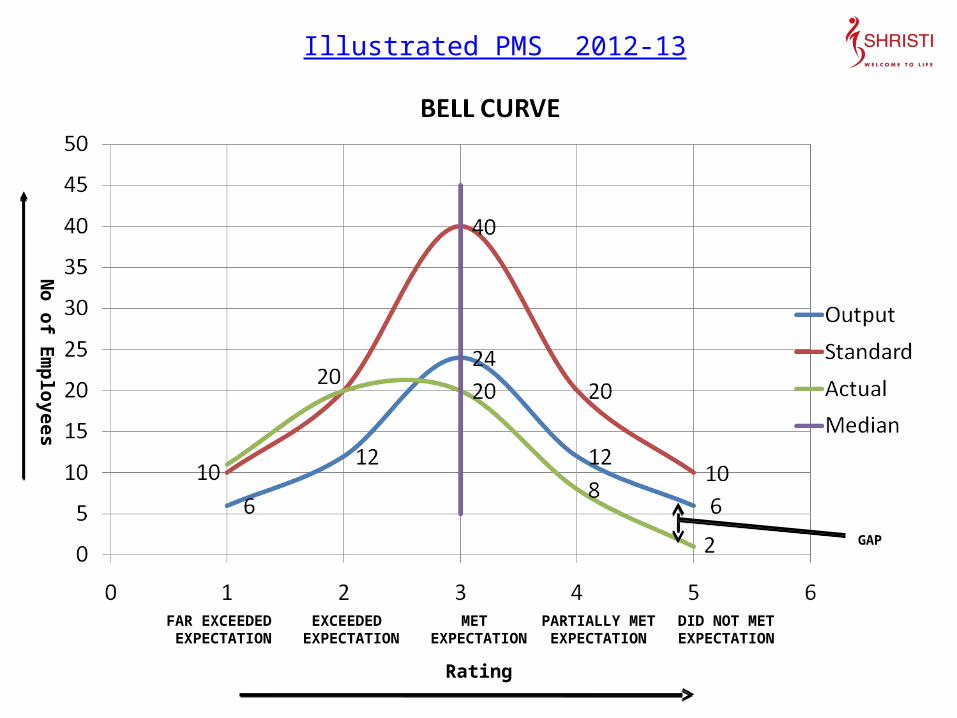
Illustrated PMS 2012-13
Rating
No
of E
mp
loyees
EXCEEDED EXPECTATION
MET EXPECTATION
DID NOT METEXPECTATION
GAP
FAR EXCEEDED EXPECTATION
PARTIALLY METEXPECTATION

Way Forward from Last Year’s Experience:
• Both the Assessor and the Assesee has to formally discuss the appraisal and agree on the appraisal before sign – off.
• All Team-Leaders are also required to be actively involved in the process, acting as Assessor for their respective team members (Assesses).
• Primary Data should be allocated through Last Year’s KRA’s and KPI’s, as and where available.
• It is recommended to have a HR representative to be present at the time of formal discussion between an Assessor and an Assesee.
• The entire department cannot be rated as Top-Most Performers. Only 10% of the total team strength can be rated as star performers and the balance 90% of the team strength is required to be distributed as per their performance during the fiscal year 2011-12.

Related Documents