Results for the 12 months ended 30 June 2017 28 August 2017 Peter George, CEO Geoff Stephenson, CFO INVESTOR PRESENTATION PMP LIMITED ABN 39 050 148 644

Welcome message from author
This document is posted to help you gain knowledge. Please leave a comment to let me know what you think about it! Share it to your friends and learn new things together.
Transcript
Results for the 12 months ended 30 June 2017 28 August 2017 Peter George, CEO Geoff Stephenson, CFO
INVESTOR PRESENTATION
PMP LIMITED ABN 39 050 148 644
2017 FULL YEAR RESULTS
Contents Pages
Delivering on Targets 3
Highlights 4-20
Priorities and Next Steps 22
Addendum 23 - 31
2
Debt Profile and Capital Management 21
PMP : DELIVERING ON TARGETS
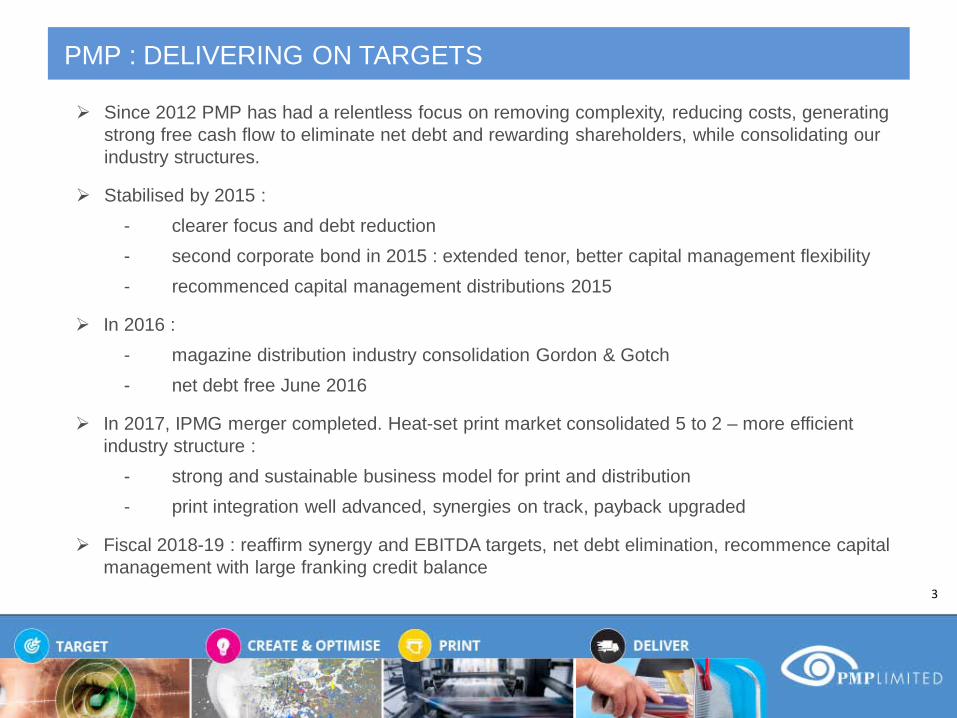
Since 2012 PMP has had a relentless focus on removing complexity, reducing costs, generating strong free cash flow to eliminate net debt and rewarding shareholders, while consolidating our industry structures.
Stabilised by 2015 : - clearer focus and debt reduction - second corporate bond in 2015 : extended tenor, better capital management flexibility - recommenced capital management distributions 2015
In 2016 : - magazine distribution industry consolidation Gordon & Gotch - net debt free June 2016
In 2017, IPMG merger completed. Heat-set print market consolidated 5 to 2 – more efficient industry structure :
- strong and sustainable business model for print and distribution - print integration well advanced, synergies on track, payback upgraded
Fiscal 2018-19 : reaffirm synergy and EBITDA targets, net debt elimination, recommence capital management with large franking credit balance
3

2017 FULL YEAR RESULTS : HIGHLIGHTS
Sales at $1,051.5M EBITDA1 at $32.2M Net Debt at $18.5M Net Loss ($126.4M) Capital Management
• Sales Revenue higher 28.9% up $235.5M : - Print Group Aust up $63.3M – IPMG - Gordon & Gotch AU/NZ up $185M – new contract on statutory basis, ($19M on underlying basis)
• Down $19.0M as reduced EBITDA across PMP Group more than offsets 4 months IPMG profits
• Normalised 12 months basis equals $49M
• Net Debt ($18.5M) v. Net Cash $0.7M pcp - ahead of guidance / improved working capital
• Interest Cover 6.3x v. 8.5x pcp
• Net Loss (after sig items) of ($126.4M) v. $0.2M pcp • $142.6M of significant items - $61.0M impairments - Goodwill/PPE - $53.6M restructuring, relocations and other - $8.0M acquisition costs - $20.0M onerous leases • Policy currently suspended during merger/integration - set to recommence H2 FY18
• Franking credit balance $62M
4 (1) before significant items

2017 FULL YEAR RESULTS : MEETS REVISED GUIDANCE, PRINT INTEGRATION WELL ADVANCED NET DEBT BETTER THAN GUIDANCE
FY17 has been a challenging year : - stalled first half waiting for ACCC merger approval
- print markets remained challenging as retailers control costs
- post merger second half - integration plan implementation
- met revised EBITDA guidance
Transformation plan has run smoothly : - press fleet rationalisation completed
- new optimised national manufacturing footprint in place
- $40M annualised savings actioned - most flow through in FY18
Continued commitment to cash flow : - free cash flow FY17 $37.2M down $0.3m pcp
- better working capital outcomes
- tight cost controls continue and lower capex/significant item spend
- stronger cash conversion up from 81% to 121% in FY17
- net debt better than revised guidance 5
2017 FULL YEAR RESULTS : CASHFLOW BRIDGE
6
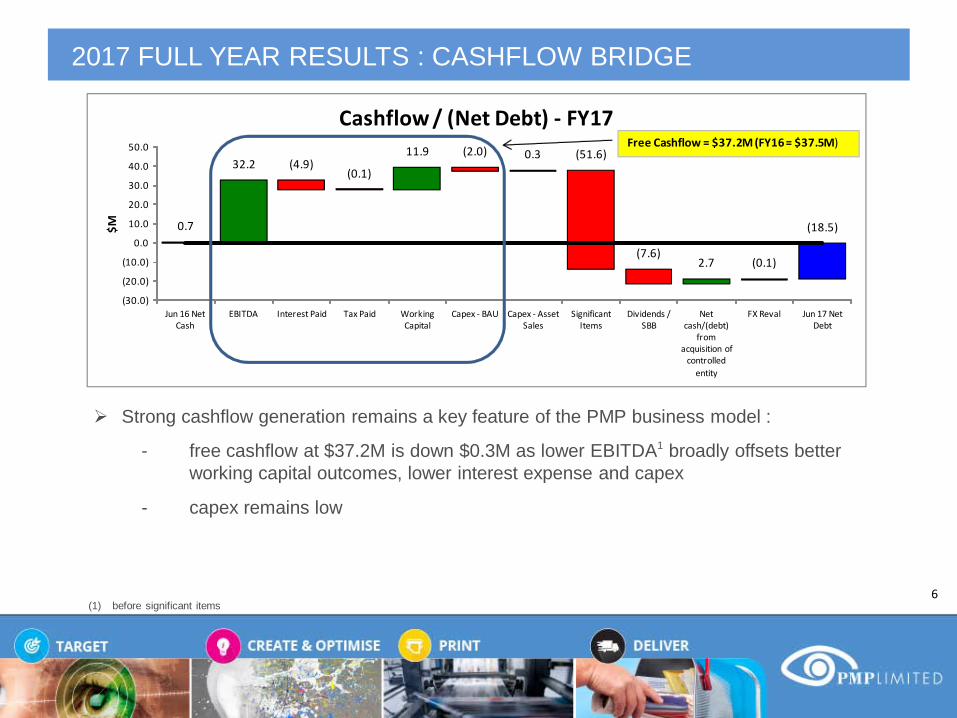
Strong cashflow generation remains a key feature of the PMP business model :
- free cashflow at $37.2M is down $0.3M as lower EBITDA1 broadly offsets better working capital outcomes, lower interest expense and capex
- capex remains low
(1) before significant items
0.7
32.2 (4.9)(0.1)
11.9 (2.0) 0.3 (51.6)
(7.6)2.7 (0.1)
(18.5)
(30.0)
(20.0)
(10.0)
0.0
10.0
20.0
30.0
40.0
50.0
Jun 16 Net Cash
EBITDA Interest Paid Tax Paid Working Capital
Capex - BAU Capex - Asset Sales
Significant Items
Dividends / SBB
Net cash/(debt)
from acquisition of
controlled entity
FX Reval Jun 17 Net Debt
$MCashflow / (Net Debt) - FY17
Free Cashflow = $37.2M (FY16 = $37.5M)
2017 FULL YEAR RESULTS : SALES REVENUE BRIDGE
7
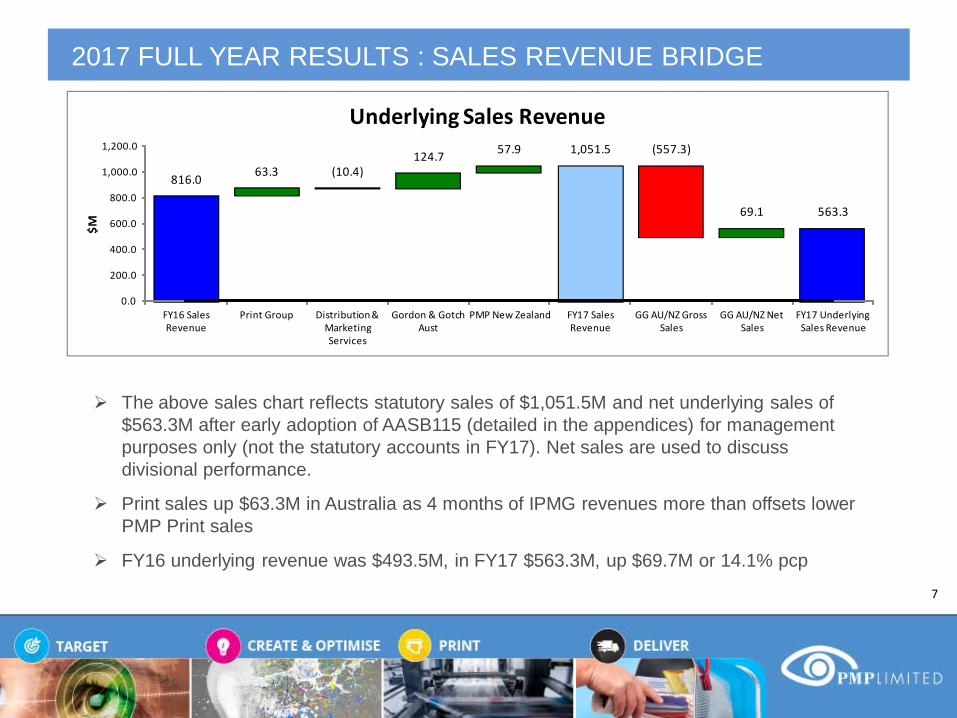
The above sales chart reflects statutory sales of $1,051.5M and net underlying sales of $563.3M after early adoption of AASB115 (detailed in the appendices) for management purposes only (not the statutory accounts in FY17). Net sales are used to discuss divisional performance.
Print sales up $63.3M in Australia as 4 months of IPMG revenues more than offsets lower PMP Print sales
FY16 underlying revenue was $493.5M, in FY17 $563.3M, up $69.7M or 14.1% pcp
816.0 63.3 (10.4)124.7 57.9 1,051.5 (557.3)
69.1 563.3
0.0
200.0
400.0
600.0
800.0
1,000.0
1,200.0
FY16 Sales Revenue
Print Group Distribution & Marketing Services
Gordon & Gotch Aust
PMP New Zealand FY17 Sales Revenue
GG AU/NZ Gross Sales
GG AU/NZ Net Sales
FY17 Underlying Sales Revenue
$M
Underlying Sales Revenue

2017 FULL YEAR RESULTS : HIGHLIGHTS PRINT AUSTRALIA
Print Group Australia revenue at $263.0M is up by $63.3M or 31.7% :
- 4 months of IPMG Print sales partially offset by lower PMP Print sales
- Post merger, PMP has retained key customers ($130M sales pa) and won $15M new work
- Print integration and cost savings program well underway and on track, cost synergies affirmed – with upgraded payback
- PMP now has significant scale and capability enabling improved capacity management and fleet utilisation
- EBITDA (pre sigs) $16.7M down $9.7M or 36.8% pcp :
IPMG Print 4 months profits and early integration savings more than offset by lower PMP print volumes & sell prices
- Migration to new manufacturing footprint completed in July 2017
8

2017 FULL YEAR RESULTS : COST OUT – EXECUTION ON TRACK
9
Changes to print footprint :
- IPMG Melbourne closed 100 FTEs out
- PMP Qld site closed at Wacol 76 FTEs
- IPMG Sydney Lidcombe site – heatset closed 120 FTEs
- 25 FTEs in March, further circa 40, May – July 2017
- Decommissioning less efficient and oldest presses – better able to match jobs to presses
Distribution and Gotch will be consolidated into Moorebank, Clayton and Warwick Farm :
- Faster lead times to market
Cash cost out spend in H2 - $43M
On track for 350 FTEs out
PMP heat-set capacity optimised post merger – 25% reduction

2017 FULL YEAR RESULTS : PMP UNMATCHED PRINT STRENGTHS
10
• Vertically integrated: pre-media, print & distribution
• No. 1 market position with 55%-60% market share and $430m heatset sales^
• PMP focuses on medium to long run heatset printing and also has short run capability (web & sheetfed)
• After cost out, new national footprint : Warwick Farm, Moorebank & Lidcombe in NSW Clayton in VIC Geebung in QLD Bibra Lake in WA
• Oldest & least efficient equipment retired • Capacity post merger delivers broadest
range of print formats to satisfy customer needs
^ Based on internal market estimates
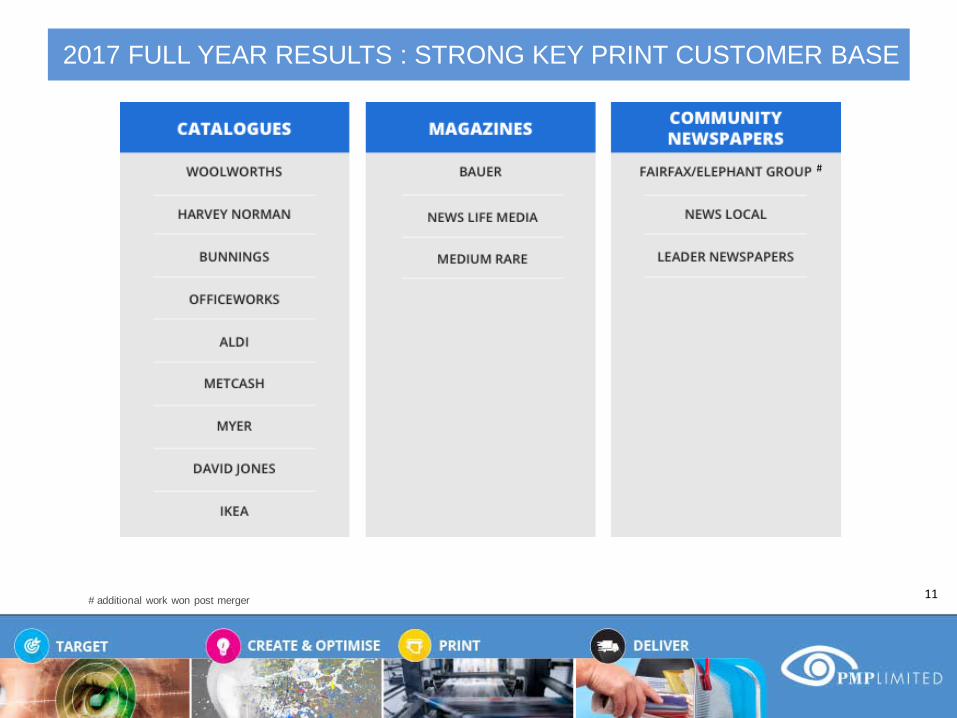
2017 FULL YEAR RESULTS : STRONG KEY PRINT CUSTOMER BASE
11 # additional work won post merger
#
2017 FULL YEAR RESULTS : HIGHLIGHTS NEW ZEALAND
PMP New Zealand underlying sales $119.3M up 4.3% : - Heatset volumes down 2.5% pcp - competitive market conditions continued - Distribution volumes 1% lower - Gotch underlying sales up $7.4M or 143% on new contract volumes - EBITDA1 at $12.4M is $2.6M lower pcp :
Print EBITDA down due to lower sell prices in heatset further cost-out initiatives and tight cost control partially offsets lower print sell
prices Gotch profit up $0.6M pcp
12 (1) before significant items

2017 FULL YEAR RESULTS : HIGHLIGHTS DISTRIBUTION & MARKETING SERVICES
13
Distribution & Marketing Services underlying revenue $180.9M up 0.8% pcp :
- Consists of Distribution, Marketing Services, Griffin and Gordon & Gotch
- Bauer new contract volumes more than offsets lower revenue from existing customers – underlying sales up $11.9M or 26.6%
- Lower revenues at Distribution & Griffin offset 4 months IPMG Marketing Services sales
- PMP Distribution volumes down 12% with 6% due to customer withdrawals from market
- Industry delivered 6.9BN catalogues this year, down 7.3%:
Lower volumes - tier 2 and 3 customers
2 customer withdrawal accounts for 30% of the drop
4 year CAGR is (3.3%)
- EBITDA1 at $6.5M down by $7.0M pcp :
- Lower EBITDA1 at Griffin and Distribution offsets new IPMG Marketing Services profits
(1) before significant items

SUSTAINED FINANCIAL PERFORMANCE CONTINUES
14
(1) Equals EBITDA (before Significant items) less Interest paid, Income tax, capital expenditure and movement in Working capital (2) FY17 includes $48.4M of trade working capital taken on as a part of the IPMG acquisition in Mar 2017 (3) In FY17, working capital reduced by $36.6M largely due to a combination of benefits such as better trading terms, improved debtor collections, transfers to PP&E
and minor impairments
FY16 $45.0IPMG take on2 $48.4
Sub total $93.4W/C mvmts3 ($36.6)TOTAL FY17 $56.8
($25)
$0
$25
$50
$75
$100
FY13
FY14
FY15
FY16
FY17
Net Debt / (Cash) - $M
($160)
($120)
($80)
($40)
$0
$40
FY13
FY14
FY15
FY16
FY17
Net Profit after Tax - $M
($10)
$0
$10
$20
$30
$40
$50FY
13
FY14
FY15
FY16
FY17
Free Cashflow1 - $M
H1 H2
$20
$30
$40
$50
$60
FY13
FY14
FY15
FY16
FY17
Trade Working Capital - $M
2017 FULL YEAR RESULTS : INCOME STATEMENT
15
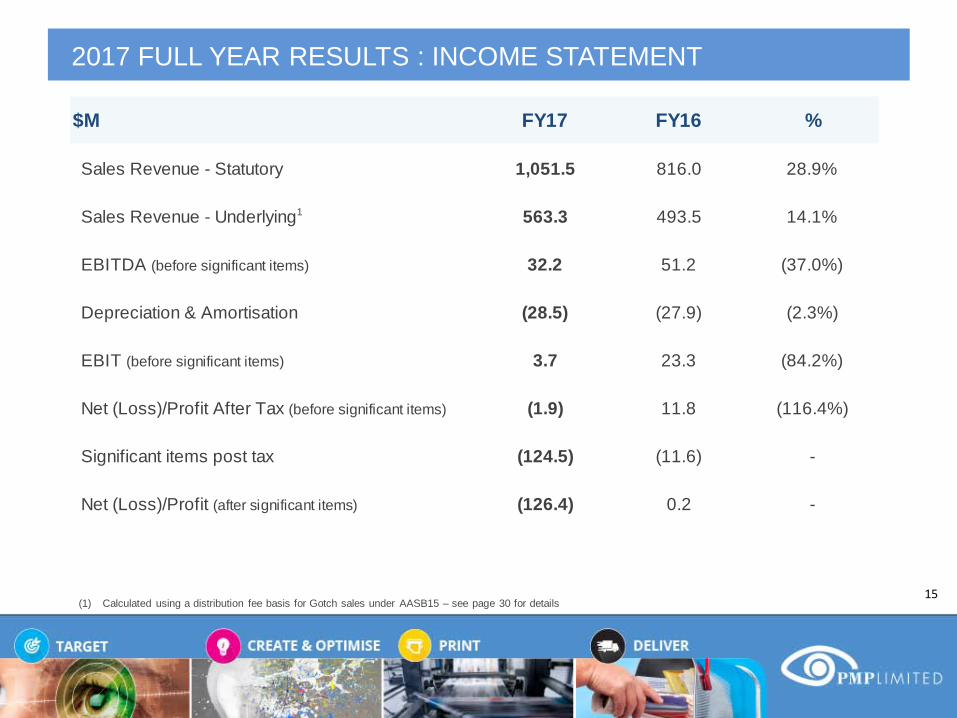
$M FY17 FY16 %
Sales Revenue - Statutory 1,051.5 816.0 28.9%
Sales Revenue - Underlying1 563.3 493.5 14.1%
EBITDA (before significant items) 32.2 51.2 (37.0%)
Depreciation & Amortisation (28.5) (27.9) (2.3%)
EBIT (before significant items) 3.7 23.3 (84.2%)
Net (Loss)/Profit After Tax (before significant items) (1.9) 11.8 (116.4%)
Significant items post tax (124.5) (11.6) -
Net (Loss)/Profit (after significant items) (126.4) 0.2 -
(1) Calculated using a distribution fee basis for Gotch sales under AASB15 – see page 30 for details

2017 FULL YEAR RESULTS : KEY METRICS
16 (1) Equals EBITDA (before Significant items) less Interest paid, Income tax, capital expenditure and movement in Working capital (2) Before Significant Items (3) Cash Conversion is calculated as Cash flow from operations (before Significant items) / EBITDA before Significant items
FY17 FY16 %
Free Cashflow1 ($m) 37.2 37.5 (0.9%)
Net Cash / (Debt) ($m) (18.5) 0.7 -
EBITDA2 to Sales Revenue Statutory (%) 3.1% 6.3% (51.1%)
EBITDA2 to Sales Revenue Underlying (%) 5.7% 10.4% (44.8%)
Cash Conversion (%)3 121.3% 81.5% 48.8%
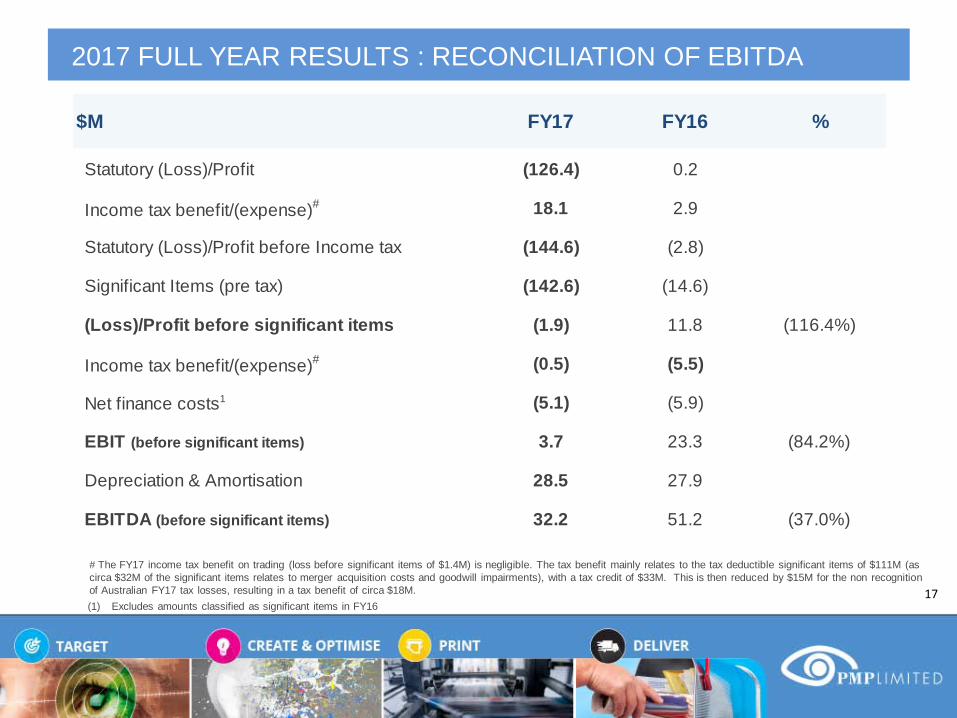
2017 FULL YEAR RESULTS : RECONCILIATION OF EBITDA
17 (1) Excludes amounts classified as significant items in FY16
# The FY17 income tax benefit on trading (loss before significant items of $1.4M) is negligible. The tax benefit mainly relates to the tax deductible significant items of $111M (as circa $32M of the significant items relates to merger acquisition costs and goodwill impairments), with a tax credit of $33M. This is then reduced by $15M for the non recognition of Australian FY17 tax losses, resulting in a tax benefit of circa $18M.
$M FY17 FY16 %
Statutory (Loss)/Profit (126.4) 0.2
Income tax benefit/(expense)# 18.1 2.9
Statutory (Loss)/Profit before Income tax (144.6) (2.8)
Significant Items (pre tax) (142.6) (14.6)
(Loss)/Profit before significant items (1.9) 11.8 (116.4%)
Income tax benefit/(expense)# (0.5) (5.5)
Net finance costs1 (5.1) (5.9)
EBIT (before significant items) 3.7 23.3 (84.2%)
Depreciation & Amortisation 28.5 27.9
EBITDA (before significant items) 32.2 51.2 (37.0%)
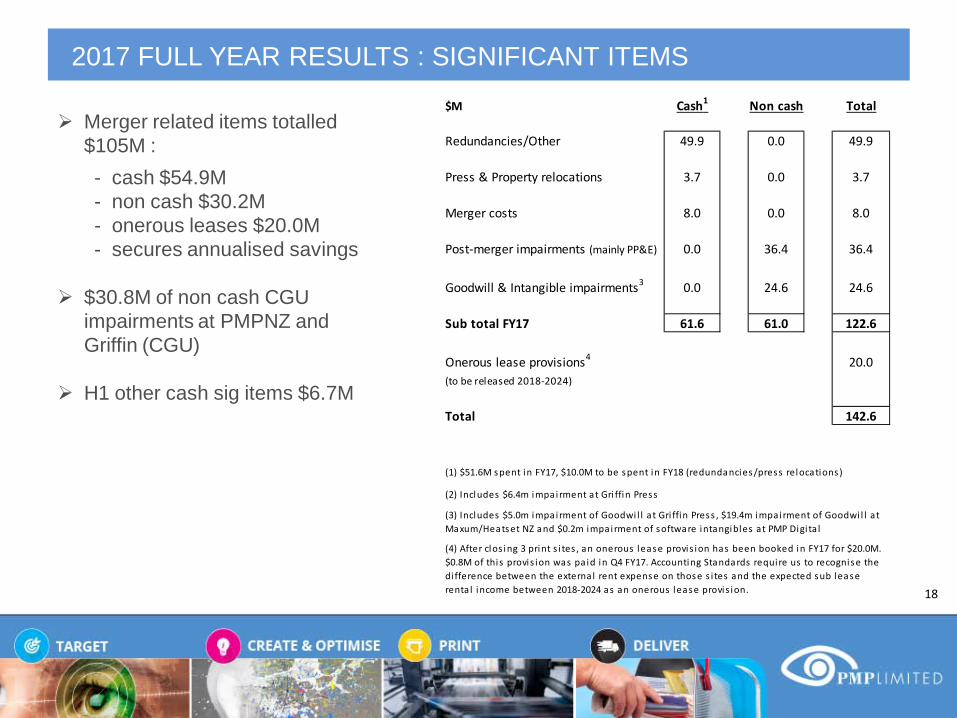
2017 FULL YEAR RESULTS : SIGNIFICANT ITEMS
18
Merger related items totalled $105M : - cash $54.9M - non cash $30.2M - onerous leases $20.0M - secures annualised savings
$30.8M of non cash CGU
impairments at PMPNZ and Griffin (CGU)
H1 other cash sig items $6.7M
$M Cash1 Non cash Total
Redundancies/Other 49.9 0.0 49.9
Press & Property relocations 3.7 0.0 3.7
Merger costs 8.0 0.0 8.0
Post-merger impairments (mainly PP&E) 0.0 36.4 36.4
Goodwill & Intangible impairments3 0.0 24.6 24.6
Sub total FY17 61.6 61.0 122.6
Onerous lease provisions4 20.0(to be released 2018-2024)
Total 142.6
(1) $51.6M spent in FY17, $10.0M to be spent in FY18 (redundancies/press relocations)
(4) After clos ing 3 print s i tes , an onerous lease provis ion has been booked in FY17 for $20.0M. $0.8M of this provis ion was pa id in Q4 FY17. Accounting Standards require us to recognise the di fference between the external rent expense on those s i tes and the expected sub lease renta l income between 2018-2024 as an onerous lease provis ion.
(3) Includes $5.0m impairment of Goodwi l l at Gri ffin Press , $19.4m impairment of Goodwi l l at Maxum/Heatset NZ and $0.2m impairment of software intangibles at PMP Digi ta l
(2) Includes $6.4m impairment at Gri ffin Press
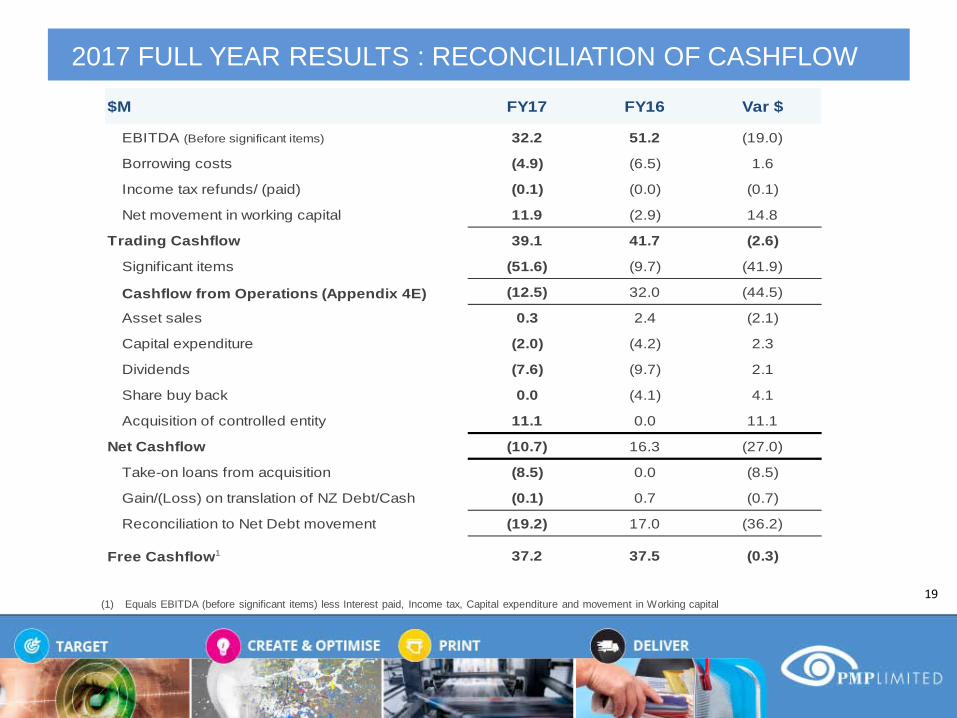
2017 FULL YEAR RESULTS : RECONCILIATION OF CASHFLOW
(1) Equals EBITDA (before significant items) less Interest paid, Income tax, Capital expenditure and movement in Working capital 19
$M FY17 FY16 Var $
EBITDA (Before significant items) 32.2 51.2 (19.0)
Borrowing costs (4.9) (6.5) 1.6
Income tax refunds/ (paid) (0.1) (0.0) (0.1)
Net movement in working capital 11.9 (2.9) 14.8
Trading Cashflow 39.1 41.7 (2.6)
Significant items (51.6) (9.7) (41.9)
Cashflow from Operations (Appendix 4E) (12.5) 32.0 (44.5)
Asset sales 0.3 2.4 (2.1)
Capital expenditure (2.0) (4.2) 2.3
Dividends (7.6) (9.7) 2.1
Share buy back 0.0 (4.1) 4.1
Acquisition of controlled entity 11.1 0.0 11.1
Net Cashflow (10.7) 16.3 (27.0)
Take-on loans from acquisition (8.5) 0.0 (8.5)
Gain/(Loss) on translation of NZ Debt/Cash (0.1) 0.7 (0.7)
Reconciliation to Net Debt movement (19.2) 17.0 (36.2)
Free Cashflow1 37.2 37.5 (0.3)

2017 FULL YEAR RESULTS : BALANCE SHEET METRICS
(1) Trade working capital (excl. provisions) included $48.4m of take on working capital at March 2017 as a result of the IPMG merger/acquisition (2) Cash Conversion is calculated as Cash flow from operations (adjusted for Significant items) / EBITDA before Significant item
20
Jun-17 Jun-16
Total Assets ($m) 570.0 476.9
Shareholders Funds ($m) 255.1 259.4
(Net Cash) / Net Debt ($m) 18.5 (0.7)
Interest Cover (EBITDA / Interest) times 6.3 8.5
(Net Cash) / Net Debt to EBITDA (times) 0.6 (0.0)
(Net Cash) / Net Debt to Equity (%) 7.3 (0.3)
Net Tangible Assets per share (cps) 0.43 0.73
Trade Working Capital ($m)1 56.8 45.0
Debtor Days 34.1 37.4
Cash Conversion (%)2 121.3% 81.5%
2017 FULL YEAR RESULTS : DEBT PROFILE & CAPITAL MANAGEMENT
Net Debt June 2017 is $18.5M v. $0.7M Net Cash at June 2016
New Working Capital and Receivables Financing facilities – total $65M :
- Drawn $14.8M at June 2017
- Headroom1 June 2017 was $50M
Capital Management :
- suspended in October 2016 post merger announcement
- planned to resume second half FY18
- franking credit balance $62M
21 (1) Excluding overdraft facilities of $9.8m
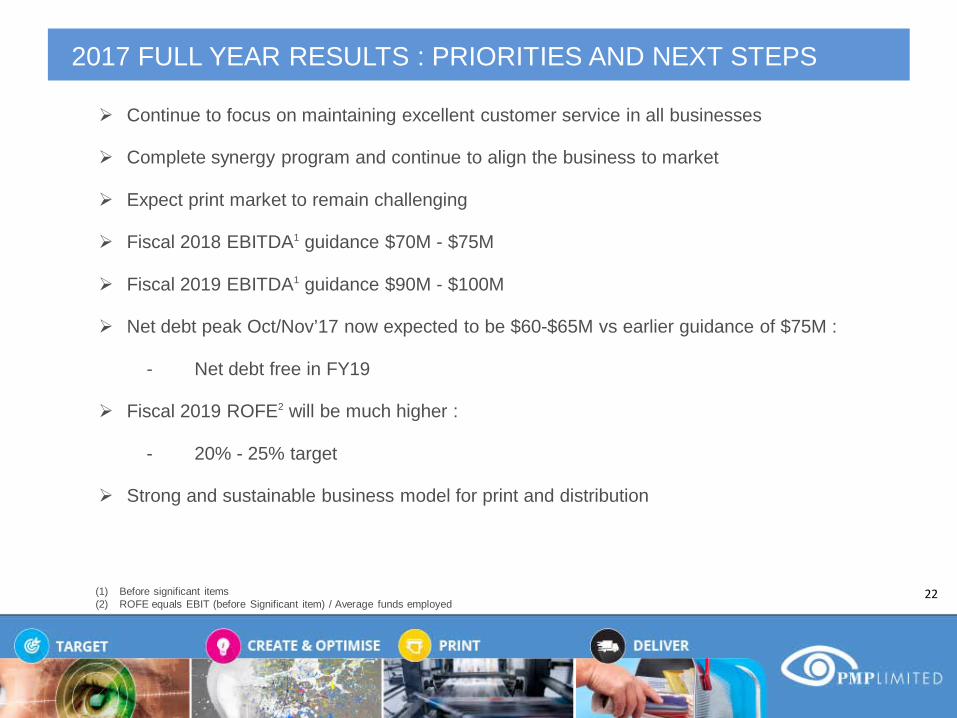
2017 FULL YEAR RESULTS : PRIORITIES AND NEXT STEPS
Continue to focus on maintaining excellent customer service in all businesses
Complete synergy program and continue to align the business to market
Expect print market to remain challenging
Fiscal 2018 EBITDA1 guidance $70M - $75M
Fiscal 2019 EBITDA1 guidance $90M - $100M
Net debt peak Oct/Nov’17 now expected to be $60-$65M vs earlier guidance of $75M :
- Net debt free in FY19
Fiscal 2019 ROFE2 will be much higher :
- 20% - 25% target
Strong and sustainable business model for print and distribution
22 (1) Before significant items (2) ROFE equals EBIT (before Significant item) / Average funds employed

2017 FULL YEAR RESULTS
ADDENDUM
23
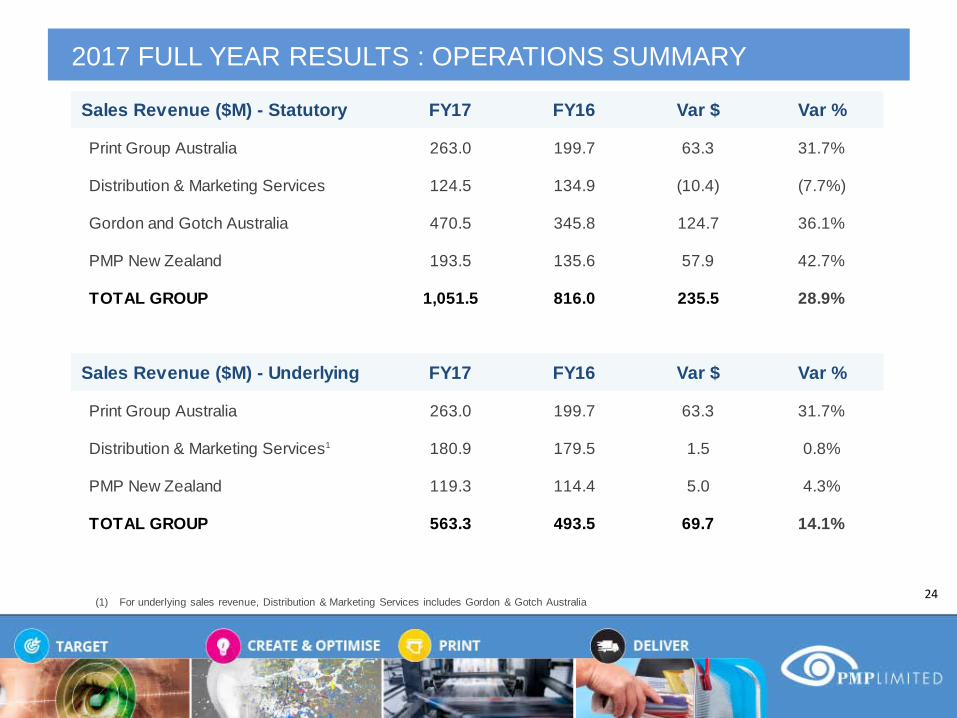
2017 FULL YEAR RESULTS : OPERATIONS SUMMARY
24 (1) For underlying sales revenue, Distribution & Marketing Services includes Gordon & Gotch Australia
Sales Revenue ($M) - Statutory FY17 FY16 Var $ Var %
Print Group Australia 263.0 199.7 63.3 31.7%
Distribution & Marketing Services 124.5 134.9 (10.4) (7.7%)
Gordon and Gotch Australia 470.5 345.8 124.7 36.1%
PMP New Zealand 193.5 135.6 57.9 42.7%
TOTAL GROUP 1,051.5 816.0 235.5 28.9%
Sales Revenue ($M) - Underlying FY17 FY16 Var $ Var %
Print Group Australia 263.0 199.7 63.3 31.7%
Distribution & Marketing Services1 180.9 179.5 1.5 0.8%
PMP New Zealand 119.3 114.4 5.0 4.3%
TOTAL GROUP 563.3 493.5 69.7 14.1%

2017 FULL YEAR RESULTS : OPERATIONS SUMMARY
25 (1) For EBITDA, Distribution & Marketing Services includes Gordon & Gotch Australia
EBITDA (before significant items) ($M) FY17 FY16 Var $ Var %
Print Group Australia 16.7 26.4 (9.7) (36.8%)
Distribution & Marketing Services 6.5 13.5 (6.9) (51.5%)
PMP New Zealand 12.4 15.0 (2.6) (17.2%)
Corporate/Other (3.5) (3.7) 0.3 7.3%
TOTAL GROUP 32.2 51.2 (19.0) (37.0%)

2017 FULL YEAR RESULTS : UNITS
26
FY17 FY16 Var %
Print AU 186.6 147.3 26.6%
Print NZ 37.3 38.3 (2.7%)
Print Tonnes ('000) 223.8 185.6 20.6%
Distribution AU 2,129.2 2,423.1 (12.1%)
Distribution NZ 625.8 630.6 (0.8%)
Distribution Units (Mio) 2,755.1 3,053.7 (9.8%)
Gordon and Gotch AU 212.6 165.0 28.8%
Gordon and Gotch NZ 40.5 11.6 250.2%
Gordon and Gotch Copies (Mio) 253.1 176.6 43.3%

2017 FULL YEAR RESULTS : PMP PRINT CUSTOMERS FIRST
27
Increased customer focus
Over 100 sales and customer service professionals on the ground, ensuring our clients have exceptional support
Time to market is critical. We deliver direct to customers from locations across Australia/New Zealand plus can save on freight by producing their work in their own state and by co-locating print & distribution to achieve further efficiency
Trusted partner, not a competitor, to print managers and brokers
Breadth of services is unrivalled

2017 FULL YEAR RESULTS : PMP PRINT CAPABILITY
28
PMP delivers on-time and in full with superior press fleet in size, age, footprint and capability - matched to the customer requirements
• We boast 16, 24, 32, 48, 64, 80pp and ANZ’s only 96pp presses plus high speed finishing and binding equipment – in multiple sites, providing essential flexibility to our customers
• Capability extends from heatset web offset to sheetfed, digital and ink jet printing - matching our process to customer needs
• Our capacity is 50% more than that of others in the sector – we can cope with peak seasonal demand
• Capex to remain low
• Best equipment retained – there are no significant gaps in formats we can offer efficiently to retailers & publishers

2017 FULL YEAR RESULTS : PMP PRINT BENEFITS OF LARGER FLEET
29
• Better press efficiency and throughput
• Gives customers greater flexibility for scheduling
• Can run work on presses optimised to suit the job:
Can manufacture smaller paginations in multiples off single presses :
e.g. a 16 page catalogue can be run 4 up on 64 page press – better productivity and speed to market. Likewise, on 24pp job can be run 4 up on our 96pp presses in Sydney and Melbourne
• Meet peak seasonal demand

2017 FULL YEAR RESULTS : IMPACT OF AASB15
30
Gordon & Gotch Australia FY17 FY16 % $
Sales Revenue - Statutory 470.5 345.8 36.1% 124.7
Underlying Sales Revenue 56.4 44.5 26.6% 11.9
EBITDA (before significant items 2.7 2.9 (7.2%) (0.2)
Gordon & Gotch New Zealand FY17 FY16 % $
Sales Revenue - Statutory 86.8 26.4 228.4% 60.4
Underlying Sales Revenue 12.6 5.2 142.7% 7.4
EBITDA (before significant items 1.1 0.4 146.1% 0.6
New revenue recognition standard
The new revenue recognition standard AASB15 comes into effect for the year ended 30 June 2019. After an initial review of the new standard, PMP has elected to early adopt from 1 July 2017 and the major impact will come from Gordon & Gotch sales. This will take into account only the distribution fee rather than the cover price of the magazines, which more closely reflects the performance obligations vs control aspects of the contracts.
The change does not impact EBITDA as the reduction in sales revenues is mirrored by a commensurate reduction in finished cost of goods sold. The new sales methodology has also been used when discussing the FY17 results for investor presentations, to provide a clearer view of the company’s performance in both the NZ business and the Distribution & Marketing Services division.
While the Gordon & Gotch statutory sales for fiscal 2017 were $557.2M on the existing basis, the new AASB15 equivalent would have been $69.1M a reduction of $488.2M in sales revenue which is shown in the sales chart on page 7 and the tables below. As such, group sales for FY17 on the new AASB15 basis is $563.3M. There is also a $488.2M reduction in finished cost of goods sold, so there is no impact at the EBITDA level.
The FY17 statutory accounts will be the last time Gordon & Gotch sales are shown on a gross basis with future statutory accounts prepared on a net basis. A final review of the impact of the new standard on other businesses will be undertaken in the coming months. No material impacts are envisaged.
2017 FULL YEAR RESULTS : DISCLAIMER
The material in this presentation is a summary of the results of PMP Limited (PMP) for the twelve months ended 30 June 2017 and an update on PMP’s activities and is current at the date of preparation, 28 August 2017. Further details are provided in the Company’s FULL YEAR accounts and results announcement released on 28 August 2017. No representation, express or implied, is made as to the fairness, accuracy, completeness or correctness of information contained in this presentation, including the accuracy, likelihood of achievement or reasonableness of any forecasts, prospects, returns or statements in relation to future matters contained in the presentation (“forward-looking statements”). Such forward-looking statements are by their nature subject to significant uncertainties and contingencies and are based on a number of estimates and assumptions that are subject to change (and in many cases are outside the control of PMP and its Directors) which may cause the actual results or performance of PMP to be materially different from any future results or performance expressed or implied by such forward-looking statements. This presentation provides information in summary form only and is not intended to be complete. It is not intended to be relied upon as advice to investors or potential investors and does not take into account the investment objectives, financial situation or needs of any particular investor. Due care and consideration should be undertaken when considering and analysing PMP’s financial performance. All references to dollars are to Australian Dollars unless otherwise stated. To the maximum extent permitted by law, neither PMP nor its related corporations, Directors, employees or agents, nor any other person, accepts any liability, including, without limitation, any liability arising from fault or negligence, for any loss arising from the use of this presentation or its contents or otherwise arising in connection with it. This presentation should be read in conjunction with other publicly available material. Further information including historical results and a description of the activities of PMP is available on our website, www.pmplimited.com.au
31
Related Documents