Continuous Improvement Platforms Boosting Operating Performance Resource Planning, Scheduling and COQ www.cresultsconsulting.com cResults / ERD confidential 1 Resource Planning, Scheduling, Cost of Quality and Efficiency Management for QC Laboratories www.smart-qc.com Batch Record Release Management and Overall QA Scheduling & Efficiency Management www.cmanageefficiency.com By an IPS affiliate

Welcome message from author
This document is posted to help you gain knowledge. Please leave a comment to let me know what you think about it! Share it to your friends and learn new things together.
Transcript
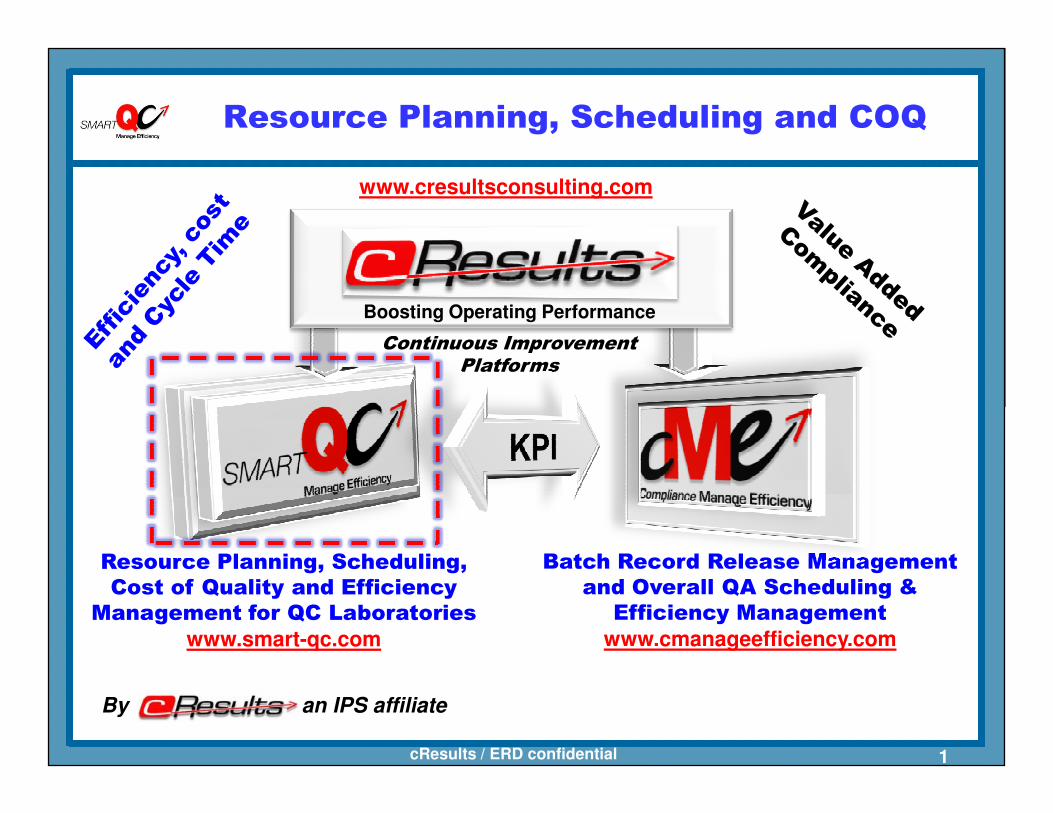
Continuous Improvement Platforms
Boosting Operating Performance
Resource Planning, Scheduling and COQ
www.cresultsconsulting.com
cResults / ERD confidential 1
Resource Planning, Scheduling,
Cost of Quality and Efficiency
Management for QC Laboratories
www.smart-qc.com
Batch Record Release Management
and Overall QA Scheduling &
Efficiency Management
www.cmanageefficiency.com
By an IPS affiliate

Table of Contents
Short Introduction
Managing Labs Operation
Frequent Asked Questions by our management team
QC Planning and Scheduling Goals
KPI – measure progress toward Operation Excellence QC
cResults / ERD confidential 2
KPI – measure progress toward Operation Excellence QC
and QA
Smart-QC Cycle Time Tracking
Smart-QC Integration with LIMS.
Case Studies
Efficiency & Service Level
Reduce Cost & Cycle Time

Introduction to Smart-QC
What is Smart-QC?
Smart-QC is a web based resource planning and scheduling, efficiency management and COQ software solution designed specifically for QC laboratories.
It was designed to effectively manage the dynamic and complex QC environment.
cResults / ERD confidential
Why QC Lab?
The lab is one of the most complex environments in terms of number of products, methods, equipment, size and hence requires an advanced platform to improve visibility, enhance & automate the scheduling practices and help improve the overall performance.
3
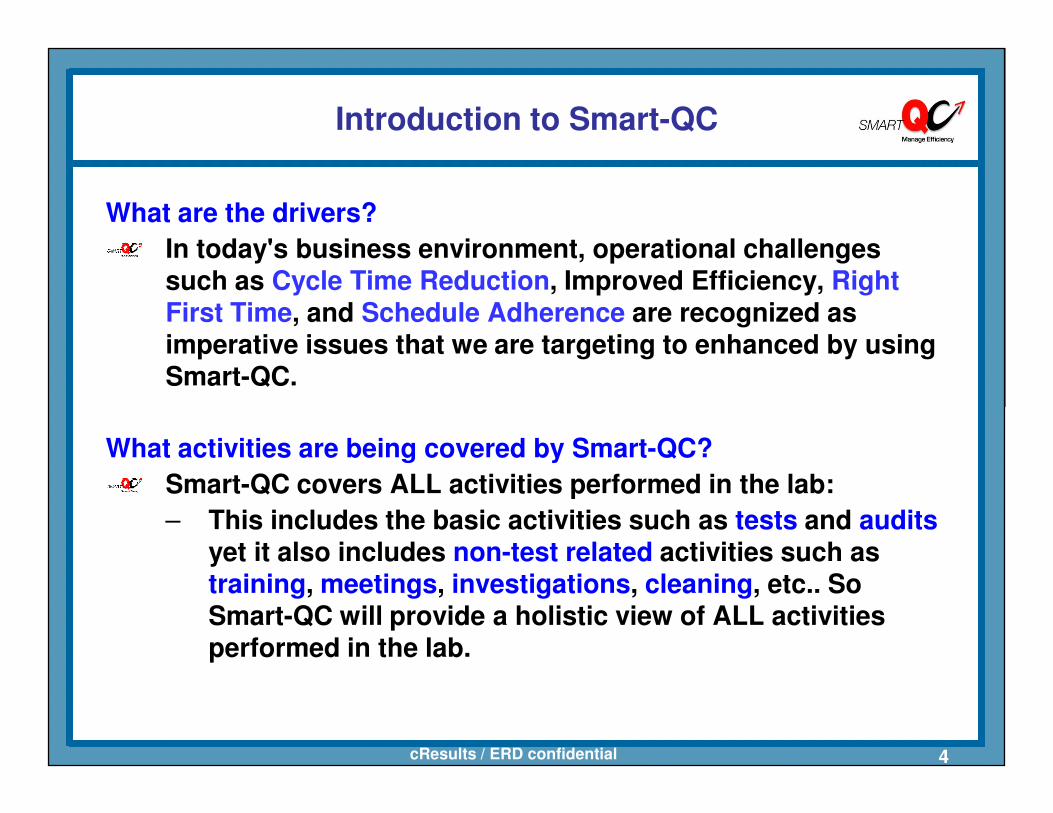
What are the drivers?
In today's business environment, operational challenges such as Cycle Time Reduction, Improved Efficiency, Right First Time, and Schedule Adherence are recognized as imperative issues that we are targeting to enhanced by using Smart-QC.
Introduction to Smart-QC
cResults / ERD confidential
What activities are being covered by Smart-QC?
Smart-QC covers ALL activities performed in the lab:
– This includes the basic activities such as tests and auditsyet it also includes non-test related activities such as training, meetings, investigations, cleaning, etc.. So Smart-QC will provide a holistic view of ALL activities performed in the lab.
4
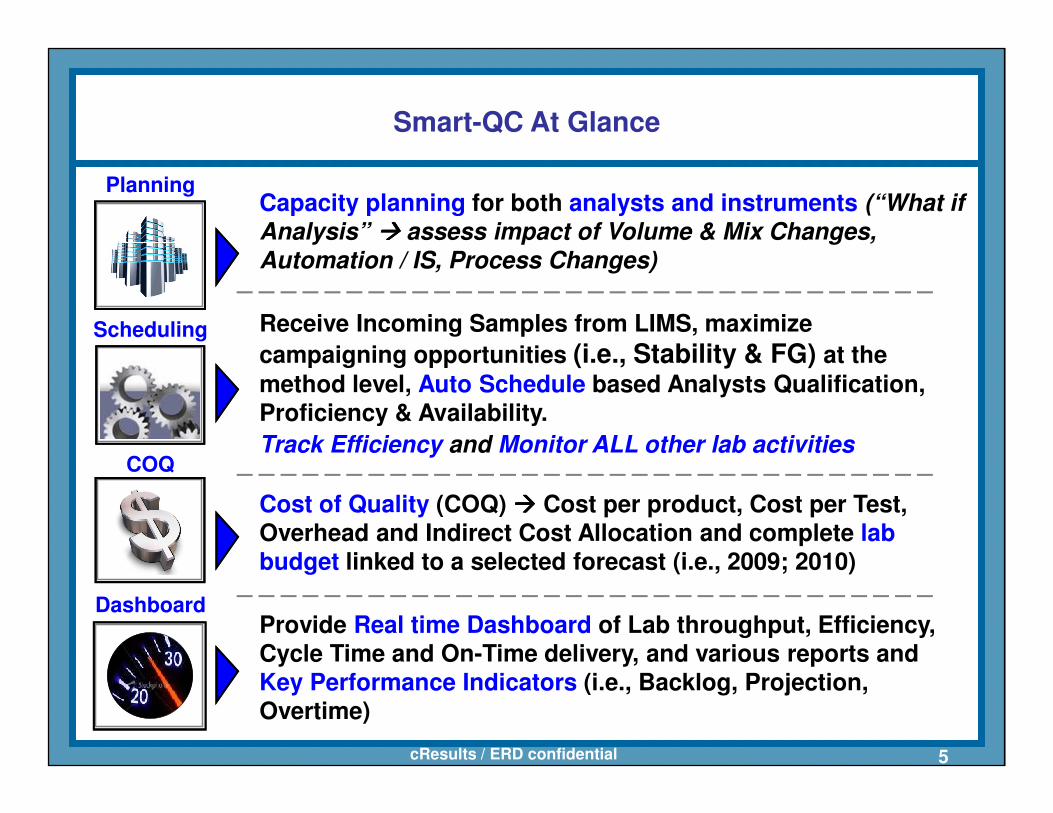
Smart-QC At Glance
Capacity planning for both analysts and instruments (“What if Analysis” ���� assess impact of Volume & Mix Changes, Automation / IS, Process Changes)
Receive Incoming Samples from LIMS, maximize
campaigning opportunities (i.e., Stability & FG) at the
method level, Auto Schedule based Analysts Qualification, Proficiency & Availability.
Scheduling
Planning
cResults / ERD confidential 5
Proficiency & Availability.
Track Efficiency and Monitor ALL other lab activities
Cost of Quality (COQ) ���� Cost per product, Cost per Test, Overhead and Indirect Cost Allocation and complete lab budget linked to a selected forecast (i.e., 2009; 2010)
Provide Real time Dashboard of Lab throughput, Efficiency, Cycle Time and On-Time delivery, and various reports and Key Performance Indicators (i.e., Backlog, Projection, Overtime)
COQ
Dashboard

Determine Resource Requirements for a given Forecast (Week, Month, Quarter, Year).
Additional Resources, Shift Structure, Allocation (internal / External), Cross Training, Special Project, Campaign Optimization etc.
(1) Do I have sufficient resources
(CAPACITY) ?
(2) How do we schedule
Managing Labs Operation: Strategic Level
and Daily Operation
Action Plan
“What if” Analysis
Resource
Planning
cResults / ERD confidential 6
Optimization etc.
(3) Monitoring / Reporting / KPI and
Cost of Quality(DASHBOARD)
Optimized Lab Performance based on Sample Arrival, Due Dates & Resources availability.
Track you COQ & Efficiency Improvements Opportunities
(2) How do we schedule samples / tests to
analysts (SCHEDULING) ?
Daily / Weekly
Schedule
KPI / Report
COQ

INTRODUCTION: Today’s Challenges: Frequent Asked Questions by our management team
What is the impact of volume changes, mix changes, new product introduction on the QC laboratories?
What is the training road map to best meet future demands?
What is the expected work-load based on the new schedule?
What is the impact of a second and third shift?
What percent of time does the analyst spend on admin., preparation, set-ups, calculations?
cResults / ERD confidential 7
Which automation project has a significant ROI?
What is the analyst value added vs. non value added percentage?
What is the campaign effect on QC efficiencies?
Who should perform these tests ,when, in what order?
What is the expected overtime / backlog this month?
How many tests were completed, what was my analyst’s efficiency, what was my turn-around time and schedule adherence?
What are my KPIs showing me?
What is the resource cost of quality?

Standardized planning and budgeting to ensure adequate number of equipment and analysts to meet customers demands.
Robust “What if” Analysis to assess impact of volume & mix changes, validation activities, method transfer, and more on lab resources
Automate scheduling to improve the overall management of tests and samples in the lab and eliminate manual and time consuming scheduling effort.
QC Planning and Scheduling Goals
cResults / ERD confidential 8
Enhance communication & visibility for all functions, hence reduce the email/phones/inquiry about sample status
Improve campaigning & efficiency throughout the labs
Provide clear prioritized schedule (R/Y/G) and expectations (Standard) for the users
Improve overall QC Lab transparency
Improve turn-around time and service level by more robust and automated scheduling algorithm
Continuous improvement platform to help identify and communicate efficiency losses & improvement opportunities.

Automate key performance indicators & dashboard
Measure efficiency & accomplishments during the week
Analyst score-card highlights previous week efficiency, accomplishments, and non-test activities.
Overall efficiency by analyst / work center enables each lab manager to monitor progress and identify areas of improvements
Enhance overall analyst accountability and ownership by
QC Planning and Scheduling Goals
cResults / ERD confidential
Enhance overall analyst accountability and ownership by showing their activities completion against standards.
Consolidate ALL manual / MS Excel / MS Access based systems with ONE business tool that addresses ALL QC operational needs
9

What should we expect from Smart-QC?Analyst View
Your weekly schedule will be automatically generated
Your schedule will optimize your workload, and campaigning opportunities
You will be able to account for all of your activities including testing, auditing, meetings, investigations, cleaning, and other
cResults / ERD confidential 10
testing, auditing, meetings, investigations, cleaning, and other
You will have a real-time visual list and status of your weekly goals and accomplishments.
You will be able to see detailed status and information about samples and test with a couple of clicks.
You will have a chance to communicate any issues/delaysrelated to your assignments so improvement actions can be generated.

Track and Manage ALL Activities in the Lab
EH&S Training, GMP Training,
Communication, Holidays, On the Schedule, Track and Manage Tests, Audit
Plan, Schedule and Track Non-Test Related Activities
cResults / ERD confidential 11
Job Training, Performance
Review, Vacations, Personal DayManage Tests, Audit and Approval
Non-Test Related Activities (i.e., Instrument Qualification,
Change Control, Analytical Data
Trending, General Cleaning,
Investigations, Method Transfer,
Method Validation Review &
Support, Special Projects)
Resource
Support
25%
Facility
Support
28%
Test Related
(HOT)
47%

Meaningful KPI –
measuring the progress
An effective labs’ structurethat support the business goals
Efficient Layout / Material Flow and Work Method / Make or Buy
Meaningful KPI –measuring the
progress
Reviewers performance,guidelines and harmonization
Clear roles and responsibilities(Mfg./Pkg./QA/QC)
Smart-QC & cME KPI – measure progress toward Operation Excellence QC and QA
QA Release Optimization QC Efficiency Improvement
cResults / ERD confidential 12
and Work Method / Make or Buy
Effective coordination & alignmentwith Mfg. / Planning / purchasing
Automation and adequate resources level(Instruments and Analysts)
Systems: LIMS / Data Acquisition / Planning / Daily Scheduling / Test Allocation / Training
Detailed Labs’ standards as a foundation for effective planning and Scheduling of the Labs’ resources
(Mfg./Pkg./QA/QC)
Value added vs. Non Value added reviews (Stage / Full Review)
Right First Time documentation –awareness, standardization, training, and
accountability
Investigation Closure improvement, early detection and determination, effective root
cause and CAPA
Batch Record design Streamlining (Layout, Clarity, Simplicity, and Standardization)
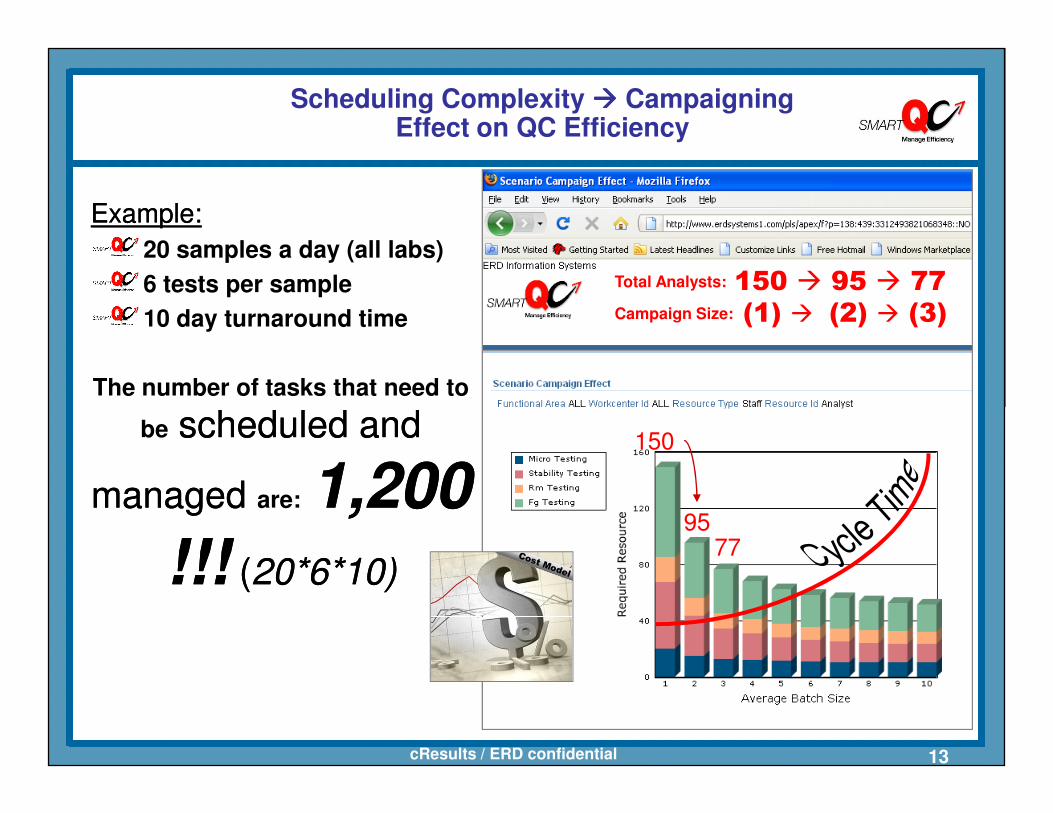
Scheduling Complexity ���� Campaigning Effect on QC Efficiency
150 � 95 � 77
(1) � (2) � (3)
Total Analysts:
Campaign Size:
Example:Example:
20 samples a day (all labs)
6 tests per sample
10 day turnaround time
The number of tasks that need to
scheduled and scheduled and
cResults / ERD confidential 13
be scheduled and scheduled and
managed managed are: 1,200 1,200 !!!!!! ((20*6*10)20*6*10)
150
9577Cost Model
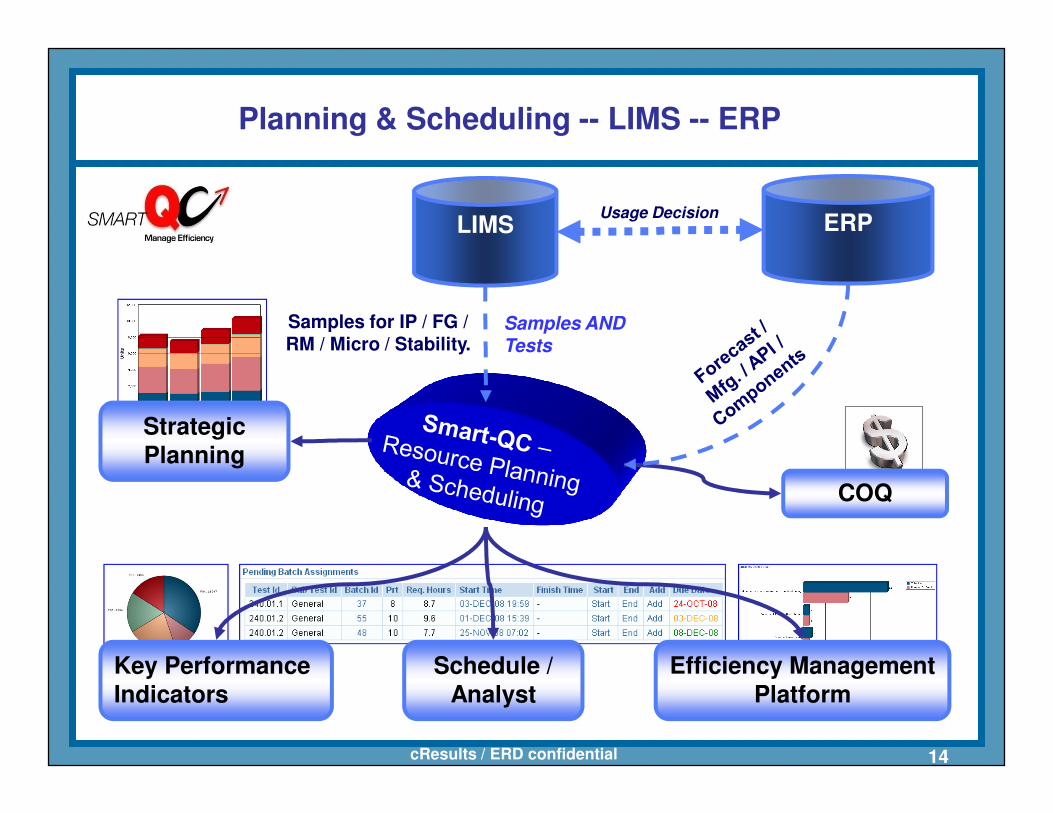
ERP
Samples for IP / FG / RM / Micro / Stability.
LIMS
Planning & Scheduling -- LIMS -- ERP
Usage Decision
Samples AND Tests
cResults / ERD confidential 14
Key Performance Indicators
Schedule / Analyst
Efficiency Management Platform
Strategic Planning
COQ
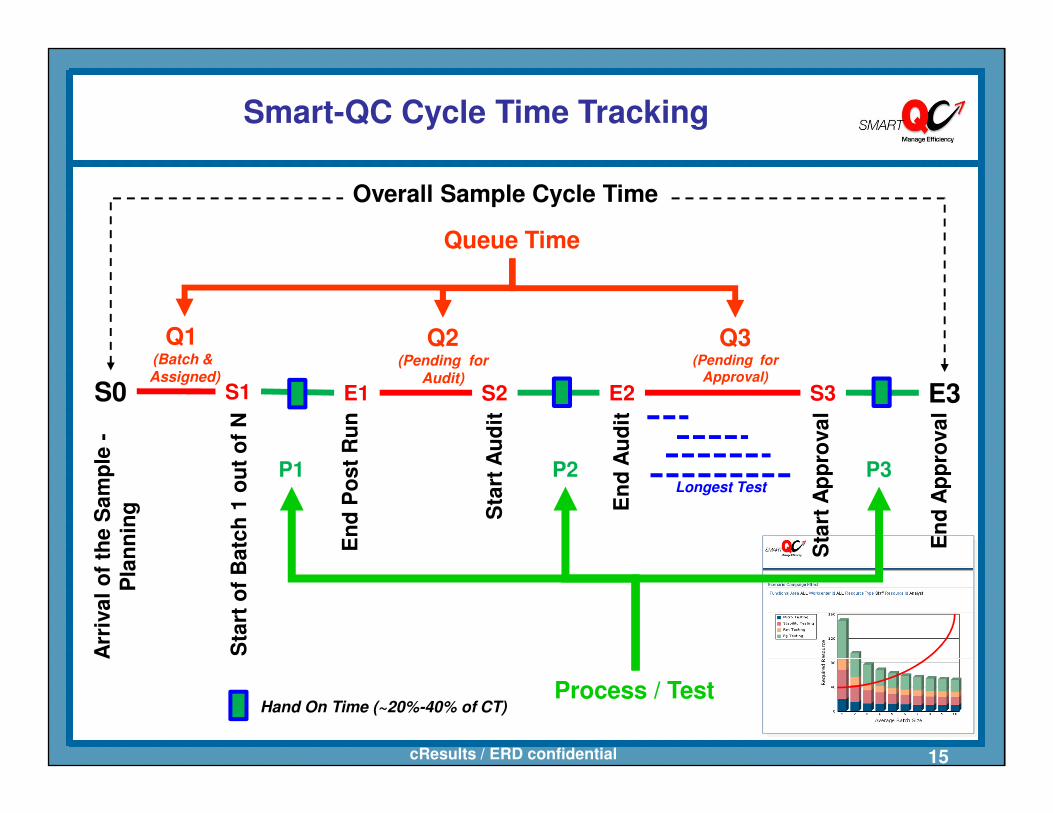
S0 E3S1 E1 S2 E2 S3
Q1 (Batch & Assigned)
Q2(Pending for
Audit)
Q3(Pending for
Approval)
Queue Time
Smart-QC Cycle Time Tracking
Overall Sample Cycle Time
cResults / ERD confidential 15
E3
Arr
iva
l o
f th
e S
am
ple
-P
lan
nin
g
Sta
rt o
f B
atc
h 1
ou
t o
f N
En
d P
os
t R
un
Sta
rt A
ud
it
En
d A
ud
it
Sta
rt A
pp
rova
l
En
d A
pp
rova
l
Process / Test
P1 P2 P3
Hand On Time (~20%-40% of CT)
Longest Test

Case Studies
Case Study-1: Campaigning Effect on Efficiency
Case Study-2: Efficiency Gain: Earned Hrs. Since Smart-
QC Kick off (3 clients)
cResults / ERD confidential 16

Case Study
� During 2008 average campaign size was:
2.5 tests
� Since the deployment of Smart-QC began in Jan-21, campaign size
1 ���� 2 ���� 3 ���� 4
65 ���� 42 ���� 35 ���� 31
Campaign Size:Analysts Required:
Avg. Campaign 2.5 (2008) ���� 4.2 since Smart-QC was implemented
Case Study-1: Campaign Effect
cResults / ERD confidential 17
Jan-21, campaign size is averaging:
4.2 tests
� This represents about
20% efficiency gain
Lower campaign size in 2008 was due to lack of robust scheduling tool and process. Planning required significant rush samples to be released which reduced overall flexibility.

Case Study-2.1: Efficiency Gain: Earned
Hrs. Since Smart-QC Kick off
223.2
258.1267
279.2 282.6
240
260
280
300
Eff
icie
ncy [
%]
Earned Hrs. Per WeekSince Smart-QC Go-Live
Earned Hrs. increases by
cResults / ERD confidential 18
192.5
212.5
223.2
180
200
220Eff
icie
ncy [
%]
Earned Hrs
Earned Hrs = Sum of ALL Test related activities times the STD
Earned Hrs. increases by
almost 50%
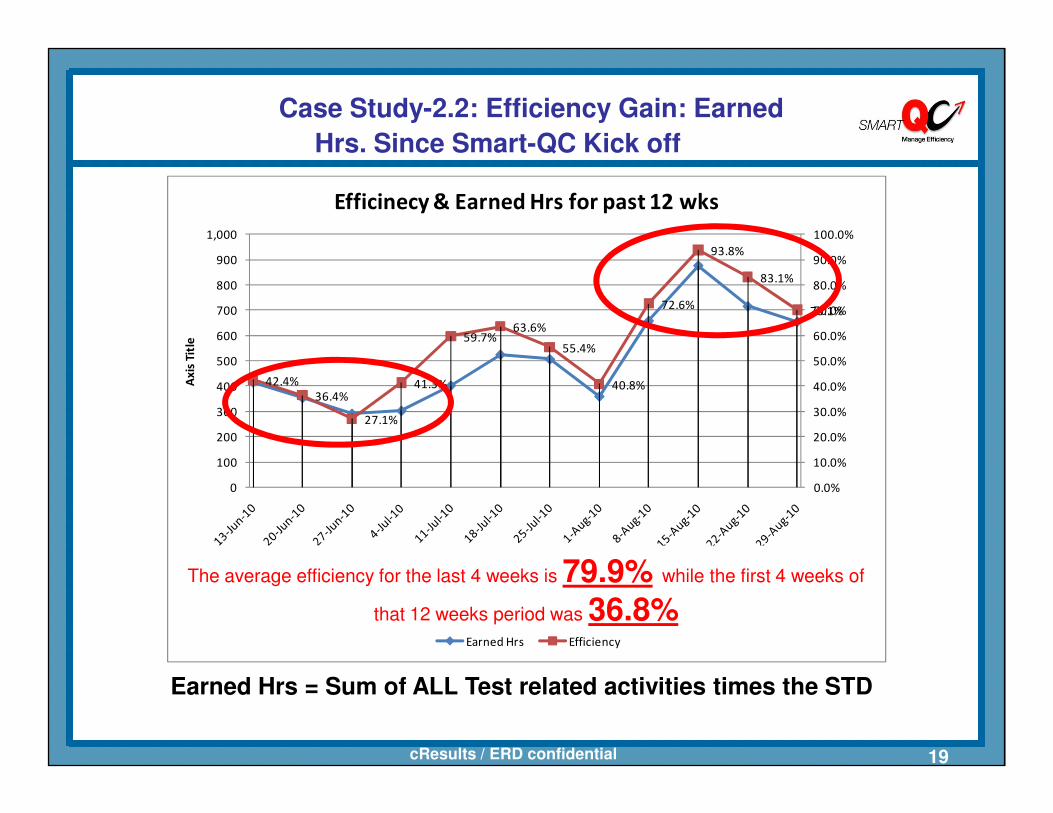
42.4%
36.4%41.3%
59.7%63.6%
55.4%
40.8%
72.6%
93.8%
83.1%
70.1%
30.0%
40.0%
50.0%
60.0%
70.0%
80.0%
90.0%
100.0%
300
400
500
600
700
800
900
1,000
Ax
is T
itle
Efficinecy & Earned Hrs for past 12 wks
Case Study-2.2: Efficiency Gain: Earned
Hrs. Since Smart-QC Kick off
cResults / ERD confidential
27.1%
0.0%
10.0%
20.0%
30.0%
0
100
200
300
Axis Title
Earned Hrs Efficiency
19
Earned Hrs = Sum of ALL Test related activities times the STD
The average efficiency for the last 4 weeks is 79.9% while the first 4 weeks of
that 12 weeks period was 36.8%
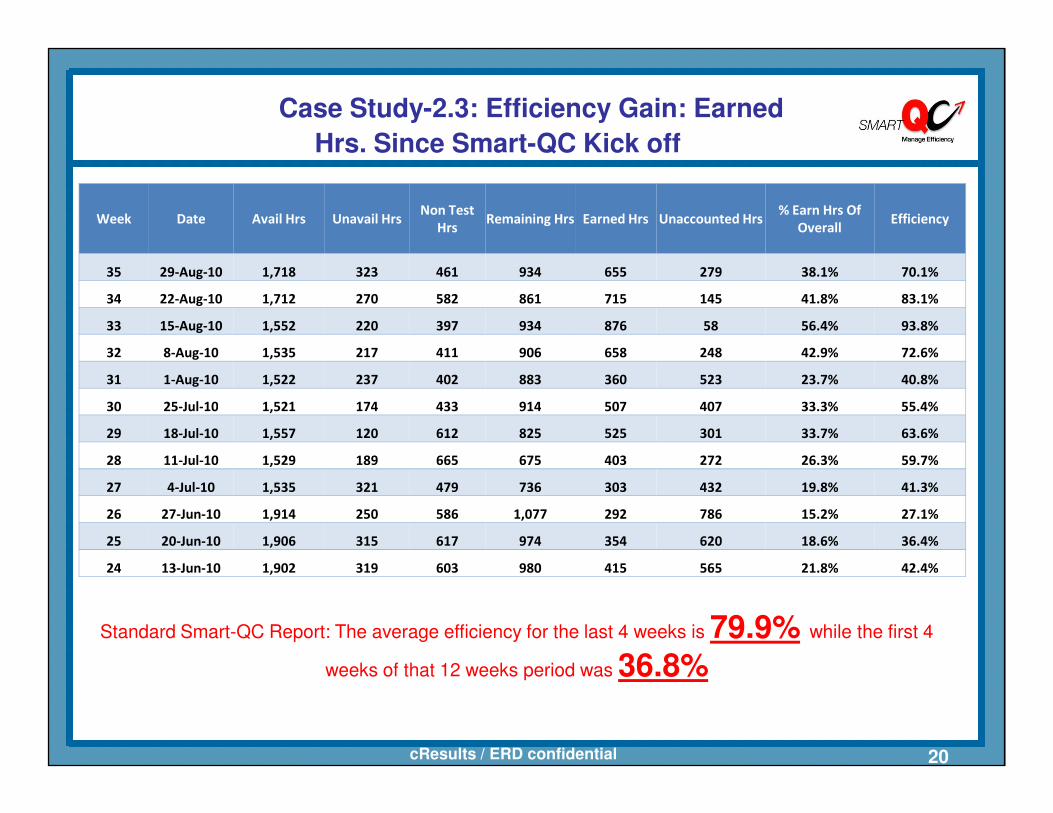
Case Study-2.3: Efficiency Gain: Earned
Hrs. Since Smart-QC Kick off
Week Date Avail Hrs Unavail HrsNon Test
HrsRemaining Hrs Earned Hrs Unaccounted Hrs
% Earn Hrs Of
OverallEfficiency
35 29-Aug-10 1,718 323 461 934 655 279 38.1% 70.1%
34 22-Aug-10 1,712 270 582 861 715 145 41.8% 83.1%
33 15-Aug-10 1,552 220 397 934 876 58 56.4% 93.8%
32 8-Aug-10 1,535 217 411 906 658 248 42.9% 72.6%
31 1-Aug-10 1,522 237 402 883 360 523 23.7% 40.8%
30 25-Jul-10 1,521 174 433 914 507 407 33.3% 55.4%
cResults / ERD confidential 20
30 25-Jul-10 1,521 174 433 914 507 407 33.3% 55.4%
29 18-Jul-10 1,557 120 612 825 525 301 33.7% 63.6%
28 11-Jul-10 1,529 189 665 675 403 272 26.3% 59.7%
27 4-Jul-10 1,535 321 479 736 303 432 19.8% 41.3%
26 27-Jun-10 1,914 250 586 1,077 292 786 15.2% 27.1%
25 20-Jun-10 1,906 315 617 974 354 620 18.6% 36.4%
24 13-Jun-10 1,902 319 603 980 415 565 21.8% 42.4%
Standard Smart-QC Report: The average efficiency for the last 4 weeks is 79.9% while the first 4
weeks of that 12 weeks period was 36.8%

SMART-QC Coming Soon to
your Lab
cResults / ERD confidential
Web Site: www.smart-qc.comEmail: [email protected] Web Site: www.cresultsconsulting.comContact Info: Rafi Maslaton; 1-732-748 1990 ext. 250
Related Documents