Planum Temporale Asymmetry in Developmental Dyslexia: Revisiting an Old Question Irene Altarelli, 1,2 * Franc ¸ois Leroy, 3,4,5 Karla Monzalvo, 3,4,5 Joel Fluss, 6,7 Catherine Billard, 6 Ghislaine Dehaene-Lambertz, 3,4,5 Albert M. Galaburda, 8 and Franck Ramus 1 1 Laboratoire de Sciences Cognitives et Psycholinguistique, D epartement d’Etudes Cognitives, Ecole Normale Sup erieure, EHESS, CNRS, PSL Research University, 75230 Paris Cedex 05, France 2 Brain and Learning Laboratory, FPSE, University of Geneva, 1211 Geneva 4, Switzerland 3 INSERM, U992, Cognitive neuroimaging unit, 91190 Gif-sur-Yvette, France 4 Commissariat a l’Energie Atomique, Division of Life Sciences, Institute of BioImaging, Neu- rospin, 91190 Gif-sur-Yvette, France 5 Paris-Sud University, 91400 Orsay, France 6 Assistance Publique-H^ opitaux de Paris, Le Kremlin-Bic ^ etre, 94275 Paris, France 7 Neurologie p ediatrique, H^ opitaux Universitaires Gene `ve, 1205 Geneva, Switzerland 8 Department of Neurology, Beth Israel Deaconess Medical Center, Harvard Medical School, Boston, Massachusetts r r Abstract: Among the various asymmetrical structures of the human brain, the planum temporale, an anatomical region associated with a variety of auditory and language-related processes, has received particular attention. While its surface area has been shown to be greater in the left hemisphere com- pared to the right in about two-thirds of the general population, altered patterns of asymmetry were revealed by post mortem analyses in individuals with developmental dyslexia. These findings have been inconsistently replicated in magnetic resonance imaging studies of this disorder. In this report, we attempt to resolve past inconsistencies by analyzing the T1-weighted MR images of 81 children (mean age: 11 years, sd: 17 months), including 46 control (25 boys) and 35 dyslexic children (20 boys). We manually outlined Heschl’s gyri, the planum temporale and the posterior rami of the Syl- vian fissure on participants’ brain images, using the same anatomical criteria as in post mortem stud- ies. Results revealed an altered pattern of asymmetry of the planum temporale surface area in dyslexic boys only, with a greater proportion of rightward asymmetrical cases among dyslexic boys compared to control boys. Additionally, analyses of cortical thickness showed no asymmetry differ- ences between groups for any of the regions of interest. Finally, a greater number of Heschl’s gyrus full duplications emerged for the right hemisphere of dyslexic boys compared to controls. The pres- ent findings confirm and extend early post mortem observations. They also stress the importance of Contract grant sponsor: Ecole des Neurosciences de Paris, Agence Nationale de la Recherche; Contract grant number: ANR-06- NEURO-019-01; ANR-11-BSV4–014-01; ANR-11-0001-02 PSL*; and ANR-10-LABX-0087; Contract grant sponsors: University Paris-Sud (BQR), CNRS, INSERM, and Bettencourt-Schueller Foundation. *Correspondence to: Irene Altarelli, FPSE, University of Geneva, 40, boulevard du Pont d’Arve, 1211 Geneva 4 – Switzerland. E-mail: [email protected] Received for publication 11 April 2014; Revised 10 June 2014; Accepted 25 June 2014. DOI: 10.1002/hbm.22579 Published online 00 Month 2014 in Wiley Online Library (wileyonlinelibrary.com). r Human Brain Mapping 00:00–00 (2014) r V C 2014 Wiley Periodicals, Inc.

Welcome message from author
This document is posted to help you gain knowledge. Please leave a comment to let me know what you think about it! Share it to your friends and learn new things together.
Transcript
Planum Temporale Asymmetry in DevelopmentalDyslexia: Revisiting an Old Question
Irene Altarelli,1,2* Francois Leroy,3,4,5 Karla Monzalvo,3,4,5
Joel Fluss,6,7 Catherine Billard,6 Ghislaine Dehaene-Lambertz,3,4,5
Albert M. Galaburda,8 and Franck Ramus1
1Laboratoire de Sciences Cognitives et Psycholinguistique, D�epartement d’Etudes Cognitives,Ecole Normale Sup�erieure, EHESS, CNRS, PSL Research University, 75230 Paris Cedex 05,
France2Brain and Learning Laboratory, FPSE, University of Geneva, 1211 Geneva 4, Switzerland
3INSERM, U992, Cognitive neuroimaging unit, 91190 Gif-sur-Yvette, France4Commissariat �a l’Energie Atomique, Division of Life Sciences, Institute of BioImaging, Neu-
rospin, 91190 Gif-sur-Yvette, France5Paris-Sud University, 91400 Orsay, France
6Assistance Publique-Hopitaux de Paris, Le Kremlin-Bicetre, 94275 Paris, France7Neurologie p�ediatrique, Hopitaux Universitaires Geneve, 1205 Geneva, Switzerland
8Department of Neurology, Beth Israel Deaconess Medical Center, Harvard Medical School,Boston, Massachusetts
r r
Abstract: Among the various asymmetrical structures of the human brain, the planum temporale, ananatomical region associated with a variety of auditory and language-related processes, has receivedparticular attention. While its surface area has been shown to be greater in the left hemisphere com-pared to the right in about two-thirds of the general population, altered patterns of asymmetry wererevealed by post mortem analyses in individuals with developmental dyslexia. These findings havebeen inconsistently replicated in magnetic resonance imaging studies of this disorder. In this report,we attempt to resolve past inconsistencies by analyzing the T1-weighted MR images of 81 children(mean age: 11 years, sd: 17 months), including 46 control (25 boys) and 35 dyslexic children (20boys). We manually outlined Heschl’s gyri, the planum temporale and the posterior rami of the Syl-vian fissure on participants’ brain images, using the same anatomical criteria as in post mortem stud-ies. Results revealed an altered pattern of asymmetry of the planum temporale surface area indyslexic boys only, with a greater proportion of rightward asymmetrical cases among dyslexic boyscompared to control boys. Additionally, analyses of cortical thickness showed no asymmetry differ-ences between groups for any of the regions of interest. Finally, a greater number of Heschl’s gyrusfull duplications emerged for the right hemisphere of dyslexic boys compared to controls. The pres-ent findings confirm and extend early post mortem observations. They also stress the importance of
Contract grant sponsor: Ecole des Neurosciences de Paris, AgenceNationale de la Recherche; Contract grant number: ANR-06-NEURO-019-01; ANR-11-BSV4–014-01; ANR-11-0001-02 PSL*; andANR-10-LABX-0087; Contract grant sponsors: University Paris-Sud(BQR), CNRS, INSERM, and Bettencourt-Schueller Foundation.
*Correspondence to: Irene Altarelli, FPSE, University of Geneva, 40,boulevard du Pont d’Arve, 1211 Geneva 4 – Switzerland.E-mail: [email protected]
Received for publication 11 April 2014; Revised 10 June 2014;Accepted 25 June 2014.
DOI: 10.1002/hbm.22579Published online 00 Month 2014 in Wiley Online Library(wileyonlinelibrary.com).
r Human Brain Mapping 00:00–00 (2014) r
VC 2014 Wiley Periodicals, Inc.
taking gender into account in studies of developmental dyslexia. Hum Brain Mapp 00:000–000, 2014.VC 2014 Wiley Periodicals, Inc.
Key words: developmental dyslexia; planum temporale; structural magnetic resonance imaging; gen-der; reading
r r
INTRODUCTION
A variety of asymmetrical features have been observedin the human brain, both in anatomy and function. Amongthe various brain regions concerned, the planum tempo-rale (PT) has received particular attention. This triangularstructure lies on the upper surface of the posterior supe-rior temporal gyrus, within the Sylvian fossa. It is an asso-ciative auditory area, located posterior to Heschl’s gyrus.As suggested by lesion and functional studies, the PT isimplicated in a number of processes, including auditoryand phonological processing, language comprehension,and subvocal articulation [Price, 2010; Griffiths and War-ren, 2002]. The post mortem study of Geschwind and Lev-itsky [1968] was among the first to outline a leftwardanatomical asymmetry of this structure in the general pop-ulation. By measuring the length of the lateral border ofthe PT in 100 brains’ photographs, the authors reported aleftward asymmetry in 65 cases, a rightward one in 11,while 24 brains were approximately symmetrical. Thesefindings were replicated in additional post mortem studiesof adults [Galaburda et al., 1987], infants [Wada et al.,1975; Witelson and Pallie, 1973], and fetuses [Chi et al.,1977].
The asymmetry in PT surface area was initially consid-ered as a potential correlate of the well-established func-tional asymmetry in the language network, which favorsthe left hemisphere over the right. Some evidence for arelationship between functional and structural asymme-tries in this region exists [Foundas et al., 1994; Moffatet al., 1998; but see J€ancke and Steinmetz, 1993]. However,a few recent studies [Dorsaint-Pierre et al., 2006; Dos San-tos Sequeira et al., 2006; Eckert et al., 2006; Keller et al.,2011] with larger groups of participants, assessing lan-guage lateralization with different techniques, haverevealed a greater prevalence of leftward anatomicalasymmetry in most participants, regardless of the func-tional organization of language.
Rather than a simple correlate of functional specializa-tion, PT anatomical asymmetry is likely to be influenced
by multiple interacting factors, among which handednessand gender. It has indeed been suggested that the degreeof leftward asymmetry is related to handedness [Foundaset al., 2002; Steinmetz et al., 1991], although further explo-ration of this issue in large samples might be beneficial.Regarding gender, a more marked PT or posterior Sylvianfissure surface area asymmetry in males compared tofemales has been reported [Good et al., 2001; Kovalevet al., 2003; Kulynych et al., 1994; Li et al., 2014], althoughstill a matter of debate [Chiarello et al., 2009; Sommeret al., 2008]. The sex difference in asymmetry coefficientsmay arise from a smaller right PT surface area in malesthan in females, a fetal testosterone related effect [Lom-bardo et al., 2012]. This hypothesis would also be in linewith early post mortem evidence of a negative correlationbetween right PT surface area and the degree of leftwardPT asymmetry [Galaburda et al., 1987].
Interestingly, interactions between gender, handedness,and also language lateralization are starting to emerge.Dos Santos Siquiera et al. [2006] observed a correlationbetween language lateralization as measured by dichoticlistening and PT asymmetry, only in right-handed men(N 5 23). This finding is supported by the studies of Chiar-ello et al. [2004, 2009], where an association betweenbehavioral lateralization (estimated by divided visual fieldlexical tasks) and PT asymmetry was also identified inright-handed men (N 5 20 and 85, respectively).
These observations, if confirmed by future studies,would support the traditional view that PT asymmetrymay to some extent be related to language function, atleast in some populations. Interestingly, in their post mor-tem analysis of the macroanatomical and microanatomicalfeatures of the dyslexic brain, Galaburda et al. [1985; Hum-phreys et al., 1990] observed symmetrical plana temporalein seven patients (4 males and 3 females) with develop-mental dyslexia, a specific learning disorder that affectsreading abilities. Many attempts have been made to repli-cate this finding in vivo, with the help of neuroimagingtechniques. Results have, however, been very contradic-tory, as summarized in Table I.
Several factors may explain these inconsistencies, includ-ing issues of sample size and of groups’ matching in termsof age, gender, handedness, and IQ. Furthermore, consid-erable variability is found in the type of measurement andin the choice of anatomical criteria, which, as we willshow below, are of great importance.
In this study, we attempted to resolve past inconsisten-cies by analyzing the magnetic resonance imaging (MRI)images of a large set of dyslexic and control children, free
Abbreviations
ADHD attention deficit hyperactivity disorderH1 first Heschl’s gyrusH2 second Heschl’s gyrusPR posterior rami of the Sylvian fissurePT planum temporale
r Altarelli et al. r
r 2 r
TABLE I. Previous studies of planum temporale anatomical asymmetry in developmental dyslexia
Year Authors Participants (ctr-dys) Males (ctr-dys) Strictly right-handed (ctr-dys) Mean age (ctr-dys)
1990 Hynd et al. 10-10 8-8 10-7 11.8–9.91990 Larsen et al. 17–19 15(?)215 10(?)26 15.4–15.11991 Semrud-Clikeman et al. 10-10 8-8 10-7 11.7–9.91993 Leonard et al. 12-9 5–7 All 37.1–361994 Schulz et al. 14–17 7–10 All 8.9-8.61997 Rumsey et al. 14–16 14–16 Most participants 24–271998 Hugdahl et al. 25-25 20-20 23-23 11.7–11.81999 Green et al. 8-8 8-8 All 24-23.51999 Best and Demb et al. 5-5 3-3 4–5 26.8–22.22000 Heiervang et al. 20-20 20-20 20-20 11.7–11.82000 Robichon et al. 14–16 14–16 10-9 23.6–212001 Leonard et al. 15-13 8-7 Most participants 22–242002 Leonard et al. (Study 1) 0–14a 7 Most participants 10.62002 Foster et al. 12–19b 5–15 8–18 9.9-9.62003 Hugdahl et al. 23-23 20-19 22-22 11.8–11.82003 Eckert et al. 32-18 19-14 32-17 11.4–11.32004 Kibby et al. 9-8c 6–8 Most participants 10-9.52006 Leonard et al. 0–22d 14 18 132013 Sanchez Bloom et al. 29-26 16–18 Most participants (96%) 10.2–10.8
Year Authors Inclusion criteria for dyslexia
1990 Hynd et al. Familial history, IQ> 85, discrepancy between IQ and WA 1 reading comprehension >20 points.1990 Larsen et al. Accuracy and speed in nonword decoding <21.8 z-scores, normal intelligence (Raven).1991 Semrud-Clikeman et al. Familial history, IQ> 85, discrepancy with WA and reading comprehension >20 standard points,
no ADHD comorbidity.1993 Leonard et al. Familial history, low performance in LAC and WRMT. No IQ test.1994 Schulz et al. IQ> 85, discrepancy between IQ and WI 1 WA, OR scores in one of the two below the 25th
percentile.1997 Rumsey et al. IQ> 90, discrepancy with GORT-3 passage scores >15 points.1998 Hugdahl et al. IQ> 85, score 2sd below age mean in standardized screening reading tests.1999 Green et al. History of dyslexia. Discrepancy between verbal IQ and reading and writing rate 1 phonologic
awareness 1 auditory retrieval.1999 Best and Demb et al. Childhood history and adult diagnosis of dyslexia, participants prescreened for fMRI experiment.2000 Heiervang et al. IQ> 85, score 2sd below age mean in standardized screening reading tests.2000 Robichon et al. Childhood diagnosis and familial history, IQ> 90 or Raven matrices >50.2001 Leonard et al. Poor word recognition (GORT, WRAT-SP, WRAT-RD, Woodcock), WRMT-WA<90. Normal intelli-
gence (WJ-Cog).2002 Leonard et al. (Study 1) From previous longitudinal study, children qualifying for remediation. (Better reading accuracy
and lower verbal ability scores than children with research diagnoses).2002 Foster et al. IQ> 75, discrepancy between IQ and WRAT 1 WRMT >20 points2003 Hugdahl et al. IQ> 85, 2 sd below mean in Norwegian standardized reading test.2003 Eckert et al. IQ> 90, at least 1 sd discrepancy between verbal IQ and WRMT-R 1 TOWRE 1 WRAT-SP. SLI
excluded.2004 Kibby et al. IQ> 85, >20 points discrepancy between IQ and WA and read comprehension2006 Leonard et al. Children identified by teachers as potential participants for previous intervention study.2013 Sanchez Bloom et al. IQ> 85, GORT<85, discrepancy of at least 15 points between the two.
Year Authors Groups matched for Anatomical criteria
1990 Hynd et al. Gender “Heschl’s sulcus” (excluding H2) to end of Sylvian fissure1990 Larsen et al. Age, gender, SES, intelligence
(Raven)ridge of Heschl’s gyrus (excluding H2) to end of Sylvian fissure
1991 Semrud-Clikemanet al.
Gender “Heschl’s sulcus” (excluding H2) to end of Sylvian fissure
r Planum Temporale Asymmetry in Dyslexia r
r 3 r
TABLE I. (continued).
Year Authors Groups matched for Anatomical criteria
1993 Leonard et al. Age, handedness Heschl’s sulcus to intersection between PDR and PAR1994 Schulz et al. Age, gender, handedness, IQ Rostral-most slice not including the insula to end of PAR1997 Rumsey et al. Age, gender, handedness, SES Heschl’s sulcus to intersection between PDR and PAR1998 Hugdahl et al. Age, gender, handedness, pIQ Heschl’s sulcus to end of PDR1999 Green et al. Age, gender, handedness,
educationHeschl’s sulcus (excluding H2) to end of PAR
1999 Best and Dembet al.
Age, gender 1) Heschl’s sulcus to end of PDR
2) and 3) Heschl’s sulcus to intersection between PDR and PAR2000 Heiervang et al. Age, gender, handedness Heschl’s sulcus to end of PDR2000 Robichon et al. Age, gender Heschl’s sulcus to end of PAR2001 Leonard et al. Age, gender, handedness, IQ 1) Heschl’s sulcus to intersection between PDR and PAR
2) Heschl’s sulcus to end of PAR2002 Leonard et al.
(Study 1)SES, IQ Heschl’s sulcus to intersection between PDR and PAR
2002 Foster et al. Age, handedness, IQ Heschl’s sulcus to intersection between PDR and PAR2003 Hugdahl et al. Age, gender, handedness, IQ Heschl’s sulcus to end of PDR2003 Eckert et al. Age, handedness, verbal IQ Heschl’s sulcus to intersection between PDR and PAR2004 Kibby et al. Age, handedness, IQ Heschl’s sulcus to intersection between PDR and PAR2006 Leonard et al. “Heschl’s sulcus” (excluding H2) to intersection between PDR and PAR2013 Sanchez Bloom
et al.Age, gender, handedness, IQ Heschl’s sulcus to end of PDR
Year Authors Labelling: Section used and protocol
1990 Hynd et al. Sagittal, length of outer border from extreme sagittal slices1990 Larsen et al. Coronal, width measurement. not into depth of sulci.1991 Semrud-Clikeman et al. Sagittal, length of outer border from extreme sagittal slices1993 Leonard et al. Sagittal, mean length between standard sagittal positions 2.75–3.25, not into depth of sulci.1994 Schulz et al. Coronal, area estimation from labelling*slice thickness, attempt accounting for curvature.1997 Rumsey et al. Convoluted area estimation from 3D rendering.1998 Hugdahl et al. Sagittal, area estimation from labelling*slice thickness, attempt accounting for curvature.1999 Green et al. sagittal, convoluted area estimation from 3D mesh (created by manual segmentation).1999 Best and Demb et al. 1) Sagittal, length between standard medial positions, then length*thickness.
2) Straight line, not accounting for curvature.3) Accounting for curvature but excluding depth of Heschl’s sulcus.
2000 Heiervang et al. Sagittal, convoluted length*slice thickness.2000 Robichon et al. Sagittal, while viewing axial and coronal too. Convoluted tracing*slice thickness.2001 Leonard et al. Sagittal, mean length between Tal x 5 46–562002 Leonard et al. (Study 1) Sagittal, mean length between Tal x 5 46–562002 Foster et al. Sagittal, mean length on best view and 2 further slices lateral and medial to the best. not
into depth of sulci.2003 Hugdahl et al. Sagittal, convoluted length*thickness.2003 Eckert et al. Sagittal, convoluted length between Tal x 5 46–56.2004 Kibby et al. Sagittal, mean length on best view, not into depth of sulci.2006 Leonard et al. Sagittal, mean length between Tal x 5 46–56.2013 Sanchez Bloom et al. Sagittal, convoluted length*slice thickness.
Year Authors Imaging protocolAsymmetry values
CONTROLSAsymmetry values
DYSLEXICS
1990 Hynd et al. 0.6 T, 7.5 mm axial Not reported Not reported1990 Larsen et al. 1.5 T, 3mm coronal with 0.3 mm gaps Not reported Not reported1991 Semrud-Clikeman et al. 0.5 T, 5 mm axial Not reported Not reported1993 Leonard et al. 1 T, 1.25 mm sagittal 0.17 6 0.22 0.48 6 0.251994 Schulz et al. 1.5 T, 5 mm coronal Boys 0.18 6 0.3 girls 0.23 6 0.3 Boys 0.33 6 0.4 girls 0.02 6 0.4
r Altarelli et al. r
r 4 r
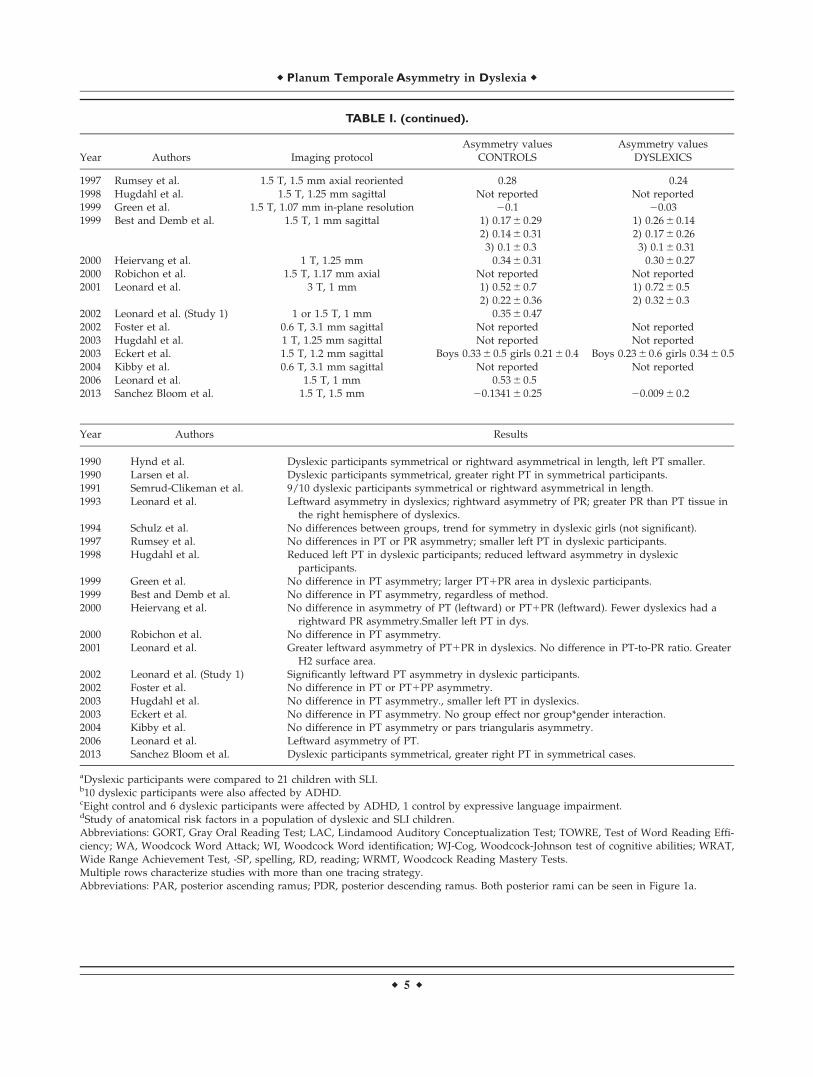
TABLE I. (continued).
Year Authors Imaging protocolAsymmetry values
CONTROLSAsymmetry values
DYSLEXICS
1997 Rumsey et al. 1.5 T, 1.5 mm axial reoriented 0.28 0.241998 Hugdahl et al. 1.5 T, 1.25 mm sagittal Not reported Not reported1999 Green et al. 1.5 T, 1.07 mm in-plane resolution 20.1 20.031999 Best and Demb et al. 1.5 T, 1 mm sagittal 1) 0.17 6 0.29 1) 0.26 6 0.14
2) 0.14 6 0.31 2) 0.17 6 0.263) 0.1 6 0.3 3) 0.1 6 0.31
2000 Heiervang et al. 1 T, 1.25 mm 0.34 6 0.31 0.30 6 0.272000 Robichon et al. 1.5 T, 1.17 mm axial Not reported Not reported2001 Leonard et al. 3 T, 1 mm 1) 0.52 6 0.7 1) 0.72 6 0.5
2) 0.22 6 0.36 2) 0.32 6 0.32002 Leonard et al. (Study 1) 1 or 1.5 T, 1 mm 0.35 6 0.472002 Foster et al. 0.6 T, 3.1 mm sagittal Not reported Not reported2003 Hugdahl et al. 1 T, 1.25 mm sagittal Not reported Not reported2003 Eckert et al. 1.5 T, 1.2 mm sagittal Boys 0.33 6 0.5 girls 0.21 6 0.4 Boys 0.23 6 0.6 girls 0.34 6 0.52004 Kibby et al. 0.6 T, 3.1 mm sagittal Not reported Not reported2006 Leonard et al. 1.5 T, 1 mm 0.53 6 0.52013 Sanchez Bloom et al. 1.5 T, 1.5 mm 20.1341 6 0.25 20.009 6 0.2
Year Authors Results
1990 Hynd et al. Dyslexic participants symmetrical or rightward asymmetrical in length, left PT smaller.1990 Larsen et al. Dyslexic participants symmetrical, greater right PT in symmetrical participants.1991 Semrud-Clikeman et al. 9/10 dyslexic participants symmetrical or rightward asymmetrical in length.1993 Leonard et al. Leftward asymmetry in dyslexics; rightward asymmetry of PR; greater PR than PT tissue in
the right hemisphere of dyslexics.1994 Schulz et al. No differences between groups, trend for symmetry in dyslexic girls (not significant).1997 Rumsey et al. No differences in PT or PR asymmetry; smaller left PT in dyslexic participants.1998 Hugdahl et al. Reduced left PT in dyslexic participants; reduced leftward asymmetry in dyslexic
participants.1999 Green et al. No difference in PT asymmetry; larger PT1PR area in dyslexic participants.1999 Best and Demb et al. No difference in PT asymmetry, regardless of method.2000 Heiervang et al. No difference in asymmetry of PT (leftward) or PT1PR (leftward). Fewer dyslexics had a
rightward PR asymmetry.Smaller left PT in dys.2000 Robichon et al. No difference in PT asymmetry.2001 Leonard et al. Greater leftward asymmetry of PT1PR in dyslexics. No difference in PT-to-PR ratio. Greater
H2 surface area.2002 Leonard et al. (Study 1) Significantly leftward PT asymmetry in dyslexic participants.2002 Foster et al. No difference in PT or PT1PP asymmetry.2003 Hugdahl et al. No difference in PT asymmetry., smaller left PT in dyslexics.2003 Eckert et al. No difference in PT asymmetry. No group effect nor group*gender interaction.2004 Kibby et al. No difference in PT asymmetry or pars triangularis asymmetry.2006 Leonard et al. Leftward asymmetry of PT.2013 Sanchez Bloom et al. Dyslexic participants symmetrical, greater right PT in symmetrical cases.
aDyslexic participants were compared to 21 children with SLI.b10 dyslexic participants were also affected by ADHD.cEight control and 6 dyslexic participants were affected by ADHD, 1 control by expressive language impairment.dStudy of anatomical risk factors in a population of dyslexic and SLI children.Abbreviations: GORT, Gray Oral Reading Test; LAC, Lindamood Auditory Conceptualization Test; TOWRE, Test of Word Reading Effi-ciency; WA, Woodcock Word Attack; WI, Woodcock Word identification; WJ-Cog, Woodcock-Johnson test of cognitive abilities; WRAT,Wide Range Achievement Test, -SP, spelling, RD, reading; WRMT, Woodcock Reading Mastery Tests.Multiple rows characterize studies with more than one tracing strategy.Abbreviations: PAR, posterior ascending ramus; PDR, posterior descending ramus. Both posterior rami can be seen in Figure 1a.
r Planum Temporale Asymmetry in Dyslexia r
r 5 r
of major comorbidities (specific language impairment orSLI and attention deficit hyperactivity disorder or ADHD)and matched for age, gender, handedness, maternal educa-tion, and performance IQ. For all participants, we man-ually segmented a number of regions: first, the PT; second,any posterior ramus (PR) of the Sylvian fissure; third, themost anterior gyrus of Heschl (H1) and any additionaltransverse gyri (H2). These multiple measures allow forcomparisons with many previous reports, in spite of theheterogeneity of the anatomical criteria that they used.
In addition to evaluating surface area asymmetry of allregions of interest, we performed exploratory analyses oncortical thickness and its asymmetry, similarly to previousstudies focusing on other populations [Barta et al., 1997;Qiu et al., 2008; Ratnanather et al., 2013].
Following the work of Schultz et al. [1994], age andglobal brain measures (mean hemispheric surface area ormean hemispheric thickness) were included as covariatesin all analyses. Moreover, given the emerging literature ongender differences in dyslexia [Altarelli et al., 2013; Evanset al., 2014] and its influence on PT surface area, as afore-mentioned, we also included this factor in all analyses.
Based on the post mortem literature, our predictionswere that significant differences in PT surface area asym-metry between control and dyslexic children would beobserved, potentially driven by variations in the right PTsurface area [Galaburda et al., 1985; Galaburda et al., 1987;Humphreys et al., 1990].
MATERIALS AND METHODS
Participants
Children in this report were drawn from two datasets,differing in age and imaging protocols. The first popula-
tion came from a larger study on the neuroanatomical andgenetic bases of dyslexia, which consisted of 64 children(32 dyslexics). The second population was drawn from thestudy of Monzalvo et al. [2012], comprising 46 children (23dyslexics). No child with a history of neurological, psychi-atric, or behavioral disorder, with a hearing or uncorrectedvisual deficit was included.
Children in this experiment were selected based on thefollowing criteria:
� high quality of their T1 images (population one: 64children, population two: 41)� above threshold cognitive performances, as detailed
below (population one: 61 children, population two:36)� right handedness (population one: 56 children, popu-
lation two: 35)� no history of SLI or ADHD, as ascertained through
specific questionnaires (population one: 46 children,population two: 35).
Therefore, 46 children from population one (29 controls)and 35 children from population two (17 controls) partici-pated in this analysis.
All dyslexic children had been previously diagnosed bya specialized learning disability centre (Dr Billard, CHUBicetre). They were selected on the basis of their readinglag, as estimated by a standardized French reading test[“L’alouette,” Lefavrais, 1965], in which a meaningless textof 265 words has to be read as quickly and accurately aspossible, within 3 min. Age-related norms have beenestablished, allowing estimation of a child’s reading ageand lag relative to his/her peers. A delay of 18 months ormore was chosen for inclusion, which is widely used as acriterion for dyslexia in childhood. Nonverbal IQ was alsotaken into account: standard scores in the block designsubtest (or the mean of block design and matrices whenavailable) from the Wechsler Intelligence Scale for Chil-dren [WISC-III or IV; Wechsler, 2005] needed to be greaterthan or equal to 7, that is within 1 standard deviationfrom the age-adjusted mean.
Dyslexic children (N 5 35, 20 boys) and controls (N 5 46,25 boys) were matched for age (average: 11 years, sd: 17months), gender, nonverbal IQ, maternal education(assessed through a sociodemographic questionnaire), andhandedness (evaluated either by direct oral questions onlaterality or by the Edinburgh handedness inventory).
All participants and their parents gave written informedconsent prior to the tests; the experimental proceduresreceived approval from the local hospital ethics committee.
Behavioral Tests
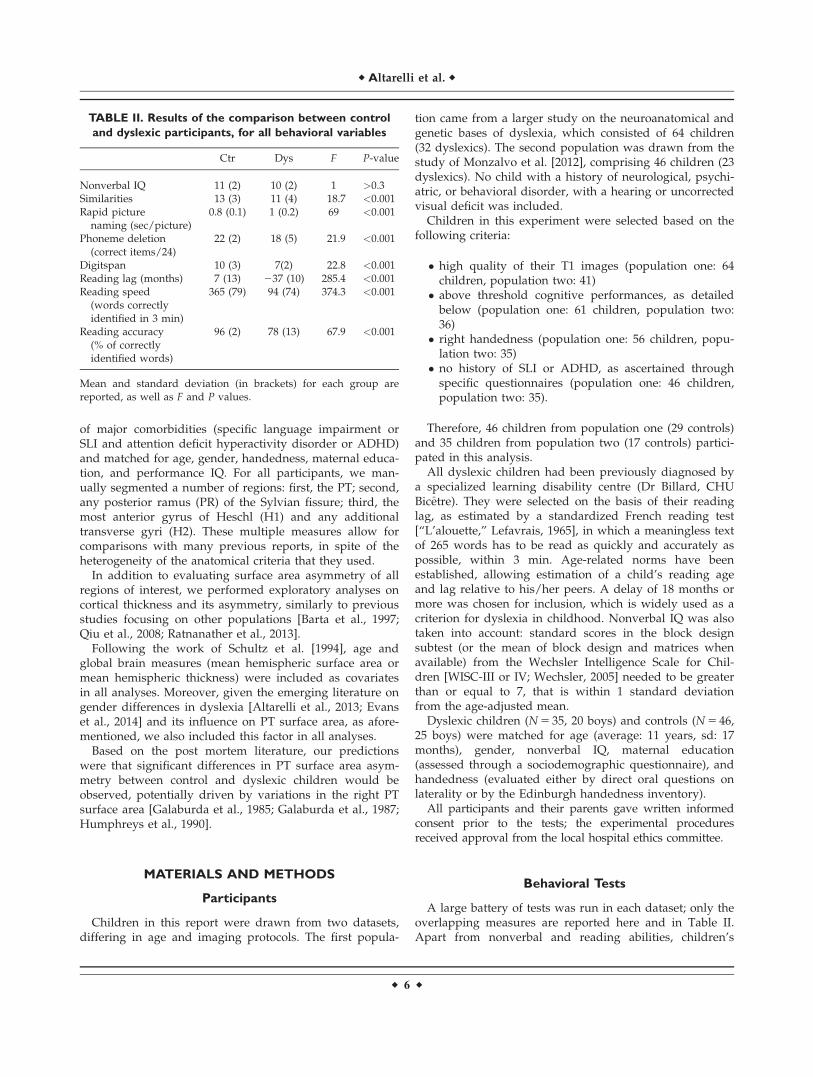
A large battery of tests was run in each dataset; only theoverlapping measures are reported here and in Table II.Apart from nonverbal and reading abilities, children’s
TABLE II. Results of the comparison between control
and dyslexic participants, for all behavioral variables
Ctr Dys F P-value
Nonverbal IQ 11 (2) 10 (2) 1 >0.3Similarities 13 (3) 11 (4) 18.7 <0.001Rapid picture
naming (sec/picture)0.8 (0.1) 1 (0.2) 69 <0.001
Phoneme deletion(correct items/24)
22 (2) 18 (5) 21.9 <0.001
Digitspan 10 (3) 7(2) 22.8 <0.001Reading lag (months) 7 (13) 237 (10) 285.4 <0.001Reading speed
(words correctlyidentified in 3 min)
365 (79) 94 (74) 374.3 <0.001
Reading accuracy(% of correctlyidentified words)
96 (2) 78 (13) 67.9 <0.001
Mean and standard deviation (in brackets) for each group arereported, as well as F and P values.
r Altarelli et al. r
r 6 r
verbal skills and working memory were evaluated, respec-tively, by the similarities and digit span subtests of WISC;rapid automatized naming was tested on pictures [Plazaand Robert-Jahier, 2006; Pech-Georgel and George, 2006];phonological skills were assessed using a phoneme dele-tion task from both consonant-vowel-consonant andconsonant-consonant-vowel pseudowords [EVALEC,Sprenger-Charolles et al., 2005].
MRI Procedure
All children were familiarized with the scanner environmentin a mock MRI setup and then underwent a 3 T MRI exam thatincluded MP-RAGE T1 imaging on the same scanner (SiemensTim Trio, Erlangen, Germany). As participants were drawnfrom two different datasets, for 46 of them whole-brain imageswere acquired using a 32-channels head coil (parameters: acqui-sition matrix 5 230 3 230 3 224, repetition time (TR)5 2300ms, echo time (TE)5 3.05 ms, flip angle 5 9 deg, field of view(FOV) 5 230 mm, voxel size 5 0.9 3 0.9 3 0.9 mm), while forthe remaining 35 children a 12-channel head coil was used(parameters: acquisition matrix: 256 3 256 3 176, TR 5 2300ms, TE 5 4.18 ms, flip angle 5 9 deg, FOV5 256 mm, voxelsize: 1 3 1 3 1 mm). To account for these differences, sequencetype was included as a factor in all analyses.
General Procedure for the Labeling of
Anatomical Regions
A cortical reconstruction procedure was applied usingBrainvisa software (brainvisa.info), so that each subject’s leftand right cortical surfaces were obtained from the T1images. Using dedicated visualization and labeling tools inAnatomist [Le Troter et al., 2012], a number of specific ana-tomical areas in the posterior part of the Sylvian fissure(described below) were marked for each child and hemi-sphere. The labeling procedure was carried out on the graymatter-CSF surface meshes, while simultaneously viewingthe T1 images in the three classic orthogonal views (coronal,axial, and sagittal). As pointed out by various authors [Gala-burda et al., 1993; Honeycutt et al., 2000; Kulynych et al.,1993; Westbury et al., 1999], taking advantage of multipleviews is of crucial importance to identify the relevant ana-tomical landmarks in the Sylvian fissure. Anatomist toolsallowed the localization of a given coordinate on all viewsas well as on the cortical surface mesh at the same time.
A clipping plane was defined on the cortical mesh, so asto view the whole superior temporal plane while hidingthe frontal and parietal lobes from view (as depicted inFig. 1a,b); this plane as well as the mesh itself could bemoved in any desired direction for better visualization.Our labeling strategy and surface area calculation allowedus to follow the cortical surface and take any convolutionand the curvature of the temporal plane into account.
Tracing was carried out by one rater (I.A.) blind to par-ticipants’ diagnostic group and gender. A second rater
(F.L.) carried out the labeling on a subset of participants(18), allowing the estimation of the inter-rater reliabilityfor the PT surface: intra-class correlation5 0.8, P< 0.0001.
We labeled four main anatomical regions:
1. The most anterior Heschl’s gyrus (H1)2. Any additional Heschl’s gyri (H2)3. The planum temporale (PT)4. The posterior rami of the Sylvian fissure (PR),
ascending or descending.
Specific Criteria for the Labeling of Anatomical
Regions
First, we labeled Heschl’s gyrus, or H1. This gyrus,which is bordered posteriorly by Heschl’s sulcus, can beeasily identified on coronal slices and on cortical meshmodels. Laterally and anteriorly H1 flattens out andbecomes level with the superior temporal gyrus, whichmakes it difficult to delineate its lateral and anterior bor-ders in brain images. Given these constraints, and takinginto consideration cytoarchitectonic studies [Rademacheret al., 1993, 2001] indicating that most of the primary audi-tory cortex lies on the medial half of H1, we decided tolabel only this easily delineated medial region. To do so,we identified the most anterior coronal section in whichthe lateral extension of the PT could be seen and arbitra-rily labeled the anterior border of Heschl’s gyrus on thatsection, giving rise to a well-defined and replicable antero-lateral margin (red line in Fig. 1b).
Any additional gyri of Heschl (posterior to Heschl’s sul-cus) were labeled as H2; no participant in our cohort pre-sented more than one additional Heschl’s gyrus.Consistent with Pfeifer’s criterion [Pfeifer, 1936] and withcytoarchitectonic studies [Rademacher et al., 1993, 2001],we considered H2 to be part of the PT. The presence of anadditional Heschl’s gyrus (H2) was identified by its medialorigin in the retroinsular region in axial slices (full poste-rior duplication). However, when an intermediate sulcus(or sulcus of Beck) split Heschl’s gyrus into a posteriorand an anterior circumvolution, but without reaching themedial retroinsular region (common-stem duplication), theposterior circumvolution was counted as part of the firstHeschl’s gyrus (H1) and not of PT, in accordance withmyelogenetic and cytoarchitectonic work on these regions[Galaburda and Sanides, 1980; Pfeifer 1920, 1936]. Theseconfigurations are depicted in Figure 2. As distinct labelswere used to mark H2 and PT, we were also able to ana-lyse the asymmetry of PT without the inclusion of H2 (PT-H2).
As aforementioned, Heschl’s sulcus was considered asthe anterior border of PT. For the definition of the poste-rior border, a variety of strategies have been developed inthe past. Here, we established a number of simple proce-dural rules for defining the posterior limit of PT, asfollows:
r Planum Temporale Asymmetry in Dyslexia r
r 7 r
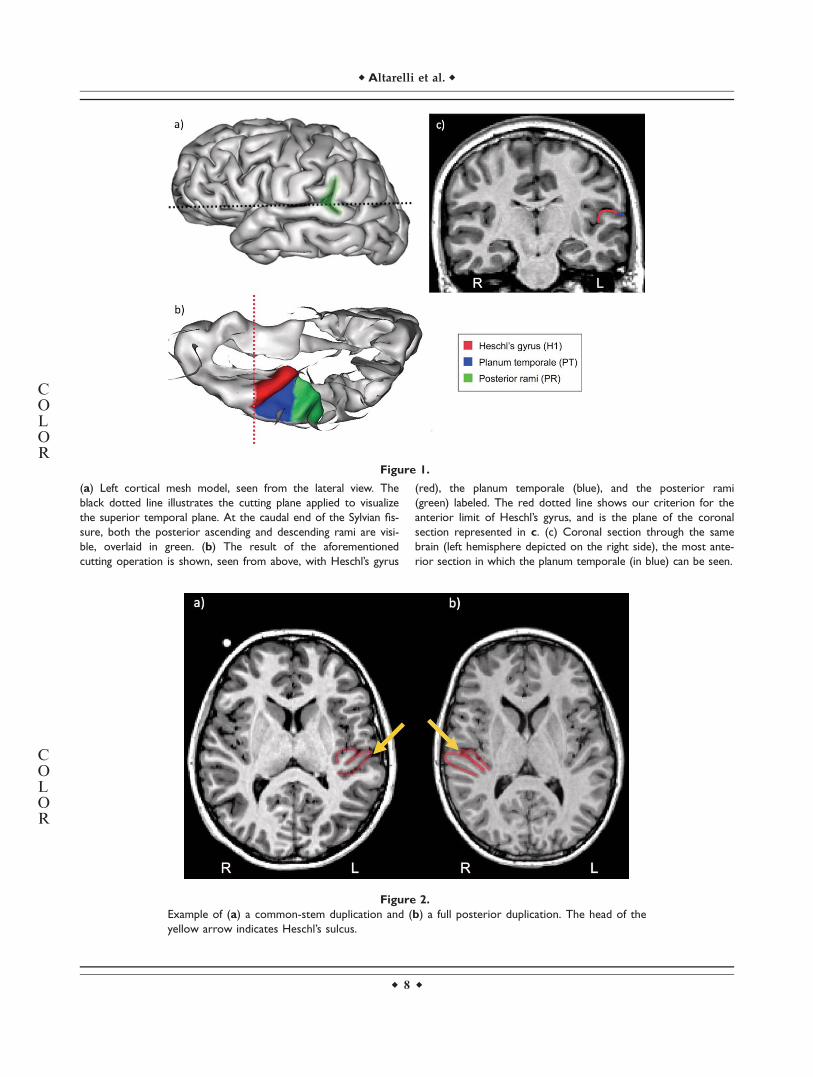
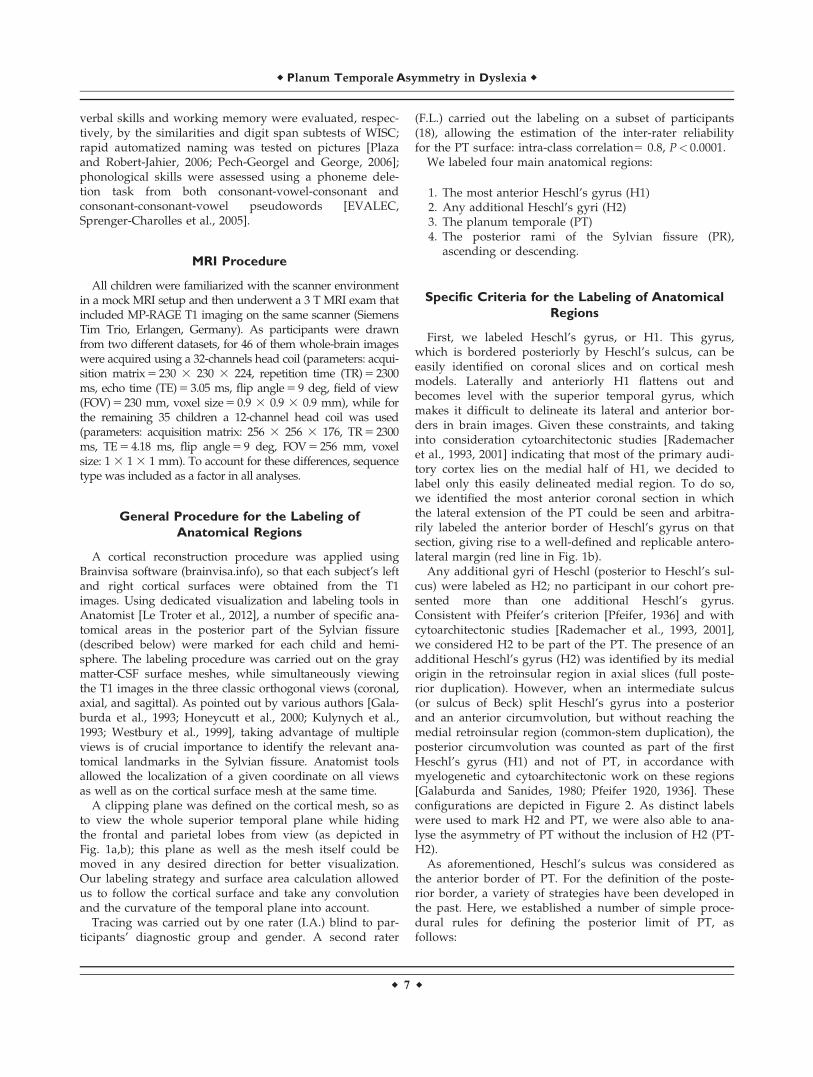
Figure 1.
(a) Left cortical mesh model, seen from the lateral view. The
black dotted line illustrates the cutting plane applied to visualize
the superior temporal plane. At the caudal end of the Sylvian fis-
sure, both the posterior ascending and descending rami are visi-
ble, overlaid in green. (b) The result of the aforementioned
cutting operation is shown, seen from above, with Heschl’s gyrus
(red), the planum temporale (blue), and the posterior rami
(green) labeled. The red dotted line shows our criterion for the
anterior limit of Heschl’s gyrus, and is the plane of the coronal
section represented in c. (c) Coronal section through the same
brain (left hemisphere depicted on the right side), the most ante-
rior section in which the planum temporale (in blue) can be seen.
COLOR
Figure 2.
Example of (a) a common-stem duplication and (b) a full posterior duplication. The head of the
yellow arrow indicates Heschl’s sulcus.
COLOR
r Altarelli et al. r
r 8 r
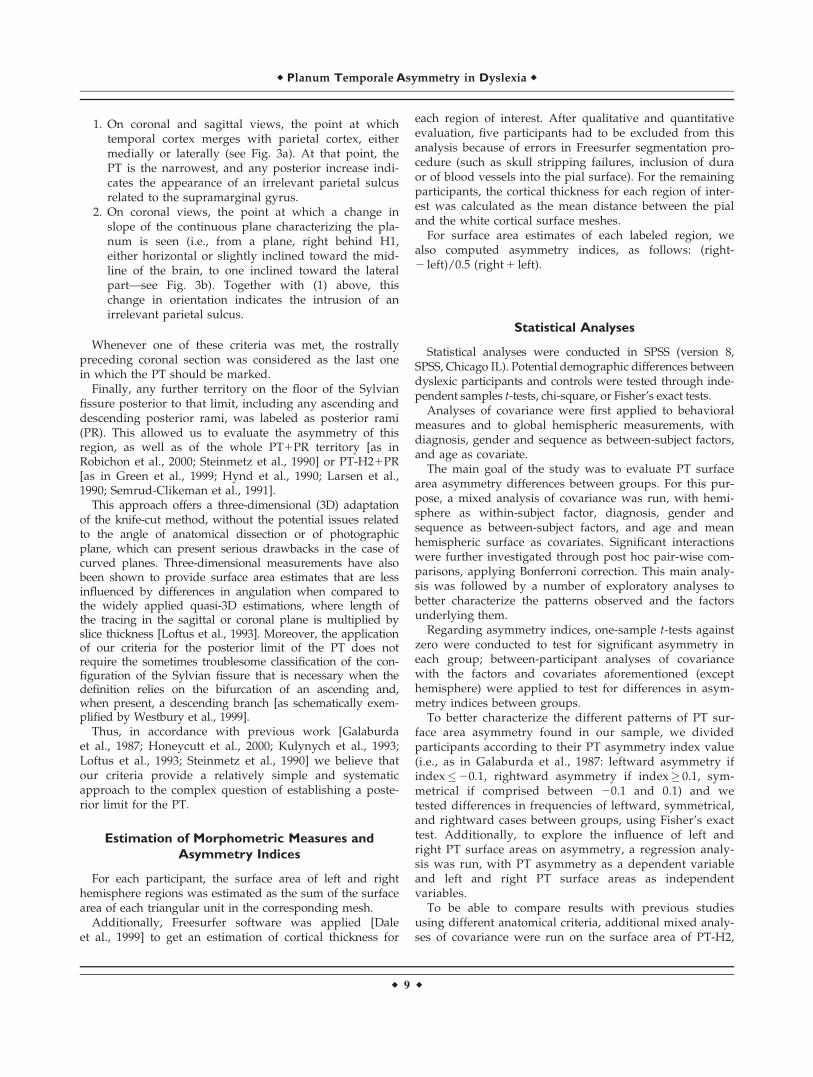
1. On coronal and sagittal views, the point at whichtemporal cortex merges with parietal cortex, eithermedially or laterally (see Fig. 3a). At that point, thePT is the narrowest, and any posterior increase indi-cates the appearance of an irrelevant parietal sulcusrelated to the supramarginal gyrus.
2. On coronal views, the point at which a change inslope of the continuous plane characterizing the pla-num is seen (i.e., from a plane, right behind H1,either horizontal or slightly inclined toward the mid-line of the brain, to one inclined toward the lateralpart—see Fig. 3b). Together with (1) above, thischange in orientation indicates the intrusion of anirrelevant parietal sulcus.
Whenever one of these criteria was met, the rostrallypreceding coronal section was considered as the last onein which the PT should be marked.
Finally, any further territory on the floor of the Sylvianfissure posterior to that limit, including any ascending anddescending posterior rami, was labeled as posterior rami(PR). This allowed us to evaluate the asymmetry of thisregion, as well as of the whole PT1PR territory [as inRobichon et al., 2000; Steinmetz et al., 1990] or PT-H21PR[as in Green et al., 1999; Hynd et al., 1990; Larsen et al.,1990; Semrud-Clikeman et al., 1991].
This approach offers a three-dimensional (3D) adaptationof the knife-cut method, without the potential issues relatedto the angle of anatomical dissection or of photographicplane, which can present serious drawbacks in the case ofcurved planes. Three-dimensional measurements have alsobeen shown to provide surface area estimates that are lessinfluenced by differences in angulation when compared tothe widely applied quasi-3D estimations, where length ofthe tracing in the sagittal or coronal plane is multiplied byslice thickness [Loftus et al., 1993]. Moreover, the applicationof our criteria for the posterior limit of the PT does notrequire the sometimes troublesome classification of the con-figuration of the Sylvian fissure that is necessary when thedefinition relies on the bifurcation of an ascending and,when present, a descending branch [as schematically exem-plified by Westbury et al., 1999].
Thus, in accordance with previous work [Galaburdaet al., 1987; Honeycutt et al., 2000; Kulynych et al., 1993;Loftus et al., 1993; Steinmetz et al., 1990] we believe thatour criteria provide a relatively simple and systematicapproach to the complex question of establishing a poste-rior limit for the PT.
Estimation of Morphometric Measures and
Asymmetry Indices
For each participant, the surface area of left and righthemisphere regions was estimated as the sum of the surfacearea of each triangular unit in the corresponding mesh.
Additionally, Freesurfer software was applied [Daleet al., 1999] to get an estimation of cortical thickness for
each region of interest. After qualitative and quantitativeevaluation, five participants had to be excluded from thisanalysis because of errors in Freesurfer segmentation pro-cedure (such as skull stripping failures, inclusion of duraor of blood vessels into the pial surface). For the remainingparticipants, the cortical thickness for each region of inter-est was calculated as the mean distance between the pialand the white cortical surface meshes.
For surface area estimates of each labeled region, wealso computed asymmetry indices, as follows: (right-2 left)/0.5 (right 1 left).
Statistical Analyses
Statistical analyses were conducted in SPSS (version 8,SPSS, Chicago IL). Potential demographic differences betweendyslexic participants and controls were tested through inde-pendent samples t-tests, chi-square, or Fisher’s exact tests.
Analyses of covariance were first applied to behavioralmeasures and to global hemispheric measurements, withdiagnosis, gender and sequence as between-subject factors,and age as covariate.
The main goal of the study was to evaluate PT surfacearea asymmetry differences between groups. For this pur-pose, a mixed analysis of covariance was run, with hemi-sphere as within-subject factor, diagnosis, gender andsequence as between-subject factors, and age and meanhemispheric surface as covariates. Significant interactionswere further investigated through post hoc pair-wise com-parisons, applying Bonferroni correction. This main analy-sis was followed by a number of exploratory analyses tobetter characterize the patterns observed and the factorsunderlying them.
Regarding asymmetry indices, one-sample t-tests againstzero were conducted to test for significant asymmetry ineach group; between-participant analyses of covariancewith the factors and covariates aforementioned (excepthemisphere) were applied to test for differences in asym-metry indices between groups.
To better characterize the different patterns of PT sur-face area asymmetry found in our sample, we dividedparticipants according to their PT asymmetry index value(i.e., as in Galaburda et al., 1987: leftward asymmetry ifindex�20.1, rightward asymmetry if index� 0.1, sym-metrical if comprised between 20.1 and 0.1) and wetested differences in frequencies of leftward, symmetrical,and rightward cases between groups, using Fisher’s exacttest. Additionally, to explore the influence of left andright PT surface areas on asymmetry, a regression analy-sis was run, with PT asymmetry as a dependent variableand left and right PT surface areas as independentvariables.
To be able to compare results with previous studiesusing different anatomical criteria, additional mixed analy-ses of covariance were run on the surface area of PT-H2,
r Planum Temporale Asymmetry in Dyslexia r
r 9 r
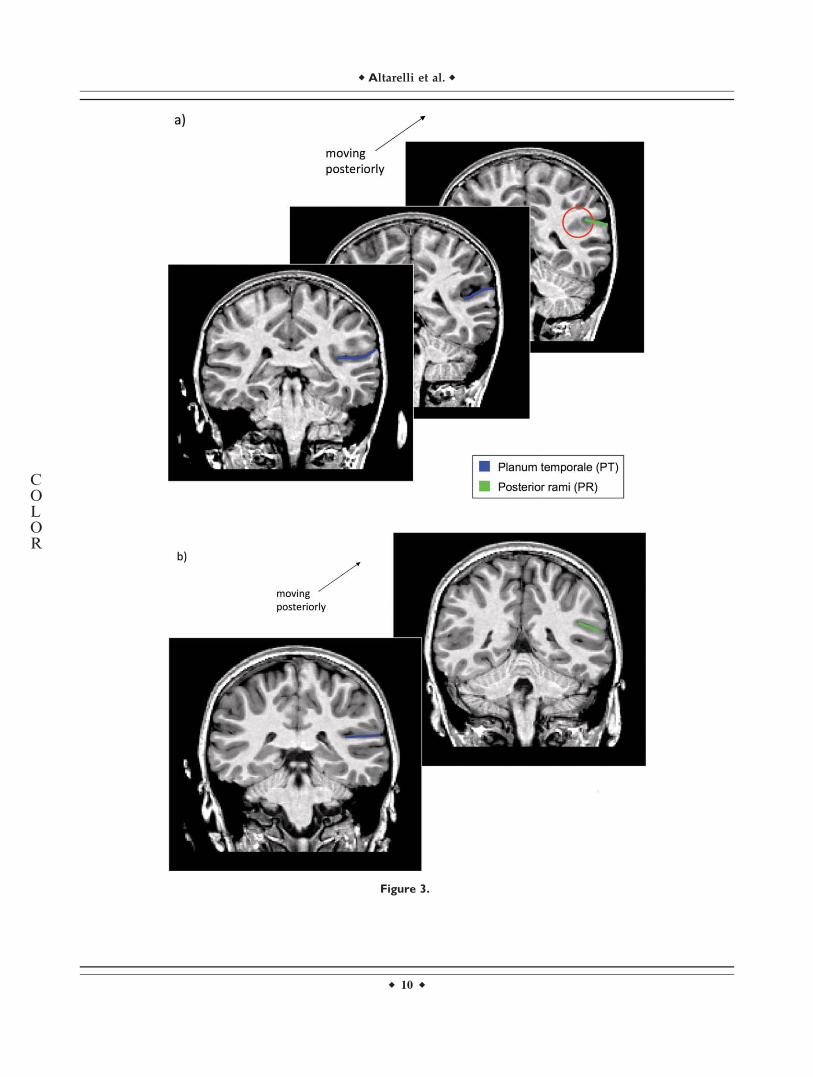
Figure 3.
COLOR
r Altarelli et al. r
r 10 r
H1 and PR as well as on combinations of these (PT1PRand PT-H21PR).
Finally, to explore potential differences in cortical thick-ness asymmetries in our sample, the same mixed analysesof covariance as above were applied to PT, H1, and PRcortical thickness, with the same factors as above andmean hemispheric cortical thickness and age as covariates.
RESULTS
Demographic and Behavioral Results
Control and dyslexic children were matched for age(t 5 20.48 P> 0.6), gender (v2(1, n 5 81) 5 0.06 P 5 0.8), andmaternal education (Fisher exact test P> 0.1). Concerningthe behavioral measures, as expected significant differen-ces between groups emerged in reading abilities, as wellas in verbal IQ, phonological awareness, working memory,and rapid automatized naming. Importantly, control anddyslexic participants did not differ in nonverbal IQ asmeasured by subtests of Wechsler’s WISC III or IV. Resultsare reported in Table II.
Additionally, a gender effect was found in reading abil-ities (reading lag F(1,72) 5 4.3 P 5 0.04), driven by differen-ces among controls (diagnosis 3 gender interaction F(1,72)
58.2 P 5 0.005), with girls presenting higher scores thanboys. However, it should be noted that no difference wasfound between dyslexic boys and girls in any of the afore-mentioned behavioral measures.
Cortical Surface Area Results
Significant differences were found for left and right cort-ical hemispheric surfaces (respectively, F(1,72) 53.8P 5 0.05; F(1,72) 54 P 5 0.05), with dyslexic participants pre-senting smaller global surface areas than controls [meanleft hemispheric surface: dyslexic children 885 cm2 (sd103), controls 944 cm2 (sd 106); right hemispheric surface:dyslexic children 884 cm2 (sd 103), controls 943 cm2 (sd105)]. This finding is in line with a number of reportsmeasuring brain volume in control and dyslexic partici-pants [Casanova et al., 2004; Eckert et al., 2003; Eckertet al., 2005; Eliez et al., 2000; but see Frye et al., 2010], ameasure known to be closely related to surface area bothphenotypically and genetically [Winkler et al., 2010]. Agender effect was also observed, with girls showingsmaller hemispheric surface areas than boys (leftF(1,72) 5 24.2 P< 0.001, right F(1,72) 5 23.8 P< 0.001). Meanhemispheric surface area was included in all analyses.
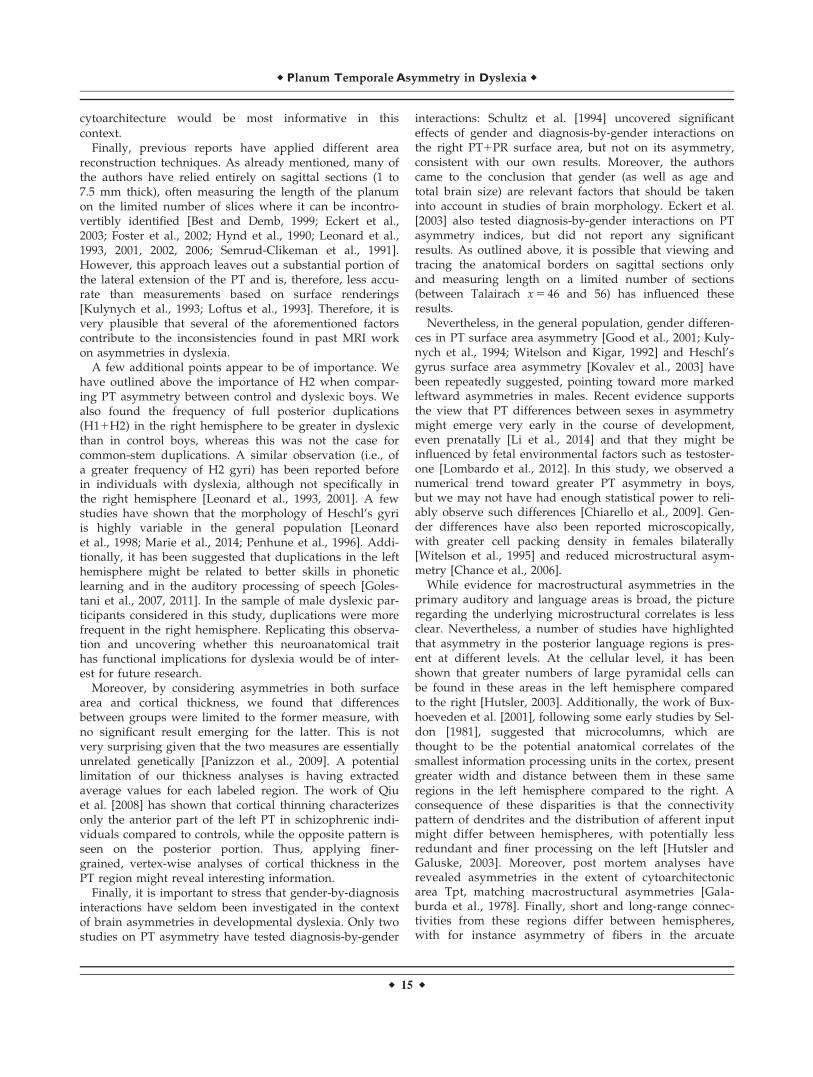
The main finding of the mixed analysis of covariance onPT surface area was a significant three-way interactionbetween gender, diagnosis, and hemisphere (F(1,71) 5 4.2,P 5 0.04). Further analyses revealed a diagnosis 3 hemi-sphere interaction in boys (F(1,39) 5 6.1, P 5 0.02), but not ingirls (F(1,30)< 1, P> 0.8). As shown in Figure 4, this interac-tion reflects an opposite asymmetry pattern in dyslexicboys (right PT> left PT, P 5 0.03) as compared to controlboys (left PT> right PT, P 5 0.05). It should be noted thatwithin each hemisphere there were no differences in PTsurface area between groups (left, F(1,71)51.2, P> 0.2; right,F(1,71) 5 1.4, P> 0.2), nor any diagnosis 3 gender interac-tions (left, F(1,71) 5 1, P 5 0.3; right, F(1,71) 51.8, P> 0.1).
The results of the mixed analyses of covariance for H1,PT, PT-H2, and PR surface area are presented in Table III.
When considering different subdivisions of the auditoryregions (PT-H2, PT1PR, and PT-H21PR), no significantresult emerged. This underlines in particular the roleplayed by H2 in determining the aforementioned PT sur-face area asymmetry results.
Cortical Surface Area Results: Asymmetry
Indices
Congruently with most previous literature, we also com-puted asymmetry indices. We used t-tests against zero toassess the significance of asymmetry for each labeledregion. These tests revealed significant leftward PT asym-metry (t(45)5-2.2 P 5 0.03) and H1 leftward asymmetry(t(45)523.6 P 5 0.001) in controls, while only H1 leftwardasymmetry (t(34)522.6, P 5 0.01) was significant in dys-lexic children.
Between-subject analyses of asymmetry indices con-firmed the aforementioned within-participants results forPT. No effect of diagnosis was observed (F(1,71)51.8,P> 0.1), but a significant diagnosis 3 gender interactionwas found (F(1,71) 5 4.6, P 5 0.04), while the same interac-tion was not significant for PT-H2 (F(1,71) 5 2.9, P 5 0.09).Post hoc analyses revealed a significant difference in PTasymmetry indices between control and dyslexic boys(P 5 0.01), but not between control and dyslexic girls(P> 0.6). Moreover, a significant diagnosis 3 gender inter-action was found for PR (F(1,71) 5 5.3, P 5 0.02), due to dif-ferences between dyslexic boys and girls (P 5 0.03), thatwere not observed in controls (P> 0.2).
To better characterize the distribution of PT asymmetrypatterns across participants, we divided participantsaccording to their PT asymmetry index value. Fisher’s
Figure 3.
(a) Series of coronal sections with the PT marked in blue. The red circle shows the fusion
between temporal and parietal lobes, which determines the posterior limit of the PT. (b) Coro-
nal sections. Left, the PT is marked in blue. Right, a change in slope of the continuous plane
characterizing the planum is seen, thus determining its posterior limit and the beginning of the
posterior ramus.
r Planum Temporale Asymmetry in Dyslexia r
r 11 r
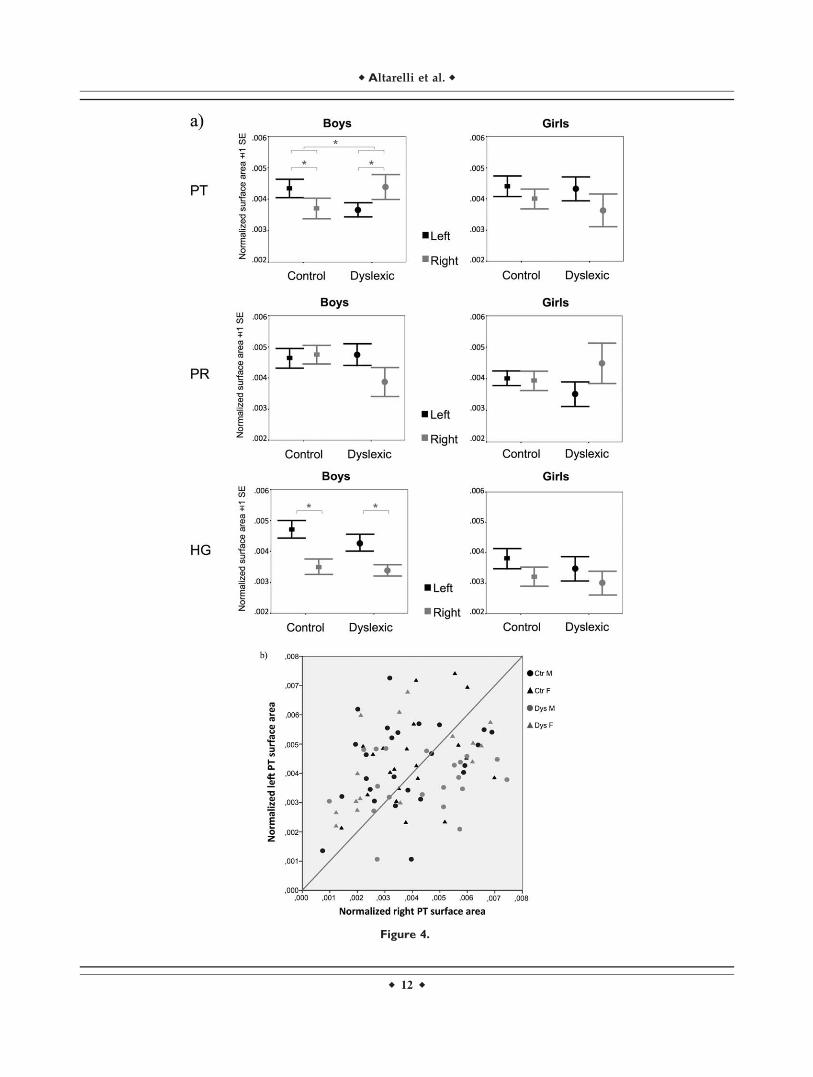
Figure 4.
r Altarelli et al. r
r 12 r
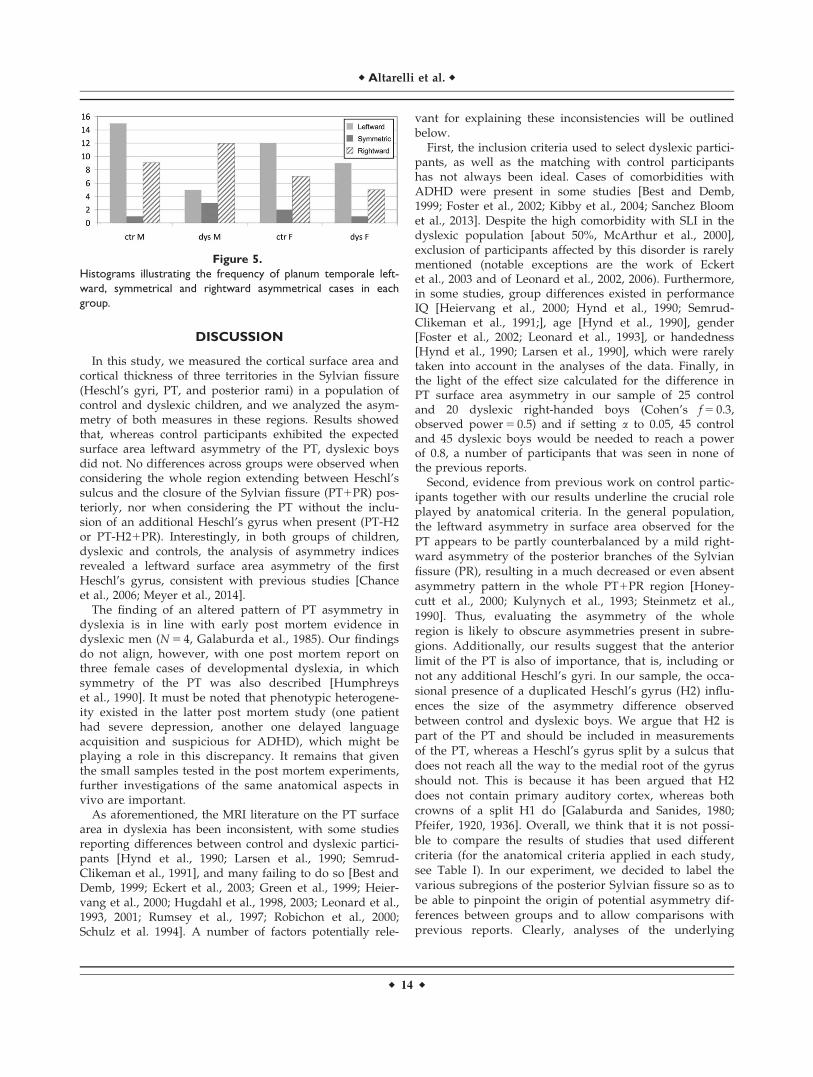
exact test revealed a significantly greater proportion ofrightward asymmetrical cases in dyslexic boys comparedto control boys (P 5 0.05, two-tailed), while no differenceexisted between dyslexic and control girls (P> 0.9, two-tailed). Histograms illustrating the frequencies of eachasymmetry category in control and dyslexic boys and girlsare presented in Figure 5.
Contribution of Right and Left PT Surface Area
to PT Asymmetry
Finally, to determine whether variations in PT asymmetrydepended on variations in left or right PT surface area or inboth, we ran a regression analysis on all participants, inwhich these two independent variables were entered intothe equation simultaneously. Both left and right PT surfaceareas were found to significantly predict PT asymmetry(R2 5 0.9), with right PT presenting a stronger weight thanleft PT (standardized b 5 0.96, P< 0.001; standardized b520.67, P< 0.001, respectively). Thus, both surfaces contrib-uted to explaining variance in PT asymmetry, although theright PT surface area did so to a greater extent than the left.
Cortical Thickness Results
We then ran the same set of analyses on cortical thick-ness as on surface area. No significant difference betweencontrol and dyslexic children was observed for left andright mean hemispheric cortical thickness (respectively,F(1,69) 5 3.6 P> 0.05; F(1,69) 5 3.7 P> 0.05), coherently withthe results of Frye et al. [2010].
The omnibus analyses for H1, PT, and PR cortical thick-ness did not reveal any significant difference betweengroups nor any significant interaction.
Common-Stem versus Full Posterior Duplication
Results
As we have mentioned in the Methods section, multi-ple configurations exist for Heschl’s gyri, which can besimple (H1 only), or exhibit a common-stem (variant ofH1 only) or full posterior duplication (H1 plus H2). Foreach subject, through careful examination of the brainimages in the three planes, we extracted the number ofHeschl’s gyri for left and right hemispheres. Given therole played by H2 in determining our surface area asym-metry results in dyslexic versus control boys, we ran aFisher exact test on these two groups, comparing thenumber of H1 and H11H2 configurations. A significantdifference between groups was found on the right hemi-sphere (P 5 0.03, two-tailed), with dyslexic boys showingmore H11H2 (4/20) than controls (0/25), while this wasnot the case on the left hemisphere (P 5 0.07, two-tailed:dyslexic boys 0/20, control boys 1/25). No differenceemerged for girls (left: P> 0.9, two-tailed, right: P> 0.5,two-tailed). Finally, the number of common-stem duplica-tions was not significantly different between control anddyslexic children, boys and girls (dyslexic versus controlboys, left hemisphere, P 5 0.3, two-tailed, right hemi-sphere, P> 0.9, two-tailed; dyslexic versus control girls,left hemisphere, P> 0.6, two-tailed, right hemisphere,P> 0.4, two-tailed).
Correlations with Behavioral Measures
Finally, no correlation between surface area nor corticalthickness asymmetry indices and behavioral measures wasidentified for the whole group, or within the dyslexic orcontrol groups.
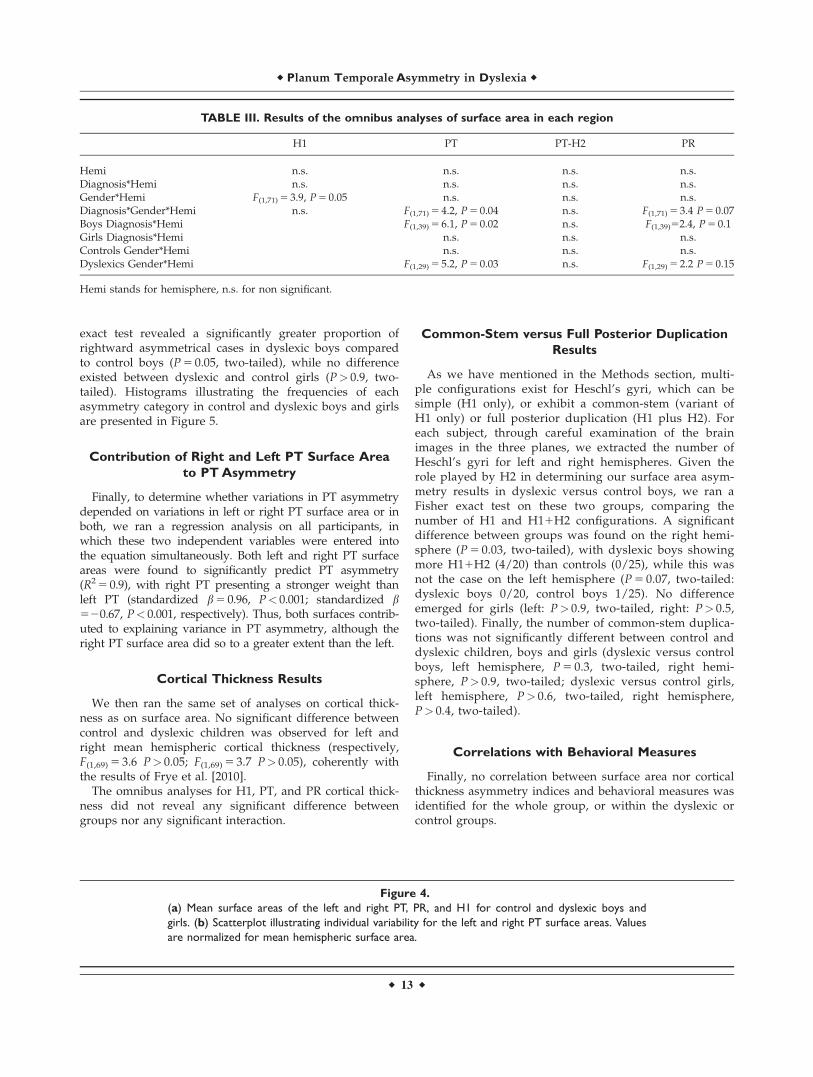
TABLE III. Results of the omnibus analyses of surface area in each region
H1 PT PT-H2 PR
Hemi n.s. n.s. n.s. n.s.Diagnosis*Hemi n.s. n.s. n.s. n.s.Gender*Hemi F(1,71) 5 3.9, P 5 0.05 n.s. n.s. n.s.Diagnosis*Gender*Hemi n.s. F(1,71) 5 4.2, P 5 0.04 n.s. F(1,71) 5 3.4 P 5 0.07Boys Diagnosis*Hemi F(1,39) 5 6.1, P 5 0.02 n.s. F(1,39)52.4, P 5 0.1Girls Diagnosis*Hemi n.s. n.s. n.s.Controls Gender*Hemi n.s. n.s. n.s.Dyslexics Gender*Hemi F(1,29) 5 5.2, P 5 0.03 n.s. F(1,29) 5 2.2 P 5 0.15
Hemi stands for hemisphere, n.s. for non significant.
Figure 4.
(a) Mean surface areas of the left and right PT, PR, and H1 for control and dyslexic boys and
girls. (b) Scatterplot illustrating individual variability for the left and right PT surface areas. Values
are normalized for mean hemispheric surface area.
r Planum Temporale Asymmetry in Dyslexia r
r 13 r
DISCUSSION
In this study, we measured the cortical surface area andcortical thickness of three territories in the Sylvian fissure(Heschl’s gyri, PT, and posterior rami) in a population ofcontrol and dyslexic children, and we analyzed the asym-metry of both measures in these regions. Results showedthat, whereas control participants exhibited the expectedsurface area leftward asymmetry of the PT, dyslexic boysdid not. No differences across groups were observed whenconsidering the whole region extending between Heschl’ssulcus and the closure of the Sylvian fissure (PT1PR) pos-teriorly, nor when considering the PT without the inclu-sion of an additional Heschl’s gyrus when present (PT-H2or PT-H21PR). Interestingly, in both groups of children,dyslexic and controls, the analysis of asymmetry indicesrevealed a leftward surface area asymmetry of the firstHeschl’s gyrus, consistent with previous studies [Chanceet al., 2006; Meyer et al., 2014].
The finding of an altered pattern of PT asymmetry indyslexia is in line with early post mortem evidence indyslexic men (N 5 4, Galaburda et al., 1985). Our findingsdo not align, however, with one post mortem report onthree female cases of developmental dyslexia, in whichsymmetry of the PT was also described [Humphreyset al., 1990]. It must be noted that phenotypic heterogene-ity existed in the latter post mortem study (one patienthad severe depression, another one delayed languageacquisition and suspicious for ADHD), which might beplaying a role in this discrepancy. It remains that giventhe small samples tested in the post mortem experiments,further investigations of the same anatomical aspects invivo are important.
As aforementioned, the MRI literature on the PT surfacearea in dyslexia has been inconsistent, with some studiesreporting differences between control and dyslexic partici-pants [Hynd et al., 1990; Larsen et al., 1990; Semrud-Clikeman et al., 1991], and many failing to do so [Best andDemb, 1999; Eckert et al., 2003; Green et al., 1999; Heier-vang et al., 2000; Hugdahl et al., 1998, 2003; Leonard et al.,1993, 2001; Rumsey et al., 1997; Robichon et al., 2000;Schulz et al. 1994]. A number of factors potentially rele-
vant for explaining these inconsistencies will be outlinedbelow.
First, the inclusion criteria used to select dyslexic partici-pants, as well as the matching with control participantshas not always been ideal. Cases of comorbidities withADHD were present in some studies [Best and Demb,1999; Foster et al., 2002; Kibby et al., 2004; Sanchez Bloomet al., 2013]. Despite the high comorbidity with SLI in thedyslexic population [about 50%, McArthur et al., 2000],exclusion of participants affected by this disorder is rarelymentioned (notable exceptions are the work of Eckertet al., 2003 and of Leonard et al., 2002, 2006). Furthermore,in some studies, group differences existed in performanceIQ [Heiervang et al., 2000; Hynd et al., 1990; Semrud-Clikeman et al., 1991;], age [Hynd et al., 1990], gender[Foster et al., 2002; Leonard et al., 1993], or handedness[Hynd et al., 1990; Larsen et al., 1990], which were rarelytaken into account in the analyses of the data. Finally, inthe light of the effect size calculated for the difference inPT surface area asymmetry in our sample of 25 controland 20 dyslexic right-handed boys (Cohen’s f 5 0.3,observed power 5 0.5) and if setting a to 0.05, 45 controland 45 dyslexic boys would be needed to reach a powerof 0.8, a number of participants that was seen in none ofthe previous reports.
Second, evidence from previous work on control partic-ipants together with our results underline the crucial roleplayed by anatomical criteria. In the general population,the leftward asymmetry in surface area observed for thePT appears to be partly counterbalanced by a mild right-ward asymmetry of the posterior branches of the Sylvianfissure (PR), resulting in a much decreased or even absentasymmetry pattern in the whole PT1PR region [Honey-cutt et al., 2000; Kulynych et al., 1993; Steinmetz et al.,1990]. Thus, evaluating the asymmetry of the wholeregion is likely to obscure asymmetries present in subre-gions. Additionally, our results suggest that the anteriorlimit of the PT is also of importance, that is, including ornot any additional Heschl’s gyri. In our sample, the occa-sional presence of a duplicated Heschl’s gyrus (H2) influ-ences the size of the asymmetry difference observedbetween control and dyslexic boys. We argue that H2 ispart of the PT and should be included in measurementsof the PT, whereas a Heschl’s gyrus split by a sulcus thatdoes not reach all the way to the medial root of the gyrusshould not. This is because it has been argued that H2does not contain primary auditory cortex, whereas bothcrowns of a split H1 do [Galaburda and Sanides, 1980;Pfeifer, 1920, 1936]. Overall, we think that it is not possi-ble to compare the results of studies that used differentcriteria (for the anatomical criteria applied in each study,see Table I). In our experiment, we decided to label thevarious subregions of the posterior Sylvian fissure so as tobe able to pinpoint the origin of potential asymmetry dif-ferences between groups and to allow comparisons withprevious reports. Clearly, analyses of the underlying
Figure 5.
Histograms illustrating the frequency of planum temporale left-
ward, symmetrical and rightward asymmetrical cases in each
group.
r Altarelli et al. r
r 14 r
cytoarchitecture would be most informative in thiscontext.
Finally, previous reports have applied different areareconstruction techniques. As already mentioned, many ofthe authors have relied entirely on sagittal sections (1 to7.5 mm thick), often measuring the length of the planumon the limited number of slices where it can be incontro-vertibly identified [Best and Demb, 1999; Eckert et al.,2003; Foster et al., 2002; Hynd et al., 1990; Leonard et al.,1993, 2001, 2002, 2006; Semrud-Clikeman et al., 1991].However, this approach leaves out a substantial portion ofthe lateral extension of the PT and is, therefore, less accu-rate than measurements based on surface renderings[Kulynych et al., 1993; Loftus et al., 1993]. Therefore, it isvery plausible that several of the aforementioned factorscontribute to the inconsistencies found in past MRI workon asymmetries in dyslexia.
A few additional points appear to be of importance. Wehave outlined above the importance of H2 when compar-ing PT asymmetry between control and dyslexic boys. Wealso found the frequency of full posterior duplications(H11H2) in the right hemisphere to be greater in dyslexicthan in control boys, whereas this was not the case forcommon-stem duplications. A similar observation (i.e., ofa greater frequency of H2 gyri) has been reported beforein individuals with dyslexia, although not specifically inthe right hemisphere [Leonard et al., 1993, 2001]. A fewstudies have shown that the morphology of Heschl’s gyriis highly variable in the general population [Leonardet al., 1998; Marie et al., 2014; Penhune et al., 1996]. Addi-tionally, it has been suggested that duplications in the lefthemisphere might be related to better skills in phoneticlearning and in the auditory processing of speech [Goles-tani et al., 2007, 2011]. In the sample of male dyslexic par-ticipants considered in this study, duplications were morefrequent in the right hemisphere. Replicating this observa-tion and uncovering whether this neuroanatomical traithas functional implications for dyslexia would be of inter-est for future research.
Moreover, by considering asymmetries in both surfacearea and cortical thickness, we found that differencesbetween groups were limited to the former measure, withno significant result emerging for the latter. This is notvery surprising given that the two measures are essentiallyunrelated genetically [Panizzon et al., 2009]. A potentiallimitation of our thickness analyses is having extractedaverage values for each labeled region. The work of Qiuet al. [2008] has shown that cortical thinning characterizesonly the anterior part of the left PT in schizophrenic indi-viduals compared to controls, while the opposite pattern isseen on the posterior portion. Thus, applying finer-grained, vertex-wise analyses of cortical thickness in thePT region might reveal interesting information.
Finally, it is important to stress that gender-by-diagnosisinteractions have seldom been investigated in the contextof brain asymmetries in developmental dyslexia. Only twostudies on PT asymmetry have tested diagnosis-by-gender
interactions: Schultz et al. [1994] uncovered significanteffects of gender and diagnosis-by-gender interactions onthe right PT1PR surface area, but not on its asymmetry,consistent with our own results. Moreover, the authorscame to the conclusion that gender (as well as age andtotal brain size) are relevant factors that should be takeninto account in studies of brain morphology. Eckert et al.[2003] also tested diagnosis-by-gender interactions on PTasymmetry indices, but did not report any significantresults. As outlined above, it is possible that viewing andtracing the anatomical borders on sagittal sections onlyand measuring length on a limited number of sections(between Talairach x 5 46 and 56) has influenced theseresults.
Nevertheless, in the general population, gender differen-ces in PT surface area asymmetry [Good et al., 2001; Kuly-nych et al., 1994; Witelson and Kigar, 1992] and Heschl’sgyrus surface area asymmetry [Kovalev et al., 2003] havebeen repeatedly suggested, pointing toward more markedleftward asymmetries in males. Recent evidence supportsthe view that PT differences between sexes in asymmetrymight emerge very early in the course of development,even prenatally [Li et al., 2014] and that they might beinfluenced by fetal environmental factors such as testoster-one [Lombardo et al., 2012]. In this study, we observed anumerical trend toward greater PT asymmetry in boys,but we may not have had enough statistical power to reli-ably observe such differences [Chiarello et al., 2009]. Gen-der differences have also been reported microscopically,with greater cell packing density in females bilaterally[Witelson et al., 1995] and reduced microstructural asym-metry [Chance et al., 2006].
While evidence for macrostructural asymmetries in theprimary auditory and language areas is broad, the pictureregarding the underlying microstructural correlates is lessclear. Nevertheless, a number of studies have highlightedthat asymmetry in the posterior language regions is pres-ent at different levels. At the cellular level, it has beenshown that greater numbers of large pyramidal cells canbe found in these areas in the left hemisphere comparedto the right [Hutsler, 2003]. Additionally, the work of Bux-hoeveden et al. [2001], following some early studies by Sel-don [1981], suggested that microcolumns, which arethought to be the potential anatomical correlates of thesmallest information processing units in the cortex, presentgreater width and distance between them in these sameregions in the left hemisphere compared to the right. Aconsequence of these disparities is that the connectivitypattern of dendrites and the distribution of afferent inputmight differ between hemispheres, with potentially lessredundant and finer processing on the left [Hutsler andGaluske, 2003]. Moreover, post mortem analyses haverevealed asymmetries in the extent of cytoarchitectonicarea Tpt, matching macrostructural asymmetries [Gala-burda et al., 1978]. Finally, short and long-range connec-tivities from these regions differ between hemispheres,with for instance asymmetry of fibers in the arcuate
r Planum Temporale Asymmetry in Dyslexia r
r 15 r
fasciculus [Takao et al., 2011]. The aforementioned factors(and especially microcolumn spacing and Tpt extent)could influence the PT surface area observed macroscopi-cally. Additionally, the number and length of connectionscould also exert some influence on the sulcal and gyralconfiguration of these areas [Van Essen et al., 1997], againimpacting what is measured as PT territory in brainimages.
One might hypothesize that asymmetry at some or all ofthe aforementioned microstructural levels might be dis-rupted in dyslexic males. Interestingly, indication of altera-tions in microcolumnar organization in the posteriorSylvian fissure of one dyslexic man exists, with increasedcolumnar width and cell spacing bilaterally [Casanovaet al., 2002], which might be related to the PT symmetryobserved in the same patient [Galaburda et al., 1985].Moreover, it is worth mentioning that post mortem workrevealed cortical anomalies in the brains of dyslexic indi-viduals in a number of areas, including the posterior Syl-vian fissure. The type of anomalies observed did notentirely coincide when examining male [Galaburda et al.,1985] and female [Humphreys et al., 1990] dyslexic individ-uals, as a greater number of myelinated glial scars charac-terized the brains of the latter, as opposed to ectopias inthe former. Thus, it is possible that different kinds of corti-cal anomalies in the brains of males and females with dys-lexia might be at the origin of different patterns of PTasymmetry. Further investigations of the potential micro-anatomical characteristics of the PT in dyslexic individualsare needed to fully understand the underpinnings of theasymmetry differences reported in the present experiments.
A final question regards the functional implications ofthe described anatomical abnormalities. If PT surface areareflects microscopic structure and connectivity at somelevel, it is conceivable that its alteration would impact localmicrocircuitry, thus potentially having local as well asbroader functional consequences. With the behavioral meas-ures assessed in this study, we were unable to uncover sig-nificant correlations between asymmetry and phonologicalor reading abilities. However, a recent study uncovered apositive correlation between left, but not right, PT surfacearea and performance in a phonemic categorization task, ina group of musicians [Elmer et al., 2013]. Recent MEG andfMRI-EEG work indicated cortical oscillations abnormalitiesin the dyslexic population, in particular a failure to showleft PT specialization for phoneme-level modulation fre-quencies [Lehongre et al., 2011, 2013], a deficit that couldwell be a consequence of abnormal interactions within andacross cortical columns [Giraud and Poeppel, 2012].
CONCLUSIONS
To conclude, by studying the morphometry of a fewregions in the Sylvian fissure, we have confirmed abnor-mal surface area asymmetry of the PT in dyslexic boys,but not in girls. These results also confirm that gender is
an essential factor to be taken into account in studies ofdevelopmental dyslexia [Altarelli et al., 2013; Evans et al.,2014]. Although based on a relatively large group of par-ticipants compared to previous studies, replication of theseresults will be needed, given the wealth of previous con-tradictory findings. To this end, we have stressed the cru-cial importance of both anatomical criteria and tracingstrategies applied, together with the fine selection andmatching of patients and control participants. Finally, totest the specific hypotheses formulated here and deepenour understanding of developmental dyslexia, furthercytoarchitectonic work or finer-grained MR imaging wouldbe of great interest.
ACKNOWLEDGMENTS
We thank Nadege Villiermet, Camille Chabernaud, LaureBricout and St�ephanie Iannuzzi for their contribution tostudy design and data collection, and Antoine Collomb-Clerc for his help with image preprocessing. We alsothank the clinical and technical staff at Bicetre Hospitaland at Neurospin centre for their contribution to childrentesting in a welcoming environment, and all children andfamilies for their participation.
REFERENCES
Altarelli I, Monzalvo K, Iannuzzi S, Fluss J, Billard C, Ramus F,Dehaene-Lambertz G (2013): A functionally guided approachto the morphometry of occipito-temporal regions in develop-mental dyslexia: Evidence for differential effects in boys andgirls. J Neurosci 33:11296–11301.
Barta PE, Pearlson GD, Brill LB 2nd, Royall R, McGilchrist IK,Pulver AE, Powers RE, Casanova MF, Tien AY, Frangou S,Petty RG (1997): Planum temporale asymmetry reversal inschizophrenia: Replication and relationship to gray matterabnormalities. Am J Psychiatry 154:661–667.
Best M, Demb JB (1999): Normal planum temporale asymmetry indyslexics with a magnocellular pathway deficit. Neuroreport10:607–612.
Buxhoeveden D, Switala A, Litaker M, Roy E, Casanova MF(2001): Lateralization of minicolumns in human planum tem-porale is absent in nonhuman primate cortex. Brain BehavEvol 57:349–358.
Casanova MF, Buxhoeveden DP, Cohen M, Switala AE, Roy EL(2002): Minicolumnar pathology in dyslexia. Ann Neurol 52:108–110.
Casanova MF, Araque J, Giedd J, Rumsey JM (2004): Reducedbrain size and gyrification in the brains of dyslexic patients. JChild Neurol 19:275–281.
Chance SA, Casanova MF, Switala AE, Crow TJ (2006): Minico-lumnar structure in Heschl’s gyrus and planum temporale:Asymmetries in relation to sex and callosal fiber number. Neu-roscience 143:1041–1050.
Chi JG, Dooling EC, Gilles FH (1977): Left-right asymmetries ofthe temporal speech areas of the human fetus. Arch Neurol 34:346–348.
r Altarelli et al. r
r 16 r
Chiarello C, Kacinik N, Manowitz B, Otto R, Leonard C (2004):Cerebral asymmetries for language: Evidence for structural-behavioral correlations. Neuropsychology 18:219–231.
Chiarello C, Welcome S, Halderman L, Towler S, Julagay J, OttoR, Leonard C (2009): A large-scale investigation of lateraliza-tion in cortical anatomy and word reading: Are there sex dif-ferences? Neuropsychology 23:210–222.
Dale AM, Fischl B, Sereno M (1999): Cortical surface-based analy-sis: I. Segmentation and surface reconstruction. Neuroimage 9:179–194.
Dorsaint-Pierre R, Penhune VB, Watkins KE, Neelin P, Lerch JP,Bouffard M, Zatorre RJ (2006): Asymmetries of the planumtemporale and Heschl’s gyrus: Relationship to language later-alization. Brain 129(Pt 5):1164–1176.
Dos Santos Sequeira S, Woerner W, Walter C, Kreuder F, LuekenU, Westerhausen R, Wittling RA, Schweiger E, Wittling W(2006): Handedness, dichotic-listening ear advantage, and gen-der effects on planum temporale asymmetry—A volumetricinvestigation using structural magnetic resonance imaging.Neuropsychologia 44:622–636.
Eckert MA, Leonard CM, Richards TL, Aylward EH, Thomson J,Berninger VW (2003): Anatomical correlates of dyslexia: Fron-tal and cerebellar findings. Brain 126(Pt 2):482–494.
Eckert MA, Leonard CM, Wilke M, Eckert M, Richards T,Richards A, Berninger V (2005): Anatomical signatures of dys-lexia in children: Unique information from manual and voxelbased morphometry brain measures. Cortex 41:304–315.
Eckert MA, Leonard CM, Possing ET, Binder JR (2006): Uncoupledleftward asymmetries for planum morphology and functionallanguage processing. Brain Lang 98:102–111.
Eliez S, Rumsey JM, Giedd JN, Schmitt JE, Patwardhan AJ, ReissAL (2000): Morphological alteration of temporal lobe gray mat-ter in dyslexia: An MRI study. J Child Psychol Psychiatry 41:637–644.
Elmer S, H€anggi J, Meyer M, J€ancke L (2013): Increased corticalsurface area of the left planum temporale in musicians facili-tates the categorization of phonetic and temporal speechsounds. Cortex 49:2812–2821.
Evans TM, Flowers DL, Napoliello EM, Eden GF (2014): Sex-spe-cific gray matter volume differences in females with develop-mental dyslexia. Brain Struct Funct 219:1041–1054.
Foster LM, Hynd GW, Morgan AE, Hugdahl K (2002): Planumtemporale asymmetry and ear advantage in dichotic listeningin Developmental Dyslexia and Attention-Deficit/Hyperactiv-ity Disorder (ADHD). JINS 8:22–36.
Foundas AL, Leonard CM, Gilmore R, Fennell E, Heilman KM(1994): Planum temporale asymmetry and language domi-nance. Neuropsychologia 32:1225–1231.
Foundas AL, Leonard CM, Hanna-Pladdy B (2002): Variability inthe anatomy of the planum temporale and posterior ascendingramus: Do right and left handers differ? Brain Lang 83:403–424.
Frye RE, Liederman J, Malmberg B, McLean J, Strickland D,Beauchamp MS (2010): Surface area accounts for the relation ofgray matter volume to reading-related skills and history ofdyslexia. Cereb Cortex 20:2625–2635.
Galaburda AM (1993): The planum temporale. Arch Neurol 50:457.
Galaburda A, Sanides F (1980): Cytoarchitectonic organization ofthe human auditory cortex. J Comp Neurol 190:597–610.
Galaburda AM, Sanides F, Geschwind N (1978): Human brain:Cytoarchitectonic left-right asymmetries in the temporal speechregion. Arch Neurol 35:812–817.
Galaburda AM, Sherman GF, Rosen GD, Aboitiz F, Geschwind N(1985): Developmental dyslexia: Four consecutive patients withcortical anomalies. Ann Neurol 18:222–233.
Galaburda AM, Corsiglia J, Rosen GD, Sherman GF (1987): Pla-num temporale asymmetry, reappraisal since Geschwind andLevitsky. Neuropsychologia 25:853–868.
Geschwind N, Levitsky W (1968): Human brain: Left-right asym-metries in temporal speech regions. Science 161:186–187.
Giraud AL, Poeppel D (2012): Cortical oscillations and speechprocessing: Emerging computational principles and operations.Nat Neurosci 15:511–517.
Golestani N, Molko N, Dehaene S, LeBihan D, Pallier C (2007):Brain structure predicts the learning of foreign speech sounds.Cereb Cortex 17:575–582.
Golestani N, Price CJ, Scott SK (2011): Born with an ear for dia-lects? Structural plasticity in the expert phonetician brain. JNeurosci 31:4213–4220.
Good CD, Johnsrude I, Ashburner J, Henson RN, Friston KJ,Frackowiak RS (2001): Cerebral asymmetry and the effects ofsex and handedness on brain structure: A voxel-based mor-phometric analysis of 465 normal adult human brains. Neuro-image 14:685–700.
Green R, Hutsler J, Loftus W, Tramo M, Thomas C, Silberfarb A,Nordgren R, Gazzaniga MS (1999): The caudal infrasylviansurface in dyslexia: Novel magnetic resonance imaging-basedfindings. Neurology 53:974–981.
Griffiths TD, Warren JD (2002): The planum temporale as a com-putational hub. Trends Neurosci 25:348–353.
Heiervang E, Hugdahl K, Steinmetz H, Inge Smievoll A,Stevenson J, Lund A, Ersland L, Lundervold A (2000): Planumtemporale, planum parietale and dichotic listening in dyslexia.Neuropsychologia 38:1704–1713.
Honeycutt NA, Musick A, Barta PE, Pearlson GD (2000): Measure-ment of the planum temporale (PT) on magnetic resonanceimaging scans. Psychiatry Res 98:103–116.
Hugdahl K, Heiervang E, Nordby H, Smievoll AI, Steinmetz H,Stevenson J, Lund A (1998): Central auditory processing, MRImorphometry and brain laterality: Applications to dyslexia.Scand Audiol Suppl 49:26–34.
Hugdahl K, Heiervang E, Ersland L, Lundervold A, Steinmetz H,Smievoll AI (2003): Significant relation between MR measuresof planum temporale area and dichotic processing of syllablesin dyslexic children. Neuropsychologia 41:666–675.
Humphreys P, Kaufmann WE, Galaburda AM (1990): Develop-mental dyslexia in women: Neuropathological findings in threepatients. Ann Neurol 28:727–738.
Hutsler JJ (2003): The specialized structure of human languagecortex: Pyramidal cell size asymmetries within auditory andlanguage-associated regions of the temporal lobes. Brain Lang86:226–242.
Hutsler JJ, Galuske RA (2003): Hemispheric asymmetries in cere-bral cortical networks. Trends Neurosci 26:429–435.
Hynd GW, Semrud-Clikeman M, Lorys AR, Novey ES, EliopulosD (1990): Brain morphology in developmental dyslexia andattention deficit disorder/hyperactivity. Arch Neurol 47:919–926.
J€ancke L, Steinmetz H (1993): Auditory lateralization and planumtemporale asymmetry. Neuroreport 5:169–172.
Keller SS, Roberts N, Garcia-Finana M, Mohammadi S, RingelsteinEB, Knecht S (2011): Can the language-dominant hemispherebe predicted by brain anatomy? J Cogn Neurosci 23:2013–2029.
r Planum Temporale Asymmetry in Dyslexia r
r 17 r
Kibby MY, Kroese JM, Morgan AE, Hiemenz JR, Cohen MJ, HyndGW (2004): The relationship between perisylvian morphologyand verbal short-term memory functioning in children withneurodevelopmental disorders. Brain Lang 89:122–135.
Kovalev VA, Kruggel F, von Cramon DY (2003): Gender and ageeffects in structural brain asymmetry as measured by MRI tex-ture analysis. Neuroimage 19:895–905.
Kulynych JJ, Vladar K, Jones DW, Weinberger DR (1993): Three-dimensional surface rendering in MRI morphometry: A studyof the planum temporale. J Comput Assist Tomogr 17:529–535.
Kulynych JJ, Vladar K, Jones D, Weinberger D (1994): Gender dif-ferences in the normal lateralization of the supratemporal cor-tex: MRI surface-rendering morphometry of Heschl’s gyrusand the planum temporale. Cerebral cortex 4:107–118.
Larsen JP, Hoien T, Lundberg I, Odegaard H (1990): MRI Evalua-tion of the size and symmetry of the planum temporale in ado-lescents with developmental dyslexia. Brain Lang 39:289–301.
Le Troter A, Auzias G, Coulon O (2012): Automatic sulcal lineextraction on cortical surfaces using geodesic path densitymaps. Neuroimage 61:941–949.
Lefavrais P (1965): Description, d�efinition et mesure de la dys-lexie. Utilisation du test "L’Alouette". Revue de PsychologieAppliqu�ee 15:33–44.
Lehongre K, Ramus F, Villiermet N, Schwartz D, Giraud AL(2011): Altered low-g sampling in auditory cortex accounts forthe three main facets of dyslexia. Neuron 72:1080–1090.
Lehongre K, Morillon B, Giraud AL, Ramus F (2013): Impairedauditory sampling in dyslexia: Further evidence from com-bined fMRI and EEG. Front Hum Neurosci 7:454.
Leonard CM, Voeller KKS, Lombardino LJ, Morris MK, HyndGW, Alexander AW, Andersen HG, Garofalakis M, HoneymanJC, Mao J, Agee OF, Staab EV. (1993): Anomalous cerebralstructure in dyslexia revealed with magnetic resonance imag-ing. Arch Neurol 50:461–469.
Leonard CM, Puranik C, Kuldau JM, Lombardino LJ (1998): Nor-mal variation in the frequency and location of human auditorycortex landmarks. Heschl’s gyrus: Where is it? Cereb Cortex 8:397–406.
Leonard CM, Eckert MA, Lombardino LJ, Oakland T, Kranzler J,Mohr CM, King WM, Freeman A (2001): Anatomical risk fac-tors for phonological dyslexia. Cereb Cortex 11:148–157.
Leonard CM, Lombardino LJ, Walsh K, Eckert MA, Mockler JL,Rowe LA, Williams S, DeBose CB (2002): Anatomical risk fac-tors that distinguish dyslexia from SLI predict reading skill innormal children. J Commun Disord 35:501–531.
Leonard CM, Eckert MA, Given B, Virginia B, Eden G (2006):Individual differences in anatomy predict reading and orallanguage impairments in children. Brain 129(Pt 12):3329–3342.
Li G, Nie J, Wang L, Shi F, Lyall A E, Lin W, Gilmore JH, Shen D(2014): Mapping longitudinal hemispheric structural asymme-tries of the human cerebral cortex from birth to 2 years of age.Cereb Cortex 24:1289–1300.
Loftus WC, Tramo MJ, Thomas CE, Green RL, Nordgren RA,Gazzaniga MS (1993): Three-dimensional quantitative analysisof hemispheric asymmetry in the human superior temporalregion. Cereb Cortex 3:348–355.
Lombardo MV, Ashwin E, Auyeung B, Chakrabarti B, Taylor K,Hackett G, Bullmore ET, Baron-Cohen S (2012): Fetal testoster-one influences sexually dimorphic gray matter in the humanbrain. J Neurosci 32:674–680.
Marie D, Jobard G, Crivello F, Perchey G, Petit L, Mellet E, JoliotM, Zago L, Mazoyer B, Tzourio-Mazoyer N: Descriptive anat-
omy of Heschl’s gyri in 430 healthy volunteers, including 198left-handers. Brain Struct Funct, in press.
McArthur GM, Hogben JH, Edwards VT, Heath SM, Mengler ED(2000): On the "specifics" of specific reading disability and specificlanguage impairment. J Child Psychol Psychiatry 41:869–874.
Meyer M, Liem F, Hirsiger S, J€ancke L, H€anggi J: Cortical surfacearea and cortical thickness demonstrate differential structuralasymmetry in auditory-related areas of the human cortex.Cereb Cortex, in press.
Moffat SD, Hampson E, Lee DH (1998): Morphology of the pla-num temporale and corpus callosum in left handers with evi-dence of left and right hemisphere speech representation.Brain 121(Pt 12):2369–2379.
Monzalvo K, Fluss J, Billard C, Dehaene S, Dehaene-Lambertz G(2012): Cortical networks for vision and language in dyslexicand normal children of variable socio-economic status. Neuro-image 61:258–274.
Panizzon MS, Fennema-Notestine C, Eyler LT, Jernigan TL, Prom-Wormley E, Neale M, Jacobson K, Lyons MJ, Grant MD, FranzCE, Xian H, Tsuang M, Fischl B, Seidman L, Dale A, KremenWS (2009): Distinct genetic influences on cortical surface areaand cortical thickness. Cereb Cortex 19:2728–2735.
Pech-Georgel C, George F (2006): Belo: Batterie d’�evaluation de lalecture et de l’orthographe. Marseille: Solal.
Penhune VB, Zatorre RJ, MacDonald JD, Evans AC (1996): Inter-hemispheric anatomical differences in human primary audi-tory cortex: Probabilistic mapping and volume measurementfrom magnetic resonance scans. Cereb Cortex 6:661–672.
Pfeifer RA (1920). Mylogenetisch-anatomische Untersuchungen€uber das kortikale Ende der H€orleitung. Acad Wiss 37:1–54.
Pfeifer RA (1936): Pathologie der H€orstrahlung und der kortikalenH€osph€are. In Handbuch der Neurologie, edited by O Bumkeund O Foerster. Berlin: Springer Verlag.
Plaza M, Robert-Jahier AM (2006): DRA enfants test ded�enomination rapide automatis�e. Paris: Adeprio.
Price CJ (2010): The anatomy of language: A review of 100 fMRIstudies published in 2009. Ann N Y Acad Sci 1191:62–88.
Qiu A, Vaillant M, Barta P, Ratnanather JT, Miller MI (2008):Region-of-interest-based analysis with application of corticalthickness variation of left planum temporale in schizophreniaand psychotic bipolar disorder. Hum Brain Mapp 29:973–985.
Rademacher J, Caviness VS Jr, Steinmetz H, Galaburda AM(1993): Topographical variation of the human primary cortices:Implications for neuroimaging, brain mapping, and neurobiol-ogy. Cereb Cortex 3:313–329.
Rademacher J, Morosan P, Schormann T, Schleicher A, Werner C,Freund HJ, Zilles K (2001): Probabilistic mapping and volumemeasurement of human primary auditory cortex. Neuroimage13:669–683.
Ratnanather JT, Poynton CB, Pisano DV, Crocker B, Postell E,Cebron S, Ceyhan E, Honeycutt NA, Mahon PB, Barta PE(2013): Morphometry of superior temporal gyrus and planumtemporale in schizophrenia and psychotic bipolar disorder.Schizophr Res 150:476–483.
Robichon F, Levrier O, Farnarier P, Habib M (2000): Developmen-tal dyslexia: Atypical cortical asymmetries and functional sig-nificance. Eur J Neurol 7:35–46.
Rumsey JM, Donohue BC, Brady DR, Nace K, Giedd JN,Andreason P (1997): A magnetic resonance imaging study ofplanum temporale asymmetry in men with developmentaldyslexia. Arch Neurol 54:1481–149.
r Altarelli et al. r
r 18 r
Sanchez Bloom J, Garcia-Barrera MA, Miller CJ, Miller SR,Hynd GW (2013): Planum temporale morphology in childrenwith developmental dyslexia. Neuropsychologia 51:1684–1692.
Schultz RT, Cho NK, Staib LH, Kier LE, Fletcher JM, Shaywitz SE,Shankweiler DP, Katz L, Gore JC, Duncan JS, Shaywitz BA.(1994): Brain morphology in normal and dyslexic children: Theinfluence of sex and age. Ann Neurol 35(6):732–42.
Seldon HL (1981): Structure of human auditory cortex I:Cytoarchitectonics and dendritic distributions. Brain Res 229:277–294.
Semrud-Clikeman M, Hynd GW, Novey ES, Eliopulos D (1991):Dyslexia and brain morphology: Relationships between neuro-anatomical variation and neurolinguistic tasks. Learn IndividDiffer 3:225–242.
Sommer IE, Aleman A, Somers M, Boks MP, Kahn RS (2008): Sexdifferences in handedness, asymmetry of the planum tempo-rale and functional language lateralization. Brain Res 1206:76–88.
Sprenger-Charolles L, Col�e P, B�echennec D, Kipffer-Piquard A(2005): French normative data on reading and related skillsfrom EVALEC, a new computerized battery of tests. RevueEurop�eenne de Psychologie Appliqu�ee 55:157–186.
Steinmetz H, J€ancke L, Thron A (1990): Total surface of temporo-parietal lntrasylvian cortex: Diverging left-right asymmetries.Brain Lang 39:357–72.
Steinmetz H, Volkmann J, J€ancke L, Freund HJ (1991): Anatomicalleft-right asymmetry of language-related temporal cortex is dif-ferent in left and right-handers. Ann Neurol 29:315–319.
Takao H, Abe O, Yamasue H, Aoki S, Sasaki H, Kasai K,Yoshioka N, Ohtomo K (2011): Gray and white matter asym-metries in healthy individuals aged 21–29 years: A voxel-basedmorphometry and diffusion tensor imaging study. Hum BrainMapp 32:1762–1773.
Van Essen DC (1997): A tension-based theory of morphogenesisand compact wiring in the central nervous system. Nature 385:313–318.
Wada JA, Clarke R, Hamm A (1975): Cerebral hemispheric asym-metry in humans. Cortical speech zones in 100 adults and 100infant brains. Arch Neurol 32:239–246.
Wechsler D (2005): WISC-IV: Echelle d’Intelligence de Wechslerpour Enfants – Quatrieme Edition. Paris: Editions du Centrede Psychologie Appliqu�ee.
Westbury CF, Zatorre RJ, Evans AC (1999): Quantifying variabilityin the planum temporale: A probability map. Cereb Cortex 9:392–405.
Winkler AM, Kochunov P, Blangero J, Almasy L, Zilles K, Fox PT,Duggirala R, Glahn DC (2010): Cortical thickness or grey mat-ter volume? The importance of selecting the phenotype forimaging genetics studies. Neuroimage 53:1135–1146.
Witelson SF, Kigar DL (1992): Sylvian fissure morphology andasymmetry in men and women: Bilateral differences in relationto handedness in men. J Comp Neurol 323:326–40.
Witelson SF, Pallie W (1973): Left hemisphere specialization forlanguage in the newborn. Neuroanatomical evidence of asym-metry. Brain 96:641–646.
Witelson SF, Glezer II, Kigar DL (1995): Women have greater den-sity of neurons in posterior temporal cortex. J Neurosci 15(Pt1):3418–3428.
r Planum Temporale Asymmetry in Dyslexia r
r 19 r
Related Documents