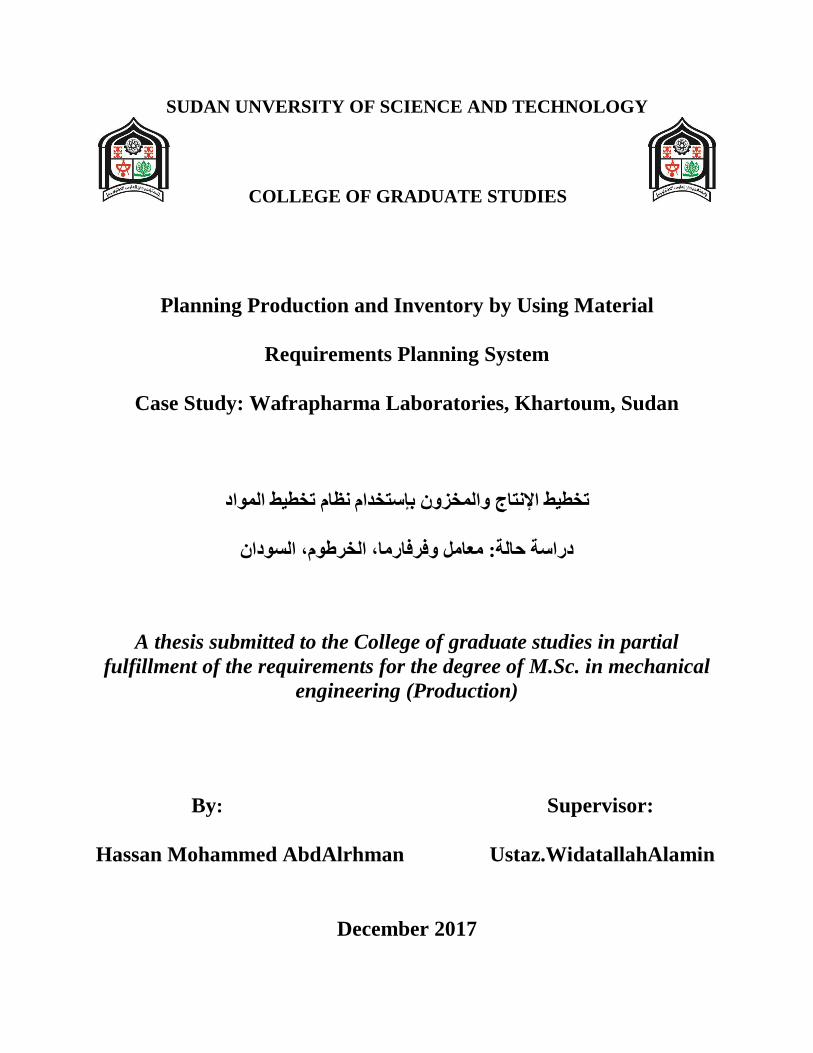
SUDAN UNVERSITY OF SCIENCE AND TECHNOLOGY COLLEGE OF GRADUATE STUDIES Planning Production and Inventory by Using Material Requirements Planning System Case Study: Wafrapharma Laboratories, Khartoum, Sudan يط نظام تخط المواديط تخطنتاج ا والمخزون بإ ستخذام، الخرطوم، السودانفارماة: معامل وفرسة حال دراA thesis submitted to the College of graduate studies in partial fulfillment of the requirements for the degree of M.Sc. in mechanical engineering (Production) By: Supervisor: Hassan Mohammed AbdAlrhman Ustaz.WidatallahAlamin December 2017

Welcome message from author
This document is posted to help you gain knowledge. Please leave a comment to let me know what you think about it! Share it to your friends and learn new things together.
Transcript
SUDAN UNVERSITY OF SCIENCE AND TECHNOLOGY
COLLEGE OF GRADUATE STUDIES
Planning Production and Inventory by Using Material
Requirements Planning System
Case Study: Wafrapharma Laboratories, Khartoum, Sudan
المواد نظام تخطيط ستخذامبإ والمخزون اإلنتاج تخطيط
دراسة حالة: معامل وفرفارما، الخرطوم، السودان
A thesis submitted to the College of graduate studies in partial
fulfillment of the requirements for the degree of M.Sc. in mechanical
engineering (Production)
By: Supervisor:
Hassan Mohammed AbdAlrhman Ustaz.WidatallahAlamin
December 2017

I
ةـــــــــــــاآلي
اآلية
الرحيم الرحمن الله بسم
ڀ پ( 2) پ پ( 1) ٻ ٻ ٻ ٱ نث
مث( 4)ٿ ٺ ٺ ٺ ٺ(3)ڀ ڀ
صدق اهلل العظيم
خالصاإل سورة

II
Dedication
To my Parent with much love
To my Brother and Sister
For their inspiration and encouragement with much gratitude
an affections that I can’t well put down here.

III
Acknowledgements
I would like to thank my Supervisor for his professional advice
and assistance Ustaz.Widatallah Alamin served as a mentor
and directed me along the traveled path and he surrendered
many valuable days revising my work.
My friend AbdAlrhmanAbaas He always seemed to know
when to encourage me to work on this research or do
something interesting. Full thanks to my wife Heba best
flower in my life.
MY brothers and sisters were great friends, and for all in Wafrapharma
laboratories.
IV
Abstract
Competition pressures are forcing manufacturing companies to
continuously seek new ways to manage their production capabilities more
effectively in order to meet the demands of the market. In addition, to
fulfillment of consumer needs and faster delivery times require efficient
manufacturing controls and planning to ensure that productivity is maintained,
stocks are minimized and resources are optimized.
Part of management's drive in an organization is to ensure future
sustainability. This involves the introduction and ongoing investment into
advanced computerized information systems that can assist management across
core production functions. This includes inventory control, order management,
production scheduling and financial management and the cross-linking thereof.
One such system that supports these activities is MRP.
This research aims at illustrating how production is planned with the
material requirements planning MRP as this system includes benefits and
multiple objectives. Also, it is an attempt to apply this system on wafrapharma
laboratories industrial firm. The context of this company was studied before and
after the implementation of MRP. The guidelines for successful system
implementation are the level of MRP usage in the company, the problems
encountered, and the resulting benefits. Some of the findings indicate that the
MRP system reduces inventories, improves deliveries, and achieves better
planning and control. This study concluded that the MRP system allows the
firm to plan at a strategic level by identifying the manufacturing and sales plans
of products.
V
صالمستخل
الشسكات الصىاعة إلي البحث باسحمساز عنه طنسج يدندد رةازد اندزاج ا ججبسالضغوط الحىافسة
مسننح نه ويواعنند ج بننة ايحايننات الو اروحايننة ع نني وحننو عكلننس ف الننة يننه عيننت ج بننة يح بننات السننوج
ان الحفنننال ع ننني اروحاينننة وج نننتالحسننن أل اعسنننسب جح نننع لنننوابظ ف النننة ل حصنننى والح نننظ لضنننم
.الموازة الم زووات وجحسه
وونرا ى نو ع ني إة نا .مىظمنة ونو لنمان ادسنحداية فن المسنح بتالارةازد ف ةاف يزء يه
ة المح دينة الحن مننه عن جسناعد ارةازد عبنس ولنا سحمساز ادسنحلماز فن وظنأل الم وينات المحوسنبوإ
.وشمت ذلك يساابة الم زون يدولة اروحناج وارةازد المالنة والنسبظ المحبناة بى منا .اروحاج اعساسة
.(MRP)دعأل وري اعوش ة ج ظ إيحايات المواة ويه به وري الىظأل الح ج
يحايننات المننواةاظ لإلوحنناج ينن يح بننات ج ننظ و ننده وننرا البحننث إلنني جولننت كفننة الح نن
(MRP) كما عو ا يحاولة لح بق ورا الىظام ع ي ي حبسات .يث حضمه ورا الىظام فوا د وعودافا يح دةد
المبناة الحوي نة لحىفنر الىظنام .(MRP)ةزسىا ساج وري الشسكة ابت وب د جىفر وافسيازيا الصىاعة
وجشس ب ض .ف الشسكة والمشاكت الح واي ح ا والفوا د الىاججة (MRP)م الىايت و يسحوى اسح دا
فن اروحناج ت الم زووات وحسه الحس أل وح ق ج ا وجحننأل عفضنت (MRP)الىحا ج إلي عن وظام
سنننمت ل شنننسكة بنننالح ظ ع ننني المسنننحوى (MRP)و صنننث ونننري الدزاسنننة إلننني عن وظنننام والم زون.
.ال جحدد ظ الحصى والمب ات ل مىحجاتادسحساجج يه
VI
Contents
List of Contents
I….…..…………………………………………………………………اـــــــــــــة
Dedication………………………………………………………………………II
Acknowledgements…………………………………………………………….III
Abstract………………………………………………………………………...IV
V…………………………………………………………………………المسح ص
Contents………………………………………………………………………..VI
List of figures………………………………………………………………...…X
List of Tables……………………………………………………………….….XI
Chapter One
Introduction
1.1 General Introduction:……………………………………………………….. 1
1.2 Problem Statement:…………………………………………………………. 2
1.3 Research Objectives:………………………………………………………… 2
1.4 Importance of the study:……………………………………………………. 2
1.5 Research Scope:…………………………………………………………….. 2
1.6 Research Methodology:…………………………………………………….. 2
1.7 Research layout:……………………………………………………………. 3
VII
Chapter Two
The Theoretical Framework and Previous Studies
2.1 Preface:……………………………………………………………………. 4
2.2 Types of Inventories:………………………………………………………. 6
2.3 Types of Inventory Management Systems:………………………………… 6
2.3.1 Minimum Stock Levels (perpetual system):……………………………… 7
2.3.2 Just In Time (JIT):………………………………………………………… 7
2.3.3 Economic Order Quantity (EOQ):……………………………………….. 8
2.3.4 Safety Stock (SS):………………………………………………………… 9
2.3.5 Last in First Out (LIFO) and First in First Out (FIFO):……………………. 10
2.3.6 Vendor Managed Inventory (VMI):……………………………………….. 10
2.3.7 ABC Method:……………………………………………………………… 11
2.3.8 Material Requirements Planning (MRP):…………………………………. 12
2.4 Definition of MRP System:………………………………………………….. 13
2.5 The scope of MRP in manufacturing:……………………………………… 16
2.6 Classes of MRP user/companies:…………………………………………… 17
2.7 Types of firms / organizations that MRP can be applied:……………………. 17
2.8 Conditions for implementation MRP:……………………………………….. 19
2.9 Implementation Procedure of MRP:…………………………………………. 20
VIII
2.9.1 Steps / Phases of a MRP project:…………………………………………. 20
2.9.2 Inputs to a Standard MRP Program:………………………………………. 20
2.9.3 MRP Computer Program:…………………………………………………. 21
2.9.4 Output Reports:……………………………………………………………. 21
2.9.5 Partial techniques and tools included in each step:………………………… 22
2.10 MRP Processing:…………………………………………………………… 22
2.11 Benefits of MRP:…………………………………………………………… 24
2.12 Previous Studies:……………………………………………………………. 25
Chapter Three
Research Methodology
3.1 Preface:………………………………………………………………………. 27
3.2 Research approach:…………………………………………………………. 27
3.3 Sample and data gathering:………………………………………………… 28
3.4 Procedures:…………………………………………………………………… 28
3.5 Basic flowchart depicting an MRP system:………………………………….. 28
3.5.1 Establish Master Production Schedule (MPS):…………………………….. 29
3.5.2 Establish Bill of Materials (BOM):……………………………………… 30
3.5.3 Establishing Inventory Status File:………………………………………… 33
3.6 Running the MRP Program:…………………………………………………. 34
3.7 Limitations:…………………………………………………………………. 34
IX
Chapter Four
Results and Discussions
4.1 General description of Wafrapharma Laboratories:…………………………. 35
4.2 Suppliers of Raw Materials:……………………………………………….. 35
4.3 Implement MRP Program on Wafrapharma:………………………………… 36
4.3.1 Overview of steps:…………………………………………………………. 36
4.3.2 Steps in Details:……………………………………………………………. 36
Chapter Five
Conclusions and Recommendations
5.1 Conclusions:…………………………………………………………………. 42
5.2 Recommendations:………………………………………………………….. 42
References.………………………………………………………………………. 43
X
List of figures
Fig. (2.1) Economic Order Quantity .......................................................................... 8
Fig. (2.2) Simple Deterministic Inventory Model Based on Fixed Demand Lead
Time ........................................................................................................................... 9
Fig. (2.3) Map of Vendor Managed Inventory System ...........................................11
Fig.(2.4): Graphical Representation of ABC Method .............................................12
Fig.(2.5) Flow of a MRP system ..............................................................................13
Fig. (2.6) MRP in context with production management processes ........................15
Fig (2.7). Overall View of the Inputs to a Standard Material Requirements
Program and the Reports Generated by the Program ..............................................16
Fig. (3.1) flowchart depicting an MRP system ........................................................29
Fig (4.1) Daily Production Sheet .............................................................................37
Fig (4.2) Master Production Schedule (MPS) .........................................................37
Fig (4.3) Raw Materials Sheet .................................................................................38
Fig (4.4) Bill of Materials (BOM) sheet ..................................................................38
Fig (4.5) Inventory Status sheet ...............................................................................39
Fig (4.6) Orders sheet...............................................................................................40
Fig (4.7) primary reports in graphic .........................................................................40
XI
List of Tables
Table.(2.1) Industry Applications and Expected Benefits of MRP .........................81
Table (3.1) Master Production Schedule .................................................................18
Table (3.2) Bill of Materials of product Wafrazole .................................................13
Table (3.3) Bill of Materials of product Waframic ..................................................13
Table (3.4) Bill of Materials of product Wafrapect .................................................11
Table (3.5) Bill of Materials of product Wafrastin ..................................................13
Table (3.6) Inventory status file ...............................................................................13
Table (4.1) Wafrapharma list of product. ...............................................................11
Chapter One
Introduction
1
1.1 General Introduction:
The current century witnessed remarkable development in all its fields.
The most important of these was the technological development of information,
the complexity of processes, and the change in the business environment. Thus,
the need for companies to develop sophisticated information systems to meet
their growing needs and requirements of their customers and increase
profitability and achieve the competitive advantages.
The material requirements planning (MRP) system was introduced at the
beginning of 1960 in the United States as a computerized method for planning
the process of obtaining materials, controlling production, placing orders and
reducing inventory to the minimum to achieve competitive advantage in the
modern industrial environment.
It is considered one of the most recent intellectual and applied trends in the
fields of production and inventory. It is a new and alternative approach to
production planning systems and traditional stocks such as production batch
models, economic demand quantity and demand reuse point. These systems are
characterized by many shortcomings due to unrealistic assumptions based on
demand volume and rates use and ignore the influence of environmental factors
and variables on production planning and operations.
The concept and philosophy of the material needs planning system is an
information system that organizes efforts to obtain the right materials in a
timely manner or in other words provide all the production process
requirements that are specified for the products listed in the main production
schedule in a timely manner (These may be basic raw materials or non-finished
products). This system was a major revolution in its early days. It introduced
computers and organized planning in the production process.
2
1.2 Problem Statement:
The research problem involved the inventory control on wafrapharma
laboratories industrial firm.
1.3 Research Objectives:
The primary research objective is to establish a Material Requirement
Planning (MRP) system within wafrapharma laboratories industrial firm.
1.4 Importance of the study:
Planning and control of material requirements is the essence of production
systems. Due to the high importance of materials and the high proportion of
total production costs, planning and control is the basis for successful operations
management in achieving its objectives by increasing efficiency of resource
utilization or reducing inventory and improving customer service through
delivery on time and reduce delays.
1.5 Research Scope:
The research aimed to determine the need for a MRP system at
wafrapharma laboratories industrial firm. The scope of this study was limited to
wafrapharma laboratories industrial firm and only included data from this
organization.
1.6 Research Methodology:
This research depends on descriptive and analytical methods to enable the
description and simplification of the subject to reach the objectives of this study
and know its various aspects and analyze its dimensions. A case-study approach
was followed, with wafrapharma pharmaceutical laboratories as the case study
organization.
3
Excel is used as computer software for design and implementation of
Material Requirements planning within wafrapharma pharmaceutical
laboratories is selected as case study.
1.7 Research layout:
In this section a brief description of the contents of the research chapters
are presented as following:
Chapter one: Gives a generic description of MRP and states the problem of
the research, objective, Importance of the study, methodology and general
search layouts. Chapter two: The Theoretical Framework of MRP, Inventory
Management and Previous Studies. Chapter three: Research Methodology,
Research approach, Sample and data gathering, Procedures and limitations.
Chapter four: Results and Discussions. Chapter Five: A conclusion presented in
addition to recommendations.
Chapter Two
The Theoretical Framework and Previous Studies
4
2.1 Preface:
Inventory Management, also called Inventory control, is a company‟s
efforts to comprehend the minimal cost and levels of inventory held in
which they can still meet demand. Many balancing acts must be constantly
addressed and monitored within inventory management. For companies
such as wafrapharma pharmaceutical laboratories, thousands of parts‟
inventory levels must be maintained, but depending on how often the part is
used these inventory levels differ. A tool many firms use to gauge their
proficiency at allotting inventory levels is the inventory turnover ratio. The
inventory turnover ratio is equal to sales divided by inventory and it
represents the amount of times inventory is sold and replaced over a given
period of time. [1] While many companies strive to reduce inventory
turnover ratios, they must not sacrifice service and lead times in order to do
so. Not enough inventory results in back ordering, while too much
inventory can result in getting caught with obsolete goods and large
expenses.
One of the most important aspects to inventory management is purchase
planning and raw material management. The first decision within this is
deciding how long the inventory will last Depending on the raw material and
the type of inventory management system, purchase planning can be done on
a number of different scales; weekly, biweekly, monthly, tri-monthly, etc.
For industries with fluctuating demand, planning and material ordering must
be done much more rapidly. The next decision of choosing the level of
inventory per order will depend on how often a company receives material
shipments. The level of raw material inventory must be adequate to meet the
production plan. [2]
5
Over the years inventory management has made many strides, and today
there are many different methods to managing a company‟s inventory, such as
MRP or JIT. Because demand, product and type differ so much industry-to-
industry, a method that is best for one company to reduce inventory while
increasing service may not be ideal for another company in a different industry.
While each system‟s methods on reaching optimal inventory levels differ,
they are all built upon the foundation of constant inventory monitoring and
improving, as well as the recording and analysis of past inventory levels
compared to business success and units produced/ shipped.
Material Requirements Planning (MRP) started in the late 1960s. The
technique was applied first to mobile and airplane industry. As the technique
became well known, many large and small businesses adopted MRP method in
order to increase their productivity and decrease the production cost.
Material requirement planning (MRP) is a key element in managing
resources in a manufacturing environment. MRP systems were developed to
help companies manage dependent demand inventory and schedule
replenishment orders. MRP systems have proven to be beneficial to many
companies.
Information technology plays a major role in designing and implementing
(MRP) systems and processes as it provides information about manufacturing
needs (linked with customer demand) as well as information about inventory
levels. MRP techniques focus on optimizing inventory. MRP techniques are
used to explode bills of material, to calculate net material requirements and plan
future production.
6
2.2 Types of Inventories:
Employing the generic definition of inventory, a large spectrum of
situations can be structured as inventory management problems. These include
the following:
1. Raw materials inventory as input to manufacturing system.
2. Bought-out-parts (BOP) inventory which directly go to the assembly of
product as it is.
3. Work-in-progress (WIP) or work-in-process inventory or pipeline
inventory.
4. Finished goods inventory for supporting the distribution to the
customers.
5. Maintenance, repair, and operating (MRO) supplies. These include spare
parts, indirect materials, and all other sundry items required for
production/service systems.
It may be noted that the basic definition of inventory being a “usable but
idle resource” remains valid irrespective of the type of inventory being
managed.
2.3 Types of Inventory Management Systems:
Why do companies invest so much in finding the perfect inventory
management system?
Inventory is one of the biggest assets in most companies. When inventory
turns increase, so does the companies bottom-line. Since most companies‟
missions are to generate the greatest profit, managing inventory vital part in the
success of the company. [3]
7
All methods of inventory management are designed to accomplish the one
goal of having the lowest total cost and the highest service (or product) level
possible. Something companies tend not to reach equal balance and instead
prefer to lean towards one side or the other.
There is no universal method that works perfectly for every company.
There are two basic types of inventory systems, continuous and periodic, with a
numerous variety of methods on each system. Each company must find the
method that works within their operations and adapt it to work perfectly for
them. Even after finding a method that works, a company must be up to date
with research and new methods that could better improve their system. [3]
2.3.1 Minimum Stock Levels (perpetual system):
The most basic method that companies use to manage inventory is by
using minimum stock levels, a type of continuous inventory system. This
method, also referred to as the perpetual system, is an independent system that
orders a certain amount on a set schedule. New stock gets ordered once an
existing stock has reached a certain level, or a minimum level that is normally
set by the company. [9] Though this is one of the simplest ways for a company
to managed inventory, there are no special benefits that come with using it.
2.3.2 Just In Time (JIT):
One of the most widely used systems of inventory management is the Just
in Time (JIT) method. This method looks to deliver the exact needed quantity of
inventory to the production floor just in time for when it is needed. The JIT
method is highly dependent on the ability of the company and the suppliers to
deliver on time. If the company and suppliers were not reliable, this method
would never work. It is also inefficient if the supplier is not located close to the
manufacturing facility since the method is so dependent on scheduling.
8
2.3.3 Economic Order Quantity (EOQ):
The Economic Order Quantity, or EOQ model, attempts to find the balance
between too much and too little inventory by looking for the optimal quantity that
will deliver the lowest cost of carrying inventory. Since a fixed quantity is being
ordered when the inventory reaches a specific level, the EOQ model is known as
a continuous inventory system. A lot of information is needed to use this formula
causing it to become a complex method and it can often become unusable. To be
successful using EOQ, a company needs to know the usage of units, ordering cost
in $/order, annual carrying cost, unit cost in $ and order unit quantity.
Without each of these values, the EOQ method is unable to be used. There
are assumptions to the model including constant demand, no shortages, constant
lead-time and instantaneous order receipts.
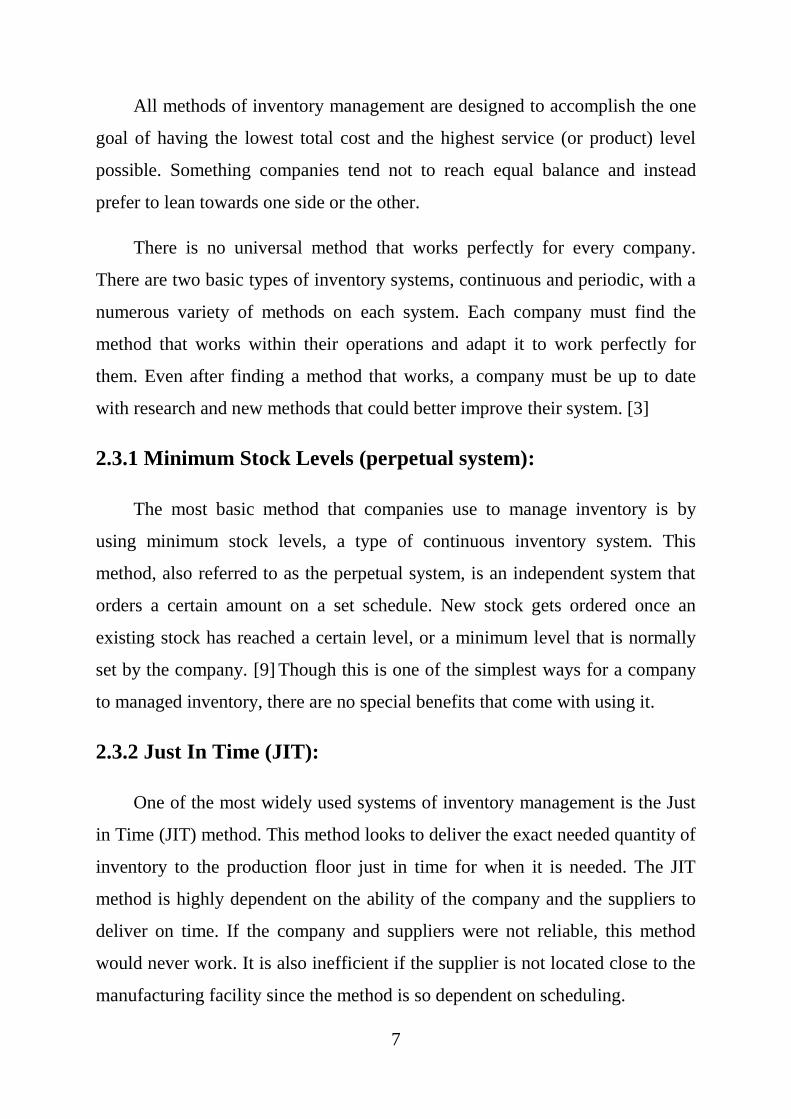
A graphical representation of EOQ is seen in Fig.(2.1) the optimal point is
when the holding cost equals the ordering cost. The EOQ is where the lowest
cost to the company can be found. If holding costs are lower than the EOQ, the
ordering costs are higher and the bottom line is also higher, and vice versa.
Fig. (2.1) Economic Order Quantity
9
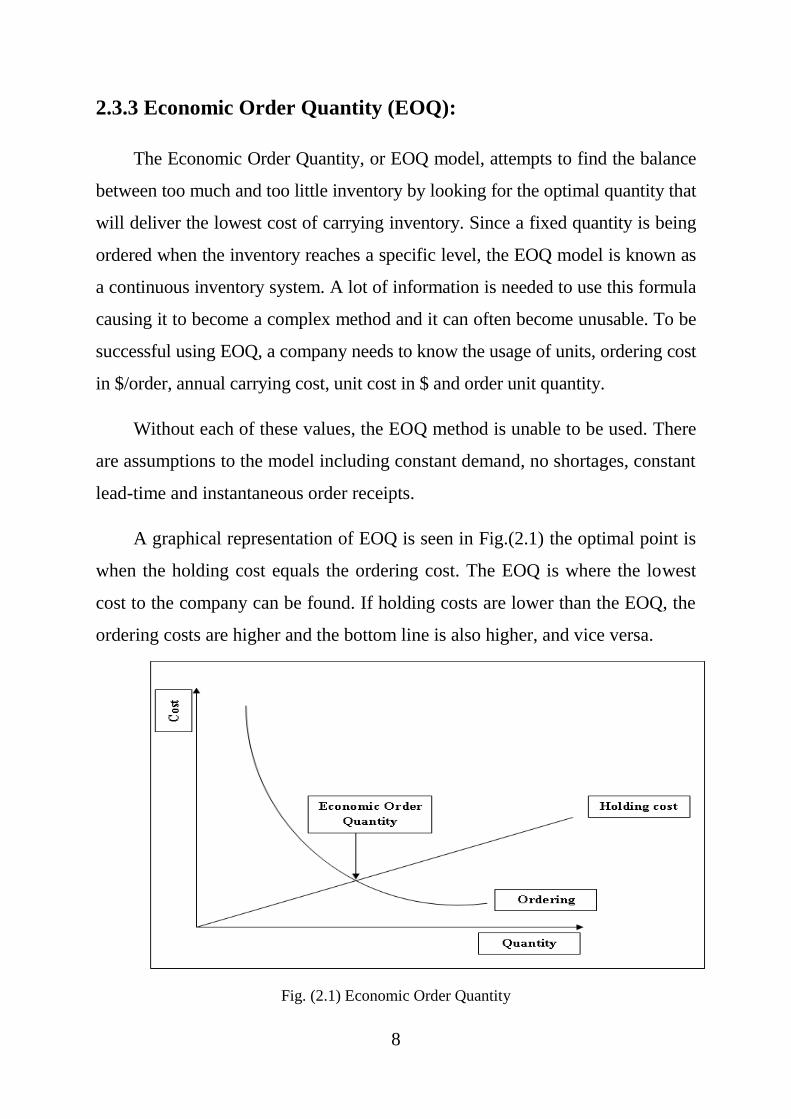
Fig. (2.2) shows the most basic EOQ model. Graphed is the level of inventory
in relation to time. The horizontal line on the graph is the reorder point or
quantity. Once the inventory depletes to that point, a new order is placed. As the
order is being filled, the rest of the inventory is depleted up until the new order
quantity is ready.
Fig. (2.2) Simple Deterministic Inventory Model Based on Fixed Demand Lead Time
2.3.4 Safety Stock (SS):
Safety stock is another common way companies manage their inventory.
Companies utilize this by keeping an extra amount of inventory that is carried
on top of the normal quantity. This is called the safety stock and it is used as a
buffer against uncertainty with situations including supplier performance issues,
long lead times and material uncertainty. Finding the perfect safety stock level
is difficult due to complex formula that is used to calculate it. For companies on
a tight budget, using this method can cause financial harm due to the potential
holding cost associated with extra inventory. [3]
It is common for companies to carry a large amount of safety stock for
seasonal or cyclical demand. Many companies that see an increase in demand
during the holiday season use this method often. By producing and holding
inventory during the holiday off-season, they are able to meet the demand
during the busy time, but keep their production at the same level all year.
10
Companies will also look to purchase large quantities of inventory to save
money causing them to then have excess inventory. They must be careful in
doing this that the cost of holding this inventory does not exceed the amount
they are saving in purchasing the large quantity.
2.3.5 Last in First Out (LIFO) and First in First Out (FIFO):
The best way to explain the method of (LIFO) would be to think of items
on a shelf. The unsold items would be pushed to the back in order to make room
for newer items. (FIFO) is a method that is similar and usually compared with
(LIFO). This method is one that is commonly seen in grocery stores. Restocking
the selves involves taking the items already there and pushing them to the front
while stocking the new items behind the older ones.
Both of these methods take different characteristics when talking about the
value of inventory and calculating profit on inventory. This is because
companies can have different types of products. They can have those that are
one-time only where once they are sold, they are gone, or they can have items
that they restock when inventory gets low. It is these types of product where
LIFO and FIFO come into play when determining the value. It is the
companies‟ choice on which method to pick to improve their profit/loss
statement.
2.3.6 Vendor Managed Inventory (VMI):
One way to manage inventory and optimize the use of a supply chain is
through Vendor Managed Inventory (VMI). With access to the distributor‟s
inventory data, this method is able to generate purchase orders along the supply
chain. Normally when a distributor needs a product, they place an order with a
manufacturer. With the VMI model, the manufacturer instead receives the
distributors‟ sales and stock level data, and creates the order. With VMI, the
11
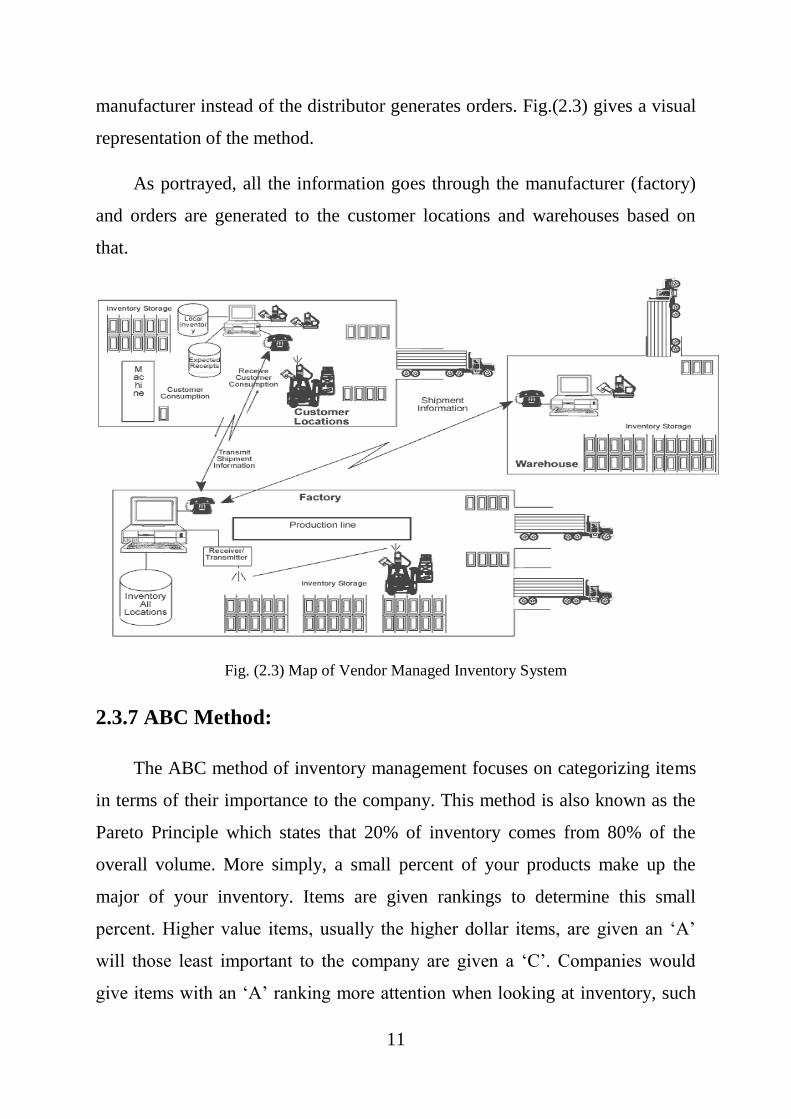
manufacturer instead of the distributor generates orders. Fig.(2.3) gives a visual
representation of the method.
As portrayed, all the information goes through the manufacturer (factory)
and orders are generated to the customer locations and warehouses based on
that.
Fig. (2.3) Map of Vendor Managed Inventory System
2.3.7 ABC Method:
The ABC method of inventory management focuses on categorizing items
in terms of their importance to the company. This method is also known as the
Pareto Principle which states that 20% of inventory comes from 80% of the
overall volume. More simply, a small percent of your products make up the
major of your inventory. Items are given rankings to determine this small
percent. Higher value items, usually the higher dollar items, are given an „A‟
will those least important to the company are given a „C‟. Companies would
give items with an „A‟ ranking more attention when looking at inventory, such
12
as when ordering is needed. There is a lot of work associated with method since
the inventory must be analyzed frequently to stay up to date and successful. [3]
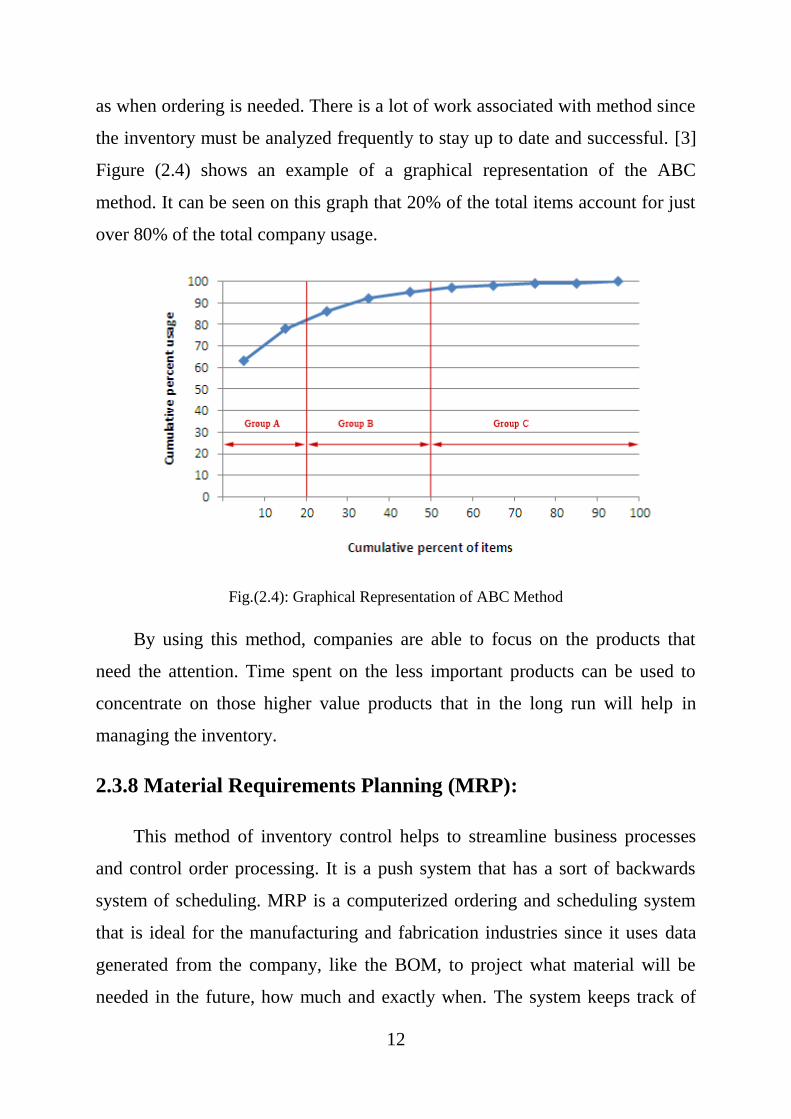
Figure (2.4) shows an example of a graphical representation of the ABC
method. It can be seen on this graph that 20% of the total items account for just
over 80% of the total company usage.
Fig.(2.4): Graphical Representation of ABC Method
By using this method, companies are able to focus on the products that
need the attention. Time spent on the less important products can be used to
concentrate on those higher value products that in the long run will help in
managing the inventory.
2.3.8 Material Requirements Planning (MRP):
This method of inventory control helps to streamline business processes
and control order processing. It is a push system that has a sort of backwards
system of scheduling. MRP is a computerized ordering and scheduling system
that is ideal for the manufacturing and fabrication industries since it uses data
generated from the company, like the BOM, to project what material will be
needed in the future, how much and exactly when. The system keeps track of
13
the parts that the production is dependent on and analyzes it to perfect the
production schedules. The benefits of MRP are that it is able to track the effects
of many different variables throughout production. Though it does have a great
deal of benefits and can greatly improve the productivity of a company, it is still
a system that takes some time to implement. It takes large amounts of data for it
to work properly so for a new company with very little information about lead
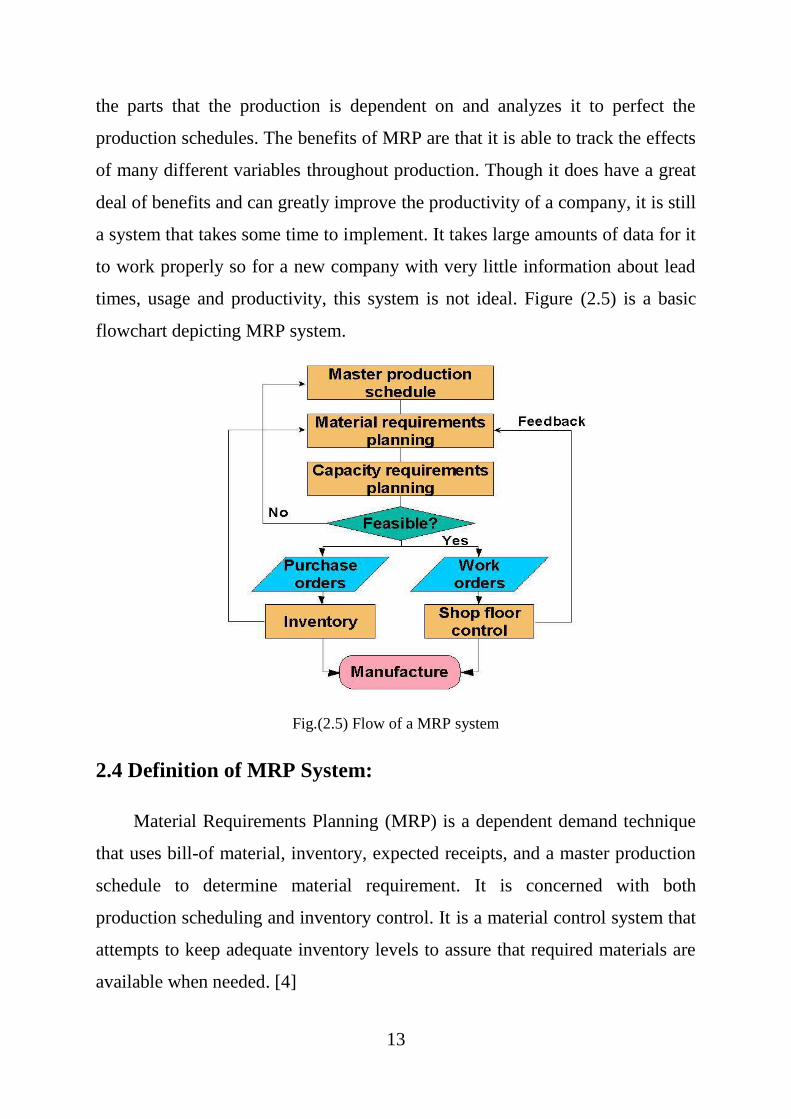
times, usage and productivity, this system is not ideal. Figure (2.5) is a basic
flowchart depicting MRP system.
Fig.(2.5) Flow of a MRP system
2.4 Definition of MRP System:
Material Requirements Planning (MRP) is a dependent demand technique
that uses bill-of material, inventory, expected receipts, and a master production
schedule to determine material requirement. It is concerned with both
production scheduling and inventory control. It is a material control system that
attempts to keep adequate inventory levels to assure that required materials are
available when needed. [4]
14
Material Requirements Planning (MRP) is a computer-based production
planning and inventory control system. It is a production planning process that
starts from the demand for finished products and plans the production step by
step of subassemblies and parts. It is software based production planning and
inventory control system used to manage manufacturing processes. [5]
Materials Requirement Planning (MRP) is a scheduling procedure for
production processes that have several levels of production. Given information
describing the production requirements of the several finished goods of the
system, the structure of the production system, the current inventories for each
operation and the lot sizing procedure for each operation, MRP determines a
schedule for the operations and raw material purchases. [6]
Material requirement planning (MRP) is a tool for estimating the material
requirements of components of different types which produce final assembly of
finished equipment. When the demand for finished product is known through
forecasting, the demand for sub-assemblies and components that go into the making
of the sub-assemblies can be calculated with accuracy by the MRP approach. [1]
MRP is a computer-based system designed to organize the timing and
ordering of the dependent demand products. The demand for the raw material
and components of the final product are calculated by using the demand for the
final product and it is determined how much and in what quantity to order from
these components and raw material, considering the production and lead times
and counting back from the delivery time of the product. Thus, the demand for
the final product is used to calculate the demand for the components in lower
levels. This process is divided into planning periods and the production and
assembly functions are organized, resulting in lower inventory levels along with
ensuring the timely deliveries of the final product. [2]
15
A key question to a MRP process is the number of times a company
replenishes (or turns around) inventory within a year. There are accounts of
inventory annual turnover ratios of greater than 100, mainly reported by
Japanese companies. One can readily realize that the a high inventory ratio is
likely to be conducive to lowering production cost since less capital is tied up to
unused inventory.
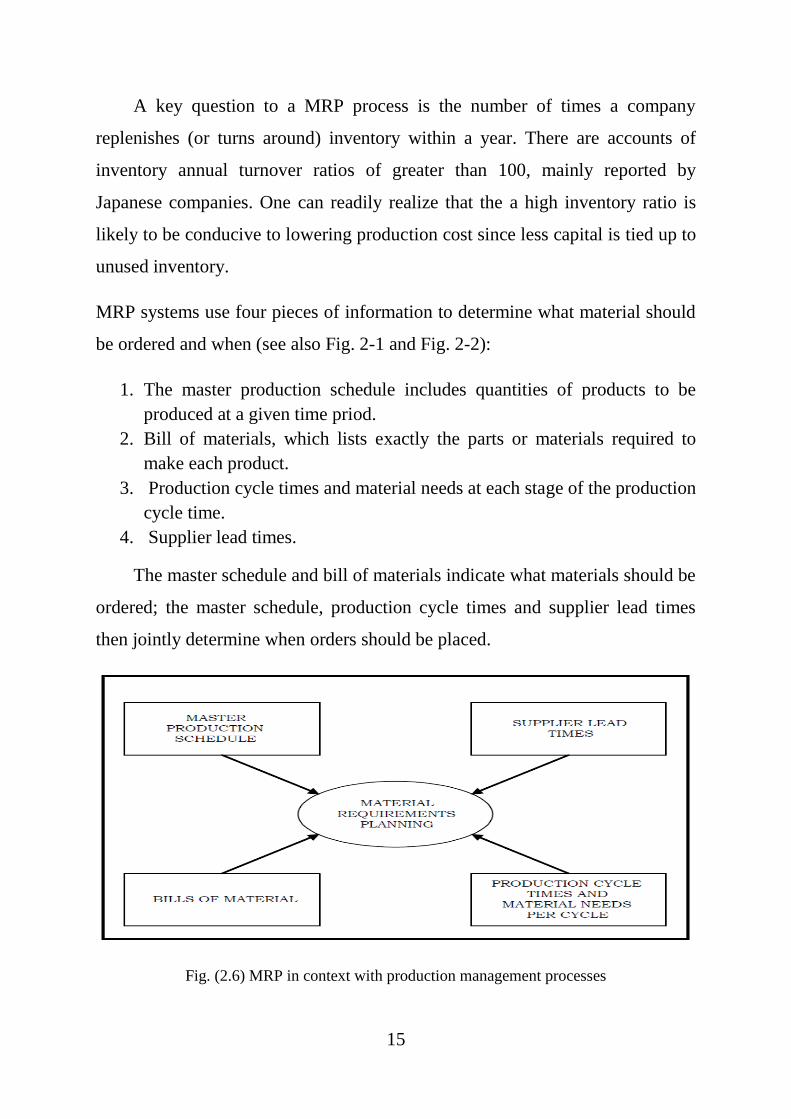
MRP systems use four pieces of information to determine what material should
be ordered and when (see also Fig. 2-1 and Fig. 2-2):
1. The master production schedule includes quantities of products to be
produced at a given time priod.
2. Bill of materials, which lists exactly the parts or materials required to
make each product.
3. Production cycle times and material needs at each stage of the production
cycle time.
4. Supplier lead times.
The master schedule and bill of materials indicate what materials should be
ordered; the master schedule, production cycle times and supplier lead times
then jointly determine when orders should be placed.
Fig. (2.6) MRP in context with production management processes
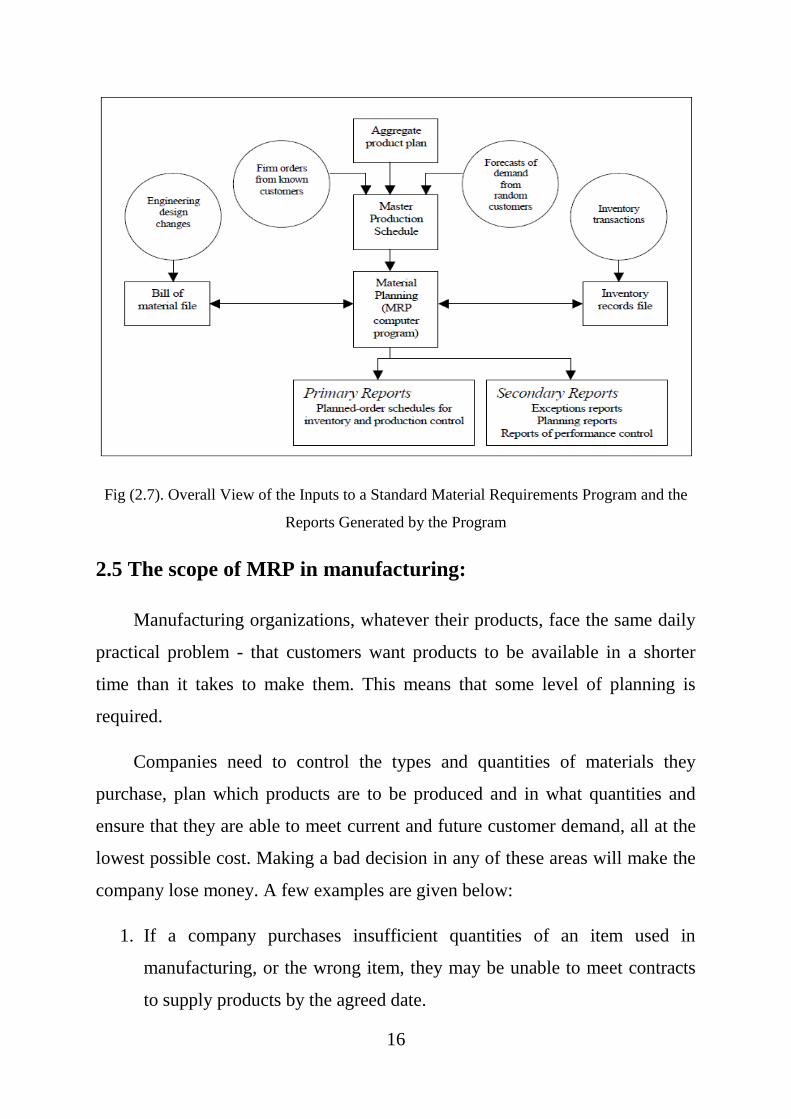
16
Fig (2.7). Overall View of the Inputs to a Standard Material Requirements Program and the
Reports Generated by the Program
2.5 The scope of MRP in manufacturing:
Manufacturing organizations, whatever their products, face the same daily
practical problem - that customers want products to be available in a shorter
time than it takes to make them. This means that some level of planning is
required.
Companies need to control the types and quantities of materials they
purchase, plan which products are to be produced and in what quantities and
ensure that they are able to meet current and future customer demand, all at the
lowest possible cost. Making a bad decision in any of these areas will make the
company lose money. A few examples are given below:
1. If a company purchases insufficient quantities of an item used in
manufacturing, or the wrong item, they may be unable to meet contracts
to supply products by the agreed date.
17
2. If a company purchases excessive quantities of an item, money is being
wasted - the excess quantity ties up cash while it remains as stock and
may never even be used at all. This is a particularly severe problem for
food manufacturers and companies with very short product life cycles.
However, some purchased items will have a minimum quantity that must
be met, therefore, purchasing excess is necessary.
3. Beginning production of an order at the wrong time can cause customer
deadlines to be missed.
2.6 Classes of MRP user/companies:
Material Requirements Planning (MRP) systems fall into four categories
often identified as ABCD, in terms of use and organizational implementation.
1. Class A represents full implementation of MRP. MRP system is tied up
with company‟s financial system and includes capacity planning, shop
floor dispatching, and vendor scheduling as well as links with human
resource planning. There exists continuous monitoring of performance and
inventory records and master production schedules are accurate.
2. Class B represents a less than full implementation. MRP system is
confined in the manufacturing area; however, it encompasses master
production scheduling.
3. Class C represents a classical MRP approach in which the system is
confined to management of inventories.
4. Class D represents a data processing application of MRP. System is used
for keeping track of data rather than as decision-making tool.
2.7 Types of firms / organizations that MRP can be applied:
MRP is being used in a variety of industries with a job-shop environment
(meaning that a number of products are made in batches using the same
18
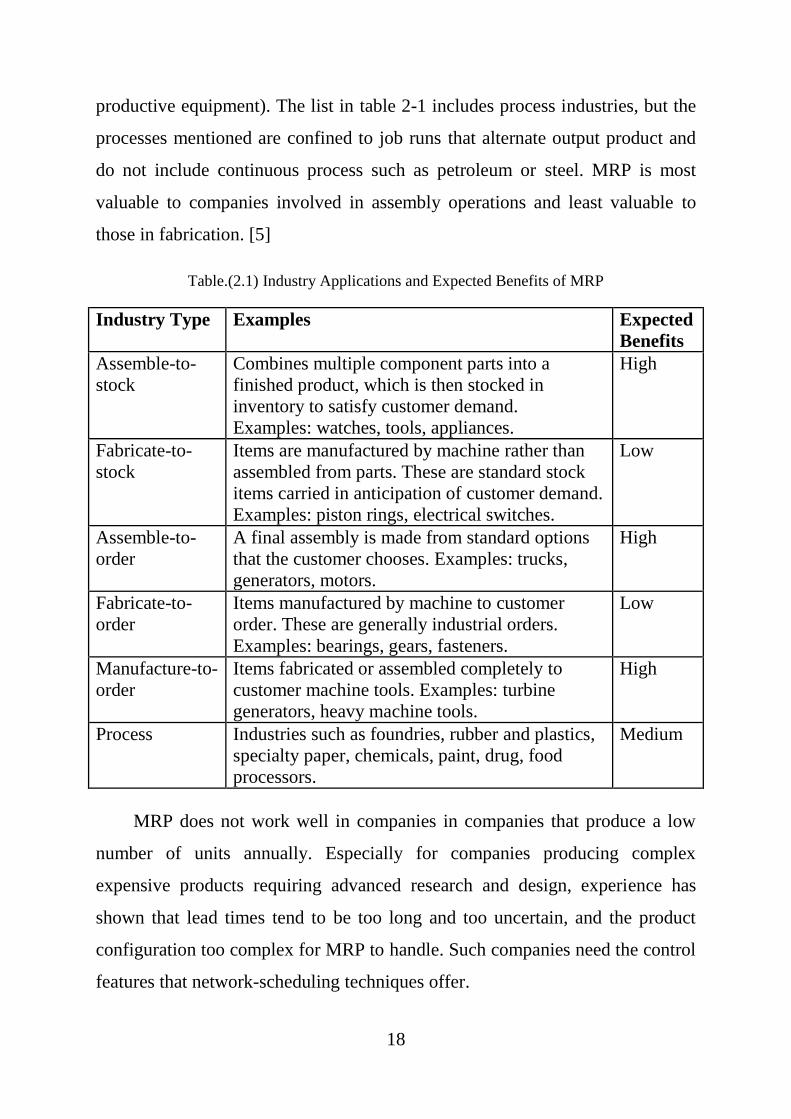
productive equipment). The list in table 2-1 includes process industries, but the
processes mentioned are confined to job runs that alternate output product and
do not include continuous process such as petroleum or steel. MRP is most
valuable to companies involved in assembly operations and least valuable to
those in fabrication. [5]
Table.(2.1) Industry Applications and Expected Benefits of MRP
Industry Type Examples Expected
Benefits
Assemble-to-
stock
Combines multiple component parts into a
finished product, which is then stocked in
inventory to satisfy customer demand.
Examples: watches, tools, appliances.
High
Fabricate-to-
stock
Items are manufactured by machine rather than
assembled from parts. These are standard stock
items carried in anticipation of customer demand.
Examples: piston rings, electrical switches.
Low
Assemble-to-
order
A final assembly is made from standard options
that the customer chooses. Examples: trucks,
generators, motors.
High
Fabricate-to-
order
Items manufactured by machine to customer
order. These are generally industrial orders.
Examples: bearings, gears, fasteners.
Low
Manufacture-to-
order
Items fabricated or assembled completely to
customer machine tools. Examples: turbine
generators, heavy machine tools.
High
Process Industries such as foundries, rubber and plastics,
specialty paper, chemicals, paint, drug, food
processors.
Medium
MRP does not work well in companies in companies that produce a low
number of units annually. Especially for companies producing complex
expensive products requiring advanced research and design, experience has
shown that lead times tend to be too long and too uncertain, and the product
configuration too complex for MRP to handle. Such companies need the control
features that network-scheduling techniques offer.
19
2.8 Conditions for implementation MRP:
Several requirements have to be met, in order to given an MRP
implementation project a chance of success:
1. Availability of a computer based manufacturing system is a must.
Although it is possible to obtain material requirements plan manually,
it would be impossible to keep it up to date because of the highly
dynamic nature of manufacturing environments.
2. A feasible master production schedule must be drawn up, or else the
accumulated planned orders of components might “bump” into the
resource restrictions and become infeasible.
3. The bill of materials (BOM) should be accurate. It is essential to
update them promptly to reflect any engineering changes brought to
the product. If a component part is omitted from the bill of material it
will never be ordered by the system.
4. Inventory records should be a precise representation of reality, or else
the netting process and the generation of planned orders become
meaningless.
5. Lead times for all inventory items should be known and given to the
MRP system.
6. Shop floor discipline is necessary to ensure that orders are processed
in conformity with the established priorities. Otherwise, the lead times
passed to MRP will not materialize.
20
2.9 Implementation Procedure of MRP:
2.9.1 Steps / Phases of a MRP project:
The material requirements planning portion of manufacturing activities
interacts with the master schedule, bill of materials file, inventory records file,
and the output reports.
2.9.2 Inputs to a Standard MRP Program:
1. Demand for Products: Product demand for end items stems from two
main reasons. The first is known customers who have placed specific
orders, such as those generated by sales personnel, or from inter
department transactions. The second source is forecast demand. Demand
from known customers and demand forecast are combined and become
the input to the master production schedule.
2. Bill of Materials File: The bill of Materials file contains the complete
product description, listing materials, parts, and components but also the
sequence in which the product is created. The BOM file is often called
the product structure file or product tree because it shows how a product
is put together. It contains the information to identify each item and the
quantity used per unit of the item of which it is a part.
3. Inventory Records File: Inventory records file under a computerized
system can be quite lengthy. Each item in inventory is carried as a
separate file and the range of details carried about an item is almost
limitless. The MRP program accesses the status segment of the file
according to specific time periods. These files are accessed as needed
during the program run.
21
2.9.3 MRP Computer Program:
The MRP program works as follows:
1. A list of end items needed by time periods is specified by the master
production schedule.
2. A description of the materials and parts needed to make each item is
specified in the bill of materials file.
3. The number of units of each item and material currently on hand and on
order are contained in the inventory file.
4. The MRP program “works” on the inventory file. In addition, it
continuously refers to the bill of materials file to compute quantities of
each item needed.
5. The number of units of each item required is then corrected for on hand
amounts, and the net requirement is “offset” to allow for the lead time
needed to obtain the material.
2.9.4 Output Reports:
Primary Reports: Primary reports are the main or normal reports used for the
inventory and production control. These reports consist of:
1. Planned orders to be released at a future time.
2. Order release notices to execute the planned orders.
3. Changes in due dates of open orders due to rescheduling.
4. Cancellations or suspensions of open orders due to cancellation or
suspension of orders on the master production schedule.
5. Inventory status data.
Secondary Reports: Additional reports, which are optional under the MRP
system, fall in to three main categories:
22
1. Planning reports to be used, for example, in forecasting inventory and
specifying requirements over some future time horizon.
2. Performance reports for purposes of pointing out inactive items and
determining the agreement between actual and programmed item lead
times and between actual and programmed quantity usage and costs.
3. Exceptions reports that point out serious discrepancies, such as errors, out
of range situations, late or overdue orders, excessive scrap, or nonexistent
parts.
2.9.5 Partial techniques and tools included in each step:
In order to achieve successful results from the use of a MRP system, many
variables (e.g. demand of orders) must be taken into consideration and thorough
examination. Statistical tools and forecasting techniques are necessary to predict
the unknown demand. In addition to these, many more techniques are used,
which are borrowed from the fields of:
1. Production management.
2. Control of production.
3. Warehouse management.
2.10 MRP Processing:
MRP processing takes the end-item requirements specified by the master
schedule and "explodes" them into time-phased requirements for assemblies,
parts and raw materials using the bill of materials offset by lead times. The
determination of the net requirements is the core of MRP processing.
Gross requirements are the total expected demands for an item or raw
material during each time period. These quantities are derived from the master
production schedule or the planned-order releases of their immediate "parents".
Scheduled receipts are open orders (orders that have been placed) and are
23
scheduled to arrive from vendors or elsewhere in the pipeline by the beginning
of a period. Projected on hand are the expected amounts of inventory that will
be on hand at the beginning of each time period: scheduled receipts plus
available inventory from last period.
Net requirements are the actual amount needed in each time period. In
addition to subtracting projected inventory on hand from gross requirements,
net requirements are sometimes adjusted to include safety stock and an
allowance for waste. Planned-order receipts are the quantities expected to be
received by the beginning of the period. Under lot-for-lot ordering (lot size = 1),
this quantity will equal net requirements. Under lot-size ordering, the order size
must be in multiples of the lot size, thus this may exceed net requirements.
Any excess is added to available inventory in the next time period. Planned
order releases are the planned amount to order in each time period; equal
planned order receipts offset by lead times. This amount generates gross
requirements at the next level in the assembly or production chain. When an
order is executed, it is removed from "planned-order releases" and entered
under "scheduled receipts". As time passes, the plans need to be updated and
revised to reflect the moving horizon overtime since old orders will have been
completed while new orders enter; also there may have been some changes in
quantities, delays, missed deliveries, and so on.
Orlicky (1975) suggested that MRP records could be updated using either
the regenerative system (approach that updates MRP records periodically) or
net-change system (approach that updates MRP records continuously).[6]
The parameters of the MRP system are one of the most important activities
for the perfect functioning of the system. In addition to basic information about
the product structure and the process of lead time or provider, one should take
into consideration some reality and circumstances of companies environment.
24
As an example, can be mentioned a supplier whose deliveries not always are on
time. In this case, normally the safety stock option can be adopted, and this
parameter should be included on the system.
Based on this, Correa et al. (2007) state that some basic parameters are
essential for MRP operation: [5]
1. Product Structure: is the specification of the quantity of each item that
make up each product, known as Bill of Materials (BOM).
2. Depended Demand Items: these are those items that make up the finished
product, whose purchase depends on the customer orders.
3. Independent Demand Items: under this category are consumer items that
are part of the production process as an input, and are not raw materials,
stored on the basis of consumption history.
4. Repleshnment Lead Time: the time spent between placing the order and
receiving the material.
5. Production run time: also named as cycle time, is the time spent from the
beginning to the end of an finished good production.
6. Production batch size: is the amount of certain item to be manufactured
in order to optimize the process.
7. Replacement batch size: is the quantity of a particular item that is
acquired each time also, with a view also on cost optimization.
8. Minimum stock: is the minimum amount that must be kept in stock,
either raw materials or finished product.
9. Maximum stock: the highest level of materials that can be kept stocked.
2.11 Benefits of MRP:
1. Reduction in inventory. MRP mainly affects raw materials, purchased
components, and work in-process inventories. Users claim a 30 to 50%
reduction in work-in-process.
25
2. Improved customer service. Some MRP proponents claim that late orders
are reduced 90%.
3. Quicker response to changes in demand and in the master schedule
4. Greater productivity. Claims are that productivity can be increased by 5
to 30% through MRP.
5. Labor requirements are reduced correspondingly.
6. Reduced setup and product changeover costs.
7. Better machine utilization.
8. Increased sales and reductions in sales price. These are also claimed as
MRP benefits by some users.
2.12 Previous Studies:
Material Requirement Planning Systems Development by James F. Cox
and Stephen J. Clark (1977) in their article Material Procurement for Effective
Production Management viewed that Materials Management is more a
dependent demand management. Information relating to the market demand will
help to procure sufficient materials which leads to materials requirement
planning.[7] Reviewing the research in Material Management taking place in
the United States, Smith and Jagetia (1978) in their article Inventory Control
System started that 50.00 % of the savings were achieved by single inventory
control system, which reduced 20.00% of annual inventory investment. The
American Management Association started that the adoption of one scientific
inventory control technique, namely the economic lot size in place of purchase
as judgment bas is was responsible for reduction in total inventory investment
by 20.00% to 30.00% without sacrificing customer service. Similarly,
Gopalkrishnan and Sandilya (1978) Standardization Techniques for Materials
Management observed that some of the leading firms in England reduced their
number of inventory items by 40.00% and the American firms by 55.00%
through the application of standardization technique. [6]
26
Datta(1978) in his article Mastering Materials A case Study of Paper
Industry that "Materials Management is an essential activity of an enterprise for
the procurement and use of materials distinctly separated from the process of
procurement and use of human skills from labourers for the ultimate
development to attain some predetermined objectives. " in his article author29
examined the importance of managing materials to paper industry by studying
the case of Altanta Paper Mills. [2]
Gopalakrishna and sundareshan (1979)explained that the integrated
materials planning, purchasing and procurement planning, inventory control,
stores custody and operation and salvage and disposal. According to them, if
functional responsibilities were kept independent from each other, they led to
conflict of interest resulting in inventory buildup and therefore integration in
turn, would result in greater coordination and better control. Further, while
discussing the materials management in the background of Indian conditions,
the authors listed seventy-six indices to evaluate materials management
planning and forecasting efficiency, inventory and stores, standardization,
codification and value analysis, transportation analysis, transportation and
distribution and twenty-five questions that become useful in any enquiry on
materials management.
Computerized materials requirement planning in manufacturing companies
in Malaysia by Mohd. Ezani and Mat Hassan (1991) in their empherical study
presented the usage of computerized Materials Requirement Planning System in
Malaysia manufacturing companies. Authors concluded in their article by
stating that the contemporary practices have been practiced by Malaysian
manufacturing companies. [6]
Chapter Three
Research Methodology
27
3.1 Preface:
This project was aimed to assist wafrapharma laboratories industrial firm
in improving their inventory management system and production with meeting
their goals.
The sections that follow describe the research approach followed,
sampling, methods employed for data gathering, data handling and data
analysis, reliability and validity and limitations of the research.
3.2 Research approach:
This study followed a case-study approach. wafrapharma laboratories
industrial firm, served as case study organization.
The benefits of a case-study approach are argued by various researchers.
Bourque and Clark (1992) postulated that a case study approach provides a
single unit of analysis from which first-hand insight is gained into a particular
phenomenon. Similarly Hussey and Hussey (1997) state that studying real-life
situations can be an advantage as it provides a medium for gaining insight into
the complexity of particular and unique phenomena experienced by a case-study
organization, allowing the researcher to recognize issues to be considered and
developing directions for change - a process that can be referred to as
'unfolding'. Furthermore Garbers (1996) is of the opinion that case-studies
provide options for in-depth descriptions and explanations of specific
phenomenon within the context of reality, environment and meaning. [7]
In choosing a case-study approach, the most important aspects relating to
operations management was able to gain an understanding and the need for an
effective material requirements planning system, both quantitative and
qualitative inventory management methods have been examined in the case
analysis. Quantitative methods employ mathematical models to manage
28
inventory, while qualitative methods use conceptual ideas from supply chain
management to reduce inventory. It is expected to arrive at a deep
understanding of how inventory management is done, and what factors
influence efficiency and effectiveness of inventory management to reduce cost,
improve service, and enhance competitive advantage, and linking research
findings to existing literature with the aim of furthering knowledge
development.
3.3 Sample and data gathering
The data used in this study were collected by interviewing warehouse
managers and procurement managers who are involved in inventory
management. Other data are collected by studying company documentation,
such as production schedules, inventory reports, and production reports.
3.4 Procedures:
First, the annual reports of sample firm were collected and developed a profile
of the inventory management style of the company I have chosen.
Second, the related staff and managers about the details of inventory
management were interviewed.
Third, the data from inventory lists, production schedules and so forth was
collected. The representative period and group of data to analyze was collected.
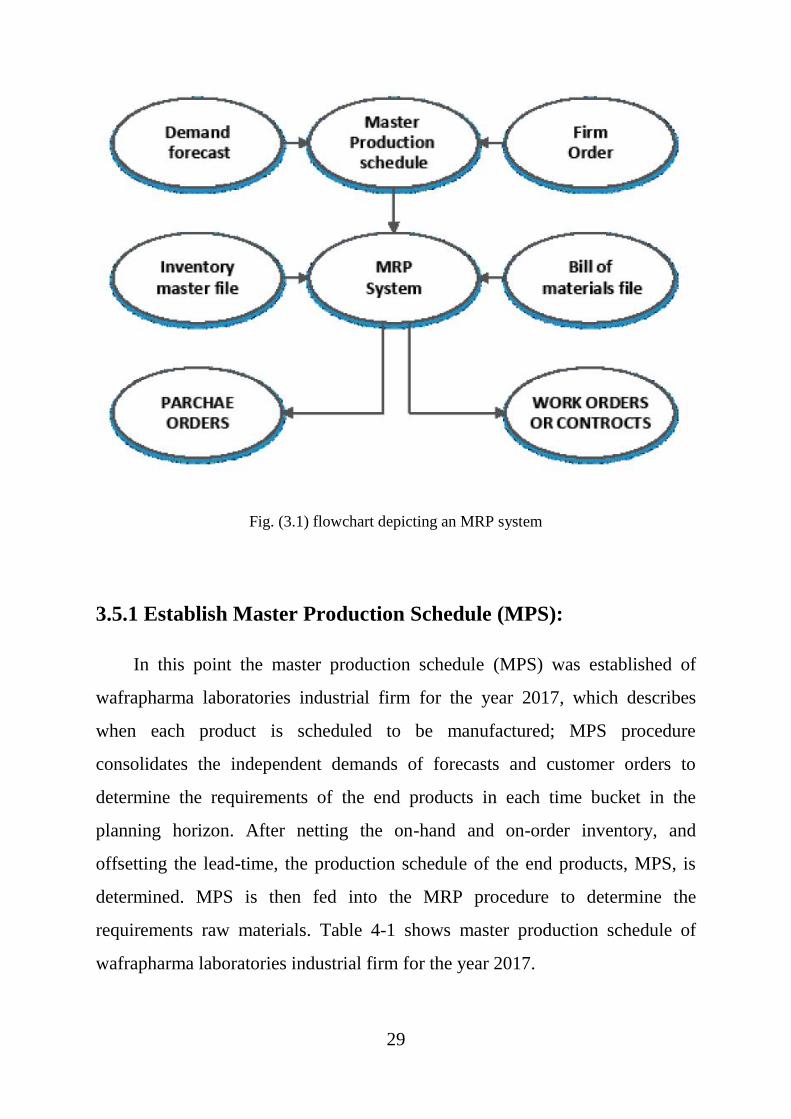
3.5 Basic flowchart depicting an MRP system:
The system calculates net requirements for all the requirement quantities
that are to be planned. The system thereby compares available warehouse stock
or the scheduled receipts from Purchasing and Production. In the case of a
material shortage, that is, if the available stock (including firmed receipts) is
smaller than the quantity required, the system creates procurement proposals.
29
Fig. (3.1) flowchart depicting an MRP system
3.5.1 Establish Master Production Schedule (MPS):
In this point the master production schedule (MPS) was established of
wafrapharma laboratories industrial firm for the year 2017, which describes
when each product is scheduled to be manufactured; MPS procedure
consolidates the independent demands of forecasts and customer orders to
determine the requirements of the end products in each time bucket in the
planning horizon. After netting the on-hand and on-order inventory, and
offsetting the lead-time, the production schedule of the end products, MPS, is
determined. MPS is then fed into the MRP procedure to determine the
requirements raw materials. Table 4-1 shows master production schedule of
wafrapharma laboratories industrial firm for the year 2017.
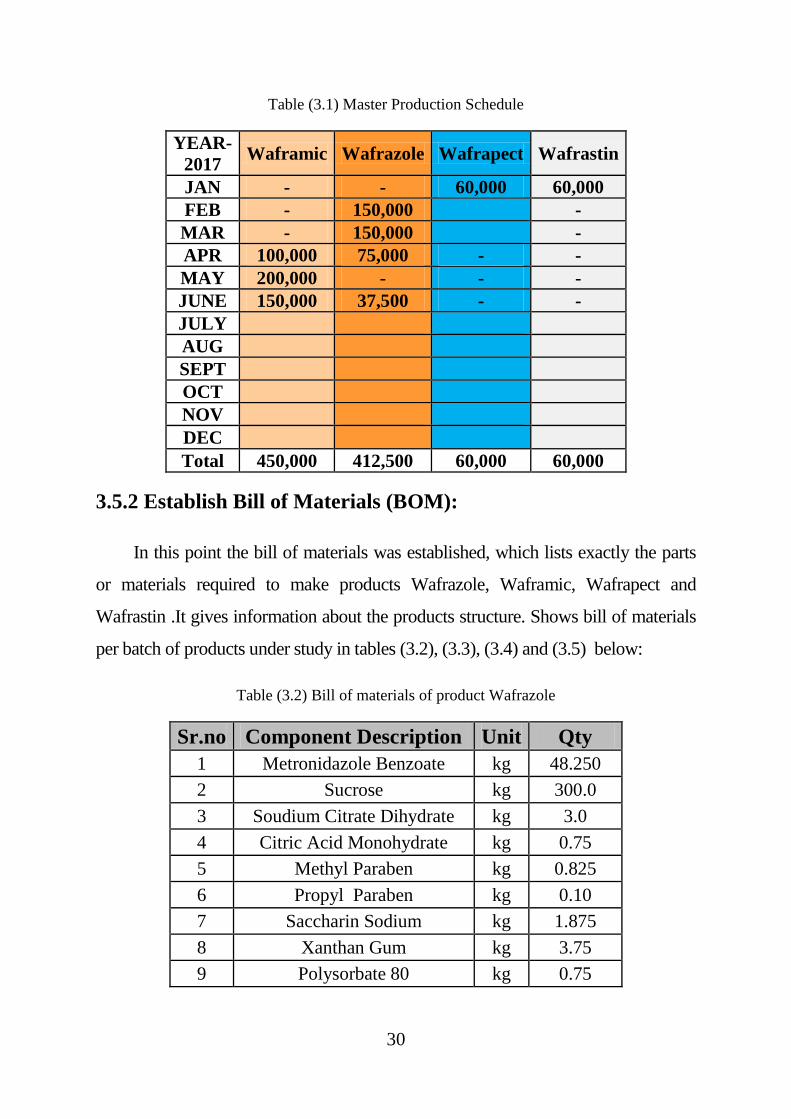
30
Table (3.1) Master Production Schedule
YEAR-
2017 Waframic Wafrazole Wafrapect Wafrastin
JAN - - 60,000 60,000
FEB - 150,000
-
MAR - 150,000
-
APR 100,000 75,000 - -
MAY 200,000 - - -
JUNE 150,000 37,500 - -
JULY
AUG
SEPT
OCT
NOV
DEC
Total 450,000 412,500 60,000 60,000
3.5.2 Establish Bill of Materials (BOM):
In this point the bill of materials was established, which lists exactly the parts
or materials required to make products Wafrazole, Waframic, Wafrapect and
Wafrastin .It gives information about the products structure. Shows bill of materials
per batch of products under study in tables (3.2), (3.3), (3.4) and (3.5) below:
Table (3.2) Bill of materials of product Wafrazole
Sr.no Component Description Unit Qty
1 Metronidazole Benzoate kg 48.250
2 Sucrose kg 300.0
3 Soudium Citrate Dihydrate kg 3.0
4 Citric Acid Monohydrate kg 0.75
5 Methyl Paraben kg 0.825
6 Propyl Paraben kg 0.10
7 Saccharin Sodium kg 1.875
8 Xanthan Gum kg 3.75
9 Polysorbate 80 kg 0.75
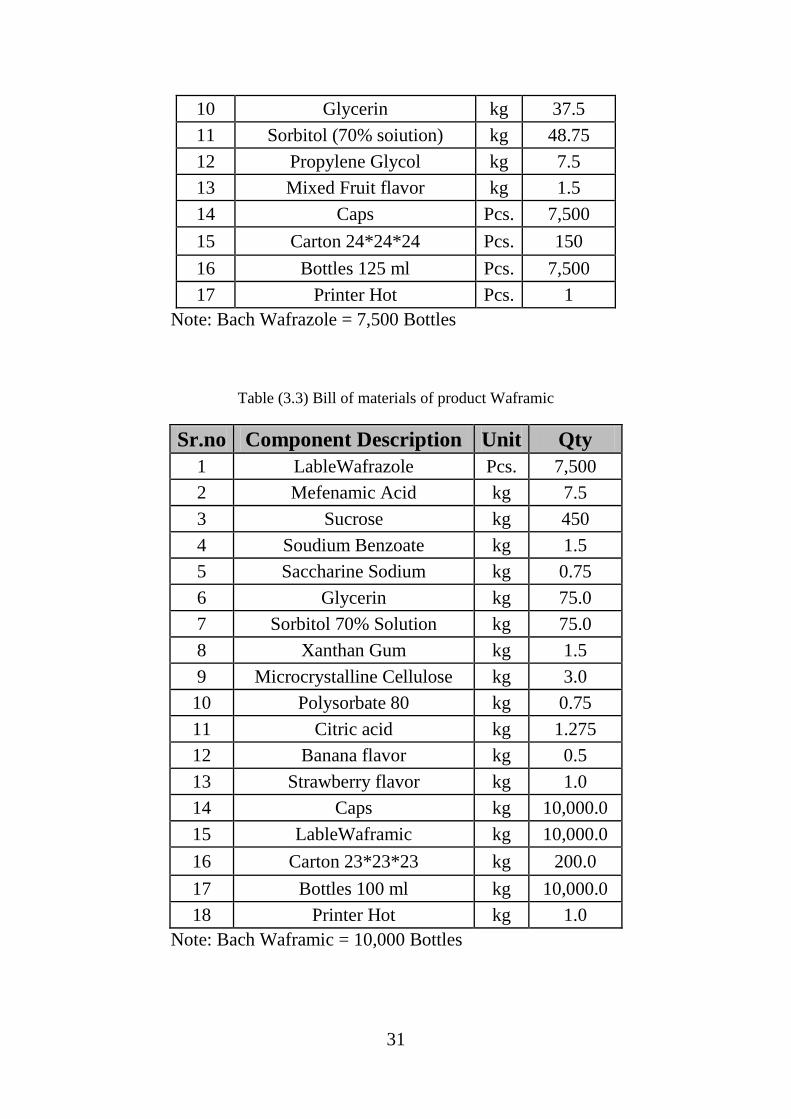
31
10 Glycerin kg 37.5
11 Sorbitol (70% soiution) kg 48.75
12 Propylene Glycol kg 7.5
13 Mixed Fruit flavor kg 1.5
14 Caps Pcs. 7,500
15 Carton 24*24*24 Pcs. 150
16 Bottles 125 ml Pcs. 7,500
17 Printer Hot Pcs. 1
Note: Bach Wafrazole = 7,500 Bottles
Table (3.3) Bill of materials of product Waframic
Sr.no Component Description Unit Qty
1 LableWafrazole Pcs. 7,500
2 Mefenamic Acid kg 7.5
3 Sucrose kg 450
4 Soudium Benzoate kg 1.5
5 Saccharine Sodium kg 0.75
6 Glycerin kg 75.0
7 Sorbitol 70% Solution kg 75.0
8 Xanthan Gum kg 1.5
9 Microcrystalline Cellulose kg 3.0
10 Polysorbate 80 kg 0.75
11 Citric acid kg 1.275
12 Banana flavor kg 0.5
13 Strawberry flavor kg 1.0
14 Caps kg 10,000.0
15 LableWaframic kg 10,000.0
16 Carton 23*23*23 kg 200.0
17 Bottles 100 ml kg 10,000.0
18 Printer Hot kg 1.0
Note: Bach Waframic = 10,000 Bottles
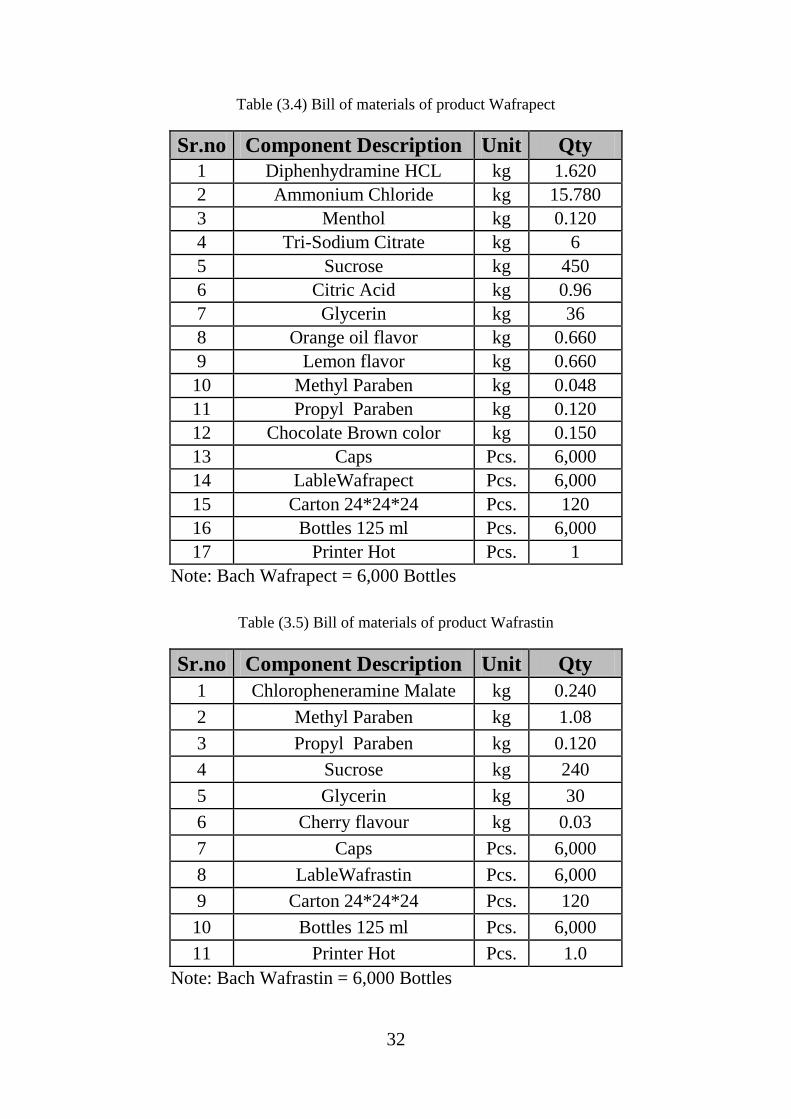
32
Table (3.4) Bill of materials of product Wafrapect
Sr.no Component Description Unit Qty
1 Diphenhydramine HCL kg 1.620
2 Ammonium Chloride kg 15.780
3 Menthol kg 0.120
4 Tri-Sodium Citrate kg 6
5 Sucrose kg 450
6 Citric Acid kg 0.96
7 Glycerin kg 36
8 Orange oil flavor kg 0.660
9 Lemon flavor kg 0.660
10 Methyl Paraben kg 0.048
11 Propyl Paraben kg 0.120
12 Chocolate Brown color kg 0.150
13 Caps Pcs. 6,000
14 LableWafrapect Pcs. 6,000
15 Carton 24*24*24 Pcs. 120
16 Bottles 125 ml Pcs. 6,000
17 Printer Hot Pcs. 1
Note: Bach Wafrapect = 6,000 Bottles
Table (3.5) Bill of materials of product Wafrastin
Sr.no Component Description Unit Qty
1 Chloropheneramine Malate kg 0.240
2 Methyl Paraben kg 1.08
3 Propyl Paraben kg 0.120
4 Sucrose kg 240
5 Glycerin kg 30
6 Cherry flavour kg 0.03
7 Caps Pcs. 6,000
8 LableWafrastin Pcs. 6,000
9 Carton 24*24*24 Pcs. 120
10 Bottles 125 ml Pcs. 6,000
11 Printer Hot Pcs. 1.0
Note: Bach Wafrastin = 6,000 Bottles
33
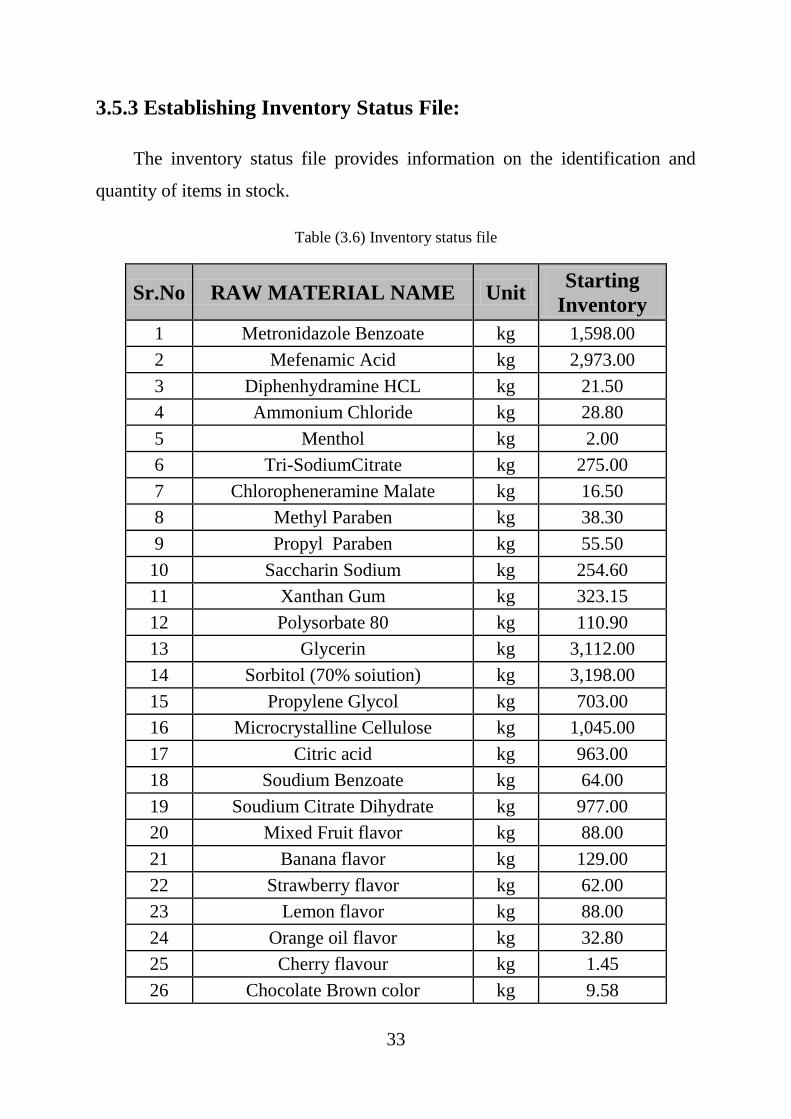
3.5.3 Establishing Inventory Status File:
The inventory status file provides information on the identification and
quantity of items in stock.
Table (3.6) Inventory status file
Sr.No RAW MATERIAL NAME Unit Starting
Inventory
1 Metronidazole Benzoate kg 1,598.00
2 Mefenamic Acid kg 2,973.00
3 Diphenhydramine HCL kg 21.50
4 Ammonium Chloride kg 28.80
5 Menthol kg 2.00
6 Tri-SodiumCitrate kg 275.00
7 Chloropheneramine Malate kg 16.50
8 Methyl Paraben kg 38.30
9 Propyl Paraben kg 55.50
10 Saccharin Sodium kg 254.60
11 Xanthan Gum kg 323.15
12 Polysorbate 80 kg 110.90
13 Glycerin kg 3,112.00
14 Sorbitol (70% soiution) kg 3,198.00
15 Propylene Glycol kg 703.00
16 Microcrystalline Cellulose kg 1,045.00
17 Citric acid kg 963.00
18 Soudium Benzoate kg 64.00
19 Soudium Citrate Dihydrate kg 977.00
20 Mixed Fruit flavor kg 88.00
21 Banana flavor kg 129.00
22 Strawberry flavor kg 62.00
23 Lemon flavor kg 88.00
24 Orange oil flavor kg 32.80
25 Cherry flavour kg 1.45
26 Chocolate Brown color kg 9.58
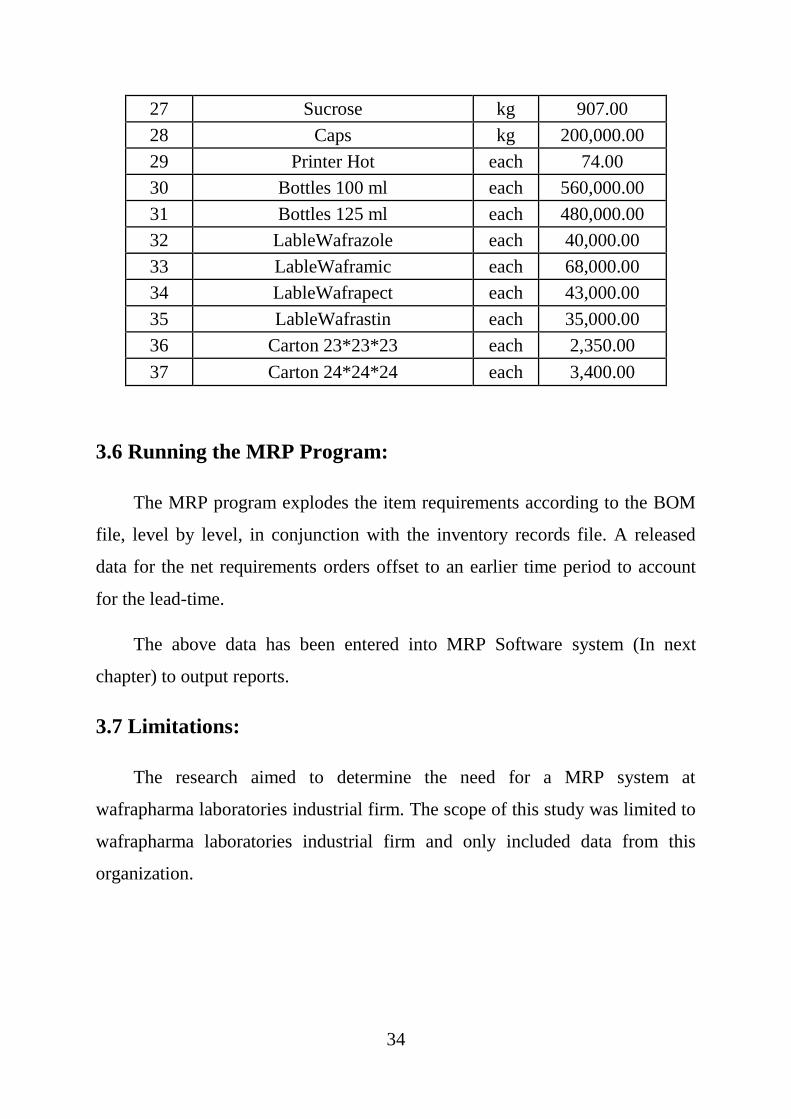
34
27 Sucrose kg 907.00
28 Caps kg 200,000.00
29 Printer Hot each 74.00
30 Bottles 100 ml each 560,000.00
31 Bottles 125 ml each 480,000.00
32 LableWafrazole each 40,000.00
33 LableWaframic each 68,000.00
34 LableWafrapect each 43,000.00
35 LableWafrastin each 35,000.00
36 Carton 23*23*23 each 2,350.00
37 Carton 24*24*24 each 3,400.00
3.6 Running the MRP Program:
The MRP program explodes the item requirements according to the BOM
file, level by level, in conjunction with the inventory records file. A released
data for the net requirements orders offset to an earlier time period to account
for the lead-time.
The above data has been entered into MRP Software system (In next
chapter) to output reports.
3.7 Limitations:
The research aimed to determine the need for a MRP system at
wafrapharma laboratories industrial firm. The scope of this study was limited to
wafrapharma laboratories industrial firm and only included data from this
organization.
Chapter Four
Results and Discussions
35
4.1 General description of Wafrapharma Laboratories:
Wafrapharma Laboratories is a governmental company. The sole
shareholder of the company is the National Treasury of Promotion of Medical
Services. It is a completely self-determined company with a board of directors
and executive staff which execute the implementation of developmental policies
with delegation of power and free hand to run the factory on economical basis.
Wafrapharma was established by the Medical Crops in 1982 with license (
D ) under drugs and poison act ( SUDAN), also it was incorporated under the
Sudanese Companies Act to produce pharmaceuticals for people Armed Forces
and their faceless taking a great part in the programme of medical insurance. It
also participates in the welfare of Sudanese society through a reasonable amount
of products sold in the market. In 1999 the factory was belonged to the National
Treasury for Promotion of Medical Services by a presidential decree. Table
(4.1) shows list of products on Wafrapharma under study.
Table (4.1) Wafrapharma list of products.
No Item Generic name
Liquid Syrup
1 Wafrazol 200mg/5ml susp. Metronidazole benzoate
2 Waframic 50mg/5ml susp. Mefenamic acid
3 Wafrapect syrup Diphenhydramine , Ammonium chloride
4 Wafrastin syrup Chlorphneramine maleate
4.2 Suppliers of Raw Materials:
1. China
2. India
3. S. Korea
4. Germany
36
5. UAE
6. Local Market
4.3 Implement MRP Program on Wafrapharma:
The Excel-Based MRP system has the following features:
1. Demand is generated by a make-to-inventory finite schedule, but may
also be from another source
2. A single level Bill of Material structure.
3. Inventory of raw material and components is allocated to the earliest
scheduled product first, and will be dynamically re-allocated as the
schedule changes.
4. A purchase action report identifies purchase orders which must be placed
or chased to meet the schedule.
4.3.1 Overview of steps:
1. Enter Products in Master Production Schedule sheet.
2. Enter Raw Materials in Raw Materials sheet.
3. Enter Bill of Materials in BOM sheet.
4. Enter orders in Orders sheet after checking availability.
5. View Current raw material stock in Raw Materials sheet
4.3.2 Steps in Details:
1. Enter daily production quantity from any type of product in Daily Production
Sheet fig. (4.1). In this screen you enter the daily production quantity of each
product.
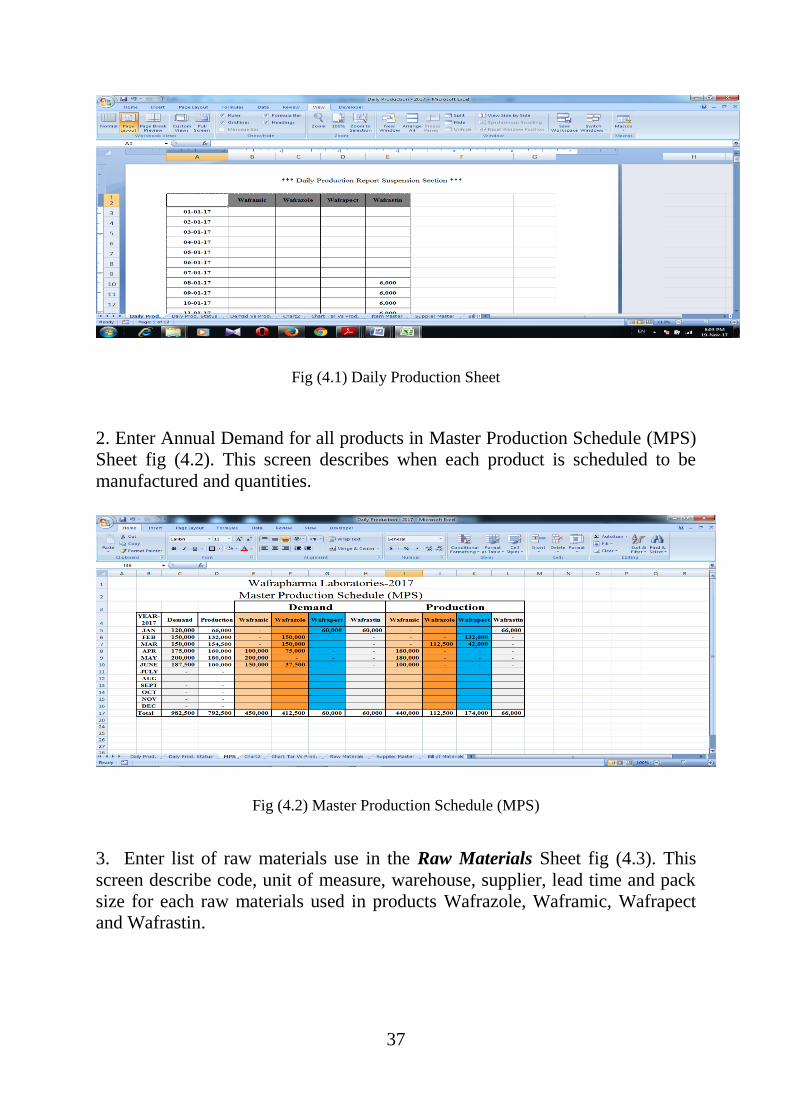
37
Fig (4.1) Daily Production Sheet
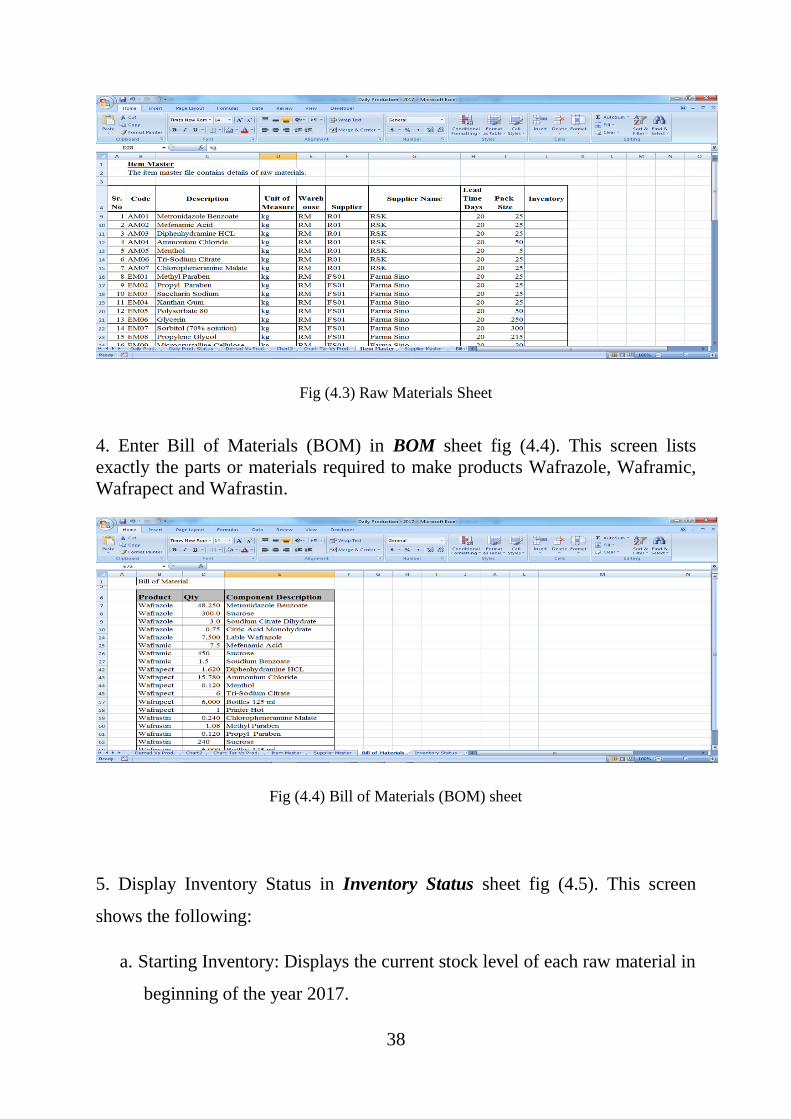
2. Enter Annual Demand for all products in Master Production Schedule (MPS)
Sheet fig (4.2). This screen describes when each product is scheduled to be
manufactured and quantities.
Fig (4.2) Master Production Schedule (MPS)
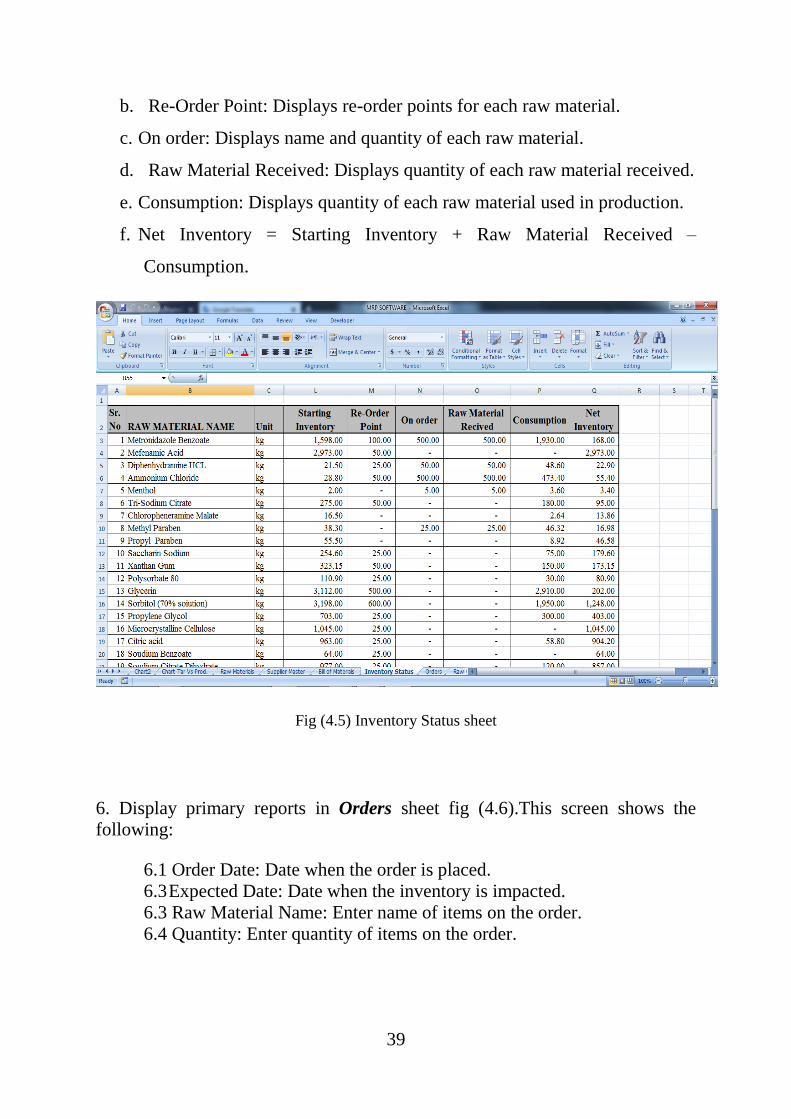
3. Enter list of raw materials use in the Raw Materials Sheet fig (4.3). This
screen describe code, unit of measure, warehouse, supplier, lead time and pack
size for each raw materials used in products Wafrazole, Waframic, Wafrapect
and Wafrastin.
38
Fig (4.3) Raw Materials Sheet
4. Enter Bill of Materials (BOM) in BOM sheet fig (4.4). This screen lists
exactly the parts or materials required to make products Wafrazole, Waframic,
Wafrapect and Wafrastin.
Fig (4.4) Bill of Materials (BOM) sheet
5. Display Inventory Status in Inventory Status sheet fig (4.5). This screen
shows the following:
a. Starting Inventory: Displays the current stock level of each raw material in
beginning of the year 2017.
39
b. Re-Order Point: Displays re-order points for each raw material.
c. On order: Displays name and quantity of each raw material.
d. Raw Material Received: Displays quantity of each raw material received.
e. Consumption: Displays quantity of each raw material used in production.
f. Net Inventory = Starting Inventory + Raw Material Received –
Consumption.
Fig (4.5) Inventory Status sheet
6. Display primary reports in Orders sheet fig (4.6).This screen shows the
following:
6.1 Order Date: Date when the order is placed.
6.3 Expected Date: Date when the inventory is impacted.
6.3 Raw Material Name: Enter name of items on the order.
6.4 Quantity: Enter quantity of items on the order.
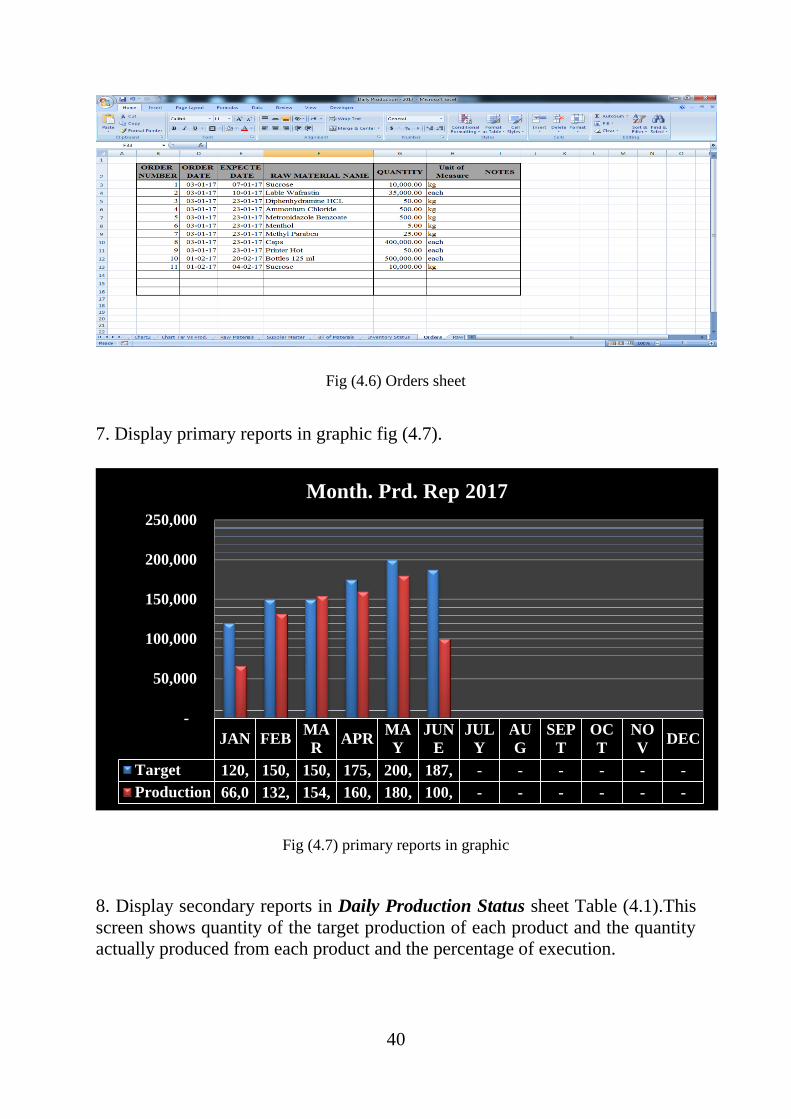
40
Fig (4.6) Orders sheet
7. Display primary reports in graphic fig (4.7).
Fig (4.7) primary reports in graphic
8. Display secondary reports in Daily Production Status sheet Table (4.1).This
screen shows quantity of the target production of each product and the quantity
actually produced from each product and the percentage of execution.
JAN FEBMA
RAPR
MA
Y
JUN
E
JUL
Y
AU
G
SEP
T
OC
T
NO
VDEC
Target 120, 150, 150, 175, 200, 187, - - - - - -
Production 66,0 132, 154, 160, 180, 100, - - - - - -
-
50,000
100,000
150,000
200,000
250,000
Month. Prd. Rep 2017
41
Table (4.1) Daily Production Status sheet
Year-2017 Waframic Wafrazole Wafrapect Wafrastin Total
Target
450,000
412,500 60,000 60,000
982,500
Production
440,000
112,500 174,000 66,000 792500
Target
Achieved% 98% 27% 290% 110% 81%
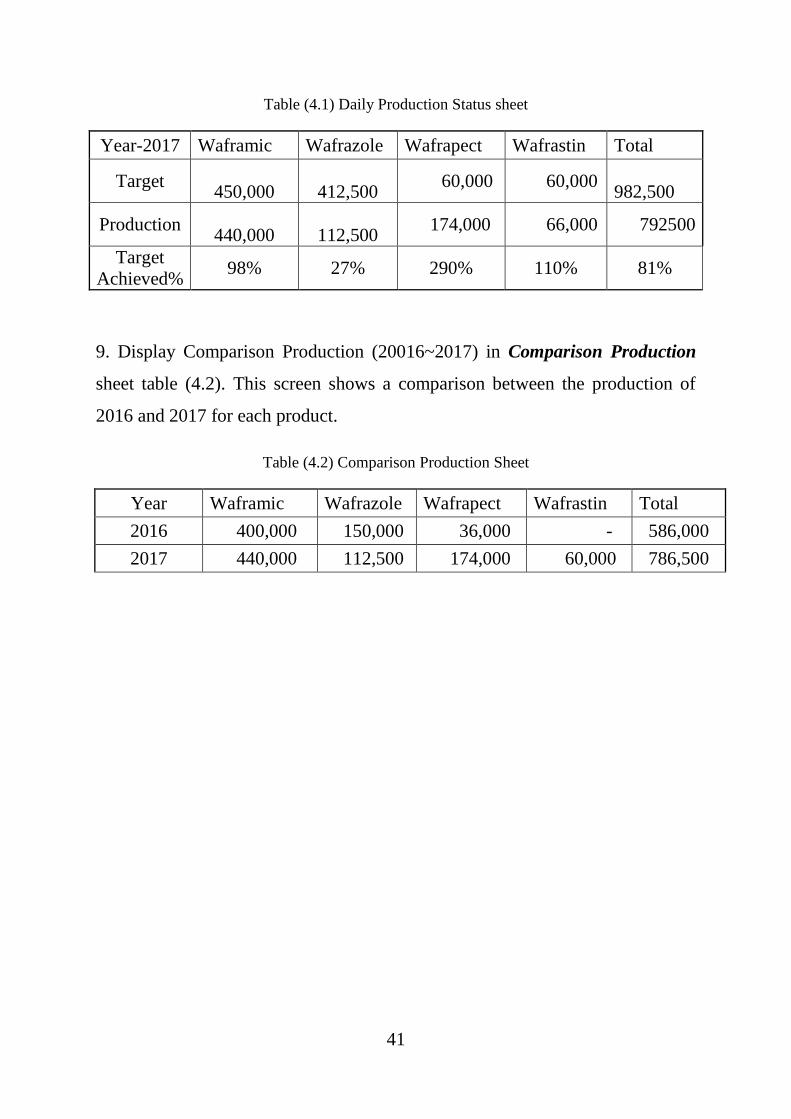
9. Display Comparison Production (20016~2017) in Comparison Production
sheet table (4.2). This screen shows a comparison between the production of
2016 and 2017 for each product.
Table (4.2) Comparison Production Sheet
Year Waframic Wafrazole Wafrapect Wafrastin Total
2016 400,000 150,000 36,000 - 586,000
2017 440,000 112,500 174,000 60,000 786,500
Chapter Five
Conclusions and Recommendations
42
5.1 Conclusions:
At the end of this research the following can be concluded:-
1. The result of MRP applications in wafrapharma laboratories industrial firm is
create direct relationship and link between production management and stores.
2. The result of MRP applications in wafrapharma laboratories industrial firm is
avoiding raw material expiration.
3. The result of MRP applications in wafrapharma laboratories industrial firm is
calculation the amount and type of material required in the production of the
final product and scheduling purchasing and manufacturing orders.
4. The result of MRP applications in wafrapharma laboratories industrial firm
is to provide the demanded quantities on demanded times and avoiding storage.
5.2 Recommendations:
From this research of got some recommendations represented in:
1. Establish prerequisite data base to provide the essential inputs for this
system.
2. Develop a program to qualify employees to apply the MRP system in the
firm.
3. Implement MRP system on all production divisions in wafrapharma
laboratories industrial firm.
43
References
1. Krajewski, L.J., Ritzman, L.P. “Operations Management: Strategy and
Analysis.” 3rd Ed., Prentice Hall, 2000.
2. LutfuSagbanşua, PhD & M. NurettinAlabay, PhD, An MRP Model for
Supply Chains International Business Research Vol. 3, No. 4; October
2010
3. Steven Nahmias. “Production and Operations Analysis.”, Sixth Edition,
McGraw Hill.
4. Nahmias, S., “Production and Operations Analysis with Student CD-
Rom.” 4th Ed., McGraw-Hill/Irwin, 2000.
5. Dr. VassilisMoustakis., “ Materials Requirement Planning MRP”,
Jan.2000
6. Argoud, Ana Rita Tiradentes Terra “MRP Implementation on Supply
Management Process: A BRAZILIAN FURNITURE INDUSTRY CASE
STUDY.” , April 2015
7. A Case Study of Inventory Management in a Manufacturing Company in
China, Hong Shen1 University of Macau, Macau,2015
8. JacobusHendrik Vorster, “THE NEED FOR A MANUFACTURING
RESOURCE PLANNING SYSTEM WITHIN A MANUFACTURING
COMPANY: A CASE STUDY”, November 2007
9. Thomas E. Vollmann, William L. Berry, D. Clay Whybark.
“Manufacturing Planning and Control Systems.” Fourth Edition
,Irwin/McGraw-Hill,2003
Related Documents