The PISA 2012 assessment of students’ mathematical, scientific and reading literacy Sue Thomson Lisa De Bortoli Sarah Buckley Australian Council for Educational Research Programme for International Student Assessment (PISA) PISA in Brief Highlights from the full Australian report: PISA 2012: How Australia measures up

Pisa 2012 in Brief
Nov 28, 2015
OECD's PISA report, comparing Australian high school students with 65 other countries,
Welcome message from author
This document is posted to help you gain knowledge. Please leave a comment to let me know what you think about it! Share it to your friends and learn new things together.
Transcript

The PISA 2012 assessment of students’ mathematical, scientific and reading literacy
Sue ThomsonLisa De BortoliSarah Buckley
Australian Council for Educational Research
Programme for International Student Assessment (PISA)
PISA in BriefHighlights from the full
Australian report:
PISA 2012:How Australia measures up

PISA 2012: How Australia measures up 3
What is PISA (Programme for International Student Assessment)?PISA is a survey that measures the knowledge and skills of 15-year-olds, who are near the end of compulsory schooling in most participating education systems.
» The survey, first carried out in 2000, is repeated every three years so that changes over time can be measured.
» Almost 510,000 students, representing 28 million 15-year-old students, from 65 countries and economies took part in PISA 2012.
» Students answered a pen-and-paper assessment booklet containing items from one or more of the mathematical, scientific and reading literacy domains. They also completed a computer-based assessment in mathematical and reading literacy, and problem solving.
» Students answered a 30-minute questionnaire about their background, their motivations to learn mathematics and their attitudes to school.
» Principals answered a 30-minute questionnaire about the level of resources in the school, the school environment and qualifications of staff.
PISA assesses young people’s ability to apply their knowledge and skills to real-life problems and situations rather than how well they have learned a specific curriculum.
» As in previous PISA assessments, PISA assessed students’ capabilities in mathematical, scientific and reading literacy. The word literacy reflects the focus on broader skills and is used to mean much more than the common meaning of being able to read and write.
» To answer the PISA 2012 tasks correctly, students had to understand key concepts, use a range of processes in the correct way and apply their knowledge and skills in different situations.
» Some of the assessment tasks were multiple-choice items, but many required students to construct and write their own answers.
PISA looks for answers to several important questions related to education, such as:
» How well prepared are young adults to meet the challenges of the future?
» What skills do young adults have that will help them adapt to change in their lives? Are they able to analyse, reason and communicate their arguments and ideas to others?
» Are some ways of organising schools and school learning more effective than others?
» What influence does the quality of school resources have on student outcomes?
» What educational structures and practices maximise the opportunities of students from disadvantaged backgrounds?
» To what extent is student performance dependent on their background? How equitable is education provision for students from all backgrounds?
In Australia, PISA is a key part of the National Assessment Program (NAP) and complements other NAP assessments. The results from these NAP assessments allow for nationally comparable reporting of student outcomes against the Melbourne Declaration on Educational Goals for Young Australians1, which aims to provide high-quality schooling in Australia that will secure for students the necessary knowledge, understanding, skills and values for a productive and rewarding life.
1 MCEETYA. (2008). Carlton, Victoria: Curriculum Corporation.

PISA in Brief | Highlights from the full Australian report4
What PISA tells usPISA in Brief summarises the results from the PISA 2012 assessment of students’ mathematical, scientific and reading literacy skills. It tells us about how students performed in the assessment and describes some wider findings about what lies behind their results.
The full Australian report is called PISA 2012: How Australia measures up and is available for download from www.acer.edu.au/ozpisa/reports/.
PISA 2012 assessed students’ capacities to apply knowledge and skills in mathematical, scientific and reading literacy. More assessment time was given to mathematical literacy, as this was the main focus for this cycle. Mathematical literacy was also the focus of PISA 2003, which allows us to make comparisons of mathematical literacy performance between 2003 and 2012. In 2000 and 2009, more time was devoted to assessing reading literacy. In 2006, the main focus was scientific literacy; this will be also the focus of PISA in 2015 and changes over time in scientific literacy will be able to be monitored.
In this way, PISA provides regular information on educational outcomes within and across countries. It provides insight into the range of skills and competencies in different assessment domains that are considered to be essential to an individual’s ability to participate in and contribute fully to society, particularly a society that experiences rapid technological change.
PISA, like many other international studies, reports results as mean scores—a measure of average performance—along with various statistics that reflect the distribution of performance. PISA also provides a more detailed picture of performance by providing a profile of what students have achieved in terms of skills and knowledge—what they can do and what they know. This performance scale is divided into levels of difficulty, or proficiency levels. Students who have reached a particular proficiency level not only typically demonstrate the knowledge and skills associated with that level, but also the proficiencies required at lower levels. E.g., a student who performs at proficiency Level 4 is expected to show all the skills and knowledge of Levels 2 and 3, and to be able to complete any assessment tasks that are illustrative of those proficiency levels.

PISA 2012: How Australia measures up 5
PISA participantsIn 2012, 65 countries and economies participated in PISA, including 34 OECD countries and 31 partner countries or economies, as shown on the map below.
OECD countries Partner countries/economies
Australia Hungary Poland Albania Kazakhstan Shanghai–China
Austria Iceland Portugal Argentina Latvia Singapore
Belgium Ireland Slovak Republic Brazil Liechtenstein Thailand
Canada Israel Slovenia Bulgaria Lithuania Tunisia
Chile Italy Spain Chinese Taipei Macao–China United Arab Emirates
Czech Republic Japan Sweden Colombia Malaysia Uruguay
Denmark Korea Switzerland Costa Rica Montenegro Vietnam
Estonia Luxembourg Turkey Croatia Peru
Finland Mexico United Kingdom Cyprus Qatar
France Netherlands United States Hong Kong–China Romania
Germany New Zealand Indonesia Russian Federation
Greece Norway Jordan Serbia
The OECD average represents OECD countries as a single entity and each country contributes to the average with equal weight. The OECD average is presented for comparative purposes.

PISA in Brief | Highlights from the full Australian report6
Who took part in Australia?The Australian PISA 2012 sample of 14,481 students, whose results feature in the national and international reports, was drawn from all jurisdictions2 and all school sectors according to the distributions shown in the table below.
Jurisdiction
Sector
TotalGovernment Catholic Independent
ACT 26 8 11 45
NSW 113 43 28 184
VIC 77 31 26 134
QLD 83 24 25 132
SA 56 18 18 92
WA 51 18 21 90
TAS 47 12 12 71
NT 17 5 5 27
Australia 470 159 146 775
Note: These numbers are based on unweighted data.
Mathematical, scientific and reading performance by country
Reading the figuresThe following figures provide the mean scores on the relevant assessment domain (mathematical, scientific or reading literacy), along with the standard errors, confidence intervals around the mean, and the difference between the 5th and 95th percentiles for participating countries. In addition, these figures also show the graphical distribution of students’ performance. The box on the right details how to read these graphs.
Countries are shown in order from the highest to the lowest mean score and the colour bands summarise Australia’s performance compared to other participating countries. Although 65 countries participated in PISA 2012, only those countries who achieved a mean score higher than Mexico (the lowest performing OECD country) have been included in these figures.
Interpreting differencesAnalyses of the PISA data indicate that one school year in Australia corresponds to an average of 35 score points in mathematical literacy, and an average of 34 score points in scientific and reading literacy.
2 Throughout this document, the Australian states and territories will be collectively referred to as jurisdictions.
Understanding the distribution of performance
Each country’s results are represented in horizontal bars with various colours. On the left end of the bar is the 5th percentile —this is the score below which 5% of the students have scored. The next two lines indicate the 10th percentile and the 25th percentile. The next line at the left of the white band is the lower limit of the confidence interval for the mean—i.e., there is 95% confidence that the mean will lie in this white band. The line in the centre of the white band is the mean. The lines to the right of the white band indicate the 75th, 90th and 95th percentiles.
25thpercentile
10thpercentile
5thpercentile
75thpercentile
95thpercentile
Mean
90thpercentile
Confidenceinterval

PISA 2012: How Australia measures up 7
CountryMean score SE
Confidence interval
Difference between
5th and 95th percentiles Distribution of scores
Sign
ifica
ntly
hig
her
than
Aus
tralia
Shanghai–China 613 3.3 606–619 331
200 300 400 500
Mean mathematical literacy performance
600 700 800
Singapore 573 1.3 571–576 344
Hong Kong–China 561 3.2 555–568 318
Chinese Taipei 560 3.3 553–566 375
Korea 554 4.6 545–563 323
Macao–China 538 1.0 536–540 306
Japan 536 3.6 529–543 309
Liechtenstein 535 4.0 527–543 310
Switzerland 531 3.0 525–537 308
Netherlands 523 3.5 516–530 297
Estonia 521 2.0 517–525 268
Finland 519 1.9 515–523 281
Canada 518 1.8 514–522 293
Poland 518 3.6 510–525 296
Belgium 515 2.1 511–519 335
Germany 514 2.9 508–519 314
Not
sig
nific
antly
diff
eren
t fro
m A
ustra
lia
Vietnam 511 4.8 502–521 283
Austria 506 2.7 500–511 301
Australia 504 1.6 501–507 315
Ireland 501 2.2 497–506 280
Slovenia 501 1.2 499–504 298
Denmark 500 2.3 496–505 272
New Zealand 500 2.2 495–504 325
Czech Republic 499 2.9 493–505 309
Sign
ifica
ntly
low
erth
an A
ustra
lia
France 495 2.5 490–500 321
OECD average 494 0.5 493–495 301
United Kingdom 494 3.3 487–500 312
Iceland 493 1.7 489–496 302
Latvia 491 2.8 485–496 266
Luxembourg 490 1.1 488–492 310
Norway 489 2.7 484–495 297
Portugal 487 3.8 480–495 307
Italy 485 2.0 481–489 306
Spain 484 1.9 481–488 287
Russian Federation 482 3.0 476–488 285
Slovak Republic 482 3.4 475–488 334
United States 481 3.6 474–488 295
Lithuania 479 2.6 474–484 293
Sweden 478 2.3 474–483 298
Hungary 477 3.2 471–483 310
Croatia 471 3.5 464–478 289
Israel 466 4.7 457–476 347
Greece 453 2.5 448–458 289
Serbia 449 3.4 442–456 296
Turkey 448 4.8 439–457 302
Romania 445 3.8 437–452 266
Cyprus 440 1.1 438–442 308
Bulgaria 439 4.0 431–447 307
United Arab Emirates 434 2.4 429–439 294
Kazakhstan 432 3.0 426–438 235
Thailand 427 3.4 420–433 273
Chile 423 3.1 417–429 264
Malaysia 421 3.2 414–427 267
Mexico 413 1.4 411–416 245
Note: See page 6 for interpretation of this graph, this relates to all graphs with similar formatting in this document.
Mathematical literacy
» Australia achieved an average score of 504 points in the PISA 2012 mathematical literacy assessment, which was significantly higher than the OECD average of 494 score points.
» Sixteen countries scored significantly higher in mathematical literacy than Australia. Shanghai–China achieved the highest score, with an average score of 613 points. The difference between Shanghai–China’s and Australia’s mean scores represents just over three years of schooling.
» Seven countries had mean scores that were not significantly different from Australia. All other countries performed at a level significantly lower than Australia.
» The range of mathematical literacy scores between the lowest and highest performing students (students who scored between the 5th and 95th percentiles) was wider for Australian students (315 score points) than the OECD average (301 score points). A wider range indicates that there is a larger gap between the lowest and highest achieving students.

PISA in Brief | Highlights from the full Australian report8
Scientific literacy
CountryMean score SE
Confidence interval
Difference between
5th and 95th percentiles Distribution of scores
Sign
ifica
ntly
hig
her
than
Aus
tralia
Shanghai–China 580 3.0 574–586 269
200 300 400 500
Mean scientific literacy performance
600 700 800
Hong Kong–China 555 2.6 549–560 276
Singapore 551 1.5 548–554 340
Japan 547 3.6 539–553 314
Finland 545 2.2 541–549 306
Estonia 541 1.9 537–545 263
Korea 538 3.7 530–544 268
Not
sig
nific
antly
diff
eren
tfro
m A
ustra
lia
Vietnam 528 4.3 519–536 254
Poland 526 3.1 519–531 286
Canada 525 1.9 521–529 300
Liechtenstein 525 3.5 517–531 273
Germany 524 3.0 518–529 310
Chinese Taipei 523 2.3 518–527 273
Netherlands 522 3.5 515–528 310
Ireland 522 2.5 517–526 300
Australia 521 1.8 518–524 329
Macao–China 521 0.8 518–522 260
New Zealand 516 2.1 511–519 343
Switzerland 515 2.7 509–520 300
Slovenia 514 1.3 511–516 297
United Kingdom 514 3.4 507–520 327
Sign
ifica
ntly
low
erth
an A
ustra
lia
Czech Republic 508 3.0 502–514 294
Austria 506 2.7 500–511 300
Belgium 505 2.1 501–509 332
Latvia 502 2.8 496–507 258
OECD average 501 0.5 500–502 304
France 499 2.6 493–504 328
Denmark 498 2.7 493–503 306
United States 497 3.8 490–504 308
Spain 496 1.8 492–500 283
Lithuania 496 2.6 490–500 283
Norway 495 3.1 488–500 326
Hungary 494 2.9 488–500 294
Italy 494 1.9 489–497 305
Croatia 491 3.1 485–497 280
Luxembourg 491 1.3 488–493 337
Portugal 489 3.7 481–496 293
Russian Federation 486 2.9 480–491 280
Sweden 485 3.0 478–490 328
Iceland 478 2.1 474–482 325
Slovak Republic 471 3.6 464–478 332
Israel 470 5.0 460–479 354
Greece 467 3.1 460–472 292
Turkey 463 3.9 455–471 263
United Arab Emirates 448 2.8 442–453 306
Bulgaria 446 4.8 437–455 332
Chile 445 2.9 439–450 264
Serbia 445 3.4 438–451 287
Thailand 444 2.9 438–449 252
Romania 439 3.3 432–445 257
Cyprus 438 1.2 435–439 320
Costa Rica 429 2.9 423–435 231
Kazakhstan 425 3.0 418–430 243
Malaysia 420 3.0 413–425 258
Uruguay 416 2.8 410–421 316
Mexico 415 1.3 412–417 232
» Australia achieved an average score of 521 points in the PISA 2012 scientific literacy assessment, which was significantly higher than the OECD average of 501 score points.
» Seven countries performed significantly higher than Australia. Shanghai–China achieved the highest score, with an average score of 580 points. In terms of schooling, Shanghai–China performed almost two years higher than Australia.
» Australia’s performance was not significantly different from that of 11 countries, while all other countries performed at a level significantly lower than Australia.
» Australia showed a comparatively wide distribution of students’ performance in scientific literacy, with 329 score points between students in the 5th and 95th percentiles, compared to 304 score points across OECD countries.
PISA 2012: How Australia measures up 9
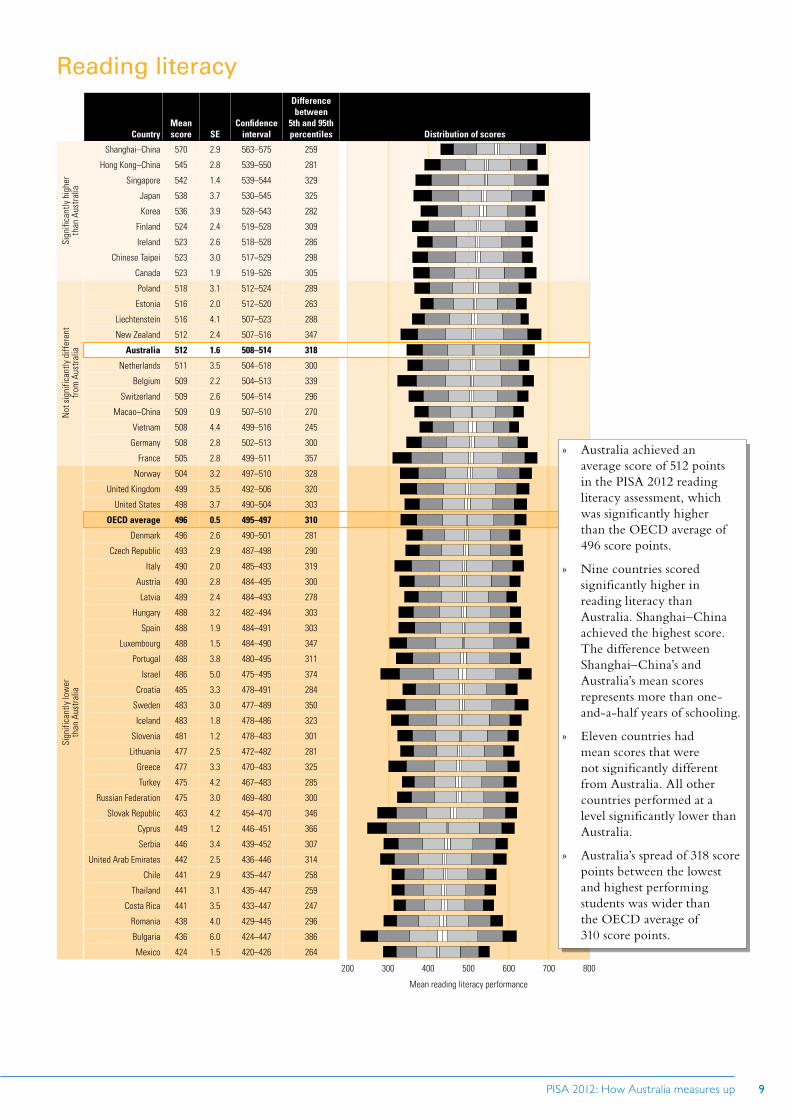
Reading literacy
CountryMean score SE
Confidence interval
Difference between
5th and 95th percentiles Distribution of scores
Sign
ifica
ntly
hig
her
than
Aus
tral
ia
Shanghai–China 570 2.9 563–575 259
200 300 400 500
Mean reading literacy performance
600 700 800
Hong Kong–China 545 2.8 539–550 281
Singapore 542 1.4 539–544 329
Japan 538 3.7 530–545 325
Korea 536 3.9 528–543 282
Finland 524 2.4 519–528 309
Ireland 523 2.6 518–528 286
Chinese Taipei 523 3.0 517–529 298
Canada 523 1.9 519–526 305
Not
sig
nific
antly
diff
eren
t fr
om A
ustr
alia
Poland 518 3.1 512–524 289
Estonia 516 2.0 512–520 263
Liechtenstein 516 4.1 507–523 288
New Zealand 512 2.4 507–516 347
Australia 512 1.6 508–514 318
Netherlands 511 3.5 504–518 300
Belgium 509 2.2 504–513 339
Switzerland 509 2.6 504–514 296
Macao–China 509 0.9 507–510 270
Vietnam 508 4.4 499–516 245
Germany 508 2.8 502–513 300
France 505 2.8 499–511 357
Sign
ifica
ntly
low
erth
an A
ustr
alia
Norway 504 3.2 497–510 328
United Kingdom 499 3.5 492–506 320
United States 498 3.7 490–504 303
OECD average 496 0.5 495–497 310
Denmark 496 2.6 490–501 281
Czech Republic 493 2.9 487–498 290
Italy 490 2.0 485–493 319
Austria 490 2.8 484–495 300
Latvia 489 2.4 484–493 278
Hungary 488 3.2 482–494 303
Spain 488 1.9 484–491 303
Luxembourg 488 1.5 484–490 347
Portugal 488 3.8 480–495 311
Israel 486 5.0 475–495 374
Croatia 485 3.3 478–491 284
Sweden 483 3.0 477–489 350
Iceland 483 1.8 478–486 323
Slovenia 481 1.2 478–483 301
Lithuania 477 2.5 472–482 281
Greece 477 3.3 470–483 325
Turkey 475 4.2 467–483 285
Russian Federation 475 3.0 469–480 300
Slovak Republic 463 4.2 454–470 346
Cyprus 449 1.2 446–451 366
Serbia 446 3.4 439–452 307
United Arab Emirates 442 2.5 436–446 314
Chile 441 2.9 435–447 258
Thailand 441 3.1 435–447 259
Costa Rica 441 3.5 433–447 247
Romania 438 4.0 429–445 296
Bulgaria 436 6.0 424–447 386
Mexico 424 1.5 420–426 264
» Australia achieved an average score of 512 points in the PISA 2012 reading literacy assessment, which was significantly higher than the OECD average of 496 score points.
» Nine countries scored significantly higher in reading literacy than Australia. Shanghai–China achieved the highest score. The difference between Shanghai–China’s and Australia’s mean scores represents more than one-and-a-half years of schooling.
» Eleven countries had mean scores that were not significantly different from Australia. All other countries performed at a level significantly lower than Australia.
» Australia’s spread of 318 score points between the lowest and highest performing students was wider than the OECD average of 310 score points.

PISA in Brief | Highlights from the full Australian report10
Mathematical, scientific and reading literacy results for the Australian jurisdictions
Mathematical literacy
Jurisdiction Mean score SEConfidence
interval
Difference between
5th and 95th percentiles Distribution of scores
ACT 518 3.6 511–525 319
200 300 400 500
Mean mathematical literacy performance
600 700 800
NSW 509 3.6 502–516 336
VIC 501 3.7 497–508 299
QLD 503 2.9 498–509 305
SA 489 3.3 483–496 299
WA 516 3.4 510–523 303
TAS 478 3.4 471–484 317
NT 452 10.4 431–472 368
Australia 504 1.6 501–507 315
Shanghai–China 613 3.3 606–619 331
OECD average 494 0.5 493–495 301
» The Australian Capital Territory, Western Australia, New South Wales and Queensland significantly outperformed the OECD average. Victoria and South Australia achieved at a level not significantly different to the OECD average, while Tasmania and the Northern Territory performed at a level significantly lower than the OECD average.
» The Australian Capital Territory, Western Australia and New South Wales performed at a level not significantly different to one another. The Australian Capital Territory and Western Australia significantly outperformed the other jurisdictions, while New South Wales performed significantly higher than South Australia, Tasmania and the Northern Territory. Queensland and Victoria performed significantly higher on average than South Australia, Tasmania and the Northern Territory. South Australia scored significantly higher than Tasmania and the Northern Territory, while Tasmania scored significantly higher than the Northern Territory. The Northern Territory was the only jurisdiction that was significantly outperformed by all other jurisdictions.
» The difference in mean mathematical literacy between the highest and lowest performing jurisdictions is 66 score points, the equivalent of almost two years of schooling.

PISA 2012: How Australia measures up 11
Scientific literacy
Jurisdiction Mean score SEConfidence
interval
Difference between
5th and 95th percentiles Distribution of scores
ACT 534 3.9 526–542 348
200 300 400 500
Mean scientific literacy performance
600 700 800
NSW 526 3.6 518–533 348
VIC 518 3.8 510–525 313
QLD 519 3.1 513–525 318
SA 513 3.7 505–520 320
WA 535 3.7 527–542 317
TAS 500 3.8 493–507 345
NT 483 10.2 463–503 412
Australia 521 1.8 518–524 329
Shanghai–China 580 3.0 574–586 269
OECD average 501 0.5 500–502 304
» The performances of Tasmania and the Northern Territory were not significantly different to the OECD average, while all other jurisdictions performed at a significantly higher level.
» Western Australia, the Australian Capital Territory and New South Wales performed at a statistically similar level, with Western Australia and the Australian Capital Territory significantly outperforming all other jurisdictions, while New South Wales performed significantly higher than South Australia, Tasmania and the Northern Territory. Queensland and Victoria achieved statistically similar scores, while the performance for Tasmania and the Northern Territory was significantly lower than the other jurisdictions, but not significantly different from each other.
» The difference in mean scientific literacy between the highest and lowest performing jurisdictions is 52 score points, the equivalent of one-and-a-half years of schooling.

PISA in Brief | Highlights from the full Australian report12
Reading literacy
Jurisdiction Mean score SEConfidence
interval
Difference between
5th and 95th percentiles Distribution of scores
ACT 525 3.6 518–532 339
200 300 400 500
Mean reading literacy performance
600 700 800
NSW 513 3.3 506–519 332
VIC 517 3.5 510–524 302
QLD 508 3.4 501–515 317
SA 500 4.0 493–508 301
WA 519 3.1 513–525 307
TAS 485 3.6 477–492 329
NT 466 8.3 499–482 413
Australia 512 1.6 508–514 318
Shanghai–China 570 2.9 563–575 259
OECD average 496 0.5 495–497 310
» The Australian Capital Territory, Western Australia, Victoria, New South Wales and Queensland performed significantly higher than the OECD average in reading literacy, while South Australia’s score was not significantly different. Tasmania and the Northern Territory achieved at a significantly lower level than the OECD average.
» Students in the Australian Capital Territory performed at a level not significantly different to students in Western Australia and Victoria, and significantly outperformed students in all other jurisdictions. Western Australia performed significantly higher than Queensland, South Australia, Tasmania and the Northern Territory, while Victoria and New South Wales performed significantly higher than South Australia, Tasmania and the Northern Territory. Queensland and South Australia performed significantly higher than Tasmania and the Northern Territory, and Tasmania performed significantly higher than the Northern Territory.
» The difference in mean reading literacy between the highest and lowest performing jurisdictions is 59 score points, the equivalent of more than one-and-a-half years of schooling.

PISA 2012: How Australia measures up 13
Providing further meaning to the PISA resultsIn addition to reporting the average (mean) scores for each country, PISA is able to provide a profile of students’ mathematical, scientific and reading literacy performance using proficiency levels—categories that summarise the skills and knowledge which students are able to display.
Students who are placed at Level 5 or 6 are considered top performers who are highly proficient in the relevant assessment domain. Students who are placed at Level 2 or below were considered low performers.
Internationally, Level 2 has been defined as a baseline proficiency level and defines the level of performance on
the PISA scale at which students begin to demonstrate the competencies that will enable them to actively participate in life situations. Students who fail to reach Level 2 have not acquired the skills and knowledge to allow them to adequately participate in the 21st century workforce and contribute as productive citizens.
In Australia, the nationally agreed baseline, as agreed in the Measurement Framework for Schooling in Australia3, is Level 3.
What students can do in mathematical literacy
Proficiency level Students at this level can
6 conceptualise, generalise and use information. They are capable of advanced mathematical thinking and reasoning; have a mastery of symbolic and formal mathematical operations and relationships; and can formulate and precisely communicate their findings, interpretations and arguments.
5 develop and work with models for complex situations; select, compare and evaluate appropriate problem-solving strategies for dealing with complex problems; work strategically using broad, well-developed thinking and reasoning skills; and reflect on their work and formulate and communicate their interpretations and reasoning.
4 work effectively with explicit models for complex, concrete situations; select and integrate different representations, including symbolic representations; utilise their skills and reason with insight; and construct and communicate explanations and arguments.
3execute clearly described procedures, including those that require sequential decisions; select and apply simple problem-solving strategies; interpret and use representations; typically show some ability to handle percentages, fractions and decimal numbers, and to work with proportional relationships; and provide solutions that reflect that they have engaged in basic interpretation and reasoning.
2interpret and recognise situations in contexts that require no more than direct inference; extract relevant information from a single source and make use of a single representational mode; employ basic algorithms, formulas, procedures or conventions to solve problems involving whole numbers; and make literal interpretations of the results.
1 answer questions involving familiar contexts where all relevant information is present and the questions are clearly defined; identify information and carry out routine procedures; and perform actions that are almost always obvious and follow immediately from the given stimuli.
Below Level 1 not demonstrate even the most basic types of mathematical literacy that PISA measures. These students are likely to be seriously disadvantaged in their lives beyond school.
Mathematical literacy results for Australia and each of the jurisdictions (as well as the OECD average and the highest scoring country/economy) are presented in the figure below and ordered by jurisdiction from the lowest to the highest percentage of students who performed below Level 2 in mathematical literacy in PISA 2012.
100 80 60 40 20 0
Percentage of students
20 40 60 80 100
OECD average
Shanghai–China
Australia
NT
TAS
SA
QLD
VIC
NSW
WA
ACT 5
5
6
3
4
2
2
2
4
31
3
13
13
11
9
11
8
7
5
11
25
9
21
23
18
20
19
17
15
11
19
20
18
25
23
24
26
25
25
24
24
25
13
24
20
21
21
23
22
24
25
23
22
8
22
10
12
13
14
14
16
16
18
14
3
15
6
4
6
6
6
7
10
18
6
1
8
Below Level 1 Level 1 Level 2 Level 3 Level 4 Level 5 Level 6
3 ACARA. (2013). Sydney: Author.

PISA in Brief | Highlights from the full Australian report14
What students can do in scientific literacy
Proficiency level Students at this level can
6identify, explain and apply scientific knowledge in a variety of complex life situations; link information sources and explanations, and use evidence from those sources to justify decisions; clearly and consistently demonstrate advanced scientific thinking and reasoning; and use their scientific understanding in support of solutions to unfamiliar scientific and technological situations.
5 identify the scientific components of many complex life situations; apply both scientific concepts and knowledge about science to these situations; use well-developed inquiry abilities; link knowledge appropriately and bring critical insights to situations; and construct explanations based on evidence and arguments.
4 work effectively with situations and issues that may involve explicit phenomena; integrate explanations from different disciplines of science or technology and link those explanations directly to aspects of life situations; and reflect on actions and communicate decisions using scientific knowledge and evidence.
3 identify clearly described scientific issues in a range of contexts; select facts and knowledge to explain phenomena and apply simple models or inquiry strategies; and interpret and use scientific concepts from different disciplines and apply them directly.
2 use adequate scientific knowledge to provide possible explanations in familiar contexts or draw conclusions based on simple investigations; and can use direct reasoning and make literal interpretations of the results of scientific inquiry or technological problem solving.
1 present scientific explanations that are obvious and follow explicitly from given evidence. They have a limited scientific knowledge that can only be applied to a few, familiar situations.
Below Level 1 not demonstrate even the most basic types of scientific literacy that PISA measures. These students are likely to be seriously disadvantaged in their lives beyond school.
The scientific literacy results for Australia as a whole, the jurisdictions, the OECD average and the highest scoring country/economy are presented in the figure below. The figure is ordered by jurisdiction from the lowest to the highest percentage of students who performed below Level 2 in scientific literacy in PISA 2012.
100 80 60 40 20 0
Percentage of students
20 40 60 80 100
OECD average
Shanghai–China
Australia
NT
TAS
SA
NSW
VIC
QLD
ACT
WA 3
3
2
2
4
2
2
3
3
4
1
13
14
10
9
13
9
8
6
11
23
7
25
26
23
23
22
22
21
19
23
35
20
29
28
29
30
27
28
26
27
29
25
29
19
17
23
22
20
24
23
19
21
10
25
9
8
10
11
10
11
14
13
10
2
13
2
4
3
3
4
4
6
13
3
5
Below Level 1 Level 1 Level 2 Level 3 Level 4 Level 5 Level 6

PISA 2012: How Australia measures up 15
What students can do in reading literacy
Proficiency level Students at this level can
6 make multiple inferences, comparisons and contrasts; demonstrate a full and detailed understanding of one or more texts; integrate information from more than one text; and deal with unfamiliar ideas in the presence of prominent competing information.
5 locate and organise several pieces of deeply embedded information, inferring which information in the text is relevant; and critically evaluate or hypothesise, drawing on specialised knowledge.
4 locate and organise several pieces of embedded information; interpret the meaning of nuances of language in a section of text; and demonstrate an accurate understanding of long or complex texts whose content or form may be unfamiliar.
3 locate (and in some cases recognise the relationship between) several pieces of information; integrate several parts of a text in order to identify a main idea; locate required information that is not prominent or where there is much competing information; and demonstrate a fine understanding of the text in relation to familiar, everyday knowledge.
2 locate one or more pieces of information; recognise the main idea in a text; and understand relationships, or construe meaning within a limited part of the text, when the information is not prominent and the reader must make low-level inferences.
1a locate one or more independent pieces of explicitly stated information; recognise the main theme or author’s purpose in a text about a familiar topic; and make simple connections.
1b locate a single piece of explicitly stated information in a prominent position in a short, syntactically simple text with a familiar context and text type in which there is a high level of support for the reader.
Below Level 1b not demonstrate even the most basic types of reading literacy that PISA measures.
Reading literacy results for Australia and each of the jurisdictions (as well as the OECD average and the highest scoring country/economy) are presented in the figure below and ordered from the lowest to the highest percentage of students who performed below Level 2 in reading literacy in PISA 2012.
100 80 60 40 20 0
Percentage of students
20 40 60 80 100
OECD average
Shanghai–China
Australia
NT
TAS
SA
QLD
NSW
ACT
WA
VIC 2
2
2
2
2
1
1
2
4
1
9
11
13
11
9
7
6
6
10
21
7
24
25
28
23
22
22
19
19
23
36
21
32
29
29
27
29
31
27
26
29
25
29
20
21
16
22
23
24
26
20
22
11
23
9
9
7
10
11
11
14
14
10
3
12
2
2
4
4
3
3
5
7
3
4
1
2
1
1
1
2
7
1
1
Level 1bBelow Level 1b Level 1a Level 2 Level 3 Level 4 Level 5 Level 6

PISA in Brief | Highlights from the full Australian report16
Results for males and females
Mathematical literacy
100 80 60 40 20 0Percentage of students
20 40 60 80 100
Aus
tral
iaO
ECD
ave
rage
Males
Females
Males
Females 3
5
2
4
9
12
8
10
19
19
18
19
25
24
24
23
22
22
24
21
15
12
16
14
6
6
8
8
Below Level 1 Level 1 Level 2 Level 3 Level 4 Level 5 Level 6
» In Australia, males achieved a mean score of 510 points, which was significantly higher than the mean score achieved by Australian females of 498 points. This difference is equivalent to about one-third of a school year.
» Twelve per cent of Australian females and 17% of Australian males were top performers compared to 10% of females and 14% of males across OECD countries.
» Twenty-one per cent of Australian females and 18% of Australian males were low performers compared to 24% of females and 22% of males across OECD countries.
Scientific literacy
100 80 60 40 20 0Percentage of students
20 40 60 80 100
Aus
tral
iaO
ECD
ave
rage
Males
Females
Males
Females 2
3
1
1
10
12
7
8
23
23
20
21
30
27
30
28
22
21
26
24
10
10
13
13
3
4
4
5
Below Level 1 Level 1 Level 2 Level 3 Level 4 Level 5 Level 6
» Australian females and males performed at a level that was not significantly different in scientific literacy, while across OECD countries males outperformed females (by 2 score points on average).
» In Australia, 12% of females and 15% of males were top performers compared to 8% of females and 9% of males across OECD countries.
» In Australia, 13% of females and 14% of males were low performers compared to 17% of females and 18% of males across OECD countries.

PISA 2012: How Australia measures up 17
Reading literacy
100 80 60 40 20 0Percentage of students
20 40 60 80 100
Aus
tral
iaO
ECD
ave
rage
Males
Females
Males
Females 2
1
1
1
12
8
9
5
27
20
25
18
30
28
31
27
20
24
22
25
7
13
9
15
2
4
2
6
1
1
2
Level 1bBelow Level 1b Level 1a Level 2 Level 3 Level 4 Level 5 Level 6
» In Australia, the mean performance for females was 530 score points and the mean performance for males was 495 score points. This difference represents one year of schooling.
» Fourteen per cent of Australian females and 9% of Australian males were top performers in reading literacy compared to 10% of females and 6% of males on average across OECD countries.
» Nine per cent of Australian females and 18% of Australian males were low performers in reading literacy compared to 12% of females and 23% of males across OECD countries.

PISA in Brief | Highlights from the full Australian report18
Results for Indigenous studentsAltogether, 1991 Australian Indigenous students participated in the PISA 2012 assessment.
Mathematical literacy
» Indigenous students achieved a mean mathematical literacy score of 417 points, which was significantly lower than the OECD average (494 score points) and non-Indigenous students (507 score points). The mean score difference of 90 points between Indigenous and non-Indigenous students equates to more than two-and-a-half years of schooling.
» There was no significant difference between the performances of Indigenous females and males in mathematical literacy.
» The results indicate that there is an under-representation of Indigenous students at the higher end of the mathematical literacy proficiency scale and an over-representation of Indigenous students at the lower end of the scale.
» Only 2% of Indigenous students were top performers in mathematical literacy compared to 15% of non-Indigenous students.
» Half of the Indigenous students were low performers compared to 18% of non-Indigenous students.
100 80 60 40 20 0
Percentage of students
20 40 60 80 100
Non-Indigenous
Indigenous
4
2
11
6
20
15
25
26
22
25
13
26
5
Below Level 1 Level 1 Level 2 Level 3 Level 4 Level 5 Level 6
Scientific literacy
» In scientific literacy, Indigenous students achieved a mean score of 440 points compared to a mean score of 524 points for non-Indigenous students. The difference of 84 score points equates to about two-and-a-half years of schooling.
» There was no significant difference between the performances of Indigenous females and males in scientific literacy.
» Two per cent of Indigenous students were top performers in scientific literacy compared to 14% of non-Indigenous students.
» Thirty-seven per cent of Indigenous students were low performers in scientific literacy compared to 13% of non-Indigenous students.
Reading literacy
» Indigenous students recorded a mean score of 428 points compared to a mean score of 515 points for non-Indigenous students. This difference of 87 score points equates to two-and-a-half years of schooling.
» The mean reading literacy score for Indigenous females was 450 points, which was significantly different to the mean score for Indigenous males of 405 points. This mean difference of 45 score points indicates Indigenous males are performing about one-and-a-third years of schooling below Indigenous females.
» Two per cent of Indigenous students were top performers in reading literacy compared to 12% of non-Indigenous students.
» Thirty-nine per cent of Indigenous students were low performers in reading literacy compared to 14% of non-Indigenous students.

PISA 2012: How Australia measures up 19
Results for school sectorsResults of student performance across the three school sectors (government, Catholic and independent) are compared using the unadjusted mean score, as well as an adjusted mean score.
» Comparing the unadjusted mean mathematical literacy scores for these three groups of students reveals that, on average, students in the independent school sector achieved significantly higher than students in the Catholic or government school sectors, and students in Catholic schools scored significantly higher than students in government schools. These findings are also applicable to scientific and reading literacy.
» There were similar proportions of top performers in mathematical literacy in government and Catholic schools (13 and 14% respectively), while there were almost twice as many top performers (23%) in independent schools.
» One-quarter of students in government schools were low performers in mathematical literacy, compared to 14% of students in Catholic schools and 9% of students in independent schools.
100 80 60 40 20 0
Percentage of students
20 40 60 80 100
Independent
Catholic
Government 4
3
7
9
11
16
16
22
26
23
28
25
24
21
17
17
10
7
8
4
2
Below Level 1 Level 1 Level 2 Level 3 Level 4 Level 5 Level 6
When examining the results for school sector, it is also important to recognise the effect that an individual student’s family background or socioeconomic background4 has on their performance, as well as the effect of school-level socioeconomic background. Statistically, the adjusted mean score accounts for the differences in a student’s socioeconomic background and also that of the school they attend.
» When student-level socioeconomic background is taken into account, students in independent schools performed significantly higher than students in Catholic schools, and students in Catholic schools performed significantly higher than students in government schools, although the differences are reduced.
» When school-level socioeconomic background is also taken into account, the differences in performance across school sectors are not significant.
4 In PISA, socioeconomic background is measured by an index of Economic, Social and Cultural Status (ESCS), which is based on student responses to several questions: occupations of students’ parents or guardians; the highest level of education of parents (converted into years of education); an index of educational resources in the home; an index of cultural possessions in the home; and an index of family wealth.

PISA in Brief | Highlights from the full Australian report20
Results for geographic location of schoolsThe geographic location of schools was classified using the broad categories (metropolitan, provincial and remote) defined in the MCEECDYA Schools Geographic Location Classification.5
Mathematical literacy
» Students who attended schools in metropolitan areas achieved significantly higher scores (511 points on average) in mathematical literacy than those in provincial (486 points on average) or remote schools (444 points on average), and students in provincial schools performed significantly higher than students in remote schools.
» Students in metropolitan schools scored on average 25 points higher (the equivalent of almost three-quarters of a school year) than students attending provincial schools. The mean score difference between students attending metropolitan schools and students attending remote schools was even larger at 67 points on average (the equivalent of almost two years of schooling). Students in provincial schools scored on average 42 points higher than students in remote schools (the equivalent of almost one-and-a-quarter years of schooling).
» Seventeen per cent of students in metropolitan schools, 10% of students in provincial schools and 6% of students in remote schools were top performers.
» Eighteen per cent of students in metropolitan schools, 23% of students in provincial schools and 39% of students in remote schools were low performers.
100 80 60 40 20 0
Percentage of students
20 40 60 80 100
Remote
Provincial
Metropolitan 5
2
1
12
8
5
20
16
12
24
26
20
21
26
23
13
16
20
5
7
19
Below Level 1 Level 1 Level 2 Level 3 Level 4 Level 5 Level 6
Scientific literacy
» In scientific literacy, students attending metropolitan schools performed at a significantly higher level (527 score points on average), than students in schools from provincial areas (509 score points on average) and remote areas (470 score points on average), and students in provincial areas significantly outperformed students in remote schools.
» The mean difference between students attending schools in metropolitan areas and provincial areas was equivalent to half-a-year of school. The difference in mean scores between schools in metropolitan areas and schools in remote areas was around one-and-a-half years of school, while the mean score difference between schools in provincial areas and schools in remote areas equates to about one year of school.
Reading literacy
» In reading literacy, students attending metropolitan schools performed at a significantly higher level (520 score points on average) than students in schools from provincial areas (490 score points on average), who in turn performed at a significantly higher level than students attending schools in remote areas (452 score points on average).
» The mean score difference between students in metropolitan schools and provincial schools represents almost one year of school. The difference in mean scores between students in metropolitan and remote schools equates to about two years of schooling, while the mean score difference between students in provincial and remote schools equates to more than one year of school.
5 For more information about the MCEECDYA Schools Geographic Location Classification, refer to the Reader’s Guide in the full Australian report.

PISA 2012: How Australia measures up 21
Results for socioeconomic backgroundSocioeconomic background in PISA is measured by an index of Economic, Social and Cultural Status (ESCS).6 Across all literacy domains, the results show the higher the level of socioeconomic background, the higher the level of students’ performance.
Mathematical literacy
» In mathematical literacy, students in the highest socioeconomic quartile achieved a mean score of 550 points, which was 29 score points higher than the average score of students in the third quartile, 58 score points higher than students in the second quartile and 87 score points higher than students in the lowest quartile.
» The gap between students in the highest and lowest quartiles equates to around two-and-a-half years of schooling.
» Twenty-seven per cent of students in the highest quartile were top performers compared to 5% of students in the lowest quartile.
» Eight per cent of students in the highest quartile were low performers compared to 33% of students in the lowest quartile.
100 80 60 40 20 0
Percentage of students
20 40 60 80 100
Highest quartile
Third quartile
Second quartile
Lowest quartile 1
3
4
9
4
8
13
18
12
17
22
26
22
27
26
24
27
25
21
15
22
16
10
6
11
6
3
2
Below Level 1 Level 1 Level 2 Level 3 Level 4 Level 5 Level 6
Scientific literacy
» In scientific literacy, students in the highest socioeconomic quartile achieved a mean score of 567 points, which was on average 88 score points higher than those students in the lowest quartile. The mean score difference between students in the lowest and highest socioeconomic quartiles represents around two-and-a-half years of schooling.
Reading literacy
» In reading literacy, students in the highest socioeconomic quartile achieved a mean score of 557 points, compared to a mean score of 471 points for students in the lowest quartile. The mean score difference of 86 points on average equates to about two-and-a-half years of schooling.
6 Refer to the footnote on page 19 for details about the ESCS index.

PISA in Brief | Highlights from the full Australian report22
Results for immigrant backgroundImmigrant background was measured on students’ self-report of where they and their parents were born.7
» Australian-born students achieved a mean score of 500 points in mathematical literacy, which was significantly lower than the mean score for foreign-born students (508 points) and first-generation students (518 points). First-generation students scored significantly higher than foreign-born students.
» Around one-fifth of first-generation students were top performers in mathematical literacy, a similar proportion to foreign-born students (17%) and a higher proportion than Australian-born students (13%).
» Approximately one-fifth of Australian-born and foreign-born students were low performers, while for first-generation students this proportion was slightly lower at 17%.
100 80 60 40 20 0
Percentage of students
20 40 60 80 100
Foreign-born
First-generation
Australian-born 3
7
5
10
12
12
19
19
20
26
24
22
23
21
20
14
12
14
6
5
7
Below Level 1 Level 1 Level 2 Level 3 Level 4 Level 5 Level 6
» In scientific literacy, the mean score of 533 points for first-generation students was significantly higher than that of Australian-born students (521 points) and that of foreign-born students (516 points).
» In reading literacy, Australian-born students achieved a mean score of 508 points, which was significantly lower than the mean score for first-generation students (526 points) and not significantly different from foreign-born students (515 points).
Results for language backgroundLanguage background was based on students’ responses regarding the main language spoken at home—English or another language.
» In mathematical literacy, students who spoke English at home scored 506 points on average, which was not significantly different from the 509 score points on average for those students who spoke a language other than English at home.
» The proportion of students who were top performers was lower for students who spoke English at home (14%) than for students who spoke a language other than English at home (21%).
» The proportion of students who were low performers was lower for students who spoke English at home (18%) than for students who spoke a language other than English at home (23%).
100 80 60 40 20 0
Percentage of students
20 40 60 80 100
Language other thanEnglish spoken
at home
English spokenat home 4
8
10
13
19
18
25
21
22
18
13
15
5
8
Below Level 1 Level 1 Level 2 Level 3 Level 4 Level 5 Level 6
» In scientific literacy, students who spoke English at home performed significantly higher (mean score of 525 points) than those students who spoke a language other than English at home (mean score of 508 points).
» In reading literacy, students who spoke English at home achieved a mean score of 515 points, which was significantly higher than students who spoke a language other than English at home (mean score of 506 points).
7 For more information about the definition of immigrant background, refer to the Reader’s Guide in the full Australian report.

PISA 2012: How Australia measures up 23
Monitoring student performance changes over time
Mathematical literacy
» Nine countries have significantly improved their mathematical literacy performance over this time, while 13 countries (including Australia) have declined significantly.
» Australia’s mean mathematical literacy performance declined significantly between PISA 2003 and PISA 2012 (by 20 score points on average).
» There has been a significant decline in the performance of top performers, average performers and low performers (i.e., there have been significant declines at the 10th, 25th, 75th and 90th percentiles between PISA 2003 and PISA 2012).
» Between PISA 2003 and PISA 2012, the proportion of Australian low performers (those students who failed to reach Level 2) significantly increased (by 5%) and the proportion of Australian top performers (those students who reached Level 5 or above) significantly decreased (by 5%).
» The mean proportion of students in Australia performing at each mathematical literacy proficiency level in PISA 2003, PISA 2006, PISA 2009 and PISA 2012 illustrates a shift in performance at either end of the proficiency scale.
100 80 60 40 20 0
Percentage of students
20 40 60 80 100
PISA 2012
PISA 2009
PISA 2006
PISA 2003 6
4
4
4
14
12
12
11
23
23
22
19
24
27
26
25
19
21
20
22
10
10
11
14
4
3
5
6
Below Level 1 Level 1 Level 2 Level 3 Level 4 Level 5 Level 6
» All jurisdictions, except Victoria, showed a significant decline in their mathematical literacy performance between PISA 2003 and PISA 2012.
» The largest change was in South Australia and the Northern Territory with a decrease of 46 and 45 score points on average respectively, followed by Western Australia, Tasmania and the Australian Capital Territory with a decrease of around 30 score points on average, and New South Wales and Queensland with a decrease of around 16 score points on average.
Jurisdiction
PISA 2003 PISA 2006 PISA 2009 PISA 2012
Difference between 2003 and 2012
(PISA 2012 – PISA 2003)
Mean score SE
Mean score SE
Mean score SE
Mean score SE Score dif. SE
ACT 548 3.5 539 5.6 528 6.4 518 3.6 –30 5.4
NSW 526 4.3 523 5.0 512 5.2 509 3.6 –17 5.9
VIC 511 5.1 513 4.0 512 4.9 501 3.7 –10 6.6
QLD 520 6.9 519 4.4 518 7.5 503 2.9 –16 7.7
SA 535 4.9 520 4.3 509 5.3 489 3.3 –46 6.2
WA 548 4.1 531 6.5 529 7.2 516 3.4 –32 5.7
TAS 507 9.4 502 3.8 487 5.1 478 3.4 –30 10.2
NT 496 4.9 481 6.2 487 4.9 452 10.4 –45 11.6
Notes: Values that are statistically significant are indicated in bold.
The mean score difference has been calculated without rounding off decimal places but the formatting shows whole numbers, which can create small discrepancies.

PISA in Brief | Highlights from the full Australian report24
» In four jurisdictions (South Australia, Western Australia, Tasmania and the Northern Territory), there was a significant increase in the proportion of low performers and a significant decrease in the proportion of top performers between PISA 2003 and PISA 2012. There were 12% more students in South Australia, 8% in Western Australia, 9% in Tasmania and 14% in the Northern Territory who had not reached Level 2 in PISA 2012 compared to PISA 2003. There were 13% fewer students in South Australia, 10% in Western Australia, 5% in Tasmania and 8% in the Northern Territory who had not reached Level 5 or above in PISA 2012 than in PISA 2003.
» In the Australian Capital Territory, the proportion of top performers decreased significantly (by 9%) between PISA 2003 and PISA 2012; while in New South Wales, the proportion of low performers significantly increased (by 6%).
» Significant differences between sexes, in favour of males, were also found in PISA 2006 (with 14 score points difference), PISA 2009 (with 10 score points difference) and PISA 2012 (with 12 score points difference).
» The mean mathematical literacy performance for Australian females and males declined significantly between PISA 2003 and PISA 2012. The mean performance for females decreased by 24 score points on average, while the mean performance for males decreased by 17 score points.
» Mathematical literacy performance for females declined significantly in all jurisdictions, except Victoria; while for males, it declined significantly in five jurisdictions (South Australia, the Northern Territory, the Australian Capital Territory, Tasmania and Western Australia) between PISA 2003 and PISA 2012.
» Average mathematical literacy performance declined significantly for Indigenous students (by 23 score points on average) and for non-Indigenous students (by 19 score points on average) between PISA 2003 and PISA 2012.
» Between PISA 2003 and PISA 2012, the proportion of Indigenous top performers fell significantly (by 2%).
» The proportion of non-Indigenous top performers decreased (by 5%) between PISA 2003 and PISA 2012, and the proportion of non-Indigenous low performers increased significantly (by 5%) between PISA 2003 and PISA 2012.
Scientific literacy
» Australia’s mean score in scientific literacy has not changed significantly between PISA 2006 and PISA 2012.
» Between PISA 2006 and PISA 2012, the proportions of top performers and low performers have remained stable and are not significantly different.
» Between PISA 2006 and PISA 2012, there was a significant decline in the mean scientific literacy performance for students in the Australian Capital Territory (by 15 score points on average) and in South Australia (by 19 score points on average).
» Between PISA 2006 and PISA 2012, there was a significant increase in the proportion of low performers in New South Wales (by 3%) and in South Australia (by 4%).
» In South Australia, average scientific literacy performance declined significantly for females (a difference of 20 score points on average) and for males (a difference of 18 score points on average) between PISA 2006 and PISA 2012.
Reading literacy
» Australia’s mean reading literacy performance declined significantly from PISA 2000 to PISA 2012 (by 16 score points on average). There was a significant decline in the performance of students at the 75th and 90th percentiles.
» The proportion of Australian top performers declined significantly (by 5%) between PISA 2000 and PISA 2012, while the proportion of Australian low performers did not change significantly between PISA 2000 and PISA 2012 in reading literacy.
» Five jurisdictions (the Australian Capital Territory, New South Wales, South Australia, Tasmania and the Northern Territory) showed a significant decline in reading literacy performance between PISA 2000 and PISA 2012. The decline in performance ranged from 23 score points in the Northern Territory to 37 score points in South Australia.
» Between PISA 2000 and PISA 2012, the proportion of top performers in the Australian Capital Territory, South Australia, Western Australia and Tasmania decreased significantly; while the proportion of low performers in the Australian Capital Territory, New South Wales and South Australia increased significantly.
» There was a significant decline in the reading literacy performance of males in three jurisdictions (the Australian Capital Territory, New South Wales and South Australia), while there was a significant decline in the performance of females in four jurisdictions (New South Wales, South Australia, Western Australia and the Northern Territory).

PISA 2012: How Australia measures up 25
Australian students’ motivation to learn and succeed in mathematicsStudents’ motivation and engagement can have a profound impact on their classroom performance in the short term and can affect the quality of their learning in the long term. In the national report, Australia’s results in this area were compared to Shanghai–China, Hong Kong–China, Singapore, Canada, New Zealand, the United States and the United Kingdom. These are referred to as comparison countries.
» Australian students, on average, demonstrated a higher level of intrinsic motivation (or higher levels of enjoyment or interest in mathematics) than the OECD average. This was similar to levels reported by students in the United States, New Zealand and Canada, but below the levels of enjoyment reported by the high-performing countries of Shanghai–China and, in particular, Singapore.
» The percentages of Australian students who agreed that learning mathematics would enhance employment, career and study opportunities were higher than the OECD average. Approximately one-third of females in Australia reported that they did not think that mathematics was important for later study compared to one-fifth of males.
» Australian students’ average level of self-concept (how competent they perceived themselves to be in mathematics) was just above the OECD average. Australia and all comparison countries had a significant difference by sex in reported self-concept in favour of males, with the biggest gap being found in Shanghai–China.
» Students from New Zealand had the lowest levels of self-efficacy, whereas students from Shanghai–China reported levels of self-efficacy almost a standard deviation higher than the OECD average. Students from Australia and the United Kingdom scored at a similar level, just above the OECD average. Females scored significantly lower than males on the self-efficacy index in all countries, with Australia and New Zealand having the largest gap between the sexes.
» In Australia and all comparison countries there was a pattern for students to take responsibility for failure in mathematics, rather than attribute it to external factors. In Australia, male and Indigenous students reported more of a tendency to attribute failure in mathematics to their own efforts compared to females and non-Indigenous students, who were more likely to attribute failure to factors beyond their control.
The Australian school environment and conditions for learningSchool climate shapes the environment of students’ learning. PISA’s examination of school climate was considered in relation to five domains: order, safety and discipline; academic outcomes; social relationships; school facilities; and school connectedness.
» Australian students, on average, reported a higher frequency of students not listening, noise and disorder, and teachers needing to wait a long time for students to quieten down compared to the OECD average and all other comparison countries, except New Zealand.
» Australian students were more likely than students from all comparison countries to report skipping days of school in the two weeks prior to the PISA assessment. Australian students were less likely than the OECD average to report skipping classes.
» Australia’s jurisdictions, in general, had access to a high quality of resources compared to the OECD average. However, 38% of Northern Territory principals reported that a lack of access to science laboratory equipment affected learning ‘to some extent’ or ‘a lot’, while 52% of principals in the Australian Capital Territory and 30% of Tasmanian principals reported learning being affected ‘to some extent’ or ‘a lot’ by inadequate internet connections. Thirty-two per cent of principals in the Australian Capital Territory and 29% of principals in the Northern Territory reported problems with a shortage or inadequacy of instructional materials.
» Principals from the United Kingdom and New Zealand reported the highest levels of teacher morale. While teacher morale is perceived by principals to be highest in Australian Capital Territory schools, it is below the OECD average in Northern Territory schools.
» On average, over 20% of Australian students felt that they did not belong, were not happy or were not satisfied at school.
PISA in Brief | Highlights from the full Australian report26
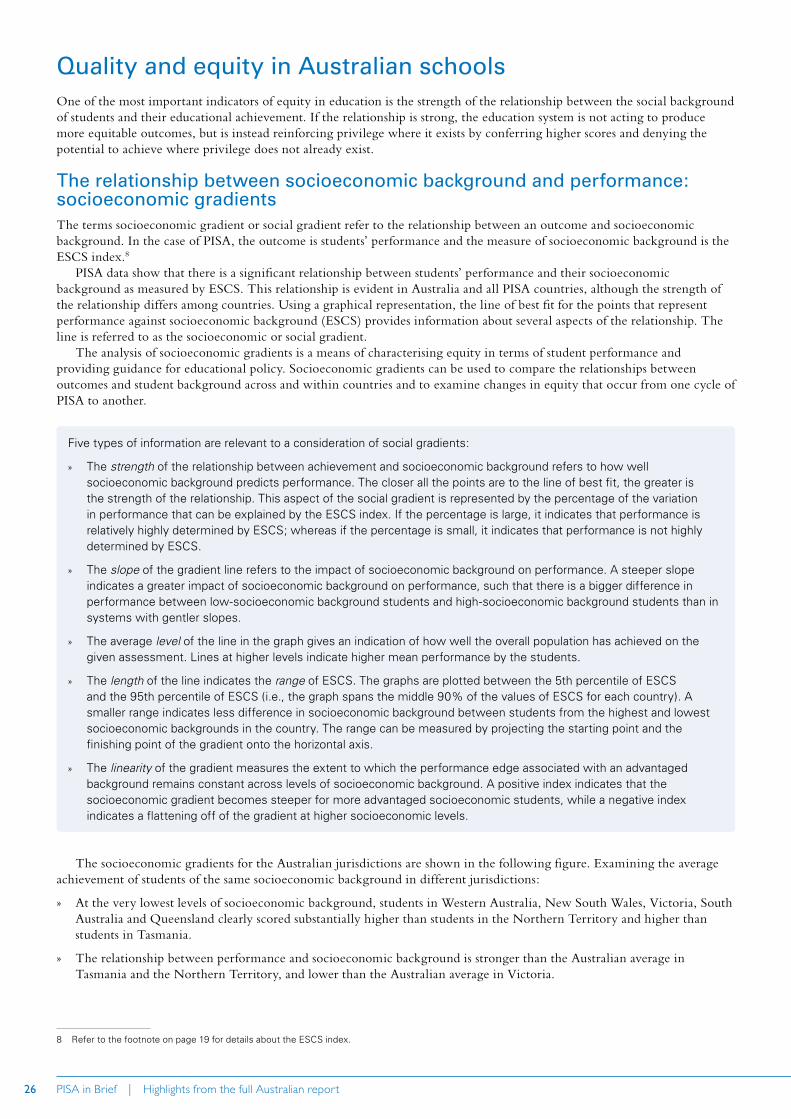
Quality and equity in Australian schoolsOne of the most important indicators of equity in education is the strength of the relationship between the social background of students and their educational achievement. If the relationship is strong, the education system is not acting to produce more equitable outcomes, but is instead reinforcing privilege where it exists by conferring higher scores and denying the potential to achieve where privilege does not already exist.
The relationship between socioeconomic background and performance: socioeconomic gradientsThe terms socioeconomic gradient or social gradient refer to the relationship between an outcome and socioeconomic background. In the case of PISA, the outcome is students’ performance and the measure of socioeconomic background is the ESCS index.8
PISA data show that there is a significant relationship between students’ performance and their socioeconomic background as measured by ESCS. This relationship is evident in Australia and all PISA countries, although the strength of the relationship differs among countries. Using a graphical representation, the line of best fit for the points that represent performance against socioeconomic background (ESCS) provides information about several aspects of the relationship. The line is referred to as the socioeconomic or social gradient.
The analysis of socioeconomic gradients is a means of characterising equity in terms of student performance and providing guidance for educational policy. Socioeconomic gradients can be used to compare the relationships between outcomes and student background across and within countries and to examine changes in equity that occur from one cycle of PISA to another.
The socioeconomic gradients for the Australian jurisdictions are shown in the following figure. Examining the average achievement of students of the same socioeconomic background in different jurisdictions:
» At the very lowest levels of socioeconomic background, students in Western Australia, New South Wales, Victoria, South Australia and Queensland clearly scored substantially higher than students in the Northern Territory and higher than students in Tasmania.
» The relationship between performance and socioeconomic background is stronger than the Australian average in Tasmania and the Northern Territory, and lower than the Australian average in Victoria.
8 Refer to the footnote on page 19 for details about the ESCS index.
Five types of information are relevant to a consideration of social gradients:
» The strength of the relationship between achievement and socioeconomic background refers to how well socioeconomic background predicts performance. The closer all the points are to the line of best fit, the greater is the strength of the relationship. This aspect of the social gradient is represented by the percentage of the variation in performance that can be explained by the ESCS index. If the percentage is large, it indicates that performance is relatively highly determined by ESCS; whereas if the percentage is small, it indicates that performance is not highly determined by ESCS.
» The slope of the gradient line refers to the impact of socioeconomic background on performance. A steeper slope indicates a greater impact of socioeconomic background on performance, such that there is a bigger difference in performance between low-socioeconomic background students and high-socioeconomic background students than in systems with gentler slopes.
» The average level of the line in the graph gives an indication of how well the overall population has achieved on the given assessment. Lines at higher levels indicate higher mean performance by the students.
» The length of the line indicates the range of ESCS. The graphs are plotted between the 5th percentile of ESCS and the 95th percentile of ESCS (i.e., the graph spans the middle 90% of the values of ESCS for each country). A smaller range indicates less difference in socioeconomic background between students from the highest and lowest socioeconomic backgrounds in the country. The range can be measured by projecting the starting point and the finishing point of the gradient onto the horizontal axis.
» The linearity of the gradient measures the extent to which the performance edge associated with an advantaged background remains constant across levels of socioeconomic background. A positive index indicates that the socioeconomic gradient becomes steeper for more advantaged socioeconomic students, while a negative index indicates a flattening off of the gradient at higher socioeconomic levels.

PISA 2012: How Australia measures up 27
600
500
400
300–3.0 –2.5 –2.0 –1.5 –1.0 –0.5 0.0 0.5 1.51.0 2.0 2.5 3.0
Mat
hem
atic
al li
tera
cy p
erfo
rman
ce
ESCS index
NT
VIC
ACTAUS
NSW
QLDSA
WA
TAS
The figure below explores the relationship between equity (the strength of the social gradient) and mean mathematical literacy performance for a selection of participating PISA 2012 countries and the Australian jurisdictions. The horizontal axis represents the strength of the relationship between socioeconomic background and performance, used as a proxy for equity in the distribution of learning opportunities. Mean performance in mathematical literacy is plotted on the vertical axis, with the line at 494 representing the OECD average.
» In PISA 2003, Australia’s overall performance in mathematical literacy was described as high quality–high equity, as the overall scores in mathematical literacy were higher than the OECD average and the impact of socioeconomic background was lower than the OECD average.
» In PISA 2012, Australia was also categorised as high quality–high equity in mathematical literacy, along with the high-scoring countries of Macao–China, Hong Kong–China, Estonia and Canada. Chinese Taipei and Singapore all scored well above the OECD average, putting them in the high-quality quarter, but their equity scores were not significantly different to the OECD average. The scores for the Slovak Republic placed it in the low quality–low equity quarter, with scores significantly lower than the OECD average for achievement but with a significantly higher proportion of the score explained by the ESCS index.
This figure also shows the levels of quality and equity for the Australian jurisdictions. Only Victoria was significantly different to the OECD average in terms of equity.
30.0400
450
500
Mat
hem
atic
al li
tera
cy p
erfo
rman
ce
550
600
650
25.0 20.0 15.0
Percentage of variance in performance in mathematical literacy explained by the ESCS index (r-squared × 100)
10.0 5.0 0.0
Low Quality–Low Equity
OECD average–Quality
OECD
ave
rage
–Equ
ity
Low Quality–High Equity
High Quality–Low Equity
High Quality–High Equity
Kazakhstan
United StatesTAS
NT
Slovak Republic
New Zealand
Chinese Taipei
Singapore
Hong Kong–China
Estonia
VIC
SAUnited Kingdom
Australia
ACT
NSWWA
Macao–China
Canada
Finland
Shangai–China
QLD
Note: Shaded diamonds represent countries in which the strength of the relationship is significantly different to the OECD average.

www.oecd.orgwww.ozpisa.acer.edu.au
Australian Council for Educational Research
ISBN 978-1-74286-238-5
9 781742 862385
Related Documents