MARINE ECOLOGY PROGRESS SERIES Mar Ecol Prog Ser Vol. 261: 21–39, 2003 Published October 17 INTRODUCTION Early studies in the Southern Ocean suggested that the marine ecosystem has a high autotrophic biomass and primary productivity, and is characterized by a short food chain composed of diatoms → krill → higher consumers (Smith & Sakshaug 1990, Marchant & Mur- phy 1994). Now it is known that these characteristics are found primarily in inshore, ice-edge and frontal regions (Smith & Nelson 1985, Tréguer & Jacques 1992, Bidigare et al. 1996, Bathmann et al. 1997). Throughout most of the Southern Ocean, the auto- © Inter-Research 2003 · www.int-res.com *Email: [email protected] Phytoplankton spatial distribution patterns along the western Antarctic Peninsula (Southern Ocean) Irene A. Garibotti 1, *, María Vernet 2 , Martha E. Ferrario 3 , Raymond C. Smith 4 , Robin M. Ross 5 , Langdon B. Quetin 5 1 Instituto Argentino de Nivología, Glaciología y Ciencias Ambientales, CRICyT, CONICET, CC 330, 5500 Mendoza, Argentina 2 Scripps Institute of Oceanography, University of California, San Diego, La Jolla, California 92093-0218, USA 3 Facultad de Ciencias Naturales y Museo, Universidad Nacional de La Plata, 1900 La Plata, Argentina 4 Institute for Computational Earth System Science and 5 Marine Science Institute, University of California, Santa Barbara, California 93106, USA ABSTRACT: This paper describes spatial distribution patterns of the phytoplankton community (com- position, cell abundance and biomass concentration) in relation to local environmental conditions in the Southern Ocean. Sampling was performed during summer 1997 off the coast of the western Antarctic Peninsula between Anvers Island and Marguerite Bay. Phytoplankton was characterized by relatively low biomass throughout most of the study area and was dominated by nanoalgae (< 20 μm). Phyto- plankton varied along an on–offshore gradient, with decreasing total cell abundance, chlorophyll a (chl a) concentration and carbon biomass toward the open ocean. Chl a concentration showed surface or subsurface maxima in coastal and middle-shelf waters, and deep maxima between ~40 and 100 m in oceanic waters. Across-shelf variability in phytoplankton correlated with vertical stability in the water column, which appears to be the major parameter affecting phytoplankton community structure in the area. We hypothesize that the deep chl a maximum offshore may be associated with iron limitation in near-surface waters and higher iron concentration in ‘winter waters’ (subsurface remnant of Antarctic Surface Waters). On a smaller spatial scale, a cluster analysis showed great regional variability in phyto- plankton assemblages. The area was divided into 4 main regions based on differences in the phyto- plankton composition and concentration. Three peaks in phytoplankton abundance were found on a north-to-south gradient in near-shore waters: a Cryptomonas spp. bloom near Anvers Island, a small unidentified phytoflagellate bloom in Grandidier Channel, and a diatom bloom in Marguerite Bay. These assemblages resemble different stages of the phytoplankton seasonal succession, and may be related to the progressive sea-ice retreat, which might have regulated the timing of the onset of the phytoplank- ton seasonal succession in a north–south gradient. Biological environmental factors, such as seeding of the water column by epontic algae and selective zooplankton herbivory, are hypothesized to affect com- munity composition in coastal regions. We conclude that large-scale variability in phytoplankton com- munity structure is related to water column physical conditions and possibly iron availability, while mesoscale variability, as seen in coastal waters, is more likely due to seasonal succession of different algae groups. KEY WORDS: Western Antarctic Peninsula · Phytoplankton spatial variability · Seasonal progression · Environmental gradients · Palmer LTER Resale or republication not permitted without written consent of the publisher

Welcome message from author
This document is posted to help you gain knowledge. Please leave a comment to let me know what you think about it! Share it to your friends and learn new things together.
Transcript
MARINE ECOLOGY PROGRESS SERIESMar Ecol Prog Ser
Vol. 261: 21–39, 2003 Published October 17
INTRODUCTION
Early studies in the Southern Ocean suggested thatthe marine ecosystem has a high autotrophic biomassand primary productivity, and is characterized by ashort food chain composed of diatoms → krill → higher
consumers (Smith & Sakshaug 1990, Marchant & Mur-phy 1994). Now it is known that these characteristicsare found primarily in inshore, ice-edge and frontalregions (Smith & Nelson 1985, Tréguer & Jacques1992, Bidigare et al. 1996, Bathmann et al. 1997).Throughout most of the Southern Ocean, the auto-
© Inter-Research 2003 · www.int-res.com*Email: [email protected]
Phytoplankton spatial distribution patterns alongthe western Antarctic Peninsula (Southern Ocean)
Irene A. Garibotti1,*, María Vernet2, Martha E. Ferrario3, Raymond C. Smith4, Robin M. Ross5, Langdon B. Quetin5
1Instituto Argentino de Nivología, Glaciología y Ciencias Ambientales, CRICyT, CONICET, CC 330, 5500 Mendoza, Argentina2Scripps Institute of Oceanography, University of California, San Diego, La Jolla, California 92093-0218, USA
3Facultad de Ciencias Naturales y Museo, Universidad Nacional de La Plata, 1900 La Plata, Argentina4Institute for Computational Earth System Science and 5Marine Science Institute, University of California, Santa Barbara,
California 93106, USA
ABSTRACT: This paper describes spatial distribution patterns of the phytoplankton community (com-position, cell abundance and biomass concentration) in relation to local environmental conditions in theSouthern Ocean. Sampling was performed during summer 1997 off the coast of the western AntarcticPeninsula between Anvers Island and Marguerite Bay. Phytoplankton was characterized by relativelylow biomass throughout most of the study area and was dominated by nanoalgae (<20 µm). Phyto-plankton varied along an on–offshore gradient, with decreasing total cell abundance, chlorophyll a(chl a) concentration and carbon biomass toward the open ocean. Chl a concentration showed surfaceor subsurface maxima in coastal and middle-shelf waters, and deep maxima between ~40 and 100 m inoceanic waters. Across-shelf variability in phytoplankton correlated with vertical stability in the watercolumn, which appears to be the major parameter affecting phytoplankton community structure in thearea. We hypothesize that the deep chl a maximum offshore may be associated with iron limitation innear-surface waters and higher iron concentration in ‘winter waters’ (subsurface remnant of AntarcticSurface Waters). On a smaller spatial scale, a cluster analysis showed great regional variability in phyto-plankton assemblages. The area was divided into 4 main regions based on differences in the phyto-plankton composition and concentration. Three peaks in phytoplankton abundance were found on anorth-to-south gradient in near-shore waters: a Cryptomonas spp. bloom near Anvers Island, a smallunidentified phytoflagellate bloom in Grandidier Channel, and a diatom bloom in Marguerite Bay. Theseassemblages resemble different stages of the phytoplankton seasonal succession, and may be related tothe progressive sea-ice retreat, which might have regulated the timing of the onset of the phytoplank-ton seasonal succession in a north–south gradient. Biological environmental factors, such as seeding ofthe water column by epontic algae and selective zooplankton herbivory, are hypothesized to affect com-munity composition in coastal regions. We conclude that large-scale variability in phytoplankton com-munity structure is related to water column physical conditions and possibly iron availability, whilemesoscale variability, as seen in coastal waters, is more likely due to seasonal succession of differentalgae groups.
KEY WORDS: Western Antarctic Peninsula · Phytoplankton spatial variability · Seasonal progression ·Environmental gradients · Palmer LTER
Resale or republication not permitted without written consent of the publisher
Mar Ecol Prog Ser 261: 21–39, 2003
trophic biomass is low and the base of the food chain isa ‘microbial network’ of bacteria, phytoplankton andzooplankton (von Bröckel 1981, Marchant & Murphy1994). This variability in the structure of the phyto-plankton community has important implications for theentire ecosystem, since phytoplankton, as the auto-trophic component of the marine ecosystem, affects thestructure and efficiency of the food web. Furthermore,the flow of autotrophic carbon through grazing ormicrobial food webs determines a high or low carbonexport to deep waters, and has major relevance in thepossible role of the ocean in regulating the global bio-geochemical carbon cycle and the atmospheric carbondioxide drawdown (Priddle et al. 1992, Smetacek 1996,Walsh et al. 2001).
The phytoplanktonic community west of the Antarc-tic Peninsula (WAP) has been studied extensively.Most studies have concentrated on the BransfieldStrait (Brandini & Kutner 1986, Holm-Hansen et al.1994, Priddle et al. 1994, Helbling et al. 1995, Kang &Lee 1995, Bidigare et al. 1996, Lorenzo et al. 2002),which has complex hydrographic characteristics due tothe mixing of water masses of the Drake Passage,Weddell Sea and Bellinghausen Sea (Niiler et al. 1991,Hofmann & Klinck 1998). South of Bransfield Strait,research was sporadic before the establishment of the‘Palmer Long-Term Ecological Research (LTER) Pro-gram’ (Smith et al. 1995, Baker et al. 1996), which hasbeen conducting an integrated study of the marinepelagic ecosystem in an area between Anvers Islandand Marguerite Bay since 1990 (Fig. 1). This area isdistinct from Bransfield Strait because it is entirelyoccupied by the waters of the Bellingshausen Sea(Hofmann et al. 1996, Hofmann & Klinck 1998). There-fore, we expected the characteristics of the phyto-plankton communities and ecosystem dynamics ofBransfield Strait and southern areas of the Belling-shausen Sea to differ due to their different hydro-graphic regimes.
Previous results indicated major spatial and tempo-ral variations in the phytoplankton biomass from thearea west of the Antarctic Peninsula between AnversIsland and Marguerite Bay. Phytoplankton biomassbegins to accumulate in the marginal ice zone duringearly spring (Holm-Hansen et al. 1989, Bidigare et al.1996, Moline & Prézelin 1996, Moline et al. 1997). Thishigh biomass zone moves from the northwest towardthe southeast as the sea-ice cover retreats during thespring and summer (Smith et al. 1996, 2001). The sum-mer phytoplankton distribution pattern, as character-ized by the chlorophyll a (chl a) concentration, shows2 major concentration gradients, one across-shelf andanother along shore, with the coastal and southernzones enriched. Surface chl a data from satellites and amultiyear study done from ships have documented this
same pattern for multiple years (Smith et al. 1996,1998, 2001). These studies concluded that coastalblooms dominated the annual autotrophic productionof the area, and that the annual advance and retreat ofthe pack ice is a major determinant of summer phyto-plankton distribution. However, in a recent analysis ofthis same area during the 1993 summer, Prézelin et al.(2000) stated that phytoplankton dynamics in this areawere dominated by episodic diatom blooms in openwaters of the continental shelf that were probablyrelated to the intrusion onto the continental shelf andupwelling of the Upper Circumpolar Deep Water(UCDW). These authors concluded that phytoplanktondynamics are non-predictable in the area, and sug-gested that the zooplankton community and the entireecosystem dynamics are highly influenced by theseupwelling processes. Thus, we lack consensus on thedistribution patterns and dynamics of the summerphytoplankton in the area of the western AntarcticPeninsula studied by the Palmer LTER project.
In the present study, we analyzed the compositionand biomass of the phytoplankton community duringthe summer of 1997 in the same mesoscale region asthe above studies (Palmer LTER project) (see Fig. 1).The aim of this study was to contribute to the under-standing of the structure and dynamics of the Antarcticphytoplanktonic community. Our main question was towhat extent do stable patterns or episodic events dom-inate the dynamics of the phytoplankton in this area.To answer this question, the spatial variability of thecommunity was analyzed in relation to local physical,chemical and biological environmental parameters,and compared to previous studies. Microscopic analy-ses provided valuable information on phytoplanktontaxonomic composition, size-fractions, cell abundanceand biomass.
MATERIALS AND METHODS
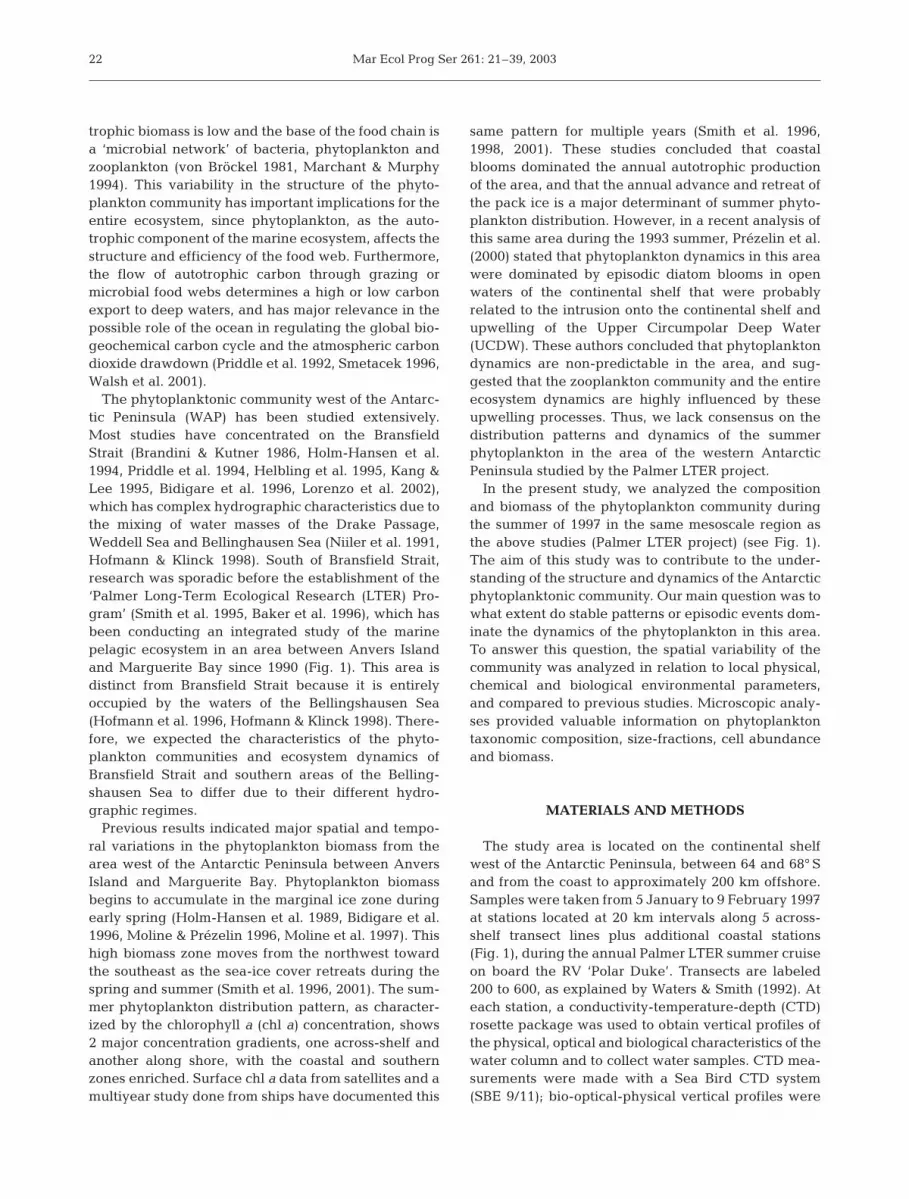
The study area is located on the continental shelfwest of the Antarctic Peninsula, between 64 and 68° Sand from the coast to approximately 200 km offshore.Samples were taken from 5 January to 9 February 1997at stations located at 20 km intervals along 5 across-shelf transect lines plus additional coastal stations(Fig. 1), during the annual Palmer LTER summer cruiseon board the RV ‘Polar Duke’. Transects are labeled200 to 600, as explained by Waters & Smith (1992). Ateach station, a conductivity-temperature-depth (CTD)rosette package was used to obtain vertical profiles ofthe physical, optical and biological characteristics of thewater column and to collect water samples. CTD mea-surements were made with a Sea Bird CTD system(SBE 9/11); bio-optical-physical vertical profiles were
22
Garibotti et al.: Phytoplankton distribution in Antarctic
made with a Biospherical Instruments MER 2040 sys-tem, and in situ fluorescence profiles were recordedwith a SeaTech profiling fluorometer. Discrete watersamples were collected with 10 l go-flow bottles at-tached to a General Oceanics rosette. The depths ofsampling were set at light levels established by mea-suring photosynthetically active radiation (PAR) using aQSI 240 quantum sensor (Biospherical Instruments).For nutrient and pigment concentration analyses, wateraliquots were taken from 6 depths within the euphoticlayer (100, 50, 30, 13, 4 and 0.5% PAR). For microscopicanalyses, they were taken from the 50% PAR depth.
Water aliquots for measurements of nutrient concen-trations were analyzed within 12 h of sampling. Silicicacid (Si(OH)2), nitrate plus nitrite (NO3
– + NO2–), and
ammonium (NH4+) concentrations were measured
according to the methods described in Johnson et al.(1985), with a Perstorp/Alpken segmented-flow nutri-ent-analysis system and Labtronics data-collection soft-ware. Chl a concentrations were estimated fluorometri-cally. Water aliquots were filtered through MilliporeHA filters (0.45 µm pore size), the filters were extractedin 90% acetone and stored frozen for 24 h (Smith et al.1981). Concentrations of pigments in theacetone were measured with a digitalTurner Designs fluoromeer. The fluorome-ter was calibrated with pure chl a dissolvedin 90% acetone (Sigma).
The water aliquots for microscopicanalyses were preserved with 2% acid Lu-gol’s iodine solution. Microscopic analyseswere done as described in Garibotti et al.(2003). Phytoplankton cells were identifiedand counted with an inverted microscope(Iroscope IS-PH) in settling chambers(Utermöhl 1958). Staining the cells with Lu-gol’s solution allows the recognition of cellcontents (e.g. presence of chloroplasts andpyrenoids), and clearer a delineation of thecell outline, favoring the recognition of itsshape and size under the microscope(Throndsen 1978). Differentiation be-tween autotrophic and heterotrophic dino-flagellates was done either on the basis ofthe genus of a known trophic mode or bythe clear presence/absence of chloroplasts.Cell biovolumes were measured using thegeometric shapes proposed by Hillebrandet al. (1999), and corrected to account forcell shrinkage due to sample fixation (Mon-tagnes et al. 1994). Cell carbon content wascalculated with 2 carbon-to-volume ratios, 1for diatoms (Montagnes & Franklin 2001)and 1 for all the other algae groups (Mon-tagnes et al. 1994).
Macrozooplankton samples were collected with netstows at all stations as described by Ross et al. (1998).Trawl contents were analyzed on board for numbers,total wet volumes and size distributions of the 2 macro-zooplanktonic grazers that typically dominate in thisarea, Antarctic krill Euphausia superba and the salpSalpa thompsoni (Quetin et al. 1996). The impacts ofgrazing by Antarctic krill and salps were calculated withgrazing models that allowed us to incorporate the func-tional response of both grazers to phytoplankton con-centrations, and the effect of size on ingestion rates forsalps, thus giving a better approximation of zooplanktonimpact on phytoplankton community than zooplanktonabundance alone. To apply the grazing models, the mea-sured wet volume of both krill and salps were convertedto wet mass assuming a density of 1 g cm–3, and chl aconcentrations were averaged over the upper 50 m, asmost krill and salp biomass appeared to be in this upperportion of the water column (R. M. Ross & L. B. Quetinunpubl. data). For Antarctic krill we used a linear func-tional response model of krill ingestion, as described inRoss et al. (1998), and grazing impact was calculated bythe product of total krill wet weight, ingestion rate and
23
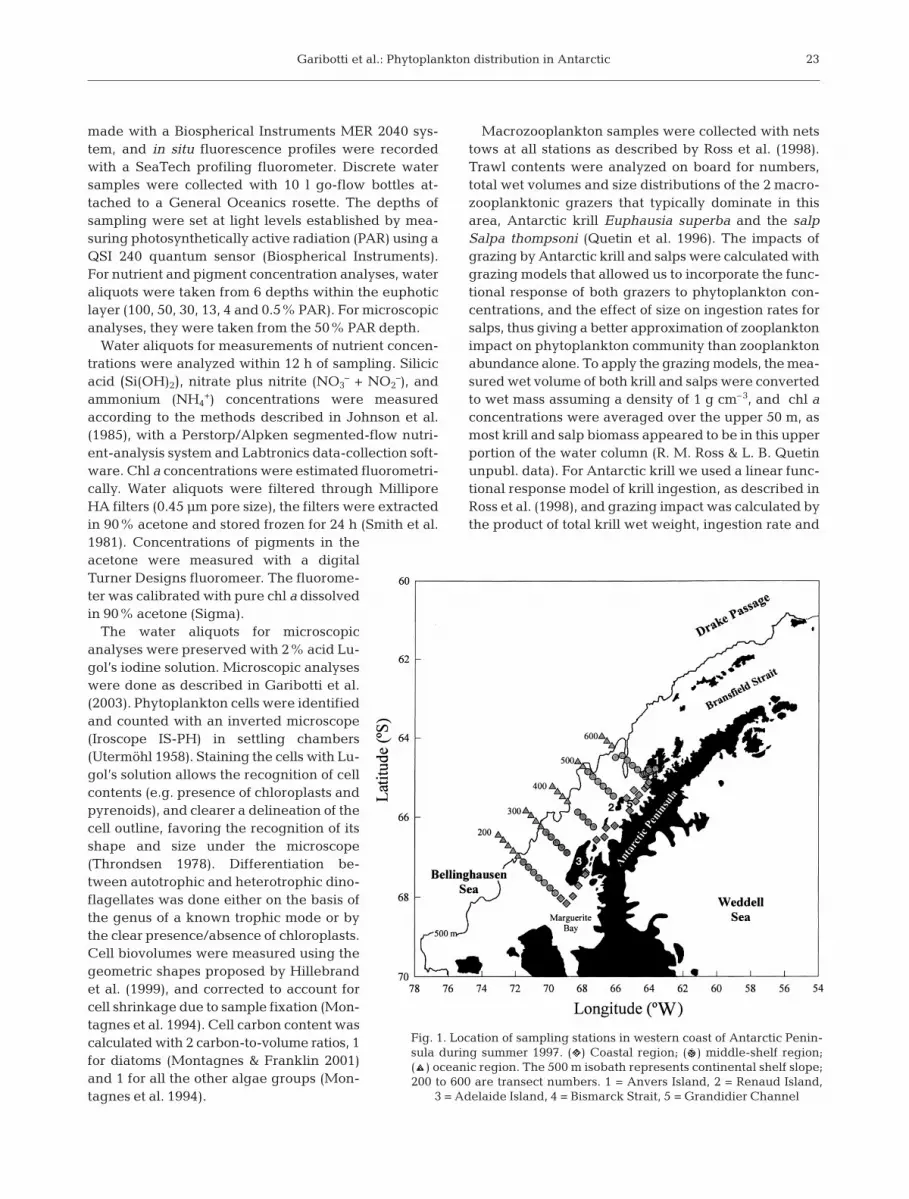
Fig. 1. Location of sampling stations in western coast of Antarctic Penin-sula during summer 1997. ( ) Coastal region; ( ) middle-shelf region; ( ) oceanic region. The 500 m isobath represents continental shelf slope;200 to 600 are transect numbers. 1 = Anvers Island, 2 = Renaud Island,
3 = Adelaide Island, 4 = Bismarck Strait, 5 = Grandidier Channel
Mar Ecol Prog Ser 261: 21–39, 2003
the average chl a concentration in the top 50 m. For salpgrazing estimates, the proportion of zooids within 6 de-fined size categories was estimated from the length-frequency distribution of a subsample of zooids.Eleoblasts were not included in the counts of salps, asthey are primarily dependent for nutrition on stored re-serves. The average filtration rate for each size categorywas calculated as described in Pakhomov et al. (2002),and the grazing impact due to salps for each station wascalculated by multiplying the filtration rate for each sizecategory by the proportion of that size category and thetotal number of zooids per m2 in the catch, and by the av-erage chl a concentration in the upper 50 m (Ross et al.1998). These estimations are first-order approximationsof grazing impact, since there are limitations to thesegrazing models. The krill model does not explicitly in-clude the effect of size on krill ingestion rate, and doesnot incorporate the known selectivity of Antarctic krill fordiatoms (Haberman et al. 2003). The lack of selectivity inthe current grazing models is not as much a concern forsalps, as they are not believed to be selective feeders(Pakhomov et al. 2002).
Data analysis. Water density was estimated assigma-t (σt). The depth of the upper mixed layer (UML)was determined as the depth where a change of σt
>0.05 occurred over a 5 m depth interval. Verticalwater column stability (E) was calculated according toMengesha et al. (1998): E = dσt /dz × 1/σt(avg) wheredσt/dz is the density vertical gradient, dz is 50 m depth,and σt(avg) is the average density.
Spatial distribution patterns of the phytoplankton andenvironmental variables were described from analysisof contour plots generated using the inverse distance-weighting algorithm to interpolate the grid (Jongman etal. 1995). Phytoplanktonic cell abundance and carbonbiomass data were from samples at the 50% PARdepth, presumed to be representative of the UML. Thisassumption is based on previous studies performed inthe area that revealed a uniform vertical distribution ofcarotenoid pigments (diagnostic of different algaegroups), suggesting no major phytoplankton composi-tion variations with depth (Ross et al. 2000, Garibotti etal. 2003). The 50% PAR depth (5 to 30 m) was alwayswithin the UML. For other variables, an average valuefor each station was calculated according to the follow-ing criteria. Chl a concentration and nutrient concen-trations were averaged over the UML determined foreach station. Physicochemical properties of the waters(temperature and salinity) were averaged over the up-per 50 m of the water column, which corresponds to thedepth-separating ‘winter waters’ from the upper watercolumn (Hofmann et al. 1996). It is in this upper portionof the water column that spatial variability in water pro-prieties can be expected due to the impact of local envi-ronmental processes (Hofmann & Klinck 1998).
Statistical analysis. A cluster analysis was performedon the algae abundances of the different phytoplank-ton classes to identify groups of stations with similarphytoplankton assemblages. The Bray-Curtis similar-ity coefficient was used to construct a sample similaritymatrix for input to cluster analysis. This coefficientmeasures the resemblance among phytoplanktonassemblages of 2 sites as the sum of the differences ofthe abundance of each phytoplankton group at eachsite (Jongman et al. 1995). Abundances were log-transformed so that large counts did not totally domi-nate the Bray-Curtis similarity coefficient. A complete-linkage hierarchical agglomerative clustering proce-dure was used to group similar samples (Pielou 1984,Jongman et al. 1995).
A canonical correlation analysis was performed tocorrelate variation in phytoplankton community withthe environmental variables. Community variablesincluded algae abundances at the class level (log-transformed) and total chl a concentration. The en-vironmental variables included water column tempera-ture, vertical stability, Si(OH)2, [NO3
– + NO2–] and NH4
+
concentrations, and krill and salp grazing impact. watercolumn salinity and density were not included becausethey were highly correlated with the water column sta-bility, which was calculated from vertical densitychanges (see above). The canonical correlation mea-sures the strength of the relationship between 2 sets ofvariables (ter Braak 1994, Jongman et al. 1995), in thiscase the phytoplankton and environmental variables.The 2 first significant canonical roots are used to con-struct the canonical diagram. The canonical roots arethe weighted sums of the phytoplankton variables,which are used to calculate the position of the stationsin the diagram according to their algae composition,abundance and total biomass. Thus, the distances be-tween stations in the ordination diagram reflect thesimilarity of their phytoplankton assemblages. Canoni-cal factor loadings are the simple correlations betweenthe environmental variables and the canonical roots,and are considered as a measure of the importance ofthe different environmental variables determiningphytoplankton variability within the area.
RESULTS
Hydrographic and physicochemical properties
The main hydrographic feature detected throughoutmost of the area was the ‘winter water’ mass, between50 and 150 m deep, which disappears only at someshoreward stations located near Anvers Island (in thenortheast section of the study area). This water mass,characterized by temperatures below –1.0°C and salin-
24
Garibotti et al.: Phytoplankton distribution in Antarctic
ity values of approximately 34 psu, corresponds to theAntarctic Surface Water mass, which is restricted dur-ing summer to a deep layer (Hofmann et al. 1996, Hof-mann & Klinck 1998).
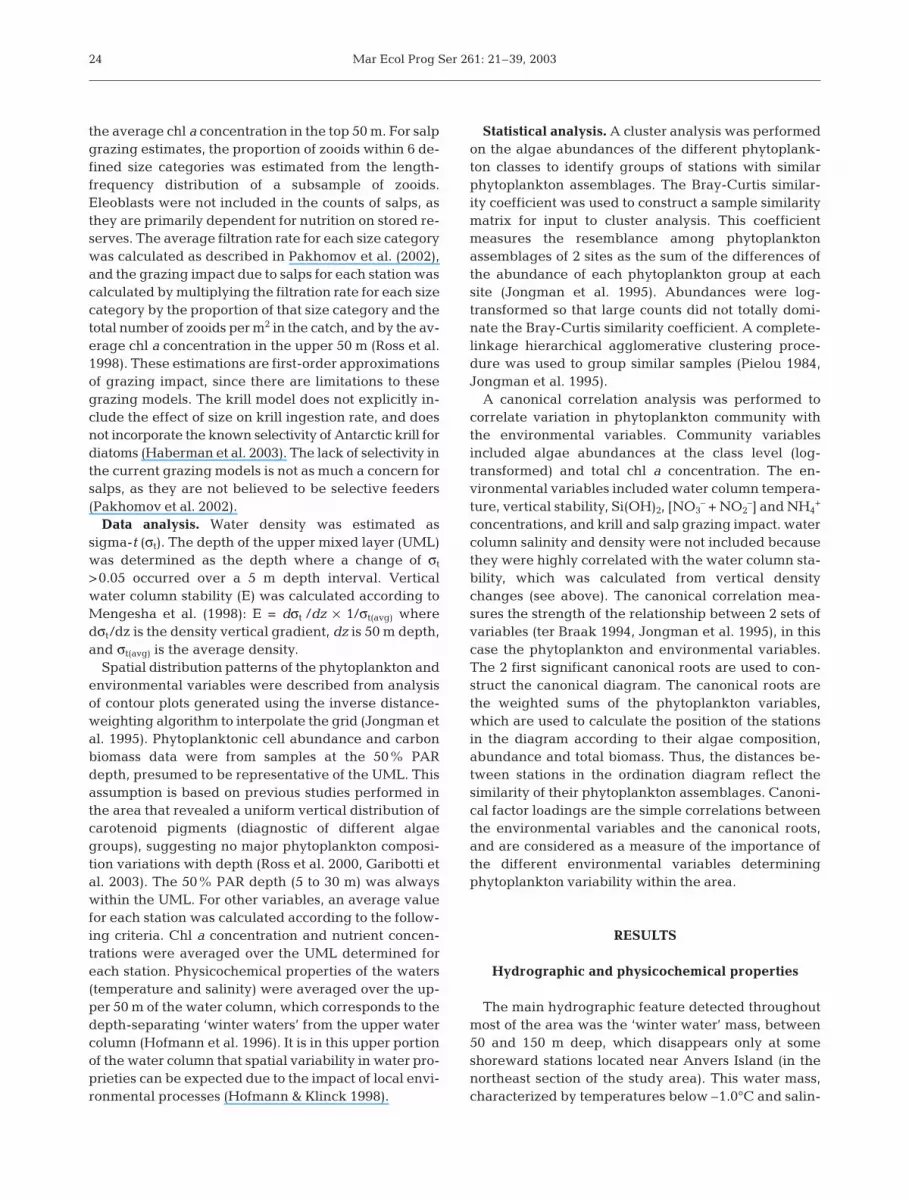
The physicochemical properties showed great spa-tial variability throughout the area. Water tempera-ture and salinity increased gradually from the coastto open ocean, with a maximum degree of change inthe zone outlined by the Anvers, Renaud and Ade-laide Islands, evidencing the presence of major dif-ferences between coastal and openwaters (Fig. 2a,b). water column stabil-ity also showed a conspicuous gradi-ent, decreasing from the coast towardopen waters (Fig. 2c), and the uppermixed layer (UML) depth increasedfrom the coast to open waters (Fig. 2d).Coastal waters had a vertical profilecharacterized by a steep density gradi-ent with depth and a very shallowmixed layer (UML depth < 15 m) (Figs.2d & 3a). These characteristics, andthe relatively low temperature andsalinity of the waters near the coast,indicate freshwater input from sea-iceor glacier melting. In fact, during thesampling period, sea-ice remnantswere found in certain stations in theGrandidier Channel, and the sea-iceedge was found in the southern part ofMarguerite Bay (Ross & Baker 1997).Moving progressively away from thecoast, the density gradient with depthwas less marked, and the upper mixedlayer was deeper or not obvious (UMLdepth > 35 m) (Figs. 2d & 3b,c).
The concentrations measured for allnutrients were relatively high through-out the study area and in the entirewater column. However, there wasconsiderable variability within the area(Fig. 4). The Si(OH)2 distribution pat-tern had a marked onshore–offshoregradient, with higher concentrationsnear the coast (Fig. 4a). NO3
– + NO2–
showed the opposite pattern, increas-ing seaward (Fig. 4b). NH4
+ had apatchy distribution pattern (Fig. 4c).Furthermore, major localized macro-nutrient depletions were found in cer-tain restricted regions. Specifically,lower NO3
– + NO2– and Si(OH)2 con-
centrations were found in MargueriteBay and in the middle of the 500 tran-sect line near Renaud Island and
higher NH4+ concentrations were found along the
500 transect line and in the Grandidier Channel andCrystal Sound.
Phytoplanktonic community
Chl a distribution
Distribution of the chl a concentration showed astrong onshore–offshore gradient, decreasing seaward
25
Fig. 2. Physicochemical properties averaged over upper water column (50 m).(a) Temperature (°C); (b) salinity (psu); (c) vertical stability (10–3 m–1); (d) uppermixed layer depth (m–1). Alongshore distance corresponds to transect numbersin Fig. 1, across-shelf distance corresponds to location of stations. Crosses (+)
in (a) correspond to sampling stations

Mar Ecol Prog Ser 261: 21–39, 2003
(Fig. 5a). The highest concentrations were recorded inMarguerite Bay, with values up to 17.86 µg chl a l–1,and the lowest in outer shelf waters, reaching a mini-mum of 0.07 µg chl a l–1.
Different patterns of chl a distribution with depthwere found within the area, and a priori 3 regions weredelineated based on their chl a profile with depth:coastal, middle-shelf and oceanic regions (Fig. 1). Thecoastal region had surface or near-surface chl a peaks
(depth ~10 m) and very low concentrations in deeperwaters (Fig. 3a). The middle-shelf region had near-surface chl a maxima and a gradual decrease of con-centration with depth (Fig. 3b). The oceanic region hadlow chl a near the surface and higher concentrationsbetween 40 and 100 m depth (Fig. 3c). These resultsshow that the biomass depth-distribution was deepermoving across the continental shelf toward the slope.Furthermore, chl a vertical profiles closely corre-
26
Fig. 4. Distribution of macronutrient concentrations (µM) averaged over upper mixed layer. (a) Si(OH)2; (b) NO3– + NO2
–; (c) NH4+.
Alongshore distance corresponds to transect numbers in Fig. 1; across-shelf distance corresponds to location of stations
Fig. 3. Vertical profiles of water column temperature, density and chlorophyll a concentration of representative stations of (a) coastal region, (b) middle-shelf region, (c) oceanic region. Regions shown in Fig. 1

Garibotti et al.: Phytoplankton distribution in Antarctic
sponded to water column physical characteristics(Fig. 3). Average chl a concentrations and physico-chemical properties in the upper water column in theseregions are shown in Table 1.
Phytoplankton spatial distribution and algae assemblages
Microscopic analysis showed that the phytoplank-tonic community was composed of small unidentifiedphytoflagellates, cryptophytes, diatoms, prasino-phytes, prymnesiophytes and dinoflagellates (Fig. 6).The unidentified phytoflagellate group might includechrysophytes and prymnesiophytes, and a small pro-portion of chlorophytes and cryptophytes (Garibotti etal. 2003), but here they were pooled together, consider-ing that they have similar ecological importance in thetrophic chain. Nanoplanktonic cells (<20 µm) domi-nated throughout most of the area, accounting for 98%of cell abundance and 41% of carbon concentration. Allphytoplankton groups had nanoplanktonic representa-tives, while the microphytoplankton (>20 µm) wasmostly represented by diatoms and dinoflagellates.
The spatial distribution of total phytoplankton cellabundance and carbon biomass (at 50% PAR depth)showed a remarkable onshore–offshore gradient(Fig. 5b,c), resembling the chl a distribution (Fig. 5a).
Variability in phytoplankton standing stock was high,ranging from 62 to 1150 × 104 cells l–1 and 10 to 967 µg C l–1. The most outstanding characteristic in thearea was the presence of 3 localized peaks in phyto-plankton cell abundance in nearshore waters of Mar-guerite Bay, Grandidier Channel, and the inside of the600 transect line near Anvers Island (Fig. 5b). In Mar-guerite Bay, the phytoplankton standing stock reached938 × 104 cells l–1 (Fig. 5b: Arrow 1) and 967 µg C l–1
(Fig. 5c). In Grandidier Channel, phytoplankton abun-dance reached 1147 × 104 cells l–1 (Fig. 5b: Arrow 2),although biomass remained relatively low (maximum
27
Parameter Coastal Middle-shelf Oceanic region region region
Chl a (µg l–1) 4.38 ± 5.33 0.92 ± 0.45 0.22 ± 0.13Temperature (°C) 0.21 ± 0.48 0.94 ± 0.23 1.25 ± 0.27Salinity (psu) 33.14 ± 0.17 33.64 ± 0.10 33.79 ± 0.05Density (kg m–3) 26.59 ± 0.13 26.95 ± 0.08 27.05 ± 0.04Vertical stability 0.90 ± 0.41 0.18 ± 0.12 0.12 ± 0.07
(10–3 m–1)
Table 1. Chlorophyll a (chl a) concentration and physicochem-ical properties: temperature, salinity, density and vertical sta-bility. Average (± SD) values for regions differentiated by theirphytoplankton vertical distribution (Fig. 1). Values of chl aaveraged over upper mixed layer and those of physico-chemical properties over upper 50 m of the water column
Fig. 5. Phytoplankton standing-stock distribution in upper mixed layer: (a) chlorophyll a concentration (µg l–1); (b) cell abundance(104 cells l–1); (c) autotrophic carbon concentration (µg l–1). Arrows in (b) point to sites with a peak in phytoplankton cell abun-dance (1: Marguerite Bay; 2: Grandidier Channel; 3: near Anvers Island). Alongshore distance corresponds to transect numbers
in Fig. 1, across-shelf distance corresponds to location of stations
Mar Ecol Prog Ser 261: 21–39, 2003
79 µg C l–1, Fig. 5c). Near Anvers Island, the peak incell abundance attained 823 × 104 cells l–1 (Fig. 5b:Arrow 3), and had relatively low carbon biomass (max-imum 83 µg C l–1, Fig. 5c). The number of cells per µg Cwas 1 order of magnitude less in Marguerite Bay thanelsewhere.
A dendrogram based on the Bray–Curtis coefficientof similarity classified the sampling stations into4 major groups with over 70% similarity in their phyto-plankton assemblages (algae composition and cellabundance) (Fig. 7a). The Marguerite Bay stations
were classified in a separated cluster (Cluster 1)(Fig. 7b), delimiting a region with a homogeneousphytoplankton assemblage (over 80% similarity). Thephytoplankton community of this region was very dif-ferent from the rest of the study area (separating at55% similarity level), and showed the presence of apeak in cell abundance and biomass, as previouslydescribed (Table 2, Fig. 5b,c). This was the only regionin the entire study area where the microphytoplanktonsize fraction had high biomass (88% C). Diatoms dom-inated, accounting for 21% of cell abundance and 86%
28
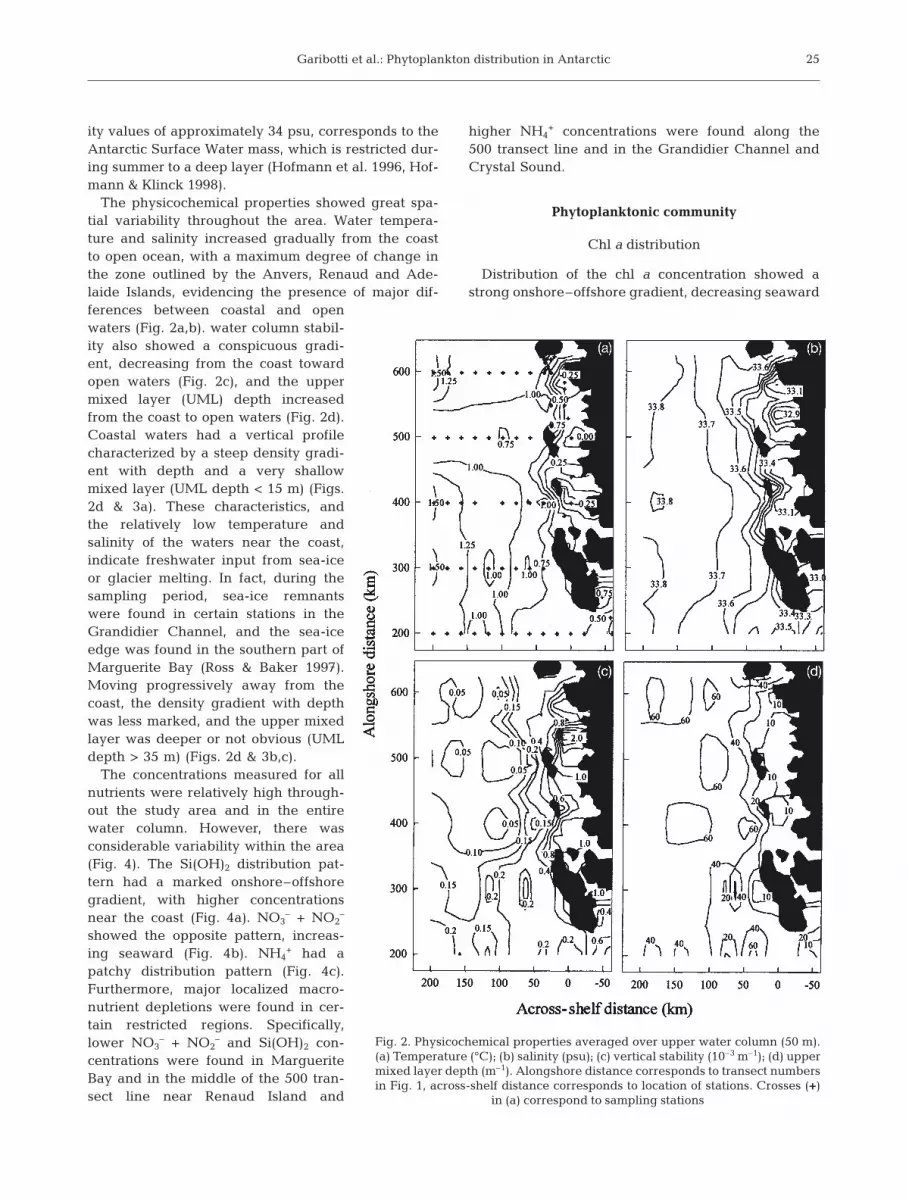
Fig. 6. Distribution of major phytoplankton groups in upper mixed layer (104 cells l–1). (a) Unidentified phytoflagellates;(b) Cryptomonas spp.; (c) Diatoms; (d) Pyramimonas spp.; (e) Phaeocystis spp.; (f) Dinoflagellates. Alongshore distance
corresponds to transect numbers in Fig. 1, across-shelf distance corresponds to location of stations

Garibotti et al.: Phytoplankton distribution in Antarctic
of C biomass (Fig. 6c). Single-cell Phaeocystis specieswere also abundant and represented 30% of cell abun-dance and 3% of phytoplankton C (Fig. 6e). Pyrami-monas spp. reached also their highest abundance inthis region (Fig. 6d). The dominant diatom specieswere Odontella weisflogii, Eucampia antarctica andThalassiosira spp. (Table 3). Chaetoceros socialis had alower carbon concentration, but reached 364 × 104 cellsl–1, contributing 58% of diatom cell abundance.
Cluster 2 (Fig. 7a) included the stations located onthe shelf slope and off the continental shelf (Fig. 7b),delimiting a region with a homogeneous phytoplank-ton assemblage (over 75% similarity), separating fromthe rest of the area at an approximately 60% similaritylevel. Stations in Cluster 2 corresponded to those in theoceanic region, as delimited previouslyby the chl a vertical distribution pattern(cf. Figs. 1 & 7b). Thus, the region delim-ited by Cluster 2 is also named oceanicregion. The phytoplankton assemblagewas dominated by unidentified phytofla-gellates, accounting for 85% cell abun-dance and 28% C biomass (Fig. 6a,Table 2). Although diatoms and dinofla-gellates had relatively low abundance (6and 2% respectively), they contributed27 and 21% of the total carbon biomassrespectively (Table 2). The most impor-tant diatom species were Corethroncriophyllum, small Fragilariopsis curta,F. cylindrus and F. pseudonana, Nitz-schia spp. and Thalassiosira spp.(Table 3). The 3 species of small Fragi-lariopsis together represented 88% ofdiatom cell abundance.
The stations located in the middlecontinental shelf and in the GrandidierChannel and Crystal Sound were amosaic of Clusters 3 and 4 (Fig. 7a). Thespatial distribution of the stations in-cluded in these clusters overlapped,making difficult the delimitation ofother regions with a homogeneousphytoplankton assemblage within thearea. Furthermore, the stations includedin the Cluster 4 were divided into3 smaller clusters with a very high simi-larity in their phytoplankton assem-blages (Fig. 7a).
Cluster 4b included stations with over85% of similarity in their phytoplanktonassemblages (Fig. 7a), which were lo-cated in 3 regions spatially distinct fromeach other (Fig. 7b). Based on their loca-tion, these 3 regions were named near
Adelaide Island (inside the Transect 200 and 300 lines),Grandidier Channel (inshore between the Transect 500and 600 lines) and near Anvers Island (inside the Tran-sect 600 line) (Fig. 7b). Of these, 2 regions (GrandidierChannel and near Anvers Island) had a peak in cellabundance (Fig. 5b). The characteristics of the phyto-plankton assemblages (Cluster 4b) were the dominanceof unidentified phytoflagellates (representing 82% cellabundance and 35% carbon biomass) and the very highabundance of cryptophytes (contributing 15% of cellabundance and 30% of the carbon biomass) (Table 2,Fig. 6a,b). Furthermore, these assemblages had a lowproportion of diatoms, which accounted for only 1% ofcell abundance and 13% of carbon biomass (Fig. 6c,Table 3). The dominant diatom species were Corethron
29
Fig. 7. Analysis of classifica-tion of sampling stations per-formed on algae class abun-dances using Bray–Curtis coefficient of similarity.(a) Dendrogram of clusteranalysis, (b) geographical lo-cations of phyto-plankton as-semblages identified by clas-sification analysis, whereregion numbers correspond tocluster numbers in (a), exceptstations in Clusters 3, 4a and4c, which were all included ina unique region; region encir-cled by dashed line along theTransect 500 line includesonly 5 of the stations groupedin Cluster 4a (criteria used forthis delimitation explained in‘Results’); crosses (+) are sam-pling stations; alongshore dis-tance corresponds to transectnumbers in Fig. 1, across-shelf distance corresponds to
location of stations
Mar Ecol Prog Ser 261: 21–39, 2003
criophyllum, Thalassiosira spp. and small Fragilariopsiscurta, F. cylindrus and F. pseudonana (Table 2). The 3small Fragilariopsis species accounted for 72% of thediatom cell abundance.
Cluster 4a (Fig. 7a) delimited a group of stations sea-ward of Renaud Island (along the central part of theTransect 500 line) (Fig. 7b), which displayed over 90% ofsimilarity in their phytoplankton assemblages. The out-standing characteristic of these stations was an incre-ment in the abundance of unidentified phytoflagellates,diatoms, dinoflagellates and prasinophytes (Fig. 6). The3 former phytoplankton groups contributed almost thesame proportion of biomass (27, 23 and 25% C respec-tively). Diatom species more common in this region weresmall Fragilariopsis curta, F. cylindrus and F. pseudo-nana, Corethron criophyllum and Nitzschia spp. Theother stations grouped in Cluster 4a corresponded to theBismarck Strait (nearshore on the Transect 600 line), in-dicating a close similarity between the phytoplanktonassemblage of the near Renaud Island region and that ofBismarck Strait. However, this latter location also in-cluded other stations classified as Cluster 3, indicating amore heterogeneous phytoplankton assemblage.
Therefore, since the stations in Clusters 3, 4a and 4cdid not group in a well-defined region, they were allcombined into a large central region (Fig. 7b). Thephytoplankton assemblage of this region was domi-
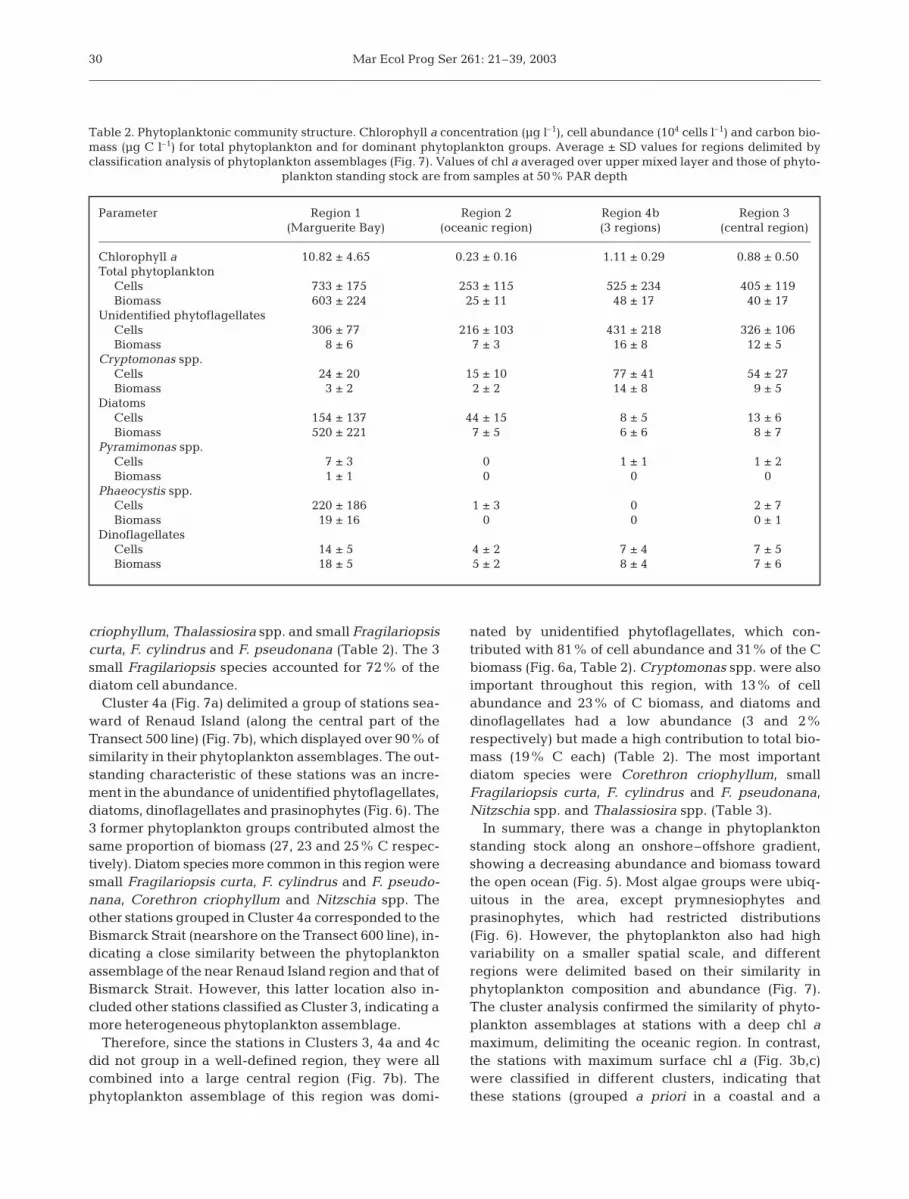
nated by unidentified phytoflagellates, which con-tributed with 81% of cell abundance and 31% of the Cbiomass (Fig. 6a, Table 2). Cryptomonas spp. were alsoimportant throughout this region, with 13% of cellabundance and 23% of C biomass, and diatoms anddinoflagellates had a low abundance (3 and 2%respectively) but made a high contribution to total bio-mass (19% C each) (Table 2). The most importantdiatom species were Corethron criophyllum, smallFragilariopsis curta, F. cylindrus and F. pseudonana,Nitzschia spp. and Thalassiosira spp. (Table 3).
In summary, there was a change in phytoplanktonstanding stock along an onshore–offshore gradient,showing a decreasing abundance and biomass towardthe open ocean (Fig. 5). Most algae groups were ubiq-uitous in the area, except prymnesiophytes andprasinophytes, which had restricted distributions(Fig. 6). However, the phytoplankton also had highvariability on a smaller spatial scale, and differentregions were delimited based on their similarity inphytoplankton composition and abundance (Fig. 7).The cluster analysis confirmed the similarity of phyto-plankton assemblages at stations with a deep chl amaximum, delimiting the oceanic region. In contrast,the stations with maximum surface chl a (Fig. 3b,c)were classified in different clusters, indicating thatthese stations (grouped a priori in a coastal and a
30
Parameter Region 1 Region 2 Region 4b Region 3(Marguerite Bay) (oceanic region) (3 regions) (central region)
Chlorophyll a 10.82 ± 4.65 0.23 ± 0.16 1.11 ± 0.29 0.88 ± 0.50Total phytoplankton
Cells 733 ± 175 253 ± 115 525 ± 234 405 ± 119Biomass 603 ± 224 25 ± 11 48 ± 17 40 ± 17
Unidentified phytoflagellates Cells 306 ± 77 216 ± 103 431 ± 218 326 ± 106Biomass 8 ± 6 7 ± 3 16 ± 8 12 ± 5
Cryptomonas spp.Cells 24 ± 20 15 ± 10 77 ± 41 54 ± 27Biomass 3 ± 2 2 ± 2 14 ± 8 9 ± 5
DiatomsCells 154 ± 137 44 ± 15 8 ± 5 13 ± 6Biomass 520 ± 221 7 ± 5 6 ± 6 8 ± 7
Pyramimonas spp.Cells 7 ± 3 0 1 ± 1 1 ± 2Biomass 1 ± 1 0 0 0
Phaeocystis spp.Cells 220 ± 186 1 ± 3 0 2 ± 7Biomass 19 ± 16 0 0 0 ± 1
DinoflagellatesCells 14 ± 5 4 ± 2 7 ± 4 7 ± 5Biomass 18 ± 5 5 ± 2 8 ± 4 7 ± 6
Table 2. Phytoplanktonic community structure. Chlorophyll a concentration (µg l–1), cell abundance (104 cells l–1) and carbon bio-mass (µg C l–1) for total phytoplankton and for dominant phytoplankton groups. Average ± SD values for regions delimited byclassification analysis of phytoplankton assemblages (Fig. 7). Values of chl a averaged over upper mixed layer and those of phyto-
plankton standing stock are from samples at 50% PAR depth

Garibotti et al.: Phytoplankton distribution in Antarctic
middle-shelf region) did not have an homogeneousphytoplankton composition. The physicochemicalproperties of the upper water column in the regionsdelimited by the cluster analysis are shown in Table 4.
Zooplanktonic community
Both Antarctic krill and salps were abundant in thenorthern half of the area in January 1997, with small iso-lated areas of elevated abundance in the southern half ofthe region surveyed (Table 4, Fig. 8a,b). However, the 2species showed less coherence on smaller spatial scales,as areas of highest abundance did not overlap, i.e. sea-ward of Renaud Island and in Crystal Sound for krill andmid-shelf on the Transect 600 line and inland Renaud Is-land for salps (Fig. 8). Krill abundance also showed anonshore–offshore gradient, with higher abundance inthe middle-shelf and coastal regions, and relatively lowabundance throughout the oceanic region (Fig. 8a). Thepattern of distribution of salps showed high concentra-tions in the northern region at the coastal stations, butthey were also consistently found in lower numbers atstations in the oceanic region (Fig. 8b).
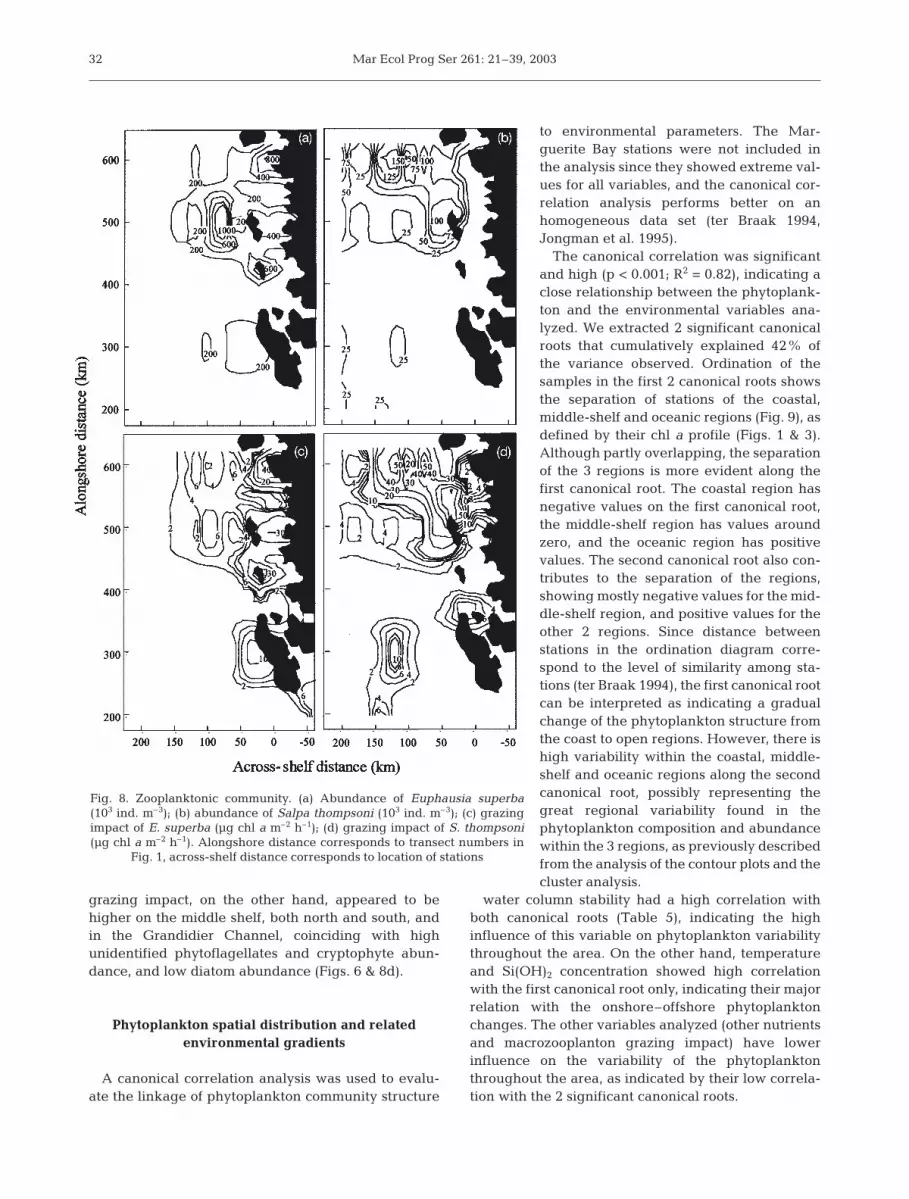
Although the grazing impact shared some of the dis-tribution patterns of abundance of the grazers alone,the differences illustrate the value of the grazing mod-els (Fig. 8c,d). Krill grazing impact was highest in thecoastal region, and null throughout the oceanic region,as phytoplankton biomass was lower than the thresh-old for krill ingestion (0.36 µg chl a l–1, Ross et al. 1998).The highest grazing impact was estimated for stationsin the Grandidier Channel, with grazing lower in the 2other regions with a similar phytoplankton assemblage(near Adelaide Island and near Anvers Island). Graz-ing impact was also lower at stations in Marguerite Bay(Cluster 1) and near Renaud Island (Cluster 4a). Salp
31
Parameter Region 1 (Marguerite Bay) Region 2 (oceanic region) Region 4b (3 regions) Region 3 (central region)
Temperature 0.37 ± 0.47 1.26 ± 0.26 0.57 ± 0.54 0.84 ± 0.42Salinity 33.13 ± 0.14 33.80 ± 0.03 33.38 ± 0.27 33.59 ± 0.20Density 26.58 ± 0.10 27.06 ± 0.03 26.77 ± 0.20 26.92 ± 0.15Vertical stability 0.79 ± 0.30 0.12 ± 0.07 0.53 ± 0.55 0.27 ± 0.27Si(OH)2 57.96 ± 3.38 47.48 ± 9.70 78.28 ± 6.09 70.18 ± 12.05NO3
– + NO2– 5.14 ± 5.00 25.01 ± 3.15 21.93 ± 2.64 22.22 ± 4.07
NH4+ 1.62 ± 0.89 1.98 ± 1.23 2.68 ± 1.13 2.80 ± 1.14
Krill abundance 9 ± 5 21 ± 33 196 ± 266 205 ± 378Krill grazing impact 5.16 ± 3.87 0 8.88 ± 14.69 3.54 ± 8.90Salp abundance 0 22 ± 33 37 ± 59 28 ± 39Salp grazing impact 0 1.95 ± 3.72 16.99 ± 25.63 7.99 ± 14.71
Table 4. Physical, chemical and biological environmental variables. Temperature (°C), salinity (psu), density (kg m–3), verticalstability (10–3 m–1), nutrients (µM), krill abundance (103 ind. m–3), krill grazing impact (µg chl a m–2 h–1), Salp abundance (103 ind.m–3), and salp grazing impact (µg chl a m–2 h–1). Average ± SD values for regions differentiated in Fig. 7. Values of physico-
chemical properties averaged over upper 50 m of water column, and nutrients averaged over upper mixed layer
Table 3. Diatom populations. Composition and biomass (µg Cl–1) of species that contributed >1% of total diatom carbonbiomass. Average ± SD values for regions delimited by classi-fication analysis of phytoplankton assemblages (Fig. 7). Cell
size given in parentheses
Region Biomass
Region 1 (Marguerite Bay)Odontella weisflogii 298.0 ± 160.0Eucampia antartica 96.0 ± 70.7Thalassiosira spp. (50 µm) 41.8 ± 46.7Chaetoceros socialis 19.5 ± 31.6Fragilariopsis curta (40 µm) 14.3 ± 11.8Nitzschia spp. (60 µm) 11.6 ± 14.0Chaetoceros dichaeta 5.8 ± 7.7
Region 2 (oceanic region)Corethron criophyllum 2.9 ± 5.0Small Fragilariopsis spp.a 1.4 ± 1.1Nitzschia spp. (60 µm) 0.8 ± 1.5Thalassiosira spp. (25 µm) 0.6 ± 2.7Fragilariopsis curta (40 µm) 0.3 ± 0.7Thalassiosira spp. (15 µm) 0.2 ± 0.7Fragilariopsis separanda 0.1 ± 0.3
Region 4b (3 regions)Corethron criophyllum 4.19 ± 4.7Thalassiosira spp. (25 µm) 0.7 ± 1.9Small Fragilariopsis spp.a 0.6 ± 0.5Chaetoceros spp. (15 µm) 0.4 ± 1.1Nitzschia spp. (60 µm) 0.2 ± 0.4Fragilariopsis separanda 0.2 ± 0.3Cylindrotheca closterium 0.1 ± 0.2
Region 3 (central region)Corethron criophyllum 3.0 ± 5.8Thalassiosira spp. (25 µm) 1.4 ± 2.7Nitzschia spp. (60 µm) 1.3 ± 1.6Small Fragilariopsis spp.a 1.2 ± 1.7Unidentified pennal (60 µm) 0.2 ± 1.0Chaetoceros spp. (15 µm) 0.2 ± 0.7Fragilariopsis curta (40 µm) 0.1 ± 0.5Nitzschia spp. (30 µm) 0.1 ± 0.1Thalassiosira spp. (15 µm) 0.1 ± 0.5
aComprised Fragilariopsis curta, F. cylindrus and F. pseudonana (10 µm)
Mar Ecol Prog Ser 261: 21–39, 2003
grazing impact, on the other hand, appeared to behigher on the middle shelf, both north and south, andin the Grandidier Channel, coinciding with highunidentified phytoflagellates and cryptophyte abun-dance, and low diatom abundance (Figs. 6 & 8d).
Phytoplankton spatial distribution and relatedenvironmental gradients
A canonical correlation analysis was used to evalu-ate the linkage of phytoplankton community structure
to environmental parameters. The Mar-guerite Bay stations were not included inthe analysis since they showed extreme val-ues for all variables, and the canonical cor-relation analysis performs better on anhomogeneous data set (ter Braak 1994,Jongman et al. 1995).
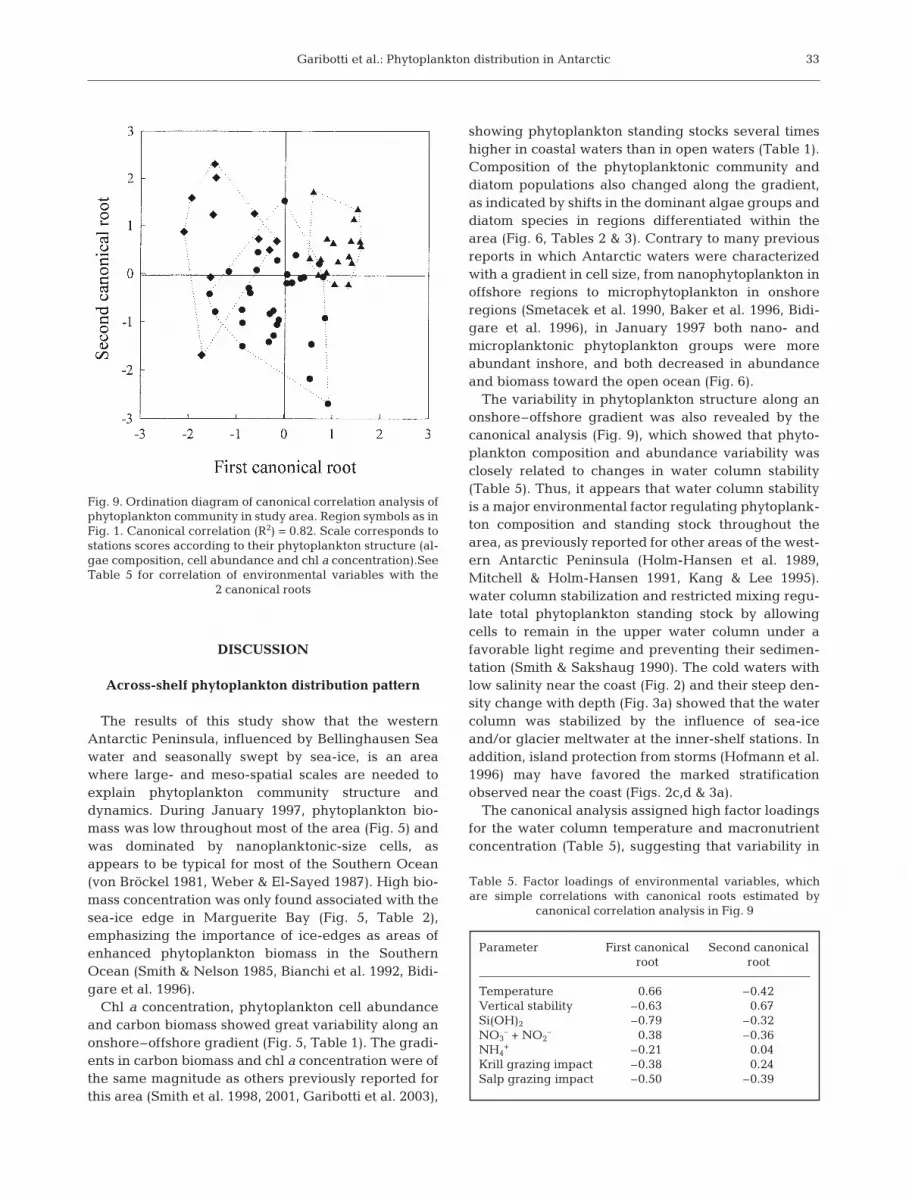
The canonical correlation was significantand high (p < 0.001; R2 = 0.82), indicating aclose relationship between the phytoplank-ton and the environmental variables ana-lyzed. We extracted 2 significant canonicalroots that cumulatively explained 42% ofthe variance observed. Ordination of thesamples in the first 2 canonical roots showsthe separation of stations of the coastal,middle-shelf and oceanic regions (Fig. 9), asdefined by their chl a profile (Figs. 1 & 3).Although partly overlapping, the separationof the 3 regions is more evident along thefirst canonical root. The coastal region hasnegative values on the first canonical root,the middle-shelf region has values aroundzero, and the oceanic region has positivevalues. The second canonical root also con-tributes to the separation of the regions,showing mostly negative values for the mid-dle-shelf region, and positive values for theother 2 regions. Since distance betweenstations in the ordination diagram corre-spond to the level of similarity among sta-tions (ter Braak 1994), the first canonical rootcan be interpreted as indicating a gradualchange of the phytoplankton structure fromthe coast to open regions. However, there ishigh variability within the coastal, middle-shelf and oceanic regions along the secondcanonical root, possibly representing thegreat regional variability found in thephytoplankton composition and abundancewithin the 3 regions, as previously describedfrom the analysis of the contour plots and thecluster analysis.
water column stability had a high correlation withboth canonical roots (Table 5), indicating the highinfluence of this variable on phytoplankton variabilitythroughout the area. On the other hand, temperatureand Si(OH)2 concentration showed high correlationwith the first canonical root only, indicating their majorrelation with the onshore–offshore phytoplanktonchanges. The other variables analyzed (other nutrientsand macrozooplanton grazing impact) have lowerinfluence on the variability of the phytoplanktonthroughout the area, as indicated by their low correla-tion with the 2 significant canonical roots.
32
Fig. 8. Zooplanktonic community. (a) Abundance of Euphausia superba(103 ind. m–3); (b) abundance of Salpa thompsoni (103 ind. m–3); (c) grazingimpact of E. superba (µg chl a m–2 h–1); (d) grazing impact of S. thompsoni(µg chl a m–2 h–1). Alongshore distance corresponds to transect numbers in
Fig. 1, across-shelf distance corresponds to location of stations
Garibotti et al.: Phytoplankton distribution in Antarctic
DISCUSSION
Across-shelf phytoplankton distribution pattern
The results of this study show that the westernAntarctic Peninsula, influenced by Bellinghausen Seawater and seasonally swept by sea-ice, is an areawhere large- and meso-spatial scales are needed toexplain phytoplankton community structure anddynamics. During January 1997, phytoplankton bio-mass was low throughout most of the area (Fig. 5) andwas dominated by nanoplanktonic-size cells, asappears to be typical for most of the Southern Ocean(von Bröckel 1981, Weber & El-Sayed 1987). High bio-mass concentration was only found associated with thesea-ice edge in Marguerite Bay (Fig. 5, Table 2),emphasizing the importance of ice-edges as areas ofenhanced phytoplankton biomass in the SouthernOcean (Smith & Nelson 1985, Bianchi et al. 1992, Bidi-gare et al. 1996).
Chl a concentration, phytoplankton cell abundanceand carbon biomass showed great variability along anonshore–offshore gradient (Fig. 5, Table 1). The gradi-ents in carbon biomass and chl a concentration were ofthe same magnitude as others previously reported forthis area (Smith et al. 1998, 2001, Garibotti et al. 2003),
showing phytoplankton standing stocks several timeshigher in coastal waters than in open waters (Table 1).Composition of the phytoplanktonic community anddiatom populations also changed along the gradient,as indicated by shifts in the dominant algae groups anddiatom species in regions differentiated within thearea (Fig. 6, Tables 2 & 3). Contrary to many previousreports in which Antarctic waters were characterizedwith a gradient in cell size, from nanophytoplankton inoffshore regions to microphytoplankton in onshoreregions (Smetacek et al. 1990, Baker et al. 1996, Bidi-gare et al. 1996), in January 1997 both nano- andmicroplanktonic phytoplankton groups were moreabundant inshore, and both decreased in abundanceand biomass toward the open ocean (Fig. 6).
The variability in phytoplankton structure along anonshore–offshore gradient was also revealed by thecanonical analysis (Fig. 9), which showed that phyto-plankton composition and abundance variability wasclosely related to changes in water column stability(Table 5). Thus, it appears that water column stabilityis a major environmental factor regulating phytoplank-ton composition and standing stock throughout thearea, as previously reported for other areas of the west-ern Antarctic Peninsula (Holm-Hansen et al. 1989,Mitchell & Holm-Hansen 1991, Kang & Lee 1995).water column stabilization and restricted mixing regu-late total phytoplankton standing stock by allowingcells to remain in the upper water column under afavorable light regime and preventing their sedimen-tation (Smith & Sakshaug 1990). The cold waters withlow salinity near the coast (Fig. 2) and their steep den-sity change with depth (Fig. 3a) showed that the watercolumn was stabilized by the influence of sea-iceand/or glacier meltwater at the inner-shelf stations. Inaddition, island protection from storms (Hofmann et al.1996) may have favored the marked stratificationobserved near the coast (Figs. 2c,d & 3a).
The canonical analysis assigned high factor loadingsfor the water column temperature and macronutrientconcentration (Table 5), suggesting that variability in
33
Parameter First canonical Second canonical root root
Temperature 0.66 –0.42Vertical stability –0.63 0.67Si(OH)2 –0.79 –0.32NO3
– + NO2– 0.38 –0.36
NH4+ –0.21 0.04
Krill grazing impact –0.38 0.24Salp grazing impact –0.50 –0.39
Table 5. Factor loadings of environmental variables, whichare simple correlations with canonical roots estimated by
canonical correlation analysis in Fig. 9
Fig. 9. Ordination diagram of canonical correlation analysis ofphytoplankton community in study area. Region symbols as inFig. 1. Canonical correlation (R2) = 0.82. Scale corresponds tostations scores according to their phytoplankton structure (al-gae composition, cell abundance and chl a concentration).SeeTable 5 for correlation of environmental variables with the
2 canonical roots
Mar Ecol Prog Ser 261: 21–39, 2003
phytoplankton composition and standing stockthroughout the onshore–offshore gradient was alsoclosely related to these variables. However, althoughtemperature can limit algal growth rates and produc-tivity, polar temperatures are below the optimum forgrowth, and cells are not expected to be sensitive tothe natural range in environmental temperature(Smith & Sakshaug 1990, Reay et al. 2001). In addition,although at some coastal stations macronutrient con-centrations were relatively low, throughout most of thearea they exceeded concentrations found to be limitingfor phytoplankton growth. Indeed, major localizedmacronutrient depletions coincided with the phyto-plankton peaks (Figs. 4 & 5), and the close relationshipbetween phytoplankton structure and [NO3
– + NO2–]
and [Si(OH)2] concentrations (Table 5) appears to bethe result of the modification of macronutrient distrib-utions by phytoplankton assimilation, as also reportedin other studies (Holm-Hansen et al. 1989, Castro et al.2002). Thus, neither temperature nor macronutrientsare likely to have influenced the across-shelf phyto-plankton changes.
The vertical phytoplankton distribution alsochanged along the onshore–offshore gradient (Figs. 1& 3). In the coastal and middle-shelf regions, chl a ver-tical profiles were closely related to water column den-sity profiles (Fig. 3a,b), indicating a relatively uniformphytoplankton distribution within the upper mixedlayer, and suggesting that phytoplankton were con-centrated in the near-surface layer by physical stratifi-cation. In contrast, in the oceanic region, low chl a con-centrations in the upper water column and maximumvalues at depths between 40 and 100 m (Fig. 3c), werenot related to the vertical density profile. The verticaldensity profile showed a deep or not obvious mixedlayer (Fig. 3c), indicating that water column stratifica-tion was not responsible for this vertical distribution ofthe phytoplankton.
Similar deep chl a maxima have been observed inDrake Passage, where it was hypothesized that phyto-plankton growth was limited in near-surface watersdue to low iron concentrations, and that the deep chl amaxima were the result of high iron concentrations inthe ‘winter water’ mass (Holm-Hansen et al. 1994). Wefound the winter water present throughout most of ourstudy area between 50 and 150 m (temperatures below–1.0°C: Fig. 3). Defining the continental shelf slope tobe at approximately the 500 m isobath (Hofmann et al.1996), the oceanic region occupies the shelf slope andwaters off the continental shelf (Fig. 1). Low iron con-centrations limiting phytoplankton growth have beenmeasured in several pelagic areas of the SouthernOcean, while high iron concentrations are expectedover the continental shelf (Martin et al. 1990, de Baaret al. 1995). Therefore, these results provide support
for the conjecture that in the oceanic region phyto-plankton may have been limited by iron in near-sur-face waters and enhanced in the deep, iron-rich winterwaters. An alternative possible scenario is that aphytoplankton bloom may have developed in associa-tion with the sea-ice edge in the oceanic region duringearly spring, as was observed in this region in anotheryear by Smith et al. (2001). This bloom may havedepleted the iron stock of surface waters, constrainingall further phytoplankton growth to deep waters. Incontrast, the presence of winter water appears to beless important to the phytoplankton assemblage of thecontinental shelf, where surface stratification of thewater column (Fig. 3) and the probable presence ofiron-rich surface waters may have allowed phyto-plankton growth in the upper water column, under afavorable light regime.
During summer 1993, Prézelin et al. (2000) sampledthe same area considered in this study, and observeddiatom-enriched assemblages at stations in the oceanicregion. Although they did not report the presence ofdeep chl a peaks, their results show an increment ofchl a and fucoxanthin concentrations at around 50 mdepth (Prézelin et al. 2000, their Plate 1), indicating thatthe diatom-enhanced biomass they found was re-stricted to a deep layer within the water column. Theyassociated this finding with upwelling of a macronutri-ent-rich water mass (UCDW), which may enhance di-atom growth. However, the high proportion of diatomsin the subsurface layer can also be explained by theiron hypothesis that we suggest is part of the dynamicshere, since enhanced diatom growth in iron-enrichedwaters has been experimentally demonstrated (de Baaret al. 1995, Boyd et al. 2000).
The dominant diatom species found in the oceanic re-gion (Cluster 2: Fig. 7), Corethron criophyllum andsmall Fragilariopsis spp. (Table 3), are known pelagicspecies (Hasle 1969, Theriot & Fryxell 1985, Villafañe etal. 1995). These same species were found in high bio-mass in deep waters of the Bransfield Strait shelf-break(Kang & Lee 1995), close to the area where Holm-Hansen et al. (1994) found the presence of a deep chl amaximum. The comparison of these combined resultsfor the Bransfield Strait with what we found in our studyarea suggests that the phytoplankton composition ofthe deep chl a peaks found in these 2 separate regionsof the western Antarctic Peninsula is similar.
Concordance between our data and those of Prézelinet al. (2000) suggests that deep phytoplankton peaksmay be a consistent year-to-year feature in the oceanicregion. Furthermore, the finding of these same patternin several years in the Bransfield Strait shelf-break(Holm-Hansen et al. 1994, Kang & Lee 1995) suggeststhat the presence of a deep chl a layer might be typicalall along the continental shelf slope of the western
34
Garibotti et al.: Phytoplankton distribution in Antarctic
Antarctic Peninsula. This pattern contrasts with thevertical distribution pattern typically reported forAntarctic coastal phytoplankton, which is described ashaving the higher concentrations in the upper watercolumn (Mitchell & Holm-Hansen 1991, Priddle et al.1994, Helbling et al. 1995, Smith et al. 1996, 1998,Dierssen et al. 2002, Varela et al. 2002). While iron lim-itation is a plausible hypothesis for these high-nutrient,low-chlorophyll (HNLC) waters, it should be notedthat, to date, this hypothesis has not been tested bydirect manipulation for this area. Therefore, furtherresearch is needed to understand what determines thisparticular distribution of the phytoplankton in thewestern Antarctic Peninsula, and the possible impactof the deep concentration of the phytoplankton in thetrophic dynamics of pelagic waters of the SouthernOcean.
During January 1997, the abundance and grazingimpact of krill and salps was relatively low in theoceanic region (Fig. 8, Table 4). Although Prézelin etal. (2000) suggested that Antarctic krill might preferthese offshore communities, krill grazing impact dur-ing January 1993 at the oceanic stations was very low(Ross et al. 1998), as found in this study. Furthermore,we can characterize the grazing impact in this regionfor other years in January (1993 to 1995). In all theseyears, krill grazing in the oceanic region was low-to-zero, and salps were present in 1994, but not in either1993 or 1995 (Ross et al. 1998). Thus, it appears thatmacrozooplankton impact is not important in thisregion. Previous studies showed the greater impor-tance of protist grazers in iron-stimulated phytoplank-ton assemblages in pelagic waters of the SouthernOcean and other marine ecosystems (Boyd et al. 2000,Landry et al. 2000), which agrees with our finding oflow macrozooplankton in this region.
Mesoscale variability in open waters
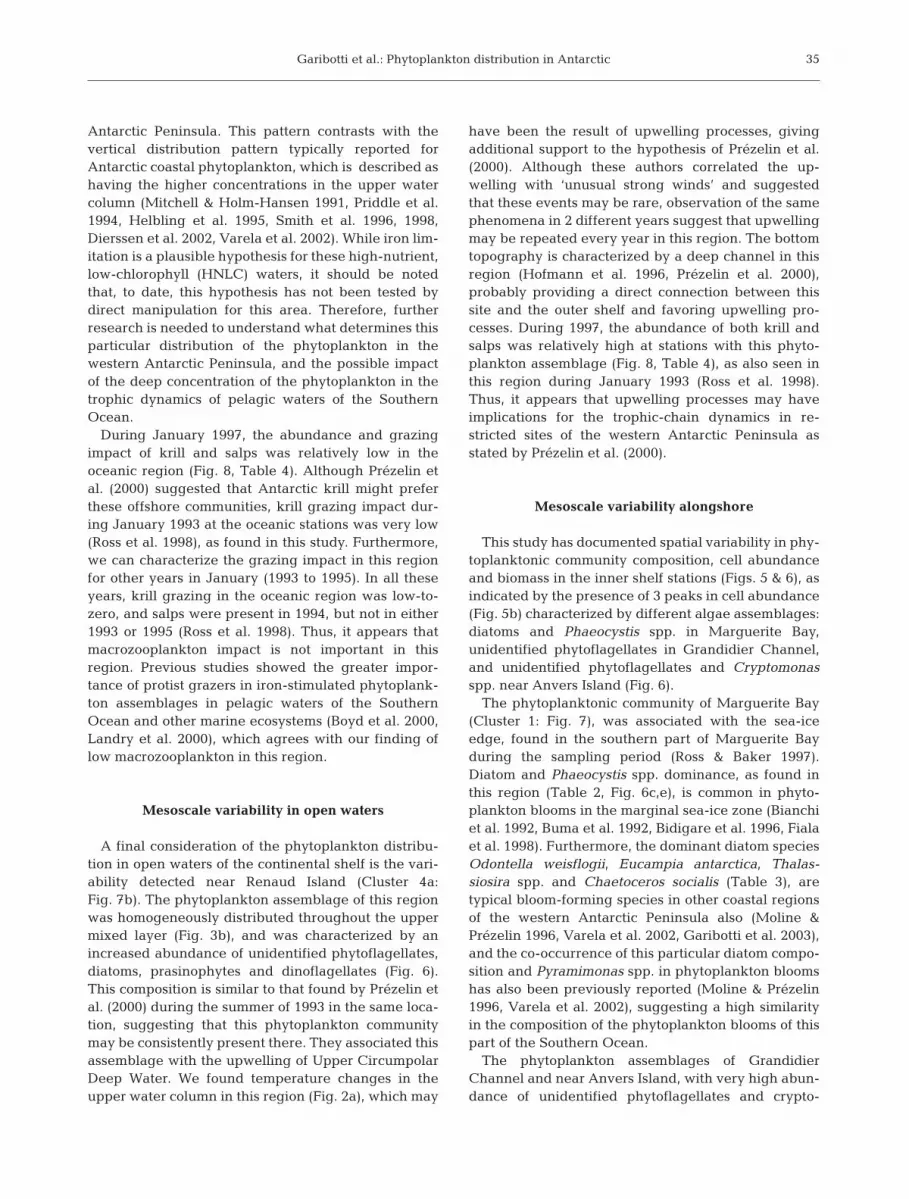
A final consideration of the phytoplankton distribu-tion in open waters of the continental shelf is the vari-ability detected near Renaud Island (Cluster 4a:Fig. 7b). The phytoplankton assemblage of this regionwas homogeneously distributed throughout the uppermixed layer (Fig. 3b), and was characterized by anincreased abundance of unidentified phytoflagellates,diatoms, prasinophytes and dinoflagellates (Fig. 6).This composition is similar to that found by Prézelin etal. (2000) during the summer of 1993 in the same loca-tion, suggesting that this phytoplankton communitymay be consistently present there. They associated thisassemblage with the upwelling of Upper CircumpolarDeep Water. We found temperature changes in theupper water column in this region (Fig. 2a), which may
have been the result of upwelling processes, givingadditional support to the hypothesis of Prézelin et al.(2000). Although these authors correlated the up-welling with ‘unusual strong winds’ and suggestedthat these events may be rare, observation of the samephenomena in 2 different years suggest that upwellingmay be repeated every year in this region. The bottomtopography is characterized by a deep channel in thisregion (Hofmann et al. 1996, Prézelin et al. 2000),probably providing a direct connection between thissite and the outer shelf and favoring upwelling pro-cesses. During 1997, the abundance of both krill andsalps was relatively high at stations with this phyto-plankton assemblage (Fig. 8, Table 4), as also seen inthis region during January 1993 (Ross et al. 1998).Thus, it appears that upwelling processes may haveimplications for the trophic-chain dynamics in re-stricted sites of the western Antarctic Peninsula asstated by Prézelin et al. (2000).
Mesoscale variability alongshore
This study has documented spatial variability in phy-toplanktonic community composition, cell abundanceand biomass in the inner shelf stations (Figs. 5 & 6), asindicated by the presence of 3 peaks in cell abundance(Fig. 5b) characterized by different algae assemblages:diatoms and Phaeocystis spp. in Marguerite Bay,unidentified phytoflagellates in Grandidier Channel,and unidentified phytoflagellates and Cryptomonasspp. near Anvers Island (Fig. 6).
The phytoplanktonic community of Marguerite Bay(Cluster 1: Fig. 7), was associated with the sea-iceedge, found in the southern part of Marguerite Bayduring the sampling period (Ross & Baker 1997).Diatom and Phaeocystis spp. dominance, as found inthis region (Table 2, Fig. 6c,e), is common in phyto-plankton blooms in the marginal sea-ice zone (Bianchiet al. 1992, Buma et al. 1992, Bidigare et al. 1996, Fialaet al. 1998). Furthermore, the dominant diatom speciesOdontella weisflogii, Eucampia antarctica, Thalas-siosira spp. and Chaetoceros socialis (Table 3), aretypical bloom-forming species in other coastal regionsof the western Antarctic Peninsula also (Moline &Prézelin 1996, Varela et al. 2002, Garibotti et al. 2003),and the co-occurrence of this particular diatom compo-sition and Pyramimonas spp. in phytoplankton bloomshas also been previously reported (Moline & Prézelin1996, Varela et al. 2002), suggesting a high similarityin the composition of the phytoplankton blooms of thispart of the Southern Ocean.
The phytoplankton assemblages of GrandidierChannel and near Anvers Island, with very high abun-dance of unidentified phytoflagellates and crypto-
35
Mar Ecol Prog Ser 261: 21–39, 2003
phytes (Fig. 6), are noteworthy, since algae bloomsdominated by small phytoplagellates have only occa-sionally been reported for the Southern Ocean (Bird &Karl 1991, Jacques & Panouse 1991, Buma et al. 1992,Kozlowski et al. 1995, Kopczynska 1996, Moline et al.1997, Varela et al. 2002). However, this kind of bloomcannot be considered a peculiarity of the study area,since these blooms do not accumulate high biomassand can be detected only when cell abundance is cal-culated. Thus, their occurrence may have been over-looked in the Southern Ocean, since the methodologyused in most ecological studies is based on biomassmeasurements only.
These 3 phytoplankton assemblages describedalongshore are similar in composition and standingstock to the communities found in Palmer Basin(Anvers Island coast) during different stages of the sea-sonal phytoplankton succession (Holm-Hansen et al.1989, Kozlowski et al. 1995, Moline & Prézelin 1996,Moline et al. 1997). From south to north, they representassemblages typically found in early spring (Mar-guerite Bay), late spring (Grandidier Channel) andsummer (near Anvers Island). Thus, we hypothesizethat the distribution of summer phytoplankton innearshore waters reflects different stages of the sea-sonal succession of organisms. This pattern may havebeen the result of the fact that the onset of the seasonalphytoplankton cycle is closely related to sea-ice melt-ing (Smith et al. 1996, Moline et al. 1997), and that theprogressive southward retreat of sea-ice cover duringspring and summer (Stammerjohn & Smith 1996) musttrigger the initiation of the phytoplankton successionat different times throughout the area, driving the vari-ability of the coastal phytoplankton. This hypothesis issupported by the results of chl a remote-sensing bysatellites, which showed a gradual movement of a pig-ment-enriched region from the northwest to the south-east of the area as the sea-ice retreated (Smith et al.1998, 2001). The presence during summer of assem-blages in different stages of succession has also beenreported for a northern region of the western AntarcticPeninsula (Bode et al. 2002).
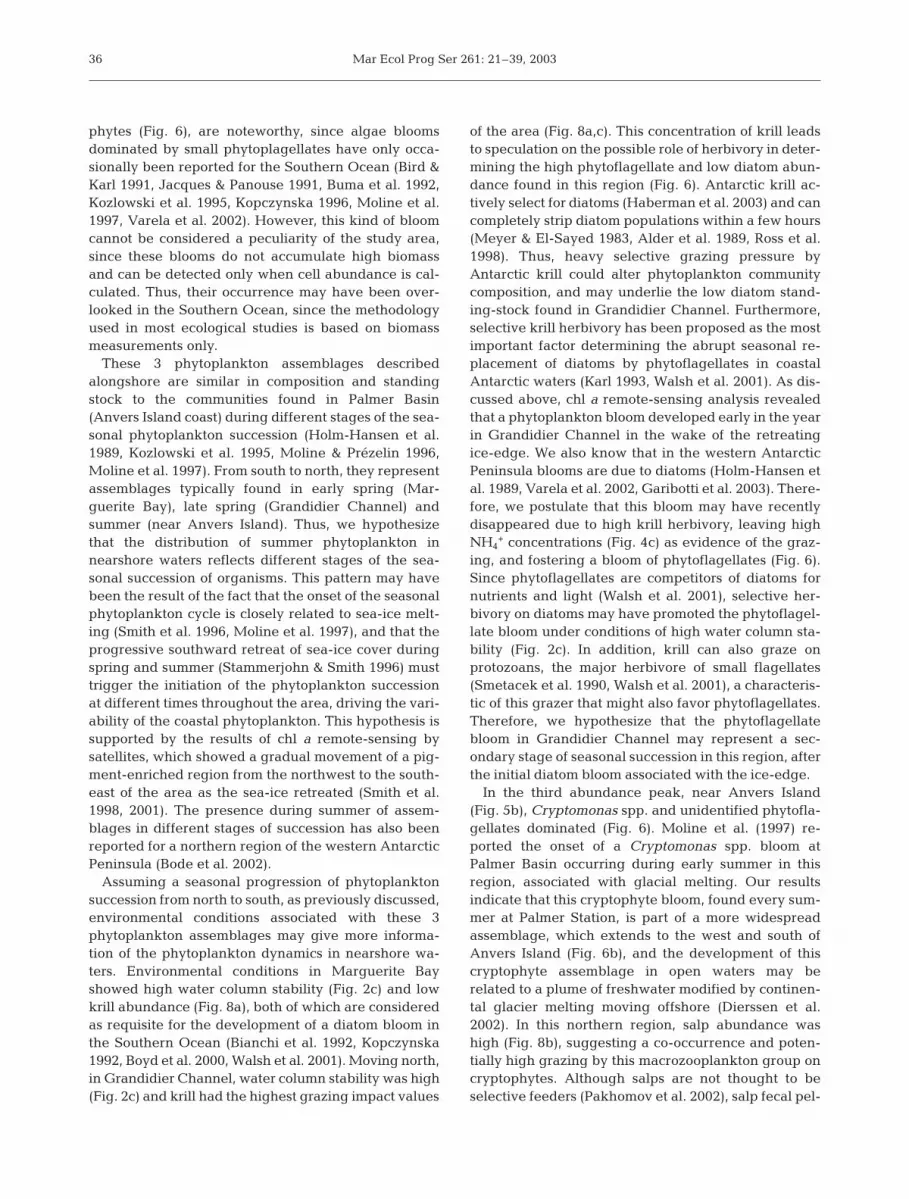
Assuming a seasonal progression of phytoplanktonsuccession from north to south, as previously discussed,environmental conditions associated with these 3phytoplankton assemblages may give more informa-tion of the phytoplankton dynamics in nearshore wa-ters. Environmental conditions in Marguerite Bayshowed high water column stability (Fig. 2c) and lowkrill abundance (Fig. 8a), both of which are consideredas requisite for the development of a diatom bloom inthe Southern Ocean (Bianchi et al. 1992, Kopczynska1992, Boyd et al. 2000, Walsh et al. 2001). Moving north,in Grandidier Channel, water column stability was high(Fig. 2c) and krill had the highest grazing impact values
of the area (Fig. 8a,c). This concentration of krill leadsto speculation on the possible role of herbivory in deter-mining the high phytoflagellate and low diatom abun-dance found in this region (Fig. 6). Antarctic krill ac-tively select for diatoms (Haberman et al. 2003) and cancompletely strip diatom populations within a few hours(Meyer & El-Sayed 1983, Alder et al. 1989, Ross et al.1998). Thus, heavy selective grazing pressure byAntarctic krill could alter phytoplankton communitycomposition, and may underlie the low diatom stand-ing-stock found in Grandidier Channel. Furthermore,selective krill herbivory has been proposed as the mostimportant factor determining the abrupt seasonal re-placement of diatoms by phytoflagellates in coastalAntarctic waters (Karl 1993, Walsh et al. 2001). As dis-cussed above, chl a remote-sensing analysis revealedthat a phytoplankton bloom developed early in the yearin Grandidier Channel in the wake of the retreatingice-edge. We also know that in the western AntarcticPeninsula blooms are due to diatoms (Holm-Hansen etal. 1989, Varela et al. 2002, Garibotti et al. 2003). There-fore, we postulate that this bloom may have recentlydisappeared due to high krill herbivory, leaving highNH4
+ concentrations (Fig. 4c) as evidence of the graz-ing, and fostering a bloom of phytoflagellates (Fig. 6).Since phytoflagellates are competitors of diatoms fornutrients and light (Walsh et al. 2001), selective her-bivory on diatoms may have promoted the phytoflagel-late bloom under conditions of high water column sta-bility (Fig. 2c). In addition, krill can also graze onprotozoans, the major herbivore of small flagellates(Smetacek et al. 1990, Walsh et al. 2001), a characteris-tic of this grazer that might also favor phytoflagellates.Therefore, we hypothesize that the phytoflagellatebloom in Grandidier Channel may represent a sec-ondary stage of seasonal succession in this region, afterthe initial diatom bloom associated with the ice-edge.
In the third abundance peak, near Anvers Island(Fig. 5b), Cryptomonas spp. and unidentified phytofla-gellates dominated (Fig. 6). Moline et al. (1997) re-ported the onset of a Cryptomonas spp. bloom atPalmer Basin occurring during early summer in thisregion, associated with glacial melting. Our resultsindicate that this cryptophyte bloom, found every sum-mer at Palmer Station, is part of a more widespreadassemblage, which extends to the west and south ofAnvers Island (Fig. 6b), and the development of thiscryptophyte assemblage in open waters may berelated to a plume of freshwater modified by continen-tal glacier melting moving offshore (Dierssen et al.2002). In this northern region, salp abundance washigh (Fig. 8b), suggesting a co-occurrence and poten-tially high grazing by this macrozooplankton group oncryptophytes. Although salps are not thought to beselective feeders (Pakhomov et al. 2002), salp fecal pel-
36
Garibotti et al.: Phytoplankton distribution in Antarctic
lets containing high concentrations of cryptophyteshave been found in other areas of the Southern Ocean(Detmer & Bathmann 1997).
In summary, these 2 postulated interactions of thephytoplankton and zooplankton community are on dif-ferent timescales. Krill grazing in the recent past issuggested as a possible mechanism to account for thelack of diatoms in Grandidier Channel, whereas thegrazing of salps on cryptophyte blooms is suggested tobe ongoing near Anvers Island. Testing such mecha-nisms requires some method of tracking changes in thecommunities over time. However, it is hypothesizedhere that both zooplankton groups may have an impor-tant influence on the replacement of algae groupsalongshore and through their seasonal succession.
Conclusions
The results of this research have shown that the west-ern Antarctic Peninsula coastal and shelf region is com-plex. Phytoplankton had high spatial variability on bothlarge- and meso-scales. The main variability in thephytoplankton composition, abundance and biomasswas observed along an onshore–offshore gradient, andsuperimposed on this pattern was high mesoscale vari-ability in the phytoplankton assemblage structure. Com-parison of our results with studies performed previouslyby other authors suggests that the distribution of summerphytoplankton within the area has a similar pattern fromyear to year. The variability of the phytoplankton com-munity was related to differences in the local environ-mental parameters and reflected the different temporalstages of the seasonal succession of algae assemblages.These results can be summarized as follows: (1) watercolumn stability appears to have had a dominant role incontrolling phytoplankton variability along a gradientbetween the coast and oceanic waters. (2) Phytoplanktonvertical distribution in the pelagic region showed a dis-tinct deep maximum (~40 to 100 m) that was related towinter waters. Low iron concentration at the surface ishypothesized to cause this vertical chl a distribution ofthe phytoplankton. (3) Sea-ice dynamics appear to havea great influence over the coastal phytoplankton. Thedifferent phytoplankton assemblages found alongshoreappear to be in different stages of the seasonal succes-sion as a consequence of the progressive retreat of thesea-ice from the north to the south. (3) There was a closerelationship between phytoplankton and zooplanktoncomposition in inner-shelf waters of the area, with lowdiatom abundance in sites with high krill grazing, andhigh cryptophytes abundance in sites with high salpgrazing. We hypothesize that krill grazing may have hada key role in determining the shift from a diatom bloomto a phytoflagellate bloom stage.
Acknowledgements. We would like to thank the crew of theRV ‘Polar Duke’ and Antarctic Support Associates, Inc. fortheir support during sampling. The members of the PalmerLong-Term Ecological Research program provided help andstimulating discussions during the cruise. We would like tothank W. Kozlowski, K. Sines, J. Jones and D. Menzies forsample collection. We thank Silvia Delgado for her help withdata analysis and valuable comments, and Walter Helblingfor critical comments and suggestions that improved the man-uscript. This project was funded by the Office of Polar Pro-grams, National Science Foundation, USA, grant 96-32763.I.A.G.’s work was supported by a doctoral fellowship of theConsejo Nacional de Investigaciones Científicas y Técnicas(CONICET), Argentina. This is Palmer LTER contribution#237.
LITERATURE CITED
Alder V, Cuzin-Roudy J, Fransz G, Graneli E, Larsen J, Rab-bani M, Thomsen H (1989) Macro- and micrograzingeffects on phytoplankton communities. In: Hempel I,Schalk PH, Smetacek V (eds) The expedition AntarktisVII/3 (EPOS LEG 2) of RV ‘Polarstern’ in 1988/89. BerPolarforsch 65:123–130
Baker KS, Fraser WR, Hofmann EE, Karl DM and 7 others(1996) The western Antarctic Peninsula region: summaryof environmental and ecological processes. In: Ross R,Hofmann E, Quetin L (eds) Foundations for ecosystemresearch in the western Antarctic Peninsula region. Amer-ican Geophysical Union, Washington, DC, p 437–448
Bathmann UV, Scharek R, Klaas C, Dubischar CD, SmetacekV (1997) Spring development of phytoplankton biomassand composition in major water masses of the Atlantic sec-tor of the Southern Ocean. Deep-Sea Res Part II 44:51–67
Bianchi F, Boldrin A, Cioce F, Diekmann G and 6 others (1992)Phytoplankton distribution in relation to sea ice, hydrogra-phy and nutrients in the northwestern Weddell Sea inearly spring 1988 during EPOS. Polar Biol 12:225–235
Bidigare RR, Iriarte JL, Kang SH, Karentz D, Ondrusek ME,Fryxell GA (1996) Phytoplankton: quantitative and quali-tative assessments. In: Ross R, Hofmann E, Quetin L (eds)Foundations for ecosystem research in the westernAntarctic Peninsula region. American Geophysical Union,Washington, DC, p 173–198
Bird DF, Karl DM (1991) Massive prasinophyte bloom innorthern Gearlache Strait. Antarct J US 26:152–154
Bode A, Castro CG, Doval MD, Varela M (2002) New andregenerated production and ammonium regeneration inthe western Bransfield Strait region (Antarctica) duringphytoplankton bloom conditions in summer. Deep-SeaRes Part II 49:787–804
Boyd PW, Watson AJ, Law CS, Abraham ER and 31 others(2000) A mesoscale phytoplankton bloom in the polarSouthern Ocean stimulated by iron fertilization. Nature407:695–702
Brandini FP, Kutner MBB (1986) Composition and distributionof summer phytoplankton in the Brasfield Strait, Antarc-tica. An Acad Bras Ciênc 58:3–11
Buma AGJ, Gieskes WWC, Thomsen HA (1992) Abundanceof Cryptophyceae and chlorophyll b-containing organismsin the Weddell–Scotia Confluence area in the spring of1988. Polar Biol 12:43–52
Castro CG, Ríos AF, Doval MD, Pérez FF (2002) Nutrient uti-lization and chlorophyll distribution in the Atlantic sectorof the Southern Ocean during austral summer 1995–96.Deep-Sea Res Part II 49:623–641
37
Mar Ecol Prog Ser 261: 21–39, 2003
de Baar HJW, de Jong JTM, Bakker DCE, Löscher BM, VethC, Bathmann U, Smetacek V (1995) Importance of iron forplankton blooms and carbon dioxide drawdown in theSouthern Ocean. Nature 373:412–415
Detmer AE, Bathmann UV (1997) Distribution patterns ofautotrophic pico- and nanoplankton and their relativecontribution to algal biomass during spring in the Atlanticsector of the Southern Ocean. Deep-Sea Res Part II 44:299–320
Dierssen HM, Smith RC, M Vernet (2002) Glacial meltwaterdynamics in coastal waters west of the Antarctic penin-sula. Proc Natl Acad Sci USA 99:1790–1795
Fiala M, Semeneh M, Oriol L (1998) Size-fractionated phyto-plankton biomass and species composition in the Indiansector of the Southern Ocean during austral summer.J Mar Syst 17:179–194
Garibotti IA, Vernet M, Kozlowski W, Ferrario M (2003) Com-position and biomass of phytoplankton assemblages incoastal Antarctic waters: a comparison of chemotaxonomicand microscopic analyses. Mar Ecol Prog Ser 247:27–42
Haberman KL, Quetin LB, Ross RM (2003) Diet of the Antarc-tic krill (Euphausia superba Dana). II. Selective grazing onmixed phytoplankton assemblages. J Exp Mar Biol Ecol283:97–113
Hasle GR (1969) An analysis of the phytoplankton of thePacific Southern Ocean: abundance, composition and dis-tribution during the Brategg expedition, 1947–1948. Hval-råd Skr 52:1–168
Helbling EW, Villafañe VE, Holm-Hansen O (1995) Variabil-ity of phytoplankton distribution and primary productionaround Elephant Island, Antarctica, during 1990–1993.Polar Biol 15:233–246
Hillebrand H, Dürselen CD, Kirschtel D, Pollingher U, ZoharyT (1999) Biovolume calculation for pelagic and benthicmicroalgae. J Phycol 35:403–424
Hofmann EE, Klinck JM (1998) Thermohaline variability ofthe waters overlying the west Antarctic Peninsula conti-nental shelf. In: Jacobs S, Weiss R (eds) Ocean, ice andatmosphere: interactions at the Antarctic continental mar-gin. American Geophysical Union, Washington, DC,p 67–81
Hofmann EE, Klinck JM, Lascara CM, Smith DA (1996) Watermass distribution and circulation west of the AntarcticPeninsula and including Bransfield Strait. In: Ross R, Hof-mann E, Quetin L (eds) Foundations for ecosystemresearch in the western Antarctic Peninsula region. Amer-ican Geophysical Union, Washington, DC, p 61–80
Holm-Hansen O, Mitchell BG, Hewes CD, Karl DM (1989)Phytoplankton blooms in the vicinity of Palmer Station,Antarctica. Polar Biol 10:49–57
Holm-Hansen O, Amos AF, Silva N, Villafañe VE, HelblingEW (1994) In situ evidence for a nutrient limitation ofphytoplankton growth in pelagic Antarctic waters.Antarct Sci 6:315–324
Jacques G, Panouse M (1991) Biomass and composition of sizefractionated phytoplankton in the Weddell–Scotia Conflu-ence area. Polar Biol 11:315–328
Johnson KS, Petty RL, Tomsen J (1985) Flow injection analy-sis in seawater macronutrients. In: Zirio A (ed) Mappingstrategies in chemical oceanography. Adv Chem Ser 209:7–30
Jongman, RHG, ter Braak CJF, van Tongeren OFR (1995)Data analysis in community and landscape ecology.Cambridge University Press, Cambridge
Kang SH, Lee SH (1995) Antarctic phytoplankton assemblagein the western Bransfield Strait region, February 1993:composition, biomass, and mesoscale distributions. Mar
Ecol Prog Ser 129:253–267Karl DM (1993) Microbial processes in the Southern Ocean.
In: Friedmann EI (ed) Antarctic microbiology. John Wiley& Sons, New York, p 1–63
Kopczynska EE (1992) Dominance of microflagellates overdiatoms in the Antarctic areas of deep vertical mixing andkrill concentrations. J Plankton Res 14:1031–1054
Kopczynska EE (1996) Annual study of phytoplankton inAdmiralty Bay, King George Island, Antarctica. Pol PolarRes 17:151–164
Kozlowski W, Vernet M, Lamerdin SK (1995) Palmer LTER:predominance of cryptomonads and diatoms in Antarcticcoastal waters. Antarct J US 30:267–268
Landry MR, Constantinou J, Latasa M, Brown SL, BidigareRR, Ordrusek ME (2000) Biological response to iron fertil-ization in the eastern equatorial Pacific (IronEx II). III.Dynamics of phytoplankton growth and microzooplanktongrazing. Mar Ecol Prog Ser 201:57–72
Lorenzo LM, Arbones B, Figueiras FG, Tilstone GH, FigueroaFL (2002) Photosynthesis, primary production and phyto-plankton growth rates in Gearlache and Bransfield Straitsduring Austral summer: cruise FRUELA 95. Deep-Sea ResPart II 49:707–721
Marchant HJ, Murphy EJ (1994) Interactions at the base ofthe Antarctic food web. In: El-Sayed SZ (ed) SouthernOcean ecology: the BIOMASS perspective. CambridgeUniversity Press, New York, p 267–285
Martin JH, Gordon RM, Fitzwater SE (1990) Iron in Antarcticwaters. Nature 345:156–158
Mengesha S, Dehairs F, Fiala M, Elskens M, Goeyens L (1998)Seasonal variation of phytoplankton structure and nitro-gen uptake regime in the Indian sector of the SouthernOcean. Polar Biol 20:259–272
Meyer MA, El-Sayed SZ (1983) Grazing of Euphausia super-aba Dana on natural phytoplankton populations. PolarBiol 1:193–197
Mitchell BG, Holm-Hansen O (1991) Observations and mod-eling of the Antarctic phytoplankton crop in relation tomixing depth. Deep-Sea Res 38:981–1007
Moline MA, Prézelin BB (1996) Long-term monitoring andanalyses of physical factors regulating variability incoastal Antarctic phytoplankton biomass, in situ produc-tivity and taxonomic composition over subseasonal, sea-sonal and interannual time scales. Mar Ecol Prog Ser 145:143–160
Moline MA, Prézelin BB, Schofield O, Smith RC (1997) Tem-poral dynamics of coastal Antractic phytoplankton: envi-ronmental driving forces and impact of a 1991/92 summerdiatom bloom on the nutrient regimes. In: Battaglia B,Valencia J, Walton DWH (eds) Antarctic communities spe-cies, structure and survival. Cambridge University Press,New York, p 67–72
Montagnes DJS, Franklin DJ (2001) Effect of temperature ondiatom volume, growth rate, and carbon and nitrogen con-tent: reconsidering some paradigms. Limnol Oceanogr 46:2008–2018
Montagnes DJS, Berges JA, Harrison PJ, Taylor FJR (1994)Estimating carbon, nitrogen, protein, and chl a from vol-ume in marine phytoplankton. Limnol Oceanogr 39:1044–1060
Niiler PP, Amos A, Hu JH (1991) Water masses and 200 m rel-ative geostrophic circulation in the western BransfieldStrait region. Deep-Sea Res 38:943–959
Pakhomov EA, Froneman PW, Perissinotto R (2002) Salp/krillinteractions in the Southern Ocean: spatial segregationand implications for the carbon flux. Deep-Sea Res Part II49:1881–1907
38

Garibotti et al.: Phytoplankton distribution in Antarctic
Pielou EC (1984) The interpretation of ecological data: aprimer on classification and ordination. John Wiley &Sons, New York
Prézelin BB, Hofmann EE, Mengelt C, Klinck JM (2000) Thelinkage between Upper Circumpolar Deep Water (UCDW)and phytoplankton assemblages on the west AntarcticPeninsula continental shelf. J Mar Res 58:165–202
Priddle J, Smetacek V, Bathmann U (1992) Antarctic marineprimary production, biogeochemical carbon cycles andclimatic change. Philos Trans R Soc Lond B 338:289–297
Priddle J, Brandini F, Lipski M, Thorley MR (1994) Patternand variability of phytoplankton biomass in the AntarcticPeninsula region: an assessment of the BIOMASS cruises.In: El-Sayed SZ (ed) Southern ocean ecology: the BIO-MASS perspective. Cambridge University Press, NewYork, p 49–61
Quetin LB, Ross RM, Frazer TK, Haberman KL (1996) Factorsaffecting distribution and abundance of zooplankton, withan emphasis on Antarctic krill, Euphausia superba. In: RossR, Hofmann E, Quetin L (eds) Foundations for ecosystemresearch in the western Antarctic Peninsula region. Amer-ican Geophysical Union, Washington, DC, p 257–371
Reay DS, Priddle J, Nedwell DB, Whitehouse MJ, Ellis-EvansJC, Deubert C, Connelly DP (2001) Regulation by lowtemperature of phytoplankton growth and nutrient uptakein the Southern Ocean. Mar Ecol Prog Ser 219:51–64
Ross RM, Baker KS (1997) Palmer LTER: annual Januarycruise for 1997 (PD97–1). Antarct J US 32:143–146
Ross RM, Quetin LB, Haberman KL (1998) Interannual andseasonal variability in short-term grazing impact ofEuphausia superba in nearshore and offshore waters westof the Antarctic Peninsula. J Mar Syst 17:261–273
Ross RM, Quetin LB, Baker KS, Vernet M, Smith RC (2000)Growth limitation in young Euphausia superba under fieldconditions. Limnol Oceanogr 45:31–43
Smetacek V (1996) Biodiversity and production in the watermass. In: Hempel G (ed) The ocean and the poles. FischerVerlag, Jena, p 207–216
Smetacek V, Scharek R, Nöthig EM (1990) Seasonal andregional variation in the pelagial and its relationship to thelife history cycle of krill. In: Kerry KR, Hempel G (eds)Antarctic ecosystems, ecological change and conserva-tion. Springer-Verlag, Heidelberg, p 103–114
Smith RC, Baker KS, Dustan P (1981) Fluorometric techniquesfor the measurement of oceanic chlorophyll in the supportof remote sensing. Scripps Institution of Oceanography,University of California (Ref 81–17)
Smith RC, Baker KS, Fraser WR, Hofmann EE and 7 others(1995) The Palmer LTER: a long-term ecological researchprogram at Palmer Station, Antarctica. Oceanography 8:77–86
Smith RC, Dierssen HM, Vernet M (1996) Phytoplankton bio-mass and productivity in the western Antarctic Peninsularegion. In: Ross R, Hofmann E, Quetin L (eds) Foundationsfor ecosystem research in the western Antarctic Peninsularegion. American Geophysical Union, Washington, DC,p 333–356
Smith RC, Baker KS, Vernet M (1998) Seasonal and interan-nual variability of phytoplankton biomass west of theAntarctic Peninsula. J Mar Syst 17:229–243
Smith RC, Baker KS, Dierssen HM, Stammerjohn SE, VernetM (2001) Variability of primary production in an Antarcticmarine ecosystem as estimated using a multi-scale sam-pling strategy. Am Zool 41:40–56
Smith WO, Nelson DM (1985) Phytoplankton bloom producedby receding ice edge in the Ross Sea: spatial coherencewith the density field. Science 227:163–166
Smith WO Jr, Sakshaug E (1990) Polar phytoplankton. In:Smith WO Jr (ed) Polar oceanography. Part B. Chemistry,biology, and geology. Academic Press, London, p 477–525
Stammerjohn SE, Smith RC (1996) Spatial and temporal vari-ability of western Antarctic Peninsula sea-ice coverage.In: Ross R, Hofmann E, Quetin L (eds) Foundations forecosystem research in the western Antarctic Peninsularegion. American Geophysical Union, Washington, DC,p 81–104
ter Braak CJF (1994) Canonical community ordination. Part I.Basic theory and linear methods. Ecoscience 1:127–140
Theriot E, Fryxell GA (1985) Multivariate statistical analysisof net diatom species distributions in the southwesternAtlantic and Indian Ocean. Polar Biol 5:23–30
Throndsen J (1978) Preservation and storage. In: Sournia A(ed) Phytoplankton manual. Monographs on oceanogra-phy methodology 6. UNESCO, Paris, p 69–74
Tréguer P, Jacques G (1992) Dynamics of nutrients and phyto-plankton, and fluxes of carbon, nitrogen and silicon in theAntarctic Ocean. Polar Biol 12:149–162
Utermöhl H (1958) Zur Vervollkommung der quantitativenPhytoplankton Methodik. Mitt Int Ver Theor Angew Lim-nol 9:1–38
Varela M, Fernández E, Serret P (2002) Size-fractionatedphytoplankton biomass and primary production in theGearlache and south Bransfield Straits (Antarctic Penin-sula) in the austral summer 1995–1996. Deep-Sea Res PartII 49:749–768
Villafañe VE, Helbling EW, Holm-Hansen O (1995) Spatialand temporal variability of phytoplankton biomass andtaxonomic composition around Elephant Island, Antarc-tica, during the summers of 1990–1993. Mar Biol 123:677–686
von Bröckel K (1981) The importance of nanoplankton withinthe pelagic Antarctic ecosystem. Kiel Meeresforsch Son-derh 5:61–67
Walsh JJ, Dieterle DA, Lenes J (2001) A numerical analysis ofcarbon dynamics of the Southern Ocean phytoplanktoncommunity: the roles of light and grazing in effecting bothsequestration of atmospheric CO2 and food availability tolarval krill. Deep-Sea Res Part I 48:1–48
Waters KJ, Smith RC (1992) Palmer LTER: a sampling grid forthe Palmer LTER program. Antarct J US 27:236–239
Weber LH, El-Sayed SZ (1987) Contributions of the net, nano-and picoplankton to the phytoplankton standing crop andprimary productivity in the Southern Ocean. J PlanktonRes 9:973–994
39
Editorial responsibility: Otto Kinne (Editor), Oldendorf/Luhe, Germany
Submitted: October 17, 2002; Accepted: May 8, 2003Proofs received from author(s): September 17, 2003
Related Documents