Chapter 3 Phytochemical Evaluation of Lagerstroemia speciosa and Mangifera indica

Welcome message from author
This document is posted to help you gain knowledge. Please leave a comment to let me know what you think about it! Share it to your friends and learn new things together.
Transcript

Chapter 3
Phytochemical Evaluation of
Lagerstroemia speciosa and Mangifera indica

3.1 INTRODUCTION
In recent years the plant materials and herbal remedies derived from them
represents a sustained proportion of global market and has gained place in the health
management. This is because of its holistic approach, cost effectiveness and lesser side
effects. The W.H.O. also has been encouraging and promoting the traditional herbal
medicines in health care programs. Hence the standardization of the raw drugs,
processing, finished products, verification of the claims, mechanism of action and purity
from metallic and microbial contamination are some of the major issues which have to be
taken in to consideration for increasing the world wide acceptability of herbal products
and also to achieve clinical success and maximum therapeutic effect.
The subject of phytochemistry has been developed in recent years as a distinct
discipline somewhere in between natural product organic chemistry and plant
biochemistry and it is closely related to both. It is concerned with enormous variety of
organic substances that are elaborated and accumulated by plants and deals with the
chemical structures of these substances, their metabolism, their natural distribution and
their biological function. In all these operations, methods are needed for separation,
purification and identification of different constituents present in the plant (Harborne,
1973). Thus advances in our understanding of phytochemistry are directly related to the
successful exploitation of known techniques and the continuing development of new
technique to solve the problem. One of the challenges of phytochemistry is to carry out
all the above operations on vanishingly small amount of material. In traditional and
alternative medicine it is common to use medicinal plant extracts or powders as such,
without isolating the active ingredients from them. Using active ingredients from crude
extracts might be a more important way to use medicinal plants than has been realized in
Western medicine, since plants contain numerous secondary metabolites, and pathogens
in nature interact with many chemicals simultaneously (Izhaki, 2002).
Due to the advancement of science and sophisticated instrumentation, it is
possible to give a complete and accurate physico-chemical value of any herb, mineral or
metal. Biomarker profiling of a maximum number of medicinal plants used in therapy is
required to establish the quality control development based on this new emerging
technique, which is being utilized by people globally for drug development from natural
resources (Sapna, et al., 2005). Fingerprinting of the herbals are done by HPLC (High
performance liquid chromatography), HPTLC (High performance Thin Layer
Chromatography), MS, LC-MS, H1nmr, C13nmr, etc. High performance Thin Layer
Chromatography is one of the many chromatographic methods presently available that
has been regarded as a simple, rapid and inexpensive one for separation, identification
and quantitation of a wide variety of substances (Fried and Sherma, 1994). These
techniques can be used for the assessment of quality consistency and stability of herbal
extracts or products by visible observation and comparison of the standardized fingerprint
pattern (Li, et al., 2006).
Essential oils contain a large number of volatile components made up of low
molecular weight organic molecules of carbon, hydrogen and oxygen and occasionally
nitrogen and sulphur. The main constituents of essential oils are terpenes. Monoterpenes
are the simplest with 10 carbon atoms and may be aliphatic, alicyclic or bi or tri cyclic
with varying degrees of unsaturation up to three double bonds. Sesqui terpenes contain
three isoprene units and they are also present in essential oils.
In the present study we have conducted possible standardization methods for the
fixation of its parameters by way to bring its therapeutic value constant for any mode of
treatment. Finger printing techniques were used in the experiment to find out the presence
of tannins and polyphenols present in the plants. The isolation of active principles will
help to identify new compound present in the plant materials. GC-MS was carried out to
quantify the active constituents present in the flower of both the plants.
3.2 MATERIALS AND METHODS
3.2.1 Extraction of plant materials
The powdered leaves of L. speciosa and bark of M. indica (section 2.1.2) were
subjected to successive soxhlet extraction using a series of solvents of increasing polarity
starting from petroleum ether, ethyl acetate, ethanol, methanol and water respectively and
used for the chemical analysis. The EtOH extract was used for the column
chromatography separation.
3.2.2 Physico-Chemical Evaluation
3.2.2.1 Determination of Ash Values (IP’96)
Ash values were determined according to the procedure laid down in Indian
pharmacopoeia such as total ash, acid insoluble ash, water-soluble ash and sulphated ash.
The ash was powdered through sieve No: 40 and the ash values were determined by the
following procedures.
a) Total Ash-Three grams of the powdered drug was accurately weighed in a silica
crucible, which was previously heated, cooled and weighed. The crucible with the
powdered drug was incinerated at a temperature not exceeding 450oC until it was free
from carbon. The crucible was cooled and weighed. The procedure was repeated until a
constant weight is obtained. The percentage of the total ash was calculated with reference
to the air-dried drug.
b) Water-soluble Ash (Wallis, 1985)-The ash obtained in the total ash was boiled for
five minutes with 25 mL of distilled water. The insoluble matter was collected on an
ashless filter paper and washed with hot distilled water. The insoluble ash was transferred
into a pre-weighed silica crucible and ignited for 15 minutes at a temperature not
exceeding 450oC. The procedure was repeated to get the constant weight. The weight of
the insoluble matter was subtracted from the weight of total ash. The difference of the
weight was considered as the water-soluble ash. The percentage of water-soluble ash was
calculated with reference to the air-dried drug.
c) Acid insoluble ash-The ash obtained as described in the determination of total ash was
boiled with 25 mL of dilute hydrochloric acid for five minutes. The insoluble ash was
collected on an ashless filter and washed with hot water. The insoluble ash was
transferred to a pre-weighed silica crucible, was ignited, cooled and weighed. The
procedure was repeated to get constant weight. The percentage of acid insoluble ash was
calculated with reference to the air-dried drug.
d) Sulphated ash-The silica crucible was heated to redness for 20 minutes allowed to
cool in a desiccator and weighed. About 1g of the drug powder was accurately weighed
and taken in the above crucible. The crucible was cooled and the residue was moistened
with 1 ml of concentrated sulphuric acid, heated gently until the white fume was no
longer evolved and ignited at 800oC±25oC until all black particles have disappeared. The
ignition was conducted in a place protected from air current. The crucible was allowed to
cool, few drops of concentrated sulphuric acid was added and again heated. The ignition

was carried out as before allowed to cool and weighed to get a constant weight. The
percentage of sulphated ash was calculated with reference to the air-dried drug.
3.2.2.2 Determination of extractive values
Water-soluble and alcohol soluble extractive values of the dried powders L.
speciosa and M. indica were determined as per the standard pharmacopoeial procedures
described below.
a) Water soluble extractive (IP ‘96)-2g of the air-dried coarsely powdered drug was
macerated with 100 mL of chloroform water in a conical flask for 24 hours. The flask
was then shaken vigorously for the first six hours and allowed to stand for 18 hours. At
the end of 24 hours, it was filtered rapidly to prevent solvent loss. 25 mL of filtrate was
evaporated in a tarred shallow dish at 1050c and weighed. The percentage of water-
soluble extractive was calculated with respect to the air-dried drug.
b) Alcohol Soluble Extractive (IP’96)-Instead of chloroform water (section 3.2.2.2a),
alcohol was used in the initial maceration procedure. Alcohol soluble extractive was
calculated with respect to the air-dried drug.
3.2.2.3 Determination of Moisture Content (Ayurvedic Pharmacopoeia, 1986)
10 g of L. speciosa and M. indica each separately was placed in a tarred
evaporating dish which has been dried in an oven at 1050c for 5 hours, cooled in a
desiccator and weighed and the process was repeated until the difference between the two
successive weighing corresponded to not more than 0.1%.
3.2.2.4 Determination of crude fiber content (Ayurvedic Pharmacopoeia, 1986)
About 3-4 g of finely powdered crude drug is weighed and extracted with
petroleum ether at room temperature. After petroleum ether extraction 2g of dried
material is boiled with 200mL sulphuric acid for 30minutes. he extracted material is
filtered through a muslin cloth and washed with boiling water. The material is boiled with
200ml of sodium hydroxide for 30 minutes and filtered the solution again through muslin
cloth and washed with 25ml of 1.25% H2SO4, 50ml of water and 25ml of alcohol
successively. After washing the residue is transferred to a silica crucible, which is
weighed previously (W1). The residue dried for 2-3 hours (at 130˚C) and the crucible is
cooled in a dessicator and weighed again (W2). After these procedures the residue is

incinerated for 30 minutes at 600˚C; cooled it to room temperature in a dessicator and
weighed again (W3).
Calculation: Percentage of crude fibre in test sample
= {[(W2-W1)-(W3-W1)]/[Wt.of test sample]} x 100
3.2.3 Determination of macro elements (Flame photometry)
Preparation of sodium and Potassium-Analar quantity of NaCl and KCl is accurately
weighed and dissolved it in exactly 250 mL of double distilled water. It is diluted (1:100)
to get 1mg Na/100 mL and 1mg K/100 mL, which is equivalent to 10 ppm.
Preparation of Calcium-Analar quantity of CaCO3 is accurately weighed and is
dissolved in minimum quantity 1:1 HCl and it is made up exactly to 250 mL with double
distilled water and it is diluted to get 10 mg Ca/100 mL which is equivalent to 100ppm.
Preparation of Test Solutions-An accurately weighed amount of ash of each drug was
digested with 5 mL of 10% HCl. This was filtered through Whatman No: 4 filter paper
and the residue was washed with hot water, cooled and made to volume. The sample
solutions were then compared in the flame photometer against standard solutions of
NaCl, KCl, and CaCO3 containing the same amount of HCl. The concentrations of the
sodium, potassium and calcium ions were collected by extrapolation method.
3.2.4 Determination of heavy metals (Atomic Absorption Spectrophotometer - AAS)
(AOAC, 1995)
Heavy metals include the elements arsenic, cadmium, mercury and lead were
detected at our lab using atomic absorption spectrometer (AAS), (Thermoelectron, UK)
‘S’ series model with VP100 vapour generator.
Preparation of Standard Curve-
Standard solutions of all the metal elements were prepared as per the standard
procedures reported in the operating manual of the instrument. And standard curves were
prepared for the same. The procedures for the preparation of standard solution was as
followed by the method of Robinson, (1990).
Preparation of Sample solutions
The bark of M. indica and leaves of L. speciosa were cleaned visually and dried at
150oc to a constant weight. The dried materials were then grounded to a fine powder and
were used for dry ashing. Pre-cleaned silica crucibles were heated to 600o C till the
weight of the crucibles was constant. The determination of heavy metals was conducted
according to the standard Food Quality Control Department method. The determination
of mercury, lead, arsenic and cadmium was conducted by Atomic Absorption
Spectrophotometry. (AAS)-FIAS).
3.2.5 Preliminary phytochemical analysis
Chemical tests were carried out to identify the phyto constituents present in the
different extracts (Evans, 1989). The successive extracts were subjected to qualitative
chemical tests for charbohydrates, flavonoids, alkaloids, glycosides, saponins and etc.
3.2.6 Extraction and estimation of phytoconstituents
The plant materials were subjected to quantification of phytoconstituents like
saponins, alkaloids, glycosides, triterpenoids, resins, polyphenols, flavonoids, total
tannins, condunced tannins, carbohydrates, polysaccharides and phytosterols.
3.2.6.1 Extraction of total tannins (Muntha et al., 2007)
Tannins were extracted according to the method of Muntha et al., (2007) with
slight modifications. The powdered plant material of the both the plants materials were
boiled with water for one hour and concentrated to dryness. This extract is successively
partitioned with ethyl acetate and n-butanol. The ethyl acetate portion was subjected to
column chromatography using silica gel and is eluted with methanol and water. The
methanol portion upon removal of solvent afforded tannins. Normal TLC was carried out
on pre-coated silica gel 60 F 254 plates (Merck) with CHCl3: MeOH:AcOH (7:2.5:0.5) and
sprayed with 5% FeCl3 which gave bluish black colour and confirmed as tannins
3.2.6.2 Extraction of polyphenols (Hara, 1994)
Dried M. indica bark powder was extracted with water and water-soluble fraction
was dissolved in hot water and washed with chloroform. Aqueous layer was extracted
with ethyl acetate and ethyl acetate layer containing polyphenol was separated out and
evaporated to dryness (Hara, 1994). It was resuspended in water and confirmed using
chemical test and used for the further experiments.
3.2.6.3 Determination of total Saponins
5g of the sample were taken in 250 mL flask and 50 mL of 90% methanol is
added. The mixture is refluxed for half an hour. The solvent is distilled and 50 mL of
methanol is added second time and the residue is refluxed again for half an hour. These

are combined and solvent is distilled off. This is treated with 25 mL ether at 60-80o for 30
minutes and the extract is treated with 25 mL of CHCl3 and 25 mL of ethyl acetate. The
solvent is decanted and the extract is dissolved in 25 mL methanol (90%). It is
concentrated to 5 mL and is washed with 25 mL acetone. The precipitate is filtered
through ashless whatman filter paper, dried and collected at 105o C. Percentage of
saponins present was calculated with respect to air-dried drug.
3.2.6.4 Estimation of Total phenolics (Jabbar et al., 2006)
The total phenolics were determined by the Folin-Ciocalteau method as
previously described (Jabbar et al., 2006). Briefly, 50 mg of the dried powder was
extracted with 100 mL of acidified methanol:water (60:40 v/v, 0.3% HCl) and filtered.
Filtrate was mixed with equal amounts of the Folin-Ciocalteau reagent (Sigma) and 2.0
mL of sodium bicarbonate was added and mixed thoroughly. After 2 h, absorbance was
measured at 725 nm and the values were derived from a standard curve prepared using
tannic acid (0 – 1.0 mg/mL in acidified methanol:water). Values were expressed as mg/g
tannic acid equivalents (mg/g of TAE).
3.2.6.5 Estimation of Total Carbohydrates (Sadhasivam and Manikam, 1992)
The total carbohydrate content was estimated by Phenol Sulphuric acid Method.
Accurately weighed 100mg of sample is taken in a boiling tube and hydrolysed by
keeping in a boiling water bath for 3 hours with 5 mL of 2.5N hydrochloric acid and then
cooled to room temperature, neutralized with solid sodium carbonate until the
effervescence is ceased and the volume is made up to 100 mL and centrifuged. Pippetted
out 0.2, 0.4, 0.6, 0.8, 1.0 and 2.0 mL of the sample solution in two separate test tubes and
made up the volume to 1 mL with water. A blank was set with one mL of water. 1 mL of
phenol solution is added to each tube. Added 5 mL of 96% sulphuric acid to each tube
and shook well. After 10 minutes the contents in the tubes were shaken and placed in a
water bath at 25o_30oc for 20 minutes. The optical density was measured at 490nm. The
amount of total carbohydrate present in the sample is calculated from the standard graph.
3.2.6.6 Estimation of flavonoid content (Jia et al., 1999)
The powdered plant material (1g) was homogenized with extracting solvent
(140:50:10, CH3OH: H2O: CH3COOH, 20 mL) and filtered into volumetric flasks.
Volumes were adjusted to 100 mL by addition of additional extracting solvent. The
solutions were prepared for analysis and aliquots (2.5 mL) were transferred into 50 mL
volumetric flasks and their volumes made up with water. To each 10 mL, of analysis
solution, water (2 mL) and AlCl3 reagent (133mg crystalline AlCl3 and 400 mg crystalline
sodium acetate dissolved in 100 mL of extracting solvent, 5 mL) were added and
absorbance recorded at 430 nm against a blank (10 mL of analyzed solution plus 5 mL of
water). The amount of flavonoids was calculated as epicatechin equivalent from the
calibration curve of epicatechin standard solutions, and expressed as g epicatechin/kg
plant material.
3.2.6.7 Determination of total triterpenoid content of L. speciosa
The powdered plant material (5.0 g) of the sample in 50% v/v methanol, heated to
ensure complete dissolution. To this 75 mL water was added and the contents were mixed
thoroughly and it was transferred to a 250 mL R.B. flask. To this 10 g sulphuric acid was
added and refluxed for 6-8 hours. The contents were cooled and were transferred into a
separating funnel. To this 25 mL CHCl3 is added, shaken well for a while and allowed to
stand for layer separation. The CHCl3 layer was transferred to another separator and
aqueous acidic layer was again washed with 25 mL CHCl3 and the washings were mixed.
It was then washed with water till free from acid (2-3 washings). Acid free chloroform
layer was dried over anhydrous sodium sulphate, filtered and evaporated to dryness in a
pre-weighed beaker. The residue in the beaker was finally dried at 80oC under vacuum to
a constant weight. This gives the quantity of total triterpenic acid (major one ursolic acid)
for calculating the percentage.
3.2.6.8 Determination of total alkaloids (Sadasivam and Manikam, 1992)
One gram of the powdered material was weighed. 80 mL of ether, 20 mL of
alcohol (95%) and 5 mL of dilute ammonia were added and shook for one hour in iodine
flask for one hour. It was then filtered into a separator and the residue was washed with
80 mL ether, 20 mL ethanol and filtered again and to this 30 mL of 1N H2SO4 was added
shook well and allowed to separate. From this the lower layer was again passed into
another separator and extracted with 25 mL of 0.5 N H2SO4. Three volume of H2SO4 and
one volume of 95% ethanol were again shaken well until complete separation of alkaloid
is effected. This extract is collected in a separator and the solution is acidified and
washed with 10mL of chloroform thrice. The chloroform layer was rejected and acidified
layer is transferred to first separator and made alkaline with dilute ammonia and shaken
with 25 and 20 mL of chloroform and this is repeated two times until alkaloid is
extracted. The chloroform layer was washed with 5 mL of water. The chloroform layer
was filtered into a weighed beaker and the paper was washed with chloroform and is
collected in the same beaker. The chloroform was evaporated in a water bath to get the
residue and 2 mL of alcohol was added and evaporated to get a constant weight.
3.2.6.9 Estimation of polysaccharide (Sadasivam and Manikam, 1992)
The polysaccharide content in L. speciosa and M. indica were estimated by
anthrone method (Sadasivam and Manikam, 1992). Anthrone reagent was prepared by
dissolving 200mg anthrone in 100mL ice cooled 95% sulphuric acid. The stock solution
was prepared by dissolving 100mg dextrose in 100 mL distilled water. The working
standard was prepared by taking 10mL of stock solution and made up to 100mL with
distilled water. The samples were prepared by dissolving accurately weighed 0.2mg of
crystals obtained from ethanol extract in 1mL water.
Pipetted out 0.2, 0.4, 0.6, 0.8 and 1mL of the working standard into a series of test
tubes. Pipetted out 0.3 and 0.5ml of the sample solution in two separate test tubes and
made up the volume in each tube to 1mL with distilled water. A blank was set with 1 mL
distilled water. Added 4mL of anthrone reagent to each tube and heated for 8 minutes in a
boiling water bath. The tubes were cooled after this and the intensity of colour (green to
dark green) was read at 630nm. Calculated the glucose content present in the samples
using standard graph.
3.2.6.10 Estimation of Total Tannins (Jain and Dixit, 2004)
Principle-Tannin like compounds reduces phosphotungstomolybdic acid in alkaline
solution to blue coloured compound. The intensity of this is proportional to the total
amount of tannin. The intensity is measured in spectrophotometer at 760nm.
Working standard solution of tannic acid-Accurately weighed tannic acid (100mg) was
dissolved in distilled water and made up to 100 mL and 5 mL of this solution was diluted
with water to 100 mL in another volumetric flask to give 50µg/mL tannic acid solution.
Sodium carbonate solution-A saturated solution of sodium carbonate was prepared by
dissolving excess sodium carbonate in 50ml water in a beaker. Heated to boiling and

cooled and kept for 24 hours. Pure crystals of sodium carbonate appeared. Then filtered
and the solution was used.
Folin-Denis reagent-Weighed out accurately 0.5g. phosphomolybdic acid and 2.5g
sodium tungstate. Transferred these into R.B flask. To this added 1.25mL ortho
phosphoric acid followed by 20ml water. A condenser was fitted to the mouth of the flask
and refluxed for two hours. After refluxing cooled and made upto 25mL.
Procedure Weighed 0.5g of the powdered material and transfered to a 250mL conical
flask. 75mL water was added. Heat the flask gently and boil for 30 minutes. Centrifuge at
2000 rpm for 20’ and collected the supernatant in 100 mL volumetric flask and make up
the volume. Transfer 1 mL of the sample extract to a 100 mL volumetric flask containing
75 mL water and 5 mL of Folin’s reagent, 10 mL of sodium carbonate solution and dilute
to 100 mL with water was added and absorbance read at 700nm after 30 minutes. A blank
was prepared with water instead of the sample. A standard graph was prepared by using
(0-100µg) tannic acid.
3.2.6.11 Determination Condensed tannins (Titto and Julkunen, 1985)
The powdered samples were extracted in 80% aqueous acetone (30 mL) for 20
minutes with agitation using magnetic stirrer at room temperature and it was filtered. The
process was repeated twice and was combined and made up to a volume of 100mL. 0.5
mL of the extract was introduced into tubes and covered with an aluminium foil. To this
3 mL of 4% vanillin (w/v) in methanol were added and the tubes were shaken
vigourously.1.5 mL of con. HCl was added and mixed well. After 20 minutes the
absorbance was read at 550 nm and the results was expressed in tannic acid equivalents
(mg/100g) of the weight.
3.2.6.12 Estimation of Phytosterols (Norcia, and Barbara, 1966)
Principle
The cholesterol content is subjected to Leibermann-Burchard reaction and the
colour produced is then compared with that produced by standard cholesterol.
Procedure
The colour was developed by adding acid mixture to the set of tubes containing
standard cholesterol solution and that containing sample of which the sterol content has
to be determined. The known volume of sample was taken, 10 mL of ethanol- ether

mixture was added and it was shaken vigourously and centrifuged. The supernatent liquid
was taken, evaporated to dryness in a water bath. To the varying volumes of cholesterol
(0-5 mL), chloroform was added to make up the volume to 5 mL in each tubes. Then 2
mL of acid mixture was added to all tubes, the optical density was plotted against
concentration and the amount of phytosterol was determined.
3.2.7 Identification of compounds by fingerprinting technique-HPTLC
Preparation of sample-Ten milligrams of the tannins and polyphenols of L. speciosa
and M. indica was weighed accurately and dissolved in 10 mL of water.
Preparation of the standard-The reference standard solution of (-) epicatechin, (+)
epicatechin and (±) catechin were prepared at a concentration of 1 mg/mL.
Applications of Sample-For the application of sample, pre-coated plates of 10cm×10cm
size (silica gel GF245, E. Merck) were used. The standard and test solutions were applied
on tracks of the plate. A thin band of 6 mm widths were applied using Linomat III
(automatic TLC applicator, CAMAG, Switzerland).
Chromatographic Development-The HPTLC plates was developed in twin trough
chamber, using the solvent system toluene:acetone:formic acid (7:5:1). After the
development the chromatogram plate was taken out, dried at room temperature and
observed under UV.
3.2.8 HPLC analysis of Polyphenols
Standard polyphenolics like (+)epicatechin, (-)epicatechin, epicatechin gallate, epi
gallo catechin gallate, gallo catechin gallate and ellagic acid were used for the
comparison with the test material. A gradient high-pressure liquid chromatograph
(Shimadzu HPLC class VP series) with variable wavelength programmable UV/Vis
detector at 271 nm was used. The column used was Reverse Phase Luna C-18 column
with 100mm length. Mobile phase used was acetonitrile, methanol and water in the ratio
of 20:40:40. The flow rate of the mobile phase was maintained at 1 ml/min and run at
ambient room temperature. The polyphenols present in the L. speciosa were estimated.
The detection wavelength was chosen at 262 nm because of better absorption and
sensitivity at this wavelength.
3.2.9 Isolation and characterization of compounds from M. indica bark

The ethanol extracts were partitioned with organic solvents of different polarities
to yield hexane, ethyl acetate (EtOAc) and water fractions in sequence. The EtOAc
fraction of each plant was subjected to silica gel chromatography with petroleum ether,
ethyl acetate, methanol and water in varying proportions in order and the tubes were
collected with 20 mL in each tube. The fractions were tested using TLC and mixtures
were pooled and pure fractions were separated out. Fraction 1-8 contains 73mg, 120mg,
735 mg, 153 mg, 945 mg, 172 mg, 65 mg and 1.23g respectively.
The fraction 3 was subjected to thin layer chromatography using the solvent
system chloroform-ethyl acetate-acetic acid (50:50:1) and detection was carried out using
iodine vapour and ferric chloride reagent. Preparative TLC was carried out and 45 mg of
a white compound (3c) was crystallized and it was recrystallised from methanol. The
fraction 5 was subjected to thin layer chromatography using the solvent system
chloroform, methanol and water in the ratio (6.5:3.5:1) and sprayed with benedict’s
reagent and aluminium chloride and yellow coloured spots were obtained and a pale
yellow compound (5b1) was recrystallised from methanol.
3.2.8.1 Column chromatography procedure
Column chromatography was carried out using petroleum ether: ethyl acetate:
methanol: water in increasing order of their polarity.
Petroleum ether:Ethyl acetate
100:0 1-10 pale yellow 90:10 11-15 brown oily like 80:20 15-19 dark brown--- 70:30 20-33 ,, ---------------fraction 1 60: 40 33-39 ,, ---- 50:50 40-62 brown gum like 40:60 63-65 ,, 30:70 66-78 pale yellow ---------- 20:80 79-84 ,, ---------------fraction 2 10:90 84-98 ,, --------- 0: 100 98-136 Orange yellow Ethyl acetate:Methanol
100:0 “ “ 80:20 137-147 Pale yellow 60: 40 148-163 yellow-------- ----fraction 3 50:50 163-182 yellow--------
40:60 183-198 turbid yellow
20:80 199-215 ,, ,, 0: 100 215-229 brownish yellow ---- fraction 4 Methanol:Water
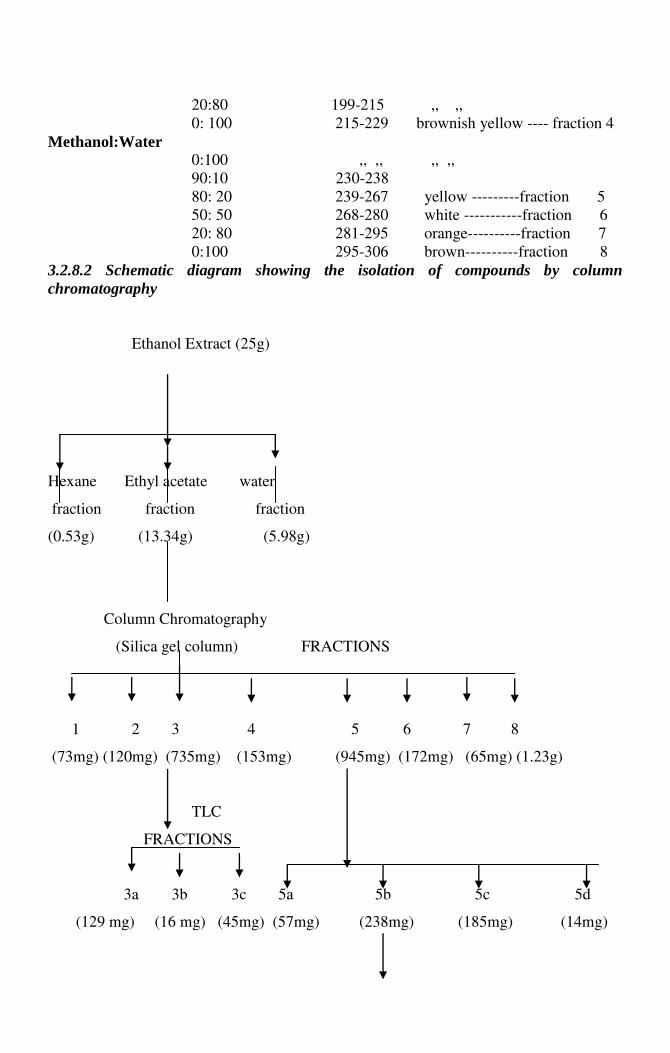
0:100 ,, ,, ,, ,, 90:10 230-238 80: 20 239-267 yellow ---------fraction 5 50: 50 268-280 white -----------fraction 6 20: 80 281-295 orange----------fraction 7 0:100 295-306 brown----------fraction 8 3.2.8.2 Schematic diagram showing the isolation of compounds by column
chromatography
Ethanol Extract (25g)
Hexane Ethyl acetate water
fraction fraction fraction
(0.53g) (13.34g) (5.98g)
Column Chromatography
(Silica gel column) FRACTIONS
1 2 3 4 5 6 7 8
(73mg) (120mg) (735mg) (153mg) (945mg) (172mg) (65mg) (1.23g)
TLC
FRACTIONS
3a 3b 3c 5a 5b 5c 5d
(129 mg) (16 mg) (45mg) (57mg) (238mg) (185mg) (14mg)
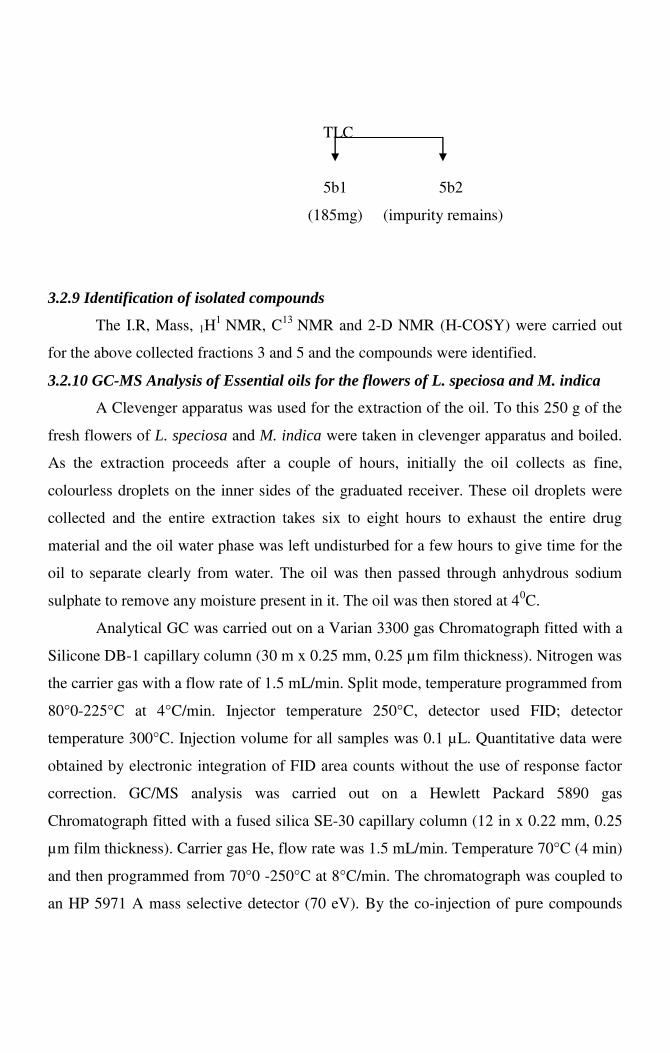
TLC
5b1 5b2
(185mg) (impurity remains)
3.2.9 Identification of isolated compounds
The I.R, Mass, 1H1 NMR, C13 NMR and 2-D NMR (H-COSY) were carried out
for the above collected fractions 3 and 5 and the compounds were identified.
3.2.10 GC-MS Analysis of Essential oils for the flowers of L. speciosa and M. indica
A Clevenger apparatus was used for the extraction of the oil. To this 250 g of the
fresh flowers of L. speciosa and M. indica were taken in clevenger apparatus and boiled.
As the extraction proceeds after a couple of hours, initially the oil collects as fine,
colourless droplets on the inner sides of the graduated receiver. These oil droplets were
collected and the entire extraction takes six to eight hours to exhaust the entire drug
material and the oil water phase was left undisturbed for a few hours to give time for the
oil to separate clearly from water. The oil was then passed through anhydrous sodium
sulphate to remove any moisture present in it. The oil was then stored at 40C.
Analytical GC was carried out on a Varian 3300 gas Chromatograph fitted with a
Silicone DB-1 capillary column (30 m x 0.25 mm, 0.25 µm film thickness). Nitrogen was
the carrier gas with a flow rate of 1.5 mL/min. Split mode, temperature programmed from
80°0-225°C at 4°C/min. Injector temperature 250°C, detector used FID; detector
temperature 300°C. Injection volume for all samples was 0.1 µL. Quantitative data were
obtained by electronic integration of FID area counts without the use of response factor
correction. GC/MS analysis was carried out on a Hewlett Packard 5890 gas
Chromatograph fitted with a fused silica SE-30 capillary column (12 in x 0.22 mm, 0.25
µm film thickness). Carrier gas He, flow rate was 1.5 mL/min. Temperature 70°C (4 min)
and then programmed from 70°0 -250°C at 8°C/min. The chromatograph was coupled to
an HP 5971 A mass selective detector (70 eV). By the co-injection of pure compounds
and correlation of their retention times (using Kovats indices), some single components
could be identified.
3.3 RESULTS
The extracts were vacuum dried and the percentage yields of the successive
extracts of the leaves of L. speciosa using solvents of increasing polarity by petroleum
ether, ethyl acetate, ethanol, methanol and water were 1.25, 5.76, 19.9, 2.56, 15.9% W/W
respectively. Successive extracts of the bark of M. indica were found to be 3.56, 5.21,
14.2, 3.19 and 17.47% W/W respectively.
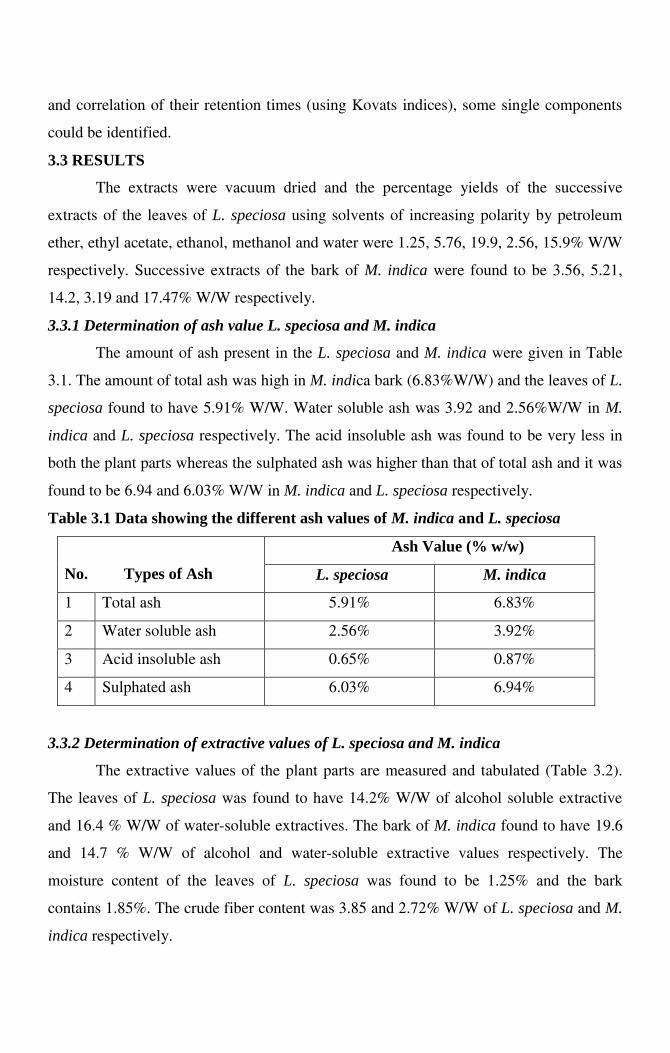
3.3.1 Determination of ash value L. speciosa and M. indica
The amount of ash present in the L. speciosa and M. indica were given in Table
3.1. The amount of total ash was high in M. indica bark (6.83%W/W) and the leaves of L.
speciosa found to have 5.91% W/W. Water soluble ash was 3.92 and 2.56%W/W in M.
indica and L. speciosa respectively. The acid insoluble ash was found to be very less in
both the plant parts whereas the sulphated ash was higher than that of total ash and it was
found to be 6.94 and 6.03% W/W in M. indica and L. speciosa respectively.
Table 3.1 Data showing the different ash values of M. indica and L. speciosa
No. Types of Ash
Ash Value (% w/w)
L. speciosa M. indica
1 Total ash 5.91% 6.83%
2 Water soluble ash 2.56% 3.92%
3 Acid insoluble ash 0.65% 0.87%
4 Sulphated ash 6.03% 6.94%
3.3.2 Determination of extractive values of L. speciosa and M. indica
The extractive values of the plant parts are measured and tabulated (Table 3.2).
The leaves of L. speciosa was found to have 14.2% W/W of alcohol soluble extractive
and 16.4 % W/W of water-soluble extractives. The bark of M. indica found to have 19.6
and 14.7 % W/W of alcohol and water-soluble extractive values respectively. The
moisture content of the leaves of L. speciosa was found to be 1.25% and the bark
contains 1.85%. The crude fiber content was 3.85 and 2.72% W/W of L. speciosa and M.
indica respectively.

Table 3.2 Data showing the extractive values of L. speciosa and M. indica
3.3.3 Determination of calcium, potassium and sodium levels of L. speciosa and bark of
M. indica
The amount of macronutrients present in the plant parts were measured and given
in table 3.3. The amount of calcium, potassium and sodium present in the leaves of L.
speciosa were found to be 143.85, 85.1 and 12.3 µg/g respectively. In the M. indica bark,
the calcium level was found to be higher (176.43µg/g) whereas the potassium (17.2µg/g)
and sodium (9.6µg/g) levels were lesser than the other plant
Table 3.3 Data showing the levels of calcium, potassium and sodium present in L.
speciosa and M. indica
Calcium Potassium Sodium
L. speciosa 143.85 ±2.1 85.1 ±1.6 12.3 ±0.08
M. indica 176.43± 3.4 17.2 ± 0.78 9.6 ± 0.05
Unit: µg/g crude drug
3.3.4 Estimation of heavy metal content of L. speciosa and M. indica
The heavy metal content was estimated in the plant parts after complete digition
and estimated by AAS and levels were compared with the WHO standard and tabulated
(Table 3.4). The mercury content was found to be 62.6 and 28.14 PPB in the leaves of L.
speciosa and bark of M. indica respectively. It was found that the L. speciosa contains
2.02, 1.16 and 0.26 PPM of arsenic, lead and cadmium respectively. The estimations
showed that the M. indica bark contains 2.58, 5.66 and 0.12 PPM of arsenic, lead and
Plants used L. speciosa M. indica
Alcohol soluble extractive value
21.2% 19.6%
Water-soluble extractive value
19.4%
18.7%
Moisture content 1.25% 1.85%
Crude fiber content 3.85 % 2.72 %

cadmium respectively. The result showed that none of the heavy metals presented in the
plant parts are above the WHO recommended level.
Table 3.4 Data showing the Heavy metal content of L. speciosa and M. indica
Heavy metals L. speciosa M. indica Recommended
level (WHO)
1. Mercury 0.626 PPM 0.281 PPM 1 PPM
2. Arsenic 2.02 PPM 2.58 PPM 3 PPM
3. Lead 1.16 PPM 5.66 PPM 10 PPM
4. Cadmium 0.26 PPM 0.12 PPM 0.3 PPM
3.3.5 Determination of qualitative phytochemical analysis
Table 3.5 showed the chemical constituents present in the L. speciosa and M.
indica using different solvents. The chemical test showed that L. speciosa contains
saponins in ethanol, methanol and water extracts. In M. indica, saponins reported in the
EtoAC, EtOH and MeOH extracts. Tannins are reported in all extracts of both the plants.
But alkaloids showed positive in EtOH and MeOH extract of L. speciosa and only in
EtOH extract of M. indica. Except water extract, flavonoids are presented in all other
extracts of L. speciosa. Reducing sugar was reported in all extracts of M. indica.
Table 3.5 Qualitative phytochemical evaluations of the extracts L. speciosa and M.
indica
Constituents Observations
Ethyl acetate Ethanol Methanol Water
Ls Mi Ls Mi Ls Mi Ls Mi
Saponins - + + + + + + - Tannins + + + + + + + + Alkaloids - - + + + - - - Sterols + + - - + - + - Glycosides - - + - - - - + Flavonoids + - + + + + - -

Reducing + + - + + + + + sugars
Ls- L. speciosa; Mi- M. indica
‘+’ and ‘-‘ indicated the presence and absence of the active constituents
3.3.6 Determination and quantitative estimation of Phytoconstituents in L. speciosa
and M. indica
Table 3.6 showed the amount of crude phytoconstituents present in the plant
materials. The amount of saponins present in the L. speciosa and M. indica was 0.75 and
0.48% respectively. The amounts of alkaloids were found to be 0.67 and 0.75%
respectively. Other major phytoconstituents like glycoside, triterpenoids, crude fiber,
resins, carbohydrates and polysaccharides were also isolated and the yield was tabulated.
The total polyphenols present in the L. speciosa and M. indica was 76.5 and 128 mg/g.
The flavonoids were found to be small quantity (0.136 and 0.523mg/kg) in both the plant
materials. The estimations showed that the content of total tannins is more than the
condensed tannins in both the plants. Phytosterols was estimated from the standard graph
of cholesterol.
Table 3.6 Determination of plant phytoconstituents
Phytoconstituents L. speciosa M. indica
Saponins 0.75% 0.48%
Alkaloids 0.67% 0.75%
Glycosides 2.17% 3.67%
Triterpenoids 1.28% ND
Resins 2.05% 3.80%
Total polyphenolsa 76.510 128.000
Flavonoids b 0.136 0.632
Total tanninsa 54.220 61.500
Condensed tanninsa 36.310 47.500

Carbohydratesa 3. 630 5.650
Polysaccharidesc 0.760 1.750
Phytosterolsd 1.030 0.730
ND- Not determined a = (mg tannic acid equivalents /g dry weight) b = (microgram epicatechin equivalents /g dry weight)
c= % W/W, calculated from standard glucose graph
d =mg/g dry weight ( from pure cholesterol graph)
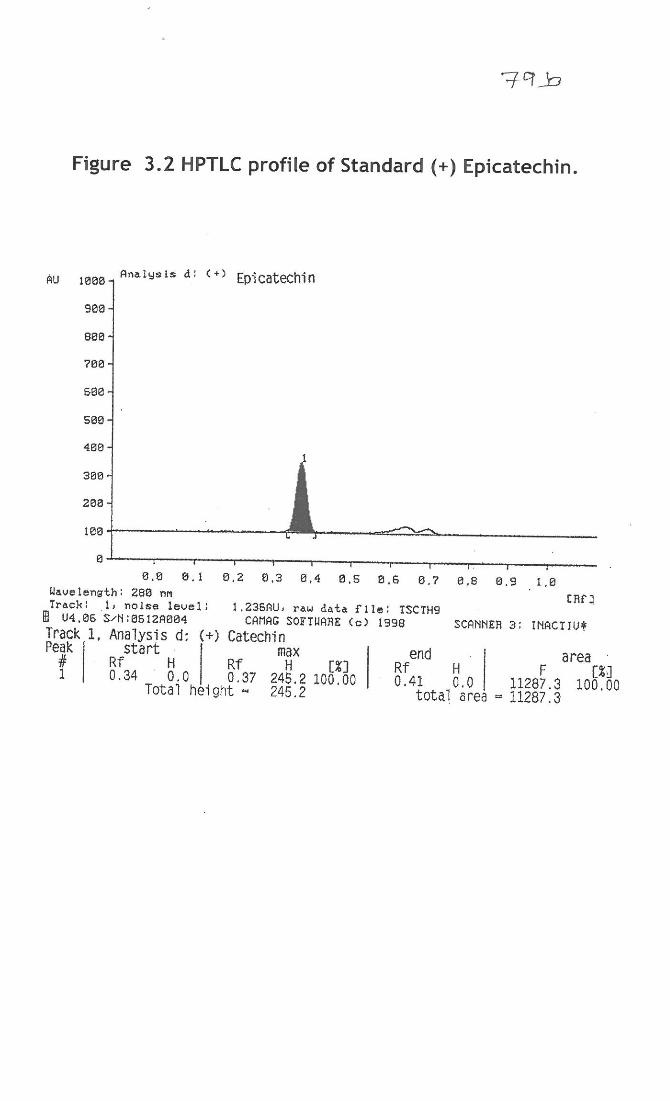
3.3.7 Detection of polyphenols by HPTLC analysis
Polyphenols from M. indica, tannins from L. speciosa and standards (-)
epicatechin, (+) epicatechin) and (±) catechin, were developed on an HPTLC plate with
the solvent system shown in figure 3.1-3.5. The presence of standard (+), (-) epicatechin,
(±) catechin and was confirmed with retardation factor (Rf) 0.34, 0.17 and 0.23 of the
plate at a 380 and 280nm wavelength. The polyphenols showed the presence of (-)
epicatechin, and (+) epicatechin in the respective Rf region, which matched very well
with that of standard. Chromatographic fingerprinting emphasizes an integral formulation
of pharmacologically active and phyto pharmaceutically characteristic components of
samples with similar or different attributions. Quantification of the marker may also
reflect the quality of raw material in general and quantitative composition of other
phytoconstituents in particular. Biomarker profiling is being highlighted in quality
control and standardization of herbal medicine to establish the quality control approaches
with chemoprofiling techniques with the lead from some therapeutically potent medicinal
plants.
The polyphenols of M. indica showed the Rf at 0.34, 0.23 and 0.16 which is
comparable with the standards and the percentage area for the polyphenols were18.84 %,
36.17 % and 4.93 %. Tannins from L. speciosa gave peaks at Rf 0.05, 0.18, 0.38 and 0.57
which shows at a wavelength of 380 nm four different constituents were present which
answered ferric chloride test.

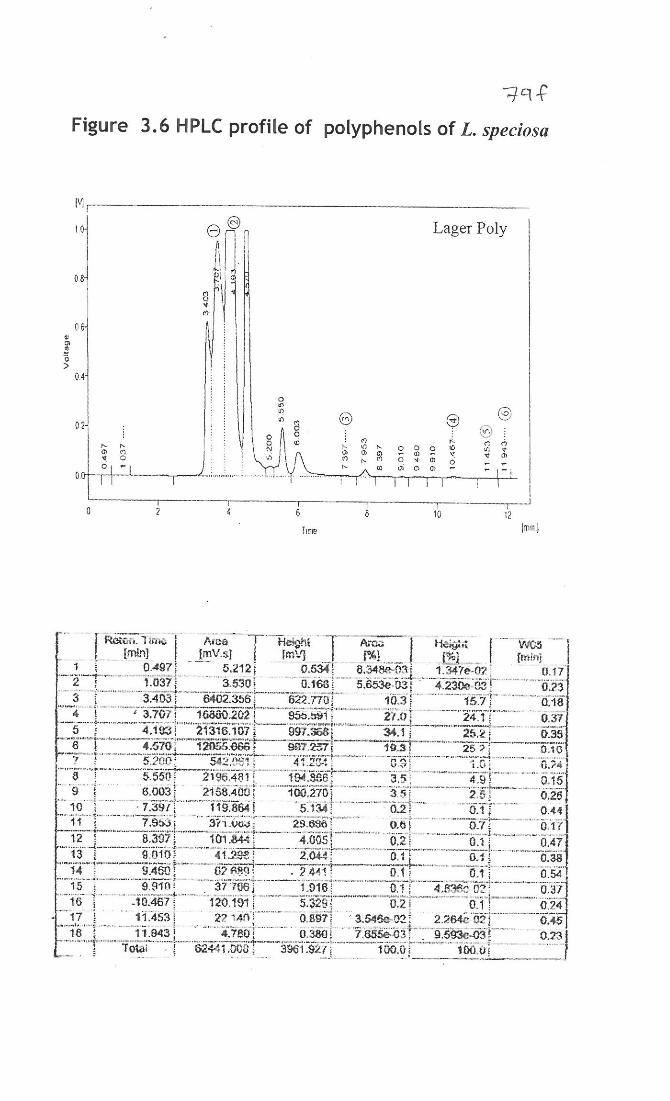
3.3.8 Detection of polyphenols by HPLC analysis
Identification of major polyphenols present in L. speciosa using HPLC,
polyphenols was dissolved in methanol and eighteen peaks were detected and six peaks
were identified as (1)(+) epicatechin, (2)(-)epicatechin, (3)epicatechin gallate,
(4)epigallocatechin gallate, (5) gallocatechin gallate, and (6) ellagic acid was resolved at
retention times (Rt) 3.707, 11.453, 7.397, 10.467, 11.943, 4.193 respectively. The
chromatogram was shown in figure 3.6 which illustrates the separation of
phytoconstituents in this system.
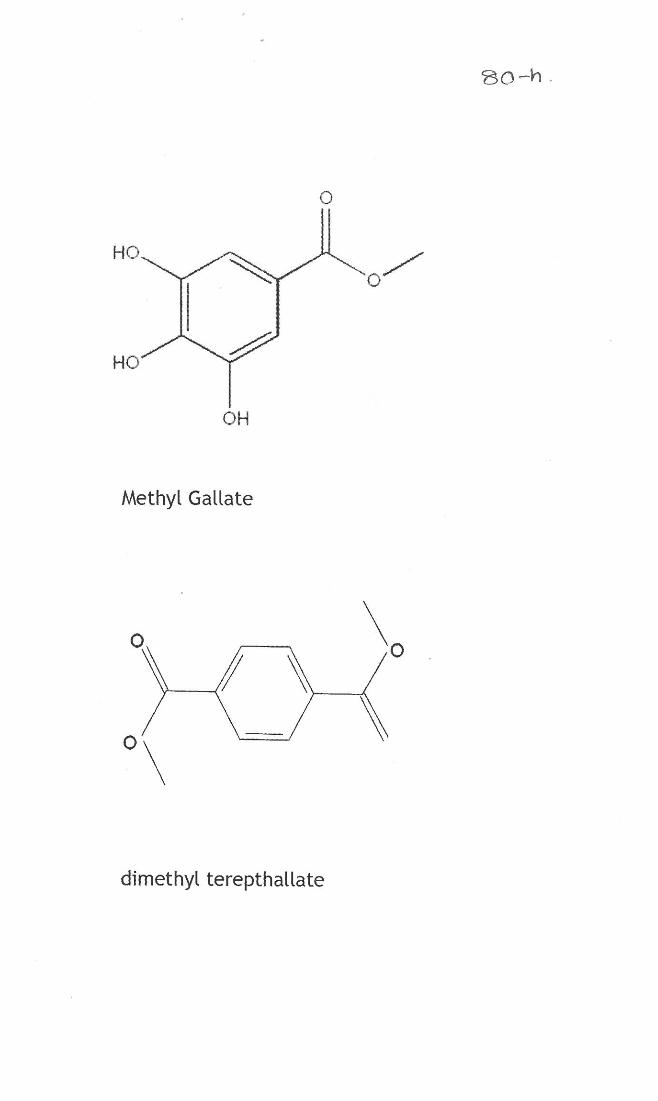
3.3.9 Identification and structural characterisation of compounds
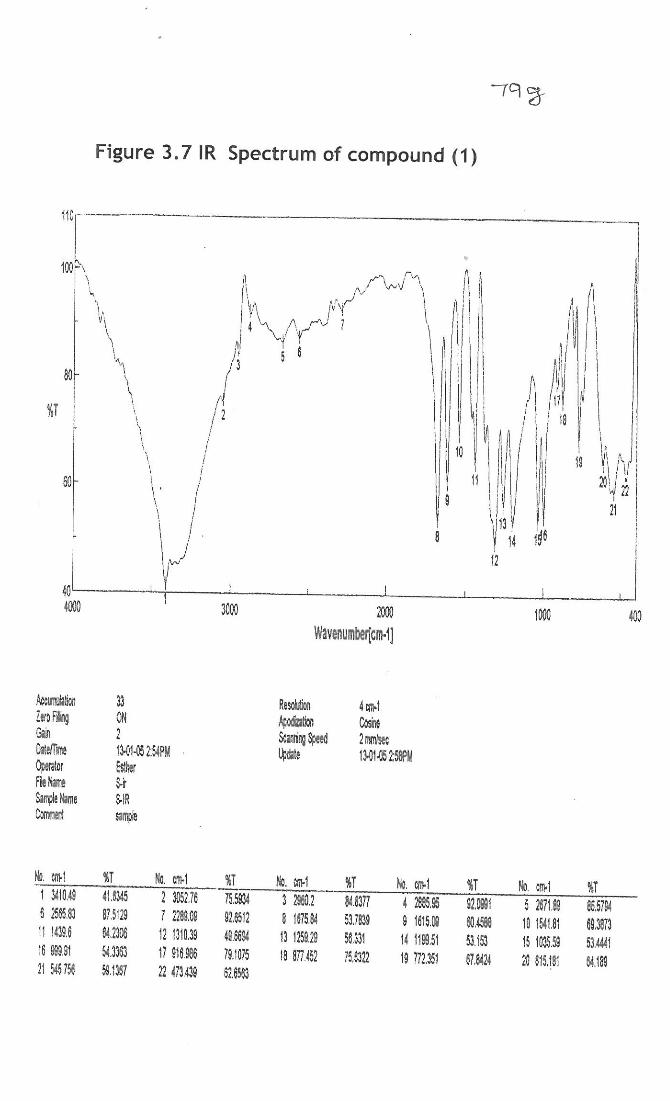
Compound (1)- Methyl gallate
Infrared spectrum: In the IR spectra, compound 3b showed bands at 3400, 1675 and
1615 cm-1 indicating the presence of hydroxyl and aromatic groups, respectively (Fig.
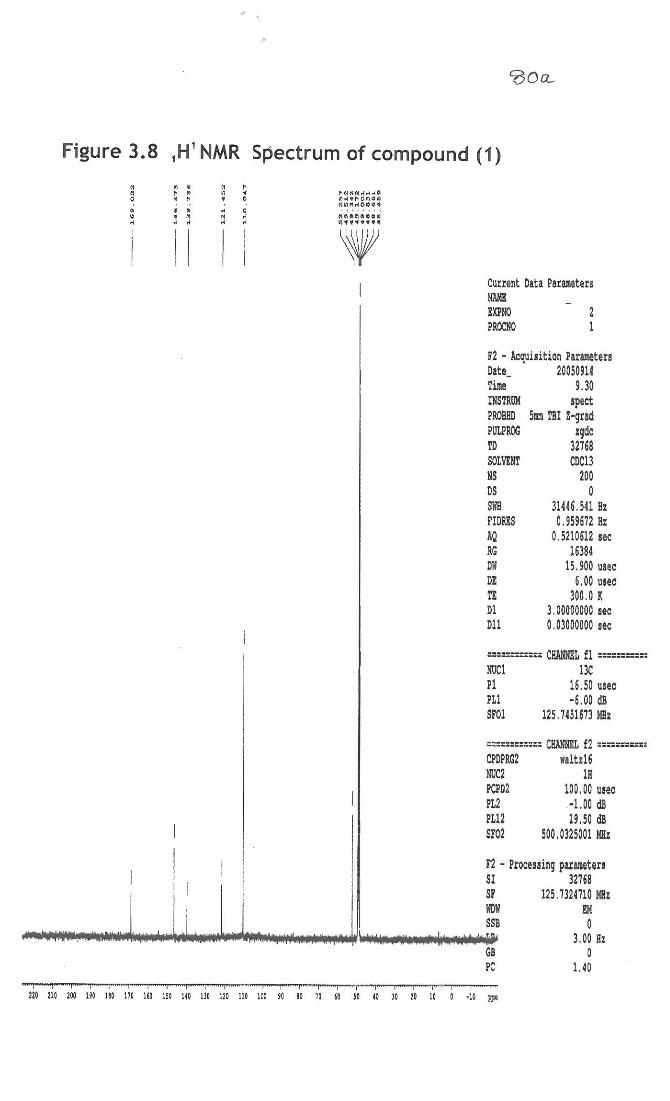
3.7a). 1H and
13C NMR: In 1H NMR spectrum, three protons singlet at 3.3 for ester methyl
group, broad singlet at 9.20 for three protons revealed that presence of three phenolic
hydroxyl groups (Fig 3.8). The same was confirmed by the disappearance of the peaks
when the spectrum was recorded in deutorated methanol as solvent. Singlet at 6.85 for
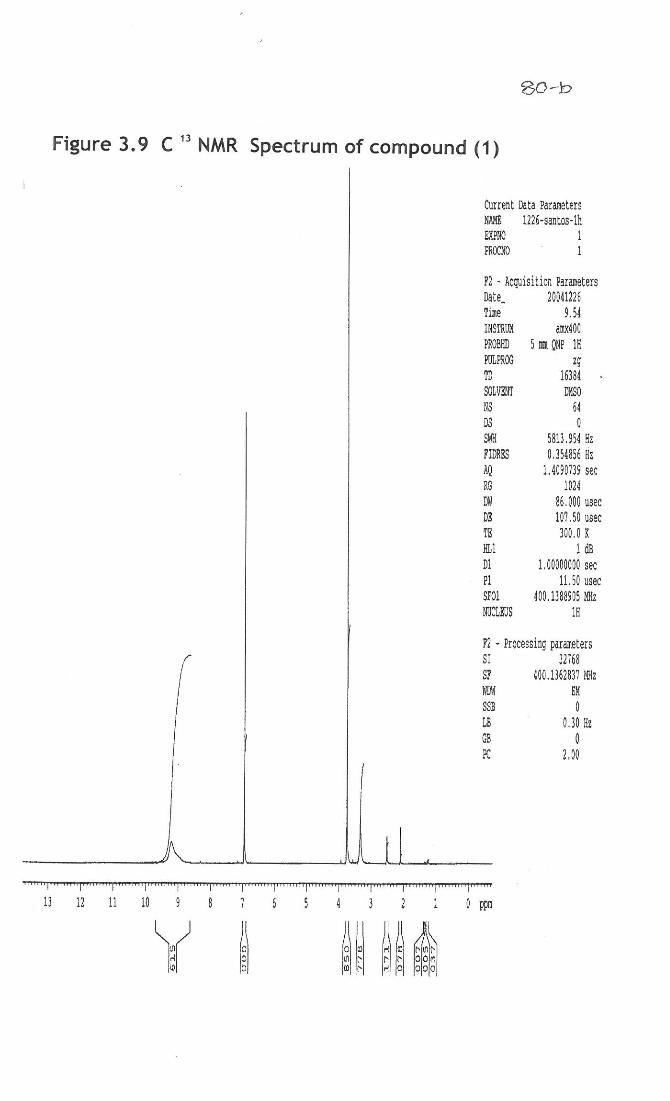
two protons showed that the compound contains a tetra substituted benzene ring. The 13C
NMR data supported the above facts by exhibiting the presence of carbonyl group at
169 and ester methyl group at 52.25. In the aromatic region only four signals were
observed at 146.67 (2 carbons), 139.73, 121.45 and 110.04 (2 carbons), revealing that a
symmetry exist in the molecule.
While placing the hydroxyl groups in the benzene ring, if they are placed in the
ortho positions to the ester group, then these hydroxyl groups will appear in the
downfield region when compared to the other hydroxyl groups due to intermolecular H-
bonding. Here all the three hydroxyl groups appear in the same region indicating that
they are not in the ortho positions. Hence the compound VI is characterized as methyl
gallate, isolated for the first time from this plant. 1H NMR, (ppm): 3.3 (s, 3H, ester methyl group), 6.85 (s, tetrasubstituted benzene ring),
9.20 (Br s, 3H, three phenolic group) (Fig 3.9).


2D NMR: There is only one cross peak in the aromatic region in 13C-1H hetero COSY
recorded in CD3OD indicating that both the aromatic protons belongs to the carbon atoms
at 110.04 (Fig. 3.10). Apart from that the ester methyl group at 3.3 showed a cross peak
with a carbon atom at 52.25.
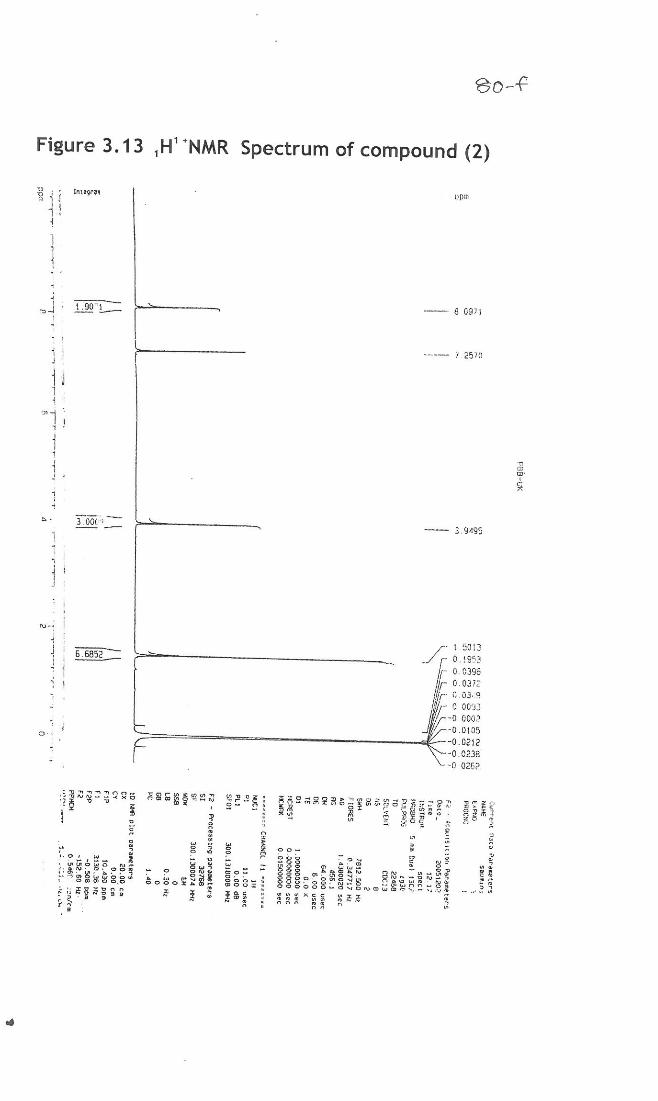
Compound (2)- Dimethyl terepthallate
The IR spectra, compound 5b showed bands at intense peak at 1719 cm-1, 3422
cm-1 1675 cm-1 indicating the presence of ester group, hydroxyl groups, aromatic ring
etc. Mass spectrum showed that molecular mass of the compound was found to be 217.42
which confirms the structure that molecular mass is 194. (Existing as its sodium salt) and
the proton nmr showed the presence of a methoxy group at 3.95 8.0971 shows
aromatic ring that molecule is highly symmetrical and there are peaks at 166, 133,
129, 52 etc and this shows that the molecule is highly symmetrical and the structure
was identified as Dimethyl terepthallate (Fig 3.11-3.14).
3.3.10 Analysis of Essential oils from the flowers of L. speciosa and M. indica- GC-MS
Many constituents were identified by comparing their retention indices with those
of authentic standards available in the author’s laboratory. The fragmentation patterns of
mass spectra were compared with those stored in the spectrometer database using the
NBS54K.L and WILEY.L built in libraries and with those reported in the literature.
The GC-MS chromatogram of the essential oils revealed the presence of
monoterpenes like α-pinene, β-pinene, myrcene, limonene, Cis- β-ocimene, trans- β –
ocimene terpinolene, α-terpineol, cis-dihydrocarvone, trans-dihydrocarvone etc and
sesquiterpenes like caryophyllene oxide, δ-cadinene, β-selinene, γ -cadinene, elemene,
copaene etc were identified through comparison of the fragmentation patterns in the
resulting mass spectra with those published in literature and using mass spectral database
of the gas chromatograph computer is represented as (a,b) in table 3.7.
The M. indica flower oil contains monoterpene hydrocarbons as the major class of
volatiles. The acyclic monoterpenes hydrocarbons were predominant components in
mango and it contains α-pinene (12.32), β-pinene (9.39%), myrcene (13.56%),
terpinolene (5.86%), α-terpineol (5.24%), β-selinene (5.78%), caryophyllene oxide
(4.16%) as major constituents and the other constituents include and L. speciosa also
contains the commonly occurring monoterpenes like α-pinene, β-pinene, myrcene etc. Cis


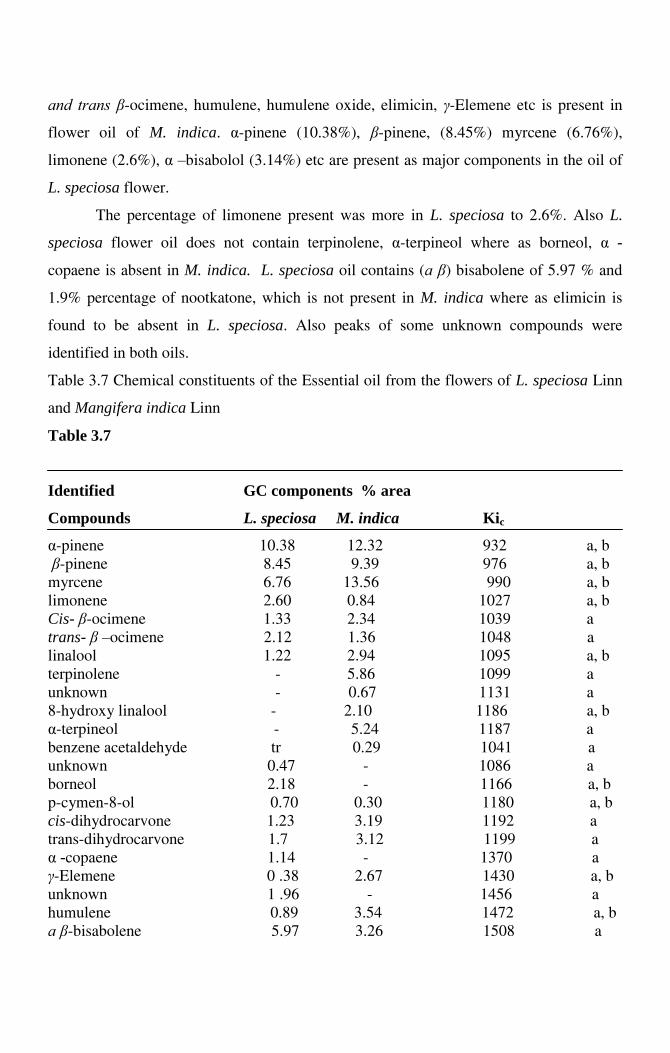
and trans β-ocimene, humulene, humulene oxide, elimicin, γ-Elemene etc is present in
flower oil of M. indica. α-pinene (10.38%), β-pinene, (8.45%) myrcene (6.76%),
limonene (2.6%), α –bisabolol (3.14%) etc are present as major components in the oil of
L. speciosa flower.
The percentage of limonene present was more in L. speciosa to 2.6%. Also L.
speciosa flower oil does not contain terpinolene, α-terpineol where as borneol, α -
copaene is absent in M. indica. L. speciosa oil contains (a β) bisabolene of 5.97 % and
1.9% percentage of nootkatone, which is not present in M. indica where as elimicin is
found to be absent in L. speciosa. Also peaks of some unknown compounds were
identified in both oils.
Table 3.7 Chemical constituents of the Essential oil from the flowers of L. speciosa Linn
and Mangifera indica Linn
Table 3.7
Identified GC components % area
Compounds L. speciosa M. indica Kic
α-pinene 10.38 12.32 932 a, b β-pinene 8.45 9.39 976 a, b myrcene 6.76 13.56 990 a, b limonene 2.60 0.84 1027 a, b Cis- β-ocimene 1.33 2.34 1039 a trans- β –ocimene 2.12 1.36 1048 a linalool 1.22 2.94 1095 a, b terpinolene - 5.86 1099 a unknown - 0.67 1131 a 8-hydroxy linalool - 2.10 1186 a, b α-terpineol - 5.24 1187 a benzene acetaldehyde tr 0.29 1041 a unknown 0.47 - 1086 a borneol 2.18 - 1166 a, b p-cymen-8-ol 0.70 0.30 1180 a, b cis-dihydrocarvone 1.23 3.19 1192 a trans-dihydrocarvone 1.7 3.12 1199 a α -copaene 1.14 - 1370 a γ-Elemene 0 .38 2.67 1430 a, b unknown 1 .96 - 1456 a humulene 0.89 3.54 1472 a, b a β-bisabolene 5.97 3.26 1508 a

γ-cadinene tr 3.34 1513 a β-selinene 3.54 5.78 1519 a, b δ-cadinene 2.47 0.39 1524 a Elimicin - 2.13 1545 a, b caryophyllene oxide 1.69 4.16 1581 a, b Humulene oxide 0.79 3.9 1595 a, b α -bisabolol 3.14 1.24 1681 a, b Unknown - 0.76 1695 a Nootkatone 1.90 - 1742 a, b a- Comparison of mass spectra with MS- libraries and retention times b- Comparison with authentic compounds tr = concentration less than 0.05% c = KI, Kovat’s indices calculated against C8 to C24 n-alkanes on the HP 5MS column
3.4 DISCUSSION
There is a strong need to adopt modern analytical method for quality control of
plant material and herbal remedies. It is important to understand that a plant extract
consists of established classes of chemical compounds. These include the primary
metabolites, secondary metabolites and inorganic salts and metals. Primary metabolites
are compounds like carbohydrates, proteins, lipids etc that are essential for the plant
physiology. Secondary metabolites are compounds which are not essential for the plant
physiology as such but are formed as byproducts in the biochemical pathways. These
include very interesting and useful classes of compounds like alkaloids, flavonoids
coumarins, terpenoids, anthocyanins, etc, and we can utilize these secondary metabolites
for the identification of plant material as our knowledge of chemistry has advanced
sufficiently and through sophisticated analytical techniques we can measure these
compounds qualitatively and quantitatively.
Saponins are glycosides of both triterpenes and sterols and are surface-active
agents with soap like properties. Humans in large quantities daily consume tannins and
polyphenols. Hydrolysable tannins are predominant polyphenols found and account for
greater antioxidant activity. For most triterpenes and sterols produce blue green colour.
Sterols are triterpenes that are based on the cyclopentane perhydro phenanthrene ring
system. At one time sterols were mainly considered to be of animal substances but
recently such compounds have been detected in plant tissues and are called phytosterols,
probably ubiquitous in occurrence in higher plants. The presence of flavonoids and
tannins in all the plants is likely to be responsible for the free radical scavenging effects
observed. Flavonoids and tannins are phenolic compounds and plant phenolics are a
major group of compounds that act as primary antioxidants or free radical scavengers
(Polterait, 1997). Cellulose, lignin and some mineral matter mainly constitute crude fiber
in a plant material. The crude fiber content is a measure of nutritive value, mainly used
for the analysis of crude drugs to detect adulteration. When the crude drug is treated with
acid and alkali, oxidative degradation of the cellulose and lignin occur.
Biomarkers on the other hand are a group of chemical compounds which are in
addition to being unique for that plant material also correlate with biological efficacy.
Fingerprinting in essence which means establishing a characteristic chemical pattern for
the plant material or its cut or fraction or extract.
Application of fingerprinting technique using modern analytical techniques like
HPTLC and HPLC can give high level of quality control of the plant. Chromatographic
fingerprinting should be done with emphasis on identification and quantification of
specific chemical marker compound representative of specific herb. But nevertheless in
its, own the limited sense the technique of chromatographic fingerprinting and specific
marker compounds are very important tools available to modern analyst as an aid for the
total quality control of a medicinal herb.
The characterization of the column isolated compounds from M. indica showed
the presence of compound 1 and 2 namely methyl gallate and Dimethyl terepthallate.
The present study demonstrated the qualitative chemoprofiling of
phytoconstituents (polyphenols and tannins) present and these chromatographic profiles
will be helpful for the standardization of these herbals and the exploration of possible
methods for standardizing their formulations via marker.
The essential oils possess fruity aroma impressions and are due to limonene, -
terpineol, nootkatone etc while sesquiterpenes such as -copaene, caryophyllene oxide
and humulene oxides possess woody odour notes. The essential oils from L.speciosa has
not been explored yet and the activity of the volatiles present in the oil has to be studied
yet.
Related Documents