Physiological responses to acute experimental hypoxia in the air-breathing Indian catfish, Clarias batrachus (Linnaeus, 1758) RATNESH KUMAR TRIPATHI 1 , VINDHYA MOHINDRA 1, * , AKANKSHA SINGH 1 , RAJESH KUMAR 1 , RAHASYA MANI MISHRA 2 and JOY KRUSHNA JENA 1 1 National Bureau of Fish Genetic Resources, Canal Ring Road, P.O. Dilkusha, Lucknow 226 001 2 Awadhesh Pratap Singh University, Rewa 486 001 *Corresponding author (Fax, +91-522-2442403; Email, [email protected]; [email protected]) With an aim to study the mechanism of adaptation to acute hypoxic periods by hypoxia-tolerant catfish, Clarias batrachus, the mass-specific metabolic rate (VO 2 ) along with its hematological parameters, metabolic response and antioxidant enzyme activities were studied. During progressive hypoxia, C. batrachus was found to be an oxyconformer and showed a steady decline in its aquatic oxygen consumption rate. When C. batrachus was exposed for different periods at experimental hypoxia level (0.98±0.1 mg/L, DO), hemoglobin and hematocrit concentrations were increased, along with decrease in mean cellular hemoglobin concentration, which reflected a physiological adaptation to enhance oxygen transport capacity. Significant increase in serum glucose and lactate concentration as well as lactate dehydrogenase activity was observed. Antioxidant enzymes were found to operate independently of one another, while total glutathione concentration was unaffected in any of the tissues across treatments. These observations suggested that hypoxia resulted in the development of oxidative stress and C. batrachus was able to respond through increase in the oxygen carrying capacity, metabolic depression and efficient antioxidant defense system to survive periods of acute hypoxia. [Tripathi RK, Mohindra V, Singh A, Kumar R, Mishra RM and Jena JK 2013 Physiological responses to acute experimental hypoxia in the air- breathing Indian catfish, Clarias batrachus (Linnaeus, 1758). J. Biosci. 38 373–383] DOI 10.1007/s12038-013-9304-0 1. Introduction Hypoxia is an environmental stressor, caused by normally large temporal and spatial variations in oxygen content of water (Damotharan et al. 2010) and influences fish behav- iour, survival, growth and reproduction (Wilhelm-Filho et al. 2005; Braun et al. 2006). Some fish species have evolved the ability to survive low oxygen exposure. However, the extent of tolerance varies among species, depending on severity and duration of hypoxia. A simple metric that is commonly employed to determine the hypoxia tolerance in these fishes is the determination of whole animal O 2 consumption rate (VO 2 ), which is thought to reflect the ability of an organism to extract O 2 from the environment to maintain routine metabolic rate as dissolved oxygen (DO) decreases. A low critical oxygen tension (pCrit) is associated with greater hypoxia tolerance presumably because of improved O 2 up- take and transport to tissues at low water oxygen. Consequently, pCrit has been employed routinely as an important measure of hypoxia tolerance in aquatic organisms including fishes (Speers-Roesch et al. 2012). Under hypoxic conditions animals adopt different mech- anism to tolerate hypoxia. Many of these responses are behavioural, including surface breathing, reduced activity, and/or increased ventilation rate (Timmerman and Chapman 2004). Hematological parameters are considered as patho- physiological indicators and are closely related to the re- sponse of fish to environmental and biological factors (Fernandes and Mazon 2003). In addition to these responses, some species have evolved additional physiological or http://www.ias.ac.in/jbiosci J. Biosci. 38(2), June 2013, 373–383, * Indian Academy of Sciences 373 Keywords. Biochemical parameters; Clarias batrachus; hematological analysis; hypoxia; metabolic rate Published online: 5 March 2013

Welcome message from author
This document is posted to help you gain knowledge. Please leave a comment to let me know what you think about it! Share it to your friends and learn new things together.
Transcript
Physiological responses to acute experimental hypoxiain the air-breathing Indian catfish, Clarias batrachus
(Linnaeus, 1758)
RATNESH KUMAR TRIPATHI1,VINDHYA MOHINDRA
1,*,AKANKSHA SINGH1 ,RAJESH KUMAR1,
RAHASYA MANI MISHRA2 and JOY KRUSHNA JENA1
1National Bureau of Fish Genetic Resources, Canal Ring Road, P.O. Dilkusha,Lucknow 226 001
2Awadhesh Pratap Singh University, Rewa 486 001
*Corresponding author (Fax, +91-522-2442403; Email, [email protected]; [email protected])
With an aim to study the mechanism of adaptation to acute hypoxic periods by hypoxia-tolerant catfish, Clariasbatrachus, the mass-specific metabolic rate (VO2) along with its hematological parameters, metabolic response andantioxidant enzyme activities were studied. During progressive hypoxia, C. batrachus was found to be anoxyconformer and showed a steady decline in its aquatic oxygen consumption rate. When C. batrachus was exposedfor different periods at experimental hypoxia level (0.98±0.1 mg/L, DO), hemoglobin and hematocrit concentrationswere increased, along with decrease in mean cellular hemoglobin concentration, which reflected a physiologicaladaptation to enhance oxygen transport capacity. Significant increase in serum glucose and lactate concentration aswell as lactate dehydrogenase activity was observed. Antioxidant enzymes were found to operate independently ofone another, while total glutathione concentration was unaffected in any of the tissues across treatments. Theseobservations suggested that hypoxia resulted in the development of oxidative stress and C. batrachus was able torespond through increase in the oxygen carrying capacity, metabolic depression and efficient antioxidant defensesystem to survive periods of acute hypoxia.
[Tripathi RK, Mohindra V, Singh A, Kumar R, Mishra RM and Jena JK 2013 Physiological responses to acute experimental hypoxia in the air-breathing Indian catfish, Clarias batrachus (Linnaeus, 1758). J. Biosci. 38 373–383] DOI 10.1007/s12038-013-9304-0
1. Introduction
Hypoxia is an environmental stressor, caused by normallylarge temporal and spatial variations in oxygen content ofwater (Damotharan et al. 2010) and influences fish behav-iour, survival, growth and reproduction (Wilhelm-Filho et al.2005; Braun et al. 2006). Some fish species have evolved theability to survive low oxygen exposure. However, the extentof tolerance varies among species, depending on severityand duration of hypoxia. A simple metric that is commonlyemployed to determine the hypoxia tolerance in these fishesis the determination of whole animal O2 consumption rate(VO2), which is thought to reflect the ability of an organismto extract O2 from the environment to maintain routinemetabolic rate as dissolved oxygen (DO) decreases. A low
critical oxygen tension (pCrit) is associated with greaterhypoxia tolerance presumably because of improved O2 up-take and transport to tissues at low water oxygen.Consequently, pCrit has been employed routinely as animportant measure of hypoxia tolerance in aquatic organismsincluding fishes (Speers-Roesch et al. 2012).
Under hypoxic conditions animals adopt different mech-anism to tolerate hypoxia. Many of these responses arebehavioural, including surface breathing, reduced activity,and/or increased ventilation rate (Timmerman and Chapman2004). Hematological parameters are considered as patho-physiological indicators and are closely related to the re-sponse of fish to environmental and biological factors(Fernandes and Mazon 2003). In addition to these responses,some species have evolved additional physiological or
http://www.ias.ac.in/jbiosci J. Biosci. 38(2), June 2013, 373–383, * Indian Academy of Sciences 373
Keywords. Biochemical parameters; Clarias batrachus; hematological analysis; hypoxia; metabolic rate
Published online: 5 March 2013
molecular mechanisms, and the capacity to undergosustained metabolic depression or to up-regulate anaerobicglycolysis (Hochachka and Somero 2002). Despite the path-way (aerobic or anaerobic) adapted by the fish, partiallyreduced oxygen intermediates, free radicals or ‘reactive ox-idant species’ (ROS) are generated, which can cause oxida-tive stress, damaging lipids, proteins and nucleic acids(Lushchak and Bagnyukova 2007; Mustafa et al. 2011).Oxidative stress develops as a consequence of disturbancebetween generation and elimination of ROS with certainphysiological consequences (Lushchak 2011). The antioxi-dant enzymes, superoxide dismutase (SOD) and catalase(CAT) act to eliminate these ROS produced within the cell(Lushchak 2011), while the processes of gene expression,apoptosis and signalling are affected by glutathione levelwithin cell and tissue (Trachootham et al. 2008).
Species from the family of Clariidae are known for theirair-breathing capabilities (Graham 1997) and their ability tosurvive the adverse conditions of frequent oscillations inoxygen content in their habitat, as they use air-breathingmechanisms to avoid hypoxia (de Graaf and Janssen 1996).The Indian catfish, Clarias batrachus, commonly known as‘Mangur’ is a freshwater air-breathing teleost species, en-demic to the Indian subcontinent and has a fairly commondistribution in freshwaters of the plains throughout India(Chonder 1999). It inhabits wetlands, swamps, rivers pondsand tanks, and is well adapted to adverse ecological condi-tions, such as dissolved oxygen changes in the same habitatduring different seasons of the year (Saha and Ratha 2007;Mohindra et al. 2012). C. batrachus, known to be hypoxia-tolerant, is a facultative air breather at normoxia (Munshi andGhosh 1994), and it was hypothesized for the present studythat the hypoxic conditions will be associated with activationof anaerobic respiration and oxidative stress in C. batrachus.
The present study was undertaken to determine the mass-specific metabolic rate (VO2) of C. batrachus, and to studythe mechanism of adaptation to acute hypoxic periods, itshematological parameters, metabolic response and antioxi-dant enzyme activities were explored.
2. Materials and methods
2.1 Fish maintenance and acclimatization to normoxicconditions
Live fishes (30–80 g, 16–20 cm) were collected from commer-cial catches at Lucknow (26° 55′ N, 80° 59′ E), Uttar Pradesh,India, and were acclimatized at normoxia (5.00±0.1 mg/L,DO), at least for a month in tanks of 100 L capacity filled with25 L of water at 22±3°C. They were fed once a day withprocessed feed of goat liver or flesh and soybean powder.Feeding was stopped 48 h before the start of experiment.
2.2 Determination of gill ventilation rate, mass-specificmetabolic rate (VO2) and critical oxygen tension (pCrit)
under hypoxic conditions
2.2.1 Acute experimental hypoxic conditions: In this study, aspecially designed closed respirometer made of glass wasused, of 7 L capacity with an inlet for the air. A submersiblepump was installed inside to circulate the water and an aquaheater (LifeTech) to maintain the temperature inside.Facilities to record dissolved oxygen (DO) and temperature(DO probe; WTW, CellOx 325) and pH (pH electrode;WTW, SenTix® 41-3) were installed. The experiments wereset up in triplicate: fishes (47.00±2.0 g, 18.1±0.1 cm) werekept in respirometer, completely filled (without access to air)with water (5.00±0.1 mg/L, DO at 25.0°C), individually.The decrease in DO (due to fish own respiration) wasrecorded at 15 min intervals, for a minimum of 16 h durationor until the fish suffocates, and the data was used to calculatemass-specific metabolic rate (VO2) as described below.
2.2.2 Gill ventilation rate: The behaviour of the fishes duringprogressive hypoxia was recorded with video camera (Cyber-shot, DSC HX 200 V, Sony), and the number of gill strokes(ventilator frequency) per min for each fish were counted at aninterval of every 30 min until the suffocation point. Individualgill strokes were easily recognized as flowing movements ofthe operculum as described by Dean (1912).
2.2.3 Mass-specific metabolic rate (VO2) and critical oxygentension (pCrit): VO2, oxygen consumption rate during freemovement under experimental conditions (Saint-Paul,1984), was determined following Cech (1990):
VO2 ¼ DOi � DOfð Þ � Vð Þ M� Tð Þ=ð Þ mgO2 kg= h=ð
where DOi0initial DO concentration, DOf0final DOconcentration, V0volume of respirometer in liters, M0weightof fish in kg and T0time in hours.
For the determination of pCrit, we used individual fishVO2 values, and then individual data points were averaged,and plotted against 16 different DO concentration values,spaced evenly every 1 h. The XY scatter plot was generatedto describe the relationship between VO2 and DO with linearregression modeling using Excel (MS Office 2003), to ob-tain regression equation and r-squared values of the analysis.
2.3 Exposure of fish to experimental hypoxia and samplecollection
The best fit curve to describe the relationship between VO2
and DO was a straight line for pooled values with simplelinear regression modeling (refer Results); the experimentalhypoxic level of 0.98±0.1 mg/L DO (2.39±0.24 kPa) was
374 Ratnesh Kumar Tripathi et al.
J. Biosci. 38(2), June 2013
selected, which was quite below the threshold reported inprevious studies for closely related air-breathing catfish spe-cies. For the experiments, 21 acclimatized fishes (31.0±1.2 g,17.60±0.33 cm) were divided into seven groups of threefishes each. First (Normox) group was kept under normoxia(5.00±0.1 mg/L DO at approximately 25.0°C) in partiallyfilled respirometer with an opened air inlet to have access toair and under constant aeration, as described above. For theexperimental hypoxia, three fishes were held in the closedrespirometer (without access to air-breath), and decrease inDOwas due to fish own respiration until experimental hypoxiclevel (0.98±0.1 mg/L DO), at which DO was furthermaintained by intermittent aeration. Samples of groups, namedPH (progressive hypoxia), were taken when DO reached atexperimental hypoxic level and for others (H1 to H12) after 1,2, 3, 6 and 12 h intervals at experimental hypoxia.
After exposure to hypoxic conditions as well as fornormoxia, blood was collected from caudal vein with non-heparinised syringes, and about 100 μL of whole blood wasquickly transferred to EDTA vials for hemoglobin and he-matocrit determination, and the remaining was allowed toclot at 37°C for 30 min, followed by centrifugation at5000 rpm for 5 min and serum was separated (Dacie andLewis 1991). Further, liver, muscle and gill tissues wereexcised after the animals were euthanized and flash-frozenin liquid nitrogen. Care was taken for the whole operation tolast no longer than 5 min.
2.4 Blood parameters
Hemoglobin [Hb] and hematocrit [Hct] were determinedfrom whole blood, while lactate and glucose were measuredfrom serum. [Hct] was determined following centrifugationof microhematocrit capillary tube filled with blood, at10,000 rpm for 5 min (Assendelft and England 1982).Cyanmethaemoglobin method (Dacie and Lewis 1991) wasused to determine [Hb]. Mean cell haemoglobin concentra-tion (MCHC) was calculated from ratio of [Hb] to fractional[Hct] (Wells and Weber 1991).
Serum glucose was determined by autozyme STAT glucosekit (Accurex Biomedical Pvt Ltd, India) based on an enzymaticmethod that uses glucose oxidase and peroxidase reaction toform a red quinoneimine dye that absorbs maximum at505 nm, measured with Microlab® 300 semiautomatedanalyser (Vilat Scientific, Dieren, the Netherlands). The inten-sity of the colour complex was directly proportional to theconcentration of glucose (mg/dL).
Quantitative determination of lactate was done using LO-POD enzymatic colorimetric kit (Ref: 1001330 Spinreact,Spain). The kit utilizes peroxide function of aminophenazoneand chlorophenol, which forms a red quinone compound,reducing H2O2 formed initially by the oxidation of lactate topyruvate. The absorbance of the red colour compound
measured at 505 nm with Microlab® 300 semiautomatedanalyser (Vilat Scientific, Dieren, the Netherlands) was pro-portional to the lactate concentration (mg/dL).
2.5 Biochemical assays
Prior to assays, liver, muscle and gill tissues were weighed andmechanically disrupted by a teflon pestle motor driver underice-cold bath. Homogenization was performed in appropriatevolume of homogenization buffer (pH 7.0) as recommended inthe kits used, for different assays as given below.
2.5.1 Total glutathione: Total glutathione (GSH) concentrationwas determined in serum, liver, gill and muscle tissues. Tissuelysates were centrifuged at 10,000g for 15 min at 4°C, and thesupernatant was incubated on ice until analyses. All the sampleswere deproteinized before assay and serum samples wereconcentrated by lyophilization. Liver and gill tissue lysateswere used after appropriate dilutions (liver 1:10; Gill 1:5times), while serum and muscle samples were not diluted. Theassay of total glutathione was done using Cayman’s GSHAssaykit (Cat no. 703002, Cayman Chemical Company, MI),following the manufacturer’s protocol. The assay utilizedenzymatic recycling method with glutathione reductase. Thesulphhydryl group of GSH reacted with DTNB, producingTNB. The mixed disulphide GSTNB produced concomitantlywas reduced to GSH by glutathione reductase to recycle GSH.The concentration of GSH in the sample was measured as theabsorbance of TNB, which provides an accurate estimation ofGSH (μM) in the sample. Measurement of the absorbance ofTNB was performed at 405–414 nm with Synergy™ HTELISA reader (BioTek Instruments, Inc USA).
2.5.2 Enzyme assays:
2.5.2.1 Lactate dehydrogenase (LDH; EC 1.1.1.27):Lactate dehydrogenase (LDH) activity was determined inserum, liver, gill and muscle tissues. All tissue lysates werecentrifuged at 10,000g for 15 min at 4°C, and the supernatantwas incubated on ice until analyses. Supernatant of all tissuesamples were diluted (1:10 times) for LDH activity assay. LDHis an oxidoreductase that catalyses the inter-conversion oflactate and pyruvate. Colorimetric kinetic determination ofLDH activity was determined using QuantiChromTM LactateDehydrogenase Kit (Cat No. DLDH-100, BioAssay Systems,USA), following the manufacturer’s protocol. The assay wasbased on the reduction of the tetrazolium salt MTT in a NADH-coupled enzymatic reaction to a reduced form of MTT whichexhibits an absorption maximum at 565 nm, which was deter-mined with Sun Rise A 5082 ELISA plate Reader (TECAN,Salzburg, Austria). The intensity of the purple colour formed isdirectly proportional to the enzyme activity. LDH activity wasreported in international units (μmol NADH oxidized per min)
Responses to acute experimental hypoxia in Clarias batrachus 375
J. Biosci. 38(2), June 2013
per milligram protein, after normalization with estimated totalprotein in milligrams in the respective tissues.
2.5.2.2 Superoxide dismutase (SOD; EC 1.15.1.1):Superoxide dismutase (SOD) activity was determined inserum, liver, gill and muscle tissues. All tissue lysates werecentrifuged at 1500g for 5 min at 4°C, and the supernatantwas incubated on ice until analyses. Only serum sampleswere diluted (1:5 times) for SOD activity assay. The activityof SOD was measured using colorimetric measurementAssay kit (Cat no. 706002, Cayman Chemicals Ltd, USA),following the manufacturer’s protocol. The assay utilizes atetrazolium salt for detection of superoxide radicalsgenerated by xanthine oxidase and hypoxanthine absorbingmaximum at 460 nm, which was determined with Sun RiseA 5082 ELISA plate reader (TECAN, Salzburg, Austria).SOD activity was reported as units per milligram protein.
2.5.2.3 Catalase (CAT; EC 1.11.1.6): Catalase (CAT)activity was determined in serum, liver, gill and muscletissues. All tissue lysates were centrifuged at 10,000g for15 min at 4°C, and the supernatant was incubated on ice untilanalyses. The supernatant of all the tissue samples were notdiluted for CAT activity assay. The colorimetricmeasurement of CAT activity was done using catalaseassay kit (Cat no. 707002, Cayman Chemicals Ltd, USA),following the manufacturer’s protocol. The kit utilizes theperoxide function of CAT for determination of enzymeactivity. The enzyme reacts with methanol in the presenceof H2O2, forming formaldehyde, which upon oxidation withpurald (chromagen) forms a purple colour bicylicheterocyclic compound showing absorbance at 540 nm,which was determined with Sun Rise A 5082 ELISA plateReader (TECAN, Salzburg, Austria). Activity was reportedin units per milligram protein.
2.6 Statistical analysis
All results were expressed as mean±standard deviation (SD)and all the values from hypoxia treated samples were com-pared with that of normoxic conditions. Data were analyzedfor homoscedasticity of variance (Levene’s test) and theserequisites were achieved by log-transformation. The effect ofhypoxia on parameters determined at a single time point(such as those obtained following terminal sampling: hemat-ocrit, hemoglobin, serum lactate, serum glucose, total gluta-thione, superoxide dismutase, catalase and lactatedehyderogenase activity) were analyzed using one-wayANOVA (with control values from fish exposed to normoxicconditions). When differences were indicated, Tukey’s posthoc test was used to determine homogeneous subsets. In allcases, α level of 5% (p<0.05) was selected to signify statis-tically significant differences. All statistical tests wereperformed with SPSS software (version 12.01, 2003).
y = 0.7727x + 0.1757
R2 = 0.9891
0
10
20
30
40
50
60
70
80
0.00 1.00 2.00 3.00 4.00 5.00 6.00
DO (mg/L)
VO
2 (m
g O
2/kg
/h)
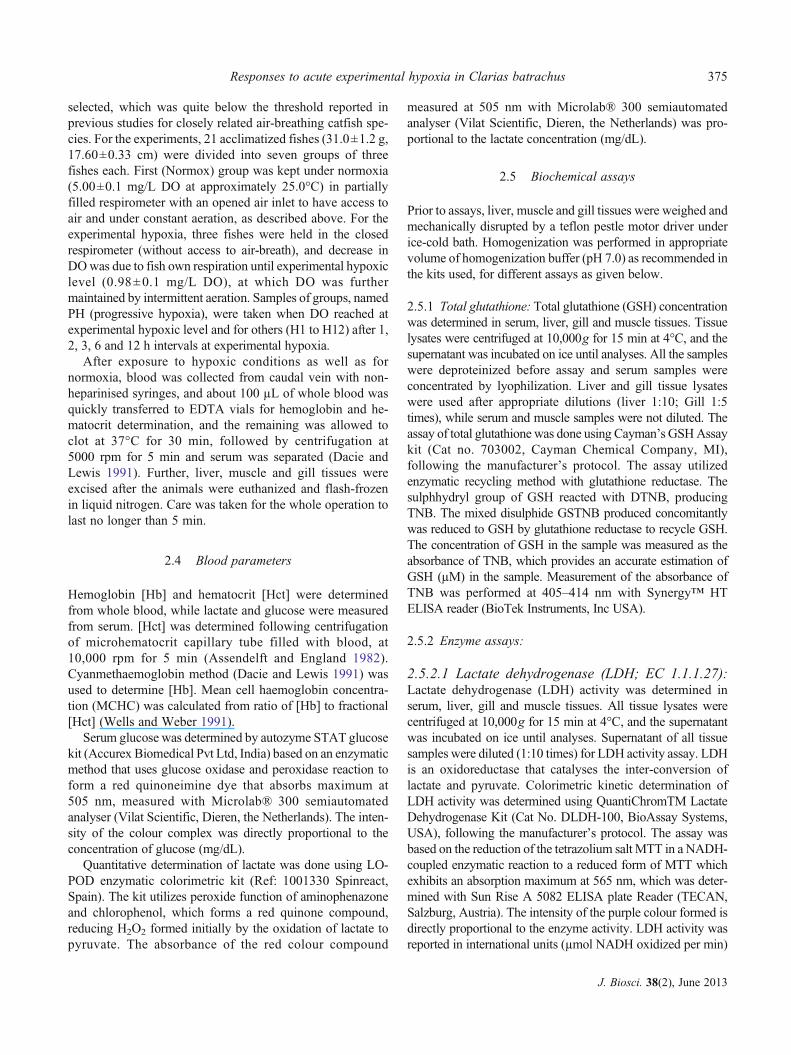
Figure 1. Representative graph showing VO2 versus [O2] curvefor Clarias batrachus respiration with declining dissolved oxygenconcentration. Values are expressed as mean±standard deviation.
Table 1. Quantitative estimation of hematocrit (Hct), hemoglobin (Hb) and mean corpuscular hemoglobin concentration (MCHC) inblood of Clarias batrachus subjected to progressive and acute hypoxia without access to air (at 0.98 mg/L≈18 mmHg) for different timeintervals
Treatments Time period at pCrit (h) Hct (%) Hb (gm%) MCHC (gm%)
Normox 25.0±4.00a 9.83±0.55a 39.8±4.24a
PH 0 18.3±4.73a 8.43±1.10a 47.2±7.12a
H1 1 18.0±2.00b (–28.0%) 9.50±1.81a 53.5±9.81c (+34.4%)
H2 2 20.3±3.21a 7.93±1.31b (–17.3%) 39.0±1.92a
H3 3 22.0±3.61a 8.83±1.38a 40.2±0.78a
H6 6 32.2±0.76b,c (+28.8%) 10.6±0.35c (+8.0%) 32.9±0.42b (–17.2%)
H12 12 41.0±4.00c (+64.0%) 13.5±1.05c (+36.9%) 32.9±0.65b (–17.3%)
[Hct], [Hb] and MCHC values are mean±SD, n03; statistical differences among treatments are indicated by dissimilar letters. Values (%) inbrackets indicate increase (+) or decrease (–) in experimental hypoxia as compared to normoxia. Superscripts a, b, c indicate homogenoussubsets (Tukey’s post hoc test).
376 Ratnesh Kumar Tripathi et al.
J. Biosci. 38(2), June 2013
3. Results
3.1 Responses to acute experimental hypoxia
It was found that in most of the period during experiment,fishes became quiescent and sedentary without noticeableactivity; however, intermittently they exhibited vigorousmovements while coming to the upper portion of respirom-eter to air-breath. Furthermore, no significant difference (p>0.1) was observed in gill ventilation rate (frequency of thegill strokes) between normoxia (58.50±2.12 strokes/min)
and under progressive-hypoxia-exposed fishes (59.22±7.62strokes/min). However, fish attempt to air-breath, i.e. tryingto come up to the surface, was observed at 1.6 mg/L DO(3.98 kPa) under progressive hypoxia.
3.2 Determination of mass-specific metabolic rate (VO2)and pCrit
There was a steady decline in mass-specific metabolicrate (VO2) of C. batrachus (figure 1) with decreasingDO concentration, where no point of sharp decrease inVO2 with varying DO was observed. When calculatedfrom start of the experiment to 16 h or till suffocation offish, VO2 reduced from 65.6±3.52 mgO2/kg/h at4.8±0.1 mg/L (11.99±0.24 kPa) to 6.45±1.35 mgO2/kg/h at0.37±0.1 mg/L (0.87±0.24 kPa) at 25°C. The best fit curve to
0
10
20
30
40
50
60
70
Normox PH H1 H2 H3 H6 H12
Hypoxic treatments
Co
nce
ntr
atio
n
HemoglobinHematocritMCHC
*
*
*
* **
*
**
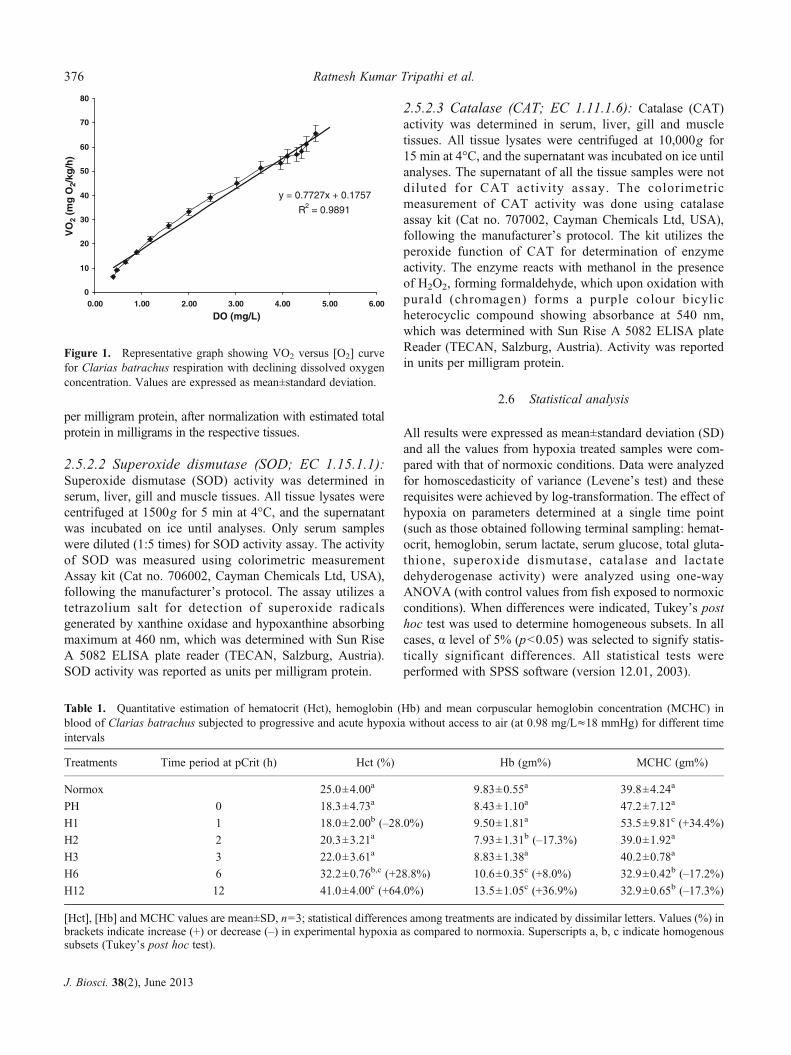
Figure 2. Hematological parameters of Clarias batrachus, meanhemoglobin concentration (gram per deciliter), mean hematocritconcentration (per deciliter) and mean cell hemoglobin concentra-tion (gram per deciliter) in normoxia (Normox), progressive hyp-oxia (PH) and after 1 h (H1), 2 h (H2), 3 h (H3), 6 h (H6) and 12 h(H12) at 0.98±0.1 mg/L, dissolved oxygen. Mean±standard devia-tion. Asterisk (*) represents significant differences (p<0.05) betweennormoxia and acute hypoxia.
Table 2. Quantitative estimation of glucose and lactate concen-tration in serum of Clarias batrachus subjected to progressive andacute hypoxia without access to air (at 0.98 mg/L≈18 mmHg) fordifferent time intervals
Treatments Serum glucose (mg%) Serum lactate (mg%)
Normox 54.4±7.63a 46.0±0.27b
PH 143±23.4b,c (+) 129±0.25c (+)
H1 123±33.3b,c (+) 89.0±0.29b
H2 187±73.6c,d (+) 72.0±0.35b
H3 58.3±10.7a 56.0±0.10b
H6 97.3±25.7b (+) 18.0±0.33a (–)
H12 55.3±9.29a 46.3±0.35b
Serum glucose and serum lactate values are mean±SD, n03; statis-tical differences among treatments are indicated by dissimilar let-ters. Whereas (+) or (–) represents significant increase or decreasein experimental hypoxia as compared to normoxia. Superscripts a,b, c indicate homogenous subsets (Tukey’s post hoc test).
0
50
100
150
200
250
300
Normox PH H1 H2 H3 H6 H12
Hypoxic treatments
[Glu
cose
] (m
g %
)
** *
*
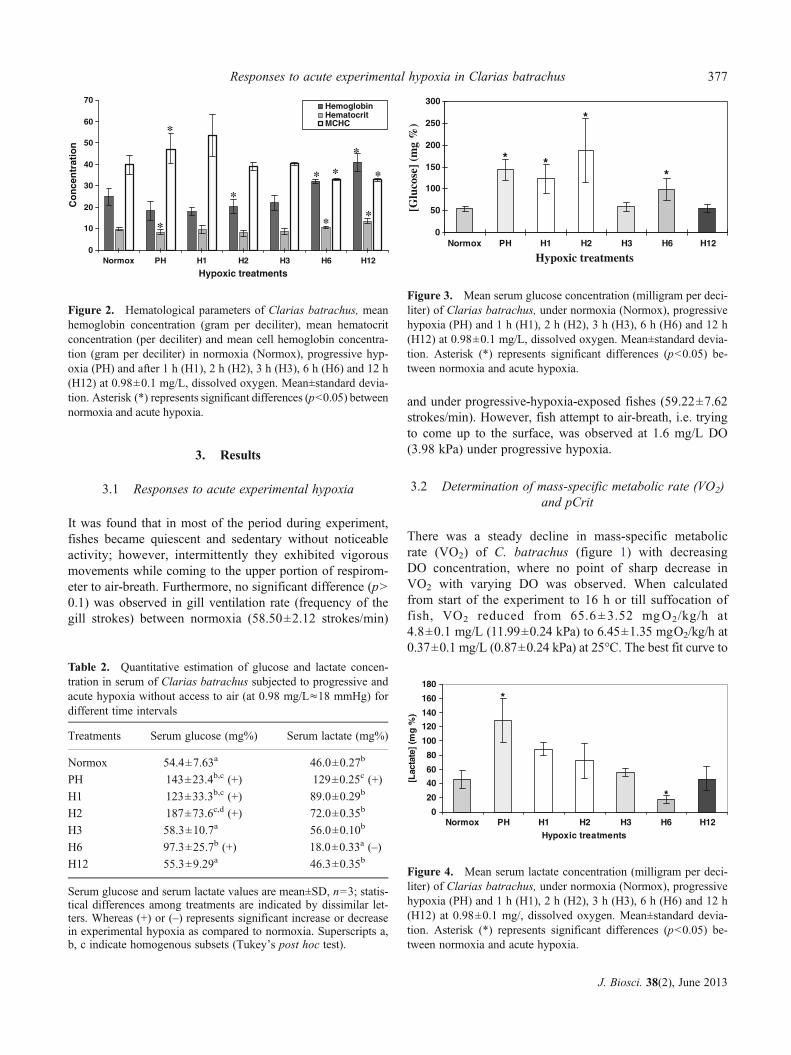
Figure 3. Mean serum glucose concentration (milligram per deci-liter) of Clarias batrachus, under normoxia (Normox), progressivehypoxia (PH) and 1 h (H1), 2 h (H2), 3 h (H3), 6 h (H6) and 12 h(H12) at 0.98±0.1 mg/L, dissolved oxygen. Mean±standard devia-tion. Asterisk (*) represents significant differences (p<0.05) be-tween normoxia and acute hypoxia.
0
20
40
60
80
100
120
140
160
180
Normox PH H1 H2 H3 H6 H12Hypoxic treatments
[Lac
tate
] (m
g %
)
*
*
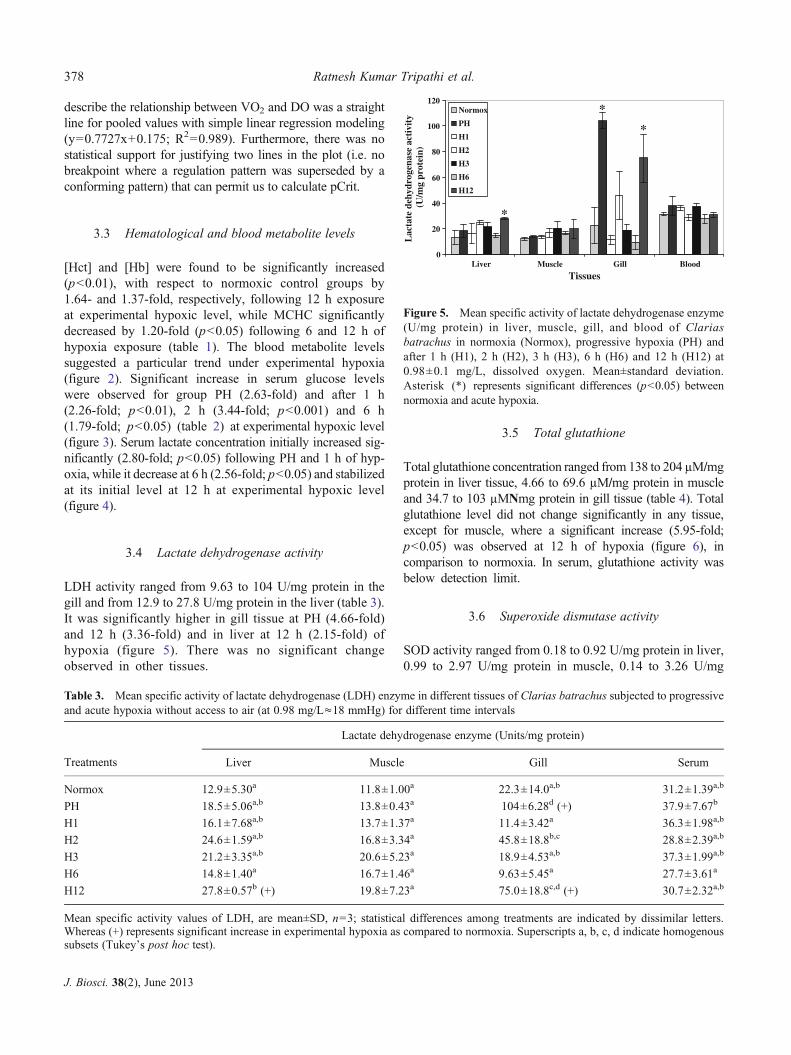
Figure 4. Mean serum lactate concentration (milligram per deci-liter) of Clarias batrachus, under normoxia (Normox), progressivehypoxia (PH) and 1 h (H1), 2 h (H2), 3 h (H3), 6 h (H6) and 12 h(H12) at 0.98±0.1 mg/, dissolved oxygen. Mean±standard devia-tion. Asterisk (*) represents significant differences (p<0.05) be-tween normoxia and acute hypoxia.
Responses to acute experimental hypoxia in Clarias batrachus 377
J. Biosci. 38(2), June 2013
describe the relationship between VO2 and DO was a straightline for pooled values with simple linear regression modeling(y00.7727x+0.175; R200.989). Furthermore, there was nostatistical support for justifying two lines in the plot (i.e. nobreakpoint where a regulation pattern was superseded by aconforming pattern) that can permit us to calculate pCrit.
3.3 Hematological and blood metabolite levels
[Hct] and [Hb] were found to be significantly increased(p<0.01), with respect to normoxic control groups by1.64- and 1.37-fold, respectively, following 12 h exposureat experimental hypoxic level, while MCHC significantlydecreased by 1.20-fold (p<0.05) following 6 and 12 h ofhypoxia exposure (table 1). The blood metabolite levelssuggested a particular trend under experimental hypoxia(figure 2). Significant increase in serum glucose levelswere observed for group PH (2.63-fold) and after 1 h(2.26-fold; p<0.01), 2 h (3.44-fold; p<0.001) and 6 h(1.79-fold; p<0.05) (table 2) at experimental hypoxic level(figure 3). Serum lactate concentration initially increased sig-nificantly (2.80-fold; p<0.05) following PH and 1 h of hyp-oxia, while it decrease at 6 h (2.56-fold; p<0.05) and stabilizedat its initial level at 12 h at experimental hypoxic level(figure 4).
3.4 Lactate dehydrogenase activity
LDH activity ranged from 9.63 to 104 U/mg protein in thegill and from 12.9 to 27.8 U/mg protein in the liver (table 3).It was significantly higher in gill tissue at PH (4.66-fold)and 12 h (3.36-fold) and in liver at 12 h (2.15-fold) ofhypoxia (figure 5). There was no significant changeobserved in other tissues.
3.5 Total glutathione
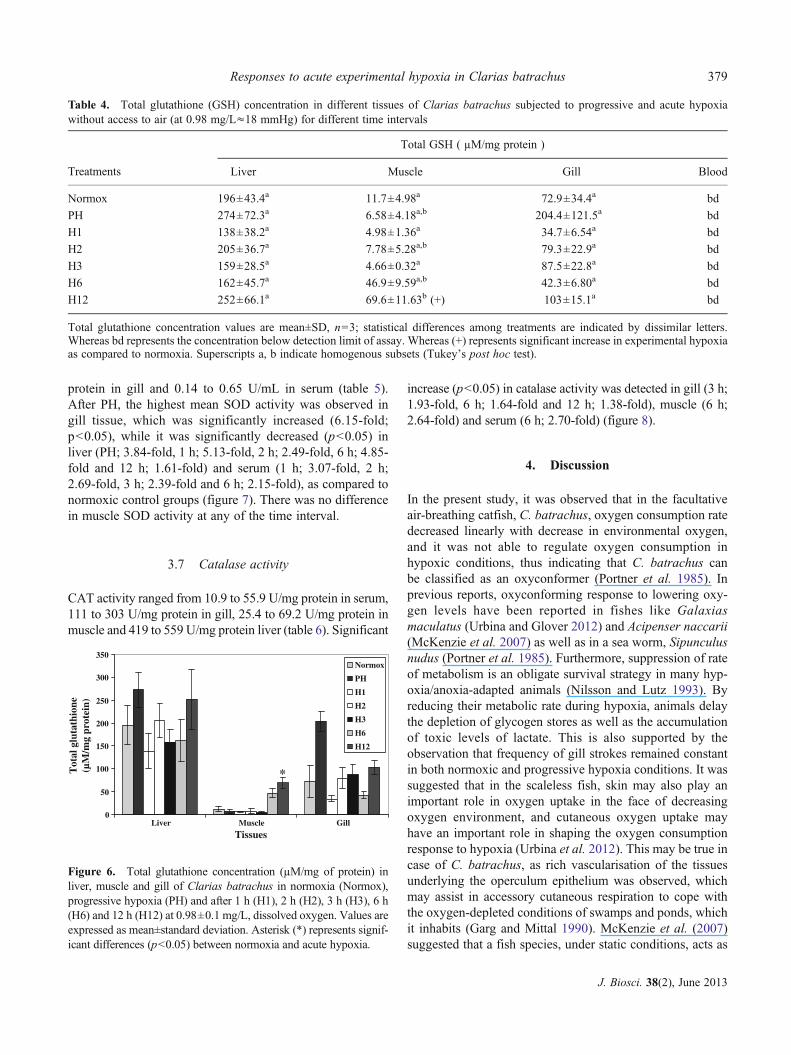
Total glutathione concentration ranged from 138 to 204μM/mgprotein in liver tissue, 4.66 to 69.6 μM/mg protein in muscleand 34.7 to 103 μMNmg protein in gill tissue (table 4). Totalglutathione level did not change significantly in any tissue,except for muscle, where a significant increase (5.95-fold;p<0.05) was observed at 12 h of hypoxia (figure 6), incomparison to normoxia. In serum, glutathione activity wasbelow detection limit.
3.6 Superoxide dismutase activity
SOD activity ranged from 0.18 to 0.92 U/mg protein in liver,0.99 to 2.97 U/mg protein in muscle, 0.14 to 3.26 U/mg
Table 3. Mean specific activity of lactate dehydrogenase (LDH) enzyme in different tissues of Clarias batrachus subjected to progressiveand acute hypoxia without access to air (at 0.98 mg/L≈18 mmHg) for different time intervals
Treatments
Lactate dehydrogenase enzyme (Units/mg protein)
Liver Muscle Gill Serum
Normox 12.9±5.30a 11.8±1.00a 22.3±14.0a,b 31.2±1.39a,b
PH 18.5±5.06a,b 13.8±0.43a 104±6.28d (+) 37.9±7.67b
H1 16.1±7.68a,b 13.7±1.37a 11.4±3.42a 36.3±1.98a,b
H2 24.6±1.59a,b 16.8±3.34a 45.8±18.8b,c 28.8±2.39a,b
H3 21.2±3.35a,b 20.6±5.23a 18.9±4.53a,b 37.3±1.99a,b
H6 14.8±1.40a 16.7±1.46a 9.63±5.45a 27.7±3.61a
H12 27.8±0.57b (+) 19.8±7.23a 75.0±18.8c,d (+) 30.7±2.32a,b
Mean specific activity values of LDH, are mean±SD, n03; statistical differences among treatments are indicated by dissimilar letters.Whereas (+) represents significant increase in experimental hypoxia as compared to normoxia. Superscripts a, b, c, d indicate homogenoussubsets (Tukey’s post hoc test).
0
20
40
60
80
100
120
Liver Muscle Gill Blood
Tissues
Lac
tate
deh
ydro
gena
se a
ctiv
ity
(U/m
g pr
otei
n)
Normox
PH
H1
H2
H3
H6
H12
*
*
*
Figure 5. Mean specific activity of lactate dehydrogenase enzyme(U/mg protein) in liver, muscle, gill, and blood of Clariasbatrachus in normoxia (Normox), progressive hypoxia (PH) andafter 1 h (H1), 2 h (H2), 3 h (H3), 6 h (H6) and 12 h (H12) at0.98±0.1 mg/L, dissolved oxygen. Mean±standard deviation.Asterisk (*) represents significant differences (p<0.05) betweennormoxia and acute hypoxia.
378 Ratnesh Kumar Tripathi et al.
J. Biosci. 38(2), June 2013
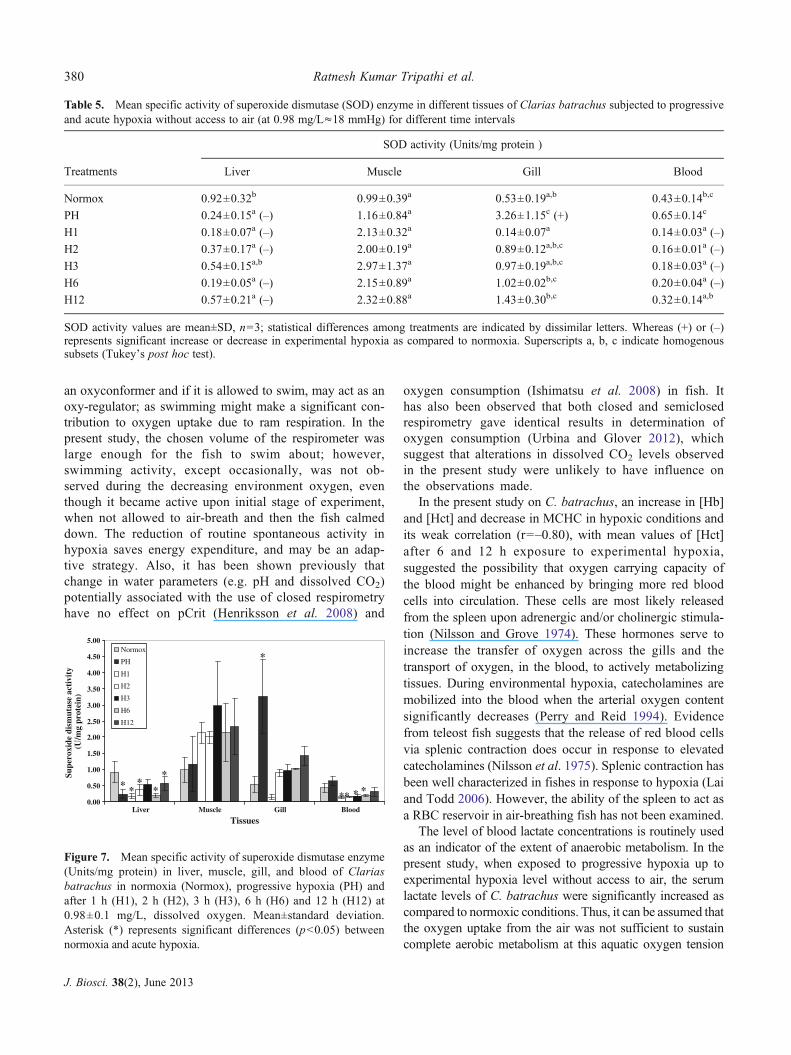
protein in gill and 0.14 to 0.65 U/mL in serum (table 5).After PH, the highest mean SOD activity was observed ingill tissue, which was significantly increased (6.15-fold;p<0.05), while it was significantly decreased (p<0.05) inliver (PH; 3.84-fold, 1 h; 5.13-fold, 2 h; 2.49-fold, 6 h; 4.85-fold and 12 h; 1.61-fold) and serum (1 h; 3.07-fold, 2 h;2.69-fold, 3 h; 2.39-fold and 6 h; 2.15-fold), as compared tonormoxic control groups (figure 7). There was no differencein muscle SOD activity at any of the time interval.
3.7 Catalase activity
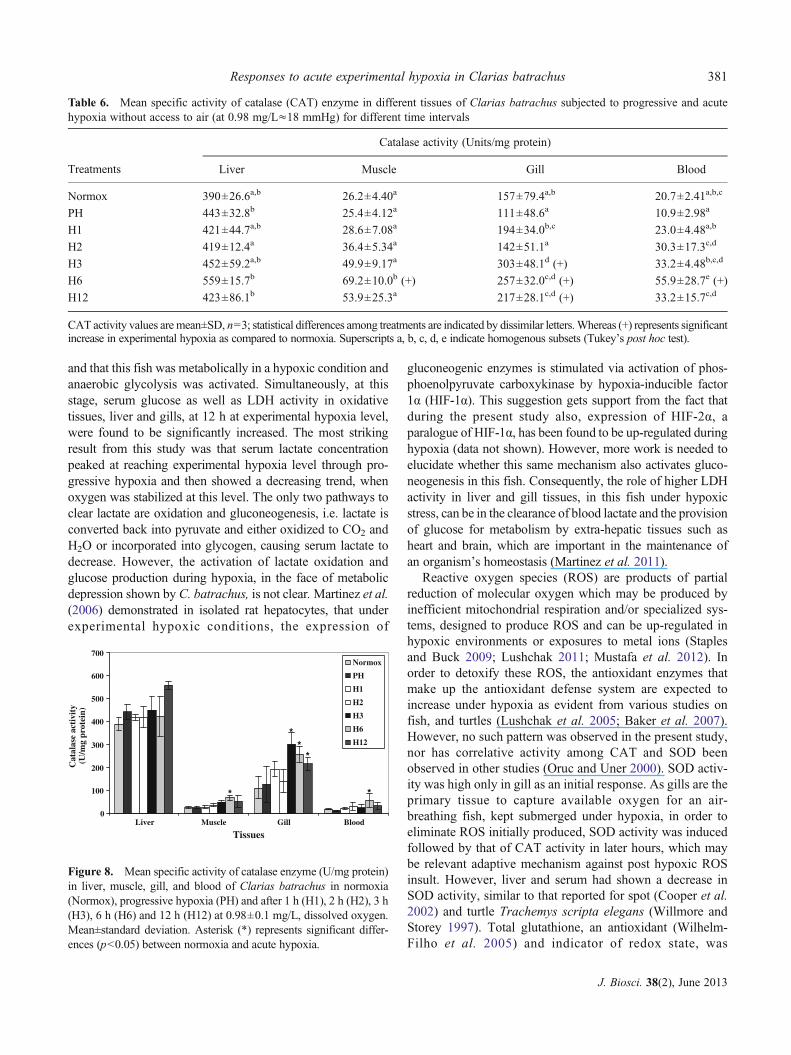
CAT activity ranged from 10.9 to 55.9 U/mg protein in serum,111 to 303 U/mg protein in gill, 25.4 to 69.2 U/mg protein inmuscle and 419 to 559 U/mg protein liver (table 6). Significant
increase (p<0.05) in catalase activity was detected in gill (3 h;1.93-fold, 6 h; 1.64-fold and 12 h; 1.38-fold), muscle (6 h;2.64-fold) and serum (6 h; 2.70-fold) (figure 8).
4. Discussion
In the present study, it was observed that in the facultativeair-breathing catfish, C. batrachus, oxygen consumption ratedecreased linearly with decrease in environmental oxygen,and it was not able to regulate oxygen consumption inhypoxic conditions, thus indicating that C. batrachus canbe classified as an oxyconformer (Portner et al. 1985). Inprevious reports, oxyconforming response to lowering oxy-gen levels have been reported in fishes like Galaxiasmaculatus (Urbina and Glover 2012) and Acipenser naccarii(McKenzie et al. 2007) as well as in a sea worm, Sipunculusnudus (Portner et al. 1985). Furthermore, suppression of rateof metabolism is an obligate survival strategy in many hyp-oxia/anoxia-adapted animals (Nilsson and Lutz 1993). Byreducing their metabolic rate during hypoxia, animals delaythe depletion of glycogen stores as well as the accumulationof toxic levels of lactate. This is also supported by theobservation that frequency of gill strokes remained constantin both normoxic and progressive hypoxia conditions. It wassuggested that in the scaleless fish, skin may also play animportant role in oxygen uptake in the face of decreasingoxygen environment, and cutaneous oxygen uptake mayhave an important role in shaping the oxygen consumptionresponse to hypoxia (Urbina et al. 2012). This may be true incase of C. batrachus, as rich vascularisation of the tissuesunderlying the operculum epithelium was observed, whichmay assist in accessory cutaneous respiration to cope withthe oxygen-depleted conditions of swamps and ponds, whichit inhabits (Garg and Mittal 1990). McKenzie et al. (2007)suggested that a fish species, under static conditions, acts as
Table 4. Total glutathione (GSH) concentration in different tissues of Clarias batrachus subjected to progressive and acute hypoxiawithout access to air (at 0.98 mg/L≈18 mmHg) for different time intervals
Treatments
Total GSH ( μM/mg protein )
Liver Muscle Gill Blood
Normox 196±43.4a 11.7±4.98a 72.9±34.4a bd
PH 274±72.3a 6.58±4.18a,b 204.4±121.5a bd
H1 138±38.2a 4.98±1.36a 34.7±6.54a bd
H2 205±36.7a 7.78±5.28a,b 79.3±22.9a bd
H3 159±28.5a 4.66±0.32a 87.5±22.8a bd
H6 162±45.7a 46.9±9.59a,b 42.3±6.80a bd
H12 252±66.1a 69.6±11.63b (+) 103±15.1a bd
Total glutathione concentration values are mean±SD, n03; statistical differences among treatments are indicated by dissimilar letters.Whereas bd represents the concentration below detection limit of assay. Whereas (+) represents significant increase in experimental hypoxiaas compared to normoxia. Superscripts a, b indicate homogenous subsets (Tukey’s post hoc test).
0
50
100
150
200
250
300
350
Liver Muscle Gill
Tissues
Tot
al g
luta
thio
ne(µ
M/m
g pr
otei
n)
Normox
PH
H1
H2
H3
H6
H12
*
Figure 6. Total glutathione concentration (μM/mg of protein) inliver, muscle and gill of Clarias batrachus in normoxia (Normox),progressive hypoxia (PH) and after 1 h (H1), 2 h (H2), 3 h (H3), 6 h(H6) and 12 h (H12) at 0.98±0.1 mg/L, dissolved oxygen. Values areexpressed as mean±standard deviation. Asterisk (*) represents signif-icant differences (p<0.05) between normoxia and acute hypoxia.
Responses to acute experimental hypoxia in Clarias batrachus 379
J. Biosci. 38(2), June 2013
an oxyconformer and if it is allowed to swim, may act as anoxy-regulator; as swimming might make a significant con-tribution to oxygen uptake due to ram respiration. In thepresent study, the chosen volume of the respirometer waslarge enough for the fish to swim about; however,swimming activity, except occasionally, was not ob-served during the decreasing environment oxygen, eventhough it became active upon initial stage of experiment,when not allowed to air-breath and then the fish calmeddown. The reduction of routine spontaneous activity inhypoxia saves energy expenditure, and may be an adap-tive strategy. Also, it has been shown previously thatchange in water parameters (e.g. pH and dissolved CO2)potentially associated with the use of closed respirometryhave no effect on pCrit (Henriksson et al. 2008) and
oxygen consumption (Ishimatsu et al. 2008) in fish. Ithas also been observed that both closed and semiclosedrespirometry gave identical results in determination ofoxygen consumption (Urbina and Glover 2012), whichsuggest that alterations in dissolved CO2 levels observedin the present study were unlikely to have influence onthe observations made.
In the present study on C. batrachus, an increase in [Hb]and [Hct] and decrease in MCHC in hypoxic conditions andits weak correlation (r0–0.80), with mean values of [Hct]after 6 and 12 h exposure to experimental hypoxia,suggested the possibility that oxygen carrying capacity ofthe blood might be enhanced by bringing more red bloodcells into circulation. These cells are most likely releasedfrom the spleen upon adrenergic and/or cholinergic stimula-tion (Nilsson and Grove 1974). These hormones serve toincrease the transfer of oxygen across the gills and thetransport of oxygen, in the blood, to actively metabolizingtissues. During environmental hypoxia, catecholamines aremobilized into the blood when the arterial oxygen contentsignificantly decreases (Perry and Reid 1994). Evidencefrom teleost fish suggests that the release of red blood cellsvia splenic contraction does occur in response to elevatedcatecholamines (Nilsson et al. 1975). Splenic contraction hasbeen well characterized in fishes in response to hypoxia (Laiand Todd 2006). However, the ability of the spleen to act asa RBC reservoir in air-breathing fish has not been examined.
The level of blood lactate concentrations is routinely usedas an indicator of the extent of anaerobic metabolism. In thepresent study, when exposed to progressive hypoxia up toexperimental hypoxia level without access to air, the serumlactate levels of C. batrachus were significantly increased ascompared to normoxic conditions. Thus, it can be assumed thatthe oxygen uptake from the air was not sufficient to sustaincomplete aerobic metabolism at this aquatic oxygen tension
Table 5. Mean specific activity of superoxide dismutase (SOD) enzyme in different tissues of Clarias batrachus subjected to progressiveand acute hypoxia without access to air (at 0.98 mg/L≈18 mmHg) for different time intervals
Treatments
SOD activity (Units/mg protein )
Liver Muscle Gill Blood
Normox 0.92±0.32b 0.99±0.39a 0.53±0.19a,b 0.43±0.14b,c
PH 0.24±0.15a (–) 1.16±0.84a 3.26±1.15c (+) 0.65±0.14c
H1 0.18±0.07a (–) 2.13±0.32a 0.14±0.07a 0.14±0.03a (–)
H2 0.37±0.17a (–) 2.00±0.19a 0.89±0.12a,b,c 0.16±0.01a (–)
H3 0.54±0.15a,b 2.97±1.37a 0.97±0.19a,b,c 0.18±0.03a (–)
H6 0.19±0.05a (–) 2.15±0.89a 1.02±0.02b,c 0.20±0.04a (–)
H12 0.57±0.21a (–) 2.32±0.88a 1.43±0.30b,c 0.32±0.14a,b
SOD activity values are mean±SD, n03; statistical differences among treatments are indicated by dissimilar letters. Whereas (+) or (–)represents significant increase or decrease in experimental hypoxia as compared to normoxia. Superscripts a, b, c indicate homogenoussubsets (Tukey’s post hoc test).
0.00
0.50
1.00
1.50
2.00
2.50
3.00
3.50
4.00
4.50
5.00
Liver Muscle Gill Blood
Tissues
Supe
roxi
de d
ism
utas
e ac
tivi
ty
(U/m
g pr
otei
n)
Normox
PH
H1
H2
H3
H6
H12
* **
*
*
*
** * *
Figure 7. Mean specific activity of superoxide dismutase enzyme(Units/mg protein) in liver, muscle, gill, and blood of Clariasbatrachus in normoxia (Normox), progressive hypoxia (PH) andafter 1 h (H1), 2 h (H2), 3 h (H3), 6 h (H6) and 12 h (H12) at0.98±0.1 mg/L, dissolved oxygen. Mean±standard deviation.Asterisk (*) represents significant differences (p<0.05) betweennormoxia and acute hypoxia.
380 Ratnesh Kumar Tripathi et al.
J. Biosci. 38(2), June 2013
and that this fish was metabolically in a hypoxic condition andanaerobic glycolysis was activated. Simultaneously, at thisstage, serum glucose as well as LDH activity in oxidativetissues, liver and gills, at 12 h at experimental hypoxia level,were found to be significantly increased. The most strikingresult from this study was that serum lactate concentrationpeaked at reaching experimental hypoxia level through pro-gressive hypoxia and then showed a decreasing trend, whenoxygen was stabilized at this level. The only two pathways toclear lactate are oxidation and gluconeogenesis, i.e. lactate isconverted back into pyruvate and either oxidized to CO2 andH2O or incorporated into glycogen, causing serum lactate todecrease. However, the activation of lactate oxidation andglucose production during hypoxia, in the face of metabolicdepression shown by C. batrachus, is not clear.Martinez et al.(2006) demonstrated in isolated rat hepatocytes, that underexperimental hypoxic conditions, the expression of
gluconeogenic enzymes is stimulated via activation of phos-phoenolpyruvate carboxykinase by hypoxia-inducible factor1α (HIF-1α). This suggestion gets support from the fact thatduring the present study also, expression of HIF-2α, aparalogue of HIF-1α, has been found to be up-regulated duringhypoxia (data not shown). However, more work is needed toelucidate whether this same mechanism also activates gluco-neogenesis in this fish. Consequently, the role of higher LDHactivity in liver and gill tissues, in this fish under hypoxicstress, can be in the clearance of blood lactate and the provisionof glucose for metabolism by extra-hepatic tissues such asheart and brain, which are important in the maintenance ofan organism’s homeostasis (Martinez et al. 2011).
Reactive oxygen species (ROS) are products of partialreduction of molecular oxygen which may be produced byinefficient mitochondrial respiration and/or specialized sys-tems, designed to produce ROS and can be up-regulated inhypoxic environments or exposures to metal ions (Staplesand Buck 2009; Lushchak 2011; Mustafa et al. 2012). Inorder to detoxify these ROS, the antioxidant enzymes thatmake up the antioxidant defense system are expected toincrease under hypoxia as evident from various studies onfish, and turtles (Lushchak et al. 2005; Baker et al. 2007).However, no such pattern was observed in the present study,nor has correlative activity among CAT and SOD beenobserved in other studies (Oruc and Uner 2000). SOD activ-ity was high only in gill as an initial response. As gills are theprimary tissue to capture available oxygen for an air-breathing fish, kept submerged under hypoxia, in order toeliminate ROS initially produced, SOD activity was inducedfollowed by that of CAT activity in later hours, which maybe relevant adaptive mechanism against post hypoxic ROSinsult. However, liver and serum had shown a decrease inSOD activity, similar to that reported for spot (Cooper et al.2002) and turtle Trachemys scripta elegans (Willmore andStorey 1997). Total glutathione, an antioxidant (Wilhelm-Filho et al. 2005) and indicator of redox state, was
Table 6. Mean specific activity of catalase (CAT) enzyme in different tissues of Clarias batrachus subjected to progressive and acutehypoxia without access to air (at 0.98 mg/L≈18 mmHg) for different time intervals
Treatments
Catalase activity (Units/mg protein)
Liver Muscle Gill Blood
Normox 390±26.6a,b 26.2±4.40a 157±79.4a,b 20.7±2.41a,b,c
PH 443±32.8b 25.4±4.12a 111±48.6a 10.9±2.98a
H1 421±44.7a,b 28.6±7.08a 194±34.0b,c 23.0±4.48a,b
H2 419±12.4a 36.4±5.34a 142±51.1a 30.3±17.3c,d
H3 452±59.2a,b 49.9±9.17a 303±48.1d (+) 33.2±4.48b,c,d
H6 559±15.7b 69.2±10.0b (+) 257±32.0c,d (+) 55.9±28.7e (+)
H12 423±86.1b 53.9±25.3a 217±28.1c,d (+) 33.2±15.7c,d
CAT activity values are mean±SD, n03; statistical differences among treatments are indicated by dissimilar letters.Whereas (+) represents significantincrease in experimental hypoxia as compared to normoxia. Superscripts a, b, c, d, e indicate homogenous subsets (Tukey’s post hoc test).
0
100
200
300
400
500
600
700
Liver Muscle Gill Blood
Tissues
Cat
alas
e ac
tivi
ty
(U/m
g pr
otei
n)
Normox
PH
H1
H2
H3
H6
H12
*
**
*
*
Figure 8. Mean specific activity of catalase enzyme (U/mg protein)in liver, muscle, gill, and blood of Clarias batrachus in normoxia(Normox), progressive hypoxia (PH) and after 1 h (H1), 2 h (H2), 3 h(H3), 6 h (H6) and 12 h (H12) at 0.98±0.1 mg/L, dissolved oxygen.Mean±standard deviation. Asterisk (*) represents significant differ-ences (p<0.05) between normoxia and acute hypoxia.
Responses to acute experimental hypoxia in Clarias batrachus 381
J. Biosci. 38(2), June 2013
unaffected in different tissues of C. batrachus. Unalteredlevel of glutathione were also reported for Nile tilapia duringhypoxia/reoxygenation (Welker et al. 2012), which may in-dicates that redox state of cells is not affected irrespective ofduration of hypoxia (Lushchak and Bagnyukova 2006).
In conclusion, on the basis of the results presented here, itwas found that the Clarias batrachus, an air-breathing fish,is an oxyconformer, and the exposure of fish to differentperiods of experimental hypoxia resulted in adjustment ofoxygen carrying capacity, metabolic depression and antiox-idant defense system. These physiological alterations mightbe correlated with its capacity to tolerate hypoxic conditions.Although these broad outlines of adaptation for hypoxicsurvival are recognized through this study, understandingof signals involved in these interrelated processes needs tobe further explored.
Acknowledgements
This work was carried out under National Agricultural Inno-vation Project ‘Bio-prospecting of Genes and Allele Miningfor Abiotic Stress Tolerance’, and financial support providedby NAIP-Indian Council of Agricultural Research is dulyacknowledged.
References
Assendelft OW and England JM 1982 Advances in hematologicalmethods—the blood count (Boca Raton, FL: CRC Press)
Baker PJ, Costanzo JP and Lee RE Jr 2007 Oxidative stress andantioxidant capacity of a terrestrially hibernating hatchling tur-tle. J. Comp. Physiol. B. 177 875–883
Braun N, Lima RL De, Moraes B, Loro VL and Baldisserotto B2006 Survival, growth and biochemical parameters of silvercatfish, Rhamdia quelen (Quoy & Gaimard, 1824), juvenilesexposed to different dissolved oxygen levels. Aqua. Res. 371524–1531
Cech JJ 1990 Respirometry; in Methods of fish biology (eds) CBSchreck and PB Moyle (Bethesda MD: American FisheriesSociety) pp 335–362
Chonder SL 1999 Biology of finfish and shellfish (Howrah, India:SCSC Publisher) pp 303–313
Cooper RU, Clough LM, Farwell MA and West TL 2002 Hypoxia-induced metabolic and antioxidant enzymatic activities in theestuarine fish Leiostomus xanthurus. J. Exp. Mar. Biol. Ecol.279 1–20
Dacie SIV and Lewis SM 1991 Practical haematology 7th edition(London, Melborne and New York: J.A. Chuchill Ltd.Livingstone)
Damotharan P, Perumal NV, Arumugam M, Vijayalakshmi S andBalasubramanian T 2010 Seasonal variation of physico-chemical characteristics in point calimere coastal waters southeast coast of India. Middle East J. Sci. Res. 64 333–339
Dean B 1912 Additional notes on the living specimens of theAustralian lungfish Ceratodus forsteri, in the collection of theZoological Society of London. Proc. Zool. Soc. London. 82607–612
de Graaf G and Janssen H 1996 Artificial reproduction and pondrearing of the African catfish, Clarias gariepinus in sub-Saharan Africa. (Amsterdam: Nesfisco Foundation)
Fernandes MN and Mazon AF 2003 Environmental pollution andfish gill morphology; in Fish adaptations (eds) AL Val and BGKapoor (Enfield: Science Publishers) pp 203–231
Garg TK and Mittal AK 1990 The epidermal and inner epitheliallining of the operculum in Clarias batrachus Clariidae,Siluriformes. Jap. J. Icthy. 37 149–157
Graham JB 1997 Air-breathing fishes: Evolution, diversity andadapatation (San Diego, CA: Academic Press)
Henriksson P, Mandic M and Richards JG 2008 The osmo-respiratory compromise in sculpins: impaired gas exchange isassociated with freshwater tolerance. Physiol. Biochem. Zool. 81310–319
Hochachka PW and Somero GN 2002 Biochemical adaptation:mechanism and process in physiological evolution (Oxford:Oxford University Press) p 466
Ishimatsu A, Hayashi M and Kikkawa T 2008 Fishes in high-CO2,acidified oceans. Mar. Ecol. Prog. Ser. 373 295–302
Lai AY and Todd KG 2006 Hypoxia-activated microglial mediatorsof neuronal survival are differentially regulated by tetracyclines.Glia 53 809–816
Lushchak VI 2011 Environmentally induced oxidative stress inaquatic animals. Aquat. Toxicol. 101 13–30
Lushchak VI and Bagnyukova TV 2006 Effects of different envi-ronmental oxygen levels on free radical processes in fish. Comp.Biochem. Physiol. B Biochem. Mol. Biol. 144 283–289
Lushchak VI and Bagnyukova TV 2007 Hypoxia induces oxidativestress in tissues of a goby, the rotan Perccottus glenii. Comp.Biochem. Physiol. B Biochem. Mol. Biol. 148 390–7
Lushchak VI, Bagnyukova TV, Lushchak OV, Storey JM andStorey KB 2005 Hypoxia and recovery perturb free radicalprocesses and antioxidant potential in common carp Cyprinuscarpio tissues. Int. J. Biochem. Cell Biol. 37 1319–1330
Martinez ML, Landry C, Boehm R, Manning S, Cheek AO andRees BB 2006 Effects of long-term hypoxia on enzymes ofcarbohydrate metabolism in the Gulf killifish, Fundulus grandis.J. Exp. Biol. 209 3851–3861
Martinez ML, Raynard EL, Bernard BR and Chapman LJ 2011Oxygen limitation and tissue metabolic potential of the Africanfish Barbus neumayeri: roles of native habitat and acclimatiza-tion. BMC Ecol. 11 2
McKenzie DJ, Steffensen JF, Korsmeyer K, Whiteley NM, BronziP and Taylor EW 2007 Swimming alters responses to hypoxia inthe Adriatic sturgeon Acipenser naccarii J. Fish Biol. 70 651–658
Mohindra V, Tripathi RK, Singh A and Singh B 2012 Molecularcharacterization and expression analysis of a novel cystatin-likegene in a hypoxia-tolerant Indian catfish, Clarias batrachus[Linnaeus, 1758]. Fish Shellfish Immunol. DOI: 10.1016/j.fsi.2012.11.018
Munshi JSD and Ghosh TK 1994 Metabolic wheel hypothesis asapplied to air-breathing fishes of India; in Advances in fish
382 Ratnesh Kumar Tripathi et al.
J. Biosci. 38(2), June 2013
biology (ed) HR Singh (Delhi: Hindustan PublishingCorporation) pp 70–78
Mustafa SA, Al-Subiai SN, Davies SJ and Jha AN 2011 Hypoxia-induced oxidative DNA damage links with higher level biolog-ical effects including specific growth rate in common carp,Cyprinus carpio L. Ecotoxicol. 20 1455–1466
Mustafa SA, Davies SJ and Jha AN 2012 Determination of hypoxiaand dietary copper mediated sub-lethal toxicity in carp,Cyprinus carpio, at different levels of biological organization.Chemosphere 87 413–422
Nilsson GE and Lutz PL 1993 Role of GABA in hypoxia tolerance,metabolic depression and hibernation–possible links to neuro-transmitter evolution. Comp. Biochem. Physiol. C 105 329–336
Nilsson L, Kogure K and Busto R 1975 Effects of hypothermia andhyperthermia on brain energy metabolism. Acta Anaesth. Scand.193 199–205
Nilsson S and Grove DG 1974 Adrenergic and cholinergic inner-vation of the spleen of the cod: Gadus morhua. Eur. J.Pharmacol. 28 135–143
Oruc EO and Uner N 2000 Combined effects of 2, 4-D andazinphosmethyl on antioxidant enzymes and lipid peroxidationin liver of Oreochromis niloticus. Comp. Biochem. Physiol. CToxicol. Pharmacol. 127 291–296
Perry SF and Reid SG 1994 The effects of acclimation temperatureon the dynamics of catecholamine release during acute hypoxiain the rainbow trout Oncorhynchus mykiss. J. Exp. Biol. 186289–307
Portner HO, Heisler N and Grieshaber MK 1985 Oxygen consump-tion and mode of energy production in the intertidal wormSipunculus nudus L: Definition and characterization of the crit-ical PO2 for an oxyconformer. Res. Physiol. 59 361–377
Saha N and Ratha BK 2007 Functional ureogenesis and adaptationto ammonia metabolism in Indian freshwater air-breathingcatfishes. Fish Physiol. Biochem. 33 283–295
Saint-Paul U 1984 Physiological adaptation to hypoxia of a neo-tropical characoid fish Colossoma macropomum, Serrasalmidae.Env. Biol. Fishes. 11 53–62
Speers-Roesch B, Brauner CJ, Farrell AP, Hickey AJR, RenshawGMC, Wang YS and Richards JG 2012 Hypoxia tolerance inelasmobranchs. II. Cardiovascular function and tissue metabolicresponses during progressive and relative hypoxia exposures. JExp. Biol. 215 103–114
Staples JF and Buck LT 2009 Matching cellular metabolic supplyand demand in energy-stressed animals. Comp. Biochem.Physiol. A 153 95–105
Timmerman CM and Chapman LJ 2004 Behavioral andPhysiological Compensation for Chronic Hypoxia in the SailfinMolly (Poecilia latipinna). Physiol. Biochem. Zool. 77 601–610
Trachootham D, Lu W, Ogasawara MA, Valle NRD and Huang P2008 Redox regulation of cell survival. Antioxid. Redox Signal10 1343–1374
Urbina MA and Glover CN 2012 Should I stay or should I go?Physiological, metabolic and biochemical consequences of volun-tary emersion upon aquatic hypoxia in the scaleless fish Galaxiasmaculatus. J. Comp. Physiol. BDOI: 10.1007/s00360-012-0678-3
Urbina MA, Glover CN and Forster ME 2012 A noveloxyconforming response in the freshwater fish Galaxiasmaculatus. Comp. Biochem. Physiol. A Mol. Integr. Physiol.161 301–306
Welker AF, Campos EG, Cardoso LA and Hermes-Lima M 2012Role of catalase on the hypoxia/reoxygenation stress in thehypoxia-tolerant Nile tilapia. Am. J. Physiol. Regu. Physiol.302 1111–1118
Wells RMG and Weber RE 1991 Is there an optimal haematocrit forrainbow trout, Oncorhynchus mykiss Walbaum? An interpreta-tion of recent data based on blood viscosity measurements. J.Fish. Biol. 38 53–65
Wilhelm-Filho D, Torres MA, Zaniboni-Filho E and Pedrosa RC2005 Effect of different oxygen tensions on weight gain, feedconversion, and antioxidant status in piapara, Leporinus elon-gates Valenciennes, 1847. Aquaculture 244 349–357
Willmore WG and Storey KB 1997 Antioxidant systems and anoxiatolerance in a freshwater turtle Trachemys scripta elegans. Mol.Cell Biochem. 170 177–185
MS received 05 November 2012; accepted 15 January 2013
Corresponding editor: STUART A NEWMAN
Responses to acute experimental hypoxia in Clarias batrachus 383
J. Biosci. 38(2), June 2013
Related Documents