WORLD COLLEGE OF TECHNOLOGY AND MANAGEMENT, GURGAON (HARYANA) PHYSICS-I PHY-101-F (1003) LAB MANUAL I SEMESTER B. Tech.

Welcome message from author
This document is posted to help you gain knowledge. Please leave a comment to let me know what you think about it! Share it to your friends and learn new things together.
Transcript

WORLD COLLEGE OF TECHNOLOGY AND MANAGEMENT,
GURGAON (HARYANA)
PHYSICS-IPHY-101-F (1003)LAB MANUAL
I SEMESTERB. Tech.

S.No. Name of Experiment
1.To find the refractive index and Cauchy’s constants of a prism using spectrometer.
2.To determine the wavelengths of prominent lines of mercury by plane diffraction grating.
3.To determine the frequency of an A.C. using Sonometer.
4.To determine the wavelength of Sodium light by Newton’s Rings.
5.To Compare the capacitances of two condensers by De-sauty’s Bridge method Using Head phone.
6.To study photovoltaic cell and hence to verify the inverse square law.
7.To determine the specific rotation of cane sugar solution using half shade Polarimeter.
8.To determine the Resolving Power of a Telescope.
9. To find the pitch of a scale using He- Ne Laser.
10. Determine the wavelength of sodium light by Fresnel’s biprism.

Experiment No.1
Aim: To find the refractive index and Cauchy’s constants of a prism using spectrometer.
Apparatus required: Spectrometer, prism, mercury lamp, spirit level.
Formula used: (i) The refractive index of the material of the prism is given by the formula:-
µ
2sin
2sin
A
A m
Where A= Angle of prism δm=Angle of minimum deviation.
(ii) Variation of refractive index with wavelength may be represented by the Cauchy’s relation
µ = A + 2
B
Where A and B are the Cauchy’s constant and can be determined as
B= µ1 - µ2 / 21
1
22
1
……..cm2, A = µ1 -
21
= µ2 -22
……..cm2,
Principle: It is based on the phenomenon of dispersion of light, in which white light is split or dispersed in to different colours, when it passes through a prism. Shorter wavelengths (like blue) bend the most while longer wavelengths (like red) bend the least.
Theory: Spectrometer Design:
The Collimeter: The collimeter C consists two hollow concentric metal tubes, one being longer than other. The longer tube carries an achromatic lens L at one end and the smaller tube at the other end. The smaller tube is provided with a slit at the outer end and can be moved in our out the longer tube with the help of rack and pinion arrangement. The slit is adjusted in the focal plane of the lens L to obtain a pencil of parallel rays from the collimeter when light is allowed to be incident upon slit. The collimeter is also provided with two screws for adjusting inclination of the axis of the collimeter. This is rigidly fixed to the main part of the apparatus.
The Prism Table: It is a circular table supported horizontally in the center of the instrument and the position can be read with the help of two verniers attached to it and moving over a graduated circular scale carried by the telescope. The leveling of the prism table is made with the help of three screws provided at the lower surface. The table can be raised or lowered and clamped in any desired position with the help of a screw. The prism table is also provided with a tangent screw for a slow motion. There are concentric circles and straight lines parallel to the line joining two of the leveling screws on the prism table.
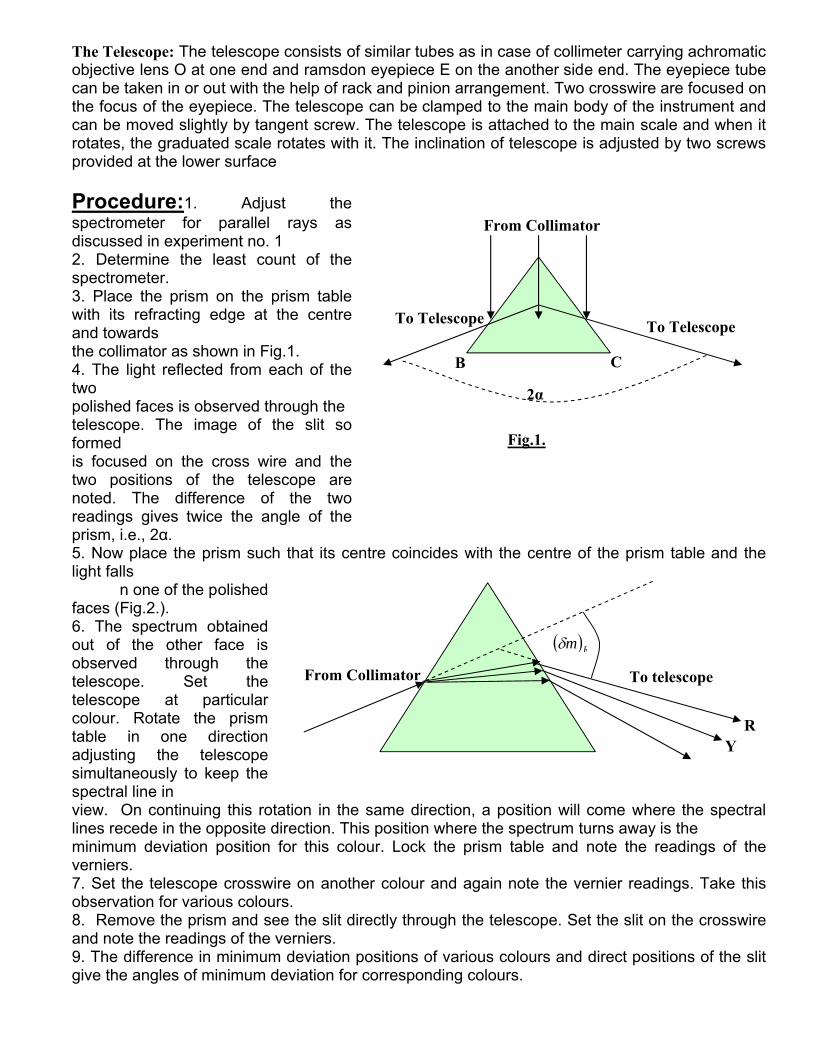
The Telescope: The telescope consists of similar tubes as in case of collimeter carrying achromatic objective lens O at one end and ramsdon eyepiece E on the another side end. The eyepiece tube can be taken in or out with the help of rack and pinion arrangement. Two crosswire are focused on the focus of the eyepiece. The telescope can be clamped to the main body of the instrument and can be moved slightly by tangent screw. The telescope is attached to the main scale and when it rotates, the graduated scale rotates with it. The inclination of telescope is adjusted by two screws provided at the lower surface
Procedure:1. Adjust the spectrometer for parallel rays as discussed in experiment no. 12. Determine the least count of the spectrometer.3. Place the prism on the prism table with its refracting edge at the centre and towards the collimator as shown in Fig.1.4. The light reflected from each of the two polished faces is observed through thetelescope. The image of the slit so formedis focused on the cross wire and the two positions of the telescope are noted. The difference of the two readings gives twice the angle of the prism, i.e., 2α.5. Now place the prism such that its centre coincides with the centre of the prism table and the light falls
n one of the polished faces (Fig.2.).6. The spectrum obtained out of the other face is observed through the telescope. Set the telescope at particular colour. Rotate the prism table in one direction adjusting the telescope simultaneously to keep the spectral line in view. On continuing this rotation in the same direction, a position will come where the spectral lines recede in the opposite direction. This position where the spectrum turns away is the minimum deviation position for this colour. Lock the prism table and note the readings of the verniers.7. Set the telescope crosswire on another colour and again note the vernier readings. Take this observation for various colours.8. Remove the prism and see the slit directly through the telescope. Set the slit on the crosswire and note the readings of the verniers.9. The difference in minimum deviation positions of various colours and direct positions of the slit give the angles of minimum deviation for corresponding colours.
To telescopeFrom Collimator
RY
Rm
To TelescopeTo Telescope
B C
2α
From Collimator
Fig.1.

Observations:(a).Determination of the least count of the SpectrometerValue of one Main Scale Division, x = Degree,Total no. of div. in circular scale, n =
.Hence, least count of the microscope screw = x/n= Degree
(b). Table for the angle of Prism (A)
(c). Table for angle of minimum deviation (δm)
Colour VernierTelescope Readings for Difference
δm = b-aDegree
Mean δm
DegreeDispersed image Direct image
M.S. V.S.Total
Degree M.S. V.S.Total
Degree
BlueV1
V2
GreenV1
V2
Calculations:Using formula from eqn.(3) we can calculate the values of refractive index, n, for all the colours. Refractive index for the material of the prism for different wavelengths is given in the following table.
Sr.No. Colour StandardWavelength, λ in Å
Refractive index, µ
1.
2.
Blue
Green
4693
5461
Ve
rnie
r
Telescope Readings for reflection from Difference2A=b-aDegree
Angle of Prism(A)Degree
Mean ADegreeFirst face (a) Degree Second Face (b) Degree
M.S. V.S.Total
Degree M.S. V.S.Total
Degree
V1
V2

Using any two values of wavelengths and n for two colours, we get the values of B and A by using eqn.(2a) and (2b) respectively.
Result:(i). The refractive indices of the material of prism for various colours are in table above,(ii). The Cauchy’s constants are A= , and, B=
Uses : (1) To determine the refractive index of the material of the prism. (2) To determine the refractive index of a liquid. (3) To study the spectra of different sources of light.
Source of error and Precautions:
(i). Spectrometer leveling and adjustments should be properly done.(ii). The slit should be sharp and vertical.(iii). The position of angle of minimum deviation should be accurately determined.(iv). The refracting surfaces of the prism should not be touched with fingers.

Experiment No.2Aim: To determine the wavelengths of prominent lines of mercury by
plane diffraction grating.Apparatus required: A plane diffraction grating, spectrometer, mercury lamp, prism, spirit level, reading lens.
Formula used : Wavelength of a spectral line can be calculated by n
de sin)(
Where, e + d = grating element n = order of spectrum
Principle: It is based on the principle of Fraunhoffer diffraction through a diffraction grating.
Theory: A diffraction grating has large no. of slits of equal width and separation. Let there are N parallel slits each of width e separated by opaque space d. So the grating element is (e + d).
Condition for principal maxima: I will be maximum when sinβ = 0 β = ± nπ; n = 0,1 2,….(4).Using (3) and (4), the intensity will be maximum when, nde sin ………………….(5)Here, n is the order of the diffraction pattern. Thus the wavelength of a spectral line can be
calculated by n
de sin)( ………………… (6)
Spectrometer Design:The spectrometer consists of a collimator, a prism table and telescope as in above Fig. The collimator consists of two hollow concentric metal tubes, one (the smaller) sliding under the other. The free end of the longer tube carries an achromatic lens and that of the smaller tube has a slit adjustable width. The slit is adjusted in the focal plane of lens in order to obtain a parallel beam. The collimator also has two screws for adjusting the inclination of the axis of the collimator. The prism table is a circular table, which moves over a graduated circular scale carried by the telescope. Fig.2
Let a collimated beam is incident on the grating normally as shown in Fig.1. The rays diffracted by various slits at the same angle θ at point P on the screen/eye piece. The resultant intensity at P due to all the rays is given b
22
sin
sin.
sin
NA
I (1)
Here, sine ……..
(2), and sinde
……(3)
Collimator
Telescope
Grating
Prism table
45˚
45˚
SlitSource
θP
Screen
Fig.1
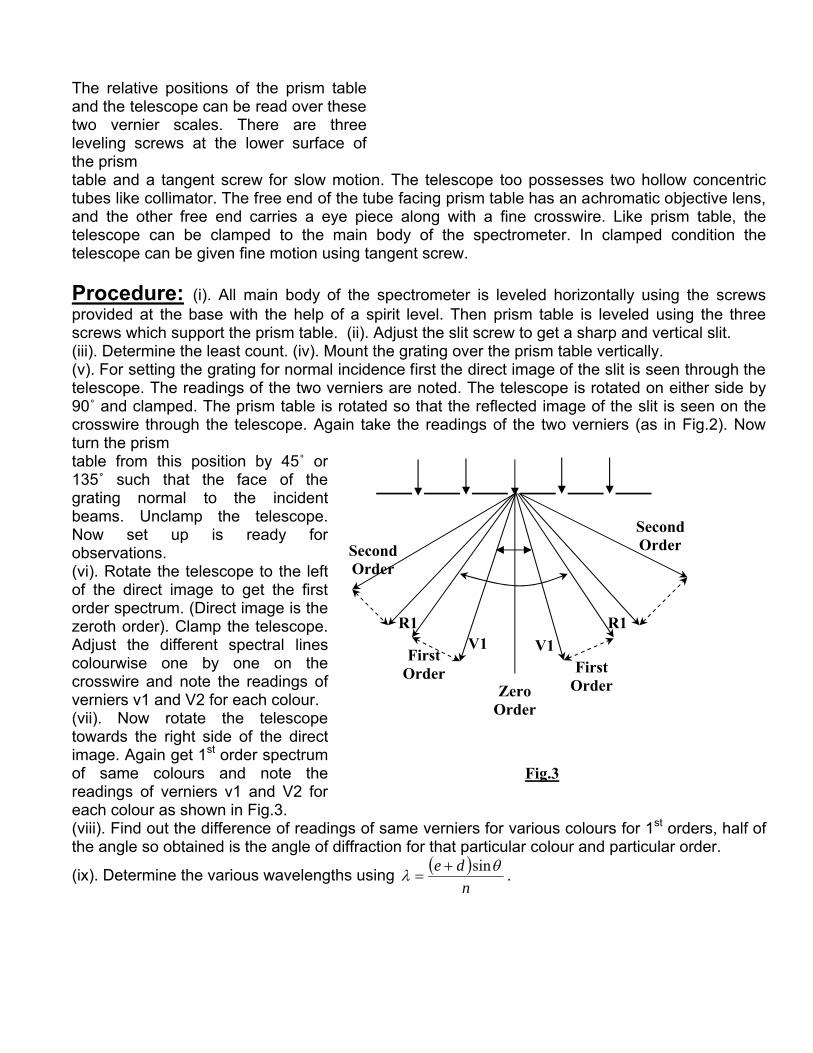
The relative positions of the prism table and the telescope can be read over these two vernier scales. There are three leveling screws at the lower surface of the prismtable and a tangent screw for slow motion. The telescope too possesses two hollow concentric tubes like collimator. The free end of the tube facing prism table has an achromatic objective lens, and the other free end carries a eye piece along with a fine crosswire. Like prism table, the telescope can be clamped to the main body of the spectrometer. In clamped condition the telescope can be given fine motion using tangent screw.
Procedure: (i). All main body of the spectrometer is leveled horizontally using the screws provided at the base with the help of a spirit level. Then prism table is leveled using the three screws which support the prism table. (ii). Adjust the slit screw to get a sharp and vertical slit.(iii). Determine the least count. (iv). Mount the grating over the prism table vertically.(v). For setting the grating for normal incidence first the direct image of the slit is seen through the telescope. The readings of the two verniers are noted. The telescope is rotated on either side by 90˚ and clamped. The prism table is rotated so that the reflected image of the slit is seen on the crosswire through the telescope. Again take the readings of the two verniers (as in Fig.2). Now turn the prism table from this position by 45˚ or 135˚ such that the face of the grating normal to the incident beams. Unclamp the telescope. Now set up is ready for observations.(vi). Rotate the telescope to the left of the direct image to get the first order spectrum. (Direct image is the zeroth order). Clamp the telescope.Adjust the different spectral lines colourwise one by one on the crosswire and note the readings of verniers v1 and V2 for each colour.(vii). Now rotate the telescope towards the right side of the direct image. Again get 1st order spectrum of same colours and note the readings of verniers v1 and V2 for each colour as shown in Fig.3.
Fig.3
(viii). Find out the difference of readings of same verniers for various colours for 1st orders, half of the angle so obtained is the angle of diffraction for that particular colour and particular order.
(ix). Determine the various wavelengths using
n
de sin .
ZeroOrder
FirstOrder First
Order
SecondOrder
SecondOrder
V1 V1
R1 R1
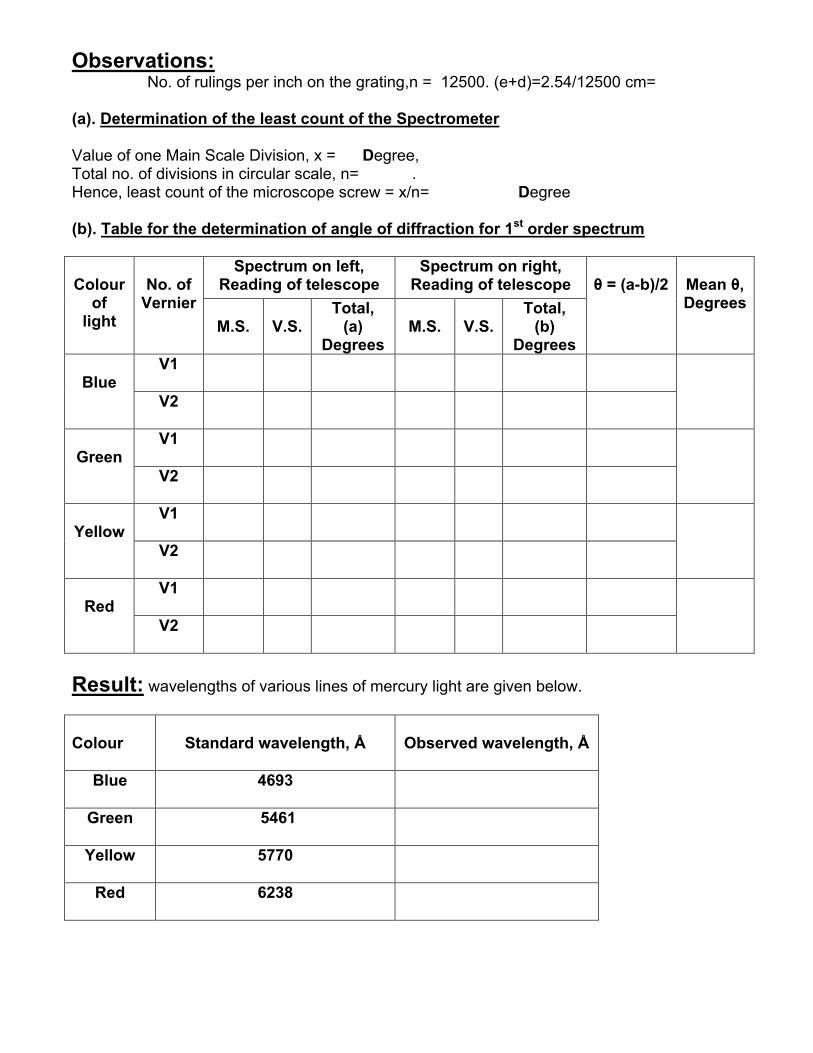
Observations: No. of rulings per inch on the grating,n = 12500. (e+d)=2.54/12500 cm=
(a). Determination of the least count of the Spectrometer
Value of one Main Scale Division, x = Degree, Total no. of divisions in circular scale, n= .Hence, least count of the microscope screw = x/n= Degree
(b). Table for the determination of angle of diffraction for 1st order spectrum
Colour of
light
No. ofVernier
Spectrum on left,Reading of telescope
Spectrum on right,Reading of telescope θ = (a-b)/2 Mean θ,
Degrees
M.S. V.S.Total,
(a) Degrees
M.S. V.S.Total,
(b) Degrees
BlueV1
V2
GreenV1
V2
YellowV1
V2
RedV1
V2
Result: wavelengths of various lines of mercury light are given below.
Colour Standard wavelength, Å Observed wavelength, Å
Blue 4693
Green 5461
Yellow 5770
Red 6238

Uses: (1) To determine the wave length of light used. (2) To study the spectra of different sources of light.
Source of error and Precautions:
(i). Spectrometer leveling and adjustments should be properly done.(ii). Setting up the collimator and telescope for parallel rays is essential.(iii). The formula used is for normal incidence of light on grating, hence this adjustment should be accurately done.(iv). The slit should be sharp and vertical, i.e., parallel to the rulings on the grating.

Experiment No.3
Aim: To determine the frequency of an A.C. using Sonometer.Apparatus Used: Sonometer with steel wire, electromagnet, horse-shoe magnet, a step down transformer, meter scale, Screw gauge and slotted half kg weights.
Formula Used : Frequency can be determined by
= ⁄ lMg r 2
1/
2
Where, g = gravitational force due to earth, r = radius of wire, ρ = density of the wire, m = mass/weight hanged, l = length of the wire between two bridges.
Theory: Consider a small portion APQB of the wire through which the transverse wave of frequency, n is the propagating. The velocity of the wave will depend upon the nature of the wire. Consider a small element PQ of the wire. Let the centre of curvature of PQ portion is at O. Let <POQ = θ. The portion of PQ is very small, so that θ is very small. Let T is the tension in the wire at points P and Q tangential in the element P and Q.
C T cos θ/2 T cos θ/2
θ/2 θ/2.
P Q R
T T A B
O Fig.1
The horizontal component of tensions is equal and opposite in direction, so cancel each other. The vertical components of tension are along CO.The resultant tension along CO = 2T sin θ/2
= 2T.= θ/2= T θ (sin θ = θ) …………(1)
For equilibrium position, the resultant tension provides the required centripetal force which is = (mdx)v2 ………….(2)
RHere m is the mass per unit length of the wire and dx is the length PQ of the portion under consideration.
. . . (mdx)v2 =T.θ
R

But θ=dx/R
So (mdx)v2 = Tdx R
.
. . v= mT / ………………..(3)
The velocity of wave in wire can also be written as
V=nλ ........................(4)
It the wire of length l vibrates making ρ loops, then length of each loop will be l/ρ and each loopwill correspond to λ/2 . . . l/P= λ/2=>λ=2l/ρ
Putting in eqn (4). We get V=n.2l/ρ ………………...(5)
Comparing eqn (3). and (5) we have,
n.2l/ρ= mT /
n= ρ/2l mT / …………………(6)
If the wire is vibrating making only one loop then.
ρ=1
Therefore the frequency of vibration is,
n= 1/2l mT / ………………….(7)
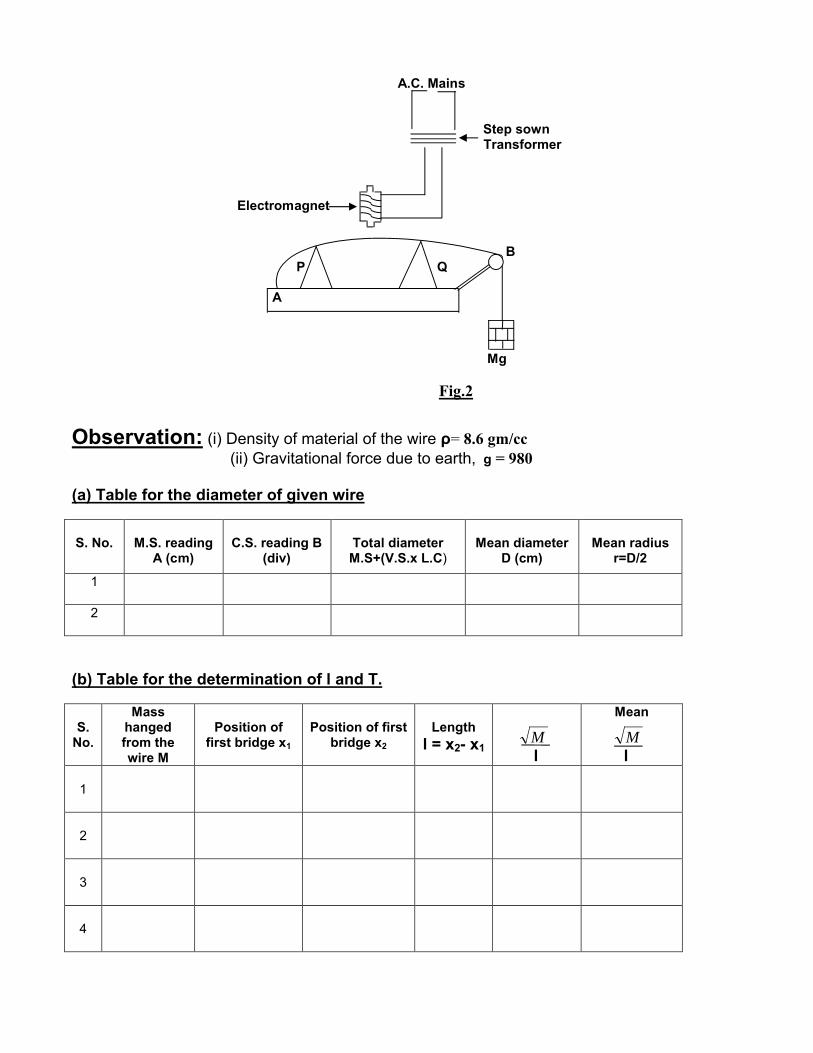
Using an electromagnet: The apparatus is shown in fig. (1). One end of the sonometer wire is fixed at the left of sonomete while the other end passes over a frictionless pully the wire is stretched under a tension by suspending some mass at the end of the wire. The sonometer wire also passes over two bridge P & Q, used for adjusting the length of the wire. The A.C. mains whose frequency is to be determined is connected to the primary winding of the step down transformer while the secondary coil is connected to an electromagnet. The electromagnet is kept just above the sonometer wire. When an A.C. is passed through the electromagnet the sonometer wire is attracted twice in a cycle of A.C therefore the wire vibrates with a frequency which is double the frequency of A.C. so the frequency A.C. will be given by.
f = n/2=1/4l mT / …………………(8)
A.C. Mains
Step sown Transformer
Electromagnet
B P Q
A
Mg
Fig.2
Observation: (i) Density of material of the wire ρ= 8.6 gm/cc (ii) Gravitational force due to earth, g = 980
(a) Table for the diameter of given wire
S. No. M.S. reading A (cm)
C.S. reading B (div)
Total diameterM.S+(V.S.x L.C)
Mean diameter D (cm)
Mean radius r=D/2
1
2
(b) Table for the determination of l and T.
S. No.
Mass hanged from the wire M
Position of first bridge x1
Position of first bridge x2
Lengthl = x2- x1
M l
Mean
M l
1
2
3
4
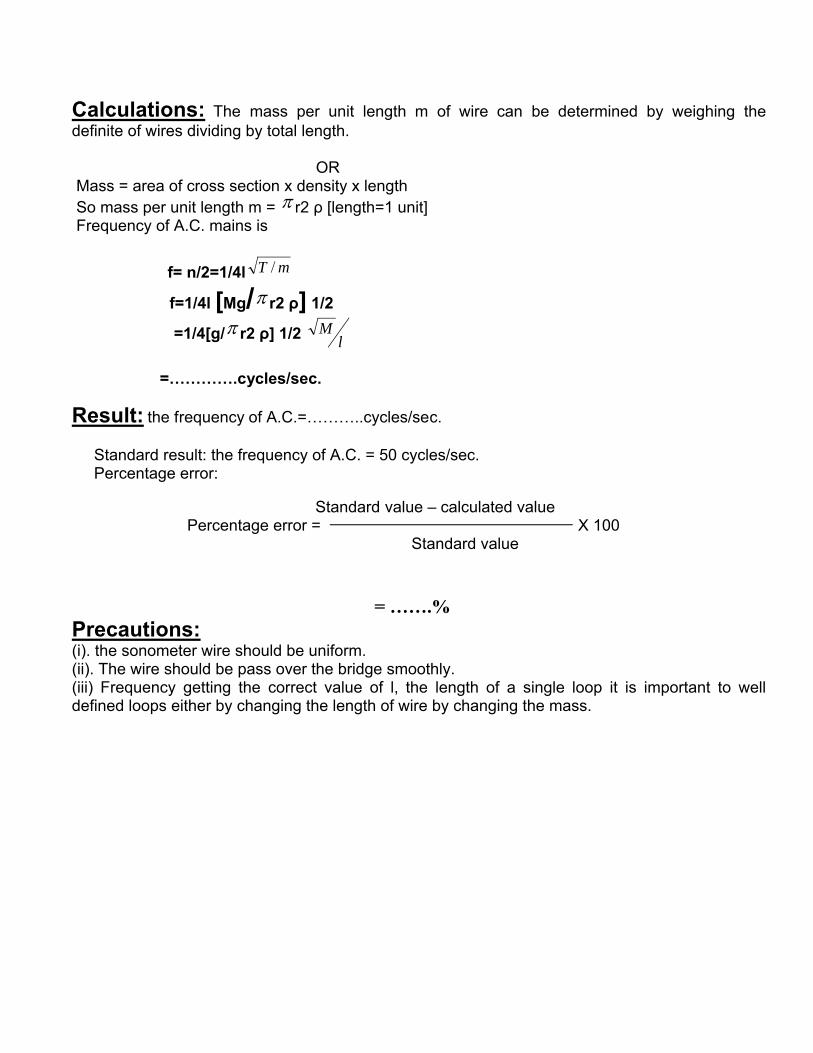
Calculations: The mass per unit length m of wire can be determined by weighing the definite of wires dividing by total length. ORMass = area of cross section x density x lengthSo mass per unit length m = r2 ρ [length=1 unit]Frequency of A.C. mains is
f= n/2=1/4l mT /
f=1/4l [Mg/ r2 ρ] 1/2
=1/4[g/ r2 ρ] 1/2 lM
=………….cycles/sec.
Result: the frequency of A.C.=………..cycles/sec.
Standard result: the frequency of A.C. = 50 cycles/sec. Percentage error:
Standard value – calculated value Percentage error = X 100
Standard value = …….%Precautions:(i). the sonometer wire should be uniform.(ii). The wire should be pass over the bridge smoothly.(iii) Frequency getting the correct value of l, the length of a single loop it is important to well defined loops either by changing the length of wire by changing the mass.

Experiment No.4
Aim : To determine the wavelength of Sodium light by Newton’s Rings.
Apparatus Required: A plane glass plate, a Plano convex lens of large radius of curvature, a flat glass sheet fixed at 45˚ to the vertical, sodium lamp and traveling microscope.
Formula used: Wave length of Sodium light can be calculated as
pR
DD npn
4
22
Where, Dn+p = Diameter of n+pth ring Dn = Diameter of nth ring P = any integer R = Radius of curvature
Principle: It is based on Interference by division of amplitude in a wedge shaped film of variable thickness. The film of air is enclosed between a plane glass plate and plano-convex lens.
Theory: The optical arrangement for Newton’s rings is shown aside. The effective path difference between interfering rays in reflected light is given by Δ=2μt cos(r+θ) –λ/2,Here, μ is the refractive index of the film, t is the thickness of the film at point P1 (see in next fig.), r is the angle of refraction inside the film, θ is the angle of wedge, and, λ is the wavelength of the incident light.
Fig.1
MMicroscope
Glass Plate Broad Slit
G1
Sodium Lamp
Convex LensPlano convexLens
Glass PlateG2
L2
L1
Hence the fringes are circular concentric rings with the centre at the point of contact.
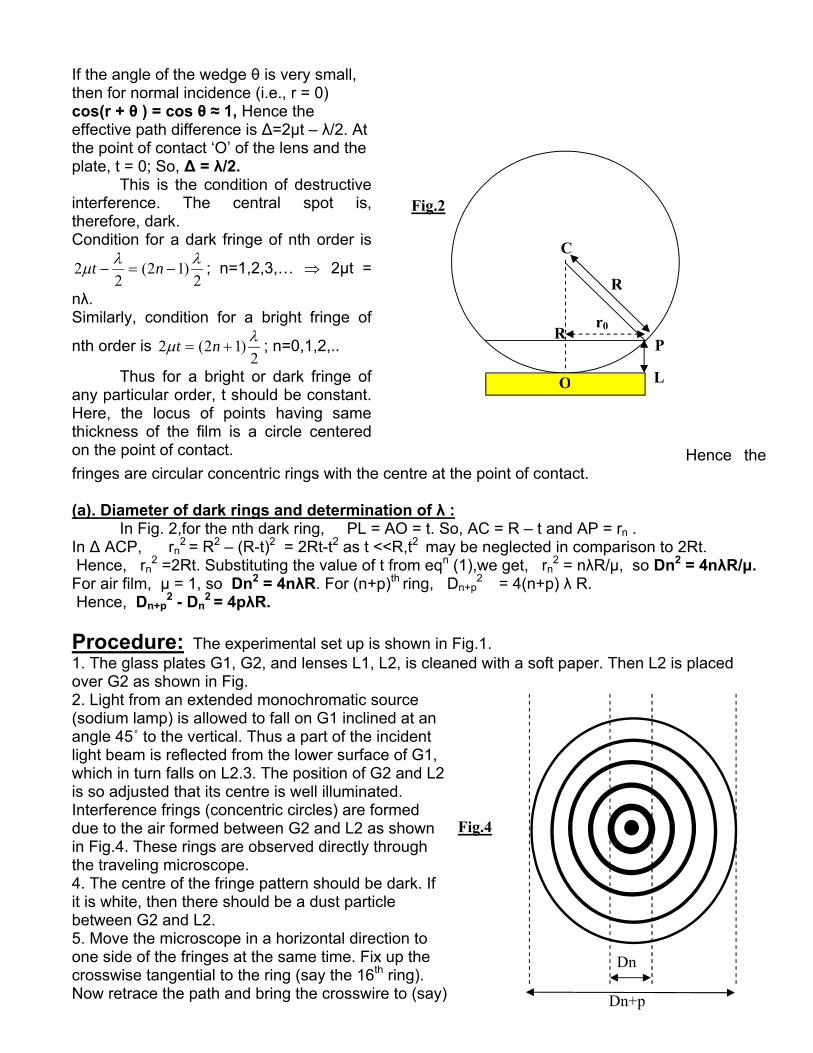
(a). Diameter of dark rings and determination of λ :In Fig. 2,for the nth dark ring, PL = AO = t. So, AC = R – t and AP = rn .
In Δ ACP, rn2 = R2 – (R-t)2 = 2Rt-t2 as t <<R,t2 may be neglected in comparison to 2Rt.
Hence, rn2 =2Rt. Substituting the value of t from eqn (1),we get, rn
2 = nλR/μ, so Dn2 = 4nλR/μ.For air film, μ = 1, so Dn2 = 4nλR. For (n+p)th ring, Dn+p
2 = 4(n+p) λ R.Hence, Dn+p
2 - Dn2 = 4pλR.
Procedure: The experimental set up is shown in Fig.1.1. The glass plates G1, G2, and lenses L1, L2, is cleaned with a soft paper. Then L2 is placed over G2 as shown in Fig.
If the angle of the wedge θ is very small, then for normal incidence (i.e., r = 0) cos(r + θ ) = cos θ ≈ 1, Hence the effective path difference is Δ=2μt – λ/2. At the point of contact ‘O’ of the lens and the plate, t = 0; So, Δ = λ/2.
This is the condition of destructive interference. The central spot is, therefore, dark.Condition for a dark fringe of nth order is
2)12(
22
nt ; n=1,2,3,… 2μt =
nλ.Similarly, condition for a bright fringe of
nth order is 2
)12(2 nt ; n=0,1,2,..
Thus for a bright or dark fringe of any particular order, t should be constant. Here, the locus of points having same thickness of the film is a circle centered on the point of contact.
2. Light from an extended monochromatic source (sodium lamp) is allowed to fall on G1 inclined at an angle 45˚ to the vertical. Thus a part of the incident light beam is reflected from the lower surface of G1, which in turn falls on L2.3. The position of G2 and L2 is so adjusted that its centre is well illuminated. Interference frings (concentric circles) are formed due to the air formed between G2 and L2 as shown in Fig.4. These rings are observed directly through the traveling microscope.4. The centre of the fringe pattern should be dark. If it is white, then there should be a dust particle between G2 and L2.5. Move the microscope in a horizontal direction to one side of the fringes at the same time. Fix up the crosswise tangential to the ring (say the 16th ring). Now retrace the path and bring the crosswire to (say)
C
R
O
P
L
R
r0
Fig.2
Dn
Dn+p
Fig.4

Observations: (a). Determination of the least count of the microscope screw
Value of one Main Scale Division, x = cm. Total no. of divisions in circular scale, n =
Hence, least count of the microscope screw = x/n= cm.
(b). Determination of Dn+p2 - Dn
2
No. of
theRing,
N
Microscope readings for the rings Dn =b – a
(cm)
Dn2
(cm2)
Dn+p2 –Dn2
(for p=6)(cm2)
For p=6Mean
Dn+p2 – Dn2
(cm2)
Left end Right end
M.S.cm.
V.S.Total
Readinga (cm)
M.Scm.
V.S.Total
Readingb (cm)
Result: The mean wavelength of sodium light = pR
DD npn
4
22 =…………..mt.
Uses: (1) To determine the wave length of monochromatic light used. (2) To determine the refractive index of transparent liquids.
Source of error and Precautions:(i).Glass plates and the lenses should be cleaned properly so that no scratches are put on their surfaces.(ii).The position of microscope should be adjusted in advance to cover the entire range of the rings.(iii).Cross wire should be focused on the ring tangentially.(iv).The micrometer screw should be move in one direction only during the observations.(v).The lens should be of large radius of curvature and it should be measured accurately.
12th dark ring. Note this reading. Now move the microscope in the same direction and fix the crosswire on successive dark rings noting the readings till other end of 12th dark ring is reached. 6. The radius of curvature of the Plano convex lens is determined by using spherometer.
Experiment No.5
Aim: To Compare the capacitances of two condensers by De-sauty’s Bridge method Using Head phone.
Apparatus Used: Two condensers,De-Sauty’s Bridge, Function generator and Head phone.
Formula used: 2
1
2
1
R
R
C
C
Principle: It works on the principle of Wheatstone bridge, which is a network of four resistances, an e.m.f. source and a galvanometer connected such that when the four resistances are balanced, the galvanometer will show a zero deflection or null reading.
Theory: In de sauty bridge method the two condensers, C1 and C2 and two resistances R1 and R2 are arranged in the arms of a wheatstone bridge as shown in figure (1). It is D.C. null method of comparing the capacities of condensers. E is the e.m.f. of the battery. When the knob of the morse key is pressed, the condensers, C1 and C2, start charging. The final charges on the condensers C1 and C2 are C1E and C2E respectively.Let during the charging process, E1, V1 & V2 are the potential at points A, E & D at any instant. The potential drop across R1 and R2 are (E1-V1) and (E2-V2). So, the current through R1 and R2 are E1-V1/R1 and E1-V2/R2.In a very small time interval dt, the quantity of charge passing through R1 and R2 are (E1-V1/R1)dt and (E1-V2/R2)dt respectively. These charges flow to C1 & C2.When the condensers are charged, the charge on C1 is C1E & on C2 is C2E. so we can write the charge on C, C1E= E1-V1/R1 dt
C2E= E1-V2/R2 dt
Or. C1ER1= (E1-V1) dt
C2ER2= (E1-V2) dt
Here C1 & C2 are the capacities of two condensers. The deflection in the B.G. will be zero when no current flows through B.G. it will happen only when,
V1=V2Throughout the charging equation (1) and (2) using (3)
C1ER1=C2ER2
Or. C1/C2=R1/R2
Above condition is true for both charging and discharging. This is the balance condition for de-sauty bridge.
The ratio of the capacitances of two condensers is given by2
1
2
1
R
R
C
C

Diagram: B
A C
D
Fig.1
Where 1R & 2R are the resistances introduced in the two arms of Wheatstone’s Bridge the two
other arms of which contain the two capacitances, 1C & 2C (Fig.1).
Procedure:(i). Make the connections as shown in the fig.1 and switch on the oscillator.
(ii). Rotate resistances in resistance arm 1R so that AB arm of the bridge offers some resistance.
(iii). Now start change resistances in resistance arm 2R such that the sound in headphone is
minimum. (iv). Write down these values of 1R & 2R in the observation table.
(v). Repeat the experiment to take at least six readings each time keeping some value of 1R and
then adjusting 2R for minimum sound in headphone.
Observations: I. Table for measurement of2
1
R
R& 2C :
Sr. No.1R
(Ohms)2R
(Ohms) Situation of sound
Mean
2
1
R
R
1
212 R
RCC Mean
C2
1
2
3
4
5
Result: The ratio of the capacitances of the given condenser is …………..µF.
R1
R2
C1
C2
Headpho
Ke Fixed Frequency
Uses: (1) It is used to measure unknown impedance, capacitance, resistance, inductance etc. (2) It can be used for balancing of linear A.C. bridge circuits for capacitance sensor elements.
Precautions:(i). The resistance 1R & 2R should be very high.
(ii). The e.m.f of the battery should be high enough so that the sufficient sensitiveness is obtained.
(iii). The resistance 1R & 2R should be non-inductive.(iv). The absorption coefficient of dielectrics of both the condensers should be same. To avoid the absorption effects of dielectric the charging time should be short.

Experiment No.6
Aim: To study photovoltaic cell and hence to verify the inverse square law.
Apparatus required: Photovoltaic cell a micrometer, single line filament lamp a wooden bench provided with meter scale.
Principle: In this apparatus the light energy is converted in to electrical energy by a photo voltaic cell. The amount of electric current produced is directly proportional to the intensity of light source which in turn is proportional to the inverse of square of distance between the source and the photo cell.
Theory: Luminous Flux: The amount of light energy flowing from the source or illuminating surface per second is called luminous flux.Illuminating Power: Illuminating Power or luminous intensity of a source is defined as the amount of light energy falling per second per unit area placed at a unit distance from the source in a direction normal to light rays.Intensity of Illumination: The intensity of illumination at a point on a surface is defined as the light falling per second per unit area at the point of consideration.Let us consider a source of light S emitting light. Let Q be the total amount of light energy per unit time by the source. Consider two spherical surfaces A and B of radius r1and r2 as in Fig.1. The illumination or intensity of illumination E1 at any point on the
surface A is given by 2
11 4 r
QE
………..(i)Similarly the intensity of illumination at any point on the surface B is given by
22
24 r
QE
………..(ii)
Now the illuminating power of a source is given by Luminous flux per unit solid angle i.e.
4
Q
AngleSolid
fluxTotalI ………… (iii). Using (i) and (ii), we have,
22
221
1r
IEand
r
IE .
221
22
2
1 1
rEor
r
r
E
E
This is the inverse square law. According to this law the intensity of illumination at a surface is inversely proportional to the square of the distance of the surface from the source. If ‘I’ is the illuminating power of a lamp and ‘E’ is the intensity of illumination at a point distant from the
source. Then inverse square law is given by 2r
IE
. If the light from a lamp is incident on a photovoltaic cell, which is placed at a distance ‘r’ from the source and ‘θ’, is the deflection in the
ammeter then, E , 2r
I 2r = constant.
B
A
r2
r1SFig.1

Procedure:(i). Mount the photovoltaic cell and lamp on a bench provided with a meter scale such that the height of photovoltaic cell and lamp is same. The experiment is performed in dark room to avoid stray light falling upon the photovoltaic cell.(ii). Make the connections as shown in the figure. Light the lamp and adjust the distance between the lamp and cell so that the galvanometer shows a large deflection.(iii). Change the distance of the lamp from photovoltaic cell and note the deflection θ in the galvanometer corresponding to different distance d between cell and lamp.
Fig.2
Observations: position of photo-voltaic cell a = ………cm.
Table for the verification of inverse square law:
S.No.Position of lamp b(cm)
Deflection(θ)Or
Current I (µA)
Distance of cell from lamp
r = a ~ b (cm)r2 cm2 r2xθ=constt.
2
1
r
1
2
3
4
5
Result: (i). The value of 2r is nearly constant, which proves the inverse square law.(ii). The graph between r2 and 1/θ is shown in attached graph, which proves inverse square law.
1/r2
θ Fig.3Uses: It is used for investigating the performance of photo voltaic cells – the efficiency of converting light energy in to electric energy.
Sources of error and precautions:
(i). The experiment should be performed in the dark room to avoid stray light. (ii). Lamp and cell should be at same height so that the light falls on the cell normally.(iii). The distance should be measured from filament of lamp to the surface of cell.
) A
AmmeterLight
Photovoltaic cell
Experiment No.7
Aim: To determine the specific rotation of cane sugar solution using half shade Polarimeter.
Apparatus Required: White light source, Half shade Polarimeter, Physical balance, Measuring cylinder, reading lens Polarimeter tube & sugar.
Formula used: lC
S
Principle: Polarization by double refraction through a half shade device occurs since Laurent’s half shade device.
Theory: The specific rotation of a substance at a particular temperature may be defined as rotation produced by one decimeter length of its solution having a concentration for 1 gm/cc. Thus
specific rotation is given by lC
S
………………………… (1)
Here θ = Rotation produced in degrees, L = Length of the solution in decimeter, C = Concentration of the substance in (cane sugar) solution (in gm/cc.)Light from a monochromatic source S is rendered parallel by a convex lens L and made to fall upon the polarizing Nicol N1. After passing through N1 the light becomes plane polarized with its vibrations in the principal plane of the nicol. This plane polarized light passes through a half shade device H (called Laurent’s plate) and then through the tube T containing the active substance, say sugar solution. The emergent light, on passing through the analyzing nicol N2 is viewed through a Galelian telescope G to which is attached a scale for measuring the rotation of the plane polarization.Working of the half shade device. Half shade device (Laurent’s plate) consists of a semi-circular plate of quartz, cut with faces parallel to the optic axis, cemented together with another semi-circular plate of glass so as to from a composite circular plate as shown in fig. The thickness of the quartz plate is such that it is half wave plate. The thickness of the glass plate is so adjusted that it transmits and absorbs the same amount of light as the quartz plate. On passing through the glass half, the vibration of light will remain in the same plane while a change occurs in the quartz half. Hence there are two plane polarized beams –one emerging from glass half while other emerging from glass half. The half shade serves the purpose of dividing the field of view into two halves.
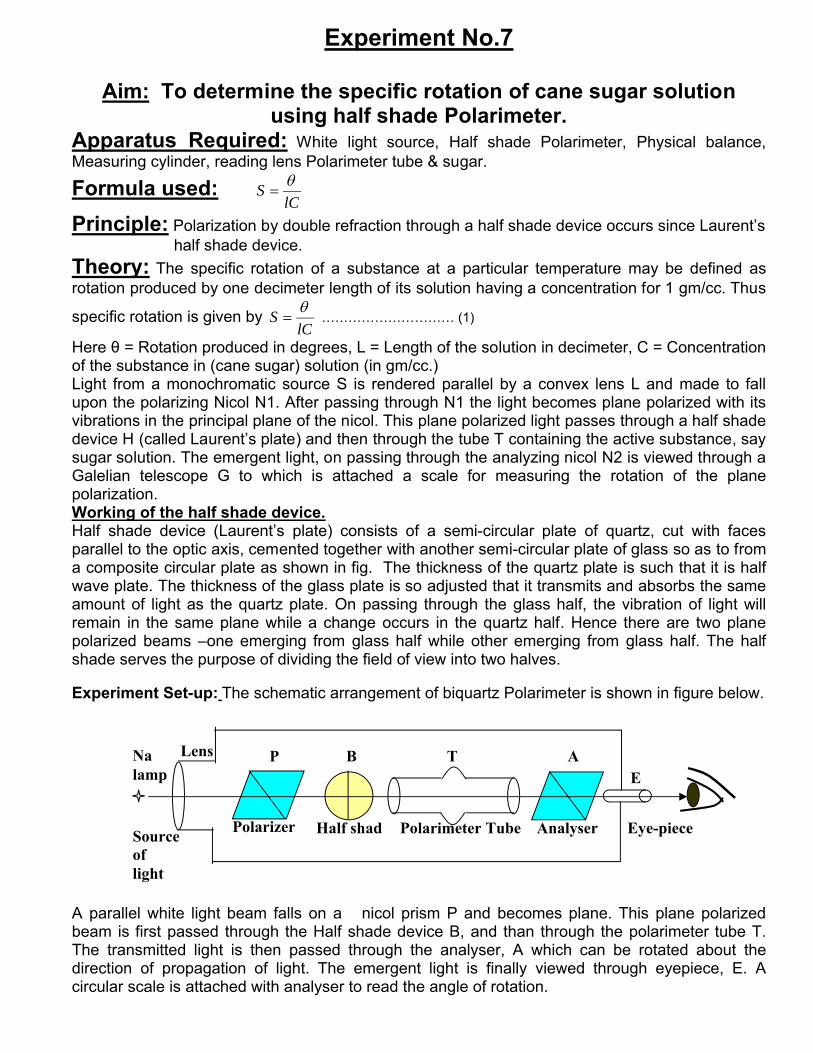
Experiment Set-up: The schematic arrangement of biquartz Polarimeter is shown in figure below.
A parallel white light beam falls on a nicol prism P and becomes plane. This plane polarized beam is first passed through the Half shade device B, and than through the polarimeter tube T. The transmitted light is then passed through the analyser, A which can be rotated about the direction of propagation of light. The emergent light is finally viewed through eyepiece, E. A circular scale is attached with analyser to read the angle of rotation.
Polarizer AnalyserHalf shad Polarimeter TubeSource of light
Eye-piece
Na lamp
Lens P B T AE
Procedure: (i). Weigh X gm.of sugar and dissolve this sugar in water to make 100ml solution. Filter the solution now 8% solution is ready for use.
(ii). Determine the least count of the vernier scale attached with the analyser.
(iii). Clean the windows of the polarimeter tube and fill it with the water such that no air bubble is enclosed with in it after the end caps have been tightened.
(iv). Place the tube inside the polarimeter horizontally as shown in fig.2. In case there is a small bubble in the tube bring it the bulged portion in the middle of tube. Place the tube in the polarimeter.
(v). Switch on the lamp and place the polarimeter in front of it as shown in the figure. Now look through the eyepiece and focus it well on both the halves of the biquartz device which may look of different colours.
(vi). Rotate the analyser slowly clockwise till the two halves appear exactly identical of grayish violet tint. Not down the position of analyser on the circular scale.
(vii). Now rotate the analyser anticlockwise till the two halves are once again of the same violet tint. Record this position of analyser also.
(viii). Remove the water from the polarimeter tube and rinse it with the 8% sugar solution. Then fill the tube with this solution not leaving any air bubbles inside. Tighten the cap properly and place it in the polarimeter.
(ix). Take the readings as in step (5) and (6). Repeat the step (7) for 4%, 2%, 1% and 0.5% sugar solution.
(xii). Obtain the angles of planes of vibration for various concentrations by subtracting the reading for water the ones for corresponding solutions.
(x). Measure the length of the glass tube in decimeters and determine the specific rotation using the given formula.
(xi). Now plot a graph of rotation versus concentration of the solution. Find the (θ/c) from the graph.

Observations: Mass of cane sugar, m = ………gm., Length of polarimeter tube, l = ………dm. Least count of the circular scale = ……….Degree.
I. Table for Scale reading with water
First position, a0 Second position, b0
M.S. V.S. Total reading
M.S. V.S. Total reading
II. Table for Measurement of θ
Sr. No.
Strength of sugar
solution, c
Scale reading with sugar solutionRotation, θ
degreesMean
θFirst position, a1 Second position, b1θ1=a1- a0 θ2=b1- b0
(%) gm/cc M.S. V.S.Total
reading M.S. V.S.Total
reading
1
2
3
Specific rotation, lcs ………………..deg/dm. gm/cc
Uses: (1) To determine the specific rotation of sugar solution. (2) It can be used to determine the concentration of solution for known specific rotation by Measuring optical rotation for the solution.
Source of error and Precautions:(i). The polarimeter tube should be rinsed before each observation with the corresponding solution/water.(ii). The end caps should be properly screwed after filling the solution/water.(iii). The end windows be clean and should not touched with fingers.(iv). The path of light through the solution should be free from air bubbles.(v). The solution water should be filleted before use.(vi). The position of the sensitive tint should be precisely set each time.(vii). The analyzer should not be rotated to and from during one set of data.
Experiment No.8
Aim: To determine the Resolving Power of a Telescope.Apparatus Used: A telescope, an adjustable rectangular slit, two parallel narrow slits 2 mm apart, traveling microscope and meter scale.
Formula used: Practical resolving power is d
D
1
.
Where, d = Width of the slit D = Distance between source of light and telescope.
Principle: The experiment is based on Raleigh’s criterion of resolution, according to which two closely spaced equally bright point sources are resoluble, when the central maxima in the diffraction pattern on the first minimum of the other.
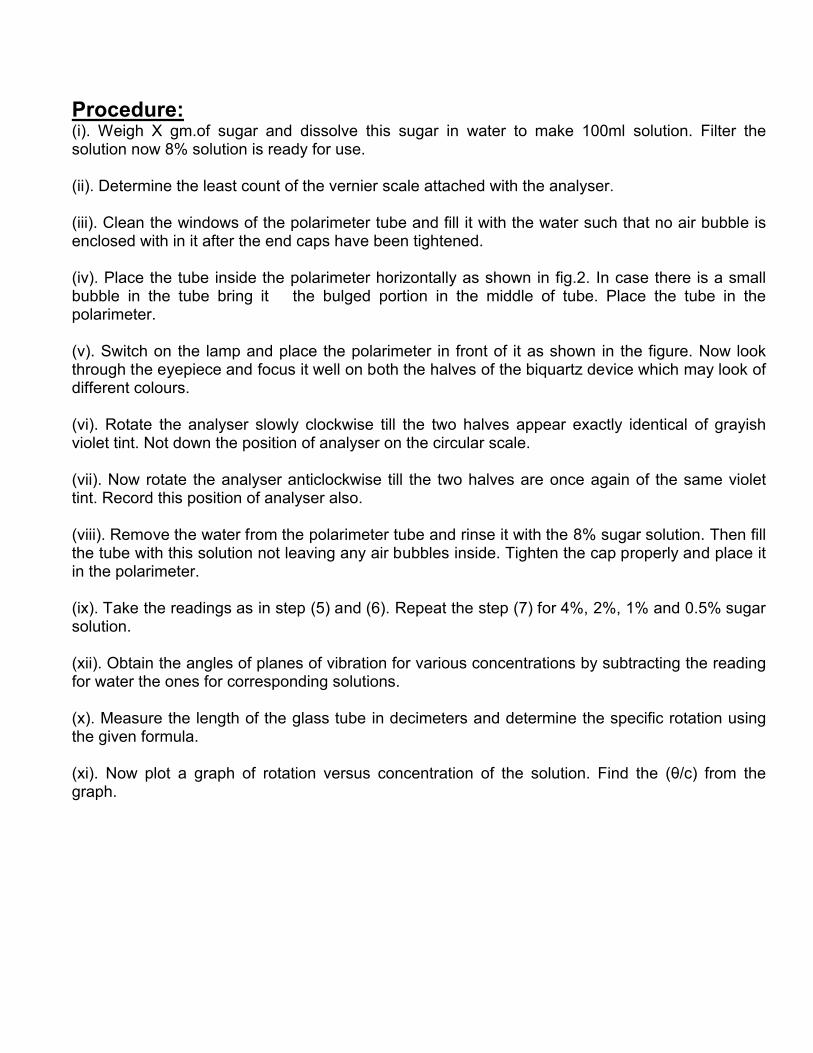
Theory:Resolving Power: The resolving power of a telescope is defined as the inverse of angle subtended at the objective of telescope by two distant objects, which are seen just separate. We know that the image of an object or illuminated slit consists of a central maximum surrounded by a no. of secondary maxima on both sides of the secondary maximum.Rayleigh’s criterion of resolution: “Two objects are said to be just resolved when the central maximum of image of one object coincides with the first minimum of the image of second object”.Diagram: Let a beam of light from a distant object O be incident normally on the objective of the telescope and focus and focus at point P1. Consider another nearby object O’. The light from object O’ is focused at P2. P1 and P2 are the positions of central maxima of diffraction patterns of images of objects O and O’. According to Rayleigh’s criterion just resolved when the central maximum of image of one object coincides with the first minimum of the image of second object. Hence from Fig.2 the path difference between the rays AP2 & BP2 is BM=ABSin. …..(1)Let AB=a is the width of rectangular slit when two objects are just resolved, then, BM=aSin=a (for small angles).The point P2 will correspond to the first minimum of the object O when path difference is
equal to , i.e.,a
a
dip
+d
+d
Resultant Intensity
Fig.1
M
B
A
O
O
O’
O’
P1
P2
Fig.2

So, theoretical resolving
power isa
1
.
If d is the distance between the two objects and D is their distance from the objectives of the
telescope, then, the angle subtended by two objects on the objective isD
d .
So, the practical resolving power isd
D
1
.
Procedure:(i). Mount the telescope on a stand such that its axis lies in the horizontal plane and the objects slits on another stand in front of sodium lamp as shown in Fig.3.(ii). Switch on the Na-lamp and open the adjustable slit by a micrometer screw attached with it. Move the telescope in horizontal plane and adjust such that the sharp and clear images of object slits are seen in the field of view of telescope.
(iii). Gradually reduce the width of the rectangular slit till the two images just ceased to be resolved. Note the micrometer reading. Again reduce the width of the slit till the complete darkness is obtained in the field of view and note the micrometer reading. The difference of these two reading gives the width of slit (a) under just resolved position.(iv). Measure the distance (D) between object slits and adjustable slit.(v). Repeat the experiment for different distances between the slit and object.(vi). Measure the distance between the two object slits (d) with the help of traveling microscope.
Sodiumlamp
Object slitsAdjustable slit
Telescope
D

Observations: (I). Determination of the least count of the microscope screwValue of one Main Scale Division, x =………….cm. Total no. of divisions in circular scale, n =…………. .Hence, least count of the microscope screw = x/n=……….cm.
(II). Table for the measurement of resolving power of telescope
Distance two object, d=1.75mm, Wavelength of sodium light, = 5893 Ǻ
Sr. No.
Distance between slit and object‘D’ (in meter)
Telescope readingWidth of slit
(a)a=X-Y(mm)
Value
of a
ValueOfD/d
When images cease to be just resolved
When complete darkness in the field
of view
M.S. V.S.Total
reading (mm)
M.S. V.S.Total
reading (mm)
1
2
3
Result: The comparison of theoretical and practical resolving powers is shown in the following table.
Sr. no. Distance, D, cm Practical resolving power,
a
Theoretical resolving
power, dD
1
2
3
Uses: It is used to determine the optical quality of the telescope.
Precaution and sources of error:(i). The object slits should be vertical and parallel to each other.(ii). The axis of telescope should be in horizontal plane.(iii). The width of the slit, a, should be adjusted carefully.(iv). The width, a, and d should be measured carefully.

EXPERIMENT:09AIM: To find the pitch of a scale using He- Ne Laser.
APPARATUS USED : He- Ne Laser, meter scale, Vertical stand to hold the scale, screen. FORMULA USED :
d = Where, Z = distance between scale and screen ym = distance of spot from the point of intersection. yo = distance between direct spot and the zeroth order spot m = any integer (say 0, 1, 2, 3, 4, -----) y = Wavelenght of the laser beam.
THEORY : The scale serves as a diffraction grating. When light strikes at grazing incidence, it is diffracted in to many orders(Fig. 1). The clarity and sepration of various orders in the diffraction pattern depends on the size and accuracy of the scale threading.
P
y4
y3
θm y2
θ1 y1 ym
Laser beam θ0 y0
0 Screw
β0 β1 β2 β3 -y0
d Z
Fig.1
Let A and C are consecutive threads (Fig 2). Consider two rays 1 and 2 incident on A and C at an angle I and diffracted at an angle 0m. Path difference between the two rays is
Δ = BC – AD = d sin I – d sinθm = d (sin I – sin θm) ----------(1)

For constructive interference; Δ = mλ; -----------(2)
Where m is an integer and order of diffraction pattern and y is the wavelength of light used. Therefore ,from (1 ) and (2),
d (sin I – sin θm) = mλ --------------(3)Thus the difference pattern is governed by the equation (3),The grating equation can also be expressed in terms of angle e and b in the form d(cos α– cos β0) = mλ ----------------(4)Where, E = 90º – I, b = 90º – θm
Using Binomial expansion,
------------(5) Cos α = cos β0; as α = β0 (for zeroth order)
------------(6)
Neglecting higher order terms in equations (5) and (6)
Hence the grating equation becomes,
‘d’ in equation(7) is a measure of the pitch of the given scale.
S.No.
Orderm
Distance of spot fromthe pt. of intersection‘O’ ym cm
ym-yo
cm
ym+yo
cm
ym2 – yo
2
cm
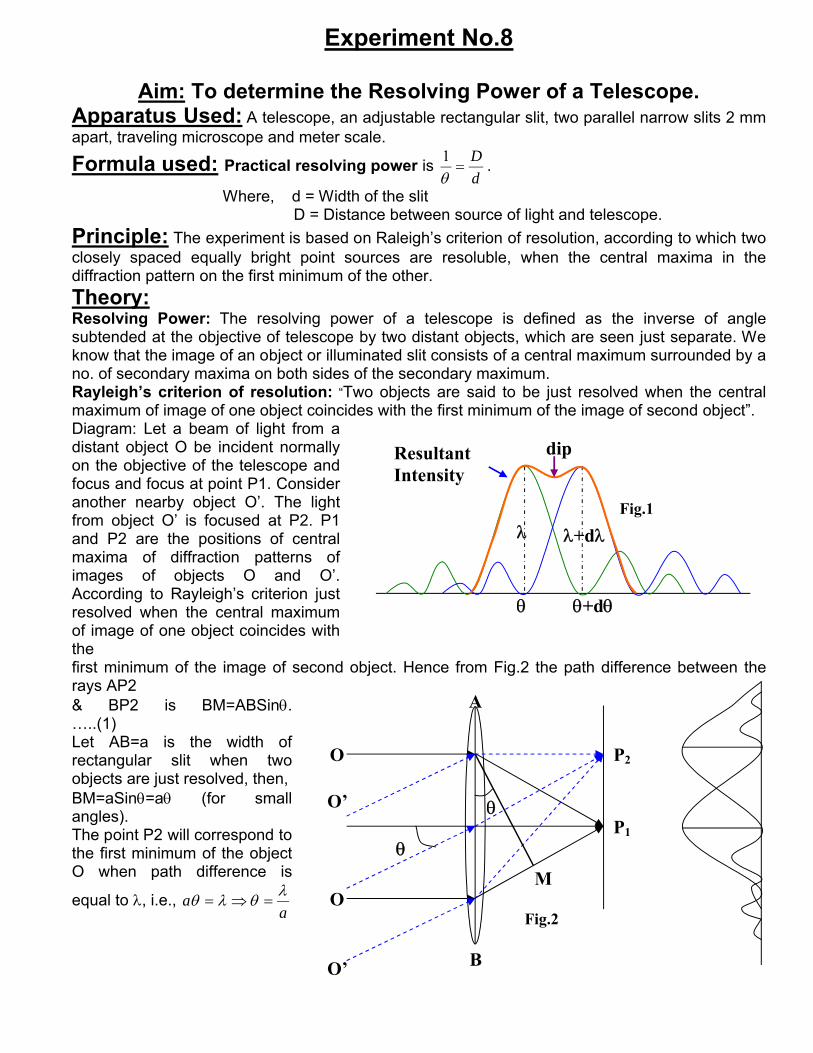
PROCEDURE :
1. Switch on the laser and adjust its leveling screws such that the laser beam is slightly tilted from the horizontal line joining the laser and the screen.
2. Place the scale on a movable stand, normal to the incident laser beam. Adjust the height of the stand so that the laser beam falls on it at grazing angle (i.e., I = 87 º - 89 º ). The diffraction pattern is observed at a distance of 3 – 4 meters away from the scale.
3. Mark the positions of various spots on the screen. These spots corresponds to various orders of diffraction, the brightest being the zeroth order.
4. Remove the scale away from the path of the laser beam and mark the position of direct spot. 5. Switch off the laser and find one mid point, ‘O’ of the direct spot and the zeroth order spot.
Measure the distance of various spots from the point ‘O’.6. Measure the distance between the scale and the screen and determine the pitch of the scale
using the formula.
OBSERVATIONS & CALCULATIONS:
Wave length of laser light y = 6328A0Distance between scale and screen z = ------ cm.
Distance between direct spot and the zeroth order spot, 2y0 = ------- cm.
Table to find the position of diffracted spots
RESULT:
The pitch of the scale = -------- cm.
SOURCES OF ERROR AND PRECAUTIONS:
1. Incidence of laser beam on the scale should be at grazing angle as the formula has been derived for this condition only.2. The plan containing the incident and the diffracted beams and the plane of screen should be perpendicular to each other.3. The positions of various spots should be accurately measured.4. One should not look in to the laser beam directly, as it may cause injury to the eyes.5. Laser should be switched on only during taking the observations.
Related Documents