Edited by Physicochemical and Sensory Evaluation of Grain-Based Food Luca Serventi, Charles Brennan and Rana Mustafa Printed Edition of the Special Issue Published in Foods www.mdpi.com/journal/foods

Welcome message from author
This document is posted to help you gain knowledge. Please leave a comment to let me know what you think about it! Share it to your friends and learn new things together.
Transcript
Edited by
Physicochemical and Sensory Evaluation of Grain-Based Food
Luca Serventi, Charles Brennan and Rana Mustafa
Printed Edition of the Special Issue Published in Foods
www.mdpi.com/journal/foods

Physicochemical and SensoryEvaluation of Grain-Based Food

Physicochemical and SensoryEvaluation of Grain-Based Food
Editors
Luca Serventi
Charles Brennan
Rana Mustafa
MDPI • Basel • Beijing • Wuhan • Barcelona • Belgrade • Manchester • Tokyo • Cluj • Tianjin
Editors
Luca Serventi
Lincoln University
New Zealand
Charles Brennan
RMIT University
Australia
Rana Mustafa
University of Saskatchewan
Canada
Editorial Office
MDPI
St. Alban-Anlage 66
4052 Basel, Switzerland
This is a reprint of articles from the Special Issue published online in the open access journal
Foods (ISSN 2304-8158) (available at: https://www.mdpi.com/journal/foods/special issues/
physicochemical sensory grain).
For citation purposes, cite each article independently as indicated on the article page online and as
indicated below:
LastName, A.A.; LastName, B.B.; LastName, C.C. Article Title. Journal Name Year, Volume Number,
Page Range.
ISBN 978-3-0365-4449-6 (Hbk)
ISBN 978-3-0365-4450-2 (PDF)
© 2022 by the authors. Articles in this book are Open Access and distributed under the Creative
Commons Attribution (CC BY) license, which allows users to download, copy and build upon
published articles, as long as the author and publisher are properly credited, which ensures maximum
dissemination and a wider impact of our publications.
The book as a whole is distributed by MDPI under the terms and conditions of the Creative Commons
license CC BY-NC-ND.
Contents
Luca Serventi, Charles Brennan and Rana Mustafa
Physicochemical and Sensory Evaluation of Grain-Based FoodReprinted from: Foods 2022, 11, 1237, doi:10.3390/foods11091237 . . . . . . . . . . . . . . . . . . . 1
Maija Greis, Taru Sainio, Kati Katina, Alissa A. Nolden, Amanda J. Kinchla, Laila Seppa and
Riitta Partanen
Physicochemical Properties and Mouthfeel in Commercial Plant-Based YogurtsReprinted from: Foods 2022, 11, 941, doi:10.3390/foods11070941 . . . . . . . . . . . . . . . . . . . 3
Etiene Valeria Aguiar, Fernanda Garcia Santos, Ana Carolina Ladeia Solera Centeno and Vanessa Dias Capriles
Defining Amaranth, Buckwheat and Quinoa Flour Levels in Gluten-Free Bread: A Simultaneous Improvement on Physical Properties, Acceptability and Nutrient Composition through Mixture DesignReprinted from: Foods 2022, 11, 848, doi:10.3390/foods11060848 . . . . . . . . . . . . . . . . . . . 19
Jovana Kojic, Miona Belovic, Jelena Krulj, Lato Pezo, Nemanja Teslic, Predrag Kojic, Lidija Peic Tukuljac, Vanja Seregelj and Nebojsa IlicTextural, Color and Sensory Features of Spelt Wholegrain Snack Enriched with BetaineReprinted from: Foods 2022, 11, 475, doi:10.3390/foods11030475 . . . . . . . . . . . . . . . . . . . 35
Srinivasan Ramalingam, Ashutosh Bahuguna, SeMi Lim, Ah-Ryeong Joe, Jong-Suk Lee,
So-Young Kim and Myunghee Kim
Physicochemical, Microbial, and Volatile Compound Characteristics of Gochujang, FermentedRed Pepper Paste, Produced by Traditional Cottage IndustriesReprinted from: Foods 2022, 11, 375, doi:10.3390/foods11030375 . . . . . . . . . . . . . . . . . . . 49
Fatma Boukid and Mohammed Gagaoua
Vegan Egg: A Future-Proof Food Ingredient?Reprinted from: Foods 2022, 11, 161, doi:10.3390/foods11020161 . . . . . . . . . . . . . . . . . . . 63
Yue He, Sarah K. Purdy, Timothy J. Tse, Bunyamin Tar’an, Venkatesh Meda, Martin J. T. Reaney and Rana Mustafa
Standardization of Aquafaba Production and Application in Vegan Mayonnaise AnalogsReprinted from: Foods 2021, 10, 1978, doi:10.3390/foods10091978 . . . . . . . . . . . . . . . . . . . 77
Jinghong Wang, Margaret Anne Brennan, Charles Stephen Brennan and Luca Serventi Effect of Vegetable Juice, Puree, and Pomace on Chemical and Technological Quality of Fresh PastaReprinted from: Foods 2021, 10, 1931, doi:10.3390/foods10081931 . . . . . . . . . . . . . . . . . . . 93
Juncai Tu, Margaret Anne Brennan, Gang Wu, Weidong Bai, Ping Cheng, Bin Tian and Charles Stephen Brennan
Delivery of Phenolic Compounds, Peptides and β-Glucan to the Gastrointestinal Tract by Incorporating Dietary Fibre-Rich Mushrooms into Sorghum BiscuitsReprinted from: Foods 2021, 10, 1812, doi:10.3390/foods10081812 . . . . . . . . . . . . . . . . . . . 105
Da-Been Lee, Mi-Ran Kim, Jeong-Ae Heo, Yang-Soo Byeon and Sang-Sook Kim
Physicochemical Properties and Drivers of Liking and Disliking for Cooked Rice ContainingVarious Types of Processed Whole WheatReprinted from: Foods 2021, 10, 1470, doi:10.3390/foods10071470 . . . . . . . . . . . . . . . . . . . 123
v
Weijun Chen, Hoi Tung Chiu, Ziqian Feng, Evelyne Maes and Luca Serventi
Effect of Spray-Drying and Freeze-Drying on the Composition, Physical Properties, and SensoryQuality of Pea Processing Water (Liluva)Reprinted from: Foods 2021, 10, 1401, doi:10.3390/foods10061401 . . . . . . . . . . . . . . . . . . . 135
Vasileia Sereti, Athina Lazaridou, Costas G. Biliaderis and Soultana Maria Valamoti
Reinvigorating Modern Breadmaking Based on Ancient Practices and Plant Ingredients, withImplementation of a Physicochemical ApproachReprinted from: Foods 2021, 10, 789, doi:10.3390/foods10040789 . . . . . . . . . . . . . . . . . . . 147
Emmanuel Oladeji Alamu, Bukola Olaniyan and Busie Maziya-Dixon
Diversifying the Utilization of Maize at Household Level in Zambia: Quality and ConsumerPreferences of Maize-Based SnacksReprinted from: Foods 2021, 10, 750, doi:10.3390/foods10040750 . . . . . . . . . . . . . . . . . . . 169
vi
Citation: Serventi, L.; Brennan, C.;
Mustafa, R. Physicochemical and
Sensory Evaluation of Grain-Based
Food. Foods 2022 , 11, 1237. https://
doi.org/10.3390/foods11091237
Received: 14 April 2022
Accepted: 20 April 2022
Published: 26 April 2022
Publisher’s Note: MDPI stays neutral
with regard to jurisdictional claims in
published maps and institutional affil-
iations.
Copyright: © 2022 by the authors.
Licensee MDPI, Basel, Switzerland.
This article is an open access article
distributed under the terms and
conditions of the Creative Commons
Attribution (CC BY) license (https://
creativecommons.org/licenses/by/
4.0/).
foods
Editorial
Physicochemical and Sensory Evaluation of Grain-Based Food
Luca Serventi 1,*, Charles Brennan 2 and Rana Mustafa 3
1 Department of Wine, Food and Molecular Biosciences, Faculty of Agriculture and Life Sciences,Lincoln University, Lincoln 7647, New Zealand
2 School of Science, RMIT University, P.O. Box 2474, Melbourne, VIC 3001, Australia;[email protected]
3 Department of Plant Sciences, College of Agriculture and Bioresources, University of Saskatchewan,51 Campus Drive, Saskatoon, SK S7N 5A8, Canada; [email protected]
* Correspondence: [email protected]
Grain-based food is a staple of the human diet. Whether it is cereals, legumes orpseudocereals, grain-based diets provide nutritional benefits. This can be in the formof macronutrients (starch, fibre, protein, and lipids) and micronutrients (minerals andvitamins), as well as bioactive peptides and phytochemicals [1]. Grains are used to developbakery products, such as savory (bread, gluten-free bread, crackers, and pasta) and sweet(cakes and muffins) [2] in addition to plant-based beverages (milk alternatives), fermentedproducts (such as yoghurt and fermented paste), extrudates and other snacks [3]. Fur-thermore, grain-based ingredients offer emulsifying, foaming and thickening abilities [4].Raw materials include cereals (barley, corn, millet, rice, rye, spelt, wheat), legumes (beans,chickpeas, lentils, peas, and soybeans) and pseudocereals (amaranth, buckwheat, quinoa,and sorghum). The functionalities are numerous, spanning from health to taste. In order tofully exploit the nutritional potential of grain-based foods, consumer acceptance must beachieved. This will guarantee compliance. The acceptability of food can be studied bothinstrumentally and via sensory science.
The physicochemical evaluation of food can be performed via numerous techniques,exploring a broad range of functionalities. Foaming, emulsifying and thickening abilitiescan be assessed with specific tests. These results offer valuable information on grain-basedingredients capability to incorporate air (thus increasing volume), stabilize emulsion sys-tems (air in water, oil in water, and water in oil) and increase viscosity, offering mouthfeel,while preventing syneresis and phase separation upon storage. Food products can be as-sessed for texture, rheology (viscosity and pasting properties), thermal properties (throughdifferential scanning calorimetry and thermogravimetric analysis) as well as water mobil-ity (nuclear magnetic resonance) in addition to image analysis (microscopy and particlesize) [5–7].
Sensory evaluation includes both consumer preference and trained panels. Consumerpanels reveal human preferences for appearance, aroma, taste and texture. It can beperformed traditionally in sensory booths, or with modern techniques such as immersivetechnologies and augmented reality. The goal is to predict consumers’ acceptability of foodproducts. Tests include hedonic scale, threshold, the triangle test and others [8]. Trainedpanels are used in focus groups, which allow us to study specific attributes with expertsof each type of food. This technique is useful in describing new foods as well as in theinvestigation of their shelf-life stability [9].
Sustainable food supply is a contemporary issue of high relevance. Societies must beable to produce food sustainably, meaning with lower environmental impact (less carbonand water footprint, and minimized land use), high nutritional quality, safety and sensoryquality. Local crops, plant-based foods and upcycling of processing side streams are threeanswers to this call. The application of grains to non-traditional foods (egg, dairy, meatalternatives) and traditional (bakery) offers new ways to deliver nutrition along with high
Foods 2022 , 11, 1237. https://doi.org/10.3390/foods11091237 https://www.mdpi.com/journal/foods1
Foods 2022 , 11, 1237
taste. Examples of upcycling include aquafaba and liluva (the processing water of legumes)used in egg replacers or as alternatives to hydrocolloids [10–12].
In recent years, there has also been attention focused on the bioactive ingredients ofcereal grains and their benefits in terms of nutritional well-being [13,14]. However, thesebioactive ingredients (fibre and phenolic compounds for instance) can affect the physicalnature of foods as well as their sensory quality [15]. This is particularly the case whenconsidering the use of wholegrains in foods [16].
Therefore, the aim of this Special Issue is to illustrate the latest scientific advances inthe field of grain-based foods, investigating their physicochemical properties and sensoryqualities. The focus is on sustainable solutions such as local crops (amaranth, ancientgrains, buckwheat, maize, quinoa, rice, and spelt), plant-based products (yoghurt and eggalternatives) and upcycled ingredients (aquafaba, liluva, and pomace).
Author Contributions: Conceptualization, L.S., C.B. and R.M.; methodology, L.S., C.B. and R.M.,software, L.S., C.B. and R.M.; validation, L.S., C.B. and R.M.; formal analysis, L.S., C.B. and R.M.;investigation, L.S., C.B. and R.M.; resources, L.S., C.B. and R.M.; data curation, L.S., C.B. and R.M.writing—original draft preparation, L.S.; writing—review and editing, L.S. and C.B.; visualization,L.S., C.B. and R.M.; supervision; L.S., C.B. and R.M. Project administration, L.S., C.B. and R.M.;funding acquisition, L.S., C.B. and R.M. All authors have read and agreed to the published version ofthe manuscript.
Funding: This research received no external funding.
Conflicts of Interest: The authors declare no conflict of interest.
References
1. Carcea, M. Nutritional value of grain-based foods. Foods 2020, 9, 504. [CrossRef] [PubMed]2. Hui, Y.H.; Corke, H.; De Leyn, I.; Nip, W.K.; Cross, N.A. (Eds.) Bakery Products: Science and Technology; John Wiley & Sons: New
York, NY, USA, 2008.3. Satija, A.; Hu, F.B. Plant-based diets and cardiovascular health. Trends Cardiovasc. Med. 2018, 28, 437–441. [CrossRef] [PubMed]4. Woomer, J.S.; Adedeji, A.A. Current applications of gluten-free grains—A review. Crit. Rev. Food Sci. Nutr. 2021, 61, 14–24.
[CrossRef] [PubMed]5. Joyner, H.S. Explaining food texture through rheology. Curr. Opin. Food Sci. 2018, 21, 7–14. [CrossRef]6. Schiraldi, A.; Dimitrios, F. Calorimetry and thermal analysis in food science. J. Therm. Anal. Calorim. 2019, 138, 2721–2732.
[CrossRef]7. Chen, Q.; Tai, X.; Li, J.; Li, C.; Guo, L. High Internal Phase Emulsions Synergistically Stabilized by Sodium Carboxymethyl
Cellulose and Palm Kernel Oil Ethoxylates as an Essential Oil Delivery System. J. Agric. Food Chem. 2021, 69, 4191–4203. [CrossRef][PubMed]
8. Aschemann-Witzel, J.; Ares, G.; Thøgersen, J.; Monteleone, E. A sense of sustainability?—How sensory consumer science cancontribute to sustainable development of the food sector. Trends Food Sci. Technol. 2019, 90, 180–186. [CrossRef]
9. Djekic, I.; Lorenzo, J.M.; Munekata, P.E.; Gagaoua, M.; Tomasevic, I. Review on characteristics of trained sensory panels in foodscience. J. Texture Stud. 2021, 52, 501–509. [CrossRef]
10. Campos-Vega, R.; Oomah, B.D.; Vergara-Castaneda, H.A. (Eds.) Food Wastes and By-Products: Nutraceutical and Health Potential;John Wiley & Sons: New York, NY, USA, 2020.
11. Mustafa, R.; Reaney, M.J. Aquafaba, from food waste to a value-added product. In Food Wastes By-Products: Nutraceutical HealthPotential; Wiley: Hoboken, NJ, USA, 2020; pp. 93–126. [CrossRef]
12. Serventi, L. (Ed.) Upcycling Legume Water: From Wastewater to Food Ingredients; Springer Nature: Berlin, Germany, 2020; p. 174.13. Radoš, K.; Cukelj Mustac, N.; Drakula, S.; Novotni, D.; Benkovic, M.; Kraljic, K.; Štifter, S.; Voucko, B.; Curic, D. The effect of
cryo-grinding and size separation on bioactive profile of buckwheat hulls. Int. J. Food Sci. Technol. 2022, 57, 1911–1919. [CrossRef]14. Yin, R.; Fu, Y.; Yousaf, L.; Xue, Y.; Hu, J.; Hu, X.; Shen, Q. Crude and refined millet bran oil alleviate lipid metabolism disorders,
oxidative stress and affect the gut microbiota composition in high-fat diet-induced mice. Int. J. Food Sci. Technol. 2022, 57,2600–2610. [CrossRef]
15. Chumsri, P.; Chaijan, M.; Panpipat, W. A comparison of nutritional values, physicochemical features and in vitro bioactivitiesof Southern Thai short-grain brown rice with commercial long-grain varieties. Int. J. Food Sci. Technol. 2021, 56, 6515–6526.[CrossRef]
16. Allai, F.M.; Azad, Z.; Gul, K.; Dar, B.N. Wholegrains: A review on the amino acid profile, mineral content, physicochemical,bioactive composition and health benefits. Int. J. Food Sci. Technol. 2022, 57, 1849–1865. [CrossRef]
2
Citation: Greis, M.; Sainio, T.; Katina,
K.; Nolden, A.A.; Kinchla, A.J.; Seppä,
L.; Partanen, R. Physicochemical
Properties and Mouthfeel in
Commercial Plant-Based Yogurts.
Foods 2022, 11, 941. https://doi.org/
10.3390/foods11070941
Academic Editors: Luca Serventi,
Charles Brennan and Rana Mustafa
Received: 24 February 2022
Accepted: 21 March 2022
Published: 24 March 2022
Publisher’s Note: MDPI stays neutral
with regard to jurisdictional claims in
published maps and institutional affil-
iations.
Copyright: © 2022 by the authors.
Licensee MDPI, Basel, Switzerland.
This article is an open access article
distributed under the terms and
conditions of the Creative Commons
Attribution (CC BY) license (https://
creativecommons.org/licenses/by/
4.0/).
foods
Article
Physicochemical Properties and Mouthfeel in CommercialPlant-Based Yogurts
Maija Greis 1,2,*, Taru Sainio 1, Kati Katina 1, Alissa A. Nolden 2, Amanda J. Kinchla 2, Laila Seppä 1
and Riitta Partanen 3
1 Department of Food and Nutrition, University of Helsinki, P.O. Box 66, 00014 Helsinki, Finland;[email protected] (T.S.); [email protected] (K.K.); [email protected] (L.S.)
2 Department of Food Science, University of Massachusetts Amherst, Amherst, MA 01003, USA;[email protected] (A.A.N.); [email protected] (A.J.K.)
3 Valio Ltd., P.O. Box 10, FI-00039 Helsinki, Finland; [email protected]* Correspondence: [email protected]
Abstract: There is a growing need for plant-based yogurts that meet consumer demands in terms oftexture. However, more research is required to understand the relationship between physicochemicaland mouthfeel properties in plant-based yogurts. The purpose of this study was to determine thephysicochemical properties of five commercial plant-based yogurt alternatives with different chemicalcompositions, making comparisons to dairy yogurts and thick, creamy, thin, and watery mouthfeelsensations. The physicochemical parameters studied included large and small deformation rheology,particle size, soluble solids, acidity, and chemical composition. Significant differences in flow behaviorand small deformation rheology were found between dairy- and plant-based yogurts. Among plant-based yogurts thick, creamy, thin, and watery mouthfeel sensations were strongly associated withsteady shear rates and apparent viscosity. The results highlight the importance of large deformationrheology to advance the use of plant-based ingredients in the development of yogurt alternatives.Furthermore, this study demonstrates that dairy- and plant-based yogurts with a similar mouthfeelprofiles may have different viscoelastic properties, which indicates that instrumental and sensorymethods should not be considered substitutive but complementary methods when developingplant-based yogurts in a cost-effective and timely manner.
Keywords: physicochemical properties; rheology; sensory evaluation; dynamic mouthfeel perception;plant-based yogurt alternative; oat
1. Introduction
In terms of dairy alternatives, oat-based products are a popular substitute due to theirmild flavor properties and potential positive health benefits [1]. The functional propertiesinherent to plant-based ingredients often include a lower gelling strength compared toanimal-based systems; therefore, the gelling structures are enhanced through the use ofhydrocolloids [2–5]. In previous work, we reported that the sensory properties amongoat-based yogurts differ, some of them resembling their dairy counterparts, both in mouth-feel and pleasantness [6]. Due to the complexity and variety in the composition of theseproducts, it is difficult to explain their mouthfeel differences through compositional factorsalone. Therefore, rheology, with the help of acidity, soluble solids, and particle size mea-surements, was applied to better understand the mouthfeel sensations and pleasantness ofthese plant-based yogurts.
There is extensive prior literature exploring the relationship between the rheologicalproperties and sensory attributes of dairy yogurts [4,7–14]. Other physicochemical parame-ters have also been successfully linked to mouthfeel in dairy yogurts. Particle size-relatedparameters have been shown to influence the creamy mouthfeel [14–18]. In addition, thereduction in sugar in dairy yogurt has been linked to a decrease in viscosity, resulting in
Foods 2022, 11, 941. https://doi.org/10.3390/foods11070941 https://www.mdpi.com/journal/foods3
Foods 2022, 11, 941
a thin and watery mouthfeel [19]. According to another study, a watery mouthfeel is theopposite to a creamy one and relates to low-fat content in emulsion-filled gels [20].
An increasing number of studies are exploring the consumer acceptance and physic-ochemical properties of different plant-based yogurts [2,5,21,22]. A noteworthy studyreports the rheological properties, sensory perception, and consumer acceptability of lacticacid fermented, oat-based gels [2]. They demonstrated that a gel with a higher total solidscontent was perceived as creamier compared to a gel with a lower total solids content.Another study reports the compositional and physicochemical properties with liking of dif-ferent commercial plant-based yogurts [20]. They concluded that soy, coconut, and cashewyogurts scored similarly in terms of texture liking as dairy yogurts. A more recent studyaims to understand the sensory acceptability and textural properties in Australian com-mercial dairy and plant-based samples [20]. The selected soy, coconut, and dairy yogurtsshowed wide variations in their microstructure and rheology. The results highlight that theprotein content, gel firmness, and consistency coefficient displayed a positive relationshipwith overall liking [21]. Notably, these previous studies did not include oat-based yogurtsin their experiments [21,22].
Our study aimed to determine the physicochemical properties of plant-based yogurts.The results were compared to dairy counterparts and previously studied mouthfeel prop-erties. Our hypothesis is that oat-based structures are predominantly carbohydrate gels,and thus provide a more fine-stranded network compared to dairy yogurts. Instead, dairyyogurts provide a distinguished particle gels system attributed to the network of proteinparticles and protein-covered fat droplets. Our previous findings suggest that the domi-nant mouthfeel attributes perceived during the early stages of mastication have a largerimpact on mouthfeel pleasantness than the dominant attributes perceived later duringmastication [6]. Therefore, conventional rheological methods are expected to be relevant indetermining factors that contribute to mouthfeel liking and disliking.
We will examine these questions using a variety of commercial products. They repre-sent a wide range of mouthfeel properties that would not be achievable if using a simple,controlled model product. By choosing a set of unflavored commercial products from thesame plant source, we limit the differences in flavor and thus focus only on the mouthfeel.In this experiment, our focus is on four following specific positive and negative mouthfeelsensations contributing to the liking of the products: thickness and creaminess (positive)and wateriness and thinness (negative) based on the findings in our previous study [6].
2. Materials and Methods
2.1. Samples
Five unflavored plant-based yogurt alternatives (P1-P5) and two unflavored dairyyogurts (D1-D2) were purchased from a local supermarket (Table 1) in Finland. The plant-based products were spoonable yogurt-like semisolid snacks labeled as “oat-based yogurts”.Dairy-based references included two spoonable dairy yogurts (fat contents of 2.5% and 4%).All samples were fermented with the help of an added starter. These yogurt alternativeswere selected due to their different structures. In addition, they represent the variety ofoat-based yogurt alternatives in the market. The reference samples resembled typical dairyyogurts in the market. The products were sourced in duplicate so that analysis could besplit for sensory [6], and physicochemical analyses. All samples were stored at 5 ◦C prior tothe sensory and physicochemical analyses. All samples were analyzed both in the sensoryanalysis and instrumental measurements at 10 ◦C within their declared shelf-life period.The studied yogurt alternatives are referred to as “plant-based” instead of “oat-basedyogurts”, as they contain pea and potato protein in addition to oat protein. All instrumentalmeasurements were performed in triplicate, apart from particle size assessment, wherethree separate measurements were conducted for each sample. A summary of the analysisis presented in Table 2.
4
Foods 2022, 11, 941
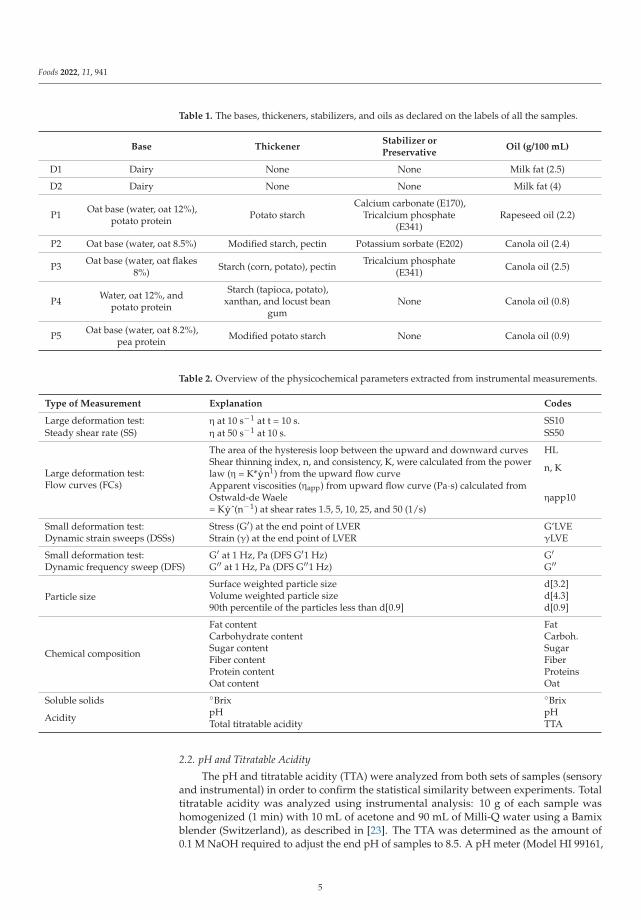
Table 1. The bases, thickeners, stabilizers, and oils as declared on the labels of all the samples.
Base ThickenerStabilizer orPreservative
Oil (g/100 mL)
D1 Dairy None None Milk fat (2.5)
D2 Dairy None None Milk fat (4)
P1 Oat base (water, oat 12%),potato protein Potato starch
Calcium carbonate (E170),Tricalcium phosphate
(E341)Rapeseed oil (2.2)
P2 Oat base (water, oat 8.5%) Modified starch, pectin Potassium sorbate (E202) Canola oil (2.4)
P3 Oat base (water, oat flakes8%) Starch (corn, potato), pectin Tricalcium phosphate
(E341) Canola oil (2.5)
P4 Water, oat 12%, andpotato protein
Starch (tapioca, potato),xanthan, and locust bean
gumNone Canola oil (0.8)
P5 Oat base (water, oat 8.2%),pea protein Modified potato starch None Canola oil (0.9)
Table 2. Overview of the physicochemical parameters extracted from instrumental measurements.
Type of Measurement Explanation Codes
Large deformation test: η at 10 s−1 at t = 10 s. SS10Steady shear rate (SS) η at 50 s−1 at 10 s. SS50
The area of the hysteresis loop between the upward and downward curves HL
Large deformation test:Flow curves (FCs)
Shear thinning index, n, and consistency, K, were calculated from the powerlaw (η = K* n1) from the upward flow curve n, K
Apparent viscosities (ηapp) from upward flow curve (Pa·s) calculated fromOstwald-de Waele= K ˆ(n−1) at shear rates 1.5, 5, 10, 25, and 50 (1/s)
ηapp10
Small deformation test: Stress (G′) at the end point of LVER G’LVEDynamic strain sweeps (DSSs) Strain (γ) at the end point of LVER γLVE
Small deformation test: G′ at 1 Hz, Pa (DFS G′1 Hz) G′Dynamic frequency sweep (DFS) G′′ at 1 Hz, Pa (DFS G′′1 Hz) G′′
Particle sizeSurface weighted particle size d[3.2]Volume weighted particle size d[4.3]90th percentile of the particles less than d[0.9] d[0.9]
Chemical composition
Fat content FatCarbohydrate content Carboh.Sugar content SugarFiber content FiberProtein content ProteinsOat content Oat
Soluble solids ◦Brix ◦Brix
Acidity pH pHTotal titratable acidity TTA
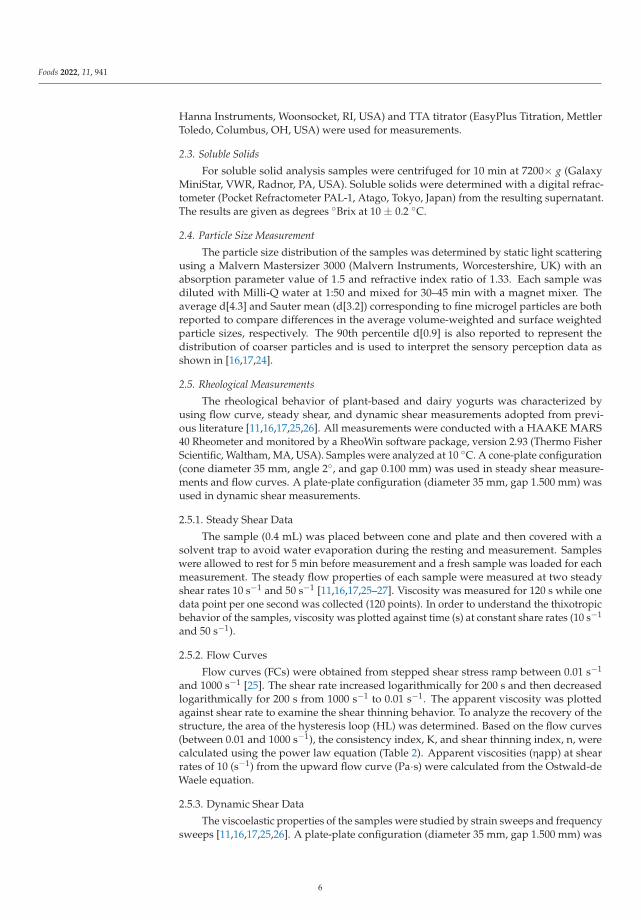
2.2. pH and Titratable Acidity
The pH and titratable acidity (TTA) were analyzed from both sets of samples (sensoryand instrumental) in order to confirm the statistical similarity between experiments. Totaltitratable acidity was analyzed using instrumental analysis: 10 g of each sample washomogenized (1 min) with 10 mL of acetone and 90 mL of Milli-Q water using a Bamixblender (Switzerland), as described in [23]. The TTA was determined as the amount of0.1 M NaOH required to adjust the end pH of samples to 8.5. A pH meter (Model HI 99161,
5
Foods 2022, 11, 941
Hanna Instruments, Woonsocket, RI, USA) and TTA titrator (EasyPlus Titration, MettlerToledo, Columbus, OH, USA) were used for measurements.
2.3. Soluble Solids
For soluble solid analysis samples were centrifuged for 10 min at 7200× g (GalaxyMiniStar, VWR, Radnor, PA, USA). Soluble solids were determined with a digital refrac-tometer (Pocket Refractometer PAL-1, Atago, Tokyo, Japan) from the resulting supernatant.The results are given as degrees ◦Brix at 10 ± 0.2 ◦C.
2.4. Particle Size Measurement
The particle size distribution of the samples was determined by static light scatteringusing a Malvern Mastersizer 3000 (Malvern Instruments, Worcestershire, UK) with anabsorption parameter value of 1.5 and refractive index ratio of 1.33. Each sample wasdiluted with Milli-Q water at 1:50 and mixed for 30–45 min with a magnet mixer. Theaverage d[4.3] and Sauter mean (d[3.2]) corresponding to fine microgel particles are bothreported to compare differences in the average volume-weighted and surface weightedparticle sizes, respectively. The 90th percentile d[0.9] is also reported to represent thedistribution of coarser particles and is used to interpret the sensory perception data asshown in [16,17,24].
2.5. Rheological Measurements
The rheological behavior of plant-based and dairy yogurts was characterized byusing flow curve, steady shear, and dynamic shear measurements adopted from previ-ous literature [11,16,17,25,26]. All measurements were conducted with a HAAKE MARS40 Rheometer and monitored by a RheoWin software package, version 2.93 (Thermo FisherScientific, Waltham, MA, USA). Samples were analyzed at 10 ◦C. A cone-plate configuration(cone diameter 35 mm, angle 2◦, and gap 0.100 mm) was used in steady shear measure-ments and flow curves. A plate-plate configuration (diameter 35 mm, gap 1.500 mm) wasused in dynamic shear measurements.
2.5.1. Steady Shear Data
The sample (0.4 mL) was placed between cone and plate and then covered with asolvent trap to avoid water evaporation during the resting and measurement. Sampleswere allowed to rest for 5 min before measurement and a fresh sample was loaded for eachmeasurement. The steady flow properties of each sample were measured at two steadyshear rates 10 s−1 and 50 s−1 [11,16,17,25–27]. Viscosity was measured for 120 s while onedata point per one second was collected (120 points). In order to understand the thixotropicbehavior of the samples, viscosity was plotted against time (s) at constant share rates (10 s−1
and 50 s−1).
2.5.2. Flow Curves
Flow curves (FCs) were obtained from stepped shear stress ramp between 0.01 s−1
and 1000 s−1 [25]. The shear rate increased logarithmically for 200 s and then decreasedlogarithmically for 200 s from 1000 s−1 to 0.01 s−1. The apparent viscosity was plottedagainst shear rate to examine the shear thinning behavior. To analyze the recovery of thestructure, the area of the hysteresis loop (HL) was determined. Based on the flow curves(between 0.01 and 1000 s−1), the consistency index, K, and shear thinning index, n, werecalculated using the power law equation (Table 2). Apparent viscosities (ηapp) at shearrates of 10 (s−1) from the upward flow curve (Pa·s) were calculated from the Ostwald-deWaele equation.
2.5.3. Dynamic Shear Data
The viscoelastic properties of the samples were studied by strain sweeps and frequencysweeps [11,16,17,25,26]. A plate-plate configuration (diameter 35 mm, gap 1.500 mm) was
6
Foods 2022, 11, 941
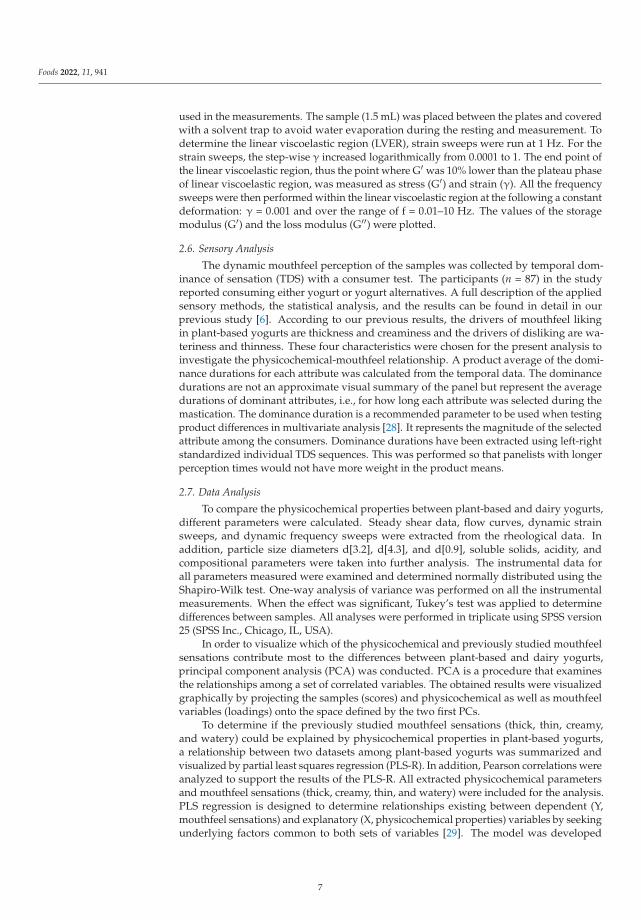
used in the measurements. The sample (1.5 mL) was placed between the plates and coveredwith a solvent trap to avoid water evaporation during the resting and measurement. Todetermine the linear viscoelastic region (LVER), strain sweeps were run at 1 Hz. For thestrain sweeps, the step-wise γ increased logarithmically from 0.0001 to 1. The end point ofthe linear viscoelastic region, thus the point where G′ was 10% lower than the plateau phaseof linear viscoelastic region, was measured as stress (G′) and strain (γ). All the frequencysweeps were then performed within the linear viscoelastic region at the following a constantdeformation: γ = 0.001 and over the range of f = 0.01–10 Hz. The values of the storagemodulus (G′) and the loss modulus (G′′) were plotted.
2.6. Sensory Analysis
The dynamic mouthfeel perception of the samples was collected by temporal dom-inance of sensation (TDS) with a consumer test. The participants (n = 87) in the studyreported consuming either yogurt or yogurt alternatives. A full description of the appliedsensory methods, the statistical analysis, and the results can be found in detail in ourprevious study [6]. According to our previous results, the drivers of mouthfeel likingin plant-based yogurts are thickness and creaminess and the drivers of disliking are wa-teriness and thinness. These four characteristics were chosen for the present analysis toinvestigate the physicochemical-mouthfeel relationship. A product average of the domi-nance durations for each attribute was calculated from the temporal data. The dominancedurations are not an approximate visual summary of the panel but represent the averagedurations of dominant attributes, i.e., for how long each attribute was selected during themastication. The dominance duration is a recommended parameter to be used when testingproduct differences in multivariate analysis [28]. It represents the magnitude of the selectedattribute among the consumers. Dominance durations have been extracted using left-rightstandardized individual TDS sequences. This was performed so that panelists with longerperception times would not have more weight in the product means.
2.7. Data Analysis
To compare the physicochemical properties between plant-based and dairy yogurts,different parameters were calculated. Steady shear data, flow curves, dynamic strainsweeps, and dynamic frequency sweeps were extracted from the rheological data. Inaddition, particle size diameters d[3.2], d[4.3], and d[0.9], soluble solids, acidity, andcompositional parameters were taken into further analysis. The instrumental data forall parameters measured were examined and determined normally distributed using theShapiro-Wilk test. One-way analysis of variance was performed on all the instrumentalmeasurements. When the effect was significant, Tukey’s test was applied to determinedifferences between samples. All analyses were performed in triplicate using SPSS version25 (SPSS Inc., Chicago, IL, USA).
In order to visualize which of the physicochemical and previously studied mouthfeelsensations contribute most to the differences between plant-based and dairy yogurts,principal component analysis (PCA) was conducted. PCA is a procedure that examinesthe relationships among a set of correlated variables. The obtained results were visualizedgraphically by projecting the samples (scores) and physicochemical as well as mouthfeelvariables (loadings) onto the space defined by the two first PCs.
To determine if the previously studied mouthfeel sensations (thick, thin, creamy,and watery) could be explained by physicochemical properties in plant-based yogurts,a relationship between two datasets among plant-based yogurts was summarized andvisualized by partial least squares regression (PLS-R). In addition, Pearson correlations wereanalyzed to support the results of the PLS-R. All extracted physicochemical parametersand mouthfeel sensations (thick, creamy, thin, and watery) were included for the analysis.PLS regression is designed to determine relationships existing between dependent (Y,mouthfeel sensations) and explanatory (X, physicochemical properties) variables by seekingunderlying factors common to both sets of variables [29]. The model was developed
7
Foods 2022, 11, 941
using internal cross-validation based on y, mouthfeel sensations, and X, physicochemicalproperties. PLS-R is a suitable model because it allows for small to medium sample sizes, alarge number of independent variables, and is robust to multicollinearity. Both PCA andPLS were analyzed using Unscrambler (Unscrambler 7.6 SR-1, Camo Asa, Oslo, Norway).
3. Results
3.1. Acidity
The acidity differences between the instrumental and sensory batches were small,indicating similarities between the batches (Table 3) and thus validating their comparison.The pH in both dairy and nondairy samples ranged from 3.4 and 4.4, with one sample (P4)having a significantly lower pH (3.4) compared to the other samples. The total titratableacidity showed clear differences between dairy and plant-based samples. Dairy yogurtshad significantly higher TTA compared to plant-based yogurts, and P2 and P3 had thelowest TTA, 2.20 and 2.18, respectively.
Table 3. pH and TTA of all the samples in the instrumental analysis (±standard deviation) anddifference to the samples in the sensory analysis. Superscript letters indicate statistical differencebetween the samples, in the same column (p < 0.05).
pH TTA
Instrumental Analysis ± STD ±Sensory Analysis Instrumental Analysis ± STD ±Sensory Analysis
D1 4.27 ± 0.12 bc −0.06 10.83 ± 0.09 a −0.18D2 4.18 ± 0.12 bc −0.12 10.86 ± 0.10 a 0.22P1 4.16 ± 0.08 c 0.01 4.43 ± 0.14 c −0.09P2 4.26 ± 0.10 b −0.07 2.00 ± 0.08 d −0.05P3 4.43 ± 0.11 a −0.17 2.18 ± 0.16 d 0.14P4 3.47 ± 0.12 d 0.06 5.36 ± 0.45 b 0.23P5 4.26 ± 0.11 bc −0.08 5.54 ± 0.33 b 0.21
3.2. Soluble Solids
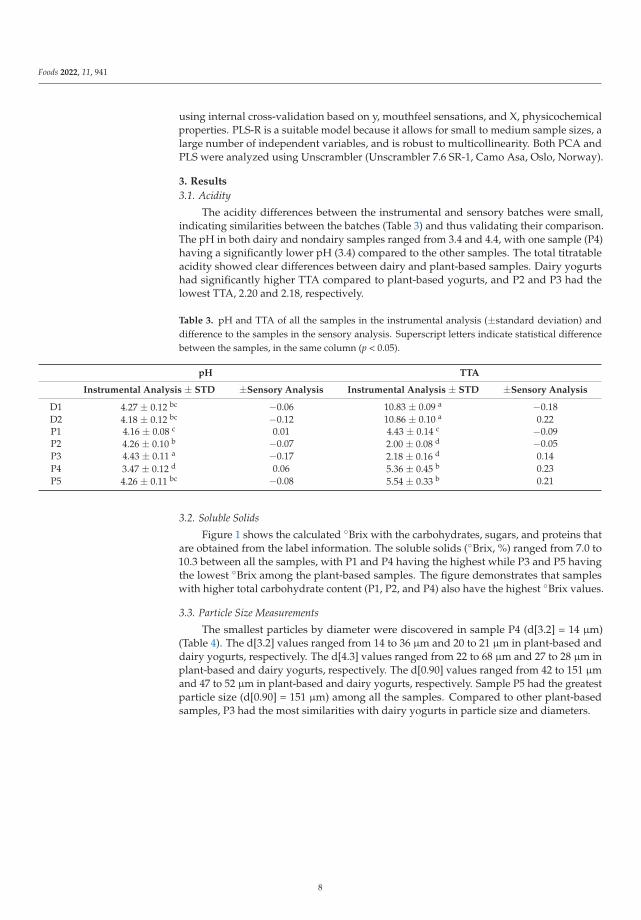
Figure 1 shows the calculated ◦Brix with the carbohydrates, sugars, and proteins thatare obtained from the label information. The soluble solids (◦Brix, %) ranged from 7.0 to10.3 between all the samples, with P1 and P4 having the highest while P3 and P5 havingthe lowest ◦Brix among the plant-based samples. The figure demonstrates that sampleswith higher total carbohydrate content (P1, P2, and P4) also have the highest ◦Brix values.
3.3. Particle Size Measurements
The smallest particles by diameter were discovered in sample P4 (d[3.2] = 14 μm)(Table 4). The d[3.2] values ranged from 14 to 36 μm and 20 to 21 μm in plant-based anddairy yogurts, respectively. The d[4.3] values ranged from 22 to 68 μm and 27 to 28 μm inplant-based and dairy yogurts, respectively. The d[0.90] values ranged from 42 to 151 μmand 47 to 52 μm in plant-based and dairy yogurts, respectively. Sample P5 had the greatestparticle size (d[0.90] = 151 μm) among all the samples. Compared to other plant-basedsamples, P3 had the most similarities with dairy yogurts in particle size and diameters.
8
Foods 2022, 11, 941
Figure 1. The final carbohydrate, sugar, and protein content as labelled in the products (w-%) and◦Brix (%) with standard deviation. Superscript letters indicate statistical difference in ◦Brix (%)between the samples (p < 0.05).
Table 4. Particle size diameters (±standard deviation) of all the samples. Superscript letters indicatestatistical difference in the same row (p < 0.05).
D1 D2 P1 P2 P3 P4 P5
d[3.2] + s.d. (μm) 20 ± 0.2 bc 21 ± 0.3 b 15 ± 0.1 e 36 ± 0.4 a 20 ± 0.1 c 14 ± 0.1 f 19 ± 0.1 d
d[4.3] + s.d. (μm) 27 ± 0.2 d 28 ± 0.9 c 24 ± 0.5 e 48 ± 0.1 b 30 ± 0.4 c 22 ± 0.3 f 68 ± 1.2 a
d[0.9] + s.d. (μm) 47 ± 0.6 e 52 ± 2.2 cd 48 ± 1.4 de 76 ± 0.7 b 56 ± 0.7 c 42 ± 0.4 f 151 ± 3.5 a
3.4. Rheological Measurements3.4.1. Steady Shear Data
Different parameters help to articulate discernable rheological differences amongsamples (Table 5). All the samples showed thixotropic behavior at steady shear rates(10 s−1 and 50 s−1), thus demonstrating structural breakdown under flow. For most ofthe samples, the viscosity decreased rapidly at the beginning of the measurement andthen decreased slowly, staying nearly constant (Table 5). The dairy yogurts had a strongerdecline in their viscosity than in the plant-based samples. Particularly at shear rates of5 and 10 s−1, samples P2 and P3 showed similar behavior to dairy yogurts compared toother plant-based samples (Figure 2B). The viscosity of sample P2 remained nearly constantafter the first drop at the beginning of the measurement (Figure 2A). Yet, a higher shearrate was associated with a lower viscosity also for P2.
Table 5. The mean value of the rheological parameters of all the samples. Superscript letters indicatestatistical differences in the same row (p < 0.05).
D1 D2 P1 P2 P3 P4 P5
SS10 (Pa s) 3.92 ±0.20 b 4.82 ±0.17 a 1.99 ±0.05 d 4.20 ±0.06 b 4.20 ±0.03 b 2.76 ±0.06 c 2.50 ±0.06 c
SS50 (Pa s) 1.53 ±0.05 b 1.99 ±0.11 a 0.52 ±0.01 e 1.55 ±0.00 b 1.01 ±0.01 c 0.90 ±0.01 c d 0.85 ±0.01 d
HL (-) 57,416.48 ±1479.05 b 59,720.44 ±1242.04 a 10,937.42 ±148.72 d −4647.42 ±152.23 e 17,678.42 ±291.84 c 11,022.59 ±177.27 d 16,278.60 ±22.35 c
n (-) 0.31 ±0.01 b 0.28 ±0.01 c 0.15 ±0.01 d 0.35 ±0.00 a 0.15 ±0.02 d 0.31 ±0.00 b c 0.36 ±0.01 a
K (Pa s n) 21.15 ±1.65 b 26.00 ±2.06 a 14.02 ±0.28 c 18.91 ±0.15 b 27.94 ±1.18 a 13.52 ±0.08 c d 10.73 ±0.09 d
ηapp10 (1/s) 4.35 ±0.27 b 4.94 ±0.29 a 1.99 ±0.02 d 4.27 ±0.03 b 3.97 ±0.02 b 2.75 ±0.01 c 2.45 ±0.03 c
G’LVE (Pa) 302.00 ±15.46 b 380.71 ±37.11 a 59.08 ±3.41 d e 77.73 ±1.39 d 195.05 ±12.77 c 16.48 ±0.92 e 24.90 ±2.35 e
γLVE (-) 0.01 ±0.00 c 0.01 ±0.00 c 0.02 ±0.00 c 0.03 ±0.00 b c 0.07 ±0.02 a 0.06 ±0.00 a b 0.06 ±0.01 a
G′ (Pa) 303.30 ±14.57 a 431.60 ±13.47 b 61.22 ±5.45 e 89.30 ±1.01 d 226.15 ±1.75 c 17.69 ±1.58 f 25.67 ±1.10 f
G′′ (Pa) 74.60 ±2.52 a 102.88 ±0.81 b 7.21 ±0.27 d e 23.13 ±0.12 d 14.81 ±0.06 c 8.53 ±0.67 e 10.51 ±0.23 e
9
Foods 2022, 11, 941
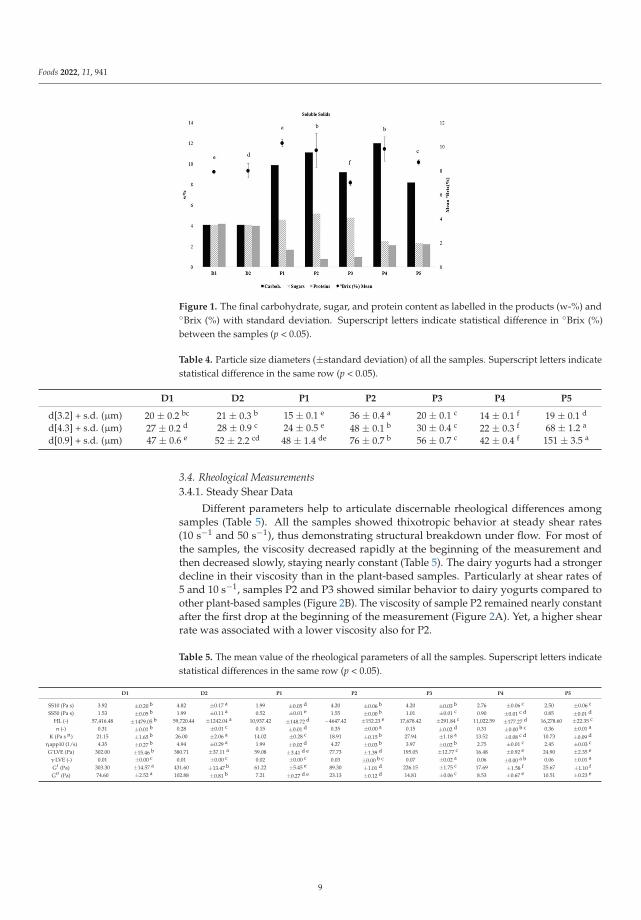
Figure 2. (A) Viscosity (Pa·s) during 120 s at a steady shear rate of 10 s−1. (B) Flow curve: viscosity(Pa·s) by shear rate (s−1). (C) Hysteresis loops in plant-based yogurts. (D) Hysteresis loops indairy yogurts.
3.4.2. Flow Curves
All the samples showed shear thinning behavior (n < 1) as the apparent viscosity de-creased by increasing the shear rate (Figure 2B) in all the samples (Table 5). The thixotropicproperties were measured by calculating the hysteresis loops, i.e., the area between theforward and backward curves (Figure 2C,D). A greater area within the hysteresis loopswas reported with dairy yogurts (D1-D2) compared to other yogurts. Furthermore, forsample P2, the hysteresis loop showed the following different behavior compared to othersamples: the forward and backward curves were partly overlapping (within 500–1000 s−1),the backward curve being also partly higher than the forward curve, indicating reversibleshear-thinning behavior (Figure 2C).
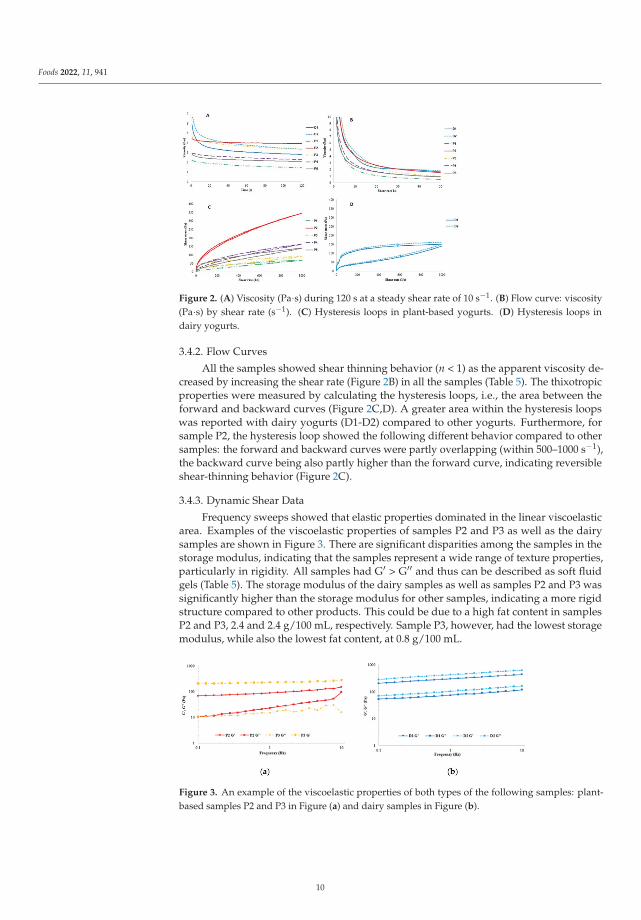
3.4.3. Dynamic Shear Data
Frequency sweeps showed that elastic properties dominated in the linear viscoelasticarea. Examples of the viscoelastic properties of samples P2 and P3 as well as the dairysamples are shown in Figure 3. There are significant disparities among the samples in thestorage modulus, indicating that the samples represent a wide range of texture properties,particularly in rigidity. All samples had G′ > G′′ and thus can be described as soft fluidgels (Table 5). The storage modulus of the dairy samples as well as samples P2 and P3 wassignificantly higher than the storage modulus for other samples, indicating a more rigidstructure compared to other products. This could be due to a high fat content in samplesP2 and P3, 2.4 and 2.4 g/100 mL, respectively. Sample P3, however, had the lowest storagemodulus, while also the lowest fat content, at 0.8 g/100 mL.
Figure 3. An example of the viscoelastic properties of both types of the following samples: plant-based samples P2 and P3 in Figure (a) and dairy samples in Figure (b).
10
Foods 2022, 11, 941
3.5. Physicochemical Differences in Dairy- and Plant-Based Yogurts
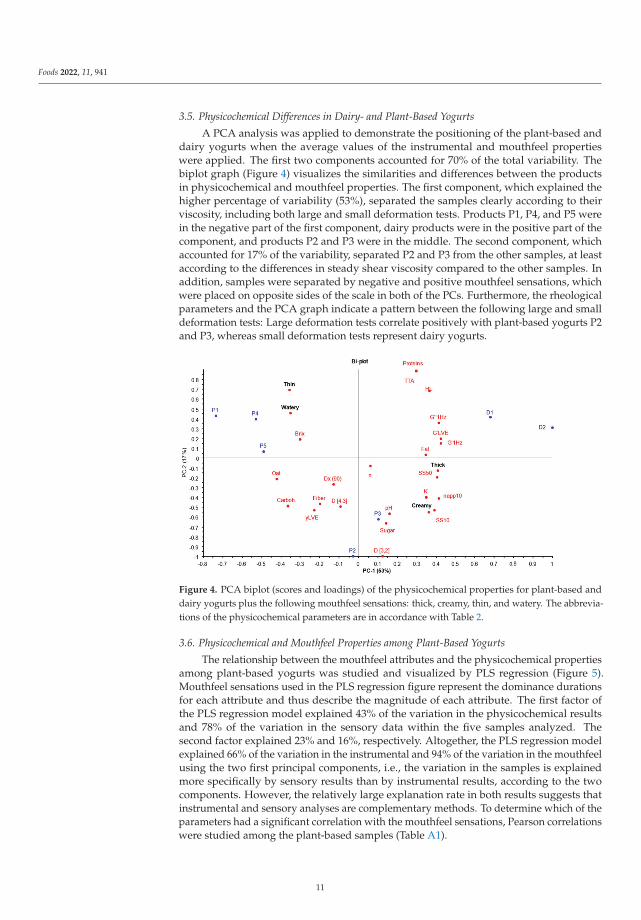
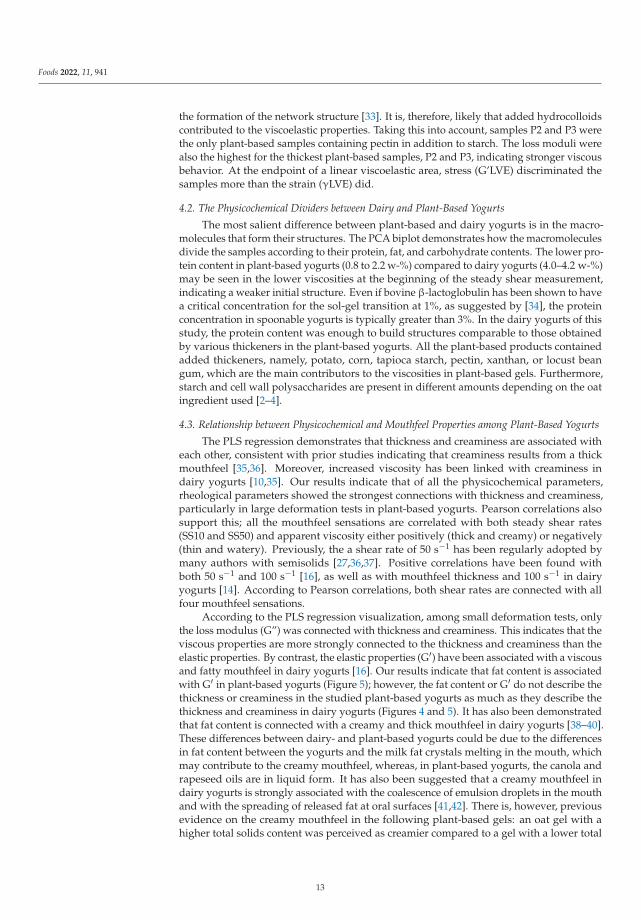
A PCA analysis was applied to demonstrate the positioning of the plant-based anddairy yogurts when the average values of the instrumental and mouthfeel propertieswere applied. The first two components accounted for 70% of the total variability. Thebiplot graph (Figure 4) visualizes the similarities and differences between the productsin physicochemical and mouthfeel properties. The first component, which explained thehigher percentage of variability (53%), separated the samples clearly according to theirviscosity, including both large and small deformation tests. Products P1, P4, and P5 werein the negative part of the first component, dairy products were in the positive part of thecomponent, and products P2 and P3 were in the middle. The second component, whichaccounted for 17% of the variability, separated P2 and P3 from the other samples, at leastaccording to the differences in steady shear viscosity compared to the other samples. Inaddition, samples were separated by negative and positive mouthfeel sensations, whichwere placed on opposite sides of the scale in both of the PCs. Furthermore, the rheologicalparameters and the PCA graph indicate a pattern between the following large and smalldeformation tests: Large deformation tests correlate positively with plant-based yogurts P2and P3, whereas small deformation tests represent dairy yogurts.
Figure 4. PCA biplot (scores and loadings) of the physicochemical properties for plant-based anddairy yogurts plus the following mouthfeel sensations: thick, creamy, thin, and watery. The abbrevia-tions of the physicochemical parameters are in accordance with Table 2.
3.6. Physicochemical and Mouthfeel Properties among Plant-Based Yogurts
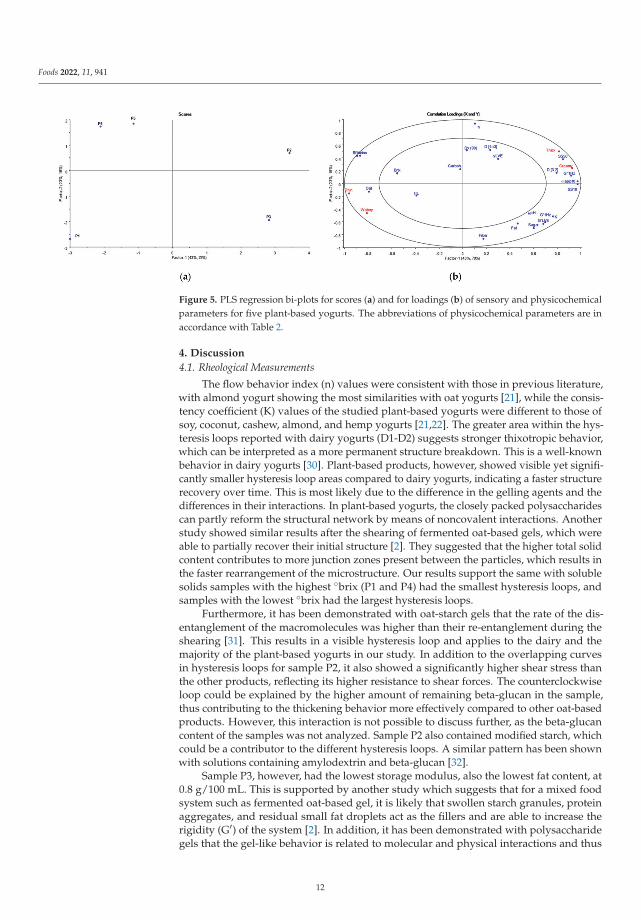
The relationship between the mouthfeel attributes and the physicochemical propertiesamong plant-based yogurts was studied and visualized by PLS regression (Figure 5).Mouthfeel sensations used in the PLS regression figure represent the dominance durationsfor each attribute and thus describe the magnitude of each attribute. The first factor ofthe PLS regression model explained 43% of the variation in the physicochemical resultsand 78% of the variation in the sensory data within the five samples analyzed. Thesecond factor explained 23% and 16%, respectively. Altogether, the PLS regression modelexplained 66% of the variation in the instrumental and 94% of the variation in the mouthfeelusing the two first principal components, i.e., the variation in the samples is explainedmore specifically by sensory results than by instrumental results, according to the twocomponents. However, the relatively large explanation rate in both results suggests thatinstrumental and sensory analyses are complementary methods. To determine which of theparameters had a significant correlation with the mouthfeel sensations, Pearson correlationswere studied among the plant-based samples (Table A1).
11
Foods 2022, 11, 941
Figure 5. PLS regression bi-plots for scores (a) and for loadings (b) of sensory and physicochemicalparameters for five plant-based yogurts. The abbreviations of physicochemical parameters are inaccordance with Table 2.
4. Discussion
4.1. Rheological Measurements
The flow behavior index (n) values were consistent with those in previous literature,with almond yogurt showing the most similarities with oat yogurts [21], while the consis-tency coefficient (K) values of the studied plant-based yogurts were different to those ofsoy, coconut, cashew, almond, and hemp yogurts [21,22]. The greater area within the hys-teresis loops reported with dairy yogurts (D1-D2) suggests stronger thixotropic behavior,which can be interpreted as a more permanent structure breakdown. This is a well-knownbehavior in dairy yogurts [30]. Plant-based products, however, showed visible yet signifi-cantly smaller hysteresis loop areas compared to dairy yogurts, indicating a faster structurerecovery over time. This is most likely due to the difference in the gelling agents and thedifferences in their interactions. In plant-based yogurts, the closely packed polysaccharidescan partly reform the structural network by means of noncovalent interactions. Anotherstudy showed similar results after the shearing of fermented oat-based gels, which wereable to partially recover their initial structure [2]. They suggested that the higher total solidcontent contributes to more junction zones present between the particles, which results inthe faster rearrangement of the microstructure. Our results support the same with solublesolids samples with the highest ◦brix (P1 and P4) had the smallest hysteresis loops, andsamples with the lowest ◦brix had the largest hysteresis loops.
Furthermore, it has been demonstrated with oat-starch gels that the rate of the dis-entanglement of the macromolecules was higher than their re-entanglement during theshearing [31]. This results in a visible hysteresis loop and applies to the dairy and themajority of the plant-based yogurts in our study. In addition to the overlapping curvesin hysteresis loops for sample P2, it also showed a significantly higher shear stress thanthe other products, reflecting its higher resistance to shear forces. The counterclockwiseloop could be explained by the higher amount of remaining beta-glucan in the sample,thus contributing to the thickening behavior more effectively compared to other oat-basedproducts. However, this interaction is not possible to discuss further, as the beta-glucancontent of the samples was not analyzed. Sample P2 also contained modified starch, whichcould be a contributor to the different hysteresis loops. A similar pattern has been shownwith solutions containing amylodextrin and beta-glucan [32].
Sample P3, however, had the lowest storage modulus, also the lowest fat content, at0.8 g/100 mL. This is supported by another study which suggests that for a mixed foodsystem such as fermented oat-based gel, it is likely that swollen starch granules, proteinaggregates, and residual small fat droplets act as the fillers and are able to increase therigidity (G′) of the system [2]. In addition, it has been demonstrated with polysaccharidegels that the gel-like behavior is related to molecular and physical interactions and thus
12
Foods 2022, 11, 941
the formation of the network structure [33]. It is, therefore, likely that added hydrocolloidscontributed to the viscoelastic properties. Taking this into account, samples P2 and P3 werethe only plant-based samples containing pectin in addition to starch. The loss moduli werealso the highest for the thickest plant-based samples, P2 and P3, indicating stronger viscousbehavior. At the endpoint of a linear viscoelastic area, stress (G’LVE) discriminated thesamples more than the strain (γLVE) did.
4.2. The Physicochemical Dividers between Dairy and Plant-Based Yogurts
The most salient difference between plant-based and dairy yogurts is in the macro-molecules that form their structures. The PCA biplot demonstrates how the macromoleculesdivide the samples according to their protein, fat, and carbohydrate contents. The lower pro-tein content in plant-based yogurts (0.8 to 2.2 w-%) compared to dairy yogurts (4.0–4.2 w-%)may be seen in the lower viscosities at the beginning of the steady shear measurement,indicating a weaker initial structure. Even if bovine β-lactoglobulin has been shown to havea critical concentration for the sol-gel transition at 1%, as suggested by [34], the proteinconcentration in spoonable yogurts is typically greater than 3%. In the dairy yogurts of thisstudy, the protein content was enough to build structures comparable to those obtainedby various thickeners in the plant-based yogurts. All the plant-based products containedadded thickeners, namely, potato, corn, tapioca starch, pectin, xanthan, or locust beangum, which are the main contributors to the viscosities in plant-based gels. Furthermore,starch and cell wall polysaccharides are present in different amounts depending on the oatingredient used [2–4].
4.3. Relationship between Physicochemical and Mouthfeel Properties among Plant-Based Yogurts
The PLS regression demonstrates that thickness and creaminess are associated witheach other, consistent with prior studies indicating that creaminess results from a thickmouthfeel [35,36]. Moreover, increased viscosity has been linked with creaminess indairy yogurts [10,35]. Our results indicate that of all the physicochemical parameters,rheological parameters showed the strongest connections with thickness and creaminess,particularly in large deformation tests in plant-based yogurts. Pearson correlations alsosupport this; all the mouthfeel sensations are correlated with both steady shear rates(SS10 and SS50) and apparent viscosity either positively (thick and creamy) or negatively(thin and watery). Previously, the a shear rate of 50 s−1 has been regularly adopted bymany authors with semisolids [27,36,37]. Positive correlations have been found withboth 50 s−1 and 100 s−1 [16], as well as with mouthfeel thickness and 100 s−1 in dairyyogurts [14]. According to Pearson correlations, both shear rates are connected with allfour mouthfeel sensations.
According to the PLS regression visualization, among small deformation tests, onlythe loss modulus (G”) was connected with thickness and creaminess. This indicates that theviscous properties are more strongly connected to the thickness and creaminess than theelastic properties. By contrast, the elastic properties (G′) have been associated with a viscousand fatty mouthfeel in dairy yogurts [16]. Our results indicate that fat content is associatedwith G′ in plant-based yogurts (Figure 5); however, the fat content or G′ do not describe thethickness or creaminess in the studied plant-based yogurts as much as they describe thethickness and creaminess in dairy yogurts (Figures 4 and 5). It has also been demonstratedthat fat content is connected with a creamy and thick mouthfeel in dairy yogurts [38–40].These differences between dairy- and plant-based yogurts could be due to the differencesin fat content between the yogurts and the milk fat crystals melting in the mouth, whichmay contribute to the creamy mouthfeel, whereas, in plant-based yogurts, the canola andrapeseed oils are in liquid form. It has also been suggested that a creamy mouthfeel indairy yogurts is strongly associated with the coalescence of emulsion droplets in the mouthand with the spreading of released fat at oral surfaces [41,42]. There is, however, previousevidence on the creamy mouthfeel in the following plant-based gels: an oat gel with ahigher total solids content was perceived as creamier compared to a gel with a lower total
13
Foods 2022, 11, 941
solids content [2]. Furthermore, it has been suggested that structural components suchas starch and protein aggregates create a smooth and thick mouthfeel in the absence ofmilk fat [36]. Another study with dairy and plant-based yogurts demonstrated that ahigh protein content provided a better gel firmness and a higher consistency coefficient(K) [21]. In addition, added starch in dairy yogurts has been shown to increase consistency,creaminess, and overall liking [43]. According to the PLS, the particle size parameter d[3.2]was associated with thick and creamy mouthfeel, whereas the other particle size parameterswere not associated with any of the mouthfeel sensations. Previous literature suggests thata small particle size explains creaminess in dairy yogurts [14,16,24,26,36]. However, ourresults indicate that with a particle size d[3.2] of ≥20 μm, there is a connection to thicknessand creaminess.
Both the PLS regression and the PCA graphs demonstrate that thin and watery aresimilar properties in plant-based yogurts (Figures 4 and 5). One explanation could be thatthe panelists were not able to distinguish wateriness from thinness. Another explanationcould be that a watery mouthfeel is a consequence of the hydrolysis of starch by α-amylase,which present in saliva [44]. Our previous results support this: watery was perceivedmainly after thinness [6]. The PLS graph and Pearson correlation indicate that thin andwatery correlated negatively with fat content. A similar correlation has been demonstratedwithin emulsion-filled gels [20]. They showed that low-fat content relates to wateriness andthat watery is the opposite of creamy. Additionally, as more saliva is added to the bolus,the perceived attributes have been found to relate to consistency (e.g., creaminess andwateriness) [8]. Furthermore, similar results were found with a descriptive analysis [45].They concluded that the watery mouthfeel in semisolid gels is a chew-down property,whereas, sugar reduction in yogurts has been shown to result in a watery mouthfeel [19].This should be investigated further. Interestingly, our results indicate that the samples withthe lowest sugar content (P4 and P5) were perceived as watery, whereas samples with thehighest sugar content (P2 and P3) were perceived as creamy.
5. Conclusions
There is a growing requirement for plant-based yogurts that meet consumer demandsin terms of texture. Extensive previous literature demonstrates the relationship betweenphysicochemical and mouthfeel properties in conventional dairy yogurts. However, moreresearch is required on plant-based yogurts. The aim of the study was to determine thephysicochemical properties of different commercial plant-based yogurts. The results werecompared to those for dairy yogurts and previously studied mouthfeel sensations.
Plant-based yogurts exhibited a wide range of viscoelastic properties, which was aresult of the fact that different hydrocolloids at different levels were incorporated in thesamples at different levels. Our results also revealed some structural differences in thefollowing two product groups: for example, a significantly stronger structure recovery wasfound in plant-based yogurts than in dairy yogurts, resulting from the differences in thegelling agents and their interactions. This study demonstrates that dairy and plant-basedyogurts with a similar mouthfeel profile may have different viscoelastic properties. Theconsiderable physicochemical differences between the two product groups are likely toalso be valid with other similar yogurts as the selected samples in this study represent thetypical dairy- and plant-based yogurts in the market. Further investigation is necessary todemonstrate this.
This study highlights the importance of rheological large deformation tests and theirability to explain essential mouthfeel sensations in plant-based yogurts. Thick and creamymouthfeel sensations were positively correlated with steady shear rates and apparentviscosity. The results also suggest that oil content does not significantly affect creaminess inplant-based yogurts. The results emphasize that instrumental and sensory methods shouldnot be considered substitutive but complementary methods when developing plant-basedyogurts in a cost-effective and timely manner.
14
Foods 2022, 11, 941
Limitations and Future Challenges
The presented relationships between the physicochemical parameters and mouthfeelare only valid within the studied plant-based yogurts. The results highlight that furtherinvestigation is necessary to demonstrate the impact of different macromolecules andhydrocolloids on the physicochemical and sensory properties in plant-based yogurts.
Author Contributions: Conceptualization and methodology: M.G., T.S., L.S., R.P. and K.K.; software,M.G. and T.S.; validation: L.S., R.P., K.K., A.J.K. and A.A.N.; formal analysis, investigation, datacuration, and visualization: M.G. and T.S; writing—original draft preparation, M.G. and T.S.; writing—review and editing, R.P., L.S, K.K., A.J.K. and A.A.N.; resources, supervision, project administration,and funding acquisition: R.P., L.S. and K.K. All authors have read and agreed to the published versionof the manuscript.
Funding: Maija Greis is financially supported by Valio Ltd. through a PhD position at the Universityof Helsinki.
Institutional Review Board Statement: The research procedure followed the ethical principles ofsensory evaluation laboratory, approved by the Ethical Committee of the University of Helsinki.
Informed Consent Statement: Informed consent was obtained from all subjects involved in the study.
Data Availability Statement: Data is contained within the article.
Acknowledgments: Special thanks to Sanna Ylisjunttila-Huusko for providing valuable advice withselecting the appropriate rheological parameters in the preliminary experiments, in addition toSchlich (INRAE) for advice on using attribute durations in the PLS correlations. We also wish tothank Astrid D’Andrea for proofreading the manuscript.
Conflicts of Interest: Authors declare no conflict of interest. All the authors have adhered to conductindependent research. M.G. is financially supported by Valio Ltd. R.P. works for Valio Ltd., and T.S.was a student of University of Helsinki during the writing process, but currently she is an employeeof Arla Foods Ltd. The funders had no role in the analysis, interpretation of data, or in the decision topublish the results.
Appendix A
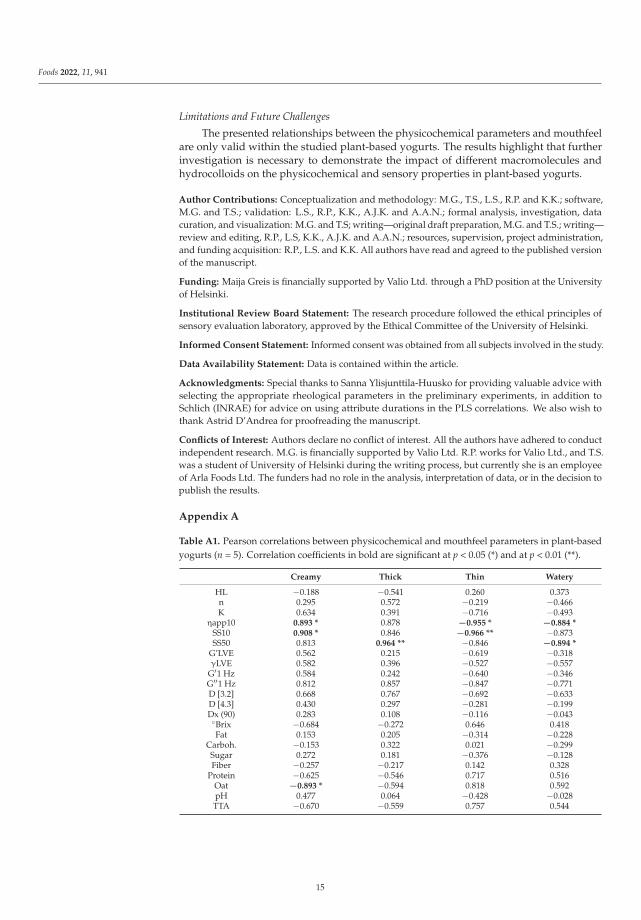
Table A1. Pearson correlations between physicochemical and mouthfeel parameters in plant-basedyogurts (n = 5). Correlation coefficients in bold are significant at p < 0.05 (*) and at p < 0.01 (**).
Creamy Thick Thin Watery
HL −0.188 −0.541 0.260 0.373n 0.295 0.572 −0.219 −0.466K 0.634 0.391 −0.716 −0.493
ηapp10 0.893 * 0.878 −0.955 * −0.884 *SS10 0.908 * 0.846 −0.966 ** −0.873SS50 0.813 0.964 ** −0.846 −0.894 *
G’LVE 0.562 0.215 −0.619 −0.318γLVE 0.582 0.396 −0.527 −0.557
G′1 Hz 0.584 0.242 −0.640 −0.346G′′1 Hz 0.812 0.857 −0.847 −0.771D [3.2] 0.668 0.767 −0.692 −0.633D [4.3] 0.430 0.297 −0.281 −0.199Dx (90) 0.283 0.108 −0.116 −0.043◦Brix −0.684 −0.272 0.646 0.418Fat 0.153 0.205 −0.314 −0.228
Carboh. −0.153 0.322 0.021 −0.299Sugar 0.272 0.181 −0.376 −0.128Fiber −0.257 −0.217 0.142 0.328
Protein −0.625 −0.546 0.717 0.516Oat −0.893 * −0.594 0.818 0.592pH 0.477 0.064 −0.428 −0.028TTA −0.670 −0.559 0.757 0.544
15
Foods 2022, 11, 941
References
1. Banovic, M.; Lähteenmäki, L.; Arvola, A.; Pennanen, K.; Duta, D.E.; Brückner-Gühmann, M.; Grunert, K.G. Foods with IncreasedProtein Content: A Qualitative Study on European Consumer Preferences and Perceptions. Appetite 2018, 125, 233–243. [CrossRef]
2. Brückner-Gühmann, M.; Banovic, M.; Drusch, S. Towards an Increased Plant Protein Intake: Rheological Properties, SensoryPerception and Consumer Acceptability of Lactic Acid Fermented, Oat-Based Gels. Food Hydrocoll. 2019, 96, 201–208. [CrossRef]
3. Ercili-Cura, D.; Miyamoto, A.; Paananen, A.; Yoshii, H.; Poutanen, K.; Partanen, R. Adsorption of Oat Proteins to Air-WaterInterface in Relation to Their Colloidal State. Food Hydrocoll. 2015, 44, 183–190. [CrossRef]
4. Jeske, S.; Zannini, E.; Arendt, E.K. Past, Present and Future: The Strength of Plant-Based Dairy Substitutes Based on Gluten-FreeRaw Materials. Food Res. Int. 2018, 110, 42–51. [CrossRef] [PubMed]
5. Mårtensson, O.; Andersson, C.; Andersson, K.; Öste, R.; Holst, O. Formulation of an Oat-Based Fermented Product and ItsComparison with Yoghurt. J. Sci. Food Agric. 2001, 81, 1314–1321. [CrossRef]
6. Greis, M.; Sainio, T.; Katina, K.; Kinchla, A.J.; Nolden, A.; Partanen, R.; Seppä, L. Dynamic Texture Perception in Plant-BasedYogurt Alternatives: Identifying Temporal Drivers of Liking by TDS. Food Qual. Pref. 2020, 86, 104019. [CrossRef]
7. Cutler, A.N.; Morris, E.R.; Taylor, L.J. Oral perception of viscosity in fluid foods and model systems. J. Texture Stud. 1983, 14,377–395. [CrossRef]
8. De Wijk, R.A.; van Gemert, L.J.; Terpstra, M.E.J.; Wilkinson, C.L. Texture of Semi-Solids; Sensory and Instrumental Measurementson Vanilla Custard Desserts. Food Qual. Pref. 2003, 14, 305–317. [CrossRef]
9. Harte, F.; Clark, S.; Barbosa-Cánovas, G.V. Yield Stress for Initial Firmness Determination on Yogurt. J. Food Eng. 2007, 80, 990–995.[CrossRef]
10. Janhøj, T.; Petersen, C.B.; Frøst, M.B.; Ipsen, R. Sensory and Rheological Characterization of Low-Fat Stirred Yogurt. J. TextureStud. 2006, 37, 276–299. [CrossRef]
11. Janssen, A.M.; Terpstra, M.E.J.; de Wijk, R.A.; Prinz, J.F. Relations between Rheological Properties, Saliva-Induced StructureBreakdown and Sensory Texture Attributes of Custards. J. Texture Stud. 2007, 38, 42–69. [CrossRef]
12. Jørgensen, C.E.; Abrahamsen, R.K.; Rukke, E.O.; Johansen, A.G.; Schüller, R.B.; Skeie, S.B. Improving the Structure and Rheologyof High Protein, Low Fat Yoghurt with Undenatured Whey Proteins. Int. Dairy J. 2015, 47, 6–18. [CrossRef]
13. Nguyen, P.T.M.; Kravchuk, O.; Bhandari, B.; Prakash, S. Effect of Different Hydrocolloids on Texture, Rheology, Tribology andSensory Perception of Texture and Mouthfeel of Low-Fat Pot-Set Yoghurt. Food Hydrocoll. 2017, 72, 90–104. [CrossRef]
14. Sonne, A.; Busch-Stockfisch, M.; Weiss, J.; Hinrichs, J. Improved Mapping of In-Mouth Creaminess of Semi-Solid Dairy Productsby Combining Rheology, Particle Size, and Tribology Data. LWT Food Sci. Technol. 2014, 59, 342–347. [CrossRef]
15. Kilcast, D.; Clegg, S. Sensory Perception of Creaminess and Its Relationship with Food Structure. Food Qual. Pref. 2002, 13,609–623. [CrossRef]
16. Krzeminski, A.; Tomaschunas, M.; Köhn, E.; Busch-Stockfisch, M.; Weiss, J.; Hinrichs, J. Relating Creamy Perception of WheyProtein Enriched Yogurt Systems to Instrumental Data by Means of Multivariate Data Analysis. J. Food Sci. 2013, 78, S314–S319.[CrossRef]
17. Laiho, S.; Williams, R.P.W.; Poelman, A.; Appelqvist, I.; Logan, A. Effect of Whey Protein Phase Volume on the Tribology, Rheologyand Sensory Properties of Fat-Free Stirred Yoghurts. Food Hydrocoll. 2017, 67, 166–177. [CrossRef]
18. Lett, A.M.; Yeomans, M.R.; Norton, I.T.; Norton, J.E. Enhancing Expected Food Intake Behaviour, Hedonics and SensoryCharacteristics of Oil-in-Water Emulsion Systems through Microstructural Properties, Oil Droplet Size and Flavour. Food Qual.Pref. 2016, 47, 148–155. [CrossRef]
19. Sodini, I.; Remeuf, F.; Haddad, C.; Corrieu, G. The Relative Effect of Milk Base, Starter, and Process on Yogurt Texture: A Review.Crit. Rev. Food Sci. Nutr. 2004, 44, 113–137. [CrossRef]
20. Sala, G.; de Wijk, R.A.; van de Velde, F.; van Aken, G.A. Matrix Properties Affect the Sensory Perception of Emulsion-Filled Gels.Food Hydrocoll. 2008, 22, 353–363. [CrossRef]
21. Grasso, N.; Alonso-Miravalles, L.; O’Mahony, J.A. Composition, Physicochemical and Sensorial Properties of CommercialPlant-Based Yogurts. Foods 2020, 9, 252. [CrossRef]
22. Gupta, M.K.; Torrico, D.D.; Ong, L.; Gras, S.L.; Dunshea, F.R.; Cottrell, J.J. Plant and Dairy-Based Yogurts: A Comparison ofConsumer Sensory Acceptability Linked to Textural Analysis. Foods 2022, 11, 463. [CrossRef]
23. Wang, Y.; Sorvali, P.; Laitila, A.; Maina, N.H.; Coda, R.; Katina, K. Dextran Produced in Situ as a Tool to Improve the Quality ofWheat-Faba Bean Composite Bread. Food Hydrocoll. 2018, 84, 396–405. [CrossRef]
24. Cayot, P.; Schenker, F.; Houzé, G.; Sulmont-Rossé, C.; Colas, B. Creaminess in Relation to Consistency and Particle Size in StirredFat-Free Yogurt. Int. Dairy J. 2008, 18, 303–311. [CrossRef]
25. De Wijk, R.A.; Prinz, J.F.; Janssen, A.M. Explaining Perceived Oral Texture of Starch-Based Custard Desserts from Standard andNovel Instrumental Tests. Food Hydrocoll. 2006, 20, 24–34. [CrossRef]
26. Krzeminski, A.; Großhable, K.; Hinrichs, J. Structural Properties of Stirred Yoghurt as Influenced by Whey Proteins. LWT Food Sci.Technol. 2011, 44, 2134–2140. [CrossRef]
27. Shama, F.; Sherman, P. Identification of stimuli controlling the sensory evaluation of viscosity II. Oral Methods. J. Texture Stud.1973, 4, 111–118. [CrossRef]
28. Schlich, P. Temporal Dominance of Sensations (TDS): A New Deal for Temporal Sensory Analysis. Curr. Opin. Food Sci. 2017, 15,38–42. [CrossRef]
16
Foods 2022, 11, 941
29. Abdi, H. Partial Least Square Regression PLS-Regression. Encyclopedia of Measurement and Statistics; SAGE Publications, Inc.:Thousand Oaks, CA, USA, 2007.
30. Lee, W.J.; Lucey, J.A. Formation and Physical Properties of Yogurt. Asian-Australas. J. Anim. Sci. 2010, 23, 1127–1136. [CrossRef]31. Sikora, M.; Kowalski, S.; Tomasik, P. Binary Hydrocolloids from Starches and Xanthan Gum. Food Hydrocoll. 2008, 22, 943–952.
[CrossRef]32. Carriere, C.J.; Inglett, G.E. Nonlinear Viscoelastic Solution Properties of Oat-Based β-Glucan/Amylodextrin Blends. Carbohydr.
Polym. 1999, 40, 9–16. [CrossRef]33. Bozzi, L.; Milas, M.; Rinaudo, M. Solution and Gel Rheology of a New Polysaccharide Excreted by the Bacterium Alteromonas Sp.
Strain 1644. Int. J. Biol. Macromol. 1996, 18, 83–91. [CrossRef] [PubMed]34. Renard, D.; Lefebvre, J. Gelation of Globular Proteins: Effect of PH and Ionic Strength on the Critical Concentration for Gel
Formation. A Simple Model and Its Application to β-Lactoglobulin Heat-Induced Gelation. Int. J. Biol. Macromol. 1992, 14,287–291. [CrossRef] [PubMed]
35. Akhtar, M.; Stenzel, J.; Murray, B.S.; Dickinson, E. Factors Affecting the Perception of Creaminess of Oil-in-Water Emulsions. FoodHydrocoll. 2005, 19, 521–526. [CrossRef]
36. Dickinson, E. On the Road to Understanding and Control of Creaminess Perception in Food Colloids. Food Hydrocoll. 2018, 77,372–385. [CrossRef]
37. Stanley, N.L.; Taylor, L.J. Rheological Basis of Oral Characteristics of Fluid and Semi-Solid Foods: A Review. Acta Psychol. 1993,84, 79–92. [CrossRef]
38. Mosca, A.C.; Rocha, J.A.; Sala, G.; van de Velde, F.; Stieger, M. Inhomogeneous Distribution of Fat Enhances the Perception ofFat-Related Sensory Attributes in Gelled Foods. Food Hydrocoll. 2012, 27, 448–455. [CrossRef]
39. Tomaschunas, M.; Hinrichs, J.; Köhn, E.; Busch-Stockfisch, M. Effects of Casein-to-Whey Protein Ratio, Fat and Protein Contenton Sensory Properties of Stirred Yoghurt. Int. Dairy J. 2012, 26, 31–35. [CrossRef]
40. Vingerhoeds, M.H.; de Wijk, R.A.; Zoet, F.D.; Nixdorf, R.R.; van Aken, G.A. How Emulsion Composition and Structure AffectSensory Perception of Low-Viscosity Model Emulsions. Food Hydrocoll. 2008, 22, 631–646. [CrossRef]
41. Dresselhuis, D.M.; de Hoog, E.H.A.; Cohen Stuart, M.A.; Vingerhoeds, M.H.; van Aken, G.A. The Occurrence of In-MouthCoalescence of Emulsion Droplets in Relation to Perception of Fat. Food Hydrocoll. 2008, 22, 1170–1183. [CrossRef]
42. van Aken, G.A.; Vingerhoeds, M.H.; de Wijk, R.A. Textural Perception of Liquid Emulsions: Role of Oil Content, Oil Viscosityand Emulsion Viscosity. Food Hydrocoll. 2011, 25, 789–796. [CrossRef]
43. Morell, P.; Hernando, I.; Llorca, E.; Fiszman, S. Yogurts with an increased protein content and physically modified starch:Rheological, structural, oral digestion and sensory properties related to enhanced satiating capacity. Food Res. Int. 2015, 70, 64–73.[CrossRef]
44. De Wijk, R.A.; Prinz, J.F.; Engelen, L.; Weenen, H. The Role of α-Amylase in the Perception of Oral Texture and Flavour inCustards. Physiol. Behav. 2004, 83, 81–91. [CrossRef]
45. Devezeaux de Lavergne, M.; van Delft, M.; van de Velde, F.; van Boekel, M.A.J.S.; Stieger, M. Dynamic Texture Perception andOral Processing of Semi-Solid Food Gels: Part 1: Comparison between QDA, Progressive Profiling and TDS. Food Hydrocoll. 2015,43, 207–217. [CrossRef]
17

Citation: Aguiar, E.V.; Santos, F.G.;
Centeno, A.C.L.S.; Capriles, V.D.
Defining Amaranth, Buckwheat and
Quinoa Flour Levels in Gluten-Free
Bread: A Simultaneous Improvement
on Physical Properties, Acceptability
and Nutrient Composition through
Mixture Design. Foods 2022, 11, 848.
https://doi.org/10.3390/
foods11060848
Academic Editors: Luca Serventi,
Charles Brennan and Rana Mustafa
Received: 12 February 2022
Accepted: 14 March 2022
Published: 16 March 2022
Publisher’s Note: MDPI stays neutral
with regard to jurisdictional claims in
published maps and institutional affil-
iations.
Copyright: © 2022 by the authors.
Licensee MDPI, Basel, Switzerland.
This article is an open access article
distributed under the terms and
conditions of the Creative Commons
Attribution (CC BY) license (https://
creativecommons.org/licenses/by/
4.0/).
foods
Article
Defining Amaranth, Buckwheat and Quinoa Flour Levels inGluten-Free Bread: A Simultaneous Improvement on PhysicalProperties, Acceptability and Nutrient Composition throughMixture Design
Etiene Valéria Aguiar, Fernanda Garcia Santos, Ana Carolina Ladeia Solera Centeno and Vanessa Dias Capriles *
Laboratory of Food Technology and Nutrition, Department of Biosciences, Institute of Health and Society,Campus Baixada Santista, Federal University of São Paulo (UNIFESP), Santos 11015-020, Brazil;[email protected] (E.V.A.); [email protected] (F.G.S.); [email protected] (A.C.L.S.C.)* Correspondence: [email protected]
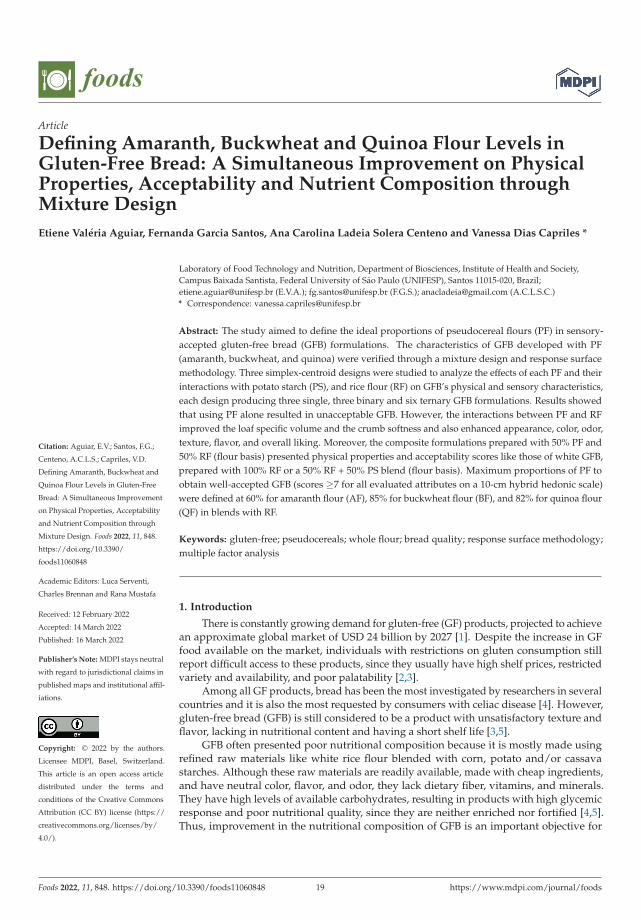
Abstract: The study aimed to define the ideal proportions of pseudocereal flours (PF) in sensory-accepted gluten-free bread (GFB) formulations. The characteristics of GFB developed with PF(amaranth, buckwheat, and quinoa) were verified through a mixture design and response surfacemethodology. Three simplex-centroid designs were studied to analyze the effects of each PF and theirinteractions with potato starch (PS), and rice flour (RF) on GFB’s physical and sensory characteristics,each design producing three single, three binary and six ternary GFB formulations. Results showedthat using PF alone resulted in unacceptable GFB. However, the interactions between PF and RFimproved the loaf specific volume and the crumb softness and also enhanced appearance, color, odor,texture, flavor, and overall liking. Moreover, the composite formulations prepared with 50% PF and50% RF (flour basis) presented physical properties and acceptability scores like those of white GFB,prepared with 100% RF or a 50% RF + 50% PS blend (flour basis). Maximum proportions of PF toobtain well-accepted GFB (scores ≥7 for all evaluated attributes on a 10-cm hybrid hedonic scale)were defined at 60% for amaranth flour (AF), 85% for buckwheat flour (BF), and 82% for quinoa flour(QF) in blends with RF.
Keywords: gluten-free; pseudocereals; whole flour; bread quality; response surface methodology;multiple factor analysis
1. Introduction
There is constantly growing demand for gluten-free (GF) products, projected to achievean approximate global market of USD 24 billion by 2027 [1]. Despite the increase in GFfood available on the market, individuals with restrictions on gluten consumption stillreport difficult access to these products, since they usually have high shelf prices, restrictedvariety and availability, and poor palatability [2,3].
Among all GF products, bread has been the most investigated by researchers in severalcountries and it is also the most requested by consumers with celiac disease [4]. However,gluten-free bread (GFB) is still considered to be a product with unsatisfactory texture andflavor, lacking in nutritional content and having a short shelf life [3,5].
GFB often presented poor nutritional composition because it is mostly made usingrefined raw materials like white rice flour blended with corn, potato and/or cassavastarches. Although these raw materials are readily available, made with cheap ingredients,and have neutral color, flavor, and odor, they lack dietary fiber, vitamins, and minerals.They have high levels of available carbohydrates, resulting in products with high glycemicresponse and poor nutritional quality, since they are neither enriched nor fortified [4,5].Thus, improvement in the nutritional composition of GFB is an important objective for
Foods 2022, 11, 848. https://doi.org/10.3390/foods11060848 https://www.mdpi.com/journal/foods19
Foods 2022, 11, 848
food research and development, a challenge that is concomitant with the improvement ofthe technological and sensory characteristics of these products [6].
To improve GFB formulation, the use of alternative ingredients with a rich nutrientand bioactive compounds content, such as wholemeal pseudocereal flours obtained fromnaturally GF grains, has been recommended [7].
The pseudocereals amaranth, buckwheat, and quinoa present high protein content,notably essential amino acids, mainly lysine (limited in cereals) and sulphur amino acids(limited in legumes). In addition, the considerable fiber, vitamin, and mineral content,and their potential as functional food are factors that increase the interest in the use ofthese grains for human consumption [8]. Thus, the incorporation of pseudocereals in theformulation has the potential to enhance the nutritional profile of GFB, which can benefitthe health of individuals with diseases related to gluten consumption [8].
Several studies have been conducted showing that it is possible to use pseudocerealflours (PF) in GFB formulations [9–14]. However, to date, no publications report the effectsof different pseudo cereal flour levels on physical characteristics, degree of liking, andnutritional profile of GFB. Therefore, this study aimed to evaluate the maximum limitsand the ideal proportions of PF (amaranth (AF), buckwheat (BF) and quinoa (QF)) incombination with rice flour (RF) and potato starch (PS) using a mixture design to obtainGFB with improved technological, sensory, and nutritional properties.
2. Materials and Methods
2.1. Ingredients
The grains of amaranth (Amaranthus caudatus) and quinoa (Chenopodium quinoa), orig-inally from Peru, were obtained from RS Blumos Industrial e Comercial Ltd.—Cotia-SP,Brazil, while the grains of buckwheat (Fagopyrum esculentum), originally from Bolivia, wereobtained from Estação dos Grãos Ltd.—São Paulo, Brazil. The pseudocereal grains weretransported to the Food Technology and Nutrition Laboratory (LAbTAN, UNIFESP) andmilled using a mill (Laboratory Mill 3303, Perten Instruments, Stockholm, Sweden) atlevel 0, obtaining flours with the smallest particle size possible, in order to not confer orminimize the sensation of grit, which is often mentioned by consumers when tasting GFBdeveloped with wholemeal flours [15]. Among the PF, the AF presents the largest particlesize (83% ≥ 250 μm), followed by the QF (73% ≥ 250 μm), and the BF with the smallestparticle size (60% < 180 μm) [16].
The xanthan gum (Ziboxan F80, Deosen Biochemical Ltd.—Mongolia, China) wasdonated by the company Vogler Ingredients Ltd. (São Bernardo do Campo-SP, Brazil)while carboxymethylcellulose (Denvercel FG-2504A, Denver Especialidades QuímicasLtd.—Cotia-SP, Brazil) was donated by its manufacturer. Other ingredients used for GFBpreparation were obtained at the local market.
2.2. Methods2.2.1. Formulation and Production of Gluten-Free Breads
The GFB formulation were elaborated according to Aguiar et al. (2021b) [16] andconsisted of the following ingredients on a flour basis (f.b.): 100% blend of one PF with RFand/or PS, according to a mixture design, 25% egg, 10.5% whole milk powder, 6% sugar,6% soybean oil, 2% salt, 0.8% dry yeast, 0.3% xanthan gum, 0.3% carboxymethylcelluloseand 100% water.
The straight dough method was used as reported by Aguiar et al. (2021b) [16]. Theanalyses were conducted within up to 3 h after production. Twelve loaves of each GFBexperimental formulation were produced, in two batches. Six loaves were used for theanalysis of physical properties and the other six were used in the sensory analysis.
2.2.2. Experimental Design
Three simplex centroid experimental designs were conducted, combining each PF withthe RF and PS: different percentage mixes of (A) AF with RF + PS; (B) BF with RF + PS; (C)
20
Foods 2022, 11, 848
QF with RF + PS. For each of the three designs, there were twelve experimental formulations,three constituted of single components (100%), three of binary blends prepared with 50%of each of two components, one formulation of ternary blend consisting of the combinationof 33.3% of each component, representing the central point of the model, which was madein three repetitions, and three formulations corresponding to the ternary blend consistingof the combination of 66% of one component and 17% of each of the others, correspondingto the axial points (Figure S1, on Supplementary Material). The sequence of executionof the experiments was randomized by a prior draw. The highest content level of eachcomponent in the blend of flours and starches (proportion = 1) represented 35.8 g of thedough (Figure S1, on Supplementary Material).
2.2.3. Bread Quality Evaluation
Physical properties were analyzed as described by Aguiar et al. (2021b) [16]. The anal-yses of specific loaf volume, crumb firmness and moisture content were made, respectively,according to method 10-05.01, 74-09 and 44-15.02 of AACC (2010) [17], while the crumb cellstructure was analyzed according to Santos et al. (2020) [18].
The sensory acceptance of samples was conducted in ten sensory analysis sessionsrandomized for each design, offering in each session up to three samples of the same design,with balanced order of presentation.
In each sensory analysis session, 50 bread consumers, recruited from students andstaff from the university campus, aged 18–59 years, assessed the acceptability of theattributes: appearance, color, odor, texture, flavor and overall liking of the breads, on asemi-structured 10 cm hybrid hedonic scale (0 = disliked very much, 5 = neither liked/nordisliked, 10 = liked very much) [19].
The evaluators received the samples of bread (slices of 12 mm in thickness) monadi-cally, packaged in polypropylene bags and coded with three random digits. The participantsassessed the GFB formulations in individual booths in the Sensory Analysis Laboratory,being instructed to drink water between samples to minimize residual effects.
2.2.4. Selection of Samples and Quality Verification
The GFB physical properties and acceptability served as response variables for themixture design regression models, applying the Scheffé canonical polynomial models asexplained by Aguiar et al. (2021b) [16].
Principal component analysis (PCA) also contributed to determining the content levelsof these flours that do not alter the physical properties and acceptability compared withthe control GFB formulation.
2.2.5. Characterization of Selected Samples
The selected samples, containing both optimum and maximum levels of PF, hadtheir dough thermomechanical characteristics evaluated using the Chopin + 90 protocol inMixolab® (Chopin Technologies, Villeneuve-la-Garenne, France), in which all ingredients(except yeast) were mixed in the proportions utilized in the bread preparation, using atotal of 90 g of dough. Adaptations were made to method 54-60.01 of AACC (2010) [17]to allow knowing the effect of ingredients on the dough characteristics, subject to mixingand temperature variation, simulating the breadmaking process. The same parameters asthose reported by of Santos et al. (2021) [20] were observed here: initial consistency (C1),weakening of protein network (C2), maximum (C3) and minimum (C4) peak during theheating phase and the value obtained after cooling (C5). Two repetitions were performedfor each sample.
In addition, the selected formulations were prepared and analyzed experimentallyto verify the physical properties and sensory acceptance using, respectively, the methodscited on Section 2.2.3, these results being compared statistically with the expected values ofthe fitted models.
21
Foods 2022, 11, 848
The selected GFB formulations had the proximate composition analyzed. Moisture,ash, protein and lipid contents were analyzed following the respective methods 950.46,923.03, 960.52, 920.39 of AOAC (2005) [21]. Dietary fiber (soluble and insoluble) contentwas verified utilizing the enzymatic-gravimetric method 991.43 of AOAC (2005) [21] andanalytical kit K-ACHDF (Megazyme International Ireland Ltd., Bray, Ireland). Availablecarbohydrates were calculated by difference. Data were means of three repetitions andexpressed as g/100 g of GFB.
2.2.6. Ethical Considerations
This study was approved by the Research Ethics Committee of UNIFESP (proto-col number 1.814.143) and all the participants signed an informed consent form beforeenrollment in the research.
2.2.7. Statistical Analysis
The adequacy of the mixture regression model was verified through variance anal-ysis (F test), R2 values, lack-of-fit test, and diagnostic plots such as normal and residualplots. One-way analysis of variance (ANOVA) and Tukey’s test were used to verify thedifferences in treatment means, comparing physical properties, sensory acceptance scoresand centesimal composition of the selected GFB formulations. The Statistica 12.0 statisticalsoftware (StatSoft Inc., Tulsa, OK, USA, 2013) was used for data processing.
Multiple factor analysis (MFA) was utilized to investigate the relationships of thestudied variables (physical, sensory and Mixolab parameters) using the XLSTAT 2021.2software (Addinsoft, New York, NY, USA), with the significance level established at 0.05for all analyses.
3. Results
3.1. Mixture Design and Response Surface Analysis
Table 1 presents the mixture regression models obtained for the physical propertiesand for the acceptability of the GFB. The models obtained with designs A and C weresignificant for the physical properties. For the acceptability scores, only models obtainedwith designs B and C were significant for appearance, color, and odor; only design Apresented a significant model for texture, while models from designs A and B were fittedfor overall liking and flavor acceptance. Linear and quadratic models were obtained butno ternary interaction was significant for the variables studied. The significant models,without lack of fit and with high coefficient of determination (R2
adj), with 70 to 98% of theexperimental variability being explained by the models, were used to generate the contourcurves (Figures 1 and 2).
The loaf specific volume and crumb firmness are related to the sensory attributesof the bread [22,23] and were therefore evaluated more thoroughly in this study. Theobjective was to obtain bread with higher expansion and lower crumb firmness, indicatinga softer loaf.
For specific volume, as displayed in Table 1 and Figure 1, RF showed the highercoefficient values in the regression models, therefore being responsible for higher specificvolume of loaves, while PS (lower coefficient value) promotes lower specific volume. TheGFB formulation prepared only with BF presented the greatest value for specific volume,followed by the formulations prepared with RF, AF, QF, and PS. The binary blends of AFwith PS, similarly to QF with RF or PS showed a synergistic effect, increasing the specificvolume of the bread.
No significant interactions were found for the other blends. Samples with the highestvalues for specific volume (~1.8 cm3/g) are indicated in the experimental region in dark red(Figure 1), comprising different blends of two or three components containing 30–75% AFcombined with RF or PS (Figure 1 Y1a), and containing 10–65% QF (Figure 1 Y1c) combinedwith RF or PS. The results show that it is possible to use up to 75% AF and up to 80% QFcombined with RF and obtain GFB in the region of highest specific volume.
22
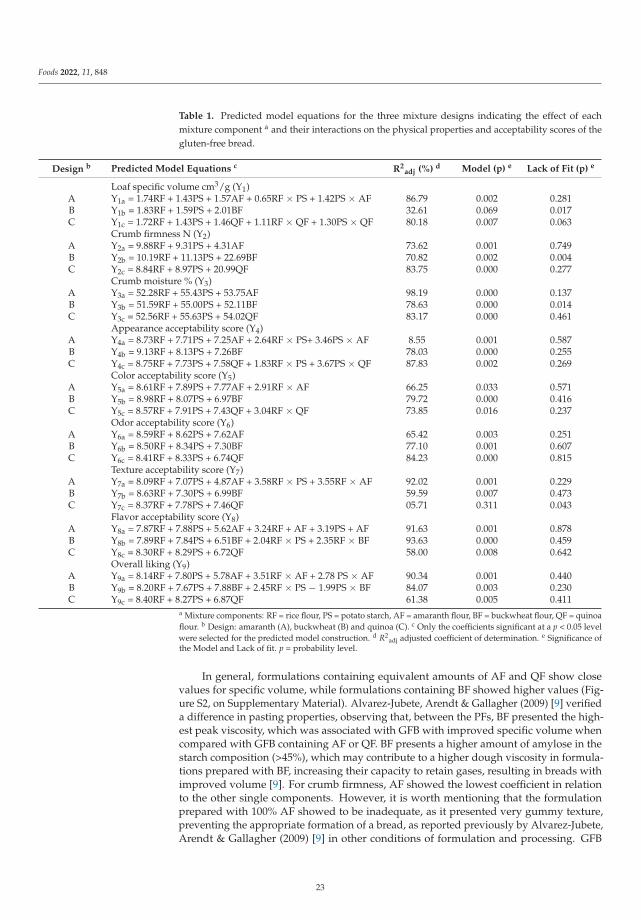
Foods 2022, 11, 848
Table 1. Predicted model equations for the three mixture designs indicating the effect of eachmixture component a and their interactions on the physical properties and acceptability scores of thegluten-free bread.
Design b Predicted Model Equations c R2adj (%) d Model (p) e Lack of Fit (p) e
Loaf specific volume cm3/g (Y1)A Y1a = 1.74RF + 1.43PS + 1.57AF + 0.65RF × PS + 1.42PS × AF 86.79 0.002 0.281B Y1b = 1.83RF + 1.59PS + 2.01BF 32.61 0.069 0.017C Y1c = 1.72RF + 1.43PS + 1.46QF + 1.11RF × QF + 1.30PS × QF 80.18 0.007 0.063
Crumb firmness N (Y2)A Y2a = 9.88RF + 9.31PS + 4.31AF 73.62 0.001 0.749B Y2b = 10.19RF + 11.13PS + 22.69BF 70.82 0.002 0.004C Y2c = 8.84RF + 8.97PS + 20.99QF 83.75 0.000 0.277
Crumb moisture % (Y3)A Y3a = 52.28RF + 55.43PS + 53.75AF 98.19 0.000 0.137B Y3b = 51.59RF + 55.00PS + 52.11BF 78.63 0.000 0.014C Y3c = 52.56RF + 55.63PS + 54.02QF 83.17 0.000 0.461
Appearance acceptability score (Y4)A Y4a = 8.73RF + 7.71PS + 7.25AF + 2.64RF × PS+ 3.46PS × AF 8.55 0.001 0.587B Y4b = 9.13RF + 8.13PS + 7.26BF 78.03 0.000 0.255C Y4c = 8.75RF + 7.73PS + 7.58QF + 1.83RF × PS + 3.67PS × QF 87.83 0.002 0.269
Color acceptability score (Y5)A Y5a = 8.61RF + 7.89PS + 7.77AF + 2.91RF × AF 66.25 0.033 0.571B Y5b = 8.98RF + 8.07PS + 6.97BF 79.72 0.000 0.416C Y5c = 8.57RF + 7.91PS + 7.43QF + 3.04RF × QF 73.85 0.016 0.237
Odor acceptability score (Y6)A Y6a = 8.59RF + 8.62PS + 7.62AF 65.42 0.003 0.251B Y6b = 8.50RF + 8.34PS + 7.30BF 77.10 0.001 0.607C Y6c = 8.41RF + 8.33PS + 6.74QF 84.23 0.000 0.815
Texture acceptability score (Y7)A Y7a = 8.09RF + 7.07PS + 4.87AF + 3.58RF × PS + 3.55RF × AF 92.02 0.001 0.229B Y7b = 8.63RF + 7.30PS + 6.99BF 59.59 0.007 0.473C Y7c = 8.37RF + 7.78PS + 7.46QF 05.71 0.311 0.043
Flavor acceptability score (Y8)A Y8a = 7.87RF + 7.88PS + 5.62AF + 3.24RF + AF + 3.19PS + AF 91.63 0.001 0.878B Y8b = 7.89RF + 7.84PS + 6.51BF + 2.04RF × PS + 2.35RF × BF 93.63 0.000 0.459C Y8c = 8.30RF + 8.29PS + 6.72QF 58.00 0.008 0.642
Overall liking (Y9)A Y9a = 8.14RF + 7.80PS + 5.78AF + 3.51RF × AF + 2.78 PS × AF 90.34 0.001 0.440B Y9b = 8.20RF + 7.67PS + 7.88BF + 2.45RF × PS − 1.99PS × BF 84.07 0.003 0.230C Y9c = 8.40RF + 8.27PS + 6.87QF 61.38 0.005 0.411
a Mixture components: RF = rice flour, PS = potato starch, AF = amaranth flour, BF = buckwheat flour, QF = quinoaflour. b Design: amaranth (A), buckwheat (B) and quinoa (C). c Only the coefficients significant at a p < 0.05 levelwere selected for the predicted model construction. d R2
adj adjusted coefficient of determination. e Significance ofthe Model and Lack of fit. p = probability level.
In general, formulations containing equivalent amounts of AF and QF show closevalues for specific volume, while formulations containing BF showed higher values (Fig-ure S2, on Supplementary Material). Alvarez-Jubete, Arendt & Gallagher (2009) [9] verifieda difference in pasting properties, observing that, between the PFs, BF presented the high-est peak viscosity, which was associated with GFB with improved specific volume whencompared with GFB containing AF or QF. BF presents a higher amount of amylose in thestarch composition (>45%), which may contribute to a higher dough viscosity in formula-tions prepared with BF, increasing their capacity to retain gases, resulting in breads withimproved volume [9]. For crumb firmness, AF showed the lowest coefficient in relationto the other single components. However, it is worth mentioning that the formulationprepared with 100% AF showed to be inadequate, as it presented very gummy texture,preventing the appropriate formation of a bread, as reported previously by Alvarez-Jubete,Arendt & Gallagher (2009) [9] in other conditions of formulation and processing. GFB
23
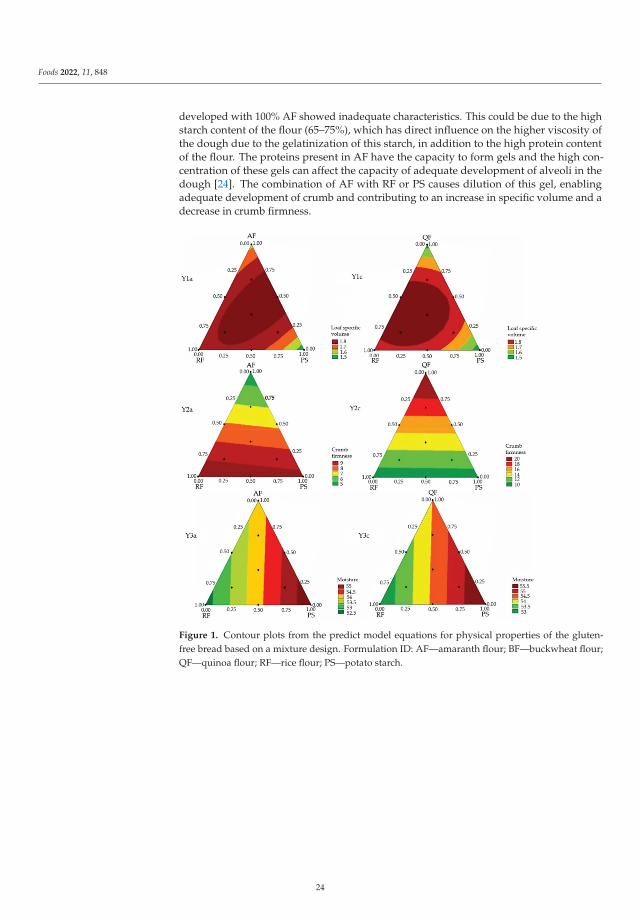
Foods 2022, 11, 848
developed with 100% AF showed inadequate characteristics. This could be due to the highstarch content of the flour (65–75%), which has direct influence on the higher viscosity ofthe dough due to the gelatinization of this starch, in addition to the high protein contentof the flour. The proteins present in AF have the capacity to form gels and the high con-centration of these gels can affect the capacity of adequate development of alveoli in thedough [24]. The combination of AF with RF or PS causes dilution of this gel, enablingadequate development of crumb and contributing to an increase in specific volume and adecrease in crumb firmness.
Figure 1. Contour plots from the predict model equations for physical properties of the gluten-free bread based on a mixture design. Formulation ID: AF—amaranth flour; BF—buckwheat flour;QF—quinoa flour; RF—rice flour; PS—potato starch.
24
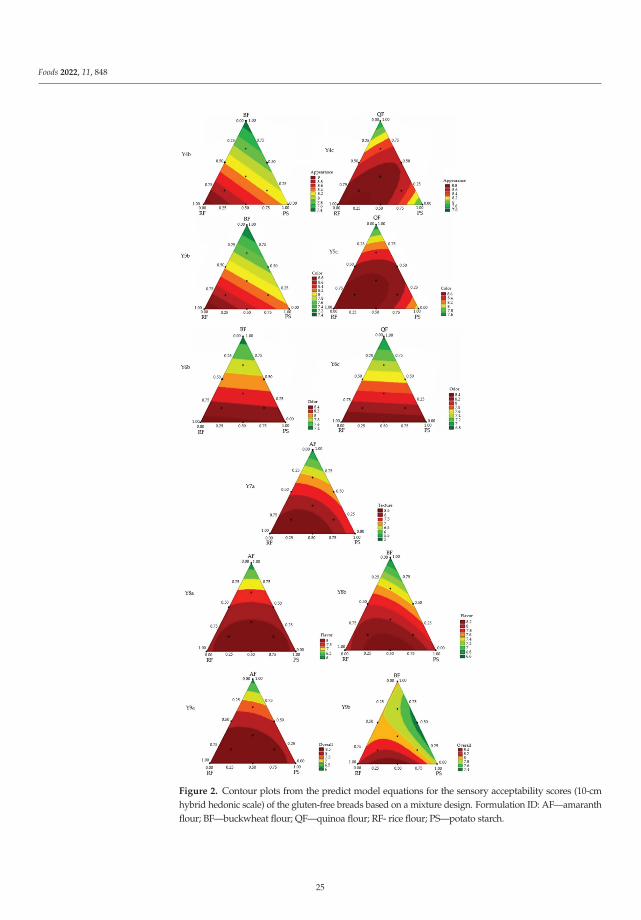
Foods 2022, 11, 848
Figure 2. Contour plots from the predict model equations for the sensory acceptability scores (10-cmhybrid hedonic scale) of the gluten-free breads based on a mixture design. Formulation ID: AF—amaranthflour; BF—buckwheat flour; QF—quinoa flour; RF- rice flour; PS—potato starch.
25
Foods 2022, 11, 848
QF showed the highest coefficient values in the regression models, therefore beingresponsible for the highest crumb firmness. The GFB formulation prepared only with BFshowed the highest value for crumb firmness, followed by the formulations prepared withQF, RF, and PS. However, the blends of BF or QF with RF and/or PS had no significanteffect on crumb firmness.
The results found in this study are similar to those reported by Föste et al. (2014) [25],as they also associate the presence of QF in GFB with increased crumb firmness, resultingin breads with lower softness. These effects may be related to the high amount of fiberspresent in QF, due to decreased starch gelatinization caused by the competition for waterbetween fibers and starch [26].
Concerning crumb moisture, PS showed the highest coefficient values in the regressionmodels, being responsible for the highest crumb moisture, while RF (lowest coefficientvalue) promoted the lowest crumb moisture, and AF, BF, and QF promoted intermediatevalues. Little variation was seen in crumb moisture between the 36 experimental formula-tions (variation from 51.6 to 55.6%), but no significant interactions were observed betweenthe components of these blends in the crumb moisture of the GFB.
The variations in the crumb moisture can be associated with the differences in theproperties of each flour, as they vary in the content and in the composition of the starchand protein fractions, as well as with the higher water absorption capacity of the PF and ofPS compared with RF [27,28].
In general, for the GFB developed with equal PF proportions, BF enabled better expan-sion of the breads, providing, at all content levels, the formation of a more homogeneouscrumb, with the highest number of small alveoli and a more even distribution. The use ofQF enabled the formation of more uniform crumb in relation to those obtained with AF.The use of high proportions (66% and 100%) of AF resulted in bread with compact structureand crumb with few alveoli.
The contour charts for the attributes of acceptability of the GFB (Figure 2) show thepossibility of using different blends of BF or QF with both RF and PS to obtain GFB withgood acceptability of appearance, color, and odor (scores > 7). The results also show thesynergistic effect of the blend of AF with RF or PS, which enables GFB with accepted texture.Blends of AF or BF with RF and PS enable increased flavor acceptability and overall liking,since they provide a less bitter flavor, besides improving the texture, which contributes to ahigher overall liking.
Figure 2 and the equations in Table 1 obtained for each model for acceptability showthat well-accepted GFB is possible (acceptability scores ≥ 7) for all attributes when usingup to 60% AF, 85% BF, and 82% QF in blends with RF in the composition.
3.2. Optimal Gluten-Free Bread Formulations
The results of the desirability function showed that the formulation prepared with100% RF corresponds to the optimal GFB formulation, with the highest scores for accept-ability (Figure S3, in the Supplementary Material).
PCA was used to determine the relations between the physical properties (specific vol-ume and crumb firmness) and the degree of liking of the GFB, presenting the formulationsaccording to similarity. This enabled the finding of the most accepted formulations thatcontain the highest amount of PF in the composition and present similar characteristicsto the optimal formulation (OF) containing 100% RF and to the control formulation (CF)prepared with 50% RF + 50% PS. The results are presented in the supplementary material(Figure S4). The two principal components explain 84.29–93.49% of the experimental varia-tion, indicating strong correlation between the variables investigated, showing that, amongthe formulations with PF, those prepared with 50% AF, BF, or QF in combination with RFpresented physical properties and acceptability closest to OF and CF.
26
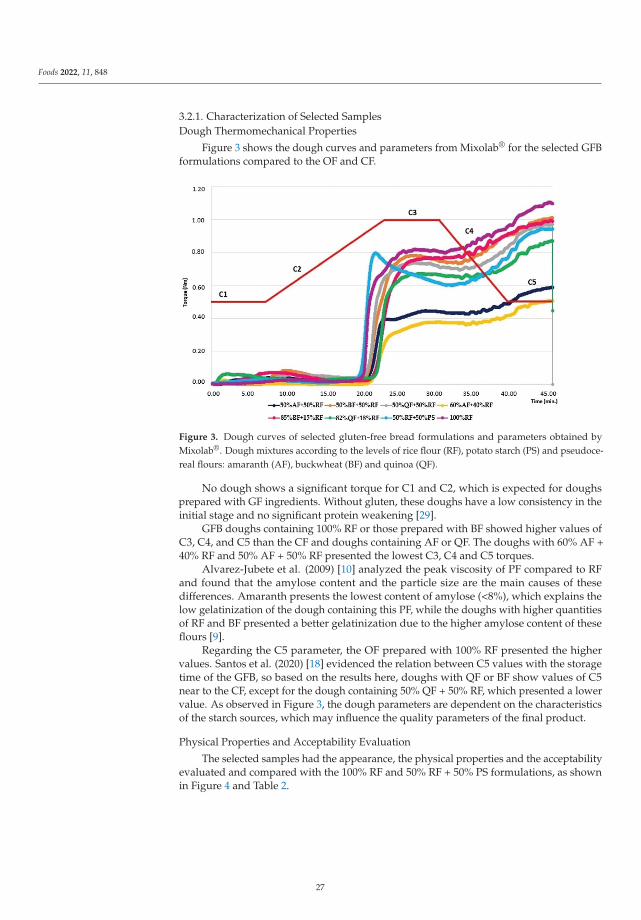
Foods 2022, 11, 848
3.2.1. Characterization of Selected SamplesDough Thermomechanical Properties
Figure 3 shows the dough curves and parameters from Mixolab® for the selected GFBformulations compared to the OF and CF.
Figure 3. Dough curves of selected gluten-free bread formulations and parameters obtained byMixolab®. Dough mixtures according to the levels of rice flour (RF), potato starch (PS) and pseudoce-real flours: amaranth (AF), buckwheat (BF) and quinoa (QF).
No dough shows a significant torque for C1 and C2, which is expected for doughsprepared with GF ingredients. Without gluten, these doughs have a low consistency in theinitial stage and no significant protein weakening [29].
GFB doughs containing 100% RF or those prepared with BF showed higher values ofC3, C4, and C5 than the CF and doughs containing AF or QF. The doughs with 60% AF +40% RF and 50% AF + 50% RF presented the lowest C3, C4 and C5 torques.
Alvarez-Jubete et al. (2009) [10] analyzed the peak viscosity of PF compared to RFand found that the amylose content and the particle size are the main causes of thesedifferences. Amaranth presents the lowest content of amylose (<8%), which explains thelow gelatinization of the dough containing this PF, while the doughs with higher quantitiesof RF and BF presented a better gelatinization due to the higher amylose content of theseflours [9].
Regarding the C5 parameter, the OF prepared with 100% RF presented the highervalues. Santos et al. (2020) [18] evidenced the relation between C5 values with the storagetime of the GFB, so based on the results here, doughs with QF or BF show values of C5near to the CF, except for the dough containing 50% QF + 50% RF, which presented a lowervalue. As observed in Figure 3, the dough parameters are dependent on the characteristicsof the starch sources, which may influence the quality parameters of the final product.
Physical Properties and Acceptability Evaluation
The selected samples had the appearance, the physical properties and the acceptabilityevaluated and compared with the 100% RF and 50% RF + 50% PS formulations, as shownin Figure 4 and Table 2.
27
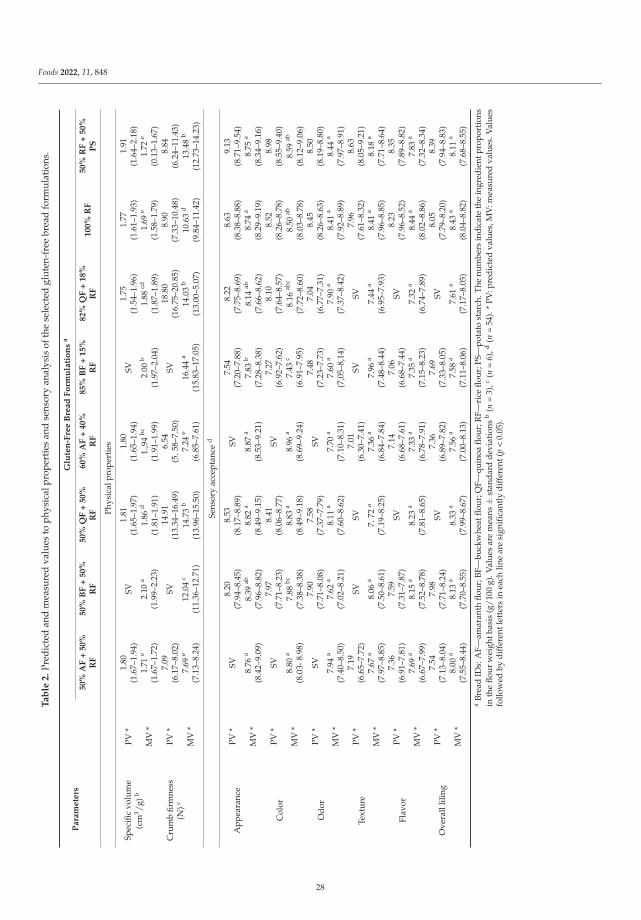
Foods 2022, 11, 848
Ta
ble
2.
Pred
icte
dan
dm
easu
red
valu
esto
phys
ical
prop
erti
esan
dse
nsor
yan
alys
isof
the
sele
cted
glut
en-f
ree
brea
dfo
rmul
atio
ns.
Pa
ram
ete
rsG
lute
n-F
ree
Bre
ad
Fo
rmu
lati
on
sa
50
%A
F+
50
%R
F5
0%
BF
+5
0%
RF
50
%Q
F+
50
%R
F6
0%
AF
+4
0%
RF
85
%B
F+
15
%R
F8
2%
QF
+1
8%
RF
10
0%
RF
50
%R
F+
50
%P
S
Phys
ical
prop
erti
es
Spec
ific
volu
me
(cm
3 /g)b
PV*
1.80
(1.6
7–1.
94)
SV1.
81(1
.65–
1.97
)1.
80(1
.65–
1.94
)SV
1.75
(1.5
4–1.
96)
1.77
(1.6
1–1.
93)
1.91
(1.6
4–2.
18)
MV
*1.
71e
(1.6
7–1.
72)
2.10
a
(1.9
9–2.
23)
1.86
d
(1.8
1–1.
91)
1.,9
4bc
(1.9
1–1.
99)
2.00
b
(1.9
7–2.
04)
1.88
cd
(1.8
7–1.
89)
1.69
e
(1.5
8–1.
79)
1.72
e
(0.1
3–1.
67)
Cru
mb
firm
ness
(N)c
PV*
7.09
(6.1
7–8.
02)
SV14
.91
(13.
34–1
6.49
)6.
54(5
.58–
7.50
)SV
18.8
0(1
6.75
–20.
85)
8.90
(7.3
3–10
.48)
8.84
(6.2
4–11
.43)
MV
*7.
69e
(7.1
3–8.
24)
12.0
4c
(11.
36–1
2.71
)14
.73
b
(13.
96–1
5.50
)7.
24e
(6.8
5–7.
61)
16.4
4a
(15.
83–1
7.05
)14
.03
b
(13.
00–5
.07)
10.6
3d
(9.8
4–11
.42)
13.4
8b
(12.
73–1
4.23
)
Sens
ory
acce
ptan
ced
App
eara
nce
PV*
SV8.
20(7
.94–
8.45
)8.
53(8
.17–
8.89
)SV
7.54
(7.2
0–7.
88)
8.22
(7.7
5–8.
69)
8.63
(8.3
8–8.
88)
9.13
(8.7
1–9.
54)
MV
*8.
76a
(8.4
2–9.
09)
8.39
ab
(7.9
6–8.
82)
8.82
a
(8.4
9–9.
15)
8.87
a
(8.5
3–9.
21)
7.83
b
(7.2
8–8.
38)
8.14
ab
(7.6
6–8.
62)
8.74
a
(8.2
9–9.
19)
8.75
a
(8.3
4–9.
16)
Col
orPV
*SV
7.97
(7.7
1–8.
23)
8.41
(8.0
6–8.
77)
SV7.
27(6
.92–
7.62
)8.
10(7
.64–
8.57
)8.
52(8
.26–
8.78
)8.
98(8
.55–
9.40
)
MV
*8.
80a
(8.0
3-8.
98)
7.88
bc
(7.3
8–8.
38)
8.83
a
(8.4
9–9.
18)
8.96
a
(8.6
9–9.
24)
7.43
c
(6.9
1–7.
95)
8.16
abc
(7.7
2–8.
60)
8.50
ab
(8.0
3–8.
78)
8.59
ab
(8.1
2–9.
06)
Odo
rPV
*SV
7.90
(7.7
1–8.
08)
7.58
(7.3
7–7.
79)
SV7.
48(7
.23–
7.73
)7.
04(6
.77–
7.31
)8.
45(8
.26–
8.63
)8.
50(8
.19–
8.80
)
MV
*7.
94a
(7.4
0–8.
50)
7.62
a
(7.0
2–8.
21)
8.11
a
(7.6
0–8.
62)
7.70
a
(7.1
0–8.
31)
7.60
a
(7,0
5–8,
14)
7.90
a
(7.3
7–8.
42)
8.41
a
(7.9
2–8.
89)
8.44
a
(7.9
7–8.
91)
Text
ure
PV*
7.19
(6.6
5–7.
72)
SVSV
7.01
(6.3
0–7.
41)
SVSV
7.96
(7.6
1–8.
32)
8.63
(8.0
5–9.
21)
MV
*7.
67a
(7.9
7–8.
85)
8.06
a
(7.5
0–8.
61)
7.72
a
(7.1
9–8.
25)
7.36
a
(6.8
4–7.
84)
7.96
a
(7.4
8–8.
44)
7.44
a
(6.9
5–7.
93)
8.41
a
(7.9
6–8.
85)
8.18
a
(7.7
1–8.
64)
Flav
orPV
*7.
36(6
.91–
7.81
)7.
59(7
.31–
7.87
)SV
7.14
(6.6
8–7.
61)
7.06
(6.6
8–7.
44)
SV8.
23(7
.96–
8.52
)8.
35(7
.89–
8.82
)
MV
*7.
69a
(6.6
7–7.
99)
8.15
a
(7.5
2–8.
78)
8.23
a
(7.8
1–8.
65)
7.33
a
(6.7
8–7.
91)
7.35
a
(7.1
5–8.
23)
7.32
a
(6.7
4–7.
89)
8.44
a
(8.0
2–8.
86)
7.83
a
(7.3
2–8.
34)
Ove
rall
lilin
gPV
*7.
54(7
.13–
8.04
)7.
98(7
.71–
8.24
)SV
7.36
(6.8
9–7.
82)
7.69
(7.3
3–8.
05)
SV8.
05(7
.79–
8.20
)8.
39(7
.94–
8.83
)
MV
*8.
00a
(7.5
5–8.
44)
8.13
a
(7.7
0–8.
55)
8.33
a
(7.9
9–8.
67)
7.56
a
(7.0
0–8.
13)
7.58
a
(7.1
1–8.
06)
7.61
a
(7.1
7–8.
05)
8.43
a
(8.0
4–8.
82)
8.11
a
(7.6
8–8.
55)
aBr
ead
IDs:
AF—
amar
anth
flour
;BF—
buck
whe
atflo
ur;Q
F—qu
inoa
flour
;RF—
rice
flour
;PS—
pota
tost
arch
.The
num
bers
indi
cate
the
ingr
edie
ntpr
opor
tions
inth
eflo
urw
eigh
tbas
is(g
/100
g).V
alue
sar
em
eans
±st
anda
rdde
viat
ions
b(n
=3)
,c(n
=6)
,d(n
=54
).*
PV:p
redi
cted
valu
es,M
V:m
easu
red
valu
es.V
alue
sfo
llow
edby
diff
eren
tlet
ters
inea
chlin
ear
esi
gnifi
cant
lydi
ffer
ent(
p<
0.05
).
28
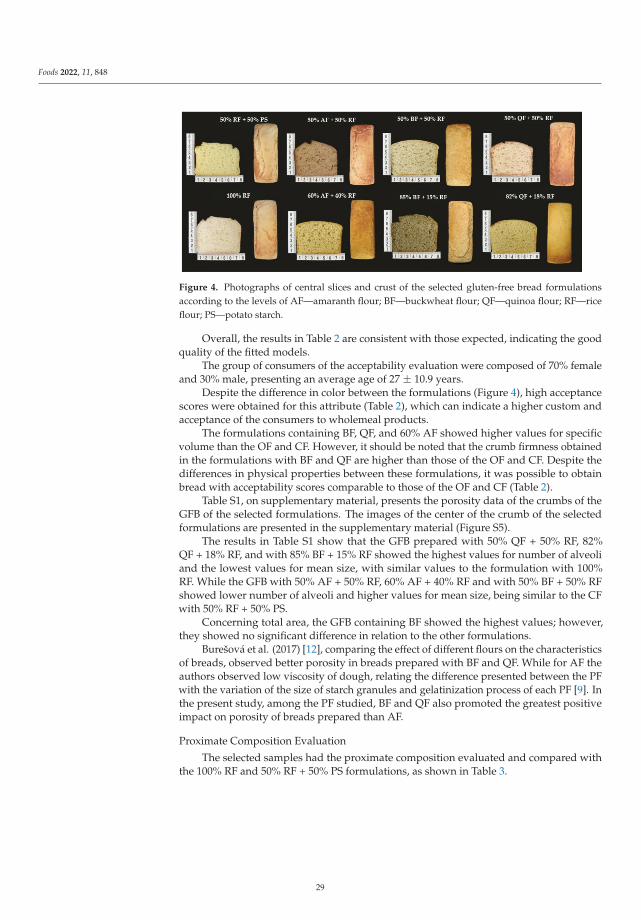
Foods 2022, 11, 848
Figure 4. Photographs of central slices and crust of the selected gluten-free bread formulationsaccording to the levels of AF—amaranth flour; BF—buckwheat flour; QF—quinoa flour; RF—riceflour; PS—potato starch.
Overall, the results in Table 2 are consistent with those expected, indicating the goodquality of the fitted models.
The group of consumers of the acceptability evaluation were composed of 70% femaleand 30% male, presenting an average age of 27 ± 10.9 years.
Despite the difference in color between the formulations (Figure 4), high acceptancescores were obtained for this attribute (Table 2), which can indicate a higher custom andacceptance of the consumers to wholemeal products.
The formulations containing BF, QF, and 60% AF showed higher values for specificvolume than the OF and CF. However, it should be noted that the crumb firmness obtainedin the formulations with BF and QF are higher than those of the OF and CF. Despite thedifferences in physical properties between these formulations, it was possible to obtainbread with acceptability scores comparable to those of the OF and CF (Table 2).
Table S1, on supplementary material, presents the porosity data of the crumbs of theGFB of the selected formulations. The images of the center of the crumb of the selectedformulations are presented in the supplementary material (Figure S5).
The results in Table S1 show that the GFB prepared with 50% QF + 50% RF, 82%QF + 18% RF, and with 85% BF + 15% RF showed the highest values for number of alveoliand the lowest values for mean size, with similar values to the formulation with 100%RF. While the GFB with 50% AF + 50% RF, 60% AF + 40% RF and with 50% BF + 50% RFshowed lower number of alveoli and higher values for mean size, being similar to the CFwith 50% RF + 50% PS.
Concerning total area, the GFB containing BF showed the highest values; however,they showed no significant difference in relation to the other formulations.
Burešová et al. (2017) [12], comparing the effect of different flours on the characteristicsof breads, observed better porosity in breads prepared with BF and QF. While for AF theauthors observed low viscosity of dough, relating the difference presented between the PFwith the variation of the size of starch granules and gelatinization process of each PF [9]. Inthe present study, among the PF studied, BF and QF also promoted the greatest positiveimpact on porosity of breads prepared than AF.
Proximate Composition Evaluation
The selected samples had the proximate composition evaluated and compared withthe 100% RF and 50% RF + 50% PS formulations, as shown in Table 3.
29
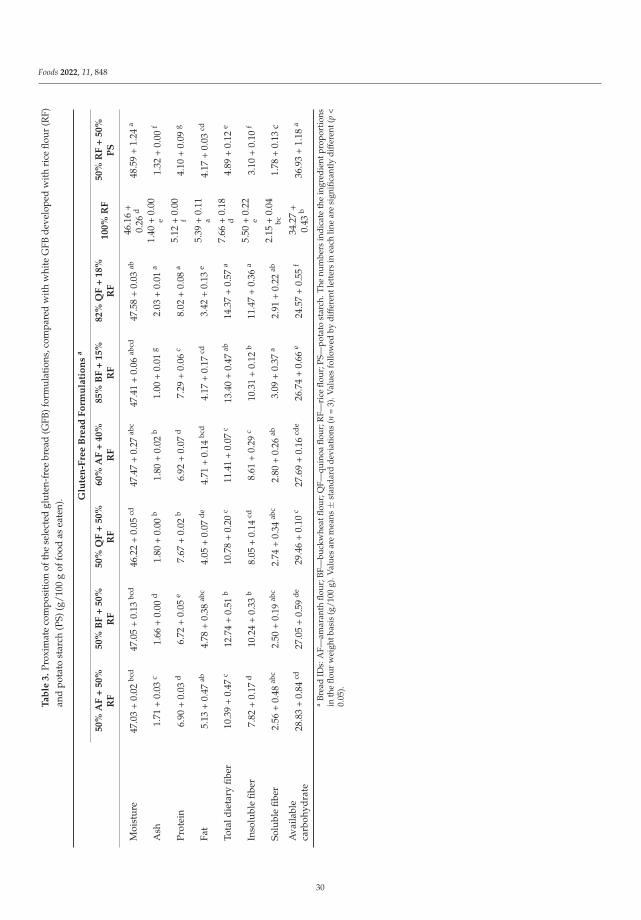
Foods 2022, 11, 848
Ta
ble
3.
Prox
imat
eco
mpo
sitio
nof
the
sele
cted
glut
en-f
ree
brea
d(G
FB)f
orm
ulat
ions
,com
pare
dw
ithw
hite
GFB
deve
lope
dw
ithri
ceflo
ur(R
F)an
dpo
tato
star
ch(P
S)(g
/100
gof
food
asea
ten)
. Glu
ten
-Fre
eB
rea
dF
orm
ula
tio
ns
a
50
%A
F+
50
%R
F5
0%
BF
+5
0%
RF
50
%Q
F+
50
%R
F6
0%
AF
+4
0%
RF
85
%B
F+
15
%R
F8
2%
QF
+1
8%
RF
10
0%
RF
50
%R
F+
50
%P
S
Moi
stur
e47
.03
+0.
02bc
d47
.05
+0.
13bc
d46
.22
+0.
05cd
47.4
7+
0.27
abc
47.4
1+
0.06
abcd
47.5
8+
0.03
ab46
.16
+0.
26d
48.5
9+
1.24
a
Ash
1.71
+0.
03c
1.66
+0.
00d
1.80
+0.
00b
1.80
+0.
02b
1.00
+0.
01g
2.03
+0.
01a
1.40
+0.
00e
1.32
+0.
00f
Prot
ein
6.90
+0.
03d
6.72
+0.
05e
7.67
+0.
02b
6.92
+0.
07d
7.29
+0.
06c
8.02
+0.
08a
5.12
+0.
00f
4.10
+0.
09g
Fat
5.13
+0.
47ab
4.78
+0.
38ab
c4.
05+
0.07
de4.
71+
0.14
bcd
4.17
+0.
17cd
3.42
+0.
13e
5.39
+0.
11a
4.17
+0.
03cd
Tota
ldie
tary
fiber
10.3
9+
0.47
c12
.74
+0.
51b
10.7
8+
0.20
c11
.41
+0.
07c
13.4
0+
0.47
ab14
.37
+0.
57a
7.66
+0.
18d
4.89
+0.
12e
Inso
lubl
efib
er7.
82+
0.17
d10
.24
+0.
33b
8.05
+0.
14cd
8.61
+0.
29c
10.3
1+
0.12
b11
.47
+0.
36a
5.50
+0.
22e
3.10
+0.
10f
Solu
ble
fiber
2.56
+0.
48ab
c2.
50+
0.19
abc
2.74
+0.
34ab
c2.
80+
0.26
ab3.
09+
0.37
a2.
91+
0.22
ab2.
15+
0.04
bc1.
78+
0.13
c
Ava
ilabl
eca
rboh
ydra
te28
.83
+0.
84cd
27.0
5+
0.59
de29
.46
+0.
10c
27.6
9+
0.16
cde
26.7
4+
0.66
e24
.57
+0.
55f
34.2
7+
0.43
b36
.93
+1.
18a
aBr
ead
IDs:
AF—
amar
anth
flour
;BF—
buck
whe
atflo
ur;Q
F—qu
inoa
flour
;RF—
rice
flour
;PS—
pota
tost
arch
.The
num
bers
indi
cate
the
ingr
edie
ntpr
opor
tions
inth
eflo
urw
eigh
tbas
is(g
/100
g).V
alue
sar
em
eans
±st
anda
rdde
viat
ions
(n=
3).V
alue
sfo
llow
edby
diff
eren
tlet
ters
inea
chlin
ear
esi
gnifi
cant
lydi
ffer
ent(
p<
0.05
).
30
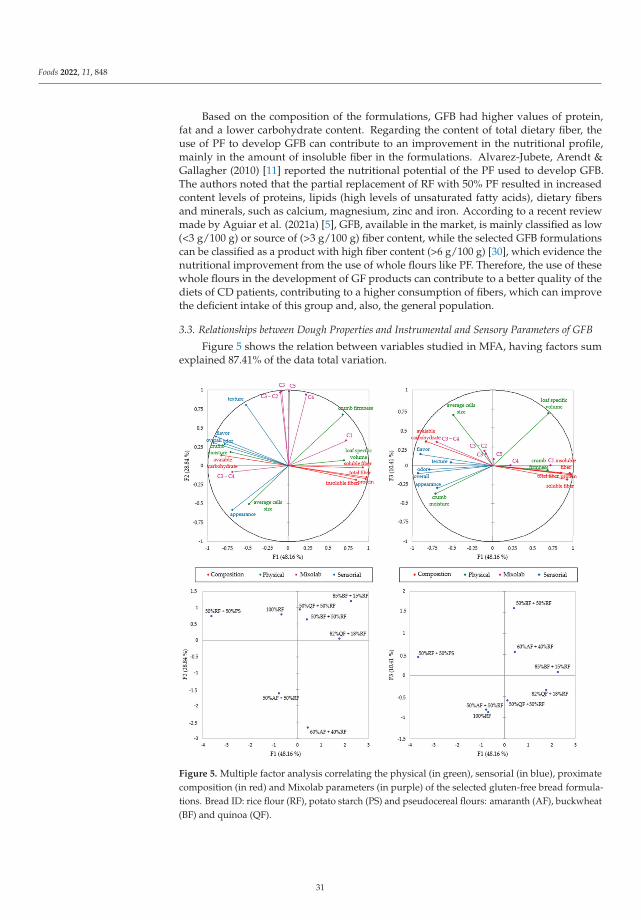
Foods 2022, 11, 848
Based on the composition of the formulations, GFB had higher values of protein,fat and a lower carbohydrate content. Regarding the content of total dietary fiber, theuse of PF to develop GFB can contribute to an improvement in the nutritional profile,mainly in the amount of insoluble fiber in the formulations. Alvarez-Jubete, Arendt &Gallagher (2010) [11] reported the nutritional potential of the PF used to develop GFB.The authors noted that the partial replacement of RF with 50% PF resulted in increasedcontent levels of proteins, lipids (high levels of unsaturated fatty acids), dietary fibersand minerals, such as calcium, magnesium, zinc and iron. According to a recent reviewmade by Aguiar et al. (2021a) [5], GFB, available in the market, is mainly classified as low(<3 g/100 g) or source of (>3 g/100 g) fiber content, while the selected GFB formulationscan be classified as a product with high fiber content (>6 g/100 g) [30], which evidence thenutritional improvement from the use of whole flours like PF. Therefore, the use of thesewhole flours in the development of GF products can contribute to a better quality of thediets of CD patients, contributing to a higher consumption of fibers, which can improvethe deficient intake of this group and, also, the general population.
3.3. Relationships between Dough Properties and Instrumental and Sensory Parameters of GFB
Figure 5 shows the relation between variables studied in MFA, having factors sumexplained 87.41% of the data total variation.
Figure 5. Multiple factor analysis correlating the physical (in green), sensorial (in blue), proximatecomposition (in red) and Mixolab parameters (in purple) of the selected gluten-free bread formula-tions. Bread ID: rice flour (RF), potato starch (PS) and pseudocereal flours: amaranth (AF), buckwheat(BF) and quinoa (QF).
31
Foods 2022, 11, 848
Figure 5 shows that F1 explained 48.16% of the data variation and positively discrimi-nates all the rheological parameter C1, and the composition parameters protein, insolublefiber, soluble fiber and the total dietary fiber describing the GFB sample containing 85%BF + 15% RF and 82% QF + 18% RF, induced by the higher amounts of PF in those formu-lations. Still on F1, the vectors negatively discriminate the variables C3–C4, appearance,odor, flavor, overall, crumb moisture, crumb firmness and available carbohydrate, relatedto CF (50% RF + 50% PS).
F2 explained 28.84% of the data variation and positively describes the dough pa-rameters C3, C4, C5, C3–C2, and the physical property parameter, texture, related to OF(100% RF) and 50% QF + 50% RF. It negatively describes the same parameters to samplesdeveloped with 50% AF + 50% RF and 60% AF + 40% RF, both having higher amounts ofAF in the dough.
F3, on the other hand, explained 10.41% of the data variation and was positivelydiscriminated with loaf-specific volume and the average cell size, related to the samplecontaining 50% BF + 50% RF.
The AFM sorted the selected GFB formulations into four distinct groups (Figure S6,in the Supplementary Material): the first group included samples containing AF (50%AF + 50% RF and 60% AF + 40% RF). The second group was composed of the samplescontaining the higher amounts of whole PF (85% BF + 15% RF and 82% QF + 18% RF). Thethird group contained the OF (100% RF) and the formulations with a lower quantity of PF(50% BF + 50% RF and 50% QF + 50% RF). The fourth group was composed of the CF (50%RF + 50% PS).
Based on the data relationship, the combination of PF and RF provides a better doughthan those that use PS, resulting in GFB with improved technological, nutritional, andsensory properties, contributing to a better food profile for people who choose or need tofollow a GF diet.
4. Conclusions
The mixture design showed that the use of PF alone resulted in GFB with low accept-ability, due to changes in odor and flavor of the product which the consumers are not soused to.
The results indicate that PF needs to be blended with RF to get possible positive effects,contributing to improved physical properties and better acceptability of the GFB. Thisshows that adding high PF levels to develop high-quality GFB enriched with protein, fatand dietary fiber is possible.
Blends of 50% AF, BF, or QF with 50% RF (flour basis) to obtain GFB with highacceptance, being similar to GFB formulated with 100% RF and also with the controlformulation developed with 50% RF + 50% PS on flour basis.
The mixture design allowed for the determination of the maximum PF proportionsthat can be used to obtain well-accepted formulations (scores ≥ 7) for appearance, color,odor, texture, and overall liking: 60% AF, 85% BF, and 82% QF in combination with RF.
The promising results of this study indicate an alternative for simultaneous improvementof physical properties, acceptability and nutritional content of GFB, which is very importantfor the nutrition and health of individuals with restrictions for gluten consumption.
Supplementary Materials: The following supporting information can be downloaded at: https://www.mdpi.com/article/10.3390/foods11060848/s1, Figure S1: Flow chart of the experimentaldesign. * Formulation ID: rice flour (RF), potato starch (PS) and pseudocereals flours—amaranth flour(AF), buckwheat flour (BF) or quinoa flour (QF). Figure S2: Scanned images of the gluten-free bread(GFB) formulations obtained from the experimental mixture designs. * Bread ID: rice flour (RF), potatostarch (PS) and pseudocereals flours—amaranth flour (AF), buckwheat flour (BF) or quinoa flour(QF). Figure S3: Profiles for predicted mixture experimental design of rice flour (RF), potato starch(PS) and pseudocereal flour (amaranth (AF), buckwheat (BF) or quinoa (QF)) and the desirabilitylevel for acceptability factor for optimum gluten-free bread. Figure S4: Principal component analysisof mixture design to evaluate the effect of rice flour—RF, potato starch—PS and pseudocereal flour
32
Foods 2022, 11, 848
(amaranth flour—AF (A), or buckwheat flour—BF (B) or quinoa flour—QF (C)) on physical propertiesand acceptability of gluten-free breads. Figure S5: Crumb porosity of gluten-free bread formulationsselected from the mixture designs. Figure S6. Dendrogram obtained by hierarchical cluster analysisfor data of selected gluten-free bread formulations. Table S1: Crumb porosity of gluten-free breadformulations selected from a mixture design to study the effects of pseudocereal flour: amaranth(AF), buckwheat (BF) and quinoa (QF) based gluten-free breads, comparing with white formulationsdeveloped with rice flour (RF) and potato starch (PS).
Author Contributions: Conceptualization and methodology, V.D.C.; validation and formal analysis,investigation, E.V.A., F.G.S. and A.C.L.S.C.; data curation, E.V.A. and V.D.C.; writing—original draftpreparation, E.V.A.; writing—review and editing, F.G.S. and V.D.C.; supervision, project administra-tion, funding acquisition, V.D.C. All authors have read and agreed to the published version of themanuscript.
Funding: This research was funded by São Paulo Research Foundation (FAPESP), grant number2012/17838-4, 2016/01505-7 and 2017/10843-6.
Institutional Review Board Statement: The study was conducted in accordance with the Declarationof Helsinki and approved by the Ethics Committee of Federal University of São Paulo (protocol code1.814.143 and date of approval 09/12/2016).
Informed Consent Statement: Informed consent was obtained from all subjects involved in the study.
Data Availability Statement: Not applicable.
Acknowledgments: The authors gratefully acknowledge Vogler Ingredients Ltd. and DenvercelFG-2504A, Denver Especialidades Químicas Ltd. who donated, respectively, xantham gum andcarboxymethylcellulose samples and the volunteers who kindly participated in this study.
Conflicts of Interest: The authors declare no conflict of interest. The funders had no role in the designof the study; in the collection, analyses, or interpretation of data; in the writing of the manuscript, orin the decision to publish the results.
References
1. Grand View Research. Gluten-Free Products Market Size, Share and Trends Analysis Report by Product (Bakery Products,Dairy/DairyAlternatives), by Distribution Channel (Grocery Stores, MassMerchandiser), by Region, and Segment Forecasts, 2020–2027;Grand View Research: San Francisco, CA, USA, 2020.
2. Do Nascimento, A.B.; Fiates, G.M.R.; Dos Anjos, A.; Teixeira, E. Gluten-free is not enough—Perception and suggestions of celiacconsumers. Int. J. Food Sci. Nutr. 2014, 65, 394–398. [CrossRef] [PubMed]
3. Alencar, N.M.M.; de Araújo, V.A.; Faggian, L.; Araújo, M.B.D.S.; Capriles, V.D. What about gluten-free products? An insight onceliac consumers’ opinions and expectations. J. Sens. Stud. 2021, 36, e12664. [CrossRef]
4. Capriles, V.D.; Santos, F.G.; Aguiar, E.V. Innovative gluten-free breadmaking. In Trends in Wheat and Bread Making, 30th ed.;Galanakis, C., Ed.; Academic Press: Cambridge, MA, USA; Elsevier: Amsterdam, The Netherlands, 2021; pp. 371–404.
5. Aguiar, E.V.; Santos, F.G.; Krupa-Kozak, U.; Capriles, V.D. Nutritional facts regarding commercially available gluten-free breadworldwide: Recent advances and future challenges. Crit. Rev. Food Sci. Nutr. 2021, 1–13. [CrossRef] [PubMed]
6. Capriles, V.; Santos, F.G.; Arêas, J.A.G. Gluten-free breadmaking: Improving nutritional and bioactive compounds. J. Cereal Sci.2016, 67, 83–91. [CrossRef]
7. Woomer, J.S.; Adedeji, A.A. Current applications of gluten-free grains—A review. Crit. Rev. Food Sci. Nutr. 2020, 61, 14–24.[CrossRef]
8. Martínez-Villaluenga, C.; Peñas, E.; Hernández-Ledesma, B. Pseudocereal grains: Nutritional value, health benefits and currentapplications for the development of gluten-free foods. Food Chem. Toxicol. 2020, 137, 111178. [CrossRef]
9. Alvarez-Jubete, L.; Arendt, E.K.; Gallagher, E. Nutritive value and chemical composition of pseudocereals as gluten-freeingredients. Int. J. Food Sci. Nutr. 2009, 60, 240–257. [CrossRef]
10. Alvarez-Jubete, L.; Auty, M.; Arendt, E.K.; Gallagher, E. Baking properties and microstructure of pseudocereal flours in gluten-freebread formulations. Eur. Food Res. Technol. 2009, 230, 437–445. [CrossRef]
11. Alvarez-Jubete, L.; Arendt, E.K.; Gallagher, E. Nutritive value of pseudocereals and their increasing use as functional gluten-freeingredients. Trends Food Sci. Technol. 2010, 21, 106–113. [CrossRef]
12. Burešová, I.; Tokár, M.; Marecek, J.; Hrivna, L.; Famera, O.; Šottníková, V. The comparison of the effect of added amaranth,buckwheat, chickpea, corn, millet and quinoa flour on rice dough rheological characteristics, textural and sensory quality ofbread. J. Cereal Sci. 2017, 75, 158–164. [CrossRef]
13. Alencar, N.M.M.; Steel, C.J.; Alvim, I.D.; de Morais, E.C.; Bolini, H. Addition of quinoa and amaranth flour in gluten-free breads:Temporal profile and instrumental analysis. LWT Food Sci. Technol. 2015, 62, 1011–1018. [CrossRef]
33
Foods 2022, 11, 848
14. Drub, T.F.; dos Santos, F.G.; Centeno, A.C.L.S.; Capriles, V.D. Sorghum, millet and pseudocereals as ingredients for gluten-freewhole-grain yeast rolls. Int. J. Gastron. Food Sci. 2020, 23, 100293. [CrossRef]
15. Capriles, V.D.; Arêas, J.A.G. Novel Approaches in Gluten-Free Breadmaking: Interface between Food Science, Nutrition, andHealth. Compr. Rev. Food Sci. Food Saf. 2014, 13, 871–890. [CrossRef]
16. Aguiar, E.V.; Santos, F.G.; Centeno, A.C.L.S.; Capriles, V.D. Influence of pseudocereals on gluten-free bread quality: A studyintegrating dough rheology, bread physical properties and acceptability. Food Res. Int. 2021, 150, 110762. [CrossRef]
17. AACC. Approved Methods of Analysis; AACC: Washington, DC, USA, 2010.18. Santos, F.G.; Aguiar, E.V.; Centeno, A.C.L.; Rosell, C.M.; Capriles, V.D. Effect of added psyllium and food enzymes on quality
attributes and shelf life of chickpea-based gluten-free bread. LWT 2020, 134, 110025. [CrossRef]19. Villanueva, N.D.; Petenate, A.J.; Da Silva, M.A. Performance of three affective methods and diagnosis of the ANOVA model. Food
Qual. Prefer. 2000, 11, 363–370. [CrossRef]20. Santos, F.G.; Aguiar, E.V.; Rosell, C.M.; Capriles, V.D. Potential of chickpea and psyllium in gluten-free breadmaking: Assessing
bread’s quality, sensory acceptability, and glycemic and satiety indexes. Food Hydrocoll. 2021, 113, 106487. [CrossRef]21. AOAC—Association of Official Analytical Chemists. Official Methods of the AOAC International, 18th ed.; Association of Official
Analytical Chemists: Rockville, MD, USA, 2005.22. Fratelli, C.; Muniz, D.G.; Santos, F.G.; Capriles, V.D. Modelling the effects of psyllium and water in gluten-free bread: An
approach to improve the bread quality and glycemic response. J. Funct. Foods 2018, 42, 339–345. [CrossRef]23. Fratelli, C.; Santos, F.; Muniz, D.; Habu, S.; Braga, A.; Capriles, V. Psyllium Improves the Quality and Shelf Life of Gluten-Free
Bread. Foods 2021, 10, 954. [CrossRef]24. Avanza, M.; Puppo, M.; Añón, M. Rheological characterization of amaranth protein gels. Food Hydrocoll. 2005, 19, 889–898.
[CrossRef]25. Föste, M.; Nordlohne, S.D.; Elgeti, D.; Linden, M.H.; Heinz, V.; Jekle, M.; Becker, T. Impact of quinoa bran on gluten-free dough
and bread characteristics. Eur. Food Res. Technol. 2014, 239, 767–775. [CrossRef]26. Collar, C.; Santos, E.; Rosell, C.M. Significance of Dietary Fiber on the Viscometric Pattern of Pasted and Gelled Flour-Fiber
Blends. Cereal Chem. J. 2006, 83, 370–376. [CrossRef]27. Wronkowska, M.; Haros, M.; Soral-Smietana, M. Effect of Starch Substitution by Buckwheat Flour on Gluten-Free Bread Quality.
Food Bioprocess Technol. 2012, 6, 1820–1827. [CrossRef]28. De la Hera, E.; Rosell, C.M.; Gomez, M. Effect of water content and flour particle size on gluten-free bread quality and digestibility.
Food Chem. 2014, 151, 526–531. [CrossRef]29. Matos, M.E.; Rosell, C.M. Quality Indicators of Rice-Based Gluten-Free Bread-Like Products: Relationships Between Dough
Rheology and Quality Characteristics. Food Bioprocess Technol. 2012, 6, 2331–2341. [CrossRef]30. Codex Alimentarius Comission. Guidelines for Use of Nutritionand Health Claims—CAC/GL 23-1997; Codex Alimentarius Comission:
Rome, Italy, 2013.
34
Citation: Kojic, J.; Belovic, M.; Krulj,
J.; Pezo, L.; Teslic, N.; Kojic, P.;
Tukuljac, L.P.; Šeregelj, V.; Ilic, N.
Textural, Color and Sensory Features
of Spelt Wholegrain Snack Enriched
with Betaine. Foods 2022, 11, 475.
https://doi.org/10.3390/
foods11030475
Academic Editors: Luca Serventi,
Charles Brennan and Rana Mustafa
Received: 31 December 2021
Accepted: 1 February 2022
Published: 6 February 2022
Publisher’s Note: MDPI stays neutral
with regard to jurisdictional claims in
published maps and institutional affil-
iations.
Copyright: © 2022 by the authors.
Licensee MDPI, Basel, Switzerland.
This article is an open access article
distributed under the terms and
conditions of the Creative Commons
Attribution (CC BY) license (https://
creativecommons.org/licenses/by/
4.0/).
foods
Article
Textural, Color and Sensory Features of Spelt Wholegrain SnackEnriched with Betaine
Jovana Kojic 1,*, Miona Belovic 1, Jelena Krulj 1, Lato Pezo 2, Nemanja Teslic 1, Predrag Kojic 3,
Lidija Peic Tukuljac 1, Vanja Šeregelj 3 and Nebojša Ilic 1
1 Institute of Food Technology, University of Novi Sad, Bulevar Cara Lazara 1, 21000 Novi Sad, Serbia;[email protected] (M.B.); [email protected] (J.K.); [email protected] (N.T.);[email protected] (L.P.T.); [email protected] (N.I.)
2 Institute of General and Physical Chemistry, University of Belgrade, Studentski Trg 12-16,11000 Beograd, Serbia; [email protected]
3 Faculty of Technology, University of Novi Sad, Bulevar Cara Lazara 1, 21000 Novi Sad, Serbia;[email protected] (P.K.); [email protected] (V.Š.)
* Correspondence: [email protected]
Abstract: The influence of different extrusion parameters, including screw speed (250–750 rpm), feedrate (15–25 kg/h) and feed moisture content (15–25%), on the textural and color properties of speltwholegrain snack products produced on a co-rotating twin-screw extruder with added betaine wasinvestigated. In order to determine the relative influence of input variables in the artificial neuralnetwork (ANN) model, Yoon’s interpretation method was used, and it was concluded that feedmoisture content has the greatest influence on L* values, while screw speed has the greatest influenceon a* and b* values. The softest samples were obtained at the lowest moisture content. Sensoryanalysis was carried out on selected samples, and it showed that betaine addition did not intensifythe bitter taste. The sample with the largest expansion exhibited the lowest hardness and chewinessbefore and after immersion in milk, and this sample is the most suitable for enrichment with betaine.
Keywords: extrusion; snack; betaine; functional foods
1. Introduction
Recently, there has been an increasing amount of interest in the replacement of ex-truded products based on corn grits, which are the most common ones in the market,with nutritional, rich, cereals-based extrudates. Numerous cereals (such as wheat, ama-ranth and quinoa) have been used to improve the nutritional value and textural propertiesof extruded snack without reducing product quality in terms of organoleptic propertiesand consumers acceptability [1–4]. Thus far, the influence of spelt flour addition on thephysical and rheological properties of extruded products based on corn grits has beeninvestigated [5]. In comparison with common wheat, spelt flour has a higher content ofprotein (especially prolamin) and some amino acids (proline, glutamic acid, tyrosine andaspartic acid), as well as vitamin B, fiber, lipids and mineral elements, and it also has higherbioavailability [6–9]. The high content of nutritionally valuable components makes speltflour suitable for the production of a wide range of food products. Although describedas poorer in technological quality compared to common wheat, spelt flour is used forthe production of pasta, bread, snacks and other food products [8,10,11]. In the last fewyears, cultivation of spelt flour has increased in Serbia, and a large number of studies havebeen conducted related to the protective role of the spelt husk of grain [12], for its use inbakeries [13], pasta production [14,15], as well as in solving byproduct issues by pelletingspelt grain husks [16]. Foods based on cereals have been presented as the largest source ofbetaine in the Western diet [17].
Betaine as a bioactive compound provides many health benefits. The main role ofbetaine in the human organism is to supply methyl groups for essential physiological
Foods 2022, 11, 475. https://doi.org/10.3390/foods11030475 https://www.mdpi.com/journal/foods35
Foods 2022, 11, 475
processes [18]. The requirements of the organism cannot be satisfied with the endogenoussynthesis of betaine, and therefore, its intake is necessary through diet. In the 2017 studyof Kojic et al., the following order was determined among cereals in terms of the highestbetaine content, with spelt flour at the top: buckwheat < millet < wheat < oats < rye <barley < amaranth < spelt [19]. Functional snack products from spelt wholegrain flourwith the addition of betaine have been produced to satisfy the need for the recommendeddaily intake of betaine of 1500 mg in accordance with Commission Regulation (EU) No432/2012. In previous work, it was shown that enriched spelt-flour-based extrudates satisfythe recommended daily intake of betaine [20]. Many critical parameters during extrusion,such as the feed rate of the mixture, screw speed and temperature in the barrel and die,affect the sensory properties of extrudate products which are primarily related to taste,texture and color.
Qualitative evaluation of snack products includes sensory, instrumental and mi-crostructural characterization, which represent the final evaluation to determine consumeracceptability. In order to obtain a sensory profile of snack product samples, an objectivesensory evaluation needs to be performed using a panel of trained evaluators. Humanperception of a product is often closely related to the instrumental analysis of texture.Instrumental texture determination is an objective, fast and relatively inexpensive analysisof the characteristics of final products [21]. Color is one of the most important attributes offood products, providing information regarding the degree of cooking of the product andappearance and freshness of food [22]. It is a very important quantitative characteristic ofextrudate quality that is directly related to consumer acceptance [23]. In addition, a changein food color may be a qualitative indicator of the extent of deterioration in food qualitydue to heat treatment [24]. Since human perception of color is subjective and individual, in-strumental techniques for defining the color of a product provide more reliable results. Theeffects of extrusion parameters and the application of different raw materials on the colorof extruded products have been the subject of numerous studies [25–30]. The main aim ofthis research was to evaluate the influence of extrusion cooking parameters (moisture, feedrate and screw speed) on the texture, color and sensory characteristics of snack productsbased on wholegrain spelt flour with added betaine.
2. Materials and Methods
2.1. Extrusion Processing—Experimental Design
Spelt flour enriched with betaine (9% w/w addition) was extruded using a co-rotatingtwin-screw extruder (Bühler BTSK 30/28D, 7 sections, length/diameter ratio = 28:1, Bühler,Uzwil, Switzerland). The extruder contains two temperature control units (the first unit-controlled temperature in sections set at 60 ◦C and the second set temperature at 120 ◦C).Screw configuration specially designed for the production of directly expanded snackproducts was used (the die opening diameter was 4 mm). A betaine addition of 9% waschosen in accordance with our preliminary trials with wholegrain spelt flour enrichedwith 1% of betaine, taking into account betaine loss during the extrusion cooking process.Before the extrusion process, the blends were mixed in a twin-shaft paddle mixer thatis part of the laboratory vacuum coater (model F-6-RVC, Forberg International AS, Oslo,Norway). Total creation of snack products from spelt wholegrain flour with added 9% w/wbetaine that can be beneficial to the human health and contribute to the recommended dailybetaine intake was successfully carried out [23]. The content of betaine was measured bythe developed and validated HPLC-ELSD method, and it was in the range from 1248.0 to1543.1 mg/40 g [19].
The effects of the three extrusion factors, i.e., moisture (M; 15–25%), feed rate (FR;15–25 kg/h) and screw speed (SS; 250–750 rpm), on hardness and color coordinates L*, a*and b* during the extrusion process of snacks was studied. The experimental data usedfor the analysis were fully determined using a central composite rotatable design (CCRD;α = 1.682), explained with eight cube points, six axial points and three central points(Table 1). The CCRD experimental design was applied to limit the number of samples to a
36
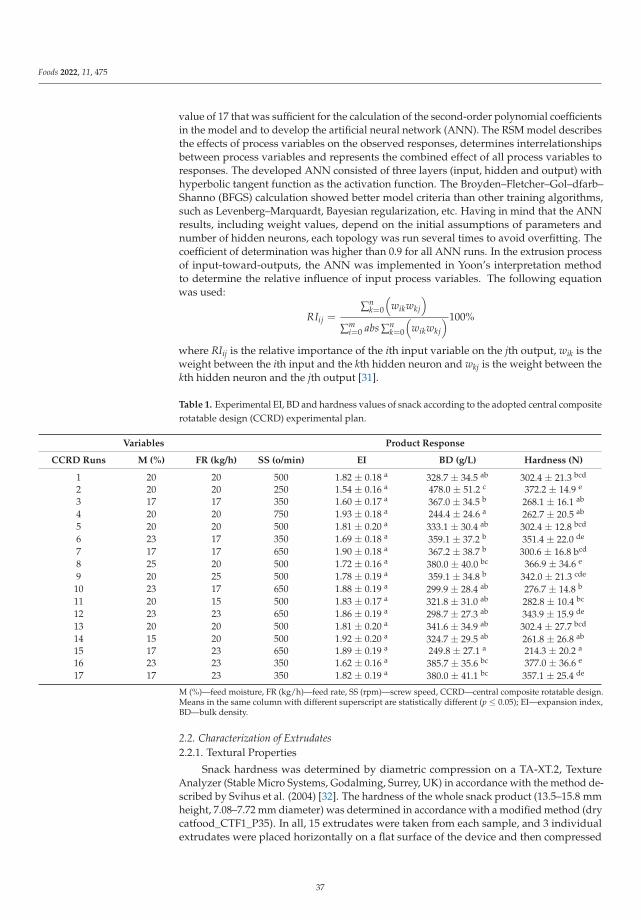
Foods 2022, 11, 475
value of 17 that was sufficient for the calculation of the second-order polynomial coefficientsin the model and to develop the artificial neural network (ANN). The RSM model describesthe effects of process variables on the observed responses, determines interrelationshipsbetween process variables and represents the combined effect of all process variables toresponses. The developed ANN consisted of three layers (input, hidden and output) withhyperbolic tangent function as the activation function. The Broyden–Fletcher–Gol–dfarb–Shanno (BFGS) calculation showed better model criteria than other training algorithms,such as Levenberg–Marquardt, Bayesian regularization, etc. Having in mind that the ANNresults, including weight values, depend on the initial assumptions of parameters andnumber of hidden neurons, each topology was run several times to avoid overfitting. Thecoefficient of determination was higher than 0.9 for all ANN runs. In the extrusion processof input-toward-outputs, the ANN was implemented in Yoon’s interpretation methodto determine the relative influence of input process variables. The following equationwas used:
RIij =∑n
k=0
(wikwkj
)
∑mi=0 abs ∑n
k=0
(wikwkj
)100%
where RIij is the relative importance of the ith input variable on the jth output, wik is theweight between the ith input and the kth hidden neuron and wkj is the weight between thekth hidden neuron and the jth output [31].
Table 1. Experimental EI, BD and hardness values of snack according to the adopted central compositerotatable design (CCRD) experimental plan.
Variables Product Response
CCRD Runs M (%) FR (kg/h) SS (o/min) EI BD (g/L) Hardness (N)
1 20 20 500 1.82 ± 0.18 a 328.7 ± 34.5 ab 302.4 ± 21.3 bcd
2 20 20 250 1.54 ± 0.16 a 478.0 ± 51.2 c 372.2 ± 14.9 e
3 17 17 350 1.60 ± 0.17 a 367.0 ± 34.5 b 268.1 ± 16.1 ab
4 20 20 750 1.93 ± 0.18 a 244.4 ± 24.6 a 262.7 ± 20.5 ab
5 20 20 500 1.81 ± 0.20 a 333.1 ± 30.4 ab 302.4 ± 12.8 bcd
6 23 17 350 1.69 ± 0.18 a 359.1 ± 37.2 b 351.4 ± 22.0 de
7 17 17 650 1.90 ± 0.18 a 367.2 ± 38.7 b 300.6 ± 16.8 bcd
8 25 20 500 1.72 ± 0.16 a 380.0 ± 40.0 bc 366.9 ± 34.6 e
9 20 25 500 1.78 ± 0.19 a 359.1 ± 34.8 b 342.0 ± 21.3 cde
10 23 17 650 1.88 ± 0.19 a 299.9 ± 28.4 ab 276.7 ± 14.8 b
11 20 15 500 1.83 ± 0.17 a 321.8 ± 31.0 ab 282.8 ± 10.4 bc
12 23 23 650 1.86 ± 0.19 a 298.7 ± 27.3 ab 343.9 ± 15.9 de
13 20 20 500 1.81 ± 0.20 a 341.6 ± 34.9 ab 302.4 ± 27.7 bcd
14 15 20 500 1.92 ± 0.20 a 324.7 ± 29.5 ab 261.8 ± 26.8 ab
15 17 23 650 1.89 ± 0.19 a 249.8 ± 27.1 a 214.3 ± 20.2 a
16 23 23 350 1.62 ± 0.16 a 385.7 ± 35.6 bc 377.0 ± 36.6 e
17 17 23 350 1.82 ± 0.19 a 380.0 ± 41.1 bc 357.1 ± 25.4 de
M (%)—feed moisture, FR (kg/h)—feed rate, SS (rpm)—screw speed, CCRD—central composite rotatable design.Means in the same column with different superscript are statistically different (p ≤ 0.05); EI—expansion index,BD—bulk density.
2.2. Characterization of Extrudates2.2.1. Textural Properties
Snack hardness was determined by diametric compression on a TA-XT.2, TextureAnalyzer (Stable Micro Systems, Godalming, Surrey, UK) in accordance with the method de-scribed by Svihus et al. (2004) [32]. The hardness of the whole snack product (13.5–15.8 mmheight, 7.08–7.72 mm diameter) was determined in accordance with a modified method (drycatfood_CTF1_P35). In all, 15 extrudates were taken from each sample, and 3 individualextrudates were placed horizontally on a flat surface of the device and then compressed
37
Foods 2022, 11, 475
with a cylindrical probe made of stainless steel with a diameter of 45 mm, load cell of50 kg and trigger force of 100 g. The hardness of the sample is expressed as the meanvalue of 15 measurements and is expressed in kilograms. The parameters of the instrumentadjustment during the test were as follows: pre-test speed: 2.0 mm/s; test speed: 1 mm/s;post-test speed: 10 mm/s, probe path: 2.5 mm.
2.2.2. Color Measurement
The color of wholegrain spelt flour with the addition of betaine (9% w/w) andgrounded snack products was determined in ten replicates using Chroma Meter CR-400(Konica Minolta Co., Ltd., Osaka, Japan) and a suitable extension (CR-A50), adapted formeasurements of this type of sample in the CIE L* a* b* color space. Total color change (ΔE)between flour and betaine blend and spelt wholegrain flour was calculated based on thefollowing formula:
ΔE = [(L − L0)2 + (a − a0) + (b − b0)2]1/2 (1)
where subscript zero indicates the color parameters of the raw material blend.
2.2.3. Sensory Evaluation of Snack Products Using a Panel of Trained Evaluators
Eight trained panelists, between 25 and 50 years old, from the Institute of FoodTechnology in Novi Sad, participated in the examination of the sensory properties of snackproducts. The panelists had more than 4 years of experience in working with commercialproducts and products developed within scientific research projects. Their training includedexercises in identifying, developing terminology and evaluating the intensity of sensoryattributes. The panelists had additional training on snack products for the purposes of thisstudy. Two-hour sessions were held to establish the sensory terminology for the testedsnack products. Initially, panelists used descriptors from previously published papers withsimilar topics [33,34] as a starting point, and they could keep, delete or add any descriptor.
A consensus approach was used to determine the final descriptors for snack products.The panel leader led a discussion of each descriptor in order to determine the appropri-ateness of the terms, definitions and assessment techniques. A final list of descriptorswith definitions is given in Supplementary Table S1, which were used by the panel toevaluate all samples in terms of intensity. Intensity assessment was performed using anunstructured linear scale with points 0—imperceptible and 100—very intense. Since it ispredicted that the created snack products will be consumed after immersion in milk, thesensory evaluation consisted of two parts.
In the first part, 6 selected attributes of snack products before immersion in milk wereevaluated (color, hardness, chewiness, sweet taste, bitter taste). In the second part, 5 g offlips product was immersed in 50 mL of milk (1.5% milk fat) at room temperature. After5 min, the attributes describing taste and texture were re-evaluated (hardness, chewiness,sweet taste, bitter taste). Distilled water was used to clean the mouth between samplesduring the evaluation. The assessment was performed in a sensory testing laboratory withappropriate control of environmental conditions [35].
2.3. Statistical Analysis
Statistical analysis was obtained by analysis of variance (ANOVA) followed by Tukey’sTest. The results, expressed as mean ± standard deviation, were considered statisticallysignificant with p ≤ 0.05. Different letters indicate significant differences in the results(p ≤ 0.05).
In order to obtain a better insight into the relationship between sensory properties,instrumentally measured quality parameters (diameter, color and textural properties) andbetaine content in snack products, principal component analysis (PCA) was performedusing the PanelCheck software (version 1.4.0, Nofima Mat, Norway, Norway, 2010, https://www.panelcheck.com/, accessed on 27 December 2021).
38
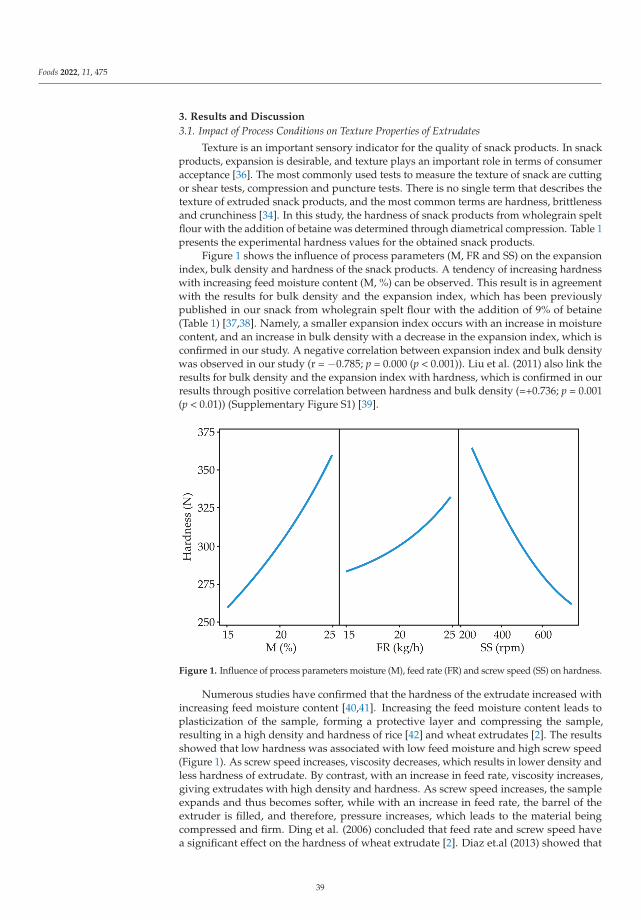
Foods 2022, 11, 475
3. Results and Discussion
3.1. Impact of Process Conditions on Texture Properties of Extrudates
Texture is an important sensory indicator for the quality of snack products. In snackproducts, expansion is desirable, and texture plays an important role in terms of consumeracceptance [36]. The most commonly used tests to measure the texture of snack are cuttingor shear tests, compression and puncture tests. There is no single term that describes thetexture of extruded snack products, and the most common terms are hardness, brittlenessand crunchiness [34]. In this study, the hardness of snack products from wholegrain speltflour with the addition of betaine was determined through diametrical compression. Table 1presents the experimental hardness values for the obtained snack products.
Figure 1 shows the influence of process parameters (M, FR and SS) on the expansionindex, bulk density and hardness of the snack products. A tendency of increasing hardnesswith increasing feed moisture content (M, %) can be observed. This result is in agreementwith the results for bulk density and the expansion index, which has been previouslypublished in our snack from wholegrain spelt flour with the addition of 9% of betaine(Table 1) [37,38]. Namely, a smaller expansion index occurs with an increase in moisturecontent, and an increase in bulk density with a decrease in the expansion index, which isconfirmed in our study. A negative correlation between expansion index and bulk densitywas observed in our study (r = −0.785; p = 0.000 (p < 0.001)). Liu et al. (2011) also link theresults for bulk density and the expansion index with hardness, which is confirmed in ourresults through positive correlation between hardness and bulk density (=+0.736; p = 0.001(p < 0.01)) (Supplementary Figure S1) [39].
Figure 1. Influence of process parameters moisture (M), feed rate (FR) and screw speed (SS) on hardness.
Numerous studies have confirmed that the hardness of the extrudate increased withincreasing feed moisture content [40,41]. Increasing the feed moisture content leads toplasticization of the sample, forming a protective layer and compressing the sample,resulting in a high density and hardness of rice [42] and wheat extrudates [2]. The resultsshowed that low hardness was associated with low feed moisture and high screw speed(Figure 1). As screw speed increases, viscosity decreases, which results in lower density andless hardness of extrudate. By contrast, with an increase in feed rate, viscosity increases,giving extrudates with high density and hardness. As screw speed increases, the sampleexpands and thus becomes softer, while with an increase in feed rate, the barrel of theextruder is filled, and therefore, pressure increases, which leads to the material beingcompressed and firm. Ding et al. (2006) concluded that feed rate and screw speed havea significant effect on the hardness of wheat extrudate [2]. Diaz et.al (2013) showed that
39
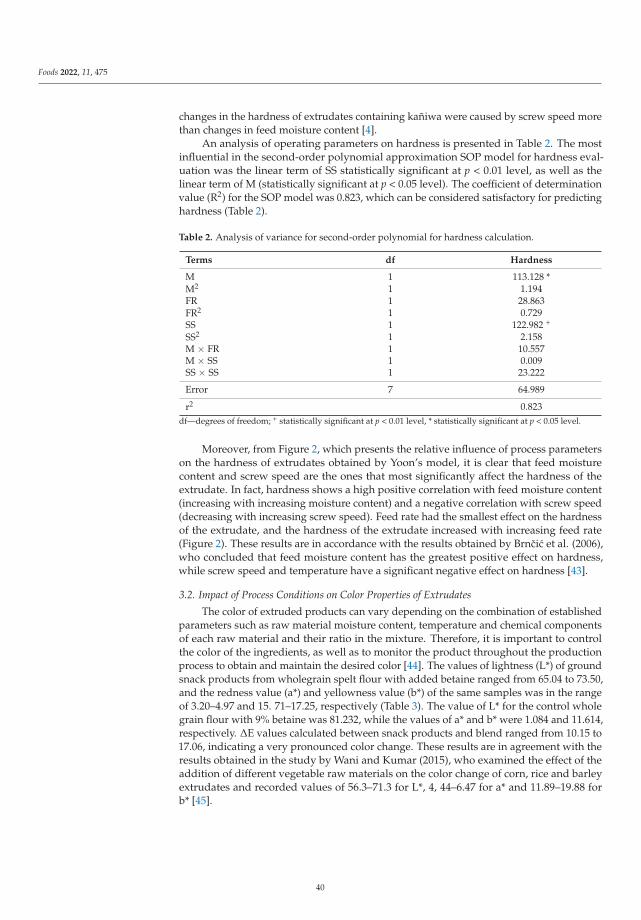
Foods 2022, 11, 475
changes in the hardness of extrudates containing kañiwa were caused by screw speed morethan changes in feed moisture content [4].
An analysis of operating parameters on hardness is presented in Table 2. The mostinfluential in the second-order polynomial approximation SOP model for hardness eval-uation was the linear term of SS statistically significant at p < 0.01 level, as well as thelinear term of M (statistically significant at p < 0.05 level). The coefficient of determinationvalue (R2) for the SOP model was 0.823, which can be considered satisfactory for predictinghardness (Table 2).
Table 2. Analysis of variance for second-order polynomial for hardness calculation.
Terms df Hardness
M 1 113.128 *M2 1 1.194FR 1 28.863FR2 1 0.729SS 1 122.982 +
SS2 1 2.158M × FR 1 10.557M × SS 1 0.009SS × SS 1 23.222
Error 7 64.989
r2 0.823df—degrees of freedom; + statistically significant at p < 0.01 level, * statistically significant at p < 0.05 level.
Moreover, from Figure 2, which presents the relative influence of process parameterson the hardness of extrudates obtained by Yoon’s model, it is clear that feed moisturecontent and screw speed are the ones that most significantly affect the hardness of theextrudate. In fact, hardness shows a high positive correlation with feed moisture content(increasing with increasing moisture content) and a negative correlation with screw speed(decreasing with increasing screw speed). Feed rate had the smallest effect on the hardnessof the extrudate, and the hardness of the extrudate increased with increasing feed rate(Figure 2). These results are in accordance with the results obtained by Brncic et al. (2006),who concluded that feed moisture content has the greatest positive effect on hardness,while screw speed and temperature have a significant negative effect on hardness [43].
3.2. Impact of Process Conditions on Color Properties of Extrudates
The color of extruded products can vary depending on the combination of establishedparameters such as raw material moisture content, temperature and chemical componentsof each raw material and their ratio in the mixture. Therefore, it is important to controlthe color of the ingredients, as well as to monitor the product throughout the productionprocess to obtain and maintain the desired color [44]. The values of lightness (L*) of groundsnack products from wholegrain spelt flour with added betaine ranged from 65.04 to 73.50,and the redness value (a*) and yellowness value (b*) of the same samples was in the rangeof 3.20–4.97 and 15. 71–17.25, respectively (Table 3). The value of L* for the control wholegrain flour with 9% betaine was 81.232, while the values of a* and b* were 1.084 and 11.614,respectively. ΔE values calculated between snack products and blend ranged from 10.15 to17.06, indicating a very pronounced color change. These results are in agreement with theresults obtained in the study by Wani and Kumar (2015), who examined the effect of theaddition of different vegetable raw materials on the color change of corn, rice and barleyextrudates and recorded values of 56.3–71.3 for L*, 4, 44–6.47 for a* and 11.89–19.88 forb* [45].
40
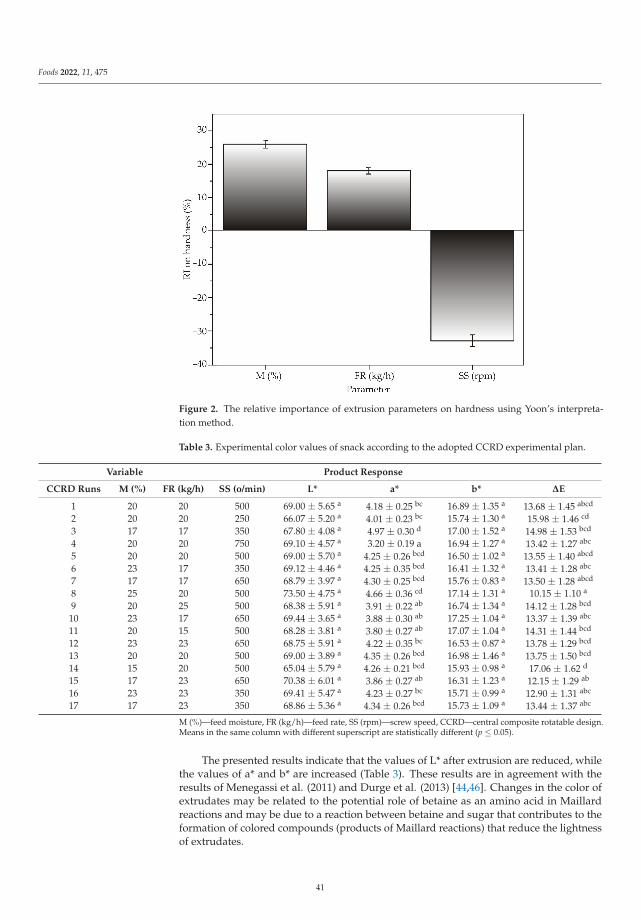
Foods 2022, 11, 475
Figure 2. The relative importance of extrusion parameters on hardness using Yoon’s interpreta-tion method.
Table 3. Experimental color values of snack according to the adopted CCRD experimental plan.
Variable Product Response
CCRD Runs M (%) FR (kg/h) SS (o/min) L* a* b* ΔE
1 20 20 500 69.00 ± 5.65 a 4.18 ± 0.25 bc 16.89 ± 1.35 a 13.68 ± 1.45 abcd
2 20 20 250 66.07 ± 5.20 a 4.01 ± 0.23 bc 15.74 ± 1.30 a 15.98 ± 1.46 cd
3 17 17 350 67.80 ± 4.08 a 4.97 ± 0.30 d 17.00 ± 1.52 a 14.98 ± 1.53 bcd
4 20 20 750 69.10 ± 4.57 a 3.20 ± 0.19 a 16.94 ± 1.27 a 13.42 ± 1.27 abc
5 20 20 500 69.00 ± 5.70 a 4.25 ± 0.26 bcd 16.50 ± 1.02 a 13.55 ± 1.40 abcd
6 23 17 350 69.12 ± 4.46 a 4.25 ± 0.35 bcd 16.41 ± 1.32 a 13.41 ± 1.28 abc
7 17 17 650 68.79 ± 3.97 a 4.30 ± 0.25 bcd 15.76 ± 0.83 a 13.50 ± 1.28 abcd
8 25 20 500 73.50 ± 4.75 a 4.66 ± 0.36 cd 17.14 ± 1.31 a 10.15 ± 1.10 a
9 20 25 500 68.38 ± 5.91 a 3.91 ± 0.22 ab 16.74 ± 1.34 a 14.12 ± 1.28 bcd
10 23 17 650 69.44 ± 3.65 a 3.88 ± 0.30 ab 17.25 ± 1.04 a 13.37 ± 1.39 abc
11 20 15 500 68.28 ± 3.81 a 3.80 ± 0.27 ab 17.07 ± 1.04 a 14.31 ± 1.44 bcd
12 23 23 650 68.75 ± 5.91 a 4.22 ± 0.35 bc 16.53 ± 0.87 a 13.78 ± 1.29 bcd
13 20 20 500 69.00 ± 3.89 a 4.35 ± 0.26 bcd 16.98 ± 1.46 a 13.75 ± 1.50 bcd
14 15 20 500 65.04 ± 5.79 a 4.26 ± 0.21 bcd 15.93 ± 0.98 a 17.06 ± 1.62 d
15 17 23 650 70.38 ± 6.01 a 3.86 ± 0.27 ab 16.31 ± 1.23 a 12.15 ± 1.29 ab
16 23 23 350 69.41 ± 5.47 a 4.23 ± 0.27 bc 15.71 ± 0.99 a 12.90 ± 1.31 abc
17 17 23 350 68.86 ± 5.36 a 4.34 ± 0.26 bcd 15.73 ± 1.09 a 13.44 ± 1.37 abc
M (%)—feed moisture, FR (kg/h)—feed rate, SS (rpm)—screw speed, CCRD—central composite rotatable design.Means in the same column with different superscript are statistically different (p ≤ 0.05).
The presented results indicate that the values of L* after extrusion are reduced, whilethe values of a* and b* are increased (Table 3). These results are in agreement with theresults of Menegassi et al. (2011) and Durge et al. (2013) [44,46]. Changes in the color ofextrudates may be related to the potential role of betaine as an amino acid in Maillardreactions and may be due to a reaction between betaine and sugar that contributes to theformation of colored compounds (products of Maillard reactions) that reduce the lightnessof extrudates.
41
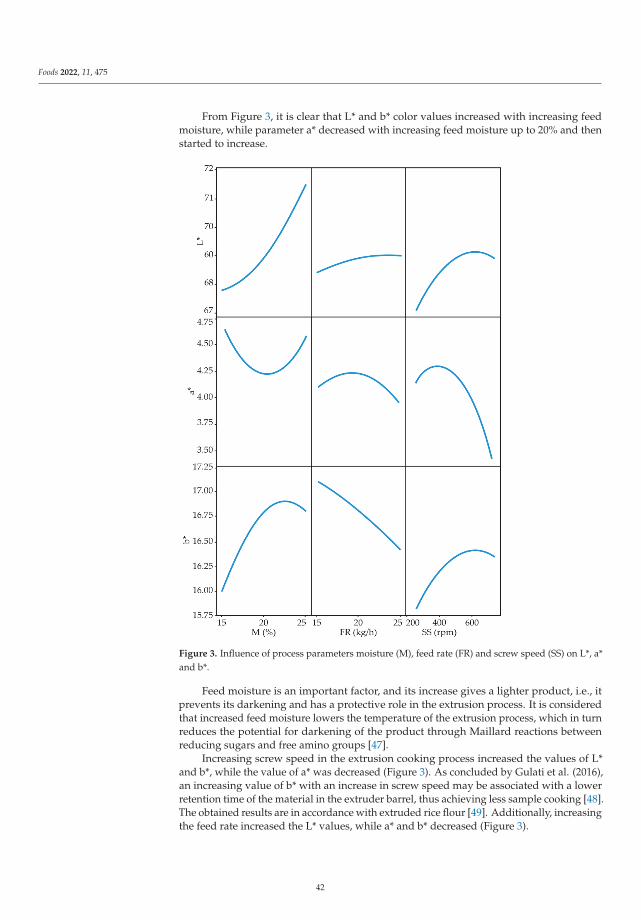
Foods 2022, 11, 475
From Figure 3, it is clear that L* and b* color values increased with increasing feedmoisture, while parameter a* decreased with increasing feed moisture up to 20% and thenstarted to increase.
Figure 3. Influence of process parameters moisture (M), feed rate (FR) and screw speed (SS) on L*, a*and b*.
Feed moisture is an important factor, and its increase gives a lighter product, i.e., itprevents its darkening and has a protective role in the extrusion process. It is consideredthat increased feed moisture lowers the temperature of the extrusion process, which in turnreduces the potential for darkening of the product through Maillard reactions betweenreducing sugars and free amino groups [47].
Increasing screw speed in the extrusion cooking process increased the values of L*and b*, while the value of a* was decreased (Figure 3). As concluded by Gulati et al. (2016),an increasing value of b* with an increase in screw speed may be associated with a lowerretention time of the material in the extruder barrel, thus achieving less sample cooking [48].The obtained results are in accordance with extruded rice flour [49]. Additionally, increasingthe feed rate increased the L* values, while a* and b* decreased (Figure 3).
42
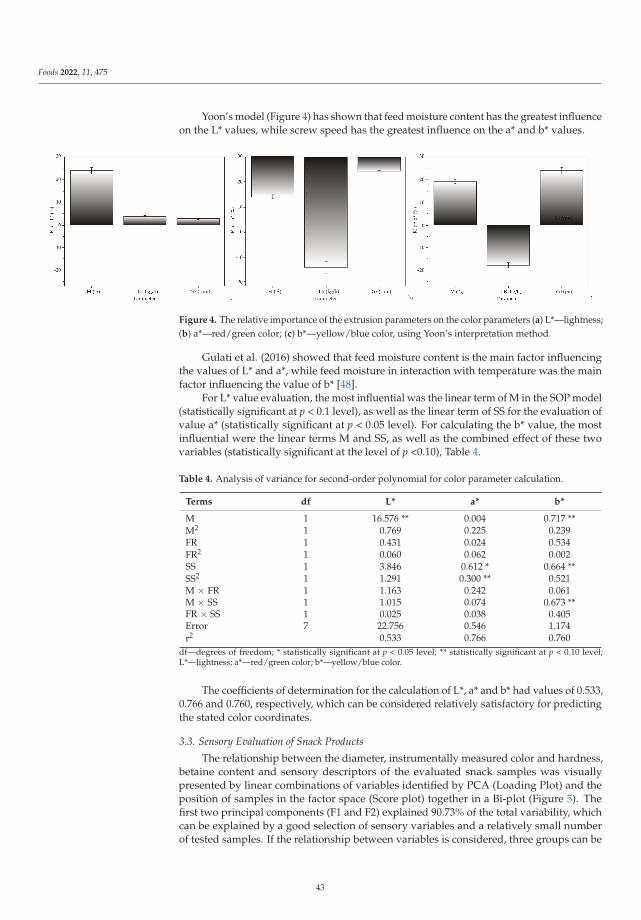
Foods 2022, 11, 475
Yoon’s model (Figure 4) has shown that feed moisture content has the greatest influenceon the L* values, while screw speed has the greatest influence on the a* and b* values.
Figure 4. The relative importance of the extrusion parameters on the color parameters (a) L*—lightness;(b) a*—red/green color; (c) b*—yellow/blue color, using Yoon’s interpretation method.
Gulati et al. (2016) showed that feed moisture content is the main factor influencingthe values of L* and a*, while feed moisture in interaction with temperature was the mainfactor influencing the value of b* [48].
For L* value evaluation, the most influential was the linear term of M in the SOP model(statistically significant at p < 0.1 level), as well as the linear term of SS for the evaluation ofvalue a* (statistically significant at p < 0.05 level). For calculating the b* value, the mostinfluential were the linear terms M and SS, as well as the combined effect of these twovariables (statistically significant at the level of p <0.10), Table 4.
Table 4. Analysis of variance for second-order polynomial for color parameter calculation.
Terms df L* a* b*
M 1 16.576 ** 0.004 0.717 **M2 1 0.769 0.225 0.239FR 1 0.431 0.024 0.534FR2 1 0.060 0.062 0.002SS 1 3.846 0.612 * 0.664 **SS2 1 1.291 0.300 ** 0.521M × FR 1 1.163 0.242 0.061M × SS 1 1.015 0.074 0.673 **FR × SS 1 0.025 0.038 0.405Error 7 22.756 0.546 1.174r2 0.533 0.766 0.760
df—degrees of freedom; * statistically significant at p < 0.05 level; ** statistically significant at p < 0.10 level;L*—lightness; a*—red/green color; b*—yellow/blue color.
The coefficients of determination for the calculation of L*, a* and b* had values of 0.533,0.766 and 0.760, respectively, which can be considered relatively satisfactory for predictingthe stated color coordinates.
3.3. Sensory Evaluation of Snack Products
The relationship between the diameter, instrumentally measured color and hardness,betaine content and sensory descriptors of the evaluated snack samples was visuallypresented by linear combinations of variables identified by PCA (Loading Plot) and theposition of samples in the factor space (Score plot) together in a Bi-plot (Figure 5). Thefirst two principal components (F1 and F2) explained 90.73% of the total variability, whichcan be explained by a good selection of sensory variables and a relatively small numberof tested samples. If the relationship between variables is considered, three groups can be
43
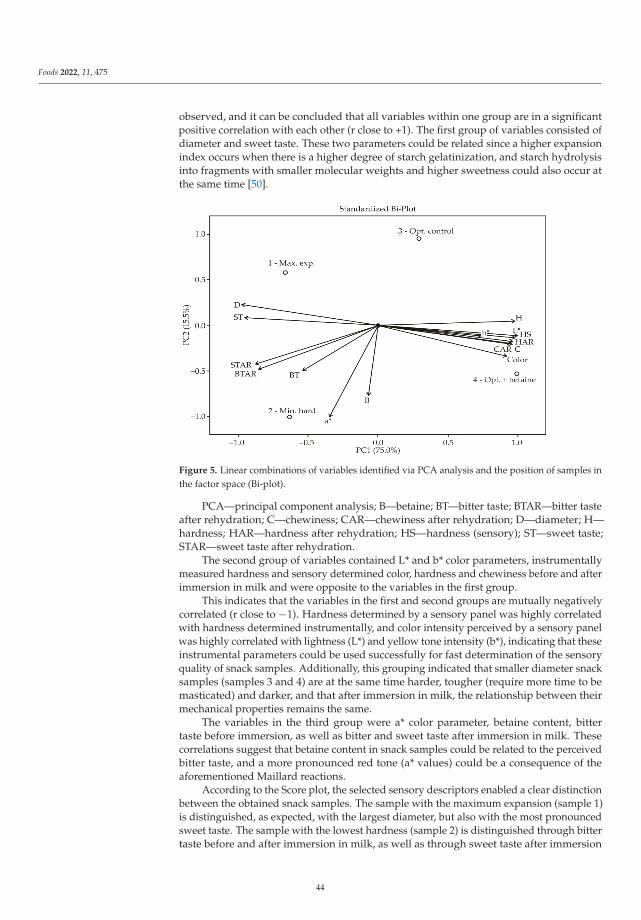
Foods 2022, 11, 475
observed, and it can be concluded that all variables within one group are in a significantpositive correlation with each other (r close to +1). The first group of variables consisted ofdiameter and sweet taste. These two parameters could be related since a higher expansionindex occurs when there is a higher degree of starch gelatinization, and starch hydrolysisinto fragments with smaller molecular weights and higher sweetness could also occur atthe same time [50].
Figure 5. Linear combinations of variables identified via PCA analysis and the position of samples inthe factor space (Bi-plot).
PCA—principal component analysis; B—betaine; BT—bitter taste; BTAR—bitter tasteafter rehydration; C—chewiness; CAR—chewiness after rehydration; D—diameter; H—hardness; HAR—hardness after rehydration; HS—hardness (sensory); ST—sweet taste;STAR—sweet taste after rehydration.
The second group of variables contained L* and b* color parameters, instrumentallymeasured hardness and sensory determined color, hardness and chewiness before and afterimmersion in milk and were opposite to the variables in the first group.
This indicates that the variables in the first and second groups are mutually negativelycorrelated (r close to −1). Hardness determined by a sensory panel was highly correlatedwith hardness determined instrumentally, and color intensity perceived by a sensory panelwas highly correlated with lightness (L*) and yellow tone intensity (b*), indicating that theseinstrumental parameters could be used successfully for fast determination of the sensoryquality of snack samples. Additionally, this grouping indicated that smaller diameter snacksamples (samples 3 and 4) are at the same time harder, tougher (require more time to bemasticated) and darker, and that after immersion in milk, the relationship between theirmechanical properties remains the same.
The variables in the third group were a* color parameter, betaine content, bittertaste before immersion, as well as bitter and sweet taste after immersion in milk. Thesecorrelations suggest that betaine content in snack samples could be related to the perceivedbitter taste, and a more pronounced red tone (a* values) could be a consequence of theaforementioned Maillard reactions.
According to the Score plot, the selected sensory descriptors enabled a clear distinctionbetween the obtained snack samples. The sample with the maximum expansion (sample 1)is distinguished, as expected, with the largest diameter, but also with the most pronouncedsweet taste. The sample with the lowest hardness (sample 2) is distinguished through bittertaste before and after immersion in milk, as well as through sweet taste after immersion
44
Foods 2022, 11, 475
in milk and betaine content. Since this sample had the best rehydration properties (theweakest mechanical properties) and therefore absorbed the largest amounts of milk, bothflavors present in the sample came to the fore due to the dissolution of substances that givea sweet and bitter taste in milk.
Snack extruded products that are obtained via an optimized extrusion process (sam-ples 3 and 4) are characterized by higher hardness and chewiness both before and afterimmersion in milk, as well as by a darker color.
Since sample 1 has the best mechanical properties (largest diameter, the lowest hard-ness before and after immersion, the lowest chewiness before and after immersion) and adistinctly sweet taste, it can be considered the most suitable for consumers. It is importantto note that betaine slightly influenced bitter taste (sample number 4) but reduced themechanical properties (samples 3 and 4). Additionally, it is assumed that sample 1 wouldbe the most suitable for enrichment with betaine.
4. Conclusions
This study confirmed that the operational parameters of the extrusion cooking process(moisture content (M, %), feed rate (FR, (kg/h)) and screw speed (SS, rpm)) affect thesuccess of the sensory experience of the snack product, which is related to texture andcolor. The softest spelt wholegrain snack was produced at the lowest level of feed moisturecontent. The results for hardness obtained by Yoon’s model showed that feed moisturecontent and screw speed are the most influential parameters during the production of speltwholegrain snacks with added betaine. Decrease in the lightness of the extrudate may beassociated with a reaction between betaine and sugar that contributes to the formation ofcolored compounds. L* color values were decreased after extrusion, while a* and b* valueswere increased. In addition to satisfying the nutritional recommended daily intake ofbetaine, it is important to obtain a product that is acceptable in terms of sensory properties.Products obtained via the optimized extrusion process are not rated as the most acceptable,which emphasizes the importance of sensory analysis, which represents the final assessmentcarried out by consumers. The sample with the largest expansion, lowest hardness beforeand after immersion and lowest chewiness before and after immersion can be consideredthe most appropriate for supplementation with betaine and for consumers.
Supplementary Materials: The following supporting information can be downloaded at: https://www.mdpi.com/article/10.3390/foods11030475/s1; Table S1: Sensory descriptors and definitionsused in the sensory analysis of snack product samples; Figure S1: Correlation between (a) theexpansion index and bulk density and between (b) hardness and bulk density.
Author Contributions: Conceptualization, J.K. (Jovana Kojic) and M.B.; methodology, N.I.; software,L.P. and P.K.; validation, V.Š. and J.K. (Jelena Krulj); formal analysis, L.P.T., J.K. (Jelena Krulj) andV.Š.; investigation, N.T. and L.P.T.; writing—original draft preparation, J.K. (Jovana Kojic) and M.B.;writing—review and editing, P.K.; visualization, L.P. and N.T.; supervision, N.I. All authors haveread and agreed to the published version of the manuscript.
Funding: This research received no external funding.
Institutional Review Board Statement: The study did not require ethical approval; it was the partof PhD study.
Informed Consent Statement: Not applicable.
Data Availability Statement: The data that support the findings of this study are available from thecorresponding author upon reasonable request.
Acknowledgments: The Ministry of Education, Science and Technological Development of theRepublic of Serbia. (451-03-9/2021-14/200222).
Conflicts of Interest: The authors declare no conflict of interest.
45
Foods 2022, 11, 475
References
1. O’Shea, N.; Gallagher, E. Evaluation of novel-extruding ingredients to improve the physicochemical and expansion characteristicsof a corn-puffed snack-containing pearled barley. Eur. Food Res. Technol. 2019, 245, 1293–1305. [CrossRef]
2. Ding, Q.B.; Ainsworth, P.; Plunkett, A.; Tucker, G.; Marson, H. The effect of extrusion conditions on the functional and physicalproperties of wheat-based expanded snacks. J. Food Eng. 2006, 73, 142–148. [CrossRef]
3. Chávez-Jáuregui, R.N.; Silva, M.E.M.P.; Areas, J.A.G. Extrusion Cooking Process for Amaranth (Amaranthus caudatus L.). J. FoodSci. 2000, 65, 1009–1015. [CrossRef]
4. Diaz, J.M.R.; Kirjoranta, S.; Tenitz, S.; Penttilä, P.A.; Serimaa, R.; Lampi, A.-M.; Jouppila, K. Use of amaranth, quinoa and kañiwain extruded corn-based snacks. J. Cereal Sci. 2013, 58, 59–67. [CrossRef]
5. Jozinovic, A.; Subari, D.; Ackar, Ð.; Babic, J.; Milicevic, B. Influence of spelt flour addition on properties of extruded productsbased on corn grits. J. Food Eng. 2016, 172, 31–37. [CrossRef]
6. Ruibal-Mendieta, N.L.; Delacroix, D.L.; Mignolet, E.; Pycke, J.M.; Marques, C.; Rozenberg, R.; Larondelle, Y. Spelt (Triticumaestivum ssp. spelta) as a source of breadmaking flours and bran naturally enriched in oleic acid and minerals but not phyticacid. J. Agric. Food Chem. 2005, 53, 2751–2759. [CrossRef]
7. Pruska- Kedzior, A.; Kedzior, Z.; Klockiewicz-Kaminska, E. Comparison of viscoelastic properties of gluten from spelt andcommon wheat. Eur. Food Res. Technol. 2008, 227, 199–207. [CrossRef]
8. Kohajdová, Z.; Karovicová, J. Nutritional value and baking applications of spelt wheat. Acta Sci. Pol. Technol. Aliment. 2008, 7,5–14.
9. Bodroža Solarov, M.; Vujic, Ð.; Acanski, M.; Pezo, L.; Filipcev, B.; Mladenov, N. Characterization of the liposoluble fraction ofcommon wheat (Triticum aestivum) and spelt (T. aestivum ssp. spelta) flours using multivariate analysis. J. Sci. Food Agric. 2014,94, 2613–2617. [CrossRef]
10. Pasqualone, A.; Piergiovanni, A.R.; Caponio, F.; Paradiso, V.M.; Summo, C.; Simeone, R. Evaluation of the technologicalcharacteristics and bread-making quality of alternative wheat cereals in comparison with common and durum wheat. Food Sci.Technol. Int. 2011, 17, 135–142. [CrossRef]
11. Filipcev, B.; Šimurina, O.; Bodroža Solarov, M.; Brkljaca, J. Dough rheological properties in relation to cracker making performanceof organically grown spelt cultivars. Int. J. Food Sci. Technol. 2013, 48, 2356–2362. [CrossRef]
12. Vuckovic, J.; Bodroža-Solarov, M.; Vujic, Ð.; Bocarov-Stancic, A.; Bagi, F. The protective effect of hulls on the occurrence ofAlternaria mycotoxins in spelt wheat. J. Sci. Food Agric. 2013, 93, 1996–2001. [CrossRef]
13. Filipcev, B.; Šimurina, O.; Bodroža-Solarov, M.; Obreht, D. Comparison of the bread-making performance of spelt varieties grownunder organic conditions in the environment of norther Serbia and their responses to dough strengthening improvers. Hem. Ind.2013, 67, 443–453. [CrossRef]
14. Filipovic, J.; Pezo, L.; Filipovic, N.; Filipovic, V.; Bodroža-Solarov, M.; Plancak, M. Mathematical approach to assessing speltcultivars (Triticum aestivum subsp. spelt) for pasta making. Inter. J. Food Sci. Technol. 2013, 48, 195–203. [CrossRef]
15. Filipovic, J.; Pezo, L.; Filipovic, V.; Brkljaca, J.; Krulj, J. The effects of omega-3 fatty acids and inulin addition to spelt pasta quality.LWT-Food Sci.Technol. 2015, 63, 43–51. [CrossRef]
16. Brlek, T.; Bodroža-Solarov, M.; Vukmirovic, D.j.; Colovic, R.; Vuckovic, J.; Levic, J. Utilization of Spelt Wheat Hull as a RenewableEnergy Source by Pelleting. Bulg. J. Agric. Sci. 2012, 18, 752–758.
17. Filipcev, B.; Kojic, J.; Krulj, J.; Bodroža-Solarov, M.; Ilic, N. Betaine in cereal grains and grain-based products. Foods 2018, 7, 49.[CrossRef]
18. Craig, S.A. Betaine in human nutrition. Am. J. Clin. Nutr. 2004, 80, 539–549. [CrossRef]19. Kojic, J.; Krulj, J.; Ilic, N.; Loncar, E.; Pezo, L.; Mandic, A.; Bodroža-Solarov, M. Analysis of betaine levels in cereals, pseudocereals
and their products. J. Funct. Foods 2017, 37, 157–163. [CrossRef]20. Kojic, J.; Ilic, N.; Kojic, P.; Pezo, L.; Banjac, V.; Krulj, J.; Bodroža-Solarov, M. Multiobjective process optimization for betaine
enriched spelt flour based extrudates. J. Food Process Eng. 2019, 42, e12942. [CrossRef]21. Chen, L.; Opara, U.L. Texture measurement approaches in fresh and processed foods—A review. Food Res. Int. 2013, 51, 823–835.
[CrossRef]22. Valadez-Blanco, R.; Virdi, A.I.S.; Balke, S.T.; Diosady, L.L. In-line colour monitoring during food extrusion: Sensitivity and
correlation with product colour. Food Res. Int. 2007, 40, 1129–1139. [CrossRef]23. Do Nascimento, E.M.D.G.C.; Carvalho, C.W.P.; Takeiti, C.Y.; Freitas, D.D.G.C.; Ascheri, J.L.R. Use of sesame oil cake (Sesamum
indicum L.) on corn expanded extrudates. Food Res. Int. 2012, 45, 434–443. [CrossRef]24. Lei, H.; Fulcher, R.G.; Ruan, R.; van Lengerich, B. Assessment of color development due to twin-screw extrusion of rice-glucose-
lysine blend using image analysis. LWT Food Sci. Technol. 2007, 40, 1224–1231. [CrossRef]25. Ondo, S.E.; Singkhornart, S.; Ryu, G.H. Effects of die temperature alkalized cocoa powder content and CO2 gas injection on
physical properties of extruded cornmeal. J. Food Eng. 2013, 117, 173–182. [CrossRef]26. Singkhornart, S.; Edou-Ondo, S.; Ryu, G.H. Influence of germination and extrusion with CO2 injection on physicochemical
properties of wheat extrudates. Food Chem. 2014, 143, 122–131. [CrossRef]27. Wang, Y.Y.; Ryu, G.H. Physical properties of extruded corn grits with corn fibre by CO2 injection extrusion. J. Food Eng. 2013, 116,
14–20. [CrossRef]
46
Foods 2022, 11, 475
28. Poliszko, N.; Kowalczewski, P.Ł.; Rybicka, I.; Kubiak, P.; Poliszko, S. The effect of pumpkin flour on quality and acoustic propertiesof extruded corn snacks. J. fur Verbraucherschutz und Leb. 2019, 14, 121–129. [CrossRef]
29. Blandino, M.; Bresciani, A.; Loscalzo, M.; Vanara, F.; Marti, A. Extruded snacks from pigmented rice: Phenolic profile and physicalproperties. J. Cereal Sci. 2022, 103, 103347. [CrossRef]
30. Grasso, S. Extruded snacks from industrial by-products: A review. Trends Food Sci.Technol. 2020, 99, 284–294. [CrossRef]31. Yoon, Y.; Swales, G., Jr.; Margavio, T.M. A comparison of discriminant analysis versus artificial neural networks. J. Oper. Res. Soc.
1993, 44, 51–60. [CrossRef]32. Svihus, B.; Kløvstad, K.H.; Perez, V.; Zimonja, O.; Sahlström, S.; Schuller, R.B.; Jeksrud, W.K.; Prestløkken, E. Physical and
nutritional effects of pelleting of broiler chicken diets made from wheat ground to different coarsenesses by the use of roller milland hammer mill. Anim. Feed Sci. Technol. 2004, 117, 281–293. [CrossRef]
33. Lazou, A.; Krokida, M. Structural and textural characterization of corn–lentil extruded snacks. J. Food Eng. 2010, 100, 392–408.[CrossRef]
34. Paula, A.M.; Conti-Silva, A.C. Texture profile and correlation between sensory and instrumental analyses on extruded snacks. J.Food Eng. 2014, 121, 9–14. [CrossRef]
35. ISO 8589; Sensory Analysis—General Guidance for the Design of Test Rooms, Amendment 1, 2014; International Organization forStandardization: Geneva, Switzerland, 2007.
36. Anton, A.A.; Luciano, F.B. Instrumental texture evaluation of extruded snack foods: A review. Cienc. Tecnol. Aliment. 2007, 5,245–251. [CrossRef]
37. Kojic, J.; Krulj, J.; Peic Tukuljac, L.; Jevtic Mucibabic, R.; Cvetkovic, B.; Kojic, P.; Ilic, N. The effect of extrusion conditions on thebulk density of spelt wholegrain snack product. In Proceedings of the Poster Session Presentation in the Book of Abstracs ofthe VII International Congress “Engineering, Environment and Materials in Process Industry” EEM2021, Jahorina, Bosnia andHerzegovina, 17–19 March 2021.
38. Kojic, J.; Krulj, J.; Šimurina, O.; Cvetkovic, B.; Pezo, L.; Ðermanovic, B.; Ilic, N. The effect of extrusion conditions on theexpansion of spelt wholegrain snack product. In Proceedings of the Poster Session Presentation in the Book of Abstracts of theVII International Conference Sustainable Postharvest and Food Technologies, Vršac, Serbia, 18–23 April 2021.
39. Liu, C.; Zhang, Y.; Liu, W.; Wan, J.; Wang, W.; Wu, L.; Zuo, N.; Zhou, Y.; Yin, Z. Preparation, physicochemical and textureproperties of texturized rice produce by Improved Extrusion Cooking Technology. J. Cereal Sci. 2011, 54, 473–480. [CrossRef]
40. Tsokolar-Tsikopoulos, K.C.; Katsavou, I.D.; Krokida, M.K. The effect of inulin addition on structural and textural properties ofextruded products under several extrusion conditions. J. Food Sci. Technol. 2015, 52, 6170–6181. [CrossRef]
41. Liu, Y.; Hsieh, F.; Heymann, H.; Huff, H.E. Effect of process conditions on the physical and sensory properties of extrudedoat–corn puff. J. Food Sci. 2000, 65, 1253–1259. [CrossRef]
42. Ding, Q.B.; Ainsworth, P.; Tucker, G.; Marson, H. The effect of extrusion conditions on the physicochemical properties and sensorycharacteristics of rice-based expanded snacks. J. Food Eng. 2005, 66, 283–289. [CrossRef]
43. Brncic, M.; Tripalo, B.; Ježek, D.; Semenski, D.; Drvar, N.; Ukrainczyk, M. Effect of twin screw extrusion parameters on mechanicalhardness of direct-expanded extrudates. Sadhana 2006, 31, 527–536. [CrossRef]
44. Menegassi, B.; Pilosof, A.M.; Areas, J.A. Comparison of properties of native and extruded amaranth (Amaranthus cruentusL.–BRS Alegria) flour. LWT-Food Sci. Technol. 2011, 44, 1915–1921. [CrossRef]
45. Wani, S.A.; Kumar, P. Characterization of extrudates enriched with health promoting ingredients. Food Measure. 2015, 9, 592–598.[CrossRef]
46. Durge, A.V.; Sarkar, S.; Survase, S.A.; Singhal, R.S. Impact of extrusion on red beetroot colour used as pre-extrusion colouring ofrice flour. Food Bioprocess Technol. 2013, 6, 570–575. [CrossRef]
47. Sun, Y.; Muthukumarappan, K. Changes in functionality of soy-based extrudates during single-screw extrusion processing. Int. J.Food Prop. 2002, 5, 379–389. [CrossRef]
48. Gulati, P.; Weier, S.A.; Santra, D.; Subbiah, J.; Rose, D. Effects of feed moisture and extruder screw speed and temperature onphysical characteristics and antioxidant activity of extruded proso millet (Panicum miliaceum) flour. Int. J. Food Sci. Technol. 2016,51, 114–122. [CrossRef]
49. Hagenimana, A.; Ding, X.L.; Fang, T. Evaluation of rice flour modified by extrusion cooking. J. Cereal Sci. 2006, 43, 38–46.[CrossRef]
50. Torbica, A.; Belovic, M.; Popovic, L.; Cakarevic, J. Heat and hydrothermal treatments of non-wheat flours. Food Chem. 2021,334, 127523. [CrossRef]
47

Citation: Ramalingam, S.; Bahuguna,
A.; Lim, S.; Joe, A.-R.; Lee, J.-S.; Kim,
S.-Y.; Kim, M. Physicochemical,
Microbial, and Volatile Compound
Characteristics of Gochujang,
Fermented Red Pepper Paste,
Produced by Traditional Cottage
Industries. Foods 2022, 11, 375.
https://doi.org/10.3390/
foods11030375
Academic Editors: Luca Serventi,
Charles Brennan and Rana Mustafa
Received: 14 December 2021
Accepted: 21 January 2022
Published: 27 January 2022
Publisher’s Note: MDPI stays neutral
with regard to jurisdictional claims in
published maps and institutional affil-
iations.
Copyright: © 2022 by the authors.
Licensee MDPI, Basel, Switzerland.
This article is an open access article
distributed under the terms and
conditions of the Creative Commons
Attribution (CC BY) license (https://
creativecommons.org/licenses/by/
4.0/).
foods
Article
Physicochemical, Microbial, and Volatile CompoundCharacteristics of Gochujang, Fermented Red Pepper Paste,Produced by Traditional Cottage Industries
Srinivasan Ramalingam 1,†, Ashutosh Bahuguna 1,†, SeMi Lim 1, Ah-Ryeong Joe 1, Jong-Suk Lee 2, So-Young Kim 3
and Myunghee Kim 1,*
1 Department of Food Science and Technology, Yeungnam University, Gyeongsan 38541, Korea;[email protected] (S.R.); [email protected] (A.B.); [email protected] (S.L.);[email protected] (A.-R.J.)
2 Division of Food & Nutrition and Cook, Taegu Science University, Daegu 41453, Korea; [email protected] Department of Agrofood Resources, National Institute of Agricultural Sciences, Rural Development
Administration, Wanju 55365, Korea; [email protected]* Correspondence: [email protected]; Tel.: +82-53-810-2958† These authors contributed equally to this work.
Abstract: Gochujang, fermented red pepper paste, is a grain-based Korean traditional food. Thequality of gochujang produced by cottage industries is not well-documented. Thus, the present studyaimed to analyze the quality of gochujang from 35 traditional cottage industries for physicochemicaland microbial characteristics, along with volatile compound contents. In addition to microbialcharacteristics, salinity, pH, free amino nitrogen, and alcohol content were evaluated. Ethanol wasdetected as the predominant alcohol and 57% of tested gochujang products harbored >1% of totalalcohol content, which was above the recommended level for halal products. Gochujang productscontained hexadecanoic and linoleic acids predominantly and several volatile compounds belongingto the classes of alcohols, aldehydes, alkanes, nitrogen-containing compounds, and terpenes. A widerange of aerobic mesophilic bacteria (2.79–8.73 log CFU/g) and yeast counts (1.56–7.15 log CFU/g)was observed. Five distinct yeast species were identified, including Zygosaccharomyces rouxii. Eightgochujang products were found to be contaminated with Bacillus cereus (>4 log CFU/g). This studysuggests that there is a need to limit B. cereus contamination in cottage industry products and reducealcohol content to comply with halal food guidelines.
Keywords: alcohol; gochujang; Bacillus cereus; free amino nitrogen; Zygosaccharomyces rouxii
1. Introduction
Gochujang (fermented red pepper paste) is one of the most important grain-basedtraditional Korean fermented foods and is generally used as a sauce in Korean cuisines andas a seasoning in spicy foods. Gochujang has a distinguished flavor and savory taste [1]. In2017, the total domestic and international retail market revenue of gochujang accounted forapproximately USD 149.55 million and USD 31.98 million, respectively. Gochujang productsare exported to several countries, including the US, China, Japan, and Middle Easterncountries [2]. Owing to the high amount of saccharified grain starch (from rice, wheat, orbarley), and powdered red hot pepper (Capsicum annuum L.), gochujang is a red and thickpaste. Furthermore, significant amounts of salt, powdered meju, and potable water areused in the preparation of gochujang. Meju is a naturally fermented soybean, which actsas the source of microorganisms (starter culture) in the fermentation of gochujang. Themixture of these ingredients starts the fermentation and aging processes [3]. Two majortypes of gochujang are available in the market: a modern large-scale industrial gochujangand traditional homemade gochujang [4,5]. The modern large-scale industrial gochujang
Foods 2022, 11, 375. https://doi.org/10.3390/foods11030375 https://www.mdpi.com/journal/foods49
Foods 2022, 11, 375
is produced in a quality-controlled environment with the use of specific starter cultures(Aspergillus and Bacillus species) in a short period of fermentation [6].
The preparation of homemade and cottage industrial gochujang relies on traditionalfermentation techniques using simple equipment. The traditional homemade gochujangis produced using an extensive fermentation process with natural microorganisms. Theprocess includes saccharification via heating of glutinous rice and malt, followed by theaddition of meju, red pepper powder, and salt, depending on the desired characteristicsof taste and flavor, and, finally, a fermentation stage, which can last from 1 to 2 years [7].The microbial composition of meju can affect the quality of gochujang [7]. The traditionalgochujang fermentation is influenced by several elements, including local microorganismssuch as the meju microflora, and surrounding environmental factors such as weather condi-tions [4,5,8]. Thus, the gochujang cottage industry in different provinces generates productswith diversified nutritional values and organoleptic properties [9]. Raw ingredients, processmethods, microorganisms involved in the fermentation, and duration of the fermentationsignificantly influence the organoleptic properties of gochujang, including its aroma, taste,and texture [6,8].
To make appropriate choices and optimize the production of traditional gochujang,it is essential to investigate the physicochemical and microbial characteristics. Althoughvarious laboratory and homemade unbranded gochujang products have been previouslyexamined [9,10], these studies have not focused on the physicochemical and microbialproperties and volatile compound characteristics of indigenous-branded, traditional cottageindustrial gochujang products. Generally, because of the use of traditional processingtechnologies adopted by cottage industries, the interbatch quality of gochujang remainsunvaried [10]. Hence, consumers are highly interested in indigenous branded traditionalgochujang products owing to the consistently outstanding quality. These traditional cottageindustries are operated with minimal capital, and thus lack a quality control department forthe analyses of gochujang products. Moreover, the physicochemical and microbial featuresof these products are not monitored by any food and health organization and, therefore,not publicly available.
A previous study detected a significant amount of different alcohol types, particularlyethanol, in gochujang during the fermentation process [11]. In addition to the basic ethanolcontent, some companies supplement the product with a considerable amount of ethanolduring the packaging phase to prevent microbial activity. The gochujang products contain-ing more than 1% ethanol are prohibited for trade in Muslim countries (halal markets).Moreover, the risk of contamination of traditional cottage industry gochujang products withfood pathogens, particularly Bacillus cereus, remains unexplored. The quality of gochujangproducts produced by cottage industries has not been sufficiently examined. This studyaimed to determine the physicochemical and microbial properties, alcohol content, andvolatile compounds of gochujang products collected from nationwide cottage industries,and to categorize such products based on the findings of biostatistical analyses.
2. Materials and Methods
2.1. Chemicals
All chemicals used were of analytical grade. Potassium chromate, 0.1 N sodiumhydroxide, silver nitrate, methyl alcohol, ethyl alcohol, and sodium chloride were obtainedfrom Duksan Pure Chemicals (Ansan, Gyeonggi-do, Korea). Sodium hydroxide, sodiumhydrogen carbonate, and ammonium hydroxide were purchased from Junsei Chemicals(Tokyo, Japan). Formalin solution, standard methanol, ethanol, pentanol, propanol, andbutanol were purchased from Sigma-Aldrich (St. Louis, MO, USA). Plate count agar,nutrient agar, potato dextrose agar (PDA), and potato dextrose broth were purchased fromDifco (Becton, Dickinson and Company, Sparks, MD, USA). Mannitol egg yolk polymyxinagar (MYP), egg yolk emulsion, and polymyxin B supplement were purchased from OxoidLTD (Basingstoke, Hampshire, UK). 3M Yeast and Mold Petrifilm was purchased from 3M
50
Foods 2022, 11, 375
Health Care (St. Paul, MN, USA). API 50CHB and API 20E were obtained from bioMerieux(Marcy I’Etoile, France).
Instruments and Apparatus
A pH meter (Orion Star A211, Thermo Fisher Scientific, Beverly, MA, USA) and KonicaMinolta Chromameter, equipped with a CR-400 model chromameter measuring head andDP-400 model data processor, were used to measure the pH and color values, respectively.GC-MS-QP2010 SE (Shimadzu Co., Kyoto, Japan) gas chromatography–mass selectivedetection (GC-MSD) system with SH-Stabilwax column (30 m × 0.32 mm × 0.25 μm) andAgilent 7890B and 5977B GC-MS system (Agilent, Santa Clara, CA, USA), which includesan Agilent DB-WAX 122-7062 column (60 m × 250 μm × 0.25 μm), were used for thedetection of volatile compounds and alcohol content, respectively. Plastic Petri plates(SPL Life Sciences, Pocheon, Gyeonggi, Korea) were used for the microbiological analysis.Internal transcribed spacer (ITS) sequencing of isolated microbes was conducted using theABI PRISM 3730XL DNA analyzer (Applied Biosystems, Foster City, CA, USA).
2.2. Sample Collection
A total of 35 gochujang products were purchased from various cottage industries lo-cated in different provinces of the Republic of Korea, as previously reported [1]. The majoringredients of gochujang products include red pepper powder, glutinous rice powder, pow-dered soybeans, grain syrup, malt, salt, and water. Detailed ingredients of the purchasedgochujang products were also previously reported [1].
2.3. Physicochemical Characteristics2.3.1. Determination of pH, Salinity, Color Values, and Free Amino Nitrogen
pH values of gochujang products were analyzed according to the protocol of Rama-lingam et al. [12]. The salinity of gochujang was determined using the Korea Food and DrugAdministration method [13]. Color values of gochujang were obtained using a chromameter.The tristimulus color analyzer was calibrated to a reference (white porcelain plate) priorto the experiment [14]. The total free amino nitrogen contents of the gochujang sampleswere determined using the titration method as described by the Korea Food and DrugAdministration [15] and Cho et al. [16].
2.3.2. Determination of Total Alcohol Content
The alcohol content profiles of gochujang products were investigated using gaschromatography–mass spectrometry (GC-MS), according to the method described byLee et al. [17] and Gil et al. [18]. Briefly, 0.5 g of a sample was mixed with 9.5 mL ofdimethyl sulfoxide and stirred at 100 rpm at 40 ◦C for 1 h in a 20 mL closed container. Thereaction solution settled before the supernatant was filtered using the Whatman syringe fil-ter. Subsequently, the supernatant was used for the GC-MS analysis via a GC-MSD system.A temperature of 160 ◦C was maintained in the GC injector, and 20 μL of the sample wasinjected with a split ratio of 40:1. The oven temperature was programmed to start at 40 ◦Cfor 5 min, and increase 10 ◦C/min up to 240 ◦C, and then stop at (isothermal) 240 ◦C for9 min. Mass spectrum analysis (70 eV, ion-source temperature 200 ◦C) was performed at0.5 s scan intervals. Standard methanol, ethanol, pentanol, butanol, and propanol solutions(0.2%) were used to estimate each alcohol concentration in the gochujang samples.
2.4. Determination of Volatile Compounds
The volatile compound profiles of gochujang products were investigated using a solid-phase microextraction (SPME) method, followed by GC-MS [12]. Approximately 5 g of sam-ple was heated to 70 ◦C for 20 min in a closed 20 mL container. A carbowax/divinylbenzenepolydimethylsiloxane SPME fiber assembly was allowed to absorb the volatile compoundswithin the samples for 30 min at 70 ◦C. Temperatures of 250 ◦C and 230 ◦C were maintainedin the GC injector and MS source, respectively. A split ratio of 20:1 was used to inject the
51
Foods 2022, 11, 375
SPME fiber at a purge flow rate of 3 mL/min (with a total flow rate of 24 mL/min) at18.5 psi. The oven temperature was programmed to start at 40 ◦C for 2 min, and increaseat a rate of 2 ◦C/min up to 220 ◦C and 10 ◦C/min up to 240 ◦C, and then stop at 240 ◦Cfor 10 min. Mass spectrum analysis (70 eV, ion-source temperature 230 ◦C) was performedat 0.5 s scan intervals. Mass spectra of the unknown compounds of samples were inter-preted using the data available in the National Institute of Standards and Technology MSlibrary [19]. The molecular weights, names, and structures of volatile compounds in thesamples were determined.
2.5. Microbial Profile
The standard methods of the Association of Official Analytical Chemists [20] wereadopted to analyze the total number of aerobic mesophilic bacteria and B. cereus in gochu-jang. 3M Petrifilm, plate count agar, and MYP culturing medium were used according tothe manufacturer’s protocol to estimate the total yeast and mold (yeast/mold) [21], aerobicmesophilic bacteria, and B. cereus counts, respectively. API 50CHB and API 20E kits wereused to identify B. cereus using the manufacturer’s protocol. PDA was used to isolateyeast/mold. The isolated yeast/mold from gochujang was subjected to ITS sequencinganalysis [12]. The analyzed sequences were aligned with the help of the sequence align-ment editor software BioEdit (version 7.0.4). The data on ITS sequences of the isolatedmicroorganisms were documented in the NCBI GenBank database using the BLAST pro-gram. Phylogenetic analysis was performed for the isolated microorganisms using theneighbor-joining method [12].
2.6. Statistical Analysis
All the experiments were performed at least in triplicate, and the values were pre-sented as the mean ± standard deviation. Statistical analyses were performed using theSPSS software 23 (IBM, Chicago, IL, USA). One-way analysis of variance in a completelyrandomized design and Duncan’s multiple range comparison tests were used to explorethe significant differences between the samples with a 95% confidence interval at p < 0.05.The multivariate exploratory techniques of principal component analysis (PCA) wereconducted to categorize the gochujang samples based on their pH, lightness, redness, yel-lowness, amino nitrogen content, aerobic mesophilic bacteria count, yeast/mold count, andmajor volatile compound profile using the XLSTAT package on Microsoft Office Excel 2016version [1].
3. Results and Discussion
3.1. Physicochemical Analysis of Gochujang Products3.1.1. pH
Optimal pH is one of the prerequisite physicochemical parameters of fermented foodsand is the main factor influencing the occurrence of several biochemical activities [12]. Allselected gochujang products exhibited acidic pH between the ranges of 3.57 ± 0.01–4.98 ±0.01 (Table 1). The mean pH value of gochujang was 4.44 ± 0.35. Based on the pH values,all the gochujang products were grouped into two categories: samples with pH higherthan 4.6 (low-acidic food), and samples with pH below 4.6 (acidic food) (USFDA, Codeof Federal Regulations) [22]. A total of 40% of the gochujang products (n = 14) showeda pH higher than 4.6 (in the range of low-acid food), whereas 60% (n = 21) presentedpH values below 4.6 (acidic food). The variation in pH between the different gochujangproducts is probably due to the origin of different basic raw materials and the contributionof different microorganisms. A previous report showed a range of low-acidic pH (4.59 ±0.36–4.79 ± 0.15) measured in 80 different homemade gochujang products [23]. However,Lee et al. [23] did not report pH values below 4.0 for any sample. The present investigationdetected a slightly acidic pH for some samples, similar to that reported by Kim et al. [4]in several laboratory-made gochujang–meju samples. In general, the initial pH values ofthe gochujang products ranged from 5.5–6. These values are then reduced to the level of
52
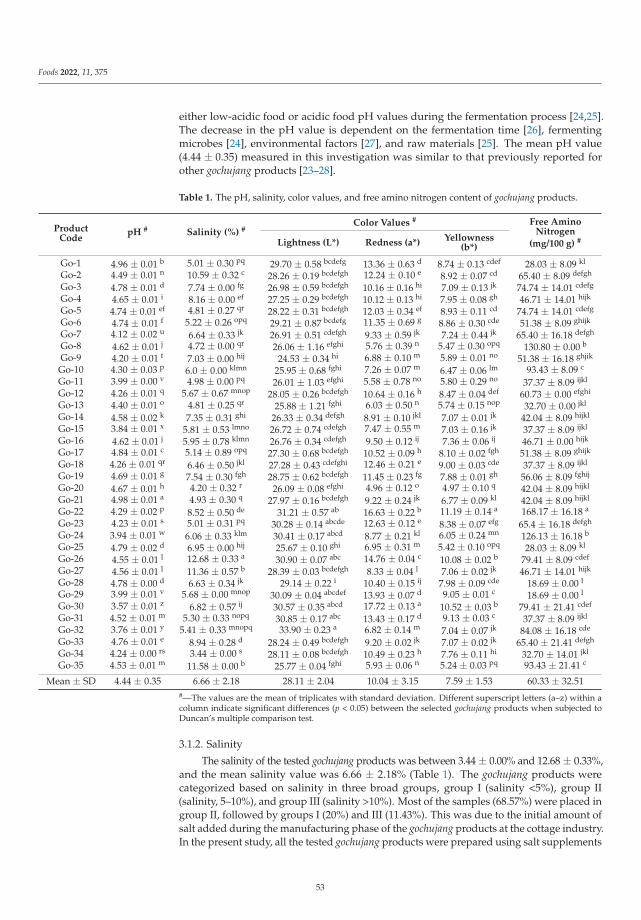
Foods 2022, 11, 375
either low-acidic food or acidic food pH values during the fermentation process [24,25].The decrease in the pH value is dependent on the fermentation time [26], fermentingmicrobes [24], environmental factors [27], and raw materials [25]. The mean pH value(4.44 ± 0.35) measured in this investigation was similar to that previously reported forother gochujang products [23–28].
Table 1. The pH, salinity, color values, and free amino nitrogen content of gochujang products.
ProductCode
pH # Salinity (%) #Color Values # Free Amino
Nitrogen
(mg/100 g) #Lightness (L*) Redness (a*)Yellowness
(b*)
Go-1 4.96 ± 0.01 b 5.01 ± 0.30 pq 29.70 ± 0.58 bcdefg 13.36 ± 0.63 d 8.74 ± 0.13 cdef 28.03 ± 8.09 kl
Go-2 4.49 ± 0.01 n 10.59 ± 0.32 c 28.26 ± 0.19 bcdefgh 12.24 ± 0.10 e 8.92 ± 0.07 cd 65.40 ± 8.09 defgh
Go-3 4.78 ± 0.01 d 7.74 ± 0.00 fg 26.98 ± 0.59 bcdefgh 10.16 ± 0.16 hi 7.09 ± 0.13 jk 74.74 ± 14.01 cdefg
Go-4 4.65 ± 0.01 i 8.16 ± 0.00 ef 27.25 ± 0.29 bcdefgh 10.12 ± 0.13 hi 7.95 ± 0.08 gh 46.71 ± 14.01 hijk
Go-5 4.74 ± 0.01 ef 4.81 ± 0.27 qr 28.22 ± 0.31 bcdefgh 12.03 ± 0.34 ef 8.93 ± 0.11 cd 74.74 ± 14.01 cdefg
Go-6 4.74 ± 0.01 f 5.22 ± 0.26 opq 29.21 ± 0.87 bcdefg 11.35 ± 0.69 g 8.86 ± 0.30 cde 51.38 ± 8.09 ghijk
Go-7 4.12 ± 0.02 u 6.64 ± 0.33 jk 26.91 ± 0.51 cdefgh 9.33 ± 0.59 jk 7.24 ± 0.44 jk 65.40 ± 16.18 defgh
Go-8 4.62 ± 0.01 j 4.72 ± 0.00 qr 26.06 ± 1.16 efghi 5.76 ± 0.39 n 5.47 ± 0.30 opq 130.80 ± 0.00 b
Go-9 4.20 ± 0.01 t 7.03 ± 0.00 hij 24.53 ± 0.34 hi 6.88 ± 0.10 m 5.89 ± 0.01 no 51.38 ± 16.18 ghjik
Go-10 4.30 ± 0.03 p 6.0 ± 0.00 klmn 25.95 ± 0.68 fghi 7.26 ± 0.07 m 6.47 ± 0.06 lm 93.43 ± 8.09 c
Go-11 3.99 ± 0.00 v 4.98 ± 0.00 pq 26.01 ± 1.03 efghi 5.58 ± 0.78 no 5.80 ± 0.29 no 37.37 ± 8.09 ijkl
Go-12 4.26 ± 0.01 q 5.67 ± 0.67 mnop 28.05 ± 0.26 bcdefgh 10.64 ± 0.16 h 8.47 ± 0.04 def 60.73 ± 0.00 efghi
Go-13 4.40 ± 0.01 o 4.81 ± 0.25 qr 25.88 ± 1.21 fghi 6.03 ± 0.50 n 5.74 ± 0.15 nop 32.70 ± 0.00 jkl
Go-14 4.58 ± 0.02 k 7.35 ± 0.31 ghi 26.33 ± 0.34 defgh 8.91 ± 0.10 jkl 7.07 ± 0.01 jk 42.04 ± 8.09 hijkl
Go-15 3.84 ± 0.01 x 5.81 ± 0.53 lmno 26.72 ± 0.74 cdefgh 7.47 ± 0.55 m 7.03 ± 0.16 jk 37.37 ± 8.09 ijkl
Go-16 4.62 ± 0.01 j 5.95 ± 0.78 klmn 26.76 ± 0.34 cdefgh 9.50 ± 0.12 ij 7.36 ± 0.06 ij 46.71 ± 0.00 hijk
Go-17 4.84 ± 0.01 c 5.14 ± 0.89 opq 27.30 ± 0.68 bcdefgh 10.52 ± 0.09 h 8.10 ± 0.02 fgh 51.38 ± 8.09 ghijk
Go-18 4.26 ± 0.01 qr 6.46 ± 0.50 jkl 27.28 ± 0.43 cdefghi 12.46 ± 0.21 e 9.00 ± 0.03 cde 37.37 ± 8.09 ijkl
Go-19 4.69 ± 0.01 g 7.54 ± 0.30 fgh 28.75 ± 0.62 bcdefgh 11.45 ± 0.23 fg 7.88 ± 0.01 gh 56.06 ± 8.09 fghij
Go-20 4.67 ± 0.01 h 4.20 ± 0.32 r 26.09 ± 0.08 efghi 4.96 ± 0.12 o 4.97 ± 0.10 q 42.04 ± 8.09 hijkl
Go-21 4.98 ± 0.01 a 4.93 ± 0.30 q 27.97 ± 0.16 bcdefgh 9.22 ± 0.24 jk 6.77 ± 0.09 kl 42.04 ± 8.09 hijkl
Go-22 4.29 ± 0.02 p 8.52 ± 0.50 de 31.21 ± 0.57 ab 16.63 ± 0.22 b 11.19 ± 0.14 a 168.17 ± 16.18 a
Go-23 4.23 ± 0.01 s 5.01 ± 0.31 pq 30.28 ± 0.14 abcde 12.63 ± 0.12 e 8.38 ± 0.07 efg 65.4 ± 16.18 defgh
Go-24 3.94 ± 0.01 w 6.06 ± 0.33 klm 30.41 ± 0.17 abcd 8.77 ± 0.21 kl 6.05 ± 0.24 mn 126.13 ± 16.18 b
Go-25 4.79 ± 0.02 d 6.95 ± 0.00 hij 25.67 ± 0.10 ghi 6.95 ± 0.31 m 5.42 ± 0.10 opq 28.03 ± 8.09 kl
Go-26 4.55 ± 0.01 l 12.68 ± 0.33 a 30.90 ± 0.07 abc 14.76 ± 0.04 c 10.08 ± 0.02 b 79.41 ± 8.09 cdef
Go-27 4.56 ± 0.01 l 11.36 ± 0.57 b 28.39 ± 0.03 bcdefgh 8.33 ± 0.04 l 7.06 ± 0.02 jk 46.71 ± 14.01 hijk
Go-28 4.78 ± 0.00 d 6.63 ± 0.34 jk 29.14 ± 0.22 i 10.40 ± 0.15 ij 7.98 ± 0.09 cde 18.69 ± 0.00 l
Go-29 3.99 ± 0.01 v 5.68 ± 0.00 mnop 30.09 ± 0.04 abcdef 13.93 ± 0.07 d 9.05 ± 0.01 c 18.69 ± 0.00 l
Go-30 3.57 ± 0.01 z 6.82 ± 0.57 ij 30.57 ± 0.35 abcd 17.72 ± 0.13 a 10.52 ± 0.03 b 79.41 ± 21.41 cdef
Go-31 4.52 ± 0.01 m 5.30 ± 0.33 nopq 30.85 ± 0.17 abc 13.43 ± 0.17 d 9.13 ± 0.03 c 37.37 ± 8.09 ijkl
Go-32 3.76 ± 0.01 y 5.41 ± 0.33 mnopq 33.90 ± 0.23 a 6.82 ± 0.14 m 7.04 ± 0.07 jk 84.08 ± 16.18 cde
Go-33 4.76 ± 0.01 e 8.94 ± 0.28 d 28.24 ± 0.49 bcdefgh 9.20 ± 0.02 jk 7.07 ± 0.02 jk 65.40 ± 21.41 defgh
Go-34 4.24 ± 0.00 rs 3.44 ± 0.00 s 28.11 ± 0.08 bcdefgh 10.49 ± 0.23 h 7.76 ± 0.11 hi 32.70 ± 14.01 jkl
Go-35 4.53 ± 0.01 m 11.58 ± 0.00 b 25.77 ± 0.04 fghi 5.93 ± 0.06 n 5.24 ± 0.03 pq 93.43 ± 21.41 c
Mean ± SD 4.44 ± 0.35 6.66 ± 2.18 28.11 ± 2.04 10.04 ± 3.15 7.59 ± 1.53 60.33 ± 32.51#—The values are the mean of triplicates with standard deviation. Different superscript letters (a–z) within acolumn indicate significant differences (p < 0.05) between the selected gochujang products when subjected toDuncan’s multiple comparison test.
3.1.2. Salinity
The salinity of the tested gochujang products was between 3.44 ± 0.00% and 12.68 ± 0.33%,and the mean salinity value was 6.66 ± 2.18% (Table 1). The gochujang products werecategorized based on salinity in three broad groups, group I (salinity <5%), group II(salinity, 5–10%), and group III (salinity >10%). Most of the samples (68.57%) were placed ingroup II, followed by groups I (20%) and III (11.43%). This was due to the initial amount ofsalt added during the manufacturing phase of the gochujang products at the cottage industry.In the present study, all the tested gochujang products were prepared using salt supplements
53
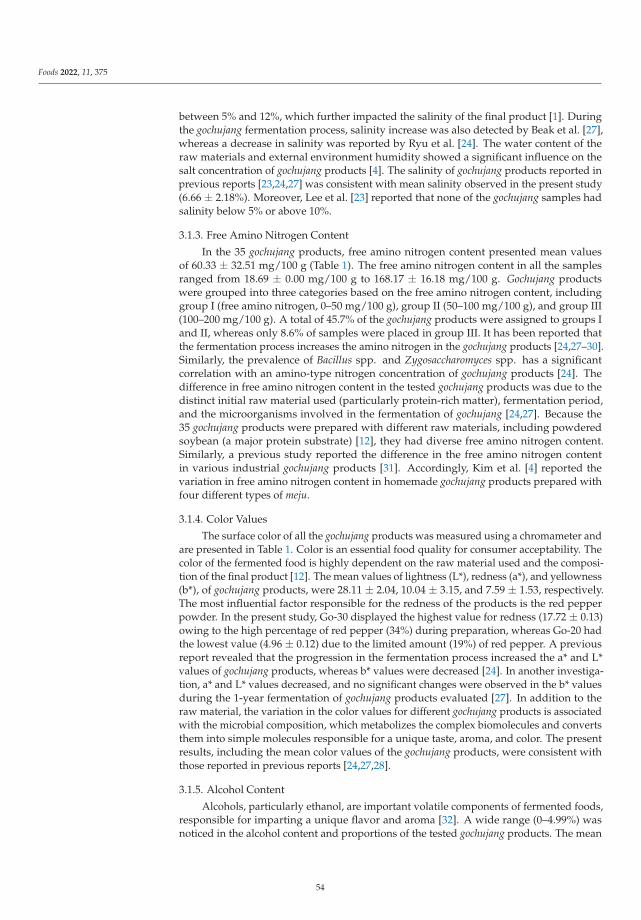
Foods 2022, 11, 375
between 5% and 12%, which further impacted the salinity of the final product [1]. Duringthe gochujang fermentation process, salinity increase was also detected by Beak et al. [27],whereas a decrease in salinity was reported by Ryu et al. [24]. The water content of theraw materials and external environment humidity showed a significant influence on thesalt concentration of gochujang products [4]. The salinity of gochujang products reported inprevious reports [23,24,27] was consistent with mean salinity observed in the present study(6.66 ± 2.18%). Moreover, Lee et al. [23] reported that none of the gochujang samples hadsalinity below 5% or above 10%.
3.1.3. Free Amino Nitrogen Content
In the 35 gochujang products, free amino nitrogen content presented mean valuesof 60.33 ± 32.51 mg/100 g (Table 1). The free amino nitrogen content in all the samplesranged from 18.69 ± 0.00 mg/100 g to 168.17 ± 16.18 mg/100 g. Gochujang productswere grouped into three categories based on the free amino nitrogen content, includinggroup I (free amino nitrogen, 0–50 mg/100 g), group II (50–100 mg/100 g), and group III(100–200 mg/100 g). A total of 45.7% of the gochujang products were assigned to groups Iand II, whereas only 8.6% of samples were placed in group III. It has been reported thatthe fermentation process increases the amino nitrogen in the gochujang products [24,27–30].Similarly, the prevalence of Bacillus spp. and Zygosaccharomyces spp. has a significantcorrelation with an amino-type nitrogen concentration of gochujang products [24]. Thedifference in free amino nitrogen content in the tested gochujang products was due to thedistinct initial raw material used (particularly protein-rich matter), fermentation period,and the microorganisms involved in the fermentation of gochujang [24,27]. Because the35 gochujang products were prepared with different raw materials, including powderedsoybean (a major protein substrate) [12], they had diverse free amino nitrogen content.Similarly, a previous study reported the difference in the free amino nitrogen contentin various industrial gochujang products [31]. Accordingly, Kim et al. [4] reported thevariation in free amino nitrogen content in homemade gochujang products prepared withfour different types of meju.
3.1.4. Color Values
The surface color of all the gochujang products was measured using a chromameter andare presented in Table 1. Color is an essential food quality for consumer acceptability. Thecolor of the fermented food is highly dependent on the raw material used and the composi-tion of the final product [12]. The mean values of lightness (L*), redness (a*), and yellowness(b*), of gochujang products, were 28.11 ± 2.04, 10.04 ± 3.15, and 7.59 ± 1.53, respectively.The most influential factor responsible for the redness of the products is the red pepperpowder. In the present study, Go-30 displayed the highest value for redness (17.72 ± 0.13)owing to the high percentage of red pepper (34%) during preparation, whereas Go-20 hadthe lowest value (4.96 ± 0.12) due to the limited amount (19%) of red pepper. A previousreport revealed that the progression in the fermentation process increased the a* and L*values of gochujang products, whereas b* values were decreased [24]. In another investiga-tion, a* and L* values decreased, and no significant changes were observed in the b* valuesduring the 1-year fermentation of gochujang products evaluated [27]. In addition to theraw material, the variation in the color values for different gochujang products is associatedwith the microbial composition, which metabolizes the complex biomolecules and convertsthem into simple molecules responsible for a unique taste, aroma, and color. The presentresults, including the mean color values of the gochujang products, were consistent withthose reported in previous reports [24,27,28].
3.1.5. Alcohol Content
Alcohols, particularly ethanol, are important volatile components of fermented foods,responsible for imparting a unique flavor and aroma [32]. A wide range (0–4.99%) wasnoticed in the alcohol content and proportions of the tested gochujang products. The mean
54
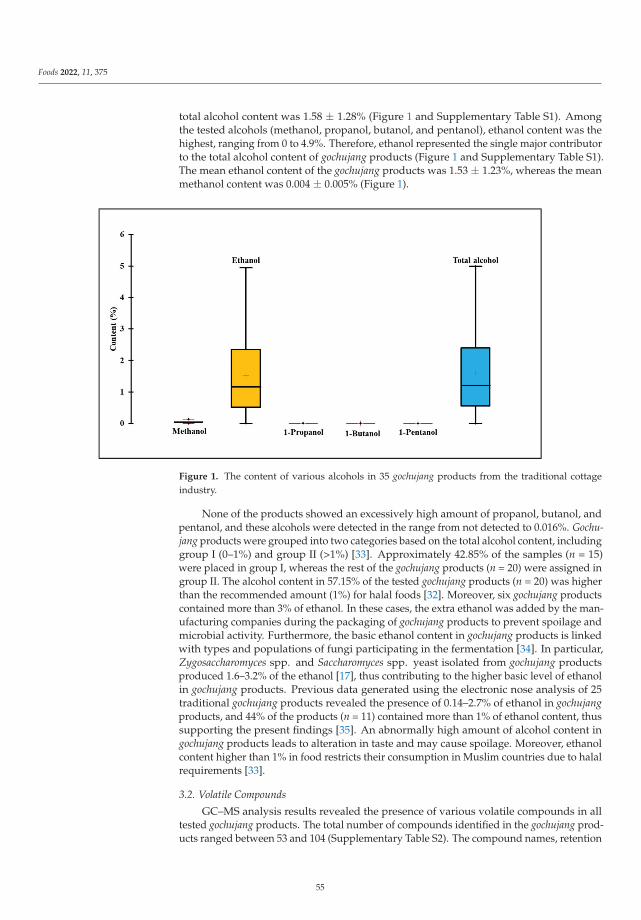
Foods 2022, 11, 375
total alcohol content was 1.58 ± 1.28% (Figure 1 and Supplementary Table S1). Amongthe tested alcohols (methanol, propanol, butanol, and pentanol), ethanol content was thehighest, ranging from 0 to 4.9%. Therefore, ethanol represented the single major contributorto the total alcohol content of gochujang products (Figure 1 and Supplementary Table S1).The mean ethanol content of the gochujang products was 1.53 ± 1.23%, whereas the meanmethanol content was 0.004 ± 0.005% (Figure 1).
Figure 1. The content of various alcohols in 35 gochujang products from the traditional cottageindustry.
None of the products showed an excessively high amount of propanol, butanol, andpentanol, and these alcohols were detected in the range from not detected to 0.016%. Gochu-jang products were grouped into two categories based on the total alcohol content, includinggroup I (0–1%) and group II (>1%) [33]. Approximately 42.85% of the samples (n = 15)were placed in group I, whereas the rest of the gochujang products (n = 20) were assigned ingroup II. The alcohol content in 57.15% of the tested gochujang products (n = 20) was higherthan the recommended amount (1%) for halal foods [32]. Moreover, six gochujang productscontained more than 3% of ethanol. In these cases, the extra ethanol was added by the man-ufacturing companies during the packaging of gochujang products to prevent spoilage andmicrobial activity. Furthermore, the basic ethanol content in gochujang products is linkedwith types and populations of fungi participating in the fermentation [34]. In particular,Zygosaccharomyces spp. and Saccharomyces spp. yeast isolated from gochujang productsproduced 1.6–3.2% of the ethanol [17], thus contributing to the higher basic level of ethanolin gochujang products. Previous data generated using the electronic nose analysis of 25traditional gochujang products revealed the presence of 0.14–2.7% of ethanol in gochujangproducts, and 44% of the products (n = 11) contained more than 1% of ethanol content, thussupporting the present findings [35]. An abnormally high amount of alcohol content ingochujang products leads to alteration in taste and may cause spoilage. Moreover, ethanolcontent higher than 1% in food restricts their consumption in Muslim countries due to halalrequirements [33].
3.2. Volatile Compounds
GC–MS analysis results revealed the presence of various volatile compounds in alltested gochujang products. The total number of compounds identified in the gochujang prod-ucts ranged between 53 and 104 (Supplementary Table S2). The compound names, retention
55
Foods 2022, 11, 375
times, and percentage peak area for all gochujang products are listed in SupplementaryTable S2. The predominant compound was identified as 2,3,5,6-tetramethyl pyrazine with apeak area of 54.31% and retention time of 40.054 min in Go-19, followed by ethanol with apeak area of 49.26% and retention time of 9.138 min in Go-7.
Ethanol was found in all tested gochujang products, with a peak area percentage rangeof 1.17–49.26%. Among the 35 gochujang products, 17 showed ethanol as the predominantcomponent, depicting a percentage range of the highest peak area between 7.54–49.26%.Linoleic acid ethyl ester and 2,3,5,6-tetramethyl pyrazine were detected as the predominantcomponents in 11 gochujang products with a peak area range of 7.92–31.19%, and to alesser extent, in four other gochujang products (Go-14, Go-16, Go-19, and Go-30) with peakarea range of 2.7–54.31%. Hexadecanoic acid, an ethyl/methyl ester, was detected in allgochujang products and was either the second or third most abundant compound in 26gochujang products with a peak area range of 6.49–25.09%. Compounds detected in thegochujang products included low quantities of acids, alcohols, aldehydes, alkanes, alkenes,benzene derivatives, carboxylic acids, cyclic and bicyclic ketones, cyclosiloxanes, esters,fatty acids, furans, hydrocarbons, nitrogen-containing compounds, phenolics, pyranones,pyrazines, sulfur-containing compounds, and terpenes.
Several compounds (such as ethanol, acetic acid, benzaldehyde, benzene acetalde-hyde, hexadecanoic acid, ethyl ester, hexanoic acid, hexanol, hexyl ester, linoleic acidethyl ester, methyl salicylate, nonanoic acid, ethyl ester, octadecanoic acid, ethyl ester,1-propanol, octanoic acid, and ethyl ester) were previously reported in gochujang [36–42],thus supporting the present results. Similar to the present investigation, previous studiesreported a high amount of ethanol in the commercial, traditional, and improved gochujangproducts generated during the fermentation process via the yeast-dependent glycolyticpathway [36,37,43–46]. Most of the ester compounds detected in the gochujang productswere ethyl esters, which render a fruity aroma to the product; fatty acid esters are produceddue to the esterification of organic acids and fatty acids with the ethanol generated duringthe fermentation process by the yeast [37]. Several aroma-active compounds, such asacetic acid (pungent sour), 2-furanmethanol (cooked sugar), methyl salicylate (peppermint),ethanol (sweet), linalool (flower and lavender), hexanal (grass, tallow, and fat), benzalde-hyde (almond and burned sugar), benzene acetaldehyde (fruity and rosy), nonanal (soapy),tetramethylpyrazine (cocoa, mocha, and milk coffee), acetic acid (sour) and ethyl hexanoate(apple peel, and fruit) were detected in the tested gochujang products [37,47]. Diversifiedclasses of compounds with different peak areas were detected in each gochujang product dueto the difference in raw materials, method of raw material processing, microbial diversityduring the fermentation process, and fermentation period and conditions.
3.3. Microbial Profile Analysis3.3.1. Aerobic Mesophilic Bacteria and Yeast/Mold
The tested gochujang products harbored aerobic mesophilic bacteria in the range of2.79 ± 0.10 to 8.73 ± 0.30 log CFU/g (Table 2). The mean value of aerobic mesophilic bacte-ria present in the gochujang products was 6.98 ± 1.42 log CFU/g. In addition to the aerobicmesophilic bacteria, the active presence of fungi and yeast in gochujang was previouslyreported [7]. The yeast/mold count in all products ranged from 1.56 ± 0.06 to 7.15 ± 0.02log CFU/g (Table 2). The mean value of gochujang products’ yeast/mold population was4.47 ± 1.47 log CFU/g (Table 2). In general, during the gochujang fermentation phase,aerobic mesophilic bacterial populations increased from approximately 5 log CFU/g to8 log CFU/g, and yeast/mold counts decreased [24,26,28]. The findings from the presentstudy are in agreement with those from previous reports that showed similar bacterialand yeast count in different gochujang products [25,26,48]. The microbial population in theproducts highly depended on external environmental factors, physicochemical and micro-bial profiles of raw materials, and the meju used as a starter culture [24,27]. Even thoughchanges occurred in the microbial composition, the total count of aerobic bacteria wasnearly constant after 3 months of gochujang fermentation [27]. Both bacteria and yeast/mold
56
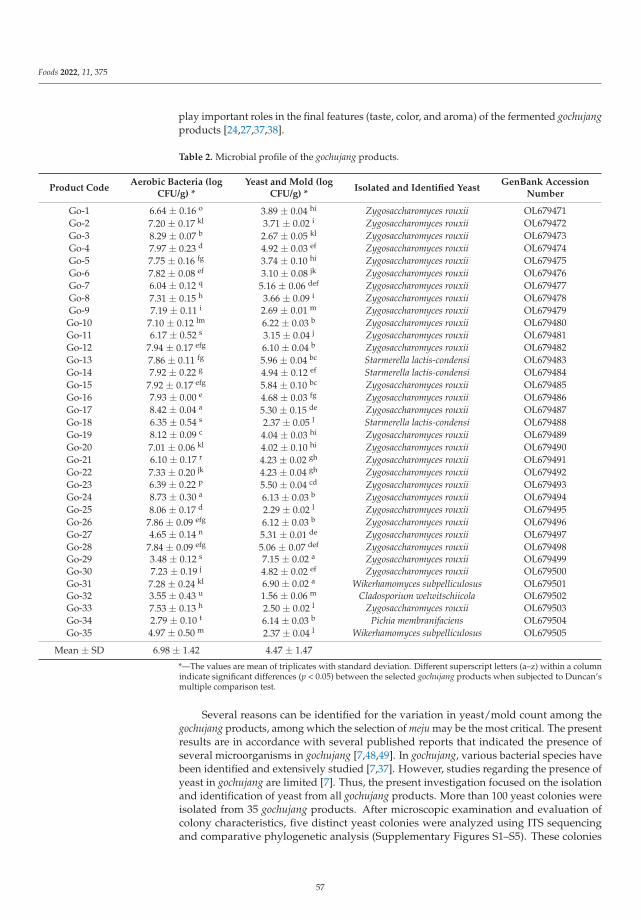
Foods 2022, 11, 375
play important roles in the final features (taste, color, and aroma) of the fermented gochujangproducts [24,27,37,38].
Table 2. Microbial profile of the gochujang products.
Product CodeAerobic Bacteria (log
CFU/g) *Yeast and Mold (log
CFU/g) *Isolated and Identified Yeast
GenBank AccessionNumber
Go-1 6.64 ± 0.16 o 3.89 ± 0.04 hi Zygosaccharomyces rouxii OL679471Go-2 7.20 ± 0.17 kl 3.71 ± 0.02 i Zygosaccharomyces rouxii OL679472Go-3 8.29 ± 0.07 b 2.67 ± 0.05 kl Zygosaccharomyces rouxii OL679473Go-4 7.97 ± 0.23 d 4.92 ± 0.03 ef Zygosaccharomyces rouxii OL679474Go-5 7.75 ± 0.16 fg 3.74 ± 0.10 hi Zygosaccharomyces rouxii OL679475Go-6 7.82 ± 0.08 ef 3.10 ± 0.08 jk Zygosaccharomyces rouxii OL679476Go-7 6.04 ± 0.12 q 5.16 ± 0.06 def Zygosaccharomyces rouxii OL679477Go-8 7.31 ± 0.15 h 3.66 ± 0.09 i Zygosaccharomyces rouxii OL679478Go-9 7.19 ± 0.11 i 2.69 ± 0.01 m Zygosaccharomyces rouxii OL679479
Go-10 7.10 ± 0.12 lm 6.22 ± 0.03 b Zygosaccharomyces rouxii OL679480Go-11 6.17 ± 0.52 s 3.15 ± 0.04 j Zygosaccharomyces rouxii OL679481Go-12 7.94 ± 0.17 efg 6.10 ± 0.04 b Zygosaccharomyces rouxii OL679482Go-13 7.86 ± 0.11 fg 5.96 ± 0.04 bc Starmerella lactis-condensi OL679483Go-14 7.92 ± 0.22 g 4.94 ± 0.12 ef Starmerella lactis-condensi OL679484Go-15 7.92 ± 0.17 efg 5.84 ± 0.10 bc Zygosaccharomyces rouxii OL679485Go-16 7.93 ± 0.00 e 4.68 ± 0.03 fg Zygosaccharomyces rouxii OL679486Go-17 8.42 ± 0.04 a 5.30 ± 0.15 de Zygosaccharomyces rouxii OL679487Go-18 6.35 ± 0.54 s 2.37 ± 0.05 l Starmerella lactis-condensi OL679488Go-19 8.12 ± 0.09 c 4.04 ± 0.03 hi Zygosaccharomyces rouxii OL679489Go-20 7.01 ± 0.06 kl 4.02 ± 0.10 hi Zygosaccharomyces rouxii OL679490Go-21 6.10 ± 0.17 r 4.23 ± 0.02 gh Zygosaccharomyces rouxii OL679491Go-22 7.33 ± 0.20 jk 4.23 ± 0.04 gh Zygosaccharomyces rouxii OL679492Go-23 6.39 ± 0.22 p 5.50 ± 0.04 cd Zygosaccharomyces rouxii OL679493Go-24 8.73 ± 0.30 a 6.13 ± 0.03 b Zygosaccharomyces rouxii OL679494Go-25 8.06 ± 0.17 d 2.29 ± 0.02 l Zygosaccharomyces rouxii OL679495Go-26 7.86 ± 0.09 efg 6.12 ± 0.03 b Zygosaccharomyces rouxii OL679496Go-27 4.65 ± 0.14 n 5.31 ± 0.01 de Zygosaccharomyces rouxii OL679497Go-28 7.84 ± 0.09 efg 5.06 ± 0.07 def Zygosaccharomyces rouxii OL679498Go-29 3.48 ± 0.12 s 7.15 ± 0.02 a Zygosaccharomyces rouxii OL679499Go-30 7.23 ± 0.19 j 4.82 ± 0.02 ef Zygosaccharomyces rouxii OL679500Go-31 7.28 ± 0.24 kl 6.90 ± 0.02 a Wikerhamomyces subpelliculosus OL679501Go-32 3.55 ± 0.43 u 1.56 ± 0.06 m Cladosporium welwitschiicola OL679502Go-33 7.53 ± 0.13 h 2.50 ± 0.02 l Zygosaccharomyces rouxii OL679503Go-34 2.79 ± 0.10 t 6.14 ± 0.03 b Pichia membranifaciens OL679504Go-35 4.97 ± 0.50 m 2.37 ± 0.04 l Wikerhamomyces subpelliculosus OL679505
Mean ± SD 6.98 ± 1.42 4.47 ± 1.47
*—The values are mean of triplicates with standard deviation. Different superscript letters (a–z) within a columnindicate significant differences (p < 0.05) between the selected gochujang products when subjected to Duncan’smultiple comparison test.
Several reasons can be identified for the variation in yeast/mold count among thegochujang products, among which the selection of meju may be the most critical. The presentresults are in accordance with several published reports that indicated the presence ofseveral microorganisms in gochujang [7,48,49]. In gochujang, various bacterial species havebeen identified and extensively studied [7,37]. However, studies regarding the presence ofyeast in gochujang are limited [7]. Thus, the present investigation focused on the isolationand identification of yeast from all gochujang products. More than 100 yeast colonies wereisolated from 35 gochujang products. After microscopic examination and evaluation ofcolony characteristics, five distinct yeast colonies were analyzed using ITS sequencingand comparative phylogenetic analysis (Supplementary Figures S1–S5). These colonies
57
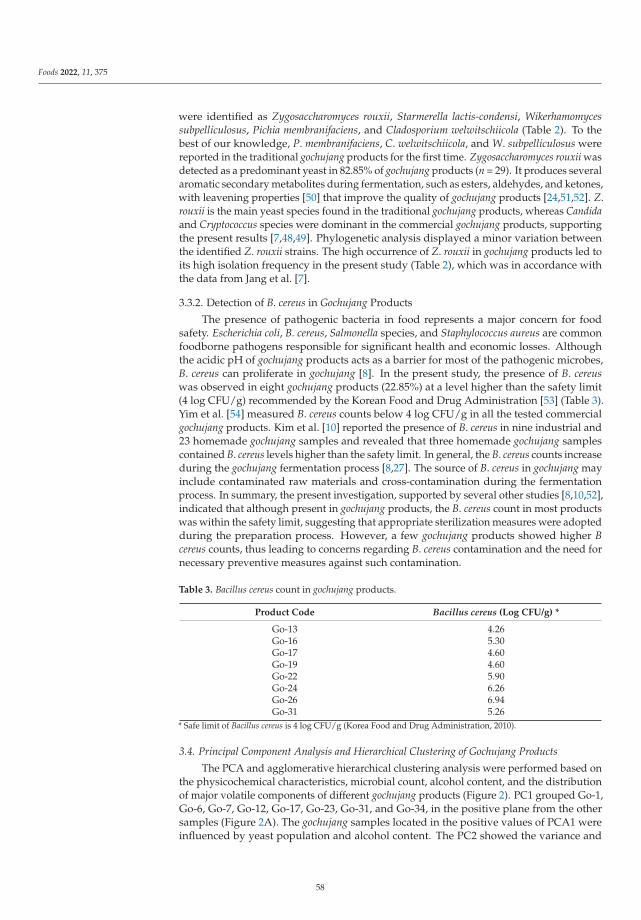
Foods 2022, 11, 375
were identified as Zygosaccharomyces rouxii, Starmerella lactis-condensi, Wikerhamomycessubpelliculosus, Pichia membranifaciens, and Cladosporium welwitschiicola (Table 2). To thebest of our knowledge, P. membranifaciens, C. welwitschiicola, and W. subpelliculosus werereported in the traditional gochujang products for the first time. Zygosaccharomyces rouxii wasdetected as a predominant yeast in 82.85% of gochujang products (n = 29). It produces severalaromatic secondary metabolites during fermentation, such as esters, aldehydes, and ketones,with leavening properties [50] that improve the quality of gochujang products [24,51,52]. Z.rouxii is the main yeast species found in the traditional gochujang products, whereas Candidaand Cryptococcus species were dominant in the commercial gochujang products, supportingthe present results [7,48,49]. Phylogenetic analysis displayed a minor variation betweenthe identified Z. rouxii strains. The high occurrence of Z. rouxii in gochujang products led toits high isolation frequency in the present study (Table 2), which was in accordance withthe data from Jang et al. [7].
3.3.2. Detection of B. cereus in Gochujang Products
The presence of pathogenic bacteria in food represents a major concern for foodsafety. Escherichia coli, B. cereus, Salmonella species, and Staphylococcus aureus are commonfoodborne pathogens responsible for significant health and economic losses. Althoughthe acidic pH of gochujang products acts as a barrier for most of the pathogenic microbes,B. cereus can proliferate in gochujang [8]. In the present study, the presence of B. cereuswas observed in eight gochujang products (22.85%) at a level higher than the safety limit(4 log CFU/g) recommended by the Korean Food and Drug Administration [53] (Table 3).Yim et al. [54] measured B. cereus counts below 4 log CFU/g in all the tested commercialgochujang products. Kim et al. [10] reported the presence of B. cereus in nine industrial and23 homemade gochujang samples and revealed that three homemade gochujang samplescontained B. cereus levels higher than the safety limit. In general, the B. cereus counts increaseduring the gochujang fermentation process [8,27]. The source of B. cereus in gochujang mayinclude contaminated raw materials and cross-contamination during the fermentationprocess. In summary, the present investigation, supported by several other studies [8,10,52],indicated that although present in gochujang products, the B. cereus count in most productswas within the safety limit, suggesting that appropriate sterilization measures were adoptedduring the preparation process. However, a few gochujang products showed higher Bcereus counts, thus leading to concerns regarding B. cereus contamination and the need fornecessary preventive measures against such contamination.
Table 3. Bacillus cereus count in gochujang products.
Product Code Bacillus cereus (Log CFU/g) *
Go-13 4.26Go-16 5.30Go-17 4.60Go-19 4.60Go-22 5.90Go-24 6.26Go-26 6.94Go-31 5.26
* Safe limit of Bacillus cereus is 4 log CFU/g (Korea Food and Drug Administration, 2010).
3.4. Principal Component Analysis and Hierarchical Clustering of Gochujang Products
The PCA and agglomerative hierarchical clustering analysis were performed based onthe physicochemical characteristics, microbial count, alcohol content, and the distributionof major volatile components of different gochujang products (Figure 2). PC1 grouped Go-1,Go-6, Go-7, Go-12, Go-17, Go-23, Go-31, and Go-34, in the positive plane from the othersamples (Figure 2A). The gochujang samples located in the positive values of PCA1 wereinfluenced by yeast population and alcohol content. The PC2 showed the variance and
58
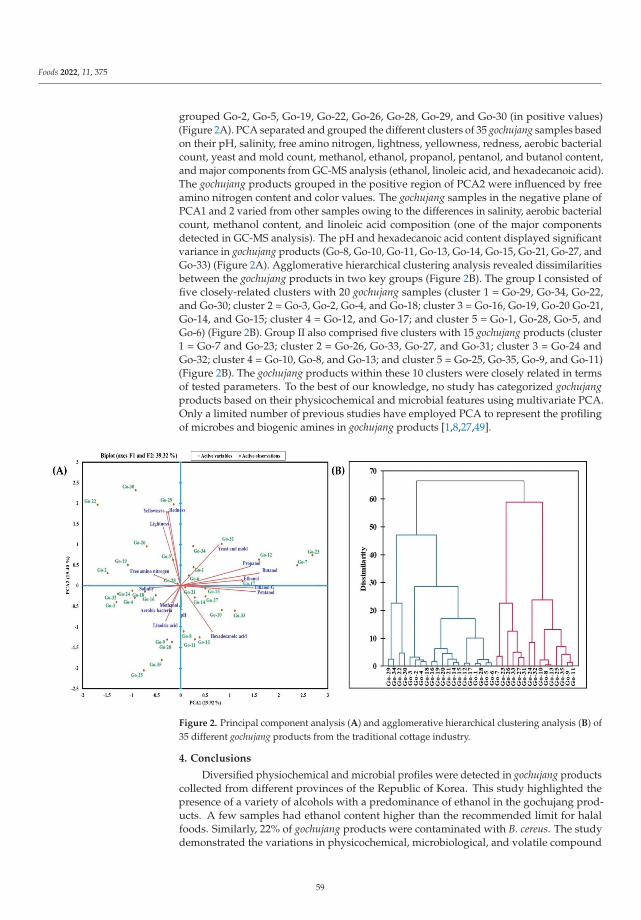
Foods 2022, 11, 375
grouped Go-2, Go-5, Go-19, Go-22, Go-26, Go-28, Go-29, and Go-30 (in positive values)(Figure 2A). PCA separated and grouped the different clusters of 35 gochujang samples basedon their pH, salinity, free amino nitrogen, lightness, yellowness, redness, aerobic bacterialcount, yeast and mold count, methanol, ethanol, propanol, pentanol, and butanol content,and major components from GC-MS analysis (ethanol, linoleic acid, and hexadecanoic acid).The gochujang products grouped in the positive region of PCA2 were influenced by freeamino nitrogen content and color values. The gochujang samples in the negative plane ofPCA1 and 2 varied from other samples owing to the differences in salinity, aerobic bacterialcount, methanol content, and linoleic acid composition (one of the major componentsdetected in GC-MS analysis). The pH and hexadecanoic acid content displayed significantvariance in gochujang products (Go-8, Go-10, Go-11, Go-13, Go-14, Go-15, Go-21, Go-27, andGo-33) (Figure 2A). Agglomerative hierarchical clustering analysis revealed dissimilaritiesbetween the gochujang products in two key groups (Figure 2B). The group I consisted offive closely-related clusters with 20 gochujang samples (cluster 1 = Go-29, Go-34, Go-22,and Go-30; cluster 2 = Go-3, Go-2, Go-4, and Go-18; cluster 3 = Go-16, Go-19, Go-20 Go-21,Go-14, and Go-15; cluster 4 = Go-12, and Go-17; and cluster 5 = Go-1, Go-28, Go-5, andGo-6) (Figure 2B). Group II also comprised five clusters with 15 gochujang products (cluster1 = Go-7 and Go-23; cluster 2 = Go-26, Go-33, Go-27, and Go-31; cluster 3 = Go-24 andGo-32; cluster 4 = Go-10, Go-8, and Go-13; and cluster 5 = Go-25, Go-35, Go-9, and Go-11)(Figure 2B). The gochujang products within these 10 clusters were closely related in termsof tested parameters. To the best of our knowledge, no study has categorized gochujangproducts based on their physicochemical and microbial features using multivariate PCA.Only a limited number of previous studies have employed PCA to represent the profilingof microbes and biogenic amines in gochujang products [1,8,27,49].
Figure 2. Principal component analysis (A) and agglomerative hierarchical clustering analysis (B) of35 different gochujang products from the traditional cottage industry.
4. Conclusions
Diversified physiochemical and microbial profiles were detected in gochujang productscollected from different provinces of the Republic of Korea. This study highlighted thepresence of a variety of alcohols with a predominance of ethanol in the gochujang prod-ucts. A few samples had ethanol content higher than the recommended limit for halalfoods. Similarly, 22% of gochujang products were contaminated with B. cereus. The studydemonstrated the variations in physicochemical, microbiological, and volatile compound
59
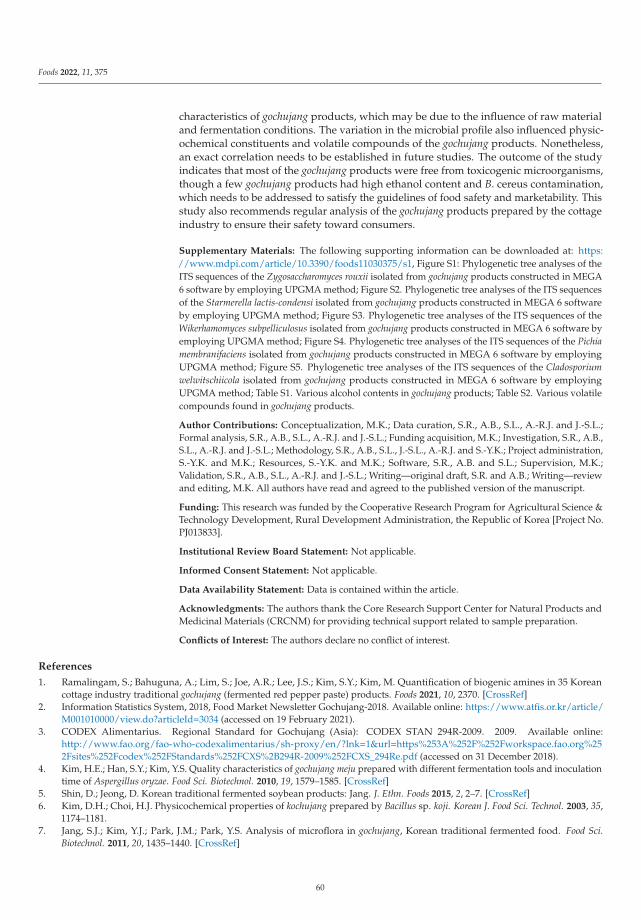
Foods 2022, 11, 375
characteristics of gochujang products, which may be due to the influence of raw materialand fermentation conditions. The variation in the microbial profile also influenced physic-ochemical constituents and volatile compounds of the gochujang products. Nonetheless,an exact correlation needs to be established in future studies. The outcome of the studyindicates that most of the gochujang products were free from toxicogenic microorganisms,though a few gochujang products had high ethanol content and B. cereus contamination,which needs to be addressed to satisfy the guidelines of food safety and marketability. Thisstudy also recommends regular analysis of the gochujang products prepared by the cottageindustry to ensure their safety toward consumers.
Supplementary Materials: The following supporting information can be downloaded at: https://www.mdpi.com/article/10.3390/foods11030375/s1, Figure S1: Phylogenetic tree analyses of theITS sequences of the Zygosaccharomyces rouxii isolated from gochujang products constructed in MEGA6 software by employing UPGMA method; Figure S2. Phylogenetic tree analyses of the ITS sequencesof the Starmerella lactis-condensi isolated from gochujang products constructed in MEGA 6 softwareby employing UPGMA method; Figure S3. Phylogenetic tree analyses of the ITS sequences of theWikerhamomyces subpelliculosus isolated from gochujang products constructed in MEGA 6 software byemploying UPGMA method; Figure S4. Phylogenetic tree analyses of the ITS sequences of the Pichiamembranifaciens isolated from gochujang products constructed in MEGA 6 software by employingUPGMA method; Figure S5. Phylogenetic tree analyses of the ITS sequences of the Cladosporiumwelwitschiicola isolated from gochujang products constructed in MEGA 6 software by employingUPGMA method; Table S1. Various alcohol contents in gochujang products; Table S2. Various volatilecompounds found in gochujang products.
Author Contributions: Conceptualization, M.K.; Data curation, S.R., A.B., S.L., A.-R.J. and J.-S.L.;Formal analysis, S.R., A.B., S.L., A.-R.J. and J.-S.L.; Funding acquisition, M.K.; Investigation, S.R., A.B.,S.L., A.-R.J. and J.-S.L.; Methodology, S.R., A.B., S.L., J.-S.L., A.-R.J. and S.-Y.K.; Project administration,S.-Y.K. and M.K.; Resources, S.-Y.K. and M.K.; Software, S.R., A.B. and S.L.; Supervision, M.K.;Validation, S.R., A.B., S.L., A.-R.J. and J.-S.L.; Writing—original draft, S.R. and A.B.; Writing—reviewand editing, M.K. All authors have read and agreed to the published version of the manuscript.
Funding: This research was funded by the Cooperative Research Program for Agricultural Science &Technology Development, Rural Development Administration, the Republic of Korea [Project No.PJ013833].
Institutional Review Board Statement: Not applicable.
Informed Consent Statement: Not applicable.
Data Availability Statement: Data is contained within the article.
Acknowledgments: The authors thank the Core Research Support Center for Natural Products andMedicinal Materials (CRCNM) for providing technical support related to sample preparation.
Conflicts of Interest: The authors declare no conflict of interest.
References
1. Ramalingam, S.; Bahuguna, A.; Lim, S.; Joe, A.R.; Lee, J.S.; Kim, S.Y.; Kim, M. Quantification of biogenic amines in 35 Koreancottage industry traditional gochujang (fermented red pepper paste) products. Foods 2021, 10, 2370. [CrossRef]
2. Information Statistics System, 2018, Food Market Newsletter Gochujang-2018. Available online: https://www.atfis.or.kr/article/M001010000/view.do?articleId=3034 (accessed on 19 February 2021).
3. CODEX Alimentarius. Regional Standard for Gochujang (Asia): CODEX STAN 294R-2009. 2009. Available online:http://www.fao.org/fao-who-codexalimentarius/sh-proxy/en/?lnk=1&url=https%253A%252F%252Fworkspace.fao.org%252Fsites%252Fcodex%252FStandards%252FCXS%2B294R-2009%252FCXS_294Re.pdf (accessed on 31 December 2018).
4. Kim, H.E.; Han, S.Y.; Kim, Y.S. Quality characteristics of gochujang meju prepared with different fermentation tools and inoculationtime of Aspergillus oryzae. Food Sci. Biotechnol. 2010, 19, 1579–1585. [CrossRef]
5. Shin, D.; Jeong, D. Korean traditional fermented soybean products: Jang. J. Ethn. Foods 2015, 2, 2–7. [CrossRef]6. Kim, D.H.; Choi, H.J. Physicochemical properties of kochujang prepared by Bacillus sp. koji. Korean J. Food Sci. Technol. 2003, 35,
1174–1181.7. Jang, S.J.; Kim, Y.J.; Park, J.M.; Park, Y.S. Analysis of microflora in gochujang, Korean traditional fermented food. Food Sci.
Biotechnol. 2011, 20, 1435–1440. [CrossRef]
60
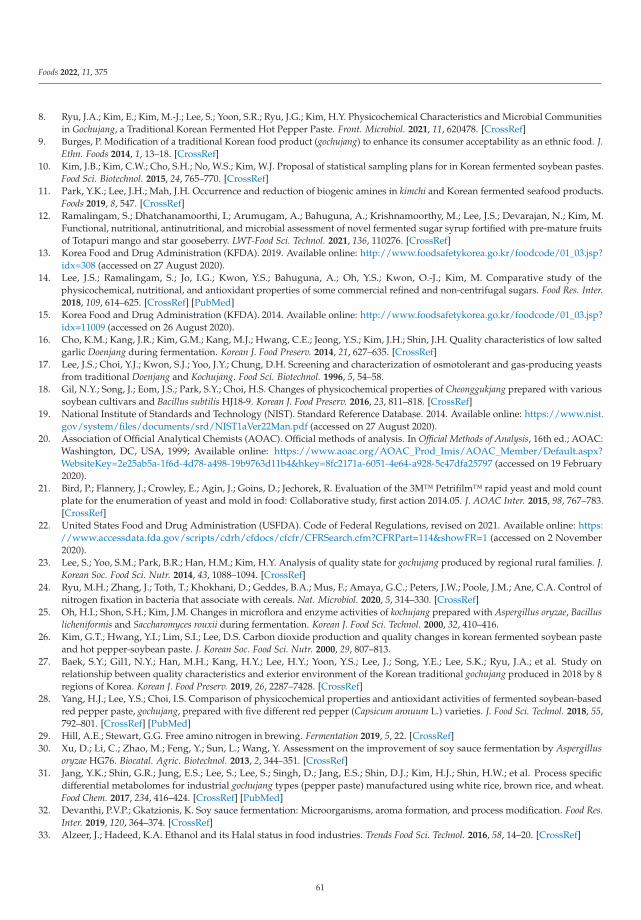
Foods 2022, 11, 375
8. Ryu, J.A.; Kim, E.; Kim, M.-J.; Lee, S.; Yoon, S.R.; Ryu, J.G.; Kim, H.Y. Physicochemical Characteristics and Microbial Communitiesin Gochujang, a Traditional Korean Fermented Hot Pepper Paste. Front. Microbiol. 2021, 11, 620478. [CrossRef]
9. Burges, P. Modification of a traditional Korean food product (gochujang) to enhance its consumer acceptability as an ethnic food. J.Ethn. Foods 2014, 1, 13–18. [CrossRef]
10. Kim, J.B.; Kim, C.W.; Cho, S.H.; No, W.S.; Kim, W.J. Proposal of statistical sampling plans for in Korean fermented soybean pastes.Food Sci. Biotechnol. 2015, 24, 765–770. [CrossRef]
11. Park, Y.K.; Lee, J.H.; Mah, J.H. Occurrence and reduction of biogenic amines in kimchi and Korean fermented seafood products.Foods 2019, 8, 547. [CrossRef]
12. Ramalingam, S.; Dhatchanamoorthi, I.; Arumugam, A.; Bahuguna, A.; Krishnamoorthy, M.; Lee, J.S.; Devarajan, N.; Kim, M.Functional, nutritional, antinutritional, and microbial assessment of novel fermented sugar syrup fortified with pre-mature fruitsof Totapuri mango and star gooseberry. LWT-Food Sci. Technol. 2021, 136, 110276. [CrossRef]
13. Korea Food and Drug Administration (KFDA). 2019. Available online: http://www.foodsafetykorea.go.kr/foodcode/01_03.jsp?idx=308 (accessed on 27 August 2020).
14. Lee, J.S.; Ramalingam, S.; Jo, I.G.; Kwon, Y.S.; Bahuguna, A.; Oh, Y.S.; Kwon, O.-J.; Kim, M. Comparative study of thephysicochemical, nutritional, and antioxidant properties of some commercial refined and non-centrifugal sugars. Food Res. Inter.2018, 109, 614–625. [CrossRef] [PubMed]
15. Korea Food and Drug Administration (KFDA). 2014. Available online: http://www.foodsafetykorea.go.kr/foodcode/01_03.jsp?idx=11009 (accessed on 26 August 2020).
16. Cho, K.M.; Kang, J.R.; Kim, G.M.; Kang, M.J.; Hwang, C.E.; Jeong, Y.S.; Kim, J.H.; Shin, J.H. Quality characteristics of low saltedgarlic Doenjang during fermentation. Korean J. Food Preserv. 2014, 21, 627–635. [CrossRef]
17. Lee, J.S.; Choi, Y.J.; Kwon, S.J.; Yoo, J.Y.; Chung, D.H. Screening and characterization of osmotolerant and gas-producing yeastsfrom traditional Doenjang and Kochujang. Food Sci. Biotechnol. 1996, 5, 54–58.
18. Gil, N.Y.; Song, J.; Eom, J.S.; Park, S.Y.; Choi, H.S. Changes of physicochemical properties of Cheonggukjang prepared with varioussoybean cultivars and Bacillus subtilis HJ18-9. Korean J. Food Preserv. 2016, 23, 811–818. [CrossRef]
19. National Institute of Standards and Technology (NIST). Standard Reference Database. 2014. Available online: https://www.nist.gov/system/files/documents/srd/NIST1aVer22Man.pdf (accessed on 27 August 2020).
20. Association of Official Analytical Chemists (AOAC). Official methods of analysis. In Official Methods of Analysis, 16th ed.; AOAC:Washington, DC, USA, 1999; Available online: https://www.aoac.org/AOAC_Prod_Imis/AOAC_Member/Default.aspx?WebsiteKey=2e25ab5a-1f6d-4d78-a498-19b9763d11b4&hkey=8fc2171a-6051-4e64-a928-5c47dfa25797 (accessed on 19 February2020).
21. Bird, P.; Flannery, J.; Crowley, E.; Agin, J.; Goins, D.; Jechorek, R. Evaluation of the 3M™ Petrifilm™ rapid yeast and mold countplate for the enumeration of yeast and mold in food: Collaborative study, first action 2014.05. J. AOAC Inter. 2015, 98, 767–783.[CrossRef]
22. United States Food and Drug Administration (USFDA). Code of Federal Regulations, revised on 2021. Available online: https://www.accessdata.fda.gov/scripts/cdrh/cfdocs/cfcfr/CFRSearch.cfm?CFRPart=114&showFR=1 (accessed on 2 November2020).
23. Lee, S.; Yoo, S.M.; Park, B.R.; Han, H.M.; Kim, H.Y. Analysis of quality state for gochujang produced by regional rural families. J.Korean Soc. Food Sci. Nutr. 2014, 43, 1088–1094. [CrossRef]
24. Ryu, M.H.; Zhang, J.; Toth, T.; Khokhani, D.; Geddes, B.A.; Mus, F.; Amaya, G.C.; Peters, J.W.; Poole, J.M.; Ane, C.A. Control ofnitrogen fixation in bacteria that associate with cereals. Nat. Microbiol. 2020, 5, 314–330. [CrossRef]
25. Oh, H.I.; Shon, S.H.; Kim, J.M. Changes in microflora and enzyme activities of kochujang prepared with Aspergillus oryzae, Bacilluslicheniformis and Saccharomyces rouxii during fermentation. Korean J. Food Sci. Technol. 2000, 32, 410–416.
26. Kim, G.T.; Hwang, Y.I.; Lim, S.I.; Lee, D.S. Carbon dioxide production and quality changes in korean fermented soybean pasteand hot pepper-soybean paste. J. Korean Soc. Food Sci. Nutr. 2000, 29, 807–813.
27. Baek, S.Y.; Gil1, N.Y.; Han, M.H.; Kang, H.Y.; Lee, H.Y.; Yoon, Y.S.; Lee, J.; Song, Y.E.; Lee, S.K.; Ryu, J.A.; et al. Study onrelationship between quality characteristics and exterior environment of the Korean traditional gochujang produced in 2018 by 8regions of Korea. Korean J. Food Preserv. 2019, 26, 2287–7428. [CrossRef]
28. Yang, H.J.; Lee, Y.S.; Choi, I.S. Comparison of physicochemical properties and antioxidant activities of fermented soybean-basedred pepper paste, gochujang, prepared with five different red pepper (Capsicum annuum L.) varieties. J. Food Sci. Technol. 2018, 55,792–801. [CrossRef] [PubMed]
29. Hill, A.E.; Stewart, G.G. Free amino nitrogen in brewing. Fermentation 2019, 5, 22. [CrossRef]30. Xu, D.; Li, C.; Zhao, M.; Feng, Y.; Sun, L.; Wang, Y. Assessment on the improvement of soy sauce fermentation by Aspergillus
oryzae HG76. Biocatal. Agric. Biotechnol. 2013, 2, 344–351. [CrossRef]31. Jang, Y.K.; Shin, G.R.; Jung, E.S.; Lee, S.; Lee, S.; Singh, D.; Jang, E.S.; Shin, D.J.; Kim, H.J.; Shin, H.W.; et al. Process specific
differential metabolomes for industrial gochujang types (pepper paste) manufactured using white rice, brown rice, and wheat.Food Chem. 2017, 234, 416–424. [CrossRef] [PubMed]
32. Devanthi, P.V.P.; Gkatzionis, K. Soy sauce fermentation: Microorganisms, aroma formation, and process modification. Food Res.Inter. 2019, 120, 364–374. [CrossRef]
33. Alzeer, J.; Hadeed, K.A. Ethanol and its Halal status in food industries. Trends Food Sci. Technol. 2016, 58, 14–20. [CrossRef]
61
Foods 2022, 11, 375
34. Buratti, S.; Benedetti, S. Alcoholic fermentation using electronic nose and electronic tongue. In Electronic Noses and Tongues in FoodScience; Academic Press: Cambridge, MA, USA, 2016; pp. 291–299.
35. Park, E.S.; Heo, J.H.; Ju, J.; Park, K.Y. Changes in quality characteristics of gochujang prepared with different ingredients and mejustarters. J. Korean Soc. Food Sci. Nutr. 2016, 45, 880–888. [CrossRef]
36. Choi, J.Y.; Lee, T.S.; Noh, B.S. Characteristics of volatile flavor compounds in improved kochujang prepared with glutinous ricekoji during fermentation. Korean J. Food Sci. Technol. 1999, 31, 1221–1226.
37. Kang, K.M.; Baek, H.H. Aroma quality assessment of Korean fermented red pepper paste (gochujang) by aroma extract dilu-tion analysis and headspace solid-phase micro extraction–gas chromatography–olfactometry. Food Chem. 2014, 145, 488–495.[CrossRef]
38. Choi, J.Y.; Lee, T.S.; Noh, B.S. Characteristics of volatile flavor compounds in kochujangs with meju and soybean koji duringfermentation. Korean J. Food Sci. Technol. 2000, 32, 1035–1042.
39. Choi, J.Y.; Lee, T.S. Characteristics of volatile flavor compounds in kochujang prepared with commercial enzyme during fermenta-tion. J. Korean Soc. Agric. Chem. Biotechnol. 2003, 46, 207–213.
40. Park, H.K.; Kim, J.G. Character impact compounds of kochujang. Korea Soybean Digest. 2003, 20, 1–11.41. Oh, J.Y.; Kim, Y.S.; Kim, Y.H.; Shin, D.H. Volatile flavor components of kochujang prepared with different kojis. Food Sci. Biotechnol.
2001, 10, 45–53.42. Shon, S.; Kim, J.; Oh, H.; Ha, J. Volatile flavor components of kochujang prepared with Aspergillus oryzae, Bacillus licheniformis and
Saccharomyces rouxii. Food Sci. Biotechnol. 2003, 12, 18–22.43. Byun, H.O.; Park, M.J.; Park, Y.S.; Bai, H.S. Analysis of microflora and volatile flavor components in traditional gochujang with
different concentrations of salt during fermentation. Food Eng. Prog. 2014, 18, 282–292. [CrossRef]44. Choi, J.Y.; Lee, T.S.; Park, S.O. Characteristics of volatile flavor compounds in improved kochujang prepared with soybean koji
during fermentation. Korean J. Food Sci. Technol. 1997, 29, 1144–1150.45. Choi, J.Y.; Lee, T.S.; Park, S.O.; Noh, B.S. Changes of volatile flavor compounds in traditional kochujang during fermentation.
Korean J. Food Sci. Technol. 1997, 29, 745–751.46. Kim, Y.S.; Oh, H.I. Volatile flavor components of traditional and commercial kochujang. Korean J. Food Sci. Technol. 1993, 25,
494–501.47. Zhang, L.; Che, Z.; Xu, W.; Yue, P.; Li, R.; Li, Y.; Pei, X.; Zeng, P. Dynamics of physicochemical factors and microbial communities
during ripening fermentation of Pixian Doubanjiang, a typical condiment in Chinese cuisine. Food Microbiol. 2020, 86, 103342.[CrossRef]
48. Cho, S.H.; Park, H.S.; Jo, S.W.; Yim, E.J.; Yang, H.Y.; Ha, G.S.; Jeong, D.Y. Comparison of microbial community profiling ontraditional fermented soybean products (Deonjang, Gochujang) produced in Jeonbuk, Jeonnam, and Jeju province area. Korean J.Microbiol. 2017, 53, 39–48. [CrossRef]
49. Nam, Y.D.; Park, S.I.; Lim, S.I. Microbial composition of the Korean traditional food “kochujang” analyzed by a massive sequencingtechnique. J. Food Sci. 2012, 77, 250–256. [CrossRef] [PubMed]
50. Zhou, N.; Schifferdecker, A.J.; Gamero, A.; Compagno, C.; Boekhout, T.; Piškur, J.; Knecht, W. Kazachstania gamospora andWickerhamomyces subpelliculosus: Two alternative baker’s yeasts in the modern bakery. Inter. J. Food Microbiol. 2017, 250, 45–58.[CrossRef] [PubMed]
51. Oh, N.S.; Shin, D.B.; In, M.J.; Chang, Y.I.; Han, M. Effects of capsaicin on the growth and ethanol production of Zygosaccharomycesrouxii KFY80 isolated from gochujang (fermented hot pepper paste). Food Sci. Biotechnol. 2004, 13, 749–753.
52. Hong, Y.J.; Son, S.H.; Kim, H.Y.; Hwang, I.G.; Yoo, S.S. Volatile components of traditional gochujang produced from small farmsaccording to each cultivation region. J. East Asian Soc. Diet. Life 2013, 23, 451–460.
53. Korea Food and Drug Administration (KFDA). Food Borne Pathogen Test Methods, Seoul, Korea. 2010. Available online:http://www.kfda.go.kr (accessed on 5 April 2020).
54. Yim, J.H.; Kim, K.Y.; Chon, J.W.; Kim, D.H.; Kim, H.S.; Choi, D.S.; Choi, I.S.; Seo, K.H. Incidence, antibiotic susceptibility, andtoxin profiles of Bacillus cereus sensulato isolated from Korean fermented soybean products. J. Food Sci. 2015, 80, M1266–M1270.[CrossRef]
62
Citation: Boukid, F.; Gagaoua, M.
Vegan Egg: A Future-Proof Food
Ingredient? Foods 2022, 11, 161.
https://doi.org/10.3390/
foods11020161
Academic Editors: Luca Serventi,
Charles Brennan and Rana Mustafa
Received: 9 December 2021
Accepted: 6 January 2022
Published: 8 January 2022
Publisher’s Note: MDPI stays neutral
with regard to jurisdictional claims in
published maps and institutional affil-
iations.
Copyright: © 2022 by the authors.
Licensee MDPI, Basel, Switzerland.
This article is an open access article
distributed under the terms and
conditions of the Creative Commons
Attribution (CC BY) license (https://
creativecommons.org/licenses/by/
4.0/).
foods
Review
Vegan Egg: A Future-Proof Food Ingredient?
Fatma Boukid 1 and Mohammed Gagaoua 2,*
1 Food Safety and Functionality Programme, Institute of Agriculture and Food Research andTechnology (IRTA), 17121 Monells, Spain; [email protected]
2 Food Quality and Sensory Science Department, Teagasc Food Research Centre, Ashtown,D15 KN3K Dublin, Ireland
* Correspondence: [email protected] or [email protected]
Abstract: Vegan eggs are designed with the aim to provide a healthier and more sustainable alterna-tive to regular eggs. The major drivers of this industry are the increasing prevalence of egg allergies,awareness towards environmental sustainability, and the shift to vegan diets. This study intends todiscuss, for the first time, the vegan egg market, including their formulation, nutritional aspects, andsome applications (i.e., mayonnaise and bakery products). Recreating the complete functionality ofeggs using plant-based ingredients is very challenging due to the complexity of eggs. Current, butscarce, research in this field is focused on making mixtures of plant-based ingredients to fit specificfood formulations. Nutritionally, providing vegan eggs with similar or higher nutritional value tothat of eggs can be of relevance to attract health-conscious consumers. Claims such as clean labels,natural, vegan, animal-free, gluten-free, and/or cholesterol-free can further boost the position ofvegan eggs in the market in the coming year. At present, this market is still in its infancy stages, andclear regulations of labeling, safety, and risk assessment are deemed mandatory to organize the sector,and protect consumers.
Keywords: future foods; sustainability; egg; algae; starches; plant proteins; bakery products;mayonnaise; food formulation
1. Introduction
Eggs play significant roles in foods, owing to its gelling, foaming, and emulsificationfeatures [1,2]. Eggs are versatile products available in the market in dry and liquid formsas whole eggs, egg whites, and egg yolks. Besides their functionality, eggs are of particularinterest from a nutritional point of view since they contain proteins, vitamins, minerals,essential fatty acids, and other micronutrients [3]. These components are distributedbetween the egg yolk and egg white. Egg yolk is rich in lipids (65–70% on dry basis) andproteins (30% on dry basis), and it is a good source of lutein, zeaxanthin, and vitamins [4].Egg white is rich in proteins, namely fibrous structural proteins (ovomucins), glycoproteins(ovalbumin, protease inhibitors), antibacterial proteins (lysozyme), and peptides [3].
Despite the nutritional value and functionality of eggs as a food ingredient, a highconsumption was reported to be related to chronic degenerative diseases that can causecardiovascular disease and mortality due to its high cholesterol content [5,6]. Moderate eggconsumption (up to one egg per day) was found to be not associated with a cardiovasculardisease risk [5]. Overall, it was recommended to limit cholesterol intake, and replacewhole eggs with egg whites/substitutes for facilitating cardiovascular health and long-termsurvival [7]. In low- and middle-income countries, due to the price increase in meat, therehas also been a shift towards increased egg consumption as a response to maintaininganimal-based protein consumption in the diet [8]. On the other hand, consumers areturning towards plant-based food substitutes as a response to rising food safety concernsrelated to eggs, among other ethical concerns in European countries such as Germany,
Foods 2022, 11, 161. https://doi.org/10.3390/foods11020161 https://www.mdpi.com/journal/foods63
Foods 2022, 11, 161
France, and Italy [9–11]. Zoonotic diseases related to poultry and eggs, such as avian tuber-culosis, erysipelas, and salmonellosis, and flus, is one of the main factors fueling the marketgrowth of vegan eggs [12]. Over the last years, increased public awareness over numerousfoodborne diseases transmittable through egg consumption are increasingly alarming forconsumers, and negatively impacting the consumption of poultry eggs [13]. Several safetyscandals have heavily affected the egg industry, such as fipronil in eggs in Europe (2017),and a salmonella outbreak in poultry in the USA (2015) and UK (2018) [13,14]. The useof antibiotics and hormones in poultry products to ensure rapid growth and health isanother contentious issue in the poultry industry [15]. Nevertheless, the accumulationof these drug residues in eggs can cause significant health concerns by triggering aller-gic reactions and transmitting antibiotic-resistant microbial infections [16]. Egg allergiesare one of the most common food allergies in young children, and tends to persist intoadulthood [17,18]. This allergy is triggered by ovomucoid (Gal d 1), ovalbumin (Gal d 2),ovotransferrin/conalbumin (Gal d 3), and lysozyme (Gal d 4), which are mainly located inegg whites and, to a lesser extent, in yolk [19,20]. This allergy can cause serious skin reac-tions, nasal congestion, and gastrointestinal and respiratory symptoms [21]. Egg allergiesmay also coexist with other food allergies, such as nuts and fish [22,23]. A diet exempt ofegg is the only solution to manage an egg allergy [24]. Different approaches were appliedto reduce cholesterol and to mitigate epitopes present in eggs by chemical (solvents andbiopolymers), physical (fractionation and separation), and biological (enzymes) process-ing [25,26]. These methods showed variable degrees of success, but they have not beenscaled up due to safety, consumer acceptance, repeatability, and economic reasons [27].These issues have increased consumers’ concern toward the consumption of eggs for health,safety, or environmental reasons, and gave room to a new variety of alternative products,such as egg substitutes.
Creating egg substitutes to replace egg functionality and nutritional properties is achallenging task due to the multi-functionality of eggs that impact the taste, texture, andthe aspect of food products. The first studies on egg substitutes go back to the seven-ties [28,29], where particular focus was attributed to replace eggs in bakery products. Atfirst, animal proteins were mostly used, such as milk powder, casein, whey, and bovineplasma protein [30,31]. This is due to their excellent functional properties, such as sol-ubility, emulsification, foaming, and heat-induced gelation properties [32]. Despite theoccurrence of animal ingredients in the human diet, plant-based foods are gaining pop-ularity around the world due to their health benefits, environmental sustainability, andethical merit [33,34]. The coronavirus (COVID-19) outbreak consolidated this transitiondue to changes in consumers’ dietary habits, associating plant-based diets to be healthieralternatives to animal products [35]. COVID-19 caused also a decrease in the demand forchickens and eggs, resulting in prices fluctuations due to lockdown restrictions limitingbusiness opportunities and customer incomes [36]. Furthermore, there are false rumorssuggesting zoonotic origins of COVID-19 or poultry products contributing to the spread ofCOVID-19 [12,37].
To cater for the growing vegan and health-conscious market, manufacturers havecreated vegan eggs using different types of plant-based ingredients (e.g., proteins, polysac-charide hydrocolloids, or emulsifiers), alone or combined, to replace regular eggs in foodproducts. These ingredients might present nutritional benefits such as low allergenicity,reduced price, and high production volumes. Nevertheless, the functional propertiesare highly variable among the different ingredients in terms of composition, purity, andsource [38]. The vegan egg market keeps growing to deliver different products with dif-ferent properties to fit a wide range of applications. In this context, this study aimed, forthe first time, to: (i) enable an overview about the current market landscape of vegan eggs,with a focus on drivers and barriers; (ii) address the main ingredients used in formulatingvegan eggs; (iii) discuss their nutritional properties in comparison to conventional eggproducts; and (iv) confer their impact on food products, with a focus on mayonnaise andbakery products as examples among other potential products.
64
Foods 2022, 11, 161
2. Global Market Landscape of Vegan Eggs
The global vegan egg market is moving upward, and accounted for US$1.5 billion in2021, and is expected to witness a high compound annual growth rate of 8.3% through2031 [39]. Due to the absence of exhaustive market reports about vegan eggs launchedin the global market, the authors made their search using Mintel’s GNPD database [40],with a focus on the period 2016–2021 to capture the current market landscape of veganeggs. From 2016 to 2021, 102 vegan egg products were launched in the global market. Theauthors gathered all information on the front-of-pack labelling. Table 1 summarizes themain market trends in the vegan egg industry, relying on the main claims used on theretrieved products. Health and well-being, naturalness, sustainability, and convenience arethe main trends, with “vegan/no animal” and “vegetarian” ingredients (related to healthand well-being and sustainability), and “low/no/reduced allergen” and “gluten-free”(related to health and well-being) being the top four sub-trends [40]. In the last decade,consumers have become more concerned on health and well-being, and are paying moreattention to what they eat. As a result, manufactures of vegan eggs consider the use of alarge spectrum of ingredients to offer a portfolio of products to accommodate all consumers,including those with special needs. Indeed, 80.4% of marketed vegan eggs claim to havelow/no/reduced allergens, including 65.7% and 18.6% claiming to be gluten-free andlow/no/reduced lactose, respectively. Increasing niches with particular lifestyles, such asvegan, vegetarian, and flexitarian, contributed to the reduction of animal-derived products,such as alternative meat, vegan dairy, and vegan eggs [41–43]. In addition, 100% claim tobe suitable for vegans and vegetarians due the absence of animal-based ingredients in eggformulations, such as whey protein, milk, or casein. Emphasizing that these products aremade with plant-based ingredients was reflected by the use of term “plant-based” on 31.4%of products. This shift to non-animal ingredients seemed to continue to benefit the industryof vegan eggs [33,44].
Vegan eggs are also rising as a healthier alternative to eggs, since they contain nocholesterol. This aligns with market trends reporting around 41.2% of launches claimedto have low/no/reduced cholesterol. This industry is further focused on designing prod-ucts with reduced sugar, fat, saturated fat, and sodium. Since consumers have a strongpreference for food products free from additives and preservatives, there is a growingtrend boosting the use of natural and clean label ingredients [45]. This was reflected bydeclarations, such as genetically modified organisms (GMO)-free (35.3%), organic (27.4%),no additives/preservatives (22.5%), free from added/artificial preservatives (7.8%), andfree from added/artificial colorings (5.9%). Consumers’ awareness towards contaminantsis also considered where terms like “toxin-free” were used to describe 1.96% of the prod-ucts. Convenience is an important driver of this market, in which 34.3% of products weredeclared as easily used. This aligns with a general trend in the food sector seeking quickand convenient meal solutions [46]. Finally, sustainability is becoming an essential criterionin the food sector [47], and the sustainability of vegan eggs is reflected by the fact that 83.3%of the products seemed to have environmental or ethical claims, including recycling foodwaste, and the use of sustainable packaging.
Like other emerging alternative products, the current market barriers of vegan eggsare the lack of high production volumes, targeted marketing, and clear regulations. Arecent study based on in-depth interviews with egg industries and retailers and plant-based egg manufacturers revealed that replicating all eggs’ nutrients and functionalities isnot realistic, and considering plant-based eggs as potential competitors to conventionalproducts is impossible. Also, there is uncertainty on how to present the labeling of plant-based eggs [48]. Consumer perception and acceptance is also an important factor for thegrowth of such a novel food sector. Consumer expectations from vegan egg productswere found to be depending on product-related (color, shape, taste, ingredients, nutrients,method of production, and shelf life) and non-product-related attributes (price, packaging,country of origin, and product naming) [49]. More in-depth quantitative and quantitativestudies are required for a deeper understanding of this first screening based on country
65
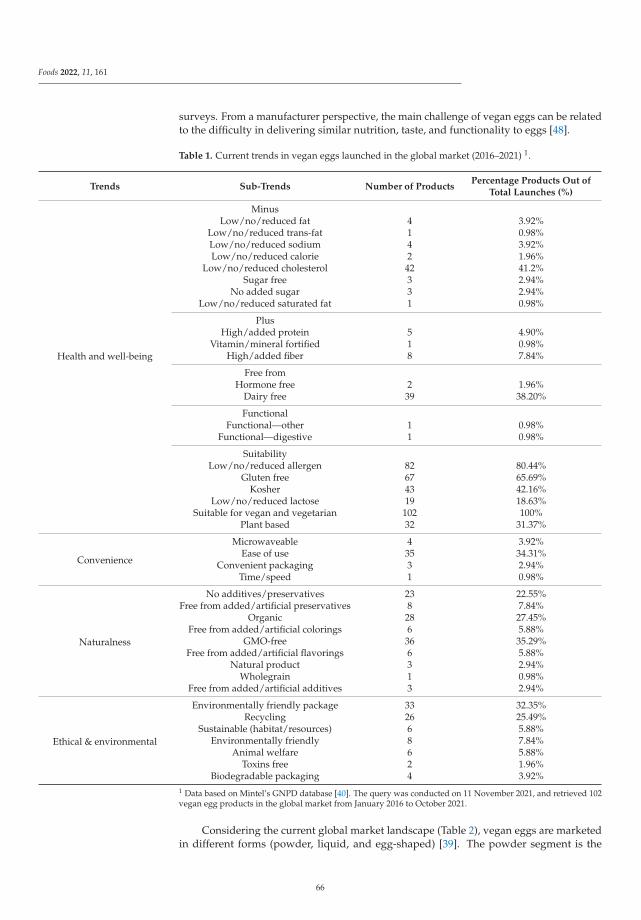
Foods 2022, 11, 161
surveys. From a manufacturer perspective, the main challenge of vegan eggs can be relatedto the difficulty in delivering similar nutrition, taste, and functionality to eggs [48].
Table 1. Current trends in vegan eggs launched in the global market (2016–2021) 1.
Trends Sub-Trends Number of ProductsPercentage Products Out of
Total Launches (%)
Health and well-being
MinusLow/no/reduced fat 4 3.92%
Low/no/reduced trans-fat 1 0.98%Low/no/reduced sodium 4 3.92%Low/no/reduced calorie 2 1.96%
Low/no/reduced cholesterol 42 41.2%Sugar free 3 2.94%
No added sugar 3 2.94%Low/no/reduced saturated fat 1 0.98%
PlusHigh/added protein 5 4.90%
Vitamin/mineral fortified 1 0.98%High/added fiber 8 7.84%
Free fromHormone free 2 1.96%
Dairy free 39 38.20%
FunctionalFunctional—other 1 0.98%
Functional—digestive 1 0.98%
SuitabilityLow/no/reduced allergen 82 80.44%
Gluten free 67 65.69%Kosher 43 42.16%
Low/no/reduced lactose 19 18.63%Suitable for vegan and vegetarian 102 100%
Plant based 32 31.37%
Convenience
Microwaveable 4 3.92%Ease of use 35 34.31%
Convenient packaging 3 2.94%Time/speed 1 0.98%
Naturalness
No additives/preservatives 23 22.55%Free from added/artificial preservatives 8 7.84%
Organic 28 27.45%Free from added/artificial colorings 6 5.88%
GMO-free 36 35.29%Free from added/artificial flavorings 6 5.88%
Natural product 3 2.94%Wholegrain 1 0.98%
Free from added/artificial additives 3 2.94%
Ethical & environmental
Environmentally friendly package 33 32.35%Recycling 26 25.49%
Sustainable (habitat/resources) 6 5.88%Environmentally friendly 8 7.84%
Animal welfare 6 5.88%Toxins free 2 1.96%
Biodegradable packaging 4 3.92%1 Data based on Mintel’s GNPD database [40]. The query was conducted on 11 November 2021, and retrieved 102vegan egg products in the global market from January 2016 to October 2021.
Considering the current global market landscape (Table 2), vegan eggs are marketedin different forms (powder, liquid, and egg-shaped) [39]. The powder segment is the
66
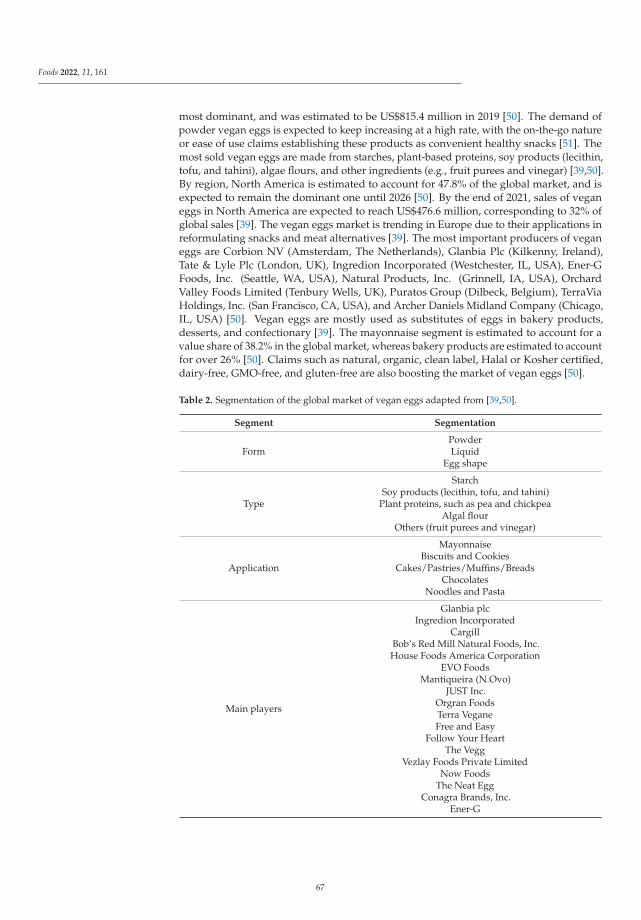
Foods 2022, 11, 161
most dominant, and was estimated to be US$815.4 million in 2019 [50]. The demand ofpowder vegan eggs is expected to keep increasing at a high rate, with the on-the-go natureor ease of use claims establishing these products as convenient healthy snacks [51]. Themost sold vegan eggs are made from starches, plant-based proteins, soy products (lecithin,tofu, and tahini), algae flours, and other ingredients (e.g., fruit purees and vinegar) [39,50].By region, North America is estimated to account for 47.8% of the global market, and isexpected to remain the dominant one until 2026 [50]. By the end of 2021, sales of veganeggs in North America are expected to reach US$476.6 million, corresponding to 32% ofglobal sales [39]. The vegan eggs market is trending in Europe due to their applications inreformulating snacks and meat alternatives [39]. The most important producers of veganeggs are Corbion NV (Amsterdam, The Netherlands), Glanbia Plc (Kilkenny, Ireland),Tate & Lyle Plc (London, UK), Ingredion Incorporated (Westchester, IL, USA), Ener-GFoods, Inc. (Seattle, WA, USA), Natural Products, Inc. (Grinnell, IA, USA), OrchardValley Foods Limited (Tenbury Wells, UK), Puratos Group (Dilbeck, Belgium), TerraViaHoldings, Inc. (San Francisco, CA, USA), and Archer Daniels Midland Company (Chicago,IL, USA) [50]. Vegan eggs are mostly used as substitutes of eggs in bakery products,desserts, and confectionary [39]. The mayonnaise segment is estimated to account for avalue share of 38.2% in the global market, whereas bakery products are estimated to accountfor over 26% [50]. Claims such as natural, organic, clean label, Halal or Kosher certified,dairy-free, GMO-free, and gluten-free are also boosting the market of vegan eggs [50].
Table 2. Segmentation of the global market of vegan eggs adapted from [39,50].
Segment Segmentation
FormPowderLiquid
Egg shape
Type
StarchSoy products (lecithin, tofu, and tahini)
Plant proteins, such as pea and chickpeaAlgal flour
Others (fruit purees and vinegar)
Application
MayonnaiseBiscuits and Cookies
Cakes/Pastries/Muffins/BreadsChocolates
Noodles and Pasta
Main players
Glanbia plcIngredion Incorporated
CargillBob’s Red Mill Natural Foods, Inc.House Foods America Corporation
EVO FoodsMantiqueira (N.Ovo)
JUST Inc.Orgran FoodsTerra VeganeFree and Easy
Follow Your HeartThe Vegg
Vezlay Foods Private LimitedNow Foods
The Neat EggConagra Brands, Inc.
Ener-G
67
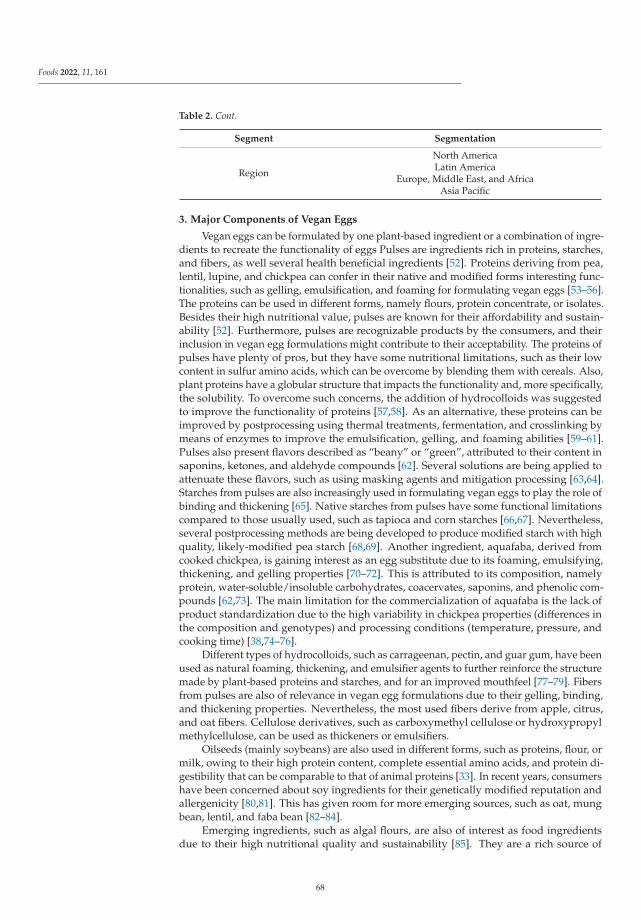
Foods 2022, 11, 161
Table 2. Cont.
Segment Segmentation
Region
North AmericaLatin America
Europe, Middle East, and AfricaAsia Pacific
3. Major Components of Vegan Eggs
Vegan eggs can be formulated by one plant-based ingredient or a combination of ingre-dients to recreate the functionality of eggs Pulses are ingredients rich in proteins, starches,and fibers, as well several health beneficial ingredients [52]. Proteins deriving from pea,lentil, lupine, and chickpea can confer in their native and modified forms interesting func-tionalities, such as gelling, emulsification, and foaming for formulating vegan eggs [53–56].The proteins can be used in different forms, namely flours, protein concentrate, or isolates.Besides their high nutritional value, pulses are known for their affordability and sustain-ability [52]. Furthermore, pulses are recognizable products by the consumers, and theirinclusion in vegan egg formulations might contribute to their acceptability. The proteins ofpulses have plenty of pros, but they have some nutritional limitations, such as their lowcontent in sulfur amino acids, which can be overcome by blending them with cereals. Also,plant proteins have a globular structure that impacts the functionality and, more specifically,the solubility. To overcome such concerns, the addition of hydrocolloids was suggestedto improve the functionality of proteins [57,58]. As an alternative, these proteins can beimproved by postprocessing using thermal treatments, fermentation, and crosslinking bymeans of enzymes to improve the emulsification, gelling, and foaming abilities [59–61].Pulses also present flavors described as “beany” or “green”, attributed to their content insaponins, ketones, and aldehyde compounds [62]. Several solutions are being applied toattenuate these flavors, such as using masking agents and mitigation processing [63,64].Starches from pulses are also increasingly used in formulating vegan eggs to play the role ofbinding and thickening [65]. Native starches from pulses have some functional limitationscompared to those usually used, such as tapioca and corn starches [66,67]. Nevertheless,several postprocessing methods are being developed to produce modified starch with highquality, likely-modified pea starch [68,69]. Another ingredient, aquafaba, derived fromcooked chickpea, is gaining interest as an egg substitute due to its foaming, emulsifying,thickening, and gelling properties [70–72]. This is attributed to its composition, namelyprotein, water-soluble/insoluble carbohydrates, coacervates, saponins, and phenolic com-pounds [62,73]. The main limitation for the commercialization of aquafaba is the lack ofproduct standardization due to the high variability in chickpea properties (differences inthe composition and genotypes) and processing conditions (temperature, pressure, andcooking time) [38,74–76].
Different types of hydrocolloids, such as carrageenan, pectin, and guar gum, have beenused as natural foaming, thickening, and emulsifier agents to further reinforce the structuremade by plant-based proteins and starches, and for an improved mouthfeel [77–79]. Fibersfrom pulses are also of relevance in vegan egg formulations due to their gelling, binding,and thickening properties. Nevertheless, the most used fibers derive from apple, citrus,and oat fibers. Cellulose derivatives, such as carboxymethyl cellulose or hydroxypropylmethylcellulose, can be used as thickeners or emulsifiers.
Oilseeds (mainly soybeans) are also used in different forms, such as proteins, flour, ormilk, owing to their high protein content, complete essential amino acids, and protein di-gestibility that can be comparable to that of animal proteins [33]. In recent years, consumershave been concerned about soy ingredients for their genetically modified reputation andallergenicity [80,81]. This has given room for more emerging sources, such as oat, mungbean, lentil, and faba bean [82–84].
Emerging ingredients, such as algal flours, are also of interest as food ingredientsdue to their high nutritional quality and sustainability [85]. They are a rich source of
68
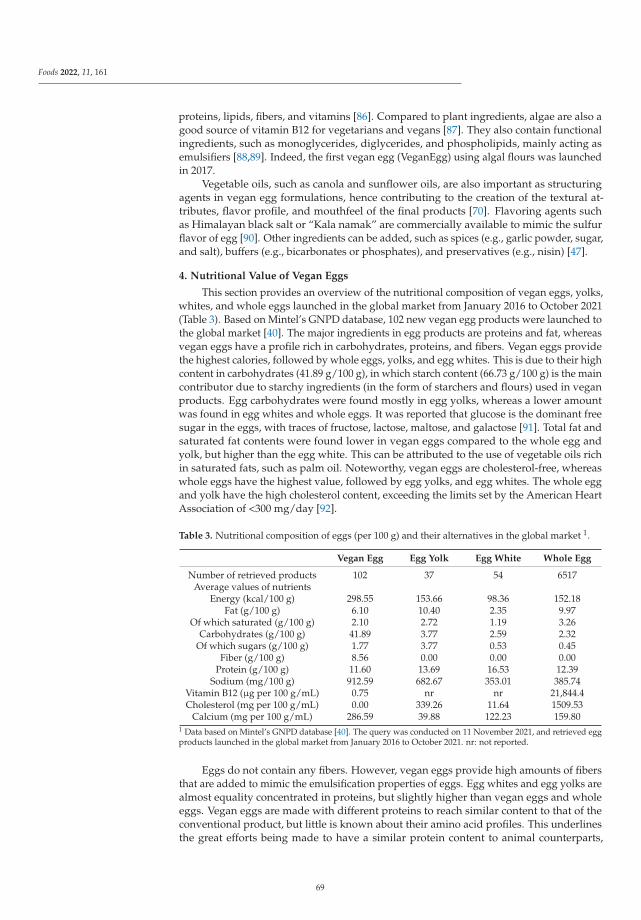
Foods 2022, 11, 161
proteins, lipids, fibers, and vitamins [86]. Compared to plant ingredients, algae are also agood source of vitamin B12 for vegetarians and vegans [87]. They also contain functionalingredients, such as monoglycerides, diglycerides, and phospholipids, mainly acting asemulsifiers [88,89]. Indeed, the first vegan egg (VeganEgg) using algal flours was launchedin 2017.
Vegetable oils, such as canola and sunflower oils, are also important as structuringagents in vegan egg formulations, hence contributing to the creation of the textural at-tributes, flavor profile, and mouthfeel of the final products [70]. Flavoring agents suchas Himalayan black salt or “Kala namak” are commercially available to mimic the sulfurflavor of egg [90]. Other ingredients can be added, such as spices (e.g., garlic powder, sugar,and salt), buffers (e.g., bicarbonates or phosphates), and preservatives (e.g., nisin) [47].
4. Nutritional Value of Vegan Eggs
This section provides an overview of the nutritional composition of vegan eggs, yolks,whites, and whole eggs launched in the global market from January 2016 to October 2021(Table 3). Based on Mintel’s GNPD database, 102 new vegan egg products were launched tothe global market [40]. The major ingredients in egg products are proteins and fat, whereasvegan eggs have a profile rich in carbohydrates, proteins, and fibers. Vegan eggs providethe highest calories, followed by whole eggs, yolks, and egg whites. This is due to their highcontent in carbohydrates (41.89 g/100 g), in which starch content (66.73 g/100 g) is the maincontributor due to starchy ingredients (in the form of starchers and flours) used in veganproducts. Egg carbohydrates were found mostly in egg yolks, whereas a lower amountwas found in egg whites and whole eggs. It was reported that glucose is the dominant freesugar in the eggs, with traces of fructose, lactose, maltose, and galactose [91]. Total fat andsaturated fat contents were found lower in vegan eggs compared to the whole egg andyolk, but higher than the egg white. This can be attributed to the use of vegetable oils richin saturated fats, such as palm oil. Noteworthy, vegan eggs are cholesterol-free, whereaswhole eggs have the highest value, followed by egg yolks, and egg whites. The whole eggand yolk have the high cholesterol content, exceeding the limits set by the American HeartAssociation of <300 mg/day [92].
Table 3. Nutritional composition of eggs (per 100 g) and their alternatives in the global market 1.
Vegan Egg Egg Yolk Egg White Whole Egg
Number of retrieved products 102 37 54 6517Average values of nutrients
Energy (kcal/100 g) 298.55 153.66 98.36 152.18Fat (g/100 g) 6.10 10.40 2.35 9.97
Of which saturated (g/100 g) 2.10 2.72 1.19 3.26Carbohydrates (g/100 g) 41.89 3.77 2.59 2.32
Of which sugars (g/100 g) 1.77 3.77 0.53 0.45Fiber (g/100 g) 8.56 0.00 0.00 0.00
Protein (g/100 g) 11.60 13.69 16.53 12.39Sodium (mg/100 g) 912.59 682.67 353.01 385.74
Vitamin B12 (μg per 100 g/mL) 0.75 nr nr 21,844.4Cholesterol (mg per 100 g/mL) 0.00 339.26 11.64 1509.53
Calcium (mg per 100 g/mL) 286.59 39.88 122.23 159.801 Data based on Mintel’s GNPD database [40]. The query was conducted on 11 November 2021, and retrieved eggproducts launched in the global market from January 2016 to October 2021. nr: not reported.
Eggs do not contain any fibers. However, vegan eggs provide high amounts of fibersthat are added to mimic the emulsification properties of eggs. Egg whites and egg yolks arealmost equality concentrated in proteins, but slightly higher than vegan eggs and wholeeggs. Vegan eggs are made with different proteins to reach similar content to that of theconventional product, but little is known about their amino acid profiles. This underlinesthe great efforts being made to have a similar protein content to animal counterparts,
69
Foods 2022, 11, 161
which is usually known as a limitation of vegan products, including meat and dairyalternatives [41,43]. Vegetable proteins are the most used sources for compensating theprotein content reduced by egg removal. It is well-known that animal proteins have acomplete composition of essential amino acids and high digestibility compared to plant-based products [33]. It will be of interest to investigate such parameters in vegan productsto address it in future product development projects.
Sodium was found to be higher in vegan eggs compared to regular eggs, egg yolks,and egg whites. A lower amount of sodium was previously reported in whole eggs(142 mg per 100 g of whole egg) [91]. This can be attributed to the increase of yolk-to-egg-white ratio [3,91]. Vitamin B12 is a big limitation in vegan eggs compared to whole eggs. Forthese reasons, fortifying vegan egg products with bioavailable forms of these micronutrientsis required [93]. However, the nutritional facts of commercial yolks and whites did notpresent the amounts of B12, since it is not mandatory information. Surprisingly, calciumwas found the highest in vegan eggs, showing the direction in new product developmentfocusing on upgrading the nutritional value of vegan products.
5. Main Food Applications of Vegan Eggs
5.1. Egg-Free and Egg-Reduced Mayonnaise
Mayonnaise is one of the most popular condiments worldwide, providing a creamytexture and special flavor [94]. Mayonnaise is a colloidal system (oil-in-water emulsion)made from vegetable oil (70–80%), egg yolk, vinegar, salt, and spices [95]. Egg yolk is akey ingredient for emulsion stability due to its high emulsifying capacity attributed to thephospholipids and lipoproteins (high-density lipoprotein and low-density lipoprotein),and non-bonded proteins (phosvitin and livetin) [96]. Egg yolk also provides formingproperties and prevents flocculation to ensure an appropriate texture of mayonnaise [1,97].Nevertheless, the use of raw eggs in mayonnaise might present some inconveniences, suchas possible contamination with Salmonella sp., and high cholesterol content [98]. As analternative, egg-free mayonnaise is gaining traction as a healthier option for consumers,and is suitable for vegan customers, as well as being more cost-effective (no pasteurizationis required). Several vegan eggs were used in single and combined forms to mimic thequality, taste, and color of conventional mayonnaise [98].
Vegetable protein isolates deriving from soy, pea, lentil, and rapeseed have been con-sidered as suitable egg alternatives [33,99,100]. Egg-free mayonnaise designed using 6% soyprotein concentrate (as an emulsifier to replace egg yolk) was accepted by consumers [101].A mayonnaise was made with a 10% substitution level of eggs, using a vegan egg made bya combination of soy milk and a blend of 6.7% mono- and di-glycerides, 36.7% guar gum,and 56.7% xanthan gum. This low substitution level produced a low cholesterol-low fatmayonnaise with improved properties (i.e., the stability, heat stability, consistency coeffi-cient, viscosity, firmness, adhesiveness, adhesive force, and overall acceptance) [102]. Eggswere replaced with soy milk at levels of 25, 50, 75, and 100%. Results showed that up toa 75% egg substitution level, viscosity was not affected, whereas stability was decreased.The sensory acceptability of the products was not impacted until 50% substitution level.This suggests that soy milk can be a good candidate to partially substitute egg (up to 50%)without hampering product viscosity and taste [103]. Nevertheless, combining soy milkwith different hydrocolloids (i.e., xanthan gum and zodo gum) increased in the apparentviscosity, the consistency coefficient, and the firmness/emulsion stability of the mayonnaise,whereas the mayonnaise flow index was reduced. The optimal formulation of vegan eggswas 0.25% xanthan gum, 3.84% zodo gum, 37.50% oil, and 63.61% soy milk [104]. Egg yolkreplaced with sesame-peanut meal milk decreased product quality, including pH, color,thermal stability, and acidity, with increasing substitution levels (0, 25, 50, 75, and 100%).Mayonnaise made with vegan eggs at 50% had desirable physical and thermal stability,and reduced cholesterol content [105].
Raikos et al. [106] reported that the use of liquid aquafaba (up to 70%) was capableof forming a stable emulsion resulting in mayonnaise with a desirable consistency and
70
Foods 2022, 11, 161
unaffected oxidative stability during storage. Using dry aquafaba resulted in a high stablemayonnaise for 28 days of storage at 4 ◦C. These results suggest that the use of dry aquafabacan be the solution to overcome standardization issues of aquafaba, and can be effectivelyused in mayonnaise manufacturing [75].
Starches were also used as ingredients to replace egg yolk in mayonnaise formulation,owing to their thickening properties. Native starches were found undesirable due totheir unfavorable effect on the texture and flavor. Modified starches, such as octenylsuccinic anhydride-modified potato starch, showed better emulsification properties whenpartially replacing eggs (0, 25, 50, 75, and 100%). Products made with 75% octenyl succinicanhydride-modified potato starch resulted in high emulsion stability even after two monthsof storage, and it also reduced cholesterol content, improved oil droplets particle size(maximum at 70 μm), and resulted in a consistent texture with no agglomerates. This isdue to the formation of a stable cohesive layer of starch surrounding the oil droplets [97].Mayonnaises were prepared with 35% freeze-dried chia mucilage instead of egg yolk dueto their emulsification properties [107,108]. The resulting mayonnaise had similar stabilityand texture parameters, as well as sensory acceptance, to the control mayonnaise [109].
Several thickeners, such as gums (xanthan and guar gums, and Arabic gum), werealso used for egg reduction, or complete removal, due to their emulsifying ability andstability [110]. Durian seed gum used at a level of 4% resulted in vegan mayonnaisewith textural and sensory properties comparable to egg-based products [111]. As such,this substitution was able to generate a stable emulsion, and to prevent coalescence andflocculation for prolonged periods of storage (up to 5 months). Arabic gum may haveinhibitory effects towards lipid oxidation and microbial contamination, owing to its highantioxidant activity [98]. Overall, these hydrocolloids improve emulsification, antibacterialactivity, and sensory quality of the final product [110], whereas guar gum and/or xanthanare considered additives that are not fully appreciated by consumers seeking “clean”labels [94].
Algal ingredients, such as Chlorella vulgaris, were also used in partially substituted yolkin combination with acid casein curd. A mix of Chlorella vulgaris (10 and 15%) and caseincurd (90 and 95%) improved the nutritional value, rheological properties, and sensoryscores of mayonnaise at 25 and 50% of egg replacement [112].
5.2. Egg-Free and Egg-Reduced Bakery Products
Egg exclusion or reduction comes in the optic to promote the healthiness of egg-freeand/or cholesterol-free bakery products. The total substitution of eggs by lupine proteinisolates resulted in the collapse of the cakes. This can be explained by the lower functionalproperties compared to egg [54]. Thus, besides lupine isolates, soy lecithin, mono- anddiglycerides, and xanthan gum were used as vegan egg substitutes. The resulting cakes hadan improved structure of crumb, reduced shrinkage, and led to high height [113]. Likewise,a blend of soy protein isolate and 1% mono- and di-glycerides produced an egg-free cakewith similar specific volume and gravity, firmness, and moisture content compared withegg-containing cakes [114]. Similarly, the use of only soymilk to replace eggs resultedin a batter with low density and viscosity, resulting in a firm, dark, and compact cake,whereas combining soymilk and soy lecithin improved the quality of egg-free cakes [115].In another study, egg-free and egg-less cakes were successfully produced by replacingeggs with a mix of lupine protein, whey proteins, and soy lecithin [116]. The completesubstitution of egg whites by Chlorella vulgaris decreased the consistency of the batter,which imparted the cake with low specific volume, and a high weight loss and hardness.Nevertheless, a partial substitution level (25%) did not affect the taste, color, odor, texture,and overall acceptability compared to the conventional preparation [117]. Aquafaba-basedcakes resulted in a similar color and texture, as well sensory acceptability compared toegg-white-based cakes. This is due to the good foaming and emulsifying properties ofaquafaba [38,70,71]. The main defect of these eggless cakes is their low springiness and
71
Foods 2022, 11, 161
cohesiveness [74]. A potential approach might be adding other ingredients together withaquafaba to overcome this defect.
Egg-free and egg-reduced cakes were also produced through the complete use ofhydrocolloids, such as hydroxypropyl methylcellulose in combination with sodium stearoyllactylate [118,119]. Depending on the level of substitution and the type of additives, cakeattributes, including color, texture, and volume, significantly changed, but in some cases,such changes were not perceived at the sensory level [115]. Nevertheless, this type ofsubstitution is decreasingly desired due to the market shift towards natural ingredients.
6. Conclusions
The market of vegan eggs is steadily growing as healthier, more sustainable, andethical alternatives to regular eggs. Affordable and available ingredients are requiredto develop cost-effective vegan eggs. Although there is plenty of ingredients that canmimic the functionality of eggs, the nutritional value of vegan eggs must be carefullyconsidered. Protein rich ingredients and vitamin/minerals fortification(s) are requiredto avoid nutritional deficiencies, especially in the case of vegan consumers. Natural andclean label ingredients are becoming a must by health-conscious consumers. There isno vegan egg fitting all food formulations. Therefore, the selection of egg replacementsneeds to be made based on the functionality required for each food product. At present,the market for vegan eggs is still a new commodity where clear regulation is required toorganize the sector. Furthermore, in-depth market studies are required to capture thisemerging market’s challenges and opportunities. Qualitative and quantitative surveysconsidering different countries, continents, gender, age, education level, and income are forinterest to understand consumers’ behaviors toward such a new market. Consumer studiesare needed to evaluate the sensorial properties of vegan eggs (different formulations) incomparison to regular eggs to provide a further understanding of the preferences andacceptability of consumers.
Author Contributions: Conceptualization, F.B. and M.G.; investigation, F.B. and M.G.; resources,F.B. and M.G.; writing—review and editing, F.B. and M.G. All authors have read and agreed to thepublished version of the manuscript.
Funding: This work was supported by CERCA Programme (Generalitat de Catalunya).
Institutional Review Board Statement: Not applicable.
Informed Consent Statement: Not applicable.
Data Availability Statement: Not applicable.
Conflicts of Interest: The authors declare no conflict of interest.
References
1. Mirzanajafi-Zanjani, M.; Yousefi, M.; Ehsani, A. Challenges and approaches for production of a healthy and functional mayonnaisesauce. Food Sci. Nutr. 2019, 7, 2471–2484. [CrossRef] [PubMed]
2. Bhat, Z.F.; Morton, J.D.; Bekhit, A.E.D.A.; Kumar, S.; Bhat, H.F. Effect of processing technologies on the digestibility of eggproteins. Compr. Rev. Food Sci. Food Saf. 2021, 20, 4703–4738. [CrossRef]
3. Réhault-Godbert, S.; Guyot, N.; Nys, Y. The golden egg: Nutritional value, bioactivities, and emerging benefits for human health.Nutrients 2019, 11, 684. [CrossRef]
4. Maeta, A.; Matsushima, M.; Katahira, R.; Sakamoto, N.; Takahashi, K. Diets Supplemented with 1% Egg White Induce OralDesensitization and Immune Tolerance in an Egg White-Specific Allergic Mouse Model. Int. Arch. Allergy Immunol. 2018, 176,205–214. [CrossRef] [PubMed]
5. Drouin-Chartier, J.P.; Chen, S.; Li, Y.; Schwab, A.L.; Stampfer, M.J.; Sacks, F.M.; Rosner, B.; Willett, W.C.; Hu, F.B.; Bhupathiraju,S.N. Egg consumption and risk of cardiovascular disease: Three large prospective US cohort studies, systematic review, andupdated meta-analysis. BMJ 2020, 368, 1986–2012. [CrossRef]
6. Xia, P.F.; Pan, X.F.; Chen, C.; Wang, Y.; Ye, Y.; Pan, A. Dietary intakes of eggs and cholesterol in relation to all-cause and heartdisease mortality: A prospective cohort study. J. Am. Heart Assoc. 2020, 9, 15743. [CrossRef]
72
Foods 2022, 11, 161
7. Zhuang, P.; Wu, F.; Mao, L.; Zhu, F.; Zhang, Y.; Chen, X.; Jiao, J.; Zhang, Y. Egg and cholesterol consumption and mortalityfrom cardiovascular and different causes in the United States: A population-based cohort study. PLoS Med. 2021, 18, e1003508.[CrossRef] [PubMed]
8. FAO. The Future of Food and Agriculture; FAO: Rome, Italy, 2017.9. Hafez, H.M.; Attia, Y.A. Challenges to the Poultry Industry: Current Perspectives and Strategic Future After the COVID-19
Outbreak. Front. Vet. Sci. 2020, 7, 516. [CrossRef]10. Sanchez-Sabate, R.; Sabaté, J. Consumer attitudes towards environmental concerns of meat consumption: A systematic review.
Int. J. Environ. Res. Public Health 2019, 16, 1220. [CrossRef]11. Kopplin, C.S.; Rausch, T.M. Above and beyond meat: The role of consumers’ dietary behavior for the purchase of plant-based
food substitutes. Rev. Manag. Sci. 2021, 1–30. [CrossRef]12. Al Sattar, A.; Mahmud, R.; Mohsin, M.A.S.; Chisty, N.N.; Uddin, M.H.; Irin, N.; Barnett, T.; Fournie, G.; Houghton, E.; Hoque,
M.A. COVID-19 Impact on Poultry Production and Distribution Networks in Bangladesh. Front. Sustain. Food Syst. 2021, 5, 306.[CrossRef]
13. Whiley, H.; Ross, K. Salmonella and Eggs: From Production to Plate. Int. J. Environ. Res. Public Health 2015, 12, 2543. [CrossRef][PubMed]
14. Reich, H.; Triacchini, G.A. Occurrence of residues of fipronil and other acaricides in chicken eggs and poultry muscle/fat. EFSA J.2018, 16, e05164. [CrossRef]
15. Mund, M.D.; Khan, U.H.; Tahir, U.; Mustafa, B.E.; Fayyaz, A. Antimicrobial drug residues in poultry products and implicationson public health: A review. Int. J. Food Prop. 2016, 20, 1433–1446. [CrossRef]
16. Kang, J.; Hossain, M.A.; Park, H.C.; Jeong, O.M.; Park, S.W.; Her, M. Cross-Contamination of Enrofloxacin in Veterinary Medicinaland Nutritional Products in Korea. Antibiotics 2021, 10, 128. [CrossRef] [PubMed]
17. Dang, T.D.; Peters, R.L.; Koplin, J.J.; Dharmage, S.C.; Gurrin, L.C.; Ponsonby, A.-L.; Martino, D.J.; Neeland, M.; Tang, M.L.K.;Allen, K.J.; et al. Egg allergen specific IgE diversity predicts resolution of egg allergy in the population cohort HealthNuts. Allergy2019, 74, 318–326. [CrossRef]
18. Sabouraud, M.; Biermé, P.; Andre-Gomez, S.A.; Villard-Truc, F.; Corréard, A.K.; Garnier, L.; Payot, F.; Braun, C. Oral immunother-apy in food allergies: A practical update for pediatricians. Arch. Pediatr. 2021, 28, 319–324. [CrossRef]
19. Mills, E.N.C. Allergies: Public Health: From Encyclopedia Food and Health; Elsevier Ltd.: Amsterdam, The Netherlands, 2016;pp. 115–121. [CrossRef]
20. Sakai, S.; Adachi, R.; Teshima, R. Detection and control of eggs as a food allergen. Handb. Food Allerg. Detect. Control 2015, 313–340.[CrossRef]
21. Uneoka, K.; Horino, S.; Ozaki, A.; Aki, H.; Toda, M.; Miura, K. Differences in allergic symptoms after the consumption of egg yolkand egg white. Allergy Asthma. Clin. Immunol. 2021, 17, 97. [CrossRef]
22. Ngai, N.A.; Leung, A.S.Y.; Leung, J.C.H.; Chan, O.M.; Leung, T.F. Identification of predictors for persistence of immediate-typeegg allergy in Chinese children. Asia Pac. Allergy 2021, 11, e41. [CrossRef]
23. Murai, H.; Irahara, M.; Sugimoto, M.; Takaoka, Y.; Takahashi, K.; Wada, T.; Yamamoto-Hanada, K.; Okafuji, I.; Yamada, Y.;Futamura, M.; et al. Is oral food challenge useful to avoid complete elimination in Japanese patients diagnosed with or suspectedof having IgE-dependent hen’s egg allergy? A systematic review. Allergol. Int. 2021, in press. [CrossRef]
24. Han, P.; Gu, J.Q.; Li, L.S.; Wang, X.Y.; Wang, H.T.; Wang, Y.; Chang, C.; Sun, J.L. The Association Between Intestinal Bacteria andAllergic Diseases—Cause or Consequence? Front. Cell. Infect. Microbiol. 2021, 11, 284. [CrossRef]
25. Ma, X.; Liang, R.; Xing, Q.; Lozano-Ojalvo, D. Can food processing produce hypoallergenic egg? J. Food Sci. 2020, 85, 2635–2644.[CrossRef]
26. Tong, P.; Chen, S.; Gao, J.; Li, X.; Wu, Z.; Yang, A.; Yuan, J.; Chen, H. Caffeic acid-assisted cross-linking catalyzed by polyphenoloxidase decreases the allergenicity of ovalbumin in a Balb/c mouse model. Food Chem. Toxicol. 2018, 111, 275–283. [CrossRef][PubMed]
27. Puertas, G.; Vázquez, M. Advances in techniques for reducing cholesterol in egg yolk: A review. Crit. Rev. Food Sci. Nutr. 2019, 59,2276–2286. [CrossRef] [PubMed]
28. Gardner, F.A.; Beck, M.L.; Denton, J.H. Functional Quality Comparison of Whole Egg and Selected Egg Substitute Products. Poult.Sci. 1982, 61, 75–78. [CrossRef]
29. Childs, M.T.; Ostrander, J. Egg substitutes: Chemical and biologic evaluations. J. Am. Diet. Assoc. 1976, 68, 229–234. [CrossRef]30. Mohamed, S.; Lajis, S.M.M.; Hamid, N.A. Effects of protein from different sources on the characteristics of sponge cakes, rice
cakes (apam), doughnuts and frying batters. J. Sci. Food Agric. 1995, 68, 271–277. [CrossRef]31. Myhara, R.M.; Kruger, G. The performance of decolorized bovine plasma protein as a replacement for egg white in high ratio
white cakes. Food Qual. Prefer. 1998, 9, 135–138. [CrossRef]32. Paraskevopoulou, A.; Donsouzi, S.; Nikiforidis, C.V.; Kiosseoglou, V. Quality characteristics of egg-reduced pound cakes following
WPI and emulsifier incorporation. Food Res. Int. 2015, 69, 72–79. [CrossRef]33. Boukid, F.; Rosell, C.M.; Rosene, S.; Bover-Cid, S.; Castellari, M. Non-animal proteins as cutting-edge ingredients to reformulate
animal-free foodstuffs: Present status and future perspectives. Crit. Rev. Food Sci. Nutr. 2021, 137, 1–31. [CrossRef] [PubMed]34. Fehér, A.; Gazdecki, M.; Véha, M.; Szakály, M.; Szakály, Z. A comprehensive review of the benefits of and the barriers to the
switch to a plant-based diet. Sustainability 2020, 12, 4136. [CrossRef]
73
Foods 2022, 11, 161
35. Di Renzo, L.; Gualtieri, P.; Pivari, F.; Soldati, L.; Attinà, A.; Cinelli, G.; Leggeri, C.; Caparello, G.; Barrea, L.; Scerbo, F.; et al. Eatinghabits and lifestyle changes during COVID-19 lockdown: An Italian survey. J. Transl. Med. 2020, 18, 229. [CrossRef]
36. GlobeNewsWire Global Egg Market Forecasts 2020–2030: COVID-19 Impact and Recovery. Available online: https://www.globenewswire.com/news-release/2020/05/08/2030249/0/en/Global-Egg-Market-Forecasts-2020-2030-COVID-19-Impact-and-Recovery.html (accessed on 21 November 2021).
37. Marchant-Forde, J.N.; Boyle, L.A. COVID-19 Effects on Livestock Production: A One Welfare Issue. Front. Vet. Sci. 2020, 7, 625372.[CrossRef]
38. Buhl, T.F.; Christensen, C.H.; Hammershøj, M. Aquafaba as an egg white substitute in food foams and emulsions: Proteincomposition and functional behavior. Food Hydrocoll. 2019, 96, 354–364. [CrossRef]
39. FACTMR Vegan Egg Market Size, Share, Trends & Forecast, 2021–2031. Available online: https://www.factmr.com/report/vegan-eggs-market (accessed on 21 November 2021).
40. Mintel Mintel Global New Product Database. Available online: https://www.gnpd.com/sinatra/search_results/?search_id=3tMdwh5e47&page=0 (accessed on 1 October 2021).
41. Boukid, F.; Castellari, M. Veggie burgers in the EU market: A nutritional challenge? Eur. Food Res. Technol. 2021, 247, 2445–2453.[CrossRef]
42. Boukid, F. Plant-based meat analogues: From niche to mainstream. Eur. Food Res. Technol. 2020, 247, 297–308. [CrossRef]43. Boukid, F.; Lamri, M.; Dar, B.N.; Garron, M.; Castellari, M. Vegan Alternatives to Processed Cheese and Yogurt Launched in the
European Market during 2020: A Nutritional Challenge? Foods 2021, 10, 2782. [CrossRef]44. Lentz, G.; Connelly, S.; Mirosa, M.; Jowett, T. Gauging attitudes and behaviours: Meat consumption and potential reduction.
Appetite 2018, 127, 230–241. [CrossRef]45. Román, S.; Sánchez-Siles, L.M.; Siegrist, M. The importance of food naturalness for consumers: Results of a systematic review.
Trends Food Sci. Technol. 2017, 67, 44–57. [CrossRef]46. Janssen, M. Determinants of organic food purchases: Evidence from household panel data. Food Qual. Prefer. 2018, 68, 19–28.
[CrossRef]47. Alcorta, A.; Porta, A.; Tárrega, A.; Alvarez, M.D.; Vaquero, M.P. Foods for Plant-Based Diets: Challenges and Innovations. Foods
2021, 10, 293. [CrossRef] [PubMed]48. Rondoni, A.; Millan, E.; Asioli, D. Plant-based Eggs: Views of Industry Practitioners and Experts. J. Int. Food Agribus. Mark. 2021,
1–24. [CrossRef]49. Rondoni, A.; Millan, E.; Asioli, D. Consumers’ preferences for intrinsic and extrinsic product attributes of plant-based eggs: An
exploratory study in the United Kingdom and Italy. Br. Food J. 2021, 123, 3704–3725. [CrossRef]50. FutureMarketInsights Egg Replacement Ingredient Market Analysis and Review 2019–2026|Future Market Insights (FMI). Avail-
able online: https://www.futuremarketinsights.com/reports/egg-replacement-ingredient-market (accessed on 26 October 2021).51. Mintel How Plant-Based Eggs will Crack into Mainstream Food—Mintel. Available online: https://clients.mintel.com/
insight/how-plant-based-eggs-will-crack-into-mainstream-food?fromSearch=%3Ffreetext%3Dvegan%2520egg (accessed on28 October 2021).
52. Boukid, F.; Zannini, E.; Carini, E.; Vittadini, E. Pulses for bread fortification: A necessity or a choice? Trends Food Sci. Technol. 2019,88, 416–428. [CrossRef]
53. Boukid, F.; Rosell, C.M.; Castellari, M. Pea protein ingredients: A mainstream ingredient to (re)formulate innovative foods andbeverages. Trends Food Sci. Technol. 2021, 110, 729–742. [CrossRef]
54. Boukid, F.; Pasqualone, A. Lupine (Lupinus spp.) proteins: Characteristics, safety and food applications. Eur. Food Res. Technol.2021, 1, 3. [CrossRef]
55. Boukid, F. Chickpea (Cicer arietinum L.) protein as a prospective plant-based ingredient: A review. Int. J. Food Sci. Technol. 2021,56, 5435–5444. [CrossRef]
56. Ladjal-Ettoumi, Y.; Boudries, H.; Chibane, M.; Romero, A. Pea, Chickpea and Lentil Protein Isolates: Physicochemical Characteri-zation and Emulsifying Properties. Food Biophys. 2016, 11, 43–51. [CrossRef]
57. Rachwa-Rosiak, D.; Nebesny, E.; Budryn, G. Chickpeas—Composition, Nutritional Value, Health Benefits, Application to Breadand Snacks: A Review. Crit. Rev. Food Sci. Nutr. 2015, 55, 1137–1145. [CrossRef] [PubMed]
58. Moreno, H.M.; Herranz, B.; Borderías, A.J.; Tovar, C.A. Effect of high pressure treatment on the structural, mechanical andrheological properties of glucomannan gels. Food Hydrocoll. 2016, 60, 437–444. [CrossRef]
59. Gharibzahedi, S.M.T.; Roohinejad, S.; George, S.; Barba, F.J.; Greiner, R.; Barbosa-Cánovas, G.V.; Mallikarjunan, K. Innovativefood processing technologies on the transglutaminase functionality in protein-based food products: Trends, opportunities anddrawbacks. Trends Food Sci. Technol. 2018, 75, 194–205. [CrossRef]
60. Cai, Q.; Zhang, W.J.; Zhu, Q.Q.; Chen, Q. Influence of heat treatment on the structure and core IgE-binding epitopes of rAra h2.02. Food Chem. 2016, 202, 404–408. [CrossRef]
61. Ma, Z.; Boye, J.I.; Hu, X. Nutritional quality and techno-functional changes in raw, germinated and fermented yellow field pea(Pisum sativum L.) upon pasteurization. LWT-Food Sci. Technol. 2018, 92, 147–154. [CrossRef]
62. Damian, J.J.; Huo, S.; Serventi, L. Phytochemical content and emulsifying ability of pulses cooking water. Eur. Food Res. Technol.2018, 244, 1647–1655. [CrossRef]
74
Foods 2022, 11, 161
63. Fischer, E.; Cachon, R.; Cayot, N. Pisum sativum vs Glycine max, a comparative review of nutritional, physicochemical, andsensory properties for food uses. Trends Food Sci. Technol. 2020, 95, 196–204. [CrossRef]
64. Trikusuma, M.; Paravisini, L.; Peterson, D.G. Identification of aroma compounds in pea protein UHT beverages. Food Chem. 2020,312, 126082. [CrossRef] [PubMed]
65. Ali, R.; Saeed, S.M.G.; Ali, S.A.; Sayed, S.A.; Ahmed, R.; Mobin, L. Effect of black gram flour as egg replacer on microstructure ofbiscuit dough and its impact on edible qualities. J. Food Meas. Charact. 2018, 12, 1641–1647. [CrossRef]
66. Martinez, M.M.; Boukid, F. Future-Proofing Dietary Pea Starch. ACS Food Sci. Technol. 2021, 1, 1371–1372. [CrossRef]67. Ashogbon, A.O.; Akintayo, E.T.; Oladebeye, A.O.; Oluwafemi, A.D.; Akinsola, A.F.; Imanah, O.E. Developments in the isolation,
composition, and physicochemical properties of legume starches. Crit. Rev. Food Sci. Nutr. 2021, 61, 2938–2959. [CrossRef]68. Dong, H.; Vasanthan, T. Amylase resistance of corn, faba bean, and field pea starches as influenced by three different phosphory-
lation (cross-linking) techniques. Food Hydrocoll. 2020, 101, 105506. [CrossRef]69. Yildiz, G.; Ding, J.; Andrade, J.; Engeseth, N.J.; Feng, H. Effect of plant protein-polysaccharide complexes produced by mano-
thermo-sonication and pH-shifting on the structure and stability of oil-in-water emulsions. Innov. Food Sci. Emerg. Technol. 2018,47, 317–325. [CrossRef]
70. Saget, S.; Costa, M.; Styles, D.; Williams, M. Does Circular Reuse of Chickpea Cooking Water to Produce Vegan MayonnaiseReduce Environmental Impact Compared with Egg Mayonnaise? Sustainability 2021, 13, 4726. [CrossRef]
71. Yazici, G.N.; Ozer, M.S. A review of egg replacement in cake production: Effects on batter and cake properties. Trends Food Sci.Technol. 2021, 111, 346–359. [CrossRef]
72. Serventi, L. Upcycling Legume Water: From Wastewater to Food Ingredients; Springer Nature: Berlin/Heidelberg, Germany, 2020; pp.1–174. [CrossRef]
73. Stantiall, S.E.; Dale, K.J.; Calizo, F.S.; Serventi, L. Application of pulses cooking water as functional ingredients: The foaming andgelling abilities. Eur. Food Res. Technol. 2018, 244, 97–104. [CrossRef]
74. Mustafa, R.; He, Y.; Shim, Y.Y.; Reaney, M.J.T. Aquafaba, wastewater from chickpea canning, functions as an egg replacer insponge cake. Int. J. Food Sci. Technol. 2018, 53, 2247–2255. [CrossRef]
75. He, Y.; Purdy, S.K.; Tse, T.J.; Tar’an, B.; Meda, V.; Reaney, M.J.T.; Mustafa, R. Standardization of Aquafaba Production andApplication in Vegan Mayonnaise Analogs. Foods 2021, 10, 1978. [CrossRef]
76. Shim, Y.Y.; Mustafa, R.; Shen, J.; Ratanapariyanuch, K.; Reaney, M.J.T. Composition and properties of aquafaba: Water recoveredfrom commercially canned chickpeas. J. Vis. Exp. 2018, 132, e56305. [CrossRef]
77. Hedayatnia, S.; Tan, C.P.; Joanne Kam, W.L.; Tan, T.B.; Mirhosseini, H. Modification of physicochemical and mechanical propertiesof a new bio-based gelatin composite films through composition adjustment and instantizing process. LWT 2019, 116, 108575.[CrossRef]
78. Larrosa, V.; Lorenzo, G.; Zaritzky, N.; Califano, A. Dynamic rheological analysis of gluten-free pasta as affected by compositionand cooking time. J. Food Eng. 2015, 160, 11–18. [CrossRef]
79. Varela, M.S.; Navarro, A.S.; Yamul, D.K. Effect of hydrocolloids on the properties of wheat/potato starch mixtures. Starch/Staerke2016, 68, 753–761. [CrossRef]
80. Li, H.; Zhu, K.; Zhou, H.; Peng, W.; Guo, X. Comparative study of four physical approaches about allergenicity of soybean proteinisolate for infant formula. Food Agric. Immunol. 2016, 27, 604–623. [CrossRef]
81. Lam, A.C.Y.; Can Karaca, A.; Tyler, R.T.; Nickerson, M.T. Pea protein isolates: Structure, extraction, and functionality. Food Rev.Int. 2018, 34, 126–147. [CrossRef]
82. Boukid, F. Oat proteins as emerging ingredients for food formulation: Where we stand? Eur. Food Res. Technol. 2021, 247, 535–544.[CrossRef]
83. Yi-Shen, Z.; Shuai, S.; Fitzgerald, R. Mung bean proteins and peptides: Nutritional, functional and bioactive properties. Food Nutr.Res. 2018, 62, 1–11. [CrossRef]
84. Jeske, S.; Bez, J.; Arendt, E.K.; Zannini, E. Formation, stability, and sensory characteristics of a lentil-based milk substitute asaffected by homogenisation and pasteurisation. Eur. Food Res. Technol. 2019, 245, 1519–1531. [CrossRef]
85. Boukid, F.; Castellari, M. Food and Beverages Containing Algae and Derived Ingredients Launched in the Market from 2015 to2019: A Front-of-Pack Labeling Perspective with a Special Focus on Spain. Foods 2021, 10, 173. [CrossRef]
86. Lafarga, T.; Acién-Fernández, F.G.; Garcia-Vaquero, M. Bioactive peptides and carbohydrates from seaweed for food applications:Natural occurrence, isolation, purification, and identification. Algal Res. 2020, 48, 101909. [CrossRef]
87. Edelmann, M.; Aalto, S.; Chamlagain, B.; Kariluoto, S.; Piironen, V. Riboflavin, niacin, folate and vitamin B12 in commercialmicroalgae powders. J. Food Compos. Anal. 2019, 82, 103226. [CrossRef]
88. Ahmmed, M.K.; Ahmmed, F.; Tian, H.; Carne, A.; Bekhit, A.E.D. Marine omega-3 (n-3) phospholipids: A comprehensive reviewof their properties, sources, bioavailability, and relation to brain health. Compr. Rev. Food Sci. Food Saf. 2020, 19, 64–123. [CrossRef]
89. Ferreira, G.F.; Pessoa, J.G.B.; Ríos Pinto, L.F.; Maciel Filho, R.; Fregolente, L.V. Mono- and diglyceride production from microalgae:Challenges and prospects of high-value emulsifiers. Trends Food Sci. Technol. 2021, 118, 589–600. [CrossRef]
90. Ismail, B.P.; Senaratne-Lenagala, L.; Stube, A.; Brackenridge, A. Protein demand: Review of plant and animal proteins used inalternative protein product development and production. Anim. Front. Rev. Mag. Anim. Agric. 2020, 10, 53. [CrossRef] [PubMed]
91. Kuang, H.; Yang, F.; Zhang, Y.; Wang, T.; Chen, G. The Impact of Egg Nutrient Composition and Its Consumption on CholesterolHomeostasis. Cholesterol 2018, 2018, 6303810. [CrossRef]
75
Foods 2022, 11, 161
92. Miranda, J.M.; Anton, X.; Redondo-Valbuena, C.; Roca-Saavedra, P.; Rodriguez, J.A.; Lamas, A.; Franco, C.M.; Cepeda, A. Eggand egg-derived foods: Effects on human health and use as functional foods. Nutrients 2015, 7, 706–729. [CrossRef] [PubMed]
93. McClements, D.J.; Grossmann, L. A brief review of the science behind the design of healthy and sustainable plant-based foods.npj Sci. Food 2021, 5, 17. [CrossRef]
94. Carcelli, A.; Crisafulli, G.; Carini, E.; Vittadini, E. Can a physically modified corn flour be used as fat replacer in a mayonnaise?Eur. Food Res. Technol. 2020, 246, 2493–2503. [CrossRef]
95. Sun, C.; Liu, R.; Liang, B.; Wu, T.; Sui, W.; Zhang, M. Microparticulated whey protein-pectin complex: A texture-controllable gelfor low-fat mayonnaise. Food Res. Int. 2018, 108, 151–160. [CrossRef] [PubMed]
96. Villarreal, M.B.; Gallardo Rivera, C.T.; Márquez, E.G.; Rodríguez, J.R.; González, M.A.N.; Montes, A.C.; Báez González, J.G.Comparative Reduction of Egg Yolk Cholesterol Using Anionic Chelating Agents. Molecules 2018, 23, 3204. [CrossRef]
97. Ghazaei, S.; Mizani, M.; Piravi-Vanak, Z.; Alimi, M. Particle size and cholesterol content of a mayonnaise formulated byOSA-modified potato starch. Food Sci. Technol. 2015, 35, 150–156. [CrossRef]
98. Ali, M.R.; EL Said, R.M. Assessment of the potential of Arabic gum as an antimicrobial and antioxidant agent in developingvegan “egg-free” mayonnaise. J. Food Saf. 2020, 40, 40. [CrossRef]
99. Sridharan, S.; Meinders, M.B.J.; Bitter, J.H.; Nikiforidis, C.V. Pea flour as stabilizer of oil-in-water emulsions: Protein purificationunnecessary. Food Hydrocoll. 2020, 101, 105533. [CrossRef]
100. Yerramilli, M.; Longmore, N.; Ghosh, S. Improved stabilization of nanoemulsions by partial replacement of sodium caseinatewith pea protein isolate. Food Hydrocoll. 2017, 64, 99–111. [CrossRef]
101. Garcia, K.; Sriwattana, S.; No, H.K.; Corredor, J.A.H.; Prinyawiwatkul, W. Sensory optimization of a mayonnaise-type spreadmade with rice bran oil and soy protein. J. Food Sci. 2009, 74, S248–S254. [CrossRef] [PubMed]
102. Nikzade, V.; Tehrani, M.M.; Saadatmand-Tarzjan, M. Optimization of low-cholesterol-low-fat mayonnaise formulation: Effect ofusing soy milk and some stabilizer by a mixture design approach. Food Hydrocoll. 2012, 28, 344–352. [CrossRef]
103. Rahmati, K.; Mazaheri Tehrani, M.; Daneshvar, K. Soy milk as an emulsifier in mayonnaise: Physico-chemical, stability andsensory evaluation. J. Food Sci. Technol. 2014, 51, 3341–3347. [CrossRef]
104. Mozafari, H.R.; Hosseini, E.; Hojjatoleslamy, M.; Mohebbi, G.H.; Jannati, N. Optimization low-fat and low cholesterol mayonnaiseproduction by central composite design. J. Food Sci. Technol. 2017, 54, 591. [CrossRef]
105. Karshenas, M.; Goli, M.; Zamindar, N. The effect of replacing egg yolk with sesame–peanut defatted meal milk on the physico-chemical, colorimetry, and rheological properties of low-cholesterol mayonnaise. Food Sci. Nutr. 2018, 6, 824. [CrossRef]
106. Raikos, V.; Hayes, H.; Ni, H. Aquafaba from commercially canned chickpeas as potential egg replacer for the development ofvegan mayonnaise: Recipe optimisation and storage stability. Int. J. Food Sci. Technol. 2020, 55, 1935–1942. [CrossRef]
107. Timilsena, Y.P.; Adhikari, R.; Barrow, C.J.; Adhikari, B. Physicochemical and functional properties of protein isolate producedfrom Australian chia seeds. Food Chem. 2016, 212, 648–656. [CrossRef] [PubMed]
108. Timilsena, Y.P.; Wang, B.; Adhikari, R.; Adhikari, B. Preparation and characterization of chia seed protein isolate-chia seed gumcomplex coacervates. Food Hydrocoll. 2015, 52, 554–563. [CrossRef]
109. Fernandes, S.S.; Mellado, M.D.L.M.S. Development of Mayonnaise with Substitution of Oil or Egg Yolk by the Addition of Chia(Salvia Hispânica L.) Mucilage. J. Food Sci. 2018, 83, 74–83. [CrossRef]
110. Hashemi, M.M.; Aminlari, M.; Forouzan, M.M.; Moghimi, E.; Tavana, M.; Shekarforoush, S.; Mohammadifar, M.A. Productionand Application of lysozyme-Gum Arabic Conjugate in Mayonnaise as a natural Preservative and Emulsifier. Pol. J. Food Nutr.Sci. 2018, 68, 33–43. [CrossRef]
111. Cornelia, M.; Siratantri, T.; Prawita, R. The Utilization of Extract Durian (Durio zibethinus L.) Seed Gum as an Emulsifier in VeganMayonnaise. Procedia Food Sci. 2015, 3, 1–18. [CrossRef]
112. El-Razik, M.A.; Mohamed, A. Utilization of Acid Casein Curd Enriched with Chlorella vulgaris Biomass as Substitute of Egg inMayonnaise Production. World Appl. Sci. J. 2013, 26, 917–925. [CrossRef]
113. Arozarena, I.; Bertholo, H.; Empis, J.; Bunger, A.; de Sousa, I. Study of the total replacement of egg by white lupine protein,emulsifiers and xanthan gum in yellow cakes. Eur. Food Res. Technol. 2014, 213, 312–316. [CrossRef]
114. Lin, M.; Tay, S.H.; Yang, H.; Yang, B.; Li, H. Replacement of eggs with soybean protein isolates and polysaccharides to prepareyellow cakes suitable for vegetarians. Food Chem. 2017, 229, 663–673. [CrossRef] [PubMed]
115. Hedayati, S.; Mazaheri Tehrani, M. Effect of total replacement of egg by soymilk and lecithin on physical properties of batter andcake. Food Sci. Nutr. 2018, 6, 1154. [CrossRef] [PubMed]
116. Abdul Hussain, S.S. Studying the Possibility of Preparing An Egg-Free Or Egg-Less Cake. Int. J. Eng. Technol. 2009, 1, 324–329.[CrossRef]
117. Hesarinejad, M.A.; Rezaiyan Attar, F.; Mossaffa, O.; Shokrolahi, B. The effect of incorporation of chlorella vulgaris into cake as anegg white substitute on physical and sensory properties. Iran. J. Food Sci. Technol. 2017, 14, 61–72.
118. Ashwini, A.; Jyotsna, R.; Indrani, D. Effect of hydrocolloids and emulsifiers on the rheological, microstructural and qualitycharacteristics of eggless cake. Food Hydrocoll. 2009, 23, 700–707. [CrossRef]
119. Ratnayake, W.S.; Geera, B.; Rybak, D.A. Effects of egg and egg replacers on yellow cake product quality. J. Food Process. Preserv.2012, 36, 21–29. [CrossRef]
76
foods
Article
Standardization of Aquafaba Production and Application inVegan Mayonnaise Analogs
Yue He 1, Sarah K. Purdy 2, Timothy J. Tse 2, Bunyamin Tar’an 2, Venkatesh Meda 1, Martin J. T. Reaney 2,3,4 and
Rana Mustafa 2,4,*
Citation: He, Y.; Purdy, S.K.; Tse, T.J.;
Tar’an, B.; Meda, V.; Reaney, M.J.T.;
Mustafa, R. Standardization of
Aquafaba Production and
Application in Vegan Mayonnaise
Analogs. Foods 2021, 10, 1978.
https:// doi.org/10.3390/
foods10091978
Academic Editor: Alex Martynenko
Received: 28 June 2021
Accepted: 20 August 2021
Published: 24 August 2021
Publisher’s Note: MDPI stays neutral
with regard to jurisdictional claims in
published maps and institutional affil-
iations.
Copyright: © 2021 by the authors.
Licensee MDPI, Basel, Switzerland.
This article is an open access article
distributed under the terms and
conditions of the Creative Commons
Attribution (CC BY) license (https://
creativecommons.org/licenses/by/
4.0/).
1 Department of Chemical and Biological Engineering, University of Saskatchewan,Saskatoon, SK S7N 5A9, Canada; [email protected] (Y.H.); [email protected] (V.M.)
2 Department of Plant Sciences, University of Saskatchewan, Saskatoon, SK S7N 5A8, Canada;[email protected] (S.K.P.); [email protected] (T.J.T.); [email protected] (B.T.);[email protected] (M.J.T.R.)
3 Prairie Tide Diversified Inc., 102 Melville Street, Saskatoon, SK S7J 0R1, Canada4 Guangdong Saskatchewan Oilseed Joint Laboratory, Department of Food Science and Engineering,
Jinan University, Guangzhou 510632, China* Correspondence: [email protected]; Tel.: +1-(306)-250-1301
Abstract: Canning or boiling pulse seeds in water produces a by-product solution, called “aquafaba”,that can be used as a plant-based emulsifier. One of the major problems facing the commercializationof aquafaba is inconsistency in quality and functionality. In this study, chickpea aquafaba productionand drying methods were optimized to produce standardized aquafaba powder. Aquafaba samples,both freeze-dried and spray-dried, were used to make egg-free, vegan mayonnaise. Mayonnaiseand analog physicochemical characteristics, microstructure, and stability were tested and comparedto mayonnaise prepared using egg yolk. Chickpeas steeped in water at 4 ◦C for 16 h, followedby cooking at 75 kPa for 30 min at 116 ◦C, yielded aquafaba that produced the best emulsionqualities. Both lyophilization and spray drying to dehydrate aquafaba resulted in powders thatretained their functionality following rehydration. Mayonnaise analogs made with aquafaba powderremained stable for 28 days of storage at 4 ◦C, although their droplet size was significantly higherthan the reference sample made with egg yolk. These results show that aquafaba production can bestandardized for optimal emulsion qualities, and dried aquafaba can mimic egg functions in foodemulsions and has the potential to produce a wide range of eggless food products.
Keywords: aquafaba; chickpea; emulsifiers; egg replacement; mayonnaise
1. Introduction
Mayonnaise is a popular semisolid condiment that can improve the texture andflavour of foods such as salads, dips, and sandwiches. In recent years, because of healthand environmental concerns, there has been an upward trend towards replacing egg withplant-based ingredients, especially in the formulation of mayonnaise analogs. Plant-basedproteins [1,2], soymilk [3–5], starch, and modified starch [6] are reported to function as eggreplacers that act as emulsifiers in mayonnaise analogs. To develop a vegan mayonnaiseanalog, one of the most difficult problems to solve is to create a stable emulsion structurethat can withstand prolonged storage without coalescence or flocculation [7–9]. Emulsionsare thermodynamically unstable systems, necessitating the use of emulsifiers to improvetheir storage stability [10].
Chickpea cooking water, commonly known as aquafaba, has recently been utilized asa vegan emulsifier in culinary formulations and as an egg replacement in vegan mayon-naise analogs. Aquafaba’s functional properties (emulsibility, foamability, gelation, andthickening properties) are attributed to its composition of protein, water-soluble/insolublecarbohydrates (oligosaccharide, starch, cellulose, hemicellulose, or lignin), polysaccharide-protein complexes, coacervates, saponins, and phenolic compounds [7,8,11–15]. Aquafaba
Foods 2021, 10, 1978. https://doi.org/10.3390/foods10091978 https://www.mdpi.com/journal/foods77
Foods 2021, 10, 1978
is a by-product of pulse canning/boiling and freezing processes and hummus production.Using aquafaba in food products expands the market for plant-based foods, increasesthe demand for pulses, and reduces wastewater generated from some bean processes [7].However, because most boiling and canning processes are designed to produce cookedpulse seed, the quality of aquafaba recovered varies significantly between manufacturersand within batches [16,17]. To assure aquafaba consistency and the quality of productsmade from it, standardization of aquafaba production is required. Different parameters,such as chickpea cultivars selected for aquafaba production and production conditions(i.e., water to seed ratio, temperature, pressure, time, and additives) should be addressedwhen standardizing aquafaba composition and functionality [16,18,19]. As aquafaba has amoisture content of more than 90% [16], it is also preferred to concentrate or dry aquafabato improve transport efficiency by minimizing shipping costs, decreasing space required forstorage, and preventing undesirable microbial growth [20]. To our knowledge, the impactof the drying process on the functional qualities of aquafaba has not yet been explored.
The purpose of this study is to standardize aquafaba production and drying processes,as well as to determine conditions that improve aquafaba powder’s function as an emul-sifier in mayonnaise analog production. The emulsion properties of aquafaba producedfrom different cooking and drying methods were measured, and the physicochemical char-acteristics and stability of aquafaba-based mayonnaise analog and egg-based mayonnaisewere examined and compared.
2. Materials and Methods
2.1. Materials
In our previous research, the Kabuli chickpea cultivar ‘CDC Leader’ was identified toproduce a more favourable aquafaba with superior emulsion properties when comparedwith aquafaba produced from other cultivars [16]. Chickpea seeds (CDC Leader) weregenerously provided by Dr. Bunyamin Tar’an from the University of Saskatchewan, CropDevelopment Centre (CDC) (Saskatoon, SK, Canada). Chickpea seed was manually cleanedto remove broken seed, dust, and other foreign materials. Canola oil (purity 100%; ACHFood Companies, Inc., Terrace, IL, USA), eggs (Great Value large sized, Canada), bakingsoda (NaHCO3; Arm & Hammer by Church & Dwight Co., Inc, Mississauga, ON, Canada),and table salt (Windsor Salt, Pointe-Claire, QC, Canada) were purchased from a localsupermarket (Walmart, Saskatoon, SK, Canada). Whole eggs were kept refrigerated at 4 ◦C,and before preparing mayonnaise, the yolk was separated from the egg white using anegg separator. White vinegar (No Name, Loblaws Inc., Toronto, ON, Canada) and sugar(Rogers granulated white sugar, Lantic Inc., Vancouver, BC, Canada) were purchased froma local supermarket (Real Canadian Superstore, Saskatoon, SK, Canada). Sodium dodecylsulphate (SDS) was purchased from GE Healthcare (Mississauga, ON, Canada), and Nilered pigment was supplied by Sigma-Aldrich (Oakville, ON, Canada).
2.2. Aquafaba Production and Drying Method Standardization
Our goal was to identify the best conditions to produce aquafaba with superioremulsion properties. Tests were conducted in sequence by selecting the top-performingparameters for the next test. First, five aquafaba production conditions were evaluated, andthe best aquafaba production conditions were selected based on the emulsifying activityindex (EAI) and stability (ES). Second, aquafaba made with the optimized productionmethods was dried using five different drying methods. To make aquafaba powder, thedrying methods that maintained aquafaba functionality were chosen. Third, the resultingaquafaba powder was used as an emulsifier to make analogs for mayonnaise.
2.2.1. Optimization of Aquafaba Production
Dry chickpea seed (approx. 100 g) was washed and rehydrated by soaking in distilledwater at a ratio of 1:4 (w/w) over time intervals of 1 and 16 h, at temperatures of 4 and85 ◦C (Table 1). The soaking water was then discarded. The soaked chickpea seed (100 g)
78
Foods 2021, 10, 1978
was rinsed with distilled water and combined with 100 mL distilled water with andwithout 0.2% NaHCO3 in 250 mL sealed glass jars and cooked for different times (20, 30,or 60 min) in a pressure cooker (70–80 kPa, and 115–118 ◦C; Instant Pot® 7-in-1 multi-useprogrammable pressure cooker, IP-DUO60 V2, 6 quart/litres, Ottawa, ON, Canada). Aftercooking, the jars were cooled to room temperature (21 ± 1 ◦C) for 24 h. Cooled aquafabawas separated from cooked chickpea seed using a stainless-steel strainer and stored ina freezer (−18 ◦C) until use. Frozen aquafaba was thawed at 4 ◦C overnight and thenwarmed to 22 ◦C for 2 h before use. The aquafaba EAI and ES were measured according toHe et al. [16].
Table 1. Aquafaba production conditions.
Condition A B C D E
Soaking time (h) 16 16 16 1 1Soaking temperature (◦C) 4 4 4 85 85Soaking water additives (w/w) NA NA NA NA 0.2% NaHCO3Cooking time (min) 20 30 60 30 20
NA—no additives.
2.2.2. Comparison of Drying Methods
Liquid aquafaba sample (750 g) prepared from chickpea seed soaked in 4 ◦C waterfor 16 h then cooked for 30 min (condition B, Table 1) was divided into five equal parts(150 g) and dried using five different drying methods: freeze drying, spray drying, ovendrying, Rotovap drying, and vacuum pressure drying. Freeze drying was performed byfreezing the samples at −20 ◦C followed by drying in a FreeZone 12 Liter Console FreezeDryer with Stoppering Tray Dryer (Labconco Corporation, Kansas City, MO, USA) until thesample temperature rose to −5 ◦C, indicating the sample had been thoroughly dried. Spraydrying was completed at 150 ◦C, using a Büchi Mini Spray Dryer B-290 (Labortechnik AG,Flawil, Switzerland). Oven-dried samples were treated at 80 ◦C, using a VWR® Signature™Forced Air Safety Oven (Radnor, PA, USA) until they reached a consistent weight. Samplesfor Rotovap drying were placed in round-bottom flasks connected to a rotary evaporator(Büchi® Model R-210 BUCHI Labortechnik AG, Switzerland) at 50 ◦C under vacuumpressure (50–100 mbar). Vacuum-dried samples were heated in a Fisherbrand™ Isotemp™Model 281A vacuum oven (Fisher Scientific International, Ottawa, ON, Canada) at 60 ◦Cfor 12 h, under vacuum (33 mbar).
The residual moisture content of dried aquafaba samples was determined followingthe American Association of Cereal Chemists (AACC) method 44-15.02 [21]. Aquafabapowder was mixed with water to obtain the same concentration of solid materials as freshaquafaba [16], and rehydrated aquafaba samples were mixed with canola oil to evaluateaquafaba emulsion properties.
2.3. Aquafaba Water Holding Capacity and Oil Absorption Capacity
Water holding capacity (WHC) and oil absorption capacity (OAC) of aquafaba powderwere determined using the method described by Damian et al. (2018) [12] with minormodification. Aquafaba powder (1 g) was mixed with 20 g of distilled water and stirred for1 min. The solution was then centrifuged for 10 min at 1860× g. After centrifugation, thesupernatant was discarded, and the pellet weight was recorded. The WHC values werecalculated as a ratio of the pellet weight to sample weight and were expressed as g water/gpulse cooking water (PCW). For OAC, distilled water was replaced with canola oil, andvalues were expressed as g oil/g PCW.
2.4. Development of Aquafaba Mayonnaise Analogs
Two formulations of egg-free analogs for mayonnaise were prepared using freeze-dried aquafaba and spray-dried aquafaba (analog A and B, respectively). Traditionalmayonnaise, made with egg yolk, was used as a reference (mayonnaise C). The mayonnaise
79
Foods 2021, 10, 1978
and analog formulations were modified from Raikos et al. (2019) [8] and included 80 mLcanola oil, 4 mL vinegar (4% acidity), 0.5 g salt, 0.5 g sugar, and 15 g emulsifying agent.Canola oil was slowly added to the aqueous mixture (aquafaba/egg yolk, vinegar, sugar,and salt) and mixed for 5 min using a Kitchen Aid Ultra Power Mixer with a 4.3 L stationarybowl (Kitchen Aid, St. Joseph’s, MI, USA). Mayonnaise and mayonnaise analog sampleswere aliquoted and stored in a refrigerator (4 ◦C) for further analysis.
2.4.1. Colour and pH
Mayonnaise and analog pH values were measured using a portable food and dairypH meter (Hanna Instruments Ltd., Leighton Buzzard, UK). The colour characteristics wereassessed using a Hunter Lab ColorFlex spectrophotometer (Hunter Associates Laboratory,Inc., Reston, VA, USA). Mayonnaise and analog colour, represented by lightness (L*),redness/greenness (±a*), and yellowness/blueness (±b*), was also determined initiallyafter preparation and after 28 days of cold storage (4 ◦C). Chroma (Ch), colour differencefrom the control (ΔE1
∗), and total colour change (ΔE2∗) of mayonnaise and analog samples
during cold storage, were calculated using the following equations [8,18]:
Ch =√
a∗2 + b∗2 (1)
ΔE∗ =√(ΔL∗)2 + (Δa∗)2 + (Δb∗)2 (2)
2.4.2. Mayonnaise and Analog Stability Test
Mayonnaise and analog samples (F0 = 10 g) were transferred to 15 mL centrifuge tubesand centrifuged for 30 min at 1860× g. The weight of the emulsified fractions (upper layer,F1) was measured after centrifugation, and emulsion stability (ES, %) was determined byEquation (3):
ES =
(F1
F0
)× 100% (3)
To measure heat stability, mayonnaise and analog samples were stored in an 80 ◦Cwater bath for 30 min before centrifugation. The heat stability was then characterized usingEquation (3).
2.4.3. Confocal Laser Scanning Microscopy
Mayonnaise and analog microstructure were analyzed with a Nikon C2 confocal laserscanning microscope (CLSM) (Nikon, Mississauga, ON, Canada) using a 543 nm laser witha 60× Plan-Apochromat VC (numerical aperture 1.4) oil immersion objective lens and fivetimes digital zoom. The oil phase was stained using Nile red dye (0.01 wt.%). A drop ofemulsion was placed on a microscope slide (Fisher Scientific, Nepean, ON, Canada) witha glass rod, covered with a coverslip (VWR International, Edmonton, AB, Canada) andobserved under the CLSM.
2.4.4. Droplet Size Distribution
Droplet size distribution of mayonnaise and analog samples was measured as afunction of time (0, 7, 14, 21, and 28 days) using a static laser diffraction particle analyzer(Mastersizer 2000, Malvern Instrument, Montreal, QC, Canada) with a Hydro 2000S sampledispersion unit (containing water). The dispersion refractive index was 1.33, and therefractive index used for canola oil droplets was 1.47. Drops of samples were added tothe sample dispersion unit until the obscuration index reached approximately 15%, andthe average droplet size was reported in terms of volume-weighted mean diameter, d43,defined by Equation (4):
d43 =∑ nid4
i
∑ nid3i
(4)
where di is the diameter of a droplet and ni is the number of droplets with the size of di.
80
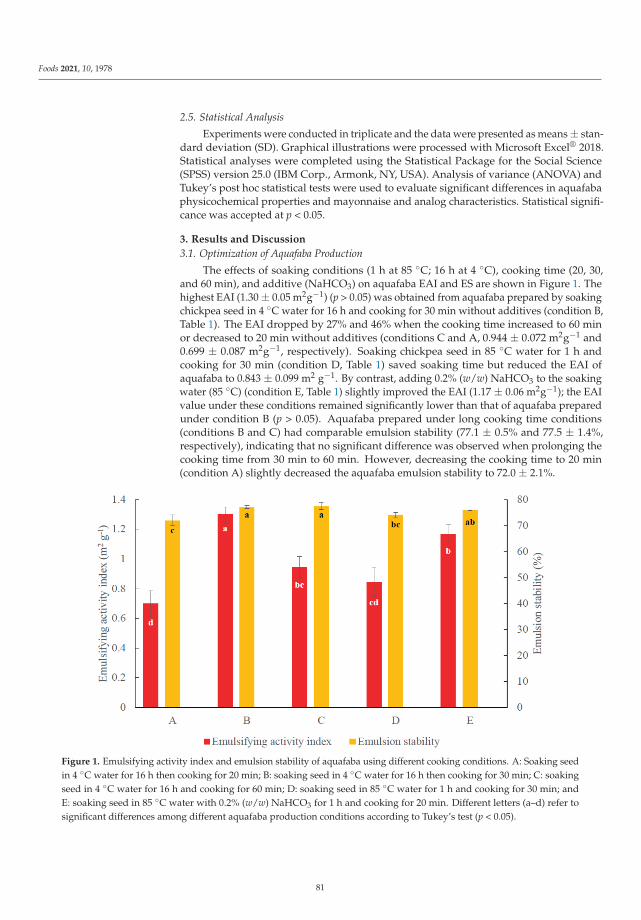
Foods 2021, 10, 1978
2.5. Statistical Analysis
Experiments were conducted in triplicate and the data were presented as means ± stan-dard deviation (SD). Graphical illustrations were processed with Microsoft Excel® 2018.Statistical analyses were completed using the Statistical Package for the Social Science(SPSS) version 25.0 (IBM Corp., Armonk, NY, USA). Analysis of variance (ANOVA) andTukey’s post hoc statistical tests were used to evaluate significant differences in aquafabaphysicochemical properties and mayonnaise and analog characteristics. Statistical signifi-cance was accepted at p < 0.05.
3. Results and Discussion
3.1. Optimization of Aquafaba Production
The effects of soaking conditions (1 h at 85 ◦C; 16 h at 4 ◦C), cooking time (20, 30,and 60 min), and additive (NaHCO3) on aquafaba EAI and ES are shown in Figure 1. Thehighest EAI (1.30 ± 0.05 m2g−1) (p > 0.05) was obtained from aquafaba prepared by soakingchickpea seed in 4 ◦C water for 16 h and cooking for 30 min without additives (condition B,Table 1). The EAI dropped by 27% and 46% when the cooking time increased to 60 minor decreased to 20 min without additives (conditions C and A, 0.944 ± 0.072 m2g−1 and0.699 ± 0.087 m2g−1, respectively). Soaking chickpea seed in 85 ◦C water for 1 h andcooking for 30 min (condition D, Table 1) saved soaking time but reduced the EAI ofaquafaba to 0.843 ± 0.099 m2 g−1. By contrast, adding 0.2% (w/w) NaHCO3 to the soakingwater (85 ◦C) (condition E, Table 1) slightly improved the EAI (1.17 ± 0.06 m2g−1); the EAIvalue under these conditions remained significantly lower than that of aquafaba preparedunder condition B (p > 0.05). Aquafaba prepared under long cooking time conditions(conditions B and C) had comparable emulsion stability (77.1 ± 0.5% and 77.5 ± 1.4%,respectively), indicating that no significant difference was observed when prolonging thecooking time from 30 min to 60 min. However, decreasing the cooking time to 20 min(condition A) slightly decreased the aquafaba emulsion stability to 72.0 ± 2.1%.
Figure 1. Emulsifying activity index and emulsion stability of aquafaba using different cooking conditions. A: Soaking seedin 4 ◦C water for 16 h then cooking for 20 min; B: soaking seed in 4 ◦C water for 16 h then cooking for 30 min; C: soakingseed in 4 ◦C water for 16 h and cooking for 60 min; D: soaking seed in 85 ◦C water for 1 h and cooking for 30 min; andE: soaking seed in 85 ◦C water with 0.2% (w/w) NaHCO3 for 1 h and cooking for 20 min. Different letters (a–d) refer tosignificant differences among different aquafaba production conditions according to Tukey’s test (p < 0.05).
81
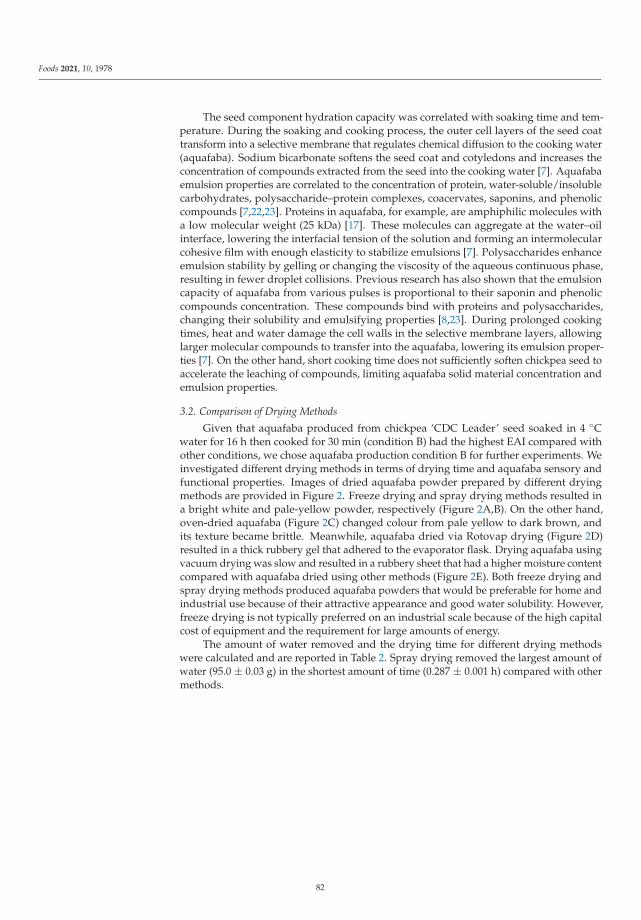
Foods 2021, 10, 1978
The seed component hydration capacity was correlated with soaking time and tem-perature. During the soaking and cooking process, the outer cell layers of the seed coattransform into a selective membrane that regulates chemical diffusion to the cooking water(aquafaba). Sodium bicarbonate softens the seed coat and cotyledons and increases theconcentration of compounds extracted from the seed into the cooking water [7]. Aquafabaemulsion properties are correlated to the concentration of protein, water-soluble/insolublecarbohydrates, polysaccharide–protein complexes, coacervates, saponins, and phenoliccompounds [7,22,23]. Proteins in aquafaba, for example, are amphiphilic molecules witha low molecular weight (25 kDa) [17]. These molecules can aggregate at the water–oilinterface, lowering the interfacial tension of the solution and forming an intermolecularcohesive film with enough elasticity to stabilize emulsions [7]. Polysaccharides enhanceemulsion stability by gelling or changing the viscosity of the aqueous continuous phase,resulting in fewer droplet collisions. Previous research has also shown that the emulsioncapacity of aquafaba from various pulses is proportional to their saponin and phenoliccompounds concentration. These compounds bind with proteins and polysaccharides,changing their solubility and emulsifying properties [8,23]. During prolonged cookingtimes, heat and water damage the cell walls in the selective membrane layers, allowinglarger molecular compounds to transfer into the aquafaba, lowering its emulsion proper-ties [7]. On the other hand, short cooking time does not sufficiently soften chickpea seed toaccelerate the leaching of compounds, limiting aquafaba solid material concentration andemulsion properties.
3.2. Comparison of Drying Methods
Given that aquafaba produced from chickpea ‘CDC Leader’ seed soaked in 4 ◦Cwater for 16 h then cooked for 30 min (condition B) had the highest EAI compared withother conditions, we chose aquafaba production condition B for further experiments. Weinvestigated different drying methods in terms of drying time and aquafaba sensory andfunctional properties. Images of dried aquafaba powder prepared by different dryingmethods are provided in Figure 2. Freeze drying and spray drying methods resulted ina bright white and pale-yellow powder, respectively (Figure 2A,B). On the other hand,oven-dried aquafaba (Figure 2C) changed colour from pale yellow to dark brown, andits texture became brittle. Meanwhile, aquafaba dried via Rotovap drying (Figure 2D)resulted in a thick rubbery gel that adhered to the evaporator flask. Drying aquafaba usingvacuum drying was slow and resulted in a rubbery sheet that had a higher moisture contentcompared with aquafaba dried using other methods (Figure 2E). Both freeze drying andspray drying methods produced aquafaba powders that would be preferable for home andindustrial use because of their attractive appearance and good water solubility. However,freeze drying is not typically preferred on an industrial scale because of the high capitalcost of equipment and the requirement for large amounts of energy.
The amount of water removed and the drying time for different drying methodswere calculated and are reported in Table 2. Spray drying removed the largest amount ofwater (95.0 ± 0.03 g) in the shortest amount of time (0.287 ± 0.001 h) compared with othermethods.
82
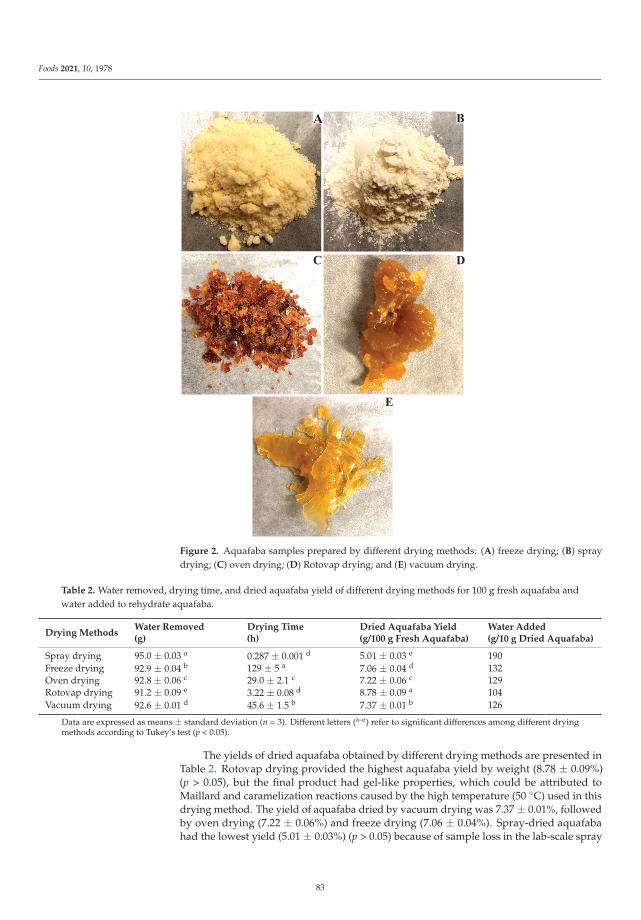
Foods 2021, 10, 1978
Figure 2. Aquafaba samples prepared by different drying methods: (A) freeze drying; (B) spraydrying; (C) oven drying; (D) Rotovap drying; and (E) vacuum drying.
Table 2. Water removed, drying time, and dried aquafaba yield of different drying methods for 100 g fresh aquafaba andwater added to rehydrate aquafaba.
Drying MethodsWater Removed(g)
Drying Time(h)
Dried Aquafaba Yield(g/100 g Fresh Aquafaba)
Water Added(g/10 g Dried Aquafaba)
Spray drying 95.0 ± 0.03 a 0.287 ± 0.001 d 5.01 ± 0.03 e 190Freeze drying 92.9 ± 0.04 b 129 ± 5 a 7.06 ± 0.04 d 132Oven drying 92.8 ± 0.06 c 29.0 ± 2.1 c 7.22 ± 0.06 c 129Rotovap drying 91.2 ± 0.09 e 3.22 ± 0.08 d 8.78 ± 0.09 a 104Vacuum drying 92.6 ± 0.01 d 45.6 ± 1.5 b 7.37 ± 0.01 b 126
Data are expressed as means ± standard deviation (n = 3). Different letters (a–e) refer to significant differences among different dryingmethods according to Tukey’s test (p < 0.05).
The yields of dried aquafaba obtained by different drying methods are presented inTable 2. Rotovap drying provided the highest aquafaba yield by weight (8.78 ± 0.09%)(p > 0.05), but the final product had gel-like properties, which could be attributed toMaillard and caramelization reactions caused by the high temperature (50 ◦C) used in thisdrying method. The yield of aquafaba dried by vacuum drying was 7.37 ± 0.01%, followedby oven drying (7.22 ± 0.06%) and freeze drying (7.06 ± 0.04%). Spray-dried aquafabahad the lowest yield (5.01 ± 0.03%) (p > 0.05) because of sample loss in the lab-scale spray
83
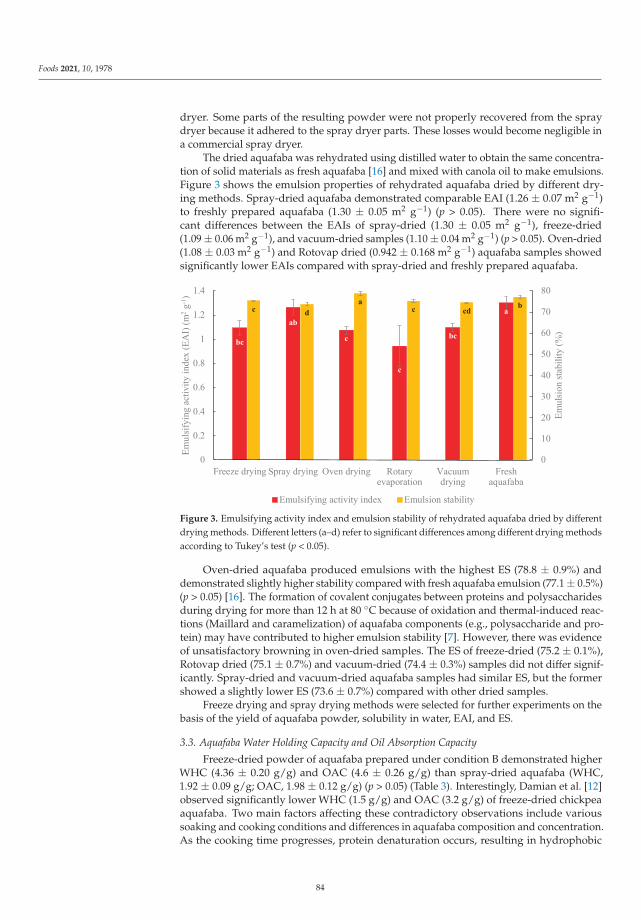
Foods 2021, 10, 1978
dryer. Some parts of the resulting powder were not properly recovered from the spraydryer because it adhered to the spray dryer parts. These losses would become negligible ina commercial spray dryer.
The dried aquafaba was rehydrated using distilled water to obtain the same concentra-tion of solid materials as fresh aquafaba [16] and mixed with canola oil to make emulsions.Figure 3 shows the emulsion properties of rehydrated aquafaba dried by different dry-ing methods. Spray-dried aquafaba demonstrated comparable EAI (1.26 ± 0.07 m2 g−1)to freshly prepared aquafaba (1.30 ± 0.05 m2 g−1) (p > 0.05). There were no signifi-cant differences between the EAIs of spray-dried (1.30 ± 0.05 m2 g−1), freeze-dried(1.09 ± 0.06 m2 g−1), and vacuum-dried samples (1.10 ± 0.04 m2 g−1) (p > 0.05). Oven-dried(1.08 ± 0.03 m2 g−1) and Rotovap dried (0.942 ± 0.168 m2 g−1) aquafaba samples showedsignificantly lower EAIs compared with spray-dried and freshly prepared aquafaba.
Figure 3. Emulsifying activity index and emulsion stability of rehydrated aquafaba dried by differentdrying methods. Different letters (a–d) refer to significant differences among different drying methodsaccording to Tukey’s test (p < 0.05).
Oven-dried aquafaba produced emulsions with the highest ES (78.8 ± 0.9%) anddemonstrated slightly higher stability compared with fresh aquafaba emulsion (77.1 ± 0.5%)(p > 0.05) [16]. The formation of covalent conjugates between proteins and polysaccharidesduring drying for more than 12 h at 80 ◦C because of oxidation and thermal-induced reac-tions (Maillard and caramelization) of aquafaba components (e.g., polysaccharide and pro-tein) may have contributed to higher emulsion stability [7]. However, there was evidenceof unsatisfactory browning in oven-dried samples. The ES of freeze-dried (75.2 ± 0.1%),Rotovap dried (75.1 ± 0.7%) and vacuum-dried (74.4 ± 0.3%) samples did not differ signif-icantly. Spray-dried and vacuum-dried aquafaba samples had similar ES, but the formershowed a slightly lower ES (73.6 ± 0.7%) compared with other dried samples.
Freeze drying and spray drying methods were selected for further experiments on thebasis of the yield of aquafaba powder, solubility in water, EAI, and ES.
3.3. Aquafaba Water Holding Capacity and Oil Absorption Capacity
Freeze-dried powder of aquafaba prepared under condition B demonstrated higherWHC (4.36 ± 0.20 g/g) and OAC (4.6 ± 0.26 g/g) than spray-dried aquafaba (WHC,1.92 ± 0.09 g/g; OAC, 1.98 ± 0.12 g/g) (p > 0.05) (Table 3). Interestingly, Damian et al. [12]observed significantly lower WHC (1.5 g/g) and OAC (3.2 g/g) of freeze-dried chickpeaaquafaba. Two main factors affecting these contradictory observations include varioussoaking and cooking conditions and differences in aquafaba composition and concentration.As the cooking time progresses, protein denaturation occurs, resulting in hydrophobic
84
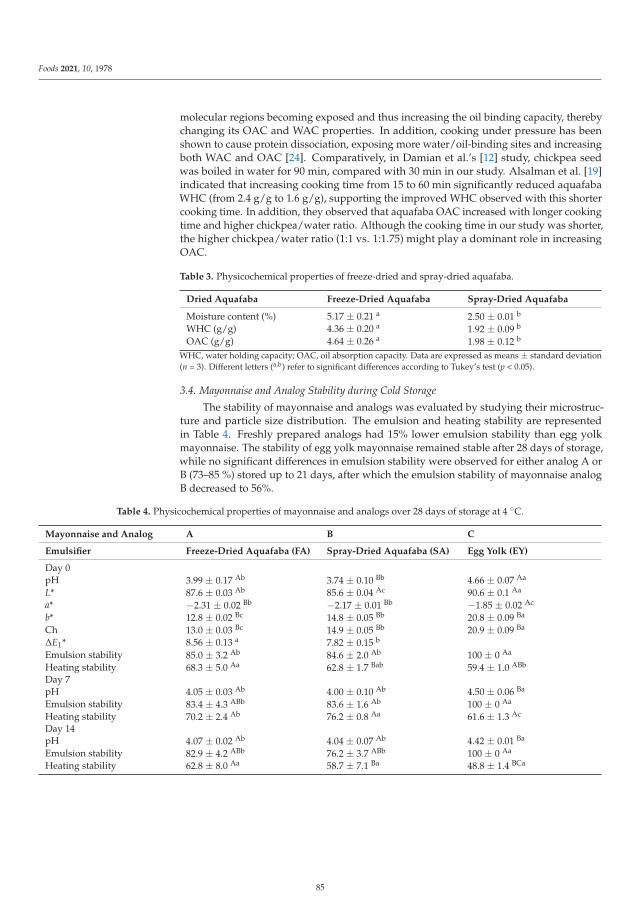
Foods 2021, 10, 1978
molecular regions becoming exposed and thus increasing the oil binding capacity, therebychanging its OAC and WAC properties. In addition, cooking under pressure has beenshown to cause protein dissociation, exposing more water/oil-binding sites and increasingboth WAC and OAC [24]. Comparatively, in Damian et al.’s [12] study, chickpea seedwas boiled in water for 90 min, compared with 30 min in our study. Alsalman et al. [19]indicated that increasing cooking time from 15 to 60 min significantly reduced aquafabaWHC (from 2.4 g/g to 1.6 g/g), supporting the improved WHC observed with this shortercooking time. In addition, they observed that aquafaba OAC increased with longer cookingtime and higher chickpea/water ratio. Although the cooking time in our study was shorter,the higher chickpea/water ratio (1:1 vs. 1:1.75) might play a dominant role in increasingOAC.
Table 3. Physicochemical properties of freeze-dried and spray-dried aquafaba.
Dried Aquafaba Freeze-Dried Aquafaba Spray-Dried Aquafaba
Moisture content (%) 5.17 ± 0.21 a 2.50 ± 0.01 b
WHC (g/g) 4.36 ± 0.20 a 1.92 ± 0.09 b
OAC (g/g) 4.64 ± 0.26 a 1.98 ± 0.12 b
WHC, water holding capacity; OAC, oil absorption capacity. Data are expressed as means ± standard deviation(n = 3). Different letters (a,b) refer to significant differences according to Tukey’s test (p < 0.05).
3.4. Mayonnaise and Analog Stability during Cold Storage
The stability of mayonnaise and analogs was evaluated by studying their microstruc-ture and particle size distribution. The emulsion and heating stability are representedin Table 4. Freshly prepared analogs had 15% lower emulsion stability than egg yolkmayonnaise. The stability of egg yolk mayonnaise remained stable after 28 days of storage,while no significant differences in emulsion stability were observed for either analog A orB (73–85 %) stored up to 21 days, after which the emulsion stability of mayonnaise analogB decreased to 56%.
Table 4. Physicochemical properties of mayonnaise and analogs over 28 days of storage at 4 ◦C.
Mayonnaise and Analog A B C
Emulsifier Freeze-Dried Aquafaba (FA) Spray-Dried Aquafaba (SA) Egg Yolk (EY)
Day 0pH 3.99 ± 0.17 Ab 3.74 ± 0.10 Bb 4.66 ± 0.07 Aa
L* 87.6 ± 0.03 Ab 85.6 ± 0.04 Ac 90.6 ± 0.1 Aa
a* −2.31 ± 0.02 Bb −2.17 ± 0.01 Bb −1.85 ± 0.02 Ac
b* 12.8 ± 0.02 Bc 14.8 ± 0.05 Bb 20.8 ± 0.09 Ba
Ch 13.0 ± 0.03 Bc 14.9 ± 0.05 Bb 20.9 ± 0.09 Ba
ΔE1* 8.56 ± 0.13 a 7.82 ± 0.15 b
Emulsion stability 85.0 ± 3.2 Ab 84.6 ± 2.0 Ab 100 ± 0 Aa
Heating stability 68.3 ± 5.0 Aa 62.8 ± 1.7 Bab 59.4 ± 1.0 ABb
Day 7pH 4.05 ± 0.03 Ab 4.00 ± 0.10 Ab 4.50 ± 0.06 Ba
Emulsion stability 83.4 ± 4.3 ABb 83.6 ± 1.6 Ab 100 ± 0 Aa
Heating stability 70.2 ± 2.4 Ab 76.2 ± 0.8 Aa 61.6 ± 1.3 Ac
Day 14pH 4.07 ± 0.02 Ab 4.04 ± 0.07 Ab 4.42 ± 0.01 Ba
Emulsion stability 82.9 ± 4.2 ABb 76.2 ± 3.7 ABb 100 ± 0 Aa
Heating stability 62.8 ± 8.0 Aa 58.7 ± 7.1 Ba 48.8 ± 1.4 BCa
85
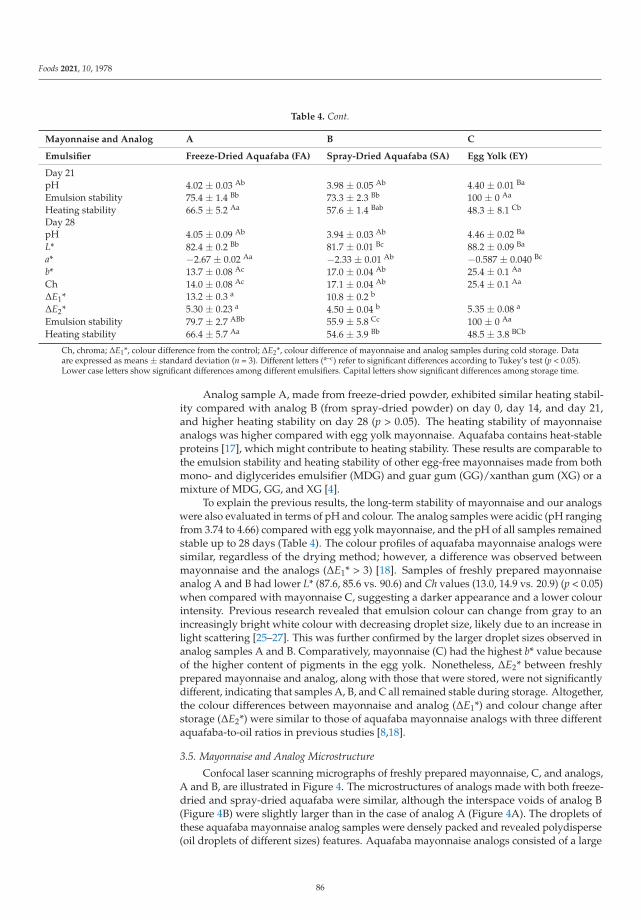
Foods 2021, 10, 1978
Table 4. Cont.
Mayonnaise and Analog A B C
Emulsifier Freeze-Dried Aquafaba (FA) Spray-Dried Aquafaba (SA) Egg Yolk (EY)
Day 21pH 4.02 ± 0.03 Ab 3.98 ± 0.05 Ab 4.40 ± 0.01 Ba
Emulsion stability 75.4 ± 1.4 Bb 73.3 ± 2.3 Bb 100 ± 0 Aa
Heating stability 66.5 ± 5.2 Aa 57.6 ± 1.4 Bab 48.3 ± 8.1 Cb
Day 28pH 4.05 ± 0.09 Ab 3.94 ± 0.03 Ab 4.46 ± 0.02 Ba
L* 82.4 ± 0.2 Bb 81.7 ± 0.01 Bc 88.2 ± 0.09 Ba
a* −2.67 ± 0.02 Aa −2.33 ± 0.01 Ab −0.587 ± 0.040 Bc
b* 13.7 ± 0.08 Ac 17.0 ± 0.04 Ab 25.4 ± 0.1 Aa
Ch 14.0 ± 0.08 Ac 17.1 ± 0.04 Ab 25.4 ± 0.1 Aa
ΔE1* 13.2 ± 0.3 a 10.8 ± 0.2 b
ΔE2* 5.30 ± 0.23 a 4.50 ± 0.04 b 5.35 ± 0.08 a
Emulsion stability 79.7 ± 2.7 ABb 55.9 ± 5.8 Cc 100 ± 0 Aa
Heating stability 66.4 ± 5.7 Aa 54.6 ± 3.9 Bb 48.5 ± 3.8 BCb
Ch, chroma; ΔE1*, colour difference from the control; ΔE2*, colour difference of mayonnaise and analog samples during cold storage. Dataare expressed as means ± standard deviation (n = 3). Different letters (a–c) refer to significant differences according to Tukey’s test (p < 0.05).Lower case letters show significant differences among different emulsifiers. Capital letters show significant differences among storage time.
Analog sample A, made from freeze-dried powder, exhibited similar heating stabil-ity compared with analog B (from spray-dried powder) on day 0, day 14, and day 21,and higher heating stability on day 28 (p > 0.05). The heating stability of mayonnaiseanalogs was higher compared with egg yolk mayonnaise. Aquafaba contains heat-stableproteins [17], which might contribute to heating stability. These results are comparable tothe emulsion stability and heating stability of other egg-free mayonnaises made from bothmono- and diglycerides emulsifier (MDG) and guar gum (GG)/xanthan gum (XG) or amixture of MDG, GG, and XG [4].
To explain the previous results, the long-term stability of mayonnaise and our analogswere also evaluated in terms of pH and colour. The analog samples were acidic (pH rangingfrom 3.74 to 4.66) compared with egg yolk mayonnaise, and the pH of all samples remainedstable up to 28 days (Table 4). The colour profiles of aquafaba mayonnaise analogs weresimilar, regardless of the drying method; however, a difference was observed betweenmayonnaise and the analogs (ΔE1* > 3) [18]. Samples of freshly prepared mayonnaiseanalog A and B had lower L* (87.6, 85.6 vs. 90.6) and Ch values (13.0, 14.9 vs. 20.9) (p < 0.05)when compared with mayonnaise C, suggesting a darker appearance and a lower colourintensity. Previous research revealed that emulsion colour can change from gray to anincreasingly bright white colour with decreasing droplet size, likely due to an increase inlight scattering [25–27]. This was further confirmed by the larger droplet sizes observed inanalog samples A and B. Comparatively, mayonnaise (C) had the highest b* value becauseof the higher content of pigments in the egg yolk. Nonetheless, ΔE2* between freshlyprepared mayonnaise and analog, along with those that were stored, were not significantlydifferent, indicating that samples A, B, and C all remained stable during storage. Altogether,the colour differences between mayonnaise and analog (ΔE1*) and colour change afterstorage (ΔE2*) were similar to those of aquafaba mayonnaise analogs with three differentaquafaba-to-oil ratios in previous studies [8,18].
3.5. Mayonnaise and Analog Microstructure
Confocal laser scanning micrographs of freshly prepared mayonnaise, C, and analogs,A and B, are illustrated in Figure 4. The microstructures of analogs made with both freeze-dried and spray-dried aquafaba were similar, although the interspace voids of analog B(Figure 4B) were slightly larger than in the case of analog A (Figure 4A). The droplets ofthese aquafaba mayonnaise analog samples were densely packed and revealed polydisperse(oil droplets of different sizes) features. Aquafaba mayonnaise analogs consisted of a large
86
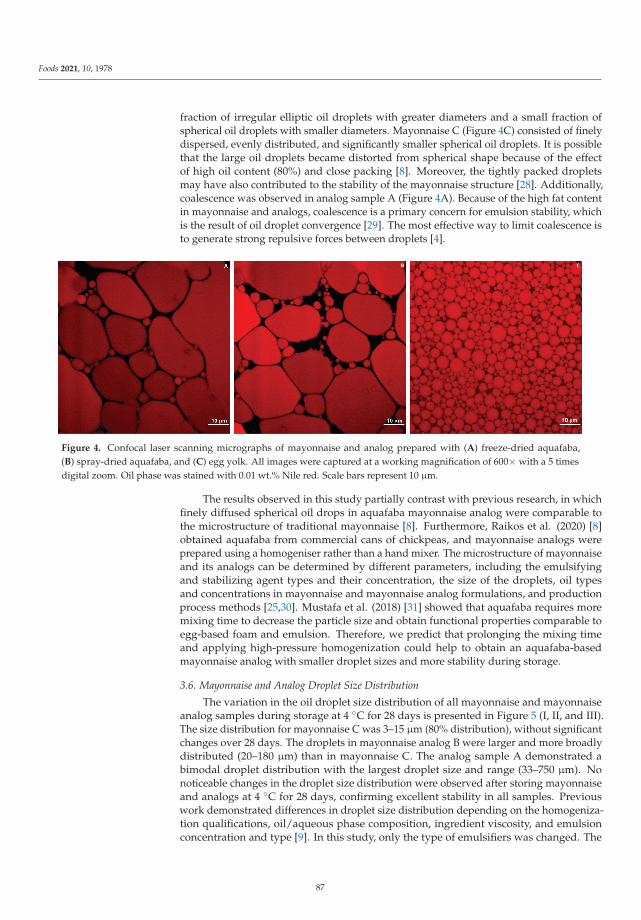
Foods 2021, 10, 1978
fraction of irregular elliptic oil droplets with greater diameters and a small fraction ofspherical oil droplets with smaller diameters. Mayonnaise C (Figure 4C) consisted of finelydispersed, evenly distributed, and significantly smaller spherical oil droplets. It is possiblethat the large oil droplets became distorted from spherical shape because of the effectof high oil content (80%) and close packing [8]. Moreover, the tightly packed dropletsmay have also contributed to the stability of the mayonnaise structure [28]. Additionally,coalescence was observed in analog sample A (Figure 4A). Because of the high fat contentin mayonnaise and analogs, coalescence is a primary concern for emulsion stability, whichis the result of oil droplet convergence [29]. The most effective way to limit coalescence isto generate strong repulsive forces between droplets [4].
Figure 4. Confocal laser scanning micrographs of mayonnaise and analog prepared with (A) freeze-dried aquafaba,(B) spray-dried aquafaba, and (C) egg yolk. All images were captured at a working magnification of 600× with a 5 timesdigital zoom. Oil phase was stained with 0.01 wt.% Nile red. Scale bars represent 10 μm.
The results observed in this study partially contrast with previous research, in whichfinely diffused spherical oil drops in aquafaba mayonnaise analog were comparable tothe microstructure of traditional mayonnaise [8]. Furthermore, Raikos et al. (2020) [8]obtained aquafaba from commercial cans of chickpeas, and mayonnaise analogs wereprepared using a homogeniser rather than a hand mixer. The microstructure of mayonnaiseand its analogs can be determined by different parameters, including the emulsifyingand stabilizing agent types and their concentration, the size of the droplets, oil typesand concentrations in mayonnaise and mayonnaise analog formulations, and productionprocess methods [25,30]. Mustafa et al. (2018) [31] showed that aquafaba requires moremixing time to decrease the particle size and obtain functional properties comparable toegg-based foam and emulsion. Therefore, we predict that prolonging the mixing timeand applying high-pressure homogenization could help to obtain an aquafaba-basedmayonnaise analog with smaller droplet sizes and more stability during storage.
3.6. Mayonnaise and Analog Droplet Size Distribution
The variation in the oil droplet size distribution of all mayonnaise and mayonnaiseanalog samples during storage at 4 ◦C for 28 days is presented in Figure 5 (I, II, and III).The size distribution for mayonnaise C was 3–15 μm (80% distribution), without significantchanges over 28 days. The droplets in mayonnaise analog B were larger and more broadlydistributed (20–180 μm) than in mayonnaise C. The analog sample A demonstrated abimodal droplet distribution with the largest droplet size and range (33–750 μm). Nonoticeable changes in the droplet size distribution were observed after storing mayonnaiseand analogs at 4 ◦C for 28 days, confirming excellent stability in all samples. Previouswork demonstrated differences in droplet size distribution depending on the homogeniza-tion qualifications, oil/aqueous phase composition, ingredient viscosity, and emulsionconcentration and type [9]. In this study, only the type of emulsifiers was changed. The
87
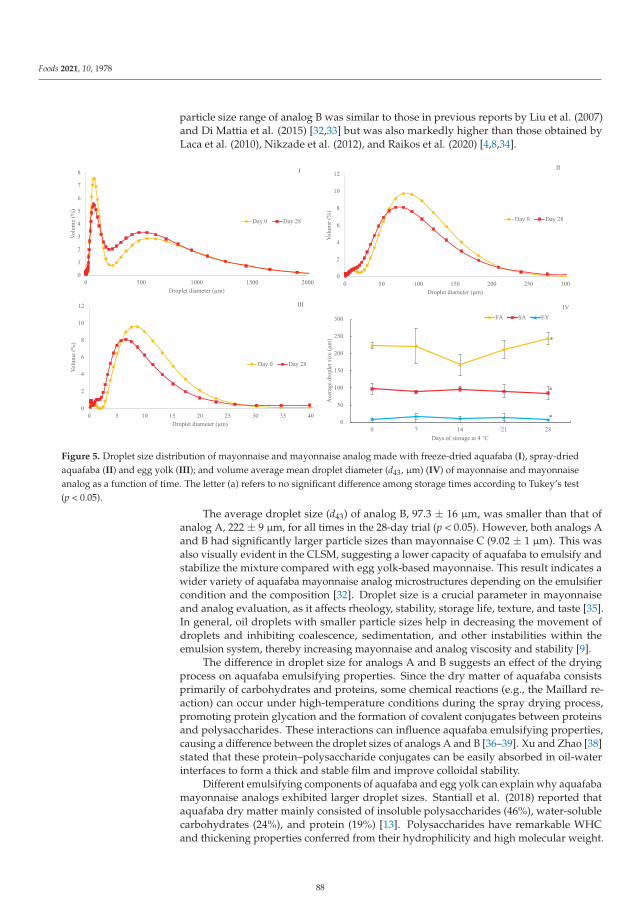
Foods 2021, 10, 1978
particle size range of analog B was similar to those in previous reports by Liu et al. (2007)and Di Mattia et al. (2015) [32,33] but was also markedly higher than those obtained byLaca et al. (2010), Nikzade et al. (2012), and Raikos et al. (2020) [4,8,34].
Figure 5. Droplet size distribution of mayonnaise and mayonnaise analog made with freeze-dried aquafaba (I), spray-driedaquafaba (II) and egg yolk (III); and volume average mean droplet diameter (d43, μm) (IV) of mayonnaise and mayonnaiseanalog as a function of time. The letter (a) refers to no significant difference among storage times according to Tukey’s test(p < 0.05).
The average droplet size (d43) of analog B, 97.3 ± 16 μm, was smaller than that ofanalog A, 222 ± 9 μm, for all times in the 28-day trial (p < 0.05). However, both analogs Aand B had significantly larger particle sizes than mayonnaise C (9.02 ± 1 μm). This wasalso visually evident in the CLSM, suggesting a lower capacity of aquafaba to emulsify andstabilize the mixture compared with egg yolk-based mayonnaise. This result indicates awider variety of aquafaba mayonnaise analog microstructures depending on the emulsifiercondition and the composition [32]. Droplet size is a crucial parameter in mayonnaiseand analog evaluation, as it affects rheology, stability, storage life, texture, and taste [35].In general, oil droplets with smaller particle sizes help in decreasing the movement ofdroplets and inhibiting coalescence, sedimentation, and other instabilities within theemulsion system, thereby increasing mayonnaise and analog viscosity and stability [9].
The difference in droplet size for analogs A and B suggests an effect of the dryingprocess on aquafaba emulsifying properties. Since the dry matter of aquafaba consistsprimarily of carbohydrates and proteins, some chemical reactions (e.g., the Maillard re-action) can occur under high-temperature conditions during the spray drying process,promoting protein glycation and the formation of covalent conjugates between proteinsand polysaccharides. These interactions can influence aquafaba emulsifying properties,causing a difference between the droplet sizes of analogs A and B [36–39]. Xu and Zhao [38]stated that these protein–polysaccharide conjugates can be easily absorbed in oil-waterinterfaces to form a thick and stable film and improve colloidal stability.
Different emulsifying components of aquafaba and egg yolk can explain why aquafabamayonnaise analogs exhibited larger droplet sizes. Stantiall et al. (2018) reported thataquafaba dry matter mainly consisted of insoluble polysaccharides (46%), water-solublecarbohydrates (24%), and protein (19%) [13]. Polysaccharides have remarkable WHCand thickening properties conferred from their hydrophilicity and high molecular weight.
88
Foods 2021, 10, 1978
These properties can provide high viscosity of the aqueous phase and restrain the formationof fine, evenly distributed droplets in vegan mayonnaise analogs. In addition, becauseof the high concentration and high molecular weight of insoluble polysaccharides, athick gel layer can be produced around the oil droplets to further enlarge their size [9].Comparatively, the size of emulsifier molecules in egg is much smaller (mainly lecithin,lipoprotein, livetin, and phosvitin) [34,40]. Generally, small molecular size emulsifiers cangenerate small fat droplets and promote superior stability in an emulsion system [41,42].
4. Conclusions
The impacts of different cooking and drying methods on aquafaba emulsion capacityand stability were investigated. Dried aquafaba powder was used as an emulsifier in avegan mayonnaise analog, and the physicochemical properties and stability were com-pared to traditional mayonnaise made from egg yolk. Aquafaba prepared by soakingchickpea seed in 4 ◦C water for 16 h and cooking for 30 min achieved the highest emulsioncapacity and stability. When compared with other drying methods, freeze drying andspray drying produced powdered aquafaba with superior emulsion properties. Spraydrying displayed a shorter drying time. Both freeze-dried and spray-dried aquafaba canbe used to produce vegan mayonnaise analogs with comparable pH, colour, and stabilityto egg yolk mayonnaise. However, the droplet size in mayonnaise analogs made fromfreeze-dried and spray-dried aquafaba were much larger than in egg-yolk mayonnaise.This reduced the long-term stability compared with egg yolk mayonnaise. This study laysthe foundation for commercial production of aquafaba powder for long-term storage andtransportation and demonstrates the use of dried aquafaba as an egg replacement andemulsifier in the formulation of vegan mayonnaise analogs. Further studies will evaluatethe effect of processing methods and investigate the effects of dried aquafaba concentrationon the microstructure and stability of aquafaba mayonnaise analogs.
Author Contributions: Conceptualization, R.M. and Y.H.; validation, V.M. and B.T.; investigation,Y.H.; writing-original draft preparation, Y.H.; writing-review and editing, Y.H., S.K.P., T.J.T., V.M.,R.M. and M.J.T.R.; supervision, V.M. and M.J.T.R.; funding acquisition, M.J.T.R. All authors have readand agreed to the published version of the manuscript.
Funding: This research was funded by the Saskatchewan Ministry of Agriculture’s AgricultureDevelopment Fund (ADF-20180091) and by the Department of Chemical and Biological Engineering,BLE Devolved Graduate Scholarship (University of Saskatchewan, Canada).
Institutional Review Board Statement: Not applicable.
Informed Consent Statement: Not applicable.
Data Availability Statement: The datasets generated for this study are available on request to thecorresponding author.
Conflicts of Interest: The authors declare no conflict of interest.
References
1. Raymundo, A.; Franco, J.M.; Empis, J.; Sousa, I. Optimization of the composition of low-fat oil-in-water emulsions stabilized bywhite lupin protein. J. Am. Oil Chem. Soc. 2002, 79, 783–790. [CrossRef]
2. Ghoush, M.A.; Samhouri, M.; Al-Holy, M.; Herald, T. Formulation and fuzzy modeling of emulsion stability and viscosity of agum–protein emulsifier in a model mayonnaise system. J. Food Eng. 2008, 84, 348–357. [CrossRef]
3. Campos, D.C.P.; Antoniassi, R.; Deliza, R.; de Freitas, S.C.; Felberg, I. Molho cremoso à base de extrato de soja: Estabilidade,propriedades reológicas, valor nutricional e aceitabilidade do consumidor. Ciênc. Tecnol. Aliment. 2009, 29, 919–926. [CrossRef]
4. Nikzade, V.; Tehrani, M.M.; Saadatmand-Tarzjan, M. Optimization of low-cholesterol-low-fat mayonnaise formulation: Effect ofusing soy milk and some stabilizer by a mixture design approach. Food Hydrocoll. 2012, 28, 344–352. [CrossRef]
5. Rahmati, K.; Mazaheri Tehrani, M.; Daneshvar, K. Soy milk as an emulsifier in mayonnaise: Physico-chemical, stability andsensory evaluation. J. Food Sci. Technol. 2014, 51, 3341–3347. [CrossRef]
6. Ghazaei, S.; Mizani, M.; Piravi-Vanak, Z.; Alimi, M. Particle size and cholesterol content of a mayonnaise formulated byOSA-modified potato starch. Food Sci. Technol. 2015, 35, 150–156. [CrossRef]
89
Foods 2021, 10, 1978
7. He, Y.; Meda, V.; Reaney, M.J.T.; Mustafa, R. Aquafaba, a new plant-based rheological additive for food applications. Trends FoodSci. Technol. 2021, 111, 27–42. [CrossRef]
8. Raikos, V.; Hayes, H.; Ni, H. Aquafaba from commercially canned chickpeas as potential egg replacer for the development ofvegan mayonnaise: Recipe optimisation and storage stability. Int. J. Food Sci. Technol. 2020, 55, 1935–1942. [CrossRef]
9. Yildirim, M.; Sumnu, G.; Sahin, S. Rheology, particle-size distribution, and stability of low-fat mayonnaise produced via doubleemulsions. Food Sci. Biotechnol. 2016, 25, 1613–1618. [CrossRef]
10. Friberg, J.; Mandell, L. Influence of phase equilibria on properties of emulsions. J. Pharm. Sci. 1970, 59, 1001–1004. [CrossRef]11. Buhl, T.F.; Christensen, C.H.; Hammershøj, M. Aquafaba as an egg white substitute in food foams and emulsions: Protein
composition and functional behavior. Food Hydrocoll. 2019, 96, 354–364. [CrossRef]12. Damian, J.J.; Huo, S.; Serventi, L. Phytochemical content and emulsifying ability of pulses cooking water. Eur. Food Res. Technol.
2018, 244, 1647–1655. [CrossRef]13. Stantiall, S.E.; Dale, K.J.; Calizo, F.S.; Serventi, L. Application of pulses cooking water as functional ingredients: The foaming and
gelling abilities. Eur. Food Res. Technol. 2018, 244, 97–104. [CrossRef]14. Serventi, L.; Wang, S.; Zhu, J.; Liu, S.; Fei, F. Cooking water of yellow soybeans as emulsifier in gluten-free crackers. Eur. Food Res.
Technol. 2018, 244, 2141–2148. [CrossRef]15. Serventi, L. Cooking water composition. In Upcycling Legume Water: From Wastewater to Food Ingredients; Springer Nature: Cham,
Switzerland, 2020; pp. 73–85. [CrossRef]16. He, Y.; Shim, Y.Y.; Mustafa, R.; Meda, V.; Reaney, M.J.T. Chickpea cultivar selection to produce aquafaba with superior emulsion
properties. Foods 2019, 8, 685. [CrossRef]17. Shim, Y.Y.; Mustafa, R.; Shen, J.; Ratanapariyanuch, K.; Reaney, M.J.T. Composition and properties of aquafaba: Water recovered
from commercially canned chickpeas. J. Vis. Exp. 2018, 2018, 56305. [CrossRef] [PubMed]18. Lafarga, T.; Villaró, S.; Bobo, G.; Aguiló-Aguayo, I. Optimisation of the pH and boiling conditions needed to obtain improved
foaming and emulsifying properties of chickpea aquafaba using a response surface methodology. Int. J. Gastron. Food Sci. 2019,18, 100177. [CrossRef]
19. Alsalman, F.B.; Tulbek, M.; Nickerson, M.; Ramaswamy, H.S. Evaluation and optimization of functional and antinutritionalproperties of aquafaba. Legum. Sci. 2020, 2, 1–15. [CrossRef]
20. Pastor, A.; Compson, Z.G.; Dijkstra, P.; Riera, J.L.; Martí, E.; Sabater, F.; Hungate, B.A.; Marks, J.C. Stream carbon and nitrogensupplements during leaf litter decomposition: Contrasting patterns for two foundation species. Oecologia 2014, 176, 1111–1121.[CrossRef]
21. AACC Approved Methods of Analysis. Method 44-15.02. Moisture-Air-Oven Methods. In AACC International Approved Methods,11th ed.; Cereals & Grains Association: St. Paul, MN, USA, 2013. [CrossRef]
22. Luo, Z.; Murray, B.S.; Yusoff, A.; Morgan, M.R.A.; Povey, M.J.W.; Day, A.J. Particle-Stabilizing Effects of Flavonoids at theOil−Water Interface. J. Agric. Food Chem. 2011, 59, 2636–2645. [CrossRef]
23. Vega, C.; Grover, M.K. Physicochemical Properties of Acidified Skim Milk Gels Containing Cocoa Flavanols. J. Agric. Food Chem.2011, 59, 6740–6747. [CrossRef] [PubMed]
24. Xu, Y.; Obielodan, M.; Sismour, E.; Arnett, A.; Alzahrani, S.; Zhang, B. Physicochemical, functional, thermal and structuralproperties of isolated Kabuli chickpea proteins as affected by processing approaches. Int. J. Food Sci. Technol. 2017, 52, 1147–1154.[CrossRef]
25. Mun, S.; Kim, Y.L.; Kang, C.G.; Park, K.H.; Shim, J.Y.; Kim, Y.R. Development of reduced-fat mayonnaise using 4αGTase-modifiedrice starch and xanthan gum. Int. J. Biol. Macromol 2009, 44, 400–407. [CrossRef] [PubMed]
26. McClements, D.J.; Demetriades, K. An Integrated Approach to the Development of Reduced-Fat Food Emulsions. Crit. Rev. FoodSci. Nutr. 1998, 38, 511–536. [CrossRef]
27. Worrasinchai, S.; Suphantharika, M.; Pinjai, S.; Jamnong, P. β-Glucan prepared from spent brewer’s yeast as a fat replacer inmayonnaise. Food Hydrocoll. 2006, 20, 68–78. [CrossRef]
28. Depree, J.; Savage, G. Physical and flavour stability of mayonnaise. Trends Food Sci. Technol. 2001, 12, 157–163. [CrossRef]29. Jaynes, E.N. Applications in the food industry: II. In Encyclopedia of Emulsion Technology, Vol. 2: Applications; Becher, P., Ed.; Marcel
Dekker: New York, NY, USA, 1985; pp. 367–369.30. Langton, M.; Jordansson, E.; Altskär, A.; Sørensen, C.; Hermansson, A.M. Microstructure and image analysis of mayonnaises.
Food Hydrocoll. 1999, 13, 113–125. [CrossRef]31. Mustafa, R.; He, Y.; Shim, Y.Y.; Reaney, M.J.T. Aquafaba, wastewater from chickpea canning, functions as an egg replacer in
sponge cake. Int. J. Food Sci. Technol. 2018, 53, 2247–2255. [CrossRef]32. Di Mattia, C.; Balestra, F.; Sacchetti, G.; Neri, L.; Mastrocola, D.; Pittia, P. Physical and structural properties of extra-virgin olive
oil based mayonnaise. LWT Food Sci. Technol. 2015, 62, 764–770. [CrossRef]33. Liu, H.; Xu, X.M.; Guo, S.D. Rheological, texture and sensory properties of low-fat mayonnaise with different fat mimetics. LWT
Food Sci. Technol. 2007, 40, 946–954. [CrossRef]34. Laca, A.; Sáenz, M.C.; Paredes, B.; Díaz, M. Rheological properties, stability and sensory evaluation of low-cholesterol mayon-
naises prepared using egg yolk granules as emulsifying agent. J. Food Eng. 2010, 97, 243–252. [CrossRef]35. McClements, D.J. Food Emulsions: Principles, Practices, and Techniques, 3rd ed.; CRC Press: Boca Raton, FL, USA, 2015; pp. 245–373.
[CrossRef]
90

Foods 2021, 10, 1978
36. Shi, C.; Lin, Z.; Xiao, X.; Zhai, X.; Ma, C.W.; Ren, J. Comparisons of Processing Stability and Antioxidant Activity of the SilkwormPupae Protein Hydrolysates by Spray-dry and Freeze-dry. Int. J. Food Eng. 2018, 14, 1–11. [CrossRef]
37. Kasran, M.; Cui, S.W.; Goff, H.D. Covalent attachment of fenugreek gum to soy whey protein isolate through natural Maillardreaction for improved emulsion stability. Food Hydrocoll. 2013, 30, 552–558. [CrossRef]
38. Xu, W.; Zhao, X.-H. Structure and property changes of the soy protein isolate glycated with maltose in an ionic liquid through theMaillard reaction. Food Funct. 2019, 10, 1948–1957. [CrossRef] [PubMed]
39. Yang, Y.; Cui, S.; Gong, J.; Miller, S.S.; Wang, Q.; Hua, Y. Stability of citral in oil-in-water emulsions protected by a soy protein–polysaccharide Maillard reaction product. Food Res. Int. 2015, 69, 357–363. [CrossRef]
40. Moros, J.E.; Franco, J.M.; Gallegos, C. Rheological properties of cholesterol-reduced, yolk-stabilized mayonnaise. J. Am. Oil Chem.Soc. 2002, 79, 837–843. [CrossRef]
41. Mangino, M.E. Protein interactions in emulsions: Protein-lipid interactions. In Protein Functionality in Food Systems; Hettiarachchy,N.S., Ziegler, G.R., Eds.; Marcel Dekker: New York, NY, USA, 1994; pp. 147–180.
42. Euston, S.R.; Hirst, R.L. Comparison of the concentration-dependent emulsifying properties of protein products containingaggregated and non-aggregated milk protein. Int. Dairy J. 1999, 9, 693–701. [CrossRef]
91

foods
Article
Effect of Vegetable Juice, Puree, and Pomace on Chemical andTechnological Quality of Fresh Pasta
Jinghong Wang 1,2, Margaret Anne Brennan 1, Charles Stephen Brennan 1,2,3 and Luca Serventi 1,*
Citation: Wang, J.; Brennan, M.A.;
Brennan, C.S.; Serventi, L. Effect of
Vegetable Juice, Puree, and Pomace
on Chemical and Technological
Quality of Fresh Pasta. Foods 2021, 10,
1931. https://doi.org/10.3390/
foods10081931
Academic Editor: Emanuele Zannini
Received: 23 July 2021
Accepted: 16 August 2021
Published: 20 August 2021
Publisher’s Note: MDPI stays neutral
with regard to jurisdictional claims in
published maps and institutional affil-
iations.
Copyright: © 2021 by the authors.
Licensee MDPI, Basel, Switzerland.
This article is an open access article
distributed under the terms and
conditions of the Creative Commons
Attribution (CC BY) license (https://
creativecommons.org/licenses/by/
4.0/).
1 Department of Wine, Food and Molecular Biosciences, Lincoln University, P.O. Box 85084,Lincoln 7647, New Zealand; [email protected] (J.W.);[email protected] (M.A.B.); [email protected] (C.S.B.)
2 Riddet Institute, Palmerston North 4442, New Zealand3 School of Science, RMIT University, P.O. Box 2474, Melbourne, VIC 3001, Australia* Correspondence: [email protected]; Tel.: +64-3-423-0860
Abstract: Vegetable pasta is a premium product, and its consumption may deliver health benefits byincreasing vegetable intake. This study investigated the replacement of semolina with juice, puree,and pomace of spinach and red cabbage. The effect of replacement on chemical composition, cookingperformance (cooking loss, swelling index, water absorption), texture quality (elasticity, firmness),and colour was evaluated. The cooking loss of pasta made with spinach juice and spinach puree at1 g/100 g substitution was the same as the control, while all other samples had a higher cooking loss.Spinach pasta had a higher breaking force but lower breaking distance in the tensile test than thecontrol, while red cabbage pasta had a lower breaking force and breaking distance. Spinach juicefortified pasta was firmer than the control. Red cabbage juice pasta was less firm than other forms offortified pasta at 1 g/100 g substitution level. Spinach and red cabbage juice are better colorants thanpuree or pomace as they change the colour of the pasta more dramatically at the same substitutionlevel. Cooking performance and texture quality of spinach juice pasta were better than other samples,which indicates a premium pasta product for the food industry.
Keywords: quality; texture; physicochemical; vegetable pasta; colour
1. Introduction
Pasta is a staple cereal food worldwide and it is a good vehicle for delivering func-tional ingredients [1,2]. Vegetables contain many health-promoting phytochemicals thattraditional pasta lacks [3]. Those phytochemicals include dietary fibre, vitamins, polyphe-nols, carotenoids, glucosinolates, and minerals. Even though consumers are aware of thehealth benefits of consuming vegetables, their ingrained eating habits prevent them froma sufficient vegetable intake [4]. Hence, incorporating vegetables in staple foods such aspasta or bread may be a good option.
Vegetable pasta has been studied by many researchers [5,6]. An inferior cookingand sensory quality of vegetable pasta have been frequently reported compared to thetraditional product [7–10]. Quality changes typically include increased cooking loss (CL),decreased firmness, and elasticity [1]. Authors substituted semolina for vegetable pow-der [7,11,12]. The powder is not only involved in nutrition loss due to air oven-drying [13],but also related to solid particle-size associated quality impact [14]. Hence, pasta enriched withother forms of vegetables, such as puree, juice, and pomace, were investigated in this study.
There are a few studies that have used other forms of vegetables to enhance pasta. Forexample, Gull et al. [15] added carrot pomace powder to a pasta formula, while Simonatoet al. [16] used 5–10% olive pomace to fortify pasta. Carini et al. [17] added carrot juiceto pasta and found that carrot juice pasta had similar extensibility and CL compared tothe control, while carrot flour enriched pasta had a very high CL (more than 8 g/100 g)and lower extensibility, which indicates inferior quality. This study’s limitation is that
Foods 2021, 10, 1931. https://doi.org/10.3390/foods10081931 https://www.mdpi.com/journal/foods93
Foods 2021, 10, 1931
the actual substitution level (based on the dry matter) of carrot flour is much higher thancarrot juice so that it is not a like for like comparison. Rakhesh et al. [18] made use ofcarrot, spinach, tomato, and beetroot puree to fortify pasta and found a decreased CL andimproved texture of the resultant pasta. This study lacks comparison with the powderform and the description of puree-semolina mixing procedure is unclear. Juice and pureeaddition also have limitations when combined with pasta. Juice contains a very lowlevel of solids, mostly around 5–15% for fresh vegetable juice [19]. Thus, achieving ahigh substitution level based on dry matter may be impossible for juice and puree dueto excessive hydration, which can cause large lump formation, resulting in difficultiesin successful extrusion [20,21]. The water content of juice and puree makes them moredifficult to store and transport and may cause an increased cost for the food industry.
This project investigated the optimum method of vegetable fortification to producevegetable-enriched pasta with better texture and cooking quality. The aim was to comparethe key chemical composition, cooking performance, and texture quality of vegetablefortified pasta produced using vegetable juice, puree, and pomace. Our preliminarystudy showed that vegetable powder shows no significant difference with vegetable pureewhen added to pasta in key technical tests such as elasticity, firmness, and cooking loss.However, the nutritional quality (e.g., antioxidant ability) of powder enriched pasta waslower than puree enriched pasta. This may be due to the oven drying used to produce thevegetable powder. Therefore, the powder was altered to puree in our study. Two kinds ofleafy vegetables, spinach (Spinacia oleracea L.) and red cabbage (Brassica oleracea convar.capitata var. capitata f. rubra), were selected in this study. Spinach is cheap and widelyavailable. It is considered to have antioxidant and antidiabetic effects [22]. Spinach is alsowidely accepted by the food industry to produce commercially available green pasta. Redcabbage is nutritious as it is high in fibre and antioxidant phytochemicals [23]. Red cabbagematerials in this study created a novel purple coloured pasta.
2. Materials and Methods
2.1. Raw Material
Semolina (Sun Valley Foods Ltd., Hamilton, New Zealand, labeled protein = 10.7 g/100 g,Fibre = 2.1 g/100 g, sodium = 10 mg/100 g), fresh spinach, and red cabbage were broughtfrom the local market (New World Supermarket, Lincoln, New Zealand).
2.2. Vegetable Preparation
Spinach and red cabbage were washed thoroughly, their roots were removed witha sharp knife, the stem and leaf were put into the juicer (Model: Oscar Neo DA 1000;NATURE’S WONDERLAND Ltd., Brisbane, Australia), and the pomace and juice werecollected separately. The vegetable juice was placed into a separate glass jar with a cap andstored at −18 ◦C until use. The pomace was spread in a backed tray and put into an oven todry at 60 ◦C for 7 h. The dried pomace was then ground to a powder with a coffee grinderfor 10 s twice, and the resultant pomace powder was stored in a Ziplock plastic bag at roomtemperature. The spinach puree and red cabbage puree were produced by mixing juiceand fresh pomace together using a blender (Nutri-bullet NBO7200-1210DG; CapitalbrandsLtd., Boston, MA, USA), then the spinach puree and red cabbage were collected in a glassjar with a cap and stored at −18 ◦C. Before use, the puree was defrosted and put into theblender again to homogenise.
2.3. Pasta Preparation
Pasta was prepared using a lab-scale pasta machine (Model: MPF15N235M; Firmer.,Ravenna, Italy) with 20 holes of 2.25 mm diameter. The vegetable pomace fortified pastawas prepared by mixing pomace with semolina in a pasta machine, and then 40 ◦C waterwas added according to the manual of the device to extrude the pasta. The formula isshown in Table 1. The puree and juice were defrosted and warmed to 40 ◦C in a water bath.Then, the puree, or juice, and 40 ◦C water were added to semolina in the pasta machine
94
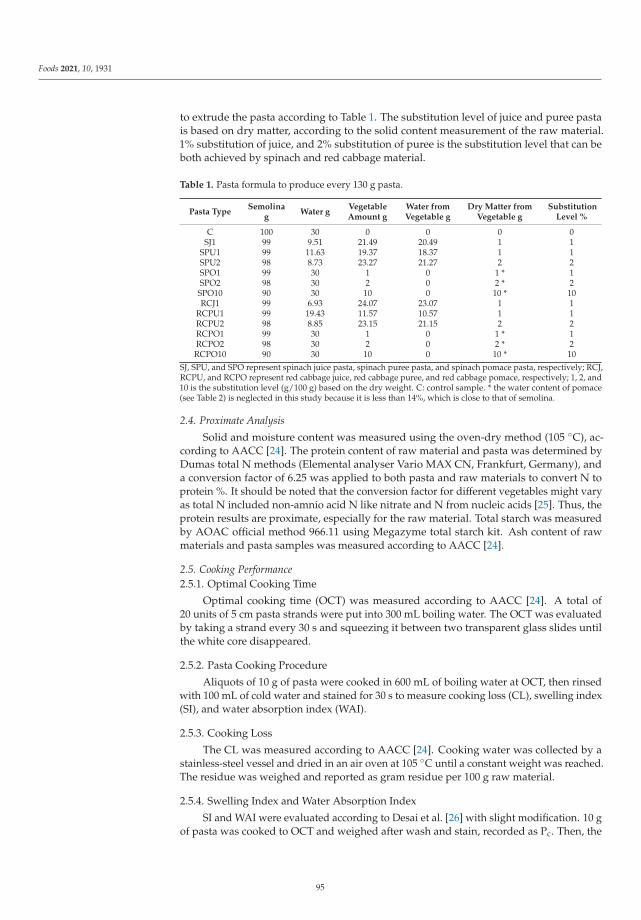
Foods 2021, 10, 1931
to extrude the pasta according to Table 1. The substitution level of juice and puree pastais based on dry matter, according to the solid content measurement of the raw material.1% substitution of juice, and 2% substitution of puree is the substitution level that can beboth achieved by spinach and red cabbage material.
Table 1. Pasta formula to produce every 130 g pasta.
Pasta TypeSemolina
gWater g
VegetableAmount g
Water fromVegetable g
Dry Matter fromVegetable g
SubstitutionLevel %
C 100 30 0 0 0 0SJ1 99 9.51 21.49 20.49 1 1
SPU1 99 11.63 19.37 18.37 1 1SPU2 98 8.73 23.27 21.27 2 2SPO1 99 30 1 0 1 * 1SPO2 98 30 2 0 2 * 2
SPO10 90 30 10 0 10 * 10RCJ1 99 6.93 24.07 23.07 1 1
RCPU1 99 19.43 11.57 10.57 1 1RCPU2 98 8.85 23.15 21.15 2 2RCPO1 99 30 1 0 1 * 1RCPO2 98 30 2 0 2 * 2RCPO10 90 30 10 0 10 * 10
SJ, SPU, and SPO represent spinach juice pasta, spinach puree pasta, and spinach pomace pasta, respectively; RCJ,RCPU, and RCPO represent red cabbage juice, red cabbage puree, and red cabbage pomace, respectively; 1, 2, and10 is the substitution level (g/100 g) based on the dry weight. C: control sample. * the water content of pomace(see Table 2) is neglected in this study because it is less than 14%, which is close to that of semolina.
2.4. Proximate Analysis
Solid and moisture content was measured using the oven-dry method (105 ◦C), ac-cording to AACC [24]. The protein content of raw material and pasta was determined byDumas total N methods (Elemental analyser Vario MAX CN, Frankfurt, Germany), anda conversion factor of 6.25 was applied to both pasta and raw materials to convert N toprotein %. It should be noted that the conversion factor for different vegetables might varyas total N included non-amnio acid N like nitrate and N from nucleic acids [25]. Thus, theprotein results are proximate, especially for the raw material. Total starch was measuredby AOAC official method 966.11 using Megazyme total starch kit. Ash content of rawmaterials and pasta samples was measured according to AACC [24].
2.5. Cooking Performance2.5.1. Optimal Cooking Time
Optimal cooking time (OCT) was measured according to AACC [24]. A total of20 units of 5 cm pasta strands were put into 300 mL boiling water. The OCT was evaluatedby taking a strand every 30 s and squeezing it between two transparent glass slides untilthe white core disappeared.
2.5.2. Pasta Cooking Procedure
Aliquots of 10 g of pasta were cooked in 600 mL of boiling water at OCT, then rinsedwith 100 mL of cold water and stained for 30 s to measure cooking loss (CL), swelling index(SI), and water absorption index (WAI).
2.5.3. Cooking Loss
The CL was measured according to AACC [24]. Cooking water was collected by astainless-steel vessel and dried in an air oven at 105 ◦C until a constant weight was reached.The residue was weighed and reported as gram residue per 100 g raw material.
2.5.4. Swelling Index and Water Absorption Index
SI and WAI were evaluated according to Desai et al. [26] with slight modification. 10 gof pasta was cooked to OCT and weighed after wash and stain, recorded as Pc. Then, the
95
Foods 2021, 10, 1931
cooked pasta was dried at 105 ◦C until a constant weight was reached, recorded as Pcd.SI and WAI can be calculated with the following Equations (1) and (2):
SI = (Pc − Pcd)/Pcd (1)
WAI = (Pc − Pu)/Pu ∗ 100 (2)
Pu is the weight of uncooked pasta, Pc is the weight of cooked pasta, Pcd is the weight ofdried, cooked pasta.
2.6. Texture Measurement
The firmness, breaking distance, and breaking force was measured by a TextureAnalyser (TA.XT2; Stable Micro systems, Godalming, UK) with a 5 kg load cell. The pastawas cooked to OCT as described above before test. Firmness test is according to ApprovedMethod 66-50 [24], with some modifications. Five strands of cooked pasta were placed ona flat metal plate. A noodle blade was used to compress the cooked pasta strands. The testparameters were set as test speed = 0.2 mm/s, post test speed = 10 mm/s, and distance of5 mm. Tension test setting was according to [27]. The A/SPR spaghetti/noodle rig (Settings:Pre-test speed, 3 mm/s; test speed, 3 mm/s; initial distance, 10 mm; Final Distance 120 mm)was used in the test. Data are represented as the mean of nine measurements from triplicatecooking batches.
2.7. Colour Measurement
A portable colour meter (Minolta Chroma Meter CR210; Minolta Camera Co., Japan)was used to measure cooked (to OCT) and uncooked pasta. Each pasta was measured ninetimes from the triplicate cooking batches, and the result was expressed as L * (brightnessrange from 100 to 0), a * (redness–greenness range from 128 to −128), b * (yellowness–blueness range from 128 to −128). The instrument was calibrated using a standard whitetile (L * = 98.03, a * = −0.23, b * = 0.25).
2.8. Statistical Analysis
All experiments were performed in triplicate except for what has been mentioned.All data were statistical analysed by one-way ANOVA, and the difference was evaluatedby the Duncan test. SPSS (version 16) was used to perform data and figures.
3. Results and Discussion
3.1. Proximate Composition of Vegetable Pasta
The protein, moisture, and ash content of spinach and red cabbage pasta are shownin Table 2. The protein content in pasta is essential as it is the key of pasta structure.In pasta, gluten protein can be described as the backbone, with starch granules trappedin it playing a crucial function in pasta structure [28]. It is widely accepted that thisstructure is mainly maintained by disulfide bonds with the help of other non-covalentinteractions like hydrogen bonds and ionic bonds [29–31]. It is suggested that protein-richmaterial may result in protein–protein interaction and form a more cohesive structure, thushelping the gluten form a homogeneous pasta structure [32]. Table 2 (a) shows that spinachraw material is rich in protein, ranked by protein content the spinach pasta is as followsSJ > SPU > SPO based on the dry weight. As a result, all the uncooked spinach pastashows a significantly higher (p < 0.05) protein content than the control. Lisiewska et al. [33]reported that raw spinach contains 36 ± 12 mg/100 g cysteine content, around 1.5% of itstotal amino acid composition. Cysteine can provide sulfhydryl groups to form disulphidebonds during dough formation [34]. It indicates that protein from spinach may positivelyimpact the formation of a gluten network and pasta quality. For cooked pasta, higherprotein content was observed compared to raw. A similar trend was found by Mantheyand Hall III [35], who use buckwheat bran flour to enrich pasta. It is possibly due to theleaching of starch into the cooking water, increasing the proportion of protein content in
96
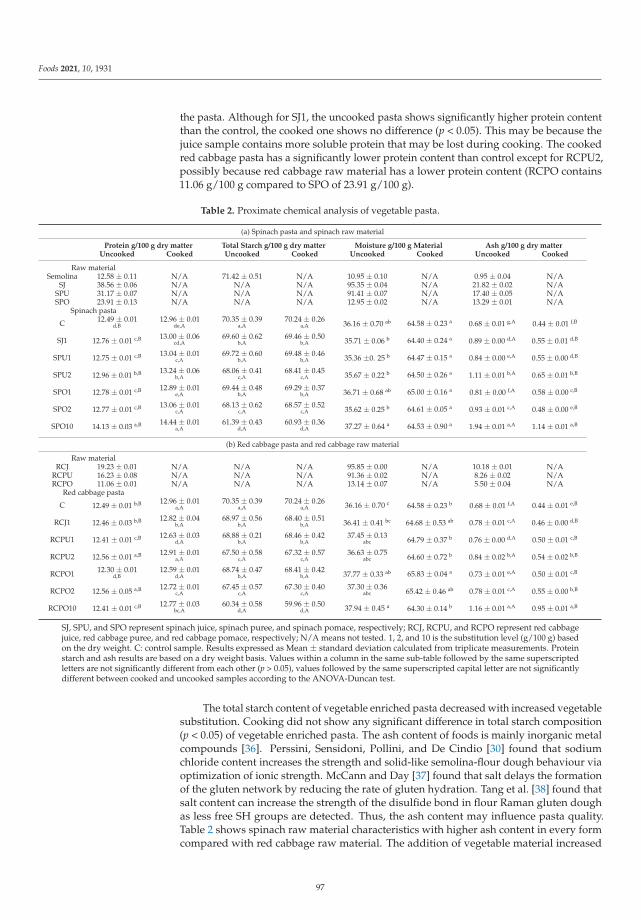
Foods 2021, 10, 1931
the pasta. Although for SJ1, the uncooked pasta shows significantly higher protein contentthan the control, the cooked one shows no difference (p < 0.05). This may be because thejuice sample contains more soluble protein that may be lost during cooking. The cookedred cabbage pasta has a significantly lower protein content than control except for RCPU2,possibly because red cabbage raw material has a lower protein content (RCPO contains11.06 g/100 g compared to SPO of 23.91 g/100 g).
Table 2. Proximate chemical analysis of vegetable pasta.
(a) Spinach pasta and spinach raw material
Protein g/100 g dry matter Total Starch g/100 g dry matter Moisture g/100 g Material Ash g/100 g dry matterUncooked Cooked Uncooked Cooked Uncooked Cooked Uncooked Cooked
Raw materialSemolina 12.58 ± 0.11 N/A 71.42 ± 0.51 N/A 10.95 ± 0.10 N/A 0.95 ± 0.04 N/A
SJ 38.56 ± 0.06 N/A N/A N/A 95.35 ± 0.04 N/A 21.82 ± 0.02 N/ASPU 31.17 ± 0.07 N/A N/A N/A 91.41 ± 0.07 N/A 17.40 ± 0.05 N/ASPO 23.91 ± 0.13 N/A N/A N/A 12.95 ± 0.02 N/A 13.29 ± 0.01 N/A
Spinach pasta
C 12.49 ± 0.01d,B
12.96 ± 0.01de,A
70.35 ± 0.39a,A
70.24 ± 0.26a,A 36.16 ± 0.70 ab 64.58 ± 0.23 a 0.68 ± 0.01 g,A 0.44 ± 0.01 f,B
SJ1 12.76 ± 0.01 c,B 13.00 ± 0.06cd,A
69.60 ± 0.62b,A
69.46 ± 0.50b,A 35.71 ± 0.06 b 64.40 ± 0.24 a 0.89 ± 0.00 d,A 0.55 ± 0.01 d,B
SPU1 12.75 ± 0.01 c,B 13.04 ± 0.01c,A
69.72 ± 0.60b,A
69.48 ± 0.46b,A 35.36 ±0. 25 b 64.47 ± 0.15 a 0.84 ± 0.00 e,A 0.55 ± 0.00 d,B
SPU2 12.96 ± 0.01 b,B 13.24 ± 0.06b,A
68.06 ± 0.41c,A
68.41 ± 0.45c,A 35.67 ± 0.22 b 64.50 ± 0.26 a 1.11 ± 0.01 b,A 0.65 ± 0.01 b,B
SPO1 12.78 ± 0.01 c,B 12.89 ± 0.01e,A
69.44 ± 0.48b,A
69.29 ± 0.37b,A 36.71 ± 0.68 ab 65.00 ± 0.16 a 0.81 ± 0.00 f,A 0.58 ± 0.00 c,B
SPO2 12.77 ± 0.01 c,B 13.06 ± 0.01c,A
68.13 ± 0.62c,A
68.57 ± 0.52c,A 35.62 ± 0.25 b 64.61 ± 0.05 a 0.93 ± 0.01 c,A 0.48 ± 0.00 e,B
SPO10 14.13 ± 0.03 a,B 14.44 ± 0.01a,A
61.39 ± 0.43d,A
60.93 ± 0.36d,A 37.27 ± 0.64 a 64.53 ± 0.90 a 1.94 ± 0.01 a,A 1.14 ± 0.01 a,B
(b) Red cabbage pasta and red cabbage raw material
Raw materialRCJ 19.23 ± 0.01 N/A N/A N/A 95.85 ± 0.00 N/A 10.18 ± 0.01 N/A
RCPU 16.23 ± 0.08 N/A N/A N/A 91.36 ± 0.02 N/A 8.26 ± 0.02 N/ARCPO 11.06 ± 0.01 N/A N/A N/A 13.14 ± 0.07 N/A 5.50 ± 0.04 N/A
Red cabbage pasta
C 12.49 ± 0.01 b,B 12.96 ± 0.01a,A
70.35 ± 0.39a,A
70.24 ± 0.26a,A 36.16 ± 0.70 c 64.58 ± 0.23 b 0.68 ± 0.01 f,A 0.44 ± 0.01 e,B
RCJ1 12.46 ± 0.03 b,B 12.82 ± 0.04b,A
68.97 ± 0.56b,A
68.40 ± 0.51b,A 36.41 ± 0.41 bc 64.68 ± 0.53 ab 0.78 ± 0.01 c,A 0.46 ± 0.00 d,B
RCPU1 12.41 ± 0.01 c,B 12.63 ± 0.03d,A
68.88 ± 0.21b,A
68.46 ± 0.42b,A
37.45 ± 0.13abc 64.79 ± 0.37 b 0.76 ± 0.00 d,A 0.50 ± 0.01 c,B
RCPU2 12.56 ± 0.01 a,B 12.91 ± 0.01a,A
67.50 ± 0.58c,A
67.32 ± 0.57c,A
36.63 ± 0.75abc 64.60 ± 0.72 b 0.84 ± 0.02 b,A 0.54 ± 0.02 b,B
RCPO1 12.30 ± 0.01d,B
12.59 ± 0.01d,A
68.74 ± 0.47b,A
68.41 ± 0.42b,A 37.77 ± 0.33 ab 65.83 ± 0.04 a 0.73 ± 0.01 e,A 0.50 ± 0.01 c,B
RCPO2 12.56 ± 0.05 a,B 12.72 ± 0.01c,A
67.45 ± 0.57c,A
67.30 ± 0.40c,A
37.30 ± 0.36abc 65.42 ± 0.46 ab 0.78 ± 0.01 c,A 0.55 ± 0.00 b,B
RCPO10 12.41 ± 0.01 c,B 12.77 ± 0.03bc,A
60.34 ± 0.58d,A
59.96 ± 0.50d,A 37.94 ± 0.45 a 64.30 ± 0.14 b 1.16 ± 0.01 a,A 0.95 ± 0.01 a,B
SJ, SPU, and SPO represent spinach juice, spinach puree, and spinach pomace, respectively; RCJ, RCPU, and RCPO represent red cabbagejuice, red cabbage puree, and red cabbage pomace, respectively; N/A means not tested. 1, 2, and 10 is the substitution level (g/100 g) basedon the dry weight. C: control sample. Results expressed as Mean ± standard deviation calculated from triplicate measurements. Proteinstarch and ash results are based on a dry weight basis. Values within a column in the same sub-table followed by the same superscriptedletters are not significantly different from each other (p > 0.05), values followed by the same superscripted capital letter are not significantlydifferent between cooked and uncooked samples according to the ANOVA-Duncan test.
The total starch content of vegetable enriched pasta decreased with increased vegetablesubstitution. Cooking did not show any significant difference in total starch composition(p < 0.05) of vegetable enriched pasta. The ash content of foods is mainly inorganic metalcompounds [36]. Perssini, Sensidoni, Pollini, and De Cindio [30] found that sodiumchloride content increases the strength and solid-like semolina-flour dough behaviour viaoptimization of ionic strength. McCann and Day [37] found that salt delays the formationof the gluten network by reducing the rate of gluten hydration. Tang et al. [38] found thatsalt content can increase the strength of the disulfide bond in flour Raman gluten doughas less free SH groups are detected. Thus, the ash content may influence pasta quality.Table 2 shows spinach raw material characteristics with higher ash content in every formcompared with red cabbage raw material. The addition of vegetable material increased
97
Foods 2021, 10, 1931
the ash content of vegetable pasta significantly (p < 0.05) in every sample. This result issimilar to Prabhasankar et al. [39], who used Japanese seaweed to fortify pasta. The ashcontent indicates a higher mineral content in those samples. Cooking causes a decreasedash content of vegetable pasta. It may be because some metal in ash is present in a water-soluble form and is lost during cooking. Desai, Brennan, and Brennan [26] found similartrends showing that cooked fish powder fortified pasta had a lower ash content thanbefore cooking.
3.2. Cooking Quality of Vegetable Pasta
Optimal cooking time (OCT), cooking loss (CL), swelling index (SI), and water ab-sorption index (WAI) are crucial cooking quality attributes of pasta [20]. Those attributesare strongly influenced by the protein–starch matrix formed during cold extrusion [31].A good quality pasta has a compact protein–starch matrix, which slows the diffusion ofthe water to the starch core and inhibits amylose leaching into cooking water, giving alonger OCT and a decreased CL [40]. Table 3 shows that red cabbage content increases thecooking loss significantly. The CL of red cabbage pasta ranged from 4.767 to 6.163 g/100 g,compared to 4.399 g/100 g of the control sample. The CL values of the spinach juicepasta and spinach puree pasta shows no significant difference at 1 g/100 g substitutionlevel versus the control. Other spinach pasta samples show increased cooking loss (from4.447 to 5.920 g/100 g) compared to control. The increased CL indicates a weaker glutenmatrix, which may be caused by fibre disruption, competition for water between glutenprotein and other compounds (such as water-soluble fibre and soluble salt), and a dilutionof gluten, which is caused by the substitution of semolina with vegetable material. Thepasta with red cabbage pomace had a higher cooking loss than puree or juice sample atthe same substitution level (RCPO1 > RCPU1, RCPO1 > RCJ1, RCPO2 > RCPU2). Thismay be because it contained less protein compared to pasta made with puree or juice,as shown in Table 2. The protein content and their properties can influence the glutennetwork formation and pasta structure [20]. The higher protein content in juice and pureecan potentially interact with gluten, hence decreasing the disruptive effect caused by fibreand diluted gluten. Carini, Curti, Spotti, and Vittadini [17] found that carrot juice pasta hasa much lower CL than pasta with carrot flour. However, the substitution level of carrotjuice and carrot flour in that research was not standardised. Kowalczewski et al. [41] reportthe CL of fresh potato juice fortified pasta is lower than that fortified by spray-dried potatojuice. All the vegetable pasta in this study had a CL lower than 8 g/100 g, which is a widelyagreed maximum value for consumer acceptability [20,42].
The OCT is not changed in the vegetable pasta of all 1 g/100 g, 2 g/100 g samples,possibly because at low substitution levels the gluten network is not significantly changedto create a measurable impact. However, at a substitution level of 10 g/100 g, SPO10 andRCPO10 have a shorter optimal cooking time (Table 3). The decreased OCT may be causedby decreased water absorption (from 81.27 g/100 g of control to 74.11 g/100 g of SPO10and 73:80 g/100 g of RCPO10). Similar results were found by Aravind et al. [43] usinginulin (soluble fibre) to enrich pasta, and a lower OCT was reported. Cárdenas-Hernándezet al. [44] also found OCT was decreased when amaranth flour and amaranth leaves andcarboxymethylcellulose were added to semolina to produce pasta. In contrast, Foschiaet al. [45] found an increased OCT when using 15 g/100 g dietary fibre (such as long-chaininulin, psyllium, or Glucagel) to substitute semolina.
The swelling index (SI) and water absorption index (WAI) reflect the amount of waterabsorbed at OCT. Table 3 shows that all spinach pasta samples show the same swellingindex compared to control. Similar results were reported by Yadav et al. [46], which showsspinach pasta has no significant difference in water absorption versus control. Red cabbagepomace samples (RCPO1, RCPO10) show a lower WAI (p < 0.05) compared to control,while red cabbage juice and puree pasta show no significant SI and WAI difference versuscontrol. It is potentially because the components of the red cabbage pomace have lessaffinity for water than the components of the red cabbage juice or puree. The results of
98
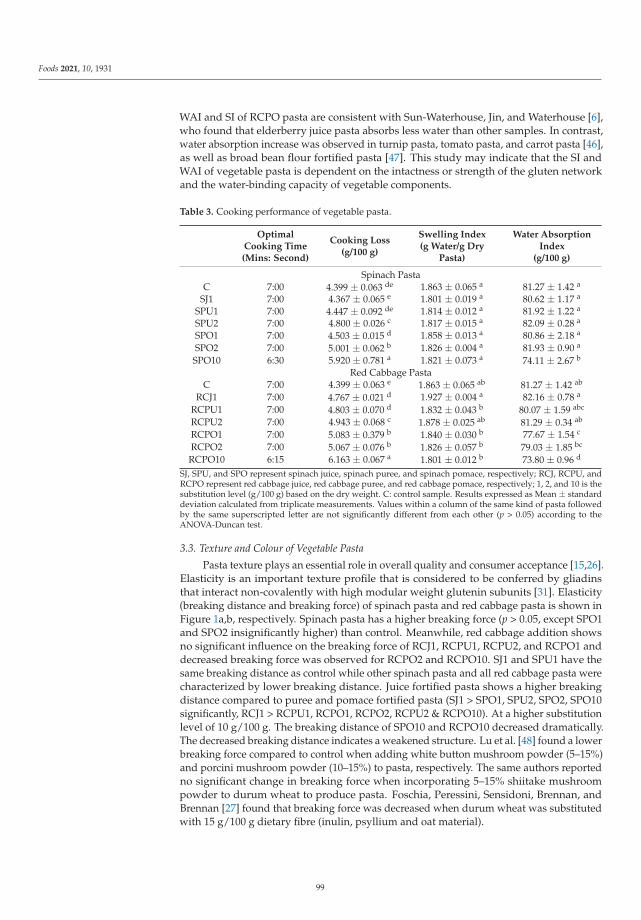
Foods 2021, 10, 1931
WAI and SI of RCPO pasta are consistent with Sun-Waterhouse, Jin, and Waterhouse [6],who found that elderberry juice pasta absorbs less water than other samples. In contrast,water absorption increase was observed in turnip pasta, tomato pasta, and carrot pasta [46],as well as broad bean flour fortified pasta [47]. This study may indicate that the SI andWAI of vegetable pasta is dependent on the intactness or strength of the gluten networkand the water-binding capacity of vegetable components.
Table 3. Cooking performance of vegetable pasta.
OptimalCooking Time(Mins: Second)
Cooking Loss(g/100 g)
Swelling Index(g Water/g Dry
Pasta)
Water AbsorptionIndex
(g/100 g)
Spinach PastaC 7:00 4.399 ± 0.063 de 1.863 ± 0.065 a 81.27 ± 1.42 a
SJ1 7:00 4.367 ± 0.065 e 1.801 ± 0.019 a 80.62 ± 1.17 a
SPU1 7:00 4.447 ± 0.092 de 1.814 ± 0.012 a 81.92 ± 1.22 a
SPU2 7:00 4.800 ± 0.026 c 1.817 ± 0.015 a 82.09 ± 0.28 a
SPO1 7:00 4.503 ± 0.015 d 1.858 ± 0.013 a 80.86 ± 2.18 a
SPO2 7:00 5.001 ± 0.062 b 1.826 ± 0.004 a 81.93 ± 0.90 a
SPO10 6:30 5.920 ± 0.781 a 1.821 ± 0.073 a 74.11 ± 2.67 b
Red Cabbage PastaC 7:00 4.399 ± 0.063 e 1.863 ± 0.065 ab 81.27 ± 1.42 ab
RCJ1 7:00 4.767 ± 0.021 d 1.927 ± 0.004 a 82.16 ± 0.78 a
RCPU1 7:00 4.803 ± 0.070 d 1.832 ± 0.043 b 80.07 ± 1.59 abc
RCPU2 7:00 4.943 ± 0.068 c 1.878 ± 0.025 ab 81.29 ± 0.34 ab
RCPO1 7:00 5.083 ± 0.379 b 1.840 ± 0.030 b 77.67 ± 1.54 c
RCPO2 7:00 5.067 ± 0.076 b 1.826 ± 0.057 b 79.03 ± 1.85 bc
RCPO10 6:15 6.163 ± 0.067 a 1.801 ± 0.012 b 73.80 ± 0.96 d
SJ, SPU, and SPO represent spinach juice, spinach puree, and spinach pomace, respectively; RCJ, RCPU, andRCPO represent red cabbage juice, red cabbage puree, and red cabbage pomace, respectively; 1, 2, and 10 is thesubstitution level (g/100 g) based on the dry weight. C: control sample. Results expressed as Mean ± standarddeviation calculated from triplicate measurements. Values within a column of the same kind of pasta followedby the same superscripted letter are not significantly different from each other (p > 0.05) according to theANOVA-Duncan test.
3.3. Texture and Colour of Vegetable Pasta
Pasta texture plays an essential role in overall quality and consumer acceptance [15,26].Elasticity is an important texture profile that is considered to be conferred by gliadinsthat interact non-covalently with high modular weight glutenin subunits [31]. Elasticity(breaking distance and breaking force) of spinach pasta and red cabbage pasta is shown inFigure 1a,b, respectively. Spinach pasta has a higher breaking force (p > 0.05, except SPO1and SPO2 insignificantly higher) than control. Meanwhile, red cabbage addition showsno significant influence on the breaking force of RCJ1, RCPU1, RCPU2, and RCPO1 anddecreased breaking force was observed for RCPO2 and RCPO10. SJ1 and SPU1 have thesame breaking distance as control while other spinach pasta and all red cabbage pasta werecharacterized by lower breaking distance. Juice fortified pasta shows a higher breakingdistance compared to puree and pomace fortified pasta (SJ1 > SPO1, SPU2, SPO2, SPO10significantly, RCJ1 > RCPU1, RCPO1, RCPO2, RCPU2 & RCPO10). At a higher substitutionlevel of 10 g/100 g. The breaking distance of SPO10 and RCPO10 decreased dramatically.The decreased breaking distance indicates a weakened structure. Lu et al. [48] found a lowerbreaking force compared to control when adding white button mushroom powder (5–15%)and porcini mushroom powder (10–15%) to pasta, respectively. The same authors reportedno significant change in breaking force when incorporating 5–15% shiitake mushroompowder to durum wheat to produce pasta. Foschia, Peressini, Sensidoni, Brennan, andBrennan [27] found that breaking force was decreased when durum wheat was substitutedwith 15 g/100 g dietary fibre (inulin, psyllium and oat material).
99
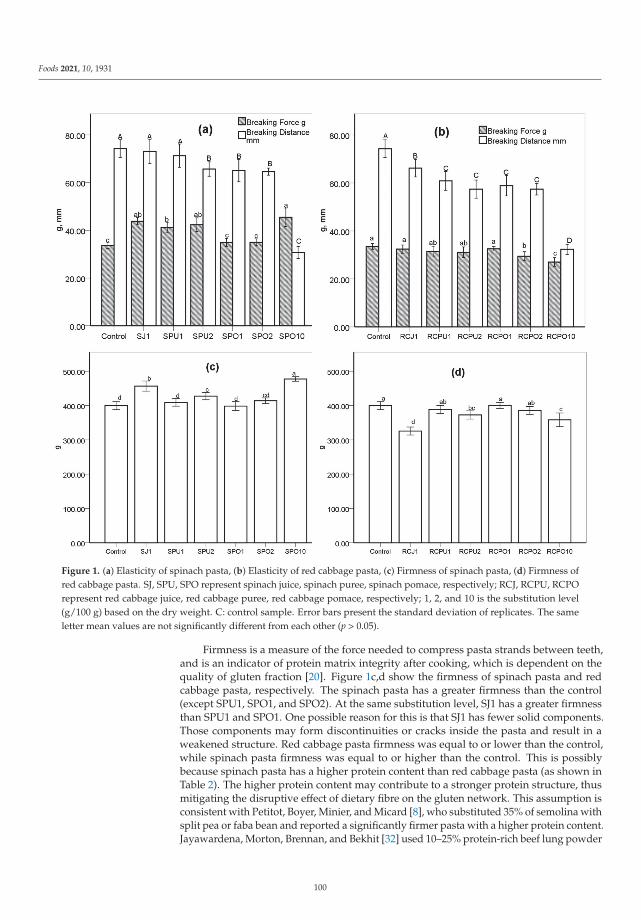
Foods 2021, 10, 1931
Figure 1. (a) Elasticity of spinach pasta, (b) Elasticity of red cabbage pasta, (c) Firmness of spinach pasta, (d) Firmness ofred cabbage pasta. SJ, SPU, SPO represent spinach juice, spinach puree, spinach pomace, respectively; RCJ, RCPU, RCPOrepresent red cabbage juice, red cabbage puree, red cabbage pomace, respectively; 1, 2, and 10 is the substitution level(g/100 g) based on the dry weight. C: control sample. Error bars present the standard deviation of replicates. The sameletter mean values are not significantly different from each other (p > 0.05).
Firmness is a measure of the force needed to compress pasta strands between teeth,and is an indicator of protein matrix integrity after cooking, which is dependent on thequality of gluten fraction [20]. Figure 1c,d show the firmness of spinach pasta and redcabbage pasta, respectively. The spinach pasta has a greater firmness than the control(except SPU1, SPO1, and SPO2). At the same substitution level, SJ1 has a greater firmnessthan SPU1 and SPO1. One possible reason for this is that SJ1 has fewer solid components.Those components may form discontinuities or cracks inside the pasta and result in aweakened structure. Red cabbage pasta firmness was equal to or lower than the control,while spinach pasta firmness was equal to or higher than the control. This is possiblybecause spinach pasta has a higher protein content than red cabbage pasta (as shown inTable 2). The higher protein content may contribute to a stronger protein structure, thusmitigating the disruptive effect of dietary fibre on the gluten network. This assumption isconsistent with Petitot, Boyer, Minier, and Micard [8], who substituted 35% of semolina withsplit pea or faba bean and reported a significantly firmer pasta with a higher protein content.Jayawardena, Morton, Brennan, and Bekhit [32] used 10–25% protein-rich beef lung powder
100
Foods 2021, 10, 1931
added to durum wheat, and the resultant pasta had a significantly higher firmness andbreaking force. The firmness of RCJ1 is the lowest of all tested samples, possibly becauseof more water swelling (see Table 3 swelling index) by the starch granules, which in turncreated a softer texture. Foschia, Peressini, Sensidoni, Brennan, and Brennan [27] foundthat incorporating short-chain inulin leads to a dramatic decrease in pasta firmness andincreased water absorption. Gull, Prasad, and Kumar [15] reported a significantly lowerfirmness than control when 2–10% carrot pomace was added to the pasta formula.
It may be assumed that the texture profile of vegetable pasta is dependent on thevegetable components. Some components such as fibre and sugar may adversely affect theoverall texture and cooking quality as they influence the water absorption, thus causinga change in the hydration process of the starch granules and the gluten network. Fibreparticles dilute the gluten and therefore also contribute to gluten network disruption andpotentially weaken the structure. Other components, such as protein, may generally havesome beneficial effects such as strengthening the gluten network and other interactionsto enhance the structure, such as increasing the firmness and breaking force. The overalltexture and cooking quality are dependent on the balance of such adverse and beneficialeffects from vegetable components. SJ1 in this study provides outstanding cooking andtexture quality, with the identical cooking loss, water absorption, and breaking distancecompared with control. It also has higher firmness and breaking force than control, thusproduces al dente products with a firm, elastic texture. A low substitution level (1 g/100 gaccording to dry matter), juice form (lower solid particles), and higher protein content thandurum wheat may contribute to its distinctive texture quality.
Colour results of vegetable pasta are shown in Table 4. The colour of vegetable pastais strongly influenced by vegetable addition. Red cabbage pasta has lower brightness andyellowness (less L * and b * value) and higher redness (increased a * value) compared to thecontrol. When comparing the different forms of vegetables, the juice’s dye effect is strongerthan puree or pomace as RCJ1 (both raw and cooked) has lower brightness and yellownessand more redness than RCPU1 and RCPO1. After cooking, the red cabbage pasta tendsto be brighter but less red and yellow. Possibly due to the fact that the phytochemicalsthat provide the colour are water-soluble and leach into the cooking water. Chigurupatiet al. [49] found that red cabbage colour is water-soluble and sensitive to pH change. It wasfound that the red cabbage colour changed from purple to deep blue when pH changedfrom acid to neutral. This could explain why cooked red cabbage pasta tends to be bluer(lower b * value except for RCPU1) and the cooking water presents a slightly blue colouras the water boils, leading to acid evaporation [50]; thus, the pH of cooking water tends tobe neutral. Spinach addition leads to the decreased brightness, redness, and yellowness(L *, a *, b *, respectively) of the resultant pasta. Cooking procedure decreases the lightness,greenness, and yellowness of spinach pasta. Interestingly, the yellowness decrease ofcooked spinach pasta is much lower than control (from 29.58 to 13.74 of control vs. 13.05 to11.03 of SJ1, for example), indicating that spinach reduces the yellowness decrease duringcooking. This is consistent with Nisha et al. [51], who found that thermal treatment causesa decrease in lightness and greenness but improved yellowness of spinach puree.
101
Foods 2021, 10, 1931
Table 4. Colour characteristics of cooked and uncooked pasta enriched with spinach and red cabbage.
Uncooked Cooked
L a bColour
ExampleL a b
ColourExample
Spinach PastaC 65.38 ± 0.40 a −0.36 ± 0.07 a 29.58 ± 0.18 a 61.68 ± 0.30 a −0.66 ± 0.02 a 13.74 ± 0.02 a
SJ1 43.04 ± 0.21 f −9.75 ± 0.09 g 13.05 ± 0.18 c 40.16 ± 0.19 e −7.71 ± 0.15 g 11.03 ± 0.06 b
SPU1 49.56 ± 0.11 c −9.59 ± 0.02 f 14.79 ± 0.03 b 43.63 ± 0.04 c −6.85 ± 0.07 f 10.39 ± 0.26 c
SPU2 45.66 ± 0.09 e −7.30 ± 0.03 e 10.68 ± 0.03 e 40.06 ± 0.41 e −6.25 ± 0.13 e 9.27 ± 0.16 d
SPO1 51.02 ± 0.46 b −5.12 ± 0.20 b 12.69 ± 0.11 d 46.49 ± 0.31 b −4.79 ± 0.19 d 7.93 ± 0.38 e
SPO2 48.54 ± 0.44 d −7.07 ± 0.09 d 10.23 ± 0.29 f 41.43 ± 0.26 d −4.54 ± 0.27 c 7.36 ± 0.23 f
SPO10 38.74 ± 0.12 g −5.78 ± 0.06 c 7.60 ± 0.17 g 29.83 ± 0.08 f −3.45 ± 0.09 b 4.95 ± 0.04 g
Red Cabbage PastaC 65.38 ± 0.40 a −0.36 ± 0.07 g 29.58 ± 0.18 a 61.68 ± 0.30 a −0.66 ± 0.02 e 13.74 ± 0.02 a
RCJ1 41.93 ± 0.74 f 8.85 ± 0.05 a −7.17 ± 0.10 g 46.46 ± 0.58 g 3.12 ± 0.12 c −8.61 ± 0.16 e
RCPU1 47.54 ± 0.39 c 5.91 ± 0.02 d −2.22 ± 0.02 e 54.26 ± 0.33 c −1.26 ± 0.03 f −1.38 ± 0.38 b
RCPU2 44.55 ± 0.35 e 6.30 ± 0.02 c −5.49 ± 0.02 f 50.07 ± 0.85 e 4.47 ± 0.18 b −8.68 ± 0.28 e
RCPO1 49.59 ± 0.38 b 3.25 ± 0.01 f 3.59 ± 0.04 b 58.02 ± 0.09 b −1.69 ± 0.07 g −2.31 ± 0.40 c
RCPO2 45.29 ± 0.32 d 4.01 ± 0.01 e 2.05 ± 0.02 c 53.23 ± 0.11 d 2.05 ± 0.04 d −5.31 ± 0.27 d
RCPO10 36.55 ± 0.12 g 6.82 ± 0.03 b −1.59 ± 0.50 d 47.12 ± 0.06 f 5.75 ± 0.06 a −5.04 ± 0.04 d
SJ, SPU, and SPO represent spinach juice pasta, spinach puree pasta, and spinach pomace pasta, respectively; RCJ, RCPU, and RCPOrepresent red cabbage juice, red cabbage puree, and red cabbage pomace, respectively; 1, 2, and 10 is the substitution level (g/100 g) basedon the dry weight. C: control sample. Results expressed as Mean ± standard deviation calculated from ten measurements. L a b colour isconverted to R G B colour through https://www.nixsensor.com/free-color-converter/ (accessed on 22 July 2021) and colour was outputthrough EXCEL. While the colour convertor can only input integer colour number, the generated example colour is proximate. Valueswithin a column from the same kind of pasta followed by the same superscripted letter are not significantly different from each other(p > 0.05), according to the ANOVA- Duncan test.
4. Conclusions
The results show that the juice, puree, and pomace of vegetables behave differentlywhen incorporated into a pasta formulation. Those differences are plausible due to het-erogeneous compositions in the varied forms of vegetables. At a low substitution level(1−2 g/100 g), juice, puree, and pomace can all be used to produce pasta with acceptablecooking performance and texture quality. Juice fortified pasta has lower cooking lossesand better elasticity compared to puree and pomace fortified pastas. Among all pastasamples in this study, the cooking performance and texture quality of spinach juice pastawere better than other vegetable pastas and comparable or even better than control. This isprobably due to its higher protein (cysteine-rich) composition and low substitution level(less gluten dilution and structure interruption). The study may indicate that vegetablejuice with high protein content, such as spinach juice, can be used to produce premiumpasta products for the food industry.
Author Contributions: Conceptualization, J.W. and C.S.B.; methodology, M.A.B.; software, J.W.;validation, L.S., C.S.B. and M.A.B.; formal analysis, J.W.; investigation, J.W.; resources, L.S.; datacuration, J.W.; writing—original draft preparation, J.W.; writing—review and editing, J.W., L.S., C.S.B.and M.A.B.; visualization, J.W.; supervision, L.S., C.S.B. and M.A.B.; project administration, L.S.;funding acquisition, L.S. and C.S.B. All authors have read and agreed to the published version ofthe manuscript.
Funding: This research received no external funding. The research fund was offered by Lincoln University.
Institutional Review Board Statement: Not applicable.
Informed Consent Statement: Not applicable.
Data Availability Statement: The data presented in this study are available in the Tables 2–4 andFigure 1 within the article.
Acknowledgments: The authors thank Letitia Stipkovits for the laboratory training and are gratefulto other colleagues for their technical support.
Conflicts of Interest: The authors declare no conflict of interest.
102
Foods 2021, 10, 1931
References
1. Oliviero, T.; Fogliano, V. Food design strategies to increase vegetable intake: The case of vegetable enriched pasta. Trends FoodSci. Technol. 2016, 51, 58–64. [CrossRef]
2. Peressini, D.; Cavarape, A.; Brennan, M.A.; Gao, J.; Brennan, C.S. Viscoelastic properties of durum wheat doughs enrichedwith soluble dietary fibres in relation to pasta-making performance and glycaemic response of spaghetti. Food Hydrocoll. 2020,102, 105613. [CrossRef]
3. Marinelli, V.; Padalino, L.; Conte, A.; Del Nobile, M.A.; Briviba, K. Red Grape Marc Flour as Food Ingredient in Durum WheatSpaghetti: Nutritional Evaluation and Bioaccessibility of Bioactive Compounds. Food Sci. Technol. Res. 2018, 24, 1093–1100.[CrossRef]
4. Sobota, A.; Wirkijowska, A.; Zarzycki, P. Application of vegetable concentrates and powders in coloured pasta production. Int. J.Food Sci. Technol. 2020, 55, 2677–2687. [CrossRef]
5. Mridula, D.; Gupta, R.K.; Bhadwal, S.; Khaira, H. Optimization of Groundnut Meal and Capsicum Juice for Protein andAntioxidant Rich Pasta. Agric. Res. 2016, 5, 293–304. [CrossRef]
6. Sun-Waterhouse, D.; Jin, D.; Waterhouse, G.I.N. Effect of adding elderberry juice concentrate on the quality attributes, polyphenolcontents and antioxidant activity of three fibre-enriched pastas. Food Res. Int. 2013, 54, 781–789. [CrossRef]
7. Jalgaonkar, K.; Jha, S.K.; Mahawar, M.K. Influence of incorporating defatted soy flour, carrot powder, mango peel powder, andmoringa leaves powder on quality characteristics of wheat semolina-pearl millet pasta. J. Food Process. Preserv. 2018, 42, e13575.[CrossRef]
8. Petitot, M.; Boyer, L.; Minier, C.; Micard, V. Fortification of pasta with split pea and faba bean flours: Pasta processing and qualityevaluation. Food Res. Int. 2010, 43, 634–641. [CrossRef]
9. Rayas-Duarte, P.; Mock, C.; Satterlee, L. Quality of spaghetti containing buckwheat, amaranth, and lupin flours. Cereal Chem.1996, 73, 381–387.
10. Ahmad, N.; Ur-Rehman, S.; Shabbir, M.A.; Abdullahl, M.; Shehzad, M.A.; Ud-Din, Z.; Roberts, T.H. Fortification of durum wheatsemolina with detoxified matri (Lathyrus sativus) flour to improve the nutritional properties of pasta. J. Food Sci. Technol. 2018, 55,2114–2121. [CrossRef]
11. Sahni, P.; Shere, D. Physico-chemical and sensory characteristics of beet root pomace powder incorporated fibre rich cookies.Int. J. Food Ferment. Technol. 2016, 6, 309. [CrossRef]
12. Sant’Anna, V.; Christiano, F.D.P.; Marczak, L.D.F.; Tessaro, I.C.; Thys, R.C.S. The effect of the incorporation of grape marc powderin fettuccini pasta properties. LWT Food Sci. Technol. 2014, 58, 497–501. [CrossRef]
13. Karam, M.C.; Petit, J.; Zimmer, D.; Baudelaire Djantou, E.; Scher, J. Effects of drying and grinding in production of fruit andvegetable powders: A review. J. Food Eng. 2016, 188, 32–49. [CrossRef]
14. Padalino, L.; Conte, A.; Lecce, A.; Likyova, D.; Sicari, V.; Pellicano, T.; Poiana, M.; Del Nobile, M. Durum wheat whole-mealspaghetti with tomato peels: How by-product particles size can affect final quality of pasta. J. Food Process. Technol. 2015, 6, 1.
15. Gull, A.; Prasad, K.; Kumar, P. Effect of millet flours and carrot pomace on cooking qualities, color and texture of developed pasta.LWT Food Sci. Technol. 2015, 63, 470–474. [CrossRef]
16. Simonato, B.; Trevisan, S.; Tolve, R.; Favati, F.; Pasini, G. Pasta fortification with olive pomace: Effects on the technologicalcharacteristics and nutritional properties. LWT 2019, 114, 108368. [CrossRef]
17. Carini, E.; Curti, E.; Spotti, E.; Vittadini, E. Effect of Formulation on Physicochemical Properties and Water Status of NutritionallyEnriched Fresh Pasta. Food Bioprocess Technol. 2012, 5, 1642–1652. [CrossRef]
18. Rakhesh, N.; Fellows, C.M.; Sissons, M. Evaluation of the technological and sensory properties of durum wheat spaghettienriched with different dietary fibres. J. Sci. Food Agric. 2015, 95, 2–11. [CrossRef]
19. Wu, J.S.; Shen, S.-C.; Sinha, N.; Hui, Y. Processing of vegetable juice and blends. In Handbook of Vegetables and Vegetable Processing;Wiley Online Library: Hoboken, NJ, USA, 2011; pp. 335–350.
20. Bustos, M.; Perez, G.; Leon, A. Structure and quality of pasta enriched with functional ingredients. Rsc Adv. 2015, 5, 30780–30792.[CrossRef]
21. González, A.; Bordón, M.G.; Bustos, M.C.; Córdova Salazar, K.L.; Ribotta, P.D.; Martínez, M.L. Study of the incorporation ofnative and microencapsulated chia seed oil on pasta properties. Int. J. Food Sci. Technol. 2021, 56, 233–241. [CrossRef]
22. Vyas, M. Nutritional profile of spinach and its antioxidant & antidiabetic evaluation. Int. J. Green Pharm. (IJGP) 2017, 11, 192–197.[CrossRef]
23. Iborra-Bernad, C.; Tárrega, A.; García-Segovia, P.; Martínez-Monzó, J. Advantages of sous-vide cooked red cabbage: Structural,nutritional and sensory aspects. LWT Food Sci. Technol. 2014, 56, 451–460. [CrossRef]
24. AACC. Approved Methods of the AACC, 10th ed.; Cereals & Grains Association: Saint Paul, MN, USA, 2000.25. Simonne, A.H.; Simonne, E.H.; Eitenmiller, R.R.; Mills, H.A.; Cresman, C.P., III. Could the Dumas Method Replace the Kjeldahl
Digestion for Nitrogen and Crude Protein Determinations in Foods? J. Sci. Food Agric. 1997, 73, 39–45. [CrossRef]26. Desai, A.; Brennan, M.A.; Brennan, C.S. The effect of semolina replacement with protein powder from fish (Pseudophycis bachus)
on the physicochemical characteristics of pasta. LWT 2018, 89, 52–57. [CrossRef]27. Foschia, M.; Peressini, D.; Sensidoni, A.; Brennan, M.A.; Brennan, C.S. How combinations of dietary fibres can affect physico-
chemical characteristics of pasta. LWT Food Sci. Technol. 2015, 61, 41–46. [CrossRef]
103
Foods 2021, 10, 1931
28. Bonomi, F.; D’Egidio, M.G.; Iametti, S.; Marengo, M.; Marti, A.; Pagani, M.A.; Ragg, E.M. Structure–quality relationship incommercial pasta: A molecular glimpse. Food Chem. 2012, 135, 348–355. [CrossRef]
29. Ooms, N.; Delcour, J.A. How to impact gluten protein network formation during wheat flour dough making. Curr. Opin. Food Sci.2019, 25, 88–97. [CrossRef]
30. Perssini, D.; Sensidoni, A.; Pollini, C.M.; De Cindio, B. Rheology of wheat doughs for fresh pasta production: Influence ofsemolina-flour blends and salt content. J. Texture Stud. 2000, 31, 163–182. [CrossRef]
31. Sicignano, A.; Di Monaco, R.; Masi, P.; Cavella, S. From raw material to dish: Pasta quality step by step. J. Sci. Food Agric. 2015, 95,2579–2587. [CrossRef]
32. Jayawardena, S.R.; Morton, J.D.; Brennan, C.S.; Bekhit, A.E.-D.A. Utilisation of beef lung protein powder as a functional ingredientto enhance protein and iron content of fresh pasta. Int. J. Food Sci. Technol. 2019, 54, 610–618. [CrossRef]
33. Lisiewska, Z.; Kmiecik, W.; Gebczynski, P.; Sobczynska, L. Amino acid profile of raw and as-eaten products of spinach (Spinaciaoleracea L.). Food Chem. 2011, 126, 460–465. [CrossRef]
34. Filip, S.; Vidrih, R. Amino acid composition of protein-enriched dried pasta: Is it suitable for a low-carbohydrate diet? FoodTechnol. Biotechnol. 2015, 53, 298–306. [CrossRef]
35. Manthey, F.A.; Hall, C.A., III. Effect of processing and cooking on the content of minerals and protein in pasta containingbuckwheat bran flour. J. Sci. Food Agric. 2007, 87, 2026–2033. [CrossRef]
36. Reilly, C. Metal Contamination of Food; Wiley Online Library: Hoboken, NJ, USA, 1980.37. McCann, T.H.; Day, L. Effect of sodium chloride on gluten network formation, dough microstructure and rheology in relation to
breadmaking. J. Cereal Sci. 2013, 57, 444–452. [CrossRef]38. Tang, Y.; Yang, Y.; Wang, Q.; Tang, Y.; Li, F.; Zhao, J.; Zhang, Y.; Ming, J. Combined effect of carboxymethylcellulose and salt on
structural properties of wheat gluten proteins. Food Hydrocoll. 2019, 97, 105189. [CrossRef]39. Prabhasankar, P.; Ganesan, P.; Bhaskar, N.; Hirose, A.; Stephen, N.; Gowda, L.R.; Hosokawa, M.; Miyashita, K. Edible Japanese
seaweed, wakame (Undaria pinnatifida) as an ingredient in pasta: Chemical, functional and structural evaluation. Food Chem. 2009,115, 501–508. [CrossRef]
40. Diantom, A.; Curti, E.; Carini, E.; Boukid, F.; Mattarozzi, M.; Vodovotz, Y.; Careri, M.; Vittadini, E. A multi-scale approach forpasta quality features assessment. LWT Food Sci. Technol. 2019, 101, 285–292. [CrossRef]
41. Kowalczewski, P.; Lewandowicz, G.; Makowska, A.; Knoll, I.; Błaszczak, W.; Białas, W.; Kubiak, P. Pasta Fortified with PotatoJuice: Structure, Quality, and Consumer Acceptance. J. Food Sci. 2015, 80, S1377–S1382. [CrossRef]
42. Sissons, M. Role of durum wheat composition on the quality of pasta and bread. Food 2008, 2, 75–90.43. Aravind, N.; Sissons, M.; Egan, N.; Fellows, C. Effect of insoluble dietary fibre addition on technological, sensory, and structural
properties of durum wheat spaghetti. Food Chem. 2012, 130, 299–309. [CrossRef]44. Cárdenas-Hernández, A.; Beta, T.; Loarca-Piña, G.; Castaño-Tostado, E.; Nieto-Barrera, J.O.; Mendoza, S. Improved functional
properties of pasta: Enrichment with amaranth seed flour and dried amaranth leaves. J. Cereal Sci. 2016, 72, 84–90. [CrossRef]45. Foschia, M.; Peressini, D.; Sensidoni, A.; Brennan, M.A.; Brennan, C.S. Synergistic effect of different dietary fibres in pasta on
in vitro starch digestion? Food Chem. 2015, 172, 245–250. [CrossRef]46. Yadav, D.N.; Sharma, M.; Chikara, N.; Anand, T.; Bansal, S. Quality Characteristics of Vegetable-Blended Wheat–Pearl Millet
Composite Pasta. Agric. Res. 2014, 3, 263–270. [CrossRef]47. Tazrart, K.; Zaidi, F.; Lamacchia, C.; Haros, M. Effect of durum wheat semolina substitution with broad bean flour (Vicia faba) on
the Maccheronccini pasta quality. Eur. Food Res. Technol. 2016, 242, 477–485. [CrossRef]48. Lu, X.; Brennan, M.A.; Serventi, L.; Mason, S.; Brennan, C.S. How the inclusion of mushroom powder can affect the physicochem-
ical characteristics of pasta. Int. J. Food Sci. Technol. 2016, 51, 2433–2439. [CrossRef]49. Chigurupati, N.; Saiki, L.; Gayser, C.; Dash, A.K. Evaluation of red cabbage dye as a potential natural color for pharmaceutical
use. Int. J. Pharm. 2002, 241, 293–299. [CrossRef]50. Hanschen, F.S. Domestic boiling and salad preparation habits affect glucosinolate degradation in red cabbage (Brassica oleracea var.
capitata f. rubra). Food Chem. 2020, 321, 126694. [CrossRef] [PubMed]51. Nisha, P.; Singhal, R.S.; Pandit, A.B. A study on the degradation kinetics of visual green colour in spinach (Spinacea oleracea L.)
and the effect of salt therein. J. Food Eng. 2004, 64, 135–142. [CrossRef]
104
foods
Article
Delivery of Phenolic Compounds, Peptides and β-Glucan to theGastrointestinal Tract by Incorporating Dietary Fibre-RichMushrooms into Sorghum Biscuits
Juncai Tu 1,2, Margaret Anne Brennan 1, Gang Wu 1,2, Weidong Bai 3, Ping Cheng 3, Bin Tian 1
and Charles Stephen Brennan 1,2,4,*
Citation: Tu, J.; Brennan, M.A.; Wu,
G.; Bai, W.; Cheng, P.; Tian, B.;
Brennan, C.S. Delivery of Phenolic
Compounds, Peptides and β-Glucan
to the Gastrointestinal Tract by
Incorporating Dietary Fibre-Rich
Mushrooms into Sorghum Biscuits.
Foods 2021, 10, 1812. https://
doi.org/10.3390/foods10081812
Academic Editor: Alessandra Marti
Received: 28 June 2021
Accepted: 3 August 2021
Published: 5 August 2021
Publisher’s Note: MDPI stays neutral
with regard to jurisdictional claims in
published maps and institutional affil-
iations.
Copyright: © 2021 by the authors.
Licensee MDPI, Basel, Switzerland.
This article is an open access article
distributed under the terms and
conditions of the Creative Commons
Attribution (CC BY) license (https://
creativecommons.org/licenses/by/
4.0/).
1 Department of Wine, Food and Molecular Biosciences, Lincoln University, Christchurch 7647, New Zealand;[email protected] (J.T.); [email protected] (M.A.B.);[email protected] (G.W.); [email protected] (B.T.)
2 Riddet Institute, Palmerston North 4474, New Zealand3 College of Light Industry and Food Sciences, Zhongkai University of Agriculture and Engineering,
Guangzhou 510225, China; [email protected] (W.B.); [email protected] (P.C.)4 School of Science, RMIT University, GP.O. Box 2474, Melbourne, VIC 3001, Australia* Correspondence: [email protected]; Tel.: +61-(3)-9925-7460
Abstract: Sorghum biscuits were enriched with mushroom powders (Lentinula edodes, Auriculariaauricula and Tremella fuciformis) at 5%, 10% and 15% substitution levels. An in vitro gastrointestinaldigestion was used to evaluate the effect of this enrichment on the phenolic content and solublepeptide content as well as antioxidant activities of the gastric or intestinal supernatants (bio-accessiblefractions), and the remaining portions of phenolic compounds, antioxidants and β-glucan in theundigested residue (non-digestible fraction). The phenolic content of the gastric and intestinalsupernatants obtained from digested mushroom-enriched biscuits was found to be higher than thatof control biscuit, and the phenolic content was positively correlated to the antioxidant activitiesin each fraction (p < 0.001). L. edodes and T. fuciformis enrichment increased the soluble proteincontent (small peptide) of sorghum biscuits after in vitro digestion. All mushroom enrichmentincreased the total phenolic content and β-glucan content of the undigested residue and they werepositively correlated (p < 0.001). The insoluble dietary fibre of biscuits was positively correlated withβ-glucan content (p < 0.001) of undigested residue. These findings suggested that enriching foodwith mushroom derived dietary fibre increases the bioavailability of the non-digestible β-glucan andphenolic compounds.
Keywords: Lentinula edodes; Auricularia auricula; Tremella fuciformis; phenolic compounds; β-glucan
1. Introduction
A diet rich in biologically active ingredients (such as polyphenols and dietary fibre)can help lower the risk of chronic diseases, such as obesity, bowel inflammation and cancerand helps to regulate gut microbiota. Sorghum is rich in phenolic compounds, includingphenolic acids, tannins and flavonoids, and the amount and diversity of the major polyphe-nols in sorghum are higher than wheat, maize and rice [1]. Previous research into theprevention of chronic disease using sorghum has concentrated on the bioactive polyphenolsin relation to their effects on antioxidant capacity, oxidative stress reduction, metabolismof glucose and lipid, inflammatory activity and regulation of the gut microbiota [2]. Inaddition to this, sorghum is gluten-free which makes it suitable for those suffering fromcoeliac disease [3]. Sorghum is not a commonly-consumed cereal, but it has been reportedthat cereal products that claim they are a source of fibre and show potential to reduce therisk of diabetes and cardiovascular disease can gain an increase in consumer liking [4].Therefore, sorghum has the potential to be an alternative to wheat flour traditionally usedin cereal-based foods.
Foods 2021, 10, 1812. https://doi.org/10.3390/foods10081812 https://www.mdpi.com/journal/foods105
Foods 2021, 10, 1812
Sorghum has a low protein digestibility, which contributes to the hydrophobic natureof kafirins, and the way in which the proteins bind with starch granules and phenoliccompounds [5–8]. Cooking increases the protein digestibility of sorghum [7], which meansthat biscuits could be a suitable food to deliver bioactive compounds from sorghum to thegastrointestinal tract. In common with other cereals, sorghum is deficient in lysine and isconsidered to have poor quality protein from a nutritional point of view [9]. Mushroomsare a good source of lysine and can be incorporated into sorghum flour to improve theprotein quality [10]. They have been recognised as the only non-animal food source thatcan provide vitamin D, mainly in the form of D2 and D3, both of which exhibit anti-inflammation, anti-tumour and anti-cancer properties [11]. Mushrooms have a high dietaryfibre content and show immunomodulatory and anti-cancer activities [12]. Mushroom β-glucan can be digested by the colonic microbiota to produce short-chain fatty acids (SCFAs)these can help to regulate blood pressure, appetite, glucose homeostasis and improve gutintegrity [13]. The insoluble dietary fibre, present in mushrooms, is also fermented toproduce SCFAs, however, an in vivo study using pigs showed that β-glucan had a higherfermentation rate and SCFAs production rate than other insoluble fibres [14].
It is of great interest to incorporate mushrooms into cereal products to improve thenutritional quality and functionalities of products in recent studies [15–18]. However,mushroom dietary fibre might negatively affect the bioaccessibility of the phenolic com-pounds and the digestion of other nutrients when they are enriched in products. Theycan create associations with polyphenols before and during gastrointestinal digestion [19].Some of the phenolic compounds are available in the stomach and upper intestine toreduce the free radicals present. The remaining phenolic compounds pass into the colonand are available to be bio-transformed to metabolites via fermentation by colonic micro-biota [20,21]. Research is needed to analyse the portions of the phenolic compounds andother nutrients that can reach to the upper or lower part of gastrointestinal tract and hownutrients are delivered when products are enriched by fibre-rich mushrooms.
The main aim of this study was to evaluate the effect of mushroom powder onthe digestion of the developed mushroom enriched sorghum biscuits and the release ofproteins and phenolic compounds in relation to the antioxidant properties. The effectof mushroom incorporation on the β-glucan content and the colonic bioavailability ofphenolic compounds were evaluated.
2. Materials and Methods
2.1. Materials
Sorghum flour (Davis Trading, New Zealand) and dried shiitake (Lentinula edodes),black ear (Auricularia auricula) and silver ear (Tremella fuciformis) mushrooms (Jade Phoenix,Guangzhou, China) were used in this study.
2.2. Preparation of Biscuits
Dried mushrooms were crushed with a Coffee Grinder (Breville, Sydney, Australia)and were further processed to powder using a Laboratory Mill 3310 (PerkinElmer, Waltham,MA, USA). The dough of sorghum biscuits was prepared by mixing sorghum flour (225 g)with 65 g sugar, 64 g vegetable shortening, 2.1 g salt, 2.5 g sodium bicarbonate and 50 gdistilled water with a stand mixer (Breville, Australia). The dough was rolled and cut(6 mm thickness and 57 mm diameter) before putting into an oven and bake for 15 min at160 ◦C. The mushroom-enriched biscuits had 5%, 10% and 15% sorghum flour replacedwith mushroom powder (As shown in Table S1).
2.3. In Vitro Gastrointestinal Digestion
An in vitro gastrointestinal digestion, including gastric and intestinal stage, wassimulated according to the method of Wu, et al. [22]. The biscuits (2 g) were dispersed intogastric (pepsin) solution and incubated at 37 ◦C for 2 h. For the intestinal stage, the pHwas adjusted by 2 mL of 1 mol/L NaHCO3 and 5 mL of 0.1 mol/L sodium maleate buffer
106
Foods 2021, 10, 1812
(pH 6). After the pH adjustment, 0.1 mL of α-amyloglucosidase (3000 U/mL) was added,following by adding 5 mL of freshly prepared pancreatin-bile solution and incubated at37 ◦C for 2 h.
The samples obtained after gastric and intestinal digestion were centrifuged at 13,000× gfor 10 min (4 ◦C) to separate the bio-accessible fraction (supernatant) and the undigestedresidue. The supernatants were used for the determination of phenolic compound contentand antioxidant activity. The undigested residue was freeze-dried and ground into apowder before further evaluation. The bio-accessibility index (%) is a measure of howavailable the phenolic compounds for absorption [20], and it was calculated according tothe equation,
BI (%) =Phenolic content o f supernatantTotal phenolic content o f biscuit
× 100.
The phenolic content in the equation was determined as described in Section 2.6.1.Total phenolic content was the sum of free and bound phenolic content.
2.4. BCA Assay and Protein Profile
After in vitro gastric and intestinal digestion described in Section 2.3, aliquots (0.5 mL)of digesta were taken and heated at 95 ◦C for 5 min. The samples were stood for 1 h atroom temperature followed by centrifugation (13,000× g, 10 min), and the soluble proteincontent of the supernatant (bio-accessible fraction) was measured by Pierce™ BCA ProteinAssay Kit (Thermo Fisher Scientific). The soluble protein content (SPC) was calculatedaccording to the equation,
SPC (mg/g dw) =Protein weight in supernatant
Total dry weight o f biscuit× 100.
An SDS-PAGE assay was carried out according to the method used by Gong, et al. [23]with NuPAGETM 4–12% Bis-Tris electrophoresis gels (Bio-Rad, Richmond, CA, USA). Themarker for molecular weight (10–250 kDa) was used as a reference to the protein bands.The proteins in biscuits and digesta supernatants were extracted with the NuPAGETM LDSsample buffer and reducing agent (×1) followed by a heat treatment (100 ◦C for 5 min).After centrifuging, 10 μL of the maker and 20 μL of sample extracts were loaded into thegel and run at 170 V for 40 min. The gel was stained with Commassie blue G-250 for 1 hand then was destained overnight.
2.5. Extraction of Phenolic Compounds
Free phenolic compounds were extracted with methanol as reported by Wang, et al. [24].Samples (1 g) were stirred with 30 mL of 70% methanol (v/v) on a magnetic multi-stirrerovernight at ambient temperature and centrifuged for 10 min (9000× g, 4 ◦C). The super-natants were transferred to a volumetric flask (50 mL). The resulting pellets were furtherextracted twice with 10 mL of 70% methanol for 30 s over a vortex and the mixtureswere centrifuged. The supernatants were combined and transferred quantitatively to avolumetric flask for the determination of phenolic content.
To extract the bound phenolic compounds, the method according to Li, et al. [25]was followed. The residues obtained after methanol extractions were subjected to alkalinehydrolysis by adding 20 mL of 4 mol/L NaOH. The samples were stirred at ambienttemperature for 4 h before centrifuging at 9000× g for 10 min. The hydrolysed sampleswere acidified with 5 mol/L HCl to pH 2 and then extracted with ethyl acetone four timesand centrifuged. Supernatants were collected and the organic phase was evaporated underreduced pressure at 30 ◦C. The samples were re-dissolved in 70% methanol. All extractionswere performed in triplicate and samples were kept in the dark at −20 ◦C prior to thedetermination of phenolic content.
107
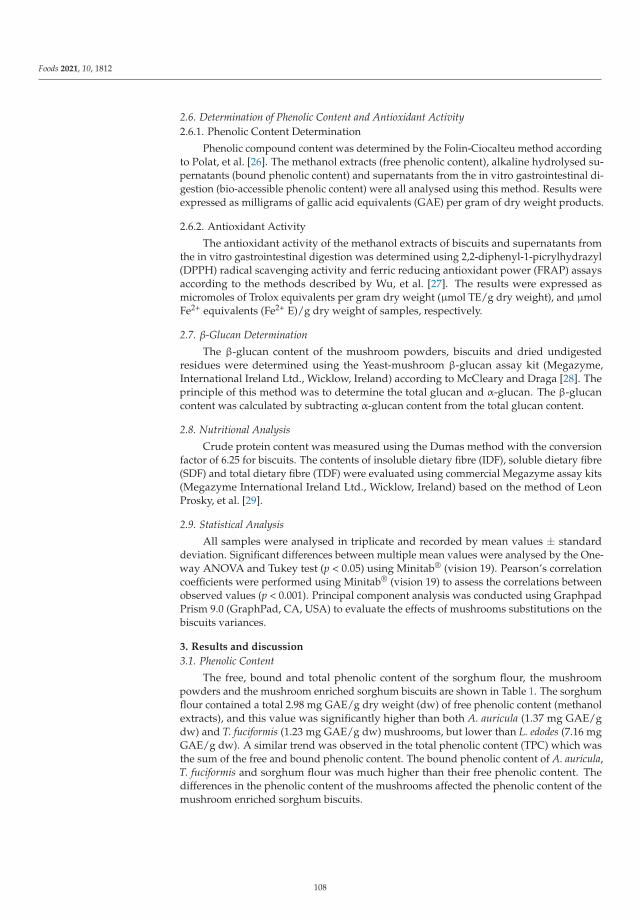
Foods 2021, 10, 1812
2.6. Determination of Phenolic Content and Antioxidant Activity2.6.1. Phenolic Content Determination
Phenolic compound content was determined by the Folin-Ciocalteu method accordingto Polat, et al. [26]. The methanol extracts (free phenolic content), alkaline hydrolysed su-pernatants (bound phenolic content) and supernatants from the in vitro gastrointestinal di-gestion (bio-accessible phenolic content) were all analysed using this method. Results wereexpressed as milligrams of gallic acid equivalents (GAE) per gram of dry weight products.
2.6.2. Antioxidant Activity
The antioxidant activity of the methanol extracts of biscuits and supernatants fromthe in vitro gastrointestinal digestion was determined using 2,2-diphenyl-1-picrylhydrazyl(DPPH) radical scavenging activity and ferric reducing antioxidant power (FRAP) assaysaccording to the methods described by Wu, et al. [27]. The results were expressed asmicromoles of Trolox equivalents per gram dry weight (μmol TE/g dry weight), and μmolFe2+ equivalents (Fe2+ E)/g dry weight of samples, respectively.
2.7. β-Glucan Determination
The β-glucan content of the mushroom powders, biscuits and dried undigestedresidues were determined using the Yeast-mushroom β-glucan assay kit (Megazyme,International Ireland Ltd., Wicklow, Ireland) according to McCleary and Draga [28]. Theprinciple of this method was to determine the total glucan and α-glucan. The β-glucancontent was calculated by subtracting α-glucan content from the total glucan content.
2.8. Nutritional Analysis
Crude protein content was measured using the Dumas method with the conversionfactor of 6.25 for biscuits. The contents of insoluble dietary fibre (IDF), soluble dietary fibre(SDF) and total dietary fibre (TDF) were evaluated using commercial Megazyme assay kits(Megazyme International Ireland Ltd., Wicklow, Ireland) based on the method of LeonProsky, et al. [29].
2.9. Statistical Analysis
All samples were analysed in triplicate and recorded by mean values ± standarddeviation. Significant differences between multiple mean values were analysed by the One-way ANOVA and Tukey test (p < 0.05) using Minitab® (vision 19). Pearson’s correlationcoefficients were performed using Minitab® (vision 19) to assess the correlations betweenobserved values (p < 0.001). Principal component analysis was conducted using GraphpadPrism 9.0 (GraphPad, CA, USA) to evaluate the effects of mushrooms substitutions on thebiscuits variances.
3. Results and discussion
3.1. Phenolic Content
The free, bound and total phenolic content of the sorghum flour, the mushroompowders and the mushroom enriched sorghum biscuits are shown in Table 1. The sorghumflour contained a total 2.98 mg GAE/g dry weight (dw) of free phenolic content (methanolextracts), and this value was significantly higher than both A. auricula (1.37 mg GAE/gdw) and T. fuciformis (1.23 mg GAE/g dw) mushrooms, but lower than L. edodes (7.16 mgGAE/g dw). A similar trend was observed in the total phenolic content (TPC) which wasthe sum of the free and bound phenolic content. The bound phenolic content of A. auricula,T. fuciformis and sorghum flour was much higher than their free phenolic content. Thedifferences in the phenolic content of the mushrooms affected the phenolic content of themushroom enriched sorghum biscuits.
108
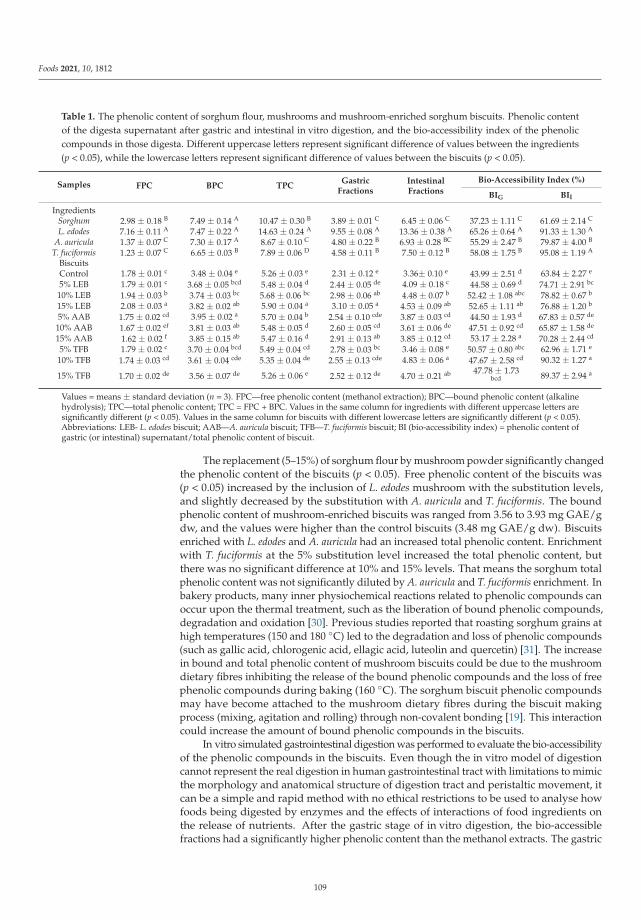
Foods 2021, 10, 1812
Table 1. The phenolic content of sorghum flour, mushrooms and mushroom-enriched sorghum biscuits. Phenolic contentof the digesta supernatant after gastric and intestinal in vitro digestion, and the bio-accessibility index of the phenoliccompounds in those digesta. Different uppercase letters represent significant difference of values between the ingredients(p < 0.05), while the lowercase letters represent significant difference of values between the biscuits (p < 0.05).
Samples FPC BPC TPCGastric
FractionsIntestinalFractions
Bio-Accessibility Index (%)
BIG BII
IngredientsSorghum 2.98 ± 0.18 B 7.49 ± 0.14 A 10.47 ± 0.30 B 3.89 ± 0.01 C 6.45 ± 0.06 C 37.23 ± 1.11 C 61.69 ± 2.14 C
L. edodes 7.16 ± 0.11 A 7.47 ± 0.22 A 14.63 ± 0.24 A 9.55 ± 0.08 A 13.36 ± 0.38 A 65.26 ± 0.64 A 91.33 ± 1.30 A
A. auricula 1.37 ± 0.07 C 7.30 ± 0.17 A 8.67 ± 0.10 C 4.80 ± 0.22 B 6.93 ± 0.28 BC 55.29 ± 2.47 B 79.87 ± 4.00 B
T. fuciformis 1.23 ± 0.07 C 6.65 ± 0.03 B 7.89 ± 0.06 D 4.58 ± 0.11 B 7.50 ± 0.12 B 58.08 ± 1.75 B 95.08 ± 1.19 A
BiscuitsControl 1.78 ± 0.01 c 3.48 ± 0.04 e 5.26 ± 0.03 e 2.31 ± 0.12 e 3.36± 0.10 e 43.99 ± 2.51 d 63.84 ± 2.27 e
5% LEB 1.79 ± 0.01 c 3.68 ± 0.05 bcd 5.48 ± 0.04 d 2.44 ± 0.05 de 4.09 ± 0.18 c 44.58 ± 0.69 d 74.71 ± 2.91 bc
10% LEB 1.94 ± 0.03 b 3.74 ± 0.03 bc 5.68 ± 0.06 bc 2.98 ± 0.06 ab 4.48 ± 0.07 b 52.42 ± 1.08 abc 78.82 ± 0.67 b
15% LEB 2.08 ± 0.03 a 3.82 ± 0.02 ab 5.90 ± 0.04 a 3.10 ± 0.05 a 4.53 ± 0.09 ab 52.65 ± 1.11 ab 76.88 ± 1.20 b
5% AAB 1.75 ± 0.02 cd 3.95 ± 0.02 a 5.70 ± 0.04 b 2.54 ± 0.10 cde 3.87 ± 0.03 cd 44.50 ± 1.93 d 67.83 ± 0.57 de
10% AAB 1.67 ± 0.02 ef 3.81 ± 0.03 ab 5.48 ± 0.05 d 2.60 ± 0.05 cd 3.61 ± 0.06 de 47.51 ± 0.92 cd 65.87 ± 1.58 de
15% AAB 1.62 ± 0.02 f 3.85 ± 0.15 ab 5.47 ± 0.16 d 2.91 ± 0.13 ab 3.85 ± 0.12 cd 53.17 ± 2.28 a 70.28 ± 2.44 cd
5% TFB 1.79 ± 0.02 c 3.70 ± 0.04 bcd 5.49 ± 0.04 cd 2.78 ± 0.03 bc 3.46 ± 0.08 e 50.57 ± 0.80 abc 62.96 ± 1.71 e
10% TFB 1.74 ± 0.03 cd 3.61 ± 0.04 cde 5.35 ± 0.04 de 2.55 ± 0.13 cde 4.83 ± 0.06 a 47.67 ± 2.58 cd 90.32 ± 1.27 a
15% TFB 1.70 ± 0.02 de 3.56 ± 0.07 de 5.26 ± 0.06 e 2.52 ± 0.12 de 4.70 ± 0.21 ab 47.78 ± 1.73bcd 89.37 ± 2.94 a
Values = means ± standard deviation (n = 3). FPC—free phenolic content (methanol extraction); BPC—bound phenolic content (alkalinehydrolysis); TPC—total phenolic content; TPC = FPC + BPC. Values in the same column for ingredients with different uppercase letters aresignificantly different (p < 0.05). Values in the same column for biscuits with different lowercase letters are significantly different (p < 0.05).Abbreviations: LEB- L. edodes biscuit; AAB—A. auricula biscuit; TFB—T. fuciformis biscuit; BI (bio-accessibility index) = phenolic content ofgastric (or intestinal) supernatant/total phenolic content of biscuit.
The replacement (5–15%) of sorghum flour by mushroom powder significantly changedthe phenolic content of the biscuits (p < 0.05). Free phenolic content of the biscuits was(p < 0.05) increased by the inclusion of L. edodes mushroom with the substitution levels,and slightly decreased by the substitution with A. auricula and T. fuciformis. The boundphenolic content of mushroom-enriched biscuits was ranged from 3.56 to 3.93 mg GAE/gdw, and the values were higher than the control biscuits (3.48 mg GAE/g dw). Biscuitsenriched with L. edodes and A. auricula had an increased total phenolic content. Enrichmentwith T. fuciformis at the 5% substitution level increased the total phenolic content, butthere was no significant difference at 10% and 15% levels. That means the sorghum totalphenolic content was not significantly diluted by A. auricula and T. fuciformis enrichment. Inbakery products, many inner physiochemical reactions related to phenolic compounds canoccur upon the thermal treatment, such as the liberation of bound phenolic compounds,degradation and oxidation [30]. Previous studies reported that roasting sorghum grains athigh temperatures (150 and 180 ◦C) led to the degradation and loss of phenolic compounds(such as gallic acid, chlorogenic acid, ellagic acid, luteolin and quercetin) [31]. The increasein bound and total phenolic content of mushroom biscuits could be due to the mushroomdietary fibres inhibiting the release of the bound phenolic compounds and the loss of freephenolic compounds during baking (160 ◦C). The sorghum biscuit phenolic compoundsmay have become attached to the mushroom dietary fibres during the biscuit makingprocess (mixing, agitation and rolling) through non-covalent bonding [19]. This interactioncould increase the amount of bound phenolic compounds in the biscuits.
In vitro simulated gastrointestinal digestion was performed to evaluate the bio-accessibilityof the phenolic compounds in the biscuits. Even though the in vitro model of digestioncannot represent the real digestion in human gastrointestinal tract with limitations to mimicthe morphology and anatomical structure of digestion tract and peristaltic movement, itcan be a simple and rapid method with no ethical restrictions to be used to analyse howfoods being digested by enzymes and the effects of interactions of food ingredients onthe release of nutrients. After the gastric stage of in vitro digestion, the bio-accessiblefractions had a significantly higher phenolic content than the methanol extracts. The gastric
109
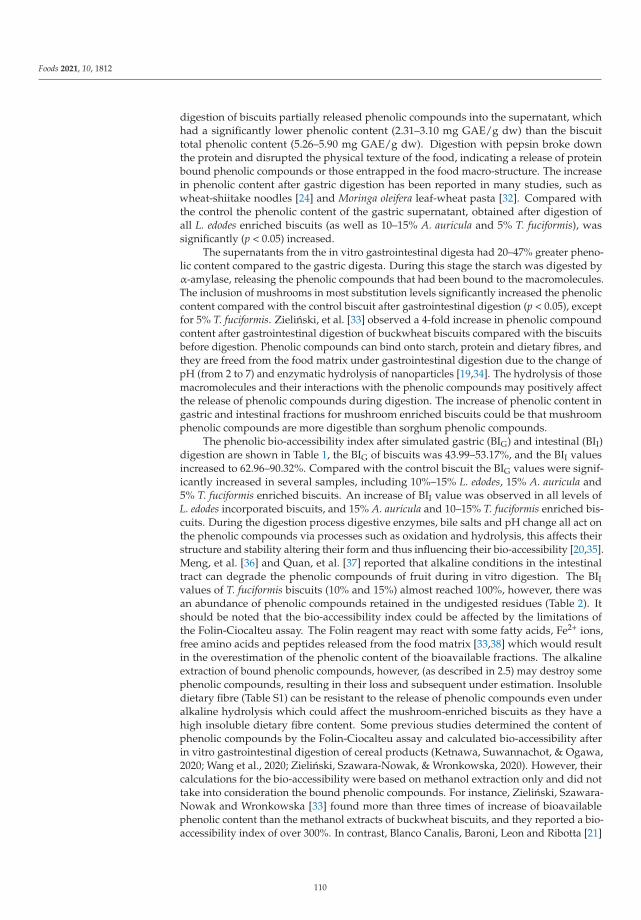
Foods 2021, 10, 1812
digestion of biscuits partially released phenolic compounds into the supernatant, whichhad a significantly lower phenolic content (2.31–3.10 mg GAE/g dw) than the biscuittotal phenolic content (5.26–5.90 mg GAE/g dw). Digestion with pepsin broke downthe protein and disrupted the physical texture of the food, indicating a release of proteinbound phenolic compounds or those entrapped in the food macro-structure. The increasein phenolic content after gastric digestion has been reported in many studies, such aswheat-shiitake noodles [24] and Moringa oleifera leaf-wheat pasta [32]. Compared withthe control the phenolic content of the gastric supernatant, obtained after digestion ofall L. edodes enriched biscuits (as well as 10–15% A. auricula and 5% T. fuciformis), wassignificantly (p < 0.05) increased.
The supernatants from the in vitro gastrointestinal digesta had 20–47% greater pheno-lic content compared to the gastric digesta. During this stage the starch was digested byα-amylase, releasing the phenolic compounds that had been bound to the macromolecules.The inclusion of mushrooms in most substitution levels significantly increased the phenoliccontent compared with the control biscuit after gastrointestinal digestion (p < 0.05), exceptfor 5% T. fuciformis. Zielinski, et al. [33] observed a 4-fold increase in phenolic compoundcontent after gastrointestinal digestion of buckwheat biscuits compared with the biscuitsbefore digestion. Phenolic compounds can bind onto starch, protein and dietary fibres, andthey are freed from the food matrix under gastrointestinal digestion due to the change ofpH (from 2 to 7) and enzymatic hydrolysis of nanoparticles [19,34]. The hydrolysis of thosemacromolecules and their interactions with the phenolic compounds may positively affectthe release of phenolic compounds during digestion. The increase of phenolic content ingastric and intestinal fractions for mushroom enriched biscuits could be that mushroomphenolic compounds are more digestible than sorghum phenolic compounds.
The phenolic bio-accessibility index after simulated gastric (BIG) and intestinal (BII)digestion are shown in Table 1, the BIG of biscuits was 43.99–53.17%, and the BII valuesincreased to 62.96–90.32%. Compared with the control biscuit the BIG values were signif-icantly increased in several samples, including 10%–15% L. edodes, 15% A. auricula and5% T. fuciformis enriched biscuits. An increase of BII value was observed in all levels ofL. edodes incorporated biscuits, and 15% A. auricula and 10–15% T. fuciformis enriched bis-cuits. During the digestion process digestive enzymes, bile salts and pH change all act onthe phenolic compounds via processes such as oxidation and hydrolysis, this affects theirstructure and stability altering their form and thus influencing their bio-accessibility [20,35].Meng, et al. [36] and Quan, et al. [37] reported that alkaline conditions in the intestinaltract can degrade the phenolic compounds of fruit during in vitro digestion. The BIIvalues of T. fuciformis biscuits (10% and 15%) almost reached 100%, however, there wasan abundance of phenolic compounds retained in the undigested residues (Table 2). Itshould be noted that the bio-accessibility index could be affected by the limitations ofthe Folin-Ciocalteu assay. The Folin reagent may react with some fatty acids, Fe2+ ions,free amino acids and peptides released from the food matrix [33,38] which would resultin the overestimation of the phenolic content of the bioavailable fractions. The alkalineextraction of bound phenolic compounds, however, (as described in 2.5) may destroy somephenolic compounds, resulting in their loss and subsequent under estimation. Insolubledietary fibre (Table S1) can be resistant to the release of phenolic compounds even underalkaline hydrolysis which could affect the mushroom-enriched biscuits as they have ahigh insoluble dietary fibre content. Some previous studies determined the content ofphenolic compounds by the Folin-Ciocalteu assay and calculated bio-accessibility afterin vitro gastrointestinal digestion of cereal products (Ketnawa, Suwannachot, & Ogawa,2020; Wang et al., 2020; Zielinski, Szawara-Nowak, & Wronkowska, 2020). However, theircalculations for the bio-accessibility were based on methanol extraction only and did nottake into consideration the bound phenolic compounds. For instance, Zielinski, Szawara-Nowak and Wronkowska [33] found more than three times of increase of bioavailablephenolic content than the methanol extracts of buckwheat biscuits, and they reported a bio-accessibility index of over 300%. In contrast, Blanco Canalis, Baroni, Leon and Ribotta [21]
110
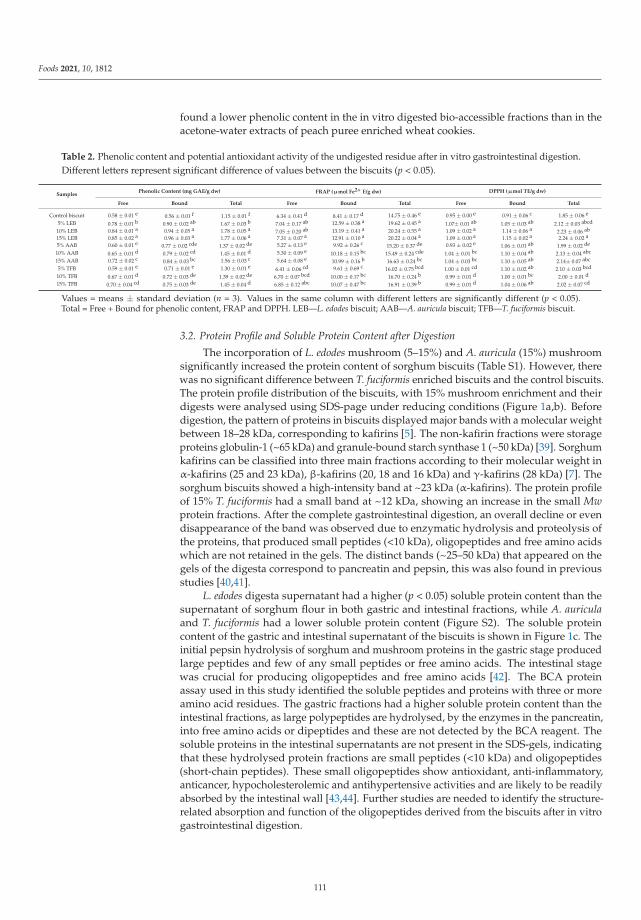
Foods 2021, 10, 1812
found a lower phenolic content in the in vitro digested bio-accessible fractions than in theacetone-water extracts of peach puree enriched wheat cookies.
Table 2. Phenolic content and potential antioxidant activity of the undigested residue after in vitro gastrointestinal digestion.Different letters represent significant difference of values between the biscuits (p < 0.05).
SamplesPhenolic Content (mg GAE/g dw) FRAP (μmol Fe2+ E/g dw) DPPH (μmol TE/g dw)
Free Bound Total Free Bound Total Free Bound Total
Control biscuit 0.58 ± 0.01 e 0.56 ± 0.01 f 1.15 ± 0.01 f 6.34 ± 0.41 d 8.41 ± 0.17 d 14.75 ± 0.46 e 0.95 ± 0.00 e 0.91 ± 0.06 c 1.85 ± 0.06 e
5% LEB 0.78 ± 0.01 b 0.90 ± 0.02 ab 1.67 ± 0.03 b 7.04 ± 0.17 ab 12.59 ± 0.38 a 19.62 ± 0.45 a 1.07± 0.01 ab 1.05 ± 0.03 ab 2.12 ± 0.03 abcd
10% LEB 0.84 ± 0.01 a 0.94 ± 0.05 a 1.78 ± 0.05 a 7.05 ± 0.20 ab 13.19 ± 0.41 a 20.24 ± 0.55 a 1.09 ± 0.02 a 1.14 ± 0.06 a 2.23 ± 0.06 ab
15% LEB 0.85 ± 0.02 a 0.96 ± 0.03 a 1.77 ± 0.06 a 7.31 ± 0.07 a 12.91 ± 0.10 a 20.22 ± 0.04 a 1.09 ± 0.00 a 1.15 ± 0.02 a 2.24 ± 0.02 a
5% AAB 0.60 ± 0.01 e 0.77 ± 0.02 cde 1.37 ± 0.02 de 5.27 ± 0.13 e 9.92 ± 0.26 c 15.20 ± 0.37 de 0.93 ± 0.02 e 1.06 ± 0.01 ab 1.99 ± 0.02 de
10% AAB 0.65 ± 0.01 d 0.79 ± 0.02 cd 1.45 ± 0.01 d 5.30 ± 0.09 e 10.18 ± 0.15 bc 15.49 ± 0.24 cde 1.04 ± 0.01 bc 1.10 ± 0.04 ab 2.13 ± 0.04 abc
15% AAB 0.72 ± 0.02 c 0.84 ± 0.03 bc 1.56 ± 0.03 c 5.64 ± 0.08 e 10.99 ± 0.16 b 16.63 ± 0.24 bc 1.04 ± 0.03 bc 1.10 ± 0.05 ab 2.14± 0.07 abc
5% TFB 0.59 ± 0.01 e 0.71 ± 0.01 e 1.30 ± 0.01 e 6.41 ± 0.06 cd 9.61 ± 0.69 c 16.02 ± 0.75 bcd 1.00 ± 0.01 cd 1.10 ± 0.02 ab 2.10 ± 0.03 bcd
10% TFB 0.67 ± 0.01 d 0.72 ± 0.03 de 1.39 ± 0.02 de 6.70 ± 0.07 bcd 10.00 ± 0.17 bc 16.70 ± 0.24 b 0.99 ± 0.01 d 1.00 ± 0.01 bc 2.00 ± 0.01 d
15% TFB 0.70 ± 0.04 cd 0.75 ± 0.03 de 1.45 ± 0.04 d 6.85 ± 0.12 abc 10.07 ± 0.47 bc 16.91 ± 0.39 b 0.99 ± 0.01 d 1.04 ± 0.06 ab 2.02 ± 0.07 cd
Values = means ± standard deviation (n = 3). Values in the same column with different letters are significantly different (p < 0.05).Total = Free + Bound for phenolic content, FRAP and DPPH. LEB—L. edodes biscuit; AAB—A. auricula biscuit; TFB—T. fuciformis biscuit.
3.2. Protein Profile and Soluble Protein Content after Digestion
The incorporation of L. edodes mushroom (5–15%) and A. auricula (15%) mushroomsignificantly increased the protein content of sorghum biscuits (Table S1). However, therewas no significant difference between T. fuciformis enriched biscuits and the control biscuits.The protein profile distribution of the biscuits, with 15% mushroom enrichment and theirdigests were analysed using SDS-page under reducing conditions (Figure 1a,b). Beforedigestion, the pattern of proteins in biscuits displayed major bands with a molecular weightbetween 18–28 kDa, corresponding to kafirins [5]. The non-kafirin fractions were storageproteins globulin-1 (~65 kDa) and granule-bound starch synthase 1 (~50 kDa) [39]. Sorghumkafirins can be classified into three main fractions according to their molecular weight inα-kafirins (25 and 23 kDa), β-kafirins (20, 18 and 16 kDa) and γ-kafirins (28 kDa) [7]. Thesorghum biscuits showed a high-intensity band at ~23 kDa (α-kafirins). The protein profileof 15% T. fuciformis had a small band at ~12 kDa, showing an increase in the small Mwprotein fractions. After the complete gastrointestinal digestion, an overall decline or evendisappearance of the band was observed due to enzymatic hydrolysis and proteolysis ofthe proteins, that produced small peptides (<10 kDa), oligopeptides and free amino acidswhich are not retained in the gels. The distinct bands (~25–50 kDa) that appeared on thegels of the digesta correspond to pancreatin and pepsin, this was also found in previousstudies [40,41].
L. edodes digesta supernatant had a higher (p < 0.05) soluble protein content than thesupernatant of sorghum flour in both gastric and intestinal fractions, while A. auriculaand T. fuciformis had a lower soluble protein content (Figure S2). The soluble proteincontent of the gastric and intestinal supernatant of the biscuits is shown in Figure 1c. Theinitial pepsin hydrolysis of sorghum and mushroom proteins in the gastric stage producedlarge peptides and few of any small peptides or free amino acids. The intestinal stagewas crucial for producing oligopeptides and free amino acids [42]. The BCA proteinassay used in this study identified the soluble peptides and proteins with three or moreamino acid residues. The gastric fractions had a higher soluble protein content than theintestinal fractions, as large polypeptides are hydrolysed, by the enzymes in the pancreatin,into free amino acids or dipeptides and these are not detected by the BCA reagent. Thesoluble proteins in the intestinal supernatants are not present in the SDS-gels, indicatingthat these hydrolysed protein fractions are small peptides (<10 kDa) and oligopeptides(short-chain peptides). These small oligopeptides show antioxidant, anti-inflammatory,anticancer, hypocholesterolemic and antihypertensive activities and are likely to be readilyabsorbed by the intestinal wall [43,44]. Further studies are needed to identify the structure-related absorption and function of the oligopeptides derived from the biscuits after in vitrogastrointestinal digestion.
111
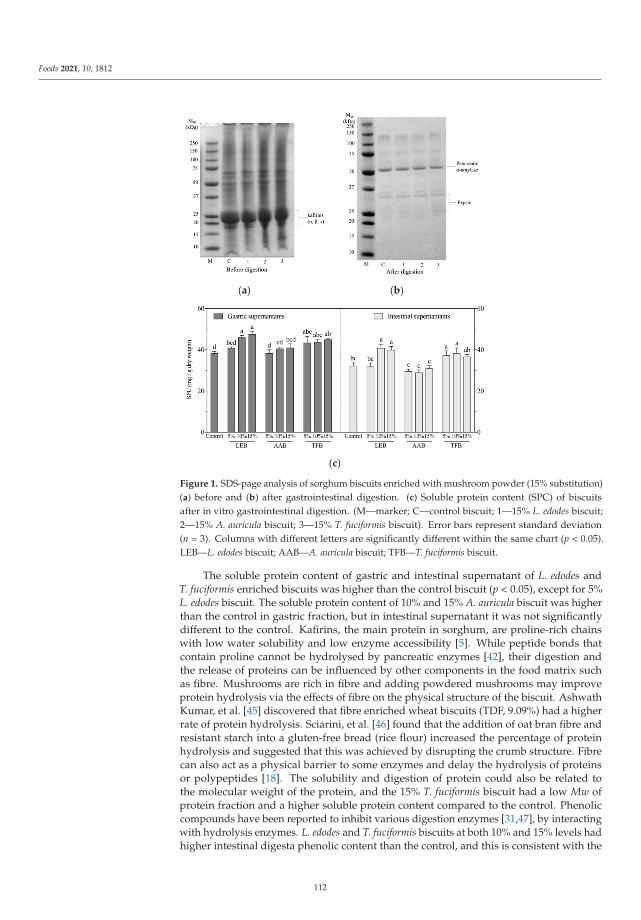
Foods 2021, 10, 1812
(a) (b)
(c)
Figure 1. SDS-page analysis of sorghum biscuits enriched with mushroom powder (15% substitution)(a) before and (b) after gastrointestinal digestion. (c) Soluble protein content (SPC) of biscuitsafter in vitro gastrointestinal digestion. (M—marker; C—control biscuit; 1—15% L. edodes biscuit;2—15% A. auricula biscuit; 3—15% T. fuciformis biscuit). Error bars represent standard deviation(n = 3). Columns with different letters are significantly different within the same chart (p < 0.05).LEB—L. edodes biscuit; AAB—A. auricula biscuit; TFB—T. fuciformis biscuit.
The soluble protein content of gastric and intestinal supernatant of L. edodes andT. fuciformis enriched biscuits was higher than the control biscuit (p < 0.05), except for 5%L. edodes biscuit. The soluble protein content of 10% and 15% A. auricula biscuit was higherthan the control in gastric fraction, but in intestinal supernatant it was not significantlydifferent to the control. Kafirins, the main protein in sorghum, are proline-rich chainswith low water solubility and low enzyme accessibility [5]. While peptide bonds thatcontain proline cannot be hydrolysed by pancreatic enzymes [42], their digestion andthe release of proteins can be influenced by other components in the food matrix suchas fibre. Mushrooms are rich in fibre and adding powdered mushrooms may improveprotein hydrolysis via the effects of fibre on the physical structure of the biscuit. AshwathKumar, et al. [45] discovered that fibre enriched wheat biscuits (TDF, 9.09%) had a higherrate of protein hydrolysis. Sciarini, et al. [46] found that the addition of oat bran fibre andresistant starch into a gluten-free bread (rice flour) increased the percentage of proteinhydrolysis and suggested that this was achieved by disrupting the crumb structure. Fibrecan also act as a physical barrier to some enzymes and delay the hydrolysis of proteinsor polypeptides [18]. The solubility and digestion of protein could also be related tothe molecular weight of the protein, and the 15% T. fuciformis biscuit had a low Mw ofprotein fraction and a higher soluble protein content compared to the control. Phenoliccompounds have been reported to inhibit various digestion enzymes [31,47], by interactingwith hydrolysis enzymes. L. edodes and T. fuciformis biscuits at both 10% and 15% levels hadhigher intestinal digesta phenolic content than the control, and this is consistent with the
112
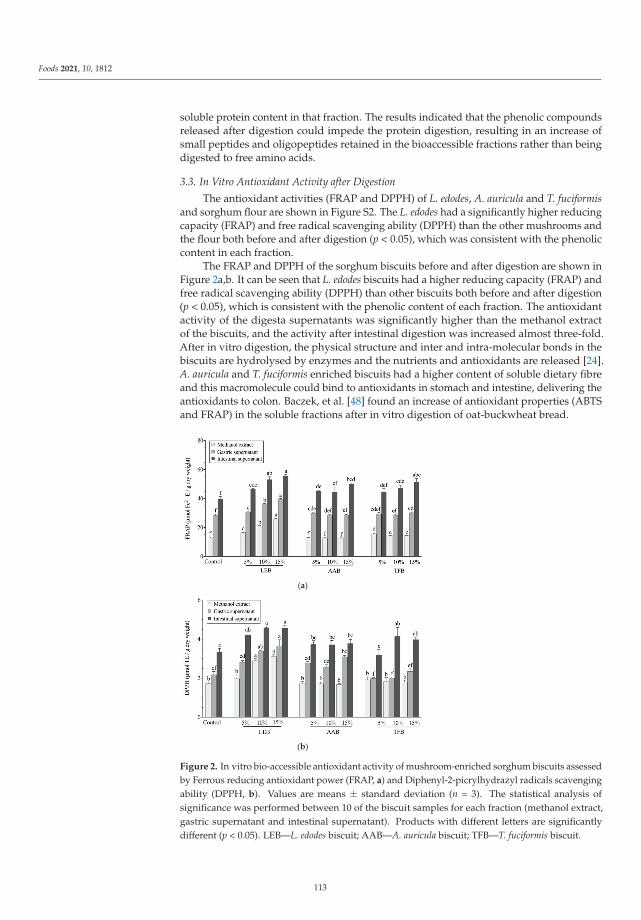
Foods 2021, 10, 1812
soluble protein content in that fraction. The results indicated that the phenolic compoundsreleased after digestion could impede the protein digestion, resulting in an increase ofsmall peptides and oligopeptides retained in the bioaccessible fractions rather than beingdigested to free amino acids.
3.3. In Vitro Antioxidant Activity after Digestion
The antioxidant activities (FRAP and DPPH) of L. edodes, A. auricula and T. fuciformisand sorghum flour are shown in Figure S2. The L. edodes had a significantly higher reducingcapacity (FRAP) and free radical scavenging ability (DPPH) than the other mushrooms andthe flour both before and after digestion (p < 0.05), which was consistent with the phenoliccontent in each fraction.
The FRAP and DPPH of the sorghum biscuits before and after digestion are shown inFigure 2a,b. It can be seen that L. edodes biscuits had a higher reducing capacity (FRAP) andfree radical scavenging ability (DPPH) than other biscuits both before and after digestion(p < 0.05), which is consistent with the phenolic content of each fraction. The antioxidantactivity of the digesta supernatants was significantly higher than the methanol extractof the biscuits, and the activity after intestinal digestion was increased almost three-fold.After in vitro digestion, the physical structure and inter and intra-molecular bonds in thebiscuits are hydrolysed by enzymes and the nutrients and antioxidants are released [24].A. auricula and T. fuciformis enriched biscuits had a higher content of soluble dietary fibreand this macromolecule could bind to antioxidants in stomach and intestine, delivering theantioxidants to colon. Baczek, et al. [48] found an increase of antioxidant properties (ABTSand FRAP) in the soluble fractions after in vitro digestion of oat-buckwheat bread.
(a)
(b)
Figure 2. In vitro bio-accessible antioxidant activity of mushroom-enriched sorghum biscuits assessedby Ferrous reducing antioxidant power (FRAP, a) and Diphenyl-2-picrylhydrazyl radicals scavengingability (DPPH, b). Values are means ± standard deviation (n = 3). The statistical analysis ofsignificance was performed between 10 of the biscuit samples for each fraction (methanol extract,gastric supernatant and intestinal supernatant). Products with different letters are significantlydifferent (p < 0.05). LEB—L. edodes biscuit; AAB—A. auricula biscuit; TFB—T. fuciformis biscuit.
113
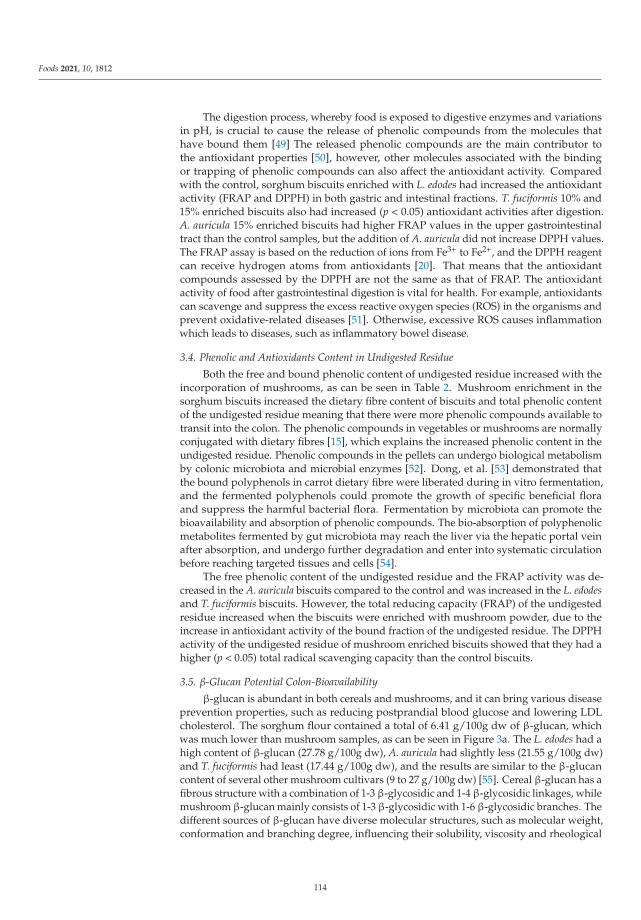
Foods 2021, 10, 1812
The digestion process, whereby food is exposed to digestive enzymes and variationsin pH, is crucial to cause the release of phenolic compounds from the molecules thathave bound them [49] The released phenolic compounds are the main contributor tothe antioxidant properties [50], however, other molecules associated with the bindingor trapping of phenolic compounds can also affect the antioxidant activity. Comparedwith the control, sorghum biscuits enriched with L. edodes had increased the antioxidantactivity (FRAP and DPPH) in both gastric and intestinal fractions. T. fuciformis 10% and15% enriched biscuits also had increased (p < 0.05) antioxidant activities after digestion.A. auricula 15% enriched biscuits had higher FRAP values in the upper gastrointestinaltract than the control samples, but the addition of A. auricula did not increase DPPH values.The FRAP assay is based on the reduction of ions from Fe3+ to Fe2+, and the DPPH reagentcan receive hydrogen atoms from antioxidants [20]. That means that the antioxidantcompounds assessed by the DPPH are not the same as that of FRAP. The antioxidantactivity of food after gastrointestinal digestion is vital for health. For example, antioxidantscan scavenge and suppress the excess reactive oxygen species (ROS) in the organisms andprevent oxidative-related diseases [51]. Otherwise, excessive ROS causes inflammationwhich leads to diseases, such as inflammatory bowel disease.
3.4. Phenolic and Antioxidants Content in Undigested Residue
Both the free and bound phenolic content of undigested residue increased with theincorporation of mushrooms, as can be seen in Table 2. Mushroom enrichment in thesorghum biscuits increased the dietary fibre content of biscuits and total phenolic contentof the undigested residue meaning that there were more phenolic compounds available totransit into the colon. The phenolic compounds in vegetables or mushrooms are normallyconjugated with dietary fibres [15], which explains the increased phenolic content in theundigested residue. Phenolic compounds in the pellets can undergo biological metabolismby colonic microbiota and microbial enzymes [52]. Dong, et al. [53] demonstrated thatthe bound polyphenols in carrot dietary fibre were liberated during in vitro fermentation,and the fermented polyphenols could promote the growth of specific beneficial floraand suppress the harmful bacterial flora. Fermentation by microbiota can promote thebioavailability and absorption of phenolic compounds. The bio-absorption of polyphenolicmetabolites fermented by gut microbiota may reach the liver via the hepatic portal veinafter absorption, and undergo further degradation and enter into systematic circulationbefore reaching targeted tissues and cells [54].
The free phenolic content of the undigested residue and the FRAP activity was de-creased in the A. auricula biscuits compared to the control and was increased in the L. edodesand T. fuciformis biscuits. However, the total reducing capacity (FRAP) of the undigestedresidue increased when the biscuits were enriched with mushroom powder, due to theincrease in antioxidant activity of the bound fraction of the undigested residue. The DPPHactivity of the undigested residue of mushroom enriched biscuits showed that they had ahigher (p < 0.05) total radical scavenging capacity than the control biscuits.
3.5. β-Glucan Potential Colon-Bioavailability
β-glucan is abundant in both cereals and mushrooms, and it can bring various diseaseprevention properties, such as reducing postprandial blood glucose and lowering LDLcholesterol. The sorghum flour contained a total of 6.41 g/100g dw of β-glucan, whichwas much lower than mushroom samples, as can be seen in Figure 3a. The L. edodes had ahigh content of β-glucan (27.78 g/100g dw), A. auricula had slightly less (21.55 g/100g dw)and T. fuciformis had least (17.44 g/100g dw), and the results are similar to the β-glucancontent of several other mushroom cultivars (9 to 27 g/100g dw) [55]. Cereal β-glucan has afibrous structure with a combination of 1-3 β-glycosidic and 1-4 β-glycosidic linkages, whilemushroom β-glucan mainly consists of 1-3 β-glycosidic with 1-6 β-glycosidic branches. Thedifferent sources of β-glucan have diverse molecular structures, such as molecular weight,conformation and branching degree, influencing their solubility, viscosity and rheological
114
Foods 2021, 10, 1812
characteristics [56]. For example, the chemical structure and molecular weight of β-glucanare two main factors that determine the solubility of β-glucan [57]. The sorghum flour,L. edodes and A. auricula all had a much lower soluble fibre content than β-glucan content,especially L. edodes samples indicating that more β-glucan is water-insoluble in L. edodes.Morales, et al. [58] found that Lentinula edodes had a low yield (4.2%) of hot water-solubleextract and a high content (27%) of β-glucan, which was consistent with L. edodes mushroomused in this study. They further determined the β-glucan of the hot water-soluble extractand the resulting insoluble fraction after extraction, finding that the insoluble fractionhad a higher content of β-glucan (38%) than the soluble extract (13.2%). The solubilityof β-glucan largely depends on the percentage of 1-3 β-glycosidic linkages, because thistype of linkage leads to twists in the straight-chain polymer allowing water molecules toenter into the chains [59]. Lentinan is a water-soluble polysaccharide from L. edodes witha primary structure of the (1-3)-β-D-glucan [60]. The solubility might also be influencedby interactions with other macronutrients in mushrooms, such as insoluble fibre andproteins [61]. β-glucan could covalently connect with the chitin (insoluble fibre) [62],leading to a high content of insoluble β-glucan content in mushroom samples. Alahmedand Simsek [57] found a decrease in the solubility of oat β-glucan due to the increase ofmolecular weight because of a rise in cohesive energy density. The molecular weight of β-glucan also relates to its viscosity and thus affects its functionalities (such as hypoglycaemicand hypocholesterolemic properties) [56].
(a)
(b) (c)
Figure 3. β-glucan and dietary fibre content of sorghum flour and mushrooms (a); and β-glucan content of biscuits andundigested residue (g/100 g dry weight biscuit) (b); and the undigested β-glucan (%) after gastrointestinal digestion (c).Undigested β-glucan (%) was calculated by the following formula: Undigested β-glucan (%) = (gram of β-glucan in theundigested residue/gram of β-glucan in the initial biscuits) × 100. Values = means ± standard deviation (n = 3). Thestatistical analysis of significance was performed between four of the materials for figure (a) and between 10 of the biscuitsamples for figures (b,c). Products with different letters are significantly different (p < 0.05). LEB—L. edodes biscuit; AAB—A.auricula biscuit; TFB—T. fuciformis biscuit.
115
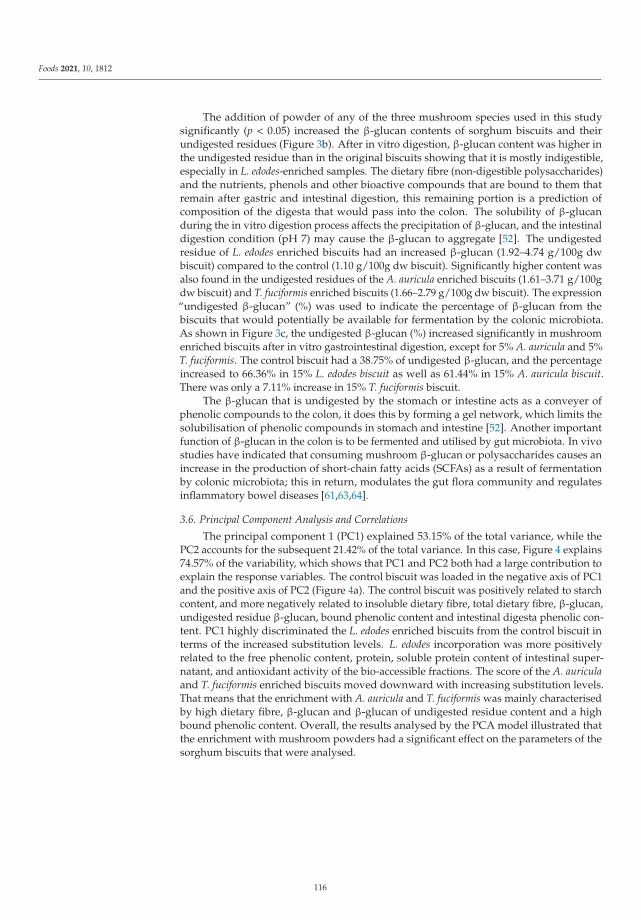
Foods 2021, 10, 1812
The addition of powder of any of the three mushroom species used in this studysignificantly (p < 0.05) increased the β-glucan contents of sorghum biscuits and theirundigested residues (Figure 3b). After in vitro digestion, β-glucan content was higher inthe undigested residue than in the original biscuits showing that it is mostly indigestible,especially in L. edodes-enriched samples. The dietary fibre (non-digestible polysaccharides)and the nutrients, phenols and other bioactive compounds that are bound to them thatremain after gastric and intestinal digestion, this remaining portion is a prediction ofcomposition of the digesta that would pass into the colon. The solubility of β-glucanduring the in vitro digestion process affects the precipitation of β-glucan, and the intestinaldigestion condition (pH 7) may cause the β-glucan to aggregate [52]. The undigestedresidue of L. edodes enriched biscuits had an increased β-glucan (1.92–4.74 g/100g dwbiscuit) compared to the control (1.10 g/100g dw biscuit). Significantly higher content wasalso found in the undigested residues of the A. auricula enriched biscuits (1.61–3.71 g/100gdw biscuit) and T. fuciformis enriched biscuits (1.66–2.79 g/100g dw biscuit). The expression“undigested β-glucan” (%) was used to indicate the percentage of β-glucan from thebiscuits that would potentially be available for fermentation by the colonic microbiota.As shown in Figure 3c, the undigested β-glucan (%) increased significantly in mushroomenriched biscuits after in vitro gastrointestinal digestion, except for 5% A. auricula and 5%T. fuciformis. The control biscuit had a 38.75% of undigested β-glucan, and the percentageincreased to 66.36% in 15% L. edodes biscuit as well as 61.44% in 15% A. auricula biscuit.There was only a 7.11% increase in 15% T. fuciformis biscuit.
The β-glucan that is undigested by the stomach or intestine acts as a conveyer ofphenolic compounds to the colon, it does this by forming a gel network, which limits thesolubilisation of phenolic compounds in stomach and intestine [52]. Another importantfunction of β-glucan in the colon is to be fermented and utilised by gut microbiota. In vivostudies have indicated that consuming mushroom β-glucan or polysaccharides causes anincrease in the production of short-chain fatty acids (SCFAs) as a result of fermentationby colonic microbiota; this in return, modulates the gut flora community and regulatesinflammatory bowel diseases [61,63,64].
3.6. Principal Component Analysis and Correlations
The principal component 1 (PC1) explained 53.15% of the total variance, while thePC2 accounts for the subsequent 21.42% of the total variance. In this case, Figure 4 explains74.57% of the variability, which shows that PC1 and PC2 both had a large contribution toexplain the response variables. The control biscuit was loaded in the negative axis of PC1and the positive axis of PC2 (Figure 4a). The control biscuit was positively related to starchcontent, and more negatively related to insoluble dietary fibre, total dietary fibre, β-glucan,undigested residue β-glucan, bound phenolic content and intestinal digesta phenolic con-tent. PC1 highly discriminated the L. edodes enriched biscuits from the control biscuit interms of the increased substitution levels. L. edodes incorporation was more positivelyrelated to the free phenolic content, protein, soluble protein content of intestinal super-natant, and antioxidant activity of the bio-accessible fractions. The score of the A. auriculaand T. fuciformis enriched biscuits moved downward with increasing substitution levels.That means that the enrichment with A. auricula and T. fuciformis was mainly characterisedby high dietary fibre, β-glucan and β-glucan of undigested residue content and a highbound phenolic content. Overall, the results analysed by the PCA model illustrated thatthe enrichment with mushroom powders had a significant effect on the parameters of thesorghum biscuits that were analysed.
116
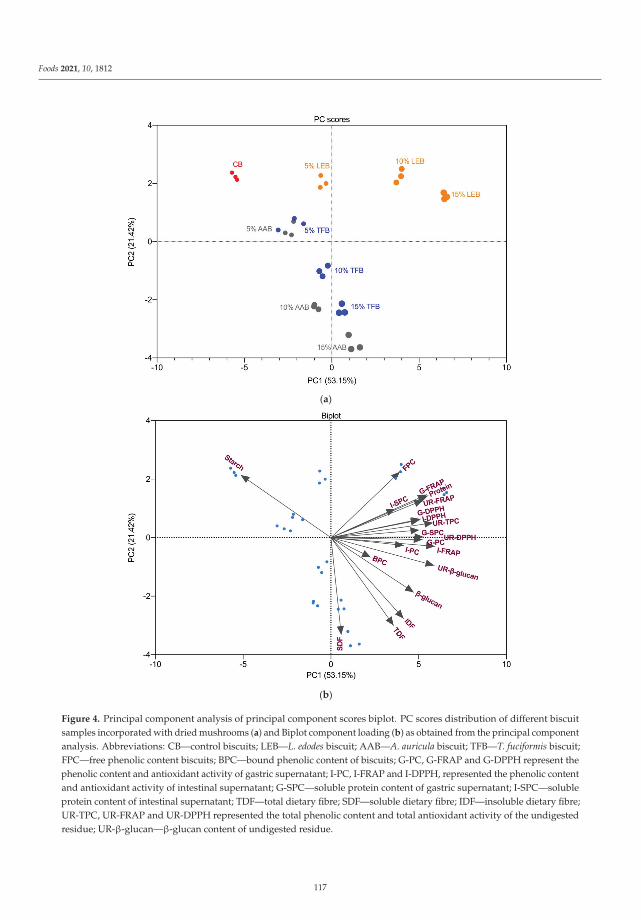
Foods 2021, 10, 1812
(a)
(b)
Figure 4. Principal component analysis of principal component scores biplot. PC scores distribution of different biscuitsamples incorporated with dried mushrooms (a) and Biplot component loading (b) as obtained from the principal componentanalysis. Abbreviations: CB—control biscuits; LEB—L. edodes biscuit; AAB—A. auricula biscuit; TFB—T. fuciformis biscuit;FPC—free phenolic content biscuits; BPC—bound phenolic content of biscuits; G-PC, G-FRAP and G-DPPH represent thephenolic content and antioxidant activity of gastric supernatant; I-PC, I-FRAP and I-DPPH, represented the phenolic contentand antioxidant activity of intestinal supernatant; G-SPC—soluble protein content of gastric supernatant; I-SPC—solubleprotein content of intestinal supernatant; TDF—total dietary fibre; SDF—soluble dietary fibre; IDF—insoluble dietary fibre;UR-TPC, UR-FRAP and UR-DPPH represented the total phenolic content and total antioxidant activity of the undigestedresidue; UR-β-glucan—β-glucan content of undigested residue.
117
Foods 2021, 10, 1812
Pearson’s correlation was conducted to evaluate the correlations between the nutri-tional composition, bio-accessible phenolic content, peptides, antioxidants and β-glucanremaining after in vitro digestion. The protein content of biscuits was positively correlatedwith the soluble protein content of gastric supernatant (r = 0.662, p < 0.001) and intestinalsupernatant (r = 0.464, p < 0.01) (Table S2). This means that the biscuits with a higherprotein content had a higher soluble peptide content in the in vitro digested supernatant.The phenolic content of both gastric and intestinal supernatant was positively correlated(p < 0.001) with the antioxidant activities (FRAP and DPPH). There was a positive correla-tion between soluble protein content and phenolic content of gastric supernatant (r = 0.601,p < 0.001). A similar correlation was observed in the intestinal supernatant (r = 0.594,p = 0.001). These findings were added of interest and suggested that the soluble peptidesin the digest supernatants might interact with phenolic compounds and potentially helptransport the bioactive compounds for further intestinal uptake.
Insoluble dietary fibre content was positively correlated with the phenolic content ofboth gastric and intestinal supernatant and antioxidant activity of the intestinal supernatant.The results showed that there were positive correlations between biscuit insoluble dietaryfibre and gastric digesta phenolic content (r = 0.524, p < 0.01), intestinal digesta phenoliccontent (r = 0.463, p = 0.01), intestinal digesta FRAP (r = 0.634, p < 0.001) and intestinaldigesta DPPH (r = 0.362, p < 0.05). The soluble dietary fibre did not show significantcorrelations with the intestinal digesta phenolic and antioxidant content. The explanationcould be that insoluble dietary fibre has a higher phenolic and antioxidant content thansoluble dietary fibre [15].
Mushroom enrichment improved the total insoluble dietary fibre content of sorghumbiscuits. Part of the phenolic compounds and antioxidants contained in insoluble dietaryfibre were released during the gastrointestinal digestion of biscuits. Phenolic contentof gastric and intestinal supernatant from mushroom enriched biscuits were increased.Phenolic compounds trapped in mushroom dietary fibre could be easier to be released thansorghum insoluble fibre during digestion. It might be due to the difference in the structureof insoluble fibre between mushroom (chitin-β-glucan) and sorghum (cellulose). Onerecent study compared the release of phenolic compounds from different cereal sourcesof insoluble dietary fibre (wheat, barley, quinoa and triticale) under in vitro simulatedgastrointestinal digestion and found that insoluble fibre from quinoa and triticale had asignificantly higher phenolic content in both gastric and intestinal fractions than wheatand barley [65].
Dietary fibres were reported to have negative effects on the release and absorptionof phenolic compounds by their molecular interactions [66]. A positive correlation wasfound between β-glucan content of the undigested residue and its total phenolic content(r = 0.754, p < 0.001), FRAP (r = 0.588, p = 0.001) and DPPH (r = 0.706, p < 0.001). Insolubledietary fibre had a lower correlation coefficient (r = 0.456, p < 0.05) with total phenoliccontent of the undigested residue. The β-glucan remaining might be the main insolublefibre that contributes to the potential delivery of bioactive compounds to the colon. Theenriched mushroom insoluble dietary fibre might have a higher content of bound phenoliccompounds than sorghum insoluble fibre. Insoluble dietary fibre also favoured the accu-mulation of β-glucan in the colon as a positive correlation was found between insolubledietary fibre and β-glucan of undigested residue (r = 0.788, p < 0.001).
3.7. Nutritional Value
Industrial production of biscuits would require the information of the functionalingredients in the manipulation of the quality and nutritional value of the final products.The optical addition of mushroom powder into cereal products were between 5% and15% with minor or no negative effects on the sensory acceptability and slight changesin physical characteristics [16]. In the nutritional view of point, enrichment of sorghumbiscuits with mushrooms enhanced the dietary fibre and β-glucan content. Previous studyhas illustrated a close association between an increase of dietary fibre consumption and
118
Foods 2021, 10, 1812
a lower incidence of obesity and type-2 diabetes in relation to gut microbiota [67]. Dailyconsumption of 3 g of β-glucan is recommended to have a healthy indicate of cholesterol-lowering [68]. This means that a serving of approximately 50 g of biscuits enriched with15% mushroom can satisfy this recommendation. Glycaemic carbohydrate is normallyhigh in biscuits, but mushroom fortification reduced the in vitro glycaemic glucose value(Table S2), especially for 15% A. auricula and T. fuciformis enriched sample with a lowerthan 30 g glucose per 100 g dry weight. The high fibre content and low glucose level ofbiscuits could be considered to be diabetic-friendly. The bioavailable small peptides andantioxidants was improved by mushroom enrichment, which can be linked to help reliefof chronic diseases. Apart from being nutrient-rich, sorghum biscuits are gluten-free thatoffers significant opportunities for those population with coeliac disease. These propertiesadded the interest of developing functional products in the future.
4. Conclusions
Enrichment of sorghum biscuits with mushroom powders improved their nutritionalquality. Most of mushroom-containing biscuits had a higher content of phenolic com-pounds quantified in their in vitro digested supernatants and better antioxidant activitythan the control biscuit, indicating that mushroom fortification enhanced the bioavailablephenolic content. The digested L. edodes and T. fuciformis biscuits contained more solu-ble peptides than the control and A. auricula biscuits. The soluble peptides had a smallmolecular weight that cannot be identified by the SDS-page gel. The undigested residueof mushroom enriched biscuits had a higher remaining portions of phenolic compoundand β-glucan than the control, which was related to the insoluble dietary fibre. Thesefindings provide an understanding of the nutritional and functional benefits of mushroomenriched biscuits under the in vitro gastrointestinal digestion and support the idea thatmushroom enrichment can potentially increase the bio-accessible phenolic content andthe proportions of phenolic compounds and β-glucan delivered to colon. This means thedeveloped biscuits would have a real application in the future with a potential to attenuatechronic diseases. Future experiments are required to evaluate the functionalities of thebiscuits ingredients released or remained during digestion through modelled cell line andin vivo studies.
Supplementary Materials: The following are available online at https://www.mdpi.com/article/10.3390/foods10081812/s1, Table S1: Formula of sorghum biscuits enriched with dried mushroompowders, Table S2: Starch, protein and dietary fibre contents and in vitro glycaemic response ofsorghum biscuits enriched with dried mushroom powders, Figure S1: Soluble protein content(SPC) of mushrooms and sorghum flour after in vitro gastrointestinal digestion., Figure S2: In vitrobioaccessible antioxidant activity of mushrooms and sorghum flour assessed by FRAP (a) and DPPH(b). Values are means ± standard deviation (n = 3). Products with different letters are significantlydifferent (p < 0.05). Figure S3: Pearson’s correlations between the observed biscuits parameters beforeand after in vitro digestion.
Author Contributions: J.T.: methodology, formal analysis, investigation, writing—original draftpreparation, data curation. M.A.B.: writing—review and editing. G.W.: writing—review andediting. W.B.: supervision. P.C.: supervision. B.T.: supervision. C.S.B.: Conceptualisation, supervi-sion, writing—review and editing. All authors have read and agreed to the published version ofthe manuscript.
Funding: This research received no external funding.
Acknowledgments: The authors would like to thank Xiaodan Hui and Letitia Stipkovits for thetechnical support.
Conflicts of Interest: The authors declare no conflict of interest.
119
Foods 2021, 10, 1812
References
1. Espitia-Hernandez, P.; Chavez Gonzalez, M.L.; Ascacio-Valdes, J.A.; Davila-Medina, D.; Flores-Naveda, A.; Silva, T.; RuelasChacon, X.; Sepulveda, L. Sorghum (Sorghum bicolor L.) as a potential source of bioactive substances and their biological properties.Crit. Rev. Food Sci. Nutr. 2020, 1–12. [CrossRef]
2. Girard, A.L.; Awika, J.M. Sorghum polyphenols and other bioactive components as functional and health promoting foodingredients. J. Cereal Sci. 2018, 84, 112–124. [CrossRef]
3. Acquisgrana, M.d.R.; Gomez Pamies, L.C.; Martinez Amezaga, N.M.J.; Quiroga, F.M.; Ribotta, P.D.; Benítez, E.I. Impact ofmoisture and grinding on yield, physical, chemical and thermal properties of wholegrain flour obtained from hydrothermallytreated sorghum grains. Int. J. Food Sci. Technol. 2020, 55, 2901–2909. [CrossRef]
4. Gosine, L.; McSweeney, M.B. Consumers’ attitudes towards alternative grains: A conjoint analysis study. Int. J. Food Sci. Technol.2019, 54, 1588–1596. [CrossRef]
5. Espinosa-Ramírez, J.; Serna-Saldívar, S.O. Functionality and characterization of kafirin-rich protein extracts from different wholeand decorticated sorghum genotypes. J. Cereal Sci. 2016, 70, 57–65. [CrossRef]
6. Marengo, M.; Bonomi, F.; Marti, A.; Pagani, M.A.; Elkhalifa, A.E.O.; Iametti, S. Molecular features of fermented and sproutedsorghum flours relate to their suitability as components of enriched gluten-free pasta. LWT Food Sci. Technol. 2015, 63, 511–518.[CrossRef]
7. Cabrera-Ramirez, A.H.; Luzardo-Ocampo, I.; Ramirez-Jimenez, A.K.; Morales-Sanchez, E.; Campos-Vega, R.; Gaytan-Martinez, M.Effect of the nixtamalization process on the protein bioaccessibility of white and red sorghum flours during in vitro gastrointestinaldigestion. Food Res. Int. 2020, 134, 109234. [CrossRef] [PubMed]
8. De Morais Cardoso, L.; Pinheiro, S.S.; Martino, H.S.; Pinheiro-Sant’Ana, H.M. Sorghum (Sorghum bicolor L.): Nutrients, bioactivecompounds, and potential impact on human health. Crit. Rev. Food Sci. Nutr. 2017, 57, 372–390. [CrossRef]
9. Taylor, J.R.N.; Belton, P.S.; Beta, T.; Duodu, K.G. Increasing the utilisation of sorghum, millets and pseudocereals: Developments inthe science of their phenolic phytochemicals, biofortification and protein functionality. J. Cereal Sci. 2014, 59, 257–275. [CrossRef]
10. Lu, X.; Brennan, M.A.; Serventi, L.; Brennan, C.S. Incorporation of mushroom powder into bread dough-effects on dough rheologyand bread properties. Cereal Chem. 2018, 95, 418–427. [CrossRef]
11. Radzki, W.; Ziaja-Sołtys, M.; Nowak, J.; Topolska, J.; Bogucka-Kocka, A.; Sławinska, A.; Michalak-Majewska, M.; Jabłonska-Rys, E.;Kuczumow, A. Impact of processing on polysaccharides obtained from button mushroom (Agaricus bisporus). Int. J. Food Sci.Technol. 2019, 54, 1405–1412. [CrossRef]
12. Khongdetch, J.; Laohakunjit, N.; Kaprasob, R. King Boletus mushroom-derived bioactive protein hydrolysate: Characterisation,antioxidant, ACE inhibitory and cytotoxic activities. Int. J. Food Sci. Technol. 2021. [CrossRef]
13. Colosimo, R.; Warren, F.J.; Edwards, C.H.; Ryden, P.; Dyer, P.S.; Finnigan, T.J.A.; Wilde, P.J. Comparison of the behavior of fungaland plant cell wall during gastrointestinal digestion and resulting health effects: A review. Trends Food Sci. Technol. 2021, 110,132–141. [CrossRef]
14. Williams, B.A.; Mikkelsen, D.; le Paih, L.; Gidley, M.J. In vitro fermentation kinetics and end-products of cereal arabinoxylans and(1,3;1,4)-β-glucans by porcine faeces. J. Cereal Sci. 2011, 53, 53–58. [CrossRef]
15. Wang, L.; Brennan, M.A.; Guan, W.; Liu, J.; Zhao, H.; Brennan, C.S. Edible mushrooms dietary fibre and antioxidants: Effectson glycaemic load manipulation and their correlations pre-and post-simulated in vitro digestion. Food Chem. 2021, 351, 129320.[CrossRef]
16. Tu, J.; Brennan, M.; Brennan, C. An insight into the mechanism of interactions between mushroom polysaccharides and starch.Curr. Opin. Food Sci. 2021, 37, 17–25. [CrossRef]
17. Biao, Y.; Chen, X.; Wang, S.; Chen, G.; McClements, D.J.; Zhao, L. Impact of mushroom (Pleurotus eryngii) flour upon qualityattributes of wheat dough and functional cookies-baked products. Food Sci. Nutr. 2020, 8, 361–370. [CrossRef]
18. Gonzalez, A.; Cruz, M.; Losoya, C.; Nobre, C.; Loredo, A.; Rodriguez, R.; Contreras, J.; Belmares, R. Edible mushrooms as a novelprotein source for functional foods. Food Funct. 2020, 11, 7400–7414. [CrossRef]
19. Jakobek, L.; Matic, P. Non-covalent dietary fiber-Polyphenol interactions and their influence on polyphenol bioaccessibility. TrendsFood Sci. Technol. 2019, 83, 235–247. [CrossRef]
20. Barros, R.G.C.; Pereira, U.C.; Andrade, J.K.S.; de Oliveira, C.S.; Vasconcelos, S.V.; Narain, N. In vitro gastrointestinal digestionand probiotics fermentation impact on bioaccessbility of phenolics compounds and antioxidant capacity of some native andexotic fruit residues with potential antidiabetic effects. Food Res. Int. 2020, 136, 109614. [CrossRef]
21. Blanco Canalis, M.S.; Baroni, M.V.; Leon, A.E.; Ribotta, P.D. Effect of peach puree incorportion on cookie quality and on simulateddigestion of polyphenols and antioxidant properties. Food Chem. 2020, 333, 127464. [CrossRef]
22. Wu, G.; Hui, X.; Mu, J.; Gong, X.; Stipkovits, L.; Brennan, M.A.; Brennan, C.S. Functionalization of sodium caseinate fortified withblackcurrant concentrate via spray-drying and freeze-drying techniques: The nutritional properties of the fortified particles. LWTFood Sci. Technol. 2021, 142, 111051. [CrossRef]
23. Gong, X.; Morton, J.D.; Bhat, Z.F.; Mason, S.L.; Bekhit, A.E.D.A. Comparative efficacy of actinidin from green and gold kiwi fruitextract onin vitrosimulated protein digestion of beef Semitendinosusand its myofibrillar protein fraction. Int. J. Food Sci. Technol.2019, 55, 742–750. [CrossRef]
24. Wang, L.; Zhao, H.; Brennan, M.; Guan, W.; Liu, J.; Wang, M.; Wen, X.; He, J.; Brennan, C. In vitro gastric digestion antioxidantand cellular radical scavenging activities of wheat-shiitake noodles. Food Chem. 2020, 330, 127214. [CrossRef]
120
Foods 2021, 10, 1812
25. Li, Q.; Yang, S.; Li, Y.; Huang, Y.; Zhang, J. Antioxidant activity of free and hydrolyzed phenolic compounds in soluble andinsoluble dietary fibres derived from hulless barley. LWT Food Sci. Technol. 2019, 111, 534–540. [CrossRef]
26. Polat, H.; Dursun Capar, T.; Inanir, C.; Ekici, L.; Yalcin, H. Formulation of functional crackers enriched with germinated lentilextract: A Response Surface Methodology Box-Behnken Design. LWT Food Sci. Technol. 2020, 123, 109065. [CrossRef]
27. Wu, G.; Hui, X.; Stipkovits, L.; Rachman, A.; Tu, J.; Brennan, M.A.; Brennan, C.S. Whey protein-blackcurrant concentrate particlesobtained by spray-drying and freeze-drying for delivering structural and health benefits of cookies. Innov. Food Sci. Emerg.Technol. 2021, 68, 102606. [CrossRef]
28. McCleary, B.V.; Draga, A. Measurement of beta-glucan in mushrooms and mycelial products. J. AOAC Int. 2016, 99, 364–373.[CrossRef]
29. Prosky, L.; Asp, N.-G.; Schweizer, T.F.; Devries, J.W.; Furda, I. Determination of insoluble and soluble dietary fiber in foods andfood products: Collaborative study. J. AOAC Int. 1992, 75, 360–367. [CrossRef]
30. Lang, G.H.; Lindemann, I.D.S.; Ferreira, C.D.; Hoffmann, J.F.; Vanier, N.L.; de Oliveira, M. Effects of drying temperature andlong-term storage conditions on black rice phenolic compounds. Food Chem. 2019, 287, 197–204. [CrossRef] [PubMed]
31. Irondi, E.A.; Adegoke, B.M.; Effion, E.S.; Oyewo, S.O.; Alamu, E.O.; Boligon, A.A. Enzymes inhibitory property, antioxidantactivity and phenolics profile of raw and roasted red sorghum grains in vitro. Food Sci. Hum. Wellness 2019, 8, 142–148. [CrossRef]
32. Rocchetti, G.; Rizzi, C.; Pasini, G.; Lucini, L.; Giuberti, G.; Simonato, B. Effect of moringa oleifera l. leaf powder addition on thephenolic bioaccessibility and on in vitro starch digestibility of durum wheat fresh pasta. Foods 2020, 9, 628. [CrossRef] [PubMed]
33. Zielinski, H.; Szawara-Nowak, D.; Wronkowska, M. Bioaccessibility of anti-AGEs activity, antioxidant capacity and phenolicsfrom water biscuits prepared from fermented buckwheat flours. LWT Food Sci. Technol. 2020, 123, 109051. [CrossRef]
34. Liu, C.; Ge, S.; Yang, J.; Xu, Y.; Zhao, M.; Xiong, L.; Sun, Q. Adsorption mechanism of polyphenols onto starch nanoparticles andenhanced antioxidant activity under adverse conditions. J. Funct. Foods 2016, 26, 632–644. [CrossRef]
35. Dantas, A.M.; Mafaldo, I.M.; Oliveira, P.M.L.; Lima, M.D.S.; Magnani, M.; Borges, G. Bioaccessibility of phenolic compounds innative and exotic frozen pulps explored in Brazil using a digestion model coupled with a simulated intestinal barrier. Food Chem.2019, 274, 202–214. [CrossRef] [PubMed]
36. Meng, X.j.; Tan, C.; Feng, Y. Solvent extraction and in vitro simulated gastrointestinal digestion of phenolic compounds frompurple sweet potato. Int. J. Food Sci. Technol. 2019, 54, 2887–2896. [CrossRef]
37. Quan, W.; Tao, Y.; Lu, M.; Yuan, B.; Chen, J.; Zeng, M.; Qin, F.; Guo, F.; He, Z. Stability of the phenolic compounds and antioxidantcapacity of five fruit (apple, orange, grape, pomelo and kiwi) juices during in vitro-simulated gastrointestinal digestion. Int. J.Food Sci. Technol. 2018, 53, 1131–1139. [CrossRef]
38. Wu, T.; Taylor, C.; Nebl, T.; Ng, K.; Bennett, L.E. Effects of chemical composition and baking on in vitro digestibility of proteins inbreads made from selected gluten-containing and gluten-free flours. Food Chem. 2017, 233, 514–524. [CrossRef]
39. Sousa, R.; Portmann, R.; Dubois, S.; Recio, I.; Egger, L. Protein digestion of different protein sources using the INFOGEST staticdigestion model. Food Res. Int. 2020, 130, 108996. [CrossRef] [PubMed]
40. Shen, C.R.; Liu, C.L.; Lee, H.P.; Chen, J.K. The identification and characterization of chitotriosidase activity in pancreatin fromporcine pancreas. Molecules 2013, 18, 2978–2987. [CrossRef]
41. Vilcacundo, R.; Martínez-Villaluenga, C.; Hernández-Ledesma, B. Release of dipeptidyl peptidase IV, α-amylase and α-glucosidaseinhibitory peptides from quinoa (Chenopodium quinoa Willd.) during in vitro simulated gastrointestinal digestion. J. Funct.Foods 2017, 35, 531–539. [CrossRef]
42. Joye, I. Protein digestibility of cereal products. Foods 2019, 8, 199. [CrossRef] [PubMed]43. Phongthai, S.; Rawdkuen, S. Fractionation and characterization of antioxidant peptides from rice bran protein hydrolysates
stimulated by in vitro gastrointestinal digestion. Cereal Chem. 2020, 97, 316–325. [CrossRef]44. Morales, D.; Miguel, M.; Garces-Rimon, M. Pseudocereals: A novel source of biologically active peptides. Crit. Rev. Food Sci. Nutr.
2020, 9, 1537–1544. [CrossRef]45. Ashwath Kumar, K.; Sharma, G.K.; Anilakumar, K.R. Influence of multigrain premix on nutritional, in-vitro and in-vivo protein
digestibility of multigrain biscuit. J. Food Sci. Technol. 2019, 56, 746–753. [CrossRef]46. Sciarini, L.S.; Bustos, M.C.; Vignola, M.B.; Paesani, C.; Salinas, C.N.; Perez, G.T. A study on fibre addition to gluten free bread: Its
effects on bread quality and in vitro digestibility. J. Food Sci. Technol. 2017, 54, 244–252. [CrossRef]47. Papoutsis, K.; Zhang, J.; Bowyer, M.C.; Brunton, N.; Gibney, E.R.; Lyng, J. Fruit, vegetables, and mushrooms for the preparation
of extracts with alpha-amylase and alpha-glucosidase inhibition properties: A review. Food Chem. 2021, 338, 128119. [CrossRef][PubMed]
48. Baczek, N.; Jarmulowicz, A.; Wronkowska, M.; Haros, C.M. Assessment of the glycaemic index, content of bioactive compounds,and their in vitro bioaccessibility in oat-buckwheat breads. Food Chem. 2020, 330, 127199. [CrossRef] [PubMed]
49. Ketnawa, S.; Suwannachot, J.; Ogawa, Y. In vitro gastrointestinal digestion of crisphead lettuce: Changes in bioactive compoundsand antioxidant potential. Food Chem. 2020, 311, 125885. [CrossRef] [PubMed]
50. Lu, X.; Brennan, M.A.; Narciso, J.; Guan, W.; Zhang, J.; Yuan, L.; Serventi, L.; Brennan, C.S. Correlations between the phenolic andfibre composition of mushrooms and the glycaemic and textural characteristics of mushroom enriched extruded products. LWTFood Sci. Technol. 2020, 118, 108730. [CrossRef]
51. Sanchez, C. Reactive oxygen species and antioxidant properties from mushrooms. Synth. Syst. Biotechnol. 2017, 2, 13–22.[CrossRef] [PubMed]
121
Foods 2021, 10, 1812
52. Mosele, J.I.; Motilva, M.J.; Ludwig, I.A. Beta-glucan and phenolic compounds: Their concentration and behavior during in vitrogastrointestinal digestion and colonic fermentation of different barley-based food products. J. Agric. Food Chem. 2018, 66,8966–8975. [CrossRef] [PubMed]
53. Dong, R.; Liu, S.; Zheng, Y.; Zhang, X.; He, Z.; Wang, Z.; Wang, Y.; Xie, J.; Chen, Y.; Yu, Q. Release and metabolism of boundpolyphenols from carrot dietary fiber and their potential activity in in vitro digestion and colonic fermentation. Food Function2020, 11, 6652–6665. [CrossRef] [PubMed]
54. Gowd, V.; Karim, N.; Shishir, M.R.I.; Xie, L.; Chen, W. Dietary polyphenols to combat the metabolic diseases via altering gutmicrobiota. Trends Food Sci. Technol. 2019, 93, 81–93. [CrossRef]
55. Sari, M.; Prange, A.; Lelley, J.I.; Hambitzer, R. Screening of beta-glucan contents in commercially cultivated and wild growingmushrooms. Food Chem. 2017, 216, 45–51. [CrossRef]
56. Du, B.; Meenu, M.; Liu, H.; Xu, B. A concise review on the molecular structure and function relationship of β-glucan. Int. J. Mol.Sci. 2019, 20, 4032. [CrossRef]
57. Alahmed, A.; Simsek, S. Pre-harvest glyphosate application effects on properties of β-glucan from oat groats. J. Cereal Sci. 2020,96, 103119. [CrossRef]
58. Morales, D.; Smiderle, F.R.; Piris, A.J.; Soler-Rivas, C.; Prodanov, M. Production of a β-d-glucan-rich extract from Shiitakemushrooms (Lentinula edodes) by an extraction/microfiltration/reverse osmosis (nanofiltration) process. Innov. Food Sci. Emerg.Technol. 2019, 51, 80–90. [CrossRef]
59. Shoukat, M.; Sorrentino, A. Cereal β-glucan: A promising prebiotic polysaccharide and its impact on the gut health. Int. J. FoodSci. Technol. 2021, 56, 2088–2097. [CrossRef]
60. Zhuang, H.; Chen, Z.; Feng, T.; Yang, Y.; Zhang, J.; Liu, G.; Li, Z.; Ye, R. Characterization of Lentinus edodes beta-glucaninfluencing the in vitro starch digestibility of wheat starch gel. Food Chem. 2017, 224, 294–301. [CrossRef]
61. Vetvicka, V.; Gover, O.; Karpovsky, M.; Hayby, H.; Danay, O.; Ezov, N.; Hadar, Y.; Schwartz, B. Immune-modulating activities ofglucans extracted from Pleurotus ostreatus and Pleurotus eryngii. J. Funct. Foods 2019, 54, 81–91. [CrossRef]
62. Singh, A.; Dutta, P.K. Extraction of chitin-glucan complex from Agaricus bisporus: Characterization and antibacterial activity. J.Polym. Mater. 2017, 34, 1–9.
63. Wang, X.; Wang, W.; Wang, L.; Yu, C.; Zhang, G.; Zhu, H.; Wang, C.; Zhao, S.; Hu, C.A.; Liu, Y. Lentinan modulates intestinalmicrobiota and enhances barrier integrity in a piglet model challenged with lipopolysaccharide. Food Funct. 2019, 10, 479–489.[CrossRef] [PubMed]
64. Zhao, R.; Ji, Y.; Chen, X.; Su, A.; Ma, G.; Chen, G.; Hu, Q.; Zhao, L. Effects of a beta-type glycosidic polysaccharide fromFlammulina velutipes on anti-inflammation and gut microbiota modulation in colitis mice. Food Funct. 2020, 11, 4259–4274.[CrossRef] [PubMed]
65. Liu, M.; Liu, X.; Luo, J.; Bai, T.; Chen, H. Effect of digestion on bound phenolic content, antioxidant activity and hypoglycemicability of insoluble dietary fibre from four Triticeae crops. J. Food Biochem. 2021, 45, e13746. [CrossRef] [PubMed]
66. Quirós-Sauceda, A.E.; Palafox-Carlos, H.; Sáyago-Ayerdi, S.G.; Ayala-Zavala, J.F.; Bello, L.A.; Álvarez-Parrilla, E.; de la Rosad, L.A.;González-Córdova, A.F.; González-Aguilar, G.A. Dietary fiber and phenolic compounds as functional ingredients: Interactionand possible effect after ingestion. Food Funct. 2014, 5, 1063–1072. [CrossRef]
67. Liu, H.; Wu, H.; Wang, Q. Health-promoting effects of dietary polysaccharide extracted from Dendrobium aphyllum on micecolon, including microbiota and immune modulation. Int. J. Food Sci. Technol. 2019, 54, 1684–1696. [CrossRef]
68. FDA. Food labelling: Health claims; soluble fiber from whole oats and risk of coronary heart disease. Fed. Regist. 1997, 62,5343–15344.
122
foods
Article
Physicochemical Properties and Drivers of Liking andDisliking for Cooked Rice Containing Various Types ofProcessed Whole Wheat
Da-Been Lee 1,†, Mi-Ran Kim 1,†, Jeong-Ae Heo 2, Yang-Soo Byeon 1,3 and Sang-Sook Kim 1,*
Citation: Lee, D.-B.; Kim, M.-R.; Heo,
J.-A.; Byeon, Y.-S.; Kim, S.-S.
Physicochemical Properties and
Drivers of Liking and Disliking for
Cooked Rice Containing Various
Types of Processed Whole Wheat.
Foods 2021, 10, 1470. https://doi.org/
10.3390/foods10071470
Academic Editors: Charles Brennan,
Luca Serventi, Rana Mustafa and
Mike Sissons
Received: 22 April 2021
Accepted: 21 June 2021
Published: 25 June 2021
Publisher’s Note: MDPI stays neutral
with regard to jurisdictional claims in
published maps and institutional affil-
iations.
Copyright: © 2021 by the authors.
Licensee MDPI, Basel, Switzerland.
This article is an open access article
distributed under the terms and
conditions of the Creative Commons
Attribution (CC BY) license (https://
creativecommons.org/licenses/by/
4.0/).
1 Research Group of Food Processing, Korea Food Research Institute, Wanju-gun 55365, Korea;[email protected] (D.-B.L.); [email protected] (M.-R.K.); [email protected] (Y.-S.B.)
2 Technical Assistance Center, Korea Food Research Institute, Wanju-gun 55365, Korea; [email protected] Department of Biotechnology, College of Life Sciences and Biotechnology,
Korea University, Seoul 02841, Korea* Correspondence: [email protected]; Tel.: +82-63-219-9042† Both authors contributed equally to this work.
Abstract: For utilization of whole wheat (WW) in cooked rice products, WW was processed by fourdifferent methods (steeping (S_WW), milling (M_WW), enzymatic treatment (E_WW), and passingthrough a roll mill (1 mm) (R_WW)). Additionally, the physicochemical properties of cooked ricecontaining various processed wheat were investigated. The hardness of the cooked rice decreasedsignificantly with R_WW and E_WW compared to WW. As a result of a consumer acceptance test,the cooked rice samples containing M_WW and E_WW with high liking scores frequently included‘chewiness’ as a reason for liking, and the cooked rice with WW and S_WW was mentioned as being‘too hard’ as a reason for disliking. The cooked rice with R_WW, which had the lowest liking score,was mentioned as having appearance characteristics such as ‘husk’, ‘clumpy appearance’, and ‘messyappearance’ as reasons for disliking. The overall results of this study suggest the inclusion of M_WWor E_WW with cooked rice considering health-related benefits and consumer acceptability.
Keywords: cooked rice; processed whole wheat; physicochemical properties; consumer acceptance;drivers of liking and disliking
1. Introduction
Rice is a major food grain in Korea, and 95% of it is a commercial staple food consumedin the form of cooked rice [1]. Various cooked rice products have been developed by mixingother grains. In particular, wheat, as the second major grain, is consumed at levels ofapproximately 32 kg per capita per year in Korea [2]. However, most wheat is importedfrom the United States, Australia, and Canada, and only approximately 2% of the totalamount consumed is produced in Korea [2]. Wheat is rich in starch, protein, dietary fiber,minerals, phenolic compounds, and phytochemicals [3]. As interest in health increases, thedemand and interest in whole wheat is increasing. The consumption of these processedproducts is effective in preventing adult diseases such as hypertension and diabetes. Inparticular, whole wheat contains fiber, vitamin B, vitamin E, iron, and magnesium, isparticularly rich in food fiber and is known to lower the risk of obesity, stroke, heartdisease, diabetes and colon cancer [4–6]. Additionally, whole wheat has a low glycemicindex (GI), which is good for diabetes management and lowers blood cholesterol, reducingthe risk of arteriosclerosis and hypercholesterolemia [7]. The benefits of eating whole grainfoods are well known, but their use is limited because of the resulting low sensory qualityfor processed foods [8].
Food development is a consumer-oriented task, and understanding consumers’ pref-erences has become a key factor in the success of such research [9,10]. Therefore, it isimportant to understand how consumers perceive products [11]. Thus, obtaining consumer
Foods 2021, 10, 1470. https://doi.org/10.3390/foods10071470 https://www.mdpi.com/journal/foods123
Foods 2021, 10, 1470
feedback on the sensory description of a product as an alternative to conventional sensoryprofiling has become of great interest over the past two decades [12]. The conventionalapproach used to understand consumers’ preferences is internal and external preferencemapping, which combines descriptive data provided by trained panels with acceptancetests performed by consumers [13]. The preference mapping technique requires consumertesting by consumers for acceptability and quantitative descriptive analysis of sensoryproperties by trained panels, which is expensive and time-consuming [9,12]. Furthermore,the terms generated by the trained panel may differ from those used by consumers and canbe difficult for consumers to understand [10,14]. Therefore, ten Kleij et al. [14] proposed atextual analysis of open-ended questions to complement the preference mapping technique.In many studies, free-comment responses explicitly written by consumers in the formof open-ended questions have been mainly used to reduce respondents’ complaints byallowing them to explain their responses to other questionnaire items [15]. Moreover,free-comment responses have a definite advantage of being easy to understand becauseconsumers’ opinions are expressed in their own language and do not require deep thinking.In addition, it is possible to obtain rich information, including what the researcher did notpredict [16].
The objectives of this study were to evaluate the consumer acceptability of processedwhole wheat products for cooked rice with improved texture using various processingmethods to find out the potential of entering the market. Additionally, functional activityand physicochemical properties were investigated. In addition to consumer acceptances,consumer perceptions were studied by applying two open-ended questions to identify thedrivers of liking and disliking for cooked rice samples of cooked rice samples with varioustypes of processed whole wheat.
2. Materials and Methods
2.1. Physicochemical Property2.1.1. Materials
The five types of cooked rice were prepared with 60% rice (Sindongjin, Yeonggwang,Jeonlanamdo, Korea, 2019) and 40% whole wheat or various types of processed wholewheat (Beakchal, Yeonggwang, Jeonlanamdo, Korea, 2018). Whole wheat (WW) wasprocessed in four ways: steeping (S_WW), milling (M_WW), enzymatic treatment (E_WW),and passing through a roll mill (1 mm) (R_MM). The S_WW was WW steeped with tapwater at 4 ◦C for 24 h; M_WW was WW milled to remove 5% bran using a pearling machine(2RSB-10FS, Kett, Tokyo, Japan); E_WW was WW treated with 5% viscozyme (Novozyme,Bagværd, Denmark) at 50 ◦C for 24 h; R_WW was WW passed three times through a rollmill with gaps of 2.0, 1.5 and 1.0 mm, sequentially, after steeping in tap water at 4 ◦C for16 h.
2.1.2. Cooked Rice with Whole Wheat
Rice (540 g) and wheat (360 g) were washed with water using a rice cleaner (PR7J,Aiho, Tokyo, Japan). Filltered water was added to the rice and wheat at a weight ratio of1.6:1 (14% moisture basis) and, then, the mixture was cooked using an electric rice cooker(CRP-LHTR1010FWM, Cuckoo, Yangsan-si, Gyeongsangnam-do, Korea). Cooked rice ina bowl was stirred smoothly five times with a spoon and then cooled for 5 min at roomtemperature. The stirring and cooling procedures of the cooked rice were repeated twice.
2.1.3. Physical Property Analysis of Cooked Rice with Whole Wheat
The moisture content of cooked rice samples containing processed WW was mea-sured according to American Association of Cereal Chemists (AACC) Method 44-15A(AACC, 2010) using a dry oven (HK-DO1000F, Hankuk S & I Co., Hwaseong, Korea).Texture profile analysis (TPA) of cooked rice was performed based on the modified AACCMethod 74-09 (AACC, 2010) with a Texture Analyzer TA-XT plus system (Stable Mi-cro System Ltd., Haslemere, UK). The cooked rice (12 g) was placed into a cylindrical
124
Foods 2021, 10, 1470
container (4 cm diameter × 1 cm length) and compressed by approximately 40% using a20 mm plunger. The return distance was 30 mm, the return speed was 1.7 mm/s, and thecontact force was 50 g. Hardness, adhesiveness, springiness, cohesiveness, chewiness, andresilience were determined from the two-cycle curves using Texture Export for Window(Stable Micro Systems, Godalming, UK). All physicochemical analyses were repeated threetimes.
2.1.4. Starch Hydrolysis Index
The in vitro starch hydrolysis index (HI) of cooked rice samples containing processedWW was determined according to a modified method [17]. Two grams of freeze-driedcooked rice powder was mixed with 100 mL of 0.05 M sodium potassium phosphate buffer(pH 6.9). Then, 110 U pancreatic amylase (Type I-A, Sigma Aldrich, St. Louis, MO, USA),was added, and the mixture was incubated in a shaking incubator (120 rpm) at 37 ◦C. Next,2 mL aliquots were added every 0, 30, 60, 90, 120 and 180 min, boiled at 95 ◦C for 5 min,and cooled on ice. The aliquots were centrifuged at 4000 rpm for 10 min, and the reducingsugar content in the supernatant was measured by a modified method from Somogyi [18].For each starch hydrolysis curve, the area under the curve (AUC) was calculated usingSigmaPlot 13.0 (Systat Software Inc., Point Richmond, CA, USA). Hydrolysis indexes wererepeated three times and calculated with the following equation.
HI = (AUC test food/average AUC reference sample) × 100 (1)
2.2. Consumer Acceptance Test2.2.1. Sample Preparation and Presentation
The cooked rice samples used in the consumer acceptance test were prepared inthe same way as those used to assess the physicochemical properties (Section 2.1.2). Thecooked rice samples (50 g) were placed in a bowl (85 × 50 mm, diameter × depth) with a lidusing a stainless-steel scoop. The cooked rice samples were coded with three-digit randomnumbers and served at 50 ± 5 ◦C. The samples were stored in a heating cabinet (HA-DB3000, Hains Co., Incheon, Korea) to maintain the temperature throughout the evaluationsession. The serving order of the samples was determined by a William Latin squaredesign [19], and samples were presented in sequential monadic order to avoid carryovereffects [20]. Filtered water at ambient temperature was provided to the consumers tocleanse the palate between samples.
2.2.2. Cooked Rice with Whole Wheat
A total of 103 consumers were students and research scientists at the Korea FoodResearch Institute (KFRI) recruited through e-mails. The participants were 36% male and64% female, with an average age of 34.3 years. Written consent was given by all consumers.The testing was carried out in the sensory laboratory of the Korea Food Research Institute(KFRI) equipped with individual booths. Ten to twelve consumers assessed in the exper-iment at one time and all consumers completed the experiment on the same day. In theconsumer acceptance test, the consumers rated the overall appearance, odor, taste/flavor,and texture liking of the samples on a standard 9-point hedonic scale (1 = dislike extremely,5 = neither like nor dislike, 9 = like extremely) [21]. After evaluating their levels of lik-ing, the consumers were asked to answer 2 open questions, freely describing the reasonsfor liking and disliking each sample. The procedure followed the method explained bySymoneaux et al. [10]. Answering was not mandatory. In this way, the participants couldexpress only reasons for liking, only reasons for disliking, both or none for each sample.Data collection was carried out with Compusense 5.0 software (Compusense Inc., Guelph,ON, Canada).
125
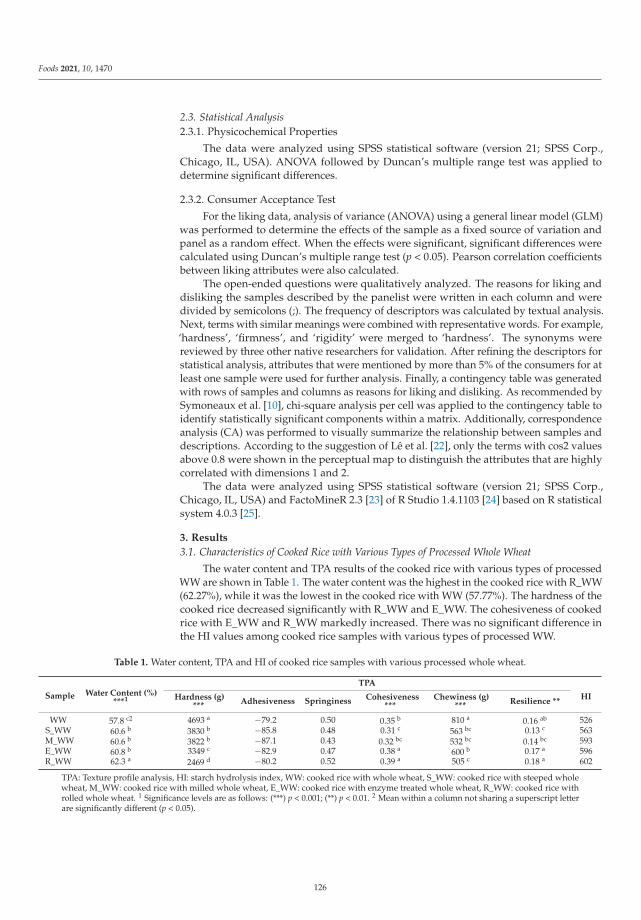
Foods 2021, 10, 1470
2.3. Statistical Analysis2.3.1. Physicochemical Properties
The data were analyzed using SPSS statistical software (version 21; SPSS Corp.,Chicago, IL, USA). ANOVA followed by Duncan’s multiple range test was applied todetermine significant differences.
2.3.2. Consumer Acceptance Test
For the liking data, analysis of variance (ANOVA) using a general linear model (GLM)was performed to determine the effects of the sample as a fixed source of variation andpanel as a random effect. When the effects were significant, significant differences werecalculated using Duncan’s multiple range test (p < 0.05). Pearson correlation coefficientsbetween liking attributes were also calculated.
The open-ended questions were qualitatively analyzed. The reasons for liking anddisliking the samples described by the panelist were written in each column and weredivided by semicolons (;). The frequency of descriptors was calculated by textual analysis.Next, terms with similar meanings were combined with representative words. For example,‘hardness’, ‘firmness’, and ‘rigidity’ were merged to ‘hardness’. The synonyms werereviewed by three other native researchers for validation. After refining the descriptors forstatistical analysis, attributes that were mentioned by more than 5% of the consumers for atleast one sample were used for further analysis. Finally, a contingency table was generatedwith rows of samples and columns as reasons for liking and disliking. As recommended bySymoneaux et al. [10], chi-square analysis per cell was applied to the contingency table toidentify statistically significant components within a matrix. Additionally, correspondenceanalysis (CA) was performed to visually summarize the relationship between samples anddescriptions. According to the suggestion of Lê et al. [22], only the terms with cos2 valuesabove 0.8 were shown in the perceptual map to distinguish the attributes that are highlycorrelated with dimensions 1 and 2.
The data were analyzed using SPSS statistical software (version 21; SPSS Corp.,Chicago, IL, USA) and FactoMineR 2.3 [23] of R Studio 1.4.1103 [24] based on R statisticalsystem 4.0.3 [25].
3. Results
3.1. Characteristics of Cooked Rice with Various Types of Processed Whole Wheat
The water content and TPA results of the cooked rice with various types of processedWW are shown in Table 1. The water content was the highest in the cooked rice with R_WW(62.27%), while it was the lowest in the cooked rice with WW (57.77%). The hardness of thecooked rice decreased significantly with R_WW and E_WW. The cohesiveness of cookedrice with E_WW and R_WW markedly increased. There was no significant difference inthe HI values among cooked rice samples with various types of processed WW.
Table 1. Water content, TPA and HI of cooked rice samples with various processed whole wheat.
Sample Water Content (%)***1
TPA
HIHardness (g)***
Adhesiveness Springiness Cohesiveness***
Chewiness (g)***
Resilience **
WW 57.8 c2 4693 a −79.2 0.50 0.35 b 810 a 0.16 ab 526S_WW 60.6 b 3830 b −85.8 0.48 0.31 c 563 bc 0.13 c 563M_WW 60.6 b 3822 b −87.1 0.43 0.32 bc 532 bc 0.14 bc 593E_WW 60.8 b 3349 c −82.9 0.47 0.38 a 600 b 0.17 a 596R_WW 62.3 a 2469 d −80.2 0.52 0.39 a 505 c 0.18 a 602
TPA: Texture profile analysis, HI: starch hydrolysis index, WW: cooked rice with whole wheat, S_WW: cooked rice with steeped wholewheat, M_WW: cooked rice with milled whole wheat, E_WW: cooked rice with enzyme treated whole wheat, R_WW: cooked rice withrolled whole wheat. 1 Significance levels are as follows: (***) p < 0.001; (**) p < 0.01. 2 Mean within a column not sharing a superscript letterare significantly different (p < 0.05).
126
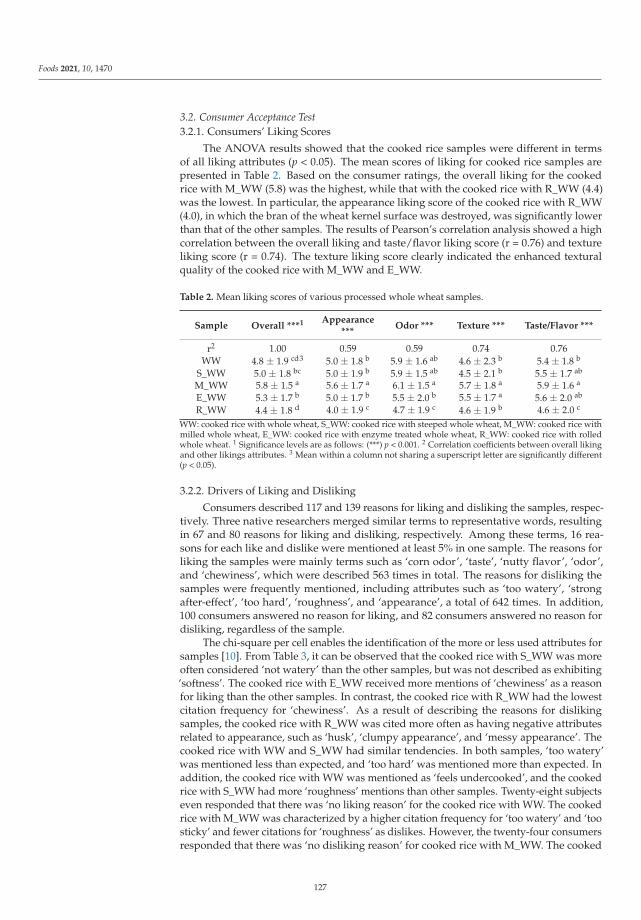
Foods 2021, 10, 1470
3.2. Consumer Acceptance Test3.2.1. Consumers’ Liking Scores
The ANOVA results showed that the cooked rice samples were different in termsof all liking attributes (p < 0.05). The mean scores of liking for cooked rice samples arepresented in Table 2. Based on the consumer ratings, the overall liking for the cookedrice with M_WW (5.8) was the highest, while that with the cooked rice with R_WW (4.4)was the lowest. In particular, the appearance liking score of the cooked rice with R_WW(4.0), in which the bran of the wheat kernel surface was destroyed, was significantly lowerthan that of the other samples. The results of Pearson’s correlation analysis showed a highcorrelation between the overall liking and taste/flavor liking score (r = 0.76) and textureliking score (r = 0.74). The texture liking score clearly indicated the enhanced texturalquality of the cooked rice with M_WW and E_WW.
Table 2. Mean liking scores of various processed whole wheat samples.
Sample Overall ***1 Appearance***
Odor *** Texture *** Taste/Flavor ***
r2 1.00 0.59 0.59 0.74 0.76WW 4.8 ± 1.9 cd3 5.0 ± 1.8 b 5.9 ± 1.6 ab 4.6 ± 2.3 b 5.4 ± 1.8 b
S_WW 5.0 ± 1.8 bc 5.0 ± 1.9 b 5.9 ± 1.5 ab 4.5 ± 2.1 b 5.5 ± 1.7 ab
M_WW 5.8 ± 1.5 a 5.6 ± 1.7 a 6.1 ± 1.5 a 5.7 ± 1.8 a 5.9 ± 1.6 a
E_WW 5.3 ± 1.7 b 5.0 ± 1.7 b 5.5 ± 2.0 b 5.5 ± 1.7 a 5.6 ± 2.0 ab
R_WW 4.4 ± 1.8 d 4.0 ± 1.9 c 4.7 ± 1.9 c 4.6 ± 1.9 b 4.6 ± 2.0 c
WW: cooked rice with whole wheat, S_WW: cooked rice with steeped whole wheat, M_WW: cooked rice withmilled whole wheat, E_WW: cooked rice with enzyme treated whole wheat, R_WW: cooked rice with rolledwhole wheat. 1 Significance levels are as follows: (***) p < 0.001. 2 Correlation coefficients between overall likingand other likings attributes. 3 Mean within a column not sharing a superscript letter are significantly different(p < 0.05).
3.2.2. Drivers of Liking and Disliking
Consumers described 117 and 139 reasons for liking and disliking the samples, respec-tively. Three native researchers merged similar terms to representative words, resultingin 67 and 80 reasons for liking and disliking, respectively. Among these terms, 16 rea-sons for each like and dislike were mentioned at least 5% in one sample. The reasons forliking the samples were mainly terms such as ‘corn odor’, ‘taste’, ‘nutty flavor’, ‘odor’,and ‘chewiness’, which were described 563 times in total. The reasons for disliking thesamples were frequently mentioned, including attributes such as ‘too watery’, ‘strongafter-effect’, ‘too hard’, ‘roughness’, and ‘appearance’, a total of 642 times. In addition,100 consumers answered no reason for liking, and 82 consumers answered no reason fordisliking, regardless of the sample.
The chi-square per cell enables the identification of the more or less used attributes forsamples [10]. From Table 3, it can be observed that the cooked rice with S_WW was moreoften considered ‘not watery’ than the other samples, but was not described as exhibiting‘softness’. The cooked rice with E_WW received more mentions of ‘chewiness’ as a reasonfor liking than the other samples. In contrast, the cooked rice with R_WW had the lowestcitation frequency for ‘chewiness’. As a result of describing the reasons for dislikingsamples, the cooked rice with R_WW was cited more often as having negative attributesrelated to appearance, such as ‘husk’, ‘clumpy appearance’, and ‘messy appearance’. Thecooked rice with WW and S_WW had similar tendencies. In both samples, ‘too watery’was mentioned less than expected, and ‘too hard’ was mentioned more than expected. Inaddition, the cooked rice with WW was mentioned as ‘feels undercooked’, and the cookedrice with S_WW had more ‘roughness’ mentions than other samples. Twenty-eight subjectseven responded that there was ‘no liking reason’ for the cooked rice with WW. The cookedrice with M_WW was characterized by a higher citation frequency for ‘too watery’ and ‘toosticky’ and fewer citations for ‘roughness’ as dislikes. However, the twenty-four consumersresponded that there was ‘no disliking reason’ for cooked rice with M_WW. The cooked
127
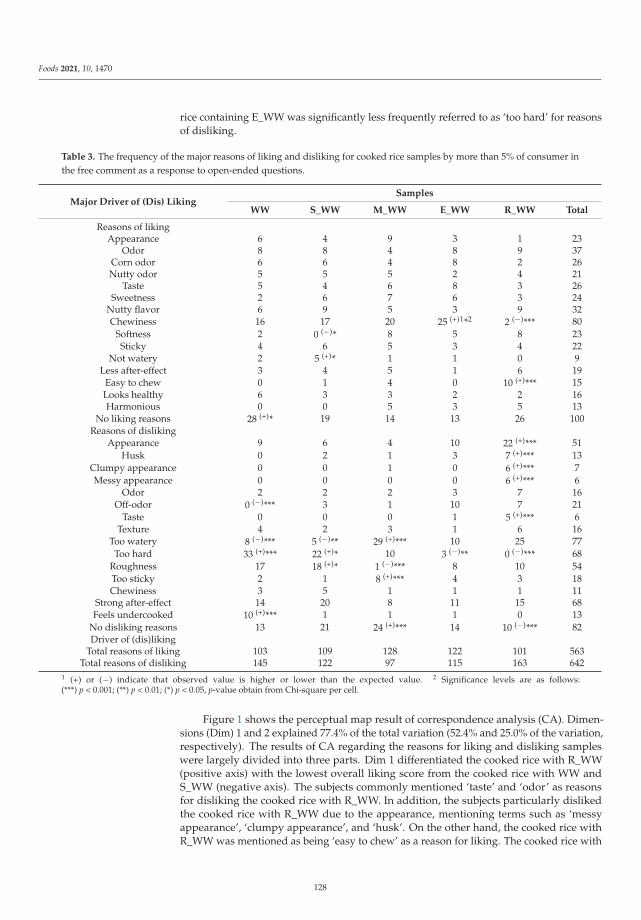
Foods 2021, 10, 1470
rice containing E_WW was significantly less frequently referred to as ‘too hard’ for reasonsof disliking.
Table 3. The frequency of the major reasons of liking and disliking for cooked rice samples by more than 5% of consumer inthe free comment as a response to open-ended questions.
Major Driver of (Dis) LikingSamples
WW S_WW M_WW E_WW R_WW Total
Reasons of likingAppearance 6 4 9 3 1 23
Odor 8 8 4 8 9 37Corn odor 6 6 4 8 2 26Nutty odor 5 5 5 2 4 21
Taste 5 4 6 8 3 26Sweetness 2 6 7 6 3 24
Nutty flavor 6 9 5 3 9 32Chewiness 16 17 20 25 (+)1*2 2 (−)*** 80
Softness 2 0 (−)* 8 5 8 23Sticky 4 6 5 3 4 22
Not watery 2 5 (+)* 1 1 0 9Less after-effect 3 4 5 1 6 19
Easy to chew 0 1 4 0 10 (+)*** 15Looks healthy 6 3 3 2 2 16Harmonious 0 0 5 3 5 13
No liking reasons 28 (+)* 19 14 13 26 100Reasons of disliking
Appearance 9 6 4 10 22 (+)*** 51Husk 0 2 1 3 7 (+)*** 13
Clumpy appearance 0 0 1 0 6 (+)*** 7Messy appearance 0 0 0 0 6 (+)*** 6
Odor 2 2 2 3 7 16Off-odor 0 (−)*** 3 1 10 7 21
Taste 0 0 0 1 5 (+)*** 6Texture 4 2 3 1 6 16
Too watery 8 (−)*** 5 (−)** 29 (+)*** 10 25 77Too hard 33 (+)*** 22 (+)* 10 3 (−)** 0 (−)*** 68
Roughness 17 18 (+)* 1 (−)*** 8 10 54Too sticky 2 1 8 (+)*** 4 3 18Chewiness 3 5 1 1 1 11
Strong after-effect 14 20 8 11 15 68Feels undercooked 10 (+)*** 1 1 1 0 13
No disliking reasons 13 21 24 (+)*** 14 10 (−)*** 82Driver of (dis)liking
Total reasons of liking 103 109 128 122 101 563Total reasons of disliking 145 122 97 115 163 642
1 (+) or (−) indicate that observed value is higher or lower than the expected value. 2 Significance levels are as follows:(***) p < 0.001; (**) p < 0.01; (*) p < 0.05, p-value obtain from Chi-square per cell.
Figure 1 shows the perceptual map result of correspondence analysis (CA). Dimen-sions (Dim) 1 and 2 explained 77.4% of the total variation (52.4% and 25.0% of the variation,respectively). The results of CA regarding the reasons for liking and disliking sampleswere largely divided into three parts. Dim 1 differentiated the cooked rice with R_WW(positive axis) with the lowest overall liking score from the cooked rice with WW andS_WW (negative axis). The subjects commonly mentioned ‘taste’ and ‘odor’ as reasonsfor disliking the cooked rice with R_WW. In addition, the subjects particularly dislikedthe cooked rice with R_WW due to the appearance, mentioning terms such as ‘messyappearance’, ‘clumpy appearance’, and ‘husk’. On the other hand, the cooked rice withR_WW was mentioned as being ‘easy to chew’ as a reason for liking. The cooked rice with
128
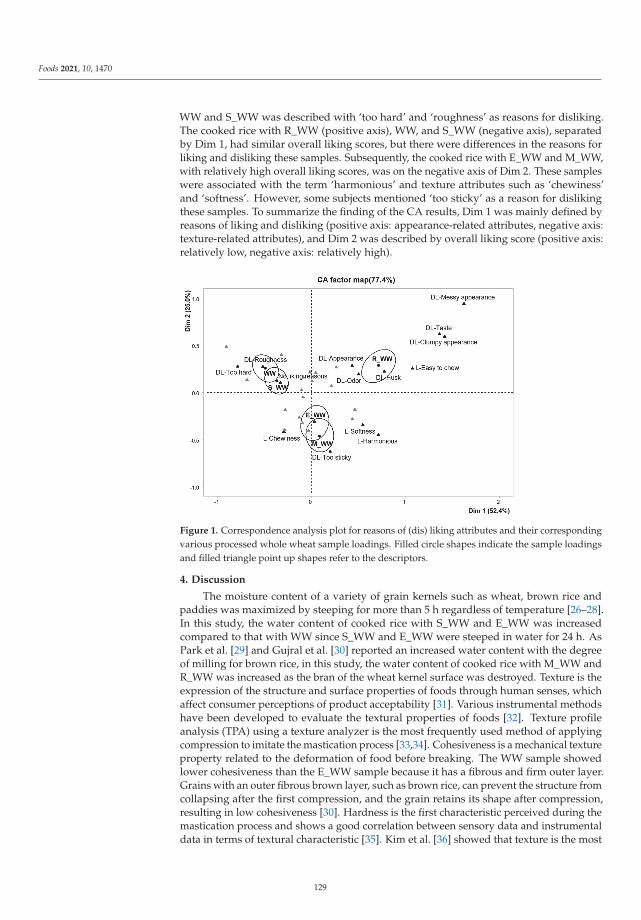
Foods 2021, 10, 1470
WW and S_WW was described with ‘too hard’ and ‘roughness’ as reasons for disliking.The cooked rice with R_WW (positive axis), WW, and S_WW (negative axis), separatedby Dim 1, had similar overall liking scores, but there were differences in the reasons forliking and disliking these samples. Subsequently, the cooked rice with E_WW and M_WW,with relatively high overall liking scores, was on the negative axis of Dim 2. These sampleswere associated with the term ‘harmonious’ and texture attributes such as ‘chewiness’and ‘softness’. However, some subjects mentioned ‘too sticky’ as a reason for dislikingthese samples. To summarize the finding of the CA results, Dim 1 was mainly defined byreasons of liking and disliking (positive axis: appearance-related attributes, negative axis:texture-related attributes), and Dim 2 was described by overall liking score (positive axis:relatively low, negative axis: relatively high).
Figure 1. Correspondence analysis plot for reasons of (dis) liking attributes and their correspondingvarious processed whole wheat sample loadings. Filled circle shapes indicate the sample loadingsand filled triangle point up shapes refer to the descriptors.
4. Discussion
The moisture content of a variety of grain kernels such as wheat, brown rice andpaddies was maximized by steeping for more than 5 h regardless of temperature [26–28].In this study, the water content of cooked rice with S_WW and E_WW was increasedcompared to that with WW since S_WW and E_WW were steeped in water for 24 h. AsPark et al. [29] and Gujral et al. [30] reported an increased water content with the degreeof milling for brown rice, in this study, the water content of cooked rice with M_WW andR_WW was increased as the bran of the wheat kernel surface was destroyed. Texture is theexpression of the structure and surface properties of foods through human senses, whichaffect consumer perceptions of product acceptability [31]. Various instrumental methodshave been developed to evaluate the textural properties of foods [32]. Texture profileanalysis (TPA) using a texture analyzer is the most frequently used method of applyingcompression to imitate the mastication process [33,34]. Cohesiveness is a mechanical textureproperty related to the deformation of food before breaking. The WW sample showedlower cohesiveness than the E_WW sample because it has a fibrous and firm outer layer.Grains with an outer fibrous brown layer, such as brown rice, can prevent the structure fromcollapsing after the first compression, and the grain retains its shape after compression,resulting in low cohesiveness [30]. Hardness is the first characteristic perceived during themastication process and shows a good correlation between sensory data and instrumentaldata in terms of textural characteristic [35]. Kim et al. [36] showed that texture is the most
129
Foods 2021, 10, 1470
influential characteristics for the overall quality of cooked rice in the sensory evaluation.Particularly, in Kim et al.’s [37] study, which analyzed the correlation between overallsensory quality and TPA of cooked rice, hardness was a negative correlation with overallsensory quality. Texture influenced overall product quality as well as consumer acceptance.Choi et al. [38] reported that stickiness was important for their overall liking of cooked rice.Park et al. [29] reported that the hardness and chewiness tend to decrease as the degreeof milling increases. When classifying cooked rice samples, the factors of hardness andstickiness are more than the taste [39], and it was reported that the change in hardness byprocessing is an important factor when preparing cooked rice using whole wheat withlow preference. Normally, the hardness of cooked rice is 2000 g to 3000 g, which is muchlower compared to the cooked rice sample with WW [29,40,41]. As the hardness of M_WWand E_WW decreased, the overall consumer liking score and texture liking score increased.The responses to open-ended questions for the cooked rice samples with M_WW andE_WW confirmed the above results by showing that the mechanical texture characteristicof hardness has a substantial influence on sensory evaluation when it is seen that there arefew people who dislike it because it is too hard [40].
In this study, consumers were asked to describe the reasons for liking and dislikingsamples, as previously proposed by Symoneaux et al. [10]. As a result of textual analysis,the number of likes and dislikes was correlated with the overall liking score, and it waspossible to predict the level of overall liking. The cooked rice with M_WW with the highestliking score had 128 likes and 97 dislikes, while the cooked rice with R_WW with the lowestliking score had 101 likes and 163 dislikes (Table 3). The higher the liking score of thesample was, the greater the number of likes and the fewer dislikes, and vice versa [10,11].In addition, when there were more reasons for liking than disliking, the overall liking scorewas more than 5 points based on the 9-point hedonic scale, and this trend was observed tohave the same pattern in Symoneaux et al. [10] which evaluated samples using a 7-pointhedonic scale. However, even though the samples had similar liking scores, this may havebeen caused by different reasons. The cooked rice with WW, S_WW, and R_WW had similarliking scores, but the reasons for liking and disliking these samples were different. Forcooked rice with WW and S_WW, a common reason for disliking was ‘too hard’, while thisdescription was never mentioned for cooked rice with R_WW. Appearance characteristicssuch as ‘messy appearance’, ‘clumpy appearance’, and ‘husk’ were frequently described asreasons for disliking cooked rice with R_WW. Often, when consumers answer only oneopen-ended question, it can be difficult to know whether what they refer to is positiveor negative for them. Asking separately for reasons of liking and disliking makes thetranscription of terms easier and provides insight to clearly identify the attributes thatare positively and negatively correlated with the consumer’s preference without furtherinterpretation [11,42]. Furthermore, we can identify which attributes are more importantto consumers’ preferences, and even the same terms can be liked by some consumers anddisliked by others. In conclusion, asking consumers separately for reasons of liking anddisliking is a better way to understand their opinion [10].
It is also noteworthy that consumers used more diverse terms to describe the reasonsfor disliking the samples than liking them. The terms were integrated by three nativeresearchers, obtaining 60 and 80 types of reasons for liking and disliking, respectively. Inaddition, the chi-square per cell analysis results showed that differences between sampleswere often larger in terms of dislikes than likes. In previous studies, using open-endedquestions [14,43], consumers reportedly cited more likes than dislikes, which was theopposite of this study. The samples surveyed in this study had a relatively lower overallliking score than in previously conducted studies. Alternatively, Letarte et al. [44] reportedthat dislikes result from more specific and intense sensory experiences than likes. This resultmay also be due to the positive-negative asymmetry effect in which negative informationis weighted more than positive information [45].
Consumers often referred to sensory-related terms rather than holistic or emotionalterms. Only three (‘easy to chew’, ‘looks healthy’, and ‘harmonious’) of the 16 reasons
130
Foods 2021, 10, 1470
for liking and two (‘messy appearance’ and ‘feels undercooked’) of the 16 reasons fordisliking mentioned by more than 5% of consumers were non-sensory terms. This isbecause consumers are relatively familiar with the samples. In fact, 73.8% of consumerswho participated in this study responded that they ate multigrain cooked rice more thanonce a week (data not shown).
The main advantage of open-ended questions is that information about attributesthat are important to consumers is collected directly in their own language. A limitednumber of available attributes in conventional profiling can lead to a dumping effect, andif consumers like the product, a halo effect can occur when evaluating attributes [14]. How-ever, the spontaneity given to consumers in free comment methods allows them to freelydescribe their sensory perception and emphasize the perceived dominant descriptors. Inother words, information about consumers’ perceptions of characteristics can be provided.Nevertheless, open-ended questions still exhibit labor-intensive issues associated with thepreprocessing phase, in which spelling errors are eliminated and synonyms are grouped.
5. Conclusions
This study was performed regarding the physical properties and consumer acceptancefor cooked rice with various types of processed whole wheat. The results of TPA showedthat all processed whole wheat samples were less hard than cooked rice with WW, indi-cating a distinct improvement in the texture property. Thus, consumer acceptance test ofthese processed whole wheat samples was conducted, with M_WW scoring relatively highoverall liking for consumers. This result suggested that M_WW was suitable for cookedrice.
On the other side, two open-ended questions, evaluated separately on the reasons ofliking and disliking, confirmed that the sensory characteristics associated with texture wereidentified as important factors in the formation of acceptance in cooked rice containingvarious types of processed whole wheat. Among the texture properties, ‘chewiness’ was thedriver of liking, while ‘hardness’ and ‘roughness’ were the drivers of disliking. In particular,incomplete appearances such as ‘husk’, ‘clumpy appearance’, and ‘messy appearance’ weredrivers of disliking. Additionally, the results of this study imply that the level of overallliking for samples could be predicted by including a separate open-ended question forreasons of liking and disliking.
The present study has several limitations in generalizing results. Although the goalwas to verify the marketability of relatively new foods, whole wheat products for cookedrice, comparative analysis with multi grain cooked rice that occupies the market wasnot particularly investigated in the present study. Further investigations on comparativeanalysis with marketed products may provide useful insights in developing marketingstrategies for these food items.
Author Contributions: Conceptualization, D.-B.L. and S.-S.K.; methodology, M.-R.K.; software, M.-R.K.; validation, S.-S.K., D.-B.L. and M.-R.K.; formal analysis, J.-A.H. and Y.-S.B.; investigation, S.-S.K.;resources, S.-S.K.; data curation, D.-B.L. and M.-R.K.; writing—original draft preparation, D.-B.L. andM.-R.K.; writing—review and editing, S.-S.K.; visualization, D.-B.L. and M.-R.K.; supervision, S.-S.K.;project administration, S.-S.K.; funding acquisition, S.-S.K. All authors have read and agreed to thepublished version of the manuscript.
Funding: This research was funded by Korea Institute of Planning and Evaluation for Technology inFood, Agriculture, Forestry (IPET) through Agri-Bio Industry Technology Development Program(Grant number: 317019-4) and High Value-added Food Technology Program(Grant number: 321039-4), funded by Ministry of Agriculture, Food and Rural Affairs (MAFRA).
Data Availability Statement: The data to support the findings of this study are included within thisarticle.
Conflicts of Interest: The authors declare no conflict of interest.
131
Foods 2021, 10, 1470
References
1. Han, G.; Lee, Y. Analysis of consumption status of cooked rice with different grains and related factors in a Korean population:Based on data from 2011 Korean National Health and Nutritional Examination Survey (KNHANES). J. East Asian Soc. Diet. Life2014, 24, 748–758. [CrossRef]
2. Mafra, I.; Ferreira, I.M.; Oliveira, M.B.P. Food authentication by PCR-based methods. Eur. Food Res. Technol. 2008, 227, 649–665.[CrossRef]
3. Arzani, A.; Ashraf, M. Cultivated ancient wheats (Triticum spp.): A potential source of health-beneficial food products. Compr.Rev. Food Sci. Food Saf. 2017, 16, 477–488. [CrossRef] [PubMed]
4. Slavin, J.L.; Martini, M.C.; Jacobs, D.R., Jr.; Marquart, L. Plausible mechanisms for the protectiveness of whole grains. Am. J. Clin.Nutr. 1999, 70, 459s–463s. [CrossRef] [PubMed]
5. Slavin, J.; Jacobs, D.; Marquart, L. Whole-grain consumption and chronic disease: Protective mechanisms. Nutr. Cancer 1997, 27,14–21. [CrossRef]
6. Jacobs, D.R., Jr.; Meyer, K.A.; Kushi, L.H.; Folsom, A.R. Whole-grain intake may reduce the risk of ischemic heart disease death inpostmenopausal women: The Iowa Women’s Health Study. Am. J. Clin. Nutr. 1998, 68, 248–257. [CrossRef]
7. McKeown, N.M.; Meigs, J.B.; Liu, S.; Wilson, P.W.; Jacques, P.F. Whole-grain intake is favorably associated with metabolic riskfactors for type 2 diabetes and cardiovascular disease in the Framingham Offspring Study. Am. J. Clin. Nutr. 2002, 76, 390–398.[CrossRef]
8. Bae, I.Y.; Im Lee, H.; Ko, A.; Lee, H.G. Substituting whole grain flour for wheat flour: Impact on cake quality and glycemic index.Food Sci. Biotechnol. 2013, 22, 1–7. [CrossRef]
9. Faye, P.; Brémaud, D.; Teillet, E.; Courcoux, P.; Giboreau, A.; Nicod, H. An alternative to external preference mapping based onconsumer perceptive mapping. Food Qual. Prefer. 2006, 17, 604–614. [CrossRef]
10. Symoneaux, R.; Galmarini, M.; Mehinagic, E. Comment analysis of consumer’s likes and dislikes as an alternative tool topreference mapping. A case study on apples. Food Qual. Prefer. 2012, 24, 59–66. [CrossRef]
11. Fonseca, F.G.; Esmerino, E.A.; Tavares Filho, E.R.; Ferraz, J.P.; da Cruz, A.G.; Bolini, H.M. Novel and successful free commentsmethod for sensory characterization of chocolate ice cream: A comparative study between pivot profile and comment analysis. J.Dairy Sci. 2016, 99, 3408–3420. [CrossRef]
12. Ares, G.; Varela, P.; Rado, G.; Giménez, A. Identifying ideal products using three different consumer profiling methodologies.Comparison with external preference mapping. Food Qual. Prefer. 2011, 22, 581–591. [CrossRef]
13. Greenhoff, K.; MacFie, H. Preference mapping in practice. In Measurement of Food Preferences; Springer: Boston, MA, USA, 1994;pp. 137–166.
14. Ten Kleij, F.; Musters, P.A. Text analysis of open-ended survey responses: A complementary method to preference mapping. FoodQual. Prefer. 2003, 14, 43–52. [CrossRef]
15. Looker, E.D.; Denton, M.A.; Davis, C.K. Bridging the gap: Incorporating qualitative data into quantitative analyses. Soc. Sci. Res.1989, 18, 313–330. [CrossRef]
16. Piqueras-Fiszman, B. Open-ended questions in sensory testing practice. In Rapid Sensory Profiling Techniques; WoodheadPublishing: Amsterdam, The Netherlands, 2015; pp. 247–267.
17. Sozer, N.; Cicerelli, L.; Heiniö, R.-L.; Poutanen, K. Effect of wheat bran addition on in vitro starch digestibility, physico-mechanicaland sensory properties of biscuits. J. Cereal Sci. 2014, 60, 105–113. [CrossRef]
18. Somogyi, M. Notes on sugar determination. J. Biol. Chem. 1952, 195, 19–23. [CrossRef]19. Williams, E.J. Experimental designs balanced for the estimation of residual effects of treatments. Aust. J. Chem. 1949, 2, 149–168.
[CrossRef]20. MacFie, H.J.; Bratchell, N.; GREENHOFF, K.; Vallis, L.V. Designs to balance the effect of order of presentation and first-order
carry-over effects in hall tests. J. Sens. Stud. 1989, 4, 129–148. [CrossRef]21. Peryam, D.R.; Pilgrim, F.J. Hedonic scale method of measuring food preferences. Food Technol. 1957, 11, 9–14.22. Lê, S.; Worch, T. Qualitative descriptive approaches (Part II). In Analyzing Sensory Data with R; CRC Press: Boca Raton, FL, USA,
2015; pp. 111–148.23. Lê, S.; Josse, J.; Husson, F. FactoMineR: An R package for multivariate analysis. J. Stat. Softw. 2008, 25, 1–18. [CrossRef]24. R Core Team. Available online: https://www.R-project.org/ (accessed on 2 March 2021).25. RStudio Team. Available online: http://www.rstudio.com/ (accessed on 2 March 2021).26. Maskan, M. Effect of maturation and processing on water uptake characteristics of wheat. J. Food Eng. 2001, 47, 51–57. [CrossRef]27. Tagawa, A.; Muramatsu, Y.; Nagasuna, T.; Yano, A.; Iimoto, M.; Murata, S. Water absorption characteristics of wheat and barley
during soaking. Trans. ASAE 2003, 46, 361. [CrossRef]28. Thakur, A.K.; Gupta, A. Water absorption characteristics of paddy, brown rice and husk during soaking. J. Food Eng. 2006, 75,
252–257. [CrossRef]29. Park, J.K.; Kim, S.S.; Kim, K.O. Effect of milling ratio on sensory properties of cooked rice and on physicochemical properties of
milled and cooked rice. Cereal Chem. 2001, 78, 151–156. [CrossRef]30. Gujral, H.S.; Kumar, V. Effect of accelerated aging on the physicochemical and textural properties of brown and milled rice. J.
Food Eng. 2003, 59, 117–121. [CrossRef]31. Szczesniak, A.S. Texture is a sensory property. Food Qual. Prefer. 2002, 13, 215–225. [CrossRef]
132
Foods 2021, 10, 1470
32. Bourne, M. Food Texture and Viscosity: Concept and Measurement; Elsevier: Amsterdam, The Netherlands, 2002.33. Herrero, A.; De la Hoz, L.; Ordóñez, J.; Herranz, B.; de Avila, M.R.; Cambero, M. Tensile properties of cooked meat sausages and
their correlation with texture profile analysis (TPA) parameters and physico-chemical characteristics. Meat Sci. 2008, 80, 690–696.[CrossRef]
34. Rahman, M.S.; Al-Farsi, S.A. Instrumental texture profile analysis (TPA) of date flesh as a function of moisture content. J. FoodEng. 2005, 66, 505–511. [CrossRef]
35. Di Monaco, R.; Cavella, S.; Masi, P. Predicting sensory cohesiveness, hardness and springiness of solid foods from instrumentalmeasurements. J. Texture Stud. 2008, 39, 129–149. [CrossRef]
36. Kim, S.S.; Lee, S.E.; Kim, O.W.; Kim, D.C. The Relationship between Sensory Quality and Market Price of Rice in Korea. Food Sci.Biotechnol. 2000, 9, 195–198.
37. Kim, H.; Kim, O.W.; Kwak, H.S.; Kim, S.S.; Lee, H.J. Prediction model of rice eating quality using physicochemical properties andsensory quality evaluation. J. Sen. Stud. 2017, 32, e12273. [CrossRef]
38. Choi, W.S.; Jarma Arroyo, S.E.; Seo, H.S. Cross-cultural comparisons between Korean and US adults with respect to textureperception and acceptance of cooked milled rice. Int. J. Food Sci. Technol. 2018, 53, 2181–2194. [CrossRef]
39. Juliano, B.O.; Perez, C.M.; Barber, S.; Blakeney, A.B.; Iwasaki, T.A.; Shibuya, N.; Keneaster, K.K.; Chung, S.; Laignelet, B.; Launay,B. International cooperative comparison of instrument methods for cooked rice texture. J. Texture Stud. 1981, 12, 17–38. [CrossRef]
40. Li, H.; Prakash, S.; Nicholson, T.M.; Fitzgerald, M.A.; Gilbert, R.G. Instrumental measurement of cooked rice texture by dynamicrheological testing and its relation to the fine structure of rice starch. Carbohydr. Polym. 2016, 146, 253–263. [CrossRef] [PubMed]
41. Lu, S.; Cik, T.T.; Lii, C.Y.; Lai, P.; Chen, H.H. Effect of amylose content on structure, texture and α-amylase reactivity of cookedrice. LWT-Food Sci. Technol. 2013, 54, 224–228. [CrossRef]
42. Galmarini, M.V.; Symoneaux, R.; Chollet, S.; Zamora, M.C. Understanding apple consumers’ expectations in terms of likes anddislikes. Use of comment analysis in a cross-cultural study. Appetite 2013, 62, 27–36. [CrossRef] [PubMed]
43. Vidal, L.; Ares, G.; Le Blond, M.; Jin, D.; Jaeger, S.R. Emoji in open-ended questions: A novel use in product research withconsumers. J. Sens. Stud. 2020, 35, e12610. [CrossRef]
44. Letarte, A.; Dube, L.; Troche, V. Similarities and differences in affective and cognitive origins of food likings and dislikes. Appetite1997, 28, 115–129. [CrossRef] [PubMed]
45. Peeters, G.; Czapinski, J. Positive-negative asymmetry in evaluations: The distinction between affective and informationalnegativity effects. Eur. Rev. Soc. Psychol. 1990, 1, 33–60. [CrossRef]
133

foods
Article
Effect of Spray-Drying and Freeze-Drying on the Composition,Physical Properties, and Sensory Quality of Pea ProcessingWater (Liluva)
Weijun Chen 1, Hoi Tung Chiu 2, Ziqian Feng 1, Evelyne Maes 3 and Luca Serventi 1,*
Citation: Chen, W.; Chiu, H.T.; Feng,
Z.; Maes, E.; Serventi, L. Effect of
Spray-Drying and Freeze-Drying on
the Composition, Physical Properties,
and Sensory Quality of Pea
Processing Water (Liluva). Foods 2021,
10, 1401. https://doi.org/10.3390/
foods10061401
Academic Editor: Alcina
M.M.B. Morais
Received: 17 May 2021
Accepted: 8 June 2021
Published: 17 June 2021
Publisher’s Note: MDPI stays neutral
with regard to jurisdictional claims in
published maps and institutional affil-
iations.
Copyright: © 2021 by the authors.
Licensee MDPI, Basel, Switzerland.
This article is an open access article
distributed under the terms and
conditions of the Creative Commons
Attribution (CC BY) license (https://
creativecommons.org/licenses/by/
4.0/).
1 Department of Wine, Food and Molecular Biosciences, Faculty of Agriculture and Life Sciences,Lincoln University, RFH Building, Lincoln P.O. Box 85054, Christchurch 7647, New Zealand;[email protected] (W.C.); [email protected] (Z.F.)
2 Dry Food NZ Ltd., 12 Ngati Kuia Drive, Port, Havelock 7100, New Zealand; [email protected] Proteins & Metabolites Team, AgResearch Limited, Lincoln 7674, New Zealand;
[email protected]* Correspondence: [email protected]
Abstract: Spray-drying and freeze-drying can extend the shelf life and improve the transportabilityof high-nutritional foods such as Liluva (processing water of legumes). Nonetheless, the effectsof these processes on nutrition, physiochemical properties, and sensory quality are unknown. Inthis study, particle sizes, protein profiles, colour, and preliminary sensory profile of pea powdersamples were determined by Mastersizer 3000, protein gels, chroma meter, and 9-point hedonicscale, respectively. Results indicated that no significant difference was found in the molecular weightdistribution of protein bands in pea water and sensory profile after drying. Fibre content in pea waterafter spray-drying was higher while soluble carbohydrates and minerals were lower than those afterfreeze-drying. Spray-drying decreased pea water’s lysine content, particle size, redness colour, andyellowness colour, while it increased its light colour; however, freeze-drying showed the oppositeresults. Overall, spray-drying could be a better drying technology that can be applied to dry peawater. Further experiments are required, however, to determine the influence of drying technologieson emulsifying activity.
Keywords: split yellow peas; soaking water; cooking water; spray-drying; freeze-drying; proximatecomposition; protein profile; particle size; colour; sensory
1. Introduction
Legumes, such as peas, chickpeas, and beans, are low price and high nutritional valuefoods that are widely consumed by people all around the world. Among legumes, peas area good source of plant-based protein because the protein content in peas is high at about22.3 g of protein/100 g [1]. Although the antinutrients (including phytic acid, tannins,and proteolytic inhibitors) found in peas decrease the digestibility of this protein, thesoaking, cooking, or baking of peas can reduce the antinutrients and improve the proteinbioactivity [1].
In industrial production of legumes, wastewater is generated. Liluva, namely thewater generated by the soaking, cooking, or canning process of legumes, can be upcycledinto functional food ingredients [2]. The wastewater from soaking and cooking of 100 gsplit yellow peas contained about 1.89 g and 4.4 g solids respectively, including protein,soluble and insoluble carbohydrates, and minerals. In peas’ soaking and cooking water,soluble carbohydrates represented 37% and 30% of the dry matter [3,4]. Additionally, theprotein content in peas’ soaking and cooking water comprises a high percentage of the drymatter as well at around 30% [3,4]. With such high contents of soluble carbohydrates andproteins, pea water has the potential to be a foaming or emulsifier agent [2], which are twoimportant agents in baking products to increase the volume and stabilize the starch–lipid
Foods 2021, 10, 1401. https://doi.org/10.3390/foods10061401 https://www.mdpi.com/journal/foods135
Foods 2021, 10, 1401
networks of bakery foods [5]. Therefore, Liluva is a valuable ingredient that can be appliedin the food industry to increase bioactive content and improve the functional properties offood products.
In order to store and transfer pea water more conveniently, and to increase the rangeof applications, drying methods, such as spray-drying and freeze-drying, can be appliedto remove the water and convert the pea water into a powder. Spray-drying is a thermalmethod widely used in the food industry to produce a dry powder from a liquid [6]. Onthe other hand, freeze-drying is a nonthermal method that is commonly used for thedehydration of heat-sensitive food through combining freeze and vacuum drying [7]. Eventhough the shelf life of peas’ soaking and cooking water may be extended by dryingbecause of the low water activity [8], its composition and functional properties mightchange with drying.
The aim of this study was to analyse the effects of spray-drying and freeze-drying onpeas’ soaking and cooking water, with particular emphasis on spray-drying. Proximatecomposition, content of free amino acids, protein bands, particle sizes, and colour wereinvestigated in this article. Additionally, preliminary sensory analysis of a food product(sponge cake) containing peas’ raw water or reconstituted spray-dried powder was covered.
2. Materials and Methods
2.1. Sample Preparation
Split yellow peas (Cates, New Zealand), wheat flour (Pams, New Zealand), applevinegar (DYC, New Zealand), icing sugar (Pams, New Zealand), and baking powder (Pams,New Zealand) were used in this study. The soaking water and cooking water of split yellowpeas were prepared as described by Serventi [2]. Briefly, split yellow pea soaking waterwas prepared by soaking split yellow peas in water at a ratio of 1:3.3 (pea to water) for 17 h.After soaking, the soaked split yellow peas were cooked in water at a ratio of 1:1.75 (peato water) for 90 min. Water samples after soaking and cooking were collected separately.Next, the soaking and cooking water of split yellow peas was spray-dried by Dry Food NZLtd. (Havelock, New Zealand) (the processing parameters of spray-drying technique areshown in Appendix A) and freeze-dried (Lincoln University, New Zealand).
2.2. Proximate Composition
The proximate composition of concentrated powders was quantified with the follow-ing methods: moisture content (AACC method 44-15A) [9], soluble carbohydrates (Pollockand Jones, Jermyn) [10,11], protein content by total nitrogen (AOAC method 954.01) [12]with a conversion factor of 6.25, fat (AOAC method 920.39) [12], ash (AOAC method930.05) [13], and insoluble carbohydrates by difference.
2.3. Free Amino Acid Profile
The free amino acid profile was analysed by the Agilent 1100 series HPLC system(Agilent Technologies, Walbronn, Germany) with a 150 mm × 4.6 mm, 3 μm C-18 column(Winlab, Scotland) at 40 ◦C according to Heems, Luck, Fraudeau, and Verette (1998)and Carducci et al. (1996) [14,15]. The precolumn derivatization was performed on theautosampler. O-phthaldialdehyde (OPA) and 9-fluorenylmethyl chloroformate (FMOC)were used as primary and secondary amino acid derivatization reagents, respectively. Thedetection was performed using a fluorescence detector with the following settings: 335 nm(excitation) and 440 nm (emission). The detector was switched to second channel at 21 minto detect secondary amino acid proline, and the parameters changed to 260 nm (excitation)and 315 nm (emission). To make solvent A, 0.01 M Na2HPO4 was added with 0.8% THFand adjusted to pH = 7.5 with H3PO4, while solvent B comprised 50% methanol and 50%acetonitrile. Solvents A and B were used for the separation with the following pumpgradients: 0 min, 0% B; 14 min, 40% B; 20 min, 50% B; 24 min, 100% B; 29 min, 100% B;30 min, 0% B; 36 min, 0% B, with a flow rate of 0.7 mL/min. Sample injection volume was12 μL.
136
Foods 2021, 10, 1401
2.4. Protein Analysis via SDS-PAGE
A sodium dodecyl sulfate polyacrylamide gel electrophoresis (SDS-PAGE) was per-formed to determine the molecular weight distribution of the protein present in the Liluvasamples (6 samples in total, including the raw soaking and cooking water, spray-driedsoaking and cooking water, and freeze-dried soaking and cooking water of split yellowpeas) as described by Buhl et al. (2019) with modifications [16]. Invitrogen™ NuPAGE™4–12% Bis-Tris precast gels (Bio-Rad, Richmond, CA, USA) were used to evaluate theprotein profile in this experiment. A molecular weight marker (10–250 kDa) was applied toestimate the molecular weight of the protein bands. Prior to heat treatment (100 ◦C for 5min), 6 samples (concentration of 0.1%) were mixed 3:1 with the NuPAGE™ LDS SampleBuffer (4X) and Sample Reducing Agent. After heating the mixed solution, 8 μL of themolecular markers and 20 μL of the samples were loaded into the gel. Then, 200 V of aconstant current and 45 min of running time were set for the electrophoresis, which wasconducted in the running buffer (0.25 M Tris, 0.192 M glycine, 0.1% SDS). Next, the gelwas stained with Commassie blue G-250 staining solution for 1 h. Afterwards, the gel wasdestained with the destain solution (20% Methanol, 10% Acetic acid) overnight.
2.5. Particle Size
The particle size of split yellow pea water and powder samples was measured witha Mastersizer 3000 (Malvern Panalytical) with constant refractive index (1.538) and ab-sorption index (0.01). Modified from the method mentioned by Govoreanu, Saveyn, Vander Meeren, Nopens, and Vanrolleghem (2009) [17], the machines were initially rinsedwith pure RO (reversed osmosis) water to stabilize size distribution. Then, samples werediluted into about 400 mL RO water to reach the acceptable obscuration limits (10–20%)in an automated flexible volume wet sample dispersion. After reaching the obscurationlimits, samples’ particle size distribution was automatically measured by the machinein quintuples.
2.6. Colour
Modified from the method described by Yagiz, Balaban, Kristinsson, Welt, and Mar-shall (2009) [18], a handheld Konica Minolta CR-400 chroma meter was used to measure thecolour of four Liluva powder samples (spray-/freeze-dried powder of pea soaking waterand spray-/freeze-dried powder of pea cooking water) after calibration with a CR-A43calibration plate. First, the powder samples were homogenized and weighed (3 g persample) before they were poured into transparent containers. Then, the colour parametersof Liluva samples, including L* (lightness), a* (greenness to redness), and b* (bluenessto yellowness), were measured. The surfaces of samples were touched by the light tubedirectly. Samples were homogenized manually after each detection, and the colour ofLiluva powder samples were measured in triplicates.
2.7. Cake Preparation
Sponge cakes were made based on the recipe of Mustafa and collaborators [19]. Briefly,110 mL of split yellow pea cooking water or spray-dried split yellow pea cooking waterwas mixed with 3 g of apple cider vinegar for 7 min by using a Brabantia BBEK1092 standmixer. The mixer was started at low speed, and the maximum speed was set when thesolution became foamy. After 7 min, 130 g of icing sugar was added to the mixer andmixed for 3 min at the maximum speed. Afterwards, the blend of 130 g of plant flourand 7 g of baking powder was manually mixed with the creamy foam. During mixing,flour was added into the foam three times. After adequately mixing, 110 g of each batterwas weighted and poured into the baking pan and was baked at 180 ◦C for 15 min ina preheated Turbofan oven (Moffat Ltd., model E32 M, Rolleston, IN, USA). The bakedcakes were cooled to room temperature and cut into small square-like pieces before thesensory test.
137
Foods 2021, 10, 1401
2.8. Sensory Analysis
Modified from the method inferred by Sveinsdottir and collaborators [20], 20 untrainedparticipants from Lincoln University were involved in the sensory test of sponge cake.Participants were asked to taste two sponge samples (one contained raw split yellow peacooking water; the other contained reconstituted spray-dried split yellow pea cookingwater) in the sensory room (with individual booths) at Lincoln University, New Zealand.Freeze-dried samples were not considered since they were not food grade. Soaking watersamples were not tested since they contained less protein than cooking water, thus makingthem less suitable for egg replacement. The small, square-like sponge cake sampleswere put into small plastic containers (without lids). Samples were labelled with digitalcodes that were in random order. Water and crackers were also provided for participantsto clean their mouths to avoid product carry-over. All the participants were asked toevaluate the appearance, aroma, texture, taste, and overall preference of the sponge cakesamples by using a 9-point hedonic scale (1—dislike extremely; 5—neither dislike nor like;9—like extremely).
2.9. Data Analysis
All data was calculated and presented as average ± standard deviation by usingExcel, Microsoft 365. Statistical analysis was performed by Minitab version 19. One-wayanalysis of variance (ANOVA) was applied to the analysis of colour, foaming ability, andemulsifying activity. Analysis of the preliminary sensory test was conducted by ANOVAusing the general linear model (GLM) procedure and a post-hoc Tukey’s honest significantdifference (HSD) test (p < 0.05).
3. Results and Discussion
3.1. Proximate Composition
According to Table 1, spray-dried split yellow pea cooking water had higher drymatter, protein, and fibre contents, but lower amounts of soluble carbohydrates andminerals than spray-dried split yellow pea soaking water. Previous studies about thecompositions of freeze-dried split yellow pea cooking and soaking water presented slightlydifferent profiles, where freeze-dried pea soaking water showed higher levels of protein(31.7%), soluble carbohydrates (36.5%), and minerals (13.8%) but lower fibre content (18%)than freeze-dried pea cooking water (28.2% of protein, 25.2% of soluble carbohydrates, 9.1%of minerals, and 34.7% of fibre) [5,21]. When comparing different drying methods underthe same type of Liluva, spray-dried water demonstrated higher fibre but lower solublecarbohydrate and mineral levels than freeze-dried water [5,21]. In terms of the proteincontent, spray-dried soaking water presented a lower amount of protein than freeze-driedsoaking water, while spray-dried cooking water conversely showed higher protein contentthan freeze-dried cooking water [5,21].
Table 1. Proximate composition of spray-dried pea soaking and cooking water powders. Differentletters in the same row represent statistical difference (p < 0.05).
Nutrients (g/100 g)Spray-Dried Pea Soaking
Water PowderSpray-Dried Pea Cooking
Water Powder
Moisture content 7.15 ± 0.07 a 4.86 ± 0.14 b
Protein 25.16 ± 0.08 a 34.63 ± 0.43 b
Soluble carbohydrates 25.17 ± 1.70 a 17.44 ± 0.92 b
Insoluble carbohydrates 32.43 ± 1.82 a 35.99 ± 0.98 b
Minerals 10.08 ± 0.11 a 7.08 ± 0.06 b
In pea soaking and cooking raw water, the content of proteins composes about 30%of the dry matter [2]. Similar protein concentrations were observed in pea powders, with25.2% in spray-dried soaking powder, 34.6% in spray-dried cooking powder, 31.7% in
138
Foods 2021, 10, 1401
freeze-dried soaking powder, and 28.2% in freeze-dried cooking powder. This is possiblybecause freeze-drying does not involve heating and therefore does not denature the protein.While spray-drying applies heat to the peas’ protein, the treatment time might be tooshort to denature proteins [22]. In terms of the higher protein content in spray-dried peacooking water (34.6%), it is possibly because the low soluble fibre content in spray-driedpea cooking powder increased its percentage of protein content.
Additionally, as reported by Serventi [2], the content of soluble carbohydrates in splityellow pea raw soaking water was 0.69 g/100 g. In other words, the content of solublecarbohydrates made up to 37% of the dry matter. Additionally, the dry matter in splityellow pea raw cooking water also contained a high percentage of soluble carbohydratesat around 30% [2]. Compared with the results shown in Table 1, spray-drying decreasedthe content of soluble carbohydrates in pea soaking and cooking water from about 37 to25.2% and 30 to 17.4% as inferred by Shishir and Chen [23]. Sugars have low molecularweight and glass transition temperature, so the mobility of sugar molecules increaseswith heat treatment at above 20 ◦C. Therefore, the reason for the lower content of solublecarbohydrates may be that the sugar in split yellow pea water sticks to the dryer when itcomes across heat; thus, the recovery yield of the material decreases [23].
3.2. Free Amino Acids
Twenty-one free amino acids found in pea raw water and spray-/freeze-dried powderwere measured and analysed (Table 2). The content of some amino acids in pea samplesexceeded the detecting limits, such as glutamic acid in all samples and aspartic acid in thespray-dried and freeze-dried soaking water powder. Additionally, some of the samplescontained amino acids that exceeded the quantification limits, such as cysteine in allsamples except those of pea soaking water and freeze-dried pea cooking water powder.
Table 2. Free amino acid profiles of different pea soaking and cooking water. Different letters represent statistical difference(p < 0.05).
Soaking Water Cooking Water
Amino AcidRaw(μM)
Spray-Dried(μM)
Freeze-Dried(μM)
Raw(μM)
Spray-Dried(μM)
Freeze-Dried(μM)
Asp 106.33 ± 5.21 b * * 291.49 ± 4.33 a 320.68 ± 14.42 a 125.36 ± 2.96 b
Glu * * * * * *Cys ** ** 94.30 ± 0.74 b ** ** 163.97 ± 5.09 a
Asn * 749.26 ± 16.53 e 1422.57 ± 72.20 d 4428.08 ± 23.66 a 4144.78 ± 18.95 b 2058.07 ± 14.58 c
Ser 342.56 ± 8.24 a 221.54 ± 0.95 b 183.88 ± 7.58 cd 197.30 ± 1.91 c 168.69 ± 2.61 d 136.06 ± 4.04 e
Gln 246.78 ± 9.60 a 58.57 ± 2.30 c 101.47 ± 4.26 b 21.71 ± 7.57 d 13.97 ± 0.36 d 9.48 ± 1.02 d
His 128.58 ± 1.63 b 192.50 ± 1.36 a 86.43 ± 10.99 c 127.60 ± 0.29 b 121.75 ± 1.75 b 100.43 ± 6.53 c
Gly * * 558.31 ± 5.44 a 288.65 ± 5.18 d 379.22 ± 4.58 c 420.11 ± 16.28 b
Thr 376.86 ± 10.36 b 542.50 ± 20.09 a 267.82 ± 1.80 d 325.46 ± 7.05 c 261.43 ± 6.07 d 238.35 ± 12.24 d
Arg * 422.27 ± 0.07 * * * *Ala 389.20 ± 5.18 c 730.06 ± 0.19 a 306.10 ± 1.53 e 392.26 ± 0.74 bc 409.71 ± 3.57 b 343.02 ± 8.98 d
Tau * * * 609.93 ± 1.04 b 643.41 ± 2.50 a *Tyr 136.34 ± 1.79 a 132.00 ± 0.08 a 101.95 ± 0.86 c 108.27 ± 0.51 b 112.18 ± 0.03 b 99.97 ± 2.66 c
Val 218.58 ± 2.98 b 300.00 ± 1.28 a 187.71 ± 0.30 c 136.62 ± 1.09 e 139.43 ± 1.61 e 159.75 ± 4.41 d
Met 48.41 ± 0.84 bc 75.07 ± 0.18 a 28.75 ± 0.15 d 51.31 ± 0.20 b 48.89 ± 0.39 bc 47.60 ± 1.62 c
Try 49.39 ± 0.58 c 68.18 ± 0.23 a 34.65 ± 0.15 d 63.31 ± 0.94 b 64.81 ± 0.54 b 62.10 ± 1.11 b
Phe 93.89 ± 1.03 d 178.84 ± 0.32 a 100.00 ± 0.58 bc 97.19 ± 0.04 cd 103.92 ± 1.03 b 98.97 ± 2.26 c
Ile 97.44 ± 1.42 c 142.49 ± 0.69 a 101.76 ± 0.10 b 64.00 ± 0.26 d 66.89 ± 1.24 d 63.82 ± 1.35 d
Lys 197.00 ± 0.72 bc 185.34 ± 1.56 cd 206.75 ± 0.52 ab 171.85 ± 1.65 e 176.33 ± 5.96 de 215.73 ± 4.32 a
Leu 123.54 ± 0.94 b 189.15 ± 2.18 a 133.58 ± 0.98 b 125.19 ± 0.32 b 125.88 ± 7.53 b 137.06 ± 3.41 b
Pro 356.46 ± 7.78 a 350.79 ± 0.84 a 251.89 ± 13.09 b 208.06 ± 3.01 bc 232.64 ± 17.66 b 173.52 ± 14.97 c
* means that the amount of amino acid exceeded the detecting limits. ** means that the amount of amino acid exceeded the quantifica-tion limits.
Nosworthy and co-authors [1] reported that the contents of methionine (around 0.22%of dry matter) and cysteine (about 0.25% of dry matter) in yellow peas were limited, whilelysine was abundant at around 1.69% of dry matter. This can be linked to the high content
139
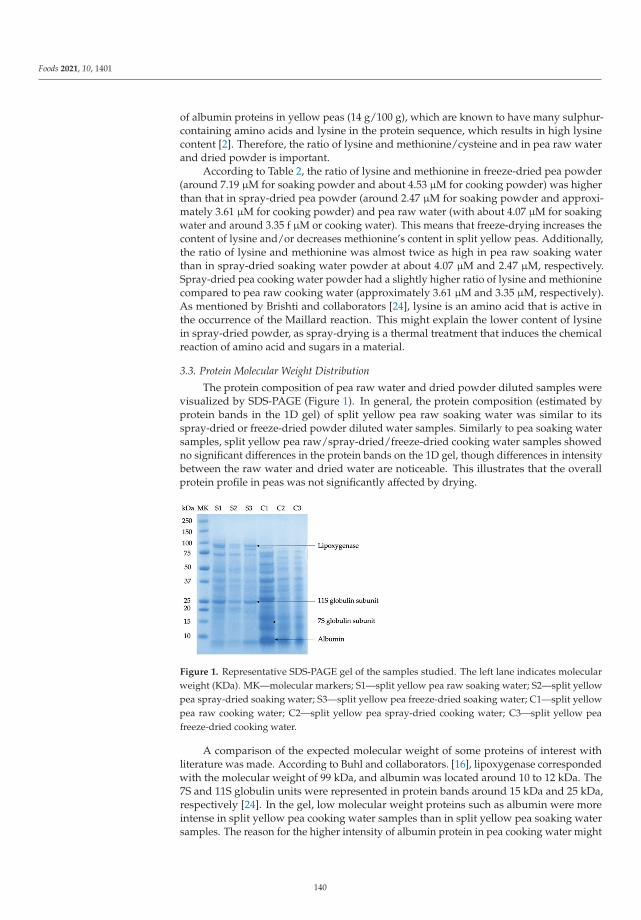
Foods 2021, 10, 1401
of albumin proteins in yellow peas (14 g/100 g), which are known to have many sulphur-containing amino acids and lysine in the protein sequence, which results in high lysinecontent [2]. Therefore, the ratio of lysine and methionine/cysteine and in pea raw waterand dried powder is important.
According to Table 2, the ratio of lysine and methionine in freeze-dried pea powder(around 7.19 μM for soaking powder and about 4.53 μM for cooking powder) was higherthan that in spray-dried pea powder (around 2.47 μM for soaking powder and approxi-mately 3.61 μM for cooking powder) and pea raw water (with about 4.07 μM for soakingwater and around 3.35 f μM or cooking water). This means that freeze-drying increases thecontent of lysine and/or decreases methionine’s content in split yellow peas. Additionally,the ratio of lysine and methionine was almost twice as high in pea raw soaking waterthan in spray-dried soaking water powder at about 4.07 μM and 2.47 μM, respectively.Spray-dried pea cooking water powder had a slightly higher ratio of lysine and methioninecompared to pea raw cooking water (approximately 3.61 μM and 3.35 μM, respectively).As mentioned by Brishti and collaborators [24], lysine is an amino acid that is active inthe occurrence of the Maillard reaction. This might explain the lower content of lysinein spray-dried powder, as spray-drying is a thermal treatment that induces the chemicalreaction of amino acid and sugars in a material.
3.3. Protein Molecular Weight Distribution
The protein composition of pea raw water and dried powder diluted samples werevisualized by SDS-PAGE (Figure 1). In general, the protein composition (estimated byprotein bands in the 1D gel) of split yellow pea raw soaking water was similar to itsspray-dried or freeze-dried powder diluted water samples. Similarly to pea soaking watersamples, split yellow pea raw/spray-dried/freeze-dried cooking water samples showedno significant differences in the protein bands on the 1D gel, though differences in intensitybetween the raw water and dried water are noticeable. This illustrates that the overallprotein profile in peas was not significantly affected by drying.
Figure 1. Representative SDS-PAGE gel of the samples studied. The left lane indicates molecularweight (KDa). MK—molecular markers; S1—split yellow pea raw soaking water; S2—split yellowpea spray-dried soaking water; S3—split yellow pea freeze-dried soaking water; C1—split yellowpea raw cooking water; C2—split yellow pea spray-dried cooking water; C3—split yellow peafreeze-dried cooking water.
A comparison of the expected molecular weight of some proteins of interest withliterature was made. According to Buhl and collaborators. [16], lipoxygenase correspondedwith the molecular weight of 99 kDa, and albumin was located around 10 to 12 kDa. The7S and 11S globulin units were represented in protein bands around 15 kDa and 25 kDa,respectively [24]. In the gel, low molecular weight proteins such as albumin were moreintense in split yellow pea cooking water samples than in split yellow pea soaking watersamples. The reason for the higher intensity of albumin protein in pea cooking water might
140
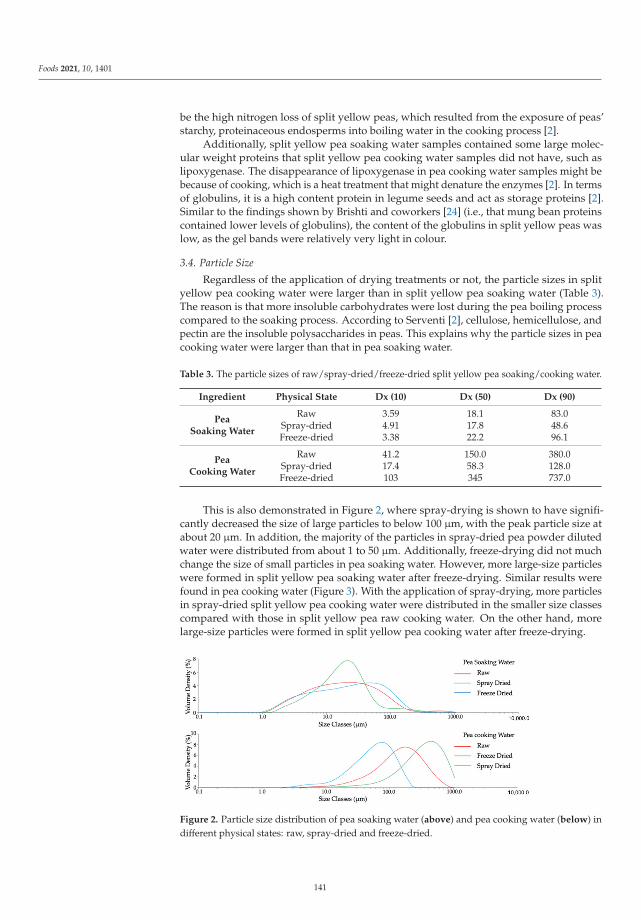
Foods 2021, 10, 1401
be the high nitrogen loss of split yellow peas, which resulted from the exposure of peas’starchy, proteinaceous endosperms into boiling water in the cooking process [2].
Additionally, split yellow pea soaking water samples contained some large molec-ular weight proteins that split yellow pea cooking water samples did not have, such aslipoxygenase. The disappearance of lipoxygenase in pea cooking water samples might bebecause of cooking, which is a heat treatment that might denature the enzymes [2]. In termsof globulins, it is a high content protein in legume seeds and act as storage proteins [2].Similar to the findings shown by Brishti and coworkers [24] (i.e., that mung bean proteinscontained lower levels of globulins), the content of the globulins in split yellow peas waslow, as the gel bands were relatively very light in colour.
3.4. Particle Size
Regardless of the application of drying treatments or not, the particle sizes in splityellow pea cooking water were larger than in split yellow pea soaking water (Table 3).The reason is that more insoluble carbohydrates were lost during the pea boiling processcompared to the soaking process. According to Serventi [2], cellulose, hemicellulose, andpectin are the insoluble polysaccharides in peas. This explains why the particle sizes in peacooking water were larger than that in pea soaking water.
Table 3. The particle sizes of raw/spray-dried/freeze-dried split yellow pea soaking/cooking water.
Ingredient Physical State Dx (10) Dx (50) Dx (90)
PeaSoaking Water
Raw 3.59 18.1 83.0Spray-dried 4.91 17.8 48.6Freeze-dried 3.38 22.2 96.1
PeaCooking Water
Raw 41.2 150.0 380.0Spray-dried 17.4 58.3 128.0Freeze-dried 103 345 737.0
This is also demonstrated in Figure 2, where spray-drying is shown to have signifi-cantly decreased the size of large particles to below 100 μm, with the peak particle size atabout 20 μm. In addition, the majority of the particles in spray-dried pea powder dilutedwater were distributed from about 1 to 50 μm. Additionally, freeze-drying did not muchchange the size of small particles in pea soaking water. However, more large-size particleswere formed in split yellow pea soaking water after freeze-drying. Similar results werefound in pea cooking water (Figure 3). With the application of spray-drying, more particlesin spray-dried split yellow pea cooking water were distributed in the smaller size classescompared with those in split yellow pea raw cooking water. On the other hand, morelarge-size particles were formed in split yellow pea cooking water after freeze-drying.
Figure 2. Particle size distribution of pea soaking water (above) and pea cooking water (below) indifferent physical states: raw, spray-dried and freeze-dried.
141
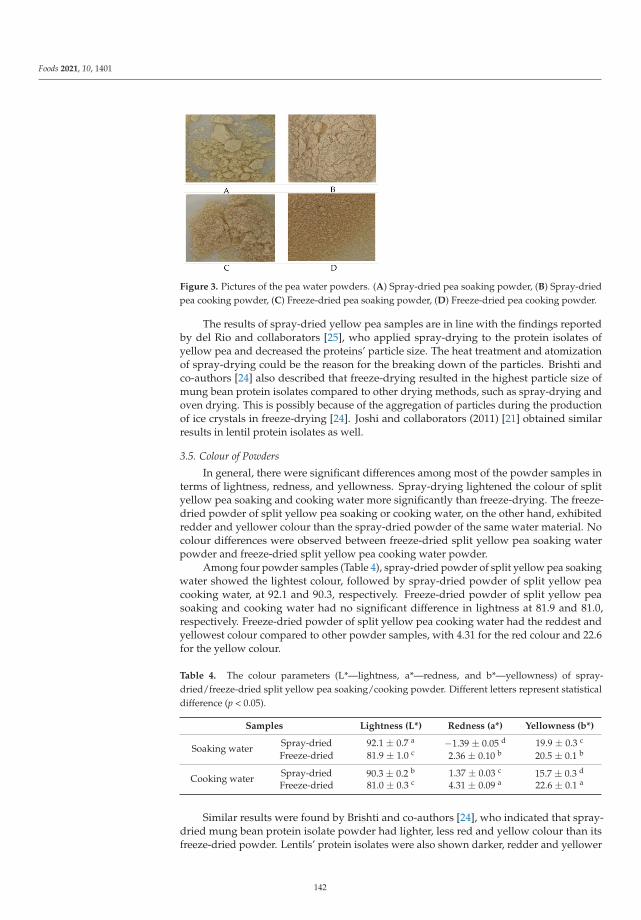
Foods 2021, 10, 1401
Figure 3. Pictures of the pea water powders. (A) Spray-dried pea soaking powder, (B) Spray-driedpea cooking powder, (C) Freeze-dried pea soaking powder, (D) Freeze-dried pea cooking powder.
The results of spray-dried yellow pea samples are in line with the findings reportedby del Rio and collaborators [25], who applied spray-drying to the protein isolates ofyellow pea and decreased the proteins’ particle size. The heat treatment and atomizationof spray-drying could be the reason for the breaking down of the particles. Brishti andco-authors [24] also described that freeze-drying resulted in the highest particle size ofmung bean protein isolates compared to other drying methods, such as spray-drying andoven drying. This is possibly because of the aggregation of particles during the productionof ice crystals in freeze-drying [24]. Joshi and collaborators (2011) [21] obtained similarresults in lentil protein isolates as well.
3.5. Colour of Powders
In general, there were significant differences among most of the powder samples interms of lightness, redness, and yellowness. Spray-drying lightened the colour of splityellow pea soaking and cooking water more significantly than freeze-drying. The freeze-dried powder of split yellow pea soaking or cooking water, on the other hand, exhibitedredder and yellower colour than the spray-dried powder of the same water material. Nocolour differences were observed between freeze-dried split yellow pea soaking waterpowder and freeze-dried split yellow pea cooking water powder.
Among four powder samples (Table 4), spray-dried powder of split yellow pea soakingwater showed the lightest colour, followed by spray-dried powder of split yellow peacooking water, at 92.1 and 90.3, respectively. Freeze-dried powder of split yellow peasoaking and cooking water had no significant difference in lightness at 81.9 and 81.0,respectively. Freeze-dried powder of split yellow pea cooking water had the reddest andyellowest colour compared to other powder samples, with 4.31 for the red colour and 22.6for the yellow colour.
Table 4. The colour parameters (L*—lightness, a*—redness, and b*—yellowness) of spray-dried/freeze-dried split yellow pea soaking/cooking powder. Different letters represent statisticaldifference (p < 0.05).
Samples Lightness (L*) Redness (a*) Yellowness (b*)
Soaking water Spray-dried 92.1 ± 0.7 a −1.39 ± 0.05 d 19.9 ± 0.3 c
Freeze-dried 81.9 ± 1.0 c 2.36 ± 0.10 b 20.5 ± 0.1 b
Cooking water Spray-dried 90.3 ± 0.2 b 1.37 ± 0.03 c 15.7 ± 0.3 d
Freeze-dried 81.0 ± 0.3 c 4.31 ± 0.09 a 22.6 ± 0.1 a
Similar results were found by Brishti and co-authors [24], who indicated that spray-dried mung bean protein isolate powder had lighter, less red and yellow colour than itsfreeze-dried powder. Lentils’ protein isolates were also shown darker, redder and yellower
142
Foods 2021, 10, 1401
colour after freeze-drying than after spray-drying [21]. The reason for the lighter colour ofthe spray-dried powder was because spray-drying broke down the particles of mung beanprotein isolates; thus, more light was refracted because of their larger surface area [24].This finding indicates that light colour is correlated to the particle size of the materials.Furthermore, the higher browning index of freeze-drying compared to spray-drying alsoexplains the lighter colour of spray-dried samples [24].
The yellow colour of yellow peas is mainly contributed by carotenoids [26]. It ispossible that freeze-drying, which is a not a heat treatment, preserves the carotenoids insplit yellow peas. Degradation and isomerization may occur during heat treatment, whichwould reduce the yellow colour of the samples [27]. Moreover, the particles may aggregatein freeze-drying [24]. The larger particle size may be the reason for the darker, yellower,and redder colour of freeze-dried powder.
3.6. Sensory Quality
In the sensory analysis of sponge cakes, sponge cakes made with split yellow pea rawcooking water showed no significant difference compared to sponge cakes made with thediluted water of split yellow pea spray-dried cooking powder in all sensory attributes,including appearance, aroma, taste, texture, and overall preference (Table 5). This resultindicated that spray-drying did not greatly impact the sensory profile of split yellow peacooking water.
Table 5. Sensory profile (appearance, aroma, taste, texture, and overall preference) of sponge cakescontaining split yellow pea raw cooking water (raw) or reconstituted pea cooking water powder(spray-dried). Different letters represent statistical difference (p < 0.05).
Recipe Appearance Aroma Taste TextureOverall
Preference
Raw 6.65 ± 0.99 a 6.05 ± 1.03 a 6.50 ± 1.47 a 6.85 ± 1.09 a 6.50 ± 1.36 a
Spray-dried 6.55 ± 0.89 a 6.25 ± 1.21 a 6.40 ± 1.47 a 6.30 ± 1.30 a 6.60 ± 1.73 a
Our research group previously reported that pea raw cooking water contained about30 g/100 g of protein and around 30 g/100 g of soluble fibre, while spray-dried pea cookingpowder diluted water had higher protein (34.6 g/100 g) but lower soluble fibre content(17.4 g/100 g) [2]. With higher protein and lower soluble fibre content, food products mightbe drier because of the unbalance of water distribution in food. The aroma score reportedin the current study is in disagreement with a study by Avellone and coworkers [28], whoinvestigated the effects of the spray-drying technique on wine’s quality. They indicatedthat the spray-drying process caused significant reductions of aroma compounds in wines.However, in the current study, the liking scores of product aroma showed no significantdifference. This suggests that spray-drying could be an ideal technique to preserve thearomatic property of Liluva.
4. Conclusions
In summary, spray-drying decreased the content of soluble fibre and lysine in splityellow pea water due to sugar loss and Maillard reaction. However, spray-drying andfreeze-drying did not greatly affect the protein content or protein profile of pea water, asshown by the SDS-PAGE gel (showed similar protein bands). Compared to pea raw water,the particles in pea spray-dried powder diluted water samples were mostly related tosmaller size classes, while freeze-dried powder diluted water samples were the opposite,highlighting the influence of the different drying mechanisms. Aside from particle size,colour was influenced by the drying method as spray-dried powder, due to its smallerparticle sizes, refracted more light. The reduction in the red and yellow colour of spray-dried powder compared to freeze-dried powder also illustrated that heat treatment mightdegrade some of the pigments in split yellow peas.
143
Foods 2021, 10, 1401
In the preliminary sensory test, no significant difference was found in the sensoryprofiles of pea raw water and powder samples. Thus, spray-drying can be used to dryLiluva from peas without greatly influencing peas’ properties. Future experiments arerequired to determine the mineral profiles of pea dried powders and to investigate theiremulsifying activity to further confirm the effects of drying methods on pea compositionand sensory profiles.
Author Contributions: Conceptualization, H.T.C. and L.S.; methodology, Z.F. and L.S.; investigation,W.C. and H.T.C.; resources, W.C., H.T.C. and Z.F.; data curation, W.C. and L.S.; writing—original draftpreparation, W.C.; writing—review and editing, Z.F., E.M. and L.S.; visualization, L.S.; supervision,L.S.; project administration, L.S. All authors have read and agreed to the published version ofthe manuscript.
Funding: This research received no external funding. The research fund was offered by LincolnUniversity in support of Master’s dissertations under the course called FOOD660.
Institutional Review Board Statement: The study was conducted according to the guidelines of theDeclaration of Helsinki, and approved by the Ethics Committee of Lincoln University (protocol code2020-60, approved on 11 December 2020).
Informed Consent Statement: Informed consent was obtained from all subjects involved in the study.
Acknowledgments: The authors would like to thank the company Dry Food NZ Ltd. for performingspray-drying of samples. Furthermore, the authors would like to thank Jiao Zhang and RogerCresswell for the analysis of total nitrogen, Rosy Tung for the ash and carbohydrate analyses, andJenny Zhao for the free amino acid quantification.
Conflicts of Interest: The authors declare no conflict of interest.
Appendix A
Table A1. Spray-drying parameters of split yellow pea water.
Cooking Water Soaking Water
Input (kg) 11.80 27.44
Output (kg) 0.25 0.13
Drying period 1 h 15 min 1 h
Target recovery (%) 5 2
Actual recovery (%) 2.12 0.46
Inlet air temperature (◦C) 179 179
Outlet air temperature (◦C) 80 94.6
Spray frequency (Hz) 170 180
Screw pump frequency (Hz) 23 10
References
1. Nosworthy, M.G.; Franczyk, A.J.; Medina, G.; Neufeld, J.; Appah, P.; Utioh, A.; Frohlich, P.; House, J.D. Effect of processing onthe in vitro and in vivo protein quality of yellow and green split peas (Pisum sativum). J. Agric. Food Chem 2017, 65, 7790–7796.[CrossRef] [PubMed]
2. Serventi, L. Upcycling Legume Water: From Wastewater Food Ingredients, 1st ed.; Springer Nature: Cham, Switzerland, 2020.3. Serventi, L. Soaking water composition. In Upcycling Legume Water: From Wastewater Food Ingredients, 1st ed.; Springer Nature:
Cham, Switzerland, 2020; pp. 27–39.4. Serventi, L. Cooking water composition. In Upcycling Legume Water: From Wastewater Food Ingredients, 1st ed.; Springer Nature:
Cham, Switzerland, 2020; pp. 73–85.5. Huang, S.; Liu, Y.; Zhang, W.; Dale, K.J.; Liu, S.; Zhu, J.; Serventi, L. Composition of legume soaking water and emulsifying
properties in gluten-free bread. Food Sci. Technol. Int. 2018, 24, 232–241. [CrossRef]6. Barbosa, J.; Teixeira, P. evelopment of probiotic fruit juice powders by spray-drying: A review. Food Rev. Int 2016, 33, 335–358.
[CrossRef]
144
Foods 2021, 10, 1401
7. Liu, Y.; Zhang, Z.; Hu, L. High efficient freeze-drying technology in food industry. Crit Rev. Food Sci Nutr 2021, 1–19. [CrossRef]8. O’Sullivan, J.J.; Norwood, E.-A.; O’Mahony, J.A.; Kelly, A.L. Atomisation technologies used in spray-drying in the dairy industry:
A review. J. Food Eng. 2019, 243, 57–69. [CrossRef]9. AACC International. Moisture-Air Oven Methods, drying at 103 ◦C. Methods 44-15.02. In Approved Methods of Analysis, 11th ed.;
Paul, S.T., Ed.; American Association of Cereal Chemists: Washington, MN, USA, 2000.10. Jermyn, M.A. A new method for determining ketohexoses in the presence of aldohexoses. Nature 1956, 177, 38–39. [CrossRef]11. Pollock, C.J.; Jones, T. Seasonal patterns of fructan metabolism in forage grasses. New. Phytol. 1979, 83, 9–15. [CrossRef]12. AOAC. Official Methods of Analysis of AOAC International, 16th ed.; AOAC International Publ.: Arlington, TX, USA, 1995.13. AOAC. Official Methods of Analysis of AOAC International, 18th ed.; AOAC International Publ.: Arlington, TX, USA, 1995.14. Heems, D.; Luck, G.; Fraudeau, C.; Verette, E. Fully automated precolumn derivatization, on-line dialysis and high-performance
liquid chromatography analysis of amino acids in food, beverages and feedstuff. J. Chromatpogr. A 1998, 198, 9–17. [CrossRef]15. Carducci, C.; Birarelli, M.; Leuzzi, V.; Santagata, G.; Serafini, P.; Antonozzi, I. Automated method for the measurement if amino
acids in ureine by high performance liquid chromatography. J. Chromatogr. A 1996, 729, 173–180. [CrossRef]16. Buhl, T.F.; Christensen, C.H.; Hammershøj, M. Aquafaba as an egg white substitute in food foams and emulsions: Protein
composition and functional behavior. Food Hydrocolloid 2019, 96, 354–364. [CrossRef]17. Govoreanu, R.; Saveyn, H.; Van der Meeren, P.; Nopens, I.; Vanrolleghem, P.A. A methodological approach for direct quantification
of the activated sludge floc size distribution by using different techniques. Water Sci. Technol. 2009, 60, 1857–1867. [CrossRef][PubMed]
18. Yagiz, Y.; Balaban, M.O.; Kristinsson, H.G.; Welt, B.A.; Marshall, M.R. Comparison of Minolta colorimeter and machine visionsystem in measuring colour of irradiated Atlantic salmon. J. Sci. Food Agric. 2009, 89, 728–730. [CrossRef]
19. Mustafa, R.; He, Y.; Shim, Y.Y.; Reaney, M.J.T. Aquafaba, wastewater from chickpea canning, functions as an egg replacer insponge cake. Int. J. Food Sci. Technol. 2018, 53, 2247–2255. [CrossRef]
20. Sveinsdottir, K.; Martinsdottir, E.; Thorsdottir, F.; Schelvis, R.; Kole, A.; Thorsdottir, I. Evaluation of Farmed Cod Products by aTrained Sensory Panel and Consumers in Different Test Settings. J. Sens. Stud. 2010, 25, 280–293. [CrossRef]
21. Stantiall, S.E.; Dale, K.J.; Calizo, F.S.; Serventi, L. Application of pulses cooking water as functional ingredients: The foaming andgelling abilities. Eur. Food Res. Technol. 2018, 244, 97–104. [CrossRef]
22. Joshi, M.; Adhikari, B.; Aldred, P.; Panozzo, J.F.; Kasapis, S. Physicochemical and functional properties of lentil protein isolatesprepared by different drying methods. Food Chem. 2011, 129, 1513–1522. [CrossRef]
23. Shishir, M.R.I.; Chen, W. Trends of spray-drying: A critical review on drying of fruit and vegetable juices. Trends Food Sci. Tech.2017, 65, 49–67. [CrossRef]
24. Brishti, F.H.; Chay, S.Y.; Muhammad, K.; Ismail-Fitry, M.R.; Zarei, M.; Karthikeyan, S.; Saari, N. Effects of drying techniqueson the physicochemical, functional, thermal, structural and rheological properties of mung bean (Vigna radiata) protein isolatepowder. Food Res. Int. 2020, 138, 109783. [CrossRef]
25. del Rio, A.R.; Opazo-Navarrete, M.; Cepero-Betancourt, Y.; Tabilo-Munizaga, G.; Boom, R.M.; Janssen, A.E. Heat-induced changesin microstructure of spray-dried plant protein isolates and its implications on in vitro gastric digestion. LWT 2020, 118, 108795.[CrossRef]
26. Shreenithee, C.R.; Prabhasankar, P. Effect of different shapes on the quality, microstructure, sensory and nutritional characteristicsof yellow pea flour incorporated pasta. J. Food Meas. Charact. 2013, 7, 166–176. [CrossRef]
27. Lin, C.H.; Chen, B.H. Stability of carotenoids in tomato juice during processing. Eur. Food Res. Technol. 2005, 22, 274–280.[CrossRef]
28. Avellone, G.; Salvo, A.; Costa, R.; Saija, E.; Bongiorno, D.; Di Stefano, V.; Calabrese, G.; Dugo, G. Investigation on the influence ofspray-drying technology on the quality of Sicilian Nero d’Avola wines. Food Chem. 2018, 240, 222–230. [CrossRef]
145

foods
Article
Reinvigorating Modern Breadmaking Based on AncientPractices and Plant Ingredients, with Implementation of aPhysicochemical Approach
Vasileia Sereti 1, Athina Lazaridou 1,*, Costas G. Biliaderis 1 and Soultana Maria Valamoti 2,3
Citation: Sereti, V.; Lazaridou, A.;
Biliaderis, C.G.; Valamoti, S.M.
Reinvigorating Modern Breadmaking
Based on Ancient Practices and Plant
Ingredients, with Implementation of a
Physicochemical Approach. Foods
2021, 10, 789. https://doi.org/
10.3390/foods10040789
Academic Editors: Luca Serventi,
Charles Brennan and Rana Mustafa
Received: 28 February 2021
Accepted: 5 April 2021
Published: 7 April 2021
Publisher’s Note: MDPI stays neutral
with regard to jurisdictional claims in
published maps and institutional affil-
iations.
Copyright: © 2021 by the authors.
Licensee MDPI, Basel, Switzerland.
This article is an open access article
distributed under the terms and
conditions of the Creative Commons
Attribution (CC BY) license (https://
creativecommons.org/licenses/by/
4.0/).
1 Laboratory of Food Chemistry and Biochemistry, Department of Food Science and Technology, School ofAgriculture, Aristotle University of Thessaloniki, P.O. Box 235, 54124 Thessaloniki, Greece;[email protected] (V.S.); [email protected] (C.G.B.)
2 Laboratory for Interdisciplinary Research in Archaeology (LIRA), Department of Archaeology, School ofHistory and Archaeology, Aristotle University of Thessaloniki, 54124 Thessaloniki, Greece; [email protected]
3 Center for Interdisciplinary Research and Innovation, Aristotle University of Thessaloniki (CIRI-AUTH),Balkan Center, Buildings A & B, 10th km Thessaloniki-Thermi Rd, P.O. Box 8318, 57001 Thessaloniki, Greece
* Correspondence: [email protected]
Abstract: In this study, the potential use of ancient plant ingredients in emerging bakery productsbased on possible prehistoric and/or ancient practices of grinding and breadmaking was explored.Various ancient grains, nuts and seeds (einkorn wheat, barley, acorn, lentil, poppy seeds, linseed) wereground using prehistoric grinding tool replicas. Barley-based sourdough prepared by multiple back-slopping steps was added to dough made from einkorn alone or mixed with the above ingredients(20% level) or commercial flours alone (common wheat, spelt, barley). Sieving analysis showedthat 40% of the einkorn flour particles were >400 μm, whereas commercial barley and commonwheat flours were finer. Differential scanning calorimetry revealed that lentil flour exhibited highermelting peak temperature and lower apparent enthalpy of starch gelatinization. Among all breadformulations tested, barley dough exhibited the highest elastic modulus and complex viscosity, asdetermined by dynamic rheometry; einkorn breads fortified with linseed and barley had the softestand hardest crust, respectively, as indicated by texture analysis; and common wheat gave the highestloaf-specific volume. Barley sourdough inclusion into einkorn dough did not affect the extent ofstarch retrogradation in the baked product. Generally, incorporation of ancient plant ingredients intocontemporary bread formulations seems to be feasible.
Keywords: prehistoric grinding practices; ancient grain flours; breadmaking; starch gelatinization;dough rheology; bread quality parameters
1. Introduction
Recent archaeological research has revealed a wide range of plant materials, preservedmainly as charred plant remains, which have been most likely used for preparation ofhuman food [1–6]. In certain cases, actual food remains from prehistoric Europe havebeen conserved through charring among the burnt debris in cooking areas or housesdestroyed by fire [4]. The study of these findings, together with a good knowledge offood preparation techniques, as reflected in the remains of cooking installations, pots andgrinding equipment found at prehistoric sites, allows glimpses into past culinary practicesand the nutritional benefits of specific ways of food preparation; moreover, such remainsallow for the exploration of an evolutionary continuum in the use of plant foods fromprehistoric times to the present.
The archaeobotanical record reveals that a wide range of cereals and pulses constitutedthe staple foods of prehistoric European communities [7,8]. In the Neolithic and BronzeAge of Greece, the glume wheats hold a dominant position among the cereal speciespresumably used for food and included three species: einkorn, emmer and ‘new glume’
Foods 2021, 10, 789. https://doi.org/10.3390/foods10040789 https://www.mdpi.com/journal/foods147
Foods 2021, 10, 789
wheat (Triticum. monococcum, T. dicoccum and T. timopheevi, respectively). During the BronzeAge, spelt wheat (T. spelta) also appears for the first time at the end of the 3rd millenniumB.C., while the free-threshing wheats (common wheat, Triticum aestivum and durum wheat,Triticum durum) had a more limited occurrence in prehistoric times [9]. Nowadays, theglume wheats, together with certain pseudocereal species, are widely referred to as ‘ancientgrains’, whereas those described as ‘modern’ (naked) wheats (T. aestivum and T. durum)have already been grown since the Neolithic period. These free-threshing cereals, over time,became the dominant cereals grown for food in Western Asia and Europe at the expense ofthe glume wheats, perhaps because the latter have a lower productivity per cultivated area,a higher bulk volume when stored in their glumes and a greater labour input requiredfor dehusking before milling [10,11]. An additional factor may have been the low qualityof their storage proteins (i.e., inferior gluten aggregation properties and inadequacy toform a strong hydrated network structure), attributed to the low amount of high molecularweight polymeric gluten fractions, resulting in difficulties in dough handling and poorbreadmaking performance [12]. Apart from the above wheat species, several other plant-derived materials could have been used for food preparation in prehistoric times, i.e., barley(Hordeum vulgare) grain and lentil (Lens culinaris) seeds, as well as seed of acorn nut (Quercussp.), linseed (Linum usitatissimum) and poppy seed (Papaver somniferum) transformed intoflour by grinding [4,6].
The transformation of cereals and other plant-derived food materials would havetaken place with the facilities available at the time, which included stone grinding andpounding implements [13], cooking installations and pots [14]. The limited availabilityof remains of actual plant foods preserved in the archaeological record include differenttypes of processed cereals, such as porridges and breads, although a clear distinctionbetween these preparations is not straightforward [9] unless complete loaves or largebread fragments were sometimes preserved, presumably in the context of specific ritual orfunerary events [3,15,16]. Precooked ground cereal foods reported in the archaeobotanicalrecord have been identified from the end of the 3rd millennium B.C. in MesimerianiToumba, and they could correspond to a prehistoric bulgur or trachanas [4,17]. These actualfood remains from a distant past provide a glimpse into prehistoric culinary practices, yetthe recipes that led to such food remains are poorly understood; therefore, an attempt isbeing made to systematically investigate these aspects under the project of PlantCult [18].
Consumer interest in ancient wheat species (e.g., spelt wheat, einkorn wheat) withregard to their use in bakery products has recently emerged, particularly because thesegrains are rich sources of bioactive components and hence suitable for producing highvalue food products with enhanced nutrient content and health benefits, especially whenused in the form of whole flours [19–21]. For instance, einkorn wheat seems to havenutritional properties that could distinguish it from common wheat varieties, althoughits rheological dough behavior may be inferior for breadmaking. Actually, einkorn wheathas a high content of ash, protein and essential amino acids, as well as various phenolicantioxidants [22–24]. Furthermore, another ancient cereal grain, barley, is an importantsource of cereal β-glucans, which are soluble dietary fibers, well-known for their hypoc-holesterolemic and hypoglycemic action [25]; in fact, barley flour is the main ingredientof several traditional bakery products made on the Greek island of Crete, such as barleyrusks (‘Dakos’), that exist as staple food of the Mediterranean diet [26,27]. Other non-cerealraw materials, such as seeds from legumes, have been recently used to fortify breads dueto their high content in carbohydrates, dietary fibers, vitamins, minerals, phytochemicals,and particularly proteins with a better amino-acids profile, ensuring a balanced diet whenconsumed in combination with cereals [28]. Additionally, seeds from nuts, such as acorns,have been incorporated into breads, mostly because of their antioxidant potential [29].Oilseeds, such as linseed and their fractions, have been also engaged in modern breadmak-ing practices for nutritional enhancement of bakery products with soluble dietary fibers,essential amino acids and essential fatty acids, with the aim of reducing starch digestibilityrates and improving atherogenic risk factors [30,31].
148
Foods 2021, 10, 789
In this context, fortification of bakery items with ancient grains and seeds could havean impact to the wellbeing of individuals and contribute to the reduction of risk factorsand/or management of chronic diseases, such as diabetes type 2 and cardiovascular dis-eases. Furthermore, adopting ancient breadmaking practices could give rise to new bakeryproducts with improved nutritional attributes, health benefits and minimally processedfood items, without additives and improvers, thereby satisfying the new consumer’s pref-erences and emerging life-trends related to ‘clean labelling’ of food products, healthy diets,and wellbeing.
In the present study, experimental breads were prepared under controlled conditionsusing plant ingredients identified in the prehistoric record and resembling some of theprehistoric and/or ancient breadmaking practices (ingredients, grinding tools, leaveningagents) in an effort to establish in ongoing studies [32] a relevant foundation for therecognition of past culinary practices, as reflected in the archaeobotanical charred remainsof breads produced from cereals, legumes, nuts and oilseeds. The current work aimedto evaluate the physicochemical characteristics of flours, doughs and breads made fromthese plant materials (grains, seeds, nuts), following their reduction into smaller particles(meal/flour) by prehistoric replica grinding tools and employing food preparation practicesthat were likely to be employed in prehistoric and/or ancient times. Besides simulatingsome aspects of prehistoric and/or ancient cuisine, the ultimate goal of our research isto use this information in the design and development of future bakery products withimproved nutritional attributes and increased consumer acceptability.
2. Materials and Methods
2.1. Flours
Five different plant raw materials—einkorn wheat (T. monococcum), barley (Hordeumvulgare), acorn (Quercus sp.), lentil (Lens culinaris), poppy seed (Papaver somniferum) andlinseed (Linum usitatissimum)—were ground using prehistoric grinding tool replicas con-structed for the PLANTCULT project (Figure 1), as described by Bofill et al. [33]. Specifically,einkorn grains were ground by three different types of grinding tools made from threedifferent grinding stone materials (andesite, sandstone and granite) with three differentgrinding ways: (a) a grinding slab with a handstone of the “overhanging” type used ina back-and-forth reciprocal motion; (b) a grinding slab with a small handstone used ina back-and-forth reciprocal motion; (c) a grinding slab with a small handstone used ina circular and free-motion action. The rest of the grains and seeds were ground by thetool made from sandstone with the second way of grinding. The einkorn flour used forbreadmaking and the study of the flour, dough and bread physicochemical propertieswas a mixture of the 9 flour samples ground by the three different stones and grindingways mixed in equal amounts; this mixture was used as a representative flour sampleprepared by the prehistoric grinding tool replicas. Two commercial flours from commonwheat (T. aestivum), type T70 (white flour), and spelt wheat (T. spelta), whole flour, werealso employed for breadmaking, whereas a commercial barley whole flour was also usedfor breadmaking and sourdough preparation. All the above three commercial flours wereorganic, provided by a local supplier (Doumos, Irinis Garden, Aridaia, Pella, Greece).
2.1.1. Particle Size Distribution
Flour particle size distribution was determined by sieve analysis using 100 g of aweighed sample, which was passed through a series of sieves with pore sizes from topto bottom: 4-mesh (0.96 mm), 5-mesh (0.80 mm), 6-mesh (0.65 mm), 8-mesh (0.50 mm),10-mesh (0.40 mm), 16-mesh (0.24 mm), 20-mesh (0.20 mm), 30-mesh (0.13 mm), 40-mesh(0.10 mm) and 70-mesh (0.063 mm). For particle size analysis of einkorn flour, all of theabove sieves were used, whereas for the commercial flours of barley and common wheat,only the last six sieves were employed. After shaking for 15 min by a mechanical vibratoryshifter, the amount of flour retained on each sieve (WS) was weighed, and the contents of
149
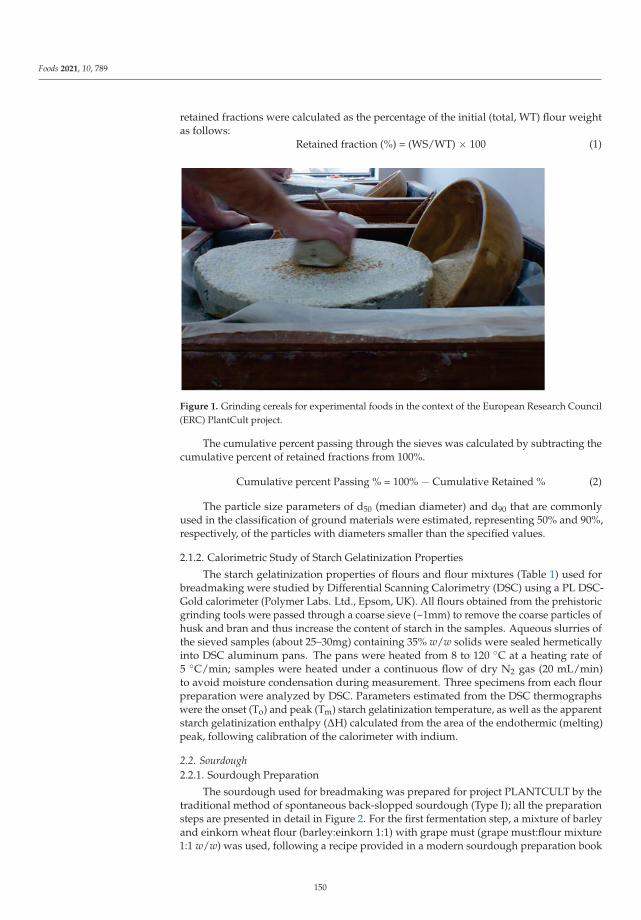
Foods 2021, 10, 789
retained fractions were calculated as the percentage of the initial (total, WT) flour weightas follows:
Retained fraction (%) = (WS/WT) × 100 (1)
Figure 1. Grinding cereals for experimental foods in the context of the European Research Council(ERC) PlantCult project.
The cumulative percent passing through the sieves was calculated by subtracting thecumulative percent of retained fractions from 100%.
Cumulative percent Passing % = 100% − Cumulative Retained % (2)
The particle size parameters of d50 (median diameter) and d90 that are commonlyused in the classification of ground materials were estimated, representing 50% and 90%,respectively, of the particles with diameters smaller than the specified values.
2.1.2. Calorimetric Study of Starch Gelatinization Properties
The starch gelatinization properties of flours and flour mixtures (Table 1) used forbreadmaking were studied by Differential Scanning Calorimetry (DSC) using a PL DSC-Gold calorimeter (Polymer Labs. Ltd., Epsom, UK). All flours obtained from the prehistoricgrinding tools were passed through a coarse sieve (~1mm) to remove the coarse particles ofhusk and bran and thus increase the content of starch in the samples. Aqueous slurries ofthe sieved samples (about 25–30mg) containing 35% w/w solids were sealed hermeticallyinto DSC aluminum pans. The pans were heated from 8 to 120 ◦C at a heating rate of5 ◦C/min; samples were heated under a continuous flow of dry N2 gas (20 mL/min)to avoid moisture condensation during measurement. Three specimens from each flourpreparation were analyzed by DSC. Parameters estimated from the DSC thermographswere the onset (To) and peak (Tm) starch gelatinization temperature, as well as the apparentstarch gelatinization enthalpy (ΔH) calculated from the area of the endothermic (melting)peak, following calibration of the calorimeter with indium.
2.2. Sourdough2.2.1. Sourdough Preparation
The sourdough used for breadmaking was prepared for project PLANTCULT by thetraditional method of spontaneous back-slopped sourdough (Type I); all the preparationsteps are presented in detail in Figure 2. For the first fermentation step, a mixture of barleyand einkorn wheat flour (barley:einkorn 1:1) with grape must (grape must:flour mixture1:1 w/w) was used, following a recipe provided in a modern sourdough preparation book
150
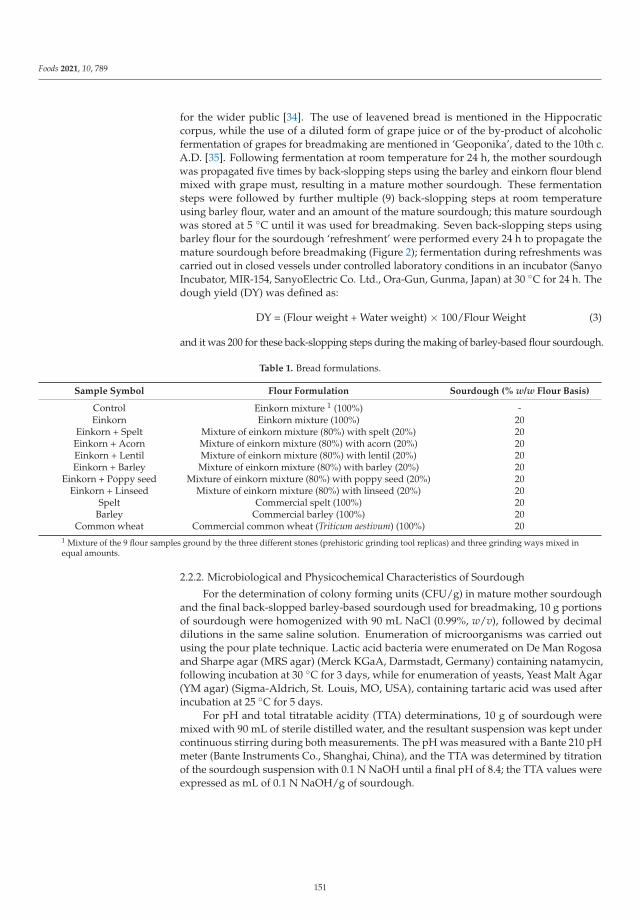
Foods 2021, 10, 789
for the wider public [34]. The use of leavened bread is mentioned in the Hippocraticcorpus, while the use of a diluted form of grape juice or of the by-product of alcoholicfermentation of grapes for breadmaking are mentioned in ‘Geoponika’, dated to the 10th c.A.D. [35]. Following fermentation at room temperature for 24 h, the mother sourdoughwas propagated five times by back-slopping steps using the barley and einkorn flour blendmixed with grape must, resulting in a mature mother sourdough. These fermentationsteps were followed by further multiple (9) back-slopping steps at room temperatureusing barley flour, water and an amount of the mature sourdough; this mature sourdoughwas stored at 5 ◦C until it was used for breadmaking. Seven back-slopping steps usingbarley flour for the sourdough ‘refreshment’ were performed every 24 h to propagate themature sourdough before breadmaking (Figure 2); fermentation during refreshments wascarried out in closed vessels under controlled laboratory conditions in an incubator (SanyoIncubator, MIR-154, SanyoElectric Co. Ltd., Ora-Gun, Gunma, Japan) at 30 ◦C for 24 h. Thedough yield (DY) was defined as:
DY = (Flour weight + Water weight) × 100/Flour Weight (3)
and it was 200 for these back-slopping steps during the making of barley-based flour sourdough.
Table 1. Bread formulations.
Sample Symbol Flour Formulation Sourdough (% w/w Flour Basis)
Control Einkorn mixture 1 (100%) -Einkorn Einkorn mixture (100%) 20
Einkorn + Spelt Mixture of einkorn mixture (80%) with spelt (20%) 20Einkorn + Acorn Mixture of einkorn mixture (80%) with acorn (20%) 20Einkorn + Lentil Mixture of einkorn mixture (80%) with lentil (20%) 20Einkorn + Barley Mixture of einkorn mixture (80%) with barley (20%) 20
Einkorn + Poppy seed Mixture of einkorn mixture (80%) with poppy seed (20%) 20Einkorn + Linseed Mixture of einkorn mixture (80%) with linseed (20%) 20
Spelt Commercial spelt (100%) 20Barley Commercial barley (100%) 20
Common wheat Commercial common wheat (Triticum aestivum) (100%) 201 Mixture of the 9 flour samples ground by the three different stones (prehistoric grinding tool replicas) and three grinding ways mixed inequal amounts.
2.2.2. Microbiological and Physicochemical Characteristics of Sourdough
For the determination of colony forming units (CFU/g) in mature mother sourdoughand the final back-slopped barley-based sourdough used for breadmaking, 10 g portionsof sourdough were homogenized with 90 mL NaCl (0.99%, w/v), followed by decimaldilutions in the same saline solution. Enumeration of microorganisms was carried outusing the pour plate technique. Lactic acid bacteria were enumerated on De Man Rogosaand Sharpe agar (MRS agar) (Merck KGaA, Darmstadt, Germany) containing natamycin,following incubation at 30 ◦C for 3 days, while for enumeration of yeasts, Yeast Malt Agar(YM agar) (Sigma-Aldrich, St. Louis, MO, USA), containing tartaric acid was used afterincubation at 25 ◦C for 5 days.
For pH and total titratable acidity (TTA) determinations, 10 g of sourdough weremixed with 90 mL of sterile distilled water, and the resultant suspension was kept undercontinuous stirring during both measurements. The pH was measured with a Bante 210 pHmeter (Bante Instruments Co., Shanghai, China), and the TTA was determined by titrationof the sourdough suspension with 0.1 N NaOH until a final pH of 8.4; the TTA values wereexpressed as mL of 0.1 N NaOH/g of sourdough.
151
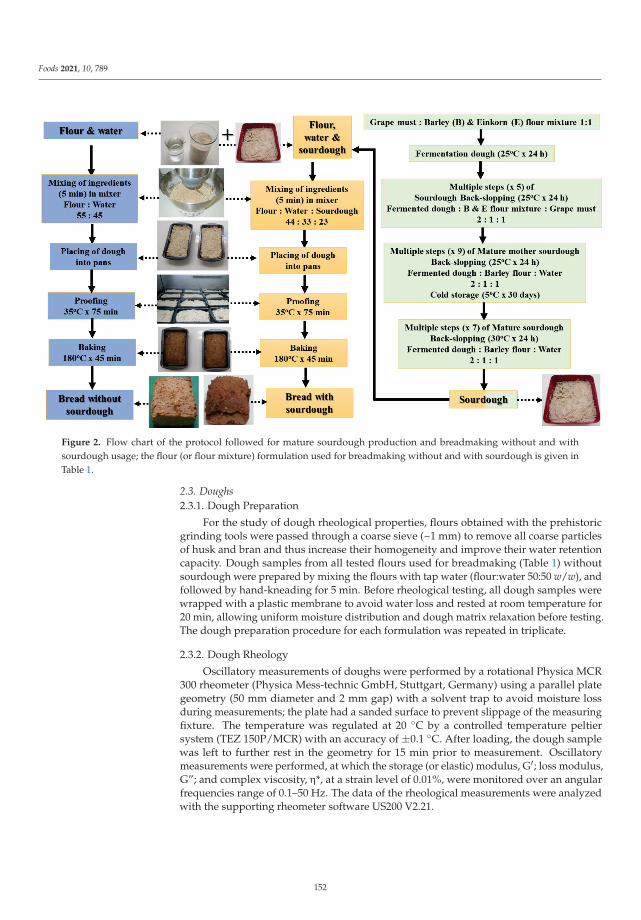
Foods 2021, 10, 789
Figure 2. Flow chart of the protocol followed for mature sourdough production and breadmaking without and withsourdough usage; the flour (or flour mixture) formulation used for breadmaking without and with sourdough is given inTable 1.
2.3. Doughs2.3.1. Dough Preparation
For the study of dough rheological properties, flours obtained with the prehistoricgrinding tools were passed through a coarse sieve (~1 mm) to remove all coarse particlesof husk and bran and thus increase their homogeneity and improve their water retentioncapacity. Dough samples from all tested flours used for breadmaking (Table 1) withoutsourdough were prepared by mixing the flours with tap water (flour:water 50:50 w/w), andfollowed by hand-kneading for 5 min. Before rheological testing, all dough samples werewrapped with a plastic membrane to avoid water loss and rested at room temperature for20 min, allowing uniform moisture distribution and dough matrix relaxation before testing.The dough preparation procedure for each formulation was repeated in triplicate.
2.3.2. Dough Rheology
Oscillatory measurements of doughs were performed by a rotational Physica MCR300 rheometer (Physica Mess-technic GmbH, Stuttgart, Germany) using a parallel plategeometry (50 mm diameter and 2 mm gap) with a solvent trap to avoid moisture lossduring measurements; the plate had a sanded surface to prevent slippage of the measuringfixture. The temperature was regulated at 20 ◦C by a controlled temperature peltiersystem (TEZ 150P/MCR) with an accuracy of ±0.1 ◦C. After loading, the dough samplewas left to further rest in the geometry for 15 min prior to measurement. Oscillatorymeasurements were performed, at which the storage (or elastic) modulus, G′; loss modulus,G”; and complex viscosity, η*, at a strain level of 0.01%, were monitored over an angularfrequencies range of 0.1–50 Hz. The data of the rheological measurements were analyzedwith the supporting rheometer software US200 V2.21.
152
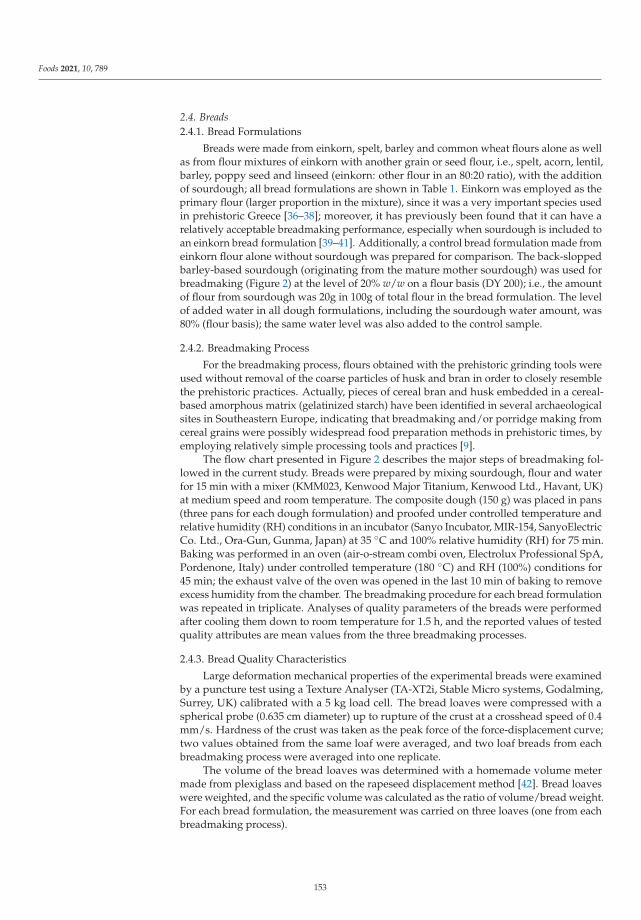
Foods 2021, 10, 789
2.4. Breads2.4.1. Bread Formulations
Breads were made from einkorn, spelt, barley and common wheat flours alone as wellas from flour mixtures of einkorn with another grain or seed flour, i.e., spelt, acorn, lentil,barley, poppy seed and linseed (einkorn: other flour in an 80:20 ratio), with the additionof sourdough; all bread formulations are shown in Table 1. Einkorn was employed as theprimary flour (larger proportion in the mixture), since it was a very important species usedin prehistoric Greece [36–38]; moreover, it has previously been found that it can have arelatively acceptable breadmaking performance, especially when sourdough is included toan einkorn bread formulation [39–41]. Additionally, a control bread formulation made fromeinkorn flour alone without sourdough was prepared for comparison. The back-sloppedbarley-based sourdough (originating from the mature mother sourdough) was used forbreadmaking (Figure 2) at the level of 20% w/w on a flour basis (DY 200); i.e., the amountof flour from sourdough was 20g in 100g of total flour in the bread formulation. The levelof added water in all dough formulations, including the sourdough water amount, was80% (flour basis); the same water level was also added to the control sample.
2.4.2. Breadmaking Process
For the breadmaking process, flours obtained with the prehistoric grinding tools wereused without removal of the coarse particles of husk and bran in order to closely resemblethe prehistoric practices. Actually, pieces of cereal bran and husk embedded in a cereal-based amorphous matrix (gelatinized starch) have been identified in several archaeologicalsites in Southeastern Europe, indicating that breadmaking and/or porridge making fromcereal grains were possibly widespread food preparation methods in prehistoric times, byemploying relatively simple processing tools and practices [9].
The flow chart presented in Figure 2 describes the major steps of breadmaking fol-lowed in the current study. Breads were prepared by mixing sourdough, flour and waterfor 15 min with a mixer (KMM023, Kenwood Major Titanium, Kenwood Ltd., Havant, UK)at medium speed and room temperature. The composite dough (150 g) was placed in pans(three pans for each dough formulation) and proofed under controlled temperature andrelative humidity (RH) conditions in an incubator (Sanyo Incubator, MIR-154, SanyoElectricCo. Ltd., Ora-Gun, Gunma, Japan) at 35 ◦C and 100% relative humidity (RH) for 75 min.Baking was performed in an oven (air-o-stream combi oven, Electrolux Professional SpA,Pordenone, Italy) under controlled temperature (180 ◦C) and RH (100%) conditions for45 min; the exhaust valve of the oven was opened in the last 10 min of baking to removeexcess humidity from the chamber. The breadmaking procedure for each bread formulationwas repeated in triplicate. Analyses of quality parameters of the breads were performedafter cooling them down to room temperature for 1.5 h, and the reported values of testedquality attributes are mean values from the three breadmaking processes.
2.4.3. Bread Quality Characteristics
Large deformation mechanical properties of the experimental breads were examinedby a puncture test using a Texture Analyser (TA-XT2i, Stable Micro systems, Godalming,Surrey, UK) calibrated with a 5 kg load cell. The bread loaves were compressed with aspherical probe (0.635 cm diameter) up to rupture of the crust at a crosshead speed of 0.4mm/s. Hardness of the crust was taken as the peak force of the force-displacement curve;two values obtained from the same loaf were averaged, and two loaf breads from eachbreadmaking process were averaged into one replicate.
The volume of the bread loaves was determined with a homemade volume metermade from plexiglass and based on the rapeseed displacement method [42]. Bread loaveswere weighted, and the specific volume was calculated as the ratio of volume/bread weight.For each bread formulation, the measurement was carried on three loaves (one from eachbreadmaking process).
153
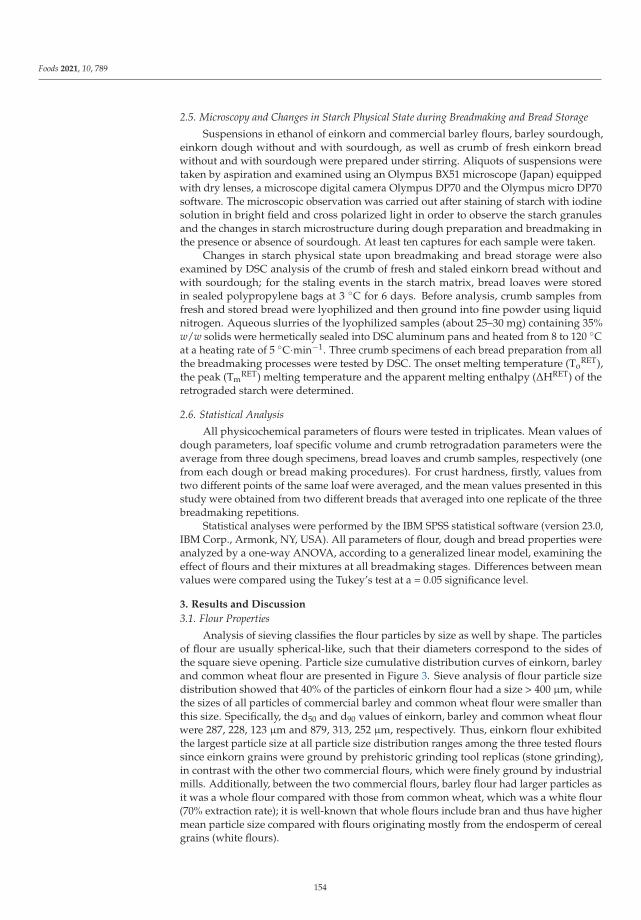
Foods 2021, 10, 789
2.5. Microscopy and Changes in Starch Physical State during Breadmaking and Bread Storage
Suspensions in ethanol of einkorn and commercial barley flours, barley sourdough,einkorn dough without and with sourdough, as well as crumb of fresh einkorn breadwithout and with sourdough were prepared under stirring. Aliquots of suspensions weretaken by aspiration and examined using an Olympus BX51 microscope (Japan) equippedwith dry lenses, a microscope digital camera Olympus DP70 and the Olympus micro DP70software. The microscopic observation was carried out after staining of starch with iodinesolution in bright field and cross polarized light in order to observe the starch granulesand the changes in starch microstructure during dough preparation and breadmaking inthe presence or absence of sourdough. At least ten captures for each sample were taken.
Changes in starch physical state upon breadmaking and bread storage were alsoexamined by DSC analysis of the crumb of fresh and staled einkorn bread without andwith sourdough; for the staling events in the starch matrix, bread loaves were storedin sealed polypropylene bags at 3 ◦C for 6 days. Before analysis, crumb samples fromfresh and stored bread were lyophilized and then ground into fine powder using liquidnitrogen. Aqueous slurries of the lyophilized samples (about 25–30 mg) containing 35%w/w solids were hermetically sealed into DSC aluminum pans and heated from 8 to 120 ◦Cat a heating rate of 5 ◦C·min−1. Three crumb specimens of each bread preparation from allthe breadmaking processes were tested by DSC. The onset melting temperature (To
RET),the peak (Tm
RET) melting temperature and the apparent melting enthalpy (ΔHRET) of theretrograded starch were determined.
2.6. Statistical Analysis
All physicochemical parameters of flours were tested in triplicates. Mean values ofdough parameters, loaf specific volume and crumb retrogradation parameters were theaverage from three dough specimens, bread loaves and crumb samples, respectively (onefrom each dough or bread making procedures). For crust hardness, firstly, values fromtwo different points of the same loaf were averaged, and the mean values presented in thisstudy were obtained from two different breads that averaged into one replicate of the threebreadmaking repetitions.
Statistical analyses were performed by the IBM SPSS statistical software (version 23.0,IBM Corp., Armonk, NY, USA). All parameters of flour, dough and bread properties wereanalyzed by a one-way ANOVA, according to a generalized linear model, examining theeffect of flours and their mixtures at all breadmaking stages. Differences between meanvalues were compared using the Tukey’s test at a = 0.05 significance level.
3. Results and Discussion
3.1. Flour Properties
Analysis of sieving classifies the flour particles by size as well by shape. The particlesof flour are usually spherical-like, such that their diameters correspond to the sides ofthe square sieve opening. Particle size cumulative distribution curves of einkorn, barleyand common wheat flour are presented in Figure 3. Sieve analysis of flour particle sizedistribution showed that 40% of the particles of einkorn flour had a size > 400 μm, whilethe sizes of all particles of commercial barley and common wheat flour were smaller thanthis size. Specifically, the d50 and d90 values of einkorn, barley and common wheat flourwere 287, 228, 123 μm and 879, 313, 252 μm, respectively. Thus, einkorn flour exhibitedthe largest particle size at all particle size distribution ranges among the three tested flourssince einkorn grains were ground by prehistoric grinding tool replicas (stone grinding),in contrast with the other two commercial flours, which were finely ground by industrialmills. Additionally, between the two commercial flours, barley flour had larger particles asit was a whole flour compared with those from common wheat, which was a white flour(70% extraction rate); it is well-known that whole flours include bran and thus have highermean particle size compared with flours originating mostly from the endosperm of cerealgrains (white flours).
154
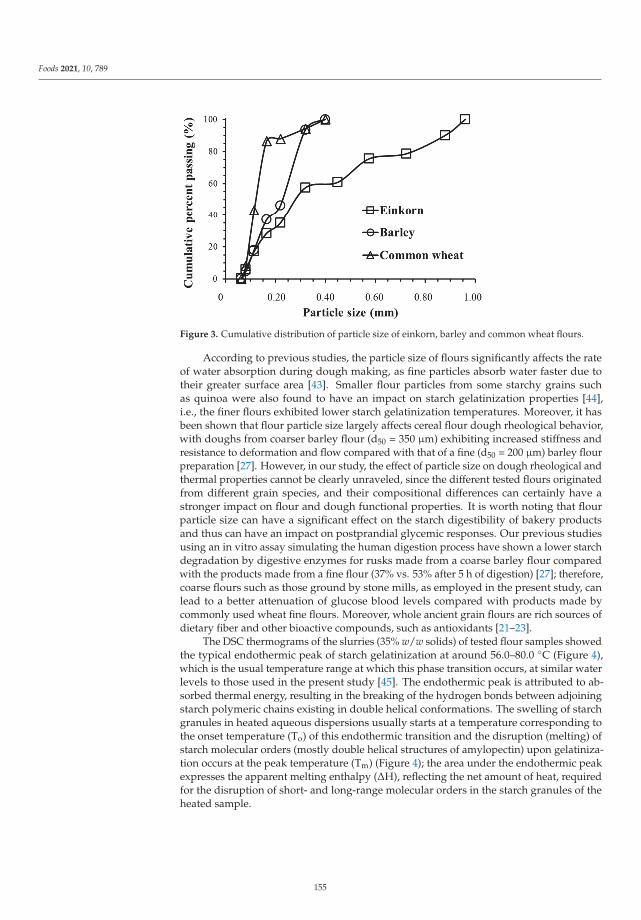
Foods 2021, 10, 789
Figure 3. Cumulative distribution of particle size of einkorn, barley and common wheat flours.
According to previous studies, the particle size of flours significantly affects the rateof water absorption during dough making, as fine particles absorb water faster due totheir greater surface area [43]. Smaller flour particles from some starchy grains suchas quinoa were also found to have an impact on starch gelatinization properties [44],i.e., the finer flours exhibited lower starch gelatinization temperatures. Moreover, it hasbeen shown that flour particle size largely affects cereal flour dough rheological behavior,with doughs from coarser barley flour (d50 = 350 μm) exhibiting increased stiffness andresistance to deformation and flow compared with that of a fine (d50 = 200 μm) barley flourpreparation [27]. However, in our study, the effect of particle size on dough rheological andthermal properties cannot be clearly unraveled, since the different tested flours originatedfrom different grain species, and their compositional differences can certainly have astronger impact on flour and dough functional properties. It is worth noting that flourparticle size can have a significant effect on the starch digestibility of bakery productsand thus can have an impact on postprandial glycemic responses. Our previous studiesusing an in vitro assay simulating the human digestion process have shown a lower starchdegradation by digestive enzymes for rusks made from a coarse barley flour comparedwith the products made from a fine flour (37% vs. 53% after 5 h of digestion) [27]; therefore,coarse flours such as those ground by stone mills, as employed in the present study, canlead to a better attenuation of glucose blood levels compared with products made bycommonly used wheat fine flours. Moreover, whole ancient grain flours are rich sources ofdietary fiber and other bioactive compounds, such as antioxidants [21–23].
The DSC thermograms of the slurries (35% w/w solids) of tested flour samples showedthe typical endothermic peak of starch gelatinization at around 56.0–80.0 ◦C (Figure 4),which is the usual temperature range at which this phase transition occurs, at similar waterlevels to those used in the present study [45]. The endothermic peak is attributed to ab-sorbed thermal energy, resulting in the breaking of the hydrogen bonds between adjoiningstarch polymeric chains existing in double helical conformations. The swelling of starchgranules in heated aqueous dispersions usually starts at a temperature corresponding tothe onset temperature (To) of this endothermic transition and the disruption (melting) ofstarch molecular orders (mostly double helical structures of amylopectin) upon gelatiniza-tion occurs at the peak temperature (Tm) (Figure 4); the area under the endothermic peakexpresses the apparent melting enthalpy (ΔH), reflecting the net amount of heat, requiredfor the disruption of short- and long-range molecular orders in the starch granules of theheated sample.
155
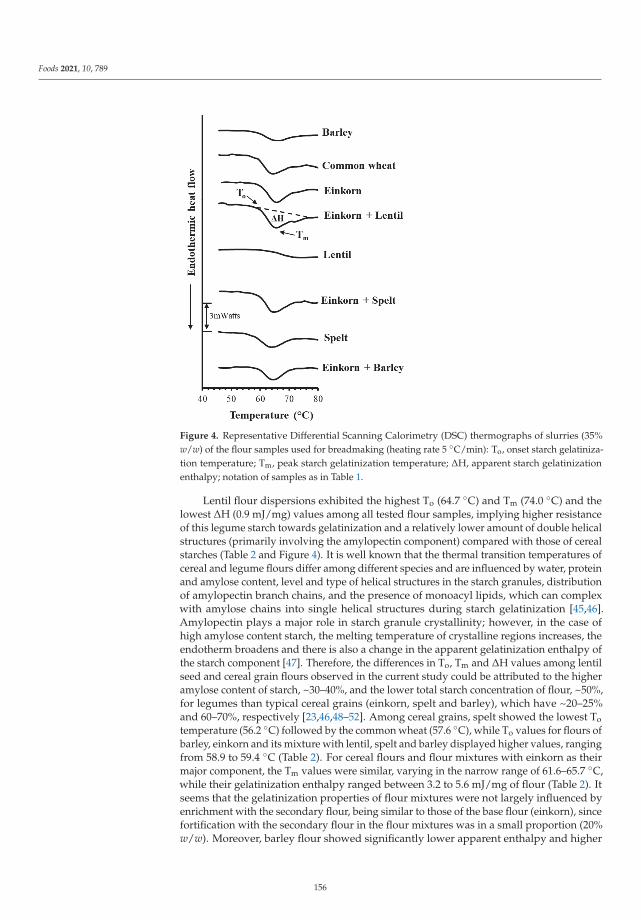
Foods 2021, 10, 789
Figure 4. Representative Differential Scanning Calorimetry (DSC) thermographs of slurries (35%w/w) of the flour samples used for breadmaking (heating rate 5 ◦C/min): To, onset starch gelatiniza-tion temperature; Tm, peak starch gelatinization temperature; ΔH, apparent starch gelatinizationenthalpy; notation of samples as in Table 1.
Lentil flour dispersions exhibited the highest To (64.7 ◦C) and Tm (74.0 ◦C) and thelowest ΔH (0.9 mJ/mg) values among all tested flour samples, implying higher resistanceof this legume starch towards gelatinization and a relatively lower amount of double helicalstructures (primarily involving the amylopectin component) compared with those of cerealstarches (Table 2 and Figure 4). It is well known that the thermal transition temperatures ofcereal and legume flours differ among different species and are influenced by water, proteinand amylose content, level and type of helical structures in the starch granules, distributionof amylopectin branch chains, and the presence of monoacyl lipids, which can complexwith amylose chains into single helical structures during starch gelatinization [45,46].Amylopectin plays a major role in starch granule crystallinity; however, in the case ofhigh amylose content starch, the melting temperature of crystalline regions increases, theendotherm broadens and there is also a change in the apparent gelatinization enthalpy ofthe starch component [47]. Therefore, the differences in To, Tm and ΔH values among lentilseed and cereal grain flours observed in the current study could be attributed to the higheramylose content of starch, ~30–40%, and the lower total starch concentration of flour, ~50%,for legumes than typical cereal grains (einkorn, spelt and barley), which have ~20–25%and 60–70%, respectively [23,46,48–52]. Among cereal grains, spelt showed the lowest Totemperature (56.2 ◦C) followed by the common wheat (57.6 ◦C), while To values for flours ofbarley, einkorn and its mixture with lentil, spelt and barley displayed higher values, rangingfrom 58.9 to 59.4 ◦C (Table 2). For cereal flours and flour mixtures with einkorn as theirmajor component, the Tm values were similar, varying in the narrow range of 61.6–65.7 ◦C,while their gelatinization enthalpy ranged between 3.2 to 5.6 mJ/mg of flour (Table 2). Itseems that the gelatinization properties of flour mixtures were not largely influenced byenrichment with the secondary flour, being similar to those of the base flour (einkorn), sincefortification with the secondary flour in the flour mixtures was in a small proportion (20%w/w). Moreover, barley flour showed significantly lower apparent enthalpy and higher
156
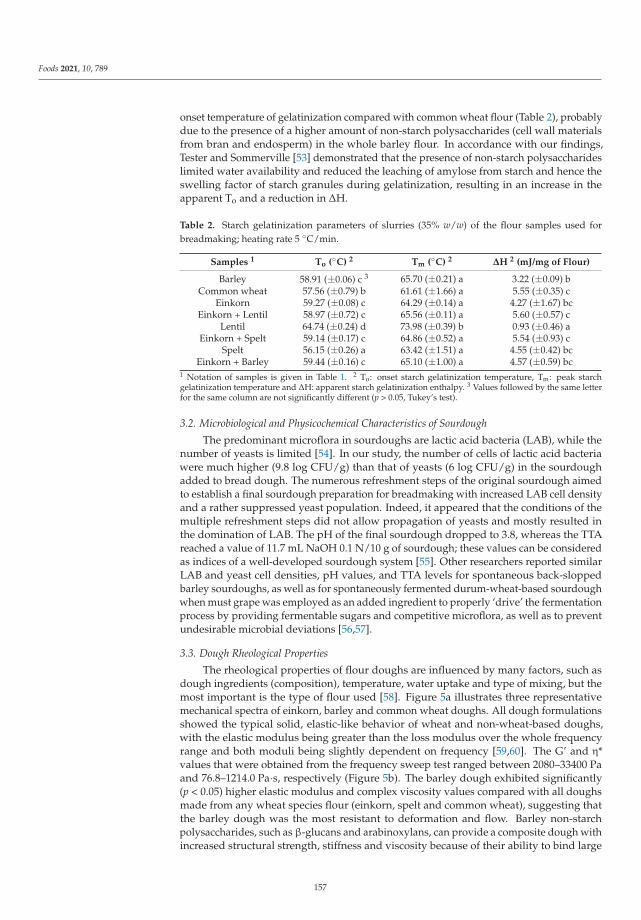
Foods 2021, 10, 789
onset temperature of gelatinization compared with common wheat flour (Table 2), probablydue to the presence of a higher amount of non-starch polysaccharides (cell wall materialsfrom bran and endosperm) in the whole barley flour. In accordance with our findings,Tester and Sommerville [53] demonstrated that the presence of non-starch polysaccharideslimited water availability and reduced the leaching of amylose from starch and hence theswelling factor of starch granules during gelatinization, resulting in an increase in theapparent To and a reduction in ΔH.
Table 2. Starch gelatinization parameters of slurries (35% w/w) of the flour samples used forbreadmaking; heating rate 5 ◦C/min.
Samples 1 To (◦C) 2 Tm (◦C) 2 ΔH 2 (mJ/mg of Flour)
Barley 58.91 (±0.06) c 3 65.70 (±0.21) a 3.22 (±0.09) bCommon wheat 57.56 (±0.79) b 61.61 (±1.66) a 5.55 (±0.35) c
Einkorn 59.27 (±0.08) c 64.29 (±0.14) a 4.27 (±1.67) bcEinkorn + Lentil 58.97 (±0.72) c 65.56 (±0.11) a 5.60 (±0.57) c
Lentil 64.74 (±0.24) d 73.98 (±0.39) b 0.93 (±0.46) aEinkorn + Spelt 59.14 (±0.17) c 64.86 (±0.52) a 5.54 (±0.93) c
Spelt 56.15 (±0.26) a 63.42 (±1.51) a 4.55 (±0.42) bcEinkorn + Barley 59.44 (±0.16) c 65.10 (±1.00) a 4.57 (±0.59) bc
1 Notation of samples is given in Table 1. 2 To: onset starch gelatinization temperature, Tm: peak starchgelatinization temperature and ΔH: apparent starch gelatinization enthalpy. 3 Values followed by the same letterfor the same column are not significantly different (p > 0.05, Tukey’s test).
3.2. Microbiological and Physicochemical Characteristics of Sourdough
The predominant microflora in sourdoughs are lactic acid bacteria (LAB), while thenumber of yeasts is limited [54]. In our study, the number of cells of lactic acid bacteriawere much higher (9.8 log CFU/g) than that of yeasts (6 log CFU/g) in the sourdoughadded to bread dough. The numerous refreshment steps of the original sourdough aimedto establish a final sourdough preparation for breadmaking with increased LAB cell densityand a rather suppressed yeast population. Indeed, it appeared that the conditions of themultiple refreshment steps did not allow propagation of yeasts and mostly resulted inthe domination of LAB. The pH of the final sourdough dropped to 3.8, whereas the TTAreached a value of 11.7 mL NaOH 0.1 N/10 g of sourdough; these values can be consideredas indices of a well-developed sourdough system [55]. Other researchers reported similarLAB and yeast cell densities, pH values, and TTA levels for spontaneous back-sloppedbarley sourdoughs, as well as for spontaneously fermented durum-wheat-based sourdoughwhen must grape was employed as an added ingredient to properly ‘drive’ the fermentationprocess by providing fermentable sugars and competitive microflora, as well as to preventundesirable microbial deviations [56,57].
3.3. Dough Rheological Properties
The rheological properties of flour doughs are influenced by many factors, such asdough ingredients (composition), temperature, water uptake and type of mixing, but themost important is the type of flour used [58]. Figure 5a illustrates three representativemechanical spectra of einkorn, barley and common wheat doughs. All dough formulationsshowed the typical solid, elastic-like behavior of wheat and non-wheat-based doughs,with the elastic modulus being greater than the loss modulus over the whole frequencyrange and both moduli being slightly dependent on frequency [59,60]. The G’ and η*values that were obtained from the frequency sweep test ranged between 2080–33400 Paand 76.8–1214.0 Pa·s, respectively (Figure 5b). The barley dough exhibited significantly(p < 0.05) higher elastic modulus and complex viscosity values compared with all doughsmade from any wheat species flour (einkorn, spelt and common wheat), suggesting thatthe barley dough was the most resistant to deformation and flow. Barley non-starchpolysaccharides, such as β-glucans and arabinoxylans, can provide a composite dough withincreased structural strength, stiffness and viscosity because of their ability to bind large
157
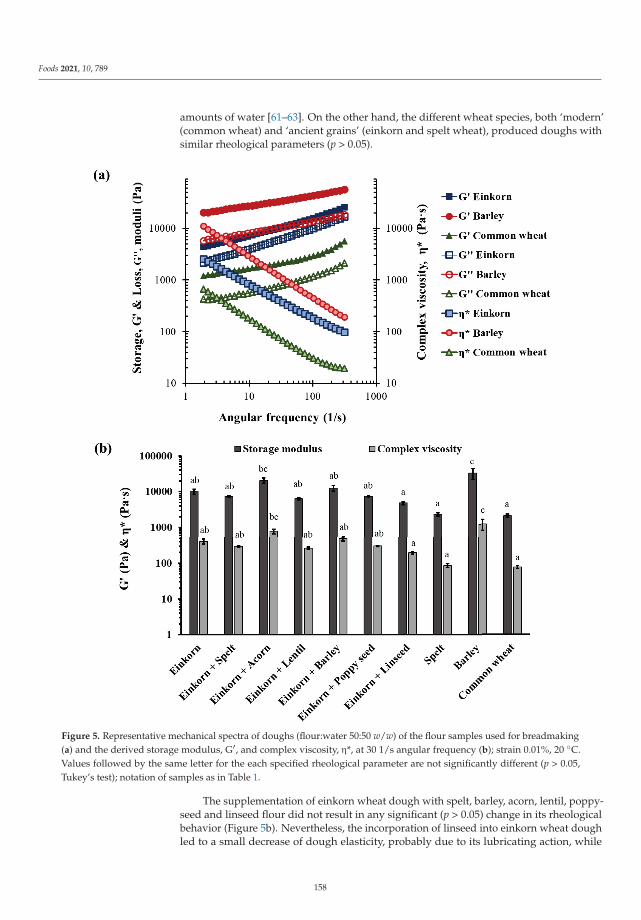
Foods 2021, 10, 789
amounts of water [61–63]. On the other hand, the different wheat species, both ‘modern’(common wheat) and ‘ancient grains’ (einkorn and spelt wheat), produced doughs withsimilar rheological parameters (p > 0.05).
Figure 5. Representative mechanical spectra of doughs (flour:water 50:50 w/w) of the flour samples used for breadmaking(a) and the derived storage modulus, G′, and complex viscosity, η*, at 30 1/s angular frequency (b); strain 0.01%, 20 ◦C.Values followed by the same letter for the each specified rheological parameter are not significantly different (p > 0.05,Tukey’s test); notation of samples as in Table 1.
The supplementation of einkorn wheat dough with spelt, barley, acorn, lentil, poppy-seed and linseed flour did not result in any significant (p > 0.05) change in its rheologicalbehavior (Figure 5b). Nevertheless, the incorporation of linseed into einkorn wheat doughled to a small decrease of dough elasticity, probably due to its lubricating action, while
158
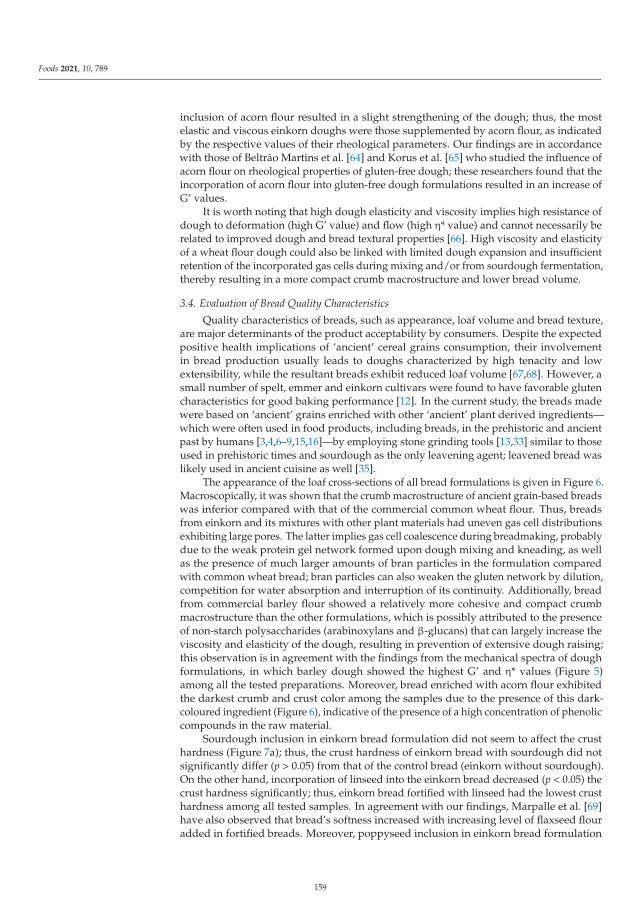
Foods 2021, 10, 789
inclusion of acorn flour resulted in a slight strengthening of the dough; thus, the mostelastic and viscous einkorn doughs were those supplemented by acorn flour, as indicatedby the respective values of their rheological parameters. Our findings are in accordancewith those of Beltrão Martins et al. [64] and Korus et al. [65] who studied the influence ofacorn flour on rheological properties of gluten-free dough; these researchers found that theincorporation of acorn flour into gluten-free dough formulations resulted in an increase ofG’ values.
It is worth noting that high dough elasticity and viscosity implies high resistance ofdough to deformation (high G’ value) and flow (high η* value) and cannot necessarily berelated to improved dough and bread textural properties [66]. High viscosity and elasticityof a wheat flour dough could also be linked with limited dough expansion and insufficientretention of the incorporated gas cells during mixing and/or from sourdough fermentation,thereby resulting in a more compact crumb macrostructure and lower bread volume.
3.4. Evaluation of Bread Quality Characteristics
Quality characteristics of breads, such as appearance, loaf volume and bread texture,are major determinants of the product acceptability by consumers. Despite the expectedpositive health implications of ‘ancient’ cereal grains consumption, their involvementin bread production usually leads to doughs characterized by high tenacity and lowextensibility, while the resultant breads exhibit reduced loaf volume [67,68]. However, asmall number of spelt, emmer and einkorn cultivars were found to have favorable glutencharacteristics for good baking performance [12]. In the current study, the breads madewere based on ‘ancient’ grains enriched with other ‘ancient’ plant derived ingredients—which were often used in food products, including breads, in the prehistoric and ancientpast by humans [3,4,6–9,15,16]—by employing stone grinding tools [13,33] similar to thoseused in prehistoric times and sourdough as the only leavening agent; leavened bread waslikely used in ancient cuisine as well [35].
The appearance of the loaf cross-sections of all bread formulations is given in Figure 6.Macroscopically, it was shown that the crumb macrostructure of ancient grain-based breadswas inferior compared with that of the commercial common wheat flour. Thus, breadsfrom einkorn and its mixtures with other plant materials had uneven gas cell distributionsexhibiting large pores. The latter implies gas cell coalescence during breadmaking, probablydue to the weak protein gel network formed upon dough mixing and kneading, as wellas the presence of much larger amounts of bran particles in the formulation comparedwith common wheat bread; bran particles can also weaken the gluten network by dilution,competition for water absorption and interruption of its continuity. Additionally, breadfrom commercial barley flour showed a relatively more cohesive and compact crumbmacrostructure than the other formulations, which is possibly attributed to the presenceof non-starch polysaccharides (arabinoxylans and β-glucans) that can largely increase theviscosity and elasticity of the dough, resulting in prevention of extensive dough raising;this observation is in agreement with the findings from the mechanical spectra of doughformulations, in which barley dough showed the highest G’ and η* values (Figure 5)among all the tested preparations. Moreover, bread enriched with acorn flour exhibitedthe darkest crumb and crust color among the samples due to the presence of this dark-coloured ingredient (Figure 6), indicative of the presence of a high concentration of phenoliccompounds in the raw material.
Sourdough inclusion in einkorn bread formulation did not seem to affect the crusthardness (Figure 7a); thus, the crust hardness of einkorn bread with sourdough did notsignificantly differ (p > 0.05) from that of the control bread (einkorn without sourdough).On the other hand, incorporation of linseed into the einkorn bread decreased (p < 0.05) thecrust hardness significantly; thus, einkorn bread fortified with linseed had the lowest crusthardness among all tested samples. In agreement with our findings, Marpalle et al. [69]have also observed that bread’s softness increased with increasing level of flaxseed flouradded in fortified breads. Moreover, poppyseed inclusion in einkorn bread formulation
159
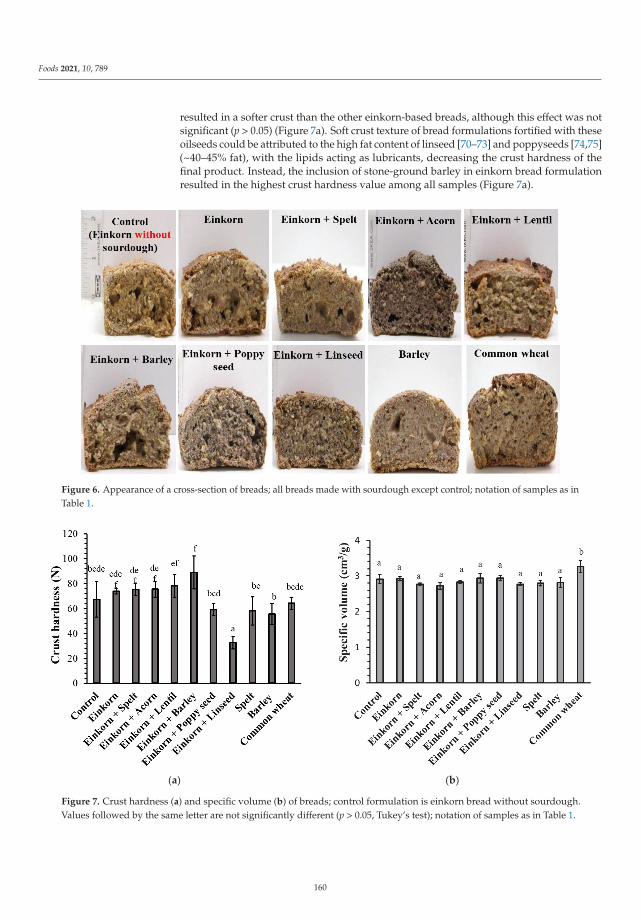
Foods 2021, 10, 789
resulted in a softer crust than the other einkorn-based breads, although this effect was notsignificant (p > 0.05) (Figure 7a). Soft crust texture of bread formulations fortified with theseoilseeds could be attributed to the high fat content of linseed [70–73] and poppyseeds [74,75](~40–45% fat), with the lipids acting as lubricants, decreasing the crust hardness of thefinal product. Instead, the inclusion of stone-ground barley in einkorn bread formulationresulted in the highest crust hardness value among all samples (Figure 7a).
Figure 6. Appearance of a cross-section of breads; all breads made with sourdough except control; notation of samples as inTable 1.
(a) (b)
Figure 7. Crust hardness (a) and specific volume (b) of breads; control formulation is einkorn bread without sourdough.Values followed by the same letter are not significantly different (p > 0.05, Tukey’s test); notation of samples as in Table 1.
160
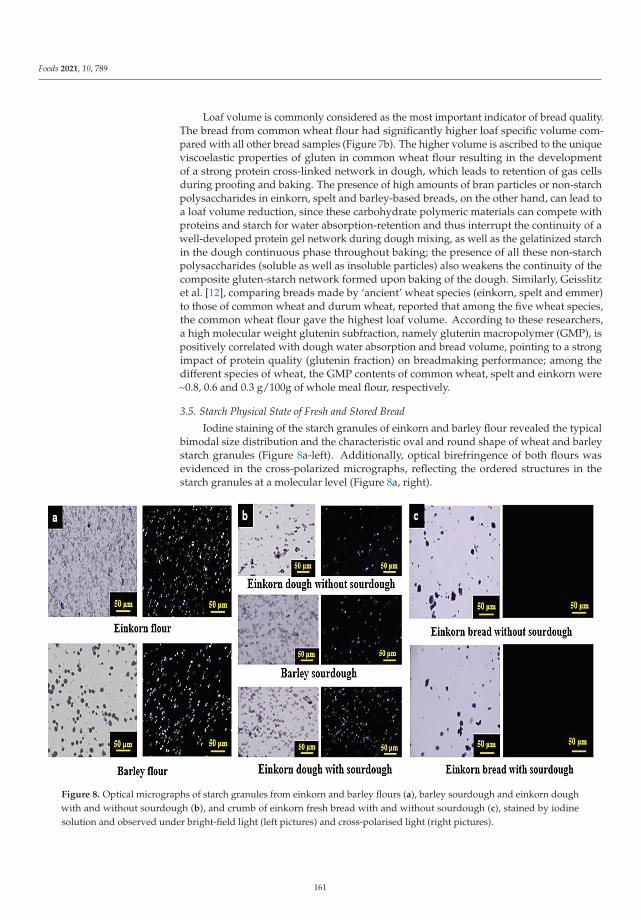
Foods 2021, 10, 789
Loaf volume is commonly considered as the most important indicator of bread quality.The bread from common wheat flour had significantly higher loaf specific volume com-pared with all other bread samples (Figure 7b). The higher volume is ascribed to the uniqueviscoelastic properties of gluten in common wheat flour resulting in the developmentof a strong protein cross-linked network in dough, which leads to retention of gas cellsduring proofing and baking. The presence of high amounts of bran particles or non-starchpolysaccharides in einkorn, spelt and barley-based breads, on the other hand, can lead toa loaf volume reduction, since these carbohydrate polymeric materials can compete withproteins and starch for water absorption-retention and thus interrupt the continuity of awell-developed protein gel network during dough mixing, as well as the gelatinized starchin the dough continuous phase throughout baking; the presence of all these non-starchpolysaccharides (soluble as well as insoluble particles) also weakens the continuity of thecomposite gluten-starch network formed upon baking of the dough. Similarly, Geisslitzet al. [12], comparing breads made by ‘ancient’ wheat species (einkorn, spelt and emmer)to those of common wheat and durum wheat, reported that among the five wheat species,the common wheat flour gave the highest loaf volume. According to these researchers,a high molecular weight glutenin subfraction, namely glutenin macropolymer (GMP), ispositively correlated with dough water absorption and bread volume, pointing to a strongimpact of protein quality (glutenin fraction) on breadmaking performance; among thedifferent species of wheat, the GMP contents of common wheat, spelt and einkorn were~0.8, 0.6 and 0.3 g/100g of whole meal flour, respectively.
3.5. Starch Physical State of Fresh and Stored Bread
Iodine staining of the starch granules of einkorn and barley flour revealed the typicalbimodal size distribution and the characteristic oval and round shape of wheat and barleystarch granules (Figure 8a-left). Additionally, optical birefringence of both flours wasevidenced in the cross-polarized micrographs, reflecting the ordered structures in thestarch granules at a molecular level (Figure 8a, right).
Figure 8. Optical micrographs of starch granules from einkorn and barley flours (a), barley sourdough and einkorn doughwith and without sourdough (b), and crumb of einkorn fresh bread with and without sourdough (c), stained by iodinesolution and observed under bright-field light (left pictures) and cross-polarised light (right pictures).
161
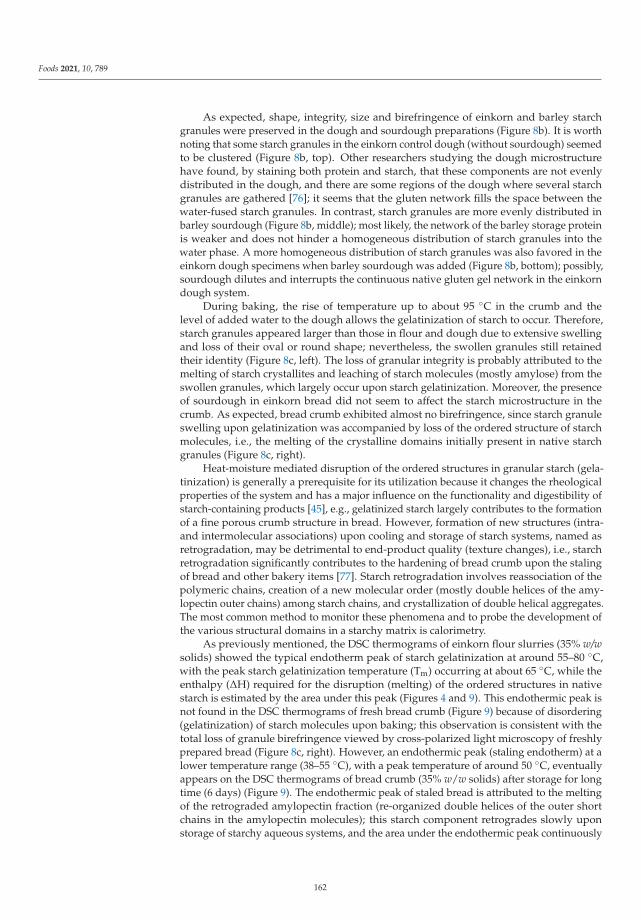
Foods 2021, 10, 789
As expected, shape, integrity, size and birefringence of einkorn and barley starchgranules were preserved in the dough and sourdough preparations (Figure 8b). It is worthnoting that some starch granules in the einkorn control dough (without sourdough) seemedto be clustered (Figure 8b, top). Other researchers studying the dough microstructurehave found, by staining both protein and starch, that these components are not evenlydistributed in the dough, and there are some regions of the dough where several starchgranules are gathered [76]; it seems that the gluten network fills the space between thewater-fused starch granules. In contrast, starch granules are more evenly distributed inbarley sourdough (Figure 8b, middle); most likely, the network of the barley storage proteinis weaker and does not hinder a homogeneous distribution of starch granules into thewater phase. A more homogeneous distribution of starch granules was also favored in theeinkorn dough specimens when barley sourdough was added (Figure 8b, bottom); possibly,sourdough dilutes and interrupts the continuous native gluten gel network in the einkorndough system.
During baking, the rise of temperature up to about 95 ◦C in the crumb and thelevel of added water to the dough allows the gelatinization of starch to occur. Therefore,starch granules appeared larger than those in flour and dough due to extensive swellingand loss of their oval or round shape; nevertheless, the swollen granules still retainedtheir identity (Figure 8c, left). The loss of granular integrity is probably attributed to themelting of starch crystallites and leaching of starch molecules (mostly amylose) from theswollen granules, which largely occur upon starch gelatinization. Moreover, the presenceof sourdough in einkorn bread did not seem to affect the starch microstructure in thecrumb. As expected, bread crumb exhibited almost no birefringence, since starch granuleswelling upon gelatinization was accompanied by loss of the ordered structure of starchmolecules, i.e., the melting of the crystalline domains initially present in native starchgranules (Figure 8c, right).
Heat-moisture mediated disruption of the ordered structures in granular starch (gela-tinization) is generally a prerequisite for its utilization because it changes the rheologicalproperties of the system and has a major influence on the functionality and digestibility ofstarch-containing products [45], e.g., gelatinized starch largely contributes to the formationof a fine porous crumb structure in bread. However, formation of new structures (intra-and intermolecular associations) upon cooling and storage of starch systems, named asretrogradation, may be detrimental to end-product quality (texture changes), i.e., starchretrogradation significantly contributes to the hardening of bread crumb upon the stalingof bread and other bakery items [77]. Starch retrogradation involves reassociation of thepolymeric chains, creation of a new molecular order (mostly double helices of the amy-lopectin outer chains) among starch chains, and crystallization of double helical aggregates.The most common method to monitor these phenomena and to probe the development ofthe various structural domains in a starchy matrix is calorimetry.
As previously mentioned, the DSC thermograms of einkorn flour slurries (35% w/wsolids) showed the typical endotherm peak of starch gelatinization at around 55–80 ◦C,with the peak starch gelatinization temperature (Tm) occurring at about 65 ◦C, while theenthalpy (ΔH) required for the disruption (melting) of the ordered structures in nativestarch is estimated by the area under this peak (Figures 4 and 9). This endothermic peak isnot found in the DSC thermograms of fresh bread crumb (Figure 9) because of disordering(gelatinization) of starch molecules upon baking; this observation is consistent with thetotal loss of granule birefringence viewed by cross-polarized light microscopy of freshlyprepared bread (Figure 8c, right). However, an endothermic peak (staling endotherm) at alower temperature range (38–55 ◦C), with a peak temperature of around 50 ◦C, eventuallyappears on the DSC thermograms of bread crumb (35% w/w solids) after storage for longtime (6 days) (Figure 9). The endothermic peak of staled bread is attributed to the meltingof the retrograded amylopectin fraction (re-organized double helices of the outer shortchains in the amylopectin molecules); this starch component retrogrades slowly uponstorage of starchy aqueous systems, and the area under the endothermic peak continuously
162
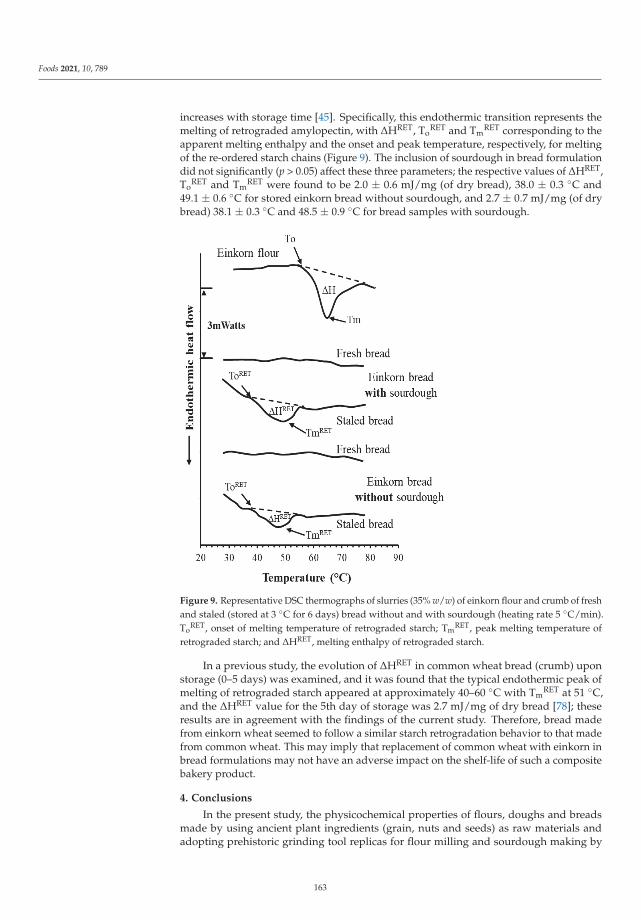
Foods 2021, 10, 789
increases with storage time [45]. Specifically, this endothermic transition represents themelting of retrograded amylopectin, with ΔHRET, To
RET and TmRET corresponding to the
apparent melting enthalpy and the onset and peak temperature, respectively, for meltingof the re-ordered starch chains (Figure 9). The inclusion of sourdough in bread formulationdid not significantly (p > 0.05) affect these three parameters; the respective values of ΔHRET,To
RET and TmRET were found to be 2.0 ± 0.6 mJ/mg (of dry bread), 38.0 ± 0.3 ◦C and
49.1 ± 0.6 ◦C for stored einkorn bread without sourdough, and 2.7 ± 0.7 mJ/mg (of drybread) 38.1 ± 0.3 ◦C and 48.5 ± 0.9 ◦C for bread samples with sourdough.
Figure 9. Representative DSC thermographs of slurries (35% w/w) of einkorn flour and crumb of freshand staled (stored at 3 ◦C for 6 days) bread without and with sourdough (heating rate 5 ◦C/min).To
RET, onset of melting temperature of retrograded starch; TmRET, peak melting temperature of
retrograded starch; and ΔHRET, melting enthalpy of retrograded starch.
In a previous study, the evolution of ΔHRET in common wheat bread (crumb) uponstorage (0–5 days) was examined, and it was found that the typical endothermic peak ofmelting of retrograded starch appeared at approximately 40–60 ◦C with Tm
RET at 51 ◦C,and the ΔHRET value for the 5th day of storage was 2.7 mJ/mg of dry bread [78]; theseresults are in agreement with the findings of the current study. Therefore, bread madefrom einkorn wheat seemed to follow a similar starch retrogradation behavior to that madefrom common wheat. This may imply that replacement of common wheat with einkorn inbread formulations may not have an adverse impact on the shelf-life of such a compositebakery product.
4. Conclusions
In the present study, the physicochemical properties of flours, doughs and breadsmade by using ancient plant ingredients (grain, nuts and seeds) as raw materials andadopting prehistoric grinding tool replicas for flour milling and sourdough making by
163
Foods 2021, 10, 789
multiple back-slopping steps as a bread leavening process were investigated. The researchfindings indicated that the particle size of einkorn flour ground with prehistoric-like stonemills was largely higher than it was for commercial fine flours of barley and common wheat.The starch gelatinization properties among cereal-based (spelt, barley, common wheat)flours were similar, while lentil flour had higher gelatinization temperature and lowerenthalpy values. Overall, variations in the thermal, rheological and textural propertiesof the tested flours, doughs and bread formulations were observed among the differentplant genera. More specifically, the barley flour made more elastic and viscous doughscompared with those containing any of the various wheat species used (einkorn, spelt andcommon wheat); additionally, inclusion of acorn into einkorn-based dough formulationresulted in similar rheological behavior with that of barley dough. Among the differentwheat species tested, no significant variations in dough rheological properties were noticed.Similarly, the various tested cereal genera (barley and wheat species) did not differ in breadcrust texture characteristics. However, fortification of einkorn bread with stone-groundedbarley and linseed flour resulted in an increase and decrease in crust hardness, respectively.As expected, common wheat exhibited the highest loaf-specific volume among all breadformulations. On the other hand, the addition of barley-based sourdough into einkorndough formulation did not affect either the textural properties and loaf volume, nor theextent of starch retrogradation of the final baked product. Overall, the use of ‘ancient’ plantmaterials in making of sourdough bread seems to be a promising method for delivering a‘clean labelling’ feature in bakery items, satisfying the consumer’s demand for healthy andnaturally produced breads, as well as exhibiting quality attributes comparable to breadsmade from conventional wheat flours.
Author Contributions: Conceptualization, S.M.V.; methodology, A.L., C.G.B. and S.M.V.; investiga-tion, V.S.; resources, S.M.V., A.L. and C.G.B.; data curation, V.S. and A.L.; writing—original draftpreparation, V.S.; writing—review and editing, A.L., C.G.B. and S.M.V.; supervision, S.M.V. andA.L.; funding acquisition, S.M.V. All authors have read and agreed to the published version ofthe manuscript.
Funding: This research was funded by the European Research Council project “PlantCult: identifyingthe food cultures of ancient Europe”, under the European Union’s Horizon 2020 research andinnovation program (grant agreement 682529, consolidator grant 2016–2021) and the APC wasfunded by the same grant (grant agreement 682529, consolidator grant 2016–2021).
Institutional Review Board Statement: Not applicable.
Informed Consent Statement: Not applicable.
Acknowledgments: We are grateful to Danai Chondrou, Tassos Bekiaris, Ismini Ninou, Maria Bofilland Toni Palomo who helped with the design and construction of the grinding stones that wereused to grind the modern reference material. We are also grateful to Pavlos Lathiras and EleftheriaAlmasidou for grinding the specimens used in this study. We also thank Vasiliki Kapetanaki forFigure 1.
Conflicts of Interest: The authors declare no conflict of interest.
References
1. Arranz-Otaegui, A.; Carretero, L.G.; Ramsey, M.N.; Fuller, D.Q.; Richter, T. Archaeobotanical evidence reveals the origins of bread14,400 years ago in northeastern Jordan. Proc. Natl. Acad. Sci. USA 2018, 115, 7925–7930. [CrossRef]
2. Carretero, L.G.; Wollstonecroft, M.; Fuller, D.Q. A methodological approach to the study of archaeological cereal meals: A casestudy at Çatalhöyük East (Turkey). Veg. Hist. Archaeobot. 2017, 26, 415–432. [CrossRef] [PubMed]
3. Primavera, M.; Heiss, A.G.; Valamoti, M.S.; Quarta, G.; Masieri, M.; Fiorentino, G. Inside sacrificial cakes: Plant componentsand production processes of food offerings at the Demeter and Persephone sanctuary of Monte Papalucio (Oria, southern Italy).Archaeol. Anthrop. Sci. 2019, 11, 1273–1287. [CrossRef]
4. Valamoti, S.M.; Samuel, D.; Bayram, M.; Marinova, E. Prehistoric cereal foods from Greece and Bulgaria: Investigation of starchmicrostructure in experimental and archaeological charred remains. Veg. Hist. Archaeobot. 2008, 17, 265–276. [CrossRef]
164
Foods 2021, 10, 789
5. Heiss, A.G.; Antolín, F.; Berihuete Azorín, M.; Biederer, B.; Erlach, R.; Gail, N.; Griebl, M.; Linke, R.; Lochner, M.;Marinova, E.; et al. The Hoard of the Rings. “Odd” annular bread-like objects as a case study for cereal-product diversity at theLate Bronze Age hillfort site of Stillfried (Lower Austria). PLoS ONE 2019, 14. [CrossRef] [PubMed]
6. Valamoti, S.M. Plant food ingredients and ‘recipes’ from Prehistoric Greece: The archaeobotanical evidence. In Plants and Culture:Seeds of the Cultural Heritage of Europe; Morel, J.P., Mercuri, A.M., Eds.; Centro Europeo per i Beni Culturali Ravello Edipuglia:Bari, Italy, 2009; pp. 25–38.
7. Zohary, D.; Hopf, M.; Weiss, E. Cereals. In Domestication of Plants in the Old World: The Origin and Spread of Domesticated Plants inSouthwest Asia, Europe, and the Mediterranean Basin, 4th ed.; Oxford University Press: Oxford, UK, 2012; pp. 20–74.
8. Zohary, D.; Hopf, M.; Weiss, E. Pulses. In Domestication of Plants in the Old World: The Origin and Spread of Domesticated Plants inSouthwest Asia, Europe, and the Mediterranean Basin, 4th ed.; Oxford University Press: Oxford, UK, 2012; pp. 75–99.
9. Valamoti, S.M.; Marinova, E.; Heiss, A.G.; Hristova, I.; Petridou, C.; Popova, T.; Michou, S.; Papadopoulou, L.; Chrysostomou, P.;Darcque, P.; et al. Prehistoric cereal foods of southeastern Europe: An archaeobotanical exploration. J. Archaeol. Sci. 2019, 104,97–113. [CrossRef]
10. Longin, C.F.H.; Ziegler, J.; Schweiggert, R.; Koehler, P.; Carle, R.; Wuerschum, T. Comparative study of hulled (einkorn, emmer,and spelt) and naked wheats (durum and bread wheat): Agronomic performance and quality traits. Crop Sci. 2015, 56, 302–311.[CrossRef]
11. Peña-Chocarro, L.; Zapata Peña, L.; Emilio González Urquijo, J.; Ibáñez Estévez, J.J. Einkorn (Triticum monococcum L.) cultivationin mountain communities of the western Rif (Morocco): An ethnoarchaeological project. In From Foragers to Farmers; Fairbairn, A.,Weiss, E., Eds.; Oxbow Books: Oxford, UK, 2009; pp. 104–111.
12. Geisslitz, S.; Wieser, H.; Scherf, K.A.; Koehler, P. Gluten protein composition and aggregation properties as predictors for breadvolume of common wheat, spelt, durum wheat, emmer and einkorn. J. Cereal Sci. 2018, 83, 204–212. [CrossRef]
13. Valamoti, S.M.; Chondrou, D.; Bekiaris, T.; Ninou, I.; Alonso, N.; Bofill, M.; Ivanova, M.; Laparidou, S.; McNamee, C.;Palomo, A.; et al. Plant foods, stone tools and food preparation in prehistoric Europe: An integrative approach in the con-text of ERC funded project PLANTCULT. J. Lithic Stud. 2020, 7, 1–21. [CrossRef]
14. Dimoula, A.; Tsirtsoni, Z.; Yiouni, P.; Stagkidis, I.; Ntinou, M.; Prevost-Dermarkar, S.; Papadopoulou, E.; Valamoti, S.M.Experimental investigation of ceramic technology and plant food cooking in Neolithic northern Greece. STAR Sci. Technol.Archaeol. Res. 2019, 5, 269–286. [CrossRef]
15. Heiss, A.G. Bread. In Archaeology of Food: An Encyclopedia; Metheny, K.B., Beaudry, M.C., Eds.; Rowman & Littlefield: Lanham,MD, USA, 2015; Volume 1, pp. 70–75.
16. Heiss, A.G.; Pouget, N.; Wiethold, J.; Delor-Ahü, A.; Le Goff, I. Tissue-based analysis of a charred flat bread (galette) from aRoman cemetery at Saint-Memmie (Dép. Marne, Champagne-Ardenne, north-eastern France). J. Archaeol. Sci. 2015, 55, 71–82.[CrossRef]
17. Valamoti, S.M.; Petridou, C.; Berihuete-Azorín, M.; Stika, H.-P.; Papadopoulou, L.; Mimi, I. Deciphering ancient ‘recipes’ fromcharred cereal fragments: An integrated methodological approach using experimental, ethnographic and archaeological evidence.J. Archaeol. Sci. 2021, 128, 105347. [CrossRef]
18. Valamoti, S.M.; Jacomet, S.; Stika, H.P.; Heiss, A.G. The PLANTCULT Project: Identifying the plant food cultures of ancientEurope. Antiquity 2017, 91, e9. [CrossRef]
19. Abdel-Aal, E.M.; Hucl, P.; Sosulski, F.W.; Bhirud, P.R. Kernel, milling and baking properties of spring-type spelt and einkornwheats. J. Cereal Sci. 1997, 26, 363–370. [CrossRef]
20. Brandolini, A.; Hidalgo, A.; Moscaritolo, S. Chemical composition and pasting properties of einkorn (Triticum monococcum L.subsp. monococcum) whole meal flour. J. Cereal Sci. 2008, 47, 599–609. [CrossRef]
21. Cooper, R. Re-discovering ancient wheat varieties as functional foods. J. Tradit. Complement. Altern. Med. 2015, 5, 138–143.[CrossRef]
22. Ruibal-Mendieta, N.L.; Delacroix, D.L.; Mignolet, E.; Pycke, J.M.; Marques, C.; Rozenberg, R.; Delzenne, N.M. Spelt (Triticumaestivum ssp. spelta) as a source of breadmaking flours and bran naturally enriched in oleic acid and minerals but not phytic acid.J. Agric. Food Chem. 2005, 53, 2751–2759. [CrossRef]
23. Arzani, A.; Ashraf, M. Cultivated ancient wheats (Triticum spp.): A potential source of health-beneficial food products. Compr. Rev.Food Sci. Food Saf. 2017, 16, 477–488. [CrossRef] [PubMed]
24. Hidalgo, A.; Brandolini, A. Nutritional properties of einkorn wheat (Triticum monococcum L.). J. Sci. Food Agric. 2014, 94, 601–612.[CrossRef] [PubMed]
25. Baik, B.K.; Ullrich, S.E. Barley for food: Characteristics, improvement, and renewed interest. J. Cereal Sci. 2008, 48, 233–242.[CrossRef]
26. Lazaridou, A.; Marinopoulou, A.; Matsoukas, N.P.; Biliaderis, C.G. Impact of flour particle size and autoclaving on β-glucanphysicochemical properties and starch digestibility of barley rusks as assessed by in vitro assays. Bioact. Carbohydr. Diet. Fibre2014, 4, 58–73. [CrossRef]
27. Lazaridou, A.; Marinopoulou, A.; Biliaderis, C.G. Impact of flour particle size and hydrothermal treatment on dough rheologyand quality of barley rusks. Food Hydrocoll. 2019, 87, 561–569. [CrossRef]
28. Boukid, F.; Zannini, E.; Carini, E.; Vittadini, E. Pulses for bread fortification: A necessity or a choice? Trends Food Sci. Technol. 2019,88, 416–428. [CrossRef]
165
Foods 2021, 10, 789
29. Beltrão Martins, R.; Gouvinhas, I.; Nunes, M.C.; Alcides Peres, J.; Raymundo, A.; Barros, A.I. Acorn flour as a source of bioactivecompounds in gluten-free bread. Molecules 2020, 25, 3568. [CrossRef] [PubMed]
30. Seczyk, Ł.; Swieca, M.; Dziki, D.; Anders, A.; Gawlik-Dziki, U. Antioxidant, nutritional and functional characteristics of wheatbread enriched with ground flaxseed hulls. Food Chem. 2017, 214, 32–38. [CrossRef] [PubMed]
31. Watkins, T.R.; Tomeo, A.C.; Struck, M.L.; Palumbo, L.; Bierenbaum, M.L. Improving atherogenic risk factors with flax seed bread.In Developments in Food Science; Charalambous, G., Ed.; Elsevier: Amsterdam, The Netherlands, 1995; Volume 37, pp. 649–658.[CrossRef]
32. Petridou, C. Plant Foods from Prehistoric Greece: An Interdisciplinary Approach. Ph.D. Thesis, School of History and Archaeology,Aristotle University of Thessaloniki, Thessaloniki, Greece. unpublished, thesis in preparation.
33. Bofill, M.; Chondrou, D.; Palomo, A.; Procopiou, H.; Valamoti, S.M. Processing plants for food: Experimental grinding within theERC-project PLANTCULT. J. Lithic Stud. 2020, 7, 1–26. [CrossRef]
34. Karagiannis, G. Fysiko Prozymi; Psihalos Publications: Athens, Greece, 2015. (In Greek)35. Valamoti, S.M.; Fyntikoglou, V.; Symponis, K. Plant Foods of Ancient Greece: An Inquiry into Ancient Texts and Plant Remains until the
Roman Conquest; University Studio Press: Thessaloniki, Greece, unpublished, book in preparation.36. Jones, G. Charred grain from late bronze age Gla, Boiotia. Annu. Br. Sch. Athens 1995, 90, 235–238. [CrossRef]37. Valamoti, S.M. The plant remains from Makriyalos: Preliminary observations. In Neolithic Society in Greece; Hastead, P., Ed.;
Sheffield Academic Press: Sheffield, UK, 1999; pp. 136–138.38. Valamoti, S.M. Plants and People in Late Neolithic and Early Bronze Age Northern Greece: An Archaeobotanical Investigation; British
Archaeological Reports: Oxford, UK, 2004; Volume 1258.39. Borghi, B.; Castagna, R.; Corbellini, M.; Heun, M.; Salamini, F. Breadmaking quality of einkorn wheat (Triticum monococcum ssp.
monococcum). Cereal Chem. 1996, 73, 208–214.40. Corbellini, M.; Empilli, S.; Vaccino, P.; Brandolini, A.; Borghi, B.; Heun, M.; Salamini, F. Einkorn characterization for bread and
cookie production in relation to protein subunit composition. Cereal Chem. 1999, 76, 727–733. [CrossRef]41. Lomolino, G.; Morari, F.; Dal Ferro, N.; Vincenzi, S.; Pasini, G. Investigating the einkorn (Triticum monococcum) and common
wheat (Triticum aestivum) bread crumb structure with X-ray microtomography: Effects on rheological and sensory properties. Int.J. Food Sci. Technol. 2017, 52, 1498–1507. [CrossRef]
42. AACC International. 10–05.01 Rapeseed displacement method. In Approved Methods of the American Association of Cereal Chemists,11th ed.; American Association of Cereal Chemists International: St. Paul, MN, USA, 2010.
43. Oladunmoye, O.O.; Aworh, O.C.; Maziya-Dixon, B.; Erukainure, O.L.; Elemo, G.N. Chemical and functional properties of cassavastarch, durum wheat semolina flour, and their blends. Food Sci. Nutr. 2014, 2, 132–138. [CrossRef] [PubMed]
44. Ahmed, J.; Thomas, L.; Arfat, Y.A. Functional, rheological, microstructural and antioxidant properties of quinoa flour indispersions as influenced by particle size. Food Res. Int. 2019, 116, 302–311. [CrossRef] [PubMed]
45. Biliaderis, C.G. Structural transitions and related physical properties of starch. In Starch, 3rd ed.; BeMiller, J., Whistler, R., Eds.;Academic Press: Cambridge, MA, USA, 2009; pp. 293–372. [CrossRef]
46. Koehler, P.; Wieser, H. Chemistry of Cereal Grains. In Handbook on Sourdough Biotechnology; Gobbetti, M., Gänzle, M., Eds.;Springer: Boston, MA, USA, 2013; pp. 11–45.
47. Flipse, E.; Keetels, C.J.A.M.; Jacobsen, E.; Visser, R.G.F. The dosage effect of the wildtype GBSS allele is linear for GBSSactivity but not for amylose content: Absence of amylose has a distinct influence on the physico-chemical properties of starch.Theor. Appl. Genet. 1996, 92, 121–127. [CrossRef]
48. Biliaderis, C.G.; Maurice, T.J.; Vose, J.R. Starch gelatinization phenomena studied by differential scanning calorimetry. J. Food Sci.1980, 45, 1669–1674. [CrossRef]
49. Biliaderis, C.G.; Grant, D.R.; Vose, J.R. Structural characterization of legume starches. I. Studies on amylose, amylopectin andβ- limit dextrins. Cereal Chem. 1981, 58, 496–502.
50. Ranhotraa, G.S.; Gelrotha, J.A.; Glasera, B.K.; Lorenzb, K.J. Nutrient Composition of Spelt Wheat. J. Food Compos. Anal. 1996, 9,81–84. [CrossRef]
51. Sotomayor, C.; Frias, J.; Fornal, J.; Sadowska, J.; Urbano, G.; Vidal-Valverde, C. Lentil Starch Content and its MicroscopicalStructure as Influenced by Natural Fermentation. Starch 1999, 51, 152–156. [CrossRef]
52. Xu, M.; Jin, Z.; Simsek, S.; Hall, C.; Rao, J.; Chen, B. Effect of germination on the chemical composition, thermal, pasting, andmoisture sorption properties of flours from chickpea, lentil, and yellow pea. Food Chem. 2019, 295, 579–587. [CrossRef] [PubMed]
53. Tester, R.F.; Sommerville, M.D. The effects of non-starch polysaccharides on the extent of gelatinisation, swelling and α-amylasehydrolysis of maize and wheat starches. Food Hydrocoll. 2003, 17, 41–54. [CrossRef]
54. Gobbetti, M.; Corsetti, A.; Rossi, J. The sourdough microflora. Interactions between lactic acid bacteria and yeasts: Metabolism ofcarbohydrates. Appl. Microbiol. Biotechnol. 1994, 41, 456–460. [CrossRef]
55. Corsetti, A. Technology of Sourdough Fermentation and Sourdough Applications. In Handbook on Sourdough Biotechnology;Gobbetti, M., Gänzle, M., Eds.; Springer: Boston, MA, USA, 2013; pp. 85–103. [CrossRef]
56. Harth, H.; Van Kerrebroeck, S.; De Vuyst, L. Community dynamics and metabolite target analysis of spontaneous, backsloppedbarley sourdough fermentations under laboratory and bakery conditions. Int. J. Food Microbiol. 2016, 228, 22–32. [CrossRef][PubMed]
166
Foods 2021, 10, 789
57. Minervini, F.; Celano, G.; Lattanzi, A.; De Angelis, M.; Gobbetti, M. Added ingredients affect the microbiota and biochemicalcharacteristics of durum wheat type-I sourdough. Food Microbiol. 2016, 60, 112–113. [CrossRef]
58. Mirsaeedghazi, H.; Emam-Djomeh, Z.; Mousavi, S.M.A. Rheometric measurement of dough rheological characteristics andfactors affecting it. Int. J. Agric. Biol. 2008, 10, 112–119.
59. Lazaridou, A.; Duta, D.; Papageorgiou, M.; Belc, N.; Biliaderis, C.G. Effects of hydrocolloids on dough rheology and bread qualityparameters in gluten-free formulations. J. Food Eng. 2007, 79, 1033–1047. [CrossRef]
60. Weipert, D. The benefits of basic rheometry in studying dough rheology. Cereal Chem. 1990, 67, 311–317.61. Brennan, C.S.; Cleary, L.J. Utilisation Glucagel® in the β-glucan enrichment of breads: A physicochemical and nutritional
evaluation. Food Res. Int. 2007, 40, 291–296. [CrossRef]62. Izydorczyk, M.S.; Hussain, A.; MacGregor, A.W. Effect of barley and barley components on rheological properties of wheat
dough. J. Cereal Sci. 2001, 34, 251–260. [CrossRef]63. Sharma, P.; Kotari, S.L. Barley: Impact of processing on physicochemical and thermal properties—A review. Food Rev. Int. 2017,
33, 359–381. [CrossRef]64. Beltrão Martins, R.; Nunes, M.C.; Ferreira, L.M.M.; Peres, J.A.; Barros, A.I.R.N.A.; Raymundo, A. Impact of acorn flour on
gluten-free dough rheology properties. Foods 2020, 9, 560. [CrossRef]65. Korus, J.; Witczak, M.; Ziobro, R.; Juszczak, L. The influence of acorn flour on rheological properties of gluten-free dough and
physical characteristics of the bread. Eur. Food Res. Technol. 2015, 240, 1135–1143. [CrossRef]66. Van Bockstaele, F.; De Leyn, I.; Eeckhout, M.; Dewettinck, K. Non-linear creep-recovery measurements as a tool for evaluating the
viscoelastic properties of wheat flour dough. J. Food Eng. 2011, 107, 50–59. [CrossRef]67. Cappelli, A.; Cini, E.; Guerrini, L.; Masella, P.; Angeloni, G.; Parenti, A. Predictive models of the rheological properties and
optimal water content in doughs: An application to ancient grain flours with different degrees of refining. J. Cereal Sci. 2018, 83,229–235. [CrossRef]
68. Guerrini, L.; Parenti, O.; Angeloni, G.; Zanoni, B. The bread making process of ancient wheat: A semi-structured interview tobakers. J. Cereal Sci. 2019, 87, 9–17. [CrossRef]
69. Marpalle, P.; Sonawane, S.K.; Arya, S.S. Effect of flaxseed flour addition on physicochemical and sensory properties of functionalbread. LWT Food Sci. Technol. 2014, 58, 614–619. [CrossRef]
70. Piłat, B.; Zadernowski, R. Physicochemical characteristics of linseed oil and flour. Pol. J. Nat. Sci. 2010, 25, 106–113. [CrossRef]71. Sharma, H.P.; Sharma, S.; Nema, V.P. Physico-chemical and functional properties of flour prepared from native and roasted whole
linseeds. J. Pharmacogn. Phytochem. 2020, 9, 1428–1433.72. Sudha, M.L.; Begum, K.; Ramasarma, P.R. Nutritional characteristics of linseed/flaxseed (Linum usitatissimum) and its application
in muffin making. J. Texture Stud. 2010, 41, 563–578. [CrossRef]73. Yadav, A.; Singh, S.; Yadav, A.; Aman, Z.; Yadav, R.K. Physico-chemical composition of two linseed flour. J. Pharmacogn. Phytochem.
2018, 7, 57–59.74. Nergiz, C.; Ötles, S. The proximate composition and some minor constituents of poppy seeds. J. Sci. Food Agric. 1994, 66, 117–120.
[CrossRef]75. Singh, K.K.; Mridula, D.; Rehal, J.; Barnwal, P. Flaxseed: A potential source of food, feed and fiber. Crit. Rev. Food Sci. 2011, 51,
210–222. [CrossRef]76. Hug-Iten, S.; Handschin, S.; Conde-Petit, B.; Escher, F. Changes in Starch Microstructure on Baking and Staling of Wheat Bread.
LWT Food Sci. Technol. 1999, 32, 255–260. [CrossRef]77. Gray, J.A.; Bemiller, J.N. Bread staling: Molecular basis and control. Compr. Rev. Food Sci. Food Saf. 2003, 2, 1–21. [CrossRef]
[PubMed]78. Vouris, D.G.; Lazaridou, A.; Mandala, I.G.; Biliaderis, C.G. Wheat bread quality attributes using jet milling flour fractions.
LWT Food Sci. Technol. 2018, 92, 540–547. [CrossRef]
167

foods
Article
Diversifying the Utilization of Maize at Household Level inZambia: Quality and Consumer Preferences ofMaize-Based Snacks
Emmanuel Oladeji Alamu 1,2,*, Bukola Olaniyan 2 and Busie Maziya-Dixon 2
Citation: Alamu, E.O.; Olaniyan, B.;
Maziya-Dixon, B. Diversifying the
Utilization of Maize at Household
Level in Zambia: Quality and
Consumer Preferences of
Maize-Based Snacks. Foods 2021, 10,
750. https://doi.org/10.3390/
foods10040750
Academic Editors: Luca Serventi,
Charles Brennan and Rana Mustafa
Received: 16 March 2021
Accepted: 26 March 2021
Published: 1 April 2021
Publisher’s Note: MDPI stays neutral
with regard to jurisdictional claims in
published maps and institutional affil-
iations.
Copyright: © 2021 by the authors.
Licensee MDPI, Basel, Switzerland.
This article is an open access article
distributed under the terms and
conditions of the Creative Commons
Attribution (CC BY) license (https://
creativecommons.org/licenses/by/
4.0/).
1 International Institute of Tropical Agriculture (IITA), Southern Africa Research and AdministrationHub (SARAH) Campus, P.O. Box 310142, Chelstone, Lusaka 10101, Zambia
2 International Institute of Tropical Agriculture (IITA), PMB 5230, Ibadan 20001, Nigeria;[email protected] (B.O.); [email protected] (B.M.-D.)
* Correspondence: [email protected]; Tel.: +260-97633-8710
Abstract: This study evaluated the nutritional, antinutritional properties, and consumer preferencesof five maize-based snacks at the household level. The physical, nutritional, and antinutritionalproperties were analyzed with standard laboratory methods, while a structured questionnaire wasused for the data collection on consumer preferences of the maize products. There were significant(p < 0.05) differences in the proximate parameters of the maize snack samples. Antinutritionalproperties among maize snacks all fell within the permissible range. Respondents from all districtsshowed no significant (p > 0.05) differences in maize chin-chin variants’ and maize finger variants’except for Serenje and Mkushi districts where maize chin-chin and maize finger showed significant(p < 0.05) differences in their sensory ratings. However, across districts, the most rated maize fingervariant was the spiced 100% maize finger. In conclusion, maize-based snacks enriched with soybeanflour have proven nutritious with a reasonable acceptability level.
Keywords: maize snacks; nutritional characterization; consumer preferences
1. Introduction
Maize serves as the nutritional backbone in central, southern, and eastern Zambia [1].It is the main staple, providing 52% of the local population’s daily calorie intake [2]. Maizeis regarded as an economic and political crop in Zambia due to enabling maize productionacross the country [3]. Approximately 80% of Zambian smallholder households and 20% ofcommercial farmers grow maize. Many produce other crops such as cassava, grown mainlyas a food security crop and soybean as a cash crop. However, there has been substantialfinancial input from the Government of Zambia in maize production. In 2006, Zambiaranked 13th among 51 countries prominent for maize production in Africa, with a totalof 0.865 million tons, and this increased to 3.607 million tons by 2016 [4]. According toFAOSTAT [5], Zambia ranked eighth among the top ten maize producing countries insub-Saharan Africa [6]. Despite government interventions in the maize sector, there werecontinuous fluctuations in productivity due to prolonged dry seasons and short rainyseasons [4].
In the bid to increase maize yield in Zambia, improved varieties prominent for grainyield, dry matter, and water usage efficiency in areas of low and erratic rainfall wereintroduced to farmers [1,7]. This was made possible through the collaborative research ofHarvestPlus, International Maize and Wheat Improvement Center (CIMMYT), IITA, theZambia Agriculture Research Institute (ZARI), and other partners who developed maizevarieties with qualities such as high yield, disease resistance, consumer acceptability, andhigh provitamin A carotenoid content [1,8]. The outcome made a positive impact on thefood security status of farm households [1]. However, maize’s household utilization hasbeen limited to traditional products such as “Nshima” and various local beverages that are
Foods 2021, 10, 750. https://doi.org/10.3390/foods10040750 https://www.mdpi.com/journal/foods169
Foods 2021, 10, 750
not nutritious enough for household consumption [9]. The National food price data revealsthat, as the overall cost of food is reducing, foods high in nutrients are more expensive thanstaple foods [10]. Hidden hunger and undernutrition have been public health issues inZambia among children and adults alike [11,12]. A recent study suggested that close to 60%of inpatients at a teaching hospital were at nutritional risk, as pre-admission nutritionalstatus was an associated factor [13].
Furthermore, to combat undernutrition/hidden hunger, most especially Fe and Zndeficiencies, there is a need for swift action such as food-to-food fortification. Regularstaples consumed without adequate protein have contributed to low dietary diversity,so utilizing the available and preferred staple to create diversity in nutrient-dense foodsat an affordable cost is imperative. However, maize is notorious for phytic acid, whichbinds with proteins and essential minerals such as Fe and Zn [14]. Nevertheless, differentprocessing methods usually reduce it to safe levels for humans; furthermore, new maizegermplasms are specifically bred to be low in phytic acid [15]. Thus, product developmentusing maize and legumes (e.g., soybean) can diversify maize’s household utilization.
Legumes are one of the world’s most valuable food supply sources, particularly indeveloping countries where food, energy, and nutrients are of utmost concern [16]. Theyhave been recognized as an essential protein source with maximum advantageous bioactivecompounds such as minerals and fat-soluble vitamins, particularly soybean [17]. Theyare well-laden with sulfur-containing amino acids; the most prominent are Lysine andTryptophan, mostly not found in cereals. They also possess digestible protein [17,18].Soybean is unique due to its ability to adjust to many soils and climates and its nitrogenfixative ability [19]. This ability qualifies it as an ideal rotational crop for nitrogen fixationfor maize crops, especially in a country such as Zambia.
Snacks are convenience foods that have been around for a long time, but demandincreased with urbanization and population [19]. Adebowale and Komolafe [20] reportedvarieties of snacks and dishes produced from maize familiar to the Nigerian populace.Most snacks are made from cereals, but several findings have exposed their low nutrientconcentration [21], which can be made up for by fortification or blending with legumes suchas soybean [22], groundnut [16], African yam bean [17], cowpea [18], and pigeon pea [23];also, defatted coconut has been used in the fortification of maize deep-fried snacks [20].
Zambia produces maize on a relatively large scale, so most of the time, the countryexports the surplus to neighboring countries. Diversifying maize for snack production atthe household level will enhance the maize value chain and improve the nation’s nutritionalstatus. Thus, the study aimed at evaluating the physical, nutritional, and antinutritionalproperties and consumer preferences of five maize-based snacks produced from maizeand soybean.
2. Materials and Methods
2.1. Materials
Maize grains, soybean grains, salt, sugar, margarine, baking powder, and vegetableoil were purchased at local Zambian markets.
2.2. Processing Maize Grain to Flour
Maize flour was produced as described by Adeola et al. [24]. The maize grains weredried, sorted, and cleaned to remove stones, dirt, and infested grains. The cleaned maizewas then milled using a laboratory hammer mill and passed through a 100-micrometermesh sieve.
2.3. Processing Soybean to Flour
The soybean flour was prepared using the methods described by Alamu et al. [25].The grains were cleaned and sorted to eliminate stones and other undesirable materials.The cleaned soybean seeds were roasted slightly at a temperature of about 120 ◦C for 5 minuntil the seed coat was loose and easily removed by hand. The roasted seeds were then
170
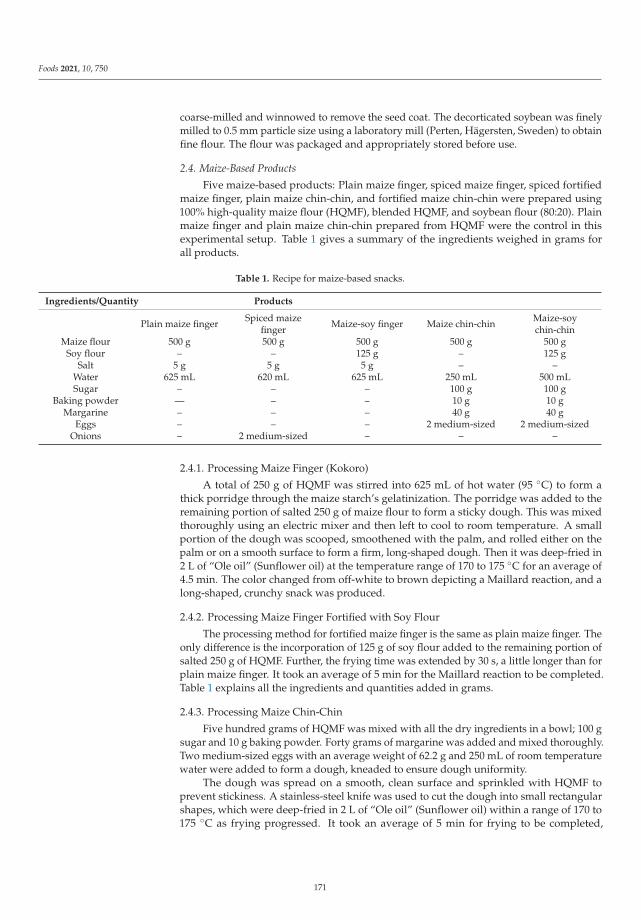
Foods 2021, 10, 750
coarse-milled and winnowed to remove the seed coat. The decorticated soybean was finelymilled to 0.5 mm particle size using a laboratory mill (Perten, Hägersten, Sweden) to obtainfine flour. The flour was packaged and appropriately stored before use.
2.4. Maize-Based Products
Five maize-based products: Plain maize finger, spiced maize finger, spiced fortifiedmaize finger, plain maize chin-chin, and fortified maize chin-chin were prepared using100% high-quality maize flour (HQMF), blended HQMF, and soybean flour (80:20). Plainmaize finger and plain maize chin-chin prepared from HQMF were the control in thisexperimental setup. Table 1 gives a summary of the ingredients weighed in grams forall products.
Table 1. Recipe for maize-based snacks.
Ingredients/Quantity Products
Plain maize finger Spiced maizefinger Maize-soy finger Maize chin-chin Maize-soy
chin-chinMaize flour 500 g 500 g 500 g 500 g 500 g
Soy flour – – 125 g – 125 gSalt 5 g 5 g 5 g – –
Water 625 mL 620 mL 625 mL 250 mL 500 mLSugar – – – 100 g 100 g
Baking powder — – – 10 g 10 gMargarine – – – 40 g 40 g
Eggs – – – 2 medium-sized 2 medium-sizedOnions – 2 medium-sized – – –
2.4.1. Processing Maize Finger (Kokoro)
A total of 250 g of HQMF was stirred into 625 mL of hot water (95 ◦C) to form athick porridge through the maize starch’s gelatinization. The porridge was added to theremaining portion of salted 250 g of maize flour to form a sticky dough. This was mixedthoroughly using an electric mixer and then left to cool to room temperature. A smallportion of the dough was scooped, smoothened with the palm, and rolled either on thepalm or on a smooth surface to form a firm, long-shaped dough. Then it was deep-fried in2 L of “Ole oil” (Sunflower oil) at the temperature range of 170 to 175 ◦C for an average of4.5 min. The color changed from off-white to brown depicting a Maillard reaction, and along-shaped, crunchy snack was produced.
2.4.2. Processing Maize Finger Fortified with Soy Flour
The processing method for fortified maize finger is the same as plain maize finger. Theonly difference is the incorporation of 125 g of soy flour added to the remaining portion ofsalted 250 g of HQMF. Further, the frying time was extended by 30 s, a little longer than forplain maize finger. It took an average of 5 min for the Maillard reaction to be completed.Table 1 explains all the ingredients and quantities added in grams.
2.4.3. Processing Maize Chin-Chin
Five hundred grams of HQMF was mixed with all the dry ingredients in a bowl; 100 gsugar and 10 g baking powder. Forty grams of margarine was added and mixed thoroughly.Two medium-sized eggs with an average weight of 62.2 g and 250 mL of room temperaturewater were added to form a dough, kneaded to ensure dough uniformity.
The dough was spread on a smooth, clean surface and sprinkled with HQMF toprevent stickiness. A stainless-steel knife was used to cut the dough into small rectangularshapes, which were deep-fried in 2 L of “Ole oil” (Sunflower oil) within a range of 170 to175 ◦C as frying progressed. It took an average of 5 min for frying to be completed,
171
Foods 2021, 10, 750
and the product was strained and cooled on a clean flat surface; the result was a sweet,crunchy snack.
2.4.4. Processing Maize-Soy Chin-Chin
The processing is the same as for the plain chin-chin. The fortifier, 125 g of HighQuality Soy flour (HQSF), was added to the maize flour when all other dry ingredientswere added. It took an average frying time of 5 min for the Maillard reaction to becompleted when the frying sample became brown.
2.4.5. Processing Spicy Maize Finger (Kokoro)
The processing follows the same as that for maize finger and maize-soy finger. Thesignificant difference is the addition of two medium-sized onions with an average weightof 63.8 g each as a spice.
2.5. Determination of Nutritional and Physico-Chemical Properties of Maize Snacks
The maize finger, maize-soy finger, maize chin-chin, and maize-soy chin-chin wereanalyzed for moisture, protein, fat, ash, total reducing sugars, total starch, digestible starch,non-digestible starch, amylose, phytate, tannins, pH, bulk density, and color parametersin duplicate
1. Moisture content determination: The pulverized samples were used to determine themoisture content using the method reported by Alamu et al. [25].
2. Ash content determination: The method of AOAC [26] as reported by Alamu et al. [27].3. Protein content determination: The Kjeldahl method was used to determine the
protein content by multiplying the nitrogen value with a conversion factor of 6.25, asdescribed by Alamu et al. [25].
4. Crude fat content determination: The Soxhlet extraction method was used as de-scribed by Alamu et al. [27].
5. Digestible starch and total reducing sugar content determination: Digestible starchand total reducing sugar were determined using the Dubois method [28], as reportedby Alamu et al. [25].
6. Amylose content determination: The adapted method Williams et al. [29] was used todetermine amylose content described by Alamu et al. [25].
7. Carbohydrate content: This was derived by calculating the difference, %CHO = 100—(sum of the percentages of moisture, ash, fat, protein, and crude fiber)
2.6. Determination of Antinutritional Properties of Maize Snacks
1. Phytic acid content: Phytate was determined by the extraction and precipitation ofphytic acid according to Wheeler and Ferrel’s method [30] as described by Okukpe &Adeloye [31].
2. Tannin content determination: Tannins were determined by the method described byda Silva Lins et al. [32].
2.7. Determination of Functional Properties of Maize Snacks
1. pH determination: This was done using 10 g of pulverized maize finger and maizechin-chin dispersed in 20 mL of deionized water to detect the suspension’s pH usinga table-top pH meter [33].
2. Bulk density determination: Bulk density was determined using the method rec-ommended by AOAC [26]. The sample (7 g) was placed into a 50 mL graduatedmeasuring cylinder and then tapped gently against the palm until a constant volumewas obtained.
3. Color parameters: Color measurements were performed on pulverized samples usinga color meter. The color of products was expressed as the average of three L*, a*, andb* readings, where L* stands for brightness, a* redness, a* greenness, b* yellowness,
172
Foods 2021, 10, 750
and b* blueness. A white calibration plate was used to standardize the equipmentbefore color measurements [34].
2.8. Sensory Evaluation and Consumer Preferences of Maize Snacks
The maize finger’ quality attributes made from 100% corn flour, spiced 100% maizefinger, spiced 80:20% maize-soy finger, 100% maize chin-chin, and 80:20% maize-soy chin-chin were assessed by a 30-member sensory panel. The panelists were well trained on thedesired descriptors for all maize products, and all precautions were adhered to strictlybefore the sensory session. Forms were administered, and panelists were asked to scorethe samples using the 9-point hedonic scale for taste, color, crispiness, flavor, and overallacceptability. The scores were ranked and subjected to statistical analysis.
The investigation was conducted in each major maize-growing district (Monze, Katete,Serenje, and Mkushi). The areas were selected based on levels of consumption and acces-sibility. Four hundred and thirteen respondents (413) were available for the survey, with104 respondents in Monze, 109 in Katete, 108 in Serenje, and 92 in Mkushi. They were allrandomly selected. The data was collected using a well-designed questionnaire adminis-tered to each respondent by well-trained enumerators. They were adequately informedabout the study, and an agreement was reached to obtain their consent. The maize-basedproducts were well coded to avoid a mix-up and presented to the participants randomlyaccording to the method described. The sensory attributes chosen were aroma, appearance,taste, texture, and overall acceptability. The attributes of each product were rated byparticipants on a 5-point hedonic scale to measure the degree of likeness using qualitativejudgments that correspond to 1 = dislike very much, 2 = dislike a little, 3 = neither like nordislike, 4 = like a little, 5 = like very much. The sensory testing order was such that productappearance was rated first, then aroma, and finally taste and texture. Clean, potable waterwas supplied to respondents for necessary rinsing of the mouth between one product andanother to be precise with each product’s sensorial attributes [35].
2.9. Statistical Analysis
The data generated on the proximate, functional, and antinutritional properties werestatistically analyzed using IBM SPSS statistical software (Version 21). The data aboutpreference and willingness to consume were subjected to Analysis of Variance (ANOVA) ata 95% level of significance. The differences between means were considered significant atp < 0.05 using the Duncan multiple range test.
3. Results and Discussion
3.1. Nutritional Properties of Deep-Fried Maize-Based Snacks
Table 2 shows the results for nutritional and antinutritional properties of deep-friedmaize-based snacks. All maize snacks’ moisture content was minimal and did not harmthe products’ quality attributes.
The addition of soy flour and eggs caused an increase of about 50% ash content in theproducts. It implies that Fe, Zn, and other minerals contents will be markedly higher in thesoy-fortified maize products than 100% maize products. All products seem to be high in fatcontent, mainly due to deep frying. This could have a negative effect on the storability ofthe products due to unsaturated fatty acid exposure to warm or hot air known as oxidativerancidity [16]. The same trend was observed as reported by [36] that some snacks’ high-fatcontent resulted from the processing techniques that involved the addition of cooking oilsand/or deep-frying.
The protein values obtained for the snacks are significantly (p < 0.05) different. Theaddition of legumes to cereals has been scientifically established to improve its proteinquality [37–39]. Soy flour is rich in sulfur-containing amino acids such as lysine, which isdeficient in maize or eroded. So the addition of soy flour or other legumes enhances maizesnacks’ nutrient content.
173
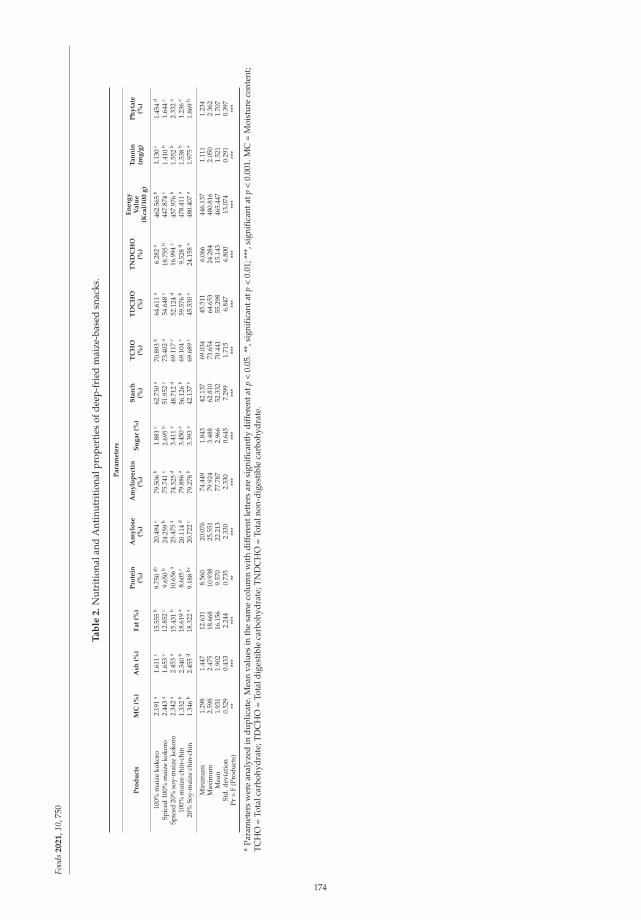
Food
s2
02
1,1
0,75
0
Ta
ble
2.
Nut
riti
onal
and
Ant
inut
riti
onal
prop
erti
esof
deep
-fri
edm
aize
-bas
edsn
acks
.
Pa
ram
ete
rs
Pro
du
cts
MC
(%)
Ash
(%)
Fa
t(%
)P
rote
in(%
)A
my
lose
(%)
Am
ylo
pe
ctin
(%)
Su
ga
r(%
)S
tarc
h(%
)T
CH
O(%
)T
DC
HO
(%)
TN
DC
HO
(%)
En
erg
yV
alu
e(K
cal/
10
0g
)
Ta
nn
in(m
g/g
)P
hy
tate
(%)
100%
mai
zeko
koro
2.19
1a
1.61
1c
15.5
55b
9.75
0ab
20.4
94c
79.5
06b
1.88
1c
62.7
30a
70.8
93b
64.6
11a
6.28
2e
462.
565
b1.
130
c1.
454
d
Spic
ed10
0%m
aize
koko
ro2.
443
a1.
653
c12
.852
c9.
650
b24
.259
b75
.741
c2.
695
b51
.952
c73
.402
a54
.648
c18
.755
b44
7.87
4c
1.41
0b
1.64
4c
Spic
ed20
%so
y-m
aize
koko
ro2.
342
a2.
453
a15
.431
b10
.656
a25
.475
a74
.525
d3.
411
a48
.712
d69
.117
c52
.124
d16
.994
c45
7.97
6b
1.55
2b
2.33
2a
100%
mai
zech
in-c
hin
1.33
2b
2.34
0b
18.6
19a
8.60
5c
20.1
14d
79.8
86a
3.45
0a
56.1
26b
69.1
04c
59.5
76b
9.52
8d
478.
411
a1.
538
b1.
236
e
20%
Soy-
mai
zech
in-c
hin
1.34
6b
2.45
5d
18.3
22a
9.18
8bc
20.7
22c
79.2
78b
3.39
3a
42.1
37e
69.6
89c
45.5
30e
24.1
58a
480.
407
a1.
975
a1.
869
b
Min
imum
1.29
81.
447
12.6
318.
560
20.0
7674
.449
1.84
342
.137
69.0
3445
.511
6.06
644
6.13
71.
111
1.23
4M
axim
um2.
598
2.47
518
.668
10.9
3825
.551
79.9
243.
488
62.8
1073
.654
64.6
5324
.284
480.
816
2.05
02.
362
Mea
n1.
931
1.90
216
.156
9.57
022
.213
77.7
872.
966
52.3
3270
.441
55.2
9815
.143
465.
447
1.52
11.
707
Std.
devi
atio
n0.
529
0.43
32.
244
0.73
52.
330
2.33
00.
645
7.29
91.
715
6.84
76.
800
13.0
740.
291
0.39
7Pr
>F
(Pro
duct
s)**
***
***
****
***
***
***
***
***
***
***
***
***
*
aPa
ram
eter
sw
ere
anal
yzed
indu
plic
ate.
Mea
nva
lues
inth
esa
me
colu
mn
with
diff
eren
tlet
ters
are
sign
ifica
ntly
diff
eren
tatp
<0.
05.*
*,si
gnifi
cant
atp
<0.
01;*
**,s
igni
fican
tatp
<0.
001.
MC
=M
oist
ure
cont
ent;
TCH
O=
Tota
lcar
bohy
drat
e;TD
CH
O=
Tota
ldig
esti
ble
carb
ohyd
rate
;TN
DC
HO
=To
taln
on-d
iges
tibl
eca
rboh
ydra
te.
174
Foods 2021, 10, 750
Furthermore, all products’ amylose content is highly significant at p < 0.001. Researchhas expounded on the importance of amylose in diets. It positively correlates with resistantstarch by slowing down glucose release into the bloodstream, thereby benefiting thosemanaging obesity or hyperinsulinemia [9]. The sugar content across all products has ahigh significance at p < 0.001, with 100% maize finger (kokoro) having the lowest value of1.88% while 100% maize chin-chin has the highest value of 3.45%. The trend observed isthat products fortified with soy flour have an elevated sugar level than their unfortifiedcounterparts. A similar pattern was reported by [24] where the sugar content of kokoroincreased as AYF (African yam bean flour) substitution increased. Another possibility isthat 100% maize chin-chin records a high sugar content due to sucrose as part of the recipe.
The product that has the highest starch content is the 100% maize finger (62.73%),while 20% soy-maize finger and spiced 20% soy-maize finger have the lowest values of42.14% and 48.71%, respectively. Maize is predominantly starch accounting for 60–75%of the kernel, and so the starch content is appreciably reduced when substituted withlegumes such as soybean. This same trend was reported by [24] when 100% of maizekokoro had the highest starch content than other products substituted with AYF. The totalcarbohydrate across the products shows no significant (p > 0.05) difference except 100%maize finger and its spiced variant. This same observation was reported by [16] and [25],who substituted maize snack (kokoro) with partially defatted groundnut paste and cowpeaflour, respectively. The high total carbohydrate values observed for 100% maize fingerand its spiced variant could be from starch hydrolysis. This suggests that the 100% maizeproducts (maize finger and chin-chin) record the highest total digestible carbohydrates.This can be explained by their starch structure with high amylopectin, which resultsin a high degree of branching, a disrupted granular structure of starch, thus increasingits susceptibility to the attack by enzymes and in-vitro digestibility [40]. Although theconsumption of 100% maize products may rapidly boost energy levels, especially when aninstant burst of energy is required, such as during an endurance sporting event, rapidlydigestible carbohydrate is the best choice to make. Therefore, glucose tablets and sportsdrinks are so popular [40].
Nevertheless, there may also be a tendency to raise blood glucose levels, resulting inhyperglycemia in some individuals, particularly those with impaired glucose tolerance [41].Alternatively, maize products fortified with soy flour and the spiced 100% maize fingerhave high values for total non-digestible carbohydrates, with 20% soy-maize chin-chinhaving the highest value of 24.15%. This qualifies the product to fit into the carbohydratesgroup known as resistance starch, generally referred to as dietary fiber. This non-digestiblecarbohydrate is absorbed in the small intestine. It ferments, to some extent, producingshort-chain fatty acids with advantages such as improvements in glycemic control, bowelhealth, and cardiovascular disease prevention [42]. The naturally occurring ones such asverbascose and low molecular weight fructans are found in legumes and onions [40]. Thisjustifies why 20% soy-maize chin-chin has the highest value of 24.15% and the spiced 100%maize finger 18.75%, the second-highest value.
The 20% soy-maize chin-chin has the highest energy value even though there is nosignificant (p > 0.05) energy difference among the products. This agrees with [39], whoreported an increase in the energy value with the increasing proportion of pigeon-peaprotein concentration in maize flour kokoro. Furthermore, protein and fat are usuallyassociated with high calorific values in food. The relatively high-fat content across theproducts resulting from deep-frying contributed immensely to the energy value.
The antinutritional properties across the products show no significant (p > 0.05)differences for tannin and phytate. The lowest value for tannin was observed in 100% maizefinger with a value of 1.13 mg/g, and the highest value observed in 20% soy-maize chin-chin. The products containing soy were observed to have the most tannin concentration,while the highest values for phytate were seen in the spiced 20% soy-maize with a valueof 2.33% and the lowest value of 1.23% observed in 100% maize chin-chin. Tannins areknown to be notorious for reducing the bioavailability of proteins in humans and animals
175
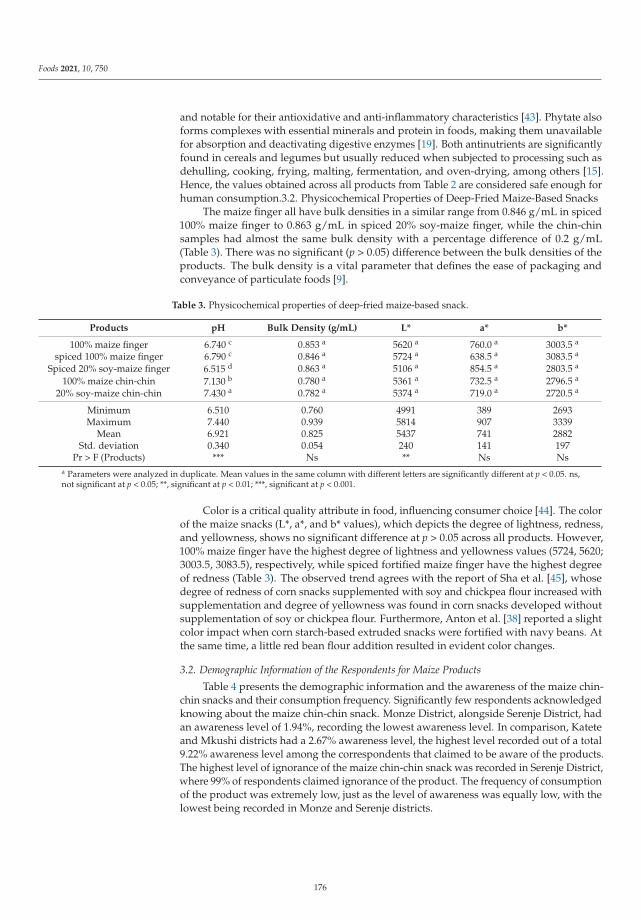
Foods 2021, 10, 750
and notable for their antioxidative and anti-inflammatory characteristics [43]. Phytate alsoforms complexes with essential minerals and protein in foods, making them unavailablefor absorption and deactivating digestive enzymes [19]. Both antinutrients are significantlyfound in cereals and legumes but usually reduced when subjected to processing such asdehulling, cooking, frying, malting, fermentation, and oven-drying, among others [15].Hence, the values obtained across all products from Table 2 are considered safe enough forhuman consumption.3.2. Physicochemical Properties of Deep-Fried Maize-Based Snacks
The maize finger all have bulk densities in a similar range from 0.846 g/mL in spiced100% maize finger to 0.863 g/mL in spiced 20% soy-maize finger, while the chin-chinsamples had almost the same bulk density with a percentage difference of 0.2 g/mL(Table 3). There was no significant (p > 0.05) difference between the bulk densities of theproducts. The bulk density is a vital parameter that defines the ease of packaging andconveyance of particulate foods [9].
Table 3. Physicochemical properties of deep-fried maize-based snack.
Products pH Bulk Density (g/mL) L* a* b*
100% maize finger 6.740 c 0.853 a 5620 a 760.0 a 3003.5 a
spiced 100% maize finger 6.790 c 0.846 a 5724 a 638.5 a 3083.5 a
Spiced 20% soy-maize finger 6.515 d 0.863 a 5106 a 854.5 a 2803.5 a
100% maize chin-chin 7.130 b 0.780 a 5361 a 732.5 a 2796.5 a
20% soy-maize chin-chin 7.430 a 0.782 a 5374 a 719.0 a 2720.5 a
Minimum 6.510 0.760 4991 389 2693Maximum 7.440 0.939 5814 907 3339
Mean 6.921 0.825 5437 741 2882Std. deviation 0.340 0.054 240 141 197
Pr > F (Products) *** Ns ** Ns Nsa Parameters were analyzed in duplicate. Mean values in the same column with different letters are significantly different at p < 0.05. ns,not significant at p < 0.05; **, significant at p < 0.01; ***, significant at p < 0.001.
Color is a critical quality attribute in food, influencing consumer choice [44]. The colorof the maize snacks (L*, a*, and b* values), which depicts the degree of lightness, redness,and yellowness, shows no significant difference at p > 0.05 across all products. However,100% maize finger have the highest degree of lightness and yellowness values (5724, 5620;3003.5, 3083.5), respectively, while spiced fortified maize finger have the highest degreeof redness (Table 3). The observed trend agrees with the report of Sha et al. [45], whosedegree of redness of corn snacks supplemented with soy and chickpea flour increased withsupplementation and degree of yellowness was found in corn snacks developed withoutsupplementation of soy or chickpea flour. Furthermore, Anton et al. [38] reported a slightcolor impact when corn starch-based extruded snacks were fortified with navy beans. Atthe same time, a little red bean flour addition resulted in evident color changes.
3.2. Demographic Information of the Respondents for Maize Products
Table 4 presents the demographic information and the awareness of the maize chin-chin snacks and their consumption frequency. Significantly few respondents acknowledgedknowing about the maize chin-chin snack. Monze District, alongside Serenje District, hadan awareness level of 1.94%, recording the lowest awareness level. In comparison, Kateteand Mkushi districts had a 2.67% awareness level, the highest level recorded out of a total9.22% awareness level among the correspondents that claimed to be aware of the products.The highest level of ignorance of the maize chin-chin snack was recorded in Serenje District,where 99% of respondents claimed ignorance of the product. The frequency of consumptionof the product was extremely low, just as the level of awareness was equally low, with thelowest being recorded in Monze and Serenje districts.
176
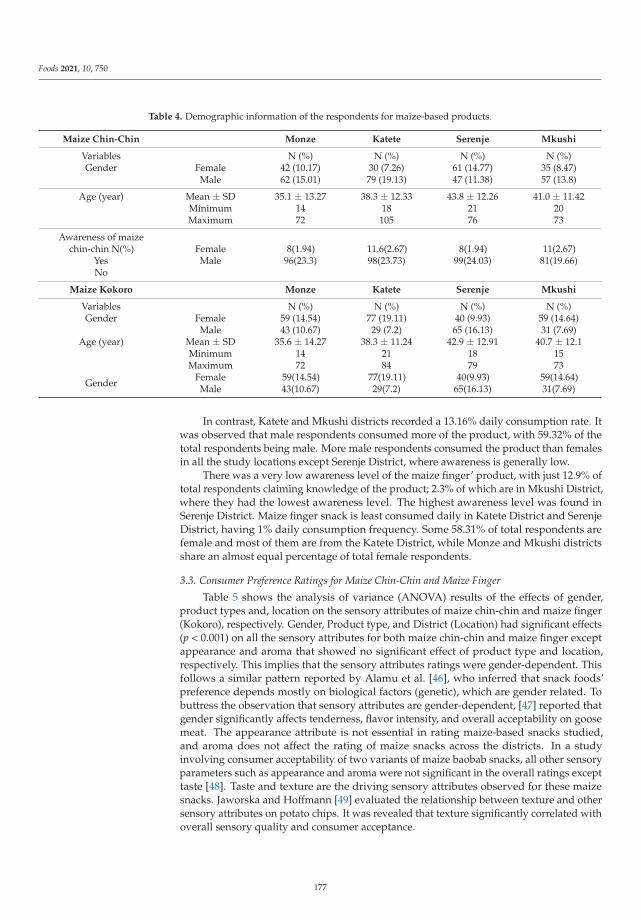
Foods 2021, 10, 750
Table 4. Demographic information of the respondents for maize-based products.
Maize Chin-Chin Monze Katete Serenje Mkushi
Variables N (%) N (%) N (%) N (%)Gender Female 42 (10.17) 30 (7.26) 61 (14.77) 35 (8.47)
Male 62 (15.01) 79 (19.13) 47 (11.38) 57 (13.8)
Age (year) Mean ± SD 35.1 ± 13.27 38.3 ± 12.33 43.8 ± 12.26 41.0 ± 11.42Minimum 14 18 21 20Maximum 72 105 76 73
Awareness of maizechin-chin N(%)
YesNo
FemaleMale
8(1.94)96(23.3)
11.6(2.67)98(23.73)
8(1.94)99(24.03)
11(2.67)81(19.66)
Maize Kokoro Monze Katete Serenje Mkushi
Variables N (%) N (%) N (%) N (%)Gender Female 59 (14.54) 77 (19.11) 40 (9.93) 59 (14.64)
Male 43 (10.67) 29 (7.2) 65 (16.13) 31 (7.69)Age (year) Mean ± SD 35.6 ± 14.27 38.3 ± 11.24 42.9 ± 12.91 40.7 ± 12.1
Minimum 14 21 18 15Maximum 72 84 79 73
Gender FemaleMale
59(14.54)43(10.67)
77(19.11)29(7.2)
40(9.93)65(16.13)
59(14.64)31(7.69)
In contrast, Katete and Mkushi districts recorded a 13.16% daily consumption rate. Itwas observed that male respondents consumed more of the product, with 59.32% of thetotal respondents being male. More male respondents consumed the product than femalesin all the study locations except Serenje District, where awareness is generally low.
There was a very low awareness level of the maize finger’ product, with just 12.9% oftotal respondents claiming knowledge of the product; 2.3% of which are in Mkushi District,where they had the lowest awareness level. The highest awareness level was found inSerenje District. Maize finger snack is least consumed daily in Katete District and SerenjeDistrict, having 1% daily consumption frequency. Some 58.31% of total respondents arefemale and most of them are from the Katete District, while Monze and Mkushi districtsshare an almost equal percentage of total female respondents.
3.3. Consumer Preference Ratings for Maize Chin-Chin and Maize Finger
Table 5 shows the analysis of variance (ANOVA) results of the effects of gender,product types and, location on the sensory attributes of maize chin-chin and maize finger(Kokoro), respectively. Gender, Product type, and District (Location) had significant effects(p < 0.001) on all the sensory attributes for both maize chin-chin and maize finger exceptappearance and aroma that showed no significant effect of product type and location,respectively. This implies that the sensory attributes ratings were gender-dependent. Thisfollows a similar pattern reported by Alamu et al. [46], who inferred that snack foods’preference depends mostly on biological factors (genetic), which are gender related. Tobuttress the observation that sensory attributes are gender-dependent, [47] reported thatgender significantly affects tenderness, flavor intensity, and overall acceptability on goosemeat. The appearance attribute is not essential in rating maize-based snacks studied,and aroma does not affect the rating of maize snacks across the districts. In a studyinvolving consumer acceptability of two variants of maize baobab snacks, all other sensoryparameters such as appearance and aroma were not significant in the overall ratings excepttaste [48]. Taste and texture are the driving sensory attributes observed for these maizesnacks. Jaworska and Hoffmann [49] evaluated the relationship between texture and othersensory attributes on potato chips. It was revealed that texture significantly correlated withoverall sensory quality and consumer acceptance.
177
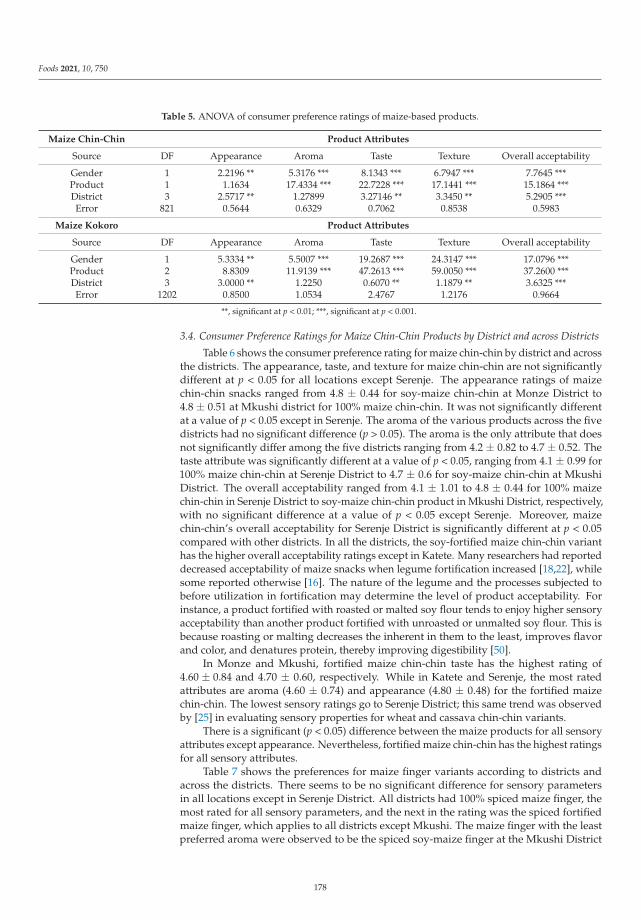
Foods 2021, 10, 750
Table 5. ANOVA of consumer preference ratings of maize-based products.
Maize Chin-Chin Product Attributes
Source DF Appearance Aroma Taste Texture Overall acceptability
Gender 1 2.2196 ** 5.3176 *** 8.1343 *** 6.7947 *** 7.7645 ***Product 1 1.1634 17.4334 *** 22.7228 *** 17.1441 *** 15.1864 ***District 3 2.5717 ** 1.27899 3.27146 ** 3.3450 ** 5.2905 ***Error 821 0.5644 0.6329 0.7062 0.8538 0.5983
Maize Kokoro Product Attributes
Source DF Appearance Aroma Taste Texture Overall acceptability
Gender 1 5.3334 ** 5.5007 *** 19.2687 *** 24.3147 *** 17.0796 ***Product 2 8.8309 11.9139 *** 47.2613 *** 59.0050 *** 37.2600 ***District 3 3.0000 ** 1.2250 0.6070 ** 1.1879 ** 3.6325 ***Error 1202 0.8500 1.0534 2.4767 1.2176 0.9664
**, significant at p < 0.01; ***, significant at p < 0.001.
3.4. Consumer Preference Ratings for Maize Chin-Chin Products by District and across Districts
Table 6 shows the consumer preference rating for maize chin-chin by district and acrossthe districts. The appearance, taste, and texture for maize chin-chin are not significantlydifferent at p < 0.05 for all locations except Serenje. The appearance ratings of maizechin-chin snacks ranged from 4.8 ± 0.44 for soy-maize chin-chin at Monze District to4.8 ± 0.51 at Mkushi district for 100% maize chin-chin. It was not significantly differentat a value of p < 0.05 except in Serenje. The aroma of the various products across the fivedistricts had no significant difference (p > 0.05). The aroma is the only attribute that doesnot significantly differ among the five districts ranging from 4.2 ± 0.82 to 4.7 ± 0.52. Thetaste attribute was significantly different at a value of p < 0.05, ranging from 4.1 ± 0.99 for100% maize chin-chin at Serenje District to 4.7 ± 0.6 for soy-maize chin-chin at MkushiDistrict. The overall acceptability ranged from 4.1 ± 1.01 to 4.8 ± 0.44 for 100% maizechin-chin in Serenje District to soy-maize chin-chin product in Mkushi District, respectively,with no significant difference at a value of p < 0.05 except Serenje. Moreover, maizechin-chin’s overall acceptability for Serenje District is significantly different at p < 0.05compared with other districts. In all the districts, the soy-fortified maize chin-chin varianthas the higher overall acceptability ratings except in Katete. Many researchers had reporteddecreased acceptability of maize snacks when legume fortification increased [18,22], whilesome reported otherwise [16]. The nature of the legume and the processes subjected tobefore utilization in fortification may determine the level of product acceptability. Forinstance, a product fortified with roasted or malted soy flour tends to enjoy higher sensoryacceptability than another product fortified with unroasted or unmalted soy flour. This isbecause roasting or malting decreases the inherent in them to the least, improves flavorand color, and denatures protein, thereby improving digestibility [50].
In Monze and Mkushi, fortified maize chin-chin taste has the highest rating of4.60 ± 0.84 and 4.70 ± 0.60, respectively. While in Katete and Serenje, the most ratedattributes are aroma (4.60 ± 0.74) and appearance (4.80 ± 0.48) for the fortified maizechin-chin. The lowest sensory ratings go to Serenje District; this same trend was observedby [25] in evaluating sensory properties for wheat and cassava chin-chin variants.
There is a significant (p < 0.05) difference between the maize products for all sensoryattributes except appearance. Nevertheless, fortified maize chin-chin has the highest ratingsfor all sensory attributes.
Table 7 shows the preferences for maize finger variants according to districts andacross the districts. There seems to be no significant difference for sensory parametersin all locations except in Serenje District. All districts had 100% spiced maize finger, themost rated for all sensory parameters, and the next in the rating was the spiced fortifiedmaize finger, which applies to all districts except Mkushi. The maize finger with the leastpreferred aroma were observed to be the spiced soy-maize finger at the Mkushi District
178
Foods 2021, 10, 750
with a value of 3.9 ± 1.21, while the product with the most preferred aroma was spiced100% maize finger with a value of 4.4 ± 1.00. The spiced soy-maize had the lowest aromarating due to its characteristic beany flavor [51]. However, the trend observed is that themaize finger product with the lowest overall acceptance level is the 100% maize fingerwith a mean value of 3.9 ± 0.93, 3.7 ± 1.18, and 3.6 ± 0.89, at Monze, Katete, and Serenjedistricts, respectively. This strongly suggests that the inclusion of soy flour positivelyinfluenced the maize finger’ taste. Uzor-Peters et al. [51] reported a similar trend whenthey fortified maize finger with defatted soya cake flour in different ratios of 1:1, 7:3, and9:1. The maize-soy finger at a ratio of 9:1 had the highest rating for all sensory attributes.
The most rated maize finger variant is the spiced 100% maize finger, while the nextin the rating is spiced soy-maize finger. The spice used on these products is onions(Allium cepa L.), a vital vegetable crop used as a spice and food ingredient due to itsscent, taste, and intense flavor [52]. It has been reported to be effective against cardio-vascular disease, hypolipidemic, anti-hypertensive, anti-diabetic, antithrombotic, andanti-hyperhomocysteinemia effects, and many other biological activities such as antimicro-bial, antioxidant, anticarcinogenic, antimutagenic, antiasthmatic, immunomodulatory, andprebiotic activities.
In contrast, the onion’s strong flavor successfully masked the beany flavor associatedwith soy flour used to fortify the spiced soy-maize finger. Thus, the spice’s inclusion servesa dual purpose; improvement of sensory attributes and health-promoting activities.
179
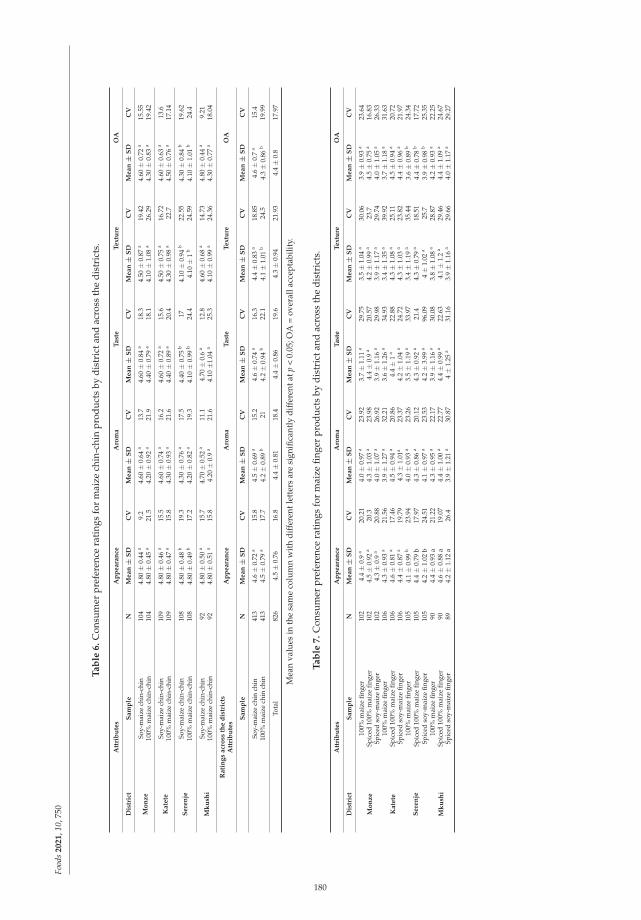
Food
s2
02
1,1
0,75
0
Ta
ble
6.
Con
sum
erpr
efer
ence
rati
ngs
for
mai
zech
in-c
hin
prod
ucts
bydi
stri
ctan
dac
ross
the
dist
rict
s.
Att
rib
ute
sA
pp
ea
ran
ceA
rom
aT
ast
eT
ex
ture
OA
Dis
tric
tS
am
ple
NM
ea
n±
SD
CV
Me
an±
SD
CV
Me
an±
SD
CV
Me
an±
SD
CV
Me
an±
SD
CV
Mo
nz
eSo
y-m
aize
chin
-chi
n10
44.
80±
0.44
a9.
24.
60±
0.64
a13
.74.
60±
0.84
a18
.34.
50±
0.87
a19
.42
4.60
±0.
72a
15.5
510
0%m
aize
chin
-chi
n10
44.
80±
0.45
a21
.54.
20±
0.92
a21
.94.
40±
0.79
a18
.14.
10±
1.08
a26
.29
4.30
±0.
83a
19.4
2
Ka
tete
Soy-
mai
zech
in-c
hin
109
4.80
±0.
46a
15.5
4.60
±0.
74a
16.2
4.60
±0.
72a
15.6
4.50
±0.
75a
16.7
24.
60±
0.63
a13
.610
0%m
aize
chin
-chi
n10
94.
80±
0.47
a15
.84.
30±
0.93
a21
.64.
40±
0.89
a20
.44.
30±
0.98
a22
.74.
50±
0.76
a17
.14
Se
ren
jeSo
y-m
aize
chin
-chi
n10
84.
80±
0.48
b19
.34.
30±
0.76
a17
.54.
40±
0.75
b17
4.10
±0.
94b
22.5
54.
30±
0.84
b19
.62
100%
mai
zech
in-c
hin
108
4.80
±0.
49b
17.2
4.20
±0.
82a
19.3
4.10
±0.
99b
24.4
4.10
±1
b24
.59
4.10
±1.
01b
24.4
Mk
ush
iSo
y-m
aize
chin
-chi
n92
4.80
±0.
50a
15.7
4.70
±0.
52a
11.1
4.70
±0.
6a
12.8
4.60
±0.
68a
14.7
34.
80±
0.44
a9.
2110
0%m
aize
chin
-chi
n92
4.80
±0.
51a
15.8
4.20
±0.
9a
21.6
4.10
±1.0
4a
25.3
4.10
±0.
99a
24.3
64.
30±
0.77
a18
.04
Ra
tin
gs
acr
oss
the
dis
tric
tsA
ttri
bu
tes
Ap
pe
ara
nce
Aro
ma
Ta
ste
Te
xtu
reO
A
Sa
mp
leN
Me
an±
SD
CV
Me
an±
SD
CV
Me
an±
SD
CV
Me
an±
SD
CV
Me
an±
SD
CV
Soy-
mai
zech
inch
in41
34.
6±
0.72
a15
.84.
5±
0.69
a15
.24.
6±
0.74
a16
.34.
4±
0.83
a18
.85
4.6±
0.7
a15
.410
0%m
aize
chin
chin
413
4.5±
0.79
a17
.74.
2±
0.89
b21
4.2±
0.94
b22
.14.
1±
1.01
b24
.54.
3±
0.86
b19
.99
Tota
l82
64.
5±
0.76
16.8
4.4±
0.81
18.4
4.4±
0.86
19.6
4.3±
0.94
21.9
34.
4±
0.8
17.9
7
Mea
nva
lues
inth
esa
me
colu
mn
wit
hdi
ffer
entl
ette
rsar
esi
gnifi
cant
lydi
ffer
enta
tp<
0.05
;OA
=ov
eral
lacc
epta
bilit
y.
Ta
ble
7.
Con
sum
erpr
efer
ence
rati
ngs
for
mai
zefin
ger
prod
ucts
bydi
stri
ctan
dac
ross
the
dist
rict
s.
Att
rib
ute
sA
pp
ea
ran
ceA
rom
aT
ast
eT
ex
ture
OA
Dis
tric
tS
am
ple
NM
ea
n±
SD
CV
Me
an±
SD
CV
Me
an±
SD
CV
Me
an±
SD
CV
Me
an±
SD
CV
Mo
nz
e10
0%m
aize
finge
r10
24.
4±
0.9
a20
.21
4.0±
0.97
a23
.92
3.7±
1.11
a29
.75
3.5±
1.04
a30
.06
3.9±
0.93
a23
.64
Spic
ed10
0%m
aize
finge
r10
24.
5±
0.92
a20
.34.
3±
1.03
a23
.98
4.4±
0.9
a20
.57
4.2±
0.99
a23
.74.
5±
0.75
a16
.83
Spic
edso
y-m
aize
finge
r10
24.
3±
0.9
a20
.88
4.0±
1.07
a26
.92
3.9±
1.16
a29
.98
3.9±
1.17
a29
.74
4.0±
1.05
a26
.33
Ka
tete
100%
mai
zefin
ger
106
4.3±
0.93
a21
.56
3.9±
1.27
a32
.21
3.6±
1.26
a34
.93
3.4±
1.35
a39
.92
3.7±
1.18
a31
.63
Spic
ed10
0%m
aize
finge
r10
64.
6±
0.81
a17
.46
4.5±
0.94
a20
.86
4.4±
1a
22.8
84.
3±
1.08
a25
.11
4.5±
0.94
a20
.72
Spic
edso
y-m
aize
finge
r10
64.
4±
0.87
a19
.79
4.3±
1.01
a23
.37
4.2±
1.04
a24
.72
4.3±
1.03
a23
.82
4.4±
0.96
a21
.97
Se
ren
je10
0%m
aize
finge
r10
54.
1±
0.99
b23
.94
4.0±
0.93
a23
.26
3.5±
1.19
a33
.97
3.4±
1.19
a35
.44
3.6±
0.89
b24
.34
Spic
ed10
0%m
aize
finge
r10
54.
4±
0.79
b17
.97
4.3±
0.86
a20
.12
4.3±
0.92
a21
.44.
3±
0.79
a18
.51
4.4±
0.78
b17
.72
Spic
edso
y-m
aize
finge
r10
54.
2±
1.02
b24
.51
4.1±
0.97
a23
.53
4.2±
3.99
a96
.09
4±
1.02
a25
.73.
9±
0.98
b25
.35
Mk
ush
i
100%
mai
zefin
ger
904.
4±
0.93
a21
.22
4.3±
0.95
a22
.17
3.9±
1.16
a30
.08
3.8±
1.08
a28
.87
4.2±
0.93
a22
.25
Spic
ed10
0%m
aize
finge
r90
4.6±
0.88
a19
.07
4.4±
1.00
a22
.77
4.4±
0.99
a22
.63
4.1±
1.2
a29
.46
4.4±
1.09
a24
.67
Spic
edso
y-m
aize
finge
r89
4.2±
1.12
a26
.43.
9±
1.21
a30
.87
4±
1.25
a31
.16
3.9±
1.16
a29
.66
4.0±
1.17
a29
.27
180
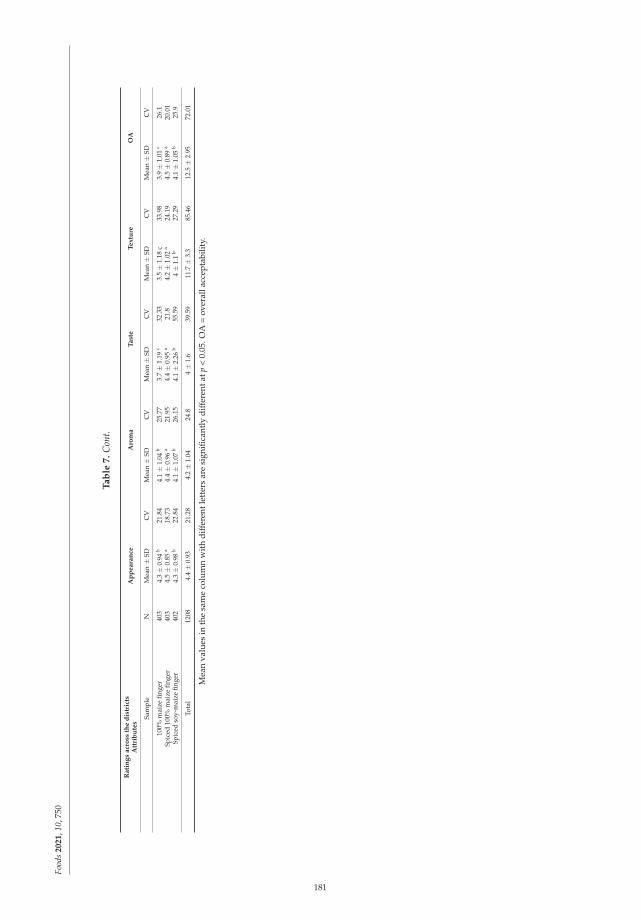
Food
s2
02
1,1
0,75
0
Ta
ble
7.
Con
t.
Ra
tin
gs
acr
oss
the
dis
tric
tsA
ttri
bu
tes
Ap
pe
ara
nce
Aro
ma
Ta
ste
Te
xtu
reO
A
Sam
ple
NM
ean±
SDC
VM
ean±
SDC
VM
ean±
SDC
VM
ean±
SDC
VM
ean±
SDC
V
100%
mai
zefin
ger
403
4.3±
0.94
b21
.84
4.1±
1.04
b25
.77
3.7±
1.19
c32
.33
3.5±
1.18
c33
.98
3.9±
1.01
c26
.1Sp
iced
100%
mai
zefin
ger
403
4.5±
0.85
a18
.73
4.4±
0.96
a21
.95
4.4±
0.95
a21
.84.
2±
1.02
a24
.19
4.5±
0.89
a20
.01
Spic
edso
y-m
aize
finge
r40
24.
3±
0.98
b22
.84
4.1±
1.07
b26
.15
4.1±
2.26
b55
.59
4±
1.1
b27
.29
4.1±
1.05
b25
.9
Tota
l12
084.
4±
0.93
21.2
84.
2±
1.04
24.8
4±
1.6
39.5
911
.7±
3.3
85.4
612
.5±
2.95
72.0
1
Mea
nva
lues
inth
esa
me
colu
mn
wit
hdi
ffer
entl
ette
rsar
esi
gnifi
cant
lydi
ffer
enta
tp<
0.05
.OA
=ov
eral
lacc
epta
bilit
y.
181
Foods 2021, 10, 750
4. Conclusions
Maize snacks have proven to contain high nutritional content whose quality can befurther improved by fortification with soybean flour with a reasonable level of acceptability.This will help to create a diversity of nutrient-dense foods, thereby shrinking the poolof an under-nourished population. Maize chin-chin fortified with 20% soy flour has thehighest acceptability in Monze, Katete, and Mkushi districts. In comparison, the spiced100% maize finger enjoyed the highest acceptability across all districts except in Mkushi,where the spiced soy-maize finger had the least rating for aroma. This indicates that thesoy flour used for fortification may undergo more processing operations or an entirelynew processing method to reduce the beany flavor of soybean. Furthermore, two or morelegumes may be used to fortify more maize products as protein digestibility and availabilitywill be researched. However, it is essential to know that the Zambians’ nutritional statuswill be considerably upgraded.
Thus, maize in nutritious, healthy snacks in Zambia will benefit the maize valuechain’s improvement by placing a higher demand on the produce, thereby increasing itseconomic value and providing job opportunities. There is an urgent need to train farmersand processors to commercialize these relatively new products.
Author Contributions: E.O.A. and B.M.-D. designed the research; E.O.A. conducted the research;B.M.-D. supervised the study; E.O.A. analyzed the data; E.O.A. and B.O. prepared the manuscript,E.O.A., B.O. and B.M.-D. reviewed the manuscript. E.O.A. and B.M.-D. were responsible for thecontents of the paper. All authors have read and agreed to the published version of the manuscript.
Funding: This research received no external funding.
Informed Consent Statement: The participants’ informed consent was obtained verbally and bysigning the informed consent form.
Acknowledgments: The authors acknowledged the support from the African Development Bank(AfDB), CGIAR Maize CRP, CGIAR CRP A4NH, Ministry of Agriculture and Livestock (MoAL),Zambia. In addition, the supports of Prisca Chilese, Ackson Mooya, Jeremiah Hantolo, Sam Ofodile(IITA, Nigeria), and all the field staff were acknowledged.
Conflicts of Interest: The authors declare no conflict of interest.
References
1. Manda, J.; Gardebroek, C.; Kuntashula, E.; Alene, A.D. Impact of improved maize varieties on food security in Eastern Zambia: Adoubly robust analysis. Rev. Dev. Econ. 2018, 22, 1709–1728. [CrossRef]
2. Melkani, A.; Mason, N.M.; Mather, D.L.; Chisanga, B. Smallholder Maize Market Participation and Choice of Marketing Channelin the Presence of Liquidity Constraints: Evidence from Zambia (No. 1879-2020-467); Michigan State University, Department ofAgricultural, Food, and Resource Economics, Feed the Future Innovation Lab for Food Security (FSP). 2019. Available online:http://foodsecuritypolicy.msu.edu/ (accessed on 10 September 2020).
3. Timler, C.; Michalscheck, M.; Alvarez, S.; Descheemaeker, K.; Groot, J.C. Exploring options for sustainable intensification throughlegume integration in different farm types in Eastern Zambia. In Sustainable Intensification in Smallholder Agriculture: An IntegratedSystems Research Approach; Earthscan: London, UK, 2017; pp. 196–209.
4. Amondo, E.; Simtowe, F.; Erenstein, O. Productivity and production risk effects of adopting drought-tolerant maize varieties inZambia. Int. J. Clim. Chang. Strat. Manag. 2019, 11, 570–591. [CrossRef]
5. Duncan, E.G.; O’Sullivan, C.A.; Roper, M.M.; Biggs, J.S.; Peoples, M.B. Influence of co-application of Nitrogen with phosphorus,potassium, and Sulphur on the apparent efficiency of nitrogen fertilizer use, grain yield and protein content of wheat. Field Crop.Res. 2018, 226, 56–65. [CrossRef]
6. FAOSTAT (2014) FAOSTAT. Available online: http://faostat.fao.org (accessed on 4 August 2020).7. Mudenda, E.M.; Phiri, E.; Chabala, L.M.; Sichingabula, H.M. Water use efficiency of maize varieties under rain-Fed conditions in
Zambia. Sustain. Agric. Res. 2017, 6. [CrossRef]8. Menkir, A.; Palacios-Rojas, N.; Alamu, O.; Dias Paes, M.C.; Dhliwayo, T.; Maziya-Dixon, B.; Rocheford, T. Vitamin A-Biofortified
maize: Exploiting Native Genetic Variation for Nutrient Enrichment; (No. 2187-2019-667); CIMMYT.; IITA.; EMBRAPA.; HarvestPlus;Crop Trust: Bonn, Germany, 2018; pp. 1–3.
9. Alamu, E.O.; Ntawuruhunga, P.; Chileshe, P.; Olaniyan, B.; Mukuka, I.; Maziya-Dixon, B. Nutritional quality of fritters producedfrom fresh cassava roots, high-quality cassava and soy flour blends, and consumer preferences. Cogent Food Agric. 2019, 5,1677129.
182
Foods 2021, 10, 750
10. Harris, J.; Chisanga, B.; Drimie, S.; Kennedy, G. Nutrition transition in Zambia: Changing food supply, food prices, householdconsumption, diet and nutrition outcomes. Food Secur. 2019, 11, 371–387. [CrossRef]
11. Farràs, M.; Chandwe, K.; Mayneris-Perxachs, J.; Amadi, B.; Louis-Auguste, J.; Besa, E.; Swann, J.R. Characterizing the metabolicphenotype of intestinal villus blunting in Zambian children with severe acute malnutrition and persistent diarrhea. PLoS ONE2018, 13, e0192092. [CrossRef]
12. Maila, G.; Audain, K.; Marinda, P.A. Association between dietary diversity, health and nutritional status of older persons in ruralZambia. S. Afr. J. Clin. Nut. 2019, 1–6. [CrossRef]
13. Miyoba, N.; Musowoya, J.; Mwanza, E.; Malama, A.; Murambiwa, N.; Ogada, I.; Liswaniso, D. Nutritional risk and associatedfactors of adult inpatients at a teaching hospital in the Copperbelt province in Zambia; A hospital-based cross-sectional study.BMC Nutr. 2018, 4, 1–6.
14. Anaemene, D.I.; Fadupin, G.T. Effect of Fermentation, Germination and Combined Germination-Fermentation ProcessingMethods on the Nutrient and Anti-nutrient Contents of Quality Protein Maize (QPM) Seeds. J. Appl. Sci. Environ. Manag. 2020,24, 1625–1630. [CrossRef]
15. Nissar, J.; Ahad, T.; Naik, H.R.; Hussain, S.Z. A review phytic acid: As antinutrient or nutraceutical. J. Pharm. Phytochem. 2017, 6,1554–1560.
16. Otunola, E.T.; Sunny-Roberts, E.O.; Adejuyitan, J.A.; Famakinwa, A.O. Effects of addition of partially defatted groundnut pasteon some Properties of ‘kokoro’ (a popular snack made from maize paste). Agric. Biol. J. N. Am. 2012, 3, 280–286. [CrossRef]
17. Idowu, A.O. Nutrient composition and sensory properties of ‘kokoro’ (a Nigerian snack) made from Maize and African yambean flour blends. Int. Food Res. J. 2015, 22, 739.
18. Abegunde, T.A.; Bolaji, O.T.; Adeyemo, T.B. Quality evaluation of maize chips (Kokoro) fortified with cowpea flour. Niger. Food J.2014, 32, 97–104. [CrossRef]
19. Ndife, J.; Abasiekong, K.S.; Nweke, B.; Linus-Chibuezeh, A.; Ezeocha, V.C. Production and comparative quality evaluation ofchin-chin snacks from maize, soybean, and orange-fleshed sweet potato flour blends. FUDMA J. Sci. 2020, 4, 300–307. [CrossRef]
20. Adebowale, O.J.; Komolafe, O.M. Effect of supplementation with defatted coconut paste on proximate composition, physical andsensory qualities of a maize-based snack. J. Culin. Sci. Technol. 2018, 16, 40–51. [CrossRef]
21. Akoja, S.S.; Adebowale, O.J.; Makanjuola, O.M.; Salaam, H. Functional properties, nutritional and sensory qualities of maize-based snack (kokoro) supplemented with protein hydrolysate prepared from pigeon pea (Cajanus cajan) seed. J. Culin. Sci. Technol.2017, 15, 306–319. [CrossRef]
22. Adelakun, O.E.; Adejuyitan, J.A.; Olajide, J.O.; Alabi, B.K. Effect of soybean substitution on some physical, compositional, andsensory properties of kokoro (a local maize snack). Eur. Food Res. Technol. 2005, 220, 79–82. [CrossRef]
23. Adegunwa, M.O.; Adeniyi, O.D.; Adebowale, A.A.; Bakare, H.A. Quality Evaluation of Kokoro Produced from Maize–PigeonPea Flour Blends. J. Culin. Sci. Technol. 2015, 13, 200–213. [CrossRef]
24. Adeola, A.A.; Olunlade, B.A.; Ajagunna, A.J. Effect of pigeon pea or soybean substitution for maize on nutritional and sensoryattributes of kokoro. Ann. Sci. Biotechnol. 2011, 2, 61–66.
25. Alamu, E.O.; Maziya-Dixon, B.; Popoola, I.; Gondwe, T.N.P.; Chikoye, D. Nutritional evaluation and consumer preference oflegume fortified maize-meal porridge. J. Food Nutr. Res. 2016, 4, 664–670.
26. AOAC, A. of Official Analytical Chemists. Coffee and tea. In Official Methods of Analysis, 17th ed.; AOAC: Gaithersburg,Maryland, 2000.
27. Alamu, E.O.; Popoola, I.; Maziya-Dixon, B. Effect of Soybean (Glycine max (L.) Merr.) flour inclusion on the nutritional propertiesand consumer preference of fritters for improved household nutrition. Food Sci. Nutr. 2018, 6, 1811–1816. [CrossRef] [PubMed]
28. Dubois, M.; Gilles, K.A.; Hamilton, J.K.; Rebers, P.A.; Smith, F. A colorimetric method for the determination of sugars. Nature1951, 168, 167. [CrossRef]
29. Williams, V.R.; Wu, W.T.; Tsai, H.Y.; Bates, H.G. Varietal differences in amylose content of rice starch. J. Agric. Food Chem. 1958, 6,47–48. [CrossRef]
30. Wheeler, E.L.; Ferrel, R.E. A method for phytic acid determination in wheat and wheat fractions. Cereal Chem. 1971, 48, 312–320.31. Okukpe, K.M.; Adeloye, A.A. Evaluation of the nutritional and antinutritional constituents of some selected browse plants in
Kwara State, Nigeria. Niger Soc. Exp. Biol. J. 2019, 11, 161–165.32. da Silva Lins, T.R.; Braz, R.L.; Silva, T.C.; Araujo, E.C.G.; De Medeiros, J.X.; Reis, C.A. Tannin content of the bark and branch of
Caatinga species. J. Exp. Agric. Int. 2019, 31, 1–8. [CrossRef]33. Rodríguez-Miranda, J.; Ruiz-López, I.I.; Herman-Lara, E.; Martínez-Sánchez, C.E.; Delgado-Licon, E.; Vivar-Vera, M.A. Develop-
ment of extruded snacks using taro (Colocasia esculenta) and nixtamalized maize (Zea mays) flour blends. LWT Food Sci. Technol.2011, 44, 673–680. [CrossRef]
34. Dauda, A.O.; Kayode, R.M.O.; Salami, K.O. Quality Attributes of Snack made from Maize Substituted with Groundnut. Ceylon J.Sci. 2020, 49, 21–27. [CrossRef]
35. Altamore, L.; Ingrassia, M.; Chironi, S.; Columba, P.; Sortino, G.; Vukadin, A.; Bacarella, S. Pasta experience: Eating with the fivesenses-A pilot study. AIMS Agric. Food. 2018, 3, 493–520.
36. Aletor, O.; Ojelabi, A. Comparative evaluation of the nutritive and functional attributes of some traditional Nigerian snacks andoil seed cakes. Pak. J. Nutr. 2007, 6, 99–103.
183
Foods 2021, 10, 750
37. Arise, A.K.; Oyeyinka, S.A.; Dauda, A.O.; Malomo, S.A.; Allen, B.O. Quality evaluation of maize snacks fortified with bambaragroundnut flour. Ann. Food Sci. Technol. 2018, 19, 283–291.
38. Anton, A.A.; Fulcher, R.G.; Arntfield, S.D. Physical and nutritional impact of fortification of corn starch-based extruded snackswith common bean (Phaseolus vulgaris L.) flour: Effects of bean addition and extrusion cooking. Food Chem. 2009, 113, 989–996.[CrossRef]
39. Akoja, S.S.; Ogunsina, T.I. Chemical Composition, Functional and Sensory Qualities of Maize-Based Snacks (Kokoro) Fortifiedwith Pigeon Pea Protein Concentrate. IOSR J. Environ. Sci. Toxicol. Food Technol. 2018, 12, 42–49.
40. Panel on the Definition of Dietary Fiber Staff, Food and Nutrition Board Staff, & Institute of Medicine Staff. Dietary ReferenceIntakes: Proposed Definition of Dietary Fiber: A Report of the Panel on the Definition of Dietary Fiber and the Standing Committee on theScientific Evaluation of Dietary Reference Intakes; National Academy Press: Washington, DC, USA, 2001.
41. Martin, K.E. Glycaemic Response to Varying the Proportions of Starchy Foods and Non-Starchy Vegetables within a Meal: ARandomized Controlled Trial. Ph.D. Thesis, University of Otago, Dunedin, New Zealand, 2017.
42. Alexander, C.; Swanson, K.S.; Fahey, G.C., Jr.; Garleb, K.A. Perspective: Physiologic importance of short-chain fatty acids fromnon-digestible carbohydrate fermentation. Adv. Nutr. 2019, 10, 576–589. [CrossRef]
43. Sharma, K.; Vikas, K.; Jaspreet, K.; Beenu, T.; Ankit, G.R.S.; Yogesh, G.; Ashwani, K. Health effects, sources, utilization and safetyof tannins: A critical review. Toxin Rev. 2019, 1–13. [CrossRef]
44. Pathare, P.B.; Opara, U.L.; Al-Said, F.A.J. Colour measurement and analysis in fresh and processed foods: A review. FoodBioprocess. Technol. 2013, 6, 36–60. [CrossRef]
45. Shah, F.U.H.; Sharif, M.K.; Butt, M.S.; Shahid, M. Development of protein, dietary fiber, and micronutrient enriched extrudedcorn snacks. J. Texture Stud. 2017, 48, 221–230. [CrossRef]
46. Alamu, E.O.; Maziya-Dixon, B.; Olaniyan, B.; Pheneas, N.; Chikoye, D. Evaluation of nutritional properties of cassava-legumessnacks for domestic consumption—Consumer acceptance and willingness to pay in Zambia. AIMS Agric. Food 2020, 5, 500.[CrossRef]
47. Uhlírová, L.; Tumová, E.; Chodová, D.; Vlcková, J.; Ketta, M.; Volek, Z.; Skrivanová, V. The effect of age, genotype and sex oncarcass traits, meat quality and sensory attributes of geese. Asian Australas. J. Anim. Sci. 2018, 31, 421. [CrossRef] [PubMed]
48. Netshishivhe, M.; Omolola, A.O.; Beswa, D.; Mashau, M.E. Physical properties and consumer acceptance of maize-baobab snacks.Heliyon 2019, 5, e01381. [CrossRef] [PubMed]
49. Jaworska, D.; Hoffmann, M. Relative importance of texture properties in the sensory quality and acceptance of commercial crispyproducts. J. Sci. Food Agric. 2008, 88, 1804–1812. [CrossRef]
50. Kavitha, S.; Parimalavalli, R. Effect of processing methods on proximate composition of cereal and legume flours. J. Hum. Nut.Food Sci. 2014, 2, 1051.
51. Uzor-Peters, P.I.; Arisa, N.U.; Lawrence, C.O.; Osondu, N.S.; Adelaja, A. Effect of partially defatted soybeans or groundnut cakeflours on proximate and sensory characteristics of kokoro. Afr. J. Food Sci. 2008, 2, 98–101.
52. Seifu, M.; Tola, Y.B.; Mohammed, A.; Astatkie, T. Effect of variety and drying temperature on physicochemical quality, functionalproperty, and sensory acceptability of dried onion powder. Food Sci. Nutr. 2018, 6, 1641–1649. [CrossRef] [PubMed]
184

MDPISt. Alban-Anlage 66
4052 BaselSwitzerland
Tel. +41 61 683 77 34Fax +41 61 302 89 18
www.mdpi.com
Foods Editorial OfficeE-mail: [email protected]
www.mdpi.com/journal/foods


MDPI
St. Alban-Anlage 66
4052 Basel
Switzerland
Tel: +41 61 683 77 34
Fax: +41 61 302 89 18
www.mdpi.com ISBN 978-3-0365-4450-2
Related Documents