CHEMOMETRICS, PHYSICOCHEMICAL AND SENSORY CHARACTERISTICS OF PEARL MILLET BEVERAGE PRODUCED WITH BIOBURDEN LACTIC ACID BACTERIA PURE CULTURES MMAPHUTI ABASHONE RATAU Thesis submitted in partial fulfilment of the requirements for the degree Master of Food Science and Technology in the Faculty of Applied Sciences at the Cape Peninsula University of Technology Supervisor: Prof. V.A. Jideani Co-supervisor: Dr. V. I. Okudoh Bellville November 2018 CPUT copyright information The thesis may not be published either in part (in scholarly, scientific or technical journals), or as a whole (as a monograph), unless permission has been obtained from the University

Welcome message from author
This document is posted to help you gain knowledge. Please leave a comment to let me know what you think about it! Share it to your friends and learn new things together.
Transcript
CHEMOMETRICS, PHYSICOCHEMICAL AND SENSORY CHARACTERISTICS
OF PEARL MILLET BEVERAGE PRODUCED WITH BIOBURDEN LACTIC ACID
BACTERIA PURE CULTURES
MMAPHUTI ABASHONE RATAU
Thesis submitted in partial fulfilment of the requirements for the degree
Master of Food Science and Technology
in the Faculty of Applied Sciences
at the Cape Peninsula University of Technology
Supervisor: Prof. V.A. Jideani
Co-supervisor: Dr. V. I. Okudoh
Bellville
November 2018
CPUT copyright information
The thesis may not be published either in part (in scholarly, scientific or technical journals),
or as a whole (as a monograph), unless permission has been obtained from the University
ii
DECLARATION
I, Mmaphuti Abashone Ratau, declare that the contents of this thesis represent my own
unaided work, and that the thesis has not previously been submitted for academic
examination towards any qualification. Furthermore, it represents my own opinions and not
necessarily those of the Cape Peninsula University of Technology.
Signed Date
iii
ABSTRACT
The aim of this study was to evaluate the physical, chemical and sensory characteristics of
non-alcoholic pearl millet beverage produced using isolated and purified cultures of
bioburden lactic acid bacteria (LAB). Traditional non-alcoholic pearl millet beverage
(TNAPMB) was produced through spontaneous fermentation. The slurry was fermented for
36 h at 37°C while monitoring the microbial growth at 3 h interval. LAB were grown on
deMan, Rogosa and Sharpe agar and identified using Vitek 2 system. The initial numbers
of LAB were 7.04 log cfu/ml and increased to 8.00 log cfu/ml after 21 h. The beverage was
dominated by LAB and contaminants and their survival was in succession. LAB from the
genera Leuconostoc, Pediococcus, Streptococcus and Enterococcus were the main
fermenting species in TNAPMB. Pearl millet extract (PME) was produced by hydrating
pearl millet flour (PMF) with water (1:10, PMF:Water). To the mixture sprouted rice flour
(10%), ground ginger (10%) and pectin (0.6%) were added. Stable PME was used in the
production of plain non-alcoholic pearl millet beverage (PNAPMB). PME was pasteurized
at 98°C for 30 min, hot filled and cooled to 25°C. The fluid was inoculated with
Leuconostoc mesenteroides, Pediococcus pentosaceus and Enterococcus gallinarum each
at 0.05, 0.075 and 0.1%, respectively, using factorial design and fermented for 18 h at
37°C. The pH of the beverage ranged between pH 3.32 and pH 3.90. L. mesenteroides, P.
pentosaceus, E. gallinarum, the interaction between L. mesenteroides and P. pentosaceus
and the interaction between L. mesentoroides and E. gallinarum had a significant effect (p ˂
0.05) on the pH of PNAPMB except the interaction between P. pentosaceus and E.
gallinarum (p = 0.631). The total titratable acidity (TTA) of the beverage ranged from 0.50 to
0.72%. All cultures had a significant influence (p ˂ 0.05) on the TTA of the beverage with
the exception of the interaction between L. mesenteroides and E. gallinarum (p = 0.102).
However, Monte Carlo simulation showed that E. gallinarum caused an increase in the pH
and a decrease in the TTA of the beverage. During fermentation, the pH of the beverage is
desired to decrease while the TTA increases, hence E. gallinarum was removed. The
interaction between L. mesenteroides and P. pentosaceus at 0.05% and 0.025%,
respectively produced an acceptable PNAPMB with potential for commercialization.
Furthermore, moringa supplemented non-alcoholic pearl millet beverage (MSNAPMB) was
produced by adding 4% of moringa (Moringa oleifera) leaf powder extract during the
production of PNAPMB. The physicochemical, nutritional, microbial (LAB) and sensory
characteristics of the PNAPMB, MSNAPMB and TNAPMB were determined. LAB were
significantly (p < 0.05) affected by the fermentation period and increased from 3.32 to 7.97
log cfu/ml and 3.58 to 8.38 log cfu/ml in PNAPMB and MSNAPMB, respectively. The pH of
iv
PNAPMB decreased from pH 5.05 to pH 4.14 while the pH of MSNAPMB decreased from pH
5.05 to pH 3.65 during the 18 h fermentation. The growth of LAB during fermentation had a
significant effect (p < 0.05) on the pH of the beverages. The TTA increased from 0.14 to
0.22% and increased from 0.17 to 0.38%, in PNAPMB and MSNAPMB, respectively. The
TTA of the beverage was affected significantly (p < 0.05) by the 18 h of fermentation. The
protein content was 1.62, 2.17 and 1.50% in PNAPMB, MSNAPMB and TNAPMB,
respectively. PNAPMB sample was deemed acceptable in comparison to the MSNAPMB.
The total colour difference (∆E) was 5.91 and 10.60 in PNAPMB and MSNAPMB,
respectively in comparison to the TNAPMB. Volatile compounds with beneficial effect such
as anti-inflammatory and anti-pathogenic properties were identified in the beverages.
Principal component analysis indicated that the variations in characteristics of PNAPMB and
MSNAPMB could be explained using total fat, saturated fat, total sugar, ash, moisture,
proteins, chroma (C), hue and b*. The results showed that isolated pure cultures could be
used as starter cultures in the production of non-alcoholic cereal beverages at a commercial
level with predictable quality and safety properties.

v
ACKNOWLEDGEMENTS
This thesis owes its production to the help, support and inspiration of the following people
and institutions:
Prof V.A. Jideani, my supervisor, sincere gratitude for introducing me to the group
(cereals and legumes) and for her support, motivation, patience and guidance.
Dr. V.I. Okudor, my co-supervisor, for his insightful comments, remarks and
encouragement.
Agrifood Technology Station (ATS) for the internship opportunity, which helped me learn
and develop professionally.
Food and Beverages Manufacturing Industry Sector Education and Training Authority
(FoodBev SETA) and National Student Financial Aid Scheme (NSFAS) for financial
assistant in the form of bursary.
Cape Peninsula University of Technology for financial assistant through the University
Research Fund (URF).
Deli Spices for the support, time and materials.
Chemical Engineering Department, at the Cape Peninsula University of Technology, for
allowing me to use the Turbiscan Vertical Scan M.A equipment.
Department of Geology, at the University of Stellenbosch for assistance with Scanning
Electron Microscope.
Mr N. Mshicileli, Mr O. Wilson, Mrs. D.L. Thomas and Mrs L. Cloete, Laboratory
technicians from the Cape Peninsula University of Technology (Food Science and
Technology and Agrifood Technology Station) for their assistance with bookings of
laboratories, purchasing of chemicals and operation of equipment.
Miss Z. Mthethwa, Mr. M. Mendziwa, Miss Z. Hardy, Miss Y. Maphosa, Mr. A.O.
Adebanji, Miss N.E Ndyameni and Miss N. Khuse my colleagues for their assistance,
guidance and assistant with operation of equipment.
Miss A. Pindani who helped me revise and correct my thesis.
vi
DEDICATION
Dedicated to Almighty God and my family, mother Koena Ratau, grandparents, Maphuti and
Mmakoena Ratau, my siblings Shonni, Ayanda, Mmakoena, Shuana, Shomane, Kholofelo,
Kgokologa Ratau and Bohlale Lefophana, my late uncles Keretla Ratau and David Nkwinika,
my late aunt Mmalesiba Ratau, for their love, support and guidance.
vii
CONTENTS
Chapter Page
Declaration ii
Abstract iii
Acknowledgements v
Dedication vi
Glossary xviii
CHAPTER ONE: MOTIVATION AND DESIGN OF THE STUDY 1
1.1 Introduction 1
1.2 Statement of the problem 2
1.3 Research objectives 3
1.3.1 Broad objectives 3
1.3.2 Specific objectives 3
1.4 Research hypotheses 3
1.5 Delimitations of the research 4
1.6 Importance of the study 4
1.7 Expected outcomes 4
1.8 Ethical statement 5
1.9 Thesis outline 5
References 7
CHAPTER TWO: LITERATURE REVIEW 11
2.1 Description of millets 11
2.2 Description of pearl millets 11
2.3 Utilisation and health benefit of pearl millet 13
2.4 World production of millet in comparison to maize and sorghum 15
2.5 Nutritional content of pearl millet 19
2.6 Socioeconomic impact of millet 19
2.7 Changes that occur during fermentation of food 20
2.8 Biochemical changes during fermentation 22
2.9 Types of fermentation models used in the industrial production of
fermented beverages 24
2.10 Factors influencing fermentation process 26
viii
2.11 Fermentation of non-alcoholic cereal beverages 27
2.12 Non-alcoholic cereal beverages in Africa 28
2.13 Importance of fermented beverages in Africa 39
2.14 Trends in the near future of commercialization and production of
non-alcoholic cereal beverages 43
2.15 Chemometrics 43
2.16 Conclusion 44
References 45
CHAPTER THREE: ISOLATION, IDENTIFICATION AND PURIFICATION OF LACTIC ACID
BACTERIA FROM PEARL MILLET SLURRY DURING
FERMENTATION FOR NON-ALCOHOLIC CEREAL BEVERAGE
58
Abstract 58
3.1 Introduction 59
3.2 Materials and Methods 60
3.2.1 Sources of materials and equipment 60
3.2.2 Production of pearl millet flour 60
3.2.3 Production of sprouted rice flour 60
3.2.4 Determination of alpha amylase activity in sprouted rice flour
61
3.2.5 Production of non-alcoholic pearl millet beverage 61
3.2.6 Physicochemical analysis of pearl millet slurry during
fermentation for the production of non-alcoholic pearl millet
beverage 62
3.2.7 Determination of total soluble sugars in pearl millet slurry
during fermentation for the production of non-alcoholic
pearl millet beverage 63
3.2.8 Measurement of cell concentration in pearl millet slurry during
fermentation by optical density 64
3.2.9 Enumeration of bacteria in pearl millet slurry during fermentation
for the production of non-alcoholic pearl millet beverage 64
3.2.10 Isolation and identification of lactic acid bacteria in pearl millet
slurry during fermentation 65
3.2.11 Determination of the generation time of bacteria in pearl millet
ix
slurry during fermentation for the production of non-alcoholic
pearl millet beverage 65
3.2.12 Lactic acid bacteria preparation for scanning electron microscope
images 66
3.2.13 Storage of purified cultures of lactic acid bacteria isolated from pearl
millet slurry during fermentation for the production of non-alcoholic
pearl millet beverage 66
3.3 Data analysis 66
3.4 Results and Discussion 67
3.4.1 Physical, chemical and biological changes in rice grains during
sprouting 67
3.4.2 Effect of fermentation time on the pH and total titratable acidity
of pearl millet slurry during fermentation 69
3.4.3 Effect of fermentation time on the soluble sugar content of
pearl millet slurry during fermentation 71
3.4.4 Effect of fermentation time on the viability of lactic acid bacteria
and total microbes in pearl millet slurry during fermentation 72
3.4.5 Lactic acid bacteria associated with pearl millet slurry 76
3.4.6 Pearson correlation between the total titratable acidity, pH,
total viable count, yeast and mould and
correlated optical density 80
3.4.7 Inherent structural grouping on the basis of fermentation time
using principal component analysis 83
3.5 Conclusion 84
References 85
CHAPTER FOUR: PRODUCTION OF NON-ALCOHOLIC PEARL MILLET BEVERAGE
USING PURIFIED CULTURES OF LACTIC ACID BACTERIA
90
Abstract 90
4.1 Introduction 91
4.2 Materials and Methods 92
4.2.1 Sources of materials and equipment 92
4.2.2 Production of pearl millet extract and effect of hydrocolloid
on the stability of PME 92
x
4.2.3 Determination of the stability of pearl millet extracts 92
4.2.4 Production of stable pearl millet extracts 94
4.2.5 Experimental design for the production of non-alcoholic
pearl millet beverage using purified cultures of lactic
acid bacteria 95
4.2.6 Generalized linear model used to model the effect of each
main and interactive probiotic cultures on the pH, total titratable
acidity and viscosity of the beverage 96
4.2.7 The effect of isolated pure lactic acid bacteria on the
pH, total titratable acidity and viscosity of the beverage 96
4.2.8 Production of non-alcoholic pearl millet beverage 97
4.2.9 Determination of the pH and lactic acid production in pearl millet
beverage 97
4.2.10 Determination of the viscosity of non-alcoholic pearl millet
beverage 97
4.2.11 Monte Carlo simulation of the pH, total titratable acidity
and viscosity produced using pure cultures 98
4.2.12 Data analysis 99
4.3 Results and Discussion 99
4.3.1 Effect of stabilizers on the stability of pearl millet extracts 99
4.3.2 Effect of different lactic acid bacteria on the pH and total titratable
acidity of non-alcoholic pearl millet beverage 105
4.3.3 Effect of different purified lactic acid bacteria on the viscosity
of non-alcoholic pearl millet beverage 112
4.3.4 Non-alcoholic pearl millet beverage produced using pure
cultures of lactic acid bacteria 115
4.3.6 Conclusion 116
References 117
CHAPTER FIVE: PRODUCTION OF PEARL MILLET BEVERAGE USING BIOBURDEN
LACTIC ACID BACTERIA AND ITS PHYSICOCHEMICAL,
NUTRITIONAL AND SENSORY PROPERTIES 120
Abstract 120
5.1 Introduction 121
5.2 Materials and Methods 123
xi
5.2.1 Sources of raw materials and equipment 123
5.2.2 Production of pearl millet flour 123
5.2.3 Preparation of moringa powder extract 123
5.2.4 Production of pearl millet extract, plain non-alcoholic pearl millet
beverage and moringa supplemented non-alcoholic pearl millet
beverage 124
5.2.5 Production of traditional non-alcoholic pearl millet beverage
124
5.2.6 Enumeration of lactic acid bacteria in pearl millet extract during
fermentation of plain and moringa-supplemented non-alcoholic
pearl millet beverages 125
5.2.7 Measurement of cell concentration in pearl millet extract by
optical density during fermentation of plain and moringa-
supplemented non-alcoholic beverages 127
5.2.8 Physicochemical analysis of pearl millet extract during
fermentation of non-alcoholic pearl millet beverages 127
5.2.9 Determination of soluble sugars in pearl millet extract during
fermentation of plain and moringa-supplemented beverages 128
5.2.10 Proximate analyses of plain, moringa-supplemented and
traditional non-alcoholic pearl millet beverages 128
5.2.11 Colour measurement of plain, moringa-supplemented
and traditional beverages 129
5.2.12 Extraction and identification of volatile compounds in PNAPMB,
MSNAPMB and TNAPMB using methanol as a solvent 129
5.2.13 Sensory evaluation of non-alcoholic pearl millet beverages 130
5.2.14 Classification of sentiments during the evaluation of non-alcoholic
pearl millet beverages 132
5.2.15 Data analysis 132
5.3 Results and Discussion 132
5.3.1 Effect of fermentation time on the viability of lactic acid
bacteria (Leuconostoc mesenteroides and Pediococcus
pentoseace) from pearl millet extract during fermentation of plain,
moringa-supplemented non-alcoholic pearl millet beverages 132
5.3.2 Effect of fermentation time on the turbidity of plain and
moringa-supplemented non-alcoholic pearl millet beverages 134
xii
5.3.3 Effect of fermentation time on the pH and total titratable acidity
of pearl millet extract during fermentation of non-alcoholic
pearl millet beverage 135
5.3.4 Effect of fermentation time on the sugar content of pearl millet
extract during fermentation of plain, moringa-supplemented
non-alcoholic beverages 137
5.3.5 Proximate composition of plain, moringa-supplemented and
traditional non-alcoholic beverages 137
5.3.6 Colour difference of plain and moringa-supplemented non-alcoholic
pearl millet beverages in comparison to traditional non-alcoholic pearl
millet beverage 141
5.3.7 Viscosity of plain, moringa-supplemented and traditional non-
alcoholic pearl millet beverages over time at different storage
conditions 141
5.3.8 Characterisation of chemical composition and colour of non-alcoholic
cereal beverages using principal component analysis 142
5.3.9 Volatile compounds in PNAPMB, MSNAPMB and TNAPMB 144
5.3.10 Sensory characteristics of non-alcoholic pearl millet beverages 149
5.3.11 Sensory sentiments for non-alcoholic pearl millet beverages 154
5.3.12 Conclusion 156
References 157
CHAPTER SIX: GENERAL SUMMARY AND CONCLUSION 162
APPENDICES 165
Language and style used in this thesis are in accordance with the requirements of the
International Journal of Food Science and Technology.
xiii
LIST OF FIGURES
Figure Page
1.1 Thesis outline 6
2.1 Pearl millet crops and grains 12
2.2 Rainfall requirements of various crops 13
2.3 Global millet consumption pattern 14
2.4 Production quantities of different millet types across African countries 17
2.5 Average production of cereals in Africa divided by regions between
1992 - 2013 18
3.1 Flow diagram for the production process of non-alcoholic pearl millet beverage
62
3.2 Paddy rice seeds during sprouting 68
3.3 Changes in the pH and total titratable acidity of pearl millet slurry
during fermentation for the production of non-alcoholic pearl millet beverage 70
3.4 Effect of fermentation time on the glucose content in pearl millet slurry
during the preparation of non-alcoholic pearl millet beverage 71
3.5 Bacterial growth curve in fermented pearl millet slurry during the
preparation of non-alcoholic pearl millet beverage 73
3.6 Scanning electron microscopy of bacterial cells isolated from pearl
millet slurry during fermentation for the production of non-alcoholic
pearl millet beverage . 78
3.7 Principal component analysis score plot for non-alcoholic
pearl millet beverage. 84
4.1 Flow diagram indicating the steps used for the production of pearl
millet extract 93
4.2 Flow diagram for the production of non-alcoholic pearl millet beverage 98
4.3 Backscattering profiles of pearl millet extract 100
4.4 Scatterplots showing the effect of lactic acid bacteria on the pH of the
Beverage 107
4.5 Percentage contributions of purified lactic acid bacteria on the pH of
non-alcoholic pearl millet beverage 108
4.6 Scatterplots showing the effect of lactic acid bacteria on the total titratable
acidity of the beverage 111
4.7 Percentage contributions of purified lactic acid bacteria on the total
xiv
titratable acidity of non-alcoholic pearl millet beverage 111
4.8 Effect of lactic acid bacteria on the viscosity of the beverage 114
4.9 Percentage contributions of purified lactic acid bacteria on the viscosity of
non-alcoholic pearl millet beverage 114
5.1 Flow diagram for the production of non-alcoholic pearl millet beverage 125
5.2 Flow diagram for the production of traditional non-alcoholic pearl millet
beverage 126
5.3 Coded non-alcoholic pearl millet beverages served to panellists 131
5.4 Changes in the Lactic acid bacteria (Leuconostoc mesenteroides and
Pediococcus pentoseace) during the fermentation of pearl millet extract
for the production of non-alcoholic pearl millet beverage 133
5.5 Effect of fermentation on the optical density of lactic acid bacteria
during the fermentation of pearl millet extract for the production
of non-alcoholic pearl millet beverage 135
5.6 Changes in the pH and total titratable acidity of pearl millet
extract during fermentation for the production of plain- and moringa-
supplemented non-alcoholic pearl millet beverages 136
5.7 Effect of fermentation time on the sucrose content in pearl millet extract
during the preparation of plain and moringa supplemented non-alcoholic
pearl millet beverages 138
5.8 Non-alcoholic pearl millet beverages 143
5.9 Changes in viscosity of PNAPMB, MSNAPMB and TNAPMB at 5
and 20°C 143
5.10 Principal component analysis score plot for non-alcoholic
pearl millet beverages in terms of their chemical composition and colour 144
5.11 GC-MS chromatogram of methanol extract from NAPMB 148
5.12 Acceptability ratings of sensory attributes of pearl millet beverages 152
5.13 Word cloud based on the comments from panellists 155
xv
LIST OF TABLES
Table Page
2.1 World production of millet in comparison to maize and sorghum 16
2.2. Nutritional composition of pearl millet grains 20
2.3 Types of fermented non-alcoholic beverages from different raw materials
and their names in selected African countries 29
2.4 Lactic acid bacteria associated with the fermentation of non-alcoholic
cereal beverages 31
3.1 Optical density of total cells in pearl millet slurry during fermentation
for the production of NAPMB 75
3.2 Tentative lactic acid bacteria isolated at different times and pH during fermentation
of pearl millet slurry for the preparation of NAPMB 77
3.3 Physiological properties of tentative lactic acid bacteria isolated from
pearl millet slurry during fermentation for the production of NAPMB 81
3.4 Pearson correlation of pH, TTA, LAB, YM and ODcorr of NAPMB 82
4.1 A full factorial design showing the independent variable and their
levels for optimization of pearl millet beverage 95
4.2 Stability of pearl millet extract after 48 h 103
4.3 The generalized linear model for the effects of L. mesenteroides
P. pentosaceus and E. gallinarum and their interaction on the pH
of non-alcoholic pearl millet beverage 106
4.4 The generalized linear model for the effects of L. mesenteroides,
P. pentosaceus and E. gallinarum and their interaction on the total titratable
acidity of non-alcoholic pearl millet beverage 110
4.5 The generalized linear model for the effects of L. mesenteroides,
P. pentosaceus and E. gallinarum and their interaction on the viscosity
of non-alcoholic pearl millet beverage 113
5.1 Proximate composition of PNAPMB, MSNAPMB and TNAPMB 139
5.2 Colour of PNAPMB, MSNAPMB and TNAPMB 142
5.3 Compounds tentatively identified in methanol extract of PNAPMB,
MSNAPMB and TNAPMB 145
5.4 Demography of panellists used in the evaluation of the beverages 150
xvi
APPENDICES
Appendices Page
Appendix A Approved ethics clearance 165
Appendix B Informed consent form signed by volunteers prior tasting 167
Appendix C Score card used to rate the beverages 170
Appendix D Research output presented at national and international conferences
172
Appendix E Manuscripts submitted for publication in peer reviewed journals
174
xvii
GLOSSARY
Terms/Acronyms/
Abbreviations Definition/explanation
∆E Total colour difference
ANC Anaerobic card
GC-MS Gas chromatography mass spectrometry
GP Gram positive cards
HPLC High performance liquid chromatography
MANOVA Multivariate analysis of variance
SRF Sprouted rice flour
MSNAPMB Moringa supplemented non-alcoholic pearl millet beverage
MUFA Monounsaturated fatty acids
NACB Non-alcoholic cereal beverage
NAPMB Non-alcoholic pearl millet beverage
NIST National Institute of Standards and Technology
OD Optical density
ODcorr Correlated optical density
PME Pearl millet extract
PMF Pearl millet flour
PMS Pearl millet slurry
PNAPMB Plain non-alcoholic pearl millet beverage
PUFA Polyunsaturated fatty acids
r Pearson correlation coefficient
SEM Scanning electron microscope
SFA Saturated fatty acids
SMEs Small and medium-sized enterprises
TNAPMB Traditional non-alcoholic pearl millet beverage
TTA Total titratable acidity
X1 Leuconostoc mesenteroides
X2 Pediococcus pentosaceus
X3 Enterococcus gallinarum
1
CHAPTER ONE
MOTIVATION AND DESIGN OF THE STUDY
1.1 Introduction
Pearl millet [Pennisetum glaucum (L) R. Br.] is a cross pollinated cereal crop grown
annually in summer (Guarino, 2012) mainly in tropical regions of Africa and Asia (Nambiar
et al., 2011). Pearl millet grows well in areas susceptible to drought, poor soil fertility, and
extreme temperature (Kajuna, 2001; Oushy, 2008; Basavaraj et al., 2010). The fifth
important cereal crop in the world is pearl millet after rice, wheat, maize, and sorghum
(Nout, 2009; Mathur, 2012) grown in arid and semi-arid areas (Ojediran et al., 2010). The
crop is neglected due to low demand, and or unreliable availability (Basavaraj et al.,
2010). Not much is known about many African foods that are prepared through
fermentation of cereal crops such as pearl millet (Abegaz, 2007).
Fermentation is a metabolic process carried out by microorganisms in which an
organic substance, usually, carbohydrates is broken down resulting in biochemical
changes (desirable and undesirable) and significant food modification (Sahlin, 1999).
Fermentation leads to lower volume of the material to be transported due to food
modification; remove unwanted components; improve the nutritive value and overall
appearance of the food; uses less energy for production and makes food safer (Blandino
et al., 2003). There are two important types of commercial fermentation, namely,
ethanolic and lactic acid fermentations (Abegaz, 2007; Chojnacka, 2011). Ethanolic
fermentation is a process in which sugar inherent in biomass is converted into liquid fuel
such as ethanol (Houghton et al., 2006), a major end product of anaerobic metabolism
carried out by mostly yeast but also of Zymomonas species. This fermentation pathway is
also referred to as alcoholic fermentation (Muller, 2001; Blandino et al., 2003). The major
end product of lactic acid fermentation is lactate (lactic acid) caused by the breakdown of
sugar (usually glucose) by lactic acid bacteria (Muller, 2001). Lactic acid has applications
in food products as a preservative, acidulant and flavourant (Liu, 2003). Lactic acid
fermentation processes are the ancient method used to preserve food for consumption
(Nyanzi & Jooste, 2012). Cereal grains such as maize, sorghum and millet are commonly
used as substrate in Africa for the production of many fermented products such as non-
alcoholic beverages. The most popular non-alcoholic beverage in southern Africa is
Mahewu (Bvochora et al., 1999; Gadaga et al., 1999).
The preparation of many fermented traditional foods especially non-alcoholic
beverages (NAB) is carried out by a mixed population of bacteria and yeast (Gotcheva et
2
al., 2000). Lactic acid bacteria (LAB) such the genera Lactobacillus, Streptococcus,
Pediococcus and Lactococcus produce lactic acid whilst Leuconostoc, Oenococcus,
Weissella and Lactobaccilus can produce lactate, CO2 and ethanol/acetate (Tanguler &
Erten, 2011). LAB are labelled as Generally Recognised as Safe (GRAS) microorganisms
(Chagnaud et al., 2001; Macwana & Muriana, 2012); they are found in fermented and
non-fermented foods and are naturally present as human commensal microflora (Rossetti
& Giraffa, 2005). Their most importance is associated with physiological features that
include substrate utilisation, metabolic capabilities and probiotic properties (Liu et al.,
2011). LAB are divided into two groups depending on the end product of glucose
metabolism, namely, homolactic and heterolactic fermentation. In homolactic
fermentation, lactate is the sole product from glucose metabolism whilst in heterolactic
fermentation; lactates, carbon dioxide and ethanol in equal molar are the end products
(Halasz, 2011; Ongol, 2012). Although different technologies such as cooking, sprouting
and milling are used during cereal processing, fermentation still remains the preferred
method for enhancing the nutritional, sensory and shelf-life properties of food (Coda et al.,
2011).
Chemometrics is the science that design or select the best measurement
procedure and experiments using mathematical and statistical information, to give
maximum chemical information by analyzing multivariate chemical data, and to represent
and show chemical data (Rodionova & Pomerantsev, 2006; Otto, 2007). Chemometrical
methods are applied to develop quantitative and qualitative structural activity relationships
between chemical structure and biological activity (Rodionova & Pomerantsev, 2006; Otto,
2007). Multivariate data analysis refers to the analysis of information with many variables
measured from a number of samples. Thus, chemometric tools are used to find the link
between the samples and variables in a given set of information and convert new
variables not directly observed (Kumar et al., 2014).
1.2 Statement of the Problem
Many of the indigenous foods and non-alcoholic beverages are produced by natural
fermentation (Gotcheva et al., 2000) and the preparation remains household art (Blandino
et al., 2003). This age-long chance inoculation and uncontrolled fermentation process
leads to variations in quality and stability (Sanni et al., 1999; Abegaz, 2007; Ali & Mustafa,
2009; Agarry et al., 2010; Omemu, 2011; Mukisa et al., 2012; Temitope, 2012).
Traditionally, the beverage is prepared in poor hygienic conditions and due to its
nutritional contents is susceptible to microbial growth and metabolism caused by mixed
3
microflora comprising of lactic acid bacteria (LAB), coliforms, yeast and mould (Abegaz,
2007; Ojimelukwe et al., 2013). Consequently, pasteurisation as a feasible preservative
method has been studied (Maji et al., 2011; Ratau, 2011). This has limitations associated
with destruction of probiotic (LAB) microorganisms, which exert health benefits beyond
inherent general nutrition (Prado et al., 2008; Nyanzi & Jooste, 2012). A lot has been
reported in the literature on the types of organisms found in naturally fermented millet
beverage but nothing on the effect of isolated and purified organisms on the properties of
beverage. Hence, the use of isolated and purified cultures of LAB from the chance
fermented beverage will benefit consumers who pay attention to food with health
promoting properties (functional food).
1.3 Research Objectives
1.3.1 Broad objectives
The aim of this study was to evaluate the physicochemical, nutritional and sensory
characteristics of non-alcoholic pearl millet beverage produced using pure cultures of
bioburden lactic acid bacteria.
1.3.2 Specific objectives
The specific objectives of the project were:
1. Isolation and identification of the microorganisms involved in the fermentation of
pearl millet beverage.
2. Obtain pure cultures of lactic acid bacteria involved in the natural fermentation of
pearl millet beverage.
3. Produce a beverage using isolated and purified lactic acid bacteria.
4. Establish the physical, chemical and viscosity properties of the beverage.
5. Establish the sensory properties of the beverage.
1.4 Research Hypotheses
It was hypothesised that:
1. Different types of microorganisms will be involved in the traditional fermentation of
pearl millet.
2. The naturally occurring microorganisms will produce a desirable non-alcoholic
pearl millet beverage.
3. The non-alcoholic pearl millet beverage will be acceptable to consumers.
4
1.5 Delimitations of the Research
Only pearl millet will be used in this study.
1.6 Importance of the Study
Climate change threaten less rain, more heat (projected 2oC rises annually), reduced
water and malnutrition. Pearl millet is a crop that can withstand these challenges, survive
and flourish (MINI, 2009). The production of the non-alcoholic beverage using pearl millet
could provide food for millions of people. There is a widespread level of consumption,
popularity and high demand of the beverage (Gaffa et al., 2002) not only in rural areas
but also urban centres as a result of traditions, commuting and rural migration (Marshall &
Mejia, 2012). The beverage could address the need for non-dairy fermented functional
food ideal for health conscious people. This could expand the growth of small and
medium-sized enterprises (SMEs) through the expansion of probiotic markets and
competitiveness. Other sectors may also benefit by supplying other raw materials and
services such as sugar, spices, transportation etc. Furthermore, the use of indigenous
crops would accelerate growth of the South African market on new brand of fermented
foods and open exports of these products in Africa and all over the world. The production
of the beverage would provide income to the cereal farmers and also offer employment.
The farm employee would also purchase goods within South Africa thus boosting the
economy through tax payments of goods. This would have positive implication on the
country’s food security system. The beverage would serve as a source of fluids, proteins
and energy required for daily manual work. The cereal beverages are popular in Africa
and have potential for export due to migration of African people. This would lead to the
South African economy earning African and international currencies. The availability of
the nutritious cereal beverage on the shelf would also support the convenient life in urban
areas where time and space does not allow the preparation of these indigenous drinks.
Overall, the study will give a better understanding of the beverage fermentation process.
1.7 Expected outcomes
The expected outcomes of this study were:
1. Innovative method for the production of non-alcoholic pearl millet beverage.
2. Non-alcoholic pearl millet beverage produced.
3. A better understanding of the beverage fermentation process.
4. A Master’s degree obtained.
5. At least one manuscript sent for publication in an accredited journal.
5
1.8 Ethical Statement
Ethical clearance was obtained from the Faculty of Health and Wellness Sciences at the
Cape Peninsula University of Technology.
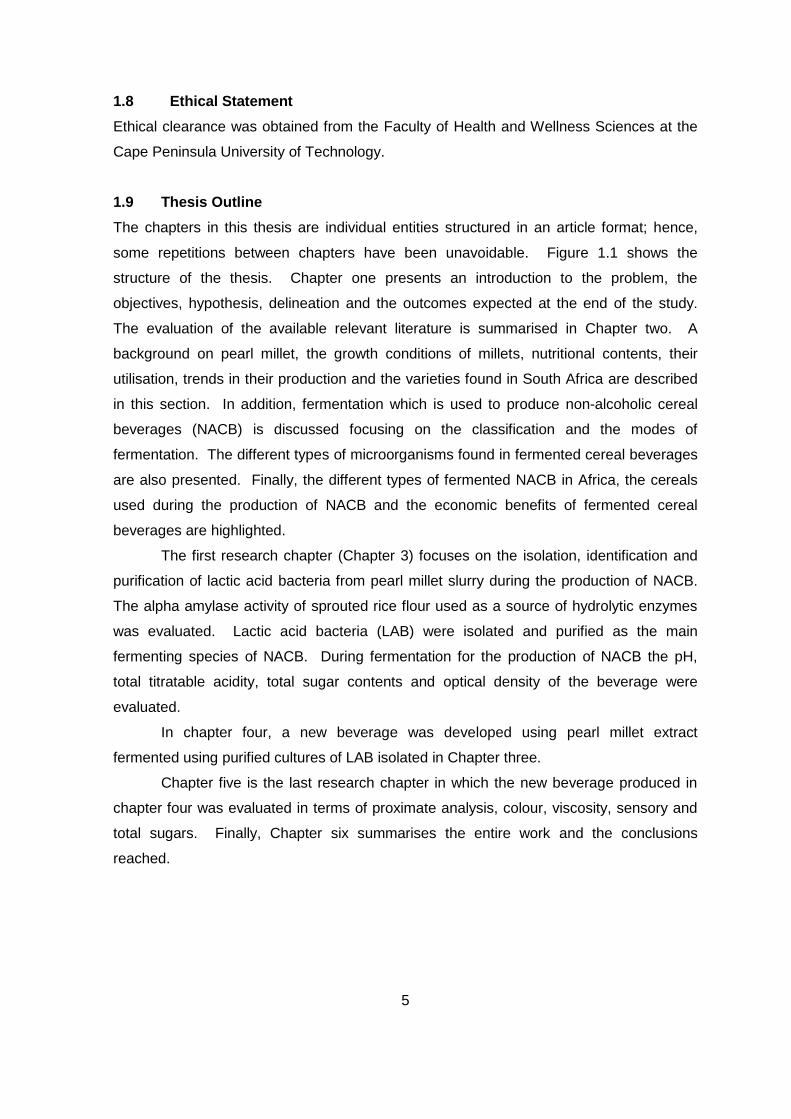
1.9 Thesis Outline
The chapters in this thesis are individual entities structured in an article format; hence,
some repetitions between chapters have been unavoidable. Figure 1.1 shows the
structure of the thesis. Chapter one presents an introduction to the problem, the
objectives, hypothesis, delineation and the outcomes expected at the end of the study.
The evaluation of the available relevant literature is summarised in Chapter two. A
background on pearl millet, the growth conditions of millets, nutritional contents, their
utilisation, trends in their production and the varieties found in South Africa are described
in this section. In addition, fermentation which is used to produce non-alcoholic cereal
beverages (NACB) is discussed focusing on the classification and the modes of
fermentation. The different types of microorganisms found in fermented cereal beverages
are also presented. Finally, the different types of fermented NACB in Africa, the cereals
used during the production of NACB and the economic benefits of fermented cereal
beverages are highlighted.
The first research chapter (Chapter 3) focuses on the isolation, identification and
purification of lactic acid bacteria from pearl millet slurry during the production of NACB.
The alpha amylase activity of sprouted rice flour used as a source of hydrolytic enzymes
was evaluated. Lactic acid bacteria (LAB) were isolated and purified as the main
fermenting species of NACB. During fermentation for the production of NACB the pH,
total titratable acidity, total sugar contents and optical density of the beverage were
evaluated.
In chapter four, a new beverage was developed using pearl millet extract
fermented using purified cultures of LAB isolated in Chapter three.
Chapter five is the last research chapter in which the new beverage produced in
chapter four was evaluated in terms of proximate analysis, colour, viscosity, sensory and
total sugars. Finally, Chapter six summarises the entire work and the conclusions
reached.
6
Figure 1.1 Thesis outline
Chapter Three Chapter Four
Production of
non-alcoholic
pearl millet
beverage using
purified cultures
of lactic acid
bacteria
Chapter Five Chapter Six
Chemometrics and sensory characteristics of pearl millet beverage produced with bioburden lactic acid bacteria pure cultures
Isolation,
identification and
purification of
lactic acid
bacteria from
pearl millet
slurry during
fermentation for
non-alcoholic
cereal beverage
Chapter One Chapter Two
Motivation and
Design of Study Literature
Review Production of
pearl millet
beverage using
bioburden lactic
acid bacteria and
its
physicochemical,
nutritional and
sensory
properties
General
summary and
conclusion
7
References
Abegaz, K. (2007). Isolation, characterization and identification of lactic bacteria involved
in traditional fermentation of borde, an Ethiopian cereal beverage. African Journal
of Biotechnology, 12,1469-1470.
Agarry, O.O., Nkama, I. & Akoma, O. (2010). Production of Kuzun-zaki (a Nigerian
ferment cereal beverage) using starter culture. International Research Journal of
Microbiology, 1(2), 18-25.
Ali, A.A. & Mustafa, M.M. (2009). Isolation, characterisation and identification of lactic acid
bacteria from fermented sorghum dough used in Sudanese Kisra preparation.
Pakistan Journal of Nutrition, 8 (9), 1349-1353.
Basavaraj, G., Rao, P.P., Bhagavatula, S. & Ahmed, W. (2010). Availability and utilisation
of pearl millet in India. Open Access Journal, 8, 1-6.
Blandino, A., Al-Aseeri, M.E.,Cantero, D. & Webb, C. (2003). Cereal-based fermented
foods and beverages. Food Research International, 36, 527-543.
Bvochora, J.M., Reed, J.D., Read, J.S. & Zvauya, R. (1999). Effect of fermentation
process on proanthocyanidins in sorguhm during preparation of Mahewu, a non-
alcoholic bevererage. Process Biochemistry, 35(1-2), 21-25.
Chagnaud, P., Machinis, K., Coutte, L.A., Marecat, A. & Mercenier, A. (2001). Rapid PCR-
based procedure to identify lactic acid bacteria: application to six common
Lactobacillus species. Journal of Microbiology Methods, 44(2). 139-148.
Chojnacka, K. (2011). Fermentation products: Chemical Engineering and Chemical
Process Technology. In: Encyclopedia of Life Support. Vol. 5. Pp. 1-12. Institut
Pasteur de Lille. France
Coda, R., Rizzello, C.G., Trani, A.& Gobbetti, M. (2011). Manufacture and characterisation
of functional emmer beverages fermented emmer beverages fermented by
selected lactic acid bacteria. Food Microbiology, 28, 526-536.
Gadaga, T.H., Mutukumira, A.N., Narvhus, J.A. & Feresu. S. B. (1999). A review of
traditional fermented foods and beverages of Zimbabwe. International Journal of
Food Microbiology, 53, 1-11.
Gaffa, T., Jideani, I.A. & Nkama, I. (2002). Traditional production, consumprion and
storage of Kunu- a non alcoholic cereal beverage. Kluwer Academica Publisher,
57, 73-81.
Gotcheva, V., Pandiella, S.S & Angelov, A., Roshkova, Z.G. & Webb, C. (2000).
Microflora identification of the Bulgarian cereal based fermented beverage boza.
Process Biochemistry, 36, 127-130.
8
Guarino, L. (2012). Global strategy for Ex Situ conservation of pearl millet and its wild
relatives. Global Crop Diversity Trust., Pp.1-89. Bioversity International, New
Delhi.
Halasz, A. (2011). Lactic acid bacteria. Encyclopedia of Life Support Systems: Food
Quality and Standards, Vol. 3. Pp. 1-6.
Houghton, J., Weatherwax, S. & Ferrell, J. (2006). Breaking the biological barriers to
cellulosic ethanol: A joint research agenda. Pp.119-154 . Biofuel Joint Roadmap ,
Maryland.
Kajuna, T. A. (2001.). Millet. 'Post-harvest operations'.(Edited by D. Mejia & B Lewis). Pp.
1-5. Sokole University of Agriculture.
Kumar, N., Bansal, A., Sarma, G. S. & Rawal, R. K. (2014). Chemometrics tools used in
analytical chemistry: An overview. Elsevier, 123, 186-199.
Liu, S., Han, Y. & Zhou, Z. (2011). Lactic acid bacteria in traditional fermented chinese
foods. Food Research International, 44, 643-651.
Liu, S.Q. (2003). Practical implication of lactate and pyruvate metabolism by lactic acid
bacteria in food and beverage fermentation. International Journal of Food
Microbiology, 83, 115-131.
Macwana, S.J. & Muriana, P.M. (2012). A bacteriocin PCR array'for identification of
bactericin-related structural genes in lactic acid bacteria. Journal of Microbiological
Methods, 88(2), 197-204.
Maji, A.A., James, O. & Chigozie, O.E. (2011). Effects of chemical treatment and
pasteurisation on the shelf life of Kunun-zaki (sorghum and maize gruel).
European Journal of Food Research & Review, 1(2), 61-70.
Marshall, E., & Mejia, D. (2012). Traditional fermented food and beverages for improved
livelihoods, Pp. 1-79. Rome: Rural Insfrastructure and Agro-Indutries Division &
FAO.
Mathur, P.N. (2012). Global strategy for the Ex Situ conservation of pearl millet and its
wild relatives. Bioversity International. South Asia.
Millet Network of India [MINI]. (2009). Millets future of food and farming. Pp. 1-16. Decan
Development Society.
Mukisa, I. M., Porcellato, D., Byaruhanga, Y. B., Muyanja, C. M. B. K., Rudi, K., Langsrud,
T. & Narvhus, J. A. (2012). The dominant microbial community associated with
fermentation of Obushera (sorghum and millet beverages) determined by culture-
dependent and culture independent methods. Science: International Journal of
Food Microbiology, 160, 1-10.
9
Muller, V. (2001). Bacterial Fermentation. Encyclopedia of life sciences, Pp. 1-7.
Nambiar, V. S., Dhaduk, J. J., Sareen, N.,Shabu, T. & Desai, R. (2011). Potential fuctional
implications of pearl millet (Pennisetum glaucum) in health and disease. Journal of
Applied Pharmaceutical Science, 1(10), 62-67.
Nout, M.J.R. (2009). Rich nutrition from the poorest- Cereal fermentation in Africa and
Asia. Food Microbiology 26, 685-692.
Nyanzi, R. & Jooste, P.J. (2012). Cereal based functional foods. Intech. Pp. 161-196.
Pretoria: Tshwane university of Technology.
Ojediran, J.O., Adamu, M. A. & Jim-George, D. L. (2010). Some physical properties of
Pearl millet (Pennisetum glaucum) seeds as a function of moisture content. African
Journal of General Agriculture, 6(1), 39-46.
Ojimelukwe, P. Elijah, A., Ekong, U. & Nwokocha, K. (2013). Effect of different
preservatives on the shelf life of Kunu-zaki: A traditional fermented cereal based
non-alcoholic beverage. Nigerian Journal of Agriculture, Food and Environment,
9(1), 76-79.
Omemu, A.M. (2011). Fermentation dynamic during production of Ogi, a Nigerian
fermented cereal porridge. Report and Opinion. 3(4), 9-10.
Ongol, M.P. (2012). Lactic acid bacteria in health and diseases. Rwanda Journal of Health
Sciences, 1(1), 39-50.
Otto, M. (2007). Chemometrics. p. 1. WILEY-VCH Verlag GmbH & Co. KGaA. Weinheim
Oushy, H. (2008). Fact sheet pearl millet. p. 1. NM State University: Afghanistan Water,
Agriculture, and Technology Transfer Program (AWATT).
Prado, F.C., Parada, J.L., Pandey, A. & Soccol, C.R. (2008). Trends in non-dairy probiotic
beverages. Food Research International, 41(2), 111-123.
Ratau, M.A. (2011). Effect of hydrocolloids on the stability and sensory properties of pearl
millet beverage., Pp. 1-60. Department of Food Technology, Cape Peninsula
University of Technology, Cape Town.
Rodionova, O.Y. & Pomerantsev, A.L. (2006). Chemometrics: achievements and
prospects. Russian Academy of Science and Turpion Ltd, 75 (4), 271-287.
Rossetti, L. & Giraffa, G. (2005). Rapid identification of dairy lactic acid bacteria by M13-
generated RAPD_PCR fingerprint databases. Journal of Microbiological Methods,
63, 135-144.
Sahlin, P. (1999). Fermentation as a method of food processing. Licentiate Thesis. Lund
Institude of Technology, Lund University.
10
Sanni, A.I., Onilude, A. A., Fadahunsi, I. F. & Afolabi, R. O. (1999). Microbial deterioration
of traditional alcoholic beverages in Nigeria. Food Research Science, 32, 163-167.
Tanguler, H. & Erten, H. (2011). occurence and growth of lactic acid bacteria species
during the fermentation of shalgan (salgam) a traditional Turkish fermented
beverage. Food Science and Technology, 46, 36-41.
Temitope, O.S. & Taiyese, O.B. (2012). Quality assessment of ‘oti-oka' like beverage
produced from pearl millet. Journal of Applied Biosciences, 51, 3608-3617.
11
CHAPTER TWO
LITERATURE REVIEW
2.1 Description of millets
Millets are cereal crops or grains among the small-seeded species that belong to the
family Poaceae and are usually grown worldwide for food and fodder (Newman et al.,
2010; Ojediran et al., 2010). The crops grow in a wide range of ecological environments
where there is less water (25%), infertile soil and vast dry-land making them the crop
suitable for the changing climate (MINI, 2009). The species of millet that grow widely in
order of cultivation worldwide are pearl millet (Penisetum glaucum), foxtail millet (Setaria
italic), proso millet (Panicum miliaceum) and finger millet (Eleusine coracan) [Ojediran et
al., 2010]. Millet production per species globally is projected at 50% pearl millet, 30%
proso & foxtail, 10% finger millet and 10% for others including Barnyard and kodo millet
(Gramene, 2014).
2.2 Description of pearl millet
Pearl millet is hard in texture when compared to wheat and rice and is grown in areas with
low rainfall (300 – 500 mm) and high temperature (>30⁰C) because of its ability to grow
and survive under continuous or intermittent drought (Jain & Bal, 1997). The crop is
similar to sorghum in terms of development and structure with exceptions that it grows
straight upward, short and an annual crop (Kajuna, 2001). The crop is planted in the
environments of the arid and semi-arid tropical regions of sub-Saharan Africa and Asia
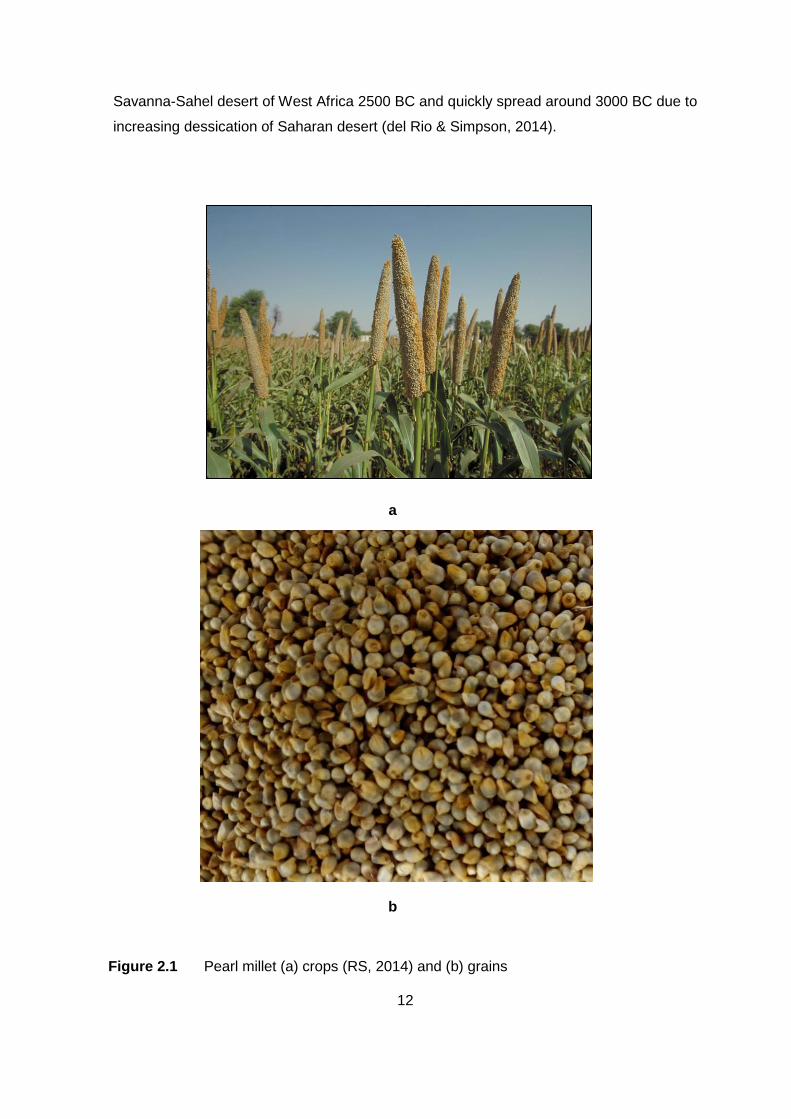
(Sharma et al., 2014). Grains of pearl millet are shaped like a liquid drop. It is smaller in
size when compared to other cereal crops (Obilana, 2013). Figure 2.1 shows pearl millet
crops and grains.
Pearl millet, Pennisetum glaucum (L.) R. Br. belongs to the tribe Paniceae of
family Poaceae (Himeno et al., 2009; ICRISAT, 2014). The crop may grow from 50 to 400
cm tall in size (DPP, 2013). The crop has high yield of grains in comparison to foxtail
millet and can re-grow after harvest if sufficient stubble is left (Lee, 2014). Vernacular
name of the crop include leotja (Pedi - South Africa), mexoeira (Mozambique), mhunga
(Zimbabwe), lebelebele (Botswana), bajra (India), gero (Hausa – Nigeria), hegni (Djerma
– Niger), sanyo (Mali), dukhon (Arabis – Sudan) and mahangu (Namibia – Hausa), cattail
or bulrush (English) [Ratau, 2011; Guarino, 2012; Andreas, 2013; Chitalu, 2013; DPP,
2013]. Pearl millet originated in areas with a lot of grasses and parks at the edge of the
12
Savanna-Sahel desert of West Africa 2500 BC and quickly spread around 3000 BC due to
increasing dessication of Saharan desert (del Rio & Simpson, 2014).
Figure 2.1 Pearl millet (a) crops (RS, 2014) and (b) grains
a
b
13
The crop is consumed as a staple food by more than 500 million people in the sub-
Saharan Africa and Asia where it is grown over 28 million ha of land (DPP, 2011). Pearl
millet is usually known in areas prone to famine since it is reliable to always produce
during harvest although at times the yield may be low (Kajuna, 2001).
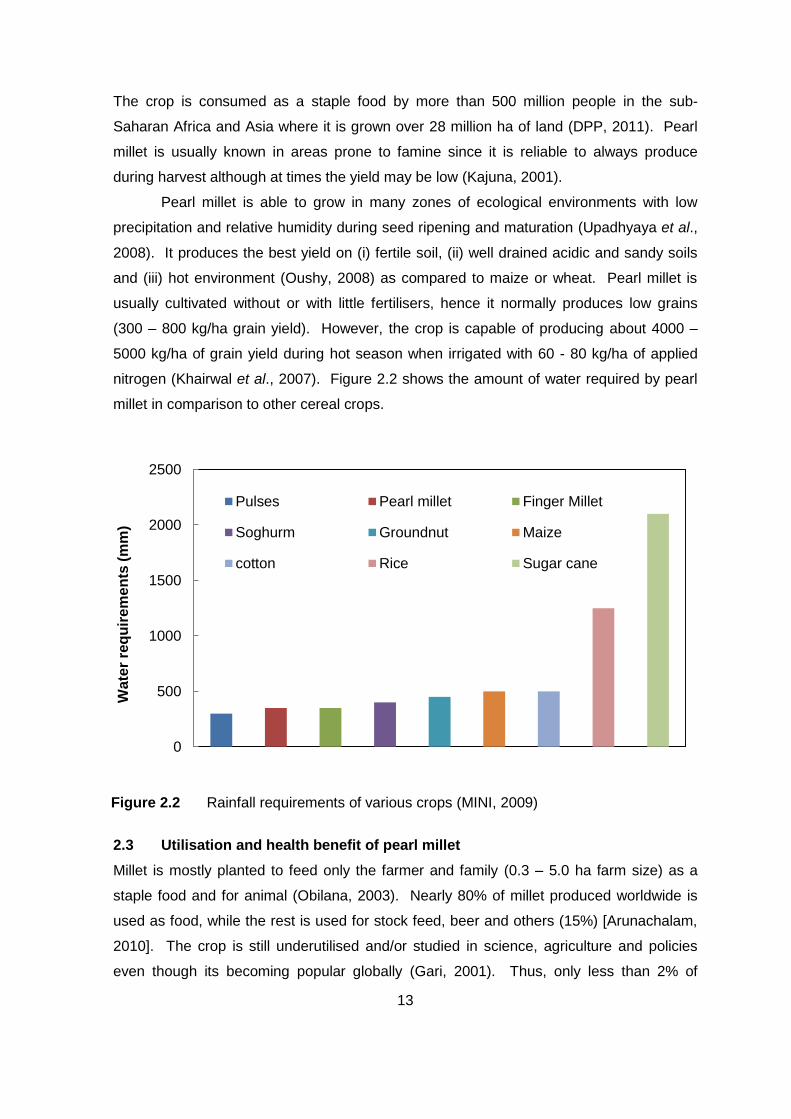
Pearl millet is able to grow in many zones of ecological environments with low
precipitation and relative humidity during seed ripening and maturation (Upadhyaya et al.,
2008). It produces the best yield on (i) fertile soil, (ii) well drained acidic and sandy soils
and (iii) hot environment (Oushy, 2008) as compared to maize or wheat. Pearl millet is
usually cultivated without or with little fertilisers, hence it normally produces low grains
(300 – 800 kg/ha grain yield). However, the crop is capable of producing about 4000 –
5000 kg/ha of grain yield during hot season when irrigated with 60 - 80 kg/ha of applied
nitrogen (Khairwal et al., 2007). Figure 2.2 shows the amount of water required by pearl
millet in comparison to other cereal crops.
2.3 Utilisation and health benefit of pearl millet
Millet is mostly planted to feed only the farmer and family (0.3 – 5.0 ha farm size) as a
staple food and for animal (Obilana, 2003). Nearly 80% of millet produced worldwide is
used as food, while the rest is used for stock feed, beer and others (15%) [Arunachalam,
2010]. The crop is still underutilised and/or studied in science, agriculture and policies
even though its becoming popular globally (Gari, 2001). Thus, only less than 2% of
Figure 2.2 Rainfall requirements of various crops (MINI, 2009)
0
500
1000
1500
2000
2500
Wa
ter
req
uir
em
en
ts (
mm
)
Pulses Pearl millet Finger Millet
Soghurm Groundnut Maize
cotton Rice Sugar cane
14
globally cereal production is millet (Prasad & Staggenborg, 2009). The consumption of
millet by humans has increased slightly in the past years in comparison to the increase in
consumption of other cereals (FAO, 1996). About 90% of the world millet (30 million
tonnes) is used in developing countries and a small portion is used in Russia. Africa has
recorded the highest per capita food consumption of millet among other cereal producing
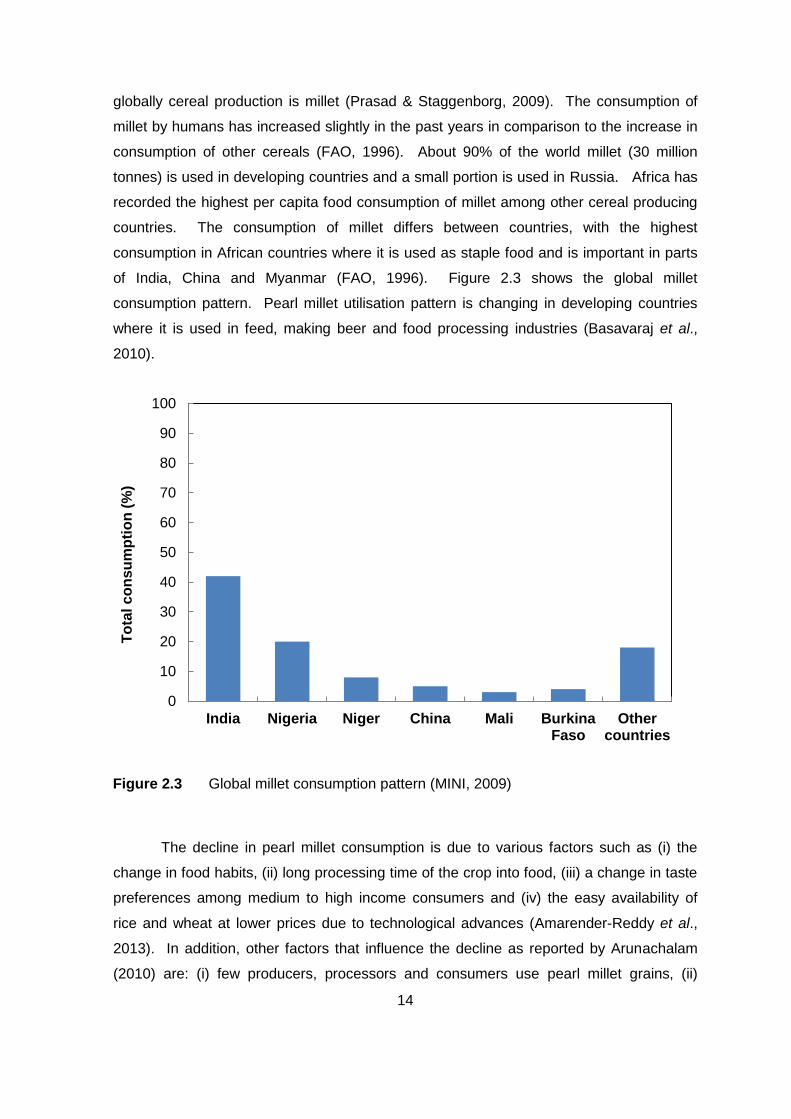
countries. The consumption of millet differs between countries, with the highest
consumption in African countries where it is used as staple food and is important in parts
of India, China and Myanmar (FAO, 1996). Figure 2.3 shows the global millet
consumption pattern. Pearl millet utilisation pattern is changing in developing countries
where it is used in feed, making beer and food processing industries (Basavaraj et al.,
2010).
The decline in pearl millet consumption is due to various factors such as (i) the
change in food habits, (ii) long processing time of the crop into food, (iii) a change in taste
preferences among medium to high income consumers and (iv) the easy availability of
rice and wheat at lower prices due to technological advances (Amarender-Reddy et al.,
2013). In addition, other factors that influence the decline as reported by Arunachalam
(2010) are: (i) few producers, processors and consumers use pearl millet grains, (ii)
0
10
20
30
40
50
60
70
80
90
100
India Nigeria Niger China Mali BurkinaFaso
Othercountries
To
tal c
on
su
mp
tio
n (
%)
Figure 2.3 Global millet consumption pattern (MINI, 2009)
15
storage costs due to limited usage, (iii) reaping, winnowing and processing by women at
household level, and (iv) slow and emerging trend in industrial use. However, pearl millet
has medicinal benefits compared to other cereal grains such as wheat, sorghum or maize
that includes: (i) suitability for gluten intolerant and diabetic individuals, (ii) relief of severe
constipation and stomach ulcers, (iii) lowering of cholesterol level due to its phytic acid
and niacin content, (iv) lowering the risk of some cancer (inhibit tumour development), (v)
rich in fibre content, and the wholegrain helps support weight loss, (vi) help in bone
development due its phosphorus content, (vii) have antioxidant activity due its lignin and
phytonutrients content (help with heart health) and (viii) has magnesium which helps
alleviate respiratory problems such as asthma (Malik, 2015).
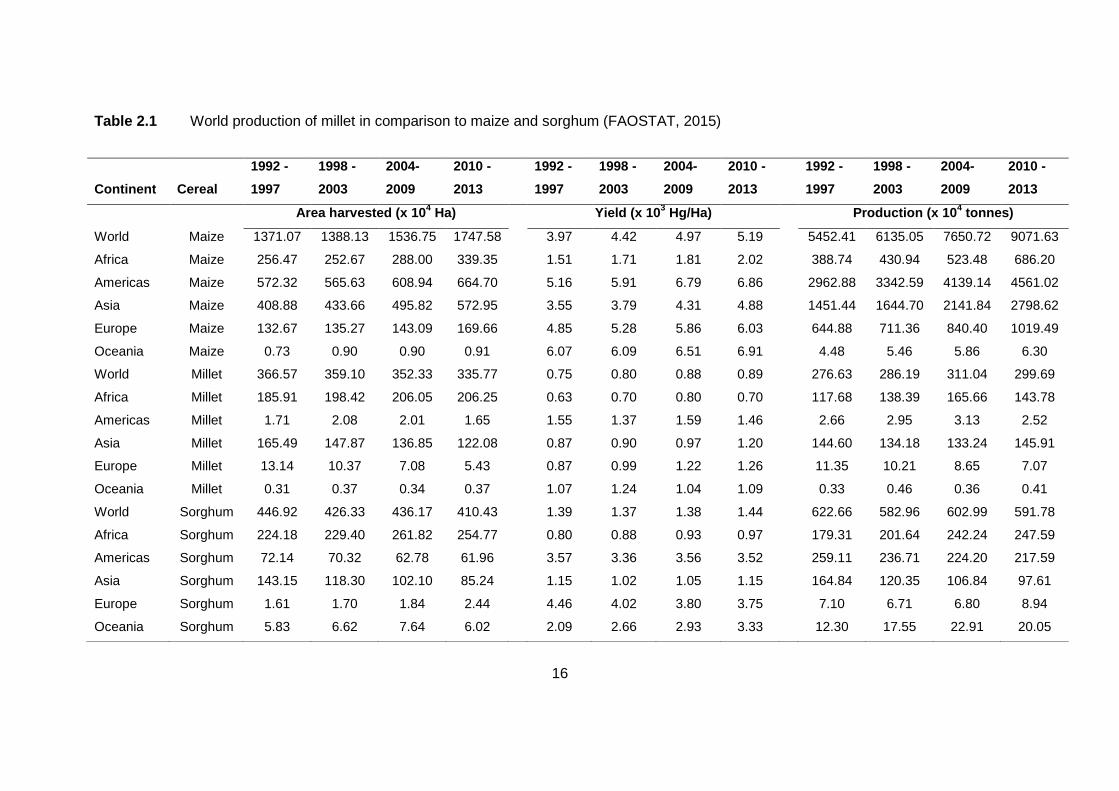
2.4 World production of millet in comparison to maize and sorghum
The highest global producer of millet is India followed by Nigeria, Niger, China, Mali,
Burkina Faso, Uganda, Ethiopia, Chad and Senegal. Trends in the global cereal in terms
of area harvested, yield and production between 1992 and 2013 are shown in Table 2.1
(FAOSTAT, 2015). Millets are grouped together in global millet production since is difficult
to determine the amount of production for each genus. During this period (1992 – 2013),
the land used to grow millet and sorghum globally has decreased by 8% each in
comparison to maize which grew by 27%. However, during this period Africa has seen a
growth in the land to grow millet by 11%. Meanwhile, the biggest decline in land to grow
millet was in Europe accounting for 59%. The global yield for millet has increased by 18%
of which Africa contributed an increase of 10%. In the same period, maize production
increased globally by 31% and sorghum by 4%. Africa has increased the yield of maize
and sorghum by 34% and 22%, respectively. The production for millet globally and in
Africa increased by 8% and 22%, respectively. Maize production has increased globally
and in Africa by 66% and 77%, respectively. Meanwhile, sorghum production decreased
globally by 5% while there was an increase in production in in Africa by 38%. Africa has
decreased the area of harvest for production of underutilised millet and sorghum in
comparison to maize which grew. However, the production and yield of millet and
sorghum has increased. As stated by Masuda & Goldsmith (2009), an increase in the
harvested area has historically been the way of boosting the crop output. In future the
available area for harvesting cereal for production could be reduced as a result of a
decrease in the area not yet used for farming mainly due to urbanisation and population
16
Table 2.1 World production of millet in comparison to maize and sorghum (FAOSTAT, 2015)
Continent Cereal
1992 -
1997
1998 -
2003
2004-
2009
2010 -
2013
1992 -
1997
1998 -
2003
2004-
2009
2010 -
2013
1992 -
1997
1998 -
2003
2004-
2009
2010 -
2013
Area harvested (x 104 Ha)
Yield (x 103 Hg/Ha)
Production (x 104 tonnes)
World Maize 1371.07 1388.13 1536.75 1747.58
3.97 4.42 4.97 5.19
5452.41 6135.05 7650.72 9071.63
Africa Maize 256.47 252.67 288.00 339.35
1.51 1.71 1.81 2.02
388.74 430.94 523.48 686.20
Americas Maize 572.32 565.63 608.94 664.70
5.16 5.91 6.79 6.86
2962.88 3342.59 4139.14 4561.02
Asia Maize 408.88 433.66 495.82 572.95
3.55 3.79 4.31 4.88
1451.44 1644.70 2141.84 2798.62
Europe Maize 132.67 135.27 143.09 169.66
4.85 5.28 5.86 6.03
644.88 711.36 840.40 1019.49
Oceania Maize 0.73 0.90 0.90 0.91
6.07 6.09 6.51 6.91
4.48 5.46 5.86 6.30
World Millet 366.57 359.10 352.33 335.77
0.75 0.80 0.88 0.89
276.63 286.19 311.04 299.69
Africa Millet 185.91 198.42 206.05 206.25
0.63 0.70 0.80 0.70
117.68 138.39 165.66 143.78
Americas Millet 1.71 2.08 2.01 1.65
1.55 1.37 1.59 1.46
2.66 2.95 3.13 2.52
Asia Millet 165.49 147.87 136.85 122.08
0.87 0.90 0.97 1.20
144.60 134.18 133.24 145.91
Europe Millet 13.14 10.37 7.08 5.43
0.87 0.99 1.22 1.26
11.35 10.21 8.65 7.07
Oceania Millet 0.31 0.37 0.34 0.37
1.07 1.24 1.04 1.09
0.33 0.46 0.36 0.41
World Sorghum 446.92 426.33 436.17 410.43
1.39 1.37 1.38 1.44
622.66 582.96 602.99 591.78
Africa Sorghum 224.18 229.40 261.82 254.77
0.80 0.88 0.93 0.97
179.31 201.64 242.24 247.59
Americas Sorghum 72.14 70.32 62.78 61.96
3.57 3.36 3.56 3.52
259.11 236.71 224.20 217.59
Asia Sorghum 143.15 118.30 102.10 85.24
1.15 1.02 1.05 1.15
164.84 120.35 106.84 97.61
Europe Sorghum 1.61 1.70 1.84 2.44
4.46 4.02 3.80 3.75
7.10 6.71 6.80 8.94
Oceania Sorghum 5.83 6.62 7.64 6.02 2.09 2.66 2.93 3.33 12.30 17.55 22.91 20.05
17
increase. Worldwide, the population is increasing resulting in more land used for
settlement rather than agriculture. In addition the weaker rights to properties in regions
such as Africa have limited the use of modern agricultural methods. Therefore,
investment into research and development to increase cereal yields to meet the growing
demand and compensate the decline in available farming land is necessary.
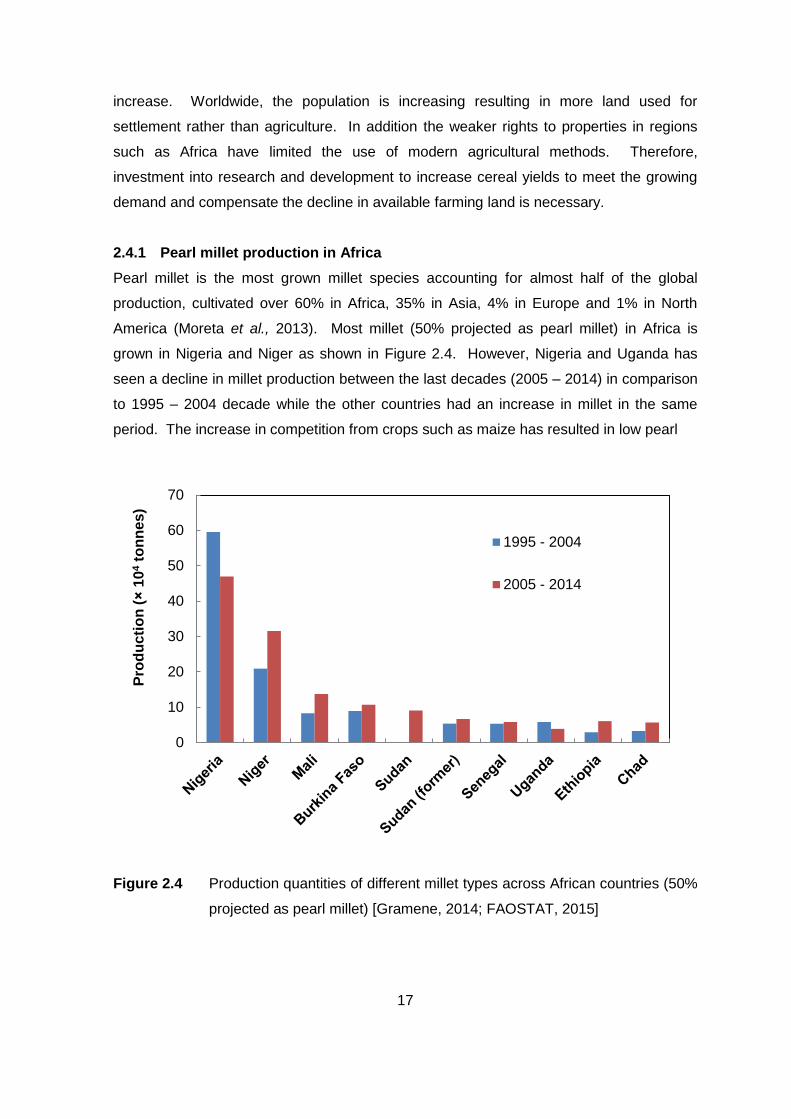
2.4.1 Pearl millet production in Africa
Pearl millet is the most grown millet species accounting for almost half of the global
production, cultivated over 60% in Africa, 35% in Asia, 4% in Europe and 1% in North
America (Moreta et al., 2013). Most millet (50% projected as pearl millet) in Africa is
grown in Nigeria and Niger as shown in Figure 2.4. However, Nigeria and Uganda has
seen a decline in millet production between the last decades (2005 – 2014) in comparison
to 1995 – 2004 decade while the other countries had an increase in millet in the same
period. The increase in competition from crops such as maize has resulted in low pearl
Figure 2.4 Production quantities of different millet types across African countries (50%
projected as pearl millet) [Gramene, 2014; FAOSTAT, 2015]
0
10
20
30
40
50
60
70
Pro
du
cti
on
(×
10
4 t
on
nes
)
1995 - 2004
2005 - 2014
18
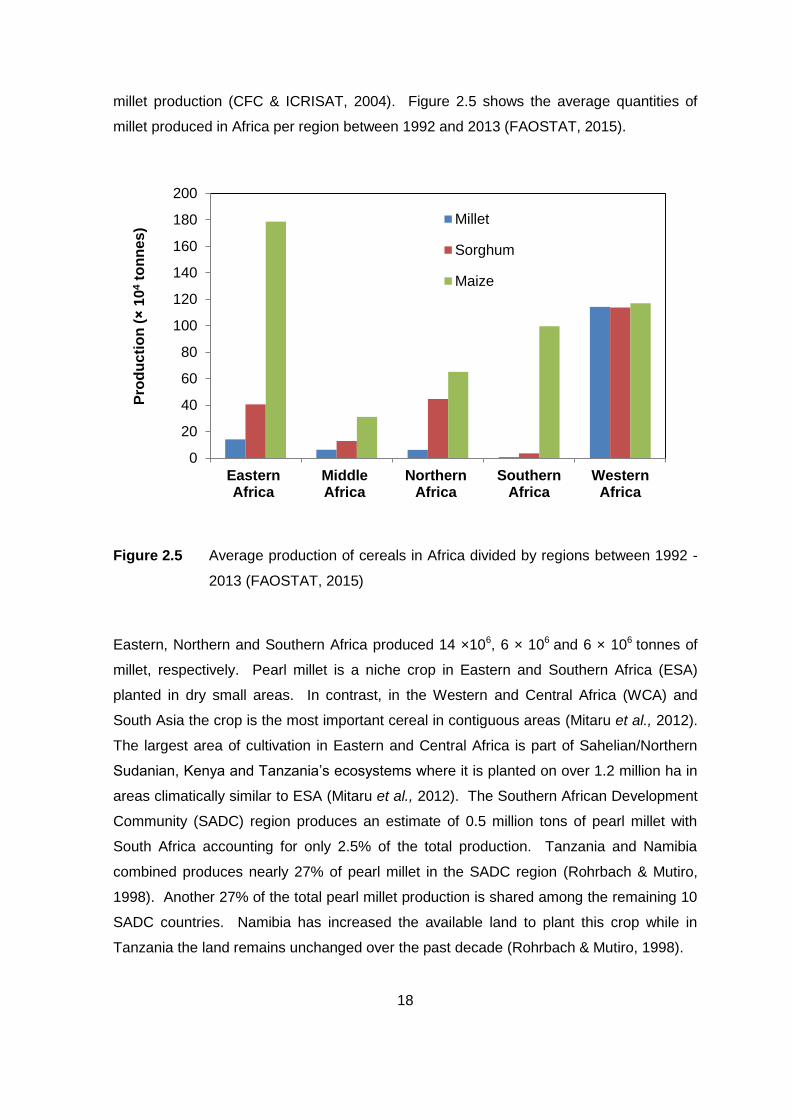
millet production (CFC & ICRISAT, 2004). Figure 2.5 shows the average quantities of
millet produced in Africa per region between 1992 and 2013 (FAOSTAT, 2015).
Figure 2.5 Average production of cereals in Africa divided by regions between 1992 -
2013 (FAOSTAT, 2015)
Eastern, Northern and Southern Africa produced 14 ×106, 6 × 10⁶ and 6 × 10⁶ tonnes of
millet, respectively. Pearl millet is a niche crop in Eastern and Southern Africa (ESA)
planted in dry small areas. In contrast, in the Western and Central Africa (WCA) and
South Asia the crop is the most important cereal in contiguous areas (Mitaru et al., 2012).
The largest area of cultivation in Eastern and Central Africa is part of Sahelian/Northern
Sudanian, Kenya and Tanzania’s ecosystems where it is planted on over 1.2 million ha in
areas climatically similar to ESA (Mitaru et al., 2012). The Southern African Development
Community (SADC) region produces an estimate of 0.5 million tons of pearl millet with
South Africa accounting for only 2.5% of the total production. Tanzania and Namibia
combined produces nearly 27% of pearl millet in the SADC region (Rohrbach & Mutiro,
1998). Another 27% of the total pearl millet production is shared among the remaining 10
SADC countries. Namibia has increased the available land to plant this crop while in
Tanzania the land remains unchanged over the past decade (Rohrbach & Mutiro, 1998).
0
20
40
60
80
100
120
140
160
180
200
EasternAfrica
MiddleAfrica
NorthernAfrica
SouthernAfrica
WesternAfrica
Pro
du
cti
on
(×
10
4 t
on
nes
)
Millet
Sorghum
Maize
19
2.4.2 Pearl millet in South Africa
Millets are extremely vital staple and ethno-botanical crops. South Africa has 0.21 million
ha of land which is semi-arid and produces only 0.04 million tons of millet. There are nine
species of millets grown worldwide of which four are relatively important across the
African continent. In South Africa pearl millet is mainly grown in the northern and western
regions. The crop was spread to northern and western South Africa over many years of
cultivation, natural growth and farmer selection. However, the cultivation of this crop is
limited to areas not known to be ideal for cereal production (Bello, 2013). An unknown
variety of pearl millet is grown in Limpopo, KwaZulu-Natal and the Free State (DPP,
2013). The crop is planted by few farmers since it is not in demand compared to other
cereals. Residue of the crop and green plants are used as building materials for fencing,
thatching and making basket (DPP, 2013).
2.5 Nutritional content of pearl millet
Pearl millet is a principal source of energy, protein, vitamins and minerals. The crop is
riche in calories than wheat due to its higher oil content of 5% of which 50% are
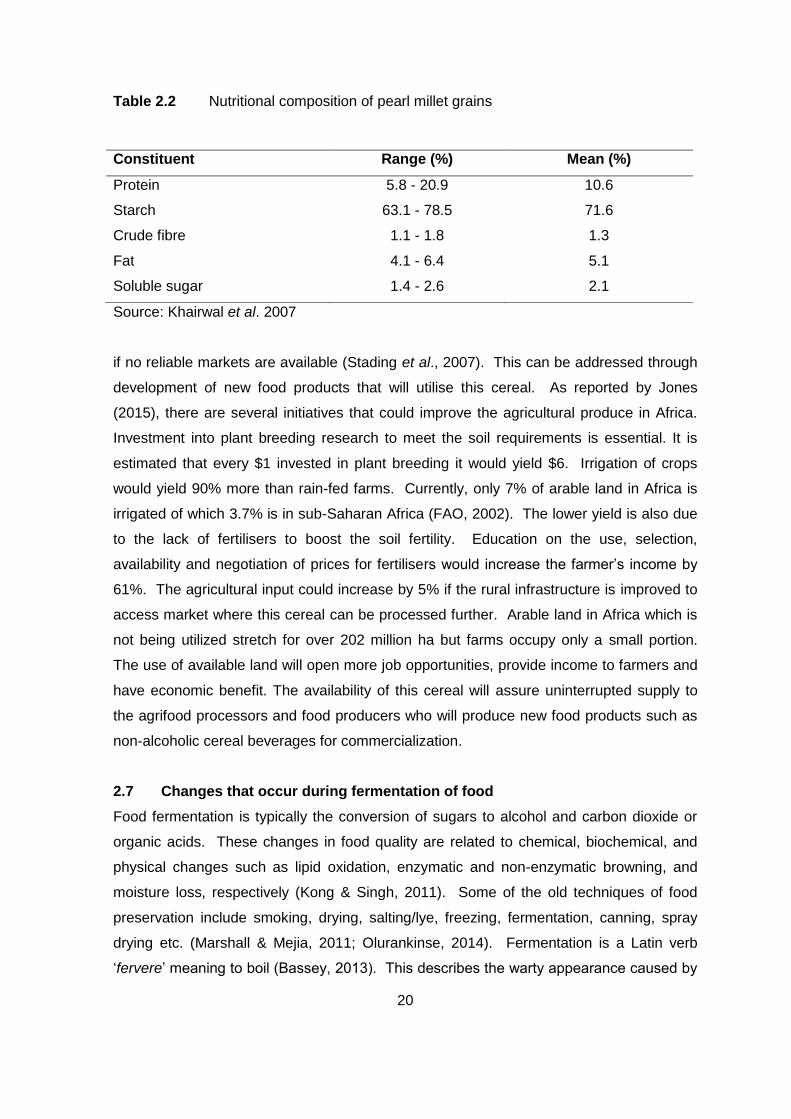
polyunsaturated fatty acids (Khairwal et al., 2007). Table 2.2 shows the nutritional
composition of pearl millet. Pearl millet is nutritionally better than other cereals, with high
levels of calcium, iron, zinc, lipids and high quality proteins (Lestienne et al., 2007).
Essential amino acid profile revealed that pearl millet is 40% richer in lysine and
methionine, and 30% richer in threonine than in the protein of corn (Osman, 2011). Pearl
millet is rich in energy (361 kcal/100 g) than wheat (346 kcal/100 g), rice (345 kcal/100 g),
maize (125 kcal/100 g) and sorghum (349 kcal/100 g). The protein content in pearl millet
grains is 11.6 g per 100 g comparible to wheat at 11.8 g per 100 g, higher that 6.8 g for
rice, 10.4 g for sorghum and 4.7 g for maize per 100 g (Nambiar et al., 2011).
2.6 Socioeconomic impact of millet
Millet is an underutilized cereal compared to other cereals such as maize and rice (Gelati
et al. 2014). Given the changing global weather pattern and increasing temperatures and
drought, this cereal can be planted in large quantities and address the social and
economic challenges. Although millets are the future crops due to their adaptability to
African land, to date they are still grown at subsistence level for food due to the lack of
market for usage. The industry only processes less than 5% (millet and sorghum
combined) of annual production quantities. This results in lower investment from farmers
20
Table 2.2 Nutritional composition of pearl millet grains
Source: Khairwal et al. 2007
if no reliable markets are available (Stading et al., 2007). This can be addressed through
development of new food products that will utilise this cereal. As reported by Jones
(2015), there are several initiatives that could improve the agricultural produce in Africa.
Investment into plant breeding research to meet the soil requirements is essential. It is
estimated that every $1 invested in plant breeding it would yield $6. Irrigation of crops
would yield 90% more than rain-fed farms. Currently, only 7% of arable land in Africa is
irrigated of which 3.7% is in sub-Saharan Africa (FAO, 2002). The lower yield is also due
to the lack of fertilisers to boost the soil fertility. Education on the use, selection,
availability and negotiation of prices for fertilisers would increase the farmer’s income by
61%. The agricultural input could increase by 5% if the rural infrastructure is improved to
access market where this cereal can be processed further. Arable land in Africa which is
not being utilized stretch for over 202 million ha but farms occupy only a small portion.
The use of available land will open more job opportunities, provide income to farmers and
have economic benefit. The availability of this cereal will assure uninterrupted supply to
the agrifood processors and food producers who will produce new food products such as
non-alcoholic cereal beverages for commercialization.
2.7 Changes that occur during fermentation of food
Food fermentation is typically the conversion of sugars to alcohol and carbon dioxide or
organic acids. These changes in food quality are related to chemical, biochemical, and
physical changes such as lipid oxidation, enzymatic and non-enzymatic browning, and
moisture loss, respectively (Kong & Singh, 2011). Some of the old techniques of food
preservation include smoking, drying, salting/lye, freezing, fermentation, canning, spray
drying etc. (Marshall & Mejia, 2011; Olurankinse, 2014). Fermentation is a Latin verb
‘fervere’ meaning to boil (Bassey, 2013). This describes the warty appearance caused by
Constituent Range (%) Mean (%)
Protein 5.8 - 20.9 10.6
Starch 63.1 - 78.5 71.6
Crude fibre 1.1 - 1.8 1.3
Fat 4.1 - 6.4 5.1
Soluble sugar 1.4 - 2.6 2.1
21
the action of yeasts on extracts of fruit or malted grain during anaerobic catabolism
(Colombie et al., 2007; Bassey, 2013). The fermentation process is carried out by
microorganisms which break down organic matter to obtain the energy required to remain
viable and make organic compounds such as alcohol and organic acid (Mkondweni, 2002;
Scott & Sullivan, 2008), as well as inorganic compounds such as CO2 and H2 (Weir &
McSpadden, 2005; IP, 2007). The difference between fermentation and decomposition
lies in the nature of the end product. The process is termed decomposition if substances
such as H2S and NH3, that are harmful to humans are formed (IP, 2007; WSU, 2014) and
is termed fermentation if beneficial substances are formed (IP, 2007). If a large amount of
putrefactive bacteria are present, the process shifts to decomposition, and if there are
many fermentative bacteria, it shifts to fermentation (GRNBA, 2012).
During storage, grains are metabolically inactive and have low water activity of less
than 0.6 and moisture content of 9-12%. Microorganisms and enzymes are not active
during storage due to this low water content (Achi & Ukwuru, 2015). If the grains are
hydrated, the enzymes become active and microorganisms start to grow and multiply.
The hydration process stimulates cereal fermentation to start and the activity of hydrolytic
enzymes such as amylosis, lipolysis, proteolysis and physiological activities of
microorganism carry out the fermentation (Achi & Ukwuru, 2015). During this phase
organic acid is produced and lowers the pH of the medium. Different metabolites are
produced which are beneficial to the consumers by improving the palatability and
acceptability of the beverage by improving flavours and texture; and preservative by
means of acidulants, alcohol and antimicrobial compounds. Cereal fermentation is
influenced by different factors such as duration of fermentation, temperature and pH which
are difficult to control in rural household families and require innovative technological
methods. In addition, factors that influence fermentation include (i) amount of moisture
content in the grain, (ii) extent of grain size reduction, (iii) type of cereal, (iv) growth
requirements for microorganisms, (v) enzyme sources, (vi) materials added to fermenting
substrate, (vii) pH, (viii) level of hygiene and sanitation and (ix) quality of starter culture
(Achi & Ukwuru, 2015 ).
Fermentation can be divided into two, namely, aerobic and anaerobic. Anaerobic
process takes place in the absence of oxygen which results in reduced pyridine
nucleotides which needs to be re-oxidised. During this process the reduced pyridine
nucleotide oxidation is followed by the reduction of organic compounds (Standburry et al.,
1995). Under aerobic process there is a supply of oxygen and re-oxidation of reduced
pyridine nucleotides occurs by electron transfer through the cytochrome system with
22
oxygen acting as electron acceptor (Standburry et al., 1995). The different types of
fermentation named based on the end products are: (i) ethanol, (ii) propionate, (iii) mixed
acid and butanediol, (iv) butyrate and acetone-butanol, (v) homoacetate and (vi) lactic
acid fermentation.
2.8 Biochemical changes during fermentation
Cereals are grown on over 103 million ha with production quantities of 169 million tons in
Africa as a source of dietary protein, carbohydrates, vitamins, minerals and fibre.
However, these nutrients are sometimes lower in comparison to dairy products
(Kohajdova & Karovicova, 2007; Katangole, 2008). Therefore, fermentation of cereal is
used to: (i) enrich the diet through creation of flavours, aromas and texture modification,
(ii) preserve food through the creation of organic acids (lactic acid), (iii) enrich the
beverages with proteins, essential amino acids, essential fatty acids, and vitamins, (iv)
detoxification during fermentation and (v) reduce the cooking times and energy usage
(Steinkraus, 1996). The process of fermentation is carried out by microorganisms and
their enzymes to achieve the desirable modification of cereals (Apena et al., 2015).
Microorganisms which carry fermentation derive their food from their immediate
environment (cereal). Water is not a nutrient but a basic need for biochemical reactions
for synthesis of cell mass and energy. During cereal fermentation carbohydrates are
broken down into monosaccharides by lactic acid bacteria (aerobic, anaerobic and
facultative). These nutrient molecules are transported into the cell through the cell wall
and cell membrane (Ray, 2004). In Gram positive lactic acid bacteria (LAB) the
cytoplasmic membrane made up of two layers of lipids is a barrier to nutrient transport.
Small molecules such as amino acids, small peptides, monosaccharides and
disaccharides are easily transported into the cell. However, large carbohydrates such as
starch need to be broken down using hydrolytic enzymes into small molecules before
transportation into the cell. LAB breakdown the glucose through the Embden-Meyerhof-
Parnas (EMP) and hexose monophosphate shunt (HMP) pathways to supply energy for
survival. The EMP and HMP are carried out by homofermentative and heterofermentative
lactic acid bacteria (Ray, 2004). All microorganisms are capable of utilizing carbohydrates
but their ability to utilize it differs greatly among different microorganisms. The end-
products (metabolic products) of fermentation are used to synthesize cellular components
of microorganisms. Other end products such as organic acids are used to support the
growth of other bacteria that tolerate acidic environment. The cereal grains have low
buffering capacity and the pH therefore decreases quickly as acid is produced during
23
fermentation by LAB. As acid is produced pathogens are then inhibited (Simpson, 2012).
In general, fermentation of cereals results in the reduction of carbohydrates and non-
digestible polysaccharides and oligosaccharides (Katangole, 2008).
Proteins, conjugate proteins, peptides, non-protein nitrogenous compounds (amino
acids, urea, ammonia, creatinine, trimethylalmine) are all major proteinaceous
components utilized by microorganisms. The proteins which are amino acids polymers
have different solubility which is the base to determine which microorganisms are capable
of utilizing the particular protein (Ray, 2004). Most microorganisms are capable of using
proteins which are soluble in water than the insoluble ones. Microorganisms such as
Lactococcus transport amino acids and peptides into the cell and thereafter the peptides
are hydrolyzed into amino acids within the cell (Ray, 2004). Sometimes proteinases and
peptidase are produced by microorganisms to breakdown large proteins and peptides into
small peptides and amino acids before transportation into the cell. Certain amino acids
are synthesized and may improve the availability of B group vitamins (Katangole, 2008).
Lipids are less preferred by microorganisms for microbial survival. They are
mostly found in food of animal origin rather than plant such as cereals. Fatty acids diffuse
easily through the lipid bilayers in the cytoplasm (Ray, 2004). Their utilization in food by
microorganisms is associated with spoilage of food. Microorganisms such as
Lactobacillus acidophilus can breakdown cholesterol in the intestine and reduce serum
cholesterol in humans (Ray, 2004).
Lactic acid bacteria like many microorganisms require small amount of minerals
such as phosphorus, calcium, magnesium, iron, sulphur, manganese and potassium for
survival. Organic acids produced during fermentation create an optimum pH environment
for enzymatic degradation of phytate available in cereal grains in the form of polyvalent
cations such as calcium, zinc, magnesium and proteins (Kohajdova, & Karovicova, 2007;
Katangole, 2008). Consequently, antinutrients such as phytate and polyphenols are
reduced during fermentation (Kohajdova, & Karovicova, 2007).
2.8.1 Growth of lactic acid bacteria during fermentation
Microorganisms in naturally fermented beverages are from internal and external sources
such as water, air, raw materials (cereal grains, spices, malts etc.), equipment, and other
sources. Proper sanitation during production is ideal to reduce the number of bacteria
especially pathogenic organisms. Natural fermentation of traditional beverages involves
mixed bacteria which can grow in mixed population, sequence, succession (diauxic),
symbiotic, synergistic and/or antagonistically (Ray, 2004). During mixed population
24
growth, different species of bacteria, yeast, and/or molds are involved. Some species
may be in large number and depending on the growth conditions others grow rapidly and
overcome the others. In sequence growth different species grows predominant in
sequence during storage. One or few species grow initially and create the environment
which favours subsequent species. Succession microorganisms are separated by a short
lag phase. Some bacteria utilizes one nutrient they prefer and once depleted uses the
other nutrient for growth. The growth curve has a repetition of exponential and stationary
phases. Synergistic growth refers to the symbiotic growing of bacteria independently
producing metabolites at lower rates. When symbiotic bacteria are in a mixed culture they
both produce high level of the end-product. Antagonistic growth happens when two or
more microorganisms in the beverage affect the growth of each other, sometimes leading
to the death of one bacteria. This can happen between bacteria and mould, mould and
yeasts, bacteria and yeast. Typical example is the growth of Gram positive lactic acid
bacteria which produces bacteriocins or proteins that kills other Gram positive bacteria
(Ray, 2004).
2.9 Types of fermentation models used in the industrial production of fermented
beverages
There are three main models of fermentation process in the industry namely, batch,
continuous and fed-batch, depending on the feeding strategy of culture and the medium in
the fermenter (Chisti, 1999).
2.9.1 Batch fermentation
Batch fermentation normally takes place in a closed system (Scott, 2004; Kumar, 2012).
At the beginning, microorganisms are added to the sterile medium fermentor and
incubated (Scott, 2004). During the course of fermentation only oxygen (in the case of
aerobic microorganism), antifoaming agent and acid or base are added to the medium to
control the pH (Chisti, 1999; Scott, 2004; Kumar, 2012; Diaz-Montano, 2014). The
composition of the culture medium, the biomass concentration, and metabolite
concentration generally change constantly as a result of the metabolism in the cells. After
the inoculation of microorganisms and cultivation of sterile nutrient under physiological
condition, four typical physiological phases of growth are observed, namely, lag,
logarithmic/exponential, stationery and death phase (Kang, 2000; Diaz-Montano, 2014).
During the lag phase, microorganisms are introduced into the fresh culture
medium; usually no immediate increase in cell number occurs (USDA, 2012). The
25
microorganisms have been injured and require time to recover. This is followed by
exponential or logarithmic phase where microorganisms are rapidly growing and dividing
at the maximal possible rate given their genetic potential, nature of the medium and
environmental conditions (Todar, 2012; MHRD, 2014). In a closed system such as batch
culture, population growth eventually ceases and the growth becomes horizontal. The
stationary phase usually is attained when the bacterial population level is around 109 cells
per ml but certain bacteria are unable to reach this level. Population growth is limited by
three factors: (i) exhaustion of available nutrients; (ii) accumulation of inhibitory
metabolites or end products; and (iii) lack of biological space (Todar, 2012). In the death
phase the energy reserves of the cells are exhausted. It is assumed that detrimental
changes in their environment such as nutrient deprivation and the build-up of toxic wastes
causes irreparable harm and damage leading to loss of viability (Al-Qadiri et al., 2008;
MHRD, 2014). When bacteria are transferred to a fresh medium, no cellular growth is
observed (Thiel, 1999). Due to loss of viability often accompanied by loss of total cell
number; it is assumed that viable cells were dead but did not lyse. At the end of
fermentation, contents are emptied preparing for next batch (Renge et al., 2012).
2.9.2 Continuous fermentation
Continuous fermentation takes place in an open system (Kumar, 2012). During
fermentation substrates are continuously added to a bioreactor. At the same time, equal
amounts of converted nutrient solution with microorganisms are removed from the system
(Chisti, 1999; Renge et al., 2012; Diaz-Montano, 2014). Homogeneously mixed
bioreactor is divided into two, chemostat or turbistat. In chemostat the growth of cells is
controlled by adjustment of the substrate concentration (Scott, 2004). Turbistat is kept
constant by using turbidity to monitor the biomass concentration. The rate of feed of
nutrient solution is also adjusted.
2.9.3 Fed-Batch fermentation
Fed-batch fermentation is the type of system where nutrients are added only when their
concentration falls (Chisti, 1999; Scott, 2004; Diaz-Montano, 2014). This mode of
fermentation can be regarded as a combination of the batch and continuous operation
(Caylak & Sukan, 1998; Standbury, 2006). The nutrients are added in several doses to
ensure that there are no surplus nutrients in the fermenter at any time (Diaz-Montano,
2014).
26
2.10 Factors influencing fermentation process
There are numerous intrinsic and extrinsic factors which can influence the fermentation
process, namely: nutrient availability, temperature, pH, heat and oxygen. Their variation
may affect the rate of fermentation, product spectrum and yield, and organoleptic
properties of the product (Chisti, 1999; Maukonen et al., 2003; Najafpour, 2006; Renge et
al., 2012).
2.10.1 Nutrient availability
Microorganisms require nutrients (amount and type depend on the range of
microorganisms) for growth and maintenance of metabolic functions (FDA, 2013).
Microorganisms require a source of carbon, nitrogen and phosphorus; a respiratory
substrate which is usually glucose; vitamins and minerals to act as co-enzymes and water
for all metabolic reactions to occur (FDA, 2013). If a nutrient is depleted it will become a
limiting factor and reduce the growth rate.
2.10.2 Temperature
Temperature influences the growth rate co-ordinated by enzymes (Enfors, 2008).
Enzymes work most efficiently over a narrow range of temperatures (around optimum). If
the temperature falls too low, the rate of enzymes-catalysed reactions becomes too low to
sustain life of microorganisms (Thiel, 1999). If the temperature is high, the denaturation of
enzymes causes cell death (Thiel, 1999). The optimum range of temperature for most
microorganisms is between 25⁰C and 45⁰C (Thiel, 1999).
2.10.3 pH
Bacterial work efficiently within a narrow pH range between pH 6 and 7 (Lambert, 2011).
However, microorganisms in general can tolerate a wider pH range. Some species grow
in acidic and others in alkaline conditions (da Vinci, 2009).
2.10.4 Oxygen
Microorganisms have different oxygen requirements. Obligate aerobes are
microorganisms that require oxygen all the times, without it they are unable to survive in
the fermentation process (Fox, 2010). Obligate anaerobic are microorganisms that find
oxygen toxic as it inhibits respiration and they cannot grow in its presence (Fox, 2010).
Facultative anaerobic refers to populations of bacteria that grow in the presence of
oxygen, but can survive without it, although their growth rate is slow (Clarke, 2013).
27
2.10.5 Heat production
Heat is produced during biological activity, thus the fermentation cycle should be carried
out in a controlled temperature environment to obtain optimal yields (van Leeff et al.,
1993; Colombie et al., 2007). Energy is also created during stirring and aeration/gassing
of the medium being fermented.
2.10.6 Gas exchange
The successful operation of aerobic fermentation requires adequate gas supply (Lee,
2001) in which oxygen is the most important gaseous substrate for microbial metabolism,
and carbon dioxide is the most vital metabolic product (FDA, 2013). Limitation in oxygen
supply may lead to an undesirable change in enzymatic make-up or death of the
organisms which could lead to lower yield of desired end product (Lee, 2001). During
fermentation by unicellular microorganisms, the rate of transfer is controlled by the
resistance in the phase boundary between the gas bubble and the liquid phase (Colombie
et al., 2007; BM, 2012; Rodriguez-Fernandez et al., 2012). Organisms near gas bubbles
may absorb oxygen directly and the gas tranfer rate may be increased (BM, 2012).
2.11 Fermentation of non-alcoholic cereal beverages
Traditional beverages can be fermented in three ways depending on the source of desired
microorganisms. The beverages can be fermented by either natural, back-slopping or
controlled fermentation (Ray, 2004).
2.11.1. Natural fermentation
Many indigenous cereal beverages are fermented through natural fermentation. The raw
materials used are not heat treated and contain a mixture of desired and unwanted
microorganisms. The production process and incubation conditions favour the growth of
desired microorganisms while slowing the undesired bacteria. These beverages have
desirable aroma caused by the lactic acid bacteria metabolizing the available nutrients
usually carbohydrates. The microflora in natural fermented beverages differs from batch
to batch resulting in inconsistent characteristics of the final beverage. This type of
fermentation is also risky since pathogens could be present in the final product.
2.11.2. Back slopping
Some cereal beverages are produced traditionally using clay pots in Africa. At the end of
a successful fermentation the pots are not washed and a new batch is mixed inside the
28
pot. The remaining microorganisms on the surface of the pot are used as starter culture
for the new batch of beverage. However, the quality of the beverages may differ over a
long period because of the change in microbial types. Pathogens could also be found in
the beverage at high level.
2.11.3 Controlled fermentation
During this type of fermentation, a starter culture is added to the beverage which had
been heat treated. The starter culture used is a single or mixed strain of microorganism.
The beverages are incubated at defined optimum temperature for starter cultures used. A
consistent beverage with predictable qualities can be produced and the chances of failure
are very low. However, the beverage may have different flavours in comparison to natural
and back slope fermented beverages due to the use of selected bacteria.
2.12 Non-alcoholic cereal beverages in Africa
Recently health conscious consumers are looking for natural foods without chemical
preservatives that will fit their healthy lifestyles (Judeikiene et al., 2012). The increasing
consumption of pre-cooked and the import of raw foods from developing countries are
among the main causes of people opting for healthy foods. Currently, fermented foods
are increasing in popularity due to their nutritious properties. Fermented products are
divided into porridges, beverages (alcoholic and non-alcoholic), breads and pancakes,
fermented meat, fish, vegetables, dairy products and condiments that are produced from
both edible and inedible raw materials in many countries (Marshall & Mejia, 2011).
Fermented cereal beverages from Africa are of interest and are shown in Table 2.3. The
classification is based on the raw material and beverage name, country of popularity and
the microorganism that ferment the beverage (Solange et al., 2014). Non-alcoholic cereal
beverages are popular in African countries (Terna & Ayo 2002). The cereals mainly used
in their production are millets, sorghum and maize although composite cereal are
sometimes used (Terna & Ayo 2002). The production of these African cereal beverages
are still limited to household level where they are carried out by mixed microorganisms in
succession. The end-product differs from each family in terms of quality, yield and safety
and hinders commercialization of the beverages. To assure the homogeneity and large
scale production, different processing and innovative approach needs to be applied to
improve these non-alcoholic beverages (Judeikiene et al., 2012).
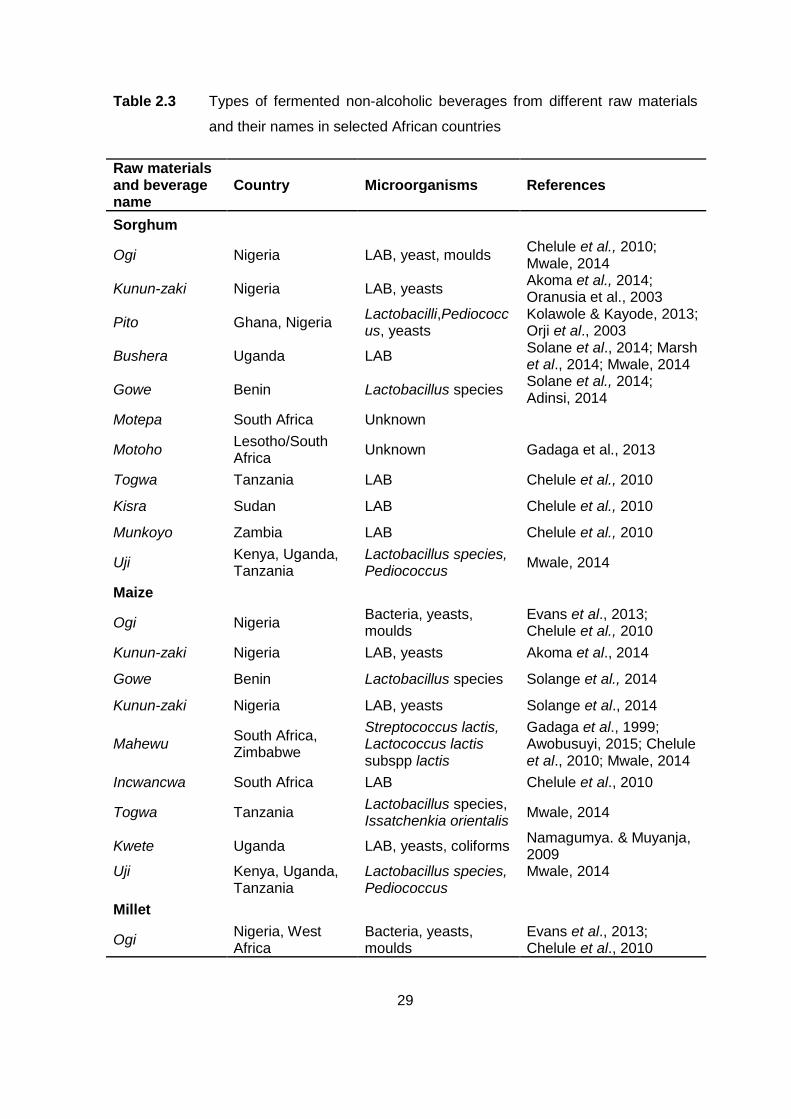
29
Table 2.3 Types of fermented non-alcoholic beverages from different raw materials
and their names in selected African countries
Raw materials and beverage name
Country Microorganisms References
Sorghum
Ogi Nigeria LAB, yeast, moulds Chelule et al., 2010; Mwale, 2014
Kunun-zaki Nigeria LAB, yeasts Akoma et al., 2014; Oranusia et al., 2003
Pito Ghana, Nigeria Lactobacilli,Pediococcus, yeasts
Kolawole & Kayode, 2013; Orji et al., 2003
Bushera Uganda LAB Solane et al., 2014; Marsh et al., 2014; Mwale, 2014
Gowe Benin Lactobacillus species Solane et al., 2014; Adinsi, 2014
Motepa South Africa Unknown
Motoho Lesotho/South Africa
Unknown Gadaga et al., 2013
Togwa Tanzania LAB Chelule et al., 2010
Kisra Sudan LAB Chelule et al., 2010
Munkoyo Zambia LAB Chelule et al., 2010
Uji Kenya, Uganda, Tanzania
Lactobacillus species, Pediococcus
Mwale, 2014
Maize
Ogi Nigeria Bacteria, yeasts, moulds
Evans et al., 2013; Chelule et al., 2010
Kunun-zaki Nigeria LAB, yeasts Akoma et al., 2014
Gowe Benin Lactobacillus species Solange et al., 2014
Kunun-zaki Nigeria LAB, yeasts Solange et al., 2014
Mahewu South Africa, Zimbabwe
Streptococcus lactis, Lactococcus lactis subspp lactis
Gadaga et al., 1999; Awobusuyi, 2015; Chelule et al., 2010; Mwale, 2014
Incwancwa South Africa LAB Chelule et al., 2010
Togwa Tanzania Lactobacillus species, Issatchenkia orientalis
Mwale, 2014
Kwete Uganda LAB, yeasts, coliforms Namagumya. & Muyanja, 2009
Uji Kenya, Uganda, Tanzania
Lactobacillus species, Pediococcus
Mwale, 2014
Millet
Ogi Nigeria, West Africa
Bacteria, yeasts, moulds
Evans et al., 2013; Chelule et al., 2010
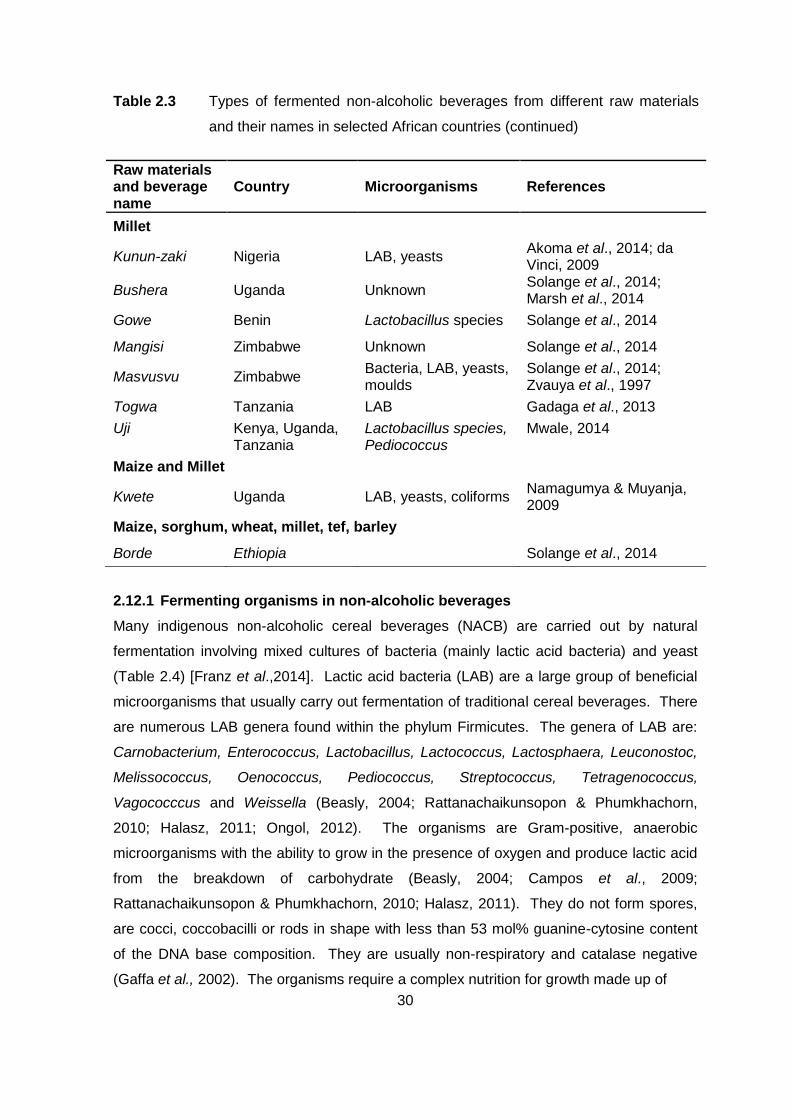
30
Table 2.3 Types of fermented non-alcoholic beverages from different raw materials
and their names in selected African countries (continued)
Raw materials and beverage name
Country Microorganisms References
Millet
Kunun-zaki Nigeria LAB, yeasts Akoma et al., 2014; da Vinci, 2009
Bushera Uganda Unknown Solange et al., 2014; Marsh et al., 2014
Gowe Benin Lactobacillus species Solange et al., 2014
Mangisi Zimbabwe Unknown Solange et al., 2014
Masvusvu Zimbabwe Bacteria, LAB, yeasts, moulds
Solange et al., 2014; Zvauya et al., 1997
Togwa Tanzania LAB Gadaga et al., 2013
Uji Kenya, Uganda, Tanzania
Lactobacillus species, Pediococcus
Mwale, 2014
Maize and Millet
Kwete Uganda LAB, yeasts, coliforms Namagumya & Muyanja, 2009
Maize, sorghum, wheat, millet, tef, barley
Borde Ethiopia Solange et al., 2014
2.12.1 Fermenting organisms in non-alcoholic beverages
Many indigenous non-alcoholic cereal beverages (NACB) are carried out by natural
fermentation involving mixed cultures of bacteria (mainly lactic acid bacteria) and yeast
(Table 2.4) [Franz et al.,2014]. Lactic acid bacteria (LAB) are a large group of beneficial
microorganisms that usually carry out fermentation of traditional cereal beverages. There
are numerous LAB genera found within the phylum Firmicutes. The genera of LAB are:
Carnobacterium, Enterococcus, Lactobacillus, Lactococcus, Lactosphaera, Leuconostoc,
Melissococcus, Oenococcus, Pediococcus, Streptococcus, Tetragenococcus,
Vagococccus and Weissella (Beasly, 2004; Rattanachaikunsopon & Phumkhachorn,
2010; Halasz, 2011; Ongol, 2012). The organisms are Gram-positive, anaerobic
microorganisms with the ability to grow in the presence of oxygen and produce lactic acid
from the breakdown of carbohydrate (Beasly, 2004; Campos et al., 2009;
Rattanachaikunsopon & Phumkhachorn, 2010; Halasz, 2011). They do not form spores,
are cocci, coccobacilli or rods in shape with less than 53 mol% guanine-cytosine content
of the DNA base composition. They are usually non-respiratory and catalase negative
(Gaffa et al., 2002). The organisms require a complex nutrition for growth made up of
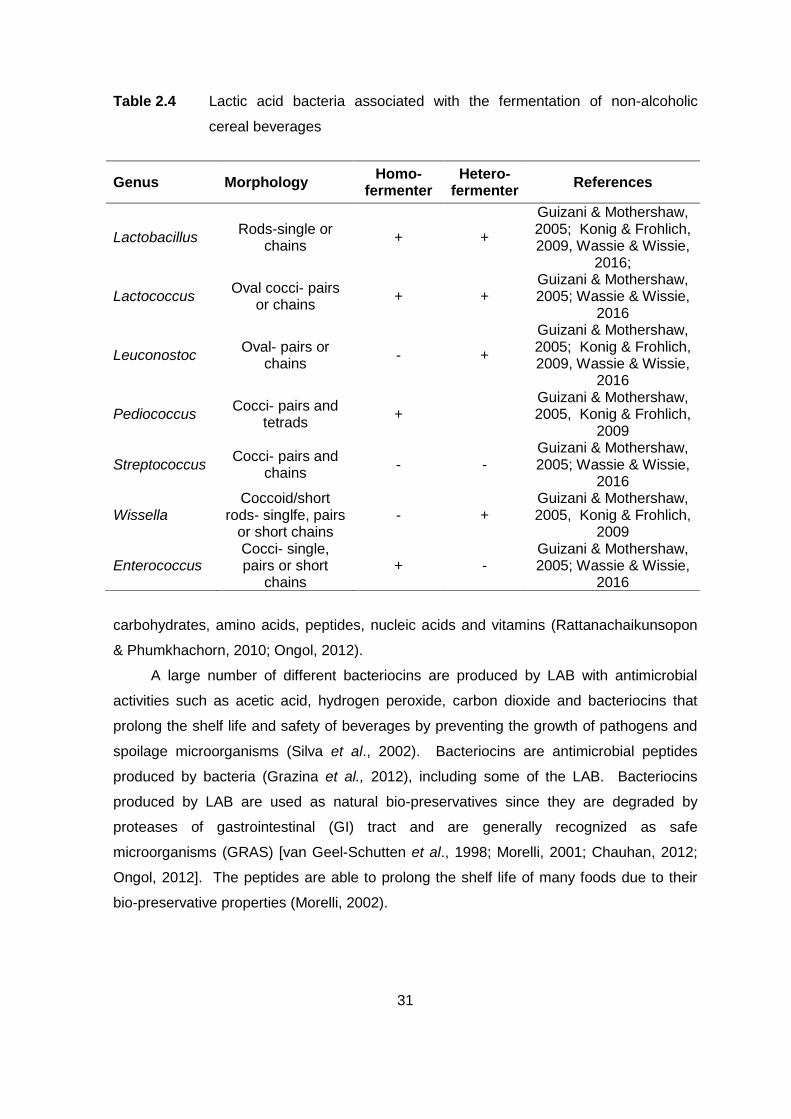
31
Table 2.4 Lactic acid bacteria associated with the fermentation of non-alcoholic
cereal beverages
carbohydrates, amino acids, peptides, nucleic acids and vitamins (Rattanachaikunsopon
& Phumkhachorn, 2010; Ongol, 2012).
A large number of different bacteriocins are produced by LAB with antimicrobial
activities such as acetic acid, hydrogen peroxide, carbon dioxide and bacteriocins that
prolong the shelf life and safety of beverages by preventing the growth of pathogens and
spoilage microorganisms (Silva et al., 2002). Bacteriocins are antimicrobial peptides
produced by bacteria (Grazina et al., 2012), including some of the LAB. Bacteriocins
produced by LAB are used as natural bio-preservatives since they are degraded by
proteases of gastrointestinal (GI) tract and are generally recognized as safe
microorganisms (GRAS) [van Geel-Schutten et al., 1998; Morelli, 2001; Chauhan, 2012;
Ongol, 2012]. The peptides are able to prolong the shelf life of many foods due to their
bio-preservative properties (Morelli, 2002).
Genus Morphology Homo-
fermenter Hetero-
fermenter References
Lactobacillus Rods-single or
chains + +
Guizani & Mothershaw, 2005; Konig & Frohlich, 2009, Wassie & Wissie,
2016;
Lactococcus Oval cocci- pairs
or chains + +
Guizani & Mothershaw, 2005; Wassie & Wissie,
2016
Leuconostoc Oval- pairs or
chains - +
Guizani & Mothershaw, 2005; Konig & Frohlich, 2009, Wassie & Wissie,
2016
Pediococcus Cocci- pairs and
tetrads +
Guizani & Mothershaw, 2005, Konig & Frohlich,
2009
Streptococcus Cocci- pairs and
chains - -
Guizani & Mothershaw, 2005; Wassie & Wissie,
2016
Wissella Coccoid/short
rods- singlfe, pairs or short chains
- + Guizani & Mothershaw, 2005, Konig & Frohlich,
2009
Enterococcus Cocci- single, pairs or short
chains + -
Guizani & Mothershaw, 2005; Wassie & Wissie,
2016
32
2.12.2 Technologies to improve the quality, shelf life and acceptability of cereal
beverages
Climate change which is linked to the rise in temperatures has threatened food security
but its impact can still be minimized. This increase in temperatures will have severe
implications on the physical and biological systems and human livelihoods. Africa is
among the most vulnerable continent to the negative effects of climate change due to its
limited financial resources, skills, technology and dependence on climate-sensitive
primary sector. Pearl millet is a better suitable climate change compliant crop to use than
other cereals since it can survive adverse environment (low rainfall and high
temperatures) [Andreas, 2013].
Traditionally prepared non-alcoholic beverages (NAB) last for one to few days
(Oranusia, et al., 2003; Amusa, & Odunbaku, 2009; Ratau, 2011) due to the unhygienic
environment where the beverages are produced, pitching of different microorganisms from
fresh milled mixture; differences in the production process from area to area, tap water
used to increase volume and profit margin not portable etc. These factors also result in
variations in taste and flavour from different producers and are a limitation to large scale
production (Oranusia, et al., 2003). Various researchers have reported on technological
approaches to improving fermented beverages. These processing methods include: (i)
heat treatment, (ii) freeze-drying, (iii) steeping of grains in sodium metabisulphite, (iv)
hurdle effect of sodium metabisulphite and refrigeration, (v) enrichment of the beverage
with soy milk, (vi) effect of preservation, (vii) enrichment with ProVitamin A, (viii)
enrichment with Moringa flour, and (vx) production of quality cereal malt. Most of these
techniques are practised in the food industry and could be used to commercialize
traditional cereal beverages. In order to standardize the beverages in terms of quality and
safety for commercialization these different technologies need to be improved and/or
implemented.
2.12.2.1 Thermal processing (pasteurization) of the beverage
Thermal processing has been used in modern day to enhance the shelf-life of food without
altering with their organoleptic qualities. Studies on thermal processing as undertaken by
Oranusia et al. (2003) showed that heat reduces the number of bacteria, yeasts and
molds that causes food spoilage and enhance the taste, smell, appearance and
digestibility of foods. Sekete, a fermented maize beverage, was pasteurised at three
temperatures (65, 70 and 75°C) for 30 min and the microbial load and sensory properties
of the beverage evaluated (Onaolapo & Busari, 2014). Pasteurization at 75°C for 30 min
33
eliminated all bacteria and increased the shelf-life of Sekete by four weeks in comparison
to 65°C and 70°C for 30 min (Onaolapo & Busari, 2014). The sensory qualities between
the beverages did not differ significantly but the taste of the sample pasteurised at 65°C
for 30 min was preferred (Onaolapo & Busari, 2014). These results were in agreement
with Egbere, (2009) during the pasteurization of sorghum cereal beverage at 70°C for 30
min (Onaolapo & Busari, 2014). The results showed that after 20 min 80% of the
microbial load was destroyed except Bacillus subtilis (Dvalue = 6.5 min) and
Saccharomyces cerevisiae. This indicated that ultra-high temperature or combinational of
pasteurization and chemical preservatives could be used to eliminate B. subtilis.
However, Maji et al. (2011) reported chemical deterioration of cereal beverage in one
week when pasteurised at 60°C for 1 h in comparison to samples treated with 0.1%
sodium benzoate or sodium metabisulphite which deteriorated in 2 weeks. Although the
beverage shelf life can be extended through pasteurization, the heat destroys labile
probiotics (Amusa & Odunbaku, 2009) and could results in the reduction of desired
chemical properties which may lead to reduced acceptability of the beverage by potential
consumers. Nutritious foods such as non-alcoholic cereal beverages with long shelf life
are in demands from consumers. Heat treatment extends the shelf life but may have
detrimental effects on the nutrition and fresh like flavors of beverages (Aneja et al., 2014).
New technologies such as high hydrostatic pressure, high pressure processing, pulsed
electric field, ultrasound, irradiations etc. developed in the food industry needs to be
developed for cereal beverages (Aneja et al., 2014).
2.12.2.2 Freeze-dried cereal beverage
Freeze drying (lypholisation) of fermented Kunun-zaki prepared using starter culture was
investigated (Nkama et al., 2010). The difference in nutritional and sensory quality
attributes between the reconstituted dried beverage and freshly prepared beverage were
investigated. There were no significant differences in overall acceptability and mineral
contents of the beverages. However, there was a marginal difference in titratable acidity
(as % lactic acid), pH, proximate and amino acids content between freeze-dried and
freshly prepared beverage. Freeze drying techniques however, prolonged the shelf life of
the beverage by 6 months and offered consumers the option to decide when to consume
the beverage (Nkama et al., 2010). However, lyophilisation technology has
disadvantages such as high cost, increased handling and processing time. Other factors
to contribute the cost could be cryogenic protector used during freeze drying. Chen et al.
(2006) reported loss of microbial viability after freeze drying without lyoprotectants but
34
there was a significant growth of surviving microorganism when 10% galactose or sucrose
was used as lyoprotectants. An instant kunun-zaki was also produced by Uvere and
Amazikwu (2011) with an addition of cowpea and soybean. The instant beverage had
high crude protein and sugar content compared to traditional beverage. However, the
moisture content and viscosity of the beverage was reduced when compared to freshly
prepared beverage. A proper package such as vacuum packaging should also be used to
avoid the loss of volatile compounds, control the growth of mold; and sterile diluents
needs to be used when reconstituting (Uvere and Amazikwu, 2011; Nireesha et al., 2013).
Ndulaka et al. (2014) also reported no-significant differences in the proximate composition
between (protein, ash, fibre and carbohydrates) reconstituted kunun-zaki and freshly
prepared beverage. However, there was a significant difference in terms of the taste and
pH of the beverages. The pH of the reconstituted beverage was 3.61 while the freshly
prepared sample had a pH of 2.03 which is in agreement with Nkama et al. (2010). The
freshly prepared beverage was scored high in terms of taste compared to reconstituted
beverage. The unacceptable taste could be due to the drying method (oven).
2.12.2.3 Steeping of grains using sodium metabisulphite
Terna & Ayo (2002) investigated the use of sodium metabisulphite at 5% in warm steeping
water (60 - 70ºC). This helped soften the grains during the steeping process. The main
aim was to improve the traditional production process while maintaining nutrient and
improving microbiological quality. The usual production process was shortened to 12 h
instead of the traditional 24 h. The shorter liquefication time resulted in less chances of
contamination and food borne infections. As a result of shortened saccharification
process, the protein content of the beverage with shortened steeping process increased
from 4.1 to 5.4%. Yang and Seib (1996) reported an optimum recovery (51%) of starch in
sorghum grains steeped for 4 h at 58°C with initial SO2 concentration at 0.3%. However,
the use of sodium metabisulphite may cause allerrgic reaction to people sensitive to
sulfite. Sulfite is known to results in asthma, rhinoconjunctivitis, urticaria and anaphylactic
shock (Oliphant, 2012). The use of NaOH as a steeping agent also resulted in high starch
purity (Nyakabau et al., 2013). Deepe and Vilayakuwa (2013) reported a reduction in
steeping time to 10 h using 0.03N NaOH resulting in optimum isolation, yield, hydration
index, swelling index and micrometric properties of starch.
35
2.12.2.4 Hurdle effect of sodium metabisulphite and refrigeration or pasteurisation
on the beverage
Microbiological, physicochemical and sensory qualities of cereal beverage made with
millet and stored at refrigerated condition were investigated by Abimbola et al. (2013).
The study was aimed at producing the beverage under hygienic conditions, improving the
traditional production process thus reducing microbial count and improving storage
stability. The improved method included the use of 0.5% sodium metabisulphite during
the 3 h steeping process, addition of 0.1% sodium metabisuphite after saccharisation at
60 - 70ºC, filtration step and lastly storing the beverage at refrigerated conditions (4 - 8ºC).
The new improved method in comparison to traditional method showed that the old
method affected the quality and acceptability. There was a significant difference in taste,
consistency and colour but no significant difference in overall acceptability. However, to
maintain the colour, odour, taste and consistency using the improved method there should
be a constant supply of electricity. There was no growth of pathogens in refrigerated
samples as compared to ambient stored samples. Maji et al. (2011) also investigated the
hurdle effect of 0.1% sodium benzoate and sodium metabisulphite on the shelf life of
cereal beverage. The shelf-life was stable for 3 weeks and the beverage was accepted by
potential consumers. This was also supported by Ojimelukwe et al. (2013) who reported
an increase in shelf life by five days and acceptability of non-alcoholic cereal beverage
from sorghum treated with 0.2 g/L sodium metabisulphite followed by pasteurisation at
65°C for 30 min.. The use of sodium metabisulphite may cause allerrgic reactions to
people sensitive to sulfite. Sulfite is know to results in asthma, rhinoconjunctivitis, urticaria
and anaphylactic shock (Oliphant, 2012). Refrigeration is cost intensive and some
villages do not have electricity.
2.12.2.5 Enrichment (fortification) and supplementation of the cereal beverage
The nutrition and safety of improved non-alcoholic beverage produced from malted cereal
enriched with malted soymilk at different substitution levels (0 - 30%) was investigated by
Adelakan et al. (2013). The aim was to improve the nutritional and acceptability of the
beverage to suite the daily dietary requirements of the consumers. The use of soymilk
and malting increased the protein, amino acid, ash and moisture content of the beverage.
Malting resulted in the reduction of carbohydrates and fat content. The protein content in
malted samples ranged from 2.79 - 3.82% while proteins in un-malted samples was
2.36%. The concentration of phytic acid and trypsin inhibitors decreased after malting but
the concentration increased when more soymilk was added. In addition the amino acid
36
content increased when more soymilk was added. Therefore, the beverage with soymilk
was more nutritious. Haard et al. (1999) also reported that the use of 10% soya flour in
ogi enhanced the nutritive value, shelf life and theurapeutic properties of the beverage.
Meanwhile, Oluwole et al. (2012) reported an increase in acceptability of beverage made
from 72 h maize malt and soymilk. The beverage was nutritious with high levels of energy
and acceptable fat, proteins and crude fibre. However, the nutritious soy milk enriched
beverage was not accepted as the soy milk content increased. This is due to the beany
taste caused by soy milk. It is advisable to use flavours to reduce the beany taste and
preservatives used to improve the shelf-life and the beverage stored at refrigerated
conditions (Adelakan et al.,2013). However, consumers need less additives in food and
refrigeration is not ideal for rural villages with no electricity. The fortification may produce
nutritious beverage but may have a low acceptability by beverage consumers (Sowonola
et al., 2005). Soy contains phytoestrogens which can have negative health effects and
needs to be regulated. Some of the soy is produced using genetic modified organisms.
Individuals allergic to soy will not be able to consume the beverage. Beside using malt,
Bede et al. (2015) used date fruit which is knowwn to be nutrtious containing high
carbohydrates, sugars (44 -88%), 1 mg salt bettwer than 55 mg in sweet potatoes and
essential vitamins and minerals (such as potassium – 696 mg/100 mg) to boost the
nutrtive and sweetness on non-alcoholic cereal beverage. The beverage made with millet
and date fruit was preferred than the sample made with millet and sweet potatoes.
Awobusuyi (2015), investigated the optimal processing parameters of Mahewu
produced using Pro-Vitamin A-biofortified maize. Mahewu was prepared traditionally with
slight modification. Maize meal was mixed with water (1:7 w/v) at 90ºC while stirring for
15 min. The porridge was cooled to 40ºC then inoculated with wheat bran, maize malt
and Lactobacillus starter culture. The concentrations used for inoculums were 0.5, 1 and
2% w/w. The different varities of Pro-Vitamin A maize used were PVAH 62 and PVAH 19
(Awobusuyi, 2015). A white Mahewu processed beverage was used as control. Pro-
Vitamin A was retained in Mahewu after fermentation, the starter cultures improved the
taste, aroma and overall acceptability and the beverage was shelf stable for 3 days at
room temperature (Awobusuyi, 2015). However, the beverge was accepted mostly by
females than male who were undecisive. The enrichment may lead to segmentation of
the consumers.
Other minerals such as zinc and iron content which help with physical growth,
cognitive developemnt and reproduction could be made available through the addition of
ascorbic acid and/or NaFeEDTA to encourage their release during fermentation. The
37
naturally available bacteriocins could eliminate spoilage microorganisms in the beverage.
Like milk based beverages, prebiotics such as fructooligosaccharides, inulin, and
galacooligosaccharides could also be added to the beverage to support the growth of LAB
bacteria (Adelakan, 2013). Different vitamins and minerals such as vitamin D, vitamin E,
vitamin C, calcium and magnesium could also be added to supplement and/or fortify the
beverage to improve the growth of children. Other technologies such as flavour enhancer
could be used to mask any undesirable taste and flavours that arise during fortification
(Sowonola, 2005).
Olosunde et al. (2014) investigated the use of Moringa (Moringa oleifera) flour to
determine the nutritional quality of cereal beverage. The beverage was prepared
traditionally with slight modification. Three varied levels (5, 10 & 15%) of Moringa seed
flour was added to the slurry during production. The protein, mineral, physicochemical,
anti-nutritional and sensory qualities of the beverage were determined. There was a
decrease in moisture and carbohydrate as the Moringa seed flour increased while the
protein, fat, ash and crude fibre contents increased. Enriched beverage with 15%
Moringa seed flour had higher mineral and anti-nutritional contents. The pH and soluble
solid also increased as Moringa flour increased. There was no significant differences in
taste, appearance and overall acceptability of 5 and 10% enriched beverage samples and
the control. It is recommended that up to 10% Moringa seed flour is desirable, as higher
concentrations (15%) impact undesirable effect on the taste and appearance. Therefore,
the level of Moringa to use in supplementing the beverages need to be monitored not only
for increasing nutritional benefit but also for taste, aroma and appearance. Abidoye
(2017) investigated the effect of cocoa powder on the nutritional properties of kunun-zaki
made from sorghum due to its antioxidants activities. The most prefered beverage was
made-up of sorghum as base and cocoa powder at 80 and 20%, respectively, scoring 3.4
compared to traditional beverages at 1.8 on a 9 point Hedonic scape. The antioxidant of
the beverage increased from 40 to 50%. Folasade and Oyenike (2012) also reported that
sesame seeds (20%) added to sorghum non-alcoholic beverage produced an acceptabe
beverage. The beverage was high in protein, ash, fat and minerals (calcium, phosphorus,
potassium, magnesium and iron) in comparions to indegenous beverage. The effect of
Aframomum danelli and black pepper on the physicochemical, sensory and shelf life of
cereal beverage were investigated (Adedokum et al., 2012). The hurdle effect of local
spices, refrigeration and/or freezing increased the shelf life, physicochemical and sensory
(flavor) of the beverage.
38
2.12.2.6 Effect of preservatives on cereal beverage
The effect of preservatives only and in combination with pasteurisation on microbiological
qualities of Kunun zaki were investigated by Ayo et al. (2013) using four varied levels
(0.01 - 0.05%) of sodium benzoate and metabisulphite as preservatives on the
physicochemical, sensory and microbial quality. The unpasteurised beverage had high
total acidity, while the pasteurised beverage with 0.05% sodium metabisulphite had low
total acidity. The decrease was due to the destruction of Lactobacillus spp. by heat and
chemical preservatives. The total soluble solids decreased in all samples over storage
time due to breakdown of sugars by surviving organisms. The protein content was high in
unpasteurised samples (4.25 - 4.31%) whereas pasteurised samples had a 10%
denatured protein. The increase in protein of unpasteurised (UP) samples was due to
protein hydrolysis during fermentation. There was an increase in total solids and moisture
content while a decrease in ash content over storage time was observed. The latter was
due to the increased metabolism of nutrients. The microbial quality of the beverage
improved in pasteurised and preserved samples. There was high microbial count in
unpasteurised samples which increased with storage period. It was noted that the
microbial count decreased with a reduction in the level of chemical preservatives. This
was due to the inhibitory and destructive effect of chemical preservatives against yeast,
mould and bacteria (Ayo et al., 2013). Unpasteurised beverage had high count of
microorganims than pasteurised beverage which increased on storage. The pasteurised
samples had high count of 4 x 10³ cfu/ml which indicated that pasteurisation was not
effective or recontamination after processing and/or package leak. There was no
microbial growth in 0.0.3 - 0.05% sodium benzoate samples. Sodium metabisulphite (0 -
0.05%) samples had no growth at the beginning of storage, however, there was growth in
subsequent storage which could be due to recontamination as a result of leak in
packaging. The sensory qualities showed that 0.03% sodium benzoate was most
preferred (Ayo et al., 2013).
Hussain et al. (2014) investigated the effect of niacin (400 RU/ml) at 1% and
potassium sorbate (0.15%) on the shelf life of sorghum based fermented milk beverage
and combination of preservatives and thermal treatment (65°C for 5 min). The use of
potassium sorbate only was the best preservation enhancing the shelf life of the beverage
at refrigeration conditions. The use of many food additives including preservatives is still
a subject of debate among academics. The additives are believed to cause a lot of
reactions in humans, estimated at a rate of 1% in adults and 2% in children
(Abdulmumeen, 2012). Chemical preservatives such as sodium benzoate and potassium
39
sorbate are used in the preservatives of cereal beverages to extend their shelf life.
However, consumers of cereal beverages demand fresh and safe foods with no added
chemically synthesized preservatives which opens doors for research into naturally
synthesized preservatives such as bacteriocins, organic acids, essental oils and phenolic
compounds (Aneja et al., 2014). Sulphites causes a variety of symptoms while benzoates
are responsible for asthma, allergic rhinitis, chronic urticaria (Oliphant, 2012). Thus, most
heath conscious consumers prefer clean label on food products.
2.12.2.7 Production of quality cereal malt
Cereal malts are used in various non-alcoholic beverages where they act as carriers for
fermenting microorganisms (inoculum). Malting of cereal grains under favourable
conditions of heat and humidity leads to a product rich in enzymes, vitamins and other
soluble compounds. The process is carried out in three phases, namely, soaking,
germinating and drying. Traditionally, malting is done by women at home under
uncontrolled conditions which pose a health risk due to the cyanogenic compounds,
enterobacteria or moulds which can grow. This uncontrolled process conditions could
also affect the enzymatic activity including amylase and affect the organoleptic qualities.
Traditional malt production could also generate aflotoxins in excess of 8 µg/kg
recommended as a limit by Codex Alimentarius. In view of this, soaking of grains in
alkaline solution could be implemented as an improvement to increase the grains diastatic
properties and control bacterial population. As suggested by Hounhouigan (2010), the
production of quality malts can create an inoculum for production and marketing for high-
quality malts to use in beverages. The effects of roasted malt on the physicochemical
characteristics of non-alcoholic maize beverage were investigated by Akonor et al. (2014).
Maillard and caramelisation which took place in roated beverages caused the beverage to
be darker in comparison to traditional beverage. The was no significant differences
between the beverage made with roasted malt and traditional beverage. This idicated that
roasted malt could be used to produce non-alcoholic beverages during commercialisation
instead of using commercial caramel.
2.13 Importance of fermented beverages in Africa
A number of methods such as genetic improvement and amino acid supplementation with
protein rich concentrates or other protein rich sources have been used to improve
nutritional qualities of cereals (Coulibaly et al., 2011). In addition, processing technologies
such as cooking, sprouting, milling, and fermentation have been put into practice to
improve the nutritional properties of cereals. Fermentation is the most simple and
40
economical way of improving the nutritional value, sensory and functional qualities of
cereals (Hui, 2012). Several changes occur during fermentation of cereals such as the
increase of biological availability of essential amino acid such as lysine and starch and the
decreases in fibre while the vitamins vary depending of raw materials used (Hui, 2012).
The major objective of fermentation is to extend shelf life of beverage products
(Marshall & Mejia, 2011). In addition, fermentation makes the beverage to be wholesome,
acceptable and of improved quality (Marshall & Mejia, 2011). Fermented beverages have
contributed to cultural evolution and preservation since 800 BC (Marshall & Mejia, 2011).
During the production of cereal beverages, various sectors within the economy will supply
water, sugar, cereals (farms), packaging, fuel and power. The purchase of these goods
and/or services will have an economic benefit. Commercialisation of non-alcoholic cereal
beverages (NACB) would employ people both in the production of the beverages and
indirectly at the farms, spend on capital expenditure and tax contribution. There will be an
indirect boost on direct suppliers in terms of production, employment and tax revenue.
The economy will also benefit indirectly when the farmers, their employees and their
families re-spend in the country’s economy further boosting economic activities. The
gross domestic product (GDP) of the continent which recently grew to an estimate of 5%
(2001 – 2014) from 2% (1980 – 1990) will be boosted through the production and sales of
NACB locally and abroad resulting in foreign earnings (Chelule et al., 2010). Other
sectors which will benefit on the long run include insurance companies, finance,
wholesale, transport, catering and accommodation and storage among others.
Food fermentation has many advantages and disadvantages. Some advantages
include the conversion of sugars and other carbohydrates such as juice to wine, grain to
alcohol, sugars in to organic acids. Other effects of food fermentation are the controlled
action of microorganisms that alter the texture of food, to preserve and produce
characteristic flavours and aromas. Additional benefits of fermented beverages as
reported by Marshall & Mejia (2011) include (i) food security and cultural importance, (ii)
nutritional and health benefit, (iii) benefits to small scale farmers, (iv) value-added
products, (v) employment benefits and (vi) gender development.
2.13.1 Food security and cultural identity
Fermented non-alcoholic cereal beverages serve as food security items for millions of
marginalised and vulnerable people around the globe. Fermentation is a food processing
way of preserving perishable food, thus bringing benefits to people. It offers the
opportunity for a range of raw materials that can be used and remove anti-nutritional
41
factors making food safe to eat. The process is cheaper to set up and energy efficient,
which is accessible to the marginalised, landless, physically incapacitated rural, semi-
urban and urban poor people. It makes use of less sophisticated equipment to undertake
or less subsequent storage for fermented product. Fermentation is still seen as a
substitute for refrigeration, safe keeping of food and utilised to make edible left overs.
Food fermentations are culturally important; they have been passed from one generation
to another. The variety of fermented foods and beverages reflects cultural diversity and
cuisine. People carry their type of fermented foods and beverages as they migrate among
countries.
2.13.2 Nutritional and health benefit
The nutrition and health of a human depend on a balanced supply of food and water. The
most susceptible group to malnutrition are women, children and weaning infants. It is
predicted that approximately 30% of women consume less than recommended daily
energy and at least 40% of them suffer from iron-deficiency (Marshall & Mejia, 2011).
Fermented beverages provide one third of worldwide diet and cereal are important raw
materials in fermented beverages. Fermentation makes beverages safe, nutritious,
palatable, improve digestible proteins and carbohydrates and remove toxins. Cereals
used as substrates contain anti-nutritive compounds and reduced availability of minerals,
calcium, iron, magnesium and zinc; and deficiencies in essential amino acid, which are
building blocks for proteins (Marshall & Mejia, 2011). However, fermentation of cereals
improves the nutritional value of protein quality. Beverages are made up of a lot of water
and this help prevent dehydration for millions of people in sunny Africa. The mechanisms
of probiotics are still not well understood, but are commonly suggested to relate to (i)
pathogen interference, (ii) exclusion or antagonism, (iii) immune modulation, (iv)
anticarcinogenic and antimutagenic activities, (v) alleviation of lactose intolerance
symptoms, (vi) reduction in serum cholesterol levels, (vii) reduction in blood pressure, (viii)
prevention and decreasing incidence and duration of diarrhoea, (ix) prevention of bacterial
vaginisos and (x) urinary tract infection, (xi) maintenance of mucosal integrity , and (xii)
improved odontal health (Franz et al., 2014).
2.13.3 Farmer benefit
A fermentation business requires minimal entry costs to set up and run, because it uses
produce from the farm and has no major impact on farm production and labour as most of
the job is carried out by fermenting microorganisms. Produces not sold to commercial
42
producers can be used for small scale fermentation. The fermentation enterprise can use
raw materials from other farm by-products. Farm by-products can also be made from
fermented products to enhance livestock nutrition and health. Fermented livestock wastes
are excellent source of energy (Marshall & Mejia, 2011).
2.13.4 Range of fermented products
Fermentation enterprises involve adding value to produce on the farm and its by-products.
This can increase income to the farmer and extend the shelf life of products.
Fermentation results in the production of nutritionally enriched, staple food products from
substrates with low value carbohydrates and protein. It also improves the flavour, aroma,
texture and appearance of food. It increases the range of products to be sold thus adding
value to farmer produce.
2.13.5 Employment benefits
Large scale fermentation business involves setting-up process, preparation, packaging,
marketing and all of these involve employing people. However, most of employment
comes from small scale fermentation enterprise that employs few people commonly
related members. Traditional and small scale fermentation enterprises are popular in
remote areas with limited resources. Popularity of fermented products will have the
potential to increase employment options due to increased demands leading to more
sales. This business when set up on farms will provide immediate family members with
employment and advance their knowledge through training in fermentation, skills such as
process management, quality control, business management and/or transferable skills will
be gained. These enterprises may also create indirect jobs by requiring other inputs not
available on farms such as sugar, transport, packaging or marketing.
2.13.6 Empowerment
Fermentation is normally done on farms by women. This represents an economic
opportunity for women in farms since the start-up capital is low and no particular assets
are required and not physically challenging. As fermentation skills are passed down
among generations from mother to daughter, women are the most traditionally
knowledgeable people on fermentation processes. The fermentation process is not labour
intensive and can be combined with other household responsibilities such as child-care
and allow flexible hours. However, due to marketing, women are required to leave their
homes to earn a living elsewhere. This in turn empowers them through social and
43
business interaction. They develop literacy and numeracy skills to improve the status of
their community. The earning generated provide for their family needs, and security in
case of abandonment and widowhood.
2.14 Trends in the near future of commercialization and production of non-
alcoholic cereal beverages
Food supply and demands globally are projected to substantially undergo transformations
in consumption pattern, technologies, policies and international trade. The change in food
consumption is mainly due to population and income growth and changes in food habits.
Although most of the population in Africa still leaves in rural areas this is likely to improve
as the income is expected to rise in many developing countries. Many people in
developing countries are likely to demand foods that are healthy, nutritious and have
theurapic value as they become conscious of what they eat. As such the demand for
traditional foods such as the non-alcoholic cereal beverages (NACB) is likely to grow.
Due to factors such as urbanization, the growing number of females in the workplace and
single person household the demand for convenient food is likely to increase. Indigenous
food such as NACB may considerable benefit the consumers’ need of greater variety in
food of which they are familiar with (Henderson, 1998). The beverages are cheap and the
cereal used is widely grown. Although there has been a growing scientific interest in
these beverages, the age-long techniques used during their production still need to be
improved for industrialization (Brian, 1998). The fermentation of cereal for beverages
production with health-promoting properties (functional) is well known in Africa. The
global production and demand of functional beverages is growing, it was said to have
increased by 1.5 fold between 2003 and 2010, by 22.8% between 2010 and 2014 with the
value of €29.8 billion and have been around €65 billion in 2016 (Mash et al., 2014). The
availability of technology and product development processes is paving the path to get
these beverages to the store shelves (Gaffa et al., 2002). In addition, beverage producers
have a chance to improve the acceptability of the beverages due to advancement in
technologies. This opens opportunities for manufacturers to respond quickly to consumer
demands. There is a need to move this household fermentation technology to an
industrial scale to meet the increasing consumer demand.
2.15 Chemometrics
Chemometrics is the branch of chemistry which deals with the evaluation of chemical data
and ensures that data collected from experiments contain maximum information (Otto,
44
2007). The notation chemometric was developed in 1972 by Swede, Svante Wold, and
the American, Bruce Kowani (Otto, 2007). It originates in chemistry and applied in the
development of qualitative structural activity relationships and/or in the evaluations of
analytical chemical data. Chemical systems or process are too complicated to understand
fully by theory hence, chemometrics is necessary to achieve information (Wold, 1995).
2.16 Conclusion
Pearl millet is a principal source of energy, protein, vitamins and mineral and is able to
grow in a broad range of ecological environment. However, this nutritional quality is
considered lower due to the presence of anti-nutritional factors which results in poor
digestibility of proteins and carbohydrates. Fermentation of pearl millet removes anti-
nutrients such as phytic acid and tannin and improves the digestibility of complex proteins.
Due to the nutritional richness and growth conditions of pearl millet, it has the potential to
be used in fermented beverages.
45
References
Abdulmumeen, H.R. (2012). Foods: its preservatives, additives and applications.
International Journal of Chemical and Biochemical Sciences, 36-47.
Abidoye, O. (2017). Fortification of Kunun-zaki with cocoa powder. African Journal of
Food Science, 11(4), 112-123.
Abimbola, A.N., Adeniyi, R.O. & Faparusi, F. (2013). Microbiological, physicochemical and
sensory assessment of improved Kunun-zaki beverage made from Millet and
stored under different storage conditions. International Journal of Food Safety,
Nutrition, Public Health and Technology, 5(2), 8-13.
Achi, O.M. & Ukwuru, M. (2015). Cereal-based fermenting foods of Africa as functional
foods. International Journal of Microbiology and Application, 2(4), 71-83.
Adedokum, I.I., Okorie, S.U., Nwokeke, B.C. & Onyeneke, E.N.. (2012). Effect of
Aframomum danelli and black pepper extract on physicochemical and sensory
properties of Kunun-zaki during storage. Journal of Food Technology, 10(3), 97-
102.
Adelakan, A.O., Alamu, A.E., Arisa, N.U., Adebayo, Y.O. & Dosa, A.S. (2013). Nutritional,
microbiological and sensory characteristics of malted soy- Kunu zaki: an
improved traditional beverage. Advances in Microbiology, 3, 389-397.
Adinsi, L., Vleira-dalode, G., Akissoe, N., Anihouvi, V., Mestres, C., Jacobs, A., Dlamini,
N., Pallet, D. & Hounhouigan, D.J. (2014). Processing and quality attributes of
gowe: a malted and fermented cereal-based beverage from Benin. Food Chain,
4(2), 1-13.
Akoma, O., Daniel, A.A., Ajewole, A.E. & Nwodo, P.G. (2014). Quality characteristics of
Kunun-zaki (A Nigerian fermented cereal beverage) sold within Bida metropolis.
Global Advanced Research Journal of Agricultural Science, 3(9), 298-303.
Akonor, P.T., Tortoe, C. & Oduro-Yeboah, C. (2014). Physicochemical characteristics of
non-alcoholic beverages produced from malted roasted varieties of maize (Zea
mays). International Journal of Food Science and Nutrition Engineering, 4(1), 20-
26.
Al-Qadiri, H., Al-alami, N., Lin, M., Al-Holy, M., Cavinato, A.G. & Rasco, B.A. (2008).
Studying of the bacterial growth phases using fourier transform infrared
spectroscopy and multivariate analysis. Journal of Rapid Methods & Automation in
Microbiology, 16, 73-89.
Amarender-Reddy, R.A., Yadav, O.P., Dharm, P.M., Singh, I.P., Ardeshna, N.J., Kundu,
K.K., Gupta, S.K., Rajan, S., Sawargaonkar, G., Moses, S.D. & Sammi, R.K.
46
(2013). Utilization pattern, demand and supply of pearl millet grain and fodder in
Western India. Working Paper Series no. 37. Patancheru 502 324, Andhra
Pradesh, India. India: International Crops Research Institute for the Semi-Arid
Tropics.
Amusa, N.A. & Odunbaku, O.A. (2009). Microbiological and nutritional quality of hawked
Kunun (a sorghum based non-alcoholic beverage) widely consumed in Nigeria.
Pakistan Journal of Nutrition, 8(1), 20-25.
Andreas, J. (2013). Trends of pearl millet (Pennisetum glaucum) yields under climate
variability conditionsin Oshana region, Namibia. MSc Thesis in Landscape Ecology
and Nature Conservation. University of Greifswald, Germany.
Aneja, K.R., Dhiman, R., Aggarwal, N.K. & Aneja, A. (2014). Emerging preservation
techniques for controlling spoilage microorganisms in fruit juices. International
Journal of Microbiology, 1-14.
Apena, A., Opeolu, S.O., Bamidele, F.A. & Shittu, A. (2015). Nutrient changes during
fermentation of some selected cereals. Sky Journal of Biochemistry Research,
4(2), 10-12.
Arunachalam, A. (2010). Millets: an old concept to adapt to new change, Pp. 11-13. ICAR.
Meghalaya
Awobusuyi, T.D. (2015). Quality and storage stability of provitamin a biofortified amahewu,
a non-alcoholic cereal beverage. Master of Technology (Food Technology). Durban
University of Technology. Durban, South Africa.
Ayo, J.A., Ayo, V.A., Yelmi, B., Onuocha, G. & Ikani, M.O. (2013). Effect of preservatives
on microbiological qualities of Kunun zaki. International Journal of Agricultural
Science Research, 2(5), 124-130.
Basavaraj, G., Rao, P.P., Bhagavatula, S. & Ahmed, W (2010). Availability and utilisation
of pearl millet in India. Open Access Journal, 8, 1-6.
Bassey, E.E. (2013). Trends in fermentation process, purification and recovering of
biomolecules: a review. International Journal of Agriculture and Biosciences , 2(6),
340-343.
Beasley, S. (2004). Isolation, identification and exploitation of lactic acid bacteria from
human and animal microbiota. Academic Dissertation in Microbiology. University
of Helsinki, Finland.
Bede, E.N., Okeke, C.E. & Amandikwa, C. (2015). Physicochemical properties and
sensory evaluation of kunun-zaki beverage produced by substitution of sweet
47
potatoes with date fruits. Journal of Environmental Science, Toxicology and Food
Technology (IOSR-JESTFT), 9(3), 81-84.
Bello, Z.A. (2013). Characterisation and modelling of water use by amaranthus and pearl
millet. Dissertation for the degree in Doctor of Philosophy in
Agrometeorology/Agronomy. University of the Free State . South africa.
Bio-Medicine (BM). (2003-2012). Fermentation Basics. Bio-Medicine. [Internet Document].
URL http://news.bio-medicine.org/?q=biology-technology/fermentation-basics-1541.
Accessed 27/04/2014.
Brian, J. (1998). Microbiology of fermented foods (Vol. II). Blackie Academic &
Professional. United Kingdom.
Campos, F.M., Figueiredo, A.R., Hogg, T.A. & Couto, J.A. (2009). Effect of phenolic acid
on glucose and organic acid metabolism by lactic acid bacteria from wine. Food
Microbiology, 26, 409-414.
Caylak, B. & Sukan, E.V. (1998). Comparison of different production processes for
bioethanol. Turkish Journal of Chemistry. 22, 351-359.
CFC & ICRISAT. (2004). Alternative uses of sorghum and pearl millet in Asia. CTC
technical paper No. 34. Common Fund for Commodities & International Crops
Research for Institute for Semi-Arid Tropics. Netherlands
Chauhan, S. (2012). Screening of potential probiotic lactic acid bacteria from water fish
intestine. Master Degree in Life Science thesis. National Institute of Technology,
Rourkela .
Chelule, P.K. Mokoena, M.P & Gqaleni, N. (2010). Advantages of traditional lactic acid
bacteria fermentation of food in Africa. Current Research, Technology and
Education Topics in Applied Microbiology and Microbial Biotechnology, 1160-
1167.
Chen, H.C., Lin, C.W. & Chen, M.J. (2006). The effect of freeze drying and rehydration on
the survival of microorganisms in kefir. Asian-Australasian Journal of Animal
Sciences, 19(1),126-130.
Chisti, Y. (1999). Fermentation (Industrial): basic considerations. In. Encyclopedia of Food
Microbiology.(edited by R. Robinson, C. Batt & P. Pattel). Pp. 663-674. London:
Academic Press.
Chitalu, G. (2013). Genetic characteristics of pearl millet (Penisetum glaucum (L.) R. Br.)
genotype in Zambia. Dissertation for the Degree in MSc Plant Breeding and Seed
System. The University of Zambia, Lusaka.
48
Clarke, A. (2013). Biology: metabolism, microbiology and homeostasis. Oxfordshire: Philip
Allan.
Colombie, S., Malherbe, S. & Sablayrolles, J. (2007). Modeling of heat in tanks during
wine-making fermentation. Elsevier: Food Control, 18, 953-960.
da Vinci, L. (2009). Microorganisms and food. education and culture lifelong learning
programme. Pp. 1-26.
Deepe, M. & Vilayakumar, T.P. (2013). Optimizing alkali concentration and steeping time
in sodium metabisulfite method of starch extraction from sorghum. International
Journal of Current Trends in Research, 2(1), 7-13.
del Rio, A. & Simpson, B.M. (2014). Agricultural adaptation to climate chamnge in the
Sahel: A review of fifteen crops cultivated in the Sahel. Vermont: Tetra Tech ARD.
Diaz-Montano, D. (2014). Continuous agave juice fermentation for producing bioethanol.
INTECH, 8, 209-230.
Directorate Plant Production [DPP]. (2013). Most common indigenous food crops of South
Africa. Pp. 1-22.: Department of Agriculture, Forestry and Fisheries. Pretoria.
Directorate Plant Production [DPP]. (2011). Production guidelines - pearl millet. Pp. 1-12.:
Department of Agriculture, Forestry and Fisheries. Pretoria.
Egbere, O. P. (2009). Effects of pasteurization on survival patterns of microorganisms and
vitamin C retention in Kunun-zaki. African Journal of Biotechnology, 8(23), 6603-
6607.
Enfors, S. -O. (2008). Food microbiology. Stockholm. Pp.1-89.
Evans, C.E., Omoaruemike, E.O. & Mohammed, A.V. (2013). Effect of fermentation
variables on nutritional and organoleptic scores of Kunu-zaki produced from rice
and acha blends. Advance Journal of Food Science and Technology, 5(9), 1117-
1119.
FAO. (2002). Comprehensive Africa agriculture development programme. Extending the
area under sustainable land management and reliable water control system.
NEPAD. Food and Agriculture Organization of the United Nations. [Internet
Document]. URL http://www.fao.org/docrep/005/y6831e/y6831e-03.htm. Accessed
25/07/2016.
FAO: Economic and Social Development Department. (1996). The world sorghum and
millet economies: facts, trends and outlook. [Internet Document]. FAO. URL
http://www.fao.org/docrep/w1808e/w1808e0f.htm#TopOfPage.
Accessed 06/04/2014.
FAOSTAT. (2015.). FAOSTAT. [Internet Document].
49
URL: http://faostat3.fao.org/download/Q/QC/E. Accessed 20/07/2016.
FDA. (2013). Evaluation and Definition of Potentially Hazardous Foods - Chapter 3.
Factors that Influence Microbial Growth. U.S Food and Drug Administration.
[Internet Document].
URL https://www.fda.gov/Food/FoodScienceResearch/ucm094145.htm. Accessed
22/07/2017.
Folasade, M. & Oyenike, O. (2012). Effect of sesame seed addition on the chemical and
sensory qualities of sorghum based Kunun-zaki drink. African Journal of Food
Science and Technology, 3(90), 204-212.
Fox, A. (2010). Nutrition, growth and metabolism. Pp. 1-5. Medical Microbiology, PAMB.
Franz, C.M.A.P., Huch, M., Mathara, J.M., Abriouel, H., Benomar, N., Reid, G., Galvez, A.
& Holzapfel, W.H. (2014). African fermented foods and probiotics. International
Journal of Food Microbiology, 19, 84-96.
Gadaga, T.H., Lehohla, M. & Ntuli, V. (2013). Traditional fermented foods of Lesotho.
Journal of Microbiology, Biotechnology and Food Sciences, 2(6), 2387-2391.
Gadaga, T.H., Mutukumira, A.N., Narvhus, J.A. & Feresu. S.B. (1999). A review of
traditional fermented foods and beverages of Zimbabwe. International Journal of
Food Microbiology, 53, 1-11.
Gaffa, T., Jideani, L.A. & Nkama, I. (2002). Traditional production, consumption and
storage of Kunu- a non-alcoholic cereal beverage. Plant Foods for Human
Nutrition, 57, 73-81.
Gari, J.A. (2001). Review of the African millet diversity. International workshop on fonio,
food security and livelihood among the rural poor in West Africa. Pp. 1-9. FAO.
Mali
Gelati, A., Oguntoyinbo, F.A., Moschetti, G., Crescimanno, M. & Settanni, L. (2014). The
cereal market and the role of fermentation in cereal-based food production in
Africa. Food Review International, 30, 317-337.
Gramene. (2014). Millet agronomic statistics. Gramene pennisetum. [Internet Document].
URLhttp://archive.gramene.org/species/pennisetum/pearlmillet_maps_and_stats.
html#faostat. Accessed 18/04/2014.
Grazina, J., Elena, B., Pranas, V., Dalia, U., Dalia, E.& Bobinas, C. (2012). Fermentation
process using lactic acid bacteria producing bacteriocins for preservation and
improving functional properties of food products. In M. edited by Prof. Petre,
Advances in Applied Biotechnology. Pp. 1-288. Croatia.
50
GRNBA. (2012). GRNBA. Decomposition to fermentation. [Internet Document]. URL
http://grnba.com/?page_id=11&lang=en. Accessed 21/04/2014.
Guarino, L. (2012). Global strategy for the ex situ conservation of pearl millet and its wild
relatives. ICRISAT.
Guizani, N. & Mothershaw, A. (2005). Fermentation: general principles. In Unknown,
Handbook of Food Science, Technology, and Engineering, Vol. 2. Pp. 63-1- 63-
21. Sultan Qaboos University:Taylor & Francis Group, LLC.
Haard, N. H., Odunfa, S. A., Lee, C. H. & Quintero-Ramirez, R. (1999). Fermented cereal.
A global perspective. Rome: FAO Agricultural Services Bulletin.
Halasz, A. (2011). Lactic acid bacteria. Encyclopedia of Life Support Systems: Food
Quality and Standards, Vol. 3. Pp. 1-6.
Henderson, D. (1998). Between the farm gate and the dinner plate: motivations for
industrial change in the processed food sector. Organization for Economic Co-
operation and Development (OECD). Paris, France
Himeno, K., Inoue, N., Kurauchi, N., Ito, O., Nishikawa, Y. & Kobayashi, Y. (2009). Minor
cereal in Niger. Focusing on pearl millet and sorghum. Japan Association for
International Collaboration of Agriculture and Forestry (JAICAF). p.39.
Hounhouigan, J. (2010). Production of quality sorghum or millet malt for small-scale or
semi-industrial food production in West Africa. Benin, Burkina Faso: DURAS.
Hui, Y. H. (2012). Handbook of plant-based fermented food and beverage technology.
Broken Sound Parkway NW: CRC Press.
Hussain, S.A., Garg, F.C. & Pal, D. (2014). Effect of different preservative treatments on
the shelf-life of sorghum malt based fermented milk beverage. Journal of Food
Science and Technology, 51(8), 1582-1587.
ICRISAT. (2014). Pearl millet taxonomy. ICRISAT. [Internet Document]. URL
http://www.icrisat.org/what-we-o/crops/PearlMillet/Taxonomy/pframe3.htm.
Accessed 06/04/2014.
Ishikawa Prefecture (IP). (2007). Fermentation and Food culture of Ishikawa Prefecture.
Ishikawa. [Internet Document].
Jain, R.K. & Bal, S. (1997). Properties of pearl millet. Journal of Agricultural Engineering
Research, 66, 85-91.
Jones, M. (2015). 8 ways Africa can raise farm productivity and boost growth., from World
Economic Forum. (Internet Document]. URL
https://www.weforum.org/agenda/2015/06/8-ways-africa-can-raise-farm-
productivity-and-boost-growth/. Accessed 22/07/2017.
51
Judeikiene, G., Bartkeiene, E., Viskelis, P., Urbanavicience, D., Eidukonyte, D. & Bobinas,
C. (2012). Fermentation processes using lactic acid bacteria bacteriocins for
preservation and improving functional properties of food products. Advances in
Applied Biotechnology, 63-100.
Kajuna, T.A. (2001.). Millet. 'Post-harvest operations'.(Edited by D. Mejia & B Lewis). Pp.
1-5. Sokole University of Agriculture.
Kang, X. (2000). UMBC. Batch Culture and Continuous Cultivation. [Internet Document].
URL http://userpages.umbc.edu/~xkang/ENCH772/advantage.htm. Accessed
21/04/2014.
Katangole, J.N. (2008). The microbial succession in indigenous fermented maize
products. MSc Agriculture Thesis. University of Free State, Bloemfontein.
Khairwal, I.S., Rai, K.N., Diwakar, B, Sharma, Y.K., Rajpurohit, B.S. Nirwan, B. &
Bhattacharjee, R. (2007). Pearl millet: Crop management and seed production
manual. Pp. 1-111. India: ICRISAT.
Kohajdova, Z. & Karovicova, J. (2007). Fermentation of cereal for specific purpose.
Journal of Food and Nutrition Research, 46(2), 51-57.
Kolawole, O.M. & Kayode, R.M.O. (2013). Proximate and microbial analyses of burukutu
and pito produced in Ilorin, Nigeria. African Journal of Microbiology, 1 (1), 015-
017.
Kong, F., Singh, R. P. (2011). Chemical deterioration and physical instability of foods and
beverages. Woodhead Publishing Limited. University of California., Pp.29-62.
Konig, H. & Frohlich, J. (2009). Lactic acid bacteria. In H. U. Honig, Biology of
microorganisms on grapes, in must and in wine (p. 5). Berlin- Heidelberg:
Springer-Verlag.
Kumar, J. (2012). Slideshare. Batch and continuous cultures: [Internet Document]. URL
http://www.slideshare.net/jayak1/02-batch-and-continuous-culture#. Accessed
21/04/2014.
Lambert, R. (2011). A new model for the effect of pH on microbial growth: an extension of
the gamma hypothesis. Journal of Applied Microbiology, 110(1), 61-68.
Lee, C. (2014). Millet. Kentuchy: University of Kentuchy. p. 1.
Lee, J.M. (2001). Agitation and aeration. Pullman. Pp. 1- 45: Washington State University:
Department of Chemical Engineering.
Lestienne, I., Buisson, M., Lullien-Pellerin, V., Picq, C. & Treche, S. (2007). Losses of
nutrients and anti-nutritional factors during abrasive decortication of two pearl
millet cultivars (Pennisetum glaucum). Food Chemistry, 100, 1316-1323.
52
Maji, A.A., James, O. & Chigozie, O.E. (2011). Effect of chemical treatment and
pasteurization on the shelf-life of Kunun-zaki (sorghum and maize cruel).
European Journal of Food Research & Review, 1(2), 61-70.
Malik, S. (2015). Pearl millet-nutritional value and medicinal uses! International Journal of
Advance Research and Innovative Ideas in Education, 1(3), 414-418.
Marsh, A.J, Hill, C., Ross, R.P. & Cotter, P.D. (2014). Fermented beverages with health-
promoting potential: Past and future perspectives. Agriculture and Food
Development Authority, 1-32.
Marshall, E., & Mejia, D. (2011). Traditional fermented food and beverages for improved
livelihoods, Pp. 1-79. Rome: Rural Infrastructure and Agro-Industries Division &
FAO.
Mash, A.J., Hill, C., Ross, P. & Cotter, P.D. (2014). Fermented beverages with health-
promoting potential: Past and future perspectives. Trends in Food Science &
Technology, 38(2), 113-124.
Masuda, T. & Goldsmith, P. D. (2009). World soybean production: area harvested, yield
and long-term projections. International Food and Agricultural Management
Review, 12(4), 143-162.
Maukonen, J., Matto, J., Wirtanen, G., Raaska, L., Mattila-Sanholm, T. & Saarela, M.
(2003). Methodologies for the characterization of microbes in industrial
environments: a review. Journal Industrial Microbiology Biotechnology, 30, 327-
356.
MHRD. (2014). Value at Amrita. Bacterial growth curve. [Internet Document]. URL
http://amrita.vlab.co.in/?sub=3&brch=73&sim=1105&cnt=1.
Accessed 27/04/2014.
Millet Network of India (MINI). (2009). Millets future of food and farming. Pp. 1-16. Decan
Development Society.
Mitaru, B.N., Mgonja, M.A., Rwomushana, I. & Opio, F. (2012). Integrated sorghum and
millet sector for increased economic growth and improved livelihoods in Eastern
and Central Africa. Proceedings of the ECARSAM Stakeholders Conference. Dar
es Salaam, Tanzania. Tanzania: ASARECA (Association for Strengthening
Agricultural Research in Eastern and Central Africa).
Mkondweni, N.S. (2002). Modelling and optimal control of fed-batch fermentation process
for the production of yeast. Thesis: Peninsula Technology. Department of
Electrical Engineering.
53
Morelli, L. (2001). Taxonomy and physiology of lactic acid bacteria, effects and function on
nutrition.: Instituto di Microbiology. Pp. 1-15. Italy
Moreta, D.E., Mathur, P.N., van Zonneveld, M., Amaya, K., Arango, J., Selvaraj, M.G. &
Dedicova, B. (2013). Current issues in cereal crop biodiversity. Biotechnological
Application of Biodiversity. 147, 1-35.
Mwale, M.M. (2014). Microbiological quality and safety of the Zambian fermented cereal
beverage: Chibwantu. University of the Free State. Thesis PhD in Microbiology.
Bloemfontein. South Africa:
Najafpour, G. (2006). Biochemical Engineering and Biotechnology. Elsevier, 81-85.
Namagumya, B.S. & Muyanja, C.M.B.K. (2009). Traditional processing, microbiological,
physiochemical and sensory characteristics of Kwete, a Ugandian fermented
maize based beverage. African Journal of Food Agriculture, Nutrition and
Development, 9(4), 1046-1059.
Nambiar, V.S., Dhaduk, J.J., Sareen, N., Shabu, T. & Desai, R. (2011). Potential
functional implications of pearl millet (Pennisetum glaucum) in health and
disease. Journal of Applied Pharmaceutical Science, 1(10), 62-67.
Ndulaka, J.C., Obasi, N.E. & Omeire, G.C. (2014). Production and evaluation of
reconstitutable Kunun-Zaki. Official Journal of Nigerian Institute of Food Science
and Technology, 32(2), 66-72.
Newman, Y., Jennings, E., Vendramini, J. & Blount, A. (2010). Pearl millet (Pennisetum
glaucum): overview and management. The Institute of Food and Agricultural
Science (IFAS), 1-5.
Nireesha, G.R., Divya, L., Sowmya, C., Venkateshan, N., Babu, M.N. & Lavakumar, V.
(2013). Lyophilization/freeze drying- A review. International Journal of Novel
Trends in Pharmaceutical Sciences, 3(4), 87-98.
Nkama, I., Agarry, O.O. & Akoma, O. (2010). Sensory and nutritional quality
characteristics of powdered ‘Kunun-zaki’: A Nigerian fermented cereal beverage.
African Journal of Food Science, 4(6), 364-370.
Nyakabau, T., Wokadala, O.W. & Emmambux, N. (2013). Effect of steeping additives on
tef starch extraction and its quality. Starch Journal, 65, 738-746.
Obilana, A.B. (2003.). Overview: Importance of millets in Africa. Pp. 1-18. Kenya:
ICRISAT.
Ojediran, J.O., Adamu, M.A. & Jim-George, D.L. (2010). Some physical properties of pearl
millet (Pennisetum glaucum) seeds as a function of moisture content. African
Journal of General Agriculture, 6(1), 39-46.
54
Ojimelukwe, P., Elijah, A., Ekong, U. & Nwokocha, K. (2013). Effect of different
preservatives on the shelf life of Kunun-zaki: a traditional fermented cereal non-
alcoholic beverage. Nigerian Journal of Agriculture, Food and Environment, 9(1),
76-79.
Oliphant, T.M. (2012). Contact allergy to sodium sulfite and its relationship to sodium
metabisulfite. Contact Demartitis, 66, 128-130.
Olosunde, O.O., Abiodum, O.A., Amanyunose, A.A. & Adepeju, A.B. (2014). Sensory and
nutritional characteristics of kunun-zaki enriched with Moringa (Moringa oleifera)
seed flour. American Journal of Experimental Agriculture, 4(9), 1027-1035.
Olurankinse, C.A. (2014). Strategies for sustainable food processing and preservation.
Journal of Environmental Sciences, Toxicology and Food Technology, 8(6), 31-
36.
Oluwole, O.B., Kosoko, S.B., Owolabi, S.O., Adeyoju, A.O., Banko, A.O., Ozumba, A.U. &
Elemo, G.N. (2012). Development and production of high protein and energy
density beverages from blends of maize (Zea mays), sorghum (Sorghum bicolor)
and soybeans (Glycine max) for school aged children: effect of malting period on
selected proximate parameters and sensory. International Journal of Applied
Science and Technology, 2(7), 285-292.
Onaolapo, I.O. & Busari, T. (2014). The Effect of Pasteurization on microbial growth and
sensory qualities of Sekete – a fermented maize beverage. Journal of
Environmental Science, Toxicology and Food Technology, 8(6), 51-54.
Ongol, M.P. (2012). Lactic acid bacteria in health and diseases. Rwanda Journal of Health
Sciences, 1(1), 39-50.
Oranusia, S.U., Umoh, V.J. & Kwaga, J.K. P. (2003). Hazards and critical control points of
Kunun-zaki, a non-alcoholic beverage in Northern Nigeria. Food Microbiology,
20, 127-132.
Orji, M.U., Mbata, T.I., Aniche, G.N. & Ahonkhai, I. (2003). The use of starter cultures to
produce ‘Pito’, a Nigerian fermented alcoholic beverage. World Journal of
Microbiology & Biotechnology, 19, 733-736.
Osman, M. (2011). Effect of traditional fermentation process on the nutrient and
antinutrient contents of pearl millet during preparation of Lohoh. Journal of the
Saudi Society of Agricultural Sciences, 10, 1-6.
Otto, M. (2007). Chemometrics. p. 1. WILEY-VCH Verlag GmbH & Co. KGaA. Weinheim
Oushy, H. (2008). Fact sheet pearl millet. p. 1. NM State University: Afghanistan Water,
Agriculture, and Technology Transfer Program (AWATT).
55
Prasad, P.V. & Staggenborg, S.A. (2009). Growth and production of sorghum and millets.
Soils, Plant Growth and Crop Production, 2. Kansas State University, Manhattan.
Rassi Seed [RS]. (2014). Products: Rasi seeds. [Internet document]. URL
http://www.rasi.in/rasiseeds/products.html#pearl. Accessed 01/05/2014.
Ratau, M. A. (2011). Effect of hydrocolloids on the stability and sensory properties of pearl
millet beverage. Dissertation for Degree BTech Food Technology. Pp. 1-60.
Department of Food Technology, Cape Peninsula University of Technology,
Cape Town.
Rattanachaikunsopon, P. & Phumkhachorn, P. (2010). Lactic acid bacteria: their
antimicrobial compounds and their uses in food production. Annals of Biological
Research, 1(4), 218-228.
Ray, B. (2004). Fundamental food microbiology. New York: CRC Press.
Renge, V.C. & Khedkar, S.V. (2012). Enzyme synthesis by fermentation method: A
review. Scientific Review & Chemical Communication. 2(4), 585-590.
Rodriguez-Fernandez, D.E., Rodriguez, J.A., carvalho, J.C., Karp, S.G., Sturm, S.G.
Parada, J.L. & Soccol, C.R. (2012). Influence of airflow intensity on phytase
production by solid-state fermentation. Bioscience Technology, 118, 603-606.
Rohrbach, D.D. & Mutiro, K (1998). Sorghum and pearl millet production, trade, and
consumption in southern.: SADC/ICRISAT Sorghum and Millet Improvement
Program (SMIP). Pp. 33-41. Bulawayo, Zimbabwe
Scott, C. (2004). Microbial fermentation. BioProcess International. 2(6), 8-20.
Scott, R. & Sullivan, W. C. (2008). Ecology of fermented foods. Research in Human
Ecology. 15(1), 25-31.
Sharma, P.C., Singh, D., Sehgal, D., Singh, G., & Hash, C.T. (2014). Further evidence
that a termical drought tolerate QTL of pearl millet is associated with reduced salt
uptake. Environmental and Experimental Botany, 102, 48-57.
Silva, J., Carvalho, A.S., Teixeira, P. & Gibbs, P.A. (2002). Bacteriocin production by
spray-dried lactic acid bacteria. Applied Microbiology, 34, 77-81.
Simpson, B. (2012). Food biochemistry and food processing (2nd ed.). Oxford, United
Kingdom: John & Sons, Inc.
Solange, A., Geogette, K., Gilbert, F., marcellin, D. K. & Bassirou, B. (2014). Review on
African traditional cereal beverages. American Journal of Research
Communication, 2(5), 103-153.
56
Sowonola, O.A., Tunde-Akintunde, T.Y. & Adedeji, F. (2005). Nutritional and sensory
qualities of soymilk-Kunun blends. African Journal of Food, Agriculture, Nutrition
and Development, 5(2), 1-12.
Stading, M., Oom, A. & Taylor, J.R.N. (2007). Food and non-food utilization of cereal
components.
Standburry, P.F., Whitaker, A. & Hall, S.J. (1995). Principles of fermentation technology.
UK, USA, Japan: Elsevier Science Ltd.
Standbury, P.F. (2006). Fermentation technology. Pp. 1-24.
Steinkraus, K. (1996). Handbook of indigenous fermented foods (2nd ed.). New York:
Marcle Dekker, Inc.
Terna, G. & Ayo, J.A. (2002). Innovations in the traditional Kunun-zaki production process.
Pakistan Journal of Nutrition, 1(5), 202-205.
Thiel, T. (1999). Microbes in action. Pp. 1-9. St. Louis, University of Biology: Department
of Biology. Science in the Real World.
Todar, K. (2012). Textbook of bacteriology. The growth of bacterial populations. [Internet
Document]. URL http://textbookofbacteriology.net/growth_3.html. Accessed
27/04/2014.
Upadhyaya, H.D., Reddy, K.N. & Sastry, D.V.S.S. (2008). Regeneration Guidelines: Pearl
millet. Pp. 1-9. India: ICRISAT. URL
http://shofu.pref.ishikawa.jp/shofu/dokunuki_e/gastronomic_culture/what_is_ferm
entation/. Accessed 19/04/2014.
USDA. (2012). Introduction the microbiology of food processing. Pp. 1-64. United States:
USDA.
Uvere, P.O. & Amazikwu, U.C.J. (2011). Processing and evaluation of instant kunun zaki
from millet-cowpea malt and millet-soybean malt. African Journal of Food
Science, 5(14), 761-768.
van Geel-Schutten, G.H., Flesch, F., Ten Brink, B., Smith, M.R. & Dijkhuizen, L. (1998).
Screening and characterisation of Lactobacillus strains producing large amounts
of exopolysaccharides. Applied Microbiology Biotechnology, 50, 697-703.
van Leeff, B.H.A., Kuenen, J.G. & Heijnen, J.J. (1993). Continuous measurement of
microbial heat production in laboratory fermentors. Biotechnology and
Bioengineering (John Wiley & Sons, Inc.), 41, 541-549.
Washington State University (WSU). (2014). Whatcom.wsu. Retrieved Anaerobic
fermentation [Internet Document].
57
URL http://whatcom.wsu.edu/ag/compost/fundamentals/biology_anaerobic.htm.
Accessed 08 April 2016.
Wassie, M. & Wassie, T. (2016). Isolation and identification of lactic acid bacteria from raw
cow milk. international Journal of Advanced Research in Biological Sciences,
3(8), 44-49.
Weir, E. & McSpadden, C. (2005). Production of industrial enzymes in fermentation. Pp.
1-11.
Whatcom.wsu.http://whatcom.wsu.edu/ag/compost/fundamentals/biology_anaerobic
.htm. Accessed 08 April 2016.
Wold, S. (1995). Chemometrics; what do we mean with it, and what do we want from it?
Chemometrics and intelligent laboratory systems, 30. 109-115.
Yang, P. & Seib, P.A. (1996). Wet milling of grain sorghum using a short steeping period.
Cereal Chemistry, 73(6), 751-755.
Zvauya, R., Mygochi, T. & Parawira, W. (1997). Microbial and biochemical changes
occurring during production of masvusvu and mangisi, traditional Zimbabwean
beverages. Plant Foods for Human Nutrition, 51, 43-51.
Coulibaly, A., Kouakou, B. & Chen, J. (2011). Phytic Acid in Cereal Grains: Structure,
Healthy or Harmful ways to reduce phytic acid in cereal grains and their effects
on nutritional quality. American Journal of Plant Nutrition and Fertilization
Technology, 1(1), 1-22.
58
CHAPTER THREE
ISOLATION, IDENTIFICATION AND PURIFICATION OF LACTIC ACID
BACTERIA FROM PEARL MILLET SLURRY DURING FERMENTATION FOR
NON-ALCOHOLIC CEREAL BEVERAGE
Abstract
The aim of this investigation was to isolate, identify and purify bioburden lactic acid
bacteria from naturally fermented pearl millet slurry during the production of non-alcoholic
cereal beverage (NAPMB). NAPMB was produced through natural fermentation of pearl
millet slurry at 37°C for 36 h. During the fermentation the pH, total titratable acidity (TTA),
correlated optical density (ODcorr), microbial growth (lactic acid bacteria and total viable
count) and the soluble sugar of the beverage were determined at 3 h interval. The total
viable cells were enumerated on total plate count agar and the lactic acid bacteria on
deMan Rogosa and Sharpe agar. The presumptive lactic acid bacteria were
characterized using scanning electron microscope and identified using Vitek 2 system.
There was a significant (p ≤ 0.05) difference in the total viable counts over the 36 h
fermentation. The total viable count increased from 6.98 to 7.82 log cfu/ml after 27 h.
There was a significant (p ≤ 0.05) difference in the lactic acid bacteria (LAB) at 3, 15, 21,
24, 27 and 30 h fermentation periods. The initial numbers of LAB were 7.04 log cfu/ml
and increased to 8.00 log cfu/ml after 21 h. The beverage was dominated by LAB from
the genera Leuconostoc, Pediococcus, Streptococcus and Enterococcus. There was a
significant (p ≤ 0.05) change in the pH and TTA of the beverage during fermentation. The
pH of the beverage at the start fermentation was pH 6.37 and decreased to pH 4.06 in 18
h. Thereafter, the pH did not significantly change over time. The TTA was inversely
proportional to the pH and ranged from 0.12 to 0.53% in 36 h. There was a moderate,
negative linear correlation between the LAB and pH (r = -0.535, p < 0.05). The TTA had a
very strong, negative linear correlation with the pH (r = -0.975, p < 0.05) while the yeast
and mould (YM) had a strong, negative correlation with the ODcorr (r = -0.713, p < 0.05).
Principal component analysis (PCA) showed that LAB, TTA, YM and ODcorr were
important parameters at 30 – 36 h of fermentation of pearl millet slurry during the
production of NAPMB. The optimum fermentation time for the beverage was 18 h at 37°C
with pH of 4.06.
59
3.1 Introduction
Indigenous non-alcoholic cereal beverages play a vital role in the everyday lives of people
in developing countries. They are considered as after-meal drinks or refreshing drinks
during dry season in rural and urban areas. These beverages are made up of about 90%
water, cereal powder, sugar, flavours and sometimes preservatives (Osuntogun &
Aboaba, 2004; Ikpoh et al., 2013). Different organisms are present in these traditional
beverages with raw materials being the main sources. The microbiological composition of
these products is complex and unexploited. It involves mixed cultures which may work in
parallel, while others act in a successive manner with changing principal microflora during
fermentation (Katongole, 2008).
Non-alcoholic cereal beverages (NACB) are popular in many African countries
(Terna & Ayo, 2002). The cereals mainly used in their production are millets; sorghum
and maize although composite cereals are sometimes used (Terna & Ayo, 2002). The
choice of cereal to use depend on availability and affordability. Sprouted cereals are also
used in the production of NACB. Sprouting modifies the cereal grains physically,
chemically and biologically. During sprouting the starch and proteins are hydrolysed into
sugars and amino acids, respectively. The sprouted cereal grains are a major source of
hydrolytic enzymes particularly the alpha-amylase (Akonor et al., 2014) and are used in
weaning food where they breakdown starch resulting in decreased viscosity and increase
in the nutritional value of the beverage (Grossmann et al., 1998). Rice is sometimes used
in the production of sprout because it is belived to produce a tasty beverage.
The increasing consumer awareness towards healthy diets and changing eating
habits due to urbanization has created a huge market demand for new functional foods
with beneficial effects on health (Rathore et al., 2012). Hence, the indigenous fermented
beverages are becoming popular due to their nutritional and therapeutic value. Hence,
there is a need to commercialise these beverage and make them available on the
supermarket shelves. The beverages made from cereal grains are sources of dietary
proteins, energy, vitamins and minerals (Blandino et al., 2003). Thus, starter cultures
need to be developed to produce beverages with similar and consistent quality with the
traditionally prepared beverage.
Lactic acid bacteria (LAB) are made up of the genera Carnobacterium,
Enterococcus, Lactobacillus, Lactococcus, Lactosphaera, Leuconostoc, Melissococcus,
Oenococcus, Pediococcus, Streptococcus, Tetragenococcus, Vagococccus and
Weissella. These bacteria are probiotics producing different antimicrobials such as acetic
acid, carbon dioxide and bacteriocins which are of interest. The preparation of NACB is
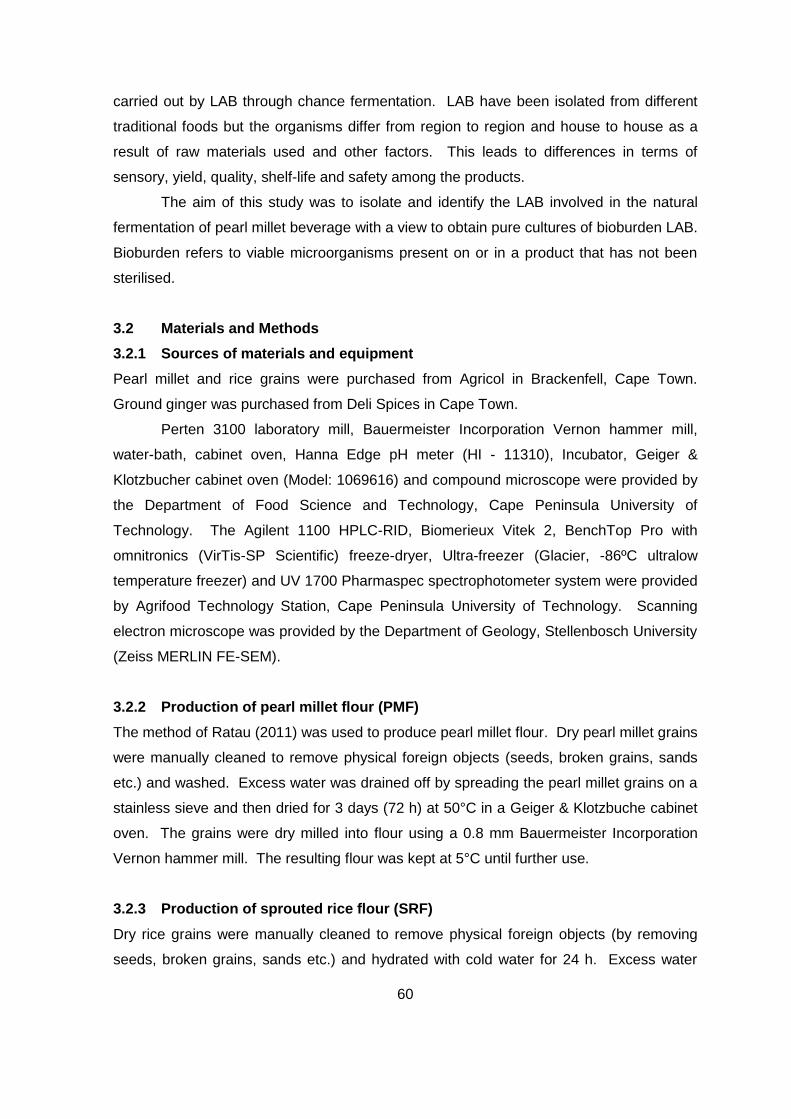
60
carried out by LAB through chance fermentation. LAB have been isolated from different
traditional foods but the organisms differ from region to region and house to house as a
result of raw materials used and other factors. This leads to differences in terms of
sensory, yield, quality, shelf-life and safety among the products.
The aim of this study was to isolate and identify the LAB involved in the natural
fermentation of pearl millet beverage with a view to obtain pure cultures of bioburden LAB.
Bioburden refers to viable microorganisms present on or in a product that has not been
sterilised.
3.2 Materials and Methods
3.2.1 Sources of materials and equipment
Pearl millet and rice grains were purchased from Agricol in Brackenfell, Cape Town.
Ground ginger was purchased from Deli Spices in Cape Town.
Perten 3100 laboratory mill, Bauermeister Incorporation Vernon hammer mill,
water-bath, cabinet oven, Hanna Edge pH meter (HI - 11310), Incubator, Geiger &
Klotzbucher cabinet oven (Model: 1069616) and compound microscope were provided by
the Department of Food Science and Technology, Cape Peninsula University of
Technology. The Agilent 1100 HPLC-RID, Biomerieux Vitek 2, BenchTop Pro with
omnitronics (VirTis-SP Scientific) freeze-dryer, Ultra-freezer (Glacier, -86ºC ultralow
temperature freezer) and UV 1700 Pharmaspec spectrophotometer system were provided
by Agrifood Technology Station, Cape Peninsula University of Technology. Scanning
electron microscope was provided by the Department of Geology, Stellenbosch University
(Zeiss MERLIN FE-SEM).
3.2.2 Production of pearl millet flour (PMF)
The method of Ratau (2011) was used to produce pearl millet flour. Dry pearl millet grains
were manually cleaned to remove physical foreign objects (seeds, broken grains, sands
etc.) and washed. Excess water was drained off by spreading the pearl millet grains on a
stainless sieve and then dried for 3 days (72 h) at 50°C in a Geiger & Klotzbuche cabinet
oven. The grains were dry milled into flour using a 0.8 mm Bauermeister Incorporation
Vernon hammer mill. The resulting flour was kept at 5°C until further use.
3.2.3 Production of sprouted rice flour (SRF)
Dry rice grains were manually cleaned to remove physical foreign objects (by removing
seeds, broken grains, sands etc.) and hydrated with cold water for 24 h. Excess water
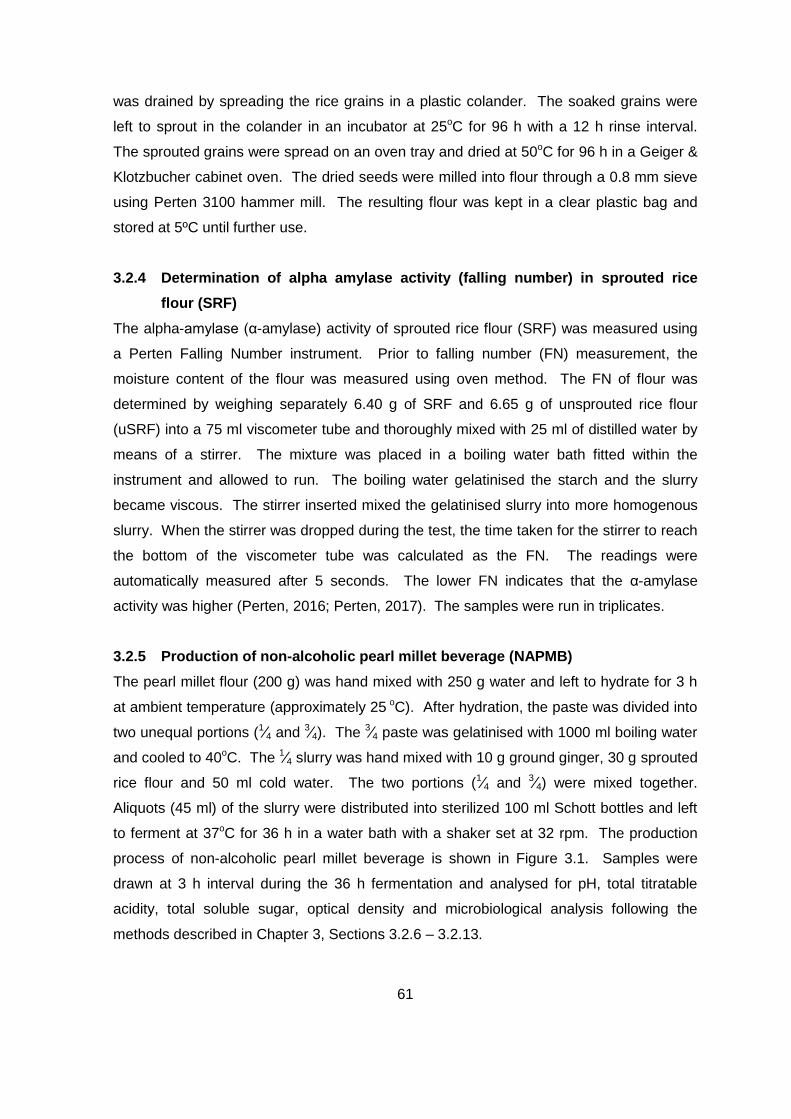
61
was drained by spreading the rice grains in a plastic colander. The soaked grains were
left to sprout in the colander in an incubator at 25oC for 96 h with a 12 h rinse interval.
The sprouted grains were spread on an oven tray and dried at 50oC for 96 h in a Geiger &
Klotzbucher cabinet oven. The dried seeds were milled into flour through a 0.8 mm sieve
using Perten 3100 hammer mill. The resulting flour was kept in a clear plastic bag and
stored at 5ºC until further use.
3.2.4 Determination of alpha amylase activity (falling number) in sprouted rice
flour (SRF)
The alpha-amylase (α-amylase) activity of sprouted rice flour (SRF) was measured using
a Perten Falling Number instrument. Prior to falling number (FN) measurement, the
moisture content of the flour was measured using oven method. The FN of flour was
determined by weighing separately 6.40 g of SRF and 6.65 g of unsprouted rice flour
(uSRF) into a 75 ml viscometer tube and thoroughly mixed with 25 ml of distilled water by
means of a stirrer. The mixture was placed in a boiling water bath fitted within the
instrument and allowed to run. The boiling water gelatinised the starch and the slurry
became viscous. The stirrer inserted mixed the gelatinised slurry into more homogenous
slurry. When the stirrer was dropped during the test, the time taken for the stirrer to reach
the bottom of the viscometer tube was calculated as the FN. The readings were
automatically measured after 5 seconds. The lower FN indicates that the α-amylase
activity was higher (Perten, 2016; Perten, 2017). The samples were run in triplicates.
3.2.5 Production of non-alcoholic pearl millet beverage (NAPMB)
The pearl millet flour (200 g) was hand mixed with 250 g water and left to hydrate for 3 h
at ambient temperature (approximately 25 oC). After hydration, the paste was divided into
two unequal portions (1∕4 and 3∕4). The 3∕4 paste was gelatinised with 1000 ml boiling water
and cooled to 40oC. The 1∕4 slurry was hand mixed with 10 g ground ginger, 30 g sprouted
rice flour and 50 ml cold water. The two portions (1∕4 and 3∕4) were mixed together.
Aliquots (45 ml) of the slurry were distributed into sterilized 100 ml Schott bottles and left
to ferment at 37oC for 36 h in a water bath with a shaker set at 32 rpm. The production
process of non-alcoholic pearl millet beverage is shown in Figure 3.1. Samples were
drawn at 3 h interval during the 36 h fermentation and analysed for pH, total titratable
acidity, total soluble sugar, optical density and microbiological analysis following the
methods described in Chapter 3, Sections 3.2.6 – 3.2.13.
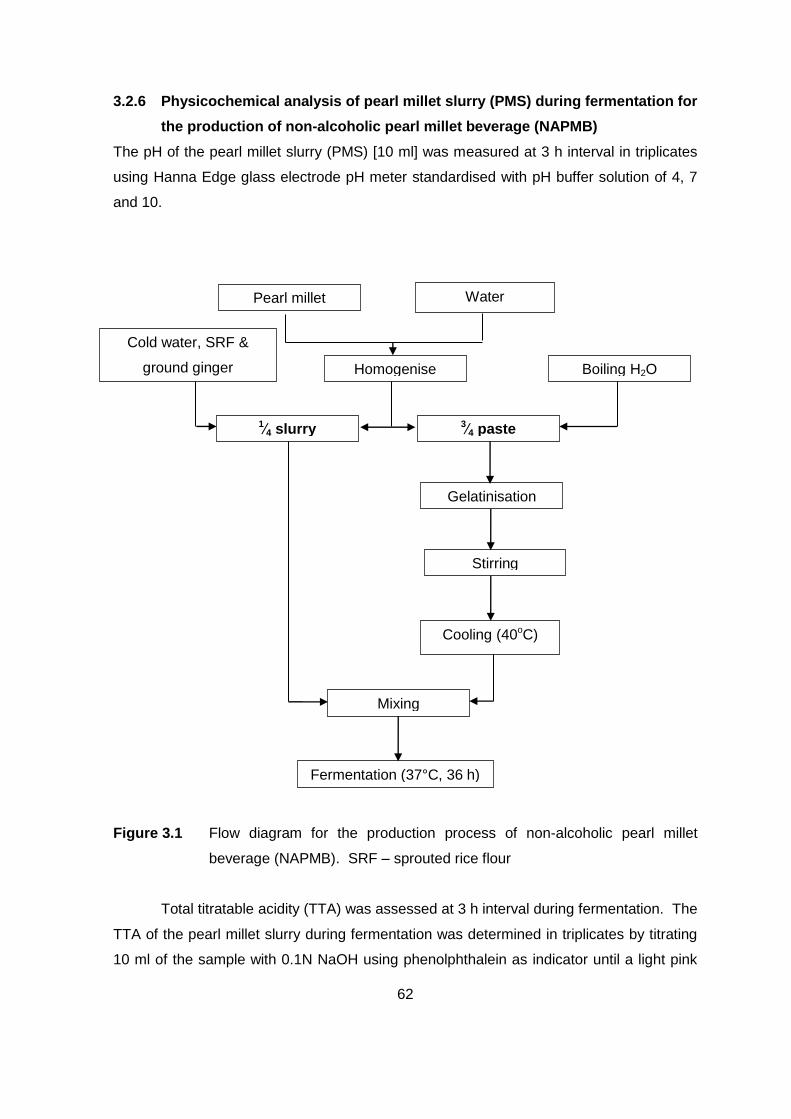
62
3.2.6 Physicochemical analysis of pearl millet slurry (PMS) during fermentation for
the production of non-alcoholic pearl millet beverage (NAPMB)
The pH of the pearl millet slurry (PMS) [10 ml] was measured at 3 h interval in triplicates
using Hanna Edge glass electrode pH meter standardised with pH buffer solution of 4, 7
and 10.
Figure 3.1 Flow diagram for the production process of non-alcoholic pearl millet
beverage (NAPMB). SRF – sprouted rice flour
Total titratable acidity (TTA) was assessed at 3 h interval during fermentation. The
TTA of the pearl millet slurry during fermentation was determined in triplicates by titrating
10 ml of the sample with 0.1N NaOH using phenolphthalein as indicator until a light pink
Water Pearl millet
Homogenise
1∕4 slurry 3∕4 paste
Gelatinisation
Boiling H2O
Cooling (40oC)
Cold water, SRF &
ground ginger
Fermentation (37°C, 36 h)
Stirring
Mixing
63
colour appears. The TTA was expressed as percentage lactic acid (AOAC, 1980).
Equation 3.1 was used to calculate the percentage acidity, with each 0.1M NaOH
equivalent to 90.08 mg lactic acid.
( lactic acid) ml a x a x .E
volume of sample used x 000 00 3.1
Where, ml NaOH = volume of NaOH (ml), N NaOH = molarity of NaOH, M.E = the
equivalent factor of lactic acid being 90.08 mg, 1000 = factor used to convert the M.E
which is normally in mg to grams, and 100 used to express the lactic acid concentration in
percentage.
3.2.7 Determination of total soluble sugars in pearl millet slurry during
fermentation for the production of non-alcoholic pearl millet beverage
(NAPMB)
The method of AOAC 982.14 as described by Li et al. (2002) was used to determine the
total soluble sugars in pearl millet slurry (PMS) during fermentation for the production of
non-alcoholic cereal beverage (NACB). Sugar extraction was done by mixing 5 g (W1) of
the pearl millet slurry (PMS) with 100 ml (W2) of 50% ethanol. The mixture was heated in
a water bath for 25 min at 85ºC with a shaker set at 25 rpm to break-up and dissolve the
sample. The mixture was cooled to room temperature and ethanol (95%) was used to
bring the sample weight to original weight (W2). The sample was filtered through a 0.45
µm nylon syringe into 1.5 ml screw neck high performance liquid chromatography (HPLC)
sample vials (11.6 mm outer diameter × 32 mm height). The total sugar content of the
extracts was determined in triplicates using HPLC (Agilent 1100 HPLC – RID system)
equipped with Zorbax carbohydrates column (4.6 × 150 mm, 5 µm) and Zorbax NH2 guard
column (4.6 × 12.5 mm, 5 µm). The mobile phase used was acetonitrile mixed and de-
gassed with millipore distilled water at 75:25 (acetonitrile:water) ratio. The sugar
standards were prepared by mixing sucrose (6 mg/ml), fructose (6 mg/ml), glucose (6
mg/ml), maltose (6 mg/ml), lactose (6 mg/ml) and sucrose (30 mg/ml) in a water/ethanol
(50:50) solution. The resulting stock solution was then used to prepare concentration
solutions used for the calibration curve. The concentration used to draw a standard curve
were 0.375 (1.875) mg/ml, 0.75 (3.75) mg/ml, 1.5 (7.5) mg/ml and 3.0 (15.0) mg/ml. The
value in parenthesis shows the sucrose concentration in each solution.
64
3.2.8 Measurement of cell concentration in pearl millet slurry during fermentation
by optical density
The growth of lactic acid bacteria was determined using optical density (OD). Pearl millet
slurry (PMS) in 100 ml Schott bottles was thoroughly mixed for 1 min. PMS (1 ml) was
aseptically transferred into deMan Rogosa and Sharpe (MRS) broth [HG000C87.500] and
incubated at 30°C for 48 h. After incubation, 0.2 ml of the broth was transferred into
sterile 3 ml de-ionised water (d). The dilution was done where necessary since the
relationship between microorganisms and OD is non-linear if the OD is above 1.0
(Champagne et al., 2007). The sample was mixed by vortexing for 30 sec prior to the OD
measurement using UV 1700 Pharmaspec visible spectrophotometer set at 20ºC and 600
nm (OD600) wavelengths (Widdel, 2010). The reference sample used was sterile MRS
broth (0.2 ml) mixed with 3 ml sterile de-ionised water (d) where necessary. The
absorbance was divided by the defined dilution factor (d) to get correlated or calculated
optical density (ODcorr).
3.2.9 Enumeration of bacteria in pearl millet slurry during fermentation for the
production of non-alcoholic pearl millet beverage (NAPMB)
Pearl millet slurry (PMS) [45 ml] was added into 100 ml Schott bottles and thoroughly
mixed by shaking for 1 min. Dilutions of PMS were carried out by transferring 10 ml to a
bottle containing 90 ml sterile ¼ strength of Ringer solution (Abegaz, 2007, Kivanc et al.,
2011) to give 10:100 dilutions followed by a 10 fold serial dilution from 10-1 to 10-10. Each
dilution was sub-cultured in triplicate. A portion of the sample dilution (1 ml) was added
into a 15 x 100 mm plastic Petri plates containing cooled molten agar by means of a
pipette, mixed and left to solidify (Omemu, 2011). Lactic acid bacteria (LAB) were plated
on deMan Rogosa and Sharpe (MRS) agar [Merck HG00C107.500] (Nwachukwu et al.,
2010; Temitope & Taiyese, 2012) under anaerobic condition using Anaerobic Gas-Pack
system and anaerobic indicator strips at 30°C for 48 h (Osuntogun & Aboaba, 2004;
Nwachukwu et al., 2010). The total viable count (TVC) was enumerated on plate count
agar (PCA) [Merck HG 0000C6.500] and incubated aerobically at 37ºC for 48 h. After
incubation, Petri plates with colonies between 30 and 300 were counted. All
microbiological data were expressed in logarithms of numbers of colony forming unit per
ml (log cfu/ml).
65
3.2.10 Isolation and identification of lactic acid bacteria in pearl millet slurry during
fermentation
Pearl millet slurry (PMS) [45 ml] was homogenized in centrifuge tubes using vortex at 5
speeds for 30 sec. After homogenisation, 1 ml of PMS was transferred aseptically into a 9
ml of ¼ strength Ringer solution and mixed thoroughly. Serial dilutions (10-1 to 10-4) were
carried-out and 0.1 ml portion of the appropriate dilutions spread onto deMan Rogosa and
Sharpe (MRS) agar plates. In addition, 1 ml of the serial dilution (10-1 to 10-4) was pour-
plated onto MRS agar. Each dilution was cultured in triplicate (Mavhungu, 2005; Omemu,
2011). The plates were incubated anaerobically for 48 h at 30ºC. Distinct colonies grown
on and/or in MRS plates with 30 - 300 colonies were harvested and sub-cultured on fresh
MRS agar and incubated for 48 h at 30ºC. Presumptive lactic acid bacteria (LAB)
colonies were further sub-cultured in triplicates on MRS agar plates and anaerobically
incubated for 48 h at 37ºC.
Presumptive LAB isolates on MRS agar were examined for Gram reaction,
catalase reaction, production of CO2 from glucose using hot loop test and gas production
using 3% H2O2 (Schillinger and Lucke, 1987). Cell morphology was examined by
compound microscope and scanning electron microscope (SEM). The growth of isolates
at 4, 10, 45ºC and 6.5% in NaCl concentration in MRS agar were evaluated after 48 h.
The colonies were identified using Vitek 2 compact system. The gram-positive (GP) cards
for Vitek 2 compact system were used to identify isolates (Enterococcus, Lactococcus,
Leuconostoc, Pediococcus, Streptococcus and Vagococcus) to species while anaerobic
cards (ANC) were used to identify Lactobacillus to species. Colonies were identified
according to the instructions provided by the manufacturer.
3.2.11 Determination of the generation time of bacteria in pearl millet slurry during
fermentation for the production of non-alcoholic pearl millet beverage
(NAPMB)
The generation time or doubling time of microorganisms refers to the time it takes for a
cell (or population) division to take place. The equation used to calculate the generation
time was derived from the binary fission growth and is shown in Equation 3.2 where, G =
generation time given in minutes; t = time interval in hours or minutes; B = the initial
bacterial count of the given time interval and b = final bacterial count of the given time
interval (Todar, 2012). The data collected in Chapter 3, Section 3.2.9 was used to
calculate the generation time.
66
t
. log
⁄ 3.2
3.2.12 Lactic acid bacteria preparation for scanning electron microscope (SEM)
images
The methods of Mavhungu (2005), Katongole (2008) and JCU (2016) were used to get
images of lactic acid bacteria (LAB) under scanning electron microscope (SEM). LAB
colonies were grown in MRS broths at 30ºC for 36 h. The broth was mixed thoroughly for
1 min and few drops (4 - 5) placed on a 0.45 µm filters and then left to air dry at room
temperature for 30 min. The specimens were then fixed using 2.5% glutaraldehyde in
phosphate buffered saline (PBS) with pH of 7.2 for 30 min at 4ºC. The specimens were
fixed using osmium tetroxide (OsO4) for 1 to 2 h prior to dehydration in a series of
ascending different ethanol concentration (30, 50, 70, 80 and 100%) for 15 min at each
concentration. The final stage in 100% ethanol was repeated twice. The specimens were
then critically-point dried at 1072 psi and 31ºC, coated with gold before viewing under
Zeiss MERLIN FE-SEM. Beam conditions during imaging were 5 kV accelerating voltage,
250 pA probe current, with a working distance of approximately 4 mm.
3.2.13 Storage of purified cultures of lactic acid bacteria isolated from pearl millet
slurry during fermentation for the production of non-alcoholic pearl millet
beverage (NAPMB)
The isolates were grown in 500 ml deMan Rogosa and Sharpe broth at 30ºC for 60 h.
The broths were hand mixed thoroughly and 2 ml of the broth mixed with 1 ml of 10%
skim milk (Kandil & Soda, 2015) in 5 ml bench-top freeze-dryer vials. The samples were
frozen in an ultra-freezer (Glacier, -86ºC ultralow temperature freezer) at -76°C for 12 h
then freeze dried using BenchTop-Pro with omnitronics (VirTis SP Scientific) freeze dryer.
The dried samples were sealed under vacuum and stored in the freezer at -18ºC.
3.3 Data analysis
The results reported are mean of three independent trials. Multivariate analysis of
variance (MANOVA) was used to determine mean difference between treatments at
p = 0.05. Duncan’s multiple range tests was used to separate means where differences
exist using IBM SPSS ver 23 (IBM, 2015). Principal component analysis (PCA) was used
to summarise and uncover any patterns in the fermentation data set by reducing the
complexity of the data. The statistical relationships between the dependent variables [pH,
67
total titratable acidity (TTA), total viable count (TVC), yeast and mould (YM), and
correlated optical density (ODcorr)] during the fermentation of pearl millet slurry (PMS) for
the production of non-alcoholic pearl millet beverage (NAPMB) were determined using
Pearson correlation (r). Pearson correlation is scaled between -1 and +1 (- ≤ r ≤ + ).
When the correlation coefficient is -1 or +1 the linear relationship is said to be the
strongest. The weakest linear relationship is observed when the correlation is 0. Any
correlation that is positive indicates that if one variable increase the other variable tends to
increase. A negative correlation means that when one variable decreases then other
variable tends to decrease (Beldjazia & Alatou, 2016). This type of correlation only
focuses on linear relationships, thus, a 0 relationship between variables does not indicate
zero relationship but rather a zero linear relationship. Evans (1996) suggested the
strength of the absolute correlation value as: 0.00 - 0.19 = very weak, 0.20 - 0.39 = weak,
0.40 - 0.59 = moderate, 0.60 - 0.79 = strong and 0.80 - 1.0 = very strong (Beldjazia &
Alatou, 2016). Furthermore, a significant test was performed to determine if there is any
evidence that a linear correlation exists between variables at 0.01 and 0.05 levels.
3.4 Results and Discussion
3.4.1 Physical, chemical and biological changes in rice grains during sprouting
The amylolytic enzyme was low in unsprouted rice grains with a falling number of (FN) of
410.33 and increased in sprouted grains with a FN of 194.67. The activity of α-amylase in
the grains differed significantly between the sprouted and unsprouted rice flour (p < 0.05).
The rice grains showed the radicle on day 3 (after 72 h) which grew larger after 96 h.
Figure 3.2 shows the sprouted rice grains over 96 h. Seeds or grains contain all the
necessary nutrients required for germination to take place. The main parts within the
seed are, the embryo – found within the seed coat and develop into a plant. It is made-up
of a plumule, radicle and one or two cotyledons; endosperm - which serves as the source
of food stored in the seed; and the seed coat - which is a protective layer of the seed.
During germination, there are three main stages, namely, inhibition of water, increased
metabolic activity and the swelling of the cells. The main factors which play a role in the
sprouting of seeds are water, oxygen and temperature. Water triggers the chemical
process; oxygen is required for cellular respiration and temperature is required to
influence the rate of metabolic activities. Prior to sprouting the grains were soaked in
water at 1:2 ratio (grains:water) and the kernels absorbed enough water. The dormant
seeds contain about 5 – 10% moisture and this increased during soaking. During this
stage, the water update was through the micropyle. As the water was absorbed into the
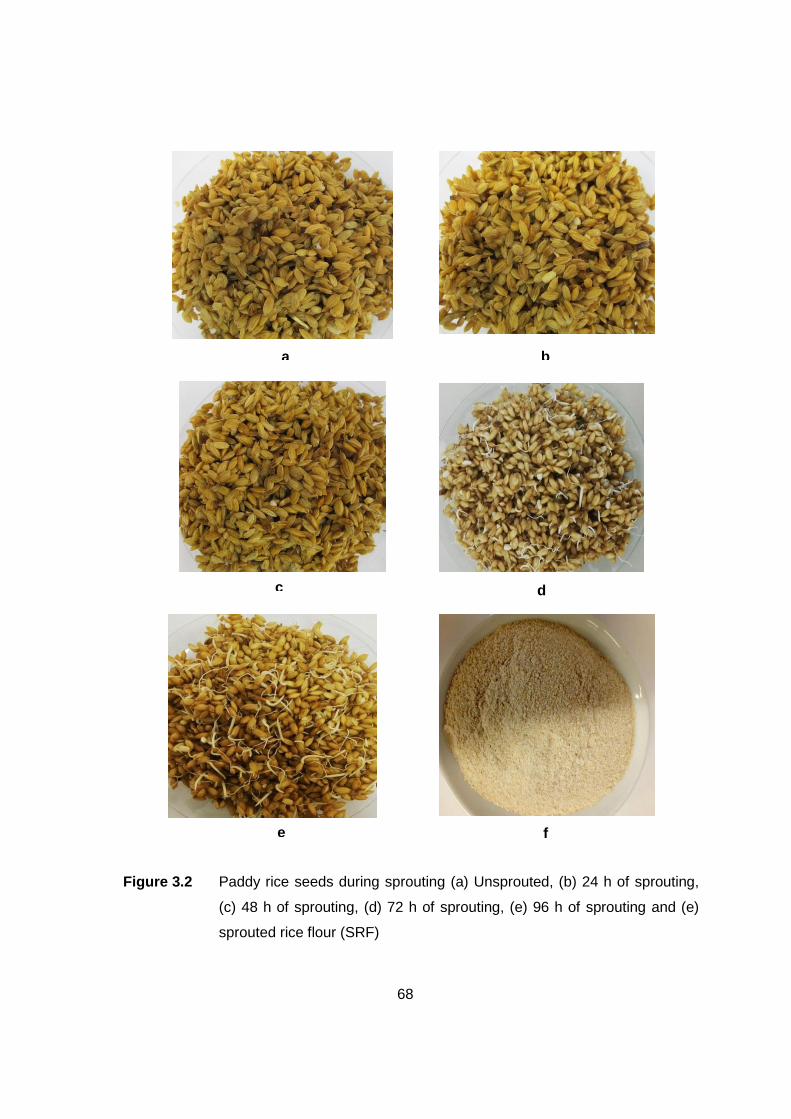
68
Figure 3.2 Paddy rice seeds during sprouting (a) Unsprouted, (b) 24 h of sprouting,
(c) 48 h of sprouting, (d) 72 h of sprouting, (e) 96 h of sprouting and (e)
sprouted rice flour (SRF)
e
c d
a b
f
69
seed, the seed increased in size nd became turgid. The process of water absorption
stimulated the increase in cellular respiration which resulted in the breakdown of starches
to energy in the presence of oxygen. The absorption of water also activated the enzymes
within the grains. These enzymes during sprouting broke down the polysaccharides
(mainly starch) into oligosaccharides and monosaccharides, the fats into free fatty acids,
and proteins into oligopeptides and free amino acids. The breakdown of starch resulted in
the reduction of viscosity. Pressure was created during the swelling of cells within the
seeds which caused the seed coat to lyse. The radicle emerged through the seed coat
with the root facing downward and the stem facing upwards. The aim of sprouting rice
grains was to stimulate the development and activity of hydrolytic enzymes (amylases,
proteases and other endogenous hydrolytic enzymes) which are not active in non-
germinated grains. As reported by Mella (2011) the germination usually lasts for 4-6 days
and takes place between 20 and 30°C with the optimum temperature of 25 - 28°C.
Ground sprouted rice grains added to either millet, sorghum or maize is believed to
increase the crude protein, fats and carbohydrates by 33, 44 and 63%, respectively
(Adelekan et al., 2013). Sprouted rice flour with high alpha amylase activity was produced
after 96 h at 25°C.
3.4.2 Effect of fermentation time on the pH and total titratable acidity (TTA) of
pearl millet slurry during fermentation
The changes in pH and total titratable acidity of pearl millet slurry (PMS) over the 36 h
fermentation for the production of non-alcoholic pearl millet beverage (NAPMB) are shown
in Figure 3.3. There was a significant (p ˂ 0.05) change in pH during the fermentation
cycle ranging from 6.37 ± 0.15 to 3.77 ± 0.01 in 36 h. The pH decreased as fermentation
time elapsed due to the increase in population of lactic acid bacteria (LAB) which
fermented glucose to lactic acid and CO2. At the beginning of fermentation the lactic acid
organisms were in lag phase (0 - 3 h) and as the fermentation time increased the
organisms exponentially produced significant acid until 21 h followed by stationary phase
where the amount of acid did not increase significantly (24 – 30 h). The decrease in pH
could be due to the built up of hydrogen ions content when microorganisms breakdown
starch. Meanwhile, the stationary phase could have been caused by exhaustion of
nutrient and build-up of waste by LAB. Thereafter, the pH did not significantly change
until 36 h. This could be caused by dying of parent cells as death phase set in. These
results were in agreement with a report by Obadina et al. (2008) who reported a decrease
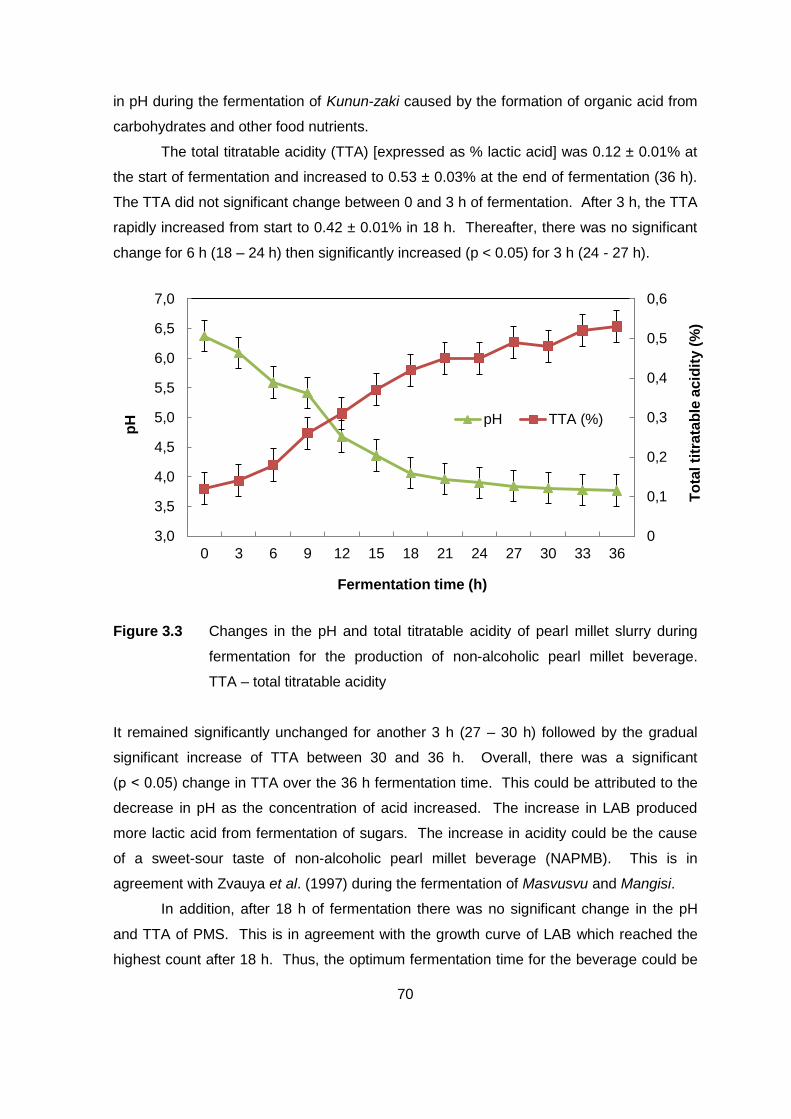
70
in pH during the fermentation of Kunun-zaki caused by the formation of organic acid from
carbohydrates and other food nutrients.
The total titratable acidity (TTA) [expressed as % lactic acid] was 0.12 ± 0.01% at
the start of fermentation and increased to 0.53 ± 0.03% at the end of fermentation (36 h).
The TTA did not significant change between 0 and 3 h of fermentation. After 3 h, the TTA
rapidly increased from start to 0.42 ± 0.01% in 18 h. Thereafter, there was no significant
change for 6 h (18 – 24 h) then significantly increased (p < 0.05) for 3 h (24 - 27 h).
Figure 3.3 Changes in the pH and total titratable acidity of pearl millet slurry during
fermentation for the production of non-alcoholic pearl millet beverage.
TTA – total titratable acidity
It remained significantly unchanged for another 3 h (27 – 30 h) followed by the gradual
significant increase of TTA between 30 and 36 h. Overall, there was a significant
(p ˂ 0.05) change in TTA over the 36 h fermentation time. This could be attributed to the
decrease in pH as the concentration of acid increased. The increase in LAB produced
more lactic acid from fermentation of sugars. The increase in acidity could be the cause
of a sweet-sour taste of non-alcoholic pearl millet beverage (NAPMB). This is in
agreement with Zvauya et al. (1997) during the fermentation of Masvusvu and Mangisi.
In addition, after 18 h of fermentation there was no significant change in the pH
and TTA of PMS. This is in agreement with the growth curve of LAB which reached the
highest count after 18 h. Thus, the optimum fermentation time for the beverage could be
0
0,1
0,2
0,3
0,4
0,5
0,6
3,0
3,5
4,0
4,5
5,0
5,5
6,0
6,5
7,0
0 3 6 9 12 15 18 21 24 27 30 33 36
To
tal ti
tra
tab
le a
cid
ity (
%)
pH
Fermentation time (h)
pH TTA (%)
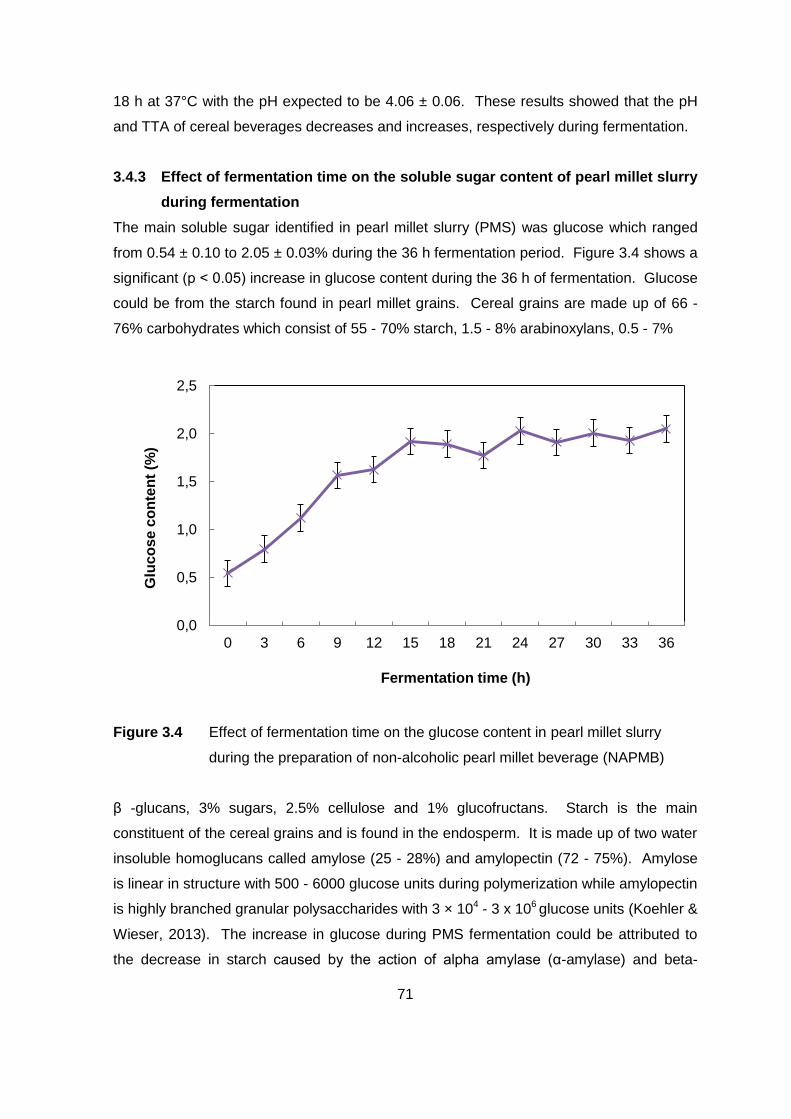
71
18 h at 37°C with the pH expected to be 4.06 ± 0.06. These results showed that the pH
and TTA of cereal beverages decreases and increases, respectively during fermentation.
3.4.3 Effect of fermentation time on the soluble sugar content of pearl millet slurry
during fermentation
The main soluble sugar identified in pearl millet slurry (PMS) was glucose which ranged
from 0.54 ± 0.10 to 2.05 ± 0.03% during the 36 h fermentation period. Figure 3.4 shows a
significant (p ˂ 0.05) increase in glucose content during the 36 h of fermentation. Glucose
could be from the starch found in pearl millet grains. Cereal grains are made up of 66 -
76% carbohydrates which consist of 55 - 70% starch, 1.5 - 8% arabinoxylans, 0.5 - 7%
Figure 3.4 Effect of fermentation time on the glucose content in pearl millet slurry
during the preparation of non-alcoholic pearl millet beverage (NAPMB)
β -glucans, 3% sugars, 2.5% cellulose and 1% glucofructans. Starch is the main
constituent of the cereal grains and is found in the endosperm. It is made up of two water
insoluble homoglucans called amylose (25 - 28%) and amylopectin (72 - 75%). Amylose
is linear in structure with 500 - 6000 glucose units during polymerization while amylopectin
is highly branched granular polysaccharides with 3 × 10⁴ - 3 x 10⁶ glucose units (Koehler &
Wieser, 2013). The increase in glucose during PMS fermentation could be attributed to
the decrease in starch caused by the action of alpha amylase (α-amylase) and beta-
0,0
0,5
1,0
1,5
2,0
2,5
0 3 6 9 12 15 18 21 24 27 30 33 36
Glu
co
se c
on
ten
t (%
)
Fermentation time (h)
72
amylase (β-amylase) acitivity. During fermentation enzymes hydrolyse starch to produce
monomeric sugar glucose. Although there was an increase in glucose content from the
onset of fermentation, the glucose did not significantly increase between 9 and 12 h; 15,
18 and 27 h; and 24, 30, 33 and 36 h. This could be due to the acidfication (low pH) of
the beverage which terminates the activity of alpha-amylase and/or the termination of
amylolytic enzymes inhibited by the build-up of tannins (Osman, 2011). The lower pH
could have been caused by the lactic acid bacteria (LAB) converting the sugars from
starch into mainly lactic acid and some traces of alcohol/acetic acid and/or CO2. Tannins
are natural polyphenols found in most cereal grains. They can act as antioxidants
together with phytic acid and phenols (Pushparaj & Urooj, 2014). Similarly, Osman (2011)
reported glucose as the main soluble sugar which gradually increased in the first 20 h
during the fermentation of pearl millet flour during the production of Lohoh bread.
Ibegbulem & Chikezie (2013) also identified 0.5% glucose during the fermentation of
Kunun-zaki. Therefore, fermentation time has an effect on the glucose content of pearl
millet slurry.
3.4.4 Effect of fermentation time on the viability of lactic acid bacteria and total
microbes in pearl millet slurry during fermentation
The growth pattern of lactic acid bacteria (LAB) and total viable counts (TVC) in pearl
millet slurry during fermentation for the production of non-alcoholic cereal beverage
(NACB) are shown in Figure 3.5. The growth of LAB in pearl millet slurry significantly
increased (p < 0.05) at 3, 15, 24, and 30 h and significantly decreased (p < 0.05) at 21
and 27 h during fermentation. The LAB counts were 7.04 ± 0.95 log cfu/ml at the onset of
fermentation and decreased to 6.73 ± 0.46 log cfu/ml after 3 h. This period can be
regarded as the apparent lag phase. During this phase a certain fraction of
microorganisms are dividing (duplication) while a certain fraction is dying or not dividing
(non-duplicating) due to the new environment they are introduced to. As a result of the
non-duplicating bacteria exceeding the duplicating bacteria, these have led to the
reduction in total cell count prior to exponential phase. The results are in agreement with
those reported by Mwale (2014) during preparation of Chibwantu. This similar concept
was explained by Yates & Smotzer (2007). The growth of LAB cells increased from 6.73
± 0.46 log cfu/ml (3 h) to 7.74 ± 0.47 log cfu/ml (6 h) then decreased to 6.76 ± 0.02 log
cfu/ml (9 h). Although most LAB tolerate low pH (acidophilic), certain strains of LAB may
have been retarded (Menconi et al., 2014). A typical example as reported by Steinkraus
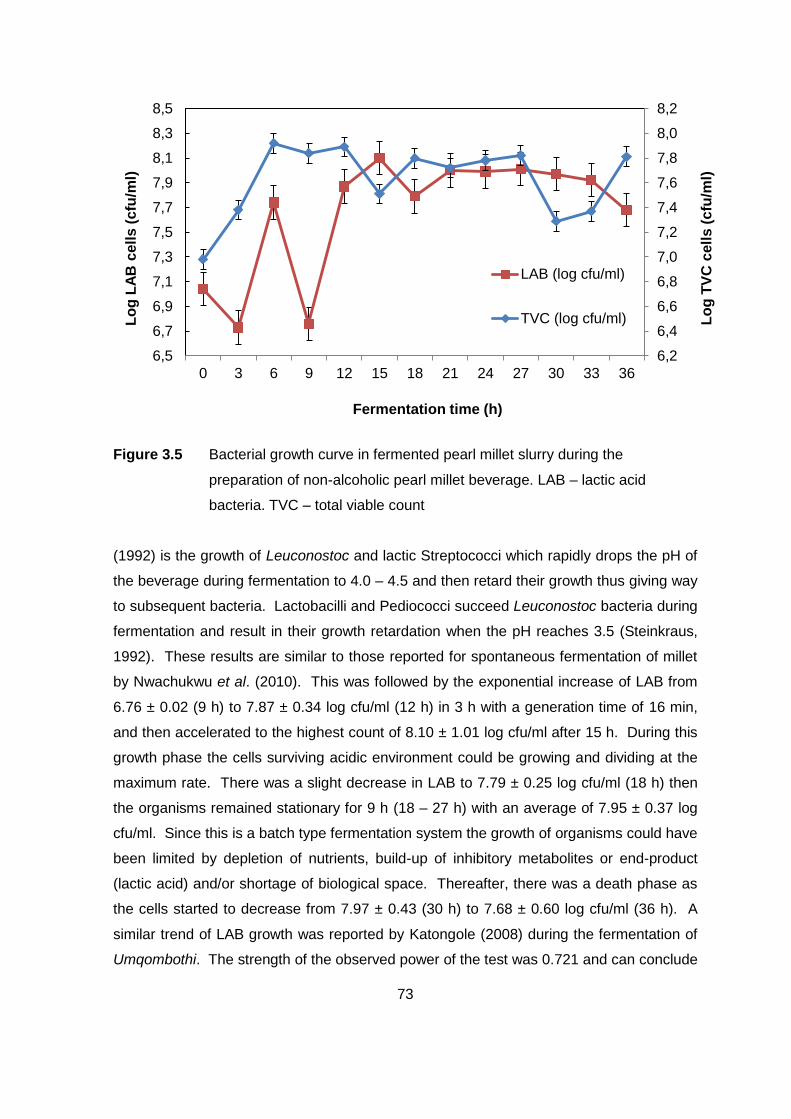
73
Figure 3.5 Bacterial growth curve in fermented pearl millet slurry during the
preparation of non-alcoholic pearl millet beverage. LAB – lactic acid
bacteria. TVC – total viable count
(1992) is the growth of Leuconostoc and lactic Streptococci which rapidly drops the pH of
the beverage during fermentation to 4.0 – 4.5 and then retard their growth thus giving way
to subsequent bacteria. Lactobacilli and Pediococci succeed Leuconostoc bacteria during
fermentation and result in their growth retardation when the pH reaches 3.5 (Steinkraus,
1992). These results are similar to those reported for spontaneous fermentation of millet
by Nwachukwu et al. (2010). This was followed by the exponential increase of LAB from
6.76 ± 0.02 (9 h) to 7.87 ± 0.34 log cfu/ml (12 h) in 3 h with a generation time of 16 min,
and then accelerated to the highest count of 8.10 ± 1.01 log cfu/ml after 15 h. During this
growth phase the cells surviving acidic environment could be growing and dividing at the
maximum rate. There was a slight decrease in LAB to 7.79 ± 0.25 log cfu/ml (18 h) then
the organisms remained stationary for 9 h (18 – 27 h) with an average of 7.95 ± 0.37 log
cfu/ml. Since this is a batch type fermentation system the growth of organisms could have
been limited by depletion of nutrients, build-up of inhibitory metabolites or end-product
(lactic acid) and/or shortage of biological space. Thereafter, there was a death phase as
the cells started to decrease from 7.97 ± 0.43 (30 h) to 7.68 ± 0.60 log cfu/ml (36 h). A
similar trend of LAB growth was reported by Katongole (2008) during the fermentation of
Umqombothi. The strength of the observed power of the test was 0.721 and can conclude
6,2
6,4
6,6
6,8
7,0
7,2
7,4
7,6
7,8
8,0
8,2
6,5
6,7
6,9
7,1
7,3
7,5
7,7
7,9
8,1
8,3
8,5
0 3 6 9 12 15 18 21 24 27 30 33 36
Lo
g T
VC
cell
s (
cfu
/ml)
Lo
g L
AB
cell
s (
cfu
/ml)
Fermentation time (h)
LAB (log cfu/ml)
TVC (log cfu/ml)
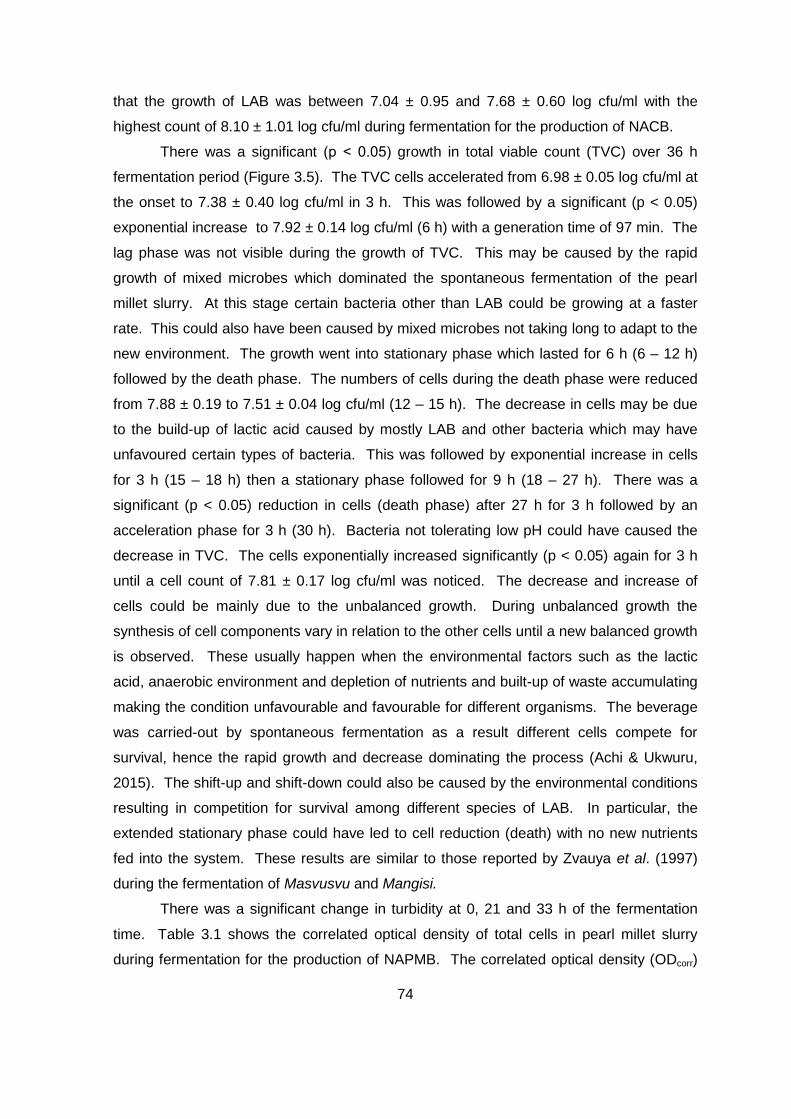
74
that the growth of LAB was between 7.04 ± 0.95 and 7.68 ± 0.60 log cfu/ml with the
highest count of 8.10 ± 1.01 log cfu/ml during fermentation for the production of NACB.
There was a significant (p ˂ 0.05) growth in total viable count (TVC) over 36 h
fermentation period (Figure 3.5). The TVC cells accelerated from 6.98 ± 0.05 log cfu/ml at
the onset to 7.38 ± 0.40 log cfu/ml in 3 h. This was followed by a significant (p < 0.05)
exponential increase to 7.92 ± 0.14 log cfu/ml (6 h) with a generation time of 97 min. The
lag phase was not visible during the growth of TVC. This may be caused by the rapid
growth of mixed microbes which dominated the spontaneous fermentation of the pearl
millet slurry. At this stage certain bacteria other than LAB could be growing at a faster
rate. This could also have been caused by mixed microbes not taking long to adapt to the
new environment. The growth went into stationary phase which lasted for 6 h (6 – 12 h)
followed by the death phase. The numbers of cells during the death phase were reduced
from 7.88 ± 0.19 to 7.51 ± 0.04 log cfu/ml (12 – 15 h). The decrease in cells may be due
to the build-up of lactic acid caused by mostly LAB and other bacteria which may have
unfavoured certain types of bacteria. This was followed by exponential increase in cells
for 3 h (15 – 18 h) then a stationary phase followed for 9 h (18 – 27 h). There was a
significant (p < 0.05) reduction in cells (death phase) after 27 h for 3 h followed by an
acceleration phase for 3 h (30 h). Bacteria not tolerating low pH could have caused the
decrease in TVC. The cells exponentially increased significantly (p < 0.05) again for 3 h
until a cell count of 7.81 ± 0.17 log cfu/ml was noticed. The decrease and increase of
cells could be mainly due to the unbalanced growth. During unbalanced growth the
synthesis of cell components vary in relation to the other cells until a new balanced growth
is observed. These usually happen when the environmental factors such as the lactic
acid, anaerobic environment and depletion of nutrients and built-up of waste accumulating
making the condition unfavourable and favourable for different organisms. The beverage
was carried-out by spontaneous fermentation as a result different cells compete for
survival, hence the rapid growth and decrease dominating the process (Achi & Ukwuru,
2015). The shift-up and shift-down could also be caused by the environmental conditions
resulting in competition for survival among different species of LAB. In particular, the
extended stationary phase could have led to cell reduction (death) with no new nutrients
fed into the system. These results are similar to those reported by Zvauya et al. (1997)
during the fermentation of Masvusvu and Mangisi.
There was a significant change in turbidity at 0, 21 and 33 h of the fermentation
time. Table 3.1 shows the correlated optical density of total cells in pearl millet slurry
during fermentation for the production of NAPMB. The correlated optical density (ODcorr)
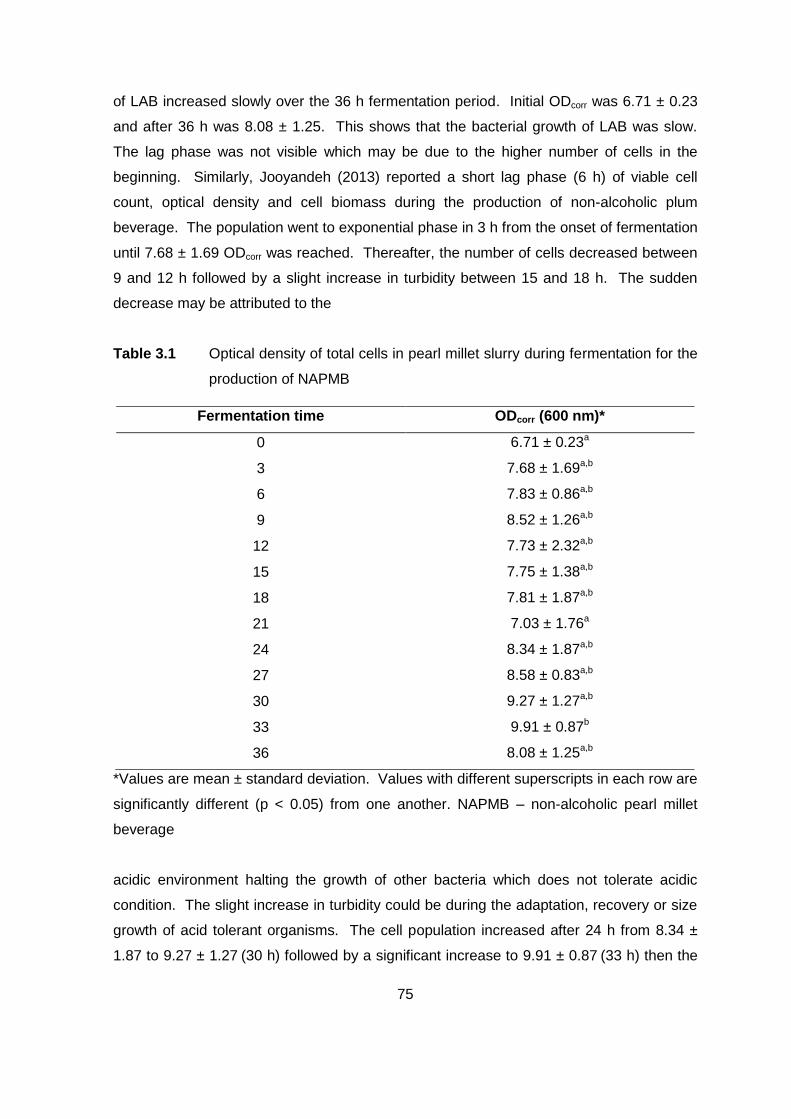
75
of LAB increased slowly over the 36 h fermentation period. Initial ODcorr was 6.71 ± 0.23
and after 36 h was 8.08 ± 1.25. This shows that the bacterial growth of LAB was slow.
The lag phase was not visible which may be due to the higher number of cells in the
beginning. Similarly, Jooyandeh (2013) reported a short lag phase (6 h) of viable cell
count, optical density and cell biomass during the production of non-alcoholic plum
beverage. The population went to exponential phase in 3 h from the onset of fermentation
until 7.68 ± 1.69 ODcorr was reached. Thereafter, the number of cells decreased between
9 and 12 h followed by a slight increase in turbidity between 15 and 18 h. The sudden
decrease may be attributed to the
Table 3.1 Optical density of total cells in pearl millet slurry during fermentation for the
production of NAPMB
*Values are mean ± standard deviation. Values with different superscripts in each row are
significantly different (p < 0.05) from one another. NAPMB – non-alcoholic pearl millet
beverage
acidic environment halting the growth of other bacteria which does not tolerate acidic
condition. The slight increase in turbidity could be during the adaptation, recovery or size
growth of acid tolerant organisms. The cell population increased after 24 h from 8.34 ±
1.87 to 9.27 ± 1.27 (30 h) followed by a significant increase to 9.91 ± 0.87 (33 h) then the
Fermentation time ODcorr (600 nm)*
0 6.71 ± 0.23a
3 7.68 ± 1.69a,b
6 7.83 ± 0.86a,b
9 8.52 ± 1.26a,b
12 7.73 ± 2.32a,b
15 7.75 ± 1.38a,b
18 7.81 ± 1.87a,b
21 7.03 ± 1.76a
24 8.34 ± 1.87a,b
27 8.58 ± 0.83a,b
30 9.27 ± 1.27a,b
33 9.91 ± 0.87b
36 8.08 ± 1.25a,b
76
ODcorr decreased to 8.08 ± 1.25 (36 h). The increase could be due to the emergence of
bacterial cells that tolerate acidic environment. The decrease of ODcorr could be caused
by the death phase of bacteria, which occurs usually when conditions are unfavourable for
most organisms. There was a possible built-up of toxins and/or waste which reached a
threshold level. At this point, the growth of bacteria was not balanced due to the lack of
growth requirements. The viable cells were lower than those dying. Therefore, pearl millet
supports the growth of LAB during fermentation.
3.4.5 Lactic acid bacteria associated with pearl millet slurry
The isolates identified from pearl millet slurry (PMS) during fermentation over 36 h are
shown in Table 3.2. Lactic acid bacteria (LAB) from the genera Leuconostoc,
Pediococcus and Enterococcus were the main species involved in the fermentation of
PMS. The Leuconostoc mesenteroides ssp. Dextraicum (Figure 3.6a).and Leuconostoc
pseudomesenteroides were identified at the beginning of fermentation between the pH of
5.59 ± 0.09 (0 h) and 6.37 ± 0.15 (6 h). Leuconostoc’s presence at the beginning of
fermentation may be attributed to their growth condition at pH 6.0 - 6.5. This is identical to
the study by Schutte (2013) who identified L. pseudomesenteroides from Oshashikwa, a
traditionally fermented milk in Namibia. The organisms were responsible for the initiation
of lactic acid fermentation (Whitman, 2009). These heterolactic organisms produce
carbon dioxide and organic acids which rapidly lower the pH of the beverage to 4.0 or 4.5
(Steinkraus, 1992) and inhibit the development of undesirable microorganisms. The
carbon dioxide produced replaces the oxygen, making the environment anaerobic
(Battock & Azam-Ali, 1998; Dimic, 2006) and suitable for the growth of subsequent
organisms such as Lactobacillus. In addition, the anaerobic environment created by the
CO2 has preservative effect to the beverage since it inhibits the growth of unwanted
contaminants bacteria (Achi & Ukwuru, 2015). As reported by Meslier et al. (2012), L.
pseudomesenteroide is widely present in many fermented foods such as dairy, wine and
beans while L. mesenteroides is associated with sauerkraut and pickled fermented
products (Dimic, 2006). The organism produces dextrans and aromatic compounds
(diacetyl, acetaldehyde, and acetoin) which could contribute to the taste and aromatic
profile. These organisms were isolated by Doulgeraki et al. (2013) from fermented Greek
table olive.
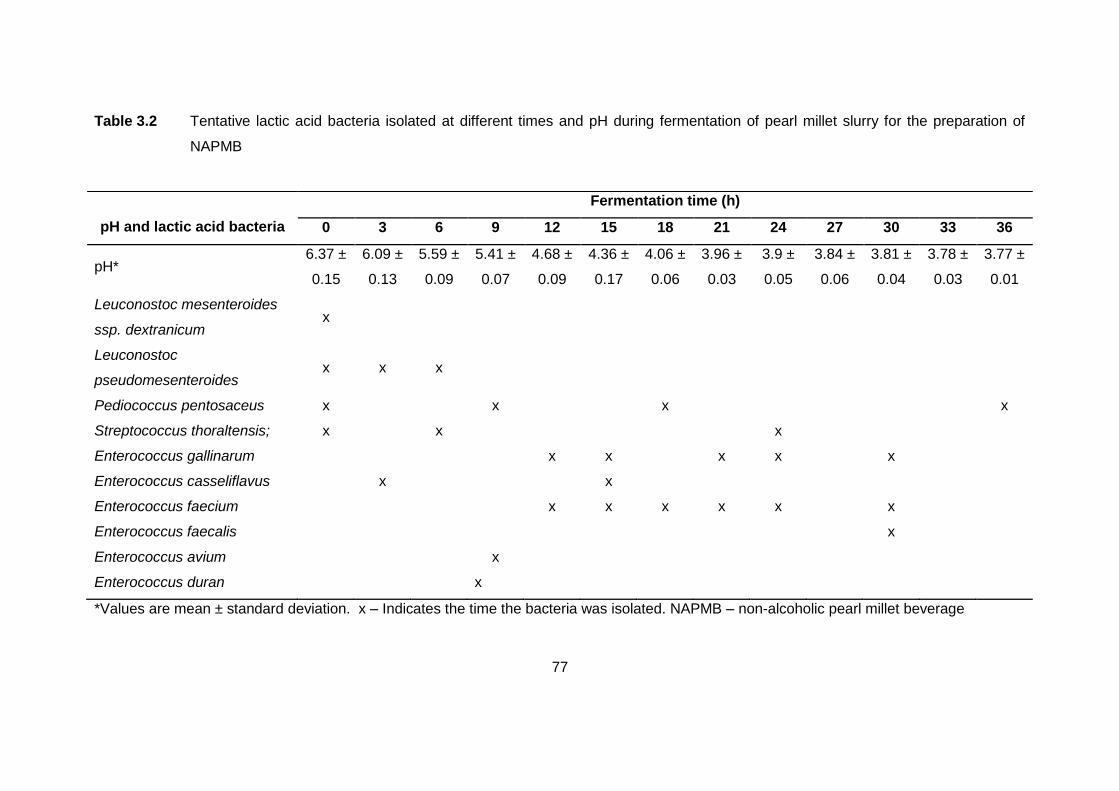
77
Table 3.2 Tentative lactic acid bacteria isolated at different times and pH during fermentation of pearl millet slurry for the preparation of
NAPMB
*Values are mean ± standard deviation. x – Indicates the time the bacteria was isolated. NAPMB – non-alcoholic pearl millet beverage
pH and lactic acid bacteria
Fermentation time (h)
0 3 6 9 12 15 18 21 24 27 30 33 36
pH* 6.37 ±
0.15
6.09 ±
0.13
5.59 ±
0.09
5.41 ±
0.07
4.68 ±
0.09
4.36 ±
0.17
4.06 ±
0.06
3.96 ±
0.03
3.9 ±
0.05
3.84 ±
0.06
3.81 ±
0.04
3.78 ±
0.03
3.77 ±
0.01
Leuconostoc mesenteroides
ssp. dextranicum x
Leuconostoc
pseudomesenteroides x x x
Pediococcus pentosaceus x
x
x
x
Streptococcus thoraltensis; x
x
x
Enterococcus gallinarum
x x
x x
x
Enterococcus casseliflavus
x
x
Enterococcus faecium
x x x x x
x
Enterococcus faecalis
x
Enterococcus avium
x
Enterococcus duran x
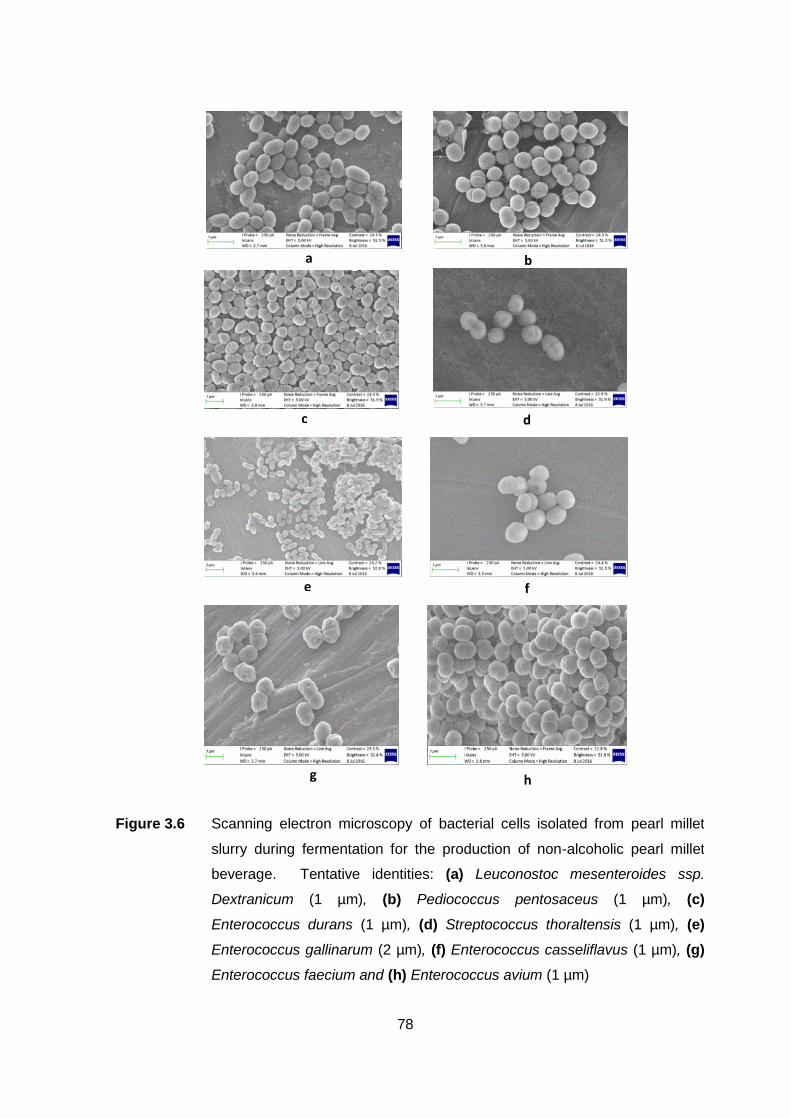
78
a b
c d
e f
g h
Figure 3.6 Scanning electron microscopy of bacterial cells isolated from pearl millet
slurry during fermentation for the production of non-alcoholic pearl millet
beverage. Tentative identities: (a) Leuconostoc mesenteroides ssp.
Dextranicum (1 µm), (b) Pediococcus pentosaceus (1 µm), (c)
Enterococcus durans (1 µm), (d) Streptococcus thoraltensis (1 µm), (e)
Enterococcus gallinarum (2 µm), (f) Enterococcus casseliflavus (1 µm), (g)
Enterococcus faecium and (h) Enterococcus avium (1 µm)
79
Pediococcus pentosaceus shown in Figure 3.6b was isolated at 0, 9, 18 and 36 h of
fermentation, similar to the report by Abegaz (2007) and Nuraida (2015). The genus
Pediococcus belongs to the family Lactobacillaceae in the order Lactobacillales growing at
optimum pH of 4.5 - 8.0 (Batt & Tortorello, 2014). They have the ability to produce
bacteriocins (antimicrobial agent) which are used as a food preservative (Batt & Tortorello,
2014). The bacteriocins produced inhibit the growth of Gram positive bacteria since they
attack the cytoplasmic membranes of the cell of which is protected by the polysaccharide
protective layer in Gram negative cells (Achi & Ukwuru, 2015). The organisms were also
responsible for producing acid during fermentation. The Pediococci depress the pH to 3.5
before they halt their own growth (Steinkraus, 1992).
Streptococcus thoraltensis was also present after 6 h of fermentation (Figure
3.6d). The presence of S. thoraltensis could be through contamination of pearl millet
grains and/or utensils. The organism was isolated from animal intestinal tracts of swine
(Facklam, 2002).
A number of enterococcus bacteria (Table 3.2) were isolated throughout the
fermentation at different times (3 – 30 h) between pH 3.81 and 6.09. They became active
between 12 and 30 h and are known to grow well between pH 4 and 9.6 (Gimenez-
Perreira, 2005). The organisms are responsible for the development of flavours due to
their glycolytic, proteolytic and lipolytic activities. They have probiotic activities and have
the potential to be used as bio-preservatives. In general enterococci organisms are
ubiquitous and are found in the environment and gastrointestinal tract of healthy animals
and humans (Gimenez-Pereira, 2005). These organisms are used as starter cultures in
the fermentation of food since they create unique sensory properties (Gimenez-Pereira,
2005); and contribute to texture and safety (Araujo & de Luces Ferreira, 2013).
Enterococcus casseliflavus shown in Figure 3.6f and Enterococcus gallinarum shown in
Figure 3.6c were identified after 3 and 15 h. E. casseliflavus have been isolated from
olive brines and traditional fermented food and used as starter culture (de Castro et al.,
2002; Mwale, 2014; Oladipo et al. 2015). E. gallinarum was isolated between 12 and 30 h
at pH 3.81 to 4.68, similar to Oladino et al. (2015) who identified the organisms in Nigerian
traditional fermented foods. They have lipolysis, proteolysis, bile tolerating and low pH
tolerating properties. They have hydrophobic properties and produce bacteriocins which
will inhibit food pathogens and spoilage microorganisms (Oladipo et al. 2015). E. faecium
(Figure 3.6g) was detected at 12, 15, 18 and 21 h while E. faecalis was detected after 30
h.
80
E. faecium and E. faecalis are reported to be probiotics but their original source may be
through contamination. Shutte (2013) also reported isolation of E. faecium from
traditionally fermented milk Omashikwa. However, as reported by Gimenez-Pereira
(2005) they are suspected to be pathogenic to humans and are resistant to antibiotics.
The biochemical properties of presumptive lactic acid bacteria (LAB) isolates are
shown in Table 3.3. All the isolates were Gram positive, catalase-negative and do not
produce gas from glucose (hot-loop test negative). All cells were cocci and cocci-oval in
morphology and showed no grow at 4ºC. At 45ºC there was no growth of the isolates
except E. faecium. The inability of all the LAB isolates to grow at 4°C could demonstrate
increased glycolytic activity which could lead to the increased production of lactic acid
(Menconi et al., 2014). However, the same report by Menconi et al. (2014) reported that
the growth of Lactococcus at low temperature resulted in reduced production of lactic acid
due to the reduced glycolytic activity. The inability to grow at high temperature could
mean that the LAB strain have a high growth rate and lactic acid production. Their
inability to grow at 45°C are in disagreement with Menconi et al. (2014)‘s report. The
differences could be due to the period of incubation which was 2 – 4 h in Menconi et al.
(2014)‘s report whereas this study incubated for 48 h. he isolates grew at 0ºC and
6.5% NaCl concentration except E. avium. The growth of all LAB isolates except E. avium
in 6.5% salt concentration indicated that the LAB strain could be used as commercial
starter culture. During the commercial production of lactic acid by LAB strain, alkali could
be added to increase the pH and reduce excess decrease in pH (Menconi et al., 2014).
However, the same report by (Menconi et al., 2014) mentioned that LAB strains grown in
the presence of salt concentration could lead to the loss of turgor pressure leading to an
effect on the physiology, enzyme activity, water activity and metabolism of the cell. These
physiological properties could be used to confirm the ability of the LAB isolates to be used
as starter cultures. The LAB of importance during fermentation of pearl millet slurry were
from the genera Leuconostoc, Pediococcus and Enterococcus.
3.4.6 Pearson correlation between the total titratable acidity (TTA), pH, total viable
count (TVC), yeast and mould (YM) and correlated optical density (ODcorr)
Table 3.4 summarises the Pearson correlation between TTA, pH, TVC, YM and ODcorr
during the fermentation of pearl millet slurry for the production of non-alcolic pearl millet
beverage (NAPMB). There was a very strong, negative linear relationship between TTA
and pH of the beverage during fermentation (r = -0.975, p < 0.05). Meanwhile, the TTA
.
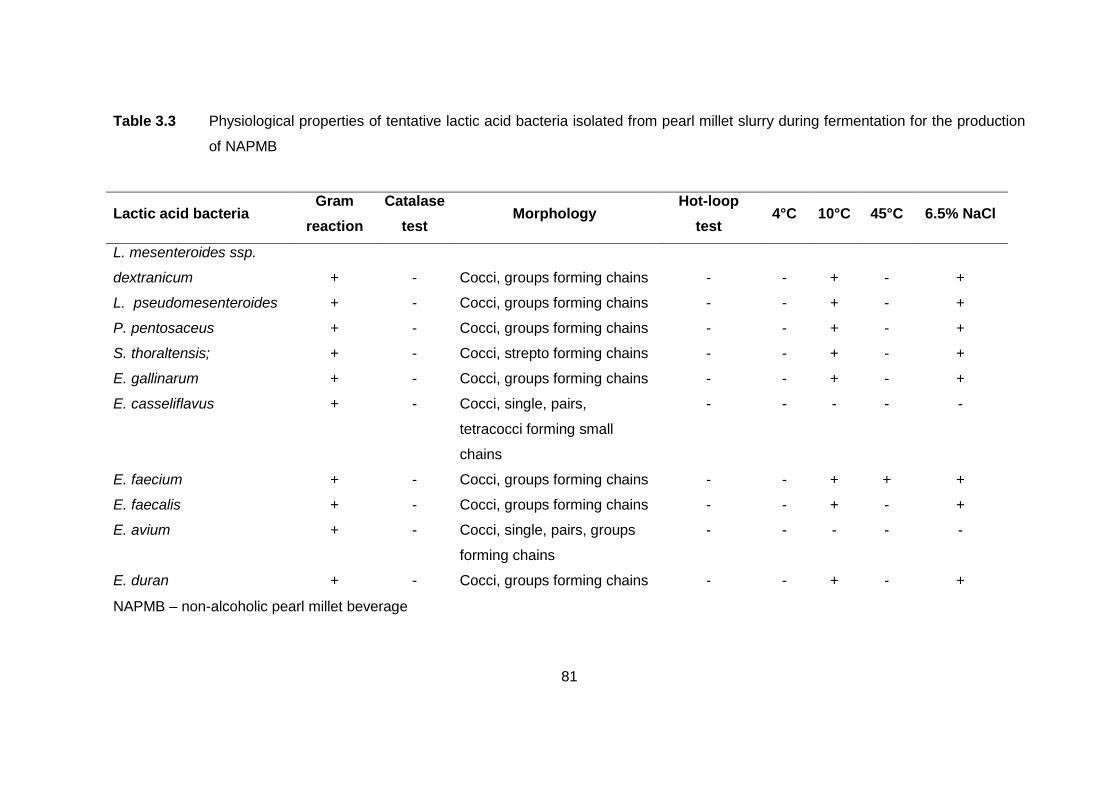
81
Table 3.3 Physiological properties of tentative lactic acid bacteria isolated from pearl millet slurry during fermentation for the production
of NAPMB
NAPMB – non-alcoholic pearl millet beverage
Lactic acid bacteria Gram
reaction
Catalase
test Morphology
Hot-loop
test 4°C 10°C 45°C 6.5% NaCl
L. mesenteroides ssp.
dextranicum
+
-
Cocci, groups forming chains
-
-
+
-
+
L. pseudomesenteroides + - Cocci, groups forming chains - - + - +
P. pentosaceus + - Cocci, groups forming chains - - + - +
S. thoraltensis; + - Cocci, strepto forming chains - - + - +
E. gallinarum + - Cocci, groups forming chains - - + - +
E. casseliflavus + - Cocci, single, pairs,
tetracocci forming small
chains
- - - - -
E. faecium + - Cocci, groups forming chains - - + + +
E. faecalis + - Cocci, groups forming chains - - + - +
E. avium + - Cocci, single, pairs, groups
forming chains
- - - - -
E. duran + - Cocci, groups forming chains - - + - +
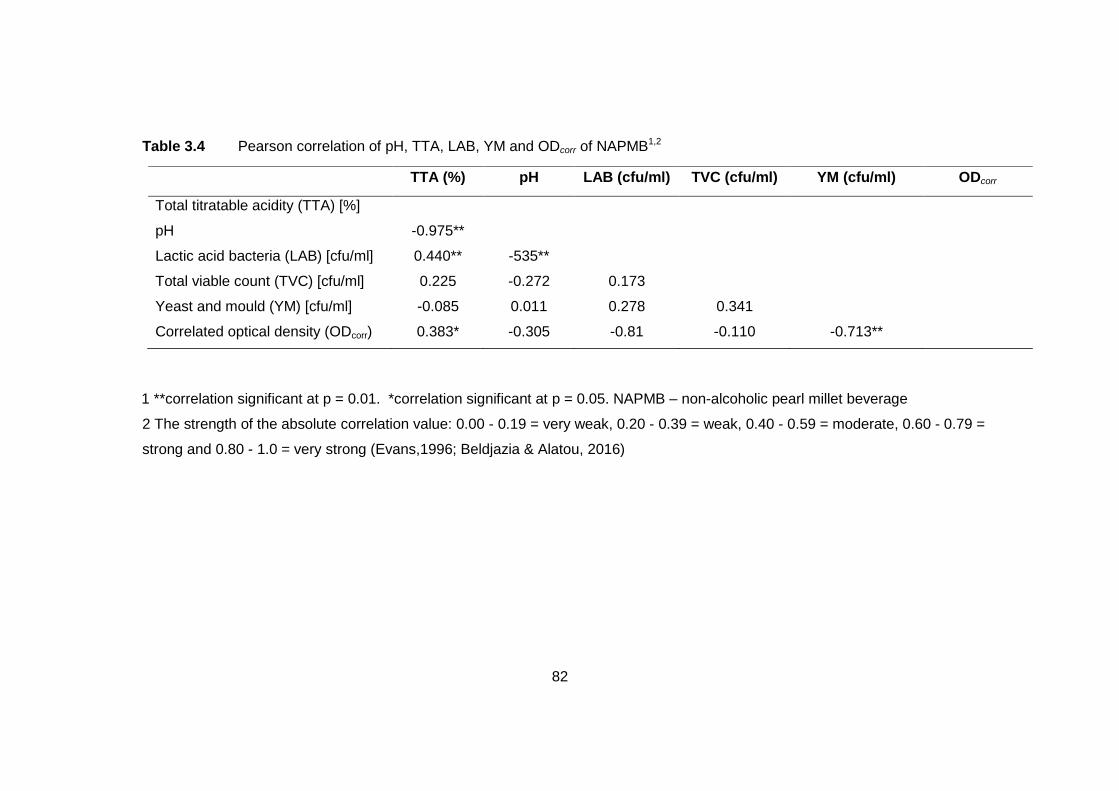
82
Table 3.4 Pearson correlation of pH, TTA, LAB, YM and ODcorr of NAPMB1,2
1 **correlation significant at p = 0.01. *correlation significant at p = 0.05. NAPMB – non-alcoholic pearl millet beverage
2 The strength of the absolute correlation value: 0.00 - 0.19 = very weak, 0.20 - 0.39 = weak, 0.40 - 0.59 = moderate, 0.60 - 0.79 =
strong and 0.80 - 1.0 = very strong (Evans,1996; Beldjazia & Alatou, 2016)
TTA (%) pH LAB (cfu/ml) TVC (cfu/ml) YM (cfu/ml) ODcorr
Total titratable acidity (TTA) [%]
pH -0.975**
Lactic acid bacteria (LAB) [cfu/ml] 0.440** -535**
Total viable count (TVC) [cfu/ml] 0.225 -0.272 0.173
Yeast and mould (YM) [cfu/ml] -0.085 0.011 0.278 0.341
Correlated optical density (ODcorr) 0.383* -0.305 -0.81 -0.110 -0.713**
83
had a moderate positive relationship between lactic acid bacteria (LAB) count (r = 0.440, p
< 0.05). The pH had negative moderate relationship with the LAB count (r = -0.535, p <
0.05). The LAB count had a positive weak and very weak relationship with the TVC and
YM, respectively. A very weak negative relationship was also observed between the LAB
and OD. Meanwhile the TVC had a positive weak and negative very weak relationship
with the YM and OD respectively. YM had a strong negative relationship with the OD (r =
-0.713, p < 0.05).
In summary a moderate-strong linear relationship was between the TTA and pH,
LAB and pH and YM and ODcorr. These results further indicated that during succession
fermentation of glucose by LAB to lactic acid, the pH dropped due to the built up of
hydrogen ion. The decrease in pH thus resulted in the increase in TTA. The OD of the
beverage was also inversely related to the growth of YM. This could be because the
increase in bacterial load was mainly from the growth of LAB in succession but not the
YM.
3.4.7 Inherent structural grouping on the basis of fermentation time using
principal component analysis (PCA)
The pH, total titratable acidity (TTA), correlated optical density (ODcorr), lactic acid bacteria
(LAB), yeast and mould (YM) and total viable count (TVC) in pearl millet slurry during
fermentation for the production of non-alcoholic pearl millet beverage (NAPMB) were
subjected to principal components analysis (PCA). Figure 3.7 shows the scores
(fermentation time) and loadings (pH, TTA, ODcorr, LAB and TVC) during 36 h
fermentation. The variations in the data could be explained by two principal components
(PC1 and PC2). The cumulative variability was 74% with much variation (54%) explained
by PC1 and 20% by PC2. PC1 was highly correlated to LAB and TTA at 36 h of
fermentation. Furthermore, PC2 was highly correlated to YM at 30 and 33 h of
fermentation. This indicated that the variations in the quality characteristics of NAPMB
could mainly be explained by high TTA, LAB, YM and OD between 30 and 36 h of
fermentation. During fermentation the LAB breakdown sugars into lactic acid which
decreased the pH. Therefore, in future work the TTA could be used to monitor the growth
of LAB during fermentation. YM also plays a role during fermentation and could be used
as an indicator. OD could be used to monitor the increase in microorganisms during
fermentation.
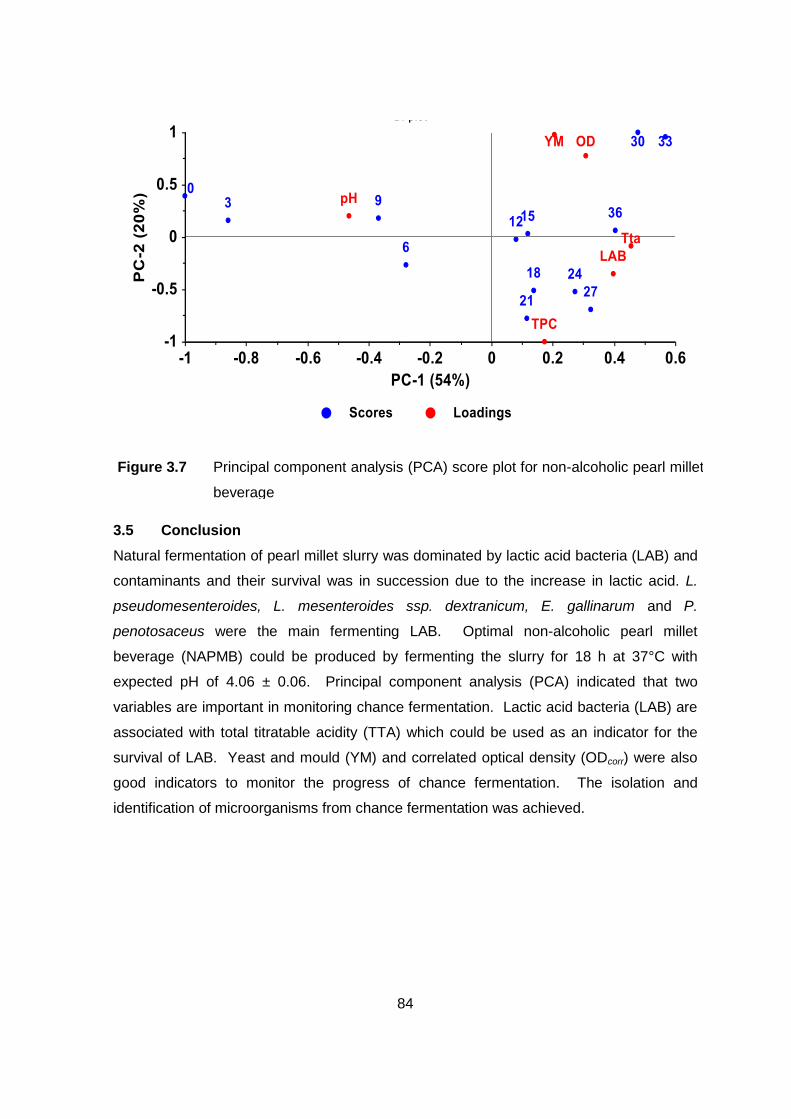
84
3.5 Conclusion
Natural fermentation of pearl millet slurry was dominated by lactic acid bacteria (LAB) and
contaminants and their survival was in succession due to the increase in lactic acid. L.
pseudomesenteroides, L. mesenteroides ssp. dextranicum, E. gallinarum and P.
penotosaceus were the main fermenting LAB. Optimal non-alcoholic pearl millet
beverage (NAPMB) could be produced by fermenting the slurry for 18 h at 37°C with
expected pH of 4.06 ± 0.06. Principal component analysis (PCA) indicated that two
variables are important in monitoring chance fermentation. Lactic acid bacteria (LAB) are
associated with total titratable acidity (TTA) which could be used as an indicator for the
survival of LAB. Yeast and mould (YM) and correlated optical density (ODcorr) were also
good indicators to monitor the progress of chance fermentation. The isolation and
identification of microorganisms from chance fermentation was achieved.
Figure 3.7 Principal component analysis (PCA) score plot for non-alcoholic pearl millet
beverage
85
References
Abegaz, K. (2007). Isolation, characterization and identification of lactic acid bacteria
involved in traditional fermentation of borde, an Ethiopian cereal beverage. African
Journal Biotechnology, 6(12), 1469-1478.
Achi, O.M. & Ukwuru, M. (2015). Cereal-based fermented foods of Africa as functional
foods. International Journal of Microbiology and Application, 2(4), 71-83.
Akonor, P.T., Tortoe, C. & Oduro-Yeboah, C. (2014). Physicochemical characteristics of
non-alcoholic beverages produced from sprouted roasted varieties of maize (Zea
mays). International Journal of Food Science and Nutrition Engineering, 4(1), 20-
26.
AOAC (Association of Official Analytical Chemist), 1980. Official methods of analysis, 15th
ed. Washington, D.C. Association of Official Analytical Chemists ISBN 2-93 558
442-0.
Araujo, T.F. & de Luces Ferreira, C.L. (2013). The genus Enterococcus as probiotic:
safety concerns. Brazilian Archives of Biology and Technology - An International
Journal, 56(3), 457-466.
Batt, C.A. & Tortorello, M.L. (2014). Encyclopaedia of food microbiology (2nd ed., Vol. 1).
2014: Academic Press. United Kingdom
Battcock, M. & Azam-Ali, S. (1998). Fermented fruits and vegetables. A global
perspective. United Nations. Rome. FAO.
Beldjazia, A. & Alatou, D. (2016). Precipitation variability on the massif forest of Mahouna
(North Eastern-Algeria) from 1986 to 2010. International Journal of Management
Sciences and Business Research, 5(3), 21-28.
Blandino, A., Al-Aseeri, M.E., Pandiella, S.S., Cantero, D. & Webb, C. (2003). Cereal-
based fermented foods and beverages. Food Research International, 36, 527-
543.
Champagne, C.P., Gardner, N.J. & Lacroix, C. (2007). Fermentation technologies for the
production of exopolysaccharide synthesizing Lactobacillus rhamnosus
concentrated cultures. Electronic Journal of Biotechnology, 10(2), 211-220.
de Castro, A., Montano, A., Casado, F. -J., Sanchez, A., -H., Rejano, L. (2002). Utilization
of Enterococcus casseliflavus and Lactobacillus pentosus as starter cultures for
Spanish-style green olive fermentation. Food Microbiology, 19, 637-644.
Dimic, G.R. (2006). Characteristics of the Leuconostoc mesenteroides subs.
mesenteroides strains from fresh vegetables. Acta Periodica Technologica, 37, 1-
192.
86
Doulgeraki, A.I., Pramateftaki, P., Argyri, A.A., Nychas, G. E., Tassou, C.C. & Panagou,
E.Z. (2013). Molecular characterization of lactic acid bacteria isolated from
industrially fermented Greek table olives. Food Science and Technology, 50. 353-
356.
Evans (1996). Straight forward statistics for the behavioural sciences. Pacific Grove, CA:
Brooks/Cole Publishing, (As cited by Beldjazia & Alatou, 2016).
Facklam, R. (2002). What happened to the Streptococci: overview of taxonomical and
nomenclature changes. Clinical Microbiology Review, 15(4), 613-630.
Gimenez-Pereira, M.L. (2005). Enterococci in milk products. A dissertation Master of
Veterinary Studies. .Massey University. Palmerston North. New Zealand:
Grossmann, M.V., Mandararino, J.M.G. & Yabu, M.C. (1998). Chemical composition and
functional properties of sprouted corn flour. Brazilian Archives of Biology and
Technology, 41(2). 1-7.
Ibegbulem, C.O. & Chikezie, P.C. (2013). Biochemical indices and sensory scores of
kunun-zaki beverage produced from sprouted and unsprouted guinea corn and
their correlation. American Journal of Food Technology, 1-7.
IBM Corporation (2015). IBM SPSS Statistics for Windows, Version 23.0. Armonk, NY:
IBM Corp.
Ikpoh, I. S., Lennox, J. A. Agbo, B. E. Henshaw, E. E. & Udoekong, N. S. (2013).
Microbial quality assessment of kunu beverage locally prepared and hawked in
Clabar, Cross River State, Nigeria . Journal of Current Research in Science, 1(1),
20-23.
James Cook University (JCU). (2016.). Biological sample preparation for the SEM.
[Internet Document]. URL https://research.jcu.edu.au/archive/enabling/aac/cairns-
aac/biological-sample-preparation-for-the-sem. Accessed 11/05/2016.
Jooyandeh, H. (2013). Production of non-alcoholic fermented plum beverages. Middle-
East Journal of Scientific Research, 13(6), 836-843.
Kandil, S. & Soda, E.L. (2015). Influence of freezing and freeze drying on intracellular
enzymatic activity and autolytic properties of some lactic acid bacterial strains.
Advances in Microbiology, 5, 371-382.
Katongole, J. N. (2008). The microbial succession in indegenous fermented maize
products. MSc Thesis in Agricultures. University of Free State, Bloemfontein.
Kivanc, M., Yilmaz, Y. & Cakir, E. (2011). Isolation and identification of lactic acid bacteria
from boza and their microbial activity against several reported strains. Tubitak. 35,
313-.324.
87
Koehler, P. & Wieser, H. (2013). Chemistry of cereal grains. In Gobbetti, M. & Ganzle, M.
Handbook on sourdough biotechnology (pp. 12-14). Germany: Springer.
Li, B. W., Andrews, K. W. & Pehrsson, P. R. (2002). Individual sugars, soluble, and
insoluble dietary fiber contents of 70 high consumption foods. Journal of Food
Composition and Analysis, 15, 715-723.
Mavhungu, J. (2005). Isolation and characterization of lactic acid bacteria from "Ting" in
the Northern Province of South Arica. Pretoria. South Africa: Thesis in MSc
Microbiology. Department of Microbiology and Plant Pathology. University of
Pretoria.
Mella, O. (2011). Effects of sprouting and fermentation on the composition and
functionality of sorghum flour. University of Nebraska.
Menconi, A., Kallapura, G., Latorre, J.D., Morgan, M.J., Pumford, N.R., Hargis, B.M. &
Tellez, G. (2014). Identification and characterization of lactic acid bacteria in a
commercial probiotic culture. Bioscience of Microbiota, Food and Health, 33(1),
25-30.
Meslier, V., Loux, V. & Renault, P. (2012). Genome sequence of Leuconostoc
pseudomesenteroides Strain 4882, isolated from a dairy starter culture. Journal of
Bacteriology, 194(23). 6637.
Mwale, M. M. (2014). Microbiological quality and safety of the Zambian fermented cereal
beverage: Chibwantu. PhD Thesis in Microbiology. University of the Free State.
Bloemfontein. South Africa
Nuraida, L. (2015). A review: Health promoting lactic acid bacteria in traditional
Indonesian fermented foods. Food Science and Human Wellness, 4. 47-55.
Nwachukwu, E.A. Achi, O.K. & Ijeoma, I.O. (2010). Lactic acid bacteria in fermentation of
cereal for the production of indigenous Nigerian foods. African Journal of Food
Science and Technology, 1(2), 21-26.
Obadina, A.O., Oyewole, O.B. & Awojobi, T.M. (2008). Effect of steeping time of milled
grains on the quality of Kunnu-Zaki (a Nigerian beverage). African Journal of Food
Science, 2. 33-36.
Oladipo, I.C., Sanni, A., Chakraborty, W., Jana, S., Rudra, D.S., Gacchui, R. &
Swarnakar, S. (2015). Technological properties of strains of Enterococcus
gallinarum isolated from selected Nigerian traditional fermented foods. Malaysian
Journal of Microbiology, 11(1). 1-13.
Omemu, A.M. (2011). Fermentation dynamic during production of Ogi, a Nigerian
fermented cereal porridge. Report and Opinion. 3(4), 9-10.
88
Osman, M. (2011). Effect of traditional fermentation process on the nutrient and
antinutrient contents of pearl millet during preparation of Lohoh. Journal of the
Saudi Society of Agricultural Sciences, 10. 1-6.
Osuntogun, B. & Aboaba, O.O. (2004). Microbiological and Physico-chemical evaluation
of some non-alcoholic beverages. Pakistan Journal of Nutrition, 3(3), 188-192.
Perten. (2016). Falling Number® - Sprout damage detection. [Internet document]. URL
http://www.perten.com/fallingnumber. Accessed 05/05/2018
Perten. (2017). The chemistry behind the Falling Number® method. [Internet document].
URL http://www.perten.com/Products/Falling-Number/The-Falling-Number-
Method/How-does-the-Falling-Number-method-work/. Accessed 22/02/2017
Pushparaj, F.S. & Urooj, A. (2014). Antioxidant activity in two pearl millet (Pennisetum
typhoideum) cultivars as influenced by processing. Antioxidants, 3, 55-66.
Ratau, M. A. (2011). Effect of hydrocolloids on the stability and sensory properties of pearl
millet beverage. Dissertation for Degree BTech Food Technology. Pp. 1-60.
Department of Food Technology, Cape Peninsula University of Technology, Cape
Town.
Rathore, S., Salmeron, I. & Pandiella, S.S. (2012). Production of potentially probiotic
beverages using single and mixed cereal substrates fermented with lactic acid
bacteria cultures. Food Microbiology, 30, 239-244.
Schillinger, U. & Lucke, F.K. (1987). Identification of lactobacilli from meat and meat
products. Food Microbiology, 4, 199-208.
Schutte, L. (2013). Isolation and identification of the microbial consortium present in
fermented milks from Sub-Saharan Africa. MSc Thesis in Food Science. University
of Stellenbosch, Cape Town
Steinkraus, K. (1992). Lactic acid fermentation. In NAP, Applications of biotechnology to
traditional fermented foods (p. 43). Washington, D.C. National Academy Press.
emitope, .S. & aiyese, .B. (20 2). Quality assessment of ‘oti-oka' like beverage
produced from pearl millet. Journal of Applied Biosciences, 51, 3608-3617.
Terna, G. & Ayo, J. A. (2002). Innovations in the traditional Kunun-zaki production
process. Pakistan Journal of Nutrition, 1(5), 202-205.
Todar, K. (2012). The growth of bacterial populations. Todar 's online textbook of
bacteriology. [WWW document].
URL http://textbookofbacteriology.net/growth_3.html. Accessed 02/04/2017
Whitman, W.B. (2009). Bergey's manual of systematic bacteriology (2nd ed.). New York:
Springer Dordrecht Heidelberg.
Widdel, F. (2010). Theory and measurements of bacterial growth. Universitat Bremen.
89
Yates, G.T. & Smotzer, T. (2007). On the lag phase and initial microbial growth curves.
Journal of Theoretical Biology, 244, 511-517.
Zvauya, R.M. (1997). Microbial and biochemical changes occurring during production of
masvusvu and mangisi, traditional Zimbabwean beverages. Plant Foods for
Human Nutrition, 51. 43-51.
Adelekan, A.O., Alamu, A.E., Arisa, N.U., Adebayo, Y.O. & Dosa, A.A. (2013). Nutritional,
microbiological and sensory Characteristics of malted Soy-Kunu Zaki: an improved
traditional beverage . Advances in Microbiology, 3. 389-397.
90
CHAPTER FOUR
PRODUCTION OF NON-ALCOHOLIC PEARL MILLET BEVERAGE USING
PURIFIED CULTURES OF LACTIC ACID BACTERIA
Abstract
The aim of this investigation was to assess the effect of using purified cultures of lactic
acid bacteria (LAB) on the fermentation parameters (pH, total titratable acidity and
viscosity) with a view to produce a stable and acceptable non-alcoholic pearl millet
beverage. Pearl millet extract (PME) was produced by hydrating pearl millet flour (PMF)
with water (1:10, PMF:Water). To the mixture, 15% of sprouted rice flour (SRF) and 10%
ground ginger were added. Carrageenan (0.03, 0.05 & 0.6%), pectin (0.6%) and sodium
alginate (0.3%) were used to stabilize the extract. The stability was determined using
Turbiscan MA 2000. Turbiscan profiles for each stabilisers indicated that sodium alginate
and pectin at 0.3% and 0.6%, respectively, produced a stable PME. Pectin was selected
for producing a stable PME. PME was pasteurized, cooled to 40°C and inoculated with
Leuconostoc mesenteroides and Pediococcus pentosaceus at 0.05 and 0.025%,
respectively, and in combination. The extract was then fermented for 18 h at 37⁰C. The
pH, total titratable acidity (TTA) and viscosity of NAPMB were determined. In addition,
sensory evaluation of the beverage was conducted. Generalized linear model was used
to determine the effect of the purified cultures on the pH, TTA and viscosity of the
beverage. SPSS Monte Carlo simulation was used to model the influence of the LAB on
the pH, TTA and viscosity of the beverage for 1000 cases. The pH of the beverage
ranged between pH 3.32 and pH 3.90. L. mesenteroides, P. pentosaceus, E. gallinarum,
the interaction between L. mesenteroides and P. pentosaceus and the interaction
between L. mesentoroides and E. gallinarum had a significant (p ˂ 0.05) effect on the pH
of NAPMB. The TTA of the beverage ranged from 0.50 to 0.72%. All cultures had a
significant (p ˂ 0.05) influence on the TTA of the beverage with the exception of the
interaction between L. mesenteroides and E. gallinarum (p = 0.102). The viscosity ranged
from -88.00 to 11.74 mPa.s. All LAB cultures had a significant influence on the viscosity
of the beverage. However, Monte Carlo simulation showed that E. gallinarum caused an
increase in the pH and a decrease in the TTA of the beverage, an undesirable effect in
beverage fermentation. During fermentation, the pH of the beverage is desired to
decrease while the TTA increases, hence E. gallinarum was removed. The interaction
between P. pentosaceus and L. mesentoroides at 0.025% and 0.05%, respectively
produced an acceptable NAPMB.
91
4.1 Introduction
Cereals play an important role in health and disease prevention in almost every country.
This has led to the growing demand in the development of a variety of cereal-based foods.
The development of cereal-based probiotic foods has the ability to increase market margin
for dairy-free food products. Dairy-free foods are in demand due to the growing number of
vegetarians; increase in lactose intolerant individuals; and many dairy products that have
high cholesterol (Yu & Bogue, 2013). Fermentation of food has been used in the
production of many probiotic foods. The combination of probiotics and cereal can produce
functional foods and beverages under controlled conditions with defined consistent
characteristics and health promoting properties (Yu & Bogue, 2013).
There are different forms of cereal beverages produced and consumed in Africa
such as Kunu, Ogi (Gaffa et al., 2002), Uji, Kivunde and Motoho (Ramaite, 2004). Many
of these beverages are produced at household level through chance fermentation and few
of them are at commercial level. Mahewu and Chibuku are examples of such
industrialized cereal beverages in South Africa and Zimbabwe, respectively (Gadaga et
al., 1999). Fermentation of beverages, especially lactic acid fermentation, is an important
indigenous technology extensively practiced by many people in Africa. This process is
cheaper to run and prevent spoilage of food and food-borne diseases especially in areas
prone to rapid food deterioration (Sahlin, 1999; Lei, 2006; Katongole, 2008).
Foods and beverages produced through fermentation play an important role in
socio-economic and protein requirements of people in many developing countries (Sahlin,
1999; Achi, 2005). However, these foods and beverages are made under unhygienic
environment which leads to low yield, poor and inconsistent quality (Achi, 2005). The
beverages are produced through traditional fermentation which depends on environmental
microorganisms. To control these, isolated and purified microorganisms involved in the
fermentation could be used in order to improve the efficiency of the fermentation process,
quality and safety of the end-product. In Chapter 3, the lactic acid bacteria (LAB) were
isolated and purified and it is of interest to investigate their effectiveness under controlled
conditions. The production of beverages under controlled conditions using purified
cultures is believed to result in beverages of high quality, which are consistently safe for
consumption (Schutte, 2013).
The aim of this investigation was to assess the effect of purified cultures of LAB on
some physical properties including viscosity of the beverage with a view to producing a
stable non-alcoholic pearl millet beverage.
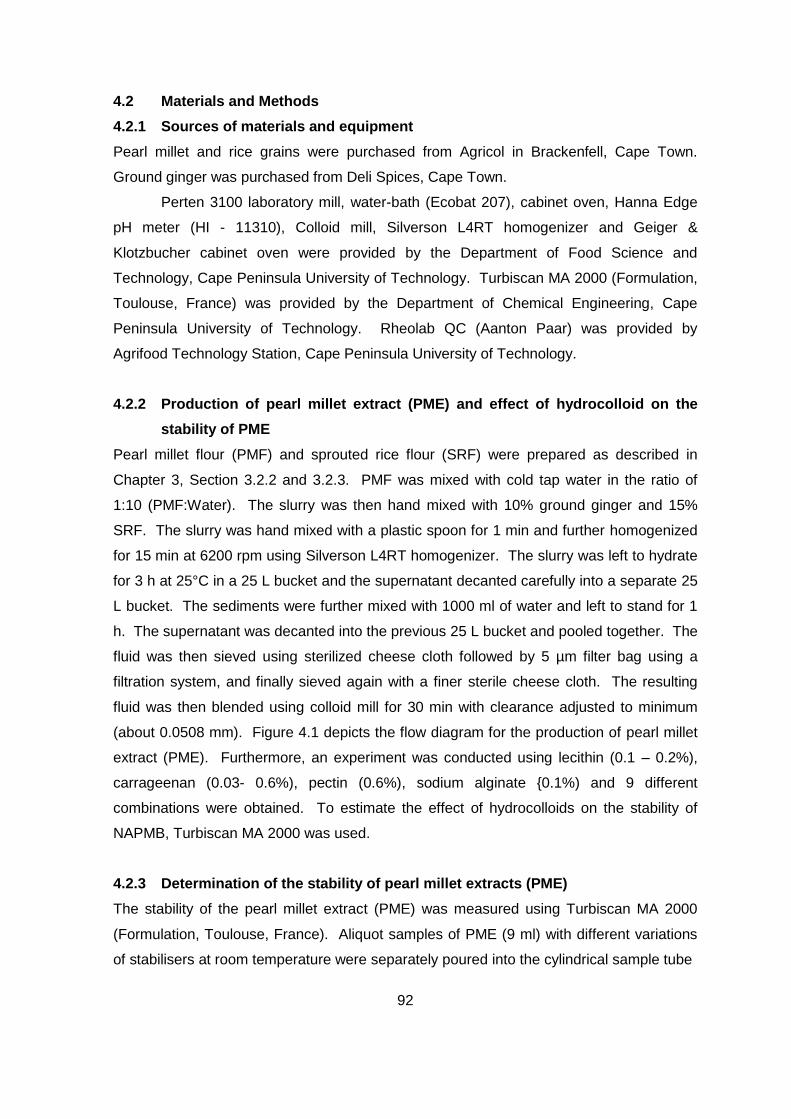
92
4.2 Materials and Methods
4.2.1 Sources of materials and equipment
Pearl millet and rice grains were purchased from Agricol in Brackenfell, Cape Town.
Ground ginger was purchased from Deli Spices, Cape Town.
Perten 3100 laboratory mill, water-bath (Ecobat 207), cabinet oven, Hanna Edge
pH meter (HI - 11310), Colloid mill, Silverson L4RT homogenizer and Geiger &
Klotzbucher cabinet oven were provided by the Department of Food Science and
Technology, Cape Peninsula University of Technology. Turbiscan MA 2000 (Formulation,
Toulouse, France) was provided by the Department of Chemical Engineering, Cape
Peninsula University of Technology. Rheolab QC (Aanton Paar) was provided by
Agrifood Technology Station, Cape Peninsula University of Technology.
4.2.2 Production of pearl millet extract (PME) and effect of hydrocolloid on the
stability of PME
Pearl millet flour (PMF) and sprouted rice flour (SRF) were prepared as described in
Chapter 3, Section 3.2.2 and 3.2.3. PMF was mixed with cold tap water in the ratio of
1:10 (PMF:Water). The slurry was then hand mixed with 10% ground ginger and 15%
SRF. The slurry was hand mixed with a plastic spoon for 1 min and further homogenized
for 15 min at 6200 rpm using Silverson L4RT homogenizer. The slurry was left to hydrate
for 3 h at 25°C in a 25 L bucket and the supernatant decanted carefully into a separate 25
L bucket. The sediments were further mixed with 1000 ml of water and left to stand for 1
h. The supernatant was decanted into the previous 25 L bucket and pooled together. The
fluid was then sieved using sterilized cheese cloth followed by 5 µm filter bag using a
filtration system, and finally sieved again with a finer sterile cheese cloth. The resulting
fluid was then blended using colloid mill for 30 min with clearance adjusted to minimum
(about 0.0508 mm). Figure 4.1 depicts the flow diagram for the production of pearl millet
extract (PME). Furthermore, an experiment was conducted using lecithin (0.1 – 0.2%),
carrageenan (0.03- 0.6%), pectin (0.6%), sodium alginate {0.1%) and 9 different
combinations were obtained. To estimate the effect of hydrocolloids on the stability of
NAPMB, Turbiscan MA 2000 was used.
4.2.3 Determination of the stability of pearl millet extracts (PME)
The stability of the pearl millet extract (PME) was measured using Turbiscan MA 2000
(Formulation, Toulouse, France). Aliquot samples of PME (9 ml) with different variations
of stabilisers at room temperature were separately poured into the cylindrical sample tube
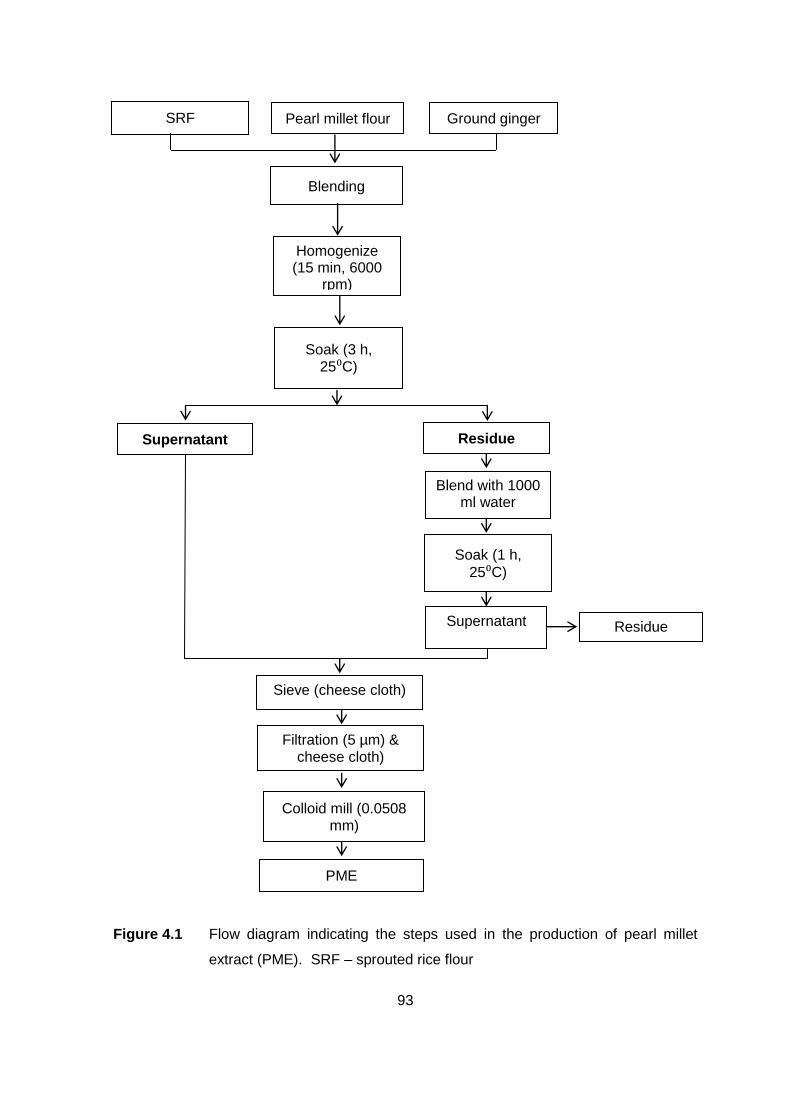
93
Figure 4.1 Flow diagram indicating the steps used in the production of pearl millet
extract (PME). SRF – sprouted rice flour
Colloid mill (0.0508 mm)
PME
Filtration (5 µm) & cheese cloth)
Sieve (cheese cloth)
Residue Supernatant
Soak (1 h,
25⁰C)
Blend with 1000 ml water
Supernatant Residue
Soak (3 h, 25⁰C)
Homogenize (15 min, 6000
rpm)
Blending
SRF Pearl millet flour Ground ginger
94
(65 mm length) and inserted into the optical scanning analyzer. The samples were
scanned following the method described by Adeyi (2014), Hardy (2016) and Maphosa
(2016). Turbiscan detection head moves along the vertical sample tube length from the
bottom to the top while multiple near-infra-red light (860 nm) were scattered through the
sample over 40 min at 5 min intervals. The lights reflected backwards (backscattering
flux) and the lights that passes through (transmission flux) the sample were measured and
backscattering (BS) flux curves generated as a function of sample height in relation to the
instrument internal standard.
In addition, the stability of the beverage was also determined by measuring the
settled particle height in a 250 ml Schott bottle. This procedure depends on the transition
time of the particles to the bottom of the glass bottles. The Schott bottles were filled with
200 g or 100 g PME and kept at 4⁰C. After 48 h of storage, the heights of the settled
particles were measured from the bottom of the bottle. The stability was expressed as the
ratio of particles at the bottom of the bottle to the height of beverage in the bottle
expressed in percentage (Equation 4.1). The zero percentage indicates that the product
is stable while the high percentage stability (100.00%) represents an unstable product.
ili y ( )
x 100 4.1
Where b = Settled particle height (mm) and B = Height of beverage (mm).
4.2.4 Production of stable pearl millet extracts (PME)
Pearl millet extract (1000 ml) was weighed into a 5 L plastic beaker. The dry ingredients
[pectin (0.6%), sodium citrate (0.1%) and white sugar (5%)] were mixed separately using
a plastic spoon in a plastic bowl. Sunflower lecithin paste (0.1%) was added to the pearl
millet extracts (PME) and blended using a spoon. PME was then blended at 6600 rpm for
5 min using a Silverson L4RT homogenizer while slowly adding the dry ingredients and
blended for about 1 min using a plastic spoon and further blended using Silverson L4RT
homogenizer for 2 min at 6600 rpm. Aliquots (250 ml) of PME in 250 ml Schott bottles
were pasteurized in a water bath (Ecobath 207) at 98⁰C for 30 min shaking at 40 rpm.
The extract was then chilled at 4⁰C until use.
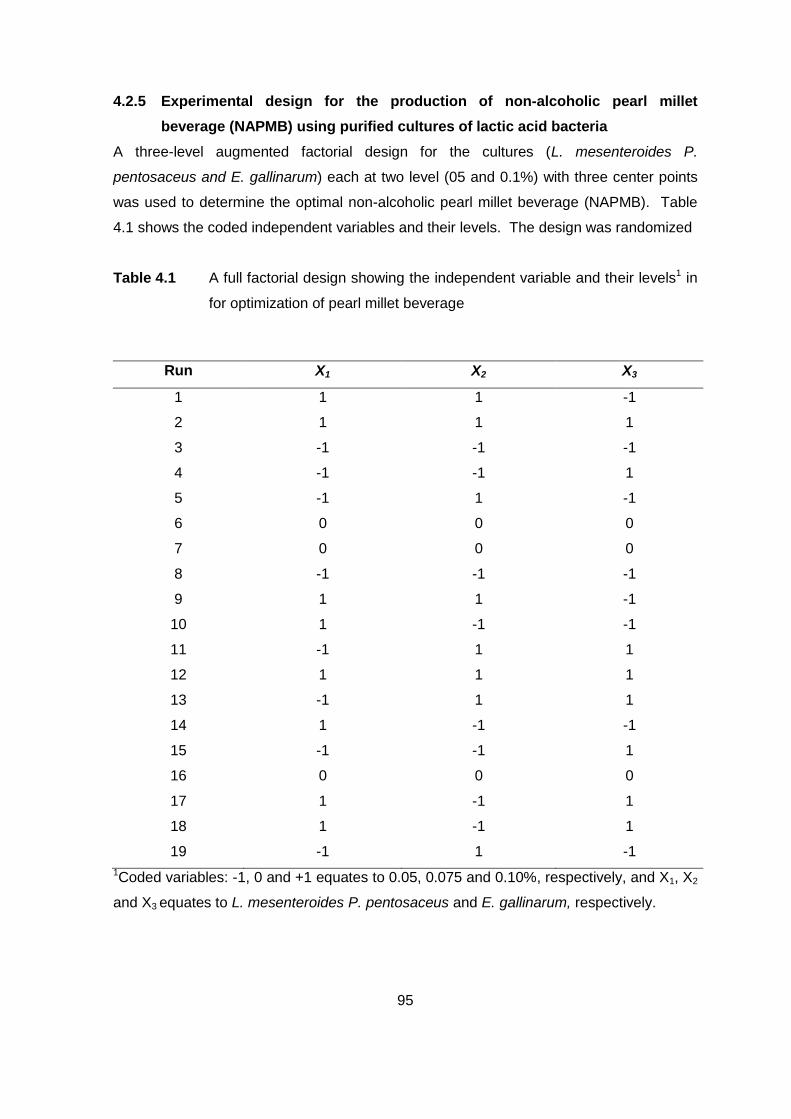
95
4.2.5 Experimental design for the production of non-alcoholic pearl millet
beverage (NAPMB) using purified cultures of lactic acid bacteria
A three-level augmented factorial design for the cultures (L. mesenteroides P.
pentosaceus and E. gallinarum) each at two level (05 and 0.1%) with three center points
was used to determine the optimal non-alcoholic pearl millet beverage (NAPMB). Table
4.1 shows the coded independent variables and their levels. The design was randomized
Table 4.1 A full factorial design showing the independent variable and their levels1 in
for optimization of pearl millet beverage
Run X1 X2 X3
1 1 1 -1
2 1 1 1
3 -1 -1 -1
4 -1 -1 1
5 -1 1 -1
6 0 0 0
7 0 0 0
8 -1 -1 -1
9 1 1 -1
10 1 -1 -1
11 -1 1 1
12 1 1 1
13 -1 1 1
14 1 -1 -1
15 -1 -1 1
16 0 0 0
17 1 -1 1
18 1 -1 1
19 -1 1 -1
1Coded variables: -1, 0 and +1 equates to 0.05, 0.075 and 0.10%, respectively, and X1, X2
and X3 equates to L. mesenteroides P. pentosaceus and E. gallinarum, respectively.
96
and run in duplicate. Generalized linear model was used to determine the effect of the
purified cultures of lactic acid bacteria (LAB) on the pH, total titratable acidity (TTA) and
viscosity of the beverage with a view to producing a stable NAPMB. SPSS Monte Carlo
simulation was used to model the influence of the LAB on the pH, TTA and viscosity for
1000 cases.
4.2.6 Generalized linear model used to model the effect of each main and
interactive probiotic cultures on the pH, total titratable acidity (TTA) and
viscosity of the beverage
Generalized linear model (SPSS GENLIN) was used to estimate the effect of each of the
main factors (L. mesenteroides, P. pentosaceus and E. gallinarum) and their interaction
on the pH, total titratable acidity (TTA) and viscosity. The multivariate linear regression
model is given in Equation 4.2.
0 1 1 2 2 3 3 12 1 2 13 1 3 23 2 3 4.2
Where the notation Y represents the estimated parameter response (pH, lactic acid or
viscosity). ß0 repre en he over ll me n (in ercep ), β1, β2 nd β3 are the main coefficient
effect for L. mesenteroides, P. pentosaceus and E. gallinarum, re pec ively. β12, β13 and
β23 are the interactive coefficient effect for the main factors. X1, X2 and X3 represent
independent factors, L. mesenteroides, P. pentosaceus and E. gallinarum, respectively.
4.2.7 The effect of isolated pure lactic acid bacteria (LAB) on the pH, total
titratable acidity (TTA) and viscosity of the beverage
A two-level factorial design for L. mesenteroides and P. pentosaceus each at two levels
(0.05 and 0.10%) augmented with centre point was used to evaluate their effects
(individual effects) and interactive effects on the acceptability (bench top sensory), pH,
total titratable acidity and viscosity of the beverage. The experimental design was run
randomly and the taste of the beverage was not accepted. Thereafter, L. mesenteroides
and P. pentosaceus were used in combination at 0.05% each and in combination at 0.05
and 0.025%, respectively. A bench top sensory was used to evaluate the taste of the
beverage. The interactive effect of P. pentosaceus and L. mesenteroides at 0.025% and
0.05%, respectively was accepted.
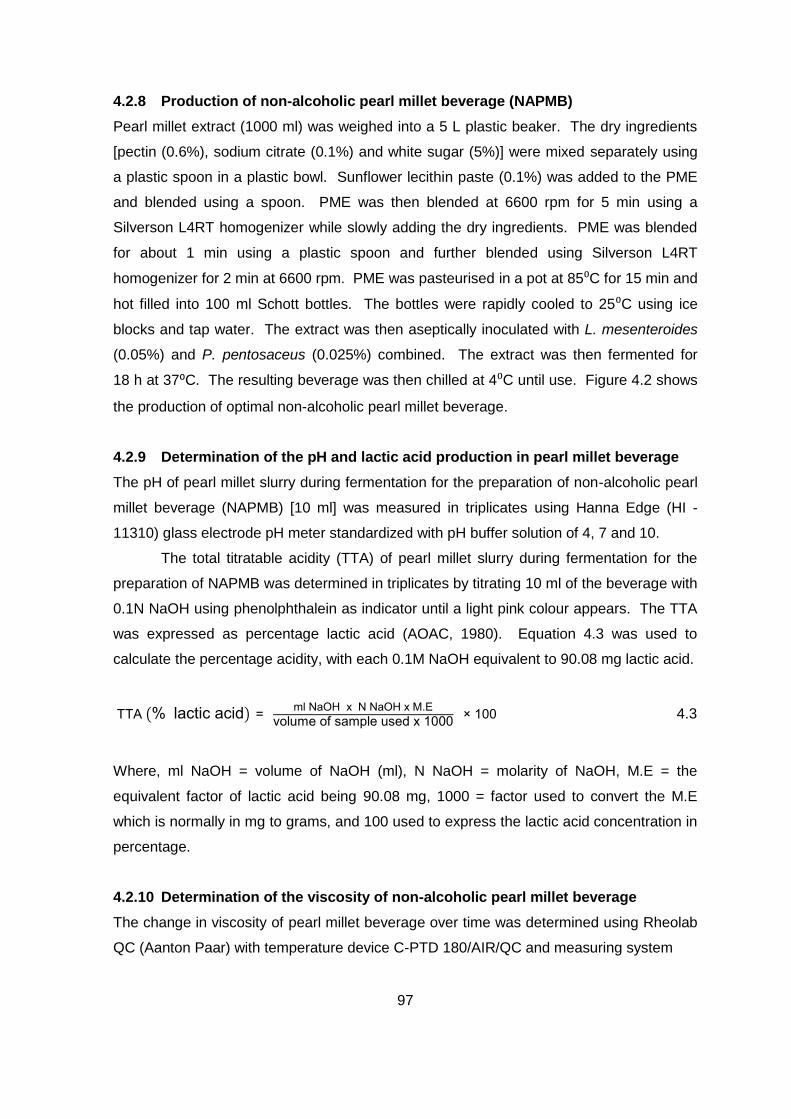
97
4.2.8 Production of non-alcoholic pearl millet beverage (NAPMB)
Pearl millet extract (1000 ml) was weighed into a 5 L plastic beaker. The dry ingredients
[pectin (0.6%), sodium citrate (0.1%) and white sugar (5%)] were mixed separately using
a plastic spoon in a plastic bowl. Sunflower lecithin paste (0.1%) was added to the PME
and blended using a spoon. PME was then blended at 6600 rpm for 5 min using a
Silverson L4RT homogenizer while slowly adding the dry ingredients. PME was blended
for about 1 min using a plastic spoon and further blended using Silverson L4RT
homogenizer for 2 min at 6600 rpm. PME was pasteurised in a pot at 85⁰C for 15 min and
hot filled into 100 ml Schott bottles. The bottles were rapidly cooled to 25⁰C using ice
blocks and tap water. The extract was then aseptically inoculated with L. mesenteroides
(0.05%) and P. pentosaceus (0.025%) combined. The extract was then fermented for
18 h at 37⁰C. The resulting beverage was then chilled at 4⁰C until use. Figure 4.2 shows
the production of optimal non-alcoholic pearl millet beverage.
4.2.9 Determination of the pH and lactic acid production in pearl millet beverage
The pH of pearl millet slurry during fermentation for the preparation of non-alcoholic pearl
millet beverage (NAPMB) [10 ml] was measured in triplicates using Hanna Edge (HI -
11310) glass electrode pH meter standardized with pH buffer solution of 4, 7 and 10.
The total titratable acidity (TTA) of pearl millet slurry during fermentation for the
preparation of NAPMB was determined in triplicates by titrating 10 ml of the beverage with
0.1N NaOH using phenolphthalein as indicator until a light pink colour appears. The TTA
was expressed as percentage lactic acid (AOAC, 1980). Equation 4.3 was used to
calculate the percentage acidity, with each 0.1M NaOH equivalent to 90.08 mg lactic acid.
( l c ic cid) ml x x .E
vol me of mple ed x 1000 100 4.3
Where, ml NaOH = volume of NaOH (ml), N NaOH = molarity of NaOH, M.E = the
equivalent factor of lactic acid being 90.08 mg, 1000 = factor used to convert the M.E
which is normally in mg to grams, and 100 used to express the lactic acid concentration in
percentage.
4.2.10 Determination of the viscosity of non-alcoholic pearl millet beverage
The change in viscosity of pearl millet beverage over time was determined using Rheolab
QC (Aanton Paar) with temperature device C-PTD 180/AIR/QC and measuring system
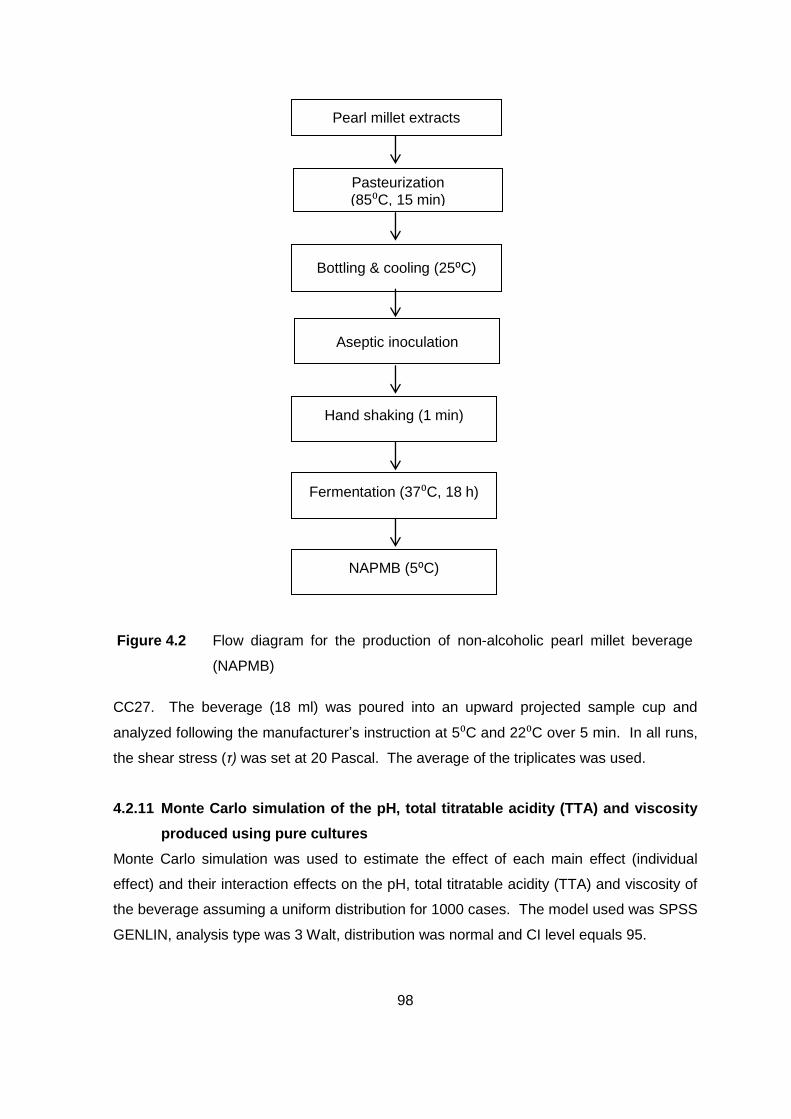
98
CC27. The beverage (18 ml) was poured into an upward projected sample cup and
analyzed following the manufacturer’ instruction at 5⁰C and 22⁰C over 5 min. In all runs,
the shear stress (τ) was set at 20 Pascal. The average of the triplicates was used.
4.2.11 Monte Carlo simulation of the pH, total titratable acidity (TTA) and viscosity
produced using pure cultures
Monte Carlo simulation was used to estimate the effect of each main effect (individual
effect) and their interaction effects on the pH, total titratable acidity (TTA) and viscosity of
the beverage assuming a uniform distribution for 1000 cases. The model used was SPSS
GENLIN, analysis type was 3 Walt, distribution was normal and CI level equals 95.
Figure 4.2 Flow diagram for the production of non-alcoholic pearl millet beverage
(NAPMB)
Pearl millet extracts
Pasteurization (85⁰C, 15 min)
Bottling & cooling (25⁰C)
Aseptic inoculation
Hand shaking (1 min)
Fermentation (37⁰C, 18 h)
NAPMB (5⁰C)
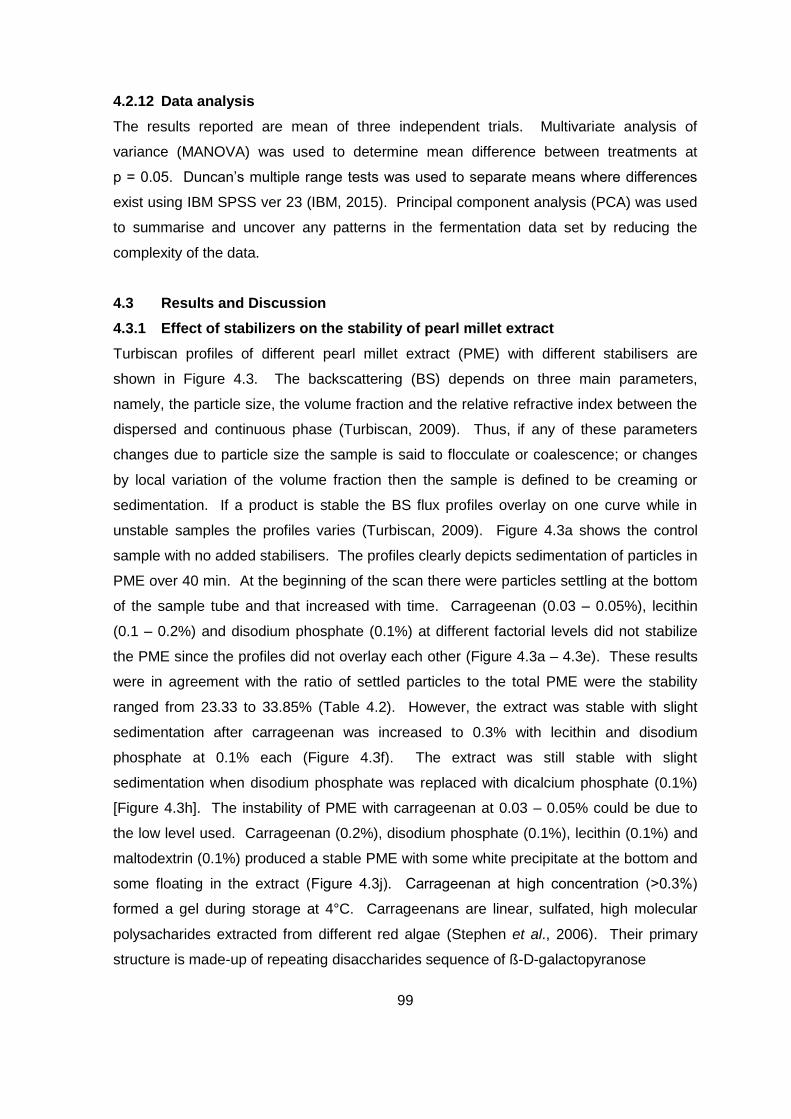
99
4.2.12 Data analysis
The results reported are mean of three independent trials. Multivariate analysis of
variance (MANOVA) was used to determine mean difference between treatments at
p 0.05. D nc n’ m l iple r nge e w ed o ep r e me n where difference
exist using IBM SPSS ver 23 (IBM, 2015). Principal component analysis (PCA) was used
to summarise and uncover any patterns in the fermentation data set by reducing the
complexity of the data.
4.3 Results and Discussion
4.3.1 Effect of stabilizers on the stability of pearl millet extract
Turbiscan profiles of different pearl millet extract (PME) with different stabilisers are
shown in Figure 4.3. The backscattering (BS) depends on three main parameters,
namely, the particle size, the volume fraction and the relative refractive index between the
dispersed and continuous phase (Turbiscan, 2009). Thus, if any of these parameters
changes due to particle size the sample is said to flocculate or coalescence; or changes
by local variation of the volume fraction then the sample is defined to be creaming or
sedimentation. If a product is stable the BS flux profiles overlay on one curve while in
unstable samples the profiles varies (Turbiscan, 2009). Figure 4.3a shows the control
sample with no added stabilisers. The profiles clearly depicts sedimentation of particles in
PME over 40 min. At the beginning of the scan there were particles settling at the bottom
of the sample tube and that increased with time. Carrageenan (0.03 – 0.05%), lecithin
(0.1 – 0.2%) and disodium phosphate (0.1%) at different factorial levels did not stabilize
the PME since the profiles did not overlay each other (Figure 4.3a – 4.3e). These results
were in agreement with the ratio of settled particles to the total PME were the stability
ranged from 23.33 to 33.85% (Table 4.2). However, the extract was stable with slight
sedimentation after carrageenan was increased to 0.3% with lecithin and disodium
phosphate at 0.1% each (Figure 4.3f). The extract was still stable with slight
sedimentation when disodium phosphate was replaced with dicalcium phosphate (0.1%)
[Figure 4.3h]. The instability of PME with carrageenan at 0.03 – 0.05% could be due to
the low level used. Carrageenan (0.2%), disodium phosphate (0.1%), lecithin (0.1%) and
maltodextrin (0.1%) produced a stable PME with some white precipitate at the bottom and
some floating in the extract (Fig re 4.3j). C rr geen n high concen r ion (˃0.3 )
formed a gel during storage at 4°C. Carrageenans are linear, sulfated, high molecular
polysacharides extracted from different red algae (Stephen et al., 2006). Their primary
structure is made-up of repeating disaccharides sequence of ß-D-galactopyranose
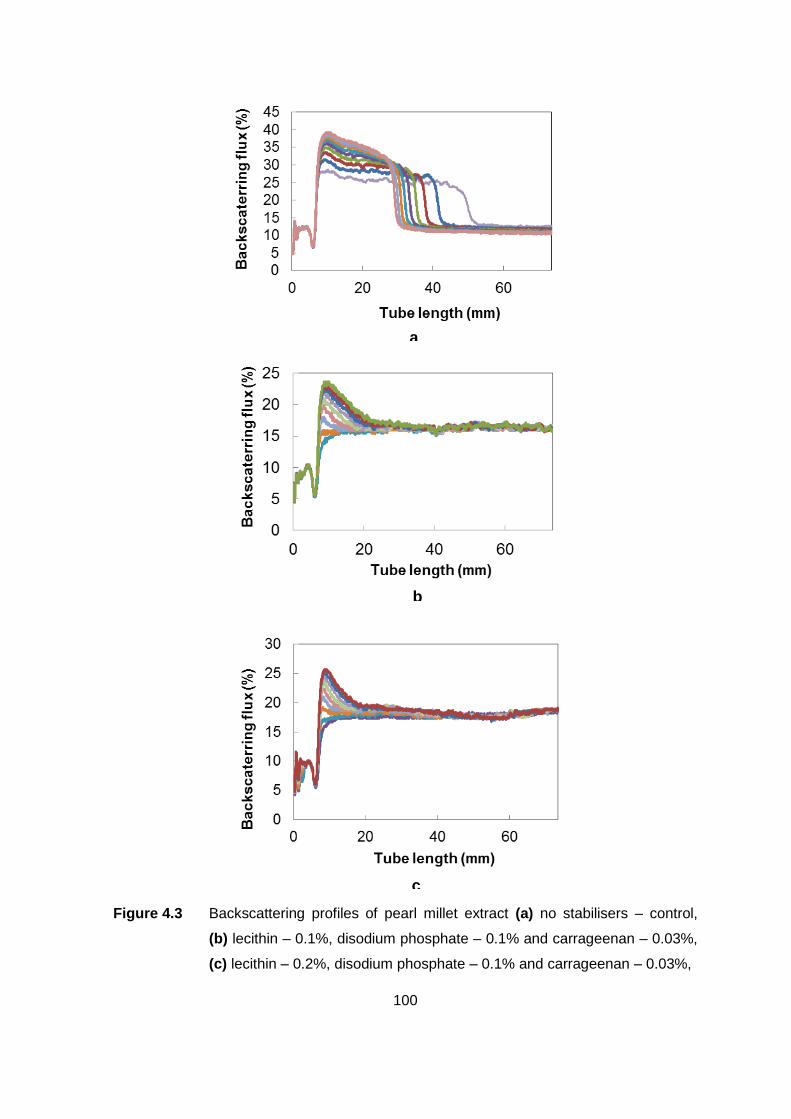
100
Figure 4.3 Backscattering profiles of pearl millet extract (a) no stabilisers – control,
(b) lecithin – 0.1%, disodium phosphate – 0.1% and carrageenan – 0.03%,
(c) lecithin – 0.2%, disodium phosphate – 0.1% and carrageenan – 0.03%,
a
b
c
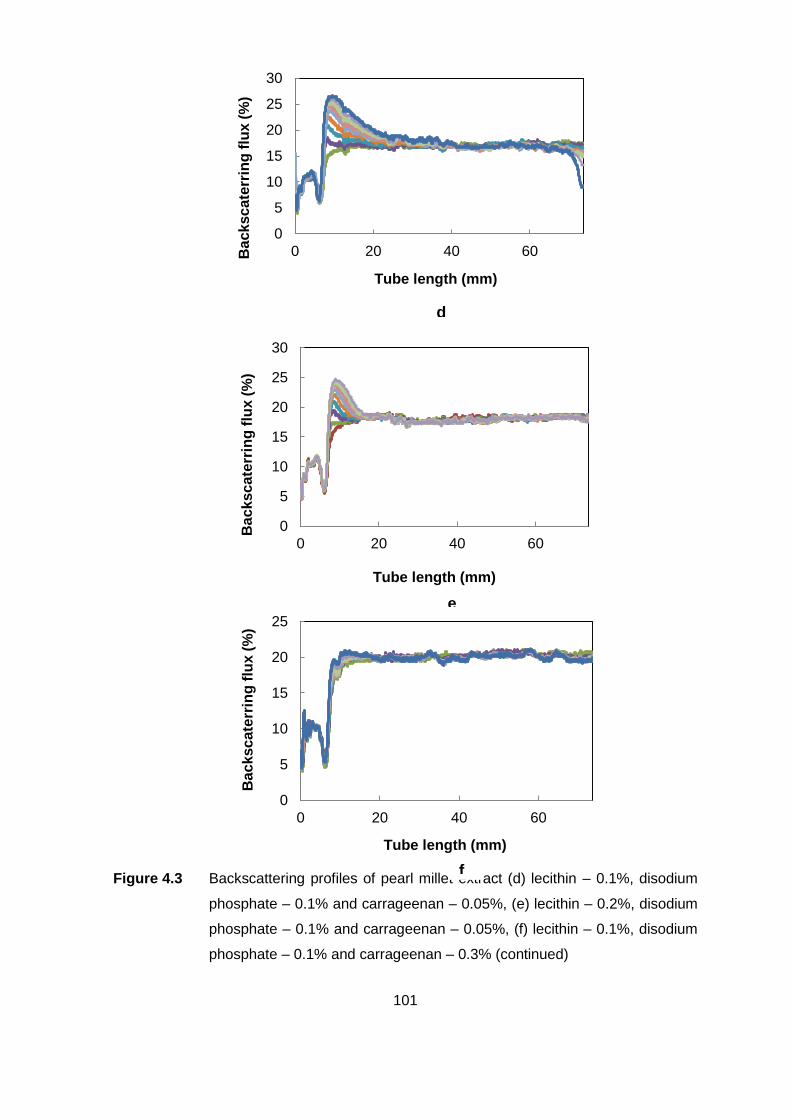
101
Figure 4.3 Backscattering profiles of pearl millet extract (d) lecithin – 0.1%, disodium
phosphate – 0.1% and carrageenan – 0.05%, (e) lecithin – 0.2%, disodium
phosphate – 0.1% and carrageenan – 0.05%, (f) lecithin – 0.1%, disodium
phosphate – 0.1% and carrageenan – 0.3% (continued)
0
5
10
15
20
25
30
0 20 40 60Backscate
rrin
g f
lux (
%)
Tube length (mm)
d
0
5
10
15
20
25
30
0 20 40 60
Ba
ck
sc
ate
rrin
g f
lux (
%)
Tube length (mm)
0
5
10
15
20
25
0 20 40 60
Ba
ck
sc
ate
rrin
g f
lux (
%)
Tube length (mm)
e
f
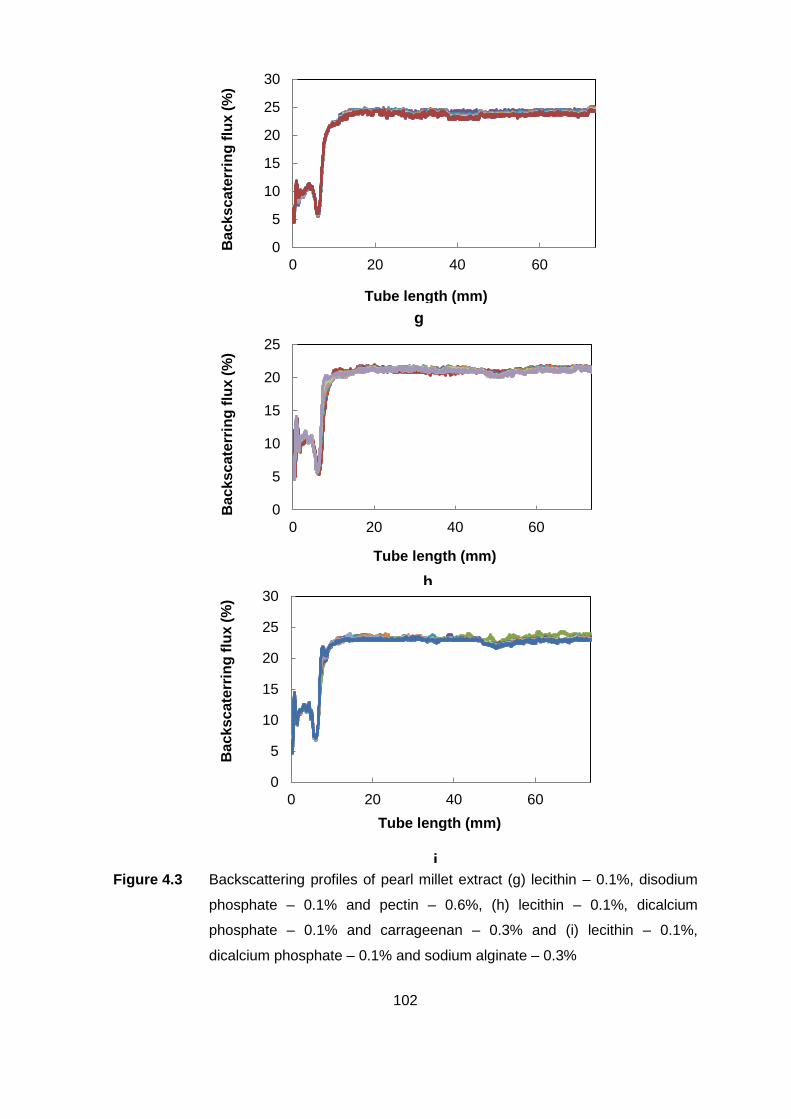
102
Figure 4.3 Backscattering profiles of pearl millet extract (g) lecithin – 0.1%, disodium
phosphate – 0.1% and pectin – 0.6%, (h) lecithin – 0.1%, dicalcium
phosphate – 0.1% and carrageenan – 0.3% and (i) lecithin – 0.1%,
dicalcium phosphate – 0.1% and sodium alginate – 0.3%
0
5
10
15
20
25
30
0 20 40 60
Ba
ck
sc
ate
rrin
g f
lux (
%)
Tube length (mm)
0
5
10
15
20
25
0 20 40 60
Ba
ck
sc
ate
rrin
g f
lux (
%)
Tube length (mm)
0
5
10
15
20
25
30
0 20 40 60
Ba
ck
sc
ate
rrin
g f
lux (
%)
Tube length (mm)
g
h
i
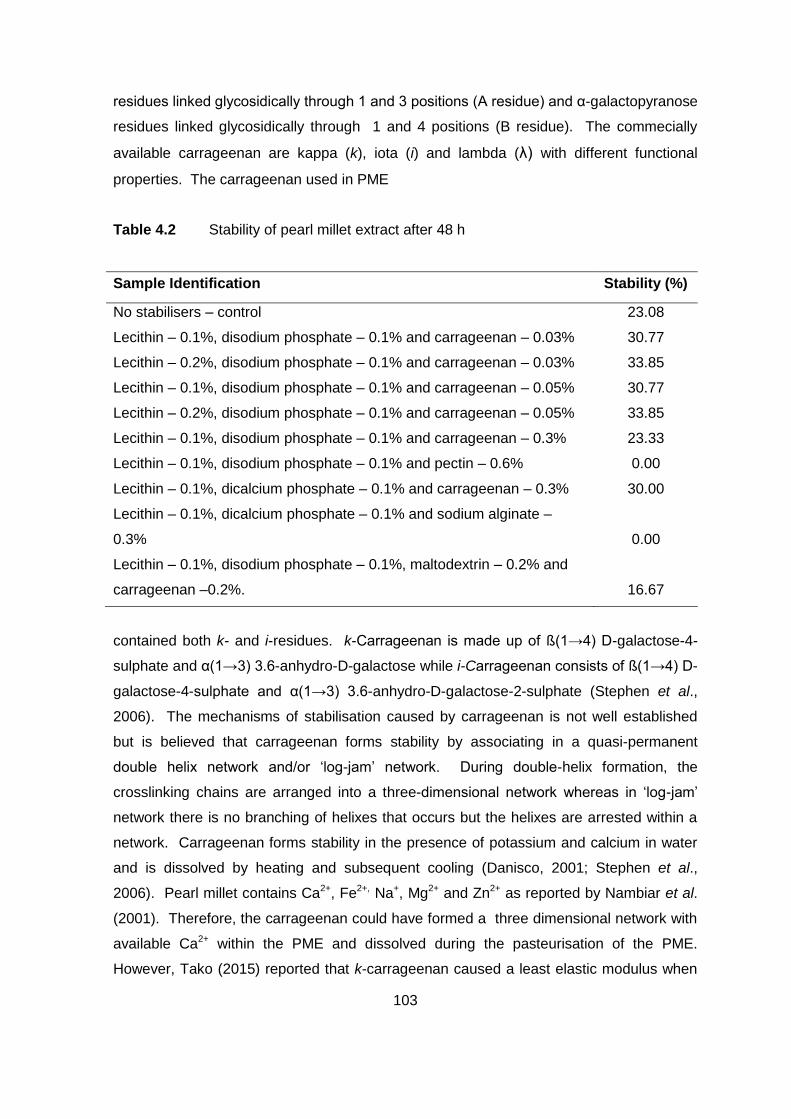
103
re id e linked glyco idic lly hro gh 1 nd 3 po i ion ( re id e) nd α-galactopyranose
residues linked glycosidically through 1 and 4 positions (B residue). The commecially
available carrageenan are kappa (k), iota (i) and lambda (λ) with different functional
properties. The carrageenan used in PME
Table 4.2 Stability of pearl millet extract after 48 h
Sample Identification Stability (%)
No stabilisers – control 23.08
Lecithin – 0.1%, disodium phosphate – 0.1% and carrageenan – 0.03% 30.77
Lecithin – 0.2%, disodium phosphate – 0.1% and carrageenan – 0.03% 33.85
Lecithin – 0.1%, disodium phosphate – 0.1% and carrageenan – 0.05% 30.77
Lecithin – 0.2%, disodium phosphate – 0.1% and carrageenan – 0.05% 33.85
Lecithin – 0.1%, disodium phosphate – 0.1% and carrageenan – 0.3% 23.33
Lecithin – 0.1%, disodium phosphate – 0.1% and pectin – 0.6% 0.00
Lecithin – 0.1%, dicalcium phosphate – 0.1% and carrageenan – 0.3% 30.00
Lecithin – 0.1%, dicalcium phosphate – 0.1% and sodium alginate –
0.3% 0.00
Lecithin – 0.1%, disodium phosphate – 0.1%, maltodextrin – 0.2% and
carrageenan –0.2%. 16.67
contained both k- and i-residues. k-C rr geen n i m de p of (1→4) D-galactose-4-
sulphate and α(1→3) 3.6-anhydro-D-galactose while i-C rr geen n con i of (1→4) D-
galactose-4- lph e nd α(1→3) 3.6-anhydro-D-galactose-2-sulphate (Stephen et al.,
2006). The mechanisms of stabilisation caused by carrageenan is not well established
but is believed that carrageenan forms stability by associating in a quasi-permanent
do le helix ne work nd/or ‘log-j m’ ne work. D ring do le-helix formation, the
crosslinking chains are arranged into a three-dimen ion l ne work where in ‘log-j m’
network there is no branching of helixes that occurs but the helixes are arrested within a
network. Carrageenan forms stability in the presence of potassium and calcium in water
and is dissolved by heating and subsequent cooling (Danisco, 2001; Stephen et al.,
2006). Pearl millet contains Ca2+, Fe2+, Na+, Mg2+ and Zn2+ as reported by Nambiar et al.
(2001). Therefore, the carrageenan could have formed a three dimensional network with
available Ca2+ within the PME and dissolved during the pasteurisation of the PME.
However, Tako (2015) reported that k-carrageenan caused a least elastic modulus when
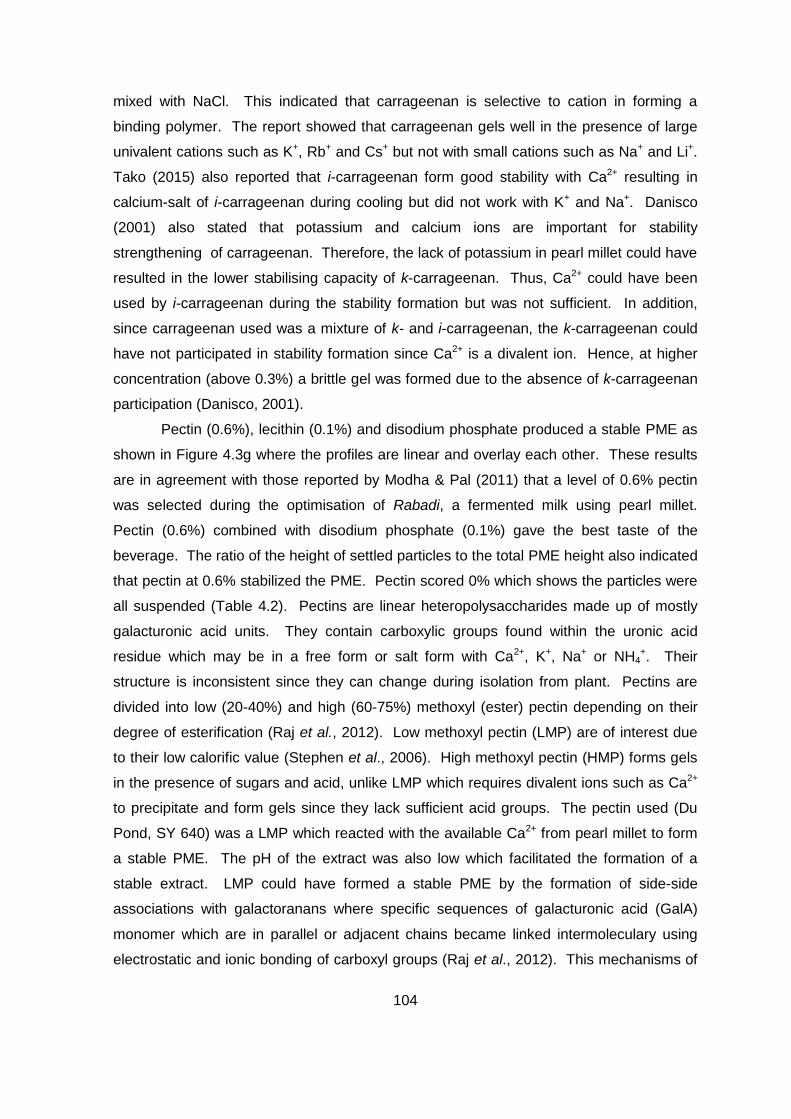
104
mixed with NaCl. This indicated that carrageenan is selective to cation in forming a
binding polymer. The report showed that carrageenan gels well in the presence of large
univalent cations such as K+, Rb+ and Cs+ but not with small cations such as Na+ and Li+.
Tako (2015) also reported that i-carrageenan form good stability with Ca2+ resulting in
calcium-salt of i-carrageenan during cooling but did not work with K+ and Na+. Danisco
(2001) also stated that potassium and calcium ions are important for stability
strengthening of carrageenan. Therefore, the lack of potassium in pearl millet could have
resulted in the lower stabilising capacity of k-carrageenan. Thus, Ca2+ could have been
used by i-carrageenan during the stability formation but was not sufficient. In addition,
since carrageenan used was a mixture of k- and i-carrageenan, the k-carrageenan could
have not participated in stability formation since Ca2+ is a divalent ion. Hence, at higher
concentration (above 0.3%) a brittle gel was formed due to the absence of k-carrageenan
participation (Danisco, 2001).
Pectin (0.6%), lecithin (0.1%) and disodium phosphate produced a stable PME as
shown in Figure 4.3g where the profiles are linear and overlay each other. These results
are in agreement with those reported by Modha & Pal (2011) that a level of 0.6% pectin
was selected during the optimisation of Rabadi, a fermented milk using pearl millet.
Pectin (0.6%) combined with disodium phosphate (0.1%) gave the best taste of the
beverage. The ratio of the height of settled particles to the total PME height also indicated
that pectin at 0.6% stabilized the PME. Pectin scored 0% which shows the particles were
all suspended (Table 4.2). Pectins are linear heteropolysaccharides made up of mostly
galacturonic acid units. They contain carboxylic groups found within the uronic acid
residue which may be in a free form or salt form with Ca2+, K+, Na+ or NH4+. Their
structure is inconsistent since they can change during isolation from plant. Pectins are
divided into low (20-40%) and high (60-75%) methoxyl (ester) pectin depending on their
degree of esterification (Raj et al., 2012). Low methoxyl pectin (LMP) are of interest due
to their low calorific value (Stephen et al., 2006). High methoxyl pectin (HMP) forms gels
in the presence of sugars and acid, unlike LMP which requires divalent ions such as Ca2+
to precipitate and form gels since they lack sufficient acid groups. The pectin used (Du
Pond, SY 640) was a LMP which reacted with the available Ca2+ from pearl millet to form
a stable PME. The pH of the extract was also low which facilitated the formation of a
stable extract. LMP could have formed a stable PME by the formation of side-side
associations with galactoranans where specific sequences of galacturonic acid (GalA)
monomer which are in parallel or adjacent chains became linked intermoleculary using
electrostatic and ionic bonding of carboxyl groups (Raj et al., 2012). This mechanisms of
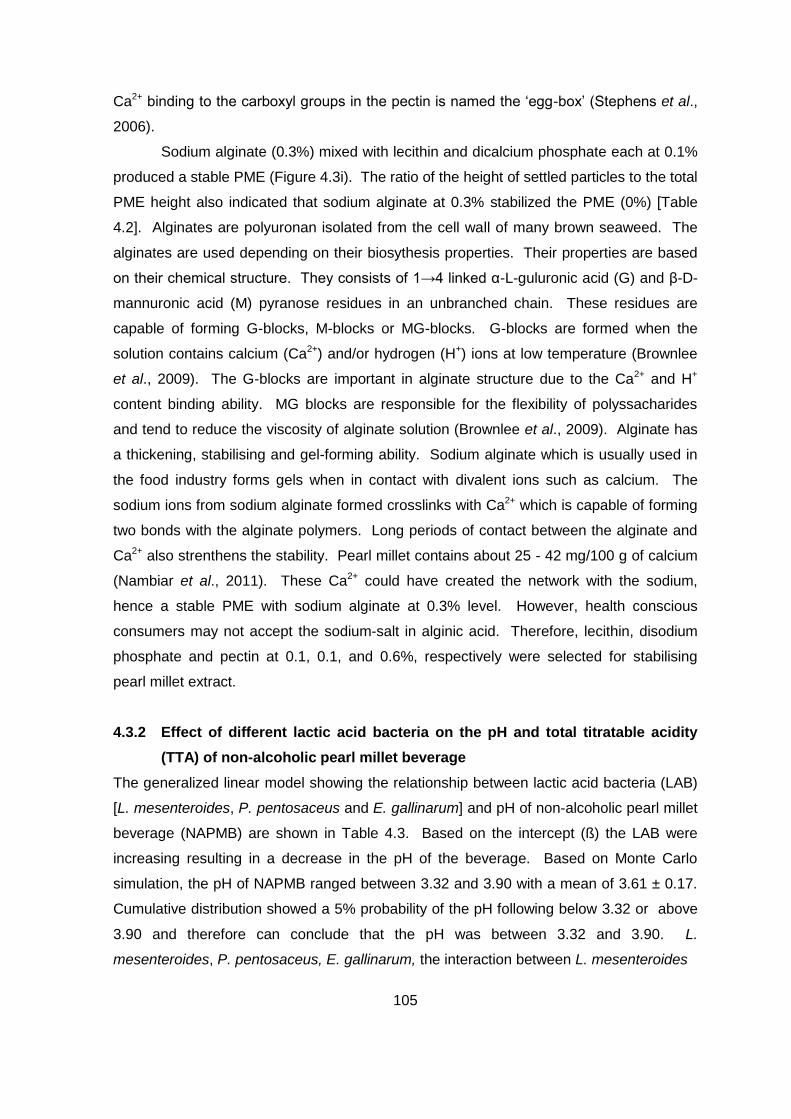
105
Ca2+ inding o he c r oxyl gro p in he pec in i n med he ‘egg- ox’ (S ephen et al.,
2006).
Sodium alginate (0.3%) mixed with lecithin and dicalcium phosphate each at 0.1%
produced a stable PME (Figure 4.3i). The ratio of the height of settled particles to the total
PME height also indicated that sodium alginate at 0.3% stabilized the PME (0%) [Table
4.2]. Alginates are polyuronan isolated from the cell wall of many brown seaweed. The
alginates are used depending on their biosythesis properties. Their properties are based
on heir chemic l r c re. hey con i of 1→4 linked α-L-guluronic acid (G) and β-D-
mannuronic acid (M) pyranose residues in an unbranched chain. These residues are
capable of forming G-blocks, M-blocks or MG-blocks. G-blocks are formed when the
solution contains calcium (Ca2+) and/or hydrogen (H+) ions at low temperature (Brownlee
et al., 2009). The G-blocks are important in alginate structure due to the Ca2+ and H+
content binding ability. MG blocks are responsible for the flexibility of polyssacharides
and tend to reduce the viscosity of alginate solution (Brownlee et al., 2009). Alginate has
a thickening, stabilising and gel-forming ability. Sodium alginate which is usually used in
the food industry forms gels when in contact with divalent ions such as calcium. The
sodium ions from sodium alginate formed crosslinks with Ca2+ which is capable of forming
two bonds with the alginate polymers. Long periods of contact between the alginate and
Ca2+ also strenthens the stability. Pearl millet contains about 25 - 42 mg/100 g of calcium
(Nambiar et al., 2011). These Ca2+ could have created the network with the sodium,
hence a stable PME with sodium alginate at 0.3% level. However, health conscious
consumers may not accept the sodium-salt in alginic acid. Therefore, lecithin, disodium
phosphate and pectin at 0.1, 0.1, and 0.6%, respectively were selected for stabilising
pearl millet extract.
4.3.2 Effect of different lactic acid bacteria on the pH and total titratable acidity
(TTA) of non-alcoholic pearl millet beverage
The generalized linear model showing the relationship between lactic acid bacteria (LAB)
[L. mesenteroides, P. pentosaceus and E. gallinarum] and pH of non-alcoholic pearl millet
beverage (NAPMB) are shown in Table 4.3. Based on the intercept (ß) the LAB were
increasing resulting in a decrease in the pH of the beverage. Based on Monte Carlo
simulation, the pH of NAPMB ranged between 3.32 and 3.90 with a mean of 3.61 ± 0.17.
Cumulative distribution showed a 5% probability of the pH following below 3.32 or above
3.90 and therefore can conclude that the pH was between 3.32 and 3.90. L.
mesenteroides, P. pentosaceus, E. gallinarum, the interaction between L. mesenteroides
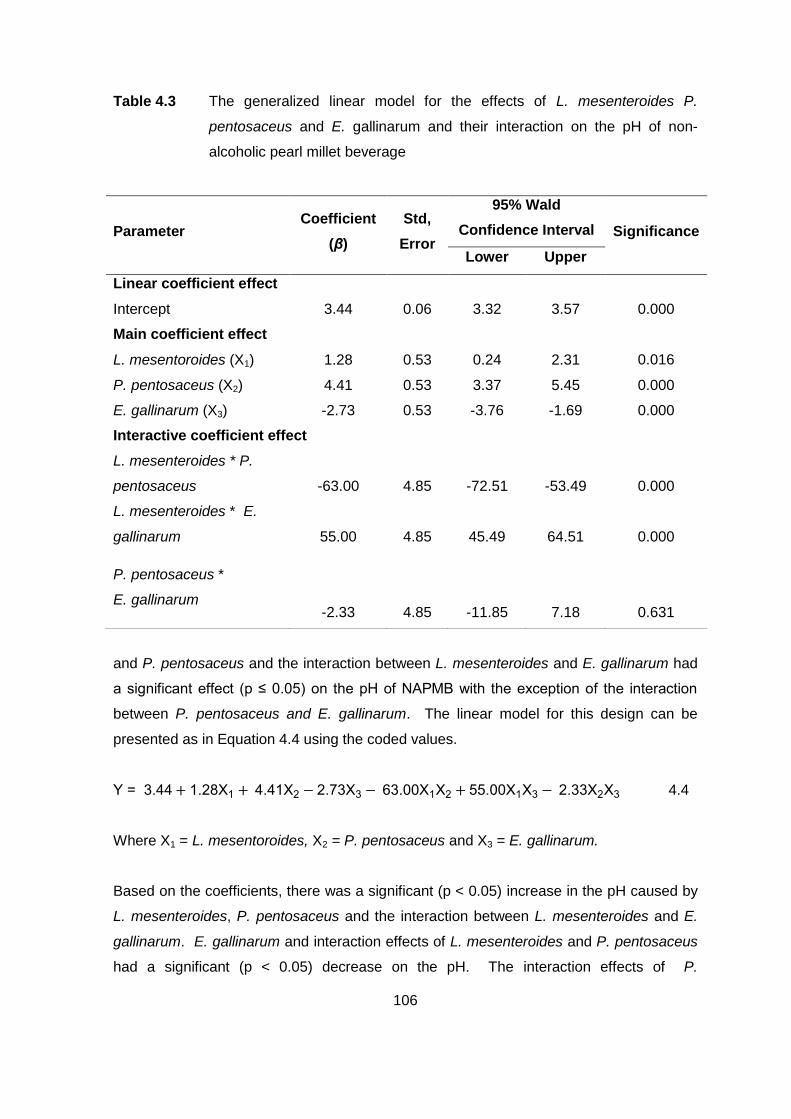
106
Table 4.3 The generalized linear model for the effects of L. mesenteroides P.
pentosaceus and E. gallinarum and their interaction on the pH of non-
alcoholic pearl millet beverage
and P. pentosaceus and the interaction between L. mesenteroides and E. gallinarum had
ignific n effec (p ≤ 0.05) on he p of P wi h he excep ion of he in er c ion
between P. pentosaceus and E. gallinarum. The linear model for this design can be
presented as in Equation 4.4 using the coded values.
3.44 1.28 1 4.41 2 2.73 3 63.00 1 2 55.00 1 3 2.33 2 3 4.4
Where X1 = L. mesentoroides, X2 = P. pentosaceus and X3 = E. gallinarum.
Based on the coefficients, there was a significant (p < 0.05) increase in the pH caused by
L. mesenteroides, P. pentosaceus and the interaction between L. mesenteroides and E.
gallinarum. E. gallinarum and interaction effects of L. mesenteroides and P. pentosaceus
had a significant (p < 0.05) decrease on the pH. The interaction effects of P.
Parameter Coefficient
(β)
Std,
Error
95% Wald
Confidence Interval Significance
Lower Upper
Linear coefficient effect
Intercept 3.44 0.06 3.32 3.57 0.000
Main coefficient effect
L. mesentoroides (X1) 1.28 0.53 0.24 2.31 0.016
P. pentosaceus (X2) 4.41 0.53 3.37 5.45 0.000
E. gallinarum (X3) -2.73 0.53 -3.76 -1.69 0.000
Interactive coefficient effect
L. mesenteroides * P.
pentosaceus
-63.00
4.85
-72.51
-53.49
0.000
L. mesenteroides * E.
gallinarum
55.00
4.85
45.49
64.51
0.000
P. pentosaceus *
E. gallinarum
-2.33
4.85
-11.85
7.18
0.631
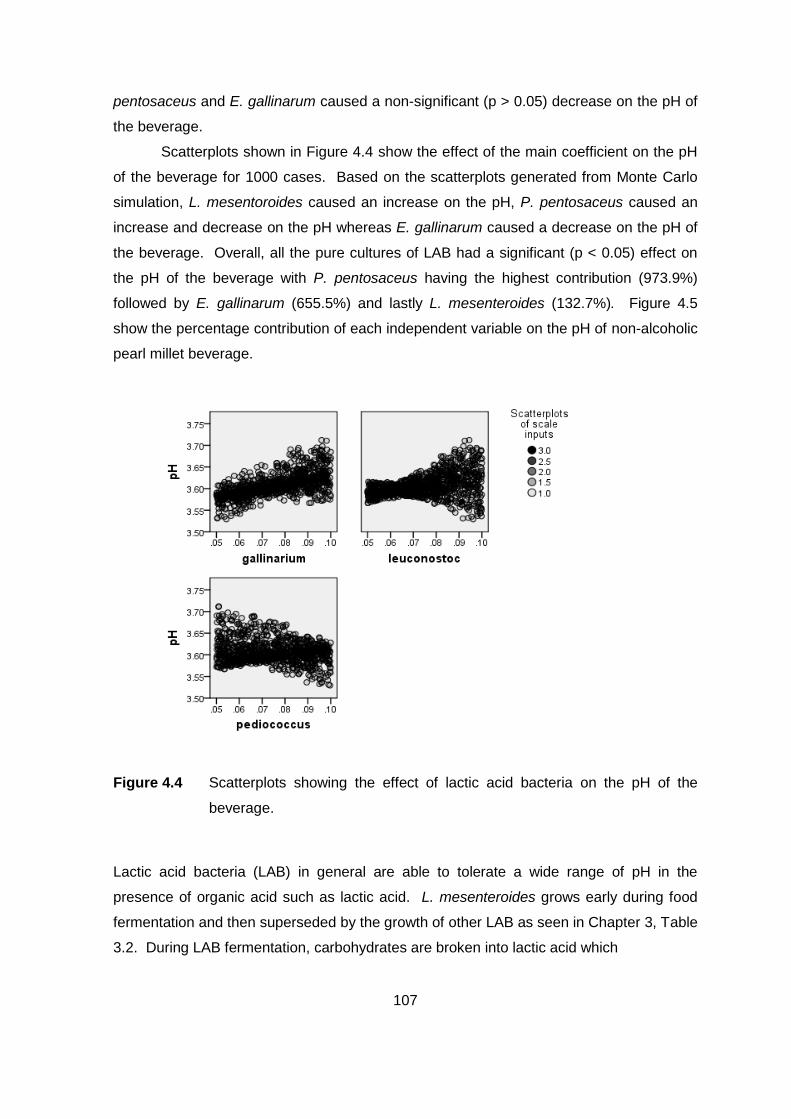
107
pentosaceus and E. gallinarum caused a non-significant (p > 0.05) decrease on the pH of
the beverage.
Scatterplots shown in Figure 4.4 show the effect of the main coefficient on the pH
of the beverage for 1000 cases. Based on the scatterplots generated from Monte Carlo
simulation, L. mesentoroides caused an increase on the pH, P. pentosaceus caused an
increase and decrease on the pH whereas E. gallinarum caused a decrease on the pH of
the beverage. Overall, all the pure cultures of LAB had a significant (p < 0.05) effect on
the pH of the beverage with P. pentosaceus having the highest contribution (973.9%)
followed by E. gallinarum (655.5%) and lastly L. mesenteroides (132.7%). Figure 4.5
show the percentage contribution of each independent variable on the pH of non-alcoholic
pearl millet beverage.
Figure 4.4 Scatterplots showing the effect of lactic acid bacteria on the pH of the
beverage.
Lactic acid bacteria (LAB) in general are able to tolerate a wide range of pH in the
presence of organic acid such as lactic acid. L. mesenteroides grows early during food
fermentation and then superseded by the growth of other LAB as seen in Chapter 3, Table
3.2. During LAB fermentation, carbohydrates are broken into lactic acid which
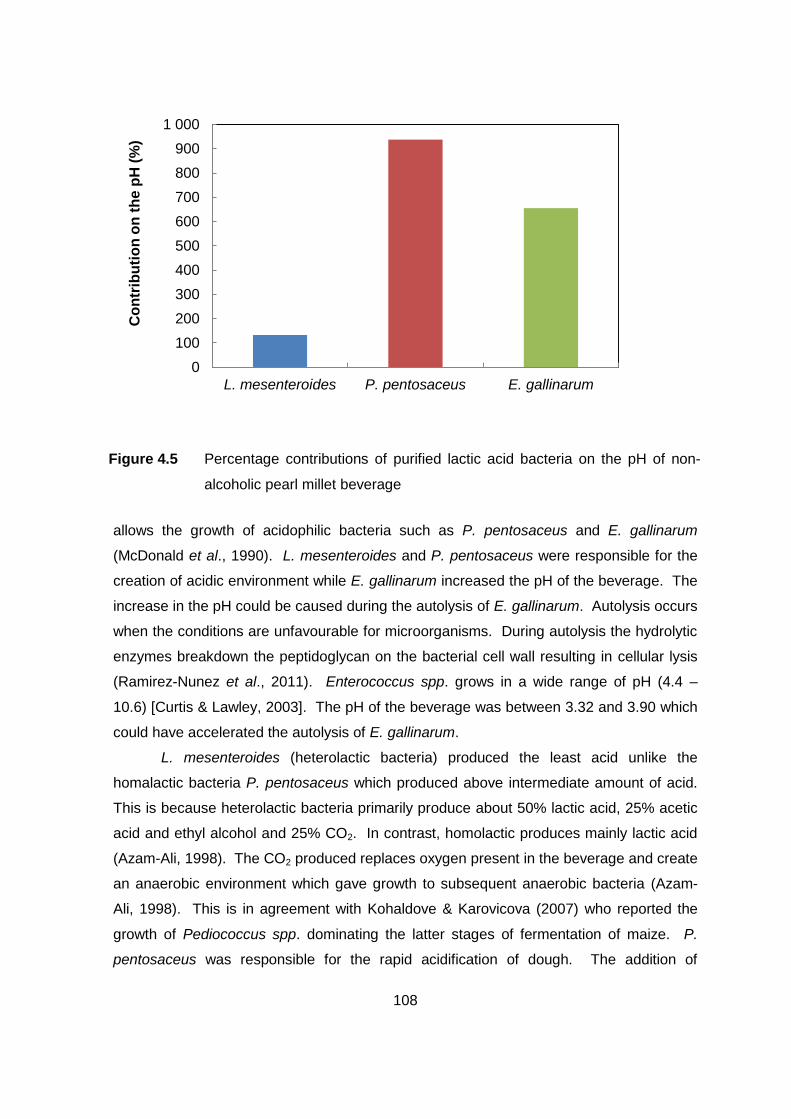
108
allows the growth of acidophilic bacteria such as P. pentosaceus and E. gallinarum
(McDonald et al., 1990). L. mesenteroides and P. pentosaceus were responsible for the
creation of acidic environment while E. gallinarum increased the pH of the beverage. The
increase in the pH could be caused during the autolysis of E. gallinarum. Autolysis occurs
when the conditions are unfavourable for microorganisms. During autolysis the hydrolytic
enzymes breakdown the peptidoglycan on the bacterial cell wall resulting in cellular lysis
(Ramirez-Nunez et al., 2011). Enterococcus spp. grows in a wide range of pH (4.4 –
10.6) [Curtis & Lawley, 2003]. The pH of the beverage was between 3.32 and 3.90 which
could have accelerated the autolysis of E. gallinarum.
L. mesenteroides (heterolactic bacteria) produced the least acid unlike the
homalactic bacteria P. pentosaceus which produced above intermediate amount of acid.
This is because heterolactic bacteria primarily produce about 50% lactic acid, 25% acetic
acid and ethyl alcohol and 25% CO2. In contrast, homolactic produces mainly lactic acid
(Azam-Ali, 1998). The CO2 produced replaces oxygen present in the beverage and create
an anaerobic environment which gave growth to subsequent anaerobic bacteria (Azam-
Ali, 1998). This is in agreement with Kohaldove & Karovicova (2007) who reported the
growth of Pediococcus spp. dominating the latter stages of fermentation of maize. P.
pentosaceus was responsible for the rapid acidification of dough. The addition of
Figure 4.5 Percentage contributions of purified lactic acid bacteria on the pH of non-
alcoholic pearl millet beverage
0
100
200
300
400
500
600
700
800
900
1 000
L. mesenteroides P. pentosaceus E. gallinarum
Co
ntr
ibu
tio
n o
n t
he p
H (
%)
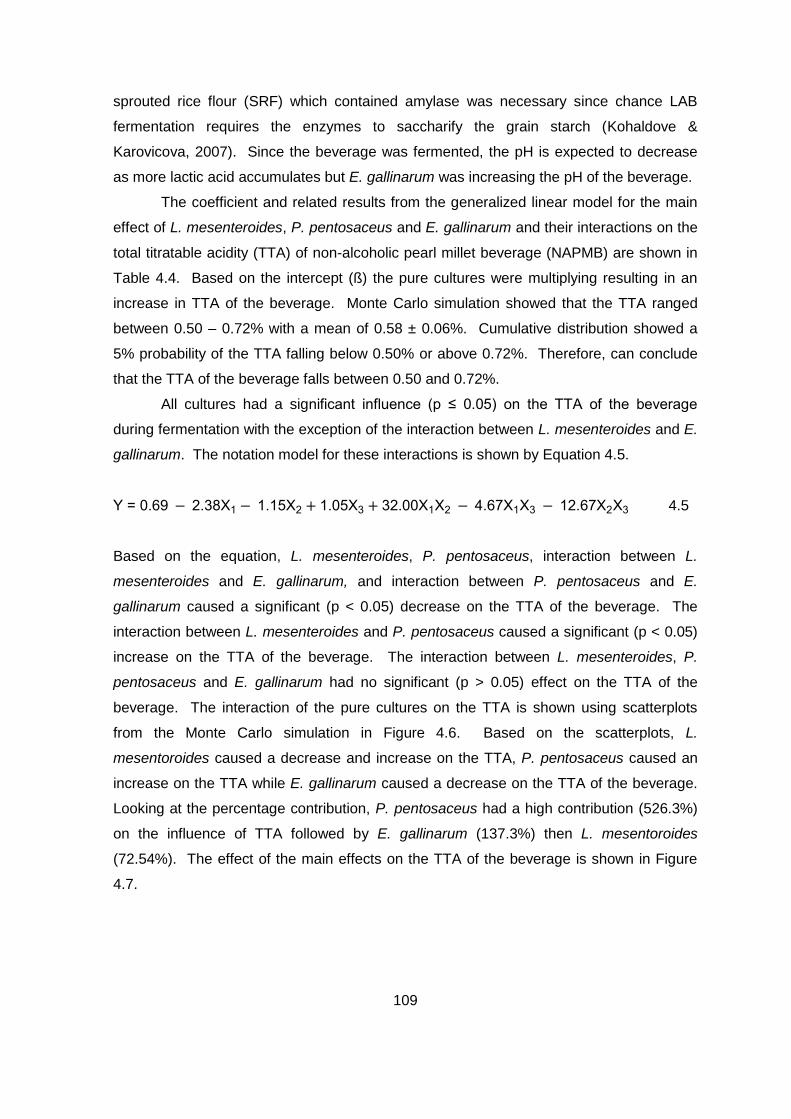
109
sprouted rice flour (SRF) which contained amylase was necessary since chance LAB
fermentation requires the enzymes to saccharify the grain starch (Kohaldove &
Karovicova, 2007). Since the beverage was fermented, the pH is expected to decrease
as more lactic acid accumulates but E. gallinarum was increasing the pH of the beverage.
The coefficient and related results from the generalized linear model for the main
effect of L. mesenteroides, P. pentosaceus and E. gallinarum and their interactions on the
total titratable acidity (TTA) of non-alcoholic pearl millet beverage (NAPMB) are shown in
Table 4.4. Based on the intercept (ß) the pure cultures were multiplying resulting in an
increase in TTA of the beverage. Monte Carlo simulation showed that the TTA ranged
between 0.50 – 0.72% with a mean of 0.58 ± 0.06%. Cumulative distribution showed a
5% probability of the TTA falling below 0.50% or above 0.72%. Therefore, can conclude
that the TTA of the beverage falls between 0.50 and 0.72%.
All cultures had a signific n infl ence (p ≤ 0.05) on he of he ever ge
during fermentation with the exception of the interaction between L. mesenteroides and E.
gallinarum. The notation model for these interactions is shown by Equation 4.5.
0.69 2.38 1 1.15 2 1.05 3 32.00 1 2 4.67 1 3 12.67 2 3 4.5
Based on the equation, L. mesenteroides, P. pentosaceus, interaction between L.
mesenteroides and E. gallinarum, and interaction between P. pentosaceus and E.
gallinarum caused a significant (p < 0.05) decrease on the TTA of the beverage. The
interaction between L. mesenteroides and P. pentosaceus caused a significant (p < 0.05)
increase on the TTA of the beverage. The interaction between L. mesenteroides, P.
pentosaceus and E. gallinarum had no significant (p > 0.05) effect on the TTA of the
beverage. The interaction of the pure cultures on the TTA is shown using scatterplots
from the Monte Carlo simulation in Figure 4.6. Based on the scatterplots, L.
mesentoroides caused a decrease and increase on the TTA, P. pentosaceus caused an
increase on the TTA while E. gallinarum caused a decrease on the TTA of the beverage.
Looking at the percentage contribution, P. pentosaceus had a high contribution (526.3%)
on the influence of TTA followed by E. gallinarum (137.3%) then L. mesentoroides
(72.54%). The effect of the main effects on the TTA of the beverage is shown in Figure
4.7.
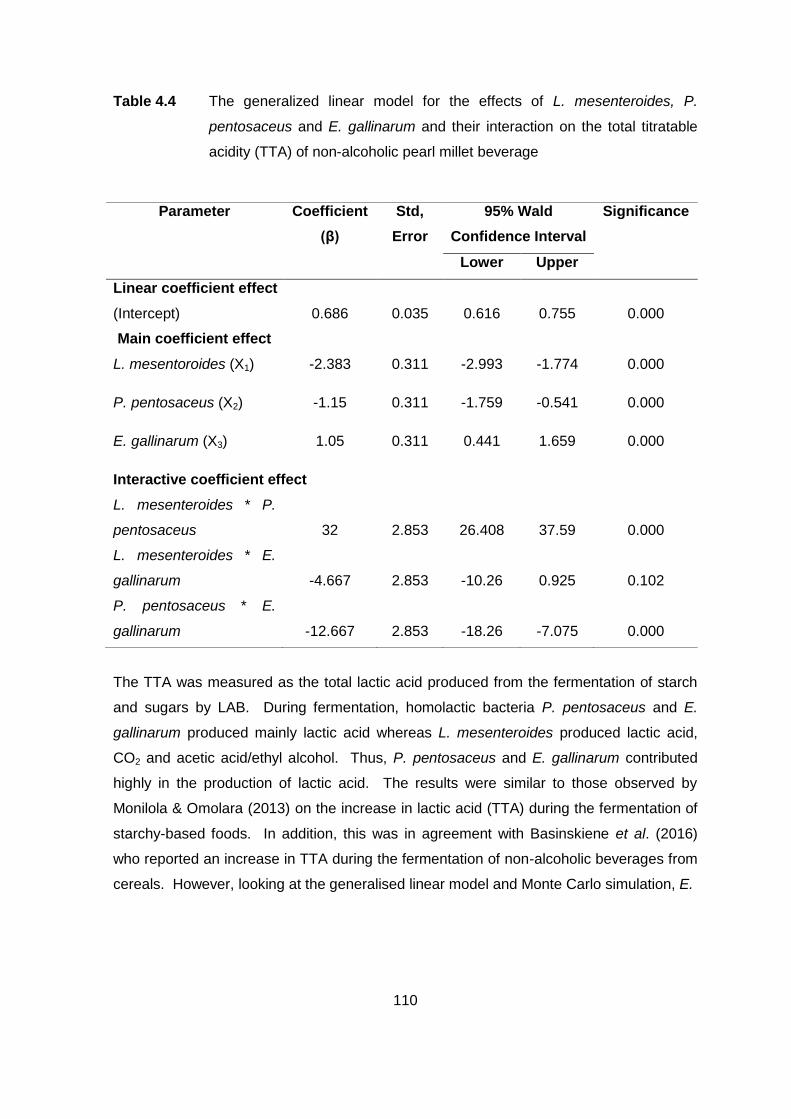
110
Table 4.4 The generalized linear model for the effects of L. mesenteroides, P.
pentosaceus and E. gallinarum and their interaction on the total titratable
acidity (TTA) of non-alcoholic pearl millet beverage
The TTA was measured as the total lactic acid produced from the fermentation of starch
and sugars by LAB. During fermentation, homolactic bacteria P. pentosaceus and E.
gallinarum produced mainly lactic acid whereas L. mesenteroides produced lactic acid,
CO2 and acetic acid/ethyl alcohol. Thus, P. pentosaceus and E. gallinarum contributed
highly in the production of lactic acid. The results were similar to those observed by
Monilola & Omolara (2013) on the increase in lactic acid (TTA) during the fermentation of
starchy-based foods. In addition, this was in agreement with Basinskiene et al. (2016)
who reported an increase in TTA during the fermentation of non-alcoholic beverages from
cereals. However, looking at the generalised linear model and Monte Carlo simulation, E.
Parameter Coefficient
(β)
Std,
Error
95% Wald
Confidence Interval
Significance
Lower Upper
Linear coefficient effect
(Intercept) 0.686 0.035 0.616 0.755 0.000
Main coefficient effect
L. mesentoroides (X1) -2.383 0.311 -2.993 -1.774 0.000
P. pentosaceus (X2) -1.15 0.311 -1.759 -0.541 0.000
E. gallinarum (X3) 1.05 0.311 0.441 1.659 0.000
Interactive coefficient effect
L. mesenteroides * P.
pentosaceus
32
2.853
26.408
37.59
0.000
L. mesenteroides * E.
gallinarum
-4.667
2.853
-10.26
0.925
0.102
P. pentosaceus * E.
gallinarum
-12.667
2.853
-18.26
-7.075
0.000
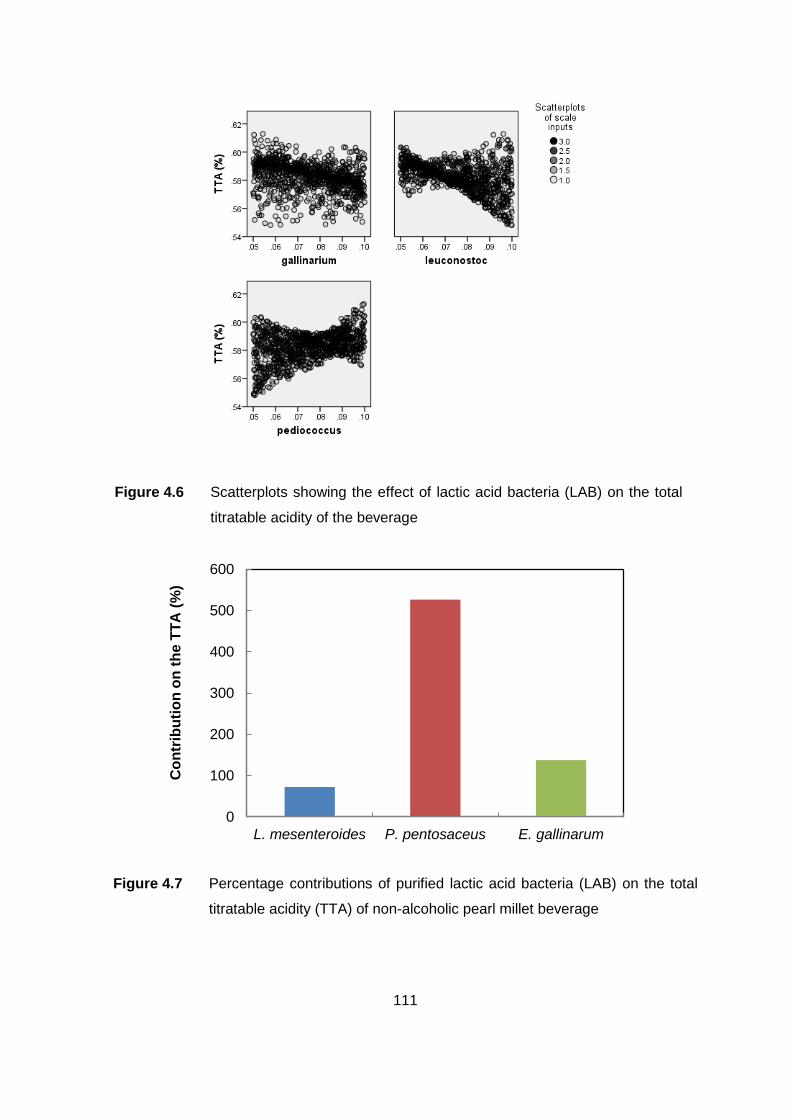
111
Figure 4.7 Percentage contributions of purified lactic acid bacteria (LAB) on the total
titratable acidity (TTA) of non-alcoholic pearl millet beverage
Figure 4.6 Scatterplots showing the effect of lactic acid bacteria (LAB) on the total
titratable acidity of the beverage
0
100
200
300
400
500
600
L. mesenteroides P. pentosaceus E. gallinarum
Co
ntr
ibu
tio
n o
n t
he T
TA
(%
)
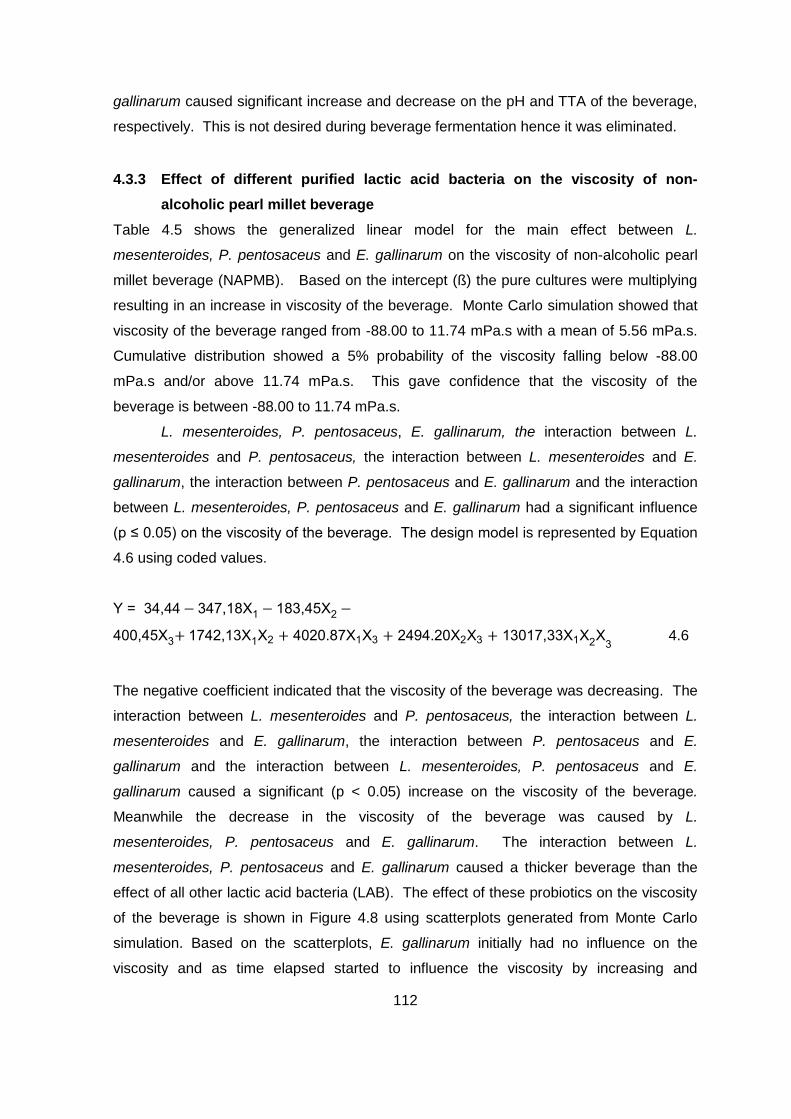
112
gallinarum caused significant increase and decrease on the pH and TTA of the beverage,
respectively. This is not desired during beverage fermentation hence it was eliminated.
4.3.3 Effect of different purified lactic acid bacteria on the viscosity of non-
alcoholic pearl millet beverage
Table 4.5 shows the generalized linear model for the main effect between L.
mesenteroides, P. pentosaceus and E. gallinarum on the viscosity of non-alcoholic pearl
millet beverage (NAPMB). Based on the intercept (ß) the pure cultures were multiplying
resulting in an increase in viscosity of the beverage. Monte Carlo simulation showed that
viscosity of the beverage ranged from -88.00 to 11.74 mPa.s with a mean of 5.56 mPa.s.
Cumulative distribution showed a 5% probability of the viscosity falling below -88.00
mPa.s and/or above 11.74 mPa.s. This gave confidence that the viscosity of the
beverage is between -88.00 to 11.74 mPa.s.
L. mesenteroides, P. pentosaceus, E. gallinarum, the interaction between L.
mesenteroides and P. pentosaceus, the interaction between L. mesenteroides and E.
gallinarum, the interaction between P. pentosaceus and E. gallinarum and the interaction
between L. mesenteroides, P. pentosaceus and E. gallinarum had a significant influence
(p ≤ 0.05) on he vi co i y of he ever ge. he de ign model is represented by Equation
4.6 using coded values.
34,44 347,18 1 183,45 2
400,45 3 1742,13 1 2 4020.87 1 3 2494.20 2 3 13017,33 1 2 3 4.6
The negative coefficient indicated that the viscosity of the beverage was decreasing. The
interaction between L. mesenteroides and P. pentosaceus, the interaction between L.
mesenteroides and E. gallinarum, the interaction between P. pentosaceus and E.
gallinarum and the interaction between L. mesenteroides, P. pentosaceus and E.
gallinarum caused a significant (p < 0.05) increase on the viscosity of the beverage.
Meanwhile the decrease in the viscosity of the beverage was caused by L.
mesenteroides, P. pentosaceus and E. gallinarum. The interaction between L.
mesenteroides, P. pentosaceus and E. gallinarum caused a thicker beverage than the
effect of all other lactic acid bacteria (LAB). The effect of these probiotics on the viscosity
of the beverage is shown in Figure 4.8 using scatterplots generated from Monte Carlo
simulation. Based on the scatterplots, E. gallinarum initially had no influence on the
viscosity and as time elapsed started to influence the viscosity by increasing and
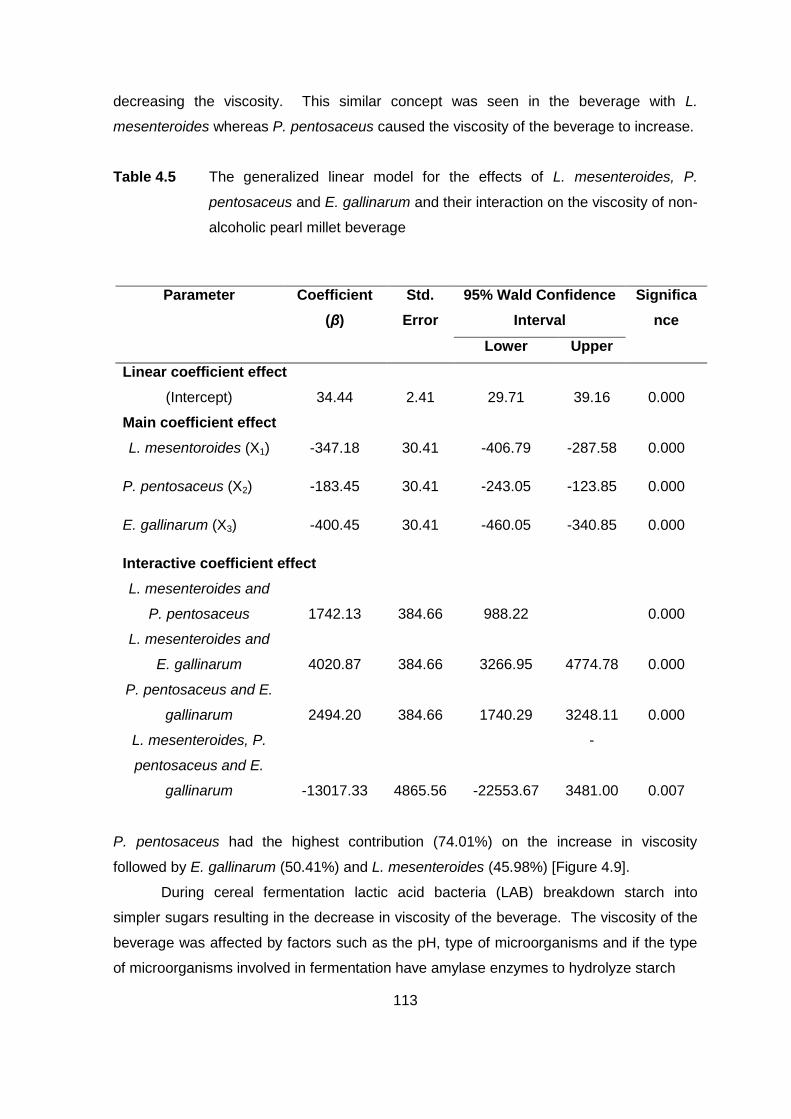
113
decreasing the viscosity. This similar concept was seen in the beverage with L.
mesenteroides whereas P. pentosaceus caused the viscosity of the beverage to increase.
Table 4.5 The generalized linear model for the effects of L. mesenteroides, P.
pentosaceus and E. gallinarum and their interaction on the viscosity of non-
alcoholic pearl millet beverage
P. pentosaceus had the highest contribution (74.01%) on the increase in viscosity
followed by E. gallinarum (50.41%) and L. mesenteroides (45.98%) [Figure 4.9].
During cereal fermentation lactic acid bacteria (LAB) breakdown starch into
simpler sugars resulting in the decrease in viscosity of the beverage. The viscosity of the
beverage was affected by factors such as the pH, type of microorganisms and if the type
of microorganisms involved in fermentation have amylase enzymes to hydrolyze starch
Parameter Coefficient
(β)
Std.
Error
95% Wald Confidence
Interval
Significa
nce
Lower Upper
Linear coefficient effect
(Intercept) 34.44 2.41 29.71 39.16 0.000
Main coefficient effect
L. mesentoroides (X1) -347.18 30.41 -406.79 -287.58 0.000
P. pentosaceus (X2) -183.45 30.41 -243.05 -123.85 0.000
E. gallinarum (X3) -400.45 30.41 -460.05 -340.85 0.000
Interactive coefficient effect
L. mesenteroides and
P. pentosaceus
1742.13
384.66
988.22
0.000
L. mesenteroides and
E. gallinarum
4020.87
384.66
3266.95
4774.78
0.000
P. pentosaceus and E.
gallinarum
2494.20
384.66
1740.29
3248.11
0.000
L. mesenteroides, P.
pentosaceus and E.
gallinarum
-13017.33
4865.56
-22553.67
-
3481.00
0.007
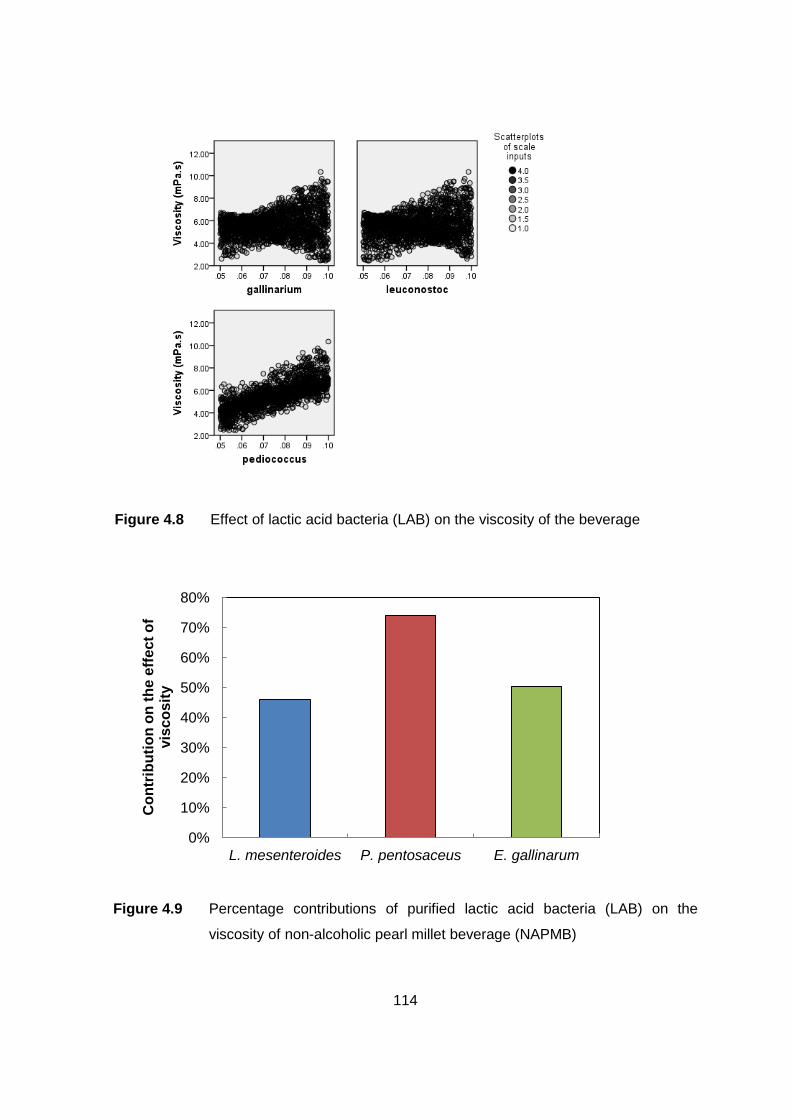
114
Figure 4.9 Percentage contributions of purified lactic acid bacteria (LAB) on the
viscosity of non-alcoholic pearl millet beverage (NAPMB)
Figure 4.8 Effect of lactic acid bacteria (LAB) on the viscosity of the beverage
0%
10%
20%
30%
40%
50%
60%
70%
80%
L. mesenteroides P. pentosaceus E. gallinarum
Co
ntr
ibu
tio
n o
n t
he e
ffe
ct
of
vis
co
sit
y
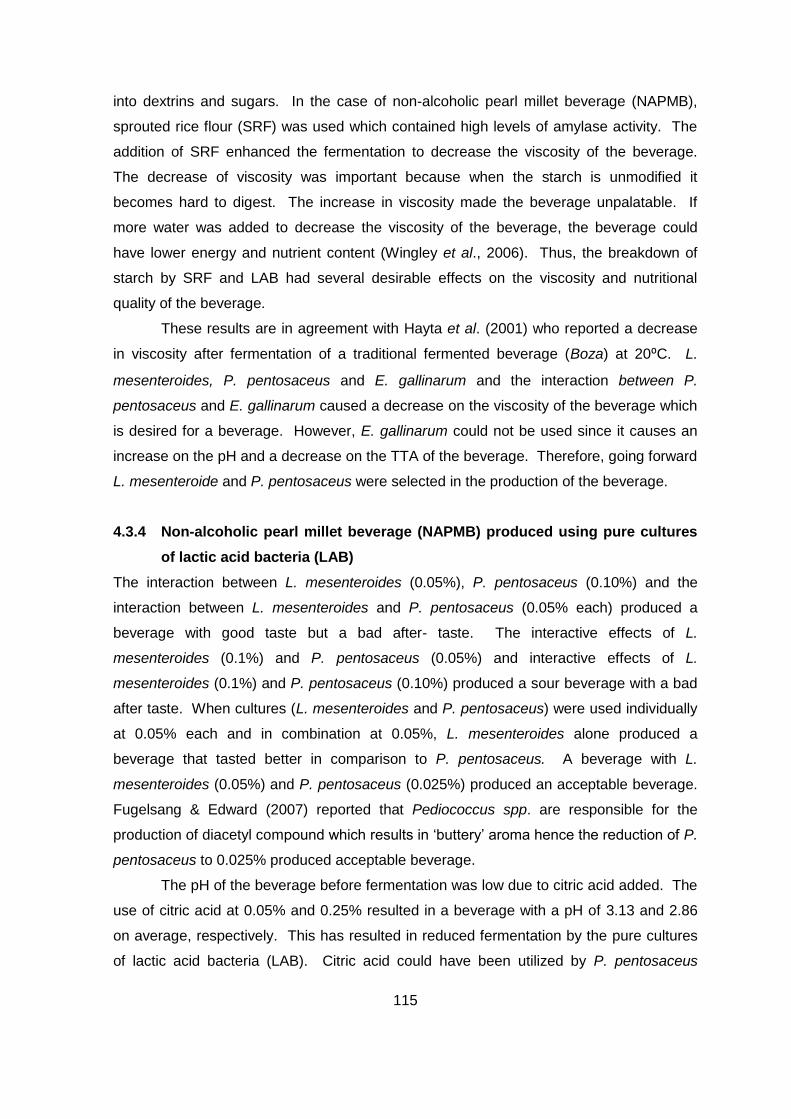
115
into dextrins and sugars. In the case of non-alcoholic pearl millet beverage (NAPMB),
sprouted rice flour (SRF) was used which contained high levels of amylase activity. The
addition of SRF enhanced the fermentation to decrease the viscosity of the beverage.
The decrease of viscosity was important because when the starch is unmodified it
becomes hard to digest. The increase in viscosity made the beverage unpalatable. If
more water was added to decrease the viscosity of the beverage, the beverage could
have lower energy and nutrient content (Wingley et al., 2006). Thus, the breakdown of
starch by SRF and LAB had several desirable effects on the viscosity and nutritional
quality of the beverage.
These results are in agreement with Hayta et al. (2001) who reported a decrease
in viscosity after fermentation of a traditional fermented beverage (Boza) at 20⁰C. L.
mesenteroides, P. pentosaceus and E. gallinarum and the interaction between P.
pentosaceus and E. gallinarum caused a decrease on the viscosity of the beverage which
is desired for a beverage. However, E. gallinarum could not be used since it causes an
increase on the pH and a decrease on the TTA of the beverage. Therefore, going forward
L. mesenteroide and P. pentosaceus were selected in the production of the beverage.
4.3.4 Non-alcoholic pearl millet beverage (NAPMB) produced using pure cultures
of lactic acid bacteria (LAB)
The interaction between L. mesenteroides (0.05%), P. pentosaceus (0.10%) and the
interaction between L. mesenteroides and P. pentosaceus (0.05% each) produced a
beverage with good taste but a bad after- taste. The interactive effects of L.
mesenteroides (0.1%) and P. pentosaceus (0.05%) and interactive effects of L.
mesenteroides (0.1%) and P. pentosaceus (0.10%) produced a sour beverage with a bad
after taste. When cultures (L. mesenteroides and P. pentosaceus) were used individually
at 0.05% each and in combination at 0.05%, L. mesenteroides alone produced a
beverage that tasted better in comparison to P. pentosaceus. A beverage with L.
mesenteroides (0.05%) and P. pentosaceus (0.025%) produced an acceptable beverage.
Fugelsang & Edward (2007) reported that Pediococcus spp. are responsible for the
production of diacetyl compo nd which re l in ‘ ery’ rom hence he red c ion of P.
pentosaceus to 0.025% produced acceptable beverage.
The pH of the beverage before fermentation was low due to citric acid added. The
use of citric acid at 0.05% and 0.25% resulted in a beverage with a pH of 3.13 and 2.86
on average, respectively. This has resulted in reduced fermentation by the pure cultures
of lactic acid bacteria (LAB). Citric acid could have been utilized by P. pentosaceus
116
resulting in increased diacetyl compound responsible for unwanted flavours (Fugelsang &
Edward, 2007). The beverage was sweeter with undesired after-taste immediately after
pasteurization which became more intense after inoculation and fermentation. The
fermentation with LAB could also have resulted in undesired compounds. In addressing
these issues, citric acid and disodium phosphate were replaced with sodium citrate to
regulate the acidity before inoculation. In addition, phenolic compounds released during
fermentation could be responsible for the unacceptable taste (Drewnowski & Gomez-
Carneros, 2000). Hence, heat and moisture could be used to treat pearl millet grains
before milling into flour. The main purpose will be to inactivate the naturally present lipase
enzymes in cereal grains that could lead to rancid off flavours. Furthermore, steaming of
the grains will make the starch in grains gelatinise and digestible (Stapley et al., 1999). .
In addition, the duration of soaking pearl millet grains prior milling could be minimized to
avoid any pre-fermentation of grains that could happen.
The increase in the ratio of pearl millet flour (PMF) to water was also important in
diluting the unwanted off-taste, bitter, astringent and/or sour taste of the beverage. The
ratio of PMF to water was increased from 1:6.5 to 1:10 (PMF:Water). The beverage was
pasteurised in an open pot instead of traditionally pasteurising in package. This was to
ensure that the grain extract was cooked in order to enhance the aroma, taste and flavour
hence removing the undesired taste. Maltodextrin which was used to give the beverage a
good body, mouthfeel and aid in the dispersibility of particles caused a bland unpleasant
taste and did not completely dissolve in the beverage. Hence, maltodextrin was removed.
In conclusion, pectin (0.6%), sunflower lecithin (0.1%) , sodium citrate (0.1%),
interactive effects of L. mesentoroides (0.05%) and P. pentosaceus (0.025%) were
selected in the production of stable NAPMB.
4.3.6 Conclusion
A stable pearl millet extract was produced using pectin at 0.6%. The interactive effects of
L. mesenteroides and P. pentosaceus each at 0.05 and 0.025%, respectively produced an
acceptable non-alcoholic pearl millet beverage.
117
References
Achi, O. (2005). The potential for upgrading traditional fermented foods through
biotechnology. African Journal of Biotechnology, 4(5), 375-380.
Adeyi, O. (2014). Effect of bambara groundnut flour on the stability and rheological
properties of oil-in-water emulsion. DTech Thesis in Chemical Engineering. Cape
Peninsula University of Technology. Bellville, South Africa
AOAC (Association of Official Analytical Chemist), 1980. Official Methods of Analysis,
15th ed. Washington, D.C. Association of Official Analytical Chemists ISBN 2-93
558 442-0.
Azam-Ali, S. (1998). Fermented fruits and vegetables. A global perspective. Warwickshire,
UK Food and Agricultural Organisation.
Basinkiene, L., Juodeikiene, G., Vdmantience, D., Tenkanen, M., Makaravicius, T. &
Bartkiee, E. (2016). Non-alcoholic beverages from fermented cereal with increased
oligosaccharide content. Food Technology and Biotechnology, 54(1). 36-44.
Brownlee, I.A., Seal, C. J., Wilcox, M., Dettmar, P.W. & Pearson, J.P. (2009). Applications
of alginates in food. In Alginate: Biology and Applications. Application of Alginates.
Berlin, Heidelberg: Springer-Verlag.
Curtis, L. & Lawley, R. (2003). Micro-facts. The working companion for food
microbiologists . United Kingdom: Leatherhead Publishing & Royal Society of
Chemistry.
Danisco. (2001). Introduction to Grindsted carrageenan. Denmark: Danisco Cultor.
Drewnowski, A. & Gomez-Carneros, C. (2000). Bitter taste, phytonutrients, and the
consumer: a review. The American Journal of Clinical Nutrition, 17, 1424-1435.
Fugelsang, K. C. & Edwards, C. G. (2007). Wine microbiology: Practical application and
procedures. Pp. 29-44. Springer.
Gadaga, T. H., Mutukumira, A. N., Narvhus, J.A. & Feresu. S. B. (1999). A review of
traditional fermented foods and beverages of Zimbabwe. International Journal of
Food Microbiology, 53, 1-11.
Gaffa, T., Jideani, I.A. & Nkama, I. (2002). Traditional production, consumption and
storage of Kunu-a non-alcoholic cereal beverage. Plant Foods for Human
Nutrition, 57, 73-81.
Hardy, Z. (2016). Functional and nutritional characteristics of bambara groundnut milk
powder as an ingredient in yoghurt. MTech Thesis in Food Technology. Cape
Peninsula University of Technology. Bellville, Cape Town.
118
Hayta, M., Alpasla, M. & Kose, E. (2001). The effect of fermentation on the viscosity and
protein solubility of Boza, a traditional cereal-based fermented Turkish beverage.
European Food Research and Technology, 213, 335-337.
IBM Corporation (2015). IBM SPSS Statistics for Windows, Version 23.0. Armonk, NY:
IBM Corp.
Katongole, J. N. (2008). The microbial succession in indegenous fermented maize
products. MSc Thesis in Agricultures. University of Free State, Bloemfontein.
Kohaldove, Z. & Karovicova, J. (2007). Fermentation of cereal for specific purpose.
Journal of Food and Nutrition Research, 46(2), 51-57.
Lei, V. (2006). Probiotic potential of African fermented millet. Denmark: PhD Thesis in
Food Microbiology. The Royal Veterinary and Agricultural University.
Maphosa, Y. (2016). Characterisation of Bambara groundnut (Vigna subterranea (L)
Verdc) non-starch polysaccharides from wet milling method as prebiotics: MTech
Thesis in Food Technology. Cape Peninsula University of Technology. Bellville,
South Africa.
McDonald, L.C., Fleming, H.P. & Hassan, H.M. (1990). Acid tolerance of Leuconostoc
mesenteroides and Lactobacillus plantarum. Applied and Environmental
Microbiology, 56(7), 2120-2124.
Modha, H. & Pal, D. (2011). Optimization of Rabadi-like fermented milk beverage using
pearl millet. Journal of Food Science and Technology, 48(2), 190-196.
Monilola, W.S. & Omolara, A.O. (2013). Production of lactic acid from starchy-based food
substrates. Journal of Applied Biosciences, 71, 5673-5681.
Nambiar, V. S., Dhaduk, J. J., Sareen, N., Shabu, T. & Desai, R. (2011). Potential
functional implications of pearl millet (Pennisetum glaucum) in health and disease.
Journal of Applied Pharmaceutical Science, 1(10), 62-67.
Raj, A.A.S., Jayabalan, S.R.R. & Ranganathan, T.V. (2012). A review on pectin: chemistry
due to general properties of pectin and its pharmaceutical uses. Open Access
Scientific Reports, 1(12), 2-4.
Ramaite, R. A. (2004). The selection of lactic acid bacteria to be used as starter cultures
for Ting production. MSc Thesis in Microbiology. University of Pretoria.
Ramirez-Nunez, J., Romero-Medrano, R., Nevarez-Moorillon, G.V. & Gutierrez-Mendez,
N. (2011). Effect of pH and salt gradient on the autolysis of Lactococcus lactis
strains. Brazilian Journal of Microbiology, 43, 1495-1499.
Sahlin, P. (1999). Fermentation as a method of food processing. Licentiate Thesis. Lund
Institute of Technology, Lund University.
119
Schutte, L. (2013). Isolation and identification of microbial consortium present in
fermented milks from Sub-Saharan Africa. Stellenbosch, South Africa: MSc Thesis
in Food Science. University of Stellenbosch.
Stapley, A.G.F., Landman, K.A., Please, C.P. & Fryer, P.J. (1999). Modelling the steaming
of whole wheat grains. Chemical Engineering Science, 54, 965-975.
Stephen, A.M., Phillips, G.O. & Williams, P.A. (2006). Polysaccharides and their
applications (2nd ed.). New York: CRS Press. Taylor & Francis Group, LLC.
Tako, M. (2015). Principle of polysaccharides gels. Advances in Bioscience and
Biotechnology, 6, 22-36.
Turbiscan. (2009). Stability and end-use properties of personal care products.
Formulation, 1-6.
Wingley, C., Corke, H., Seetharaman, K. & Faubion, J. (2006). Encyclopedia of food
grains. The world of food grains. Waltham: Academica Press, Elsevier.
Yu, H. & Bogue, J. (2013). Concept optimisation of fermented functional cereal
beverages. British Food Journal. 115(4), 541-563.
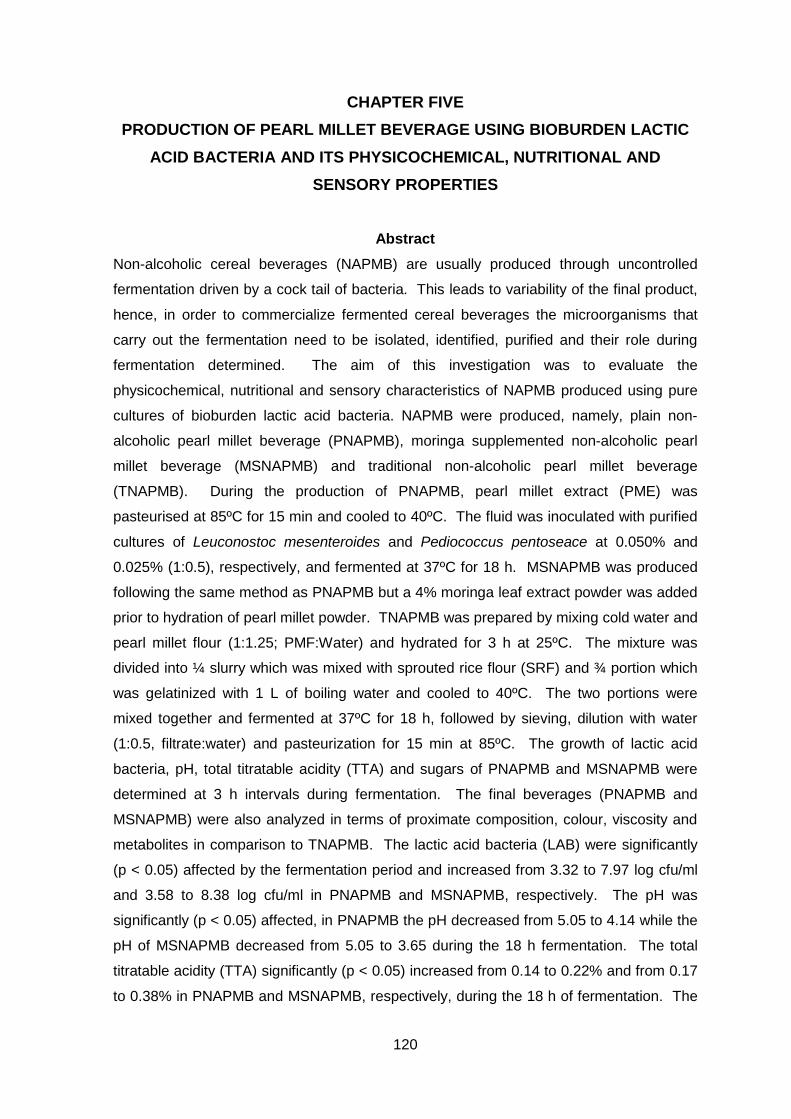
120
CHAPTER FIVE
PRODUCTION OF PEARL MILLET BEVERAGE USING BIOBURDEN LACTIC
ACID BACTERIA AND ITS PHYSICOCHEMICAL, NUTRITIONAL AND
SENSORY PROPERTIES
Abstract
Non-alcoholic cereal beverages (NAPMB) are usually produced through uncontrolled
fermentation driven by a cock tail of bacteria. This leads to variability of the final product,
hence, in order to commercialize fermented cereal beverages the microorganisms that
carry out the fermentation need to be isolated, identified, purified and their role during
fermentation determined. The aim of this investigation was to evaluate the
physicochemical, nutritional and sensory characteristics of NAPMB produced using pure
cultures of bioburden lactic acid bacteria. NAPMB were produced, namely, plain non-
alcoholic pearl millet beverage (PNAPMB), moringa supplemented non-alcoholic pearl
millet beverage (MSNAPMB) and traditional non-alcoholic pearl millet beverage
(TNAPMB). During the production of PNAPMB, pearl millet extract (PME) was
pasteurised at 85ºC for 15 min and cooled to 40ºC. The fluid was inoculated with purified
cultures of Leuconostoc mesenteroides and Pediococcus pentoseace at 0.050% and
0.025% (1:0.5), respectively, and fermented at 37ºC for 18 h. MSNAPMB was produced
following the same method as PNAPMB but a 4% moringa leaf extract powder was added
prior to hydration of pearl millet powder. TNAPMB was prepared by mixing cold water and
pearl millet flour (1:1.25; PMF:Water) and hydrated for 3 h at 25ºC. The mixture was
divided into ¼ slurry which was mixed with sprouted rice flour (SRF) and ¾ portion which
was gelatinized with 1 L of boiling water and cooled to 40ºC. The two portions were
mixed together and fermented at 37ºC for 18 h, followed by sieving, dilution with water
(1:0.5, filtrate:water) and pasteurization for 15 min at 85ºC. The growth of lactic acid
bacteria, pH, total titratable acidity (TTA) and sugars of PNAPMB and MSNAPMB were
determined at 3 h intervals during fermentation. The final beverages (PNAPMB and
MSNAPMB) were also analyzed in terms of proximate composition, colour, viscosity and
metabolites in comparison to TNAPMB. The lactic acid bacteria (LAB) were significantly
(p < 0.05) affected by the fermentation period and increased from 3.32 to 7.97 log cfu/ml
and 3.58 to 8.38 log cfu/ml in PNAPMB and MSNAPMB, respectively. The pH was
significantly (p < 0.05) affected, in PNAPMB the pH decreased from 5.05 to 4.14 while the
pH of MSNAPMB decreased from 5.05 to 3.65 during the 18 h fermentation. The total
titratable acidity (TTA) significantly (p < 0.05) increased from 0.14 to 0.22% and from 0.17
to 0.38% in PNAPMB and MSNAPMB, respectively, during the 18 h of fermentation. The
121
total sugar content (sucrose) was significantly affected (p < 0.05) during fermentation and
ranged from 5.48 to 5.26% in PNAPMB while it ranged from 5.21 to 5.33% in MSNAPMB.
The protein, total fat, moisture total sugar and carbohydrates differed significantly (p <
0.05) among the samples. PNAPMB, MSNAPMB and TNAPMB had protein content of
1.62%, 2.17% and 1.50%, respectively. The total fat content was low in all beverages
accounting for 0.92%, 0.65% and 0.1.54% of total solids in PNAPMB, MSNAPMB and
TNAPMB, respectively. The total sugar content was 5.06%, 5.31% and 6.11% in
PNAPMB, MSNAPMB and TNAPMB, respectively. The carbohydrates (CHO) were
4.31%, 5.03% and 9.41% in PNAPMB, MSNAPMB and TNAPMB, respectively. The CHO
and energy differed significantly (p < 0.05) between MSNAPMB and TNAPMB, and
between PNAPMB and TNAPMB. The total colour difference (∆E) was 5.91 and 10.60 in
PNAPMB and MSNAPMB, respectively in comparison to the TNAPMB. PNAPMB sample
was deemed acceptable in comparison to the MSNAPMB. PNAPMB was preferred by a
consumer panel followed by MSNAPMB and TNAPMB. Volatile compounds with
beneficial effect such as anti-inflammatory and anti-pathogenic properties were identified
in the beverages. Principal component analysis (PCA) indicated that the variations in
characteristics of PNAPMB and MSNAPMB could be explained using total fat, saturated
fat, total sugar, ash, moisture, proteins, chroma (C), hue and b*.
5.1 Introduction
Beverages are liquid foods that serve as sources of both fluid and nutrients for the body.
They provide the body with energy (Ogbonna et al., 2013). Traditional non-alcoholic
fermented cereal beverages are light to yellowish homogenous suspension with a sweet
to sour taste (Bogue & Yu, 2009) consumed by all people including children, pregnant
women, sick and old people (Solange et al., 2014). They may also serve as breakfast
drink, food complement, thirst quencher or refreshment to many people including
vegetarians and others with cereal allergies (Gyar et al., 2014).
The beverages contain no alcohol. They are considered to be ruined should there
be alcohol at high levels. The beverages are traditionally not heat treated after
fermentation and thus are considered functional beverages containing high levels of lactic
acid bacteria (LAB) [Basinskiene et al., 2016]. Fermented non-alcoholic cereal beverages
(NACB) are popular in African countries (Terna & Ayo, 2002) as part of tradition and
culture. These beverages are fermented by different microorganisms which change the
solid or liquid substrates into different products (Weir & McSpadden, 2005). The
substrates differ widely, with any material that supports microbial growth being a potential
substrate (Chisti, 1999).
122
Non-alcoholic cereal beverages (NACB) are increasing rapidly as part of the latest
trend towards convenient healthy nutrition (Sternenzym, 2011). Beverages are produced
from malt or cereal sugar and spices and are sources of antioxidants, vitamins and other
health promoting substances. The cereal beverages differ depending on the type of
functional constituents used (Sternenzym, 2011). The beverage properties such as
viscosity, mouth feel and sweetness can be adjusted to meet the consumer’s preferences.
The extract of cereal grains can also be mixed with oil emulsion to produce drinks similar
to milk or cream but without animal protein, lactose or soy. New flavours can be produced
by fermenting with microorganisms (Sternenzym, 2011).
Traditionally, NACB are carried out through spontaneous fermentation involving
mixed microflora. However, the spontaneous fermentation of the beverage is difficult to
control especially in mass production. Furthermore, unwanted microorganisms that can
be found in the beverage can speed-up spoilage after fermentation. This can be worse if
the periods between product preparation and consumption are long resulting in premature
spoilage. Although numerous technologies (Yang & Seib, 1996; Terna & Ayo, 2002;
Oranusia et al., 2003; Onaolapo & Busari, 2004; Nkama et al., 2010; Uvere & Amazikwu
2011; Oluwole et al., 2012; Abimbola, 2013; Adelakan et al., 2013; Ayo et al., 2013;
Olosunde et al., 2014) have been developed to address the challenges of underutilization
of African cereals, the production of these beverages on large scale is still limited. The
limitation of these beverages at large scale could be due to the low acceptability of the
beverages due to variability in taste in comparison to traditionally prepared beverages. In
order to commercialize these beverages the microorganisms which carry the fermentation
needs to be isolated, identified, purified and their role during fermentation determined
(Moodley, 2015).
In Chapter 4, a stable pearl millet extract (PME) was produced using pectin
(0.6%), while Leuconostoc mesentooides and Pediococcus pentoseace isolated from the
indigenous beverage were selected for the production of acceptable beverage. The
effects of these organisms on the modified pearl millet beverage were determined. The
aim of this investigation was to produce a stable non-alcoholic pearl millet beverage using
the selected bioburden lactic acid bacteria with or without moringa (Moringa oleifera) and
determine their physical, chemical and sensory properties in comparison to the traditional
beverage. Bioburden refers to the number of viable bacteria on the grains that has not
been sterilised.
123
5.2 Materials and Methods
5.2.1 Sources of raw materials and equipment
Pearl millet and rice grains were purchased from Agricol in Brackenfell, Cape Town.
Ground ginger was purchased from Deli Spices in Epping, Cape Town. Moringa leaf
powder was purchased from Moringa South Africa, Garden Route.
Perten 3100 laboratory mill, Bauermeister Inc., Vernon hammer mill , water-bath
(Ecobat 207), Butcherquip junior cooker (Model CCB 0170), Hanna Edge pH meter,
Anaerobic Gas-Pack system, incubator, Geiger & Klotzbucher cabinet oven, Sonicator cell
disruptor (Heat system-ultrasonic INC. Sonicator cell disruptor, Model W-225R) and
compound microscope were provided by the Department of Food Science and
Technology, Cape Peninsula University of Technology. The Agilent 1100 HPLC-RID,
Biomerieux Vitek 2, BenchTop Pro with omnitronics (VirTis-SP Scientific) freeze-dryer,
Ultra-freezer (Glacier, -86ºC ultralow temperature freezer), nitrogen analyser (Leco-
TruSpec-N) and UV 1700 Pharmaspec spectrophotometer system were provided by
Agrifood Technology Station, Cape Peninsula University of Technology.
5.2.2 Production of pearl millet flour
Pearl millet flour was produced as reported in Chapter 3, Section 3.2.2 but with slight
modifications. Dry pearl millet grains were manually cleaned to remove any seeds,
broken grains, sand, twigs and any other foreign objects. Excess water after washing was
drained off by spreading the grains on a stainless sieve. The grains were steamed for 15
min at 110ºC in a Butcherquip junior cooker. The grains were washed after steaming
using cold tap water and soaked in cold water for 6 h (1:2, grains:water). After soaking
the grains were dried at 50ºC for 45 h in a cabinet dryer (Geiger & Klotzbucher). The
grains were dry milled into 0.8 mm (Falling number/Kjeldal analysis size) powder using a
Perten 3100 hammer mill. The resulting pearl millet flour was kept in a clear zipper bag at
4ºC until required.
5.2.3 Preparation of moringa powder extract
Moringa (Moringa oleifera) leaf powder was blended with cold tap water at 1:12 ratio
(moringa:water) using a Silverson L4R homogenizer at 7000 rpm for 15 min. The mixture
was soaked for 30 min and sieved through 850, 355, 250 and finally 125 µm sieves in a
descending order. The extract was spread on freeze-dry trays and frozen for 48 h at -
76ºC using an Ultra-freezer (Glacier, -86ºC ultralow temperature freezer). The extract
was freeze-dried for 72 h using Virtics SP Scientific 35 XL pilot freeze dyer (freeze mode
set to -50ºC). The resulting flakes with 96% moisture loss was placed into stomacher bag
124
and milled using an AES Smasher for 80 sec. The resulting powder was kept in zipper
bags until use.
5.2.4 Production of pearl millet extract (PME), plain non-alcoholic pearl millet
beverage (PNAPMB) and moringa supplemented non-alcoholic pearl millet
beverage (MSNAPMB)
Pearl millet extract (PME) was prepared similar to Chapter 4, Section 4.2.3 with slight
modification. Pearl millet flour [PMF] (400 g) was mixed with 15% sprouted rice flour, 12%
ground ginger and cold water at 1:2.5 (PMF:Water) ratio. The paste was homogenized
using Silverson L4RT blender for 15 min at 7000 rpm. The paste was left to hydrate for 1
h at 25ºC. The supernatant was decanted and the sediments discarded. The liquid was
filtered through a sterile cheese cloth followed by a 5 µm filter bag. The extract was mixed
with sunflower lecithin (0.1%), sodium citrate (0.1%), pectin (0.6%) and white sugar (5%).
The mixture was blended using Silverson L4RT blender at 7800 rpm for 7 min. The
resulting PME was pasteurized for 15 min in a pot at 85°C, followed by bottling in sterile
500 ml Schott bottles and cooled immediately in cold water (≤37ºC). The cooled samples
were inoculated with L. mesenteroides (0.05%) and P. pentoseaceus (0.025%) at 1:0.5
ratio and fermented in an incubator at 37ºC for 18 h. During fermentation samples were
drawn at 3 h interval for enumeration of lactic acid bacteria, determination of the optical
density, analysis of pH, total titratable acidity and sugars. After fermentation the beverage
was chilled at 4ºC. The process used in the production of plain non-alcoholic pearl millet
beverage (PNAPMB) is shown in Figure 5.1.
Following this method, moringa supplemented non-alcoholic pearl millet beverage
(MSNAPMB) was produced by mixing moringa concentrate (4%) with ground ginger
(12%) and sprouted rice flour (15%). During fermentation samples were drawn at 3 h
interval for enumeration of lactic acid bacteria, determination of the optical density, and
analysis of pH, total titratable acidity and sugars. After fermentation the beverage was
chilled at 4ºC.
5.2.5 Production of traditional non-alcoholic pearl millet beverage (TNAPMB)
The same method as reported in Chapter 3, Section 3.2.3 was followed with slight
modification. Pearl millet flour (PMF) [100 g] was mixed with cold water at 1:1.5
(PMF:Water) and left to hydrate for 3 h. The paste was divided into ¼ (62.5 g) and ¾
(187.5 g). To the ¼ portion, 48% sprouted rice flour, 16% ground ginger and 160% cold
water were added and mixed with a plastic spoon. The ¾ portion was gelatinized with
boiling water at 1:2.7 (paste:water) ratio and cooled to 40ºC in cold water. The two
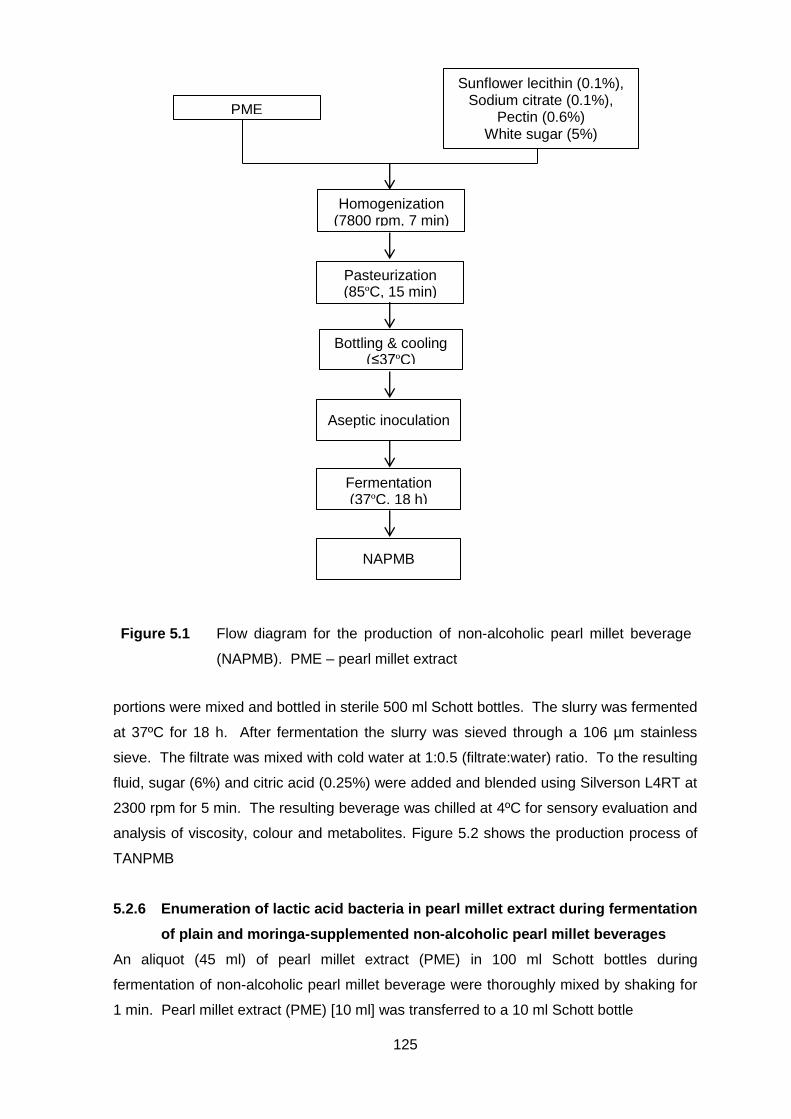
125
portions were mixed and bottled in sterile 500 ml Schott bottles. The slurry was fermented
at 37ºC for 18 h. After fermentation the slurry was sieved through a 106 µm stainless
sieve. The filtrate was mixed with cold water at 1:0.5 (filtrate:water) ratio. To the resulting
fluid, sugar (6%) and citric acid (0.25%) were added and blended using Silverson L4RT at
2300 rpm for 5 min. The resulting beverage was chilled at 4ºC for sensory evaluation and
analysis of viscosity, colour and metabolites. Figure 5.2 shows the production process of
TANPMB
5.2.6 Enumeration of lactic acid bacteria in pearl millet extract during fermentation
of plain and moringa-supplemented non-alcoholic pearl millet beverages
An aliquot (45 ml) of pearl millet extract (PME) in 100 ml Schott bottles during
fermentation of non-alcoholic pearl millet beverage were thoroughly mixed by shaking for
1 min. Pearl millet extract (PME) [10 ml] was transferred to a 10 ml Schott bottle
PME
Homogenization (7800 rpm, 7 min)
Pasteurization (85ºC, 15 min)
Sunflower lecithin (0.1%), Sodium citrate (0.1%),
Pectin (0.6%) White sugar (5%)
Bottling & cooling (≤37ºC)
Aseptic inoculation
Fermentation (37ºC, 18 h)
NAPMB
Figure 5.1 Flow diagram for the production of non-alcoholic pearl millet beverage
(NAPMB). PME – pearl millet extract
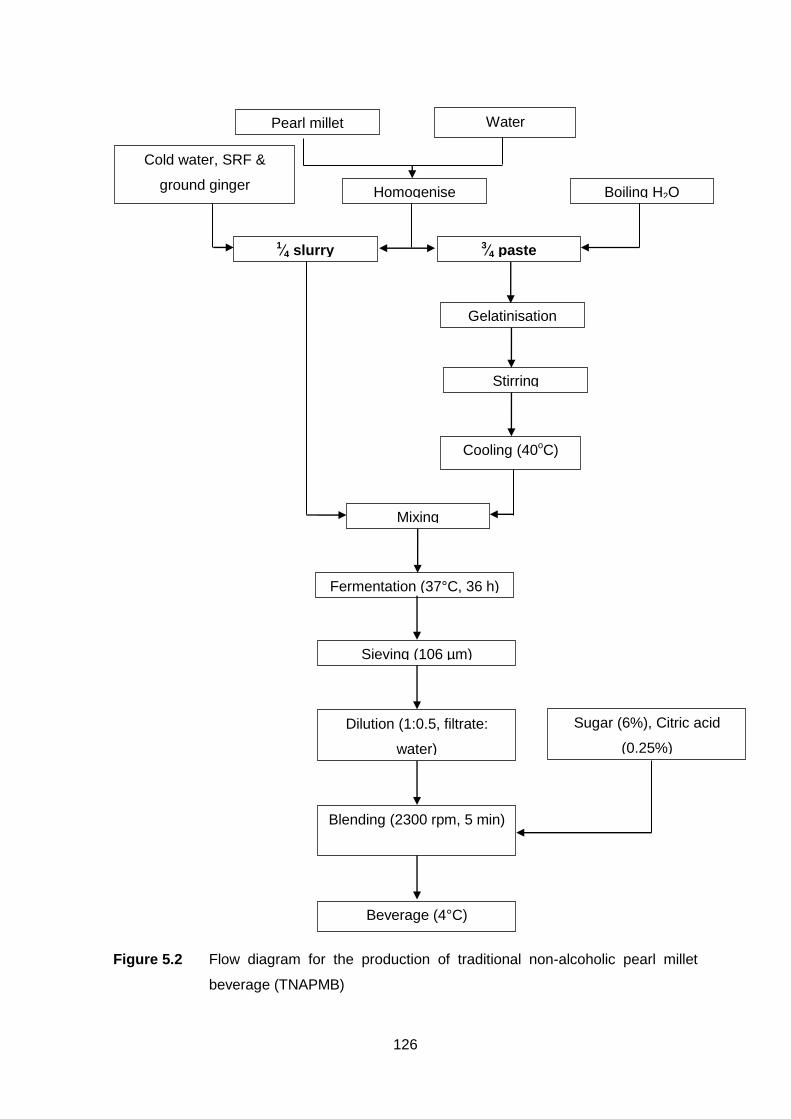
126
Figure 5.2 Flow diagram for the production of traditional non-alcoholic pearl millet
beverage (TNAPMB)
Water Pearl millet
Homogenise
1∕4 slurry 3∕4 paste
Gelatinisation
Boiling H2O
Cooling (40oC)
Cold water, SRF &
ground ginger
Fermentation (37°C, 36 h)
Stirring
Mixing
Sieving (106 µm)
Dilution (1:0.5, filtrate:
water)
Blending (2300 rpm, 5 min)
Beverage (4°C)
Sugar (6%), Citric acid
(0.25%)
127
containing 90 ml sterile ¼ strength of Ringer solution (Abegaz, 2007, Kivanc et al., 2011)
to give 10:100 dilutions followed by a 10 fold serial dilution from 10-1 to 10-10. Each
dilution was sub-cultured in triplicate. A portion of the sample dilution (1 ml) was added
into a 15 x 100 mm plastic Petri plates containing cooled molten deMan Rogosa and
Sharpe (MRS) agar [Merck HG00C107.500] (Nwachukwu et al., 2010; Temitope &
Taiyese, 2012) by means of a pipette and left to solidify (Omemu, 2011). The plates were
incubated under anaerobic condition using Anaerobic Gas-Pack system and anaerobic
indicator strips at 30ºC for 48 h (Osuntogun & Aboaba, 2004; Nwachukwu et al., 2010).
All microbiological data were expressed in logarithms of numbers of colony forming unit
per ml (log cfu/ml).
5.2.7 Measurement of cells concentration in pearl millet extract by optical density
during fermentation of plain and moringa-supplemented non-alcoholic
beverages (NAPMB & MSNAPMB)
The growth of lactic acid bacteria (turbidity) was determined using optical density (OD).
Pearl millet extract (PME) in 100 ml Schott bottles was thoroughly mixed for 1 min. PME
(1 ml) was aseptically transferred into deMan Rogosa and Sharpe (MRS) broth and
incubated at 30ºC for 48 h. After incubation, 0.2 ml of the broth was transferred into
sterile 3 ml de-ionised water (d). The dilution (d) was done where necessary (OD above
1.0) since the relationship between microorganisms and OD is non-linear if the OD is
above 1.0 (Champagne et al., 2007). The sample was mixed by vortexing for 30 sec prior
to the OD measurement using UV 1700 Pharmaspec visible spectrophotometer set at
20ºC and 600 nm (OD600) wavelengths (Widdel, 2010). The reference sample used was
sterile MRS broth (0.2 ml) mixed with 3 ml sterile de-ionised water (d) where necessary.
The absorbance was divided by the defined dilution factor (d) to get correlated or
calculated optical density (ODcorr).
5.2.8 Physicochemical analysis of pearl millet extract (PME) during fermentation
of non-alcoholic pearl millet beverages (NAPMB)
The pH of pearl millet extract (PMS) [10 ml] during fermentation of non-alcoholic pearl
millet beverage (NAPMB) was measured at 3 h interval in triplicates using Hanna Edge
(HI - 11310) glass electrode pH meter standardized with pH buffer solution of 4, 7 and 10.
Total titratable acidity (TTA) was assessed at 3 h intervals during the beverage
fermentation. The TTA of pearl millet extract during fermentation of NAPMB was
determined in triplicates by titrating 10 ml of the sample with 0.1N NaOH using
phenolphthalein as indicator until a light pink colour appears. The TTA was expressed as
128
percentage lactic acid (AOAC, 1980). Equation 5.1 was used to calculate the percentage
acidity, with each 0.1M NaOH equivalent to 90.08 mg lactic acid.
( lactic acid) ml a x a x .
volume of sample used x 5.1
Where, ml NaOH = volume of NaOH (ml), N NaOH = molarity of NaOH, M.E = the
equivalent factor of lactic acid being 90.08 mg, 1000 = factor used to convert the M.E
which is normally in mg to grams, and 100 used to express the lactic acid concentration in
percentage.
5.2.9 Determination of soluble sugars in pearl millet extract during fermentation of
plain and moringa-supplemented beverages (NAPMB & MSNAPMB)
The method of AOAC 982.14 as described by Li et al. (2002) was used to determine the
soluble sugars in pearl millet extract (PME) during fermentation of plain and moringa
supplemented non-alcoholic beverages. Sugar extraction was done by mixing 5 g (W1) of
the pearl millet slurry (PMS) with 100 ml (W2) of 50% ethanol. The mixture was heated in
a water bath for 25 min at 85ºC while shaking at 25 rpm to break-up and dissolve the
sample. The mixture was cooled to 25ºC ethanol (95%) was used to bring the sample
weight to original weight (W2). The sample was filtered through a 0.45 µm nylon syringe
into a 1.5 ml clear screw neck high performance liquid chromatography (HPLC) sample
vial. The total sugar content of the extracts was determined in triplicates using HPLC
(Agilent 1100 HPLC – RID system) equipped with Zorbax carbohydrates column (4.6 ×
150 mm, 5 µm) and Zorbax NH2 guard column (4.6 × 12.5 mm, 5 µm). The mobile phase
used was acetonitrile mixed and de-gassed with milipore distilled water at 75:25
(acetonitrile:water) ratio. The sugar standards were prepared by mixing sucrose (6
mg/ml), fructose (6 mg/ml), glucose (6 mg/ml), maltose (6 mg/ml), lactose (6 mg/ml) and
sucrose (30 mg/ml) in a water/ethanol (50:50) solution. The resulting stock solution was
used to prepare concentration solutions used for the calibration curve. The concentration
used to draw a standard curve were 0.375 (1.875) mg/ml, 0.75 (3.75) mg/ml, 1.5 (7.5)
mg/ml and 3.0 (15.0) mg/ml. The values in parenthesis show the sucrose concentration in
each solution.
5.2.10 Proximate analyses of plain, moringa-supplemented and traditional non-
alcoholic pearl millet beverages
The moisture and ash content in plain, moringa-supplemented and traditional cereal
beverages were determined using the oven and muffle furnace method, respectively
129
(AOAC, 2005). The protein was determined using nitrogen analyser (Leco- TruSpec-N)
with furnace set at 950ºC. The protein factor used was 6.31 for millet. Fat was
determined using AOAC 996.06 (2005) 18th edition. Total dietary fibre (TDF) was
determined using the Fibertec system method. The carbohydrates were determined by
difference.
5.2.11 Colour measurement of plain, moringa-supplemented and traditional
beverages
A Konica Minolta spectrophotometer (CM-5) was used to measure the colour of plain,
moringa-supplemented and traditional non-alcoholic pearl millet beverages. The
equipment was set at 10º/D65 illuminate and prior to any measurement the instrument
was zero calibrated using the black tile (L* = 5.49, a* = -7.08, b* = 4.66) and white tile (L*
= 93.41, a* = -1.18, b* = 0.75). The beverage (10 ml) was poured into a 30 mm diameter
Petri dish and the reflectance measured in terms of L*, a* and b*. Each measurement
was done three times by doing a quarter-turn of the sample and each sample was
measured in triplicates. L* indicates the lightness of the beverage, a* represent the
red/greenish of the beverage and b* shows the yellowish/blue of the beverage
coordinates. The change in L*, a* and b* can either be negative or positive where -L* =
lighter, +L* = darker, -a* = greener and +a* = redder and –b* = blue and +b* = yellow.
Chroma (C) shows the quality that differentiates a pure hue from a grey shade and
describes the hue saturation or purity. he total colour difference (∆E) of the beverage
was calculated using Equation 5.2. The change in colour is the numerical comparison of
the PNAPMB and MSNAPMB to the TNAPMB (control). A colour difference of 1 is
defined as just-noticeable difference at which a trained evaluator will notice the
differences in colour. If the ∆E is between 4 and 8 the samples are deemed acceptable
(Murenanhema, 2012).
∆ √[ (∆ *) + (∆a*) + (∆b
*) ] 5.2
5.2.12 Extraction and identification of volatile compounds in PNAPMB, MSNAPMB
and TNAPMB using methanol as a solvent
Aliquot samples (200 ml) of plain non-alcoholic pearl millet beverage (PNAPMB), moringa-
supplemented non-alcoholic pearl millet beverage (MSNAPMB) and traditional non-
alcoholic pearl millet beverage (TNAPMB) were separately poured in 600 ml freeze-dry
jars and frozen at -76°C for 12 h in an ultra-freezer (Glacier -86ºC ultralow temperature
freezer) and freeze dried using BenchTop-Pro with omnitronics (VirTis SP Scientific) for
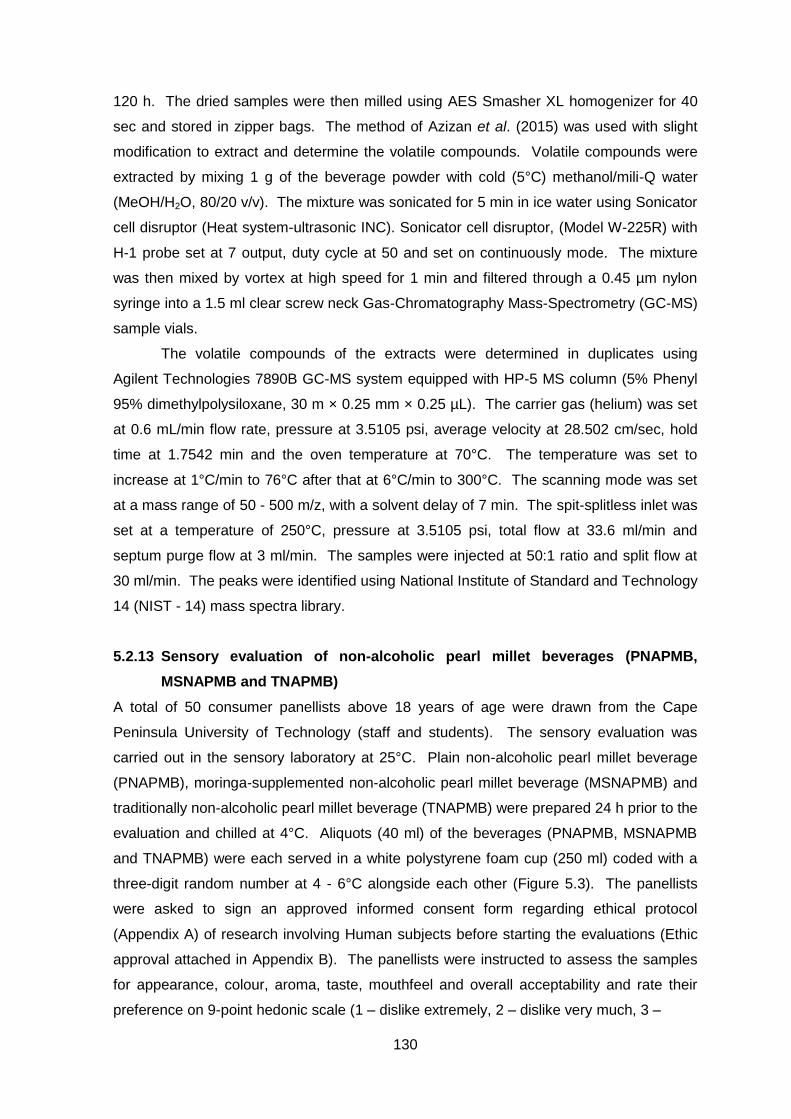
130
120 h. The dried samples were then milled using AES Smasher XL homogenizer for 40
sec and stored in zipper bags. The method of Azizan et al. (2015) was used with slight
modification to extract and determine the volatile compounds. Volatile compounds were
extracted by mixing 1 g of the beverage powder with cold (5°C) methanol/mili-Q water
(MeOH/H2O, 80/20 v/v). The mixture was sonicated for 5 min in ice water using Sonicator
cell disruptor (Heat system-ultrasonic INC). Sonicator cell disruptor, (Model W-225R) with
H-1 probe set at 7 output, duty cycle at 50 and set on continuously mode. The mixture
was then mixed by vortex at high speed for 1 min and filtered through a 0.45 µm nylon
syringe into a 1.5 ml clear screw neck Gas-Chromatography Mass-Spectrometry (GC-MS)
sample vials.
The volatile compounds of the extracts were determined in duplicates using
Agilent Technologies 7890B GC-MS system equipped with HP-5 MS column (5% Phenyl
95% dimethylpolysiloxane, 30 m × 0.25 mm × 0.25 µL). The carrier gas (helium) was set
at 0.6 mL/min flow rate, pressure at 3.5105 psi, average velocity at 28.502 cm/sec, hold
time at 1.7542 min and the oven temperature at 70°C. The temperature was set to
increase at 1°C/min to 76°C after that at 6°C/min to 300°C. The scanning mode was set
at a mass range of 50 - 500 m/z, with a solvent delay of 7 min. The spit-splitless inlet was
set at a temperature of 250°C, pressure at 3.5105 psi, total flow at 33.6 ml/min and
septum purge flow at 3 ml/min. The samples were injected at 50:1 ratio and split flow at
30 ml/min. The peaks were identified using National Institute of Standard and Technology
14 (NIST - 14) mass spectra library.
5.2.13 Sensory evaluation of non-alcoholic pearl millet beverages (PNAPMB,
MSNAPMB and TNAPMB)
A total of 50 consumer panellists above 18 years of age were drawn from the Cape
Peninsula University of Technology (staff and students). The sensory evaluation was
carried out in the sensory laboratory at 25°C. Plain non-alcoholic pearl millet beverage
(PNAPMB), moringa-supplemented non-alcoholic pearl millet beverage (MSNAPMB) and
traditionally non-alcoholic pearl millet beverage (TNAPMB) were prepared 24 h prior to the
evaluation and chilled at 4°C. Aliquots (40 ml) of the beverages (PNAPMB, MSNAPMB
and TNAPMB) were each served in a white polystyrene foam cup (250 ml) coded with a
three-digit random number at 4 - 6°C alongside each other (Figure 5.3). The panellists
were asked to sign an approved informed consent form regarding ethical protocol
(Appendix A) of research involving Human subjects before starting the evaluations (Ethic
approval attached in Appendix B). The panellists were instructed to assess the samples
for appearance, colour, aroma, taste, mouthfeel and overall acceptability and rate their
preference on 9-point hedonic scale (1 – dislike extremely, 2 – dislike very much, 3 –
131
Figure 5.3 Coded non-alcoholic pearl millet beverages served to panellists
dislike moderately, 4 – dislike slightly, 5 – neither like nor dislike, 6 – like slightly, 7 – like
moderately, 8 – like very much and 9 – like extremely) [Appendix C]. The panellists were
asked to rate each sample on own merit based on the attributes and not compare the
samples.
132
5.2.14 Classification of sentiments during the evaluation of non-alcoholic pearl
millet beverages (PNAPMB, MSNAPMB and TNAPMB)
Word clouds were used to visually present, identify trends and pattern of the comments
from the panellists to make it easier to see word frequencies. Word clouds are graphical
representation of the most frequent words that give greater prominence to words that are
appearing in a source of text. Most frequent words are displayed larger and in bold.
However, the word clouds emphasised on the frequencies of the words but not their
importance (negative or positive sense). Thus, sentiment analysis (negative, positive or
neutral) was used to discern the meaning/thought of each word from the panellist.
5.2.15 Data analysis
The results reported are mean standard deviation (±) of three independent trials unless
stated. Multivariate analysis of variance (MANOVA) was used to determine mean
difference between treatments at p . 5. Duncan’s multiple range tests was used to
separate means where differences existed using IBM SPSS ver 23 (IBM, 2015). Principal
component analysis (PCA) was used to summarize and uncover any patterns in the
fermentation data set by reducing the complexity of the data (The Unscrambler X10.4).
5.3 Results and Discussion
5.3.1 Effect of fermentation time on the viability of lactic acid bacteria
(Leuconostoc mesenteroides and Pediococcus pentoseace) from pearl millet
extract during fermentation of plain- and moringa-supplemented non-
alcoholic pearl millet beverages (PNAPMB & MSNAPMB)
The effect of fermentation time on the survival of lactic acid bacteria (LAB) [interaction of
Leuconostoc mesenteroides and Pediococcus pentoseace] is shown in Figure 5.4. The
growth of the interaction of Leuconostoc mesenteroides and Pediococcus pentoseace in
plain and moringa-supplemented cereal beverages ranged from 3.32 ± 0.04 to 7.97 ± 0.13
cfu/ml and 3.58 ± 0.00 to 8.38 ± 0.02 log cfu/ml, respectively. Initial LAB in plain non-
alcoholic pearl millet beverage (PNAPMB) was 3.32 ± 0.004 cfu/ml and significantly
increased to 7.96 ± 0.08 cfu/ml in 12 h. The lag phase was not visible as the cells
immediately grew exponentially. The cells did not take long to adapt to the new
environment. Thereafter, the growth of LAB was not significant between 12 and 15 h. At
this point the available nutrients were being depleted and bacteria started to compete for
remaining nutrients. Leuconostoc mesentoroides which stops growing at a pH of 4.0 - 4.5
could also have been halted as the pH was between 4.71 ± 0.21 and 4.13 ± 0.01. The
cells decreased from 8.16 ± 0.02 (15 h) to 7.97 ± 0.13 cfu/ml (18 h). Death phase was
setting in after all the nutrients were used up.
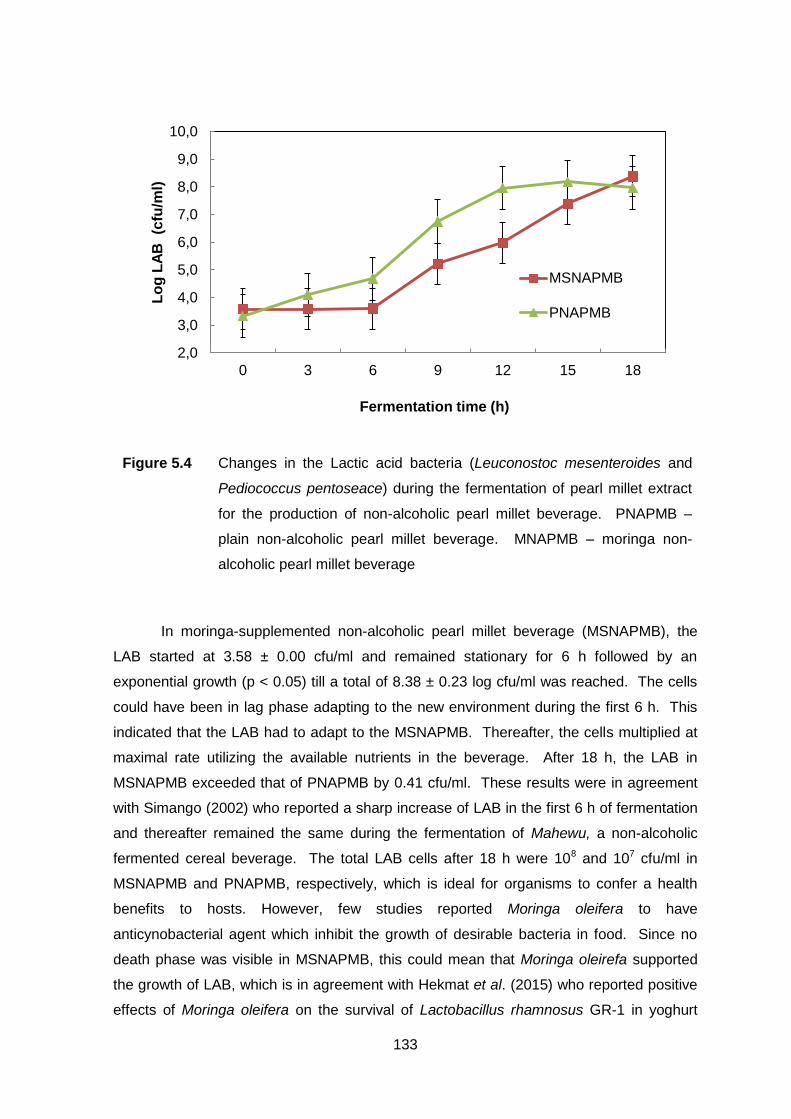
133
In moringa-supplemented non-alcoholic pearl millet beverage (MSNAPMB), the
LAB started at 3.58 ± 0.00 cfu/ml and remained stationary for 6 h followed by an
exponential growth (p < 0.05) till a total of 8.38 ± 0.23 log cfu/ml was reached. The cells
could have been in lag phase adapting to the new environment during the first 6 h. This
indicated that the LAB had to adapt to the MSNAPMB. Thereafter, the cells multiplied at
maximal rate utilizing the available nutrients in the beverage. After 18 h, the LAB in
MSNAPMB exceeded that of PNAPMB by 0.41 cfu/ml. These results were in agreement
with Simango (2002) who reported a sharp increase of LAB in the first 6 h of fermentation
and thereafter remained the same during the fermentation of Mahewu, a non-alcoholic
fermented cereal beverage. The total LAB cells after 18 h were 108 and 107 cfu/ml in
MSNAPMB and PNAPMB, respectively, which is ideal for organisms to confer a health
benefits to hosts. However, few studies reported Moringa oleifera to have
anticynobacterial agent which inhibit the growth of desirable bacteria in food. Since no
death phase was visible in MSNAPMB, this could mean that Moringa oleirefa supported
the growth of LAB, which is in agreement with Hekmat et al. (2015) who reported positive
effects of Moringa oleifera on the survival of Lactobacillus rhamnosus GR-1 in yoghurt
Figure 5.4 Changes in the Lactic acid bacteria (Leuconostoc mesenteroides and
Pediococcus pentoseace) during the fermentation of pearl millet extract
for the production of non-alcoholic pearl millet beverage. PNAPMB –
plain non-alcoholic pearl millet beverage. MNAPMB – moringa non-
alcoholic pearl millet beverage
2,0
3,0
4,0
5,0
6,0
7,0
8,0
9,0
10,0
0 3 6 9 12 15 18
Lo
g L
AB
(c
fu/m
l)
Fermentation time (h)
MSNAPMB
PNAPMB
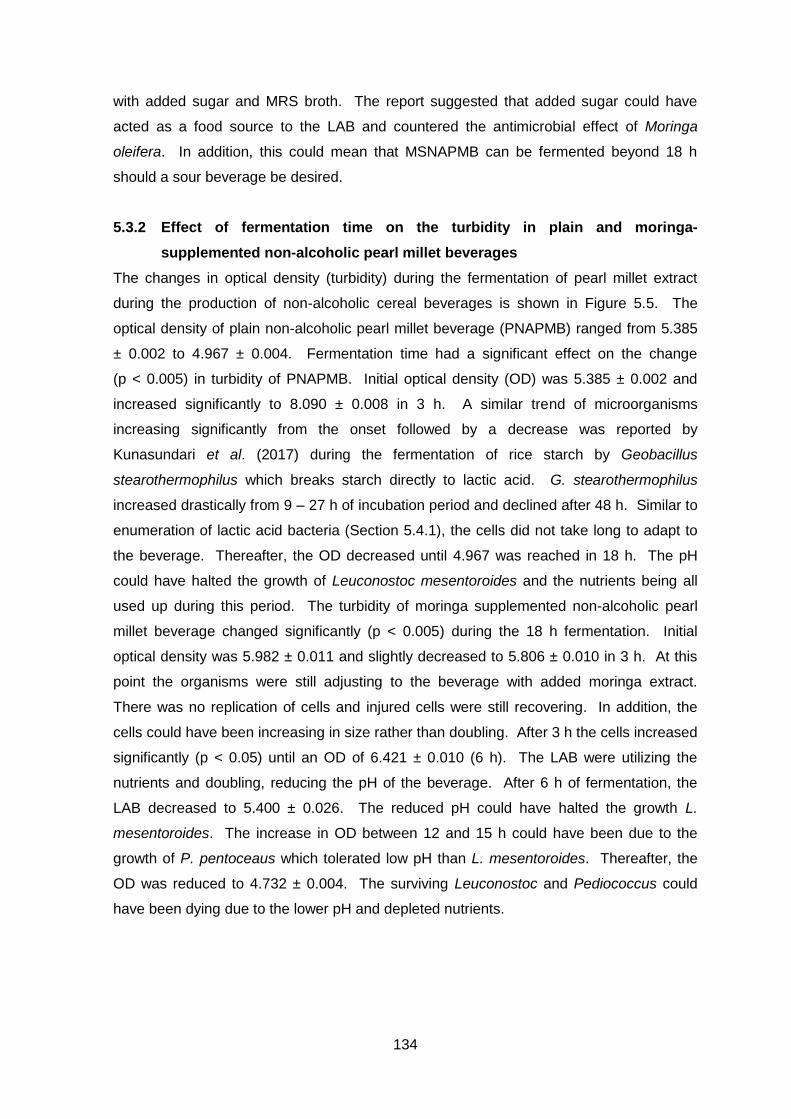
134
with added sugar and MRS broth. The report suggested that added sugar could have
acted as a food source to the LAB and countered the antimicrobial effect of Moringa
oleifera. In addition, this could mean that MSNAPMB can be fermented beyond 18 h
should a sour beverage be desired.
5.3.2 Effect of fermentation time on the turbidity in plain and moringa-
supplemented non-alcoholic pearl millet beverages
The changes in optical density (turbidity) during the fermentation of pearl millet extract
during the production of non-alcoholic cereal beverages is shown in Figure 5.5. The
optical density of plain non-alcoholic pearl millet beverage (PNAPMB) ranged from 5.385
± 0.002 to 4.967 ± 0.004. Fermentation time had a significant effect on the change
(p < 0.005) in turbidity of PNAPMB. Initial optical density (OD) was 5.385 ± 0.002 and
increased significantly to 8.090 ± 0.008 in 3 h. A similar trend of microorganisms
increasing significantly from the onset followed by a decrease was reported by
Kunasundari et al. (2017) during the fermentation of rice starch by Geobacillus
stearothermophilus which breaks starch directly to lactic acid. G. stearothermophilus
increased drastically from 9 – 27 h of incubation period and declined after 48 h. Similar to
enumeration of lactic acid bacteria (Section 5.4.1), the cells did not take long to adapt to
the beverage. Thereafter, the OD decreased until 4.967 was reached in 18 h. The pH
could have halted the growth of Leuconostoc mesentoroides and the nutrients being all
used up during this period. The turbidity of moringa supplemented non-alcoholic pearl
millet beverage changed significantly (p < 0.005) during the 18 h fermentation. Initial
optical density was 5.982 ± 0.011 and slightly decreased to 5.806 ± 0.010 in 3 h. At this
point the organisms were still adjusting to the beverage with added moringa extract.
There was no replication of cells and injured cells were still recovering. In addition, the
cells could have been increasing in size rather than doubling. After 3 h the cells increased
significantly (p < 0.05) until an OD of 6.421 ± 0.010 (6 h). The LAB were utilizing the
nutrients and doubling, reducing the pH of the beverage. After 6 h of fermentation, the
LAB decreased to 5.400 ± 0.026. The reduced pH could have halted the growth L.
mesentoroides. The increase in OD between 12 and 15 h could have been due to the
growth of P. pentoceaus which tolerated low pH than L. mesentoroides. Thereafter, the
OD was reduced to 4.732 ± 0.004. The surviving Leuconostoc and Pediococcus could
have been dying due to the lower pH and depleted nutrients.
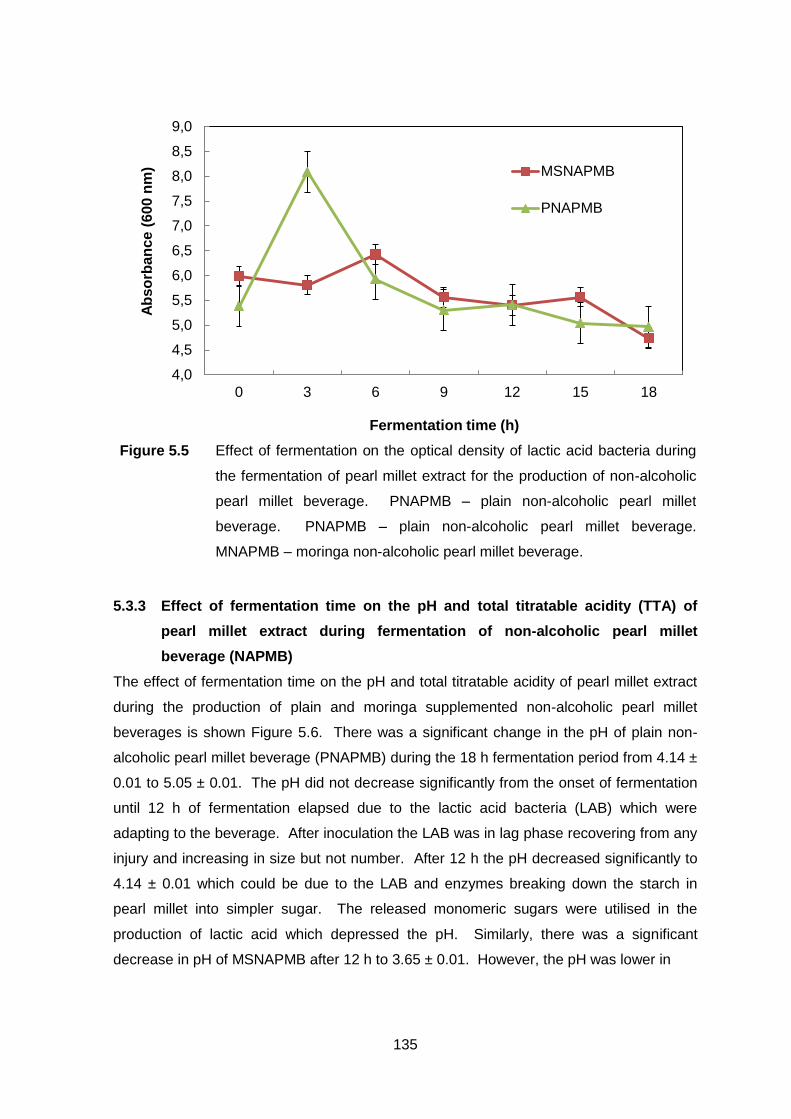
135
5.3.3 Effect of fermentation time on the pH and total titratable acidity (TTA) of
pearl millet extract during fermentation of non-alcoholic pearl millet
beverage (NAPMB)
The effect of fermentation time on the pH and total titratable acidity of pearl millet extract
during the production of plain and moringa supplemented non-alcoholic pearl millet
beverages is shown Figure 5.6. There was a significant change in the pH of plain non-
alcoholic pearl millet beverage (PNAPMB) during the 18 h fermentation period from 4.14 ±
0.01 to 5.05 ± 0.01. The pH did not decrease significantly from the onset of fermentation
until 12 h of fermentation elapsed due to the lactic acid bacteria (LAB) which were
adapting to the beverage. After inoculation the LAB was in lag phase recovering from any
injury and increasing in size but not number. After 12 h the pH decreased significantly to
4.14 ± 0.01 which could be due to the LAB and enzymes breaking down the starch in
pearl millet into simpler sugar. The released monomeric sugars were utilised in the
production of lactic acid which depressed the pH. Similarly, there was a significant
decrease in pH of MSNAPMB after 12 h to 3.65 ± 0.01. However, the pH was lower in
4,0
4,5
5,0
5,5
6,0
6,5
7,0
7,5
8,0
8,5
9,0
0 3 6 9 12 15 18
Ab
so
rban
ce
(6
00
nm
)
Fermentation time (h)
MSNAPMB
PNAPMB
Figure 5.5 Effect of fermentation on the optical density of lactic acid bacteria during
the fermentation of pearl millet extract for the production of non-alcoholic
pearl millet beverage. PNAPMB – plain non-alcoholic pearl millet
beverage. PNAPMB – plain non-alcoholic pearl millet beverage.
MNAPMB – moringa non-alcoholic pearl millet beverage.
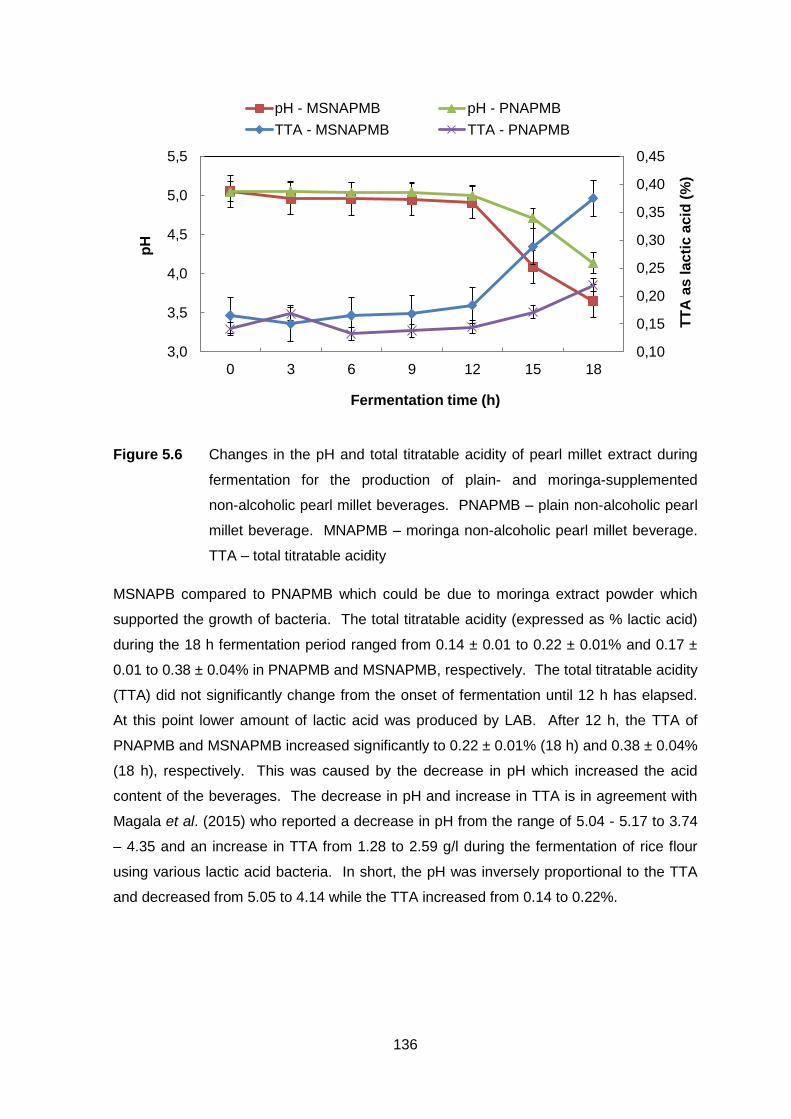
136
Figure 5.6 Changes in the pH and total titratable acidity of pearl millet extract during
fermentation for the production of plain- and moringa-supplemented
non-alcoholic pearl millet beverages. PNAPMB – plain non-alcoholic pearl
millet beverage. MNAPMB – moringa non-alcoholic pearl millet beverage.
TTA – total titratable acidity
MSNAPB compared to PNAPMB which could be due to moringa extract powder which
supported the growth of bacteria. The total titratable acidity (expressed as % lactic acid)
during the 18 h fermentation period ranged from 0.14 ± 0.01 to 0.22 ± 0.01% and 0.17 ±
0.01 to 0.38 ± 0.04% in PNAPMB and MSNAPMB, respectively. The total titratable acidity
(TTA) did not significantly change from the onset of fermentation until 12 h has elapsed.
At this point lower amount of lactic acid was produced by LAB. After 12 h, the TTA of
PNAPMB and MSNAPMB increased significantly to 0.22 ± 0.01% (18 h) and 0.38 ± 0.04%
(18 h), respectively. This was caused by the decrease in pH which increased the acid
content of the beverages. The decrease in pH and increase in TTA is in agreement with
Magala et al. (2015) who reported a decrease in pH from the range of 5.04 - 5.17 to 3.74
– 4.35 and an increase in TTA from 1.28 to 2.59 g/l during the fermentation of rice flour
using various lactic acid bacteria. In short, the pH was inversely proportional to the TTA
and decreased from 5.05 to 4.14 while the TTA increased from 0.14 to 0.22%.
0,10
0,15
0,20
0,25
0,30
0,35
0,40
0,45
3,0
3,5
4,0
4,5
5,0
5,5
0 3 6 9 12 15 18
TT
A a
s l
ac
tic
ac
id (
%)
pH
Fermentation time (h)
pH - MSNAPMB pH - PNAPMB
TTA - MSNAPMB TTA - PNAPMB
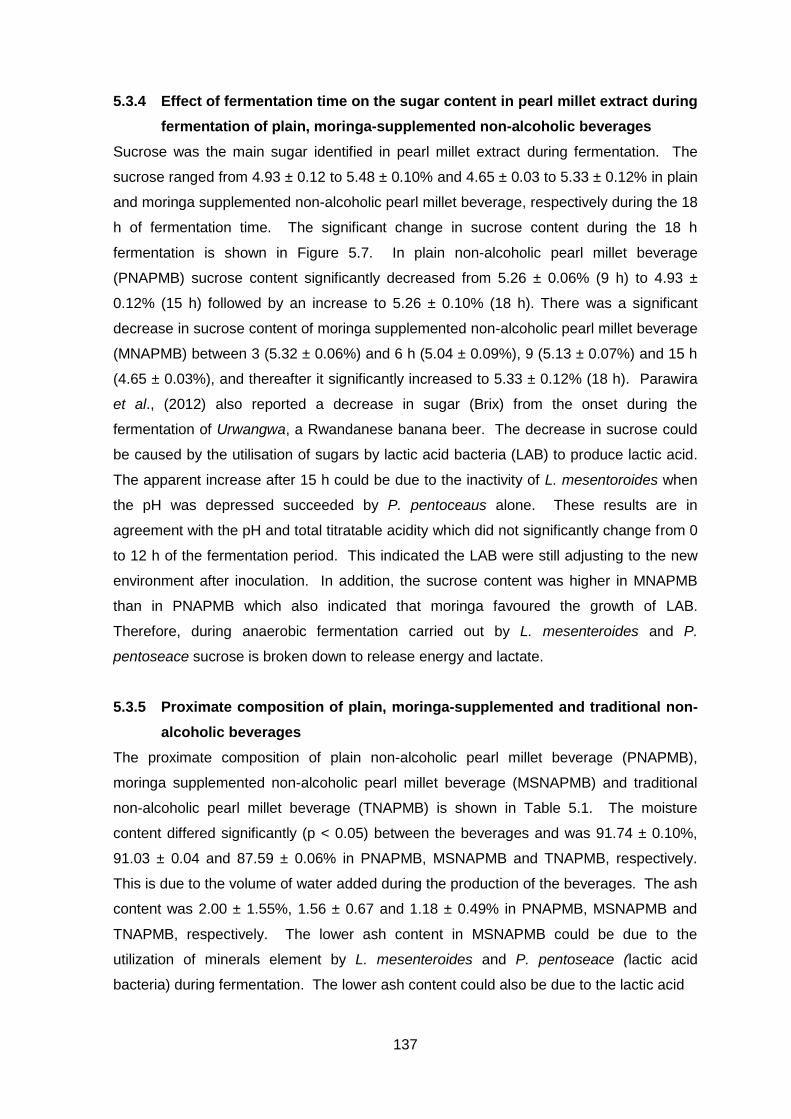
137
5.3.4 Effect of fermentation time on the sugar content in pearl millet extract during
fermentation of plain, moringa-supplemented non-alcoholic beverages
Sucrose was the main sugar identified in pearl millet extract during fermentation. The
sucrose ranged from 4.93 ± 0.12 to 5.48 ± 0.10% and 4.65 ± 0.03 to 5.33 ± 0.12% in plain
and moringa supplemented non-alcoholic pearl millet beverage, respectively during the 18
h of fermentation time. The significant change in sucrose content during the 18 h
fermentation is shown in Figure 5.7. In plain non-alcoholic pearl millet beverage
(PNAPMB) sucrose content significantly decreased from 5.26 ± 0.06% (9 h) to 4.93 ±
0.12% (15 h) followed by an increase to 5.26 ± 0.10% (18 h). There was a significant
decrease in sucrose content of moringa supplemented non-alcoholic pearl millet beverage
(MNAPMB) between 3 (5.32 ± 0.06%) and 6 h (5.04 ± 0.09%), 9 (5.13 ± 0.07%) and 15 h
(4.65 ± 0.03%), and thereafter it significantly increased to 5.33 ± 0.12% (18 h). Parawira
et al., (2012) also reported a decrease in sugar (Brix) from the onset during the
fermentation of Urwangwa, a Rwandanese banana beer. The decrease in sucrose could
be caused by the utilisation of sugars by lactic acid bacteria (LAB) to produce lactic acid.
The apparent increase after 15 h could be due to the inactivity of L. mesentoroides when
the pH was depressed succeeded by P. pentoceaus alone. These results are in
agreement with the pH and total titratable acidity which did not significantly change from 0
to 12 h of the fermentation period. This indicated the LAB were still adjusting to the new
environment after inoculation. In addition, the sucrose content was higher in MNAPMB
than in PNAPMB which also indicated that moringa favoured the growth of LAB.
Therefore, during anaerobic fermentation carried out by L. mesenteroides and P.
pentoseace sucrose is broken down to release energy and lactate.
5.3.5 Proximate composition of plain, moringa-supplemented and traditional non-
alcoholic beverages
The proximate composition of plain non-alcoholic pearl millet beverage (PNAPMB),
moringa supplemented non-alcoholic pearl millet beverage (MSNAPMB) and traditional
non-alcoholic pearl millet beverage (TNAPMB) is shown in Table 5.1. The moisture
content differed significantly (p < 0.05) between the beverages and was 91.74 ± 0.10%,
91.03 ± 0.04 and 87.59 ± 0.06% in PNAPMB, MSNAPMB and TNAPMB, respectively.
This is due to the volume of water added during the production of the beverages. The ash
content was 2.00 ± 1.55%, 1.56 ± 0.67 and 1.18 ± 0.49% in PNAPMB, MSNAPMB and
TNAPMB, respectively. The lower ash content in MSNAPMB could be due to the
utilization of minerals element by L. mesenteroides and P. pentoseace (lactic acid
bacteria) during fermentation. The lower ash content could also be due to the lactic acid
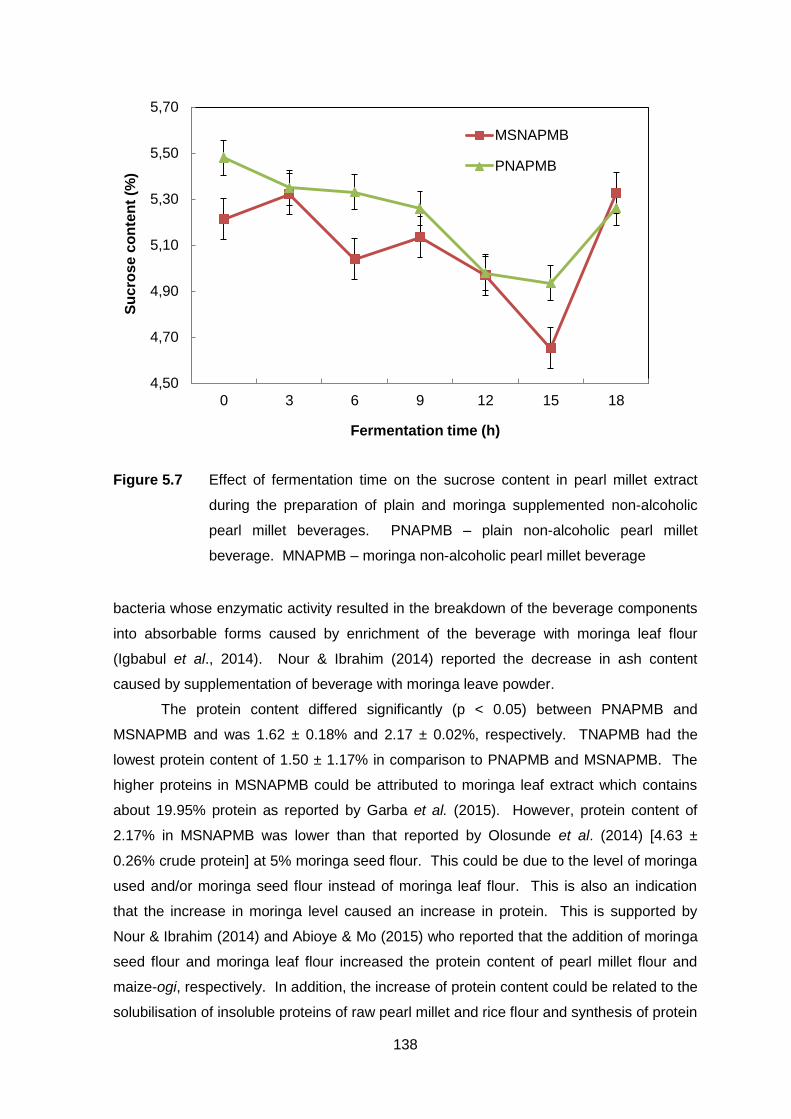
138
Figure 5.7 Effect of fermentation time on the sucrose content in pearl millet extract
during the preparation of plain and moringa supplemented non-alcoholic
pearl millet beverages. PNAPMB – plain non-alcoholic pearl millet
beverage. MNAPMB – moringa non-alcoholic pearl millet beverage
bacteria whose enzymatic activity resulted in the breakdown of the beverage components
into absorbable forms caused by enrichment of the beverage with moringa leaf flour
(Igbabul et al., 2014). Nour & Ibrahim (2014) reported the decrease in ash content
caused by supplementation of beverage with moringa leave powder.
The protein content differed significantly (p < 0.05) between PNAPMB and
MSNAPMB and was 1.62 ± 0.18% and 2.17 ± 0.02%, respectively. TNAPMB had the
lowest protein content of 1.50 ± 1.17% in comparison to PNAPMB and MSNAPMB. The
higher proteins in MSNAPMB could be attributed to moringa leaf extract which contains
about 19.95% protein as reported by Garba et al. (2015). However, protein content of
2.17% in MSNAPMB was lower than that reported by Olosunde et al. (2014) [4.63 ±
0.26% crude protein] at 5% moringa seed flour. This could be due to the level of moringa
used and/or moringa seed flour instead of moringa leaf flour. This is also an indication
that the increase in moringa level caused an increase in protein. This is supported by
Nour & Ibrahim (2014) and Abioye & Mo (2015) who reported that the addition of moringa
seed flour and moringa leaf flour increased the protein content of pearl millet flour and
maize-ogi, respectively. In addition, the increase of protein content could be related to the
solubilisation of insoluble proteins of raw pearl millet and rice flour and synthesis of protein
4,50
4,70
4,90
5,10
5,30
5,50
5,70
0 3 6 9 12 15 18
Su
cro
se c
on
ten
t (%
)
Fermentation time (h)
MSNAPMB
PNAPMB
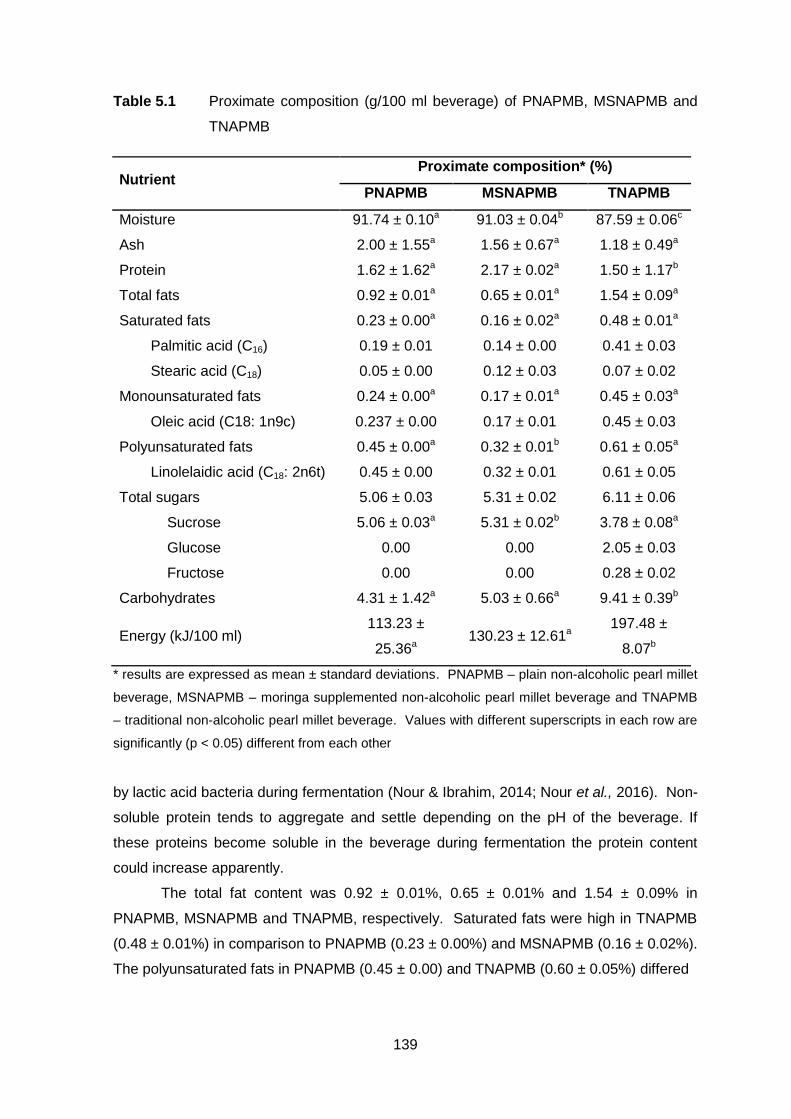
139
Table 5.1 Proximate composition (g/100 ml beverage) of PNAPMB, MSNAPMB and
TNAPMB
Nutrient Proximate composition* (%)
PNAPMB MSNAPMB TNAPMB
Moisture 91.74 ± 0.10a 91.03 ± 0.04b 87.59 ± 0.06c
Ash 2.00 ± 1.55a 1.56 ± 0.67a 1.18 ± 0.49a
Protein 1.62 ± 1.62a 2.17 ± 0.02a 1.50 ± 1.17b
Total fats 0.92 ± 0.01a 0.65 ± 0.01a 1.54 ± 0.09a
Saturated fats 0.23 ± 0.00a 0.16 ± 0.02a 0.48 ± 0.01a
Palmitic acid (C16) 0.19 ± 0.01 0.14 ± 0.00 0.41 ± 0.03
Stearic acid (C18) 0.05 ± 0.00 0.12 ± 0.03 0.07 ± 0.02
Monounsaturated fats 0.24 ± 0.00a 0.17 ± 0.01a 0.45 ± 0.03a
Oleic acid (C18: 1n9c) 0.237 ± 0.00 0.17 ± 0.01 0.45 ± 0.03
Polyunsaturated fats 0.45 ± 0.00a 0.32 ± 0.01b 0.61 ± 0.05a
Linolelaidic acid (C18: 2n6t) 0.45 ± 0.00 0.32 ± 0.01 0.61 ± 0.05
Total sugars 5.06 ± 0.03 5.31 ± 0.02 6.11 ± 0.06
Sucrose 5.06 ± 0.03a 5.31 ± 0.02b 3.78 ± 0.08a
Glucose 0.00 0.00 2.05 ± 0.03
Fructose 0.00 0.00 0.28 ± 0.02
Carbohydrates 4.31 ± 1.42a 5.03 ± 0.66a 9.41 ± 0.39b
Energy (kJ/100 ml) 113.23 ±
25.36a 130.23 ± 12.61a
197.48 ±
8.07b
* results are expressed as mean ± standard deviations. PNAPMB – plain non-alcoholic pearl millet
beverage, MSNAPMB – moringa supplemented non-alcoholic pearl millet beverage and TNAPMB
– traditional non-alcoholic pearl millet beverage. Values with different superscripts in each row are
significantly (p < 0.05) different from each other
by lactic acid bacteria during fermentation (Nour & Ibrahim, 2014; Nour et al., 2016). Non-
soluble protein tends to aggregate and settle depending on the pH of the beverage. If
these proteins become soluble in the beverage during fermentation the protein content
could increase apparently.
The total fat content was 0.92 ± 0.01%, 0.65 ± 0.01% and 1.54 ± 0.09% in
PNAPMB, MSNAPMB and TNAPMB, respectively. Saturated fats were high in TNAPMB
(0.48 ± 0.01%) in comparison to PNAPMB (0.23 ± 0.00%) and MSNAPMB (0.16 ± 0.02%).
The polyunsaturated fats in PNAPMB (0.45 ± 0.00) and TNAPMB (0.60 ± 0.05%) differed
140
significantly to that of MSNAPMB (0.32 ± 0.01%). The fatty acids identified in the
beverages were palmitic acid and stearic acid [saturated fats (SFA)], oleic acid
[monounsaturated fats (MUFA)], and linolelaidic acid [polyunsaturated fats (PUFA)] .
Oleic acid and palmitic acid were the highest in TNAPMB followed by PNAPMB.
MSNAPMB had the highest amount of stearic acid followed by TNAPMB. These fatty
acids (SFA, MUFA and PUFA) are prime in pearl millet and occur naturally (Sarita, 2016).
The presence of palmitic acid was low in PNAPMB (0.19%) and MSNAPB (0.14%) in
comparison to the TNAPMB (0.41 ± 0.03%) and stearic acid was also low in PNAPMB
(0.05 ± %) and MSNAPMB (0.02 ± 0.03%) when compared to TNAPMB (0.07 ± 0.02%).
Palmitic acid is associated with increased risk of coronary heart diseases and tumors
while stearic acid is associated with neutral effect on blood total and low density
lipoprotein (LDL) cholesterol levels of 1 – 5. However, these saturated fatty acid are lower
in cereal beverages in comparison to yoghurt where palmitic and stearic acid account to
16.54% and 11.73%, respectively (Sumarmono et al., 2015). Oleic acid (omega-9) was
0.45 ± 0.03% in TNAPMB, 0.24% in PNAPMB and 0.17 ± 0.01% in MSNAPMB. Oleic
acid lowers the risk of heart attacks and artherosclerosis and helps in the prevention of
cancer (Win, 2005). Linolelaidic acid is an essential fatty acid which is not synthesised by
the body and should be provided through a meal. They are essential in the prevention of
diseases related to cardiovascular and cancer (Ovando-Martinez et al., 2014). This
makes the beverages a source of this essential nutrient. The increase in fat during
fermentation could be due to the transformation of carbohydrates to fat, meanwhile, the
decrease could be caused by the utilization of fat by lactic acid bacteria present in the
beverage during fermentation (Nour & Ibrahim, 2014). In contrast, Olosunde et al. (2014)
reported an increase in fat content from 1.67 ± 0.10% to 2.20 ± 0.05% when 5% moringa
seed flour was added to the beverage. However, Nour & Ibrahim, (2014) reported a
decrease in the oil content in fermented sorghum with 5% moringa seed flour. Sarita
(2016) also reported that fermentation decreases the long-chain fatty acid content in finger
millet.
The beverages differed significantly (p < 0.05) in terms of sucrose content which
was 5.06 ± 0.03%, 5.31 ± 0.02% and 3.78 ± 0.08% in PNAPMB, MSNAPMB and
TNAPMB, respectively. In addition to sucrose identified in TNAPMB, glucose and fructose
were identified at 2.05 ± 0.02% and 0.28 ± 0.02%, respectively. The sucrose could mainly
be from the added sugar during production of the beverages and available free sucrose
found in millet (Bora, 2013). The fibre in the beverages could have been utilized by
fermenting LAB (Nour & Ibrahim, 2014).
The carbohydrates (CHO) differed significant (p < 0.05) between PNAPMB and
TNAPMB, and MSNAPMB and TNAPMB. The CHO in PNAPMB, MSNAPMB and
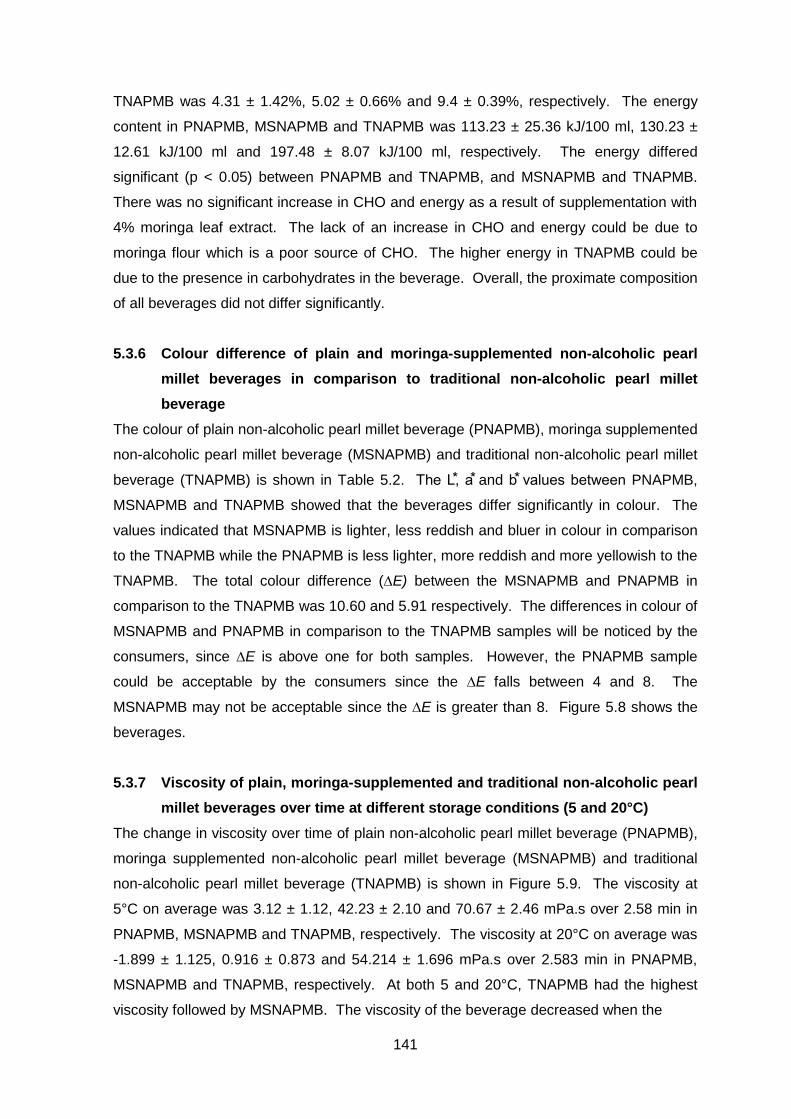
141
TNAPMB was 4.31 ± 1.42%, 5.02 ± 0.66% and 9.4 ± 0.39%, respectively. The energy
content in PNAPMB, MSNAPMB and TNAPMB was 113.23 ± 25.36 kJ/100 ml, 130.23 ±
12.61 kJ/100 ml and 197.48 ± 8.07 kJ/100 ml, respectively. The energy differed
significant (p < 0.05) between PNAPMB and TNAPMB, and MSNAPMB and TNAPMB.
There was no significant increase in CHO and energy as a result of supplementation with
4% moringa leaf extract. The lack of an increase in CHO and energy could be due to
moringa flour which is a poor source of CHO. The higher energy in TNAPMB could be
due to the presence in carbohydrates in the beverage. Overall, the proximate composition
of all beverages did not differ significantly.
5.3.6 Colour difference of plain and moringa-supplemented non-alcoholic pearl
millet beverages in comparison to traditional non-alcoholic pearl millet
beverage
The colour of plain non-alcoholic pearl millet beverage (PNAPMB), moringa supplemented
non-alcoholic pearl millet beverage (MSNAPMB) and traditional non-alcoholic pearl millet
beverage (TNAPMB) is shown in Table 5.2. he , a and b values between PNAPMB,
MSNAPMB and TNAPMB showed that the beverages differ significantly in colour. The
values indicated that MSNAPMB is lighter, less reddish and bluer in colour in comparison
to the TNAPMB while the PNAPMB is less lighter, more reddish and more yellowish to the
TNAPMB. The total colour difference (∆E) between the MSNAPMB and PNAPMB in
comparison to the TNAPMB was 10.60 and 5.91 respectively. The differences in colour of
MSNAPMB and PNAPMB in comparison to the TNAPMB samples will be noticed by the
consumers, since ∆E is above one for both samples. However, the PNAPMB sample
could be acceptable by the consumers since the ∆E falls between 4 and 8. The
MSNAPMB may not be acceptable since the ∆E is greater than 8. Figure 5.8 shows the
beverages.
5.3.7 Viscosity of plain, moringa-supplemented and traditional non-alcoholic pearl
millet beverages over time at different storage conditions (5 and 20°C)
The change in viscosity over time of plain non-alcoholic pearl millet beverage (PNAPMB),
moringa supplemented non-alcoholic pearl millet beverage (MSNAPMB) and traditional
non-alcoholic pearl millet beverage (TNAPMB) is shown in Figure 5.9. The viscosity at
5°C on average was 3.12 ± 1.12, 42.23 ± 2.10 and 70.67 ± 2.46 mPa.s over 2.58 min in
PNAPMB, MSNAPMB and TNAPMB, respectively. The viscosity at 20°C on average was
-1.899 ± 1.125, 0.916 ± 0.873 and 54.214 ± 1.696 mPa.s over 2.583 min in PNAPMB,
MSNAPMB and TNAPMB, respectively. At both 5 and 20°C, TNAPMB had the highest
viscosity followed by MSNAPMB. The viscosity of the beverage decreased when the
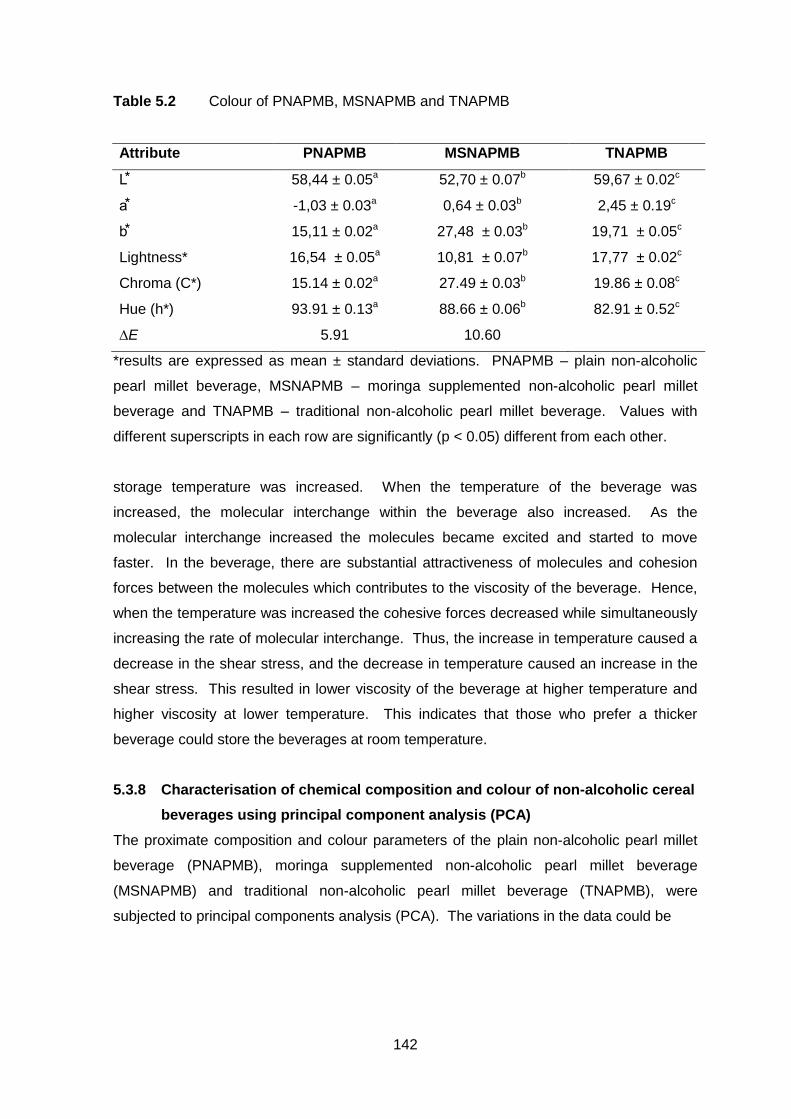
142
Table 5.2 Colour of PNAPMB, MSNAPMB and TNAPMB
Attribute PNAPMB MSNAPMB TNAPMB
58,44 ± 0.05a 52,70 ± 0.07b 59,67 ± 0.02c
a -1,03 ± 0.03a 0,64 ± 0.03b 2,45 ± 0.19c
b 15,11 ± 0.02a 27,48 ± 0.03b 19,71 ± 0.05c
Lightness* 16,54 ± 0.05a 10,81 ± 0.07b 17,77 ± 0.02c
Chroma (C*) 15.14 ± 0.02a 27.49 ± 0.03b 19.86 ± 0.08c
Hue (h*) 93.91 ± 0.13a 88.66 ± 0.06b 82.91 ± 0.52c
∆E 5.91 10.60
*results are expressed as mean ± standard deviations. PNAPMB – plain non-alcoholic
pearl millet beverage, MSNAPMB – moringa supplemented non-alcoholic pearl millet
beverage and TNAPMB – traditional non-alcoholic pearl millet beverage. Values with
different superscripts in each row are significantly (p < 0.05) different from each other.
storage temperature was increased. When the temperature of the beverage was
increased, the molecular interchange within the beverage also increased. As the
molecular interchange increased the molecules became excited and started to move
faster. In the beverage, there are substantial attractiveness of molecules and cohesion
forces between the molecules which contributes to the viscosity of the beverage. Hence,
when the temperature was increased the cohesive forces decreased while simultaneously
increasing the rate of molecular interchange. Thus, the increase in temperature caused a
decrease in the shear stress, and the decrease in temperature caused an increase in the
shear stress. This resulted in lower viscosity of the beverage at higher temperature and
higher viscosity at lower temperature. This indicates that those who prefer a thicker
beverage could store the beverages at room temperature.
5.3.8 Characterisation of chemical composition and colour of non-alcoholic cereal
beverages using principal component analysis (PCA)
The proximate composition and colour parameters of the plain non-alcoholic pearl millet
beverage (PNAPMB), moringa supplemented non-alcoholic pearl millet beverage
(MSNAPMB) and traditional non-alcoholic pearl millet beverage (TNAPMB), were
subjected to principal components analysis (PCA). The variations in the data could be
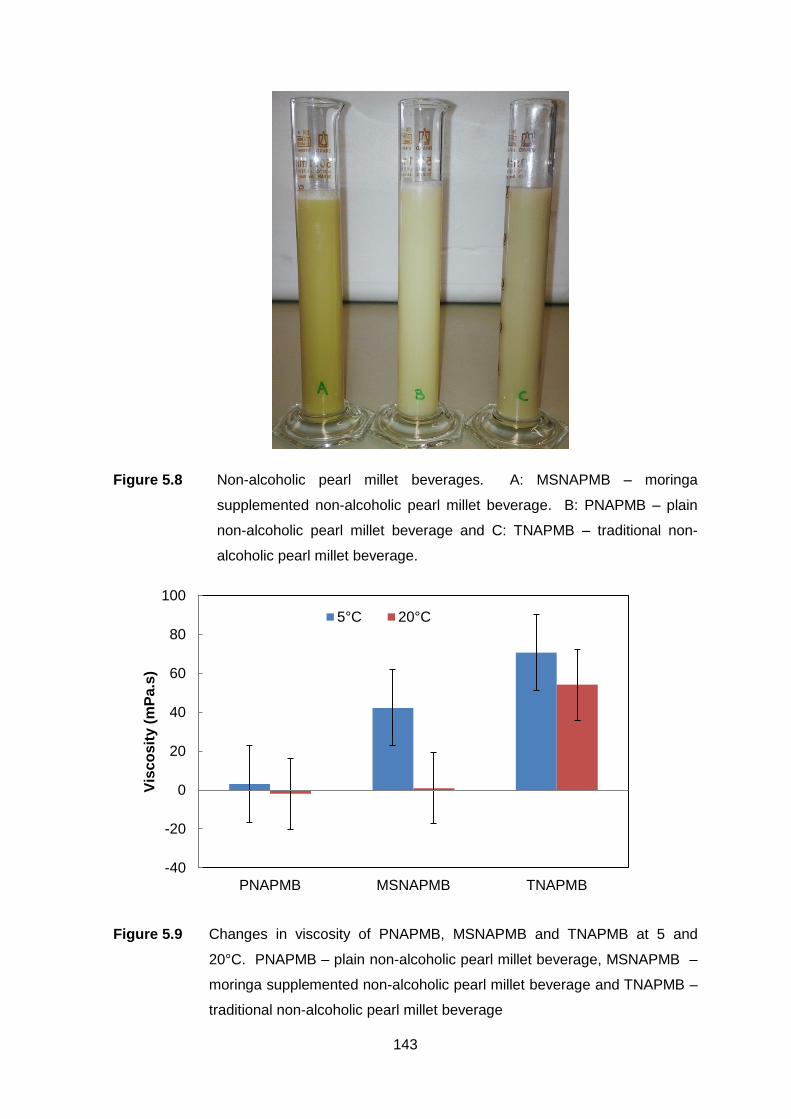
143
Figure 5.8 Non-alcoholic pearl millet beverages. A: MSNAPMB – moringa
supplemented non-alcoholic pearl millet beverage. B: PNAPMB – plain
non-alcoholic pearl millet beverage and C: TNAPMB – traditional non-
alcoholic pearl millet beverage.
Figure 5.9 Changes in viscosity of PNAPMB, MSNAPMB and TNAPMB at 5 and
20°C. PNAPMB – plain non-alcoholic pearl millet beverage, MSNAPMB –
moringa supplemented non-alcoholic pearl millet beverage and TNAPMB –
traditional non-alcoholic pearl millet beverage
-40
-20
0
20
40
60
80
100
PNAPMB MSNAPMB TNAPMB
Vis
co
sit
y (
mP
a.s
)
5°C 20°C
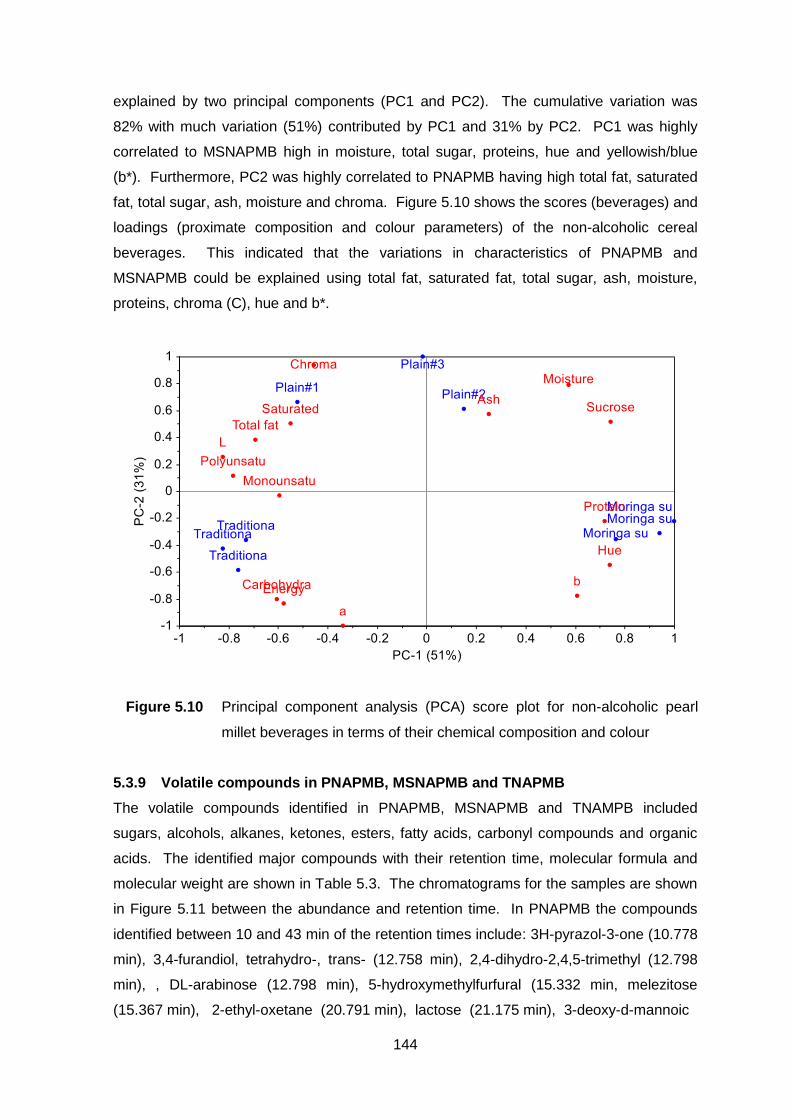
144
explained by two principal components (PC1 and PC2). The cumulative variation was
82% with much variation (51%) contributed by PC1 and 31% by PC2. PC1 was highly
correlated to MSNAPMB high in moisture, total sugar, proteins, hue and yellowish/blue
(b*). Furthermore, PC2 was highly correlated to PNAPMB having high total fat, saturated
fat, total sugar, ash, moisture and chroma. Figure 5.10 shows the scores (beverages) and
loadings (proximate composition and colour parameters) of the non-alcoholic cereal
beverages. This indicated that the variations in characteristics of PNAPMB and
MSNAPMB could be explained using total fat, saturated fat, total sugar, ash, moisture,
proteins, chroma (C), hue and b*.
5.3.9 Volatile compounds in PNAPMB, MSNAPMB and TNAPMB
The volatile compounds identified in PNAPMB, MSNAPMB and TNAMPB included
sugars, alcohols, alkanes, ketones, esters, fatty acids, carbonyl compounds and organic
acids. The identified major compounds with their retention time, molecular formula and
molecular weight are shown in Table 5.3. The chromatograms for the samples are shown
in Figure 5.11 between the abundance and retention time. In PNAPMB the compounds
identified between 10 and 43 min of the retention times include: 3H-pyrazol-3-one (10.778
min), 3,4-furandiol, tetrahydro-, trans- (12.758 min), 2,4-dihydro-2,4,5-trimethyl (12.798
min), , DL-arabinose (12.798 min), 5-hydroxymethylfurfural (15.332 min, melezitose
(15.367 min), 2-ethyl-oxetane (20.791 min), lactose (21.175 min), 3-deoxy-d-mannoic
Figure 5.10 Principal component analysis (PCA) score plot for non-alcoholic pearl
millet beverages in terms of their chemical composition and colour
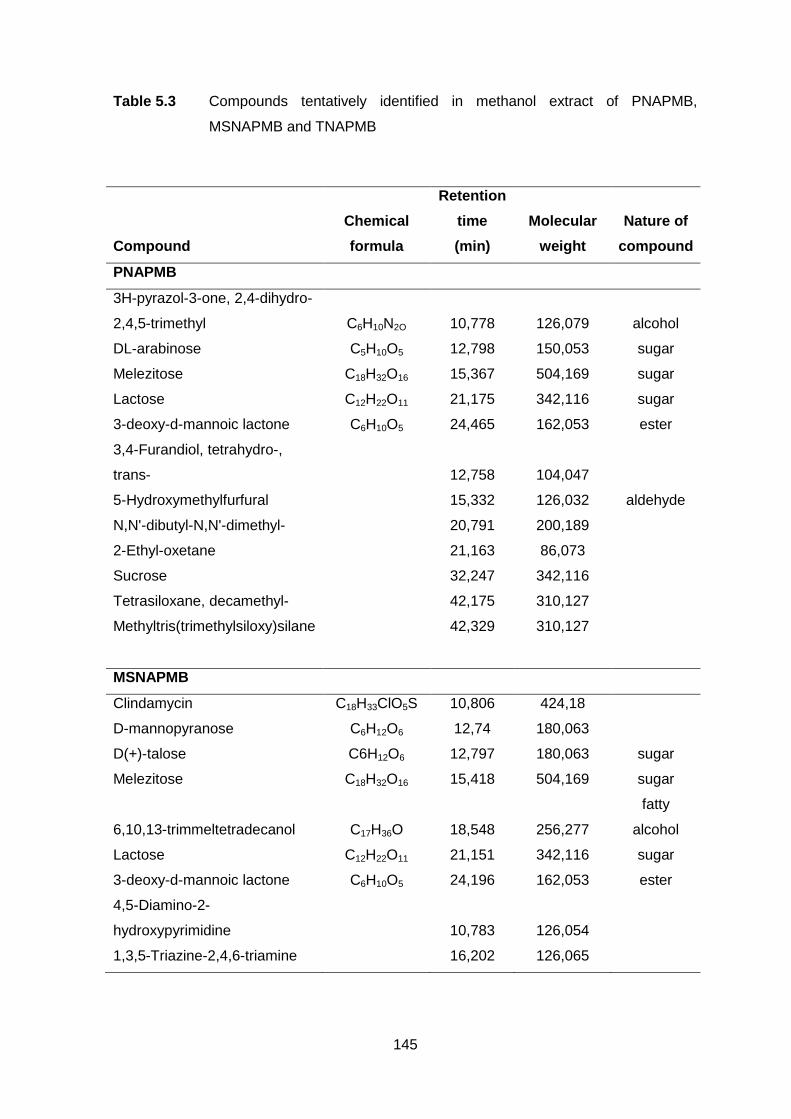
145
Table 5.3 Compounds tentatively identified in methanol extract of PNAPMB,
MSNAPMB and TNAPMB
Compound
Chemical
formula
Retention
time
(min)
Molecular
weight
Nature of
compound
PNAPMB
3H-pyrazol-3-one, 2,4-dihydro-
2,4,5-trimethyl C6H10N2O 10,778 126,079 alcohol
DL-arabinose C5H10O5 12,798 150,053 sugar
Melezitose C18H32O16 15,367 504,169 sugar
Lactose C12H22O11 21,175 342,116 sugar
3-deoxy-d-mannoic lactone C6H10O5 24,465 162,053 ester
3,4-Furandiol, tetrahydro-,
trans-
12,758 104,047
5-Hydroxymethylfurfural
15,332 126,032 aldehyde
N,N'-dibutyl-N,N'-dimethyl-
20,791 200,189
2-Ethyl-oxetane
21,163 86,073
Sucrose
32,247 342,116
Tetrasiloxane, decamethyl-
42,175 310,127
Methyltris(trimethylsiloxy)silane
42,329 310,127
MSNAPMB
Clindamycin C18H33ClO5S 10,806 424,18
D-mannopyranose C6H12O6 12,74 180,063
D(+)-talose C6H12O6 12,797 180,063 sugar
Melezitose C18H32O16 15,418 504,169 sugar
6,10,13-trimmeltetradecanol C17H36O 18,548 256,277
fatty
alcohol
Lactose C12H22O11 21,151 342,116 sugar
3-deoxy-d-mannoic lactone C6H10O5 24,196 162,053 ester
4,5-Diamino-2-
hydroxypyrimidine
10,783 126,054
1,3,5-Triazine-2,4,6-triamine
16,202 126,065
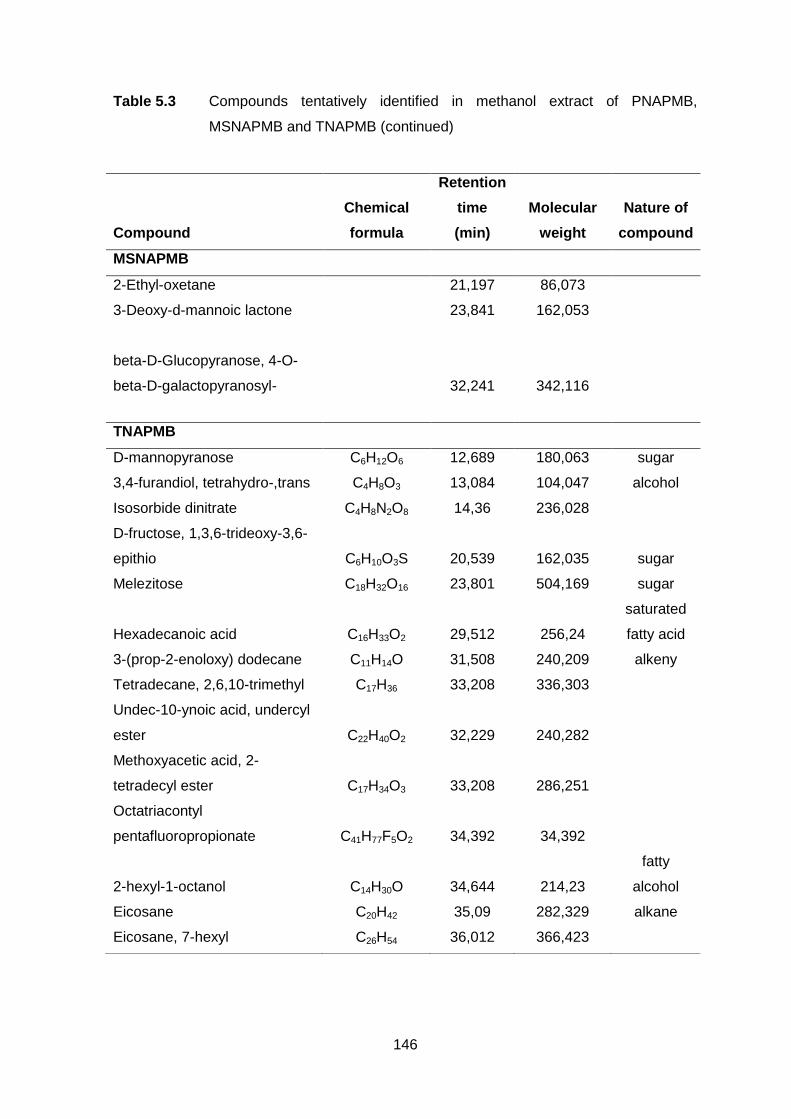
146
Table 5.3 Compounds tentatively identified in methanol extract of PNAPMB,
MSNAPMB and TNAPMB (continued)
Compound
Chemical
formula
Retention
time
(min)
Molecular
weight
Nature of
compound
MSNAPMB
2-Ethyl-oxetane
21,197 86,073
3-Deoxy-d-mannoic lactone
23,841 162,053
beta-D-Glucopyranose, 4-O-
beta-D-galactopyranosyl-
32,241 342,116
TNAPMB
D-mannopyranose C6H12O6 12,689 180,063 sugar
3,4-furandiol, tetrahydro-,trans C4H8O3 13,084 104,047 alcohol
Isosorbide dinitrate C4H8N2O8 14,36 236,028
D-fructose, 1,3,6-trideoxy-3,6-
epithio C6H10O3S 20,539 162,035 sugar
Melezitose C18H32O16 23,801 504,169 sugar
Hexadecanoic acid C16H33O2 29,512 256,24
saturated
fatty acid
3-(prop-2-enoloxy) dodecane C11H14O 31,508 240,209 alkeny
Tetradecane, 2,6,10-trimethyl C17H36 33,208 336,303
Undec-10-ynoic acid, undercyl
ester C22H40O2 32,229 240,282
Methoxyacetic acid, 2-
tetradecyl ester C17H34O3 33,208 286,251
Octatriacontyl
pentafluoropropionate C41H77F5O2 34,392 34,392
2-hexyl-1-octanol C14H30O 34,644 214,23
fatty
alcohol
Eicosane C20H42 35,09 282,329 alkane
Eicosane, 7-hexyl C26H54 36,012 366,423
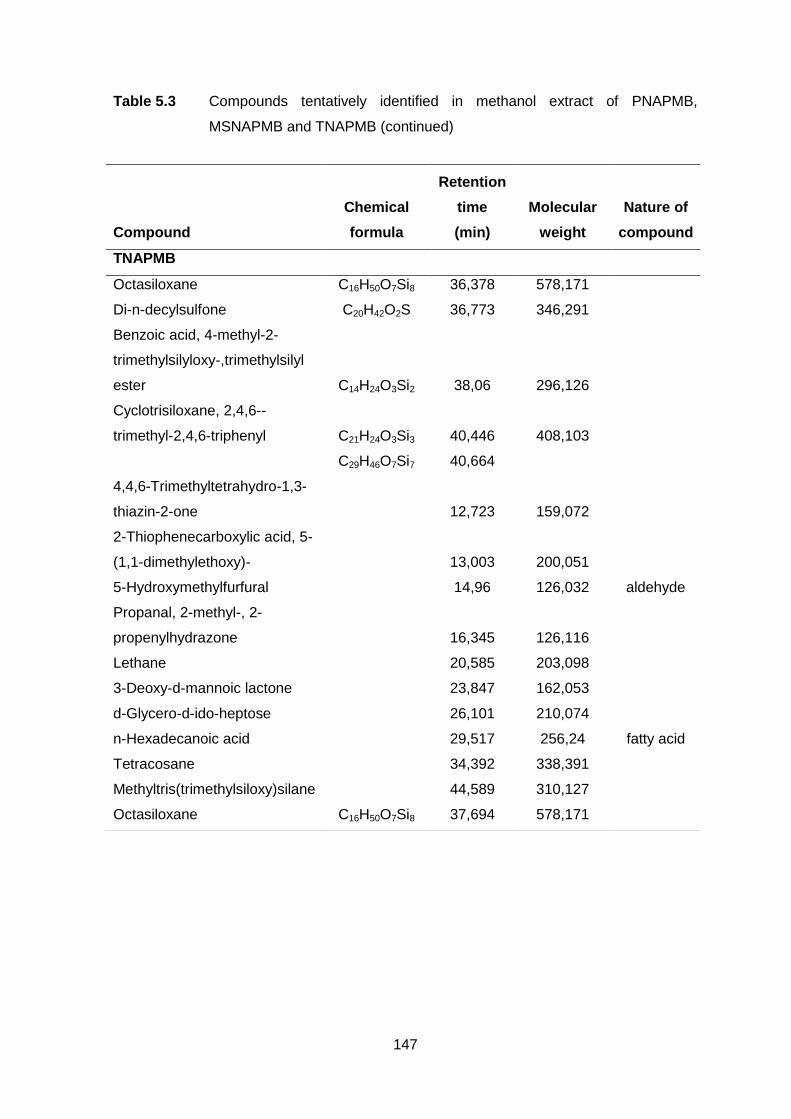
147
Table 5.3 Compounds tentatively identified in methanol extract of PNAPMB,
MSNAPMB and TNAPMB (continued)
Compound
Chemical
formula
Retention
time
(min)
Molecular
weight
Nature of
compound
TNAPMB
Octasiloxane C16H50O7Si8 36,378 578,171
Di-n-decylsulfone C20H42O2S 36,773 346,291
Benzoic acid, 4-methyl-2-
trimethylsilyloxy-,trimethylsilyl
ester C14H24O3Si2 38,06 296,126
Cyclotrisiloxane, 2,4,6--
trimethyl-2,4,6-triphenyl C21H24O3Si3 40,446 408,103
C29H46O7Si7 40,664
4,4,6-Trimethyltetrahydro-1,3-
thiazin-2-one
12,723 159,072
2-Thiophenecarboxylic acid, 5-
(1,1-dimethylethoxy)-
13,003 200,051
5-Hydroxymethylfurfural
14,96 126,032 aldehyde
Propanal, 2-methyl-, 2-
propenylhydrazone
16,345 126,116
Lethane
20,585 203,098
3-Deoxy-d-mannoic lactone
23,847 162,053
d-Glycero-d-ido-heptose
26,101 210,074
n-Hexadecanoic acid
29,517 256,24 fatty acid
Tetracosane
34,392 338,391
Methyltris(trimethylsiloxy)silane
44,589 310,127
Octasiloxane C16H50O7Si8 37,694 578,171
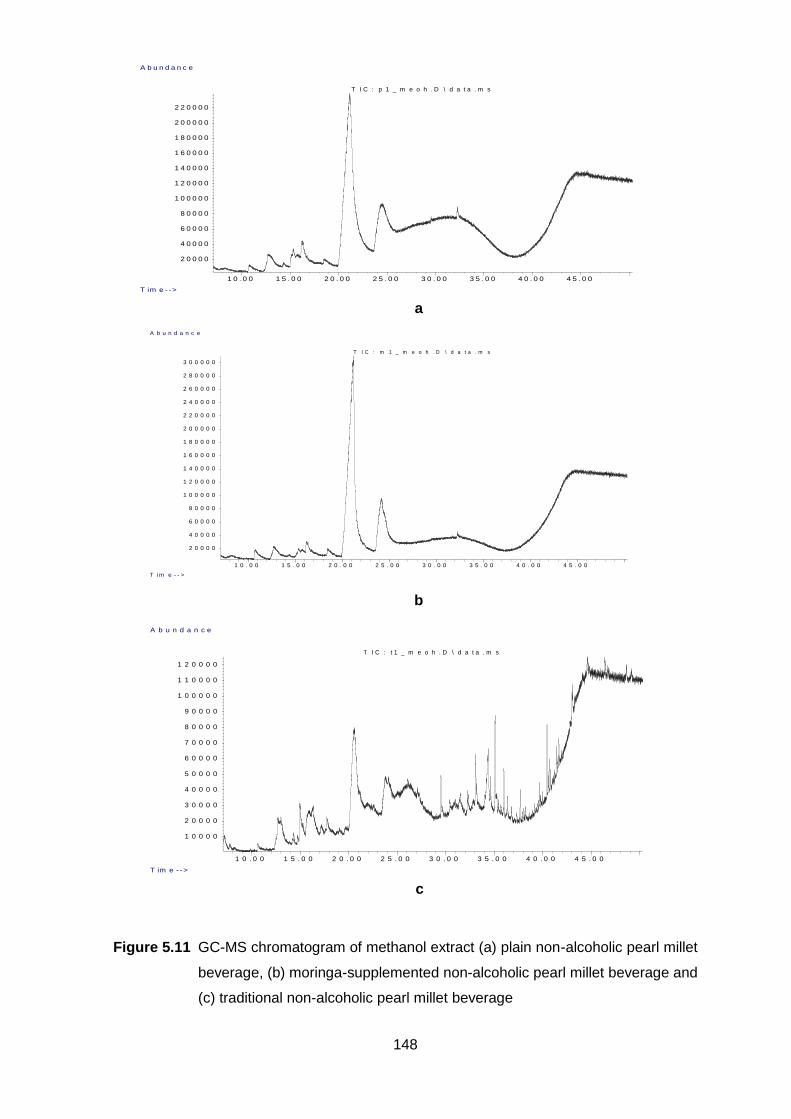
148
Figure 5.11 GC-MS chromatogram of methanol extract (a) plain non-alcoholic pearl millet
beverage, (b) moringa-supplemented non-alcoholic pearl millet beverage and
(c) traditional non-alcoholic pearl millet beverage
1 0 . 0 0 1 5 . 0 0 2 0 . 0 0 2 5 . 0 0 3 0 . 0 0 3 5 . 0 0 4 0 . 0 0 4 5 . 0 0
2 0 0 0 0
4 0 0 0 0
6 0 0 0 0
8 0 0 0 0
1 0 0 0 0 0
1 2 0 0 0 0
1 4 0 0 0 0
1 6 0 0 0 0
1 8 0 0 0 0
2 0 0 0 0 0
2 2 0 0 0 0
T im e - ->
A b u n d a n c e
T I C : p 1 _ m e o h . D \ d a t a . m s
a
1 0 . 0 0 1 5 . 0 0 2 0 . 0 0 2 5 . 0 0 3 0 . 0 0 3 5 . 0 0 4 0 . 0 0 4 5 . 0 0
2 0 0 0 0
4 0 0 0 0
6 0 0 0 0
8 0 0 0 0
1 0 0 0 0 0
1 2 0 0 0 0
1 4 0 0 0 0
1 6 0 0 0 0
1 8 0 0 0 0
2 0 0 0 0 0
2 2 0 0 0 0
2 4 0 0 0 0
2 6 0 0 0 0
2 8 0 0 0 0
3 0 0 0 0 0
T i m e - - >
A b u n d a n c e
T I C : m 1 _ m e o h . D \ d a t a . m s
b
1 0 . 0 0 1 5 . 0 0 2 0 . 0 0 2 5 . 0 0 3 0 . 0 0 3 5 . 0 0 4 0 . 0 0 4 5 . 0 0
1 0 0 0 0
2 0 0 0 0
3 0 0 0 0
4 0 0 0 0
5 0 0 0 0
6 0 0 0 0
7 0 0 0 0
8 0 0 0 0
9 0 0 0 0
1 0 0 0 0 0
1 1 0 0 0 0
1 2 0 0 0 0
T im e - - >
A b u n d a n c e
T I C : t 1 _ m e o h . D \ d a t a . m s
c
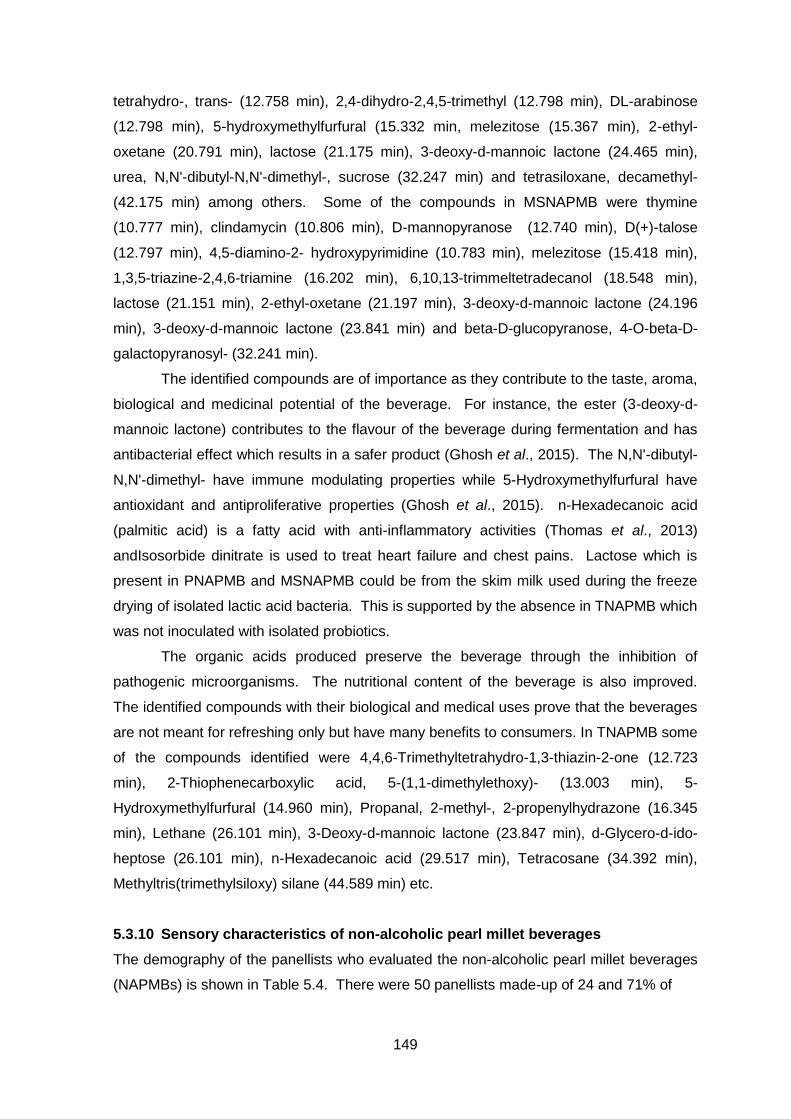
149
tetrahydro-, trans- (12.758 min), 2,4-dihydro-2,4,5-trimethyl (12.798 min), DL-arabinose
(12.798 min), 5-hydroxymethylfurfural (15.332 min, melezitose (15.367 min), 2-ethyl-
oxetane (20.791 min), lactose (21.175 min), 3-deoxy-d-mannoic lactone (24.465 min),
urea, N,N'-dibutyl-N,N'-dimethyl-, sucrose (32.247 min) and tetrasiloxane, decamethyl-
(42.175 min) among others. Some of the compounds in MSNAPMB were thymine
(10.777 min), clindamycin (10.806 min), D-mannopyranose (12.740 min), D(+)-talose
(12.797 min), 4,5-diamino-2- hydroxypyrimidine (10.783 min), melezitose (15.418 min),
1,3,5-triazine-2,4,6-triamine (16.202 min), 6,10,13-trimmeltetradecanol (18.548 min),
lactose (21.151 min), 2-ethyl-oxetane (21.197 min), 3-deoxy-d-mannoic lactone (24.196
min), 3-deoxy-d-mannoic lactone (23.841 min) and beta-D-glucopyranose, 4-O-beta-D-
galactopyranosyl- (32.241 min).
The identified compounds are of importance as they contribute to the taste, aroma,
biological and medicinal potential of the beverage. For instance, the ester (3-deoxy-d-
mannoic lactone) contributes to the flavour of the beverage during fermentation and has
antibacterial effect which results in a safer product (Ghosh et al., 2015). The N,N'-dibutyl-
N,N'-dimethyl- have immune modulating properties while 5-Hydroxymethylfurfural have
antioxidant and antiproliferative properties (Ghosh et al., 2015). n-Hexadecanoic acid
(palmitic acid) is a fatty acid with anti-inflammatory activities (Thomas et al., 2013)
andIsosorbide dinitrate is used to treat heart failure and chest pains. Lactose which is
present in PNAPMB and MSNAPMB could be from the skim milk used during the freeze
drying of isolated lactic acid bacteria. This is supported by the absence in TNAPMB which
was not inoculated with isolated probiotics.
The organic acids produced preserve the beverage through the inhibition of
pathogenic microorganisms. The nutritional content of the beverage is also improved.
The identified compounds with their biological and medical uses prove that the beverages
are not meant for refreshing only but have many benefits to consumers. In TNAPMB some
of the compounds identified were 4,4,6-Trimethyltetrahydro-1,3-thiazin-2-one (12.723
min), 2-Thiophenecarboxylic acid, 5-(1,1-dimethylethoxy)- (13.003 min), 5-
Hydroxymethylfurfural (14.960 min), Propanal, 2-methyl-, 2-propenylhydrazone (16.345
min), Lethane (26.101 min), 3-Deoxy-d-mannoic lactone (23.847 min), d-Glycero-d-ido-
heptose (26.101 min), n-Hexadecanoic acid (29.517 min), Tetracosane (34.392 min),
Methyltris(trimethylsiloxy) silane (44.589 min) etc.
5.3.10 Sensory characteristics of non-alcoholic pearl millet beverages
The demography of the panellists who evaluated the non-alcoholic pearl millet beverages
(NAPMBs) is shown in Table 5.4. There were 50 panellists made-up of 24 and 71% of
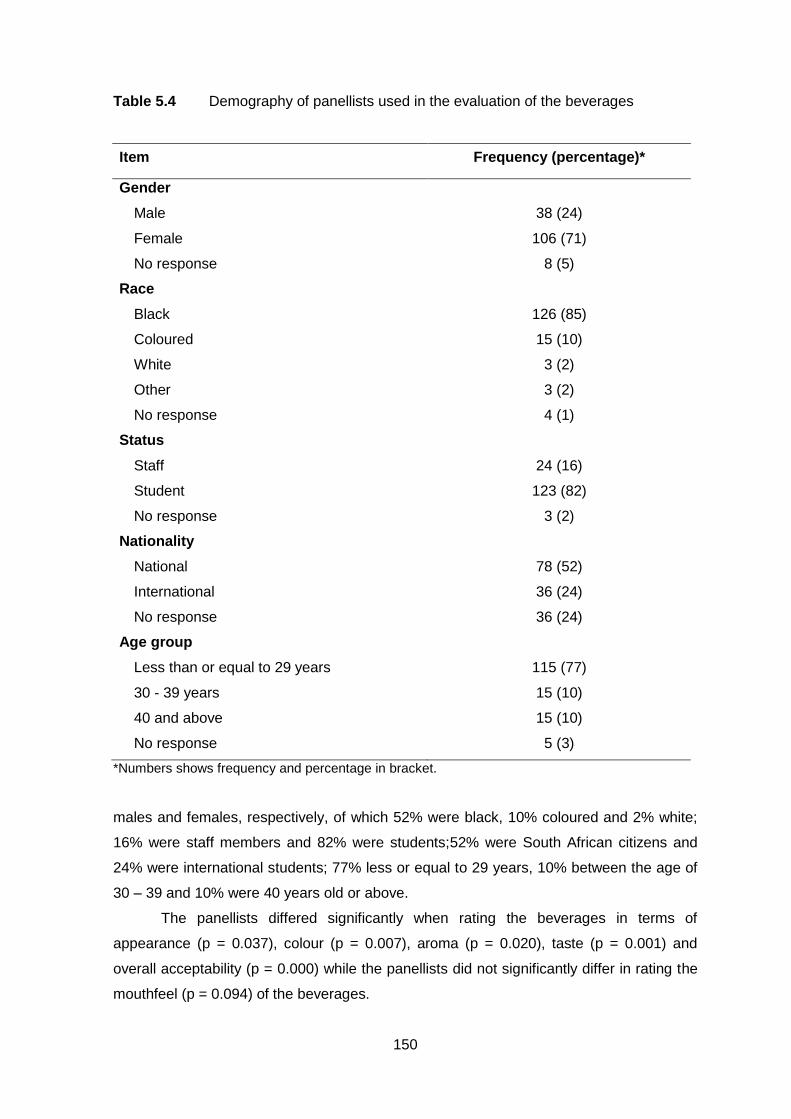
150
Table 5.4 Demography of panellists used in the evaluation of the beverages
Item Frequency (percentage)*
Gender
Male 38 (24)
Female 106 (71)
No response 8 (5)
Race
Black 126 (85)
Coloured 15 (10)
White 3 (2)
Other 3 (2)
No response 4 (1)
Status
Staff 24 (16)
Student 123 (82)
No response 3 (2)
Nationality
National 78 (52)
International 36 (24)
No response 36 (24)
Age group
Less than or equal to 29 years 115 (77)
30 - 39 years 15 (10)
40 and above 15 (10)
No response 5 (3)
*Numbers shows frequency and percentage in bracket.
males and females, respectively, of which 52% were black, 10% coloured and 2% white;
16% were staff members and 82% were students;52% were South African citizens and
24% were international students; 77% less or equal to 29 years, 10% between the age of
30 – 39 and 10% were 40 years old or above.
The panellists differed significantly when rating the beverages in terms of
appearance (p = 0.037), colour (p = 0.007), aroma (p = 0.020), taste (p = 0.001) and
overall acceptability (p = 0.000) while the panellists did not significantly differ in rating the
mouthfeel (p = 0.094) of the beverages.
151
Figure 5.12 shows the sensory parameters of NAPMBs. The mean rating for appearance
of the plain non-alcoholic pearl millet beverage (PNAPMB), moringa-supplemented non-
alcoholic pearl millet beverage (MSNAPMB) and traditional non-alcoholic pearl millet
beverage (TNAPMB) were 5.90, 5.46 and 4.47, respectively. The beverages differed
significantly (p = 0.037) in appearance with PNAPMB being the most preferred. The
mean rating for colour of PNAPMB, MSNAPMB and TNAPMB were 5.77 (liked slightly),
5.61(liked slightly) and 4.84 (neither liked nor disliked), respectively. There was a
significant (p = 0.007) difference in the colour of the beverages.
There was no artificial colorants added in all samples, the PNAPMB was golden
brown, MSNAPMB was greenish-and-golden in colour while TMNAPMB was milky in
colour and appearance. The panellists preferred PNAPMB followed by MSNAPMB and
this could be because the beverages were made from pearl millet extract while the
appearance of TNAPMB could have been affected by starch in the beverage. In addition,
moringa extract powder used in MSNAPMB could have affected the ratings of the
beverage colour and appearance. This is in agreement with Olosunde et al. (2014) report
that a beverage supplemented with moringa seed powder differed significantly in
appearance to a beverage with no moringa seed powder. However, this study used
moringa seed powder instead if moringa leaf powder. In addition, Olosunde et al. (2014)
prepared the beverage using same method for TNAPMB and not PNAPMB. PNAPMB
and MSNAPMB made using pearl millet extract appeared similar to commercial soft
drinks, hence they were preferred. In contrast, TNAPMB still contained particles of starch,
proteins and minerals which could have affected the colour. TNAPMB beverage was
made with no stabilizers and the sedimentation of particles could be attributed to the lower
scores.
The mean score for aroma of PNAPMB was 5.26 (neither liked nor disliked), 4.68
(neither liked nor disliked) for MSNAPMB and 4.23 (disliked slightly) for TNAPMB, hence
the beverages differed significantly (p = 0.020) in aroma. The organic acids and
metabolites produced during fermentation by Leuconostoc mesentoroides and
Pediococcus pentosaceaus could be responsible for the aroma of the beverages.
Indigenous cereal beverages lack flavour which develops during fermentation when
volatile substances (diacetyl, acetic acid, butyric acid, amino acids, aldehydes etc.) are
developed. The unique development of aromas and/or flavour depend on the chemical
composition of substrate (type of cereal, sprouted etc.), environmental condition during
fermentation (pH, temperature, anaerobic/aerobic) and starter culture (Kohajdová &
Karovičová, 2 7). P B was carried out by chance fermentation made up of a
diversity of lactic acid bacteria and other bacteria which could have resulted in the
unacceptable aromas thus
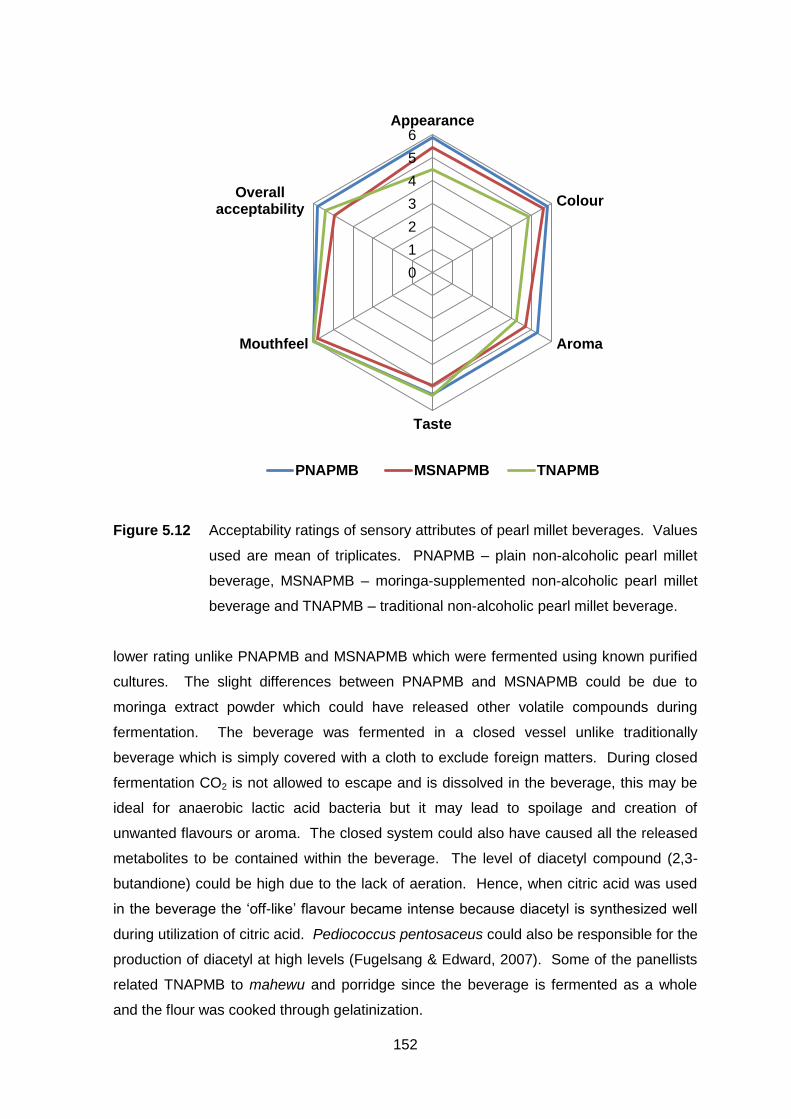
152
Figure 5.12 Acceptability ratings of sensory attributes of pearl millet beverages. Values
used are mean of triplicates. PNAPMB – plain non-alcoholic pearl millet
beverage, MSNAPMB – moringa-supplemented non-alcoholic pearl millet
beverage and TNAPMB – traditional non-alcoholic pearl millet beverage.
lower rating unlike PNAPMB and MSNAPMB which were fermented using known purified
cultures. The slight differences between PNAPMB and MSNAPMB could be due to
moringa extract powder which could have released other volatile compounds during
fermentation. The beverage was fermented in a closed vessel unlike traditionally
beverage which is simply covered with a cloth to exclude foreign matters. During closed
fermentation CO2 is not allowed to escape and is dissolved in the beverage, this may be
ideal for anaerobic lactic acid bacteria but it may lead to spoilage and creation of
unwanted flavours or aroma. The closed system could also have caused all the released
metabolites to be contained within the beverage. The level of diacetyl compound (2,3-
butandione) could be high due to the lack of aeration. Hence, when citric acid was used
in the beverage the ‘off-like’ flavour became intense because diacetyl is synthesized well
during utilization of citric acid. Pediococcus pentosaceus could also be responsible for the
production of diacetyl at high levels (Fugelsang & Edward, 2007). Some of the panellists
related TNAPMB to mahewu and porridge since the beverage is fermented as a whole
and the flour was cooked through gelatinization.
0
1
2
3
4
5
6Appearance
Colour
Aroma
Taste
Mouthfeel
Overallacceptability
PNAPMB MSNAPMB TNAPMB
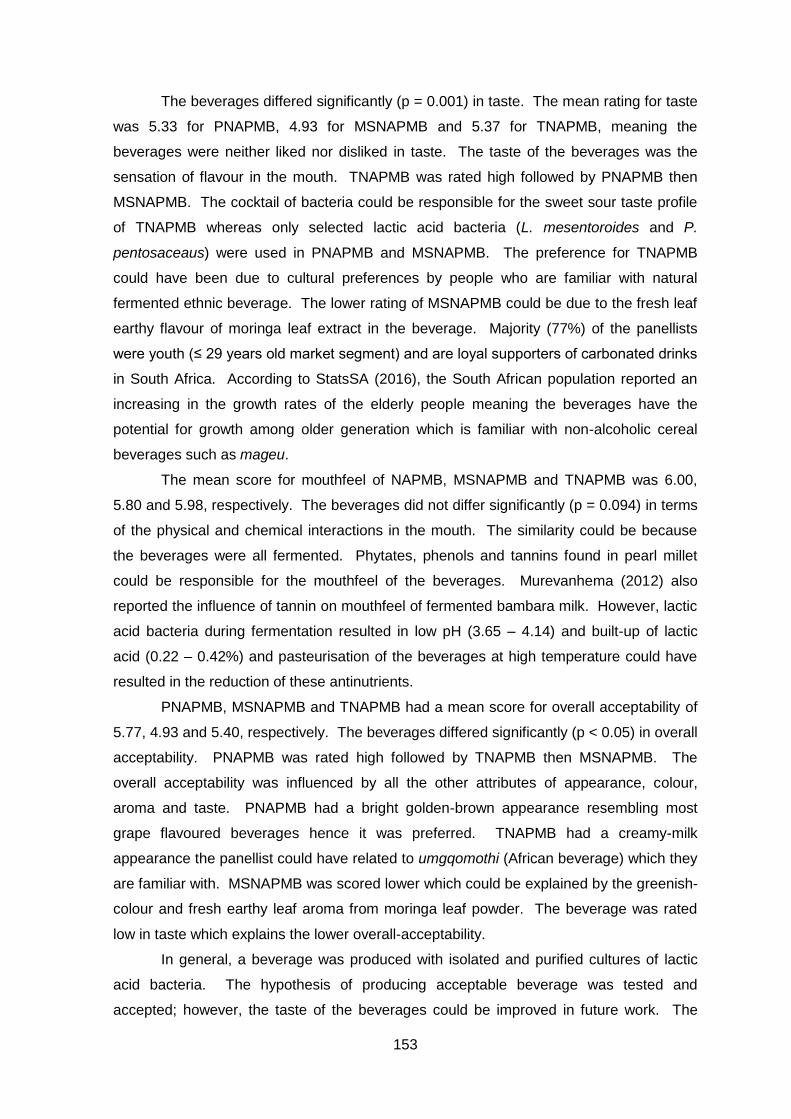
153
The beverages differed significantly (p = 0.001) in taste. The mean rating for taste
was 5.33 for PNAPMB, 4.93 for MSNAPMB and 5.37 for TNAPMB, meaning the
beverages were neither liked nor disliked in taste. The taste of the beverages was the
sensation of flavour in the mouth. TNAPMB was rated high followed by PNAPMB then
MSNAPMB. The cocktail of bacteria could be responsible for the sweet sour taste profile
of TNAPMB whereas only selected lactic acid bacteria (L. mesentoroides and P.
pentosaceaus) were used in PNAPMB and MSNAPMB. The preference for TNAPMB
could have been due to cultural preferences by people who are familiar with natural
fermented ethnic beverage. The lower rating of MSNAPMB could be due to the fresh leaf
earthy flavour of moringa leaf extract in the beverage. Majority (77%) of the panellists
were youth (≤ 29 years old market segment) and are loyal supporters of carbonated drinks
in South Africa. According to StatsSA (2016), the South African population reported an
increasing in the growth rates of the elderly people meaning the beverages have the
potential for growth among older generation which is familiar with non-alcoholic cereal
beverages such as mageu.
The mean score for mouthfeel of NAPMB, MSNAPMB and TNAPMB was 6.00,
5.80 and 5.98, respectively. The beverages did not differ significantly (p = 0.094) in terms
of the physical and chemical interactions in the mouth. The similarity could be because
the beverages were all fermented. Phytates, phenols and tannins found in pearl millet
could be responsible for the mouthfeel of the beverages. Murevanhema (2012) also
reported the influence of tannin on mouthfeel of fermented bambara milk. However, lactic
acid bacteria during fermentation resulted in low pH (3.65 – 4.14) and built-up of lactic
acid (0.22 – 0.42%) and pasteurisation of the beverages at high temperature could have
resulted in the reduction of these antinutrients.
PNAPMB, MSNAPMB and TNAPMB had a mean score for overall acceptability of
5.77, 4.93 and 5.40, respectively. The beverages differed significantly (p < 0.05) in overall
acceptability. PNAPMB was rated high followed by TNAPMB then MSNAPMB. The
overall acceptability was influenced by all the other attributes of appearance, colour,
aroma and taste. PNAPMB had a bright golden-brown appearance resembling most
grape flavoured beverages hence it was preferred. TNAPMB had a creamy-milk
appearance the panellist could have related to umgqomothi (African beverage) which they
are familiar with. MSNAPMB was scored lower which could be explained by the greenish-
colour and fresh earthy leaf aroma from moringa leaf powder. The beverage was rated
low in taste which explains the lower overall-acceptability.
In general, a beverage was produced with isolated and purified cultures of lactic
acid bacteria. The hypothesis of producing acceptable beverage was tested and
accepted; however, the taste of the beverages could be improved in future work. The
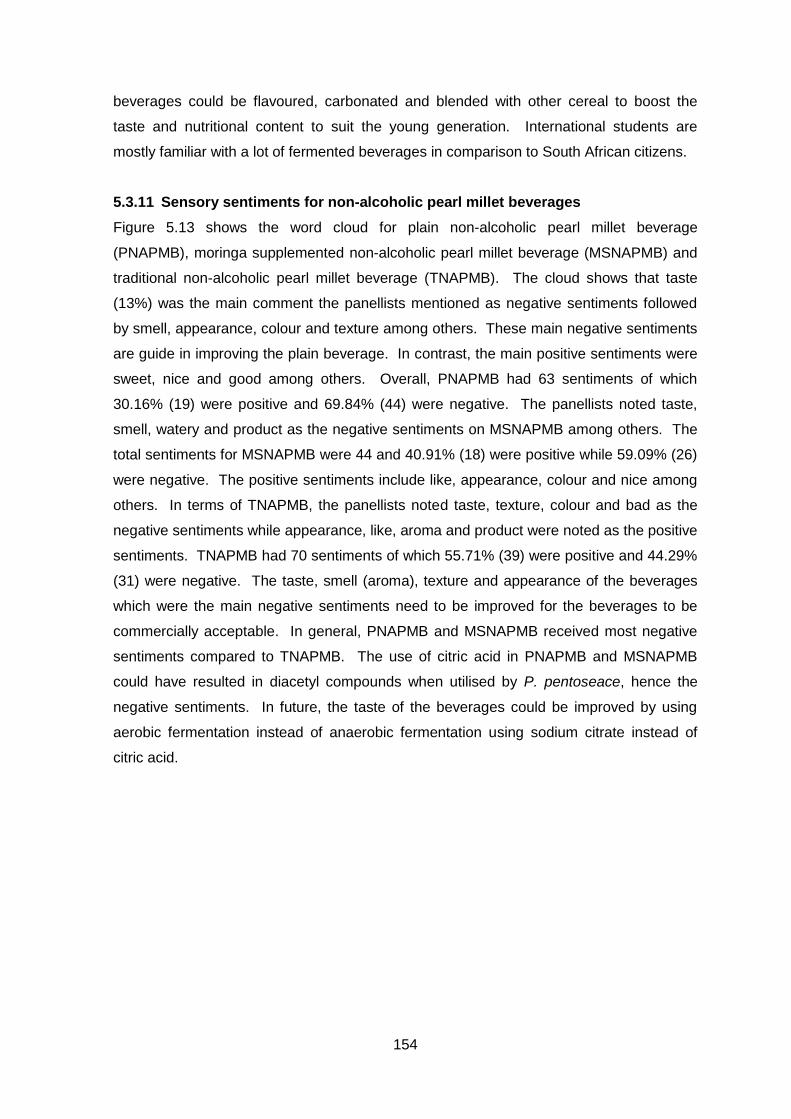
154
beverages could be flavoured, carbonated and blended with other cereal to boost the
taste and nutritional content to suit the young generation. International students are
mostly familiar with a lot of fermented beverages in comparison to South African citizens.
5.3.11 Sensory sentiments for non-alcoholic pearl millet beverages
Figure 5.13 shows the word cloud for plain non-alcoholic pearl millet beverage
(PNAPMB), moringa supplemented non-alcoholic pearl millet beverage (MSNAPMB) and
traditional non-alcoholic pearl millet beverage (TNAPMB). The cloud shows that taste
(13%) was the main comment the panellists mentioned as negative sentiments followed
by smell, appearance, colour and texture among others. These main negative sentiments
are guide in improving the plain beverage. In contrast, the main positive sentiments were
sweet, nice and good among others. Overall, PNAPMB had 63 sentiments of which
30.16% (19) were positive and 69.84% (44) were negative. The panellists noted taste,
smell, watery and product as the negative sentiments on MSNAPMB among others. The
total sentiments for MSNAPMB were 44 and 40.91% (18) were positive while 59.09% (26)
were negative. The positive sentiments include like, appearance, colour and nice among
others. In terms of TNAPMB, the panellists noted taste, texture, colour and bad as the
negative sentiments while appearance, like, aroma and product were noted as the positive
sentiments. TNAPMB had 70 sentiments of which 55.71% (39) were positive and 44.29%
(31) were negative. The taste, smell (aroma), texture and appearance of the beverages
which were the main negative sentiments need to be improved for the beverages to be
commercially acceptable. In general, PNAPMB and MSNAPMB received most negative
sentiments compared to TNAPMB. The use of citric acid in PNAPMB and MSNAPMB
could have resulted in diacetyl compounds when utilised by P. pentoseace, hence the
negative sentiments. In future, the taste of the beverages could be improved by using
aerobic fermentation instead of anaerobic fermentation using sodium citrate instead of
citric acid.
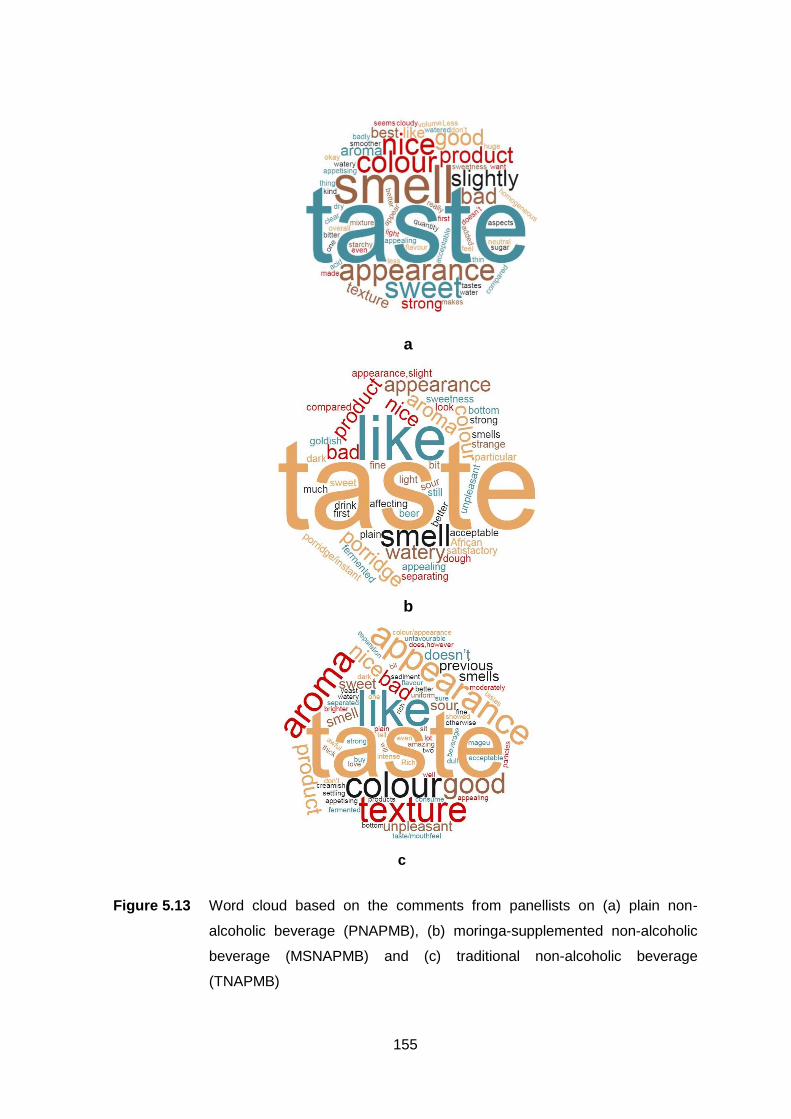
155
Figure 5.13 Word cloud based on the comments from panellists on (a) plain non-
alcoholic beverage (PNAPMB), (b) moringa-supplemented non-alcoholic
beverage (MSNAPMB) and (c) traditional non-alcoholic beverage
(TNAPMB)
a
b
c
156
5.3.12 Conclusion
Two formulations of non-alcoholic pearl millet beverages were produced, namely, plain
non-alcoholic beverage (PNAPMB) and moringa supplemented plain non-alcoholic pearl
millet beverage (MSNAPMB). The two beverages were produced similarly although
moringa concentrate powder was added to one variation to produce MSNAPB. In
addition, traditional non-alcoholic beverage was produced as a control using commonly
followed traditional method. The beverages were produced using Leuconostoc
mesenteroides and Pediococcus pentoseace isolated from traditionally prepared non-
alcoholic pearl millet beverage. The beverages differed in colour with PNAPMB and
MSNAPMB deemed acceptable (liked slightly) by the consumers while PNAPMB was
neither liked nor disliked. The beverages may have biological and medicinal benefits due
to the compounds present in the beverages. Overall, the beverages were accepted by the
consumers; however, the taste of the beverage could be improved. The nutritional
content of the beverages did not differ significantly. The modified non-alcoholic pearl
millet beverages, PNAPMB and MSNAPMB provide 113.23 and 130.23 kJ/100 ml of
energy, respectively. The successful use of isolated and purified cultures of lactic acid
bacteria from the indigenous beverage is an indication that a stable acceptable beverage
could be produced for the commercial market. An acceptable beverage could be
produced using isolated and purified lactic acid bacteria by fermenting pearl millet extract
for 18 h at 37ºC.
157
References
Abegaz, K. (2007). Isolation, characterization and identification of lactic acid bacteria
involved in traditional fermentation of borde, an Ethiopian cereal beverage. African
Journal Biotechnology, 6(12), 1469-1478.
Abimbola, A.N., Adeniyi, R.O. & Faparusi, F. (2013). Microbiological, physicochemical and
sensory assessment of improved Kunun-zaki beverage made from Millet and
stored under different storage conditions. International Journal of Food Safety,
Nutrition, Public Health and Technology, 5(2), 8-13.
Abioye, V.F. & Mo, A. (2015). Proximate composition and sensory properties of moringa
fortified maize-ogi. Journal of Nutrition and Food Sciences, 1-4.
Adelakan, A.O., Alamu, A.E., Arisa, N.U., Adebayo, Y.O. & Dosa, A.S. (2013). Nutritional,
microbiological and sensory characteristics of malted soy- Kunu zaki: an
improved traditional beverage. Advances in Microbiology, 3, 389-397.
AOAC (1980). Official Methods of Analysis, 15th ed. Washington, D.C. Association of
Official Analytical Chemists ISBN 2-93 558 442-0.
AOAC., 2005. Official Method of Analysis (18th Ed.). Association of Official Analytical
Chemists International, Maryland, USA.
Ayo, J.A., Ayo, V.A., Yelmi, B., Onuocha, G. & Ikani, M.O. (2013). Effect of preservatives
on microbiological qualities of Kunun zaki. International Journal of Agricultural
Science Research, 2(5), 124-130.
Azizan, K.A., Ghani, N.H. & Nawawi, M.F. (2015). GC-MS based metabolomics and
multivariate statistical analysis of Wedelia trilobata extracts for the identification of
potential phytochemical properties. Plant Omics Journal, 8(6), 537-543.
Basinskiene, L., Juodeikiene, G., Vidmantiene, D., Tenkanen, M., Makaravicius, T. &
Bartkiene, E. (2016). Non-alcoholic beverages from fermented cereals. Food
Technology and Biotechnology, 54(1), 36-44.
Bogue, J. & Yu, H. (2009). Market-oriented new product development of novel foods: The
case study of functional cereal beverages. Cork, Ireland: Agribusiness discussion
paper. University of College.
Bora, P. (2013). Nutritional properties of different millet types and their selected products.
Ontaria, Canada: MSc Thesis in Food Science. The University of Guelph.
Champagne, C.P., Gardner, N.J. & Lacroix, C. (2007). Fermentation technologies for the
production of exopolysaccharide synthesizing Lactobacillus rhamnosus
concentrated cultures. Electronic Journal of Biotechnology, 10(2). 211-220.
Chisti, Y. (1999). Fermentation (Industrial): Basic considerations. In. Encyclopedia of Food
Microbiology. (edited by R. Robinson, C. Batt & P. Pattel). Pp. 663-674. London:
Academic Press.
158
Fugelsang, K.C. & Edwards, C.G. (2007). Wine microbiology: Practical application and
procedures. Pp. 29-44. Springer.
Garba, H., Shettima, Y.M., Mustapha, B.U.A. & Putaya, H.A.N. (2015). Proximate
composition and phytochemical screening of Moringa oleifera leaves.
Applied Research Journal, 1(9), 470-472.
Ghosh, G., Panda, P., Rath, M., Pal, A., Sharma, T. & das, D. (2015). GC-MS analysis of
bioactive compounds in the methanol extract of Clerodendrum viscosum leaves.
Phamacognosy Research, 7(1), 110-113.
Gyar, S.D., Bala, H. & Reuben, C.R. (2014). Bacteriological quality assessment of
Nigerian non-alcoholic beverage (Kunun-zaki) sold in Keffi Metropolis, Nigeria.
Greener Journal of Microbiology and Antimicrobials ,2(2), 21-25.
Hekmat, H., Morgan, K., Soltani, M., Gouch, R. (2015). Sensory evaluation of locally-
grown fruit purees and inulin fibre on probiotic yogurt in Mwanza, Tanzania and the
microbial analysis of probiotic yogurt fortified with Moringa oleifera. Journal of
Health, Population and Nutrition, 33(1), 60-67.
IBM Corporation (2015). IBM SPSS Statistics for Windows, Version 23.0. Armonk, NY:
IBM Corp.
Igbabul, B.D., Amove, J. & Twadue, I. (2014). Effect of fermentation on the proximate
composition, antinutritional factors and functional properties of cocoyam
(Colocasia esculenta) flour. African Journal of Food Science and Technology, 5(3),
67-74.
Kivanc, M., Yilmaz, Y. & Cakir, E. (2011). Isolation and identification of lactic acid bacteria
from boza and their microbial activity against several reported strains. Tubitak. 35,
313-.324.
Kohajdova, Z. & Karovicova, J. (2007). Fermentation of cereal for specific purpose.
Journal of Food and Nutrition Research, 46(2), 51-57.
Kunasundari, B., Zulkeple, M.F. & Teoh, Y.P. (2017). Screening for direct production of
lactic acid from starch waste by Geobacillus stearothermiphillus. MATEC, 1-6.
Li, B.W., Andrews, K.W. & Pehrsson, P.R. (2002). Individual sugars, soluble, and
insoluble dietary fiber contents of 70 high consumption foods. Journal of Food
Composition and Analysis, 15, 715-723.
Magala, M., Korovicova, J., Greifova, M. & Hojerova, J. (2015). Application of lactic acid
bacteria for production of fermented beverages based on rice flour. Food
Technology and Economy, Engineering and Physical Properties. Czech Journal of
Food Sciences, 33(5). 458-463.
159
Moodley, S. (2015). Investigating the microbiological profile of motoho, a fermented
sorghum beverage. MSc Thesis in Microbiology. University of Pretoria, Pretoria.
South Africa.
Murevanhema, Y. (2012). Evaluation of bambara groundnuts (Vigna subterrenea (L.)
Verdc.) milk fermented with lactic acid bacteria as a probiotics beverage. Cape
Peninsula University of Technology. MTech Thesis in Food Technology. Bellville,
South Africa
Nkama, I., Agarry, O.O. & Akoma, O. (2010). Sensory and nutritional quality
characteristics of powdered ‘Kunun-zaki’: A Nigerian fermented cereal beverage.
African Journal of Food Science, 4(6), 364-370.
Nour, A.A. & Ibrahim, M.A.E.M. (2014). Effect of supplementation with moringa leaves
powder (MLP) and fermentation on chemical composition, total minerals contents
and sensory characteristics of sorghum flour. International Journal of Science and
Research, 5(3). 672-677.
Nour, A.A., Mohamed, A.R., Adiamo, O.Q. & Babiker, E.E. (2016). Changes in protein
nutrition quality as affected by processing of millet supplemented with moringa
seed flour. Journal of the Saudi Society of Agricultural Sciences, 1-7.
Nwachukwu, E.A. Achi, O.K. & Ijeoma, I.O. (2010). Lactic acid bacteria in fermentation of
cereal for the production of indigenous Nigerian foods. African Journal of Food
Science and Technology, 1(2), 21-26.
Ogbonna, A.C., Abuajah, C. I., Akpan, M. F. & Udofia, U. S.. (2013). A comparative study
of the nutritional values of Palmwine and Kunun-zaki. Annals. Food Science and
Technology, 14(1), 39-43.
Olosunde, O.O., Abiodum, O.A., Amanyunose, A.A. & Adepeju, A.B. (2014). Sensory and
nutritional characteristics of kunun-zaki enriched with Moringa (Moringa oleifera)
seed flour. American Journal of Experimental Agriculture, 4(9), 1027-1035.
Oluwole, O.B., Kosoko, S.B., Owolabi, S.O., Adeyoju, A.O., Banko, A.O., Ozumba, A.U. &
Elemo, G.N. (2012). Development and production of high protein and energy
density beverages from blends of maize (Zea mays), sorghum (Sorghum bicolor)
and soybeans (Glycine max) for school aged children: effect of malting period on
selected proximate parameters and sensory. International Journal of Applied
Science and Technology, 2(7), 285-292.
Omemu, A.M. (2011). Fermentation dynamic during production of Ogi, a Nigerian
fermented cereal porridge. Report and Opinion. 3(4), 9-10.
Onaolapo, I.O. & Busari, T. (2014). The Effect of Pasteurization on microbial growth and
sensory qualities of Sekete – a fermented maize beverage. Journal of
Environmental Science, Toxicology and Food Technology, 8(6), 51-54.
160
Oranusia, S.U., Umoh, V.J. & Kwaga, J.K. P. (2003). Hazards and critical control points of
Kunun-zaki, a non-alcoholic beverage in Northern Nigeria. Food Microbiology,
20, 127-132.
Osuntogun, B. & Aboaba, O.O. (2004). Microbiological and Physico-chemical evaluation
of some non-alcoholic beverages. Pakistan Journal of Nutrition, 3(3), 188-192.
Ovando-Martinez, M., Daglioglu, O., Guner, KG., Gecgel, U. & Simsek, S. (2014).
Analysis of the fatty acids and phenolic compounds in a cereal-based
fermented food (Tarhana). Food and Nutrition Sciences, 5, 1177-1184.
Parawira, W., Tuslime, D. & Binomugisha, S. (2012). Microbial and biochemical changes
during production of traditional Rwandanese banana beer 'Urwagwa'.
Fermentation Technology, 1(3). 1-4.
Sarita, E. (2016). Potential functional implications of finger millet (Eleusine coracana) in
nutritional benefits, processing, health and disease: A review. International Journal
of Home Science, 2(1), 151-155.
Simango, C. (2002). Lactic acid fermentation of sour porridge and mahewu, a non-
alcoholic fermented cereal beverage. Journal of Applied Science in Southern
Africa, 8(2). 89-98.
Solange, A., Geogette, K., Gilbert, F., marcellin, D. K. & Bassirou, B. (2014). Review on
African traditional cereal beverages. American Journal of Research
Communication, 2(5), 103-153.
StatsSA. (2016). Stats SA. 55,9 million people in South Africa: Planning for a better
tomorrow: [Internet document]. URL http://www.statssa.gov.za/?p=8176. Accessed
27/06/2017.
Sternenzym.(2011). Production of functional non-alcoholic drinks based on cereals.
Sternenzym. Germany.
Sumarmono, J., Sulistywoti, M. & Soenarto (2015). Fatty acids profiles of fresh milk,
yoghurt and concentrated yoghurt from Pearanakan Etawah goat milk. Procedia
Food Science 3, 216-222.
emitope, .S. & aiyese, .B. (2 2). Quality assessment of ‘oti-oka' like beverage
produced from pearl millet. Journal of Applied Biosciences, 51, 3608-3617.
Terna, G. & Ayo, J.A. (2002). Innovations in the traditional Kunun-zaki production process.
Pakistan Journal of Nutrition, 1(5), 202-205.
Thomas, E., Aneesh, T.P., Thomas, D.G. & Anandan, R. (2013). GC-MS analysis of
phytochemical compounds present in the rhizomes of Nervilia aragoana GAUD.
Asian Journal of Pharmaceutical and Clinical Research, 6(3), 68-74.
161
Uvere, P.O. & Amazikwu, U.C.J. (2011). Processing and evaluation of instant kunun zaki
from millet-cowpea malt and millet-soybean malt. African Journal of Food
Science, 5(14), 761-768.
Weir, E. & McSpadden, C. (2005). Production of industrial enzymes in fermentation. Pp.
1-11.
Widdel, F. (2010). Theory and measurements of bacterial growth. Universitat Bremen.
Win, D. (2005). Oleic acid - the anti-breast cancer component in olive oil. AU Journal of
Technology, 9(2), 75-78.
Yang, P. & Seib, P.A. (1996). Wet milling of grain sorghum using a short steeping period.
Cereal Chemistry, 73(6), 751-755.
162
CHAPTER SIX
GENERAL SUMMARY AND CONCLUSION
The aim of this study was to evaluate the physicochemical, nutritional and sensory
characteristics of non-alcoholic pearl millet beverage produced using pure cultures of
bioburden lactic acid bacteria. The objectives in the study were:
1. Isolation and identification of the microorganisms involved in the fermentation of
pearl millet beverage.
2. Obtain pure cultures of lactic acid bacteria involved in the natural fermentation of
pearl millet beverage.
3. Produce a beverage using isolated and purified lactic acid bacteria.
4. Establish the physical, chemical and viscosity properties of the beverage.
5. Establish the sensory properties of the beverage.
The first and second objectives were successfully accomplished from traditionally
prepared pearl millet beverage. A traditional pearl millet beverage was produced through
spontaneous fermentation at 37°C for 36 h. During fermentation the number of total
viable organisms and lactic acid bacteria were determined at 3 h interval over 36 h
fermentation period. In addition, the lactic acid bacteria were isolated based on the colony
colour and size, and purified by subsequent growth on fresh MRS agar, and identified
using Vitek 2 system. The optimum fermentation time of the beverage was 18 h since
there was not significant growth beyond this period. There was a total of 10 species
identified from traditionally prepared beverage which included Leuconostoc, Pediococcus,
Streptococcus and Enterococcus. These included probiotics and pathogens which may
have a health risk to consumers of the beverage.
The third objective was also achieved successfully using L. mesenteroides ssp.
Dextranicum and P. penotosaceus to produce a beverage. Stable pearl millet extract was
produced by mixing pearl millet flour with water, spices and malted rice flour and
thereafter sieving the mixture. The extract (filtrate) was stabilized using pectin (0.6%) and
lecithin (0.1%). The stability was verified using Turbiscan MA. The extract was
pasteurised and inoculated with pure cultures of L. mesenteroides ssp. Dextranicum and
P. penotosaceus and fermented for 18 h at 37°C. The resulting beverage was chilled at
4°C.
The fourth and last objectives of establishing the physical, chemical, viscosity and
sensory properties of the beverage produced using L. mesenteroides ssp. Dextranicum
and P. penotosaceus was achieved. The beverage was characterised by determining the
proximate composition, colour measurement, volatile compounds produced by the
163
probiotics used. In addition the viscosity of the beverage, total titratable acidity, pH,
growth of probiotics (L. mesenteroides ssp. Dextranicum and P. penotosaceus),
determination of the total sugar content during fermentation and sensory evaluation of the
PNAPMB and MSNAPMB in comparison to traditionally prepared beverage (TNAPMB).
The new beverage was also fortified with extract of moringa leaf powder to increase the
nutritional composition. Since cereals have lower protein content the addition of moringa
increased the protein content of the beverage although not significantly, hence the
concentration of moringa leaf powder could be increased. The beverages have many
benefits beyond hydrating; the volatile compounds identified include antimicrobial, anti-
inflammatory and anti-pathogenic substances. In terms of colour, the beverages differed
significantly. PNAPMB and MSNAPMB had a low viscosity which is beneficial since the
new generation prefer drinks similar to commercially available soft-drink. All the
beverages were neither liked nor disliked, this proves that the new beverage have the
potential to replace the traditional beverage. The taste and aroma could be improved by
adding other cereals and flavourings to remove bad odour produced by the lactic acid
bacteria.
The following challenges and limitation were experienced in the study:
1 Isolation, identification and purification of lactic acid bacteria from pearl
millet slurry
1.1 It was difficult to differentiate lactic acid bacteria (LAB) grown by spread
plate on MRS agar, hence pour and spread plating were used.
1.2 New LAB were isolated from each batch of pearl millet slurry fermentation;
hence only microorganisms identified were used in the study.
2 Production of non-alcoholic pearl millet beverage using purified cultures
2.1 The sieving of pearl millet slurry was difficult and the slurry had sediments
of starch. Pectin was used to stabilise the pearl millet extract.
2.2 Addition of citric acid lowered the pH of the beverage before fermentation.
This has led to reduced fermentation by purified cultures. Sodium citrate
was then used to replace citric acid.
2.3 Maltodextrin was used to give the beverage a rich body but it did not
dissolve fully in the extract and resulted in white precipitate and
unacceptable taste. Therefore, maltodextrin was removed during the
production of the beverage.
2.4 Some cells of LAB precipitated in pearl millet extract during fermentation.
164
3 Production of non-alcoholic pearl millet beverage using purified cultures and
its physicochemical, nutritional and sensory properties
3.1 Supplementation of the beverage with moringa leaf powder produced a
beverage with leafy earthy taste and was acceptable by panellist.
3.2 The sour fermented flavour of the beverage as unacceptable by panellists.
4 In future the following could be of interest
4.1 The use of yoghurt cultures during the fermentation of pearl millet extract
could be used to determine the acceptability of the beverage if
commercially available starter cultures are used.
4.2 Aerobic fermentation instead of anaerobic fermentation could be used to
determine the acceptability of the beverage if different metabolites are
released.
4.3 Supplementation of pearl millet with other cereals such as sorghum and
maize.
4.4 The use of colourants and flavours to mask the unacceptable appearance
and smell of the beverage.
4.5 The use of a better filtration system for extraction of pearl millet extract.
165
Appendix A: Approved ethical clearance
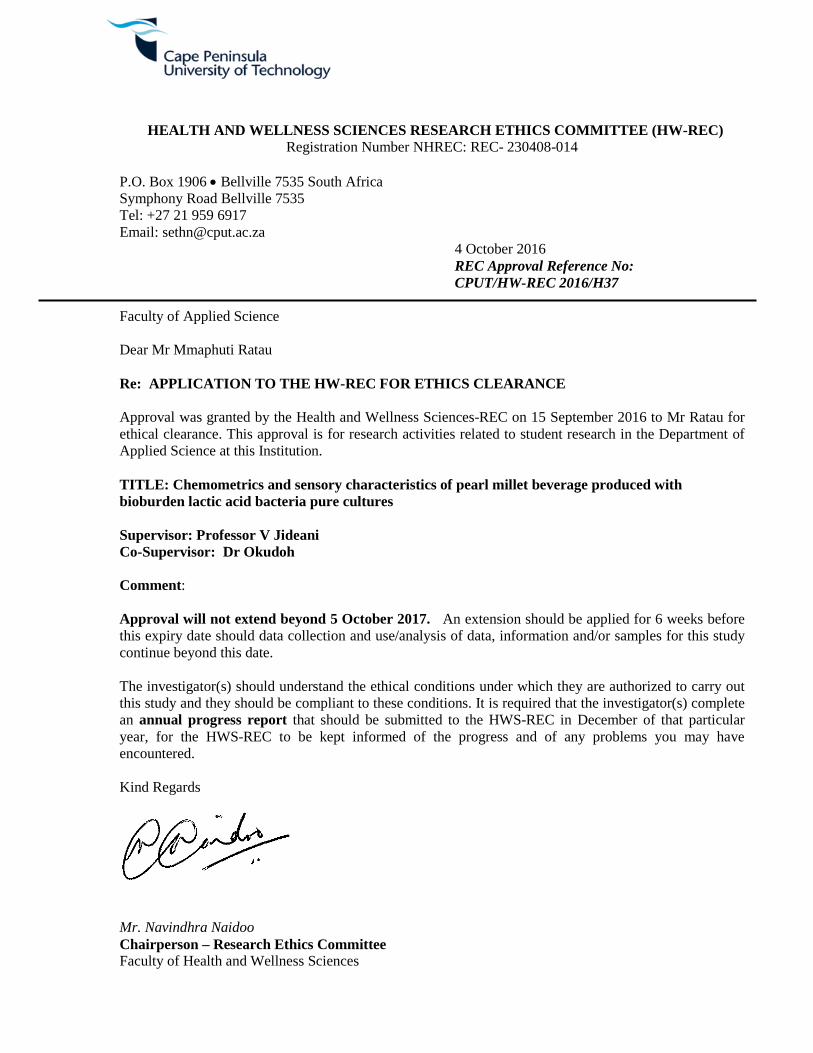
HEALTH AND WELLNESS SCIENCES RESEARCH ETHICS COMMITTEE (HW-REC) Registration Number NHREC: REC- 230408-014
P.O. Box 1906 • Bellville 7535 South Africa Symphony Road Bellville 7535 Tel: +27 21 959 6917 Email: [email protected]
4 October 2016 REC Approval Reference No: CPUT/HW-REC 2016/H37
Faculty of Applied Science Dear Mr Mmaphuti Ratau Re: APPLICATION TO THE HW-REC FOR ETHICS CLEARANCE Approval was granted by the Health and Wellness Sciences-REC on 15 September 2016 to Mr Ratau for ethical clearance. This approval is for research activities related to student research in the Department of Applied Science at this Institution. TITLE: Chemometrics and sensory characteristics of pearl millet beverage produced with bioburden lactic acid bacteria pure cultures Supervisor: Professor V Jideani Co-Supervisor: Dr Okudoh Comment: Approval will not extend beyond 5 October 2017. An extension should be applied for 6 weeks before this expiry date should data collection and use/analysis of data, information and/or samples for this study continue beyond this date. The investigator(s) should understand the ethical conditions under which they are authorized to carry out this study and they should be compliant to these conditions. It is required that the investigator(s) complete an annual progress report that should be submitted to the HWS-REC in December of that particular year, for the HWS-REC to be kept informed of the progress and of any problems you may have encountered. Kind Regards
Mr. Navindhra Naidoo Chairperson – Research Ethics Committee Faculty of Health and Wellness Sciences
167
Appendix B: Informed consent form signed by volunteers prior tasting
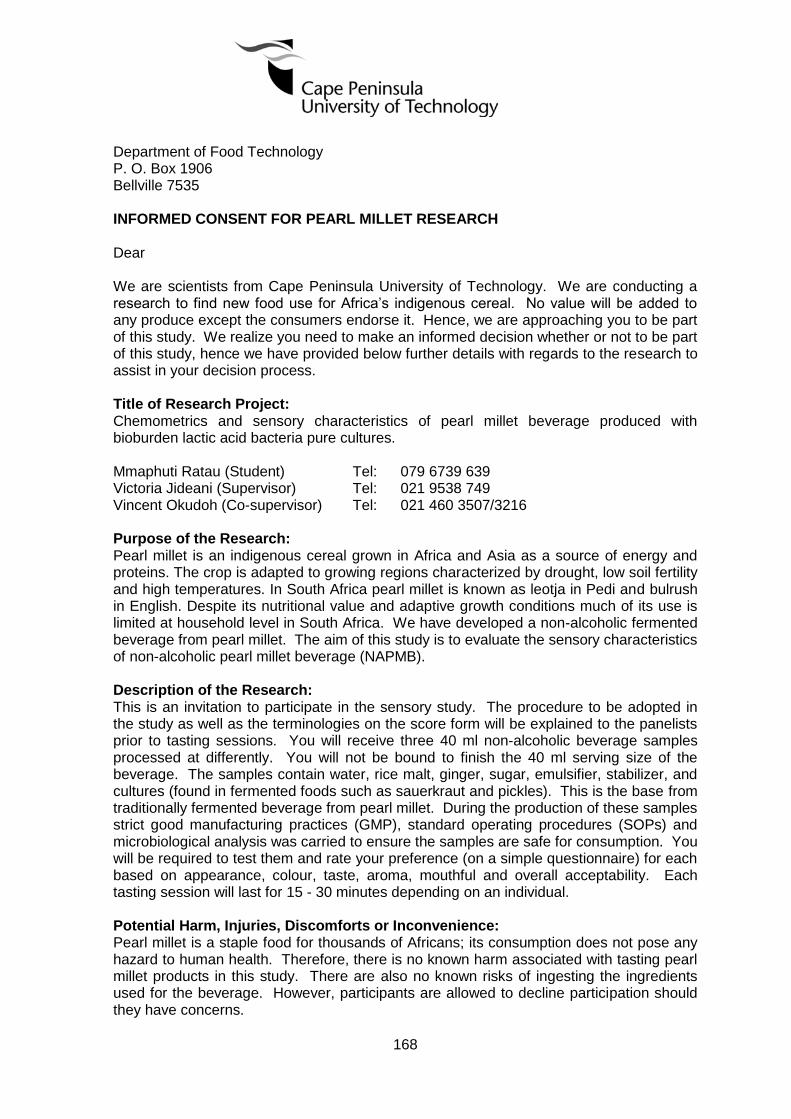
168
Department of Food Technology P. O. Box 1906 Bellville 7535 INFORMED CONSENT FOR PEARL MILLET RESEARCH Dear We are scientists from Cape Peninsula University of Technology. We are conducting a research to find new food use for Africa’s indigenous cereal. No value will be added to any produce except the consumers endorse it. Hence, we are approaching you to be part of this study. We realize you need to make an informed decision whether or not to be part of this study, hence we have provided below further details with regards to the research to assist in your decision process. Title of Research Project: Chemometrics and sensory characteristics of pearl millet beverage produced with bioburden lactic acid bacteria pure cultures. Mmaphuti Ratau (Student) Tel: 079 6739 639 Victoria Jideani (Supervisor) Tel: 021 9538 749 Vincent Okudoh (Co-supervisor) Tel: 021 460 3507/3216 Purpose of the Research: Pearl millet is an indigenous cereal grown in Africa and Asia as a source of energy and proteins. The crop is adapted to growing regions characterized by drought, low soil fertility and high temperatures. In South Africa pearl millet is known as leotja in Pedi and bulrush in English. Despite its nutritional value and adaptive growth conditions much of its use is limited at household level in South Africa. We have developed a non-alcoholic fermented beverage from pearl millet. The aim of this study is to evaluate the sensory characteristics of non-alcoholic pearl millet beverage (NAPMB). Description of the Research: This is an invitation to participate in the sensory study. The procedure to be adopted in the study as well as the terminologies on the score form will be explained to the panelists prior to tasting sessions. You will receive three 40 ml non-alcoholic beverage samples processed at differently. You will not be bound to finish the 40 ml serving size of the beverage. The samples contain water, rice malt, ginger, sugar, emulsifier, stabilizer, and cultures (found in fermented foods such as sauerkraut and pickles). This is the base from traditionally fermented beverage from pearl millet. During the production of these samples strict good manufacturing practices (GMP), standard operating procedures (SOPs) and microbiological analysis was carried to ensure the samples are safe for consumption. You will be required to test them and rate your preference (on a simple questionnaire) for each based on appearance, colour, taste, aroma, mouthful and overall acceptability. Each tasting session will last for 15 - 30 minutes depending on an individual. Potential Harm, Injuries, Discomforts or Inconvenience: Pearl millet is a staple food for thousands of Africans; its consumption does not pose any hazard to human health. Therefore, there is no known harm associated with tasting pearl millet products in this study. There are also no known risks of ingesting the ingredients used for the beverage. However, participants are allowed to decline participation should they have concerns.
169
Potential Benefits: You will not benefit directly from participating in this study. Confidentiality: Confidentiality will be respected and no information that discloses the identity of the participant will be released or published. Participation: Participation in this research is voluntary. If you choose to participate in this study you may withdraw at any time. Contact If you have any questions about this study, please contact: Mmaphuti Ratau (Student) Tel: 079 6739 639 Victoria Jideani (Supervisor) Tel: 021 9538 749 Vincent Okudoh (Co-supervisor) Tel: 021 460 3507/3216 Consent: By signing this form, I agree that:
1. The study was explained to me and all my questions answered. 2. I have the right to participate and the right to stop at any time. 3. I have been told that my personal information will be kept confidential. 4. There is no likely harm from tasting non-alcoholic beverage from pearl millet. 5. I am 18 years or above.
I hereby consent to participate in this study: ............................................................................ ................................................. Name of Participant Signature & Date ............................................................................ ................................................. Name of Researcher Signature & Date
170
Appendix C: Score card used to rate the beverages
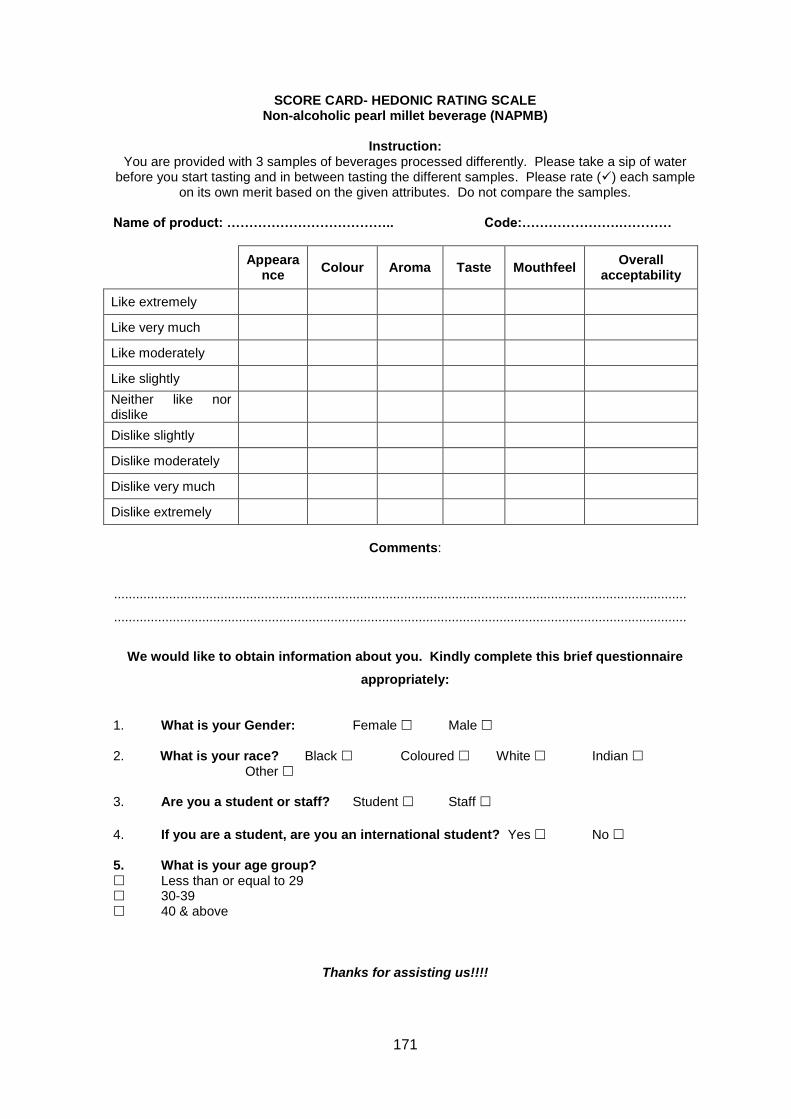
171
SCORE CARD- HEDONIC RATING SCALE Non-alcoholic pearl millet beverage (NAPMB)
Instruction:
You are provided with 3 samples of beverages processed differently. Please take a sip of water before you start tasting and in between tasting the different samples. Please rate () each sample
on its own merit based on the given attributes. Do not compare the samples. Name of product: ……………………………….. Code:………………….…………
Appearance
Colour Aroma Taste Mouthfeel Overall
acceptability
Like extremely
Like very much
Like moderately
Like slightly
Neither like nor dislike
Dislike slightly
Dislike moderately
Dislike very much
Dislike extremely
Comments:
............................................................................................................................................................
............................................................................................................................................................
We would like to obtain information about you. Kindly complete this brief questionnaire
appropriately:
1. What is your Gender: Female Male 2. What is your race? Black Coloured White Indian
Other 3. Are you a student or staff? Student Staff
4. If you are a student, are you an international student? Yes No 5. What is your age group? Less than or equal to 29 30-39 40 & above
Thanks for assisting us!!!!
172
Appendix D: Research outputs presented at national and international
conferences
173
1. Ratau, M.A. & Jideani, V. A. (2014). Dietary fibre extraction from plant
materials - A review U6 Consortium 2nd International Conference, Cape Town,
South Africa, 6 - 10 September 2014. Pp. 26. (Paper presentation).
2. Ratau, M.A. Okudoh, V. I. & Jideani, V.A. Identification, Isolation and
Purification of Lactic Acid Bacteria from African Fermented Non-Alcoholic
Cereal Beverage. Sorghum in the 21st century. Cape Town, South Africa. 9 –
12 April 2018. (poster presentation).
3. Ratau, M.A. Okudoh, V. I. & Jideani, V.A. Fermentation profile of pearl millet
extract with purified bioburden cultures of lactic acid bacteria. Cereals &
Grains 18. London. United Kingdom. 9 – 12 April 2018. (oral presentation).
174
Appendix E: Manuscripts submitted for publication in peer reviewed journals
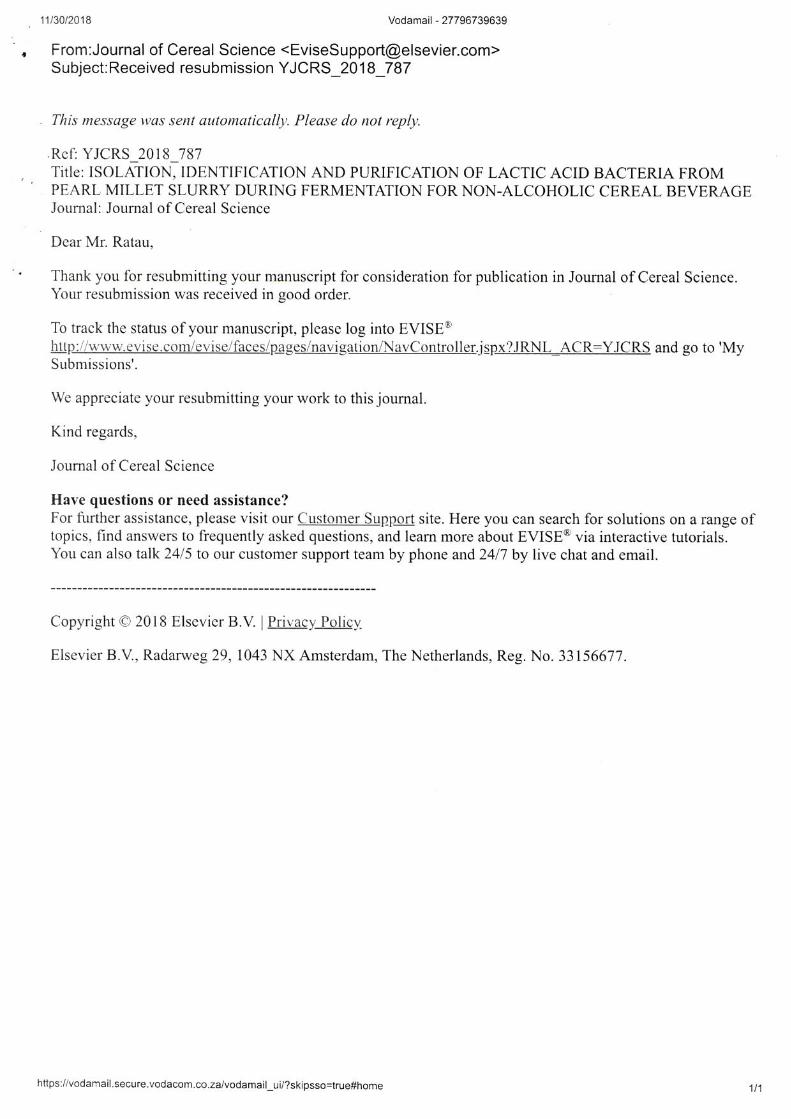
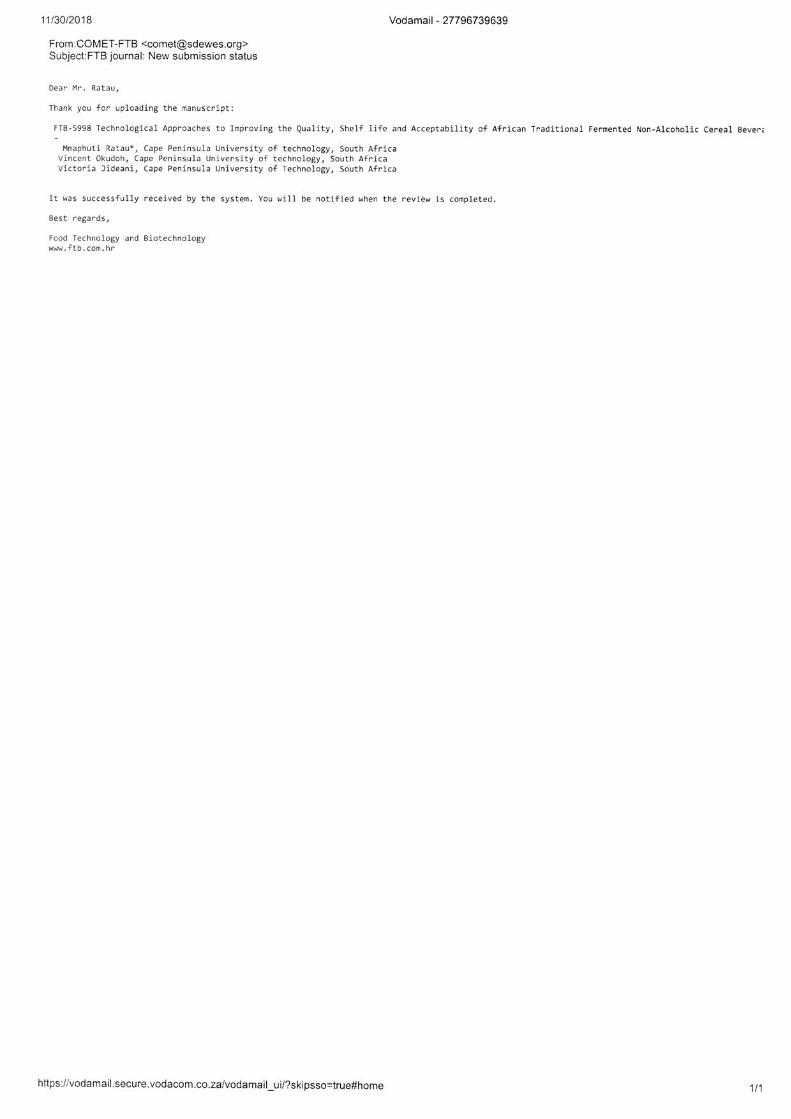
Related Documents