Physical parameterization and sensitivity of urban hydrological models: Application to green roof systems Jiachuan Yang, Zhi-Hua Wang * School of Sustainable Engineering and the Built Environment, Arizona State University, Tempe, AZ 85287, USA article info Article history: Received 13 January 2014 Received in revised form 12 February 2014 Accepted 15 February 2014 Keywords: Hydrological model Sensitivity Green roof Monte Carlo simulations Parameter uncertainty Urban heat island abstract Rapid urbanization has emerged as the source of many adverse environmental effects and brings cities to a vulnerable situation under future climate challenges. Green roofs are proven to be an effective solution to alleviate these effects by field observations under a wide range of climate conditions. Recent advances in modeling urban land-atmosphere interactions provide a useful tool in capturing the dynamics of coupled transport of water and energy in urban conies, thus bridge the gap of modeling at city to regional scales. The performance of urban hydrological models depends heavily on the accurate determination of the input parameter space, where uncertainty is ubiquitous. In this paper, we use an advanced Monte Carlo approach, viz. the Subset Simulation, to quantify the sensitivity of urban hydrological modeling to parameter uncertainties. Results of the sensitivity analysis reveal that green roofs exhibit markedly different thermal and hydrological behavior as compared to conventional roofs, due to the modification of the surface energy portioning by well-irrigated vegetation. In addition, statistical predictions of critical responses of green roofs (extreme surface temperature, heat fluxes, etc.) have relatively weak depen- dence on climatic conditions. The statistical quantification of sensitivity provides guidance for future development of urban hydrological models with practical applications such as urban heat island mitigation. Ó 2014 Elsevier Ltd. All rights reserved. 1. Introduction To date, more than 50% of the world’s populations are living in cities and the percentage continues to increase with undergoing urbanization process, especially in developing countries [1]. Rapid urbanization has emerged as the source of many adverse effects such as urban heat island (UHI) [2], storm floods [3], air pollution [4], increased building energy consumption [5], disruption of ecosystem [6], etc. These effects pose stringent constraints on en- ergy and water sustainability and bring cities to a vulnerable situ- ation under future climate challenge [7,8]. Green roofs, rooftop structures with vegetation, have been proved as an effective solu- tion to alleviate some of these adverse effects, by improving stormwater management, reducing energy usage, mitigating heat island, improving air quality, and accommodating native wildlife habitat [9,10,56,57]. These benefits have been observed under a wide range of climate conditions through field observations [11e 14]. Broadly, green roofs can be classified into two major types by their characteristics: intensive and extensive roofs. Intensive green roofs are usually associated with roof gardens and feature a variety of vegetation species [15]. A relatively deep layer of soil and frequent maintenance are required for this type. Extensive green roofs have relatively thin layers of soil and are designed to be virtually self-sustaining with minimum maintenance [16]. Popular across Europe over the last few decades, green roofs are now becoming more familiar to North Americans with studies and implementations of green roof projects in a number of cities [9]. While recent years have seen rapidly increasing number of studies on green infrastructure, particularly green roofs, nearly all of them have been limited to either field measurements at very small (e.g. a single roof) or simulation results at very large (continental or global) scales, leaving the gap widely open at city and regional scales. Pioneering work on studying city and regional scale cooling effect to reduce UHI has resorted to remotely sensed imagery using, e.g. Landsat TM [17]. The lack of city scale modeling of green roofs is partly owing to the sensitivity of green roof performance to a va- riety of parameters, such as ambient environments, vegetation specie and soil property, etc. Therefore, for city planners or decision makers to develop general guidance on green roof implementation * Corresponding author. Tel.: þ1 480 727 2933; fax: þ1 480 965 0577. E-mail addresses: [email protected], [email protected] (Z.-H. Wang). Contents lists available at ScienceDirect Building and Environment journal homepage: www.elsevier.com/locate/buildenv http://dx.doi.org/10.1016/j.buildenv.2014.02.006 0360-1323/Ó 2014 Elsevier Ltd. All rights reserved. Building and Environment 75 (2014) 250e263

Welcome message from author
This document is posted to help you gain knowledge. Please leave a comment to let me know what you think about it! Share it to your friends and learn new things together.
Transcript
lable at ScienceDirect
Building and Environment 75 (2014) 250e263
Contents lists avai
Building and Environment
journal homepage: www.elsevier .com/locate/bui ldenv
Physical parameterization and sensitivity of urban hydrologicalmodels: Application to green roof systems
Jiachuan Yang, Zhi-Hua Wang*
School of Sustainable Engineering and the Built Environment, Arizona State University, Tempe, AZ 85287, USA
a r t i c l e i n f o
Article history:Received 13 January 2014Received in revised form12 February 2014Accepted 15 February 2014
Keywords:Hydrological modelSensitivityGreen roofMonte Carlo simulationsParameter uncertaintyUrban heat island
* Corresponding author. Tel.: þ1 480 727 2933; faxE-mail addresses: [email protected], wzh.wang@gm
http://dx.doi.org/10.1016/j.buildenv.2014.02.0060360-1323/� 2014 Elsevier Ltd. All rights reserved.
a b s t r a c t
Rapid urbanization has emerged as the source of many adverse environmental effects and brings cities toa vulnerable situation under future climate challenges. Green roofs are proven to be an effective solutionto alleviate these effects by field observations under a wide range of climate conditions. Recent advancesin modeling urban land-atmosphere interactions provide a useful tool in capturing the dynamics ofcoupled transport of water and energy in urban conies, thus bridge the gap of modeling at city to regionalscales. The performance of urban hydrological models depends heavily on the accurate determination ofthe input parameter space, where uncertainty is ubiquitous. In this paper, we use an advanced MonteCarlo approach, viz. the Subset Simulation, to quantify the sensitivity of urban hydrological modeling toparameter uncertainties. Results of the sensitivity analysis reveal that green roofs exhibit markedlydifferent thermal and hydrological behavior as compared to conventional roofs, due to the modificationof the surface energy portioning by well-irrigated vegetation. In addition, statistical predictions of criticalresponses of green roofs (extreme surface temperature, heat fluxes, etc.) have relatively weak depen-dence on climatic conditions. The statistical quantification of sensitivity provides guidance for futuredevelopment of urban hydrological models with practical applications such as urban heat islandmitigation.
� 2014 Elsevier Ltd. All rights reserved.
1. Introduction
To date, more than 50% of the world’s populations are living incities and the percentage continues to increase with undergoingurbanization process, especially in developing countries [1]. Rapidurbanization has emerged as the source of many adverse effectssuch as urban heat island (UHI) [2], storm floods [3], air pollution[4], increased building energy consumption [5], disruption ofecosystem [6], etc. These effects pose stringent constraints on en-ergy and water sustainability and bring cities to a vulnerable situ-ation under future climate challenge [7,8]. Green roofs, rooftopstructures with vegetation, have been proved as an effective solu-tion to alleviate some of these adverse effects, by improvingstormwater management, reducing energy usage, mitigating heatisland, improving air quality, and accommodating native wildlifehabitat [9,10,56,57]. These benefits have been observed undera wide range of climate conditions through field observations[11e14].
: þ1 480 965 0577.ail.com (Z.-H. Wang).
Broadly, green roofs can be classified into two major types bytheir characteristics: intensive and extensive roofs. Intensive greenroofs are usually associated with roof gardens and feature a varietyof vegetation species [15]. A relatively deep layer of soil andfrequent maintenance are required for this type. Extensive greenroofs have relatively thin layers of soil and are designed to bevirtually self-sustaining with minimum maintenance [16]. Popularacross Europe over the last few decades, green roofs are nowbecoming more familiar to North Americans with studies andimplementations of green roof projects in a number of cities [9].While recent years have seen rapidly increasing number of studieson green infrastructure, particularly green roofs, nearly all of themhave been limited to either field measurements at very small (e.g. asingle roof) or simulation results at very large (continental orglobal) scales, leaving the gap widely open at city and regionalscales. Pioneering work on studying city and regional scale coolingeffect to reduce UHI has resorted to remotely sensed imagery using,e.g. Landsat TM [17]. The lack of city scale modeling of green roofs ispartly owing to the sensitivity of green roof performance to a va-riety of parameters, such as ambient environments, vegetationspecie and soil property, etc. Therefore, for city planners or decisionmakers to develop general guidance on green roof implementation
J. Yang, Z.-H. Wang / Building and Environment 75 (2014) 250e263 251
at large scales, accurate models that well capture energy as well aswater budgets on green roofs are necessary.
As green roofs are installed in the built environment, their nu-merical simulations necessarily require a good representation ofurban surface processes and land-atmosphere interactions. Duringthe past decade, numerous urban canopy models (UCM) have beendeveloped focusing on the dynamics of energy transport in theurban canopy layer [18e21]. By explicitly resolving urban geometryas a big “street canyon” [22], most of the UCMs are generally goodin reproducing energy budgets but are inevitably inadequate incapturing the dynamics of urban water budgets owing to theoversimplified representation of complex urban hydrological pro-cesses [23e25]. For example, Kusaka et al. [19] used hypothesizedsaturated surface with an evaporative parameter to representvegetated surfaces in cities. Lee [20] included tall trees and grasssurface in his hydrological model but subsurface water transportwas neglected. In this paper, we adopt a physical urban hydrolog-ical model, developed recently by Wang et al. [26], to simulategreen urban infrastructure. Compared to previous schemes [19e21], main developments in the model include detailed descriptionof natural and engineered surfaces, consideration of subsurfacewater transport and sub-facet heterogeneity resolution. Sun et al.[27] replaced the homogeneous single-layer roof module withinthe model to enable the simulation of hygrothermal dynamics inmulti-layer green roof system. Vertical transport and distribution ofsoil water content in a green roof were then resolved in discretizedlayers. Inter-layer heat fluxes in a green roof system are computedby a spatially-analytical scheme using Green’s function approach[28]. Spurious numerical oscillation due to temperature disconti-nuities at the interface can be avoided with this scheme. This hy-drological model was integrated into a single-layer UCM to fullycapture the surface and subsurface energy and water transport inthe built environment. Capability of the model had been validatedby field measurements under different climate conditions [26e28].
Though the coupled UCM-hydrology framework is generallysuitable for modeling various green roof designs, its performancedepends largely on the accuracy of the input parameters [29,30].Currently detailed field measurements of all input parameters ofthe model at various scales of applications are rarely possible. Inputparameters related to vegetation types and soil properties in urbanhydrological modeling vary widely for different green infrastruc-ture. In addition, manufacturers of green roofs usually keep thetechnical information confidential to achieve competitive advan-tage. As a result, uncertainties inherent in the input parameterspace of the hydrological model inevitably impair the quality ofmodel performance.
This paper seeks to shed new light on the impact of parameteruncertainties on green roof modeling with twomain objectives: (1)to investigate the sensitivity of the integrated UCM-hydrologymodel to various uncertain input parameters; and (2) to evaluatecritical responses of green roofs under different scenarios(geographical locations, weather conditions, and vegetation coverfractions). The challenge of characterizing unsaturated hydraulicproperties of soils adds to the complexity of numerical modeling.Cuenca et al. [31] showed that for bare soils, the parameterization ofsoil water transport had significant effect on evaporation process.Accurate estimates of soil hydraulic properties are of paramountimportance in regulating land-atmosphere interactions and deter-mining the land surface states [32,33]. In particular, properties suchas hydraulic diffusivity and conductivity are highly nonlinear to soilmoisture q, which can vary by several orders of magnitude even forvery small changes in q, especially under relatively dry condition[34]. In this study, we adopt two widely used unsaturated soil hy-draulic models and compare their performance in the integratedUCM-hydrology framework before the sensitivity analysis, namely
the van Genuchten model (hereafter referred to as the vG model)[34] and the empirical soil hydraulic model developed by Clapp andHornberger [35] and Cosby et al. [36] (hereafter referred to as theCHC model). Note that the CHC model has been adopted formodeling soil hydraulics in the Weather Research and Forecasting(WRF) model [32].
Analyzing model sensitivity to parameter uncertainty is com-mon in environmental studies [37,38]. In conventional approach,the sensitivity of model output to an individual parameter is ob-tained by changing the values of that particular parameter whilethe rest parameters remain fixed. However, statistical correlationsbetween the uncertain parameters from such approach can bebiased towards the chosen base scenario [30]. In this paper, we usean advancedMonte Carlo simulation tool, i.e. the Subset Simulation[39], to conduct the sensitivity analysis. Subset Simulation is anadaptive stochastic simulation procedure that is particularly effi-cient in capturing critical events associated with small probabilities(i.e. risk analysis) and the uncertain parameter space of large di-mensions. It has been applied over a broad range of engineeringproblems such as seismic risk analysis [40], fire risk analysis [41]and dynamics [42]. In the context of green roof study, assessmentof critical responses of a roof system under local climate conditionsmanifests its effectiveness and is of great interest to manufacturer,city planner and households.
In the next section, we describe the basis of the urban hydro-logical model, unsaturated soil hydraulic models, and the advancedMonte Carlo simulation. Statistics of uncertain parameters in thisstudy are summarized in Section 3. Model evaluation againstobservational dataset is demonstrated in Section 4. Section 5 showsthe comparison between performances of two soil hydraulicmodels integrated in the hydrological model. Sensitivity of greenroof modeling to uncertain parameters and critical performanceunder different weather conditions are discussed in Section 6, fol-lowed by concluding remarks in Section 7.
2. Methodology
2.1. Urban hydrological model
In this section, the urban hydrological model and the embeddedunsaturated soil hydraulic models are briefly explained. Only pa-rameterizations relevant to this study are discussed below, whiledetailed description can be found in original papers [26,27,34,36]. Aschematic of the UCM is shown in Fig. 1(b). Building arrays arerepresented as one-dimensional (1D) infinite street canyons withequal heights on both sides. In Fig. 1(b), it clearly illustrates that theUCM takes the surface heterogeneity of urban terrain into accountby dividing urban facets (roof, wall and ground) into sub-facets. Inthis paper, we categorize roof surface into two types: the green roofand the engineered roof (schematic is shown in Fig. 1(a)). As shownin Fig. 1(a), the green roof has three additional layers of variousmaterials on top of the concrete deck, namely the vegetation-soil,the growing media and the drainage layers. These layers consistof porous materials and their volumetric water content q iscomputed by vertically discretizing the layer. At the top layer, theinfiltration I is calculated by:
I ¼ min½P;KðqÞ�; (1)
where P is the precipitation and K(q) denotes the q-dependenthydraulic conductivity. The surface runoff R is then calculated as theresidual water budget:
R ¼ P � I � ET ; (2)
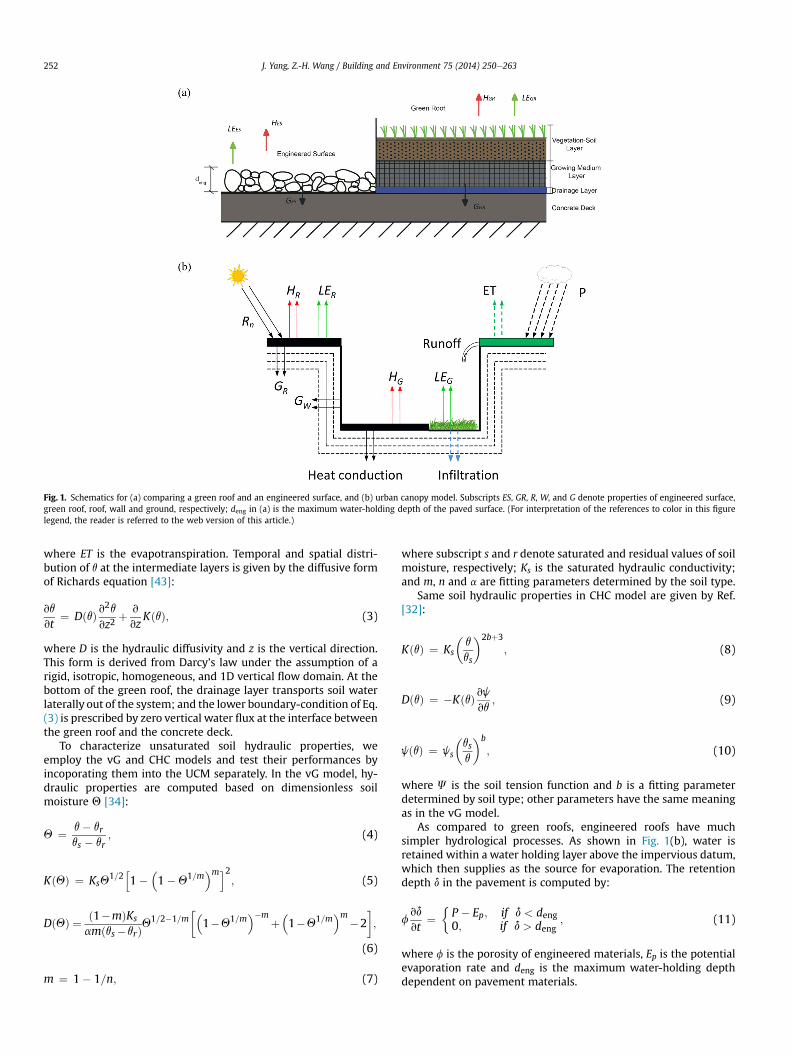
Fig. 1. Schematics for (a) comparing a green roof and an engineered surface, and (b) urban canopy model. Subscripts ES, GR, R, W, and G denote properties of engineered surface,green roof, roof, wall and ground, respectively; deng in (a) is the maximum water-holding depth of the paved surface. (For interpretation of the references to color in this figurelegend, the reader is referred to the web version of this article.)
J. Yang, Z.-H. Wang / Building and Environment 75 (2014) 250e263252
where ET is the evapotranspiration. Temporal and spatial distri-bution of q at the intermediate layers is given by the diffusive formof Richards equation [43]:
vq
vt¼ DðqÞ v
2q
vz2þ v
vzKðqÞ; (3)
where D is the hydraulic diffusivity and z is the vertical direction.This form is derived from Darcy’s law under the assumption of arigid, isotropic, homogeneous, and 1D vertical flow domain. At thebottom of the green roof, the drainage layer transports soil waterlaterally out of the system; and the lower boundary-condition of Eq.(3) is prescribed by zero vertical water flux at the interface betweenthe green roof and the concrete deck.
To characterize unsaturated soil hydraulic properties, weemploy the vG and CHC models and test their performances byincoporating them into the UCM separately. In the vG model, hy-draulic properties are computed based on dimensionless soilmoisture Q [34]:
Q ¼ q� qrqs � qr
; (4)
KðQÞ ¼ KsQ1=2
h1�
�1�Q1=m
�mi2; (5)
DðQÞ ¼ ð1�mÞKs
amðqs�qrÞQ1=2�1=m
��1�Q1=m
��mþ�1�Q1=m
�m�2�;
(6)
m ¼ 1� 1=n; (7)
where subscript s and r denote saturated and residual values of soilmoisture, respectively; Ks is the saturated hydraulic conductivity;and m, n and a are fitting parameters determined by the soil type.
Same soil hydraulic properties in CHC model are given by Ref.[32]:
KðqÞ ¼ Ks
�q
qs
�2bþ3
; (8)
DðqÞ ¼ �KðqÞ vjvq
; (9)
jðqÞ ¼ js
�qsq
�b
; (10)
where J is the soil tension function and b is a fitting parameterdetermined by soil type; other parameters have the same meaningas in the vG model.
As compared to green roofs, engineered roofs have muchsimpler hydrological processes. As shown in Fig. 1(b), water isretained within a water holding layer above the impervious datum,which then supplies as the source for evaporation. The retentiondepth d in the pavement is computed by:
fvd
vt¼
�P � Ep; if d < deng0; if d > deng
; (11)
where f is the porosity of engineered materials, Ep is the potentialevaporation rate and deng is the maximum water-holding depthdependent on pavement materials.
J. Yang, Z.-H. Wang / Building and Environment 75 (2014) 250e263 253
The total turbulent heat exchange from the rooftop to the at-mospheric layer is given by:
HR ¼ racpra
ðTR � TaÞ (12)
LER ¼ braLVra
hq*s ðTRÞ � qa
i(13)
where cp is specific heat of air at constant pressure, ra the density ofair, Lv the latent heat of vaporization, ra the aerodynamic resistance,TR the roof surface temperature, Ta the air temperature, b theevaporation reduction factor due to the soil water availability (b¼ 1for saturated soils and 0 for dry soils), and qa the specific air hu-midity. The term qs
* is the saturated specific humidity, given byClausius-Clapeyron relation:
q*s ðTÞ ¼ 0:622e0p
exp�LvRV
�1T0
� 1T
��(14)
where p is the atmospheric pressure, T0 and e0 the reference tem-perature and vapor pressure, respectively, and RV the gas constantfor water vapor. It is noteworthy that green roofs controlled thesurface energy partitioning process through modifications of (i) theavailability of soil water, and (ii) the surface temperature. Detailedparameterization schemes for the coupled surface energy transportand hydrological processes in urban canopy layers can be found inWang et al. [26], and are not duplicated here.
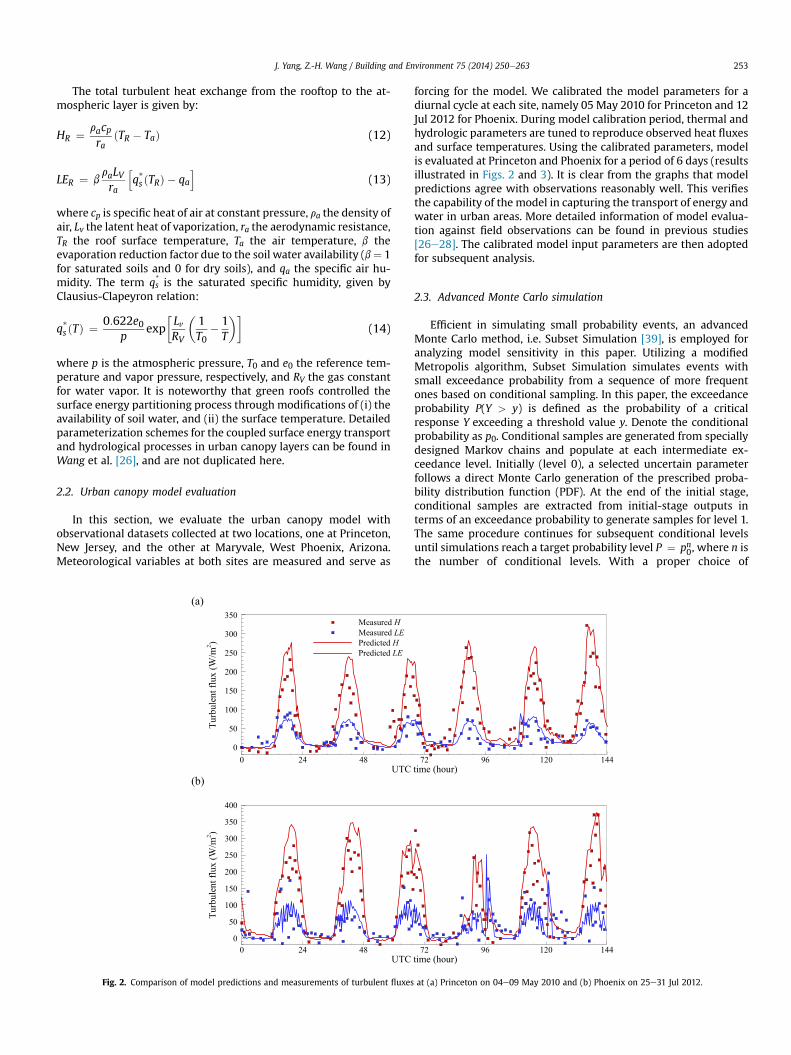
2.2. Urban canopy model evaluation
In this section, we evaluate the urban canopy model withobservational datasets collected at two locations, one at Princeton,New Jersey, and the other at Maryvale, West Phoenix, Arizona.Meteorological variables at both sites are measured and serve as
UTC
Turb
ulen
tflu
x(W
/m2 )
0 24 480
50
100
150
200
250
300
350Measured HMeasured LEPredicted HPredicted LE
UTC
Turb
ulen
tflu
x(W
/m2 )
0 24 480
50
100
150
200
250
300
350
400
(a)
(b)
Fig. 2. Comparison of model predictions and measurements of turbulent fluxes
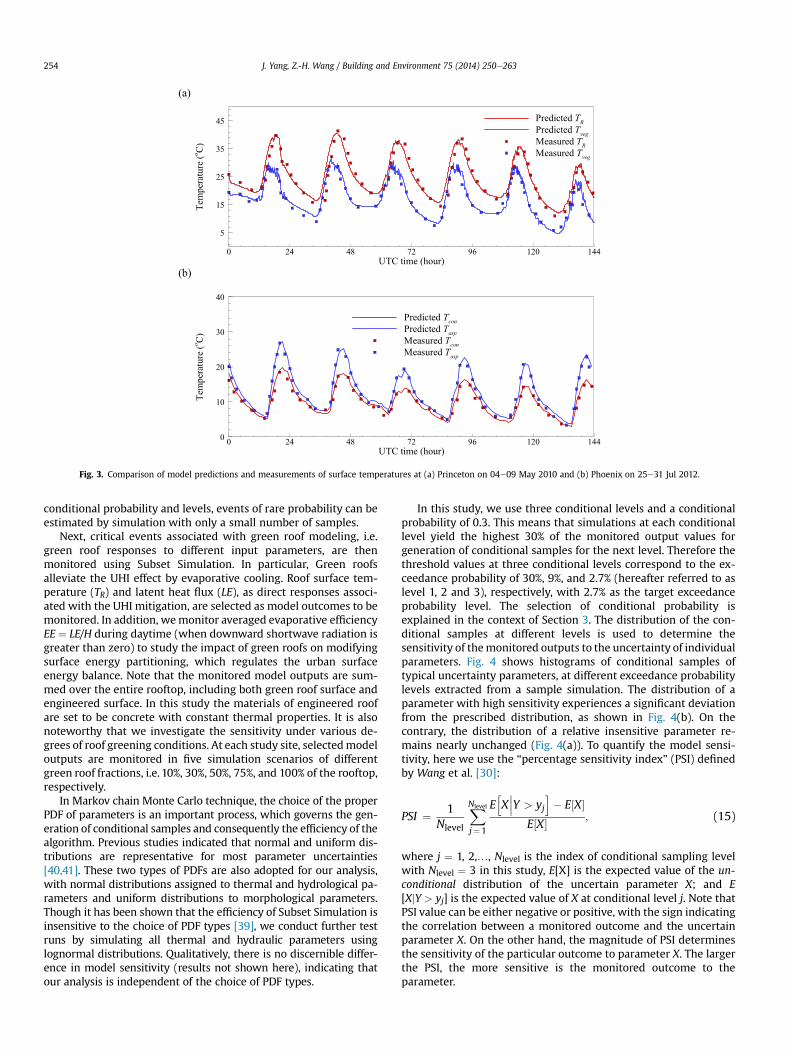
forcing for the model. We calibrated the model parameters for adiurnal cycle at each site, namely 05 May 2010 for Princeton and 12Jul 2012 for Phoenix. During model calibration period, thermal andhydrologic parameters are tuned to reproduce observed heat fluxesand surface temperatures. Using the calibrated parameters, modelis evaluated at Princeton and Phoenix for a period of 6 days (resultsillustrated in Figs. 2 and 3). It is clear from the graphs that modelpredictions agree with observations reasonably well. This verifiesthe capability of the model in capturing the transport of energy andwater in urban areas. More detailed information of model evalua-tion against field observations can be found in previous studies[26e28]. The calibrated model input parameters are then adoptedfor subsequent analysis.
2.3. Advanced Monte Carlo simulation
Efficient in simulating small probability events, an advancedMonte Carlo method, i.e. Subset Simulation [39], is employed foranalyzing model sensitivity in this paper. Utilizing a modifiedMetropolis algorithm, Subset Simulation simulates events withsmall exceedance probability from a sequence of more frequentones based on conditional sampling. In this paper, the exceedanceprobability P(Y > y) is defined as the probability of a criticalresponse Y exceeding a threshold value y. Denote the conditionalprobability as p0. Conditional samples are generated from speciallydesigned Markov chains and populate at each intermediate ex-ceedance level. Initially (level 0), a selected uncertain parameterfollows a direct Monte Carlo generation of the prescribed proba-bility distribution function (PDF). At the end of the initial stage,conditional samples are extracted from initial-stage outputs interms of an exceedance probability to generate samples for level 1.The same procedure continues for subsequent conditional levelsuntil simulations reach a target probability level P ¼ pn0, where n isthe number of conditional levels. With a proper choice of
time (hour)72 96 120 144
time (hour)72 96 120 144
at (a) Princeton on 04e09 May 2010 and (b) Phoenix on 25e31 Jul 2012.
UTC time (hour)
Tem
pera
ture
(o C)
0 24 48 72 96 120 144
5
15
25
35
45 Predicted TRPredicted TvegMeasured TRMeasured Tveg
UTC time (hour)
Tem
pera
ture
(o C)
0 24 48 72 96 120 1440
10
20
30
40
Predicted TconPredicted TaspMeasured TconMeasured Tasp
(a)
(b)
Fig. 3. Comparison of model predictions and measurements of surface temperatures at (a) Princeton on 04e09 May 2010 and (b) Phoenix on 25e31 Jul 2012.
J. Yang, Z.-H. Wang / Building and Environment 75 (2014) 250e263254
conditional probability and levels, events of rare probability can beestimated by simulation with only a small number of samples.
Next, critical events associated with green roof modeling, i.e.green roof responses to different input parameters, are thenmonitored using Subset Simulation. In particular, Green roofsalleviate the UHI effect by evaporative cooling. Roof surface tem-perature (TR) and latent heat flux (LE), as direct responses associ-ated with the UHI mitigation, are selected as model outcomes to bemonitored. In addition, wemonitor averaged evaporative efficiencyEE ¼ LE/H during daytime (when downward shortwave radiation isgreater than zero) to study the impact of green roofs on modifyingsurface energy partitioning, which regulates the urban surfaceenergy balance. Note that the monitored model outputs are sum-med over the entire rooftop, including both green roof surface andengineered surface. In this study the materials of engineered roofare set to be concrete with constant thermal properties. It is alsonoteworthy that we investigate the sensitivity under various de-grees of roof greening conditions. At each study site, selectedmodeloutputs are monitored in five simulation scenarios of differentgreen roof fractions, i.e. 10%, 30%, 50%, 75%, and 100% of the rooftop,respectively.
In Markov chain Monte Carlo technique, the choice of the properPDF of parameters is an important process, which governs the gen-eration of conditional samples and consequently the efficiency of thealgorithm. Previous studies indicated that normal and uniform dis-tributions are representative for most parameter uncertainties[40,41]. These two types of PDFs are also adopted for our analysis,with normal distributions assigned to thermal and hydrological pa-rameters and uniform distributions to morphological parameters.Though it has been shown that the efficiency of Subset Simulation isinsensitive to the choice of PDF types [39], we conduct further testruns by simulating all thermal and hydraulic parameters usinglognormal distributions. Qualitatively, there is no discernible differ-ence in model sensitivity (results not shown here), indicating thatour analysis is independent of the choice of PDF types.
In this study, we use three conditional levels and a conditionalprobability of 0.3. This means that simulations at each conditionallevel yield the highest 30% of the monitored output values forgeneration of conditional samples for the next level. Therefore thethreshold values at three conditional levels correspond to the ex-ceedance probability of 30%, 9%, and 2.7% (hereafter referred to aslevel 1, 2 and 3), respectively, with 2.7% as the target exceedanceprobability level. The selection of conditional probability isexplained in the context of Section 3. The distribution of the con-ditional samples at different levels is used to determine thesensitivity of themonitored outputs to the uncertainty of individualparameters. Fig. 4 shows histograms of conditional samples oftypical uncertainty parameters, at different exceedance probabilitylevels extracted from a sample simulation. The distribution of aparameter with high sensitivity experiences a significant deviationfrom the prescribed distribution, as shown in Fig. 4(b). On thecontrary, the distribution of a relative insensitive parameter re-mains nearly unchanged (Fig. 4(a)). To quantify the model sensi-tivity, here we use the “percentage sensitivity index” (PSI) definedby Wang et al. [30]:
PSI ¼ 1Nlevel
XNlevel
j¼1
EhXY > yj
i� E½X�
E½X� ; (15)
where j ¼ 1, 2,., Nlevel is the index of conditional sampling levelwith Nlevel ¼ 3 in this study, E[X] is the expected value of the un-conditional distribution of the uncertain parameter X; and E[XjY > yj] is the expected value of X at conditional level j. Note thatPSI value can be either negative or positive, with the sign indicatingthe correlation between a monitored outcome and the uncertainparameter X. On the other hand, the magnitude of PSI determinesthe sensitivity of the particular outcome to parameter X. The largerthe PSI, the more sensitive is the monitored outcome to theparameter.
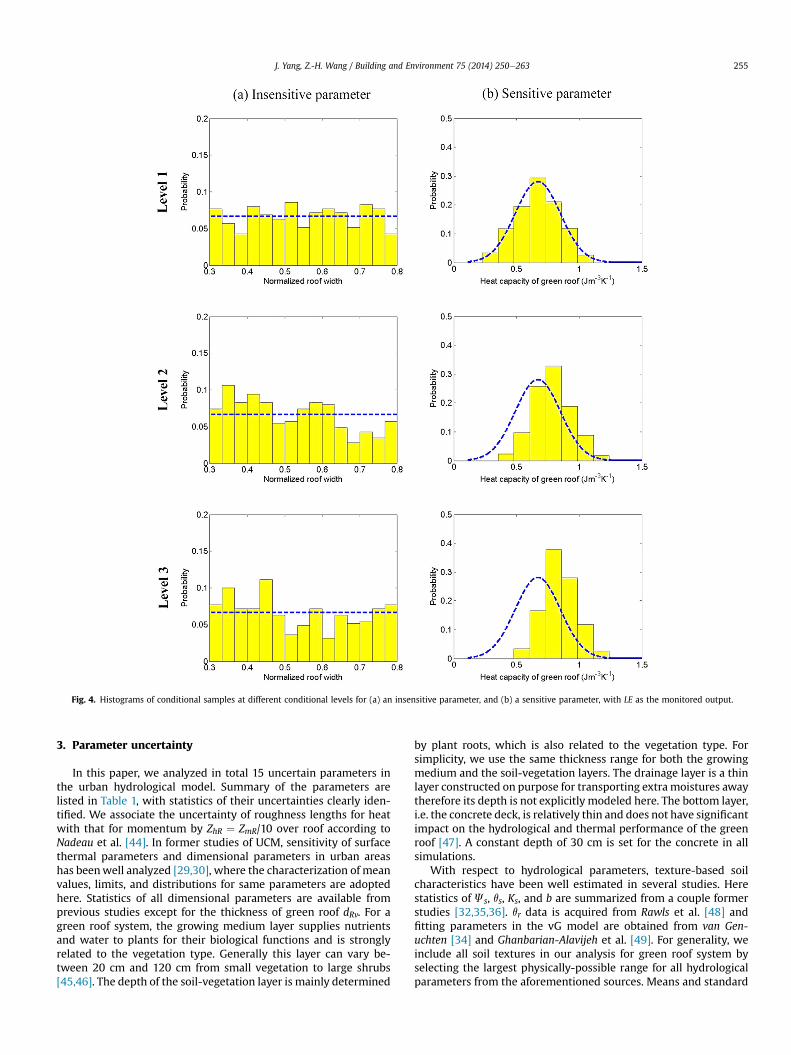
Fig. 4. Histograms of conditional samples at different conditional levels for (a) an insensitive parameter, and (b) a sensitive parameter, with LE as the monitored output.
J. Yang, Z.-H. Wang / Building and Environment 75 (2014) 250e263 255
3. Parameter uncertainty
In this paper, we analyzed in total 15 uncertain parameters inthe urban hydrological model. Summary of the parameters arelisted in Table 1, with statistics of their uncertainties clearly iden-tified. We associate the uncertainty of roughness lengths for heatwith that for momentum by ZhR ¼ ZmR/10 over roof according toNadeau et al. [44]. In former studies of UCM, sensitivity of surfacethermal parameters and dimensional parameters in urban areashas beenwell analyzed [29,30], where the characterization of meanvalues, limits, and distributions for same parameters are adoptedhere. Statistics of all dimensional parameters are available fromprevious studies except for the thickness of green roof dRv. For agreen roof system, the growing medium layer supplies nutrientsand water to plants for their biological functions and is stronglyrelated to the vegetation type. Generally this layer can vary be-tween 20 cm and 120 cm from small vegetation to large shrubs[45,46]. The depth of the soil-vegetation layer is mainly determined
by plant roots, which is also related to the vegetation type. Forsimplicity, we use the same thickness range for both the growingmedium and the soil-vegetation layers. The drainage layer is a thinlayer constructed on purpose for transporting extramoistures awaytherefore its depth is not explicitly modeled here. The bottom layer,i.e. the concrete deck, is relatively thin and does not have significantimpact on the hydrological and thermal performance of the greenroof [47]. A constant depth of 30 cm is set for the concrete in allsimulations.
With respect to hydrological parameters, texture-based soilcharacteristics have been well estimated in several studies. Herestatistics of Js, qs, Ks, and b are summarized from a couple formerstudies [32,35,36]. qr data is acquired from Rawls et al. [48] andfitting parameters in the vG model are obtained from van Gen-uchten [34] and Ghanbarian-Alavijeh et al. [49]. For generality, weinclude all soil textures in our analysis for green roof system byselecting the largest physically-possible range for all hydrologicalparameters from the aforementioned sources. Means and standard
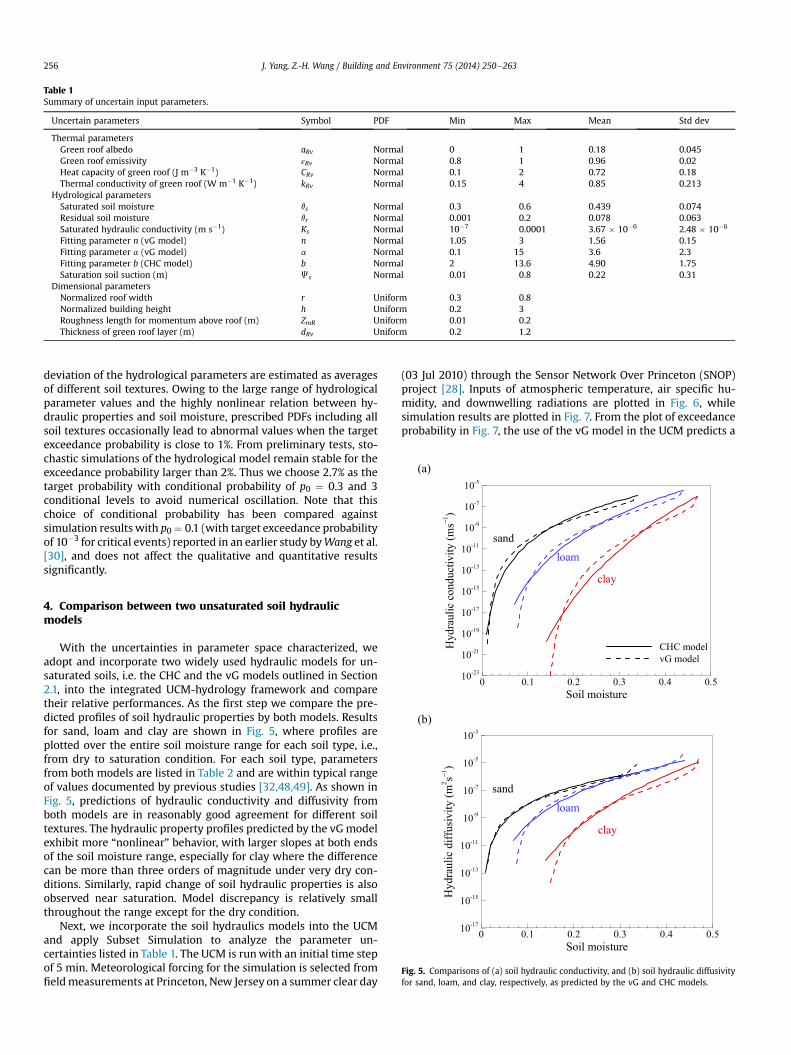
Table 1Summary of uncertain input parameters.
Uncertain parameters Symbol PDF Min Max Mean Std dev
Thermal parametersGreen roof albedo aRv Normal 0 1 0.18 0.045Green roof emissivity εRv Normal 0.8 1 0.96 0.02Heat capacity of green roof (J m�3 K�1) CRv Normal 0.1 2 0.72 0.18Thermal conductivity of green roof (W m�1 K�1) kRv Normal 0.15 4 0.85 0.213
Hydrological parametersSaturated soil moisture qs Normal 0.3 0.6 0.439 0.074Residual soil moisture qr Normal 0.001 0.2 0.078 0.063Saturated hydraulic conductivity (m s�1) Ks Normal 10�7 0.0001 3.67 � 10�6 2.48 � 10�6
Fitting parameter n (vG model) n Normal 1.05 3 1.56 0.15Fitting parameter a (vG model) a Normal 0.1 15 3.6 2.3Fitting parameter b (CHC model) b Normal 2 13.6 4.90 1.75Saturation soil suction (m) Js Normal 0.01 0.8 0.22 0.31
Dimensional parametersNormalized roof width r Uniform 0.3 0.8Normalized building height h Uniform 0.2 3Roughness length for momentum above roof (m) ZmR Uniform 0.01 0.2Thickness of green roof layer (m) dRv Uniform 0.2 1.2
(a)
uctiv
ity(m
s−1)
10-13
10-11
10-9
10-7
10-5
sand
loam
J. Yang, Z.-H. Wang / Building and Environment 75 (2014) 250e263256
deviation of the hydrological parameters are estimated as averagesof different soil textures. Owing to the large range of hydrologicalparameter values and the highly nonlinear relation between hy-draulic properties and soil moisture, prescribed PDFs including allsoil textures occasionally lead to abnormal values when the targetexceedance probability is close to 1%. From preliminary tests, sto-chastic simulations of the hydrological model remain stable for theexceedance probability larger than 2%. Thus we choose 2.7% as thetarget probability with conditional probability of p0 ¼ 0.3 and 3conditional levels to avoid numerical oscillation. Note that thischoice of conditional probability has been compared againstsimulation results with p0¼ 0.1 (with target exceedance probabilityof 10�3 for critical events) reported in an earlier study byWang et al.[30], and does not affect the qualitative and quantitative resultssignificantly.
(b)
Soil moisture
Hyd
raul
icco
nd
0 0.1 0.2 0.3 0.4 0.510-23
10-21
10-19
10-17
10-15
CHC modelvG model
clay
Soil moisture
Hyd
raul
icdi
ffus
ivity
(m2 s−1
)
0 0.1 0.2 0.3 0.4 0.510-17
10-15
10-13
10-11
10-9
10-7
10-5
10-3
clay
sandloam
Fig. 5. Comparisons of (a) soil hydraulic conductivity, and (b) soil hydraulic diffusivityfor sand, loam, and clay, respectively, as predicted by the vG and CHC models.
4. Comparison between two unsaturated soil hydraulicmodels
With the uncertainties in parameter space characterized, weadopt and incorporate two widely used hydraulic models for un-saturated soils, i.e. the CHC and the vG models outlined in Section2.1, into the integrated UCM-hydrology framework and comparetheir relative performances. As the first step we compare the pre-dicted profiles of soil hydraulic properties by both models. Resultsfor sand, loam and clay are shown in Fig. 5, where profiles areplotted over the entire soil moisture range for each soil type, i.e.,from dry to saturation condition. For each soil type, parametersfrom both models are listed in Table 2 and are within typical rangeof values documented by previous studies [32,48,49]. As shown inFig. 5, predictions of hydraulic conductivity and diffusivity fromboth models are in reasonably good agreement for different soiltextures. The hydraulic property profiles predicted by the vGmodelexhibit more “nonlinear” behavior, with larger slopes at both endsof the soil moisture range, especially for clay where the differencecan be more than three orders of magnitude under very dry con-ditions. Similarly, rapid change of soil hydraulic properties is alsoobserved near saturation. Model discrepancy is relatively smallthroughout the range except for the dry condition.
Next, we incorporate the soil hydraulics models into the UCMand apply Subset Simulation to analyze the parameter un-certainties listed in Table 1. The UCM is runwith an initial time stepof 5 min. Meteorological forcing for the simulation is selected fromfieldmeasurements at Princeton, New Jersey on a summer clear day
(03 Jul 2010) through the Sensor Network Over Princeton (SNOP)project [28]. Inputs of atmospheric temperature, air specific hu-midity, and downwelling radiations are plotted in Fig. 6, whilesimulation results are plotted in Fig. 7. From the plot of exceedanceprobability in Fig. 7, the use of the vG model in the UCM predicts a
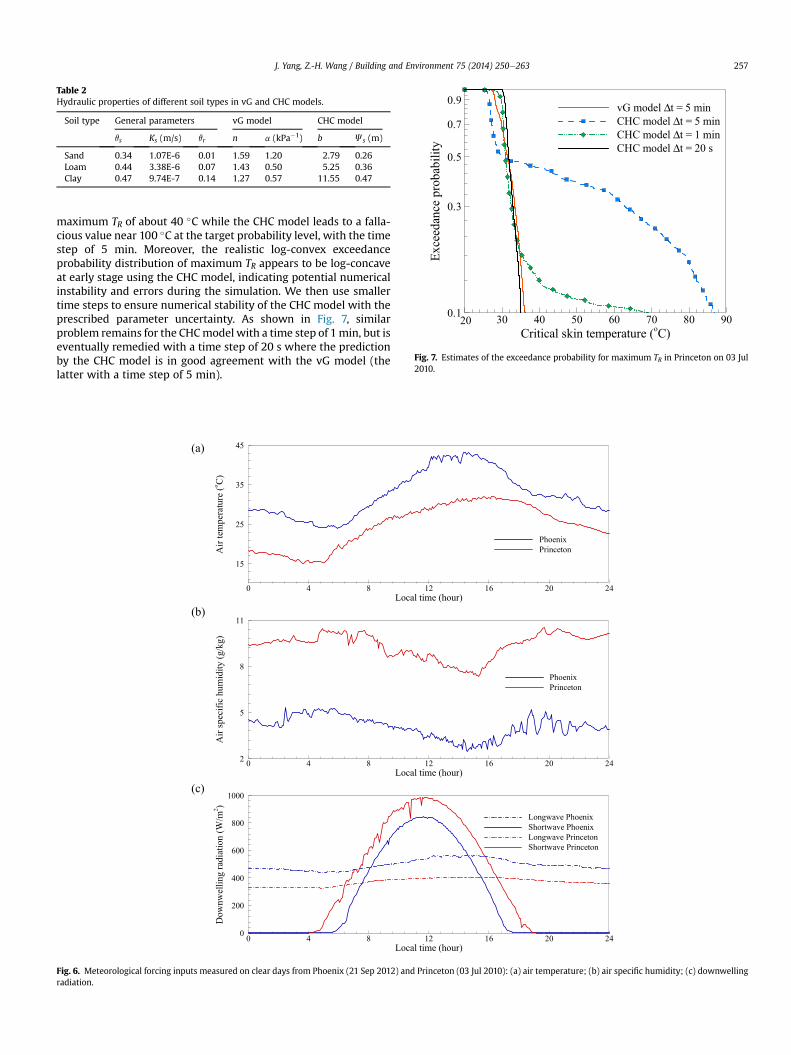
Table 2Hydraulic properties of different soil types in vG and CHC models.
Soil type General parameters vG model CHC model
qs Ks (m/s) qr n a (kPa�1) b Js (m)
Sand 0.34 1.07E-6 0.01 1.59 1.20 2.79 0.26Loam 0.44 3.38E-6 0.07 1.43 0.50 5.25 0.36Clay 0.47 9.74E-7 0.14 1.27 0.57 11.55 0.47
Fig. 7. Estimates of the exceedance probability for maximum TR in Princeton on 03 Jul2010.
J. Yang, Z.-H. Wang / Building and Environment 75 (2014) 250e263 257
maximum TR of about 40 �C while the CHC model leads to a falla-cious value near 100 �C at the target probability level, with the timestep of 5 min. Moreover, the realistic log-convex exceedanceprobability distribution of maximum TR appears to be log-concaveat early stage using the CHC model, indicating potential numericalinstability and errors during the simulation. We then use smallertime steps to ensure numerical stability of the CHC model with theprescribed parameter uncertainty. As shown in Fig. 7, similarproblem remains for the CHCmodel with a time step of 1min, but iseventually remedied with a time step of 20 s where the predictionby the CHC model is in good agreement with the vG model (thelatter with a time step of 5 min).
Local time (hour)
Air
tem
pera
ture
(o C)
0 4 8 12 16 20 24
15
25
35
45
PhoenixPrinceton
Local time (hour)
Air
spec
ific
hum
idity
(g/k
g)
0 4 8 12 16 20 242
5
8
11
PhoenixPrinceton
Local time (hour)
Dow
nwel
ling
radi
atio
n(W
/m2 )
0 4 8 12 16 20 240
200
400
600
800
1000
Longwave PhoenixShortwave PhoenixLongwave PrincetonShortwave Princeton
(a)
(b)
(c)
Fig. 6. Meteorological forcing inputs measured on clear days from Phoenix (21 Sep 2012) and Princeton (03 Jul 2010): (a) air temperature; (b) air specific humidity; (c) downwellingradiation.
Maximum T ( C)
Exce
edan
cepr
obab
ility
40 50 60 70
0.1
0.4
0.7
1
10% Green roof50% Green roof100% Green roof
0.027
Maximum LE (W/m )
Exce
edan
cepr
obab
ility
0 40 80 120 160
0.1
0.4
0.7
1
0.027
(a)
(b)
R
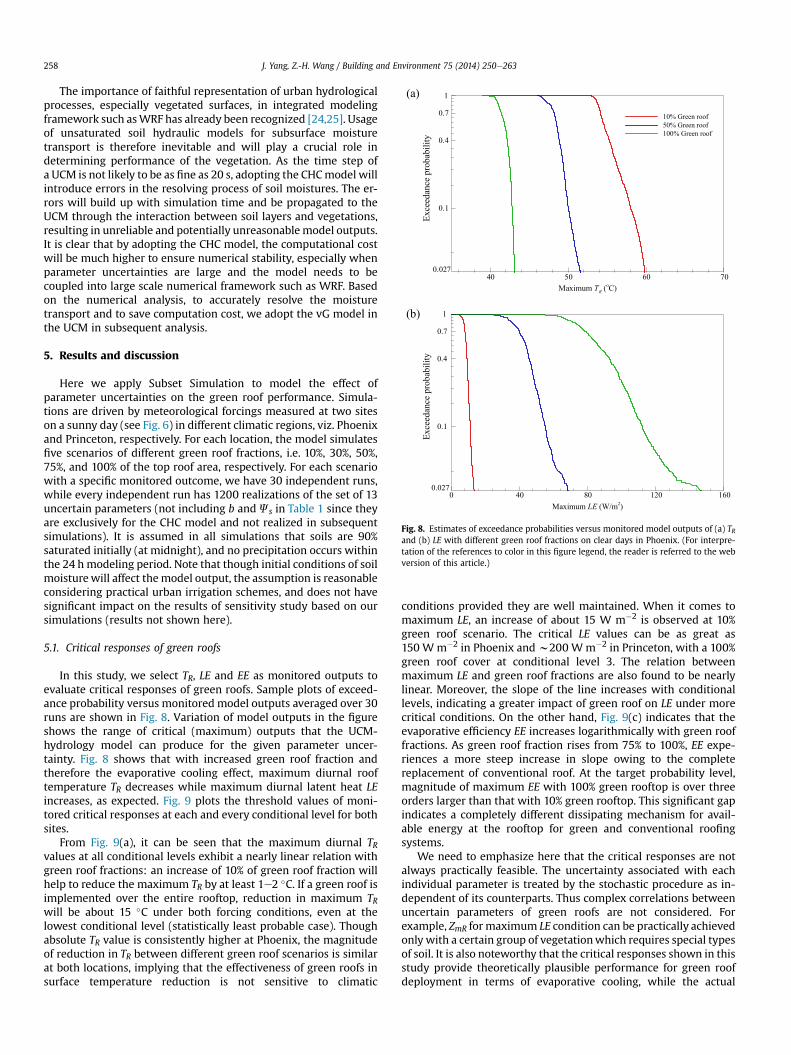
Fig. 8. Estimates of exceedance probabilities versus monitored model outputs of (a) TRand (b) LE with different green roof fractions on clear days in Phoenix. (For interpre-tation of the references to color in this figure legend, the reader is referred to the webversion of this article.)
J. Yang, Z.-H. Wang / Building and Environment 75 (2014) 250e263258
The importance of faithful representation of urban hydrologicalprocesses, especially vegetated surfaces, in integrated modelingframework such asWRF has already been recognized [24,25]. Usageof unsaturated soil hydraulic models for subsurface moisturetransport is therefore inevitable and will play a crucial role indetermining performance of the vegetation. As the time step ofa UCM is not likely to be as fine as 20 s, adopting the CHCmodel willintroduce errors in the resolving process of soil moistures. The er-rors will build up with simulation time and be propagated to theUCM through the interaction between soil layers and vegetations,resulting in unreliable and potentially unreasonablemodel outputs.It is clear that by adopting the CHC model, the computational costwill be much higher to ensure numerical stability, especially whenparameter uncertainties are large and the model needs to becoupled into large scale numerical framework such as WRF. Basedon the numerical analysis, to accurately resolve the moisturetransport and to save computation cost, we adopt the vG model inthe UCM in subsequent analysis.
5. Results and discussion
Here we apply Subset Simulation to model the effect ofparameter uncertainties on the green roof performance. Simula-tions are driven by meteorological forcings measured at two siteson a sunny day (see Fig. 6) in different climatic regions, viz. Phoenixand Princeton, respectively. For each location, the model simulatesfive scenarios of different green roof fractions, i.e. 10%, 30%, 50%,75%, and 100% of the top roof area, respectively. For each scenariowith a specific monitored outcome, we have 30 independent runs,while every independent run has 1200 realizations of the set of 13uncertain parameters (not including b and Js in Table 1 since theyare exclusively for the CHC model and not realized in subsequentsimulations). It is assumed in all simulations that soils are 90%saturated initially (at midnight), and no precipitation occurs withinthe 24 hmodeling period. Note that though initial conditions of soilmoisturewill affect themodel output, the assumption is reasonableconsidering practical urban irrigation schemes, and does not havesignificant impact on the results of sensitivity study based on oursimulations (results not shown here).
5.1. Critical responses of green roofs
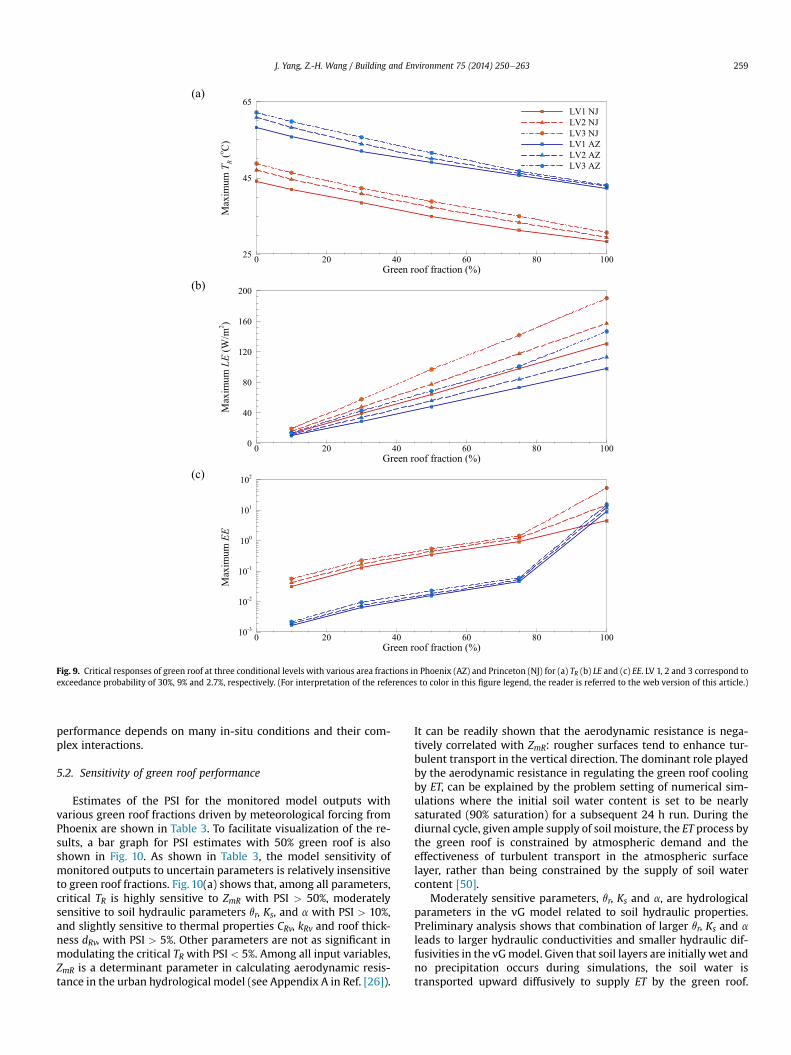
In this study, we select TR, LE and EE as monitored outputs toevaluate critical responses of green roofs. Sample plots of exceed-ance probability versus monitored model outputs averaged over 30runs are shown in Fig. 8. Variation of model outputs in the figureshows the range of critical (maximum) outputs that the UCM-hydrology model can produce for the given parameter uncer-tainty. Fig. 8 shows that with increased green roof fraction andtherefore the evaporative cooling effect, maximum diurnal rooftemperature TR decreases while maximum diurnal latent heat LEincreases, as expected. Fig. 9 plots the threshold values of moni-tored critical responses at each and every conditional level for bothsites.
From Fig. 9(a), it can be seen that the maximum diurnal TRvalues at all conditional levels exhibit a nearly linear relation withgreen roof fractions: an increase of 10% of green roof fraction willhelp to reduce the maximum TR by at least 1e2 �C. If a green roof isimplemented over the entire rooftop, reduction in maximum TRwill be about 15 �C under both forcing conditions, even at thelowest conditional level (statistically least probable case). Thoughabsolute TR value is consistently higher at Phoenix, the magnitudeof reduction in TR between different green roof scenarios is similarat both locations, implying that the effectiveness of green roofs insurface temperature reduction is not sensitive to climatic
conditions provided they are well maintained. When it comes tomaximum LE, an increase of about 15 W m�2 is observed at 10%green roof scenario. The critical LE values can be as great as150 W m�2 in Phoenix andw200 Wm�2 in Princeton, with a 100%green roof cover at conditional level 3. The relation betweenmaximum LE and green roof fractions are also found to be nearlylinear. Moreover, the slope of the line increases with conditionallevels, indicating a greater impact of green roof on LE under morecritical conditions. On the other hand, Fig. 9(c) indicates that theevaporative efficiency EE increases logarithmically with green rooffractions. As green roof fraction rises from 75% to 100%, EE expe-riences a more steep increase in slope owing to the completereplacement of conventional roof. At the target probability level,magnitude of maximum EE with 100% green rooftop is over threeorders larger than that with 10% green rooftop. This significant gapindicates a completely different dissipating mechanism for avail-able energy at the rooftop for green and conventional roofingsystems.
We need to emphasize here that the critical responses are notalways practically feasible. The uncertainty associated with eachindividual parameter is treated by the stochastic procedure as in-dependent of its counterparts. Thus complex correlations betweenuncertain parameters of green roofs are not considered. Forexample, ZmR for maximum LE condition can be practically achievedonly with a certain group of vegetationwhich requires special typesof soil. It is also noteworthy that the critical responses shown in thisstudy provide theoretically plausible performance for green roofdeployment in terms of evaporative cooling, while the actual
Green roof fraction (%)
Max
imumT R
(o C)
0 20 40 60 80 10025
45
65LV1 NJLV2 NJLV3 NJLV1 AZLV2 AZLV3 AZ
Green roof fraction (%)
Max
imumLE
(W/m
2 )
0 20 40 60 80 1000
40
80
120
160
200
Green roof fraction (%)
Max
imumEE
0 20 40 60 80 10010-3
10-2
10-1
100
101
102
(a)
(b)
(c)
Fig. 9. Critical responses of green roof at three conditional levels with various area fractions in Phoenix (AZ) and Princeton (NJ) for (a) TR (b) LE and (c) EE. LV 1, 2 and 3 correspond toexceedance probability of 30%, 9% and 2.7%, respectively. (For interpretation of the references to color in this figure legend, the reader is referred to the web version of this article.)
J. Yang, Z.-H. Wang / Building and Environment 75 (2014) 250e263 259
performance depends on many in-situ conditions and their com-plex interactions.
5.2. Sensitivity of green roof performance
Estimates of the PSI for the monitored model outputs withvarious green roof fractions driven by meteorological forcing fromPhoenix are shown in Table 3. To facilitate visualization of the re-sults, a bar graph for PSI estimates with 50% green roof is alsoshown in Fig. 10. As shown in Table 3, the model sensitivity ofmonitored outputs to uncertain parameters is relatively insensitiveto green roof fractions. Fig. 10(a) shows that, among all parameters,critical TR is highly sensitive to ZmR with PSI > 50%, moderatelysensitive to soil hydraulic parameters qr, Ks, and a with PSI > 10%,and slightly sensitive to thermal properties CRv, kRv and roof thick-ness dRv, with PSI > 5%. Other parameters are not as significant inmodulating the critical TR with PSI < 5%. Among all input variables,ZmR is a determinant parameter in calculating aerodynamic resis-tance in the urban hydrological model (see Appendix A in Ref. [26]).
It can be readily shown that the aerodynamic resistance is nega-tively correlated with ZmR: rougher surfaces tend to enhance tur-bulent transport in the vertical direction. The dominant role playedby the aerodynamic resistance in regulating the green roof coolingby ET, can be explained by the problem setting of numerical sim-ulations where the initial soil water content is set to be nearlysaturated (90% saturation) for a subsequent 24 h run. During thediurnal cycle, given ample supply of soil moisture, the ET process bythe green roof is constrained by atmospheric demand and theeffectiveness of turbulent transport in the atmospheric surfacelayer, rather than being constrained by the supply of soil watercontent [50].
Moderately sensitive parameters, qr, Ks and a, are hydrologicalparameters in the vG model related to soil hydraulic properties.Preliminary analysis shows that combination of larger qr, Ks and a
leads to larger hydraulic conductivities and smaller hydraulic dif-fusivities in the vGmodel. Given that soil layers are initially wet andno precipitation occurs during simulations, the soil water istransported upward diffusively to supply ET by the green roof.
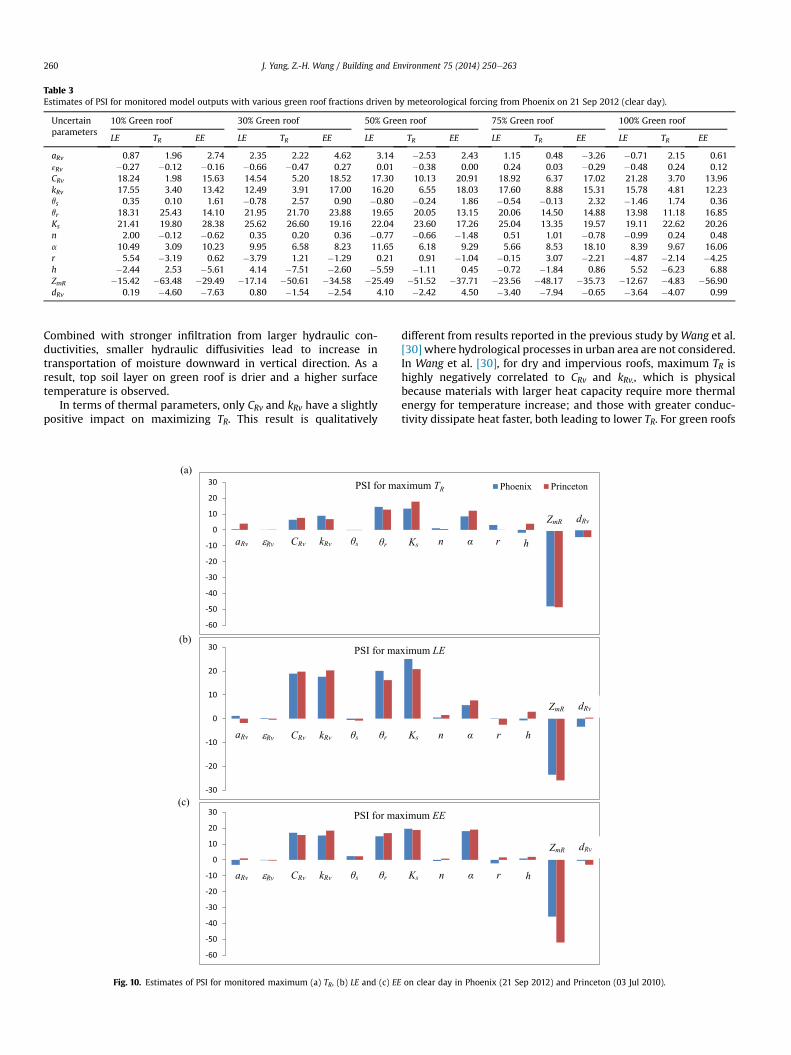
Table 3Estimates of PSI for monitored model outputs with various green roof fractions driven by meteorological forcing from Phoenix on 21 Sep 2012 (clear day).
Uncertainparameters
10% Green roof 30% Green roof 50% Green roof 75% Green roof 100% Green roof
LE TR EE LE TR EE LE TR EE LE TR EE LE TR EE
aRv 0.87 1.96 2.74 2.35 2.22 4.62 3.14 �2.53 2.43 1.15 0.48 �3.26 �0.71 2.15 0.61εRv �0.27 �0.12 �0.16 �0.66 �0.47 0.27 0.01 �0.38 0.00 0.24 0.03 �0.29 �0.48 0.24 0.12CRv 18.24 1.98 15.63 14.54 5.20 18.52 17.30 10.13 20.91 18.92 6.37 17.02 21.28 3.70 13.96kRv 17.55 3.40 13.42 12.49 3.91 17.00 16.20 6.55 18.03 17.60 8.88 15.31 15.78 4.81 12.23qs 0.35 0.10 1.61 �0.78 2.57 0.90 �0.80 �0.24 1.86 �0.54 �0.13 2.32 �1.46 1.74 0.36qr 18.31 25.43 14.10 21.95 21.70 23.88 19.65 20.05 13.15 20.06 14.50 14.88 13.98 11.18 16.85Ks 21.41 19.80 28.38 25.62 26.60 19.16 22.04 23.60 17.26 25.04 13.35 19.57 19.11 22.62 20.26n 2.00 �0.12 �0.62 0.35 0.20 0.36 �0.77 �0.66 �1.48 0.51 1.01 �0.78 �0.99 0.24 0.48a 10.49 3.09 10.23 9.95 6.58 8.23 11.65 6.18 9.29 5.66 8.53 18.10 8.39 9.67 16.06r 5.54 �3.19 0.62 �3.79 1.21 �1.29 0.21 0.91 �1.04 �0.15 3.07 �2.21 �4.87 �2.14 �4.25h �2.44 2.53 �5.61 4.14 �7.51 �2.60 �5.59 �1.11 0.45 �0.72 �1.84 0.86 5.52 �6.23 6.88ZmR �15.42 �63.48 �29.49 �17.14 �50.61 �34.58 �25.49 �51.52 �37.71 �23.56 �48.17 �35.73 �12.67 �4.83 �56.90dRv 0.19 �4.60 �7.63 0.80 �1.54 �2.54 4.10 �2.42 4.50 �3.40 �7.94 �0.65 �3.64 �4.07 0.99
J. Yang, Z.-H. Wang / Building and Environment 75 (2014) 250e263260
Combined with stronger infiltration from larger hydraulic con-ductivities, smaller hydraulic diffusivities lead to increase intransportation of moisture downward in vertical direction. As aresult, top soil layer on green roof is drier and a higher surfacetemperature is observed.
In terms of thermal parameters, only CRv and kRv have a slightlypositive impact on maximizing TR. This result is qualitatively
Fig. 10. Estimates of PSI for monitored maximum (a) TR, (b) LE and (c) EE
different from results reported in the previous study byWang et al.[30] where hydrological processes in urban area are not considered.In Wang et al. [30], for dry and impervious roofs, maximum TR ishighly negatively correlated to CRv and kRv., which is physicalbecause materials with larger heat capacity require more thermalenergy for temperature increase; and those with greater conduc-tivity dissipate heat faster, both leading to lower TR. For green roofs
on clear day in Phoenix (21 Sep 2012) and Princeton (03 Jul 2010).
Table 4Estimates of PSI for monitored model outputs with various green roof fractions driven by meteorological forcing from Princeton on 03 Jul 2010 (clear day).
Uncertainparameters
10% Green roof 30% Green roof 50% Green roof 75% Green roof 100% Green roof
LE TR EE LE TR EE LE TR EE LE TR EE LE TR EE
aRv 2.28 3.34 4.82 3.22 0.39 3.19 �2.22 0.07 4.29 �1.81 3.89 0.91 0.04 �2.12 1.86εRv �0.11 �0.30 �0.15 �0.49 �0.03 �0.03 �0.17 �0.32 �0.39 �0.46 0.11 �0.46 �0.15 �0.04 �0.23CRv 20.02 3.92 17.17 18.11 �1.56 21.06 18.33 3.26 22.44 19.75 7.50 15.66 16.75 6.57 13.97kRv 19.42 7.03 19.74 19.89 2.28 19.23 18.87 �0.65 23.30 20.30 6.75 18.43 16.75 4.45 12.09qs 2.25 1.13 0.47 �0.31 1.12 4.97 0.07 0.02 0.76 �0.81 �0.13 2.27 0.77 0.18 �1.10qr 14.71 12.44 18.08 9.81 26.68 10.66 22.41 32.04 22.13 16.19 12.71 16.84 17.21 24.41 25.07Ks 12.82 18.76 18.18 8.22 20.78 14.79 17.44 16.57 17.44 20.83 17.78 18.82 20.63 22.91 19.39n 0.81 �0.26 0.45 0.39 0.42 1.89 0.23 �0.48 0.70 1.57 0.53 0.77 0.15 2.41 0.15a 4.46 12.77 10.72 5.84 6.25 16.38 6.27 9.38 16.75 7.67 12.03 19.05 9.24 9.48 13.76r 1.02 0.13 �1.59 2.99 �1.63 0.14 �0.89 �2.00 0.60 �2.79 0.04 1.60 �0.50 �0.10 0.51h 5.51 4.66 1.55 5.02 �4.54 4.06 �0.11 5.23 �3.73 2.91 6.83 1.87 �1.40 �1.80 1.93ZmR �21.56 �62.07 �26.02 �27.71 �60.60 �15.41 �15.28 �57.90 �4.34 �25.90 �48.80 �52.06 �22.92 �45.55 �52.50dRv �4.59 0.60 �2.00 0.70 �0.04 �5.63 �6.71 �3.04 0.03 0.78 �5.61 �3.11 3.50 �5.80 �2.99
J. Yang, Z.-H. Wang / Building and Environment 75 (2014) 250e263 261
with ET, on the other hand, larger CRv and kRv will lead to largerthermal inertias for bothH and LE [51]. As the turbulent transport oflatent heat in a high temperature regime is more efficient than thatof sensible heat [52], given the same amount of available energy,smaller CRv and kRv of the green roof enhance ET and result in thesurface cooling. The actual effect of CRv and kRv on TR involvescomplex mechanism of land surface energy partitioning [53], thatslightly positive PSI values obtained in this study indicates thattheir positive correlation through ET from vegetation exceeds theirnegative correlation through direct heat conduction, as far as UHImitigation is concerned.
In addition, for dry and impervious roofs, it was found that themaximum TR is fairly sensitive to roof albedo [30], while thissensitivity is insignificant for green roofs as shown in this study. Fordry pavements with higher albedo, more incoming solar radiationwill be reflected back to space, leaving less available energy andtherefore lower surface temperature. In contrast, the UCM-hydrology model has LE as an important surface energy budget.Through its complex relation with H and G via the signature con-tained in the land surface temperature (LST), LE interferes the directand strong correlation between LST and surface albedo leading toless sensitivity. Similar phenomenon was also observed in thegreen roof simulation in Wang et al. [26]. Also note that themaximum TR is relatively insensitive to the thickness of the greenroof, owing to the fact that the introduction of additionalvegetation-soil and growing medium layers on top of the concretedeck makes the green roof well-insulated and insensitive to thebuilding interior conditions.
Fig. 10(b) illustrates that LE is sensitive to CRv, kRv, qr, Ks and ZmR
(PSI > 20%), slightly sensitive to a (PSI > 5%), and insensitive toother parameters. Combining Eqs. (13) and (14), it is straightfor-ward to show that LE is a function of TR, b and ra. Since LE has apositive relation with TR, its sensitivity to uncertain parameters isexpected to be similar to that of TR. As discussed earlier, thoughsmaller ZmR is efficient in increasing TR, it tends to inhibit verticalturbulent transport from the surface by increasing ra. Thus themagnitude of PSI for ZmR is reduced from about 50% with respect toTR to about 25% with respect to LE. Also larger CRv and kRv tend tostrengthen ET from the green roof and thus lead to positive PSI withrespect to LE. Results for the sensitivity of evaporative efficiency EEon parameter uncertainties are shown in Fig. 10(c). It can be seenfrom Eqs. (12) and (13) that both H and LE have similar trends withTR and ra. Thus the sensitivity of EE is an intriguing result that de-scribes the capacity of uncertain parameters in regulating the ratioof LE over H disproportionally. TR and LE are sensitive to the samegroup of uncertain parameters, so does EE. From Fig. 10(c), EE isfound to be very sensitive to ZmR (PSI > 40%), moderately sensitive
to CRv, kRv, Ks, qr, and a (PSI > 20%), and insensitive to other pa-rameters. This is the same set of parameters that dictates the greenroof output in terms of critical TR and LE.
To investigate the effect of different climatic conditions on theanalysis result, we conducted another set of simulations driven bymeteorological forcing from Princeton. Estimates of the PSI for themonitored model outputs are listed in Table 4, and the bar graphshown in Fig. 10. As model setup is different for Phoenix andPrinceton, it is clear from Fig. 10 that the sensitivity of the moni-tored green roof responses to all uncertain parameters is generallyindependent of the field (boundary) conditions in different climatezones. Overall, the magnitudes of PSI among sensitive parametersrank in a similar order from the largest to smallest: ZmR, Ks and qr, a,kRv and CRv for both locations. This agrees with previous studies byHenderson-Sellers [54], Beljaars and Viterbo [55] and Chen et al. [32]that land-vegetation-surface model is notably sensitive to theroughness length for heat/moisture transport. In addition, ourstudy shows that the model sensitivity is independent of seasonalvariability and weather conditions, which is consistent to the re-sults reported in Wang et al. [30] and is not repeated here.
6. Concluding remarks
In this paper, we used an advanced Monte Carlo simulationapproach, viz. Subset Simulation, to statistically quantify thesensitivity of urban hydrological models, with particular applica-tion to green roofs, in an integrated UCM-hydrologymodel. We firstanalyzed two widely used soil hydraulic models, namely, the CHCand the vG models. Results show that the CHC model is morecomputationally expensive than the vG model, in order to achievenumerical stability under the same parameter uncertainty. Thusthe vG model is more suitable for urban hydrological modeling,especially for large-scale simulations with coupling to atmosphericdynamics.
To assess the green roof performance in term of effective UHImitigation, we choose to monitor the critical values of diurnal rooftemperature, latent heat flux and evaporative efficiency (reciprocalof the Bowen ratio), with two sets of meteorological forcingmeasured at Phoenix, AZ, and Princeton, NJ, respectively. It isshown that while well irrigated, a green roof is effective in reducingTR, and enhancing LE and EE, through evapotranspirative cooling.The performance of a green roof is most sensitive to the aero-dynamic resistance (turbulent transport), hydraulic properties ofunsaturated soils (and growing medium), as well as the thermalproperties of the green roof. It is interesting to note that the greenroof performance in the framework of integrated UCM-hydrologymodel, exhibit qualitatively different thermal and hydrological
J. Yang, Z.-H. Wang / Building and Environment 75 (2014) 250e263262
behavior as compared to that of conventional dry and impervious(engineered) roofs, largely due to the different physics of surfaceenergy balance and portioning of available energy involved in thesetwo roof systems. In particular, ET and the transport of latent heatare enhanced at high environmental temperature and high surfaceroughness, yielding the green roof more effective under theseconditions.
It is also found that the model physics of UCM-hydrology isweakly sensitive to the actual fraction of green roofs and climaticconditions. We reiterate here that simulation results produced inthis study only reflect the model physics of the coupled UCM-hydrology framework; and that the critical response of greenroofs under given model uncertainties may not be actually attain-able owing to complex in-situ conditions and actual practices ofinfrastructure implementation and maintenance. Nevertheless,results of this study shed new light on the performance of greenroof systems for UHI mitigation, especially at large scales, andprovide useful guidelines for parametric studies for future urbanhydrological model development.
Acknowledgment
The authors would like to thank Dr. Siu-Kui Au for sharing theSubset Simulation procedure and Dr. Elie Bou-Zeid for sharing thePrinceton dataset. JY is partly supported by the Graduate StudentGrant of the Central Arizona Project e Long Term EcologicalResearch (CAP LTER) program, under CAP3: BCS-1026865.
References
[1] United Nations Department of Economic and Social Affairs PD. World ur-banization prospects: the 2011 revision. United Nations; 2012.
[2] Cheryl N, Alan R, Barbara L. Assessing the performance of sustainable tech-nologies: a framework and its application. Build Res Inform Int J Res DevDemonstr 2007;35(3):237e51.
[3] Ntelekos A, Oppenheimer M, Smith J, Miller A. Urbanization, climate changeand flood policy in the United States. Clim Change 2010;103(3e4):597e616.
[4] Mayer H. Air pollution in cities. Atmos Environ 1999;33(24e25):4029e37.[5] Kolokotroni M, Zhang Y, Watkins R. The London heat island and building
cooling design. Sol Energy 2007;81(1):102e10.[6] Eigenbrod F, Bell VA, Davies HN, Heinemeyer A, Armsworth PR, Gaston KJ. The
impact of projected increases in urbanization on ecosystem services. Proc RoySoc B 2011;278:3201e8.
[7] Georgescu M, Mahalov A, Moustaoui M. Seasonal hydroclimatic impacts of suncorridor expansion. Environ Res Lett 2012;7(3):034026.
[8] Gober P, Kirkwood CW. Vulnerability assessment of climate-induced watershortage in Phoenix. Proc Natl Acad Sci 2010;107(50):21295e9.
[9] Dvorak B, Volder A. Green roof vegetation for North American ecoregions: aliterature review. Landsc Urban Plan 2010;96(4):197e213.
[10] Oberndorfer E, Lundholm J, Bass B, Coffman RR, Doshi H, Dunnett N, et al.Green roofs as urban ecosystems: ecological structures, functions, and ser-vices. BioScience 2007;57(10):823e33.
[11] Jim CY, He H. Coupling heat flux dynamics with meteorological conditions inthe green roof ecosystem. Ecol Eng 2010;36(8):1052e63.
[12] Niachou A, Papakonstantinou K, Santamouris M, Tsangrassoulis A,Mihalakakou G. Analysis of the green roof thermal properties and investiga-tion of its energy performance. Energy Build 2001;33(7):719e29.
[13] Santamouris M, Pavlou C, Doukas P, Mihalakakou G, Synnefa A, Hatzibiros A,et al. Investigating and analysing the energy and environmental performanceof an experimental green roof system installed in a nursery school building inAthens, Greece. Energy 2007;32(9):1781e8.
[14] Wong NH, Cheong DKW, Yan H, Soh J, Ong CL, Sia A. The effects of rooftopgarden on energy consumption of a commercial building in Singapore. EnergyBuild 2003;35(4):353e64.
[15] Molineux CJ, Fentiman CH, Gange AC. Characterising alternative recycledwaste materials for use as green roof growing media in the U.K. Ecol Eng2009;35(10):1507e13.
[16] Carter T, Keeler A. Life-cycle costebenefit analysis of extensive vegetated roofsystems. J Environ Manage 2008;87(3):350e63.
[17] Mackey CW, Lee X, Smith RB. Remotely sensing the cooling effects of city scaleefforts to reduce urban heat island. Build Environ 2012;49:348e58.
[18] Kondo H, Genchi Y, Kikegawa Y, Ohashi Y, Yoshikado H, Komiyama H.Development of a multi-layer urban canopy model for the analysis of energyconsumption in a big city: structure of the urban canopy model and its basicperformance. Boundary-Layer Meteorol 2005;116(3):395e421.
[19] Kusaka H, Kondo H, Kikegawa Y, Kimura F. A simple single-layer urban canopymodel for atmospheric models: comparison with multi-layer and slab models.Boundary-Layer Meteorol 2001;101(3):329e58.
[20] Lee S-H. Further development of the vegetated urban canopy model includinga grass-covered surface parametrization and photosynthesis effects. Bound-ary-Layer Meteorol 2011;140(2):315e42.
[21] Masson V. A physically-based scheme for the urban energy budget in atmo-spheric models. Boundary-Layer Meteorol 2000;94(3):357e97.
[22] Johnson GT, Oke TR, Lyons TJ, Steyn DG, Watson ID, Voogt JA. Simulation ofsurface urban heat island under ’ideal’ conditions at night, Part I: theory andtests against field data. Boundary-Layer Meteorol 1991;56(3):275e94.
[23] Grimmond CSB, Oke TR. Turbulent heat fluxes in urban areas: observationsand a local-scale urban meteorological parameterization scheme (LUMPS).J Appl Meteorol 2002;41(7):792e810.
[24] Grimmond CSB, Blackett M, Best MJ, Barlow J, Baik JJ, Belcher SE, et al. Theinternational urban energy balance models comparison project: first resultsfrom phase 1. J Appl Meteorol Climatol 2010;49(6):1268e92.
[25] Grimmond CSB, Blackett M, Best MJ, Baik JJ, Belcher SE, Beringer J, et al. Initialresults from phase 2 of the international urban energy balance model com-parison. Int J Climatol 2011;31(2):244e72.
[26] Wang Z-H, Bou-Zeid E, Smith JA. A coupled energy transport and hydrologicalmodel for urban canopies evaluated using a wireless sensor network. Q J RoyMeteorol Soc 2013;139:1643e57.
[27] Sun T, Bou-Zeid E, Wang Z-H, Zerba E, Ni G-H. Hydrometeorological de-terminants of green roof performance via a vertically-resolved model for heatand water transport. Build Environ 2013;60(0):211e24.
[28] Wang Z-H, Bou-Zeid E, Smith J. A spatially-analytical scheme for surfacetemperatures and conductive heat fluxes in urban canopy models. Boundary-Layer Meteorol 2011;138(2):171e93.
[29] Loridan T, Grimmond CSB, Grossman-Clarke S, Chen F, Tewari M, Manning K,et al. Trade-offs and responsiveness of the single-layer urban canopy parame-trization in WRF: an offline evaluation using the MOSCEM optimization algo-rithm and field observations. Q J Roy Meteorol Soc 2010;136(649):997e1019.
[30] Wang Z-H, Bou-Zeid E, Au SK, Smith JA. Analyzing the sensitivity of WRF’ssingle-layer urban canopy model to parameter uncertainty using advancedMonte Carlo simulation. J Appl Meteorol Climatol 2011;50(9):1795e814.
[31] Cuenca RH, Ek M, Mahrt L. Impact of soil water property parameterization onatmospheric boundary layer simulation. J Geophys Res Atmos 1996;101(D3):7269e77.
[32] Chen F, Dudhia J. Coupling an advanced land surface-hydrology model withthe Penn State-NCAR MM5 modeling system. Part II: preliminary modelvalidation. Mon Weather Rev 2001;129(4):587e604.
[33] Loosvelt L, Pauwels VRN, Cornelis WM, De Lannoy GJM, Verhoest NEC. Impactof soil hydraulic parameter uncertainty on soil moisture modeling. WaterResour Res 2011;47(3):W03505.
[34] van Genuchten MT. A closed-form equation for predicting the hydraulicconductivity of unsaturated soils. Soil Sci Soc Am J 1980;44(5):892e8.
[35] Clapp RB, Hornberger GM. Empirical equations for some soil hydraulicproperties. Water Resour Res 1978;14(4):601e4.
[36] Cosby BJ, Hornberger GM, Clapp RB, Ginn TR. A statistical exploration of therelationships of soil moisture characteristics to the physical properties of soils.Water Resour Res 1984;20(6):682e90.
[37] Liu Y, Chen JN, He WQ, Tong QY, Li WF. Application of an uncertainty analysisapproach to strategic environmental assessment for urban planning. EnvironSci Technol 2010;44:3136e41.
[38] Refsgaard JC, van der Sluijs JP, Højberg AL, Vanrolleghem PA. Uncertainty inthe environmental modelling process e a framework and guidance. EnvironModel Softw 2007;22(11):1543e56.
[39] Au S-K, Beck JL. Estimation of small failure probabilities in high dimensions bysubset simulation. Probabilistic Eng Mech 2001;16(4):263e77.
[40] Au S-K, Beck J. Subset simulation and its application to seismic risk based ondynamic analysis. J Eng Mech 2003;129(8):901e17.
[41] Au S-K, Wang Z-H, Lo S-M. Compartment fire risk analysis by advanced MonteCarlo simulation. Eng Struct 2007;29(9):2381e90.
[42] Au S-K, Ching J, Beck JL. Application of subset simulation methods to reliabilitybenchmark problems. Struct Saf 2007;29(3):183e93.
[43] Hanks RJ. Applied soil physics: soil water and temperature applications. 2nded. New York: Springer-Verlag; 1992. p. 176.
[44] Nadeau DF, Brutsaert W, Parlange MB, Bou-Zeid E, Barrenetxea G, Couach O,et al. Estimation of urban sensible heat flux using a dense wireless network ofobservations. Environ Fluid Mech 2009;9(6):635e53.
[45] Villarreal EL, Bengtsson L. Response of a sedum green-roof to individual rainevents. Ecol Eng 2005;25(1):1e7.
[46] Yang J, Yu Q, Gong P. Quantifying air pollution removal by green roofs inChicago. Atmos Environ 2008;42(31):7266e73.
[47] Bianchini F, Hewage K. How “green” are the green roofs? Lifecycle analysis ofgreen roof materials. Build Environ 2012;48(0):57e65.
[48] Rawls W, Brakensiek D, Saxton K. Estimation of soil water properties. TransASAE 1982;25(5):1316e20.
[49] Ghanbarian-Alavijeh B, Liaghat A, Huang G-H, Van Genuchten MT. Estimationof the van Genuchten soil water retention properties from soil textural data.Pedosphere 2010;20(4):456e65.
[50] Shokri N, Lehmann P, Vontobel P, Or D. Drying front and water content dy-namics during evaporation from sand delineated by neutron radiography.Water Resour Res 2008;44(6):W06418.

J. Yang, Z.-H. Wang / Building and Environment 75 (2014) 250e263 263
[51] Wang JF, Bras RL. A model of evapotranspiration based on the theory ofmaximum entropy production. Water Resour Res 2011;47:W03521.
[52] Yang J, Wang ZH, Lee TW. Relative efficiency of surface energy partitioningover different land covers. Br J Environ Clim Change 2013;3(1):86e102.
[53] Bateni SM, Entekhabi D. Relative efficiency of land surface energy balancecomponents. Water Resour Res 2012;48:W04510.
[54] Henderson-Sellers A. A factorial assessment of the sensitivity of the BATSland-surface parameterization scheme. J Clim 1993;6(2):227e47.
[55] Beljaars AC, Viterbo P. The sensitivity of winter evaporation to the formulationof aerodynamic resistance in the ECMWF model. Boundary-Layer Meteorol1994;71(1e2):135e49.
[56] Gill SE, Handley JF, E AR, Pauleit S. Adapting cities for climate change: the roleof the green infrastructure. Built Environ 2007;33(1):115e33.
[57] Speak AF, Rothwell JJ, Lindley SJ, Smith CL. Urban particulate pollutionreduction by four species of green roof vegetation in a UK city. Atmos Environ2012;61:283e93.
Related Documents


![Flexible automated parameterization of hydrologic models ...water.geog.buffalo.edu/ehmg/pdf/2002WR001349.pdf[2] Most hydrological models are conceptual representa-tions of ideal hydrological](https://static.cupdf.com/doc/110x72/5f07d1487e708231d41ee62e/flexible-automated-parameterization-of-hydrologic-models-watergeog-2-most.jpg)


