New Jersey Institute of Technology Digital Commons @ NJIT Dissertations eses and Dissertations Spring 1999 Physical and geotechnical characterization of water treatment plant residuals Swamy C. Basim New Jersey Institute of Technology Follow this and additional works at: hps://digitalcommons.njit.edu/dissertations Part of the Civil Engineering Commons is Dissertation is brought to you for free and open access by the eses and Dissertations at Digital Commons @ NJIT. It has been accepted for inclusion in Dissertations by an authorized administrator of Digital Commons @ NJIT. For more information, please contact [email protected]. Recommended Citation Basim, Swamy C., "Physical and geotechnical characterization of water treatment plant residuals" (1999). Dissertations. 977. hps://digitalcommons.njit.edu/dissertations/977

Welcome message from author
This document is posted to help you gain knowledge. Please leave a comment to let me know what you think about it! Share it to your friends and learn new things together.
Transcript

New Jersey Institute of TechnologyDigital Commons @ NJIT
Dissertations Theses and Dissertations
Spring 1999
Physical and geotechnical characterization of watertreatment plant residualsSwamy C. BasimNew Jersey Institute of Technology
Follow this and additional works at: https://digitalcommons.njit.edu/dissertations
Part of the Civil Engineering Commons
This Dissertation is brought to you for free and open access by the Theses and Dissertations at Digital Commons @ NJIT. It has been accepted forinclusion in Dissertations by an authorized administrator of Digital Commons @ NJIT. For more information, please [email protected].
Recommended CitationBasim, Swamy C., "Physical and geotechnical characterization of water treatment plant residuals" (1999). Dissertations. 977.https://digitalcommons.njit.edu/dissertations/977

Copyright Warning & Restrictions
The copyright law of the United States (Title 17, United States Code) governs the making of photocopies or other
reproductions of copyrighted material.
Under certain conditions specified in the law, libraries and archives are authorized to furnish a photocopy or other
reproduction. One of these specified conditions is that the photocopy or reproduction is not to be “used for any
purpose other than private study, scholarship, or research.” If a, user makes a request for, or later uses, a photocopy or reproduction for purposes in excess of “fair use” that user
may be liable for copyright infringement,
This institution reserves the right to refuse to accept a copying order if, in its judgment, fulfillment of the order
would involve violation of copyright law.
Please Note: The author retains the copyright while the New Jersey Institute of Technology reserves the right to
distribute this thesis or dissertation
Printing note: If you do not wish to print this page, then select “Pages from: first page # to: last page #” on the print dialog screen

The Van Houten library has removed some of the personal information and all signatures from the approval page and biographical sketches of theses and dissertations in order to protect the identity of NJIT graduates and faculty.

ABSTRACT
PHYSICAL AND GEOTECHNICAL CHARACTERIZATION OF WATERTREATMENT PLANT RESIDUALS
bySwamy C. Basim
The study of Water Treatment Plant (WTP) residuals is of recent origin and very little
information is available in literature regarding these residuals. These waste materials
have high solids contents, even in the mechanically dewatered condition, making it
difficult to handle. These, along with stringent environmental regulations have forced the
water utilities to look for new disposal options for these residuals. For this purpose as
well as for evaluating suitable options for the beneficial reuse of residuals, it is essential
to characterize WTP residuals.
As the dewatered residuals are plastic, the researcher may be prompted to treat
these materials as clays. But, unlike clays, these residuals lose all their plasticity and
behave like granular materials upon drying and weathering. Furthermore, available
literature indicates that the compaction characteristics for these materials are different
depending upon whether the test is carried out from the "wet to dry" condition or from
"dry to wet" condition. Therefore, WTP residuals are different from clays, due to the
presence of organics, and high concentrations of chemicals. It is postulated that the above
changes in behavior of residuals are brought about by the change in structure, resulting in
increased cementation and increase in grain size. This reinforces the need for
characterizing these materials.

In this research, geotechnical tests were performed on six residual samples and
geoenvironmental tests were carried out three on residuals to determine the causes and
mechanisms responsible for the changes in behavior of residuals. Grain size analysis
conducted by sieve, hydrometer analyses and particle size analyzer indicated that particle
sizes increased substantially upon weathering and drying. Electron micrographs,
elemental maps, X-Ray diffraction and X-Ray Fluorescence spectra were obtained. The
results indicated that the particle size increase could be attributed to aggregation due to
organic matter and cementation due to metal oxides such as calcium oxide. It was also
observed that no leaching of metals occurred due to drying, freeze, and thaw effects.

PHYSICAL AND GEOTECHNICAL CHARACTERIZATION OF WATERTREATMENT PLANT RESIDUALS
bySwamy C. Basim
A DissertationSubmitted to the Faculty of
New Jersey Institute of technologyIn partial Fulfillment of the Requirements for the Degree of
Doctor of Philosophy
Department of Civil and Environmental Engineering
May 1999

Copyright© by Swamy C. Basim
ALL RIGHTS RESERVED

APPROVAL PAGE
PHYSICAL AND GEOTECHNICAL CHARACTERIZATION OF WATERTREATMENT PLANT RESIDUALS
Swamy C. Basim
Dr. Dorairaja Raghu, Thesis Advisor
DateProfessor of Civil and Environmental Engineering,New Jersey Institute of Technology, Newark, NJ.
Dr. William Spillers, Committee Member
DateProfessor of Civil and Environmental Engineering,New Jersey Institute of Technology, Newark, NJ.
Dr. Raj P. Khera, Committee Member DateProfessor of Civil and Environmental Engineering,New Jersey Institute of Technology, Newark, NJ.
Dr. Hsin-Neng Hsieh, Committee Member
DateProfessor of Civil and Environmental Engineering,New Jersey Institute of Technology, Newark, NJ.
Dr. Nuggehalli M. Ravindra, Committee Member DateProfessor of Physics,New Jersey Institute of Technology, Newark, NJ.

BIOGRAPHICAL SKETCH
Author: Swamy C. Basim
Degree: Doctor of Philosophy
Date: May 1999
Undergraduate and Graduate Education:
■ Doctor of Philosophy in Civil EngineeringNew Jersey Institute of Technology, Newark, NJ, 1999.
■ Master of Science Civil EngineeringBangalore University, Bangalore, India 1981.
■ Bachelor of Science in Civil EngineeringUniversity of Mysore, Mysore, India 1975.
Major: Civil Engineering
Presentations and Publications:
Raghu, D., Hsieh, H.N., Basim, S.C., and Morgan, M., "PhysicalCharacterization of Water Treatment Plant Residual and Top Soil Mixtures"STP 12 75-ASTM Publication code Number (PCN); 04-012 750-38. ASTMWest Conshohocken, PA., 1997.
2. Raghu, D., Hsieh, RN., Basim, S.C., and Tian, P., "Effects of Aging on theProperties of Water Treatment Plant Residuals"— Proceedings ofWEFA WWA Joint Residuals/Biosolids conference, Kansas City, MS., July23-26, 1995.
3. Raghu, D. and Basim, S.C., "Use of Cupola Slag as Fill Material"—Proceedings of the 10 th International Conference on Solid WasteManagement and Secondary Materials Philadelphia, PA., Nov 1994,
4. Raj, P.P and Basim, S.C., "Stress-Strain Modulus of Compacted Silt"—Proceedings of Indian Geotechnical Conference Vol. I, Roorkee, India, Dec16-18 1995.
iv

To the Memory ofMy Brother Shri. B.G. Murthy and his Wife Smt. PratibhaWho Reached the Heavenly Abode on December 10, 1995

ACKNOWLEDGEMENT
This research became possible only due to the constant inspiration and guidance of my
advisor Dr Dorairaja Raghu. To be more precise, I got this wonderful opportunity to join
NJIT and work on my Ph.D., only because of his earnest efforts despite many odds. I take
this opportunity to record my sincere thanks and appreciation for his intelligible and
excellent guidance in my research work.
All my committee members deserve my appreciation. Dr. Raj P. Khera encouraged
me to expand my ken of Soil Behavior and other related subjects. His meticulous
attention to minute details inspired me to do work as perfectly as possible to perfect my
laboratory skills. I am highly thankful to him.
Ever since my association with NJIT, Dr. William Spillers was very considerate to
me for all of my requests both academic and otherwise. I am very much grateful to him.
My acquaintance with Dr Hsieh dates back to January 1994 when I was working for
AWWA sponsored project. I learned a great deal of environmental engineering from him.
Also, during the course of this research work he provided useful comments. He was kind
enough to extend my assistantship as my research took twice the time it should have
taken. I will be failing in my duties if I do not acknowledge his help.
Despite his hectic schedule, Dr. Ravindra spent many hours with me and helped me
in analyzing micrographs. I thank him profusely.
During this research, I have spent more than two years exclusively to study the
fabric and microstructure of WTP residuals using different types of optical microscopes
and environmental scanning electron microscope. Dr. Sudhi Mukherjee, Research
Professor in Civil and Environmental engineering, sat with me months together ignoring
vi

his priorities in front of microscopes to gather good images. I place on record my sincere
thanks and appreciation of his help and kindness.
In deed I had a very good company and a great opportunity to work with Dr. H.K.
Sehgal, Professor of Physics, Indian Institute of Technology, New-Delhi, India on the
microscope during summer of 1997. I learned from him the physics behind scanning
electron microscope to some depth. I sincerely acknowledge his help.
My friends Mr.Wiwat Kamolpornwijit, Ms Bumrongjaroen Walairat and Mr.
Manaskon Rachakornkij (all soon to be doctors) happily extended their help while I was
working with XRD, XRF and EDX. My friend Mr. Chandrakanth Patel, Laboratory
Chemist of Geo-environmental laboratory, provided me unlimited entry to his laboratory.
Mr. Clint Brockaway, helped me during TGA studies. Mr. Paras Trivedi offered me his
constructive suggestions about my micrographs.
I thank Prof. Daunheimer; chairman, department of civil and environmental
engineering, for all the support rendered to me during my stay at NJIT. My thanks are also
due to Dr. Ronald Kane and Ms. Annette Damiano of Graduate Studies Office for helping
me with format and corrections for this dissertation report.
I thank the authorities of Jersey City Department of Water, Jersey City, United
Water Company, Hackensack, North Jersey District Water supply Commission, Wanaque,
NJ, Pennsylvania American Water Company, Hershey, Pa, Sturgeon Point Water
Treatment Plant, Derby, NY, Niagara River Water Treatment Plant, Tonawanda, NY and
the Erie County Water Authority, Buffalo, NY, for providing me with residuals for this
study.
vii

Outside MIT campus, I enjoyed unlimited help of all kinds and encouragement from
my friends, Mr. Kartik Naik, Mr. David Cohen, Mr. Prabhakar, Dr. Mamatha Prabhakar,
Dr. Nidugalle Gowda, Ms. Latha Gowda Dr. P. K. Swain, Mr. Ravi K. Iyengar, and many
more. I take this opportunity to thank everyone.
Rather it is highly ineffable to explain the sacrifices made by my parents Sri. Basim
Thimma Reddy and Smt. Kamalamma to impart me with modern scientific education with
moral and philosophical outlook. They are the constant source of inspiration and
encouragement. I take this opportunity to place on record my sincere gratitude to them.
viii

TABLE OF CONTENTS
Chapter Page
I INTRODUCTION, REVIEW OF LITERATURE AND PROPOSED RESEARCH
1.1 Introduction 1
1.2 Composition and Structure of WTP Residuals 2
1.2.1 Water Phase of WTP Residuals 2
1.2.2 Solid Phase of the Residuals 4
1.3 Characteristics of Water Treatment Plant Residuals 7
1.3.1 Prior Studies Related to WTP Residual Characteristics 7
1.4 Prior Work Done at New Jersey Institute of Technology (NJIT), Newark, NJ 13
1.4.1 particle Size Distribution of Solids 13
1.4.2 Liquid Limit and Plastic Limit Tests 13
1.4.3 Specific Gravity of Solids 14
1.4.4 Compaction Tests 15
1.4.5 Unconfined Compression Tests 17
1.4.6 Effects of Aging and Weathering on the Properties of WTP Residuals I 7
1.5 Proposed research 20
2 ORIGIN AND PRODUCTION OF RESIDUAL SAMPLES TESTED FOR THISSTUDY
2.1 General 23
2.2 Treatment Plants Which Samples Were Collected
ix

TABLE OF CONTENTS(continued)
Chapter Page
2.2.1 Ellwood City Water Treatment Plant, Ellwood City, Pennsylvania 23
2.2.2 Haworth Water Treatment Plant, Harrington Park, New Jersey 25
2.2.3 Jersey City Water Treatment Plant, Boonton, New Jersey 25
2.2.4 Strugeon Point Water treatment Plant Derby, New-York 29
2.2.5 Jerome D. Van de Water, Water treatment Plant, Tonawanda, New-York 29
2.2.6 Wanaque Water Treatment Plant, Wanaque, New Jersey 32
3 TESTING TECHNIQUES AND PROCEDURES
3.1 Natural water Content 38
3.2 Specific Gravity of Solids Tests 38
3.3 Organic content Determination 39
3.4 particle Size analysis 39
3.4.1 particle Size Analyzer (PSA) 40
3.5 Compaction Tests (Wet to Dry) 40
3.6 Unconfined compression Tests 41
3.7 Freeze-Thaw Tests 41
3.8 X-Ray diffraction (XRD) spectrometer 42
3.9 X-Ray Fluorescence (XRF) Spectrometer 42
3.10 Fabric Determination 43

TABLE OF CONTENTS(continued)
Chapter Page
4 RESULTS AND DISCUSSIONS
4.1 Introduction 44
4.2 Natural Water Content 44
4.3 Organic Content 45
4.4 Specific Gravity of Solids 46
4.5 Atterberg Limits 49
4.6 Particle Size Distribution 51
4.7 Compaction Characteristics 61
4.8 Unconfined Compression and Direct Shear Tests 69
4.9 Freeze-Thaw Tests 74
4.10 Chemical Composition of WTP Residuals from XRF 7 5
4.11 X-Ray Diffraction Studies of the Residuals 84
4.12 Electron Micrographs 83
4.13 Energy Dispersive Spectrometer (EDS) Spectra 84
4.14 Elemental Mapping 93
4.15 Discussion on the Probable Causes and Mechanismsof Increase in Grain Size 93
xi

TABLE OF CONTENTS(continued)
Chapter Page
5. CONCLUSIONS AND RECCOMENDATIONS FOR FURTHER STUDY
Si Concusions 99
5.2 Suggestions for Further Study 100
REFERENCES 101
xi i

LIST OF TABLES
Table Page
2.1 Information Summary of Water Treatment Facilities and Residual Samples 24
2.2 Impurities in Water Sources (yearly range) 32
2.3 Water Treatment Processes, Chemicals added (yearly average value) 34
4.1 Natural Water Content of WTP residuals at different Drying Temperatures 45
4.2 Organic Content of the WTP Residuals at Different Drying Temperatures 46
4.3 Specific Gravity Values at Different Drying Conditions 49
4.4 Atterberg Limits and Indices for WTP Residuals 50
4.5 Grain Size Analysis Data for HWD, JCD and WQD at Different Conditions 53
4.6 Grain Size Analysis Data for ELD, STD and VDD at Different Conditions 54
4.7 Compaction Characteristics of WTP Residuals 6l
4.8 Shear Strength Parameters as Obtained from Direct Shear Tests 71
4.9 Freeze-Thaw Test Results of Water Treatment Plant Residual Samples 75
4.10 Percentile Chemical Composition of WTP Residuals as determined by XRF 76
4,11 Minerals/Compounds as Identified by XRD 78

LIST OF FIGURES
Figure Page
1.1 Comparison of Compaction Curves from Dry and Wet sides for residual RWA 16
1.2 Variation of Unconfined Compressive Strength for Residual RWA 18
2.1 Flow diagram of Ellwood City Water Treatment Plant, Ellwood City, PA 26
2.2 Flow Diagram of Haworth Water Treatment Plant at Harrington, NJ 27
2.3 Flow Diagram of Jersey City Water Treatment Plant at Boonton, NJ 28
2.4 Flow Diagram of Sturgeon Point Water Treatment Plant at Derby, NY 30
2.5 Flow Diagram of Jerome D. Van De Water, Water Treatment Plant, NY 31
2.6 Flow diagram of Water Treatment plant Water Supply Commission Wanaque, NJ 33
4.1 Variation of Specific Gravity with Increased drying Temperatures 48
4.2 Grain Size Curve of Particles due to Weathering for Residual HWD 55
4.3 Grain size Curve of particles due to Weathering for Residual JCD. 56
4.4 Grain Size Curve of Particles due to Weathering for Residual WQD 57
4.5 Grain size Curve of Particles due to Weathering for Residual ELD 58
4.6 Grain size Curve Particles due to Weathering for Residual STD 59
4.7 Grain size Curve of Particles due to Weathering for Residual STD 60
4.8 Variation of Undrained Shear Strength for Residual HWD 62
4.9 Variation of Undrained Shear Strength for Residual JCD 63
4.10 Variation of Undrained Shear for Residual WQD 64
4.11 Variation of Undrained Shear Strength for Residual ELD 65
4.12 Variation of Undrained Shear Strength for Residual STD 66
xi'

LIST OF FIGURES
Figure Page
4.13 Variation of Undrained Shear Strength for Residual VDD 67
4.14 Shear Stress vs Horizontal Displacement Curves for the Residual JCD 72
4.15 Failure Envelope for Residual JCD 73
4.16 X-ray Diffractogram for residual JCD Prior to the Removal of Organics 79
4.17 X-ray Difffractogram for the Residual HWD after Drying at 105 0 C 80
4.18 X-ray Difffractogram for the Residual JCD after Drying at 105 ° C 81
4.19 X-ray Difffractogram for the Residual WQDafter Drying at 105 ° C 82
4.20 A Low Magnification Micrograph of the Residual HWD 85
4.21 Micrograph of the Residual HWD at a Magnification of 1100x 86
4.22 Micrograph of the Residual HWD at a Magnification of 2100x 87
4.23 A Low Magnification Micrograph of the Residual JCD 88
4.24 A Low Magnification Micrograph of the Residual WQD 89
4.25 EDS Spectra for the Residual HWD 90
4.26 EDS Spectra for the Residual JCD 91
4.27 EDS Spectra for the Residual JCD 92
4.28 Elemental Map for the WTP Residual HWD 95
4.29 Elemental Map for the WTP Residual JCDD 96
4.30 Elemental Map for the WTP Residual JCDD 97
xv

LIST OF ACRONYMS, ABBREVIATIONS AND SYMBOLS
DDL Diffused Double Layer
EDS Energy Dispersive Spectroscopy
ELD Dewatered sample from Ellwood City Water Treatment Plant in Ellwood
City, Pennsylvania.
ESEM Environmental Scanning Electron Microscope
HWD Sample taken from Haworth Water Treatment Plant in Monmouth County,
New Jersey
JCD Sample taken from Jersey City Water Treatment Plant at Boonton, New
Jersey
kPa Kilo-Pascal
LL Liquid Limit
MDD Maximum Dry Density
ME Silts of High Compressibility
MX-15 Master Sizer 15 -X
xvi
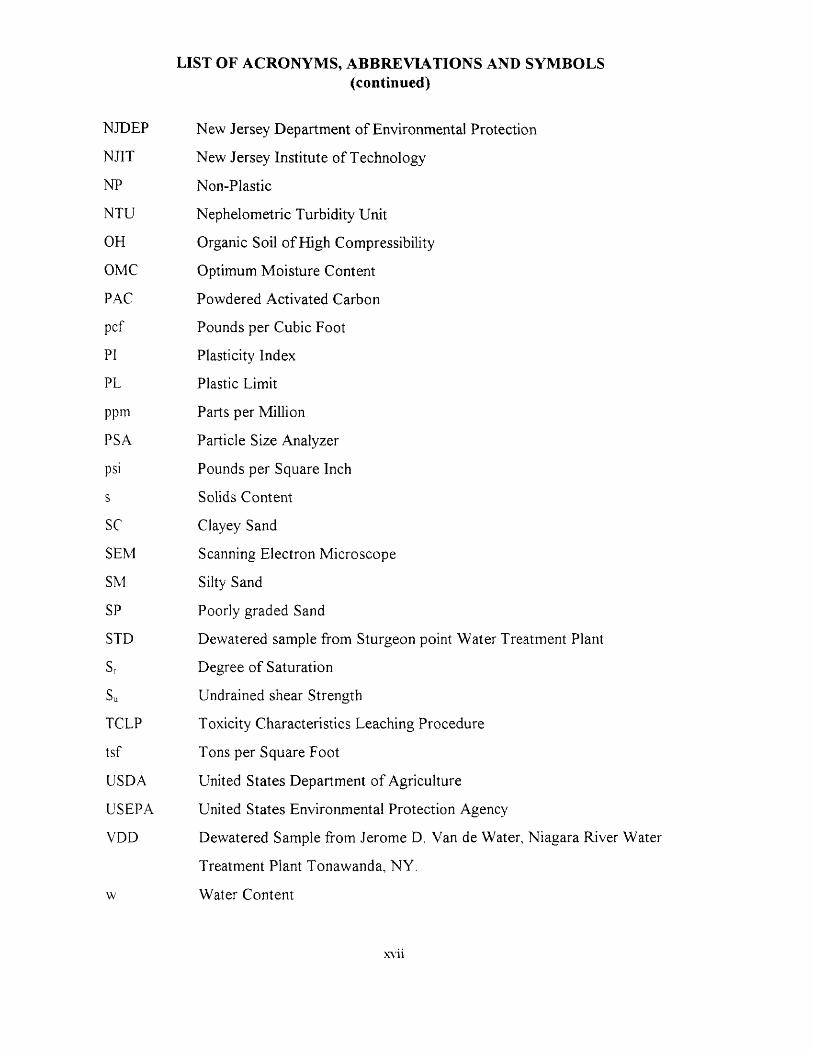
LIST OF ACRONYMS, ABBREVIATIONS AND SYMBOLS(continued)
NJDEP New Jersey Department of Environmental Protection
NJIT New Jersey Institute of Technology
NP Non-Plastic
NTU Nephelometric Turbidity Unit
OH Organic Soil of High Compressibility
OMC Optimum Moisture Content
PAC Powdered Activated Carbon
pcf Pounds per Cubic Foot
PI Plasticity Index
PL Plastic Limit
ppm Parts per Million
PSA Particle Size Analyzer
psi Pounds per Square Inch
s Solids Content
SC Clayey Sand
SEM Scanning Electron Microscope
SM Silty Sand
SP Poorly graded Sand
STD Dewatered sample from Sturgeon point Water Treatment Plant
S rDegree of Saturation
S u Undrained shear Strength
TCLP Toxicity Characteristics Leaching Procedure
tsf Tons per Square Foot
USDA United States Department of Agriculture
USEPA United States Environmental Protection Agency
VDD Dewatered Sample from Jerome D. Van de Water, Niagara River Water
Treatment Plant Tonawanda, NY.
w Water Content
xvii

LIST OF ACRONYMS, ABBREVIATIONS AND SYMBOLS(continued)
WQD Dewatered sample from Wanaque Water Treatment Plant at Wanaque,
New Jersey
WTP Water Treatment Plant
XAFS X-Ray Absorption Fine Structure
XRD X-Ray Diffraction
XRF X-Ray Fluorescence
ZAVD Zero Air Void Density
xviii

CHAPTER 1
INTRODUCTION, REVIEW OF LITERATURE AND PROPOSED RESEARCH
1.1. Introduction
This introductory chapter deals with the origin, composition, classification, disposal and
the regulations governing Water Treatment Plant (WTP) residuals.
Water Treatment Plant residuals contain fine solid particles and organic materials
removed from raw water during coagulation, softening, sedimentation and filter back
washing processes at water treatment facilities. In addition, these residuals contain
cations such as Calcium, Iron and Aluminum. These are introduced during the water
treatment process by the addition of coagulants and conditioning agents. Depending on
the type of coagulants added, the WTP residuals are classified into 3 main groups;
namely lime, ferric, and alum residuals.
Various water treatment facilities of USA produce 200 to 300 million tons of
residuals every year. These wastes contain 1 to 2% solids before dewatering. The solids
contents of dewatered residuals is highly variable and it is varies from plant to plant and
one process of dewatering to another. Typical ranges of solids contents are from 10 to
30%. Due to the low solids contents, handling and disposal of these residuals pose
significant problems. The stringent environmental regulations make it very difficult to
deal with the issue of disposal of WTP residuals (Raghu and Hsieh 1997).
In the past, the disposal methods of WTP residuals have included direct discharge
into sanitary sewers, waterways, land disposal, and ocean dumping with or without prior

2
dewatering and incineration. However, some of these alternatives are no longer feasible
due to the current regulations that limit the direct discharge of water treatment plant
residuals into watercourses such as rivers, streams and even lakes.
1.2. Composition and Structure of WTP Residuals
WTP residuals are two phase materials consisting of a solid phase and a liquid phase. In
fresh residuals, liquid phase dominates the solid phase, consequently WTP residuals
behave like viscous liquids. The solid phase of residuals is composed of inorganic soil
solid particles, coagulants, and organic materials from the plant tissues. Sources of the
soil particles and organic materials are the colloidal and suspended materials in raw water
sources. The soil particles may be silt and or clay. The particles impart color and
turbidity to the surface water. The liquid phase of residuals is water.
1.2.1 Water phase of WTP Residuals
Water in WTP residuals can be classified into four categories as discussed below
(Knocke and Wakeland 1983, and Huang 1979):
1. Free water: Free water surrounds the flocs of residuals. This kind of water is
capable of moving freely by gravity. Typically, WTP residual samples
collected from lagoons contain large quantities of free water, and dewatered
cake samples have very little free water.
2. Floc water: This kind of water is free water trapped within the voids of the floc
structure and it travels within a floc. Dewatered residual cake contains mostly
floc water. Unless the floc structure is destroyed, the floc water can not be

3
removed. Significant amount of energy may be required to remove floc water.
This can be accomplished by processes such as heating, freeze and thaw, air
drying and mechanical squeezing.
3. Capillary water: This is the water held tightly to the surfaces of particles by
surface tension. These forces are believed to be short-ranged but very close to
the particle surface resulting in the appearance of highly structured water
molecules. In WTP residuals, this water can be within the flocs as well, as long
as it is associated with a solid surface. The major difference between capillary
water and floc water is that the latter is free to move within the floc and can be
removed by mechanical dewatering. The capillary water is not free to move but
adheres to solid surfaces. It can be removed by mechanical force if the flocs are
broken up and the capillary water becomes free water.
4. Adsorbed (Bound) water: This kind of water is bound (adsorbed) within the
molecular structure of colloidal solids. Water molecules are held together by
hydrogen bonding. Due to the elliptical shape of these molecules, the centers of
gravity of the positive and negative charges are not the same. So, the water
molecules tend to assume a configuration such that their positively charged
fractions are close to the negatively charged surfaces of the colloids present in
the WTP residuals. These water molecules are adsorbed and so mechanical
effects such as dewatering, evaporation, and normal drying processes can not
remove them. A great deal of energy must be expended in breaking the bond
between the water molecules and the negatively charged surfaces. Very high
temperatures can accomplish this.

4
1.2.2 Solid Phase of WTP Residuals
Suspended inorganic solids are mainly clay-sized particles with a size ranging from 1nm
to 1 µm. They are fine crystal mineral sheets resulting from the weathering products of
rocks. Minerals of the clay-sized fraction commonly include carbonate and sulfur
minerals, layered silicates, and various oxides. These solids normally do not undergo any
chemical reactions during water treatment processes (Bohn et al. 1985).
Clay minerals are very fine crystalline substances. Chemically they are hydrous
aluminosilicates with some metallic ions. The presence of clay minerals in WTP
residuals imparts plasticity, cohesion, swelling and shrinkage. Depending upon the type
of clay mineral present, the cation exchange capacity (CEC) of the WTP residual also
changes.
Other important constituents are free oxide minerals such as allophane. Allophane
is a general name for amorphous aluminosilicate gels. Although the composition of
allophane varies widely, it includes mostly hydrated Alumina (Al 20 3 ), Silica (SiO 2 ), and
Iron oxide (Fe2O3 ). Allophane may also have a high CEC and specific surface (Bohn et
al. 1985). Layer silicates, allophane and chemical additives from water treatment process
can play important role in affecting the properties of WTP residuals.
Organic materials are mainly colloidal polymers called humus produced by the
degradation of non-humus materials undergoing enzymatic and chemical reactions.
Organic matter in particulate media may be responsible for high plasticity, high
shrinkage, high compressibility and low strength. Effects of organic carbon on plasticity
properties of soils are now well known to engineers. A small increase in organic content
of about 2 percent increases the plasticity of montmorrillonite by 20 percent (Odell et al.

5
1960). Soil organic matter is complex both physically and chemically and a variety of
reactions and inter-reactions are possible (Oades 1989). Organic particles may range
down to 0.1 micron in size and hence have high specific surfaces. The specific properties
of the colloidal particles vary greatly depending upon parent material, climate, and stage
of decomposition.
The humic fraction is negatively charged and has gel-like properties (Mitchell
1993, Marshall 1964). Organic particles may be strongly adsorbed on mineral surfaces
and this adsorption modifies both properties of the minerals and the organic material
itself. 20 to 70% of the total CEC of many soils is due to the organic matter present in
them (Bohn et al. 1985). Decomposed organic matter, if present in large quantities,
imparts to the soils dark grey to black color. At high moisture contents, decomposed
organic matter may behave as a reversible swelling system. At some critical stages
during drying, however, this reversibility ceases and this is often manifested by a large
decrease in the Atterberg limits because of drying. Humus helps to stabilize the structure
by forming structural units called aggregates, which are similar to flocs. It also increases
the cation exchange capacity of the residual.
Soil organic matter consists not only of humic substance but also non-humic
substances. The non-humic substances have recognizable physical and chemical
properties and consist of carbohydrates, peptides, amino acids, fats, waxes, and low
molecular weight acids. These compounds are easily attacked by soil microorganisms and
persist in soil for only a brief period of times (Sparks. D.L., 1995)
During the water treatment process, hardness and color are usually removed by
addition of lime and/or soda ash. Colloidal particles are removed from water by the

6
addition of coagulants, which induce flocculation. Some ions in the residual are retained
in soils by cation and anion exchange, precipitation, and weak electrostatic attraction and
as a complex with organic matter.
Alum, ferric chloride, ferric sulfate, and lime are mainly used as coagulants in
water treatment process. Some water treatment plants use lime as conditioning agent in
dewatering processes. These additives are used to promote colloidal aggregation by
destroying the forces that stabilize colloidal particles. When these destabilized colloidal
particles move toward each other and become attached during the sedimentation or
dewatering process, flocculation occurs.
Clay colloidal impurities in receiving water usually carry negative charges. Since
like charges repel, these similarly charged colloids are held apart from each other by their
electric charges and thus are prevented from aggregating into larger particles. When
coagulants are added (like alum or ferric sulfate, etc.), they will dissociate to yield A1 3- or
Fe3 + ions. In turn, these ions hydrate to form a variety of aquametal complexes such as
Al (OH) 2+, Al (OH) 2+ and other poly-nuclear species such as aluminum hydroxide
polymer (A1 8(013)204±). These species are capable of being adsorbed at the surface of
colloidal particles, reducing the surface potential. The negative charges of colloids are
neutralized by a swarm of positive ions in the solution called diffused double layer
(DDL), resulting in the destabilization of the colloidal particles. The DDL imparts a net
positive charge at the edges of the colloidal particles. During processes such as
flocculation, the charges at the edge participate to form an edge-to-face linkage between
particles. The resulting structure is referred to as a floc-structure. The structure thus
formed is sometimes called salt type floc-structure (Lambe and Whitman 1969).

7
1.3. Characteristics of WTP Residuals
Despite some common characteristics, WTP residuals behave significantly different from
one treatment plant to another. Variations in properties have also been observed even in
the residuals of the same plant. Characteristics of residuals depend mainly on the quality
of water, treatment processes, chemicals added, and methods of dewatering. A detailed
study of residuals and their characteristics is a prerequisite for engineers involved in safe
and economical disposal of WTP residuals.
Generally, geotechnical behavior of WTP residual material is not only a function of
the physical and chemical composition of its solid contents but also a function of the
type, amount, and chemical nature of the pore fluids. As the structure and the solids,
content of the WTP residual change, interactions between the solid and the liquid phases
such as cementation takes place. This will affect the geotechnical properties such as
compaction, shear strength and permeability.
Change in the water content (amount and distribution) of residual materials is the
greatest single cause of variation in their geotechnical properties. It will not only alter the
floc structure and the particle sizes of the solids but will also change the ion
concentration and complex formation within the residuals.
1.3.1. Prior Studies Related to WTP Residual Characteristics
Research performed on WTP residuals, to date, indicate the drastic change in
characteristics of WTP residuals from one treatment plant to another. Parameters such
as, the quality of raw water, treatment processes, chemicals added, and methods of
dewatering are found to have a significant effect on the characteristics of the WTP

8
residuals. The other possible factors that contribute to the variation in characteristics of
residuals are the heterogeneity in the properties of soil in the catchment area of the water
source and seasonal variation of water levels in the watercourses. A brief summary of
some common characteristics of residuals presented in the literature is described below.
Elliott et al. (1990) conducted a study on the land application of WTP residuals.
For the 20 WTP residuals tested, they found that the typical WTP residuals were
predominantly inorganic. On an average, the residuals contained 3 percent by weight of
organic carbon, which is stable and resistant to degradation. The nitrogen content is
similar to that present in soil, which is 0.6 percent by weight. Trace metal concentrations
in WTP residuals are between those of soils and sewage sludge. The total concentrations
of the six metals (cadmium, copper, chromium, nickel, lead, and zinc) studied, varied
considerably. Only two WTP residuals had total Ni levels close to the maximum
recommended level (200 mg/kg) allowed in Pennsylvania for land application of waste
materials. WTP residuals contain very low concentrations of phosphorus and large
amounts of aluminum and iron hydroxide solids. The microbial toxicity of the residuals
was very low except for two samples that had high concentrations of extractable Nickel
and Cadmium.
In order to determine leaching of metals from coagulant residuals and their effect
on water sources, George et al. (1991) conducted alum residual toxicity studies and found
that toxicity occurs with both acidic and basic extracts and not with circumneutral
extracts. They also reported that no chronic toxicity was measured with the alum residual
extracts from the four water treatment plants tested. The data indicate that water utilities
may adversely affect aquatic production by discharging alum residuals in acidic receiving
9
waters and soft surface waters with a hardness less than 40 mg CaCO 3/L. A pilot
evaluation study for toxicity of WTP residuals was conducted by Cornwell et al. (1992).
For the three residuals studied, they found that all three residuals were non-hazardous
based on the results of Toxicity Characteristics Leaching Procedure (TCLP) tests. Some
degree of leaching of arsenic, copper, iron, manganese, and zinc was observed from all
residuals; however, the percentage of the total contaminants that leached was under 3
percent and often below 1 percent.
Historically, physical characteristics of WTP residuals have not been a major
concern. This is because ultimate disposal practices did not have stringent strength
requirements. Disposal of dewatered residual was typically governed by solids
concentration (Cornwell et al. 1992). To establish design guidelines and criteria for
residual handling, determination and understanding of the fundamental properties of
these residuals are essential.
In one of the early studies on this subject, Raghu and Hsieh (1987a, 1987b)
performed modified Proctor compaction tests on a lime/alum type residual and a lime
type residual. Compaction curves exhibited typical one-hump shape. For the lime/alum
residual, the optimum water content was about 65 percent and the maximum dry unit
weight was about 51 pcf. The corresponding numbers for the lime residual were 28
percent and 84.5 pcf respectively. Cornwell et al. (1992) reported the results of standard
Proctor compaction test on a coagulant residual that had been stored at a water plant for
an extended time. The test results showed the typical one-hump compaction curve.
Optimum moisture content and maximum dry unit weights were approximately 17
percent and 105 pcf, respectively. Wang et al. (1992a, 1992b) reported the engineering

10
behavior of one ferric and two alum coagulant WTP residuals. Test results indicate that
the residuals were extremely plastic and highly compressible. The compaction curve for
the iron type residual exhibited typical one-hump shape, whereas that for the alum
residuals showed no peak. Wang et al. (1993) found that the compaction curve for alum
type WTP residual was not that of the typical one-hump. Instead, it exhibited a
monotonically decreasing pattern, the dry density decreased with increasing water
content from a maximum near zero water content.
Raghu and Hsieh (1987a, 1987b) calculated the coefficients of permeability for two
residuals from the results of one-dimensional consolidation tests. They found that the
residuals were relatively impermeable and the ranges of permeability varied from 10 -6 to
10 -7 cm/s. Knocke and Wakeland (1983) investigated the compressibility of four
residuals, --alum (low density), alum (high density), conditioned alum, and lime
residuals. The average compression indices for the first three alum residuals ranged
between 0.94 and 0.97, whereas the lime residual had a compressibility index of 0.79.
These results indicate that the lime residual was considerably less compressible than the
alum residual. Wang and Tseng (1993) reported the permeability characteristics of an
alum water-treatment residual treated separately with a slaked lime and fly ash. They
showed that, for both the treated and the untreated residuals, the permeability-versus-void
ratio relationship was expressed as a power function as opposed to an exponential
function. Under the same void ratio, the treated sample was found to be more permeable
than the untreated sample.
Available information on the shearing strength characteristics of WTP residuals
concentrates mainly on the undrained strength. Raghu and Hsieh (1987a) conducted

11
unconfined compression and direct shear tests on lime residuals. They have reported an
unconfined compressive strength of 9.6 psi at a dry density of 84.5 pcf and moisture
content of 28 percent. The direct shear tests made at the same density and water content
gave an angle of internal friction of 28 degrees and cohesion of 2.5 psi.
Cornwell and Koppers (1990) determined the shearing strength of WTP residuals
obtained from 14 utilities at solid contents ranging from 20 to 50 percent using a
laboratory vane shear apparatus. They have observed a very inconsistent variation of
shear strength with respect to solids content. The vane shear strength was found to vary
from 2 kPa to 40 kPa for solids for solids contents ranging from 20 to 50 percent. They
also found that 72% of the samples failed to satisfy the minimum required shear strength
of 10 kPa, to be placed in landfills.
Novak and Calkins (1975) after studying the shearing strength of five soft residuals
using a torvane recommended a minimum undrained strength of 0.04 tsf for easy
handling of residuals. This minimum shear strength is about 2.5 times lower than 10 kPa
(0.104 tsf) currently used in Germany and Netherlands for determining the acceptability
of WTP residuals for disposal in a landfill (Cornwell and Koppers 1990). Using both a
torvane and a viscometer, Huang (1979) presented a relationship between the undrained
shear strength and solids concentration for two residuals. He observed that the undrained
strength increased with increase in solids content.
Knocke and Wakeland (1983) found that WTP residuals exhibit marked increase in
strength due to thixotropic hardening. However, very little information on the thixotropic
behavior of WTP residual is currently available. Alvi and Lewis (1986) suggested that in
residuals, the attractive forces due to cementation dominate over gravity forces.

12
Wang et al. (1992) tested one iron and two alum coagulant WTP residuals and
found that the samples were highly sensitive and thixotropic. For the same moisture
contents, ferric residuals had higher shear strength than alum residual samples.
Wang et al. (1993) found that mixing of alum residuals with certain additives
increases the shear strength considerably. The undrained shear strength of untreated
residual was low. Both the untreated and the treated residuals were sensitive and highly
thixotropic.
The major constituent of any of the WTP residuals is water. In the case of lime
residuals, the dewatering characteristics are related to the calcium and magnesium molar
ratio. A residual with a calcium and magnesium ratio less than two will be difficult to
dewater AWWA (1981). Studies have also shown that the calcium carbonate formed
during the chemical reaction also affects the residual thickening and dewatering (Judkin
and Wynne (1983).
Softening and coagulation of residuals tend to be thixotropic and the coagulated
residual is generally gelatinous AWWA (1978). In the case of alum residual, the
chemically bound water is about 40 percent of the total water content and therefore, it
will be difficult to dewater a residual in the form of chemical hydroxide to greater than 60
percent solids concentration with a mechanical device. In practice, dewatering is limited
to 45 to 50 percent solids concentration. With the passage of time, because of the
alternate freezing and thawing, and wet and dry environment, concentration of solids
increases up to 90 percent.
Ferrell et al. (1970) reported on the design of facilities for dewatering alum
residuals by natural freezing. Logsdon and Edgerley (1971) studied the relationship

13
between dewatering and rate of freezing. They observed that residuals could be frozen
effectively in thin layers. Vesilind et al. (1990) presented a conceptual model for freezing
of WTP residuals that explained the improvement of dewaterability of WTP residuals by
freezing.
1.4. Prior Work Done at New Jersey Institute of Technology (NJIT), Newark, NJ
In the research project sponsored by American Water Works Association Research
Foundation (AAWARF), Raghu and Hsieh (1997) of NJIT have investigated the
geotechnical properties of residuals from 10 water treatment plants. The results of these
investigations are explained below.
1.4.1 Particle Size Distribution of Solids
Since 95% of residual solids passed No. 200 mesh, particle size distribution was
determined by hydrometer analysis. Hydrometer tests were performed using wet residual
in the slurry form and air-dried pulverized residual. It was observed that there was a
noticeable difference in the grain size distribution curves indicating larger grain sizes
when air-dried residuals were used. In certain cases, zone settling occurred making it
impossible to determine the grain size distribution. Raghu et al. (1995) found that the
residuals lost all their plasticity and became non-plastic after weathering.
1.4.2 Liquid Limit and Plastic Limit Tests
The liquid limit and plastic limit tests are helpful to classify and characterize the
residuals. The residual samples studied during this course of research had higher liquid

14
and plastic limits than natural clays (in some cases the liquid limits and plasticity indices
were as high as 600 and 230, respectively). The residual samples with high initial water
contents had high liquid and plastic limits. Samples of residuals with low initial water
contents had low values for these limits.
The natural water content (initial water contents in tests) of one of the samples was
equal to its liquid limit. This sample was in a cake form with natural water content of
330% (initial water contents in tests) and possessed thixotropic properties. It is believed
that in its natural state, this sample possessed a flocculated structure with significant
amounts of trapped water. Upon squeezing, the floc water escaped and slurry was
formed. Without water being added, the sample lost its shear strength. This residual
behaved like a sensitive fine-grained soil, which loses strength upon remolding.
1.4.3 Specific Gravity of Solids
Specific gravity is a fundamental property. It provides vital clues about the physical
characteristics of materials and their mineral chemistry. Presence of organic matter
decreases the specific gravity and the presence of heavy metals increases the specific
gravity. This may be due to the reduction of volume and water content by shearing.
Raghu and Hsieh (1997) found that the values of specific gravity for most of the residuals
varied from 1.87 to 23 and only in one out of ten samples, the specific gravity was 2.71.
That particular residual was found to contain Iron.

15
1.4.4 Compaction Tests
Raghu and Hsieh (1997) studied the compaction characteristics of 10 WTP residuals by
both dry to wet and by wet to dry methods. Typical compaction curves plotted as percent
solids content vs. dry unit weight are shown in Figure 1.1.
In dry to wet tests, the values of maximum dry unit weight ranged from 6.0 to
14.64 kN/m3 corresponding to optimum solids contents of 50 to 80%. The relationship
between solids content (s) and water content (w) was given by the following formula.
The compaction curves for the dry to wet as shown Figure 1.1 were of one hump
form with a significant peak. In all the cases, the compaction curves for all residuals
were similar to those of mixed soils. This pattern was also observed for water treatment
residual samples by other researchers (Wang et al. 1992).
In wet to dry method, the representative sample of residuals earmarked for
compaction test was compacted by drying the residuals at room temperature. Raghu and
Hsieh (1997) noticed that the residuals behaved differently at the same moisture content
in wet to dry tests than those in dry to wet tests. The compaction curves were of odd
shape without a definite peak. Further the values of maximum dry unit weights were
lower than those obtained from dry to wet tests. These trends are clearly observed in
Figure 1.1. Raghu and Hsieh (1997) attribute this strange pattern to the floc structure of
WTP residuals and the process of cementation.

Figure 1.1 Comparison of Compaction Curves from Dry and Wet Sides for Residual RWA (after Raghu and Hsieh 1997)

17
During drying, the floc water was gradually removed from floc spaces. Edge-to-
face bonding is gradually lost and voids collapse. The flocs are held together to form a
new inter-particle bonding. Finally, floc structure gets destroyed while the particle size
increases leaving behind a dry sandy material. Raghu and Hsieh (1997) also observed
that when the dried samples of residuals were soaked in water for a week, water failed to
break the strong adhesion due to inter-particle bonding. Therefore the original floc
structure can not be recreated and the particle size distributions of the samples will
resemble those of silts or sands.
1.4.5 Unconfined Compression Tests
Raghu and Hsieh (1997) determined the unconfined compressive strength of WTP
residuals with increasing solids content. The unconfined compressive strength vs. percent
solids content as reported by them for one residual is given in Figure 1.2. They observed
that the unconfined compressive strength increased with increasing solids content up to a
certain point and it decreased with further increase in solids content.
1.4.6 Effects of Aging and Weathering on the Properties of WTP Residuals:
While working on the AWWA sponsored project "Development of Criteria for WTP
Residual monofills', the author noticed marked changes in the basic characteristics of
residuals upon aging and weathering. For this study, the fresh residual samples were
collected from a water treatment plant from New Castle, Pennsylvania. The aged and
weathered samples were obtained at different time intervals from a monofill made out of
the same residuals. The following observations were made.

Figure 1.2 Variation of Unconfined Compressive Strength with Solids Content for Residual RWA (after Raghu and Hsieh 1997)
19
1. Fresh WTP residuals had very high plasticity. The values of liquid limit and
plasticity index for residuals in their fresh state was found to vary from 280 to 425 and 82
to 225 respectively. These values were comparable to those of clay mineral
montmorrillonite. However, unlike clay minerals and clayey soils, the WTP residuals
subjected to weathering lost not only plasticity but also affinity to water. The values of
liquid limit dropped to 55 and lower. Further, as plastic limit could not be determined in
this state, as they became non-plastic. It is believed that in addition to air drying, freeze-
thaw cycles tend to expel trapped water resulting in the rearrangement of the floc
structure causing the suppression of the diffused double layer. The suppression of the
double layer leads to the cementation of the particles and increases the particle size. This
was corroborated from the results of grain-size analyses on weathered samples.
2.Water content-dry unit weight relationships for the fresh and aged samples also
revealed marked differences. In their fresh state, compaction of residuals was difficult
and compaction curve obtained was close to zero air voids curve. Further, compaction
tests performed from wet to dry state showed high optimum moisture content (OMC) and
low maximum dry unit weight for fresh residuals. However, tests performed on
weathered residuals yielded lower optimum moisture contents and relatively higher dry
unit weights than fresh residuals. This further confirmed that the residuals transform into
granular material after weathering.
3. Results of direct shear tests showed increase in angle of friction for the residuals
upon weathering.
4. From the results of one-dimensional consolidation tests, it was observed (Raghu
and Hsieh, 1997) that the compression index (C c) and the coefficient of secondary

20
consolidation (Ca )) decreased and the coefficient of permeability increased due to aging
and weathering.
1.5. Proposed Research
Although the research work on geotechnical characteristics of WTP residuals (Raghu and
Hsieh 1987) began a decade ago, a critical mass of knowledge in this area is not available
presently. Physical and geotechnical behavior of WTP residuals is not understood
completely. Therefore, this proposed research is aimed at characterizing the geotechnical
behavior of WTP residuals.
In the preceding sections, results of prior work done at NIT on characterizing
WTP residuals were discussed. One of the significant findings of that work was that the
residual materials behaved, differently under the same water contents in the wet to dry
tests than in dry to wet tests.
Compaction characteristics from dry to wet tests, show a one hump pattern,
whereas the compaction curves in wet to dry tests were odd shaped without any definite
peak. The latter pattern is unlikely for mixed soils and is only possible for highly
compressive cohesive soils with liquid limits greater than 70 (Das 1994). The hump
pattern does occur for all mixed soils. These trends indicate that the residuals undergo
irreversible changes in structure resulting in reduction of cohesion upon drying.
In order to explain the characteristics of residuals, the researcher may be tempted to
compare the residuals with clays due to the high plasticity of the residuals. Clays are the
plastic fines possessing cohesion or cohesive strength, which increases with decrease in
water content. They have very low permeability, are difficult to compact when wet and

21
are impossible to drain by ordinary means. Compacted clays are usually resistant to
erosion and piping, and are not normally susceptible to frost heave. Expansion and
shrinkage accompany changes in water content in clays. Properties of clays are
influenced by, size shape and mineralogical composition.
WTP residuals are also made up of clay, silt and sometimes-fine sand particles with
higher concentrations of cations and organic matter. The values of compacted density for
WTP residuals are much lower than clays. Residuals are susceptible to frost action.
Unlike clays, the behavior of residuals is different in wet to dry conditions and dry to wet
conditions. Hence, the WTP residuals do not behave like clays.
Since no explanation for the irreversible changes occurring in WTP residuals due to
loss of water is available in literature, the following hypothesis has been proposed. It is
believed that with the egress of water, the concentration of cations increases resulting in
the depression of the double layer and an increase in net repulsive forces. As the particles
get closer to each other, the cations in solution, come out of solution and cause
cementation. This increases particle size, which in turn causes reduction in double layer
and increase in permeability. Due to this, more water is removed. As this process
continues, so does the cementation phenomenon.
The purpose of this doctoral research is to investigate the behavior of residuals and
to verify and confirm our hypothesis regarding the mechanisms that alters basic nature of
residuals from cohesive to cohesionless upon drying. Results of this study can be utilized
to predict the long-term behavior of the residuals in monofills and to determine beneficial
uses of this waste material. Geotechnical tests will be conducted on WTP residual
samples in fresh, dry and freeze-thawed conditions to determine the index properties,

22
specific gravity of solids, compaction and shear strength characteristics. X-ray diffraction
(XRD) and X-ray fluorescence (XRF) analyses will be conducted to determine the
chemical composition. Microstructures of these residuals will be investigated using
environmental scanning electron microscope (ESEM) and energy dispersive spectrometer
(EDS). Electron micrographs, elemental maps and EDS spectra will be obtained from the
aforementioned tests. Based on these results, conclusions will be drawn for the changes
in behavior of residuals from fresh state to dry and freeze-thawed states.
CHAPTER 2
ORIGIN AND PRODUCTION OF RESIDUAL SAMPLES TESTEDFOR THIS STUDY
2.1 General
Samples of WTP residuals for this study were collected from six treatment facilities
whose locations are listed in Table 2.1. This table also presents information describing
the designations used in this study for residual samples, the types of WTP residuals and
water sources.
Samples were collected directly from the drying beds and dewatering machines,
since the purpose of this research was to investigate the dried/dewatered residuals which
are ready to be disposed off. The respective utility personnel shipped STD and VDD
samples to New Jersey Institute of Technology (NJIT). They were properly labeled and
placed in the coolers with freeze packs. Appropriate procedures were followed during
transportation, storage, and preparation for testing so that samples would not be disturbed
or cross contaminated (USEPA 1986)
2.2 Treatment Plants from which Samples were Collected
2.2.1 Ellwood City Water Treatment Plant, Ellwood City, Pennsylvania
The water source for this plant is Slippery Rock Creek. Figure 2.1 displays the flow
diagram for this plant. Average water production is 8 mgd (3 x 10 4 M 3/d). Impurities in
water are turbidity, taste and odor, iron, and hardness (Table 2.2). Water treatment
processes include coagulation with lime, sometimes oxidation with KMnO 4, pre-settling,
23

24
sedimentation, filtration and chlorination. Ferric Chloride and cationic polymer are used
as coagulants. Backwash water from dual media gravity filtration and sedimentation
residuals is directly sent to lagoons. Then they are moved to a drying bed and transported
to a monofill after drying.
Table 2.1 Information summary of water treatment plant facilities and residual samples
Residual
Designation
Residual
Type
Location Water source
ELD Lime Ellwood City Water Treatment Plant,
Ellwood City, PA
Slippery Rock Creek
HWD Alum Haworth Water Treatment plant at
Harrington Park, NJ
Hackensack River
JCD Lime Jersey City Water Treatment plant at
Boonton, NJ
Rockaway River and
Boonton Reservoir
STD Polymer Sturgeon Point Water Treatment
Plant, Derby, NY
Lake Erie
VDD Alum Jerome D. Van de Water, Water
Treatment Plant, Tonawanda, NY
Niagara River
WQD Polymer Wanaque Water Treatment Plant at
Wanaque, NJ
Wanaque reservoir

25
2.2.2 Haworth Water Treatment Plant at Harrington Park, New Jersey
Haworth Water Treatment Plant (Figure 2.2) has a peak capacity of 160 mgd (6.1 x 10 5
M3/day) at two treatment plants and an average capacity of 103 mgd (3.9 x 10 5 M3/day).
The surface water from Hackensack River and Pascack Brook is stored in the reservoir,
and is then pumped into an ozone contactor. Water is then subjected to flotation/skimmer,
dual media filtration, and finally it flows into the distribution system after disinfection.
The impurities in raw water include hardness and color (Table 2.2). Alum is used as
coagulant in the coagulation process (Table 2.3). Activated carbon is used occasionally.
Ozone is used as the primary disinfectant. The backwash water from dual media filters is
pumped into the lagoons and is transported to the drying bed after thickening. The
residual sample was collected from the drying bed.
2.2.3 Jersey City Water Treatment Plant at Boonton, New Jersey
Water treated in Jersey City Water Treatment Plant (Figure 2.3) is collected from the
Rockaway River and Boonton Reservoir. This plant produces 47 to 80 mgd (1.7 to 3.0 x
10 5 m3 /day) of water. Impurities in raw water include turbidity, color, iron, and hardness
(Table 2.2). Treatment processes consist of rapid mix coagulation, flocculation, filtration
and chlorination. Lime, alum, and polymers are used as coagulants. WTP residuals,
produced from coagulation and filtration, are conditioned by adding 59 percent of lime
and dewatered with plate frame filter press (table 2.3). The amount of residual cake
generated in this plant is approximately 8,000 lb/day (3,616 kg/day). The dewatered
residual has a solids content of about 25-35 percent.

Figure 2.1 Flow Diagram of Ellwood City Water Treatment Plant of PennsylvaniaAmerican Water Company Western Division in Ellwood City, PA.
26

Figure 2.2 How Diagram of Haworth Water Treatment Plant at Harrington Park NJ.
27

Figure 2.3 Flow Diagram of Jersey City Water Treatment Plant at Boonton, NJ.
28

29
2.2.4 Sturgeon Point Water Treatment Plant, Derby, New York
The flow diagram of Sturgeon Point Water Treatment Plant, shown in Figure 2.4. This
plant has a maximum production capacity of 90 mgd (3.4 x 10 5 M3 /d). Raw water from
Lake Erie is pumped into rapid mixing tanks where dispersion of pretreatment chemicals
(powder activated carbon and chlorine) is accomplished. Chemically treated water from
the mixing tanks flows by gravity to coagulation tanks for flocculation and
sedimentation. From here, water flows to mixed-media filters. Filtered water is treated
with chlorine, caustic soda and fluorine and stored on-site in a clearwell from where it is
pumped into the distribution system. Filtered residuals from the coagulation basins and
filter backwash waste water flow to thickener/clarifier tanks. Decant water from this tank
is blended with raw water. Thickened residuals are led into lagoons. Dewatered residuals
from the lagoons are taken to retention area for disposal.
2.2.5 Jerome D. Van de Water, Water Treatment Plant, Tonawanda, New York
Flow diagram of Jerome D. Van de Water, Water Treatment plant is shown in Figure 2,5.
The current rated capacity is 49 mgd (1.9 x 10 5 M3 /d). Raw water is mixed with alum in
the rapid mixer and flows to flocculation and sedimentation basins. Then chlorine is
added and the water is sent to mixed- media filters. The water is then mixed with caustic
soda, fluosilicic acid and chlorine and conveyed to the distribution system. Filter
backwash water is pumped into equalization tanks. Wastewater from coagulation basins
and the equalization basins is thickened utilizing sludge thickener and decant tank.
Thickened residual is conditioned in a conditioning tank and dewatered using pressure
filtration and then disposed.

Figure 2.4 Flow Diagram of Sturgeon Point Water Treatment Plant at Derby NY.
30

Figure 2.5 Row Diagram of Jerome D. Van de Water, Water Treatment Plantat Tonawanda, NY.
31

32
2.2.6 Wanaque Water Treatment Plant at Wanaque, New Jersey
The flow in the Wanaque water treatment plant (Figure 2.6) varies from 40 to 140 mgd
(1.5 to 5.3 x 10 5 M3/day), and the average capacity is 105 mgd (4.0 x 10 5 M3/day). Water
is stored in Wanaque Reservoir before treatment. Impurities in raw water mainly consist
of turbidity, color, iron and manganese (Table 2.2). The water treatment process involves
pretreatment (premix basins and reaction basins), coagulation, sedimentation, and
filtration. Alum and polymer are used as coagulants (Table 2.3). WTP residuals,
produced from settling basins and filters, flow to lagoons and have an average solids
content of 0.25 to 1.0 percent. The residuals were dewatered with a belt press-dewatering
machine to a concentration of 14 percent solids content and then air dried in a drying bed.
Table 2.2 Impurities in water sources (yearly range)

Figure 2.6 Flow Diagram of Water Treatment Plant of North Jersey District WaterSuppy Commission in Wanaque, N.J.
33

Table 2.3 Water treatment processes, chemicals added (yearly average value)
34

Table 2.3 (continued)
35
The information presented here will be helpful in analyzing and interpreting the
geotechnical and geoenvironmental test data presented in this research.

CHAPTER 3
TESTING TECHNIQUES AND PROCEDURES
This chapter deals with the testing techniques adopted to characterize the residuals
considered for this study. Tests conducted include physical and geotechnical tests, X-ray
diffraction (XRD) to determine the inorganic mineralogical composition, X-ray
fluorescence (XRF) to determine the elemental chemical composition. Environmental
Scanning Electron Microscope (ESEM) and Energy Dispersive Spectrometer (EDS) were
used to study the microstructure, the distribution of elements on the surface (elemental
mapping) and the mineral composition.
The XRD analysis was carried out by using Philips PW 3040-MPD X'PERT
machine. The XRF study was made by using Philips PW 2400 Spectrometer. In the study
of fabric of residuals, Electroscan ESEM 2020 was used. Dispersive X-ray scanning was
studied using Kevex Super Dry EDX. Malvern's MasterSizer X was used to measure the
grain size analysis. In all these cases testing procedure was followed in accordance with
the manufacturers' manual.
Barring a few, most of the geotechnical tests listed below were conducted in
accordance with American Society of Testing and Materials (ASTM) standards and the
reader is referred to ASTM (1997) for detailed discussions of the test procedures. In
some cases where the ASTM procedures were not available, the tests were carried out in
accordance with reference cited. In some cases the test procedures were modified from
ASTM standards and/or formulated to suit the requirements of testing of residuals.
36

37
For all geotechnical tests, quartering was performed to obtain the required quantity
of representative samples. All tests were repeated at least three times and the average
values were reported. Following is the list of all the tests conducted on residuals.
1. Natural moisture content ASTM D 2216 (modified)
2. Specific gravity tests ASTM D 854
3. Organic content determination ASTM D 2974
4. Grain size analysis ASTM D 421 and 422
5. Atterberg limits (dry to wet)
6. Atterberg limits (wet to dry) ASTM D 4318
7. Compaction tests (dry to wet) ASTM D 698
8. Compaction tests (wet to dry)
9. Unconfined compression tests ASTM D 2166
10. Direct Shear tests ASTM D 3080
11. Freeze and thaw tests ASTM D 560
12*. X-ray diffraction analysis Manufacturer's Manual
13. X-ray fluorescence spectroscopy Manufacturer's Manual
14. Study of the fabric
(a) Scanning electron microscope Manufacturer's Manual
(b) Image mapping by Energy
(c) Dispersive X-ray scanning Manufacturer's Manual

38
3.1. Natural Water Content
Water present in the pores is in the form of gravitational water, capillary water, and
adsorbed water; it can also be present as chemically bounded water within the crystalline
lattice of clay particles (Wilun. Z, and Starzewski. K 1972)
On heating up to 150 ° C, free water, capillary water, and some of the weakly held
water on the perfect crystal faces is lost. On further heating from 150 ° C to 400 ° C, water,
which is strongly held by the free ions at the points of imperfections in the crystalline
lattices and at the edges of the clay crystals, is evaporated. Only on heating to
temperatures higher than 400 ° C does the chemically bounded water in the form of
hydroxides, contained within the crystalline lattices of clay minerals, begin to evaporate.
Because a given soil loses different quantities of water, depending on the temperature, in
engineering analysis of soils, a temperature range of 105-110 ° C has been adopted.
However, for organic soils drying temperatures of 105 - 110 ° C drives out significant
amounts of organic matter (Singh. A 1975). As the residuals were suspected to possess
organic matter their water content was determined at 60 ° C. Drying of residuals at 60 ° Crequires a prolonged drying period of about 48 hours.
3.2 Specific Gravity of Solids Tests
For inorganic soils, specific gravity values ranges from 2.6 to 2.8. Organic soils and
residuals have low specific gravity values. In this test, removal of air is the critical factor.
ASTM recommends air removal either by heating the contents of the pycnometer in a
temperature bath for about 15 minutes or by applying a vacuum. As heating may result in
loss of volatile solids and organic matter, air was removed by the application of vacuum

39
to the sample. For all the residuals considered in this study, the specific gravity tests were
carried out on freeze/thaw sample and samples dried at 60 ° , 105 ° , 250 ° and 550 ° C.
3.3 Organic Content Determination
The total organic/carbon content consists of first drying in a constant temperature oven at
105 ° C for 24 hours. This dried mass is further dried in a muffle furnace at 550 — 600 ° Cfor about 2 hours. The ratio of loss in weight to the weight of the dry sample dried at 105 °C is called the total organic/carbon content. ASTM recommends a drying temperature of
105 ° C for inorganic soils to remove water. As the residuals were suspected as highly
organic, they were first dried at 60 ° C to remove water. The organic/carbon contents were
also determined at drying temperatures of 105 and 250 ° C.
3.4 Particle Size Analysis
Particle size distribution of solids in residuals can be quantitatively determined by
conducting sieve analysis for the coarse portion and by hydrometer analysis for fine
portion of the particles. Depending upon the particulate media and the extent of particle
size distribution required, particle size analysis may involve both sieving and hydrometer
analysis or it may be restricted to either one of them. As the residuals contain sand, silt
and clay size particles combined sieve and sedimentation analyses were performed. The
representative samples used for these tests were prepared by quartering. PSA required a
very small quantity of sample of about 5 grams in the form of suspension. This
representative sample was taken after homogenizing the entire residual. In order to get
the consistent and reliable data the grain size distribution was repeated for six times.

40
3.4,1 Particle Size Analyzer (PSA)
Particle size distribution for fine-grained particles such as WTP residuals is usually
performed by hydrometer analysis. Xia (1994), Raghu and Hsieh (1997) reported that
hydrometer tests could not be performed for some residuals due to zone settling. In such
circumstances, laser beam techniques to measure particle size distribution can be
employed.
The sample preparation stage is particularly important to obtain accurate and
reproducible results. The sample should be preferably in the form of suspensions in a
liquid media. Fresh, air-dried, and freeze-thawed residual samples tested for this study
were mixed with water and suspensions were prepared. These suspensions were used in
the P SA to determine the particle size distribution. The tendency for the particles to stick
together and form flocs is prevented by mechanical action of stirring and ultrasound
using Master Sizer X-15 (MSX 15) sampling unit.
3.5 Compaction tests (Wet to Dry)
This method of test is a deviation from the standard test procedure. This method consists
in running the test from wet side than from the dry side. The residuals were allowed to
dry slowly under at room temperature. Compaction characteristics were studied as and
when they were ready to be compacted. This method took about ten days to complete
one compaction test.

41
3.6 Unconfined Compression Tests
Unconfined compressive strength of WTP residuals were determined corresponding to
dry unit weights and water contents of both the wet to dry and dry to wet compaction
methods. Cylindrical specimens were obtained by pushing Harvard miniature
compaction molds of diameter 33 mm and length 71 mm pushed into the compacted
residuals.
3.7 Freeze-Thaw Tests
If a WTP residual is placed in landfills, it may be subjected to cycles of freezing and
thawing. In order to determine the stability of the residuals under these conditions, freeze
and thaw tests were conducted. Cylindrical specimens of 33 mm in diameter and length
71 mm long were prepared from each residual sample at its original (natural) condition.
The specimens were prepared by compacting the residuals in a Harvard miniature
compaction mould by spring calibrated 20-pounds tamping rod in five layers and each
receiving 25 blows. The molding water contents and the corresponding values of density
at which the test specimens were prepared are given in Table 4.9. If the samples were
very wet and could not be compacted in the condition in which they were received, they
were air-dried under room conditions. When the samples were in a condition to be
molded, they were prepared for testing. In such case, the molding water contents were
not the same as natural moisture contents. Then the specimens were stored in the freezer
at a temperature of -5±0.5°C for 24 hours. After this, the samples were allowed to thaw
under room temperature of 24 ± 2°C conditions for 24 hours. This 24 hours cycle of
alternate freezing and thawing was repeated 12 times for each specimen.
42
3.8 X-ray Diffraction (XRD) Spectrometer
X-ray diffraction studies for WTP residuals can be employed to detect the presence of
crystalline clay minerals that may be present. For this research work, Philips X'PERT
MPD X-ray Diffractometer was used. A 486 personal computer with X'MANAGER
software is used in controlling the instrument, acquiring data, analyzing data and making
reports.
Sample preparation: The sample preparation is an important step in XRD analysis.
It is recommended that all samples to be analyzed using XRD should not contain more
than 5% organic matter and they should pass 75 micron mesh. As WTP residuals were
rich in organic matter, it became necessary to remove them by drying the sample at 105-
degree Celsius for about 24 hours. The residuals are then pulverized using mortar and
pestle and the material passing No.200 sieve was used in XRD analysis. The percentages
passing for residuals HWD, JCD and WQD were respectively 42%, 35% and 22%
respectively.
3.9 X-ray Fluorescence (XRF) Spectrometer
Elemental compositions of WTP residuals in different states were determined by using X-
ray Fluorescence Spectrometry. For this study, Philips PW2400 wavelength dispersive X-
ray Fluorescence Spectrometer (XRF) with a Semi-Q software was utilized.
Sample preparation: For quantitative analysis, sample matrix effects should be
taken into account while preparing the sample. The sample should be homogeneous and
representative with respect particle size and distribution. The clear advantage of XRF is
that the samples can be reused repeatedly or be used with other instruments for

43
confirmation or for more detailed analyses. During the course of this study wet and dry
powder samples were used. The representative samples were first homogenized by
mixing thoroughly using a spatula and it was reduced to the required size by quartering.
In addition to quartering and homogenization, dry samples were prepared by passing the
dry residuals by sieving through 200 mesh. The material passing 200 mesh is used for
the analysis.
3.10 Fabric Determination
Both direct and indirect methods are available to study the fabric and fabric features of
fine-grained materials. Mitchell (1993) presents many methods of fabric measurement.
Of these methods, electron microscopy offers the advantage of direct unambiguous
information about the specific fabric features. For this research, observations of
microstructure of WTP residuals were performed by Environmental Scanning Electron
Microscope (ESEM) Electroscan ESEM 2020. Samples were subjected to freeze and
thaw using the cold stage system.
Sample Preparation: Representative samples were prepared by homogenization,
making sure that the particle sizes and shapes were not altered. The sample was mounted
on a specimen stub, coated with the adhesive carbon solvent and observed in ESEM. It
was ensured that the specimen was unaffected by the adhesive solvent and the coating
method did not damage the surface.

CHAPTER 4
RESULTS AND DISCUSSIONS
4.1 Introduction
This chapter deals with the results and discussions of the physical and geotechnical
characteristics of the residuals considered for this study. The discussions include the
effects of drying and freezing and subsequent thawing. It is to be noted here that the
residuals HWD, WQD and VDD are alum residuals, JCD is a lime residual and ELD is a
ferric residual. The residual STD is rich in carbon as the treatment plant uses activated
carbon to remove organic matter in raw water. All tests were conducted on three samples
of each residual and the average values are reported
4.2 Natural Water Content
The water contents for all the residuals were determined by drying in air at controlled
temperature of 20 degree Celsius, at 60 degree Celsius and at 105 degree Celsius in a
constant temperature oven. As it can be seen from the Table 4.1, there is a marked
difference in water contents indicating significant loss of organic matter when heated to
105 degree Celsius. Hence, for all subsequent geotechnical tests, water contents were
determined upon drying at 60 degree Celsius till constant weight was attained. In most
cases, the time required was about 48 hours. The natural water contents, when dried at
105 degree Celsius, varied from 115% for the residual JCD to 602% for the residual
WQD. These values of high initial water contents can be attributed to the presence of
organic matter, as their moisture retention capability is very high.
44
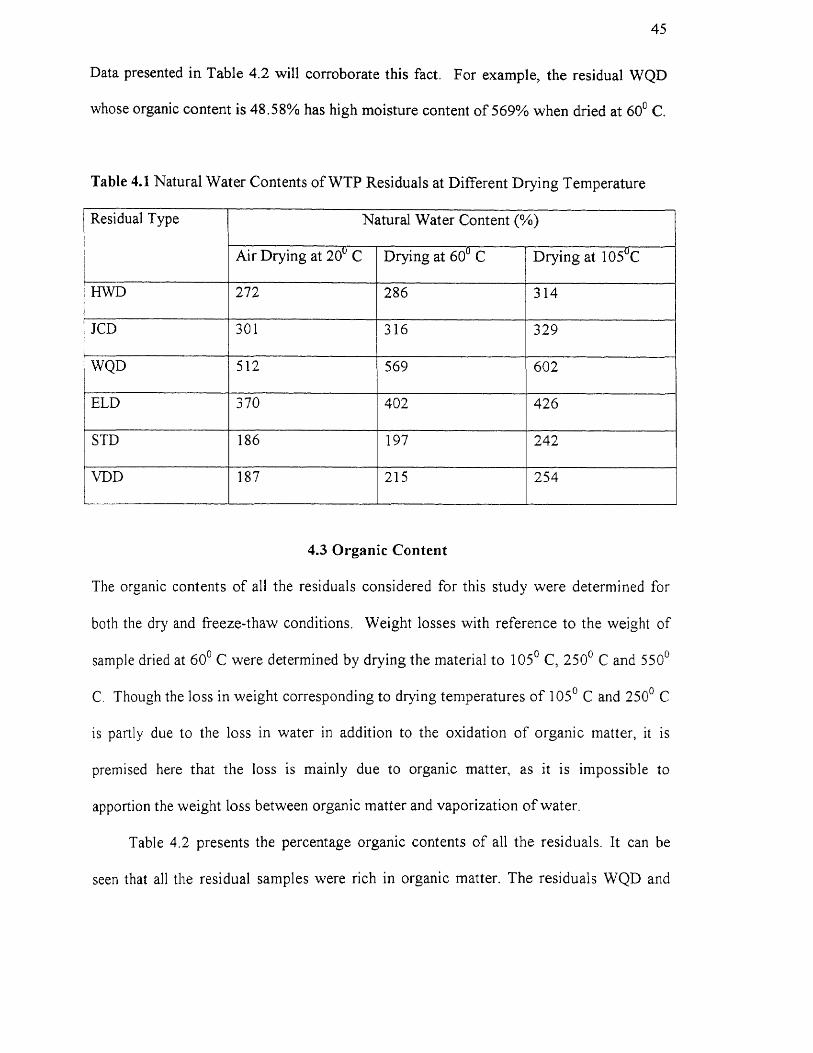
45
Data presented in Table 4.2 will corroborate this fact. For example, the residual WQD
whose organic content is 48.58% has high moisture content of 569% when dried at 60° C.
Table 4.1 Natural Water Contents of WTP Residuals at Different Drying Temperature
4.3 Organic Content
The organic contents of all the residuals considered for this study were determined for
both the dry and freeze-thaw conditions. Weight losses with reference to the weight of
sample dried at 60 ° C were determined by drying the material to 105 ° C, 250° C and 550 °C. Though the loss in weight corresponding to drying temperatures of 105 0 C and 250 ° Cis partly due to the loss in water in addition to the oxidation of organic matter, it is
premised here that the loss is mainly due to organic matter, as it is impossible to
apportion the weight loss between organic matter and vaporization of water.
Table 4.2 presents the percentage organic contents of all the residuals. It can be
seen that all the residual samples were rich in organic matter. The residuals WQD and

46
HWD possess very high organic fractions of 48.58% 41.85% respectively. The effect of
freezing and thawing on organic matter was also studied by determining organic content
of residuals which have been subjected to 12 cycles of alternate freezing and thawing.
These values are presented in the extreme right column of table 4.2. The variations in
organic contents for all the residuals from air-dried to freeze-thaw conditions is less than
2%. For all practical purposes, this variation is negligible. Hence it can be inferred that
freeze and thaw conditions do not change the organic contents of residuals.
Table 4.2 Organic Contents of the WTP Residuals at Different Drying Temperatures
4.4 Specific Gravity of Solids
Specific gravity of solids for all the residuals was determined utilizing residuals dried at
different temperatures and for freeze-thawed samples. The ash was removed by washing
and filtering the dried samples. The results obtained and presented in Figure 4.1 and

47
Table 4.3 show that with the increase in drying temperatures the specific gravity values
increase. This indirectly suggests that, as in most of the organic soils, organic phase
(indicated by the weight losses) of WTP residuals is responsible for low values of
specific gravity. .But, upon heating, the specific gravity of solids increases. For instance,
the specific gravity of the residual JCD that had a total organic content of 34.5% was 2.11
before the oxidation of organic matter. However, upon heating and drying at 550 ° C, the
specific gravity rose to 2.75. This means that there is an increase of 30.3% in the values
of specific gravity. As it can be seen from Table 4.3 after the oxidation of organic matter,
all residuals experienced an increase in specific gravity values and the range of increase
varied from 28.7 to 53.6%.
As the sample loses weight upon heating to high temperature, two things happen.
Organic contents are reduced. The oxides such as Calcium oxide, Iron oxide and alumina
come out of solution and cement the grains of solids in the residuals. The reduction in the
organic matter and the change in chemical composition due to cementation by metal
oxides cause increase in the specific gravity of solids of the WTP residuals. Further
discussion on the cementation phenomenon will be presented at the end of this chapter.
By comparing the specific gravity, values for freeze—thaw and dried samples at 60 °C again we can reconfirm that freeze and thaw do not bring about any change in organic
matter. For instance, the residual JCD possessed a specific gravity value of 2.11 both
during freeze-thaw and drying at 60 ° C. The same trend has been observed for all the
other five residuals

Figure 4.1 Variation of Specific Gravity with Increased drying Temperatures

49
Table 4.3 Specific gravity values at different drying conditions.
Residual
sample
Freeze/Thaw
weathered
Dried at
60°C
Dried at
105°C
Dried at
250°C
Dried at
550°C
Percent
Increase from
60° to 550° CHWD 1.75 1.66 1.88 2.10 2.55 53.6
JCD 2.11 2.11 2.38 2.51 2.75 30.33
WQD 1.92 1.93 2.12 2.36 2.52 30.56
ELD 2.02 2.02 2.18 2.35 2.60 28.70
STD 1.95 1.95 2.26 2.42 2.52 29.20
VDD 1.83 1.84 2.00 2.15 2.42 31.52
4.5 Atterberg Limits
The properties of interest are liquid limit, plastic limit and plasticity index. These
characteristics are not only important in classification and identification but also in
predicting engineering behavior such as strength and compressibility. These limits and
indices were determined on samples at their natural water contents, air-dried, and freeze-
thaw conditions respectively. The results are tabulated in the Table 4.4.
By studying the results presented in Table 4.4, one will underscore the drastic
reduction in the plasticity characteristics of the residuals due to drying, freezing and
subsequent thawing. In the fresh state, all of these residuals were soft and plastic with
very high liquid limits and plasticity indices. The alternate freezing and thawing
conditions rendered all residuals non-plastic. However after air-drying all of the
residuals except ELD became non-plastic. In the dry to wet tests on air-dried samples,

50
this residual had plasticity index of 82, that is much lower than that for fresh residual in
wet to dry state. This indicates that freezing and thawing is more effective in
transforming a plastic residual to a non-plastic material especially for the residuals such
as ELD.
Table 4.4 Atterberg Limits and Indices for WTP Residuals.
Residual Liquid limit Plastic limit Plasticity Index
Wet
to
Dry
Dry
to
wet
Freeze-
Thaw
Wet
to
Dry
Dry to
wet
Freeze-
Thaw
Wet
to
Dry
Dry
to
wet
Freeze-
Thaw
HWD 371 107 110 228 NP NP 144 NP NP
JCD 329 37 42 200 NP NP 129 NP NP
WQD 690 151 165 20 NP NP 670 NP NP
ELD 330 125 70 212 43 NP 118 82 NP
STD 161 55 53 57 49 NP 104 6 NP
VDD 206 118 110 115 NP NP 91 NP NP
Note: NP indicates Non-plastic.
The residual WQD had a very high liquid limit of 690, and plastic limit of 20
possessed a very high plasticity with a plasticity index of 670. But the same residual lost
all of its plasticity upon drying and freezing and thawing. The values of liquid limit
corresponding to these two conditions are 151 and 165 respectively and in both the cases
plastic limit could not be determined. This transformation might be due to the

51
suppression of double layer, which increased the growth of particles by flocculation and
cementation. Further, the loss of plasticity is found to be irreversible as the residuals lost
affinity to water. This means that the water treatment plant residuals will not rehydrate
when water is added. More discussion on the causes and mechanisms responsible for the
loss of plasticity will be presented in later sections of this chapter.
4.6 Particle Size Distribution
Particle size distributions for all the residuals were determined by the sieve analysis,
hydrometer analyses and Particle Size analyzer (PSA). In their fresh states, combined
sieve and sedimentation analyses were carried out on residuals JCD, ELD, STD and
VDD. Hydrometer and PSA tests were employed to determine grain size distribution of
fresh residual HWD. However in the case of fresh residual WQD, hydrometer test was
not successful since the sample formed a gel. The grain size distribution of that residual
was determined by PSA. For sample JCD in the fresh state, grain size distribution by
PSA was not possible, since the sampling chamber choked up, probably due to the high
calcium compounds present in that sample. For dry and freeze and thaw samples, the
grain size distribution was determined by combined sieve and hydrometer and PSA
methods.
Figures 4.2 to 4.7 present the grain distribution of the six residuals considered for
this study under fresh, dried and freeze-thawed conditions respectively. The parameters
required for classification, --the uniformity coefficient, coefficient of curvature, sand, silt
and clay fractions have been shown in Tables 4.5 and 4.6 respectively. The specific
surfaces for all the residuals corresponding to the average size (D 50) were calculated,

52
assuming the solid particles were to be perfectly spherical. The residuals were classified
according to the unified classification system and the group names and the group symbols
are also included in Tables 4.5 and 4.6.
An examination of the results presented in the Table 4.5 and 4.6 and the grain size
distribution curves shown in Figures 4.2 to 4.7 clearly indicates the increases in sizes of
particles of residuals, due to drying and freezing and thawing. Initially in fresh state, all
these residuals were predominantly fine-grained. Upon drying, and freezing and thawing,
increase in the sizes of particles took place, making the residuals coarse-grained
materials. The values specific surface, defined as the ratio of surface area to -weight,
dropped significantly for all the residuals. Increase in particle size is more pronounced in
the residual JCD, where the value of specific surface decreased from 23800 cm 2/g in the
fresh state to 476 cm 2/g for weathered sample due to freezing and thawing. Discussion
for the possible causes will be presented later in this chapter.
The grain size distribution of residual HWD in its fresh state as obtained by
hydrometer gives smaller sizes of the particles than that of PSA. This may due to the fact
that no dispersing agent solution was used in PSA and some particles might have
flocculated. Also, it has to be pointed out here that both PSA and hydrometer techniques
do not make absolute determinations of particle size. In PSA, particle size is measured
from the diffraction patterns created by the laser beam on the sample. The hydrometer
technique is based on the measurement of settling velocities.

53
Table 4.5-Grain Size Distribution Analysis Data for HWD, JCD and WQD at DifferentConditions.
Residual HWD JCD WQD
Fresh Dry Freeze/
Thaw
Fresh Dry Freeze/
Thaw
Fresh Dry Freeze/
Thaw
% fines 86 48 35 100 30 24 65 27 34
% sand 14 52 65 --- 70 76 35 73 66
D 10(mm) 0.004 0.006 0.006 0.0008 0.014 0.014 0.0065 0.027 0.013
D30(mm) 0.012 0.024 0.06 0.0034 0.08 0.1 0.023 0.16 0.065
D 50(mm) 0.04 0.4 1.4 0.006 0.28 0.3 0.05 0.4 0.29
D60(mm) 0.024 0.24 0.8 0.008 0.5 0.38 0.07 0.6 0.4
C, 6 40 133.3 10 35.7 27.14 10.77 22.22 30.77
C c 1.5 0.4 0.75 1.8 0.9 1.88 116 1.58 0.82
Specific
surface
(cm2/g)*
2820 282 81 23800 510 476 2544 318 439
Group
Symbol OH SM SM OH SM SM OH SM SM
Group
name
Organic
silt
Silty
Sand
Silty
Sand
Organic
Silt
Silty
Sand
Silty
Sand
Sandy
Organic
Clay
Silty
Sand
Silty
Sand
*The specific surfaces are calculated by assuming the particles are as perfect spheres and the average size
D50 is used in these calculations.
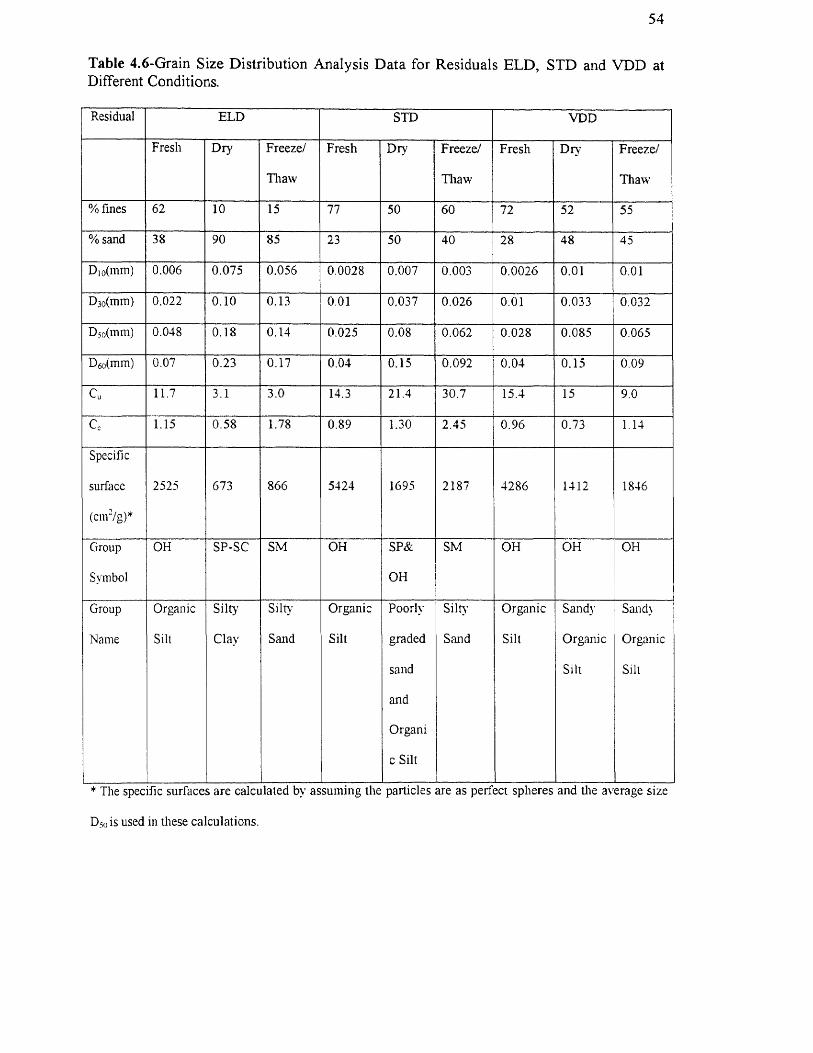
54
Table 4.6-Grain Size Distribution Analysis Data for Residuals ELD, STD and VDD atDifferent Conditions.
Residual ELD STD VDD
Fresh Dry Freeze/
Thaw
Fresh Dry Freeze/
Thaw
Fresh Dry Freeze/
Thaw
% fines 62 10 15 77 50 60 72 52 55
% sand 38 90 85 23 50 40 28 48 45
D 10(mm) 0.006 0.075 0.056 0.0028 0.007 0.003 0.0026 0.01 0.01
D 30(mm) 0.022 0.10 0.13 0.01 0.037 0.026 0.01 0.033 0.032
D 50(mm) 0.048 0.18 0.14 0.025 0.08 0.062 0.028 0.085 0.065
D 60(min) 0.07 0.23 0.17 0.04 0.15 0.092 0.04 0.15 0.09
Cu 11.7 3.1 3.0 14.3 21.4 30.7 15.4 15 9.0
Cc 1.15 0.58 1.78 0.89 1.30 2.45 0.96 0.73 1.14
Specific
surface
(cm2/g)*
2525 673 866 5424 1695 2187 4286 1412 1846
Group
Symbol
OH SP-SC SM OH SP&
OH
SM OH OH OH
Group
Name
Organic
Silt
Silty
Clay
Silty
Sand
Organic
Silt
Poorly
graded
sand
and
Organi
c Silt
Silty
Sand
Organic
Silt
Sandy
Organic
Silt
Sandy
Organic
Silt
* The specific surfaces are calculated by assuming the particles are as perfect spheres and the average size
D5 is used in these calculations.

100
90
80
70
60
50
40
30
20
10
0
10 1
0.1
0.01
0.001
Dia (mm)
--*—HWD (Dry) —11— HWD (Freeze-Thaw) —A— HWD (Fresh by Hydrometer) -- HWD (Fresh by PSA)
Figure 4.2 Grain Size Curve Depicting Increase in Size of Particles due to Weathering for Residual HWD

Figure 4.3 Grain Size Curve Depicting Increase in Size of Particles due to Weathering for Residual JCD

Figure 4.4 Grain Size Curve Depicting Increase in Size of Particles due to Weathering for Residual WQD

Figure 4.5 Grain Size Curve Depicting Increase in Size of Particles due to Weathering for Residual ELD

Figure 4.6 Grain Size Curve Depicting Increase in Size of Particles due to Weathering for Residual STD

Figure 4.7 Grain Size Curve Depicting Increase in Size of Particles due to Weathering for Residual VDD0

61
4.7 Compaction Characteristics
The compaction characteristics for the residuals were determined by performing standard
proctor tests. These tests were carried out both on the fresh residuals, by decreasing water
content (wet to dry) and by increasing water content (dry to wet). Figure 4.8 to 4.13 show
plots of dry density with water content. Table 4.7 summarizes the values of maximum dry
unit weights and the corresponding optimum moisture contents and the degree of
saturation for all the residuals obtained from theses tests.
Table 4.7 Compaction Characteristics of WTP Residuals.
Residual
Type
Dry to Wet Wet to Dry
OMC(%) Maximum Unit
Weight
(kN/m3 )
S r (%) OMC(%) Maximum Unit
Weight
(kN/m3)
Sr (%)
HWD 75 7.22 90.86 130 4.08 69.51
JCD 27 13.88 94.44 57 9.10 86.79
WQD 25 13.35 95.28 110 5.90 92.49
ELD 80 7.53 95.00 86 6.98 91.00
STD 35 12.16 96.20 46 10.30 90.23
VDD 62 8.58 96.45 94 6.30 89.20

Figure 4.8 Variation of Undrained Shear Strength with Water Contentand Dry Unit Weight for Residual HWD

Figure 4.9 Variation of Undrained Shear Strength with Water Content and Dry Unit Weight for Residual JCD

Figure 4.10 Variation of Undrained Shear Strength with Water Content and Dry Unit Weight for Residual WQD

Figure 4.11 Variation of Undrained Shear Strength with Water Content and Dry Unit Weight for Residual ELD

Figure 4.12 Variation of Undrained Shear Strength with Water Content and Dry Unit Weight for Residual STD

Figure4.13 Variation of Undrained Shear Strength with Water Content and Dry Unit Weight for Residual VDD

68
From Figures 4.8 to 4.13 and the results presented in Table 4.7, the following
observations are made:
1. For all residuals, maximum dry unit weight was greater and the OMC was
lower for tests conducted under dry to wet conditions than those under wet to
dry conditions did.
2. Degree of saturation values at OMC in dry to wet tests were higher than those
from wet to dry tests, though values obtained for OMC were very high in wet
to dry tests.
Reduction in OMC and increase in maximum dry unit weight can be attributed to
the increase in particle sizes of the residuals upon drying. For all particulate materials
with very fine particles, the specific surface is high and the water requirement for
lubrication of all the surfaces of particles is also high. Hence, in case of WTP residuals,
high values of OMC and low values of maximum dry unit weight are possible in the wet
to dry tests.
The significant drop in the values of OMC and the raise in maximum dry unit
weights in the dry to wet compaction tests reconfirmed the inference drawn from the
results of the Atterberg limit tests that WTP residuals have transformed into coarse-
grained materials. It is well known that coarse-grained soils require less water for
complete saturation than that required for fine-grained materials. For example, well-
graded sands (SW) can attain a maximum dry unit weight of about 19 kN/m3 at optimum
moisture content of about 13%. Silts of high compressibility (MH) can have a maximum
dry unit weight of 13 kN/m3 at an optimum moisture content of about 30%. Likewise as
indicated in Table 4.7, WTP residuals possess higher optimum moisture contents in the

69
wet to dry tests and lower maximum dry unit weights than those in dry to wet tests.
Further the degree of saturation is lower in the wet to dry state than those in the dry to
wet state.
4.8 Unconfined Compression and Direct Shear Tests
Unconfined compression tests were conducted at the water contents and dry unit weights
obtained from compaction tests. Cylindrical specimens of diameter 3.3 cms and length
7.04 cms were obtained by pushing Harvard miniature compaction molds into the
compacted residual samples in Proctor molds. Specimens so retrieved were tested to
failure at a strain rate of 5% per minute in the unconfined compression machine to
prevent the loss of moisture content. Three trial tests were run corresponding to each
water content and density to obtain average values.
Most of the specimens tested for unconfined strength at conditions corresponding to
"wet to dry" compaction tests exhibited bulging at failure. Failure planes, in wet
condition became noticeable after the samples were air-dried for about two days. These
planes were inclined approximately at an angle of 45 degree with the major principal
plane. Therefore the angle of friction was assumed to be zero. However, in the case of
specimens tested for unconfined strength in the dry to wet procedure of compaction
exhibited brittle failure and the inclination of failure planes to the major principal planes
ranged from 50 to 65 degrees. The undrained shear strength (S u) was calculated for all
the cases as half the unconfined compressive strength.

70
The undrained shear strength (S u) as obtained from unconfined compression tests
corresponding to the dry unit weights and water contents of dry to wet and wet to dry
compaction tests are shown in Figures 4.8 to 4.13.
From these graphs, the following trends were observed
1. In dry to wet conditions, Su decreased with increasing moisture content and
decreasing dry density for all residuals except for HWD and JCD. However, Su
for these two residuals increased with increase in moisture contents. This may
be due to increased effective stress due to capillary action
In wet to dry tests, Su increased with increase in moisture content upto a certain
point and decreased with the further increase in moisture content. For instance,
the residual HWD had an undrained strength of about 4.5 kPa at a water content
of 122%. With increase in water content, S u increased to a peak value of 14kP a
at a water content of 235%, then S u decreased to about 5 kPa at a water content
of 248%%.
Shear strength parameters of the residuals for water contents corresponding to dry
to wet method of compaction were also determined by direct shear tests. Table 4.8
presents the shear strength parameters of WTP residuals. The shear stress vs. horizontal
displacement plot and failure envelope for the residual JCD at a water content of 27%
and a dry unit weight of 13.9kN/m 3 are presented in Figures 4.14 and 4.15 respectively.

71
Table 4.8 Shear Strength Parameters Obtained from Direct Shear Tests
Residual Type Water Content
(%)
Dry Unit
Weight (kN/m3 )
Cohesion (kPa) Angle of
Internal
Friction
(Degrees)
79 7.3 2.20 32
HWD 84 7.0 3.5 29
97 6.4 4.5 25
27 13.9 38.0 35
JCD 30 13.5 41.0 31
35 12.6 43.0 28
30 12.8 7.0 33
WQD 35 12.0 7.5 29
39 11.4 7.5 27
65 7.16 16.5 25
ELD 72 7.32 18.1 20
80 7.53 20.0 16
20 11.1 -- 34
STD 28 11.9 17.53 28
35 12.2 38.52 20
54 8.3 2.25 26
VDD 62 8.6 3.57 22
68 8.3 4.9 18

Figure 4.14 Shear Stress vs Horizontal Displacement Curves for the Residual JCD.

Figure 4.15 Failure Envelope for Residual JCD.
74
4.9 Freeze-Thaw Tests
Weight losses of the samples at the end of 12 cycles are presented in Table 4.9. In
addition, cracks formed on the surface of most samples. Finally, the surface of the
material became dry, loose, crispy, and even sprawled off. Cylindrical specimens of
residuals that have experienced large reductions in volume and weight crumbled to many
pieces.
It can be inferred that the initial water content influenced the weight loss after
twelve cycles. Residual specimens with high initial water contents experienced high
losses in weight while low weight losses were observed for samples with low initial water
contents. For example, the residual WQD with the molding water content of 569%
experienced a weight loss of 82.6%, whereas the residual JCD with the molding water
content of 72% experienced the weight loss of 40.5%. This indicates that the major cause
of weight loss during freeze/thaw was the moisture loss caused by evaporation.
When a residual is being frozen and or being dried, inorganics will come out of the
solution. These substances may cause cementation and increase in particle size. Freezing
of water is always associated with increase in volume and the overall increase is about
9% (Mitchell 1993). Volume expansion caused by freezing of water will cause some of
the unfrozen water in the residual to squeeze out due to increased permeability. This
increased permeability may also be due to increased grain size caused by cementation.
These phenomena cause both volume and weight reduction of residuals. Since the
cylindrical specimens of residuals in our study cracked and crumbled the volume changes
could not be measured. But the percentage weight loss based on the total initial weight
were recorded in Table 4.9

75
Table 4.9 Freeze-thaw test results of water treatment plant residual samples
Residual Type Molding
Water
Content(%)
Molding Dry
Unit
weight(kN/m3)
Solids Content
(%)
Weight loss (%)
Based on total
weight
HWD 286 2.50 25.9 72.5
JCD 72 8.4 58.1 40.5
WQD 569 1.58 14.9 82.6
ELD 402 2.17 19.9 78.5
STD 197 4.07 33.7 69.5
VDD 215 3.73 68.5 68.5
4.10 Chemical Composition of WTP Residuals from XRF
The chemicals added to thicken and condition the residuals brings about changes in their
chemistry. In order to determine the effects of normal air drying, freezing, and thawing
conditions on the chemical composition of the residuals, representative samples were
analyzed using wavelength X-ray fluorescence spectrometry (XRF). Table 4.10 shows
average percentile concentration of compounds present in the residuals HWD, JCD and
WQD in their fresh, air dried, and freeze/thaw conditions as determined by XRF.
From the data presented in Table 4.10, it can be noted that there is no significant
variation in the chemical compositions of residuals in their fresh, air dried and freeze-
thaw conditions with the exception of iron oxide. It is believed that iron oxide, upon
release from solution, may have formed different complex compounds with organic
matter, which may not have been detected by XRF tests. Calcium and aluminum
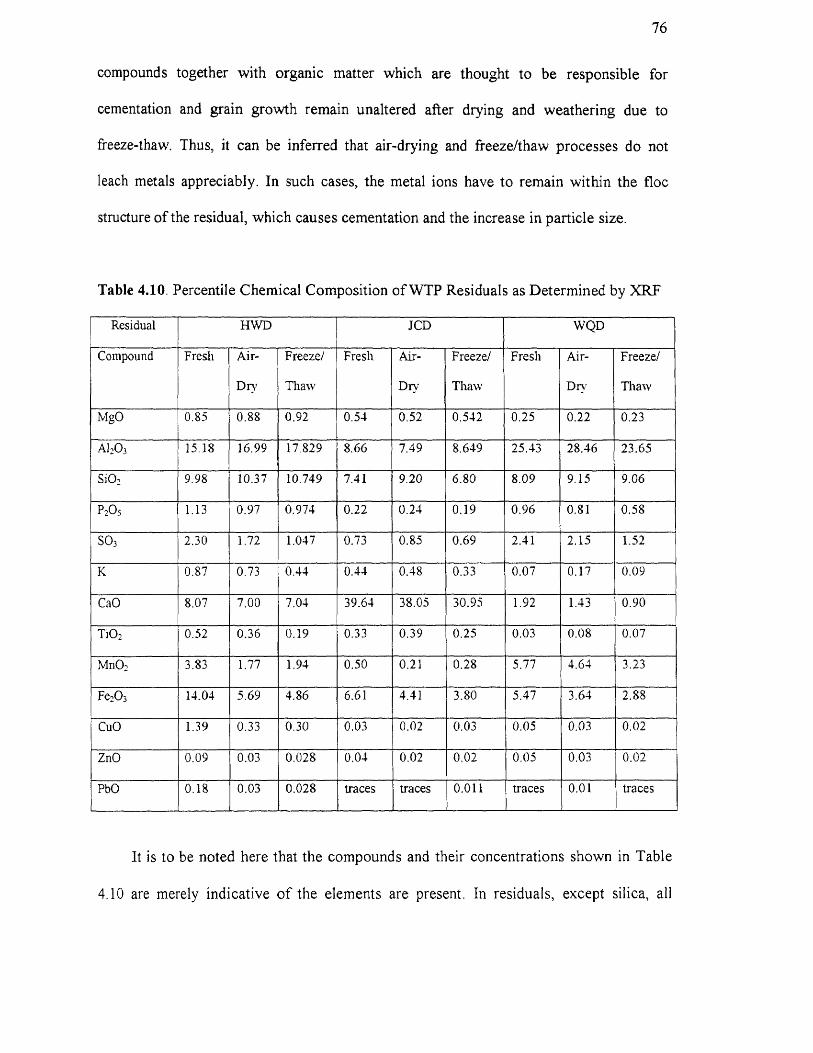
76
compounds together with organic matter which are thought to be responsible for
cementation and grain growth remain unaltered after drying and weathering due to
freeze-thaw. Thus, it can be inferred that air-drying and freeze/thaw processes do not
leach metals appreciably. In such cases, the metal ions have to remain within the floc
structure of the residual, which causes cementation and the increase in particle size.
Table 4.10. Percentile Chemical Composition of WTP Residuals as Determined by XRF
It is to be noted here that the compounds and their concentrations shown in Table
4.10 are merely indicative of the elements are present. In residuals, except silica, all

77
compounds occur either in the form of hydroxide and carbonates but not as oxides. Thus
the data obtained from the software of XRF and presented in Table 4.10 only gives the
clue as to what inorganic compounds are present in the residuals.
From the results presented in Table 4.10, it can be inferred the chemical
composition of WTP residuals unaltered after drying and subjected to freezing and
subsequent thawing. Further it can be seen that alumina contents in the residuals WQD
and HWD are about 17% and 27% indicating that the treatment uses alum as a
conditioner. The residual JCD has very high concentration of Calcium of about 31%
indicating that the treatment plant utilizes very high dosage of lime as coagulant in the
treatment of water and as a conditioner to thicken the residual.
4.11 X - Ray Diffraction Studies of the Residuals
XRD analyses on the residuals were carried out to determine qualitatively as to whether
the WTP residuals contained any clay minerals or not Tests were carried out first
without removing organic matter and then by removing organic matter. Presence of
organic matter produced broad X-ray diffraction peaks, increased the background and
inhibited dispersal of other minerals as evidenced in the diffractogram of the residual
sample JCD presented in Figure 4.16. As the residuals were rich in organic matter, low
temperature ashing technique was used to remove organic matter (Moore and Reynolds,
1996).
With the set up of XRD used for this study, quantitative analysis was not possible
and the results are only qualitative. Figures 4.17, 4.18 and 4.19 show the X-ray
diffraction patterns for the three residuals (HWD, JCD and WQD) considered for this

78
study. Peaks of these patterns matched with the peaks of the minerals/compounds shown
in Table 4.11. By studying the results presented in Table 4.10 and 4.11,both XRF and
XRD have identified silica in the three residuals chosen for the study. XRF results
indicate the presence of alumina (Al20 3) in all the three residuals HWD, JCD and WQD.
XRD detected alumina only in HWD and WQD. Alumina has also been detected in XRF.
Table 4.11 Minerals/compounds as identified by XRD
XRD detected a non-clay mineral herecynite (FeAl2O4 ) in the residual JCD. This
was not observed from the results of XRF. Calcium was detected in XRF analyses in the
form of oxide in all the three residuals. XRD showed the presence of calcium in the form
of calcium carbonate in the residual JCD. Some of the differences in results between
XRD and XRF analyses may be due that drying the sample at 105 ° C will not remove
organics fully. It was also found that none of these residuals contain clay minerals and
hence plasticity of residuals is only due to the organic matter.

Figure 4.16 X- ray Diffractogram for Residual JCD Prior to the Removal of Organics
79

Figure 4.17 X- ray Diffractogram for Residual HWD after Drying at 105 ° C.

Figure 4.18 X- ray Diffractogram for Residual 'CD after Drying at 105 ° C.

Figure 4.19 X- ray Diffractogram for Residual WQD after Drying at i05 ° C.

83
4.12 Electron Micrographs
In order to understand the mechanisms of increase in particle size in residuals due to
drying and freeze-thaw, electron micrographs of residuals were obtained. ESEM is
particularly useful in materials analysis for the examination of surfaces. By
supplementing this technique with compositional analysis as determined by EDX, XRD
and XRF, interpretations about the microstructure were made.
Figure 4.20 is a low magnification scanning electron micrograph of the sample
HWD in its frozen condition. Three distinct areas can be identified here. For the sake of
convenience, these have been labeled as "A", "B" and "C". In region "A", ordered
structures resembling long chains can be seen. A number of organic compounds used as
soil conditioners are mostly long chain compounds that attach themselves to the exchange
sites and thus link together many small particles. (Kohnke, 1968). This results in
increased grain sizes. In region "B", structures with long range order resembling that of
an amorphous phase is visible. The XRF and XRD analyses conducted on residuals
revealed the presence of several metal oxides such CaO, Al2O 3 , Fe2O 3 and SiO2 that are
amorphous in nature and the results are consistent. The area in region "C" represents
droplets of water arising from frozen state of the sample as has been confirmed by the
supplementing techniques.
Figure 4.21 is the micrographs of the same sample HWD. This has been taken with
a magnification of 1100x. The tubular structures believed to be organic matter are
observed again. (Region "A"). Presence of these structures became more clear in Figure
4,22 as this micrograph has been captured with high magnification of 2100x.

84
Figure 4.23 shows a typical micrograph for the residual JCD. Unlike in the residual
HWD, tubular structures are not present. Three distinct zones have been identified and
they have been marked as "F", "G", and "0".
The regions "F" are clusters of dense metallic precipitates as confirmed from the
supplementing experimental techniques. The region "G" is also part of the residuals with
lesser concentration of metallic precipitates. "0" is the region where higher
concentrations of organic matter are observed. JCD sample has a very high concentration
of calcium oxide and hence the presence of regions "F" and "G" can be explained.
A typical micrograph for the residual WQD is presented in figure 4.22. Five distinct
regions have been identified. They are labeled as "A", "B", "C", "0" and "V". In zone
"A", long tubular structures were noticed. "B" is the region concentrated by amorphous
like materials as confirmed by other experimental techniques. The droplets of water are
labeled as "C". The zone "V" represents voids. These voids are present in any soil-like
materials. In this case, they may be due to the escape of water from the pores.
4.13 Energy Dispersive Spectrometer (EDS) Spectra
EDS spectra for residual samples, HWD JCD and WQD are presented in Figures 4.25,
4.26, and 4.27 respectively. These spectra confirm the results of XRF and XRD analyses
and reinforce our interpretations of electron micrographs. For example, the large peaks
of calcium for the sample JCD are consistent with the large calcium content of this
sample obtained from XRF analyses. Quantitative analysis by using EDS gave the
percentile composition of calcium, aluminum, silica and iron in the residual JCD as
24.42, 10.24, 12.23 and 6.12 respectively. These results are consistent with those

85
obtained from XRF. Results of chemical composition obtained by' XRF are more
representative than those obtained by EDS. EDS provides us with the concentrations of
elements on the surface. Hence, the EDS spectra obtained are used only for the purposes
of verifying the results ofXRF analyses.
Figure 4.20 A Low Magnification Micrograph of the Residual HWD

86
Figure 4.21 Micrograph of the Residual HWD at a Magnification of 1100x.

87
Figure 4.22 Micrograph of the Residual HWD at a Magnification of2100X

88
Figure 4.23 A Low Magnification Micrograph of the Residual JeD.

89
Figure 4.24 A Low Magnification Micrograph of the Residual WQD.

Figure 4.25 EDS Spectra for the Residual HWD

Figure 4.26 EDS Spectra for the Residual JCD

Figure 4.27 EDS Spectra for the Residual WQD

93
4.14 Elemental Mapping:
Determination of the Distribution of various elements over the area of the micrographs is
possible with EDS (Goldstein., 1994). Figures, 4.28, 4.29 and 4.30 represent selected
elemental maps of the residual samples. These maps show the presence of inorganic
substances such as Ca, Al, Fe and Si Presence of oxides of these elements has been
indicated by the results of XRD and XRF analyses. The amorphous phases observed in
electron micrographs may be attributed to the presence of these oxides.
4.15 Discussion on the Probable Causes and Mechanisms of Increase in Grain Sizeof Residuals due to Drying and Freeze-Thaw
The mechanisms responsible for growth in particle size are (1) Dehydration of residuals
upon drying and (2) Change in plasticity due to change in the nature of organic matter.
Van Schulenborgh, (1954), also noticed similar phenomenon which caused the increase
in grain size of organic topsoil due to air-drying.
The dehydration of soil by drying: This may result in a vigorous cementing action
of the colloids on the soil aggregate. The dispersion of such aggregates requires a
rehydration of the colloidal particles and this rehydration may be very slow. WTP
residuals contain humus, which possess gel-like properties, as stated in Chapter''. During
drying, the alteration of gel structure causes permanent reduction in volume Moreover,
air has entered the gel structure and this air can hardly be removed on re-wetting.
Schalsa and others (1965) investigated the influence of air-drying on volcanic soils
from Frutillar and Santa Barbara regions of Chile. These soils were rich in organic
matter. They have observed that the effect of air-drying on the sand and clay fractions
was more pronounced than silt fraction. Maximum increase in sand fraction occurred in

94
the B-horizon of the Frutillar soil and amounted to 93%. The clay fraction of the same
sample decreased by 57%. On the other hand, the sand content of the A-horizon of the
Santa Barbara was not significantly affected by air drying, whereas there was a 68%
increase in sand fraction with the B-horizon. Air-drying decreased the silt fraction in the
A-horizon of the Frutillar soil by 13%. In the Santa Barbara soil, air-drying increased the
amount of silt by 10% in the A-horizon, but caused a 26% decrease in the B-horizon.
The change in plasticity may be due to a change in the nature of the organic matter,
Organic matter can not be re-wetted upon drying, due to absorption of the air and
polymerization of organic molecules under the influence of Al, Fe or Si compounds, so
that a hydrophobic humate is formed. Both the above phenomena prevent the water from
penetrating into the pores of the aggregates.
It is interesting to note that WTP residuals contain the necessary elements Al, Fe,
and Si for these mechanisms stated above to have happened. Several references can be
cited in which the bridging action of organic materials to form stable aggregates is
indicated (Kohnke 1968, USDA Soil Survey Manual 1951). According to Berger (1965),
soils with a good organic matter content and also those high in iron oxides have a good
granular texture. Soils with fine texture acquire their granular structure because of the
binding of the particles together by iron oxides and by gums and resins formed by the
decomposition of organic matter. In this study, of the above two mechanisms cited, the
binding due to iron oxide is possible, since all the three residual samples tested contained
iron oxide.

95
(a) Aluminum (b) calcium
(c) Iron (d) Silica
Figure 4.28 Elemental Map for the WTP Residual HWD

96
(a) Alumnia (b) Calcium
(c) Iron (d) Silica
Figure 4.29 Elemental Map for the WTP Residual JCD

97
(a) Aluminum (b) Calcium
(c) Iron (d) Silica
Figure 4.28 Elemental Map for the WTP Residual WQD

98
Weil (1998) offers the following explanation for cementation which is the result of
dehydration and loss of plasticity. During flocculation, individual colloidal particles
coagulate together into tiny clumps or floccules. The floccules can then be bound
together by cementing agents such as the microbial polysaccharides or iron oxides to
form the stable aggregations in the topsoil. Once again, this mechanism is also possible
for the three residual samples utilized for this study, since these samples contained iron
oxide.
References regarding topsoil and organic matter have been cited in the above
section to describe the phenomenon occurring in WTP residuals. The source of WTP
residuals is the raw water in the reservoirs. This water is due to run-off from the
catchment area of the reservoir. This run-off carries with it the topsoil, rich in organic
matter and the erodibile silt-sized particles. In order to understand the nature,
composition and behavior of solids in the WTP results, it is quite logical to investigate
the topsoil.
The mechanism of cementation due to organic matter can be utilized to explain the
increase in particle sizes of the residuals HWD and WQD. The sample JCD has a
significant amount of lime content. This compound causes cementation, similar to that of
lime stabilization. Therefore the significant increase in grain size of JCD samples can be
attributed to the presence of organic contents and calcium oxide. Other residuals HWD
and WQD also contain metallic oxides in small quantities and hence the dominant cause
for increase in grain sizes for these samples can be attributed to cementation by organic
contents.

CHAPTER 5
CONCLUSIONS AND RECOMMENDATIONS FOR FURTHER STUDY
5.1 Conclusions
Based on the results of this study, the following conclusions have been drawn:
1. After the residuals are subjected to drying and freeze-thaw conditions, grain sizes
of the WTP residuals increase. Plasticity of the residuals decrease and the materials
become granular. Specific gravity of solids increases.
2. Effects observed under item 1 above can be attributed to cementation due partly
to organic matter and partly due to oxides such as calcium oxide, aluminum oxide and
ferric oxide present in the residuals.
3. The water content Vs dry unit weight curves for the residuals are bell shaped
with a definite peak in the dry to wet tests, where as in the wet to dry tests these curves
are of odd shape without a definite peak. In the dry to wet tests, the residuals attained
higher dry unit weights at lower optimum moisture contents than those obtained in wet to
dry tests.
4. Undrained shear strength of all residuals excepting JCD "wet to dry" conditions
were greater than those obtained during "dry to wet" conditions.
5. Chemical composition of fresh residuals is almost the same as those for dry
residuals and for those subjected to freeze-thaw conditions.
6. Organic contents of dry residuals are almost the same as those subjected to
freeze-thawed conditions.
7. X-Ray Diffraction studies showed the presence of no clay minerals in the three
residuals considered for this study.
99

100
9. Organic matter present in the residuals made it difficult to obtain X-ray
diffractograms and Electron micrographs of fresh residual samples could not be obtained
since samples of fresh residuals desiccated immediately upon placement inside the ESEM.
5.2 Suggestions for Further Study
Following are the suggestions for the study with WTP residuals.
1. In order to obtain information regarding the microstructure of fresh residuals, X-
ray Absorption Fine Structure (XAFS) tests have to be performed on fresh, dry
and freeze thaw residuals. The distribution of organic matter and the metal oxides
will have to be observed.
2. Detailed investigations regarding the nature and composition of organic matter
should be undertaken.
3. Techniques will have to be developed to look at the amount and distribution of
water in the residuals subjected to different conditions.

REFERENCES
Alvi, P. M., and K.H., Lewis. 1986. "Geotechnical Properties of Industrial Sludge".International Symposium on Environmental Geotechnology, 1 and 2: 57-76.
ASTM. 1995. Annual Book of ASTM Standards, Philadelphia, PA.
AWWA. 1978. Water Treatment Plant Sludges - An Update of the State of the Art: Part1. Committee Report. Jour. A WWA, 70(9): 498-503.
AWWA. 1981. Lime Softening Sludge Treatment and Disposal. Committee Report. Jour.AWWA, 71(11): 600-608.
Berger, and Kermit C., 1965.Sun, Soil and Survival — An Introduction to Soils, Universityof Oklahoma Press, Norman, OK.
Bohn, H. L., B.L. McNeal, and G.A. O'Connor. 1985. Soil Chemistry. 2nd Ed. A Wiley-Interscience Publication, and John Wiley & Sons. New York, NY.
Cornwell, D. A., and H. M. M. Koppers. 1990 Slib, Schlamm, Sludge. AWWARF andKIWA Ltd. Denver, CO.
Cornwell, D. A., C. Vandermeyden, and G. Dillow. 1992. Landfilling of Water TreatmentPlant Coagulant Sludges. AWWARF, Denver, CO.
Das, B. M., 1994. Principles of Geotechnical Engineering. 3 rd Ed., PWS PublishingCompany Boston. MA.
Elliott, H. A., Dempssey, B.A., Hamilton, D.W., and deWolfe, J.R.,. 1990. LandApplication of Water Treatment Sludges: Impacts and management. Denver, CO.:AWWARF.
Farrell, J. B., J. E. Smith Jr., R. B. Dean, E. Grossman, and 0. L. Grant., 1970. NaturalFreezing for Dewatering of Aluminum Hydroxide Sludges. Jour. AWWA, 62(12):787-791.
George, D.B., Berk, S.G., Adams, V. D., Morgan, E.L., Roberts, R.O., Holloway, C.A.,Lott, R.C., Holt, L.K., Ting, R. S., and Welch, A. W., 1991. Ahim Sludge in theAquatic Environment. AWWARF. Denver, CO.
Goldstein, J.1., 1994. Scanning Electron Microscopy and X-Ray Microanalysis. 2 nd Ed.Plenum Press, New-York, NY.
101

102
Huang, J. C. 1979. Sludge Characterization and Dewatering. Ph. D Dissertation.University of Missouri-Columbia, MS.
Judkins Jr, J. F, and R. H. Wynne Jr., 1983. Crystal-Seed Condtioning of Lime-SofteningSludge. Jour. AWWA, 75(10):485-540.
Knocke, W. R., and D. L Wakeland., 1983. Fundamental Characteristics of WaterTreatment Plant Sludges. Jour. AWWA, 75(10): 516-524.
Kohnke, H. 1968. Soil Physics, McGraw Hill, Inc., New York, NY.
Lambe, T. W., and R.V. Whitman. 1969. Soil Mechanics. John Wiley & Sons, NewYork, NY
Logsdon, G. S. and E. Edgerley Jr., 1971. Sludge Dewatering by Freezing, Jour. AWWA,63(11): 734-740.
Marshal C.E.1964. The Physical Chemistry and Mineralogy of Soils, Vol. 1: SoilMaterials John Wiley & Sons, Inc. NY.
Mitchell, J. K. 1993. Fundamentals of Soil Behavior, John Wiley & Sons, Inc. New York,NY.
Moore, D. M and Reynolds, R.C., 1996. X-Ray Diffraction and the Identification andAnalysis of Clay Minerals, Oxford University Press, New York, NY.
Novak, J. T., and D. C. Calkins., 1975. Sludge Dewatering and Its Physical Properties.Jour. AWWA, 67(2): 42-45.
Oades, J.M., 1989. "An Introduction to Organic Matter in Mineral Soils", Chap 3. In: J.B.Dixon and S.B. Weed (Eds). Minerals in Soil Environments, 2nd ed., Soil ScienceSociety of America Book Series: 1, Madison, WI, pp 252-273.
Odell, R.T., Thornburn, T. H., and McKenzie, L. 1960. Relationships of Atterberg limitsto some other properties of Illinois soils. Proceedings of the Soil Science Society ofAmerica Vol. 24, No 5, pp 297-300
Raghu, D., and H. N. Hsieh. 1987a. Water Treatment Plant Sludge as Landfill Liner, InASCE-GT Special Conference - Geotechnical Practice for Waster Disposal, ASCE,pp. 744-758. Ann Arbor, MI.
Raghu, D., and H. N. Hsieh. 1987b. Material Properties of Water Treatment Plant Sludge,The International Journal of Civil Engineering for Practicing and DesignEngineers, 5(5): 927-941.

103
Raghu, D., and Hsieh. H.N., 1997. Criteria Development for Water Treatment PlantResidual Monofills AWWA Research Foundation and American Water WorksAssociation, Denver, CO.
Raghu, D., Hsieh. H.N., Basim. S.C., and Tian. P., 1995 Effects of Aging on theProperties of Water Treatment Plant Residuals. Proceedings of WEF/AWWA JointResiduals/Biosolids Conference Kansas City MI.
Schalsa, E.B., Gonzalez, C., Vergara, I., Galindo, G., and Schatz, A.,1965. "Effect ofDrying on Volcanic Ash Soils in Chile", Proceedings of the Soil Science Society ofAmerica, 29, 481,
Singh. A., 1975. Soil Engineering in Theory and Practice Vol. 1, Asia Publishing HouseNew Delhi. India
Sparks. D. L. 1995. Environmental Soil Chemistry Academic Press, New-York, NY
USDA, 1951. Soil Survey Manual, Handbook 18,
USEPA, 1986. Handbook For Stabilization/Solidification of Hazardous Waste.EPA/540/2-86/001. Government Printing Office, Washington, D.C.
Van Schuylenborgh, J., 1954. The Effect of Air-drying Of Soil Samples UPON SomePhysical Soil Properties, Netherlands Journal of Agricultural Society, 2,50,
Vesilind, P. A. and C. J. Martel. 1990. Freezing of Water and Wastewater Sludges, Jour.Environmental Engineering, ASCE, 116: 854-862.
Wang, M. C. and W. Tseng. 1993. Permeability Behavior of a Water Treatment Sludge.Jour. Geotechnical Engineering, 119(10): 1672-1677.
Wang, M. C., J.Q. Hull, and M. Jao., 1992a. Stabilization of Water Treatment PlantSludge for Possible Use as Embankment Material. Transportation Research Record,1345: 36-43.
Wang, M. C., J.Q. Hull, B.A. Dempsey, and D.A. Cornwall., 1992b. EngineeringBehavior of Water Treatment Sludge. Jour. Environmental Engineering, 118(6):848-864.
Weil, Ray R., 1998. Laboratory Manual for Introductory Soils, Sixth Edition, KendallHunt Publishing Company. Dubuque, IA.

104
Wilum Z and Starzewski K., 1972. Soil Mechanics in Foundation Engineering, Vol. 1,John Wiley & Sons, New York NY.
Xia 1993, Geotechnical Characterization of Water Treatment Plant Residuals. M. SThesis submitted to the Faculty of Civil and Environmental Engineering. New JerseyInstitute of Technology, Newark, NJ.
Related Documents