GEOTECHNICAL CHARACTERIZATION OF SOFT SOIL ALONG MOLLAHAT -NOAPARA ROAD SECTION ATBAGERHAT BY A Thesis Submitted to the Department of Civil Engineering, Bangladesh University of Engineering and Technology, Dhaka, inpartial fulfillment of the requirements for the degree of MASTER OF ENGINEERING IN CIVIL ENGINEERING II I 1\1\\\ 11\\111\11\ \111\\1111 \ \\\ #98255# April 2003

Welcome message from author
This document is posted to help you gain knowledge. Please leave a comment to let me know what you think about it! Share it to your friends and learn new things together.
Transcript

GEOTECHNICAL CHARACTERIZATION OFSOFT SOIL ALONG MOLLAHAT -NOAPARA ROAD SECTION
ATBAGERHAT
BY
A Thesis Submitted to the Department of Civil Engineering,Bangladesh University of Engineering and Technology, Dhaka,
in partial fulfillment of the requirements for the degree
of
MASTER OF ENGINEERING IN CIVIL ENGINEERING
II I 1\1\\\ 11\\111\11\ \111\\1111 \ \\\#98255#
April 2003

GEOTECHNICAL CHARACTERIZATION OFSOFT SOIL ALONG MOLLAHAT -NOAPARA ROAD SECTION
ATBAGERHAT
.0
\
Member
Member
Clirman(Supervisor)
.,'<
MD. MANSURUL KABIR MUNSHI
April, 2003
By
~(Dr. Mohammad Shariful Islam)Assistant ProfessorDepartment of Civil EngineeringBUET, Dhaka
Approved as to style and contents by:
(Dr. Eqramul HoqueAssociate ProfessorDepartment of Civil EngineeringBUET, Dhaka
____________;{k-(Dr. Syed ~Ul Ameen)ProfessorDepartment of Civil EngineeringBUET, Dhaka

ACKNOWLEDGEMENT
(All Praises to Almighty Allah)
The author gratefully expresses his profound gratitude and heartiest appreciation to his
supervisor Dr. Eqramul Hoque, Associate Professor, Department of Civil Engineering,
Bangladesh University of Engineering and Technology, Dhaka for his continued
guidance and encouragement at all stages of this research work. His keen interest in
this project and his valuable advice and constructive suggestions made this research
possible.
The author expresses his deep regard and indebtedness to Dr. Mohammad Shariful
Islam, Assistant Professor, Department of Civil Engineering, Bangladesh University of
Engineering and Technology, Dhaka for his valuable advice, suggestion and co-
operation in completing this work.
The author is highly obliged to Dr. Syed Fakhrul Ameen, Professor, Department of
Civil Engineering, Bangladesh University of Engineering and Technology, Dhaka for
his valuable suggestions.
The author is also obliged to Dr. Abu Siddique, Professor of Civil Engineering,
Bangladesh University of Engineering and Technology, Dhaka for his sincere support
in providing the technical information of soft soil improvement in Bangladesh.
The author is highly grateful to Mr. Kazi Mahbubul Huque, Director BCL, Mr.
Mohammad Abdul Aziz, Director BCL, Mr. Kafil Uddin Ahmed, Deputy Team Leader,
SRNDP' and Mr. Rafiqul Islam, Resident Engineer, SRNDP, Contract - 5 for kind co-
operation for continuing this course.
Assistance provided by Mr. Habibur Rahman and Mr. Alimuddin Miah and Mr.
Rafiqul Islam is duly acknowledged.
Io
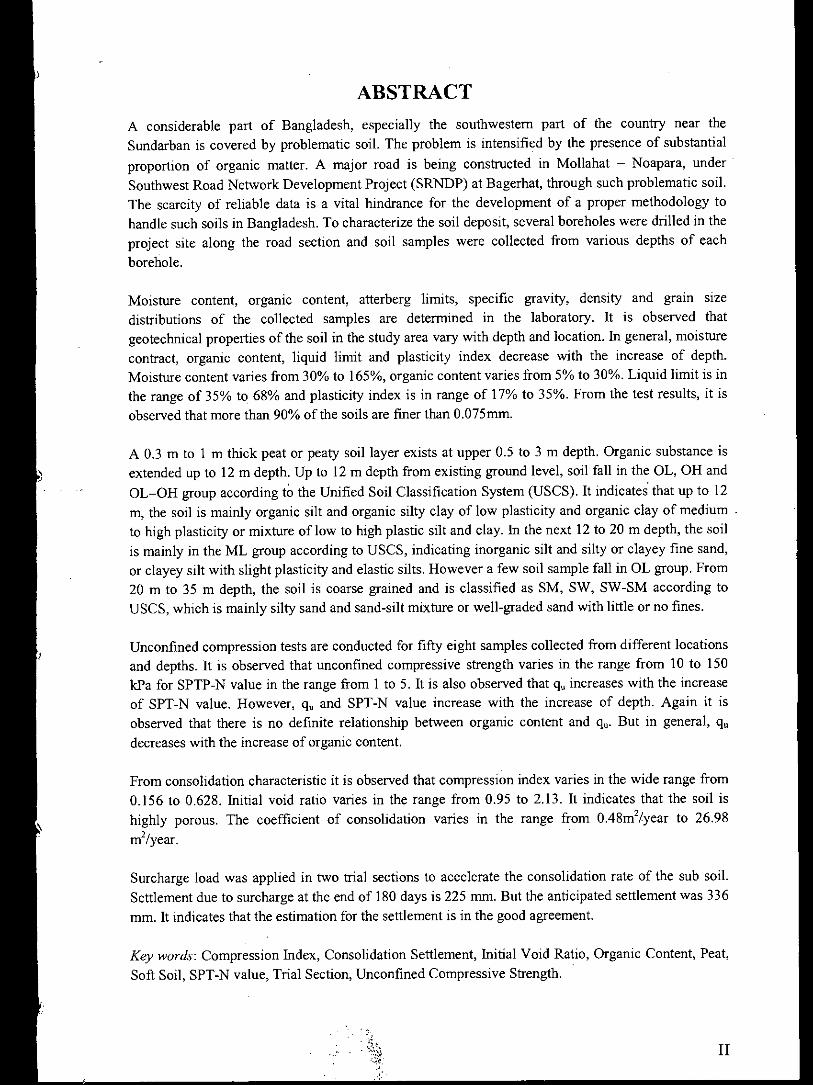
ABSTRACTA considerable part of Bangladesh, especially the southwestern part of the country near theSundarban is covered by problematic soil. The problem is intensified by the presence of substantialproportion of organic matter. A major road is being constructed in Mollahat - Noapara, underSouthwest Road Network Development Project (SRNDP) at Bagerhat, through such problematic soil.The scarcity of reliable data is a vital hindrance for the development of a proper methodology tohandle such soils in Bangladesh. To characterize the soil deposit, several boreholes were drilled in theproject site along the road section and soil samples were collected from various depths of eachborehole.
Moisture content, organic content, atterberg limits, specific gravity, density and grain sIzedistributions of the collected samples are determined in the laboratory. It is observed thatgeotechnical properties of the soil in the study area vary with depth and location. In general, moisturecontract, organic content, liquid limit and plasticity index decrease with the increase of depth.Moisture content varies from 30% to 165%, organic content varies from 5% to 30%. Liquid limit is inthe range of 35% to 68% and plasticity index is in range of 17% to 35%. From the test results, it isobserved that more than 90% of the soils are finer than 0.075mm.
A 0.3 m to I m thick peat or peaty soil layer exists at upper 0.5 to 3 m depth. Organic substance isextended up to 12 m depth. Up to 12 m depth from existing ground level, soil fall in the OL, OH andOL-OH group according to the Unified Soil Classification System (USCS). It indicates' that up to 12m, the soil is mainly organic silt and organic silty clay of low plasticity and organic clay of medium .to high plasticity or mixture oflow to high plastic silt and clay. In the next 12 to 20 m depth, the soilis mainly in the ML group according to USCS, indicating inorganic silt and silty or clayey fine sand,or clayey silt with slight plasticity and elastic silts. However a few soil sample fall in OL group. From20 m to 35 m depth, the soil is coarse grained and is classified as SM, SW, SW-SM according toUSCS, which is mainly silty sand and sand-silt mixture or well-graded sand with little or no fines.
Unconfined compression tests are conducted for fifty eight samples collected from different locationsand depths. It is observed that unconfined compressive strength varies in the range from 10 to 150kPa for SPTP-N value in the range from I to 5. It is also observed that q, increases with the increaseof SPT-N value. However, q, and SPT-N value increase with the increase of depth. Again it isobserved that there is no definite relationship between organic content and q,. But in general, q,decreases with the increase of organic content.
From consolidation characteristic it is observed that compression index varies in the wide range from0.156 to 0.628. Initial void ratio varies in the range from 0.95 to 2.13. It indicates that the soil ishighly porous. The coefficient of consolidation varies in the range from 0.48m'/year to 26.98m'/year.
Surcharge load was applied in two trial sections to accelerate the consolidation rate of the sub soil.Settlement due to surcharge at the end of 180 days is 225 mm. But the anticipated settlement was 336mm. It indicates that the estimation for the settlement is in the good agreement.
Key words: Compression Index, Consolidation Settlement, Initial Void Ratio, Organic Content, Peat,Soft Soil, SPT -N value, Trial Section, Unconfined Compressive Strength.
II.':

1.1 General I
1.2 Physiographic Description of Bangladesh 2
1.3 Location and Geology of the Study Area 4
1.4 Objective of the Research 6
1.5 Thesis Layout 6
CHAPTER 2: LITERATURE REVIEW 7
2.1 General 7
2.2 Problems with Soft Soil in Bangladesh 7
2.3 Case History of Civil Construction on Soft Soil 8
2.3.1 Khulna University Building 8
2.3.2 Goran Land Project (Phase -I), Dhaka 11
2.3.3 Embankment at the Dhaka Export
Promotion Zone (Depz) Area in Savar, Dhaka 12
2.3.4 J amuna Bridge Access Road Project, at Kaliakoir 14
2.3.5 Dhaka Integrated Flood Protection Project (DIFPP) 16
2.3.6 The Settlement of a Highway on Soft Bangkok Clay 19
2.3.7 Time and Stress Compressibility Interrelationship
of Some Clay 23
2.3.8 ca/cc Concept Applied to Compression of Middletone Peat 26
2.4 Conclusion 27
ACKNOWLEDGMENT
ABSTRACT
CONTENTS
LIST OF TABLES
LIST OF FIGURES
NOTATIONS
I
II
III
V
VI
IX
I
Page
CONTENTS
INTRODUCTIONCHAPTER!:

CHAPTER 6: CONCLUSION AND RECOMMENDATIONS FOR FUTURE STUDY 88
CHAPTER 4: GEOTECHNICAL CHARACTERISTICS OF UNDERLYING SOIL 34
91
IV
888889
75
77
7982
28
2833
General
Concl usions
Recommendation for future study
General
Subsoil Property under Trial Sections.
Description of Trial Section
Performance Evaluation
General
Methodology
Organic Content Determination
Page
6.1
6.2
6.3
5.1
5.2
5.3
5.4
3.1
3.2
3.3
REFERENCES
4.1 General 344.2 Borehole Description 344.3 Assemblage of Data 51
a. Index Property 51b. Unconfined Compr.essive Strength 54c. Consolidation Characteristics 58
4.4 Variation of Soil Properties with Depth 61
CHAPTERS: PRELOADING AND ITS PERFORMANCE EVALUATION 75
CHAPTER 3: METHODOLOGY AND INVESTIGATION PROGRAMME 28

LIST OF TABLESPage
Table 2.1 Property of Soft Organic Soil at Khulna University 9
Table 2.2 Properties of a Soft Organic Clay Sample atDhaka Epz Site, Savar 12
Table 2.3 Index Properties of Three Natural Soil Deposits 23
Table 2.4 Values of calc, for Natural Soil Deposits 25
Table 3.1 Borehole Location in the Study Area 31
Table 3.2 Classification of Fine Grain Soil 32
Table 3.3 Classification of Coarse Grain Soil 32
Table 4.1 Summary of the range of soil parameters of the study area 52
Table 4.2 Range of Soil Parameters within Chainage
Km 10+000 to Km 11+000 67
Table 4.3- Range of Soil Parameters within Chain age
Km 11+000 to Km 12+000 68
Table 4.4 Range of Soil Parameters within Chainage
Km 12+000 to Km 13+000 69
Table 4.5 Range of Soil Parameters within Chainage
Km 13+000 to Km 14+000 70
Table 4.6 Range of Soil Parameters within Chainage
Km 14+000 to Km 15+000 71
Table 4.7 Range of Soil Parameters within Chainage
Km 15+000 to Km 16+000 72
Table 4.8 Range of Soil Parameters within Chainage
Km 16+000 to Km 17+000 73
Table 4.9 Range of Soil Parameters within Chainage
Km 17+000toKm 18+000 74
Table 5.1 Geotechnical Properties of Subsoil up to 6 m depth 77
Vt>

Figure 2.10 Grade Line and Settlement Result Along
Bang Na - Bang Pakong Highway 19
Figure 2.11 Shear Strength Characteristics along the High Way 20
Figure 2.12 Compressibility Characteristics along Bang N a-
Bang Pakong Highway 21
Figure 2.13 Settlement vs. Time for Bang. Na-Bang Pakong
High Way 22
Figure 2.14 Relationship Between Ca and Cc for (A) Maxico
City Clay (B) Leada Clay (C) New Haven Organic Silt 24
Figure 2.15 Relationship Between Cc and Ca with Consolidation Pressure for
(a) Maxico City Clay (b) Leda Clay (c) New Haven Organic Silt 24
Figure 2.16 e - log t Curve for Middleton Peat 26
Figure 2.17 e -log a v' Curve for Middleton Peat 27
VI
9
3
5
13
13
10
11
10
Page
LIST OF FIGURES
Typical Borelog at Khulna University Site
Foundation System of the 4-Storied Academic
Building at Khulna University
Time Settlement Observation of Academic
Building at Khulna University
Time Settlement Observation of Boys' Hostel
at Khulna University
Typical Borelog With Embankment Section
at Dhaka EPZ Site, Savar
Steps of Construction of Embankment
Typical Soil Profile Along the Soft Ground
Alignment at Jamuna Bridge Access Road Project 14
Construction Sequence of Embankment at Jamuna Bridge Access Road
Project Site at Kaliakoir 16
Complete Jute Drain Made of Jute Fabric Filter and
Coconut Coir Strands 18
Physiographic Map of Bangladesh
Soil Map of Bangladesh Showing the Study Area
Figure 2.8
Figure 2.6
Figure 2.7
Figure 2.9
Figure 2.5
Figure 2.4
Figure 2.3
Figure 2.1
Figure 2.2
Figure. 1.1
Figure 1.2

Figure 3.1
Figure 4.1
Figure 4.2
Figure 4.3
Figure 4.4
Figure 4.5
Figure 4.6
Figure 4.7
Figure 4.8
Figure 4.9
Figure 4.10
Figure 4.11
Figure 4.12.a
Figure 4.12.b
Figure 4.12.c
Figure 4.12.d
Figure 4.13
Figure 4.14
Figure 4.15
Figure 4.16
Figure 4.17
Figure 5.1
Figure 5.2
Page
Location Map of Borehole on Road Alignment 30
Position of the Soil Sample from the Study Area
in the Plasticity Chart 53
Variation ofliquid limit with respect to organic content 53
Typical Axial Stress vs. Axial Strain curve for Soil
Sample of study area 54
Unconfined Compressive Strength vs. SPT-N Value
for Different Range of Organic Content . 55
Influence of SPT -N value on unconfined compressive strength
for OL, OH, OL-OH soil sample 56
Unconfined Compressive Strength vs. Natural water Content 56
Unconfined Compressive Strength vs. Organic Content 57
Typical e vs. log (p) curve for the study area 58
Typical settlement vs. time curve for the study area 59
Compression Index vs. Organic Content for the study area 60
Comparison of Variation of Compression Index
With Respect to Initial Void Ratio of Soil Sample
from the Study Area and Different Researcher 60
Variation of natural moisture content w.r.t depth 61
Variation of organic content W.r.t depth 61
Variation ofliquid limit W.r.t depth 61
Variation of plasticity index W.r.t depth 61
Variation ofSPT-N value with depth 62
Variation ofSPT-N value W.r.t depth for boreholes in the study area by
~JOC~CL ~
b) COVEC 63
c) Test borehole 63
Variation of qu with respect to depth 64
General soil profile along the study area 65
Depth of soft soil and peaty soil 66
Relation between consolidation settlement and height of embankment 79
Gradation curve for local sand, blended sand and sylhet sand 82
VII

Figure 5.3
Figure 5.4
Figure 5.5.a
Figure 5.5.b
Figure 5.6.a
Figure 5.6.b
Figure 5.7.a
Figure 5.7.b
Dry density versus moisture content for iocal sand, blended sand and
embankment fill material 82
Cross section of trial section 83
Settlement vs. time for trial section I with local sand blanket 85
Settlement vs. time for trial section I with blended sand blanket 85
Settlement vs. time for trial section 2 with local sand blanket 86
Settlement VS. time for trial section 2 with blended sand blanket 86
Variation of SPT - N value vs. depth, before and after preloading for
trial section I 87
Variation of SPT- N value vs. depth, before and after preloading for
trial section 2 87
VIII

NOTATIONS
Cc Compression index
Cn Coefficient of secondary consolidation
Cv Coefficient of consolidation for vertical drainage
Ch Coefficient of consolidation for horizontal drainage
eo Initial void ratio
k Coefficient of permeability
N SPT value
OC Organic content
Po' Effective initial soil pressure
/!,pv Pressure increment caused by the embankment
qu Unconfined compressive strength
Sc Consolidation settlement
Su Undrained shear strength
Wn Natural moisture content
Yd Dry density
Yw Wet density
•

1.1 General
Soft soil deposits are widespread, and they impose special problems in engineering design and
construction. Civil engineering construction work on soft soil is a difficult task. Foundation
failures in soft clay are common. High surface loading in the form of embankments and
shallow foundations inevitably results in large settlements which must be accommodated for
in design, and which invariably necessitate long-term maintenance of engineered facilities.
Most of the area of greater Khulna district consists of soft and peaty soil, which causes
difficulties for civil construction work. Greater Khulna district was once under Shundarban
forest. Due to decomposition of plants and vegetation for many years, top several meter soils
are very soft; peaty soil exists at those layers. Major area of Bagerhat district is low laying
area, mostly marshy land. These areas remain water-logged for about 10 month in a year. The
study area along Mollahat to Noapara road section (Southwest Road Network .Development
Project) passes through shrimp culture area. Existing road embankment (Mollahat to Noapara)
was settled down at several locations due to faulty road design and construction that results
from lack of proper soil investigation and measures. For proper design and construction of
civil work especially road embankment and structure, proper geotechnical characterization of
the subsoil is necessary.
So far many researchers had investigated geological characteristics of Bangladesh soil for
many years e.g. Morgan and McIntire (1959), Bramer (1971), Hunt (1976), Master Plan
Organization (1986) etc, had investigated geological characteristics of Bangladeshi soil.
Geotechnical characteristics of Dhaka clay and regional soils from different locations have
been investigated by many researchers. Eusufzai (1967) established a soil profile across Dacca
the Capital city of East Pakistan. He classified Dhaka clay as CL and ML under unified soil
classification system. Ameen (1985) analyzed geotechnical characteristics of Dhaka clay.
Uddin (1990) reported compressibility and shear strength of remolded Dhaka clay. Siddique et
al. (1995) had studied permeability characteristics of reconstituted Dhaka clay. Islam (1999)
investigated strength anisotropy of Dhaka clay. Bashar (2000) analyzed geotechnical
characteristics of Dhaka soil. Serajuddin et al. (2001) reported characteristics of uplifted
Pleistocene deposits of Dhaka.
I

Some research work has been conducted for coastal and regional soil, such as; Serajuddin
(1969 - 1970) attempted to correlate Dutch penetrometer cone resistance (qc) with SPT-N
value and unconfined compressive strength, qu, of silty clay of coastal districts of Khulna,
Barisal and Chittagong. He reported the soils at these regions are predominantly cohesionless
fine sandy silt, peat and cohesive silty clay. Amin et al. (1987) and Kabir et al. (1992)
attempted to correlate geotechnical properties of coastal soil from about 200 boreholes and 134
boreholes, respectively. Ansary (1993) also reported the geotechnical properties of regional
soil particularly the coastal soil.
Available published literature does not give a comprehensive picture of geotechnical
characteristics of organic soil or peat of Bangladesh. Consolidation behavior of peat or
organic soil is rather complex with comparison to inorganic soil. Also treatment for peat or
organic soil is difficult. Mollahat - Noapara road section under Southwest Road Network
Development Project at Bagerhat district is passing through soft organic soil and peat.
Geotechnical investigation of soft organic soil this site has been investigated a little. For
proper design and construction of this road section proper geotechnical characterization is
prime important.
1.2 Physiographic description of Bangladesh
Bangladesh can be divided into three major physiographic units namely (i) the tertiary hill
formation (ii) the Pleistocene terrace and (iii) the recent flood plains. The generalized
physiographic map of Bangladesh is shown in Figure 1.1. Nearly 85 percent of Bangladesh is.
underlain by quaternary sediments consisting deltaic and alluvial deposits of the Ganges,
Brahmaputra and Meghna river and their numerous tributaries. The deltaic deposits are
sediments that are deposited on the active delta, which is defined as the area south of the
Ganges river and mostly west of the Meghna estuary. Most of the delta is less then 15 m
above the mean sea level. Old Brahmaputra flood plain stretching from the southwestern
corner of Garo hills along the eastern rim of Modhupur tract down to Meghna river a gentle
morphology composed of broad ridges and depressions. According to the study of Morgan
and McIntire (1959), there are two major areas of Pleistocene sediments, commonly known as
the Modhupur tract and Barind tract. The Modhupur block lies between the Jamuna and old
Bralunaputra (18th century) channels and 6 m to 30 m above mean sea level. Modhupur tract is
bounded by faults; they appear to be uplifted and structurally complex; the Modhupur block
has been tilted eastward (Morgan and McIntire, 1959). All or part of the clay is depositional.
Most of the oxidized clay is now considered to be the product of weathering (the residuum), is
2

•••
••
~.--~~ ~~-JllANlltAlll:5l1
PHYSICAl.
OF /lENG""II II r
..•..
Figure L1: Physiographic map of Bangladesh (after Hossain, 2002)
11m."
3
therefore, a relict paleosol. Residuum is defined as material derived by in-place chemical
weathering of elastic sediment with no appreciable subsequent lateral support. Patches of
residuum also overlie gently dipping Tertiary units in the Fold Belt, including the Lalmai hill
at Comilla area.
, ...
, ...., .

1.3 Location and geology ofthe study area
Present study area is confined within the under construction road section from MoIlahat to
Noapara under Southwest Road Network Development Project (SRNDP) at Bagerhat district.
'Very soft' to 'soft' soil layer is extended up to a depth of 12 m (SPT-N value ~) at chainage
from Km 6+000 to Km 18+000. The study area has been selected from chainage Km 10+000
to Km 18+000 because this location is more problematic then other locations. The
approximate latitude of the study area is 23°_0' to 23°_4' and longitude is 89°-54' to 89°-58'
(after Hossain, 2002).The chainage starts Km 0+000 at Noapara side abutment of Abul Khair
bridge over Modhumoti river at MoIlahat Upa-zila and arbitrary co-ordinate of Katakhali
intersection on Khulna - Mongla road is N = 25000, E = 25000. Location of the project area is
shown in Figure 1.2. The project area is situated mostly at low laying area passes through
marshy land, composed of organic substance or peat (high possibility since sundarban is
nearby) at the upper 0.5 m to 3 m depth (N-value =0; I) or more that caused by the
decomposition of plants and vegetations yield from Sundarban forest.
Marsh clay and peat deposits are underlain up to 3 m or more in this area. They are mainly
gray colour, in some places deep brown to black depending upon the organic content, mostly
at the upper 3 to 5 m layers. AIluvial deposits, consists of medium to dark gray colour silt and
clay. The colour is darkening as the amount of organic substance increases. It includes flood
basin silt, backs warp silty clay and organic rich clay in sag ponds and large depressions.
Large area underlain by this unit is dry only few months ofthe year.
Most of the low-lying area is water-logged for 10 months of the year. Average ground
elevation is I m to 1.5 m PWD and water table elevation is 0.5 m to 2.5 m PWD in the month
of April. A soil map of Bangladesh is shown in Figure 1.2 indicating the study area.
4

U:GIlNb
BAN(;LAllllSHSOIL MAl'
II'
,,.
"
"
Flood ~lSinSolb"I::J N*~bmmAltuvfwnM 1=:1"'OllAddSoll~A~trblL.QffY~ Bl\lIolll
c::J ea-. 8mb""",G.y.n"""'r:::1"'. SolIsc:::J Add~ Soils Ttttl1(r:SoU~c::1G~)'It nut O~y,AcidSoils [=:J ,tl:td.RlU\A.lI ~c'~IDlI Bm.'ftoGttlr~ ~~~.'--I Ottyl[brtOMyNonS~IIAeSOib _ _ ,Hill Soil(
,0D,.."Ams.i1
•• • I tt :'II' • •• ••, : I ,II :' i '; ,.., I' • ., ""ll,a
•••
Figure 1.2: Soil map of Bangladesh showing the study area (after Hossain, 2002)

1.S Thesis Layout
1.4 Objective of the research
••; (1$•
6
I. To establish the sub soil profile ofthe study area.
ii. To determine the extent and depth of peaty soil in the swampy areas along study area.
lll. To establish approximate correlation among different geotechnical properties of sub-
soil (especially clay and organic soil) ofthe study area.
IV. To observe the improvement (Geotechnical properties) of the soft soil due to
preloading.
Attempts will be made to establish relationships between unconfined compressive strength
(qu) and SPT-N value, organic content with compression index (cc), compression index (cc)
with initial void ratio (eo), etc. Attempt will be made to obtain a profile for soft soil and peaty
soil layer with depth.
The major objectives of present study are as follows:
The remaining of the thesis is organized in four chapters. Chapter 2 describes some literature
review which describes geotechnical characteristics of soft soil and peat from home and
abroad. Chapter 3 describes the methodology for geotechnical characterization of the study
area. Chapter 4 deals with geotechnical characteristics of study area and correlations among
different soil parameters. Description of soil profile and property of soil are presented in this
chapter. Chapter 5 presents the main findings and conclusions of the research.
Recommendations for future study are also presented in this chapter.

CHAPTER 2
LITERATURE REVIEW
2.1 General
The review mainly deals with the published literatures about different soft soils of Bangladesh
and abroad. It deals with information about available index properties of soft soil and case
histories of different civil construction work on soft soil in different countries. The general
idea of this chapter is to draw an inference from the published data of similar type to compare-'-the geotechnical properties of soft soil ofthe study area. -
2.2 Problems with Soft Soils in Bangladesh
The principal foundation problems in Bangladesh at the project site as well as in the nearby
area are related to the low shear strength of the underlying soil. Such soils with low shear
strength are not strong enough to support the most common structures with conventional
shallow foundation systems and therefore, pose a serious foundation problem for the entire
region. In practice, various types of shallow foundations such as pad, strip and compensating
types are used for light structures with pressures ranging from 25 to 40 kPa at depths between
1.5 m and 3.0 m.
Settlement is another major foundation problem in_Bangladesh related to the loose and
compressible nature of the subsoil. Excessive settlement is observed with many structures even
with portal frames and boundary walls. The most extreme settlement is seen in rural roads and
also in the major roads connecting the districts. Several segments of these roads are built on
1.5 m to 3.0 m high embankments where settlements up to 40 cm were recorded (Mollah
1993). It is expected that these settlements are due to the consolidation of both fill material and
compressible underlying soft soil. Numerous settlements on a large number of road segments
have made the bituminous surface uneven causing severe cracks. Embankments, requiring
extensive filling work; are constructed. throughout the plains of Bangladesh for flood
protection, irrigation and for development of road network. In general, the natural state of the
local soils is not suitable for embankment constmction and maintenance. The most common
problem with embankment construction is generally soft nature of the top soil as well as the
underlying soil. With the rapid urbanization, the major cities of Bangladesh are facing
foundation problems on soft ground ..Because the balter founding land has been exhausted
leaving the Beels, Khals, Jheels, etc. that needs massive reclamation work before con'struCti6n.
7

Structural foundations on soft soils in this country are limited to use of raft foundations, piled
footing and well supported footings. The principle of floating foundations (raft foundations)
has been frequently used in reducing settlements, specially in soft clays. Wells, sunk by
manual digging, are normally used up to depths of 5 m to 8 m. These wells, made of brick
masomy, are 1.2 m to 1.6 m in diameters. Piled foundations, using reinforced concrete piles
are extensively used for durable structures. The loads created by major civil engineering
structures are often transferred through reinforced piles on the sand siratum, which has a high
bearing value. Pre-cast concrete piles are commonly used in areas where there is soft clay.
Because of low labour costs, large diameter cast in place (bored) piles are normally used in soft
clays to support heavy concentrated loads. For smaller loads, timber piles with a diameter of
120 mm to 150 mm and a length of 8 m to 10m have been extensively used for a long time to
support buildings in soft soil. The "Cut and Replacement" technique has been used recently in
a number of building construction projects. In these constructions, the top soils, often
containing soft organic layers are excavated and replaced by river sands. Spread footings or
mat foundations are then constructed. These are used to increase the allowable bearing
pressure and to achieve uniform stress on underlying soft layers, thereby minimizing the
differential and total settlements. Very recently some use of sand columns, the so called sand
piles, has been reported. Sand piles ranging in diameter from 150 mm to 300 mm has been
used. However deep-seated soft soils containing organic matters, peat, etc. are now becoming a
big challenge for the geotechnical engineering, especially for land reclamation works at the
location ofproject area.
2.3 Case History of civil construction on soft soil
2.3.1 Khulna university building
Siddique et al. (2002) reported the Khulna University has been constructed on such a
troublesome soft soil. A typical soil bore log is shown in Fig. 2.1. From this boring, four
distinct layers are recognized. The top layer about 1 m to 4 m thick consists of gray soft clay.
Below this layer a very soft dark gray and black organic soil with thickness of about 3.5 m.
The third layer consists of soft clay with silt and some organic matter up to a depth of 18 m to
21 m that is the problematic soil that had standard penetration value as low as zero. Within
upper 6 m, soil is very soft containing in place water content as high as 400%. Presence of
organic matter is also evident within this zone. Organic content in different boreholes in
various depth varied form 3%' to 50%.
8

[""L S"£J.A STAOIGTM ••••
H - VALVl!: 0(5 CltlPT ION
, ~ <> '0 ~,'" <> .ro ,:?::i
, G "., •• .,. lOll 0
tl., , 80
- \ ~r~r:OOr,.M40
0
G~r --.. w,el.y, It ••• , .tdKO"'~H" -.4G~oI """,...,
') ~~"..'",,7'td In G~;l:r
~
a•• 0>< .,11 , lIsT"'" 100 kPa"'ICI 01 0.." •••. I fl ;: 0,305 III,"otle'
0 ': S/woo' '"""'l- t-. " ••••5.' ,,' cloy 0 Ton-._
0
U_ I_L-L.~
Properties Values
Natural water content (wn) 400%
Organic content (OC) 3 - 50%
Initial void ratio (eo) 3%
Undrained shear strength (So) 2 - 25 kPa
"
'0
.0
.0
",0
'0
"ww 30•
'0
o
9
Void ratio is close to 3 in some undisturbed samples were noted. Undrained shear strength of
undisturbed sample in the soft organic clay layer varied from 2 kPa to 25 kPa. Table 2.1
presents geotechnical property of Khulna University site. Two four-storied buildings, a
student residential building and an academic building were built at the above location.
Foundation for the buildings consisted of shallow continuous footing (raft foundation) over
fine sand fill placed after removal of about 4 m of soft ground at the surface and the peat
layer. Because of the low level of the surrounding area the sand fill was extended to an
additional 1.4 m above the surrounding ground level. The filling sand having fineness. .modulus of 2.2 and 1.2 was mixed at a ratio 1:1 and compacted properly by sheep foot roller.
Figure 2.1: Typical borelog at Khulna university site(after SiddiqUI::et al. 2002)
Table 2.1: Property of soft organic soil at Khulna University (After Siddique et al. 2002)

"""
ITLI
•.•.1.,.. ,[.0.:.~.:..j;'
. ",'."
Time in Days1000 I~
it
\\\\\
-......
'00
""
,o
200
E "'"E,S 400
i"",iooo
'00
I•••t-"..t-.L
-
,1Figure 2.2: Foundation system of the 4-storied academic buildingat Khulna university (after Razzaque & alamgir 1999)
10
Figure 2.3: Time settlement observation of academic buih;;ngat Khulna University (after Razzaque & Alamgir 1999)
During compaction the optimum water content and the layer of sand which was approximately
230 mm for each compaction was ensured to attain the maximum dry density around 16.5
kN/mJ. Mat depth of 305 mm to 457 mm was cast over mixed compacted sand filling.
From mat up to plinth, fine sand (fineness modulus = 0.8) was used as filling materials. Detail
of the foundation system is shown in Figure 2.2. The construction of the academic building
commenced in November 1992 and was completed in February, 1994. Razzaque and Alamgir
(1999) investigated the long term settlement of the academic building. Figure 2.3 shows an the
academic building settled an average value of 760 mm occurred in six year with the last
recording on 16th March, 1999. The result shows that around 508 mm settlement occurred,
during the first 1.5 year. Rate of settlement decreased as the elapsed time increased.
• " ( • <
lim. InO.y.100 .,0
, loe'loOn 1I--Location 2--lOCOl!,on3.-loulion ~.--Location ~'.--Loc.<llJon 6--locilion1-:!:..oe&hon .!
"
"
,,"
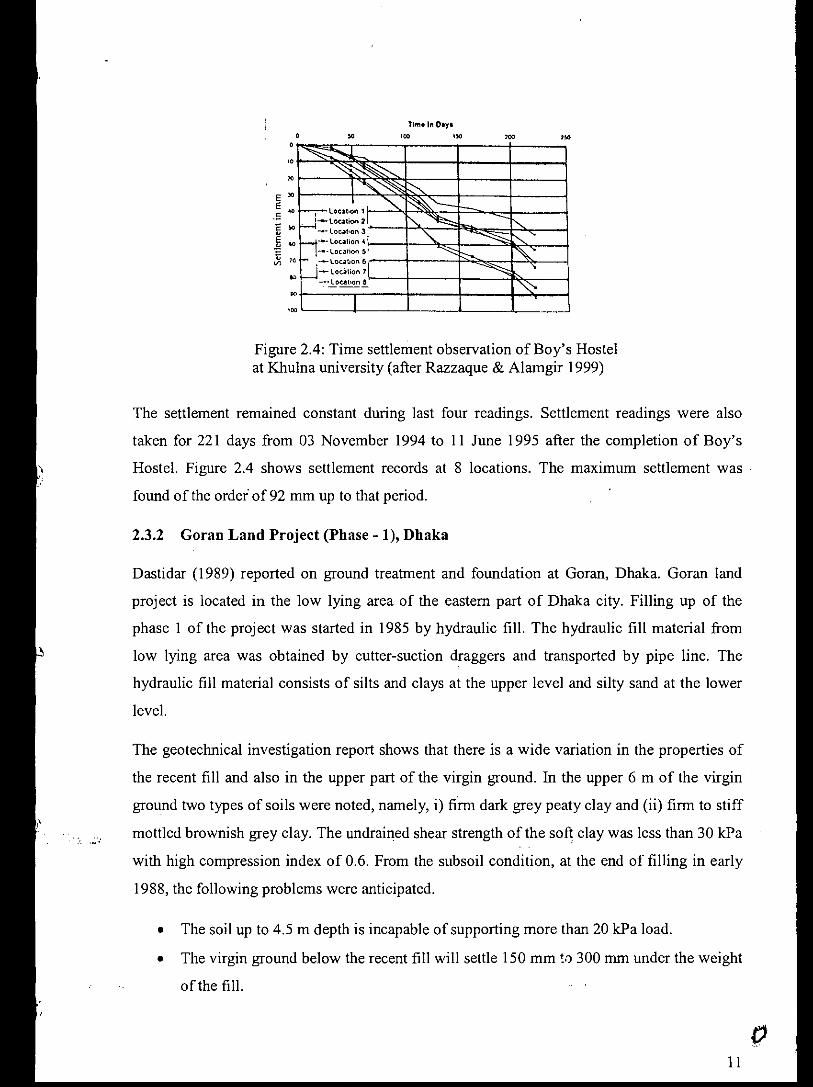
The settlement remained constant during last four readings. Settlement readings were also
taken for 221 days from 03 November 1994 to II June 1995 after the completion of Boy's
Hostel. Figure 2.4 shows settlement records at 8 locations. The maximum settlement was .
found of the order of92 mm up to that period.
Figure 2.4: Time settlement observation of Boy's Hostelat Khulna university (after Razzaque & Alamgir 1999)
2.3.2 Goran Land Project (Phase - 1), Dhaka
• The soil up to 4.5 m depth is incapable of supporting more than 20 kPa load.
• The virgin ground below the recent fill will settle 150 mm !() 300 mm under the weight
of the fill.
11
Dastidar (1989) reported on ground treatment and foundation at Goran, Dhaka. Goran land
project is located in the low lying area of the eastern part of Dhaka city. Filling up of the
phase 1 of the project was started in 1985 by hydraulic fill. The hydraulic fill material from
low lying area was obtained by cutter-suction draggers and transported by pipe line. The,hydraulic fill material consists of silts and clays at the upper level and silty sand at the lower
level.
The geotechnical investigation report shows that there is a wide variation in the properties of
the recent fill and also in the upper part of the virgin ground. In the upper 6 m of the virgin
ground two types of soils were noted, namely, i) film dark grey peaty clay and (ii) firm to stiff
mottled brownish grey clay. The undrained shear strength of the soft clay was less than 30 kPa
with high compression index of 0.6. From the subsoil condition, at the end of filling in early
1988, the following problems were anticipated.

• The virgin ground below the recent fill will settle 150 mm to 300 mm under the weight
ofthe fill.
• Under the load of a 5-storied building, the ground may settle 0.6 m to 1.2 m.
• Piles will be more than 15 ill long.
In order to strengthen the weak sub-soil preloading with sand wicks was suggested. In this
project sand wicks having 64 mm diameter with 1.22 m centers were used up to a depth of
6 m to 12 m. For preloading, soil heaps and brick stacks were used as a ground improvement
technique. It was observed that more then 90% of consolidation achieved within 4 to 5 weeks
of application of load at each stage. Piezometric reading showed that excess pore water
pressure steadily reduced with time. Standard penetration tests before and after preloading
showed substantial improvement in the ground condition. Test on samples recovered from
boreholes after preloading showed an average value of untrained shear strength of 45 kPa.
2.3.3 Embankment at the Dhaka Export Promotion Zone (DEPZ) area in savar,
Dhaka .
.Siddique et al. (2002) reported the construction work 'for embankment at Export Processing
Zone area at Savar, Dhaka commenced in January 1994. During the construction period, the
earth fill at two areas subsided in April 1994. An investigation was carried out to assess the
cause of subsidence. Table 2.2 shows typical geotechnical properties of soft organic sample
Table 2.2: Properties of a soft organic clay sample at Dhaka EPZ site, Savar(after Siddique et al. 2002)
Properties Values
Natural water content (wn) 346%
Liquid limit (LL) 220%
Plastic limit (PL) 57%
Plasticity Index (PI) 163%
Initial void ratio (eo) 4.52
Compression index (cc) 2.1
Coefficient of consolidation (Cv, *10-4 cm2/s) I to II

13
1(1 .. 14 rn
. RL+IOm
..•..•...•...•
. ..-.,"'~,:,.
I ~ ' • ' :;.._
N_Vo~
r---- - - -..,Bl ",./ B2 ..•...••
1",/'"
!!ll..JPWn •.•••• ,., •••.•.••i" •••10
. , '.t~.,,~.'...
Ill. n..u
.','.
LoqMboro- ':
~"~~:;
Figure 2.6: Steps for construction of embankments
Figure 2.5: Typical borelog with embankment sectionat Dhaka EPZ site, Savar (after Siddique et al. 2002)
collected from 4 m depth. Figure 2.5 shows embankment section and soil condition at a
typical section. It can be observed that below the embankment, a very soft to soft clay layer
exists. Thickness of this layer varies in place from I.m to 7 m depending upon location. The
N value in this layer is as low as zero at some locations. The undrained shear strength and the
extent of soft layer is the main concern in the embankment construction as well as its stability.
From stability analysis, fill height of 7 m and undrained shear strength of the foundation soil
of IS kPa provide a factor of safety of less than 1.0. It was therefore necessary to increase the
shear strength of the foundation soil (soft clay layer) by consolidation and preloading before
7 m of embankment fill is placed. In order to accelerate the consolidation of the soft clay, 65
mm diameter sand wicks encased in jute cloth at a triangular spacing of 1.5 m center to center
was recommended. Installation equipment for this type of cores is available to the local
contractors.

14
o
•
,..--- __ -10
-- - - - --- --_~_"'""',=, __I2.'
~""wtIl __ o.,' .•_1
o -------
_5 --- _
L' --
-'" -------------------------
-1..5---- _
2.3.4 Jamuna Bridge Access Road Project at Kaliakair project
Figure 2.7: Typical soil profile along the soft ground aligrunent at Jamuna Bridge AccessRoad Project site at Kaliakoir (after Kiso- Jiban 1999)
'j""1lll O'I;~ 0<,""'"
•• (-.) •• (,.oJ~5 ----------------------------------------- U
The following steps were recommended for the reconstruction of the fill (Figure 2.6):
Step I: Removal of excess soil
Step 2: Installation of sand wicks
Step 3: Placement 0000 mm thick coarse sand (enclosed in jute fabric of adequate strength)
Step 4: Placement of I m fill on jute fabric with compaction of soil at 0.3 m thick layers.
Step 5: Construction of the embankment up to the required level would be carried out, after a
waiting period of 9 to 10 months for allowing consolidation.
Note that the project was ended without installation of jute-drains. Reliable post -
construction data is not available for this project.
Siddique et a!. (2002) reported the sub soil of the part of the aligrunent namely the Kaliakoir
Bypass Road (3 km stretch) in Jamuna Bridge Access Road Project consists of very soft clay
deposit with peat. The total length of the soft ground section in the 3 Km stretch Bypass is
approximately 1.4 Km. The total thickness of the soft clay layer varies from 4 m to 13 m .
.Comprehensive laboratory tests were conducted to determine the strength and compressibility
characteristics of soft organic clay. Result indicates that the values of compression index,

(..'
initial void ratio, and natural moisture content of soft clay sample were as high as 4.5, 7.2 and
500%, respectively. The undrained shear strength of the soft samples varied from 2 kPa to 25
kPa, the coefficient of consolidation for vertical drainage was cv=3x 10⁻⁴ cm2/sec and that for
horizontal drainage was Ch = 6xlO-4 cm2/sec. The predicted magnitude of final settlement for
the proposed road embankment varied from 0.5 m to 3.2 m depending upon the ground
condition and thickness of the fill placed. A typical soil profile along the soft ground
alignment is shown in Figure 2.7.
From stability analysis of embankment on unimproved ground, it was found that the
embankment (inclusive of the extra fill required to compensate for consolidation settlement)
that would be constructed to its proposed design level on the unimproved soft clay areas had a
factor of safety of less than 1.0. The limit height of the embankment on the unimproved soft
ground varies from 5.5 to 8 m. The estimated time required to achieve a degree of
consolidation of90% is 0.3 to 2 year if the length of the drainage path was less then 2 m and it
would require 5 years where the drainage path length is greater than 4.5 m. In these soft
ground, some sort of soil improvement technique was, therefore, required to construct the
proposed embankment and to limit the post construction settlement to an acceptable level.
Ground improvement by preloading appeared to be the most economical method of the soil
improvement for this project. Installation of vertical drains were recommended for the
sections where the time for nearly completing the consolidation settlement is in an order of 5
to 10 years or more. For the section where the time required for completing most of the
consolidation settlement is in an order of 0.5 to 2 years, preloading without vertical drain was
recommended.
Soil improvement using vertical drains was carried out together with multi-stage (6 steps)
construction of the proposed embankment on soft clay ground. The objective of installing the
vertical drain is to speed-up the rate of consolidation of the soft clay soil and thereby
increasing the rate of strength gain in the soft clay layer. Before installing the vertical drain, a
1.5 m thick sand mat at the ground surface was constructed to assist the dissipation of excess
pore water pressure in the soft clay layer. Two geo-synthetic layers, a layer of geo-textile and
a layer of geo-grid, was placed in the first stage fill. The first geo-textile layer acted as a
separator which prevent filled sand from mixing with soft clay. The geo-grid was placed at
approximately 3 m above the ground level. This geo-grid layer functions as a reinforcement to
prevent slope failure that might occur within the fill during the construction of the
embankment. The proposed sequence. for the multi-stage construction of the embankment is
shown in Figure 2.8.
15

_."_0<>00Ootr0.'''' II '101/,o.,~.•_
"
_"'-0.-O1t(Jl.""."U,0. ,m ••,••
--cw,"'''lI''''U10. 1SJ"II'MO
,--r•••o..'III''''""'llt •• 1eO
S~l
--_.--Dflo.""IIIUI'0.")110'.
Figure 2.8: Construction sequence of embankment at Jamuna Bridge Access RoadProject site at Kaliakoir (after Kiso-Jiban 1999)
2.3.5 Dhaka Integrated Flood Protection Project (DIFPP)
16
Louis Berger International Inc. and Geosyntec Consultants performed a damage survey on
DIFPP in May 1991 and October 1991. Among other things they concluded that parts of the
embankment, totaling about 4.7 kIn might be subjected to sudden failure re~ulting from
inadequate sub grade shear strength. These areas were classified as Class I areas requiring: •
Q
Ansary et al. (1998) reported the results of recent soil investigations carried out at the Dhaka
Intergraded Flood Protection Embankment site. The subgrade soil profile beneath the western
embankment was found to be fairly consistent along the embankment aligrunent. The
subgrade soil consists of an upper 1 m to 30 m layer of soft clayey silt with high plasticity or
non-plastic clay with silt. This layer was underline by medium dense silty sand or sand at
depth. The clayey silt or silt layer encountered below the embankment varied in thickness
from about 1 m to 30 m. Undrained shear strength varied between 25 to 50 kPa. Initial void
ratio (eo), compression index (cc) and coefficient of consolidation (cv) varied from 0.78 to
0.89, 0.06 to 0.09 and 0.001 to 0.008 cm2/s, respectively. The upper layers consisting of
clayey silt to silt were interbedded with very soft, high plasticity organic clays or silts at
several locations along the embankment aligrunent. These soil layers were typically less than
3 m in thickness. The organic clay and silt layers were of high plasticity, very weak and highly
compressible. The upper layer of clayey silt and soils are underlain at depth by silty sand and
sand layer.

immediate remedial action. In an additional 3.1 km of the embankment, deep foundation
failure was not likely. These areas were classified as Class II and required short-term remedial
action. As a remedial action for Class I areas, the use of synthetic prefabricated vertical drain
and high strength geosynthetics were recommended. Only synthetic vertical drains were
recommended for Class II area. The wick drains consisted of a continuous polypropylene
drainage core wrapped in a needle punched non-woven geotextile. The wick drains were
installed in the class I area to an average depth of 23 m. It was found that if the vertical drains
were spaced at about 1.5 m on center, 90 percent consolidation would be achieved in about 10
months. The critical mode of failure changed from deep circle to a shallow circle at an average
degree of consolidation of about 33% which would be achieved in about 3.5 months. In class
II areas requiring sub-grade improvement, vertical drains were installed through the existing
embankment. The wick drains would be extended either to the top of the sand layer or to the
top of the medium stiff clayey silt layer. After the embankment reached to about 90 percent
consolidation under the existing load, the embankment was constructed to the final elevations.
Class II areas requiring monitoring and inspection have been resolved by constructing toe
berms, flattening the slopes and reconstructing the embankment. The previous remedial
actions in these areas had increased the factors of safety and reduced the probability of failure.
While the existing factor of safety might still be low, it was anticipated that an acceptable
factor of safety of 1.2 would be achieved in these areas over time. In addition, failure of these
sections of the embankment, if it did occur, would not likely be catastrophic. Therefore, it was
recommended that a monitoring and inspection program be developed.
Under the backdrop of very expensive remedial measures suggested by the bridging period
consultants, a pilot project proposal for use of jute fiber drains (JFD) was prepared by the
Civil Engineering Department of the Bangladesh University of Engineering and Technology
(BUET), Dhaka in 1993. BUET took the initiative for a number of reasons. These are
described in the following.
(i) Developing a very cost effective solution for the problem of Dhaka embankment.
(ii) Development of a technology which will bring substantial cost saving in soil
improvement (land development) technology in Bangladesh. cost of construction of
embankment on soft soils and hydraulic structures like gates, pump houses, barrages, etc. on
soft soil may be substantially minimized.
(iii) Bring confidence in soil construction technology, where there is lack in confidence in
the. field. of hardware development and their proper. use. As part of this project'vertical drain
installation technology will be developed.

10 I.IC~mm
r
CROSS S!CIIOH
T--l~S to IOmm
JOIl'llll .
mIl.
Smm 10 Imm li,mllu{oif SI~tldl .
- -- -- - ----------_.-- ---.- - -,- ----- A
EUVAIIOH
I.SrIY'I'I10 7mm di,mlluIvll fibn l!'o'lld
~
~, •.....ill 1:1•r. ~';,; .1-------- .,U'/- .. ~-
'!9: \f~i,~i~~:=.~::i:~-::::"-1- ----.."..".------ ---- ..--------._--------
18
It was anticipated that JFDs with coconut wire would be installed in the Class I and Class II
areas. The purpose of the jute drains was to provide vertical drainage, thus reducing the length
of the drainage path. Since the undrained shear strength of the soil is closely related to the
degree of consolidation of the soil, providing vertical drainage increases the shear strength of
Figure 2.9: Complete Jute drain made of jute fabric filter and coconut coir strands
It was also decided that a preliminary trial work of sample jute drain production by
Bangladesh Jute Mills Corporation (BJMC) and trial installation of a number of drains will be
conducted by Mechanical Engineering Directorate of the Bangladesh Water Development
Board. This will be done under the supervision of the BUET, before the commencement of the
real pilot project. As part of trial production exercise the BJMC produced a number of
samples of drains using jute rope core and jute fabric sleeve, replicating samples brought from
Singapore. A series of laboratory tests were performed on the drain materials and JFD. These
results have been reported by Kabir et al. (1994). The trial installations were conducted in
May, 1994 at the Dhaka Embankment. A total of seven JFDs were installed up to a depth of
5 m under the supervision of BUET. Box type mandrels having a cross-section of
125 mm x 25 mm and wedge shaped steel carrier shoes were used. A 20 ton tire mounted
crane with a hydraulically operated vibratory hummer was used satisfactorily to perform the
job. It consists of two layers of jute burlap (Plain Hycess jute fabric) wrapped around four of
coconut coir strands, held together by three continuous longitudinal stitches. Its width is about
100 mm, and thickness varies from 10 to 14 mm. It weighs about 525 glm. Average Grab
tensile strength of jute drains were 5290 kN and average elongation at break was about 12
percent.
(iv) Development of analytical and testing capability of the BUET in the area of vertical
drains, which will remain available for future projects involving vertical drains.

19
2.3.6 The Settlement of a Highway on Soft Bangkok Clay
'"20 ?~ y:, ~~DISTANCE rROIol ~MO NA C 1(",)"
,
EMBANKMENT GRADE LINE I r" AS ~ILT ROAOjY GRAD( 11'19J! ----
f \" ROADWAY~ADC 10 Y£~S AFTEA CO S / ~ 1\ /,\",,",XI N ~Qi WAr R LEVEL I ~L' \ ~ IF .
'~----~ ,L-=-'- .~'"-'''''-~-\. •..•. ' " ,------ - "..-----r - ...•.• - -- ....••... -~."-- •......••.••-- "",,"''''''',-...r/
ttl,r' .. ~ -'"" /T'"
~ .n.', COOSTR'JCTIO'l S£T~lE~T~. ';h ~~(~.~-.-'" r-._ . --- ..••. ~ ~ .
:;/" : ~~'0'..••.-_ .•...•.•. ::: ::::::./ J.f:.•...•.•.~;:~/v:.; \..: '" ),..-~.-".•... •••...•~~-_.:'-:--""':" \ .i.. .•
("/ \.- --.-:-- y! " '. 1'7/,~ -.,
POST~...cn:::lN :5ETTtLMEN'T1~969-19741 ---. ,\,. /'
"l. ,r '--.._\ ) L.1'TAL SEHl~MCNT "'-POST CONSTRUCT1 N SETTLEMENT-
SETTLEMENT I\...V"0o
•• '00•w2~ t~O....~ ZO(')
Figure 2.10: Grade line and settlement result along Bang Na - Bang Pakong highway(after Cox 1981)
The soft clay layer (the variation of shear strength along the highway in this surfaces zone is
shown in Figure 2.11) extends to a depth varying from 12 m near Bang Na to 25 m at km 28
from Bang Na (Figure 2.12). It is recent alluvial marine clay formed from the advance of the
Cox J. B (1981) reported the settlement characteristics of a 55 km long Bang Na - Bang
Pakong highway on Bangkok clay. Height of the embankment is 1.0 m to 2.0 m. Total
settlements of the highway embankment 10 years after construction have varied from 100 cm
to 240 cm. 20 cm to 80 cm settlements were found to conform to settlements estimated from
elastic methods using the settlement ratio method ofD'APPOLONIA et al. (1971).
0'o
i ~ou
the soil with time. Increase in undrained shear strength of the subsoil of embankment already
achieved due to preloading for the last decade. Compared with the previous investigation
(Techno consult 1994), factor of safety of the embankment section also increased as reported
by Siddique et al. (1998). It was therefore concluded that jute drain or other wick drains may
not be necessary for enhancing vertical drainage in order to achieve sufficient shear strength
of the embankment sub-soil.
'0
The highway traverses low lying areas where the depth of flooding in the rice growing season
of about five months in every year varies from 0.30 m to 0.90 m. In 1969, the carriage way. .
was built at elevations varying from 2.0 m to 2.6 m. The settlements along the highway, both
construction and post construction, are shown on Fig. 2.10.
z 2:.0o;:> I ~.w~w

10 20 30 40 . 50~.5OISTAHa; FROM BANG NA (Il"")
Figure 2. I I: Shear strength characteristics along the Highway
Cha Phraya delta and is quite young, being only about 2000 years old. Soft clay layer is
underlain by a stiff clay layer to a depth of 20 m to 25 m, followed by sand.
The moisture content in the soft clay decreases with depth but averages 80% to 120% in
surface layers up to 5 m depth, but at Ian 30 and Ian 53, it increases to 140%. The total unit
weight above 10 m depth in the area between km 20 and Ian 30 averages only 13.5. kN/mJ,
whereas most other locations the unit weight is 14.5 kN/mJ. Near Bang Na pore water
salinities are a maximum of 20 gm/liter and have been reduced to 5 gm/liter toward thesurface.
Organic contents of 3% to 10%, the plasticity index PI varies between 50% and 85% in the
surface zones with the higher values being recorded in the center of the highway at Ian 30.
The plasticity index decreases with depth and average 30% 'at the bottom of soft clay layer.
The vane shear strength is reasonably constant in the top 5.0 m, after which it increases withdepth (Figure 2. I I).
The compressibility characteristics are shown in Figure 2. I2 and indicate more highly
compressible soils from Km 20 - 35 and from Km 50 - 55. The apparent pre-consolidation
pressure in these soft areas is low and was found to increase at 1.6 times the effective
overburden pressure after 4.0 m depth.
There is a second group of firmer soils between Km 0 - 10 and Km 35 _ 50 where the
compression ration is lower, the apparent pre-consolidation pressure in surface layers is higher
(4 - 6 Tlm2) and the increase in pre-consolidation pressure values with depth is higher because
of the larger unit weights.
The settlement result is shown in Figure 2.10 indicate non-uniform construction settlement,
with the highest in the soft areas between Km 25 - 35 and Km 50 - 55 and very little in the
firmer areas between Km 0 - 10 and Km 40 - 50. Post cons'iuction settlements is more
uniform except the less settlement is still evident between Kni 40 - 50. It is seen from
20

"
~ Lpe ~ ---1\ -;::::: ~''\ ;;;.:- r."
,< ' ' '1) l.J ,'0~?'4.. .//.
. ,/ ::.r- ./ -1.,:~)I'.. 0 sc re' ,
'\ -<Ie ,v.:. f c~"(cc:w'R£SS18un I \ /RATIO
CcIt. eo, '\ - /".' / --- "'- ,...-",
I •..•.••• r- 6-
" / V-I'--- ,/
" •PREtONSOl,Dl,TXJ.j ~E (T IM1,
Figure 2.12: Compressibility characteristics along Bang Na-Bang Pakong highway (after Cox 1981)
21
'0 o , 10 I~ 20 2' 30 3~ "0 4~ ~o :.:. 1.0
DISTANCE: FROM SANG NA t KM I
• '0
"e: 10o
I) KmO-IO
o
Figure 2.10 that post construction settlements between 1974 and 1979 at Km 0 - 10 are
greater than those in 1969 and 1974. This is due to Bangkok subsidence effects becoming
dominant in recent years.
The settlement characteristics in three main settlement zones will be described. Other areasalong the highway not described are transition zones to these three main settlement Zones.Typical settlement vs. time curves are given in Figure 2.13 for three locations in these zonesand are described below.
The settlement at station 2+899 indicates low construction settlements in this area and thisbecause of the firm subgrade. Embankment pressures did not exceed the apparentpreconsolidation pressure over the full depth of the soft clay layer so that pore pressuresdeveloped were low. Consolidation settlements are generally in the over consolidated rangeand also low. However drawdown of piezometric pressures in the lower portion of the softclay layer due to ground water pumping at greater depths has caused settlements to increasefrom 8 em/year at the end of construction to 12 cm/year at the present time (Figure 2.13)
2) Km 20 - 30'and Km 50 - 55
The settlement at station Km 30 + 270 was high during construction (40 - 70 em/year) and hasgradually decreased exponentially to about 6 centimeters/year at the present time. Settlementrates decreased substantially within 5 years after construction. Embankment pressureexceeded preconsolidation pressure to depths of over 10m consolidation settlements due tothe development of significant excess pore pressures.

o
\\ •..•..--- ~STA. , •••~ •.•••. -, T.4.4'+ ~ f--
"-._.l- ...•..• rOT 30.2
::::::::::::: ---t\.\.;
1c..~~~"3+41i .. _ 1--.-I
--'<; rt:r 5T".30 270 ~STA. ••••\
, '-,
'"0.0
22
1%8 1970 1972 19704 197& 1978 1geO
o
~ ..u
E 100
•~ I~..:: 200
Figure 2.13: Settlement vs. time for Bang Na-Bang Pakong highway (after Cox 1981)
3) Km40-50.
The settlement at station Km 43+756 indicates that most of the settlement took place during
the construction period and that there has b.een little settlement thereafter. Settlements were
initially higher than between Km 0 - 10 because embankment pressures exceed pre-
consolidation pressures slightly around 5.0 m depth. However most settlements are in the over
consolidated range and are therefore fast.

2.3.7 Time- and Stress- Compressibility Interrelationship of some clay
Mesri et a!. (1977) described time- and stress- co~pressibility interrelationship of some clay.
Index properties of three natural soil deposits are presented in Table 2.3. This includes Mexico
City clay, Leda clay from Ottawa, Canada, and New Haven organic clay silt from New Haven
Harbor, Connecticut, U.S.A. Figure 2.14 and Figure 2.15 shows the relationship of Ca and Cc
for these three soil samples and relationship between compression index, Cc and secondary
compression index, Ca with respect to consolidation pressure respectively. Existing data on
calec for variety of natural soils are summarized in Table 2.4. The higher values of Ca
indicate the existences of higher percentage of organic soil.
Table 2.3: Index Properties of three natural soil deposits (after Mesri et a!., 1977)
Depth Natural Liquid Plastic Fraction Specific Critical Critical
of water limit, limit finer than gravity pressure (psi) pressure/Soil sample content 0.002mm over
burden(feet) (%) (%) (%) pressure
Mexico38 - 48 421 -574 500 150 25 - 30 2.35 1500 - 2000 1.5
city clay
Leda clay 12 - 33 82.6 - 89.5 57 - 60 22 - 27 74 2.74 1500 - 3000 1.7
New
Haven6-26 60.1-117.5 79 - 98 39 - 50 20 - 33 2.68 500 - 1500 1.5 - 1.8
orgamc
clay silt
23

I"
I. It
, I It)
'0000
c"/c,- 0 075 "'
• From The Slime Load IncrementAt Three Different Times
• From The increment With0,0 I ;; ••0,05
900
0.Q2:
004
'"
-00<0 -') Undisturbed• Remolded
From The Slime LoadIncrc~nl AI TwoDifTc~ntTimes
o~ 06 '1 • f, ~O ~ 4
o (h)100 1000 10-900 IOO,lXlO
Consolidation pressure, psf
0,01
003-
00>
006
(,(
(0)
00-000
Undisturbedc,.le,'" 0.034
Second '" r••.•••.•• , ••SUSl.ained :::::.~' J:r::.••....Loading ....L-
• UndisturbedSedimc:~~d /'Rcmol/ ...
'0
20" "Sample Depth
2.0 •• (feel)
0 UndislUrbed " •Sedimanred1 ,
~
0Remoided '0
'0,
0' - ,0
0'• 0 ~ e
0'
0 O'Undisturbed
00' Remolded
Finl SecondSllSlained Sustained
00.Loading, Loading 0'00 Undisturbed
Scl.!imcnlcd 00' 006Remolded
006002
24
r
FimS\l$laincdLoading,O'
0'
0
0'
O''"-"~ ° ,<J
" 0'oJ
0'
0'00
Figure 2.14: Relationship between Ca and Cc for (a) Mexico City clay; (b) Leda clay;(c) New Haven organic silt (after Mesri et al. 1977)
Figure 2.15: Relationship between cc and Cet with consolidation pressure for (a) Mexico Cityclay; (b) Leda clay; (c) New Haven organic silt (after Mesri et al. 1977)

Table 2.4: Values ofca I Ce for Natural Soil Deposits (after Mesri et al. 1977)
Soil calce
Whangamarino clay 0.03 - 0.04
Norfolk organic silt 0.05
Calcareous organic silt 0.035 -0.06
AmOlphous and fibrous peat 0.035 - 0.083
Canadian muskeg 0.09 - 0.10
Leda clay 0.03 - 0.055
Leda clay 0.04 - 0.06
Peat 0.075 - 0.085
Post glacial organic clay 0.05 - 0.07
Soft blue clay 0.026
Organic clay and silt 0.04 - 0.06
Sensitive clay, Portland 0.025 - 0.055
Peat 0.05 - 0.08
San Francisco Bay mud 0.04 - 0.06
Mexico City clay 0.03 - 0.035
Hudson River silt 0.03 - 0.06
25

860•• 25 to 50 kPa 0 e
u82 ~
0-~:>
Q) 7.8 ai~Q :>
V)OJ 1 4 V)
a: ~7.4 0-."2
Q)0 ~> 7 00-V)
70 V)Q)ux
0 w
661 O. 2 1 O. I 1 00 1 0 I 1 02 1 03 1 04 1 05
Time, t (min)
Patrick et al. (1991) described the calc, concept with Middleton peat, where Ca is coefficient
of secondary consolidation and c, is Compression index, Sample of these materials was
obtained using thin walled Shelby tubes and by hand excavation of large block from a test pit
at a depth of 104m.Middleton peat has the following average index properties: fiber content of
50%, water content of550%, organic content of93%, and initial void ratio, of 10.5. Middleton
peat is normally consolidated and has an effective pre-consolidation stress of25 kPa.
26
2.3.8 calc, Concept Applied to Compression of Middleton Peat.
Figure 2.16: e- log (t) curve for Middleton peat (after Patrick et al. 1991)
The curves of void ratio (e) versus logarithm of time for Middleton peat shows some
difference from those of most inorganic soils. Figure 2.16 shows the e- log t curve for a
sample oflarge diameter (~=295 mm and height is 118 mm) subjected to consolidation for 10
week at the 50 kPa load increment. The excess pore pressure (u) dissipation curve (u- log t) is
also shown in Figure 2.16. The inflection point between primary and secondary stages at time
tp, which is taken to indicate the end of primary consolidation for most clay, is not well
defined for Middleton peat. From the curve it is seen that after some time tk, the curve deviate
from the linear secondary portion and gives rise to a steeper compression segment on the
logarithmic plot. Figure 2.16 shows clearly the increase of Ca with time and the existence of
tertiary compression for long duration test on Middleton peat.

27
1000100
Effective Stress. o' (kPa)y
21 0
10~,
8
Q)
0
OJ 6a:t p
TI0 10 1---p> 100 1--p
4 1000 1----p10000 I p
According to the calce method (Mesri and Godlewski 1977), an end of pnmary
Figure 2.17: e -log (ay') curve for Middleton peat (after Patrick et al. 1991)
compressibility curve is constructed by plotting ep for each load increment on a e - logav'
diagram. Additional e- logav' curves are constructed on the same graph from void ratios
corresponding to times 10tp, 100tp, lOOOtpand lOOOOtp,where tp is time of end of primary
consolidation. Figure 2.17 shows a set e- logav' curve for small diameter sample (lj> = 63 mm
2.4 Concluding remarks
and height is 25mm) 10 week test. The value of Ce is not constant but increases to maximum
at ay'= lOOkpa, then decreases with increasing effective stress. Also at any given stress, the
value of c, changes with elapsed time ofloading.
A lot of works has been done on soft clay as well as soft organic clay by various researchers.
Not much work has been reported on Bangladeshi soft soil, especially on soft soils underline
by organic matter. However, the soil profile of this project area is very close to Khulna
University premises. So it is likely that the soils of this project area would be at least as soft
as that occurred at the vicinity ofKhulna University.

CHAPTER 3
METHODOLOGY ANDINVESTIGATION PRO GRAMM
3.1 General
The present study area is confined in SRNDP within the under-construction road section from
Mollahat to Noapara at Bagerhat. The concerned area is mostly swampy and low-lying
marshy land. The area remains water-logged almost throughout the year, leaving only a couple
of months in dry condition. Preliminary investigation shows that soil deposits are non-
homogeneous, of varying thickness at various locations. In general, the soft soil deposits are
deeply extended and hence their existence was observed at deeper depths of the existing canal
or river with respect to other plain land. It indicates that previously there were deeper canals
and/or rivers in this area, which had been filled up eventually by alluvial and organic deposits.
Historically, this alluvial and organic deposits makes the project area a challenge for
geotechnical engineers. Data for 32 boreholes (BHs) drilled in the area were assembled for the
site characterization and therefore, to develop correlation among various soil parameters that.
can be used to develop a suitable and effective methodology to improve the subsoil
conditions.
3.2 Methodology
As mentioned earlier, data of 32 BHs were analyzed for this research purpose. All the BHs
were drilled along the centerline of the road section of SRNDP from Mollahat to Noapara
between the chainage km 10+000 to km 18+000. Note that the chainage km 10+000 indicates
a chainage distance of 10 km from the reference, which is the Mollahat-end of having
chainage km 0+000. Thus the digit before '+' symbol indicates kilometer and that after the '+'
symbol indicates meter, while the '+' symbol adds the two quantities so as to provide the total
chainage distance from the reference end of Mollahat. However, out of 32 BHs, the author
conducted eight BHs by himself solely for this research purpose; Six of them were along the
centerline of the road sections and the other two were in two trial sections after subj ecting to
preloading. The purpose of preloading was to investigate the extent of subsoil improvement
by use of this technique, details of which will be described later. The remaining 24 BHs were
drilled by the Consultant and the Contractor farms of SRNDP, who have been engaged in
materializing the project. The Consultailt farm is consisted of three consulting farms, namely,
Japan Overseas Consultants Co. Ltd., Nathan Associates Ins. (both overseas farms) and a
28

native farm - The Bangladesh Consultants Ltd. (BCL). They conducted 10 BHs. The
remaining 14 BHs were drilled by China National Overseas Engineering Corporation
(COVEC) - the Contractor of this section ofSRNDP.
The depth of these BHs was ranging from 3 m to 35 m depending on the necessity of work.
That is, the depth of drilling was varied from 3 m to 10m at various locations for the purpose
of identifying the area and the extent of soft and peat (organic soil) layer, while at locations of
the proposed short-span bridge foundation, drilling depth was more extending inside the
ground varying in the range from 15 m to 25 m. On the other hand, drilling depth was from
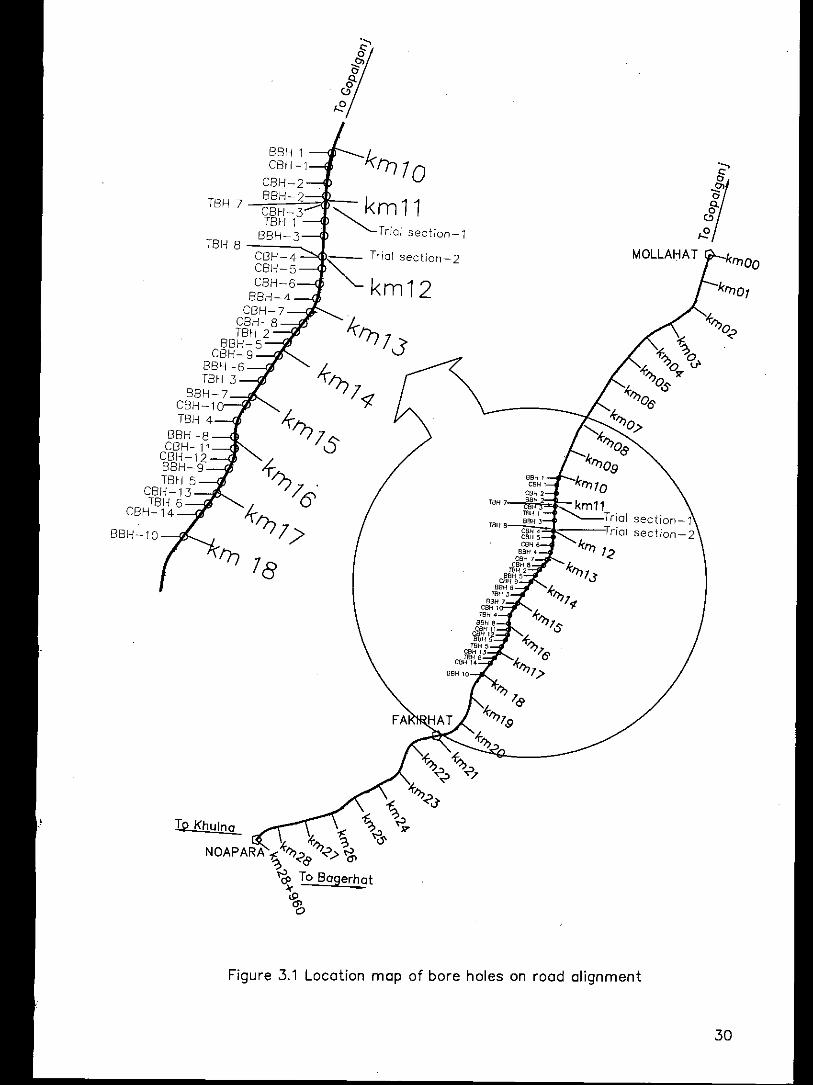
30 m to 35 m at locations for the proposed relatively long span bridge foundation. Location of
these BHs was shown in Figure 3.1. Table 3.1 also lists identification of each BH together
with the chainage from the reference (i.e., Mollahat end). Each BH is also defined in-place
with respect to the names of Mouza and Village in the locality as well as with the help of a
pair of co-ordinates (i.e., Northing and Easting corresponding to a reference). For this
purpose, an arbitrary co-ordinate at Katakhali intersection on Khulna- Mongla road is assumed
to be N (i.e., Northing)= 2500 and E (i.e., Easting)= 2500. The co-ordinates of each BH
together with its Mouza and Village names are listed in Table 3.1. Site location of each -BH is"-"
identified approximately on the map in Figure 3.1 and are marked by putting the same
identification number on it. In the table, the BHs conducted by the author are named (i.e., the
identification number) in series ofTBH, i.e., TBHl, TBH2, .... , TBH8. On the other hand, the
BHs drilled by the Consultant and the Contractor were designated by the series of BH, i.e.,
BHl, BH2, ..... , BH23 and BH24.
Field test such as Standard penetration test (SPT) was conducted in all BHs at various depths
with an interval of 1.5 m down to a particular BH. For execution of SPT, a split spoon was
attached to the lower end of the drill rod and the rod was lowered in the BH. The upper end of
the drill rod was fitted with a collar on which a weight of 63.52 kg (140 lb) was dropped
freely from a height of 760 mm (30 inch). The number of hammer blows required for each
150 mm penetration of the drill rod, out of 450 mm (18 inch) in three stages, was recorded.
The total blow count required for the last two stages (i.e., for last 12 inch) is the measure of
SPT -N value at a particular depth. Boring operation was continued until a hard formation of
minimum 5 m thick exhibiting SPT-N value more than 50 encountered. Again, a BH drilling
was terminated if a minimum of 7 m thick bearing layer with having SPT -N value over 30 was
achieved. On the other hand, for soft and peat soil investigation, drilling was continued until
SPT-N value more than 3 was achieved. Drilling was progressed by wash boring method.
Bore logs of all 32 BHs were presented in Appendix-A.
29
.....,
78.
gt.9
MOLLAHAT
88H 1CSH 1
CSH 2
18'17 ~8HTI," ,
TBH 8 BSH)CSH 4CBH 5CSH 6BaH 4
CBH 7CBH 8
""aSH 5CBH 9
BSH 6TBH J
BSH 7CBH 1,,«
aSH Bc1J~rWaSH 9TBH5
CBH 13
""CBH 14
BSH 10
30
Figure 3.1 Location map of bore holes on road alignment
BBH 1CBH-l
CBH-2TBH 7 BBH-2
CBH-3TBH 1BBH-3
TBH 8CBH-4CBH-5CBH-6BBH-4CBH-7CBH-8TBH2
BBH-5CBH-9
BBH-6TBH3
BBH-7CBH-lTBH4
BBH-8CBH-l1CBH-12BBH-9TBH 5
CBH-13TBH6
CBH-14
BBH-l0
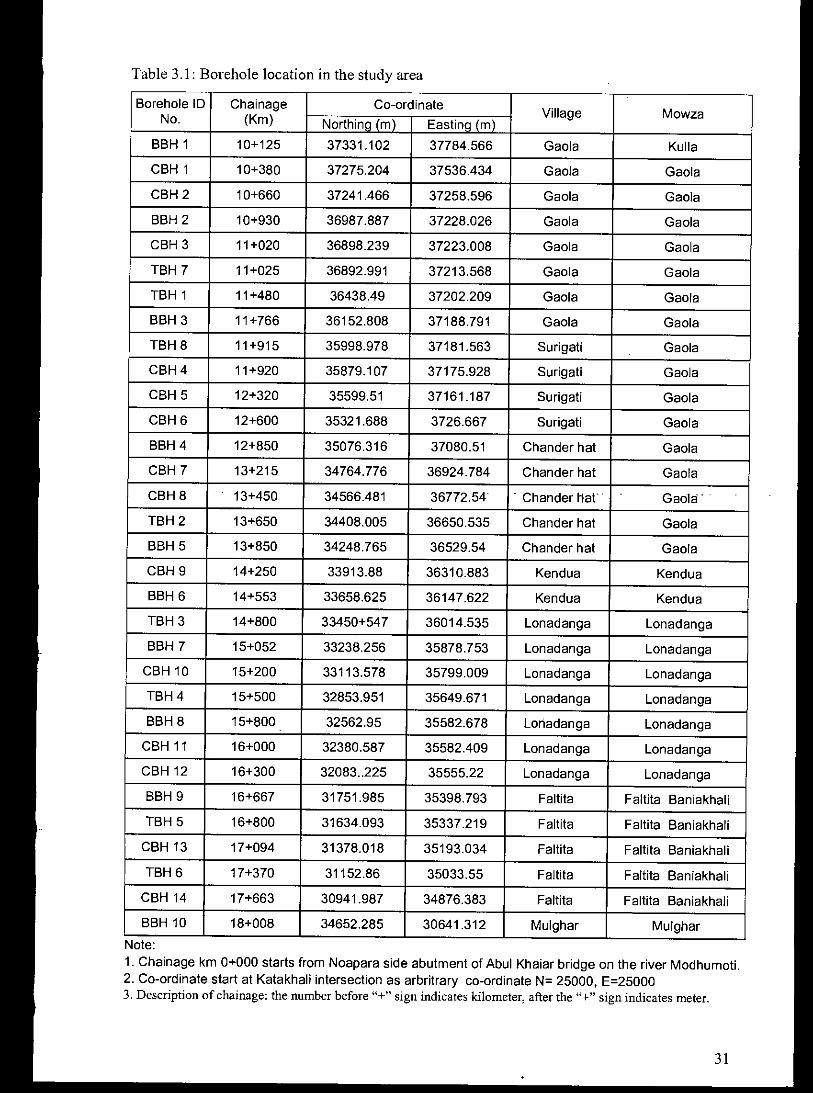
Table 3.1: Borehole location in the study area
Borehole 10 Chainage Co-ordinateVillage MowzaNo. (Km) Northina (m) Eastina (m)
BBH 1 10+125 37331.102 37784.566 Gaola Kulla
CBH 1 10+380 37275.204 37536.434 Gaola Gaola
CBH2 10+660 37241.466 37258.596 Gaola Gaola
BBH 2 10+930 36987.887 37228.026 Gaola Gaola
CBH3 11+020 36898.239 37223.008 Gaola Gaola
TBH 7 11+025 36892.991 37213.568 Gaola Gaola
TBH 1 11+480 36438.49 37202.209 Gaola Gaola
BBH 3 11+766 36152.808 37188.791 Gaola Gaola
TBH8 11+915 35998.978 37181.563 Surigati Gaola
CBH4 11+920 35879.107 37175.928 Surigati Gaola
CBH 5 12+320 35599.51 37161.187 Surigati Gaola
CBH6 12+600 35321.688 3726.667 Surigati Gaola
BBH4 12+850 35076.316 37080.51 Chander hat Gaola
CBH 7 13+215 34764.776 36924.784 Chander hat Gaola
CBH8 13+450 34566.481 36772.54 - Chander Hat" . Gaola' .
TBH2 13+650 34408.005 36650.535 Chander hat Gaola
BBH 5 13+850 34248.765 36529.54 Chander hat Gaola
CBH9 14+250 33913.88 36310.883 Kendua Kendua
BBH6 14+553 33658.625 36147.622 Kendua Kendua
TBH3 14+800 33450+547 36014.535 Lonadanga Lonadanga
BBH 7 15+052 33238.256 35878.753 Lonadanga Lonadanga
CBH10 15+200 33113.578 35799.009 Lonadanga Lonadanga
TBH4 15+500 32853.951 35649.671 Lonadanga Lonadanga
BBH8 15+800 32562.95 35582.678 Loriadanga Lonadanga
CBH 11 16+000 32380.587 35582.409 Lonadanga Lonadanga
CBH12 16+300 32083 ..225 35555.22 Lonadanga Lonadanga
BBH 9 16+667 31751.985 35398.793 Faltita Faltita Baniakhali
TBH 5 16+800 31634.093 35337.219 Faltita Faltita Baniakhali
CBH 13 17+094 31378.018 35193.034 Faltita Faltita Baniakhali
TBH6 17+370 31152.86 35033.55 Faltita Faltita Baniakhali
CBH14 17+663 30941.987 34876.383 Faltita Faltita Baniakhali
BBH 10 18+008 34652.285 30641.312 Mulghar MulgharNote:1. Chain age km 0+000 starts from Noapara side abutment of Abul Khaiar bridge on the river Modhumoti.2. Co-ordinate start at Katakhali intersection as arbritrary co-ordinate N= 25000, E=250003. Description of chainage: the number before "+" sign indicates kilometer, after the "+" sign indicates meter.
31

Description N value from SPT
Very soft 0-2
Soft 3-4
Medium stiff 5-8
Stiff 9 -15
Very stiff 16 - 30
Hard >30
32
Class Symbol
Subsoil deposit is layered type, basically fine grained soils (cohesive type) and coarse-grained
soils (cohesion less). In bore log description, soil deposit, whether fine-grained or coarse-
grained, are classified for pictorial representation into six sub-groups. Fine-grained soils are
sub-divided as: Ct (N= 0-2, consistency: very soft), Cz (N= 3-4, soft), .... , C6 (N)30, hard).
On the other hand, the coarse-grained soils are classified as St, Sz, .... , and Ss. For each sub-
division of coarse-grained soil, the range of SPT-N value, density state (e.g., loose, dense,
etc.) and the representing symbol are given in Table 3.3. Similar description for fine-grained
soil is given in Table 3.2. It is to be mentioned that a soil is defined as fine-grained if it
contains fines passing through #200 sieve more than 50% of total material, otherwise the soil
is coarse-grained.
Table 3.2: Classification of fine grain soil
Table 3.3: Classification of coarse grain soil
Class Symbol Description N value from SPT
St WtX+MLmiX+i%}/1 Very loose 0 - 4SZ I;:;:;:;:;:;:;:;: ;:;: ;:;:;:;:;:;:1 Loose 5 - 10s} ~~~~~~~~~~~~~~~~~~~~~~~~~~lMedium dense 11 - 30S4 I ! ! ! ! ! , Dense 30 - 50Ss ~ Very dense > 50
33
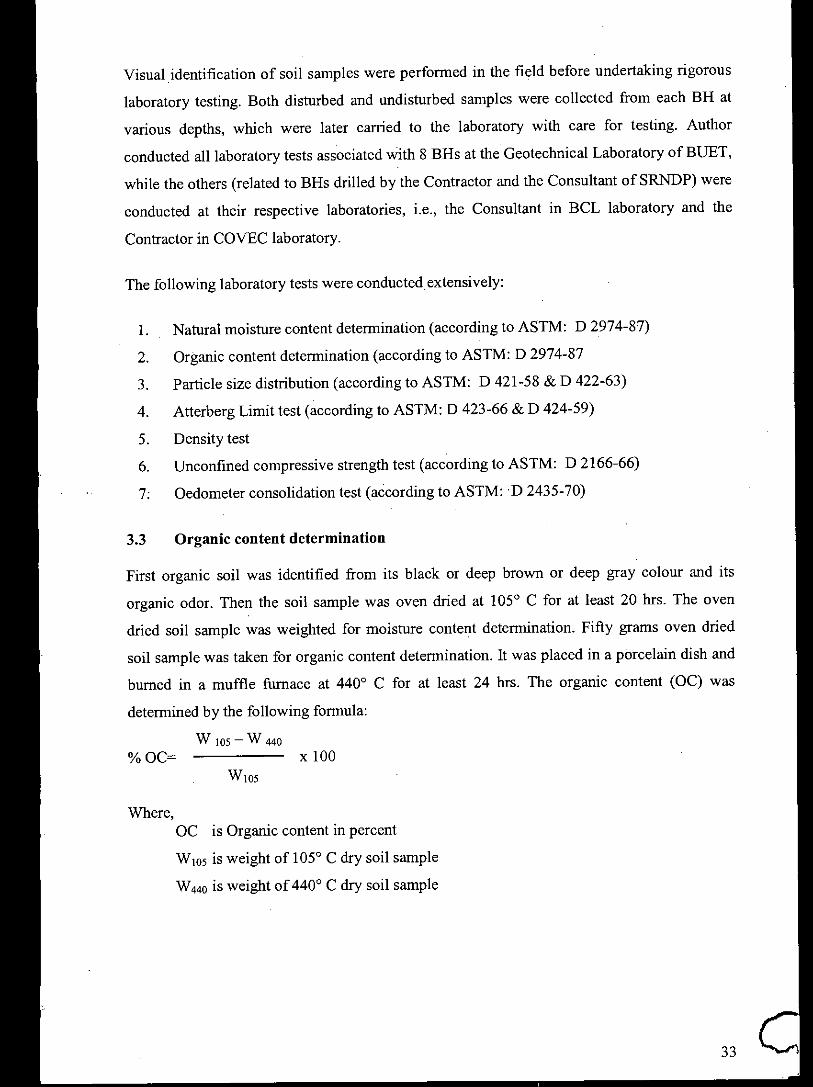
The following laboratory tests were conducted extensively:
x 100WlO5
%OC=
1. Natural moisture content determination (according to ASTM: D 2974-87)
2. Organic content determination (according to ASTM: D 2974-87
3. Particle size distribution (according to ASTM: D 421-58 & D 422-63)
4. Atterberg Limit test (according to ASTM: D 423-66 & D 424-59)
5. Density test
6. Unconfined compressive strength test (according to ASTM: D 2166-66)
7: Oedometer consolidation test (according to ASTM:'D 2435-70)
Where,OC is Organic content in percent
W 105 is weight of 1050 C dry soil sample
W 440 is weight of 4400 C dry soil sample
3.3 Organic content determination
First organic soil was identified from its black Of deep brown or deep gray colour and its
organic odor. Then the soil sample was oven dried at 1050 C for at least 20 hrs. The oven
dried soil sample was weighted for moisture content determination. Fifty grams oven dried
soil sample was taken for organic content determination. It was placed in a porcelain dish and
burned in a muffle furnace at 4400 C for at least 24 hrs. The organic content (OC) was
determined by the following formula:
W 105 - W 440
Visual identification of soil samples were performed in the field before undertaking rigorous
laboratory testing. Both disturbed and undisturbed samples were collected from each BH at
various depths, which were later carried to the laboratory with care for testing. Author
conducted all laboratory tests associated with 8 BHs at the Geotechnical Laboratory ofBUET,
while the others (related to BHs drilled by the Contractor and the Consultant of SRNDP) were
conducted at their respective laboratories, i.e., the Consultant in BCL laboratory and the
Contractor in COVEC laboratory.

CHAPTER 4
GEOTECHNICALCHARACTERISTICS OF UNDERLYING SOIL
4.1 General
A geological profile is a graphical representation of underground soil condition along a curtail
aligrunent on the ground surface. The exact condition of geological profile as compared to the
actual soil condition depends upon the nature of ground and the spacing of boring. If the soil
conditions are erratic, the arrangement of various layers may differ considerably from the
interpolation.
Field and laboratory test data obtained from 32 boreholes drilled by the author, consultants
and contractor of SRNDP were compiled, analyzed to characterize the profile of the project
area. Based on the test results, two trial sections, which will be used later as embankment of
the road, were developed, the trial section were preloaded to improve underline soil. .characteristics. Data, irrespective of the source, were compiled and analyzed to characterize
sub soil of the project site. Additional two more boreholes were drilled at these two trial
sections to determine the effectiveness of preload. Summary of the range of soil parameters is
presented in table 4.1. The elevation of the study area varies from -0.279 m PWD to 3.103 m
PWD. Elevation of water table also varies from -0.217 m PWD to 1.303 m PWD.
4.2 Borehole Description
The soil sample collected from site (both disturbed and undisturbed) at different location and
different depth within the study area were tested in the laboratory to ascertain the general
characteristics of the soil. These collected soil samples were subjected to routine classification
of natural moisture content, organic content, grain size distribution, Atterberg limit test. The
soil has been classified as per Unified Soil Classification System (USCS).
Table 4.2 shows range of soil parameter within chainage Km 10+000 to Km II +000. At this
location four boreholes were drilled up to depth from 12 m to 35 m. One borehole was drilled
up to 12 m, two nos. boreholes were drilled up to 25 m and one borehole was drilled up to 35
m depth.
Borehole BBH 1 at chainage Km 10+125, soil up to 4.5 m depth is very soft (N value is 1 -
3) clayey silt, top 0.5 to 1 m thick soil is deep brown to black colour. Various soil properties at
this stratum are as follows: organic contents (OC) is 11%, natural moisture content (wn) is
34

,
37%, Liquid limit (LL) is 45% and plasticity index (PI) is 23%; sand is 3% and clay is 17%;
wet density (I'w) and dry density (I'd) are 17.48 kN/m3 and 12.88 kN/m3, respectively;
unconfined compressive strength, qu at this depth is 15 kN/m2; compression index (cc) and
initial void ratio (eo) are 0.264 and 1.047, respectively. Soil at this stratum can be classified as
per unified soil classification system as OL.
From 4.5 to 9 m depth, the soil at this stratum is medium stiff to stiff silt. Various soil
properties at this stratum are as follows: N value is in the range of 6 - 13, natural moisture
content (wn) is 32%, organic content (OC) is 5%; sand is 7% and clay is 5%; liquid limit (LL)
is 37% and plasticity index (PI) is 21%; wet density (I'w) and dry density (I'd) are 17.14 kN/m3
and 12.9 kN/m3, respectively; unconfined compressive strength, qu is 27 kN/m2
; compression
index (cc) is 0.26 and initial void ratio (eo) is 1.042. Soil at this stratum can be classified as per
unified soil classification system as OL.
Soil at depth from 9 - 18 m is medium stiff to stiff sandy silt with little clay content. Various
soil properties at this stratum are as follows: natural moisture content (wn) and organic
content (OC ) are 35% and 3%, respectively; liquid limit, LL is 32% and plasticity index, PI is
14%; sand content is 20% and clay content is 5%; unconfined compressive strength, qu is 36
kN/m2; SPT-N value is in the range of 7 -13. Grain size is larger and compacted with
increasing depth. Natural moisture content (wn) and organic content (OC) decrease with
increasing depth. At larger depth (up to 35 m) the soil is medium dense to dense sandy silt
(SPT-N value is in the range of 30 - >50). Sand content is 45% and silt content is 55%.
Ground RL at this location is +2.75 m PWD. Water table RL is +0.686 m PWD in the month
of April.
Borehole CBH 1 at KIn 10+380, soil up to 7 m depth is very soft, SPT-N value is in the range
of I - 2, qu is 12 kN/m2; there is a peaty soil layer of 1m thick at a depth 0.6 m below the
existing ground surface, Wn and OC are 55% and 29%, respectively; LL and PI are 55% and
35%, respectively; sand and clay content are 2% and 12%, respectively; I'w and I'd areI5.92
kN/m3 and 10.31 kN/m3, respectively. Soil at this stratum can be classified as per unified soil
classification system as OR.
Organic substance decreases with increase in depth. Below 7 m depth, bearing capacity of soil
gradually increases. SPT -N value increases up to 15 within a depth of 12 m from ground
surface. From 7 to 12 m depth, soil is stiff. Various soil properties at this stratum are as
follows: Wn is 50% and OC is 5%. LL and PI is 40% and 30%, respectively; sand and clay
35•

content are 4% and 16%, respectively; qu is 170 kN/m2• Soil at this stratum can be classified as
per unified soil classification system as OL.
From 12 - 25 m depth, the soil is very stiff silt. Various soil properties at this stratum are as
follows: SPT- N value is in the range of20 - 30; Wn and OC are 35% and 3%, respectively;
LL and PI are 36% and 8%, respectively; sand and clay contents are 20% and 10%,
respectively. Soil at this stratum is classified as per unified soil classification system as OL.
Ground RL at this location is +0.638 m PWD. Water table RL is -0.217 m PWD in the month
of April.
Borehole eBB 2 at Chainage km 10+660, it is a shallow depth borehole for determining the
soft soil thickness. The soil is very soft up to 7 m depth. Various soil properties at this stratum
are as follows: qu is 9 kN/m2, SPT-N value is in the range from 1 to 2; Wn is 45%, OC is
12.5%; LL is 50%, PI is 33%; Ywis 15.86 kN/m3 and Ydis 11.04 kN/m3; silt content is 75%,
sand content is 4%, and clay content is 21%. The soil is classified as per unified soil
classification system as OH.
Organic substance decreases with increasing depth. SPT -N value increases with increasing
depth and it is within a range from 5 to 12 at a depth up to 7 to 12 m. The soil is medium to
stiff silt with fine sand. Various soil properties at this stratum are as follows: LL is 40%, PI is
6%; sand content is 12%, clay content is 3%; Wn and OC are 41% and 6%, respectively; qu is
125 kN/m2• The soil is classified as per unified soil classification system as OL.
Borehole BBB 2 at Chainage KIn 10+930, top 15 m soil is composed of very soft to medium
cohesive soil with SPT-N value is from 1 to 7; fine particle is 90% at top 10 m and 63% at a
depth of 15 m. Various soil properties at this stratum are as follows: Wn is 52%, OC is in the
range of3% - 17%. OC is maximum at a depth from 2 to 4 m; LL is 38% and PI is l7%;"yw is
in the range from 15.85 kN/m3 to 17.02 kN/m3 and "Ydis in the range from 10.4 kN/m3 to
12.38 kN/m3; specific gravity (Gs) is 2.679, qu is from 14 kN/m2 to 22 kN/m2; eo is in the
range 1.13 - 1.202, Cc is from 0.29 to 0.316. The soil is classified as per unified soil
classification system as OL.
From 15 to 26 m depth soil is mainly consisting of medium dense fine sand. SPT -N value is
ranging from 22 - 39. The soil at this stratum consists of 85% fine sand and clay content is
0%. The soil is classified as per unified soil classification system as SM. RL of ground is
+2.198 m PWD, ground water level is +0.568 m PWD in the month of April.
36

Table 4.3 shows ranges of soil parameter within chainage K.m II +000 to K.m 12+000. At
these location four boreholes were drilled up to a depth from 8 to 25 m. Two nos. boreholes
were drilled up to 8 m depth, one test borehole was drilled up to 15 m and another one
borehole was drilled up to 25 m depth.
Borehole CBH 3 is located at chainage Km II +020. This is a shallow depth borehole. This
hole was drilled up to 9 m depth. Top 6 m soil is very soft clayey silt with high plasticity. The
soil is classified as per unified soil classification system as OH. Various soil properties at this
stratum are as follows: Wn is 52%, OC is 25%; LL and PI are 56% and 28%, respectively; sand
and clay contents are 2% and 18%, respectively; 'Yw and 'Yd are 14.65 kN/m3 and 12.19 kN/m3,
respectively; qu is 10 kN/m2, SPT-N value is in the range I - 2. The soil is classified as per
unified soil classification system as OH.
Soil stratum at depth 6 m to 9 m is sandy silt with medium plasticity. Various soil properties at
this stratum are as follows: Wn is 46% and OC is 3%, LL and PI are 48% and 27%,
respectively; sand and clay content are 31% and 4%, respectively; 'Yw and 'Yd are 16.11 KN/m3
an<;l12.35 kN/m3, respectively; qu is 22 kN/m2; SPT-N value is in the range 7 - II. The soil is
classified as per unified soil classification system as OL. RL of ground is + 0.892 m PWD,
ground water level is +0.655 m PWD.
Borehole TBH 1 at chainage km II +480, this is a test borehole. This borehole was drilled up
to 15 m depth. Soil at this location can be divided into three strata. From 0 m to 4.5 m depth,
the soil is very soft to soft clayey silt with medium compressibility. Various soil properties at
this stratum are as follows: Wn and OC are 63% and 7%, respectively; LL and PI are 39% and
16%, respectively; sand and clay content are 3% and 30%, respectively; qu is 64 kN/m2, SPT-
N value is in the range of 2 - 3. The soil is classified as per unified soil classification system
uOC-OO. •
From 4.5 m to 12 m depth, the soil is very soft to medium stiff clayey silt with medium
compressibility. Various soil properties at this stratum are as follows: Wn and OC are 57% and
19%, respectively; LL and PI are 38% and 10%, respectively; sand content and clay content
are 2% and 23%, respectively; qu is 56 kN/m2and SPT-N value is in the range of I - 5; Cc is
0.311 and eo is 1.422. The soil is classified as per unified soil classification system as OL.
From 12 m to 15 m depth, the soil is soft to medium stiff clayey silt with little quantity of fine
sand. Various soil properties at this stratum are as follows: Wn and OC are 44% and 2%,
respectively; LL and PI are 38% and 12%, respectively; sand content and clay content are 6%

and 16%, respectively; qu is 150 kN/m2 and SPT-N value is in the range of 4 - 5. The soil is
classified as per unified soil classification system as OL. Ground RL at this location is +0.818
m PWD. Water table RL is +0.623 m PWD in the month of April.
Borehole BBH 3 at chainage km 11+766, this borehole was drilled up to 25 m depth. Soil at
this location can be divided in to four strata. From 0 m to 2 m depth, the soil is soft clayey silt
with high compressibility. Various soil properties at this stratum are as follows: Wn and OC
are 38% and 14%, respectively; LL and PI are 53% and 26%, respectively; sand and clay
contents are 2% and 33%, respectively; 'Ywand 'Ydare 17.25 kN/m3 and 12.46 kN/m3,
respectively; qu is 14 kN/m2 and SPT-Nvalue is 3; cc is 0.238 and eo is 1.231. The soil is
classified as per unified soil classification system as OR.
From 2 m to 6 m depth, the soil at this stratum is very soft to soft with high compressibility.
Various soil properties at this stratum are as follows: Wn and OC are 36% and 3%,
respectively; LL and PI are 54% and 27%, respectively; sand content and clay contents are
15% and 10%, respectively; 'Ywand 'Ydare 17.49 kN/m3 and 13.17 kN/m3, respectively; qu is
12 kN/m2 and SPT-N value is in the range of 1 - 3; cc is 0.279 and eo is 1.116. Soil at this
stratum is classified as per unified soil classification system as OR.
From 6 m to 10.5 m depth, the soil is very loose to loose fine sand with some silt. Various soil
properties at this stratum are as follows: Wn is 35%, sand content and clay content are 80%
and 0%, respectively; SPT-N value is in the range of 5 - 7. Soil at this stratum is classified as
per unified soil classification system as SM.
From 10.5 m to 25 m depth, the soil is medium dense silty fine sand. Various soil properties at
this stratum are as follows: Wn is 42%; sand content and clay content are 82% and 0%,
respectively; SPT -N value is in the range of 17 - 30. Soil at this stratum is classified as per
unified soil classification system as SM. Ground RL at this location is +0.627 m PWD. Water
table RL is +0.265 m PWD in the month of April.
Borehole CBR 4 at chainage km 11+920, this borehole was drilled up to 10.5 m depth. Soil at
this location can be divided into three strata. From 0 m to 5 m depth, the soil is very soft
clayey silt with high compressibility. Various soil properties at this stratum are as follows: Wn
and OC are 43% and 12%, respectively; LL and PI are 57% and 27%, respectively; sand and
clay contents are 2% and 20%, respectively; 'Ywand 'Ydare 16.86 kN/m3 and 12.18 kN/m3,
respectively; qu is 14 kN/m2and SPT-N value is in the range of 1 - 4. Soil at this stratum is
classified as per unified soil classification system as OR.
38

From 5 m to 10m depth, the soil at this stratum is very soft to medium with medium
compressibility. Various soil properties at this stratum are as follows: Wn and OC are 37% and
3%, respectively; LL and PI are 49% and 32%, respectively; sand and clay content are 20%
and 5%, respectively; qu is 17 kN/m2 and SPT-N value is from 2 to 5. Soil at this stratum is
classified as per unified soil classification system as OL.
From 10m to 15 m depth the soil is medium to stiff sandy silt. Various soil properties at this
stratum are as follows: Wn and OC are 35% and 2%, respectively; LL and PI are 36% and
13%, respectively; sand and clay are 43% and 2%, respectively; SPT-N value is in the range
of7 - 23.
Table 4.4 shows ranges of soil parameter within chainage Km 12+000 to Km 13+000. At this
location three boreholes were drilled up to depth from 10m to 25.5 m.
Borehole CBH 5 at chainage Km 12+320, this borehole was drilled up to 10 m depth. This
borehole was drilled to determine the soft soil thickness. Soil at this location can be divided
into three strata. From 0 m to 3 m depth, the soil is very soft to medium clayey silt with high
compressibiliiy. Various soil properties at this stratum are as follows: wn and OC are 35% and
2.5%, respectively; LL and PI are 51% and 33%, respectively; sand and clay contents are 7%
and 20%, respectively; 'Ywand I'd are 17.67 kN/mJ and 13.55 kN/mJ, respectively; qu is 51
kN/m2; SPT-N value is in the range of 3 - 5. Soil at this stratum is classified as per unified
soil classification system as OH.
From 3 m to 4 m depth, the soil at this stratum is very soft to soft with medium
compressibility. Various soil properties at this stratum are as follows: Wn and OC are 50% and
12%, respectively; LL and PI are 42% and 23%, respectively; SPT-N value is in the range of2
_ 3. From 4 m to 10 m depth, the soil is soft to medium sandy silt with medium
compressibility. Various soil properties at this stratum are as follows: Wn and OC are 34% and
I%, respectively; LL and PI are 38% and 6%, respectively; sand and clay contents are 10%
and 5%, respectively; qu is 45 kN/m2 and SPT-N value is in the range of 3- 5. Soil at this
stratum is classified as per unified soil classification system as OL.
Borehole CBH 6 at chainage Km 12+600, this borehole was drilled up to 25 m depth. Soil at
this location can be divided into three strata. From 0 m to 5 m depth, the soil is very soft
clayey silt with high compressibility. Various soil properties at this stratum are as follows: Wn
and are 43% and 12%, respectively; LL and PI are 54% and 27%, respectively; sand and clay
content are 3% and 22%, respectively; 'Yw and I'd are 17.25 kN/mJ and 12.47 kN/mJ,
39

respectively; qu is 12 kN/m2 and SPT-N value is I; CC is 0.300 and eo is 1.16. Soil at this
stratum is classified as per unified soil classification system as OH.
From 5 m to 10 m depth, the soil at this stratum is very soft to soft sandy silt with medium
compressibility. Various soil properties at this stratum are as follows: Wn and OC are 37% and
5%, respectively; LL and PI is 38% and 15%, respectively; sand and clay content are 15% and
7%, respectively; "{wand J'd are 17.57 kN/m3 and 13.04 kN/m3, respectively; qu is 26 kN/m2
and SPT-N value is in the range of 2 - 4. Soil at this stratum is classified as per unified soil
classification system as OL.
From 10m to 25 m depth, the soil is medium dense to dense fine sand with little silt. Various
soil properties at this stratum are as follows: Wn and OC are 35% and 2%, respectively; Sand
and clay contents are 80% and 0%, respectively; SPT-N value is in the range of 15 - 37. Soil
at this stratum is classified as per unified soil classification system as SM. Ground RL at this
location is 0.830 m PWD. Water table RL is 0.895 m PWD in the month of April.
Borehole BBH 4 at chainage Km 12+850, this borehole was drilled up to 25.5 m depth. Soil. .
at this location can be divided into four strata. From 0 m to 2 m depth, the soil is very soft to
soft clayey silt with high compressibility. Various soil properties at this stratum are as follows:
Wn and OC are 36% and 2%, respectively; LL and PI are 53% and 26%, respectively; sand
and clay content are 1% and 23%, respectively; "{wand 'Yd are 17.21 kN/m3 and 12.61 kN/m3,
respectively; qu is 14 kN/m2, SPT-N value is in the range of 1- 3; cc is 0.276 and eo is 1.116.
Soil at this stratum is classified as per unified soil classification system as OH.
From 2 m to 8 m depth, the soil at this stratum is very soft silt with medium compressibility.
Various soil properties at this stratum are as follows: Various soil properties at this stratum are
as follows: Wn and OC are 35% and 5%, respectively; LL and PI are 48% and 23%,
respectively; Sand and clay content are 13% and 6%, respectively; "{wand 'Yd are 17.17 kN/m,3
and 12.67 kN/m3 respectively; qu is 12 kN/m2, SPT-N value is 1 - 2. Soil at this stratum is
classified as per unified soil classification system as OL.
From 8 m to 10.5 m depth, the soil is very stiff sandy silt. Various soil properties at this
stratum are as follows: Wn and OC are 38%and 2%, respectively; sand content and clay
content is 34% and 3%, respectively; SPT-N value is 17. The soil at this stratum can be
classified as OL.
From 10.5 m to 25 m depth, the soil is medium dense well graded fine sand. Various soil
properties at this stratum are as follows: Wn is 32%. Sand content and clay content are 80%
40

and 4%, respectively; SPTN- value is 14 - 30. Soil at this stratum is classified as per unified
soil classification system as SM. Ground RL at this location is 1.076 m PWD. Water table RL
is 0.895 m PWD in the month of April.
Table 4.5 shows range of soil parameters within chainage KIn 13+000 to KIn 14+000. At
these locations four nos. of boreholes of different depths were drilled. Two nos. boreholes
were drilled up to 26 m, one borehole is test borehole, it is drilled up to 15 m and another is
shallow depth borehole drilled up to 7 m.
Borehole CBB 7 at KIn 13+215, soil has been divided into two major strata. Top 12 m soil is
mainly fine grained soil with organic content of 2% to 17%. Soil at this stratum is very soft to
medium consistency with high to medium plasticity. Various soil properties at this stratum are
as follows: sand content is I - 7%, clay content is 11% to 27%. 'Ywand 'Ydare 17.33 and
12.54 respectively. qu is 12 kN/m2• N value is 1-5, eo is 1.143 and Cc is 0.29. Soil at this
stratum is classified as per unified soil classification system as OR and OL - OR. Next 14 m
depth, the soil is relatively stronger. N value is 12 - 34. Soil strata suddenly changed to dense
fine sand. Moisture content reduced to 32%. Sand, silt and clay percentage are 81, 19 and 0%.
Soil at this stratum is classified as per unified soil classification system as SM.
Borehole CBB 8 at chainage KIn 13+450 is a shallow depth borehole. Soil up to 2.5 m depth
is very soft to medium stiff clayey silt with high compressibility. N value is I to 5. Clay
content is 22% and sand content is 2%. Various soil properties at this stratum are as follows:
Wn is 43%. OC is 8%. 'Ywis 16.981 kN/m3 and 'Ydis 13.46 kN/m3 Soil at this stratum is
classified as per unified soil classification system as OR. Soil at depth 4.5 m - 7 m is
classified as per unified soil classification system as OL. Sand content is 35% that for silt is
65%, LL is 38% and PI is 8%. Various soil properties at this stratum are as follows: Wn is
36%. OC is 3%, SPT-N value is from 15 to 19.
At chainage KIn 13+650, TBH 2 is drilled up to 15 m. First 4.5 m is very soft clayey silt with
medium plasticity. Various soil properties at this stratum are as follows: Wn and OC are
41% and 5%, respectively; LL is 49% and PI is 22%, sand and clay content are 2% and 22%,
respectively; eo is 1.072; Cc is 0.275. qu is 12 kN/m2 for SPT-N value 1. Soil at this stratum is
classified as per unified soil classification system as OL
-OR.
From 4.5 m to 9 m depth soil is medium to stiff with medium compressibility. LL is 34% and
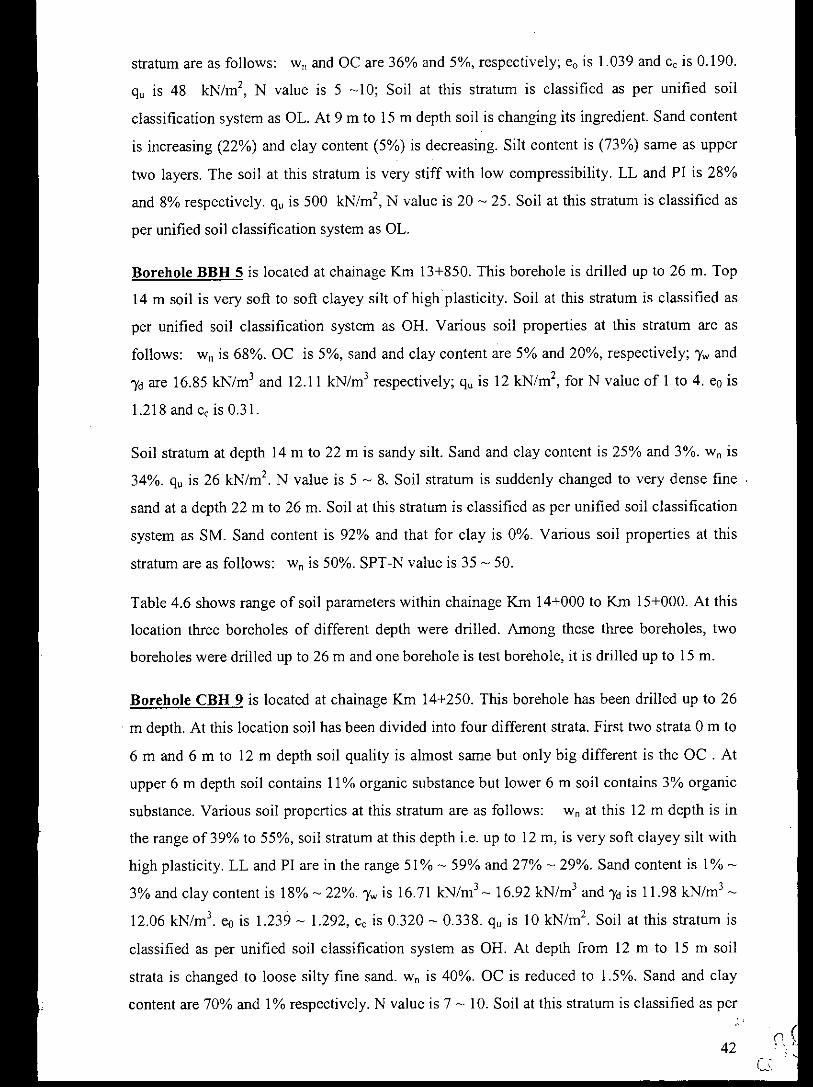
stratum are as follows: Wn and OC are 36% and 5%, respectively; eo is 1.039 and Cc is 0.190.
qu is 48 kN/m2, N value is 5 -10; Soil at this stratum is classified as per unified soil
classification system as 01. At 9 m to 15 m depth soil is changing its ingredient. Sand content
is increasing (22%) and clay content (5%) is decreasing. Silt content is (73%) same as upper
two layers. The soil at this stratum is very stiff with low compressibility. LL and PI is 28%
and 8% respectively. qu is 500 kN/m2, N value is 20 - 25. Soil at this stratum is classified as
per unified soil classification system as 01.
Borehole BBH 5 is located at chainage Km 13+850. This borehole is drilled up to 26 m. Top
14 m soil is very soft to soft clayey silt of high plasticity. Soil at this stratum is classified as
per unified soil classification system as OB. Various soil properties at this stratum are as
follows: Wn is 68%. OC is 5%, sand and clay content are 5% and 20%, respectively; 'Ywand
'Ydare 16.85 kN/mJ and 12.11 kN/mJ respectively; qu is 12 kN/m2, for N value of 1 to 4. eo is
1.218 and Cc is 0.31.
Soil stratum at depth 14 m to 22 m is sandy silt. Sand and clay content is 25% and 3%. Wn is
34%. qu is 26 kN/m2 N value is 5 - 8.. Soil stratum is suddenly changed to very dense fine
sand at a depth 22 m to 26 m. Soil at this stratum is classified as per unified soil classification
system as SM. Sand content is 92% and that for clay is 0%. Various soil properties at this
stratum are as follows: Wn is 50%. SPT-N value is 35 - 50.
Table 4.6 shows range of soil parameters within chainage Km 14+000 to Km 15+000. At this
location three boreholes of different depth were drilled. Among these three boreholes, two
boreholes were drilled up to 26 m and one borehole is test borehole, it is drilled up to 15 m.
Borehole CBH 9 is located at chainage Km 14+250. This borehole has been drilled up to 26
m depth. At this location soil has been divided into four different strata. First two strata 0 m to
6 m and 6 m to 12 m depth soil quality is almost same but only big different is the OC . At
upper 6 m depth soil contains 11% organic substance but lower 6 m soil contains 3% organic
substance. Various soil properties at this stratum are as follows: Wn at this 12 m depth is in
the range of 39% to 55%, soil stratum at this depth i.e. up to 12 m, is very soft clayey silt with
high plasticity. LL and PI are in the range 51% - 59% and 27% - 29%. Sand content is 1%-
3% and clay content is 18% - 22%. 'Ywis 16.71 kN/mJ - 16.92 kN/mJ and 'Ydis 11.98 kN/mJ-
12.06 kN/mJ• eo is 1.239 - 1.292, Cc is 0.320 - 0.338. qu is 10 kN/m2 Soil at this stratum is
classified as per unified soil classification system as OR. At depth from 12 m to 15 m soil
strata is changed to loose silty fine sand. Wn is 40%. OC is reduced to 1.5%. Sand and clay
content are 70% and I% respectively. N value is 7 - 10. Soil at this stratum is classified as per
42 c;

unified soil classification system as SM. At larger depth (15 m - 26 m), soil is dense to very
dense well graded fine sand layer. Various soil properties at this stratum are as follows: Wn is
48%; sand content is 87% and clay content is 1%; SPT-N value is 35 - >50. Soil at this
stratum is classified as per unified soil classification system as SM. Ground RL at this location
is +0.151 m PWD. Water table RL is +0.455 m PWD in the month of April.
Borehole BBH 6 is located at chainage KIn 14+553. This borehole is drilled up to 26 m depth.
At this location soil is divided into three strata. Top 6 m soil is very soft with high plasticity.
Various soil properties at this stratum are as follows: Wn and OC are 40% and 7%.,LL and PI
are 58% and 28%, respectively; sand and clay contents are 1% and 19%, respectively;. 'Ywand
'Ydare 16.59 kN/m3 and 12.15 kN/m3,respectively; eo and Cc are 1.204 and 0.314,
respectively; qu is 13 kN/m2 and N value is 1. Soil at this stratum classified as per unified soil
classification system as OH.
From 6 - 15 m depth strata is changed to medium densed sand layer. Various soil properties at
this stratum are as follows: Wn is 36%, OC is 2%; sand and clay contents are 80% and 0%,
respectively; 'Ywarid 'Ydare 16.88 kN/m3 and 12.02 kN/m3, respectively; eo and Cc are 1.233 and
0.322, respectively; SPT-N value is from 10 to 18. Soil at this stratum classified as per unified
soil classification system as SM.
Soil stratum from 15 m to 26 m is medium dense to dense fine sand. Various soil properties at
this stratum are as follows: Wo is 27%; sand and clay contents are 90% and 0; SPT-N value is
in the range of 21 - 46. Soil at this stratum classified as per unified soil classification system
as SM - SG. Ground RL at this location is +0.452 m PWD. Water table RL is +0.455 m PWD
in the month of April.
At chainage KIn 14+800, TBH 3 is drilled up to 15 m depth. First 4.5 m is very soft silty clay
with high plasticity. Various soil properties at this stratum are as follows: Wn and OC are
50% and 12%, respectively; LL is 76% and PI is 51%; sand and clay contents are 3% and
25%, respectively; eo is 1.167 and Cc is 0.26; qu is 20 kN/m2 with SPT-N value is within 1- 3.
Soil at this stratum classified as per unified soil classification system as OH.
From 4.5 m to 9 m depth soil is soft to medium stiff with medium compressibility. Various
soil properties at this stratum are as follows: Wn and OC are 39% and 3.5%, respectively; LL
is 32% and PI is 7%; sand and clay contents are 5% and 22%, respectively; qu is 42 kN/m2,
SPT-N value is within the range of 4 - 8. Soil at this stratum is classified as per unified soil
classification system as OL.
43

At 9 m to 15 m depth soil is medium to stiff silt. The soil at this stratum is medium plastic.
Sand content is 9% and clay content is 14%; LL and PI are 30% and 8%, respectively; qu is 54
kN/m2 and N value is in the range of 9 - 13. Soil at this stratum is classified as per unified
soil classification system as 01. Ground RL at this location is + 1.099 m PWD. Water table
RL is +0.473 m PWD in the month of April.
Table 4.7 shows the range of soil parameter within chain age Km 15+000 to Km 16+000. At
this location four boreholes of varying depth were drilled including one test borehole. One
borehole was drilled up to 35 m depth; two boreholes were drilled up to 15 m depth and
another one was drilled up to 10m depth.
Borehole BBH 7 at chainage Km 15+052, this borehole was drilled up to 35 m depth. Soil at
this location can be divided into three strata. From 0 m to 5 m depth, the soil is very soft to
soft clayey silt with high compressibility. Various soil properties at this stratum are as follows:
Wn and OC are 45% and 17%, respectively; LL and PI are 57% and 28%, respectively; sand
content and clay content are 4% and 20%, respectively; "/W and "/d are 16.52 kN/m3 and 11.37
kN/m3, respectively; qu is 14 kN/m2, SPT-N value is in the range of I - 4; cc is 0.292 and eois
1.144. Soil at this stratum is classified as per unified soil classification system as OH.
From 5 m to 10.5 m depth, the soil is very soft clayey silt with medium compressibility.
Various soil properties at this stratum are as follows: Wn and OC are 37% and 5%,
respectively; LL and PI are 38% and 22%, respectively; sand content and clay content are 6%
and 18%, respectively; "/W and "/d are 17.3 kN/m3 and 12.64 kN/m3, respectively; qu is 16
kN/m2, SPT-N value is in the range of I - 2; cc is 0.288 and eo is 1.129. Soil at this stratum
may be classified as per unified soil classification system as 01.
From 10.5 m to 35 m depth, the soil is medium dense to dense fine sand with little silt.
Various soil properties at this stratum are as follows: Wn and OC are 32% and 0%,
respectively; sand content and clay content are 77% and 3%, respectively; SPT-N value is in
the range of II - 36. Soil at this stratum is classified as per unified soil classification system
as SM. Ground RL at this location is 0.735 m PWD. Water table RL is 0.473 m PWD in the
month of April.
Borehole CBH 10 at chainage Km 15+200, this borehole was drilled up to 15 m depth. Soil at
this location can be divided into three strata. From 0 m to 6 m depth, the soil is very soft
clayey silt with medium compressibility. Various soil properties at this stratum are as follows:
Wn and OC are 42% and 12%, respectively; LL and PI are 48% and 26%, respectively; sand
44

content and clay content are 2% and 27%, respectively; SPT-N value is 1. Soil at this stratum
is classified as per unified soil classification system as OL.
From 6 m to 9 m depth, soil at this stratum is medium compressible soft silt with little clay
content. Various soil properties at this stratum are as follows: Wn and OC are 35% and 5%,
respectively; LL and PI are 46% and 21%, respectively; sand and clay contents are 6% and
21%, respectively; 'Yw and 'Yd are 17.24 kN/m3 and 12.52 kN/m3, respectively; qu is 12 kN/m2
and SPT-N value is in the range of 3 - 4. Soil at this stratum is classified as per unified soil
classification system as OL.
From 9 m to 15 m depth, the soil is stiff silt with little sand. Various soil properties at this
stratum are as follows: Wn and OC are 32% and 3%, respectively; sand and clay contents are
20% and 8%, respectively; SPT-N value is in the range of 10 - 15. Ground RL at this location
is 0.595 m PWD. Water table RL is 0.473 m PWD in the month of April.
Borehole TBH 4 at chainage KIn 15+500, this is a test borehole. This borehole was drilled up
to 15 m depth. Soil at this location can be divided into three strata. From 0 m to 5 m depth, the
soil is soft to medium silt with medium compressibility. Various soil properties at this stratum
are as follows: Wn and OC are 32%and 2%, respectively; LL and PI are 45% and 25%,
respectively; sand and clay contents are 5% and 20%, respectively; qu is 10 kN/m2 and SPT-N
value is in the range of 3 - 7. Soil at this stratum is classified as per unified soil classification
system as OL.
From 5 m to 10m depth, the soil at this stratum is medium stiff to stiff with low
compressibility. Various soil properties at this stratum are as follows: Wn and OC are 33% and
7%, respectively; LL and PI are 25% and 14%, respectively; sand content and clay content are
3% and 23%, respectively; qu is 70 kN/m2, SPT-N value is in the range of 8 - 9; cc is 0.156
and eo is 0.948. Soil at this stratum may be classified as per unified soil classification system
as OL.
From 10m to 15 m depth, the soil is very stiff silt with few fine sand. Various soil properties
at this stratum are as follows: Wn and OC are 37% and 2%, respectively; sand content and
clay content are 12% and 8%, respectively; SPT-N value is in the range of 20 - 28. Soil at
this stratum may be classified as per unified soil classification system as OL. Ground RL at
this location is 0.103m PWD. Water table RL is 0.473 m PWD in the month of April.
45

Borehole BBH 8 at chainage Km 15+800, this borehole was drilled up to 10m depth. Soil at
this location can be divided in to two strata. From 0 m to 7 m depth, the soil is very softto soft
highly compressible silt with little clay. Various soil properties at this stratum are as follows:
Wn and OC are 43% and 9%, respectively; LL and PI are 52% and 27%, respectively; sand
content and clay content are 2% and 16%, respectively; rw and rd are 16.33 kN/mJ and 11.45
kN/mJ, respectively; qu is 12 kN/m2 and SPT N value is in the range of I - 3. Soil at this
stratum may be classified as per unified soil classification system as OH.
From 7 m to 10m depth, soil at this stratum is medium dense fine sand with little silt. Various
soil properties at this stratum are as follows: Wn and OC are 37% and I%, respectively; sand
content and clay content are 75% and 5%, respectively and SPT N value is in the range of 5 -
17. Soil at this stratum may be classified as per unified soil classification system as SM.
Ground RL at this location is 0.251 m PWD. Water table RL is 0.473 m PWD in the month of
April.
Table 4.8 shows the range of soil parameter within chainage Km 16+000 to Km 17+000. At
this location four boreholes of varying depth were drilled. One borehole was drilled up to a
depth of 35 m, another up to 25 m depth, and two boreholes were drilled up to 15 m depth.
Borehole CBH 11 at chainage Km 16+000, this borehole was drilled up to 25 m depth. Soil at
this location can be divided into four strata. From 0 m to 7 m depth, the soil is very soft clayey
silt with high compressibility. Various soil properties at this stratum are as follows: Wn and
OC are 53% and 5%, respectively; LL and PI are 51% and 22%, respectively; sand content
and clay content are 3% and 24%, respectively; rw and rd are 16.87 kN/mJ and 12.13 kN/mJ,
respectively; qu is 12 kN/m2, SPT-N value is 1. cc is 0.320 and eo is 1.218. Soil at this stratum
is classified as per unified soil classification system as OH.
From 7 m to 10m depth, the soil is soft to medium stiff silt with little sand content with
medium compressibility. Various soil properties at this stratum are as follows: Wn and OC are
48% and 7%, respectively; LL and PI is 35% and 8%, respectively; Sand content and clay
content is 17% and 9%, respectively; Yw and Yd is 16.88 kN/mJ and 12.19 kN/mJ respectively.
qu IS 27 kN/m2, SPT-N value is 4 - 8. Soil at this stratum is classified as per unified soil
classification system as OL.
From 10 m to 20 m depth, the soil is medium dense to dense silty fine sand. Various soil
properties at this stratum are as follows: Wn and OC are 32% and 2%, respectively; sand
content and clay content is 82% and 3%, respectively; SPT-N value is 17 - 48. Soil at this
46

stratum may be classified as per unified soil classification system as SM. From 20 m to 25 m
depth, the soil is medium dense to dense silty fine sand. Various soil properties at this stratum
are as follows: Wn is 33%. Sand content and clay content is 95% and 0%, respectively; SPT-N
value is 12 - 33 Soil at this stratum may be classified as per unified soil classification system
as SW - SM. Ground RL at this location is -0.279 m PWD. Water table RL is 0.473 m PWD
in the month of April.
Borehole CBH 12 at chainage Km 16+300, this borehole was drilled up to 15 m depth. Soil at
this location can be divided into three strata. From 0 m to 1 m depth, the soil is very soft
clayey silt with high compressibility. Various soil properties at this stratum are as follows: Wn
and OC are 37% and 15%, respectively; LL and PI are 57% and 27%, respectively, sand
content and clay content are 0% and 35%, respectively; SPT-N value is 1. Soil at this stratum
may be classified as per unified soil classification system as OR.
From 1 m to 10 m depth, the soil at this stratum is very soft with medium compressible.
Various soil properties at this stratum are as follows: Wn and OC are 38% and 4%,
respectively; LL and PI are 43% and 20%, respectively; sand content and clay content are 5%
and 16%, respectively; Yw and Yd are 16.10 kN/m3 and 12.28 kN/m3, respectively; qu is 16
kN/m2; SPT-N value is 1 - 2. Soil at this stratum may be classified as per unified soil
classification system as OL.
From 10 m to 15 m depth, the soil is medium stiff silt with some fine sand and clay. Various
soil properties at this stratum are as follows: Wn and OC are 36% and 2%, respectively;. Sand
content and clay content are 14% and 10%, respectively; qu is 25 kN/m2. SPT-N value is 5.
Ground RL at this location is +0.045 m PWD. Water table RL is +0.473 m PWD in the month
of April.
Borehole BBH 9 at chainage Km 16+667, this borehole was drilled up to 35 m depth. Soil at
this location can be divided into five strata. From 0 m to 7 m depth, the soil is very soft clayey
silt with high compressibility. Various soil properties at this stratum are as follows: Wn and
OC are 48% and 17%, respectively; LL and PI are 54% and 27%, respectively; sand content
and clay content are 2% and 36%, respectively; Yw and Yd are 15.83 kN/m3 and 10.89 kN/m3
respectively. qu, is 14 kN/m2; SPT-N value is 1. cc is 0.420 and eois 1.559. Soil at this stratum
may be classified as per unified soil classification system as OR.
From 7 m to 10m depth, the soil is stiff clayey silt with medium compressibility. Various soil
properties at this stratum are as follows: Wn and OC are 46% and 3%, respectively; LL and PI
47

are 44% and 19%, respectively; sand content and clay content is 9% and 19%, respectively;
SPT-N value is 11 - 15. Soil at this stratum may be classified as per unified soil classification
system as OL.
From 10m to 17 m depth, the soil is very loose to loose silty fine sand. Wn and OC are 33%
and I% respectively. Sand content and clay content are 82% and 0% respectively. qu, is 28
kN/m2, SPT-N value is 3 - 6. Soil at this stratum may be classified as per unified soil
classification system as SM.
From 17 m to 24 m depth, the soil is medium dense to very dense silty fine sand. Various soil
properties at this stratum are as follows: Wn and OC are 37% and 0%, respectively; sand
content and clay content is 86% and 0%, respectively; SPT -N value are 17 - 70. Soil at this
stratum may be classified as per unified soil classification system as SM.
From 24 m to 35 m depth, the soil is medium dense to dense fine sand. Various soil properties
at this stratum are as follows: Wn and OC are 41% and 0%, respectively; sand content and
clay content are 92% and 0%, respectively;. SPT-N value is 16 - 35 Soil at this stratum may
be classified as per unified soil classification system as OL. Ground RL at this location is
0.809 m PWD. Water table RL is 0.315 m PWD in the month of April.
Borehole TBH 5 at chainage KIn 16+800, this is a test borehole. This borehole was drilled up
to 15 m depth. Soil at this location can be divided into three strata. From 0 m to 5 m depth, the
soil is very soft clayey silt with high compressibility. Various soil properties at this stratum
are as follows: Wn and OC are 32% and 1.5%, respectively; LL and PI are 51% and. 32%,
respectively; sand content and clay content are 1% and 41% respectively. qu is 10 kN/m2•
SPT -N value is 1. Soil at this stratum may be classified as per unified soil classification
system as OR.
From 5 m to 10 m depth, the soil at this stratum is medium stiff with high compressibility.
Various soil properties at this stratum are as follows: Wn and OC are 48% and 11%,
respectively; LL and PI are 60% and 37%, respectively; sand content and clay content are 2%
and 42%, respectively; qu is 14 kN/m2; SPT-N value is 6. cc is 0.628 and eo is 2.068. Soil at
this stratum may be classified as per unified soil classification system as OR.
From 10m to 15 m depth, the soil is medium stiff to very stiff clayey silt with high
compressibility. Various soil properties at this stratum are as follows: Wn and OC are 36% and
3%, respectively; LL and PI are 57% and 28%, respectively; sand content and clay content are
3% and 28%, respectively; SPT-N value is 8 - 20. Soil at this stratum may be classified as per
48

unified soil classification system as OH. Ground RL at this location is 1.208 m PWD. Water
table RL is 1.303 m PWD in the month of April.
Table 4.9 shows the range of soil parameter within chainage Km 17+000 to Ian 18+000. At
this location four boreholes of varying depth were drilled. One borehole was drilled up to 15
m depth; another three boreholes were drilled up to 25.5m depth.
Borehole CBH 13 at chainage Km 17+094, this borehole was drilled up to 26 m depth. Soil at
this location can be divided into three strata. From 0 m to 5 m depth, the soil is soft clayey silt
with high compressibility. Various soil properties at this stratum are as follows: Wn and OC
are 39% and 7%, respectively; LL and PI are 58% and 28%, respectively; sand content and
clay content are I% and 17%, respectively; Yw and Yd are 17.01 kN/m3 and 12.25 kN/m,3
respectively.; qu, is 40 kN/m2, SPT-N value is 3 - 7. c, is 0.310 and eo is 1.2. Soil at this
stratum may be classified as per unified soil classification system as OH.
From 5 m to 12 m depth, the soil is medium stiff sandy silt. Various soil properties at this
stratum are as follows: Wn and OC are 33% and 3%, respectively; sand and clay content is
24% and I% respectiv~ly .. Yw and Yd are 17.63 kN/m3 and 12.37 kN/m3 resp~ctively. SPT-N
value is 6 - 7. From 12 m to 26 m depth, the soil is medium dense silty fine sand. Various soil
properties at this stratum are as follows: Wn is 36%. Sand content and clay content are 78%
and 0%, respectively; SPT-N value is II - 38. Ground RL at this location is 01.910m PWD.
Water table RL is 1.303 m PWD in the month of April.
Borehole TBH 6 at chainage Km 17+370, this is a test borehole. This borehole was drilled up
to 15 m depth. Soil at this location can be divided into three strata. From 0 m to 5 m depth, the
soil is very soft clayey silt with medium compressibility. Various soil properties at this
stratum are as follows: Various soil properties at this stratum are as follows: Wn and OC are
65% and 13%, respectively; LL and PI are 36% and 8%, respectively.; sand content and clay
content is 5% and 25%, respectively; qu is 10 kN/m2• SPT-N value is 1. c, is 0.186 and eo is
1.13. Soil at this stratum may be classified as per unified soil classification system as OL.
From 5 m to 10m depth, the soil at this stratum is soft with medium compressibility. Various
soil properties at this stratum are as follows: Wn and OC are 78%and 5%, respectively; LL and
PI are 36% and 7%, respectively; sand content and clay content are 15% and 19%,
respectively; qu is 7 kN/m2; SPT-N value is 4. c, is 0.651 and eo is 2.132. Soil at this stratum
may be classified as per unified soil classification system as OL.
49
1/\ '
"--~..,. __ J- \

From 10m to 15 m depth, the soil is medium stiff to stiff silty soil. Various soil properties at
this stratum are as follows: Wn and OC is 52% and 3%, respectively; sand content and clay
content is 25% and 13%, respectively; SPT-N value is 5 - 13. Ground RL at this location is
1.175 m PWD. Water table RL is 0.815 m PWD in the month of April.
Borehole CBH 14 at chainage Km 17+663, this borehole was drilled up to 25 m depth. Soil at
this location can be divided into three strata. From 0 m to 3 m depth, the soil is soft clayey silt
with medium compressibility. Various soil properties at this stratum are as follows: Wn and
OC are 37% and 6%, respectively; LL and PI is 38% and 23%, respectively; sand and clay
content are 1% and 17%, respectively; Yw and Yd are 16.65 kN/m3 and 11.37 kN/m3
respectively. qu is 14 kN/m2; SPT-N value is 4. Soil at this stratum may be classified as per
unified soil classification system as OH.
From 0 m to 5 m depth, the soil at this stratum is soft with medium compressible. Various soil
properties at this stratum are as follows: Wn and OC are 41% and 15%, respectively; LL and
PI are 48% and 28%, respectively; sand content and clay content are 3% and 12%,
respectively; Yw and Yd are 16.65 kN/m3 and i1.35 kN/m3, respectively; qu is 14 kN/m2
; SPT-N
value is 1 - 7. cc is 0.284 and eo is 1.114. Soil at this stratum may be classified as per unified
soil classification system as OL.
From 5 m to 12 m depth, the soil is medium stiff silt with some fine sand. Various soil
properties at this stratum are as follows: Wn and OC are 38% and 3%, respectively; sand
content and clay content are 24% and 0%, respectively; qu is 39 kN/m2; SPT-N value is 5 - 9.
From 12 m to 25 m depth, the soil is medium dense to dense silty fine sand. Various soil
properties at this stratum are as follows: Wn is 32%. Sand content and clay content are 88%
and 0%, respectively; SPT -N value is 13 - 22: Soil at this stratum may be classified as per
unified soil classification system as SW - SM. Ground RL at this location is 1.087 m PWD.
Water table RL is 1.303 m PWD in the month of April.
Borehole BBH 10 at chainage Km 18+008, this borehole was drilled up to 26 m depth. Soil at
this location can be divided into four strata. From 0 m to 3 m depth, the soil is very soft clayey
silt with high compressibility. Various soil properties at this stratum are as follows: Wn and
OC are 48% and 12%, respectively; LL and PI are 57% and 27%, respectively; Sand content
and clay content are 1% and 18%, respectively; Yw and Yd are 16.37 kN/m3 and 11.03 kN/m3
respectively. qu, is 12 kN/m2, SPT-N value is 1. cc is 0.380 and eois 1.432. Soil at this stratum
may be classified as per unified soil classification system as OH.
50

From 3 m to 10 m depth, the soil is soft to medium stiff clayey silt with medium
compressibility. Various soil properties at this stratum are as follows: Wn and OC are 36% and
3%, respectively; LL and PI are 32% and 10%, respectively; sand content and clay content are
19% and 3%, respectively; Yw and Yd are 17.11 kN/m3 and 12.56 kN/m3 respectively. qu, is 38
kN/m2, SPT-N value is 4 - 6. Soil at this stratum may be classified as per unified soil
classification system as OL.
From 10 m to 18 m depth, the soil is medium stiff sandy silt with fine sand. Various soil
properties at this stratum are as follows: Wn is 32%. Sand content and clay content are 30%
and 5% respectively. SPT-N value is 6 - 7. From 18 m to 26 m depth, the soil is loose to
medium dense silty fine sand. Various soil properties at this stratum are as follows: Wn is 37%.
Sand content and clay content are 74% and 0%, respectively; SPT-N value is 10 - 30. Soil at
this stratum may be classified as per unified soil classification system as SM. Ground RL at
this location is 1.500 m PWD. Water table RL is 1.303 m PWD in the month of April.
4.3 Assemblage of Data
The soil sample collected from site (both disturbed and undisturbed) at different location and
depth within the study area were tested in the laboratory to ascertain the general
characteristics of the soil. These collected soil samples were subjected to routine classification
of natural moisture content, organic content, grain size distribution, atterberg limit test. The
soil has been classified as per Unified Soil Classification System (USCS). Density test,
unconfined compressive test and odometer consolidation test also has performed on these soil
samples.
a. Index property
It was observed from the test data that up to 12 m depth, majority of soil have more than 90%
of material passing through # 200 seive (0.075 mm opening). The soil up to 12 m depth is
predominantly fine-grained soil falling mainly in the Unified Soil Classification System as
OL, OH and OL-OH, which is grouped as organic silt and organic silty clay of low plasticity
and organic clay of medium to high plasticity or mixture of low to high plastic silt and clay.
From 12 m depth to 20 m depth, the soil is mainly OL and ML, indicates organic and
inorganic silts and silty or clayey fine sand, or clayey silts with slight plasticity and elastic
silts.
Figure 4.1 shows the position of the soil sample from the study area in the plasticity chart.
Total 58 cohesive soil sample from the study area is presented in this Figure. It shows that
51

that most of the data are above 'A' .line, indicating organic clay of low to medium and.
medium to high plasticity. A few data however fall below the A-line indicating cohesive silt
sample. These data represent mainly samples for 0 m to 20 m depth. At higher depth from 20
m to 35 m, the soil is mainly coarse grained and is classified as SM, SW, SW-SM which is
mainly silty sand and sand-silt mixture or well-graded sand with little or no fines.
Variation of liquid limit, LL with respect to organic content is shown in Figure 4.2. For batter
comparison the soil sample has been grouped as OL, OR and OL-OR. Variation of liquid
limit, LL with organic content for these three groups of soil is plotted in this Figure. It is seen
from this Figure that soil samples with low plasticity has a significant influence of organic
content on liquid limit than for a highly plastic soil sample. Liquid limit increases rapidly with
increases in organic content for soil sample of low plasticity (OL) but there is no or little
effect for OR soil sample.
Table 4.1: Summary of the range of soil parameters of the study area
Physical and Geotechnical Up to 12 m From 12 m to From 20 m to
properties depth 20 mdepth 35 m depth
Natural moisture content (wn) % 30 - 165 27 - 55 30 - 50
Organic content (OC) % 5 - 30 0-5 0-2.5
Liquid limit (LL) % 35 - 68 30-42 N.P.
Plasticity index (PI)% 17 - 35 7-22 -
Sand content % 0-10 0-20 40- 90
Silt content % 55 - 85 45 - 80 10- 30
Clay content % 20 - 35 0-20 0-5
Compression index ( Cc ) 0.156 - 0.628 - -Coefficient of consolidation (cv) 9.240* lO,n to
- -m2/min 5.134*10.5
Initial void ratio ( eo ) 0.948 - 2.068 - -Group symbol according to Unified OL, OR and SM, SGand
OL,MLSoil Classification System OL-OR SW - SM
Note: CoefficIent of consolidation, Cv was determmed by root (t) fitting method
Table 4.1 presents a summary of the range of soil parameters for chainage Km 10+000 to
chainage Km 18+000. The soil parameters included are N-valueobtained from SPT, Liquid
limit (LL), Plasticity index (PI), Natural moisture content (wn), Organic content (OC), grain
52

53
30
10090
o
25
Aoe for OL - OH
<> DC for OL
ooe for OH
80
MH orOH
70
oLL = -0.3367 (OC) + 52.643for OL - OH soil sample
60
00\0A LinePI= 0.73(LL-20)
50
o
40
10 15 20
Organic content (OC) %
o
o~o 0o CMLor OL
.Liquid limit (LL) %
30
o
08CH or OH
o
o
o
CL or OLJlo
o
20
5
0
LL = -0.011 (OC) + 57.339for OH soil sample
0 0 8 \e e e0 0 0 0
l& A A bE A~ <><> <><><> <><> <> <> <>
10
<> ~<><> \
<> LL = 0.5293 (OC) + 34.609<> for OL soil sample
20o
30
Figure 4.2: Variation ofliquid limit with respect to organic content
Figure 4.1: Position of the soil sample from the study area in the plasticity chart
80
70
60~ 00
:::J 00:=!. 50 A A~'E A A A"tJ <><>':; 400-:::; <><><>
(eo) etc.
60
50
~ 400~e:-x 30Q)"tJ.S;Z-'0 20tiCIl0::
10
00
size fraction, unconfined compressive strength (qu), Compression index (cc), initial void ratio

25201510
Axial strain, Ea (%)
5oo
20
~N
E 15-Z Depth :3m~0- Natural water .content, Wn :42%<Ii Organic content, OC : 12%
'" Liquid limit, LL :57%~ 10- Plasticity index, PI :28%'"c,; Initial void ratio, eo : 1.17
~Compression index~Cc : 0.311
5
54
25
settlement for structures.
Figure 4.3: Typical axial stress vs. axial strain curve for soil sample of study area
The plot of unconfined compressive strength, qu versus SPT-N value for different range of
organic content for 58 Nos. cohesive soil samples from the study area has been presented in
Figure 4.4. For better comparison the soil samples were divided in to three groups according
to presence of organic content. Influence of SPT -N value on unconfined compressive strength
is more significant for low organic content (0 - 5%) soil sample than a higher organic content
(20 - 30%) soil sample. It is shown in figure that qu increases with increase in SPT-N value
for all range of organic content. The relationship between qu and SPT-N value can be
expressed by the equation qu = 16.76 N-26.21 for OC <5%. This relationship for soil samples
b. Unconfined compressive strength
Fifty eight cohesive soil samples were tested to determine the axial stress of soft soil at
different location and at different depth. It varies from 10 kN/m2 to 150 kN/m2 for N value
from I to 5. Typical axial stress vs. axial strain is presented in Figure 4.3. From this Figure it
is seen that soil sample does not fail even at 20% axial strain. In other word axial strain is
faster for soft soil sample though it hasn't reached to its ultimate failure stress. This type of
behavior causes trouble for civil construction work on soft soil since it causes excessive

with OC = 10 - 15% can be expressed by the equation qu = 11.25 N-0.25 and that for soil
samples with OC = 20 - 30% is qu = 1.78 N+12.56. From these three equations itis seen that
at lower range of N value qu is higher for samples with high organic content and it is low at
high range ofN value with comparison to low organic content soil sample.
3530
OOC=O-5%
25
o
20
OOC= 10 -15 %
\ IIOC= 20 -30 %q, = 16.759 N - 26.214for OC = 0 - 5 %
15
SPT- N value
10
oq, = 1.7784 N + 12.563for OC =20 - 30 %
5
o
q, = 11.25 N - 0.25 forOC=10-15%
Figure 4.4: Unconfined compressive strength, qu vs. SPT-Nvalue for different range of organic content
600
~N
E 500-Ze-,400q:
.<:0,c: 300.,.loCI).,> 200.iiiCI)Q)~c.E 1000()
"0.,0c:
0=c:0()c: -100:J
0
Figure 4.5 shows the influence of SPT-N value on unconfined compressive strength for OL,
OH, OL-OH soil sample. It is seen from Figure that SPT-N value has almost same influence
on unconfined compressive strength for OL and OH soil sample but for OL-OH soil sample
SPT -N value has more influence on unconfined compressive strength.
Plots of unconfined compressive strength (qu) versus natural water (wn) content for 58 nos.
samples from different locations of the study area are presented in Figure 4.6. From the plot it
is seen that there is a little influence of natural moisture content on unconfined compressive
strength (qu) for soft soil sample.
Figure 4.7 shows the variation of unconfined compressive strength (qu) with respect to organic
content (OC ). 62 nos. of samples from different location of the study area has been presented
in this Figure. From the plot it is seen that there is a little or no injluence of organic content on
unconfined compressive strength (qu) for soft soil sample.

90
12
80
o
o OH soil sample
o OL soil sample
a OL-OH soil sample
10
70
aoe = 20-30%
DOC = 10-15%
8
o
o 4
o
60
q, = 8.2793N + 5.5169lor OL soil sample 0
6
o
SPT-N value
<>
50Naturalmoisture content (%w,)
4
q, = 8.7054N + 3.8914°lor OH soil sample
o
.056
Ooe = 0-5%
o
40
2
q,= 14.776N+ 1.186lor OL-OH soil sample
o
o
o
<>
Figure 4.5: Influence of SPT-N value on unconfined compressive strength forOL, OR, OL-OR soil sample
Figure 4.6: Unconfined compressive strength (qu) vs. natural moisture content (wn)
180
~ 160N
EZ 140c-,0-
120.<::e;,c:OJ 100~
"'OJ> 80'iii'"~
60c.E0
"u 40OJc:<.=c: 200
"c:::> 0
-2030
140N
EZ 120c-,0-
.<:: 100e;,c:OJ~
"' 80OJ>'iii'" 60OJ~c.E0 40"uOJc:<.= 20c:0
"c:::>00

~ 210N
E-z6 00 160c- o.J:: o Moisturecontent<40%0, 0c o Moisturecontent=40-50%Q) 110~<n 6. Moisture content >50%Q)>.iii 8Ul 60Q)
O~ 00~
c- DE 000 ~ta 0 0<.)
LlOrioOLl. ." 10 0 0 0 0Q)c'"c0<.)c -40::J
0 5 10 15 20 25 30Organic content, OC %
Figure 4.7: Unconfined compressive strength (qu) vs. organic content (Oe )
57

c. Consolidation Characteristics
58
1000
II
10
log (P)
III II I
Figure 4.8: Typical e vs. log (P) curve for the study area
1.3
1.2
1.1
1.0'-
'" 0.9
0.8
0.7
0.6 -0.5
0.1
Figure 4.9 shows the typical settlement vs. time curve for soft fine grained soil for the study
area. The test result shows, value of coefficient of consolidation, Cv is in the range of
9.240*10-6 to 5.134*10-5 m2/min. Average value of Cv at 25 kPa pressure is 5.91 *10-6 m2/min,
at 50 kPa is 8.04*10-6 m2/min, at 100 kPa is 7.34*10-6 m2/min, at 200 kPa is 8.45*10-6
m2/min, that at 400 kPa pressure is 0.64*10-6 m2/min and at 800 kPa it is 6.86*10-6 m2/min.'.
Figure 4.8 shows a typical e vs. log (p) curve for the soft fine grained soil for the study area.
Average Ccwas found 0.311 with a maximum value of 0.628 and eo found 1.229 with a
maximum value of2.132.
Thirty seven samples were tested for one dimensional consolidation to determine
consolidation characteristics of soft clayey soil. Compression index (cc) was found within a
range of 0.156 to 0.628 and an initial void ration (eo) of 0.948 to 2.132. Soft sub soils
extended as deep as 6 m to 12 m within the study area, which belongs to swampy area. It is
anticipated that high embankment construction over soft/peaty sub soil will be flatten or settle
down excessively. It is estimated that a maximum of 800 mm settlement will be encountered
depending on embankment height and thickness of peaty soft ground.

59
Figure 4.10 shows the plot of compression index (cc) versus organic content. For better
understanding compression index was plot against different range of organic content
i.e. 0 - 5%; 10 - 15 and 20 - 30%. It can be seen from this Figure that influence of organic
content on compression index is more significant for soil with organic content ranging from
10-15%.
Pressure = 800 kpaCv = 9.374*10.7 m2/min
Pressure = 50 kpaCv = 1.863*10.6 m2/min
Pressure = 100 kpaCv = 1.126*10.6 m2/min
Pressure = 400 kpaCv = 1.768*10.6 m2/min
Pressure = 25 kpaCv = 3.275*10-6 m2/min
Pressure = 12.5 kpaCv = 9.88*10-6 m2/min
Pressure = 200 kpaCv= 1.123*10.6m2/min
Pressure = 6.25 kpa
10000.00100.00
Time. (min)
1.00
I II I I I I II I
I, I
I I II II1:: 1 III"
1 ••1 I III1 II I
"I I
I II•••.... IIIII III II
I 1 II ...••.,.II III I I
.••.•. I II I I
IIIII 1I I
I I I
II "'-~ I ~ -I 1
I"X
I I1Ik I /
II I
I NolJ.Ii,,1
I I f..-l...1 /I I I
I,
1-"'"
I II
I I
"'-I
I I /I I I
II I I
8
2
0.01o
Figure 4.9: Typical settlement vs. time curve for the study area
12
10
4
ES"EQ)
EQ)
E 6Q)CfJ

1.5
3530
1.3
60C = 20 - 30
OOC=0-5
oOC= 10-15
o Srudy area
o Azzouz et. el (1976)
" Serajuddin and Ahmed (1967)
o Serajuddin (1987)
25
•
1 .1
•
20
C, =0.0261 (OC)- 0.2683\6
0.9
15
oo
10
Initialvoid ratio, eo
~.3951e~ - 0.t251
\cc = 0.2924eo - 0.0769
0.7
Organic content, OC %
o
5
c, = 0.0314(OC)+ 0.003\0:t:
c,= 0.4295eo- 0.1265
\
C, =0.0033 (OC)+ 0.2945
0.000.5
Figure 4.10 Compression index vs. organic content for the study area
Figure 4.11: Comparison of variation of compression index with respect toinitial void ratio of soil sample from the study area and different researcher
0.40
0.35
0.300
"x 0.25'"'C.!:c0 0.20'iiiU)
'"~c. 0.15E0(,)
0.10
0.05
0.70
0.60
0 0.50"X'"'C.!: 0.40c0'iiiU) 0.30'"~c.E0 0.20(,)
0.10
0.000

4.4 Variation of Soil Properties with Depth
A comparative plot of data of Cc vs. eo is presented in Figure 4.11 for the study area and three
equations of different authors shown below for Dhaka clay. It is found from the plot that
Bagerhat soil has a higher value than that of Dhaka clay.
_BBH1
--e-CBH1
--tr- BBH2
~C8H6
~BBH4
-CSH7
--+-CBH9
-BSH7
-CBH11
_BSH9__ BBH10
61
4030
Aastic~y index, PI%
2010
Figure 4.12.d: Variation of plasticity index W.r.tdepth
~~) II
~ )-
IIII II I I
- I~ •I ~k'I'I 'JI Ii j ,/I / / ./
I I V ./I I 'I ./I I .-<'I y II 1 1
I
oo
4
B
% organic content -+- BSH 1
5 10 15 20 25 30 35 -CBH1
--tr-BBH 2
~BBH3
---iIE- CBH 6
_BBH4
-CBH9
-BSH7
--CBH11
_BBH9
-Q-CBH 13
-+--CBH 14
24 '" Cleu iOFigure 4.12.b: Variation of organic content w.r.tdepth
16
20
oo
5
30
25
20
10
E
E
% 12•c
.£ 15a
65
50
5545
w.%30 40
35
y :;-/ ,/,po
\ ,/ d.Iv \W
5<'1'\
I
I I • ."""II Y ~, ry \1I --::f-' AI
I , ,I
.v- I..- /1 II I I
I II I I II I I I
I I I I II I I I I
-BBH1
---8-CBH 1__ BBH2
_BBH3
~CBH6
_BBH4
-+-CBH7
-tr-CBH 9
---*""- BSH 7
-.-CBH 11
-BSH9
-+-BBH10
Figure 4.12.c: Variation of liquid limit w.r.tdepth
20o
5
Uquid linit, LL%
Figure 4.12.a: Variation of natural moisturecontent w.r.t depth
25
o
30
10
60_BBH1
_CBH1
_BBH2
_BBH3
---iIE- CBH 6
-e-BBH4
-CBH7
-CBH9
--+-BBH7
-a-CBH 11
----ft- BSH 9
40 --+- BSH 10
25
20
30
10
• c, = 0.44 (eo -0.30) Serajuddin and Ahmed (1967) eqn. a.
• Cc = 0.4049( eo - 0.3216) Serajuddin (1987) eqn. b.
• Cc = 0.30( eo -0.27) Azzouz et. al (1976) eqn. c.
E:5 15l
Soil depth, has been found an important factor influencing the magnitudes of different soil
parameters. Natural water content (wn), organic content (OC), liquid limit (LL) and plasticity
index (PI) were found to decrease with increase in depth. The influence of depth on these soil
parameters are shown in Figure 4.12.a, 4.12.b, 4.12.c and 4.12.d respectively.
The relationships between compressIOn index, Cc and organIc content (OC) are Cc =
0.0033(OC) + 0.2945 (for OC: 0 - 5%), Cc = 0.0314 (OC) + 0.003 (for OC: 10 - 15%) and Cc
= 0.0261(OC) - 0.2683 (for OC: 20 - 30%).

Variation of SPT-N value with depth is shown in Figure 4.13. In general SPT-N value is less
than 5 upto a depth 6 m to 12 m but it increases upto more than N = 20-25 within a depth 12
m to 20 m and it reaches N = 30 - 50 within a depth 20 m to 36 m. For batter understanding
plot of SPT-N value vs. depth for IOC-NA-BCL, COVEC and test bore holes are presented in
Figure 4.14. Unconfined compressive strength (qu), generally increases with depth. Variation
of qu with respect to depth is shown in Figure 4.15. General soil profile of the study area along
the road section is shown in Figure 4.16. From this Figure it is shown that very soft to soft
clayey silt layer exists at top 6 m depth to 12 m depth. Organic substance exists at these strata.
In general, black to deep brown colour 0.3 m to 1 m thick organic soil or peat layer exist
within top 0.5 m depth to 5 m depth. Organic content decreases with increasing depth. Figure
4.17 shows the soft and peaty soil depth.
62
- - ~ .. BBH 1D CBH 1
".'..6" BBH2~BBH3--CBH6
• BBH4-+- CBH7
CBH9••.•BBH7
• BBH9• CBH13
----+-- CBH 14JE BBH10
--
,
,
,
,_. _ ...._.._._--- -- --
i'
"
-- -----. -_..
'~ . -
SPT-Nvalue
24 32 40 48 56 64 72 80
"'., .I
--I .
'--. ,
;.- .~ --- ----- ".'~'
~ ' '~ ----'\"""'~ '
'~.~-".".,......... -----'.--<.~ I .• •
. • .••••• - ~ I :', .t~.... I J--t ..-_._-~\'if-~~+:::=~-!I.
,I '. _" ". I I. N'!.~,., L,-' I '
--- ---. --.- " '6 •..-.,0--- ---X...... ,
0 8 160.00
f--.,I3.00
I" I6.00
Figure 4.13: Variation of SPT -N value with depth
27.00
15.00
12.00
9.00
24.00
30.00
39.00
33.00
~.5. 18.00.<:15.~ 21.00

cr~2~
SPT-N value
-M-TBH4
___ TBH5
---e--TBH 2
~TBH6
-6-TBH3
--+-TBH 1
32
Th~
h21m
4
SPT-N value
o 8 16 24
o
6j~I
16c)
14
E,:; 8a.
'"o
""""'-CBH 14
____ CBH 11--+-CBH 10
-M-CBH13
--'-CBH 12
--CBH8
--CBH9
~CBH7
~CBH6
~CBH5
-M-CBH4
-6-CBH3
~CBH2
-+-CBH1
SPT-N value
8 16 24 32 40 48 56
8
4
b)
oo
28
1-:--1! .
E 12
t'"o 16
20
•• _-- BBH9
~BBH10
-t--BBH7
---BSHB
----6-- BSH3
----M--BBH 4
~BBH2
_______ BSH 5
-+--BBH1
8064483216oo
i ! ii!I'I,I,
4 . ; I II I!
8 ..... iiI I 'I---!---;.
12 ~ , ! ', , I, j
E 16
~~ 20 ~BBH6
24 I .j IIi ~ i
28 I I! ,-' .'
32.;"i -.;.1
36 l..1...' Ia)
Figure 4.14: Variation of SPT-N value w.r.t depth for boreholes in the study area by a) JOC-NA-BCL; b) COVEC; c) Test borehole
0-W

. Appendix A presents variation of N value, natural moisture content, organic content, liquid
limit, plasticity index and unconfined compressive strength with respect to depth for a number
of boreholes along the study area.
G'-II64 -.;'~
•
---BBH4
-+-BBH7
--CBH 11
-CBH14
--BBH 10
-+-BBH 1
~BBH2
"""'*- BBH3-*-CBH6
5040302010
I If( ~ I
tI~
"""."",\:"- ","- "" '" \ "" I~ '\ \. ~
~ ~\","'--I- 4 \ ""
11 ,I"" I
I r\I / \
1/ \.J
I \\
\.
I
6
oo
Figure 4.15: Variation ofqu with respect to depth
4
2
8
14
12
16
18
20
E
:5 10c-alo

65
'"'"u~'"OJOJ
~'"'"'"~ I . . . . .'"OJU
~ I'"OJOJ
~'"OJU
..'"OJOJ
~'"'"u~'"OJOJ
N
'"OJOJ
'"OJU
'"OJU
:0
'"OJU
'"OJOJ

~- - N N - ~ ~ ~ on ~ ~ ~ •• N on ~ ~ ~ ~ S ~ •• :: ~ ~ on !:l ~ .:. Siii ~ ~ ~ ~ ~ ~ ~ iii iii ~ ~ iii iii iii iii iii iii iii ~ iii iii iii ~ i i ~ ~ iii i~ ~ ~ ~ ~ ~ ~ ~ ~~ u u ~ u ~ u u u ~ u u ~ ~ u .~ ~ ~ ~ ~ ~ ~ ~ ~ ~ ~ uu u u u ~
"-'"'o.•
-to
Legend:(D Connecting line of top of peaty soil <6> Connecting line of bottom of peaty soil <;D Connecting line of N=3 elevation.
Note: 1. Drawing not to scale 2. RL taken with reference to PWD Bench mark.
Figure 4.17: Depth of soft soil & peaty soil
enen

Table 4.2: Range of soil Parameters within Chainage KIn 10+000 to KIn 11+000 .
. Density
Borehole Depth Wn . Organic LL PI Sand Silt Clay ( kN/m3) Permeability qu N-contentIDno. (m) (%) (%) (%) (%) (%) (%) Wet Dry (m/min) (kN/m2
)cc eo Value(%)
('Yw) ( 'Yd)
0-4.5 37 11 45 23 3 80 17 17.48 12.88 1.548*10-::> 15 0.264 1.047 1- 3BBH 1 4.5-9 32 5 37 21 7 88 5 17.14 12.9 2.034*10.8 27 0.26 1.042 6-13
9- 18 35 3 32 14 20 75 5 - - - 36 - - 7-1518- 35 30 - - - 45 55 0 - - - - - - 30- >500-7 55 29 55 35 2 86 12 15.92 10.31 - 12 - - 1- 2
CBH 1 7-12 50 5 40 30 4 80 16 - - - 170 - - 10- 1512- 25 35 3 36 8 20 70 10 - - - - - - 20- 30
0-7.5 45 12.5 50 33 4 75 21 15.86 11.04 - 9 - - 1- 2CBH2 7-12 41 6 40 6 12 85 3 - - - 125 - - 5- 12
0- 10.5 52 17 38 17 10 71 19 15.85 10.4 2.112*10" 22 0.316 1.202 2- 8BBH2 10.5 - 15 53 3 27 12 37 62 1 17.02 12.38 1.764*10'8 14 0.29 1.13 10- 18
15-26 - . - - - 85 15 0 - - - - - 22- 39
0"--..l
•

Table 4.3: Range of soil Parameters within Chainage Km 11+000 to Km 12+000.
DensityBorehole Depth Wn Organic
LL PI Sand Silt Clay ( kN/m3) Permeabilitygu N-ID no. (m) (%) content (%) (%) (%) (%) (%) Wet Dry (m/min) (kN/m2
)cc eo Value(%)
(I'w) (I'd)0-6 52 25 56 28 2 80 18 14.65 12.19 - 10 0.32 1.20 1-2
CBH3 6 -9 46 3 48 27 31 65 4 16.11 12.35 - 22 - - 7 - 110-5 165 25 56 27 1 84 15 - - - 39 0.211 1.122 4-5TBH7 5 - 10 55 7 44 18 6 82 12 - - - - - - 4-910-15 53 3 - - 9 88 3 - - - - - - 11 - 210-4.5 63 7 39 16 3 67 30 - - - 64 0.271 1.131 2-3
TBH 1 4.5 -12 57 19 38 10 2 75 23 - - - 56 0.311 1.422 1 - 512 - 15 44 2 38 12 6 78 16 - - - 150 - - 4-50-2 38 14 53 26 2 65 33 17.25 12.46 - 14 0.238 1.231 3
BBH3 2-6 36 3 54 27 15 75 10 17.49 13.17 - 12 0.279 1.116 1- 36 - 10.5 35 - - - 80 20 0 - - - - - - 5-710.5 - 25 42 - - - 82 18 0 - - - - - - 17 - 300-5 51 13 55 26 1 72 27 - - - 35 0.27 0.93 3-5TBH8 5 - 10 43 4 51 28 5 82 13 - - - - - - 7-910-15 47 2 43 19 16 77 7 - - - - - - 10 - 200- 5 43 12 57 27 2 78 20 16.86 12.18 7.112x10-" 14 0.271 1.08 1-4
CBH4 5 -10 37 3 49 32 20 75 5 - - - 17 - - 2- 510 - 15 35 2 36 13 43 65 2 - - - - - - 7 -23
~~0\00

,.
Table 4.4: Range of soil Parameters within Chainage Km 12+000 to Km 13+000.
Density
Borehole Depth WnOrganic LL PI Sand Silt Clay (kN/mJ
) Permeability qu N-IDno. (m) (%) content (%) (%) (%) (%) (%) Wet Dry (m/min) (kN/m2
)cc eo Value(%)
('Yw) (I'd)
0-3 35 2 51 33 7 73 20 17.67 13.55 - 51 - - 3- 5CBH5 3-4 50 12 42 23 - - - - - - - - - 2-3
4-10 34 1 38 6 10 85 5 - - - 45 - - 3- 5
0-5 43 12 54 27 3 75 22 '17.25 12.47 3.07*10-. 12 0.3 1.16 1CBH6 5-10 37 5 38 15 15 78 7 17.57 13.04 1.65* 10-8 26 0.261 1.116 2-4
10- 25 35 2 - - 80 20 0 - - - - - - 15-37
0-2 36 2 53 26 1 76 23 17.21 12.61 1.55*10-0 14 0.276 1.116 1- 3BBH4 2-8 35 5 48 23 13 81 6 17.17 12.67 - 12 - - 1- 2
8- 10.5 38 2 - - 34 63 3 - - - - - - 1710.5- 25.5 32 - - - 80 16 4 - - - - - - 14- 30
'"'\0
c~m,.~

Table 4.5: Range of soil Parameters within Chainage KIn 13+000 to KIn 14+000.
OrganicDensitl
PermeabilityBorehole Depth Wn LL PI Sand Silt Clay (kN/m) qucontent (m1min) ( kN/m2)
cc eo N- ValueIDno. (m) (%) (%) (%) (%) (%) (%) (%) Wet Dry(')'w) (I'd)
0- 2.5 47 17 48 27 2 71 27 - - - - - - 2CBH7 2.5- 6 58 5 52 22 1 76 23 17.33 12.54 2.19*10'8 12 0.29 1.143 3-4
6-12 49 2 - - 7 82 11 - - - - - - 1-5.12- 26 32 - - - 81 19 0 - - - - - - 12 - 34
CBH8 0-4.5 43 8 54 27 2 76 22 16.981 13.46 - - - - 1- 54.5- 7.5 36 3 38 8 35 65 0 - - - - - - 15 - 19
0-4.5 41 5 49 22 2 76 22 - - 2.959*10'5 12 0.275 1.072 1TBH2 4.5- 9 36 5 34 7 4 78 18 - - 1.13*10,7 48 0.19 1.039 5-10
9-15 39 3 28 8 22 73 5 - - - 500 - - 20- 25
0-14 68 5 58 22 5 75 20 16.85 12.11 3.42*10'. 12 0.31 1.185 1-4BBH5 14- 22 34 - - - 25 72 3 - - - 26 - - 5- 8
22-26 50 - - - 92 8 0 - - - - - - 35 - >50
...,--..lo

Table 4.6: Range of soil Parameters within Chainage KIn 14+000 to KIn 15+000.
Organic DensitlPermeability quBorehole Depth Wn LL PI Sand Silt Clay (kN/m)
IDno. (m) (%) content (%),(%) (%) (%) (%) Dry (m/min) cc eo N- Value(%) Wet(kN/m2
)(/'w) (I'd)
0-6 39 11 59 29 I 77 22 16.71 11.98 1.89*10,8 10 0.338 1.292 ICBH9 6 - 12 55 3 51 27 3 79 18 16.92 12.06 2.184*10'8 10 0.32 1.239 I
12 - 15 40 1.5 - - 70 29 I - - - - - - 7 -1015 - 26 48 - - - 87 12 1 - - - - - - 35 - >500-6 40 7 58 28 1 80 19 16.59 12.15 3.02*10'8 13 0.314 1.204 1
BBH6 6 -15 36 2 - - 80 20 0 16.88 12.02 2.60*10'8 - 0.322 1.233 10 - 1815 - 26 27 - - - 90 10 0 - - - - - - 21- 46
0-4.5 50 12 76 51 3 72 25 - - 3.158*10,9 20 0.26 1.167 1 - 3TBH3 4.5 - 9 39 3.5 32 7 5 73 22 - - - 42 - - 4-8
9 -15 35 2 30 8 9 77 14 - - - 54 - - 9-13
.....,-

Table 4.7: Range of soil Parameters within Chainage KIn 15+000 to KIn 16+000.
Densitl .
Organic PermeabilityBorehole Depth (m) Wn content LL PI Sand Silt Clay (kN/m) qu N-!Dno. (%) (%) (%) (%) (%) (%) Wet Dry (m/min) kN/m2
)cc eo Value(%) ('Yw) (I'd)
0-5 45 17 57 28 4 76 20 16.52 11.37 2.04*10'8 14 0.292 1.144 1-4BBH7 5 -10.5 37 5 38 22 6 76 18 17.3 12.64 2.88*10'8 16 0.288 1.129 1-2
10.5 - 35 32 - - - 77 20 3 - - - - - - 11 - 36
0-6 42 12 48 26 2 71 27 - - - - - - ICBH 10 6-9 35 5 46 21 6 73 21 17.24 12.52 - 12 3-4
9 -15 32 3 - - 20 72 8 - - - - - - 10 - 15
0-5 32 2 45 25 5 75 20 - - 2.17*10'5 10 0.365 1.167 3-7.
TBH4 5 -10 33 7 25 14 3 74 23 - - - 70 - - 8-910 - 15 37 2 30 17 12 80 8 - - - - - - 20-28
0-6 43 '9 52 27 2 82 16 16.33 11.45 - 12 - - 1 - 3BBH8 6-10 37 I - - 75 20 5 - - - - - - 5 -17
;j

Table 4.8: Range of soil Parameters within Chainage KIn 16+000 to Km 17+000.
OrganicDensity
Borehole Depth Wn LL PI Sand Silt (kN/m3) Permeability qu N-
IDno. (m) (%) content (%) (%) (%) (%) ClayDry (m/min) (kN/m2)
cc eo Value(%) (%) Wet('Yw) ( 'Yd)
0-7 53 5 51 22 3 73 24 16.87 12.13 1.002*10-7 12 0.32 1.218 1CBH 11 7 -10 48 7 35 8 17 74 9 16.88 12.19 - 27 - - 4-8
10 - 20 32 2 - - 82 15 3 - - - - - - 12 - 4820-25 33 - - - 95 5 0 - - - - - - 29 - 400-1 37 15 57 27 0 65 35 - - - - - - 1
CBH 12 1 - 10 38 4 43 20 5 79 16 16.1 12.28 - 16 - - 1-210 -15 36 2 - - 14 76 10 - - - 25 - - 5
0-7 48 17 54 27 2 62 36 15.83 10.89 1.812*10-8 14 0.42 1.559 1-2BBH9 7 -10 46 3 44 19 9 72 19 - - - - - - 11 - 15
10 - 15 33 1 - - 82 18 0 - - - - - - 3-615 - 24 37 - - - 86 14 0 I - - - - - - 16 - 7024 - 35 41 - - - 92 8 0 - - - - - - 28 -460-5 32 2 51 32 1 58 41 - - 3.061*10-8 10 0.321 1.107 1
TBH5 5 -10 48 11 60 37 2 56 42 - - 8.916*10-9 14 0.628 2.068 6-710 - 15 36 3 57 28 3 69 28 - - - - - - 8-20
-..j
w
c~)•••

Table 4.9: Range of soil Parameters within Chainage Km 17+000 to Km 18+000.
Organic DensitrPermeabilityBorehole Depth Wn LL PI Sand Silt Clay
(kN/m) qu N-IDno. (m) (%) content (%) (%) (%) (%) Wet Dry (m/min) (kN/m2
)cc eo Value(%) (%)
('Yw) (I'd) .0- 4.5 39 7 58 28 I 82 17 17.01 12.25 5.34*10-8 40 0.310 1.200 3-5
CBH 13 4.5 - 12 33 3 - - 24 75 I 17.63 12.37 - - - - 6-712 - 26 36 - - - 78 22 0 - - - - - - 11 - 38
0-5 65 13 36 10 5 70 25 - - 5.129*10-8 10 0.186 1.130 1TBH6 5 -10 78 5 36 7 15 66 19 - - 3.005*10-8 14 0.651 2.132 6-7
10-15 52 3 - 25 62 13 - - - - - - 8 - 20
0-5 41 15 48 28 3 85 12 16.65 11.35 3.18*10-8 14 0.284 1.114 1-7CBH 14 5 - 12 38 3 - - 24 76 0 17.4 12.74 - 39 - - 4-9
12 - 26 32 - - - 88 12 0 - - - - - - 13 - 22
0-3 48 12 57 27 1 81 18 16.37 11.03 - 12 0.380 1.432 1BBH 10 3 -10 36 3 32 10 19 78 3 17.11 12.56 - 38 - - 4-6
10 - 18 32 - - - 30 65 5 - - - - - - 6-718 - 26 37 - - - I 74 26 0 - - - - - - 10 - 30
~
L:J._. •

CHAPTERS
PRELOADING AND ITSPERFORMANCE EVALUATION
5.1 General
Peats are among the worst kinds of foundation material that may be encountered. Because of
they are often unsuitable for supporting structure of any kind. Method of dealing with
construction over peat includes such techniques as: (1) Replacing the peat with inorganic
materials; (2) carrying the foundation supports down to a better stratum; or (3) some form of
stabilization or improvement of the peat properties in situ, such as preloading.
As the last-named method is often the least expensive, it has received much attention,
particularly with regard to highway projects where very large areas of peat or organic soils are
encountered. The preloading technique consists essentially of subjecting the in situ peat to a
load in excess of that to be imposed by the final structure. In this way, settlements equal to the
expected magnitude under the final loading, are secured relatively quickly; the excess load is
then removed and the structUre is completed.
Efficient use of this technique requires the ability to predict in advance the behavior of peat
with particular reference to: (1) The final settlements to be expected under different loads; (2)
the rates at which such settlements will occur; and (3) the strength characteristics of the soil,
as these control the allowing loading. The first two considerations are controlled primarily by
the consolidation characteristics of the peat. Consolidation and increase in shear strength are
related through rate of pore pressure dissipation.
Consolidation of a saturated soil is a time-dependent volume reduction involving a decrease in
the water content of the soil. Any soil is a system of two or three spatially co-existent phases:
a solid phase; a liquid phase; and sometimes (particularly for peat) a gas phase. When there is
an increase of pressure on such a system in equilibrium, there is a volume change with an
escape of fluid from the system. This process of volume reduction (consolidation) involves a
time lag.
Consolidation of inorganic soils is thought to be divided into two stages: the primary
consolidation stage (described by the classical concept of Terzaghi); and the secondary
consolidation (or compression) stage. The time lag in the primary consolidation stage is
associated with dissipation of excess pore water pressures and results from the resistance to
75

volume change offered by the escaping water. The time lag in the secondary compression
stage is associated with plastic flow or creep, and, in effect, is due to resistance offered by the
"solid" phase to volume change in the system.
The approach to the consolidation process of peat has been generally similar to that for clays
that exhibit exceptionally large secondary compression effects. Most investigators have been
preoccupied with the need to obtain immediate results that have relied on this concept. A
literature review (MacFarlane, 1965) clearly indicates that the two-stage concept of
consolidation, one terminating at a clearly defined point and the other continuing for a long
period of time, leaves something to be desired with reference to peat. The point at which
primary consolidation ends and secondary compression begins is obscure in most cases.
Because application of the classical (Terzaghi) consolidation theory utilizes curve fitting
techniques (Taylor, 1948), which requires determination of the point of 100% primary
consolidation, the standard consolidation test used for inorganic soils is much more difficult to
interpret when used for peat. The shortcomings of this theory when applied to organic soils
are described in (Forrest and MacFarlane, 1969; Lea; 1963): -The- extreme variation (large
value in the order of 1.5 to 6.0 cm2/sec) of Cv (coefficient of consolidation, calculated using
measured values of vertical permeability) with applied pressure below 1.5 kg/cm2 is primarily
due to the drastic changes in coefficient of permeability, k, with consolidation. It is within this
range of stresses (below 1.5 kg/cm 2) that most loading applied to peat might be expected to
fall (Forrest and MacFarlane, 1969).
Although some success has been reported (Goodman and Lee, 1962; Shea, 1955) in prediCting
the magnitude of peat settlement from laboratory results, other writers (e.g., Ward, 1948) have
not been able to support this claim. The prediction of the rates of settlement on the basis of
laboratory work has proved an even more difficult problem (Goodman and Lee, 1962;
Miyakawa, 1960; Shea, 1955).
The complexity of the consolidation rate phenomena is illustrated by the work of Lake (1960)
and Root (1958), all of whom found that sand drains did not significantly affect the rate of
settlement of peat although they did increase the rate of excess pore water pressure
dissipation. Consolidation and pore pressure dissipation are directly related, however, in the
classical theory of consolidation.
76

It would appear, therefore, that the techniques available within the present framework of soil
mechanics are not completely satisfactory when applied to peat; the stress-strain-
hydrodynamic relations for peat require further investigation. This should deal not only with
the soil behavior under usual conditions, such as uni-dimensional and hydrostatic
compression, but should also examine response interrelationships under the conditions
occurring in the vicinities of loading boundaries. The pore water pressure set up near applied
loads and their dissipation patterns should also be observed.
This part of the thesis represents the results of field investigation carried out on two trial
sections constructed on deep-seated soft soils having a varying thick stratum of peat. The trial
sections were subjected to preloading by a 3 m depth compacted soil. The settlement of the
soft peaty layer due to preloading was measured by monitoring the settlements of several
settlement-plates installed just over the soft soil stratum. After the settlement ceased down
considerably, bore holes were drilled while counting the SPT -N values at various depths,
which are compared with those measured before the application of preloading to evaluate the
improvement of subsoil.
5.2 Subsoil properties under trial sections
Bore hole profiles and descriptions up to 35 m depth were described in the previous chapter.
However, the zone of influence for preloading may not be more than 6 m below EGL. Table
5.1 describes various soil properties up to this depth.
Table 5.1: Geotechnical properties of subsoil up to 6 m depth
Physical and Geotechnical properties Range
Natural moisture content, Wn (%) 43 - 165
Organic content, OC (%) 12 - 25
Liquid limit, LL (%) 56
Plasticity index, PI (%) 27
Bulk density, Yw (kN/m3) 14.65
Unconfined Compressive Strength, qu (kPa) 10 -14
Coefficient of consolidation, Cy C* lO.6m'/min) 3.57 - 5.34
Compression index, Cc 0.27 - 0.32
Initial void ratio, eo 1.08 - 1.20
Note: CoeffiCIent of consolidation, Cy was determined by root (t) fitting method
77

Time (t) required for occurring a specific percentage of consolidation (U) is determined by:
(5.1)
(5.2a)
(5.2b)
(5.3a)
(5.3b)
Po'H 10glO
(Tv)90x H2 I Cv
0.848
11/4 x (U/100l, for U < 60%
l+eo
= -0.9332 X 10glO(I-U/IOO) - 0,0851, for U > 60%
Cc
Tv
Sc is consolidation settlement
Ccis compression index
eo is initial void ratio
Po' is initial effective soil pressure
!'J.pv is pressure increment caused by the embankment
H is thickness of peaty soft ground
Where:
The subsoil was very soft as can be realized from the results of qu, which varied in the range
between 10 to 14 kPa with having moisture content in the range 43-165%. The problem
associated with the soft deposit is augmented by the presence of organic matter, which
constitutes 12 to 25%. The compression index and the initial void ratio evaluated by one-
dimensional consolidation test (Table 5.2) were also indicative to the softness of the subsoil.
Based on the average values of Ccand assuming the zone of influence likely to be compressed
due to the traffic load of the proposed road network (SRNDP) would not go beyond 6m, the
total settlement was predicted under the working load of the road embankment was estimated
using Eqn. (5.1):
In Eqn. (5.2a), t90 stands for the time required for U= 90% consolidation, Cvfor coefficient of
consolidation and (Tv)90 for theoretical time factor. For achieving any other degree of
consolidation, the theoretical time factor, Tv, can be evaluated from Eqn. (5.3) as given below
(Lambe and Whitman, 1979):
In Eqn. (5.1), the average value of Cc(Table 5.1) was assumed for the entire subsoil up to 6 m
depth, the total depth of influence zone was assumed to be 6 m and 12 m and the pressure
increment due to surcharge loading !'J.pvwas assumed to be the average pressure occurring at

79
53 4Heightof Embankment (m)
302
C 70'"E'"~ 60(f)
co
~ 50(5enco() 40
the mid-height of the depth of influence (i.e., either 6 m or 12 m). The predicted settlement
thus estimated is shown in Figure 5.1. The settlement was estimated for various assumed
embankment height (i.e., preloading depth) ranging from 2 m to 5 m. The relationships
between the consolidation settlement, thus estimated (Eqn. 5.1), and the height of
embankment are plotted in Figure 5.1. Expectedly consolidation settlement increased with the
increase of the preloading intensity (i.e., the height of the embankment). Also for a given
height of embankment, the predicted consolidation settlement increased with the increase of
the depth of the zone of influence. For the proposed road project of SRNDP, an embankment
height of 3 m was considered sufficient for preloading and it is assumed that the zone of
influence depth could be reasonably 6 m for this project. That is, the influence of surcharge
load beyond 6 m depth was assumed negligible. Based on this assumption, the estimated
settlement (0.7*480 =336 mm) under the surcharge loading and time required to occur this
settlement (i.e., to dissipate the excess pore water pressure developed as result of t1pv) would
be 180 days.
--+- Thickness of soft ground, 6 m -+- Thickness of soft ground, 12 m .
80
Figure 5.1: Relation between consolidation settlement and height of embankment
In order to accelerate the consolidation process under the surcharge (i.e., the imposed /),.Pv),
two trial section were constructed with providing drainage paths (Figure 5.4). They were
90
5.3 Description of trial section

constructed along the road alignment at chainage KIn 10+990 to KIn II +040 and chainage
KIn 11+890 to KIn 11+940 (shown in Figure 3.1). The purpose ofthese two trial sections is to
determine the effectiveness of preload prior to actual construction and to evaluate the
performance of drainage blanket layer. Each 3 m high trial section was constructed, 50 m long
at the top and 20.188 m wide at top. Both of the trial sections were constructed using drainage
blankets of two different granular soils (i.e., half of each trial section was constructed by using
only Modhumoti river sand and half was by using Sylhet sand and the local Modhumoti river
sand mixture at a proportion 1:1). In both cases, the blanket was underlain by a layer of
geotextile, which was laid on the ground after removing 300 mm thick soft mud. The
properties of geotextile used were: average thickness = 2.90 mm, average strip tensile strength
= 15.66 kNlm, average CBR puncture strength = 2860 N, average apparent opening size = 75
micron (requirements by the specification are as follows: minimum thickness = 2.0 mm;
minimum strip tensile strength = 15 kN/m; minimum CBR puncture strength = 2500 N,
maximum apparent opening size = 250 micron). As separator, the layer of geotextile
prevented mixing of clean sand with clay underneath, while providing drainage facility in
horizontal direction along the geotextile surface and also in vertical direction through sand
blanket. It is to be noted that to avoid clogging of geotextile (that would result in stopping the
drainage path), a thin layer of sand (300 mm) was provided as interface in between the
geotextile layer and the soft soil underneath.
Sand blanket was used to provide sufficient drainage path for water escaping out of the
underlying soft soil due to the surcharge. Local sand from Modhumoti river (FM = 0.5, DIO =
<0.075 mm, D50 = 0.10 mm, emax=1.44, emin""0.7 and Gs = 2.67) was used as blanket as this
sand is locally available at the vicinity of the project site. On the other hand, a blended sand of
Modhumoti river sand and Sylhet sand (property of blended sand: FM = 2.4, DIO=0.075 mm,
Dso= 0.19 mm, emax=0.95, emin=0.58, and Gs = 2.68) at a proportion of 1:1 was used. Since
Sylhet sand is coarse grained sand, it is more suitable as a blanket layer than that of
Modhumoti sand. But using Sylhet sand as blanket would cost much as it had to be
transported from a remote place. Sand blanket of 450 mm thick was laid over the geotextile
layer at each trial section to act as drainage layer.
Settlement plates were installed 150 mm above geotextile into the sand blanket. The
installation work was commenced simultaneously with the sand blanket construction. Five
settlement plates were installed at 6 m interval at cross direction and 5 m interval at
longitudinal direction. Settlement plates were installed simultaneously for both local sand
80

81
blanket and blended sand blanket, Settlement reading was started taking just after the
installation of settlement plate and was taken according to the following sequence:
daily
twice in a week
Once in a week
Once in two weeks• Next two months
• Next two months
• 1st 15 days
• Next one month
Three meter high (including 450 mm sand blanket out of 750 mm in total) embankment was
constructed at two trial sections to act as a surcharge that eventually applied as preload on the
underlying soft soil. The embankment was constructed following the same procedure and
specification as the permanent road embankment so that it could be used as a part of the new
road. The embankment was raised layer-wise using 150 mm lift thickness. The fill soil was a
silty clay collected from borrow pit with having following physical properties such as: Gs =
2.66, LL = 38%, PI = 18%, Yd max= 16.22 kN/m3 and Wopt= 16.9%, while Yd max and Wopt were
determined according to the procedure stated in' AASHTO-T99.' After each lift, the fill was
compacted so as to obtain at least 95% of maximum dry density achieved at the laboratory
following AASHTO- T99 procedure. For this purpose, at least 5 passes were applied in each
layer of moist fill by using a 10 ton vibratory roller, which attains 12 ton static-equivalent
weight while eccentric load causing vibration is being in use. Following the same procedure,
the embankment was constructed in one month, after which a pause for a period of six months
was given to achieve 70% consolidation. During the pause period, settlement readings were
monitored to evaluate the consolidation process. After six months, the second stage
construction work (i.e., the construction of road sub grade and so on) was started.
Gradation curve for local sand, blended sand and sylhet sand are presented in Figure 5.2.
Figure 5.3 shows the dry density versus moisture content for embankment fill material as well
as filter blanket material. Figure 5.3 shows that blended sand reaches to its maximum dry
density at a relatively low moisture content, where as embankment fill material attain to its
maximum dry density at relatively high moisture content compared to blended sand and local
sand.
In general, embankment was 3 m high, but it was 4 to 5 m at very soft ground areas. It was
anticipated that the underlying soil would attain 90% consolidation at two years after the 2nd
stage construction. A typical cross section of trial section is shown in Figure 5.4.
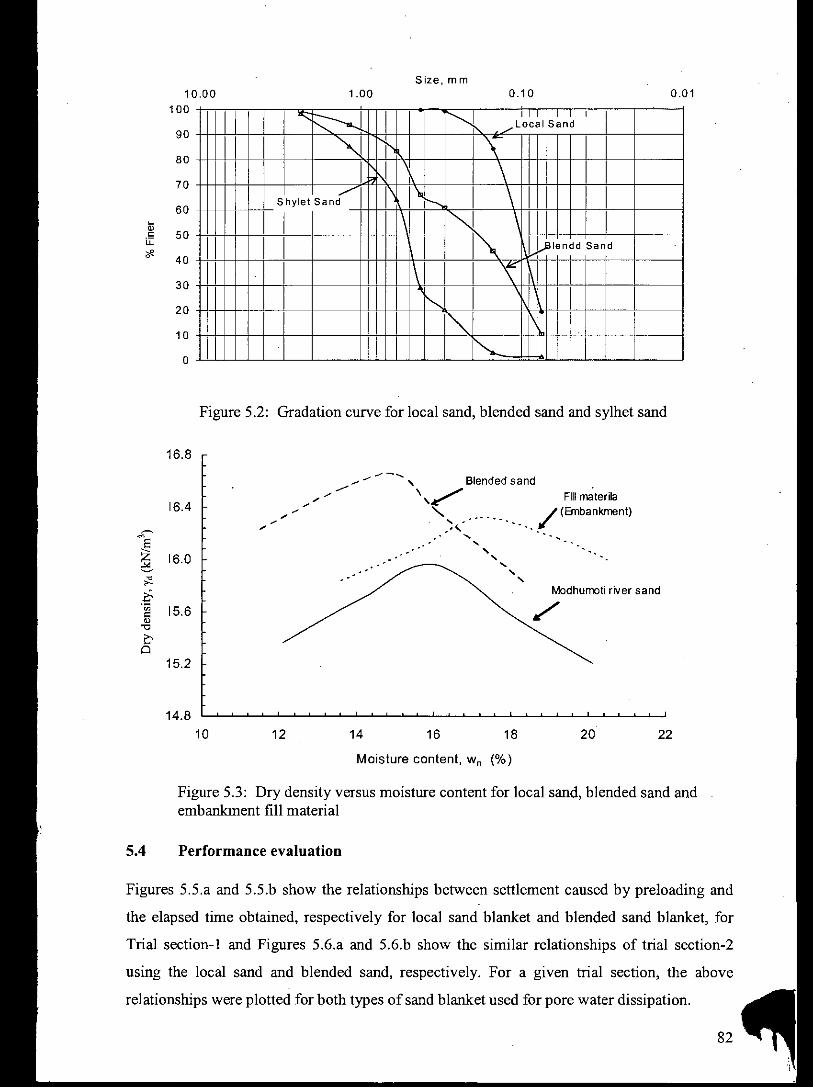
Figure 5.2: Gradation curve for local sand, blended sand and sylhet sand
Figure 5.3: Dry density versus moisture content for local sand, blended sand andembankment fill material
2220
Modhumoti river sand
1816
Moisture content, wn (%)
1412
......_ - '\ Blended sand
///~ ',/ FiII~terila/" ~ ", 0.0- '. /(Embankment)
,. .... ,..... . .....,.•. .•..•. .•. .•.
16.8
14.810
16.4
1 16.0~~?-
.~00 15.6=""0~Q
15.2
5.4 Performance evaluation
using the local sand and blended sand, respectively. For a given trial section, the above
relationships were plotted for both types of sand blanket used for pore water dissipation.
Figures 5.5.a and 5.5.b show the relationships between settlement caused by preloading and
the elapsed time obtained, respectively for local sand blanket and blended sand blanket, for
Trial section-l and Figures 5.6.a and 5.6.b show the similar relationships of trial section-2

R1
SettlementPlate60006000
20188, •• L C R "I
-- 6000 ~n 6000 ~.
.... . . '..... . ~.. . .
L1
•••••••• ••••••• •••• ••••• ••••••••••• ••• ••••••••••• ! •••••••••••••••••••<Pr0~ertY0Isoits"jl:<>.<.:<>:.«:»:<: ... :«<>:::::><:::.>«::>1:>:<:::<»: : :: .ooo"'
. '1'; 'N8tura~'mois-t'l:lre.content." ; 4'3' ~'52.%'.'.'.'.'.'.'.'.'.'. ' ' ' ,' '. ' ' .
~~~J~rf2iLLstrenglhqu7~~51:LL ::::::: ::::::::::::::::::SOFTSOIL:::::::: :::::::::::::::::::: :::::: ::::::::::::::::: ::::1::>:: .... :::: ::. <: :<: <I. . . . . . . . . . . . . . . . . . . . . . . . . . . . . . . . . . . .. ~. .•• • ••• ••••••• •• •• •• •• •• • •• •• •• • •• •••••••••• ••••• • • •••••• d ••• r ••••. . . . . . . . . . . . . . . . . . . ~. .. . . . . .. . .
32675
750 mmthicksandblanketSingle layer non oven Geotextile
Figure 5.4: Cross section of trial section
cow
c~
\

The figure shows the influence of grain size of blanket materials. It can be seen that the
escaping water driven by pore pressure dissipated slightly more rapidly through the blanket
made by blended sand with having higher grain size (i.e., higher void ratio) than that by fine
Modhumoti sand. However, the difference in the rate of dissipation in two trial sections was
small (3 - 5% in trial section-I and about 20% in trial section-2 after 75 days). The
inconsistency in the dissipation rate, however, encouraged the designer of the project to use
the local Modhomoti river sand as the sand blanket confidently rather than using the
expensive blended blanket. It is already mentioned that five settlement plates were used in
either part of each trial section. One half of a given trial section used local sand as the
drainage blanket, while the other used the blended sand. Locations of settlement plates
installed in each half of a trial section were shown typically in Figures 5.4. Out of five
settlement plates, three were installed at the central part of the road embankment, while the
other two were installed at the midway of each sloping side. As a result, the overburden
pressure, the surcharge load, was not fully imposed on the sloping sides, while it did at the
central part. Consequently, the consolidation settlement at the sloping side was less than 50%
settlement occurred at the central part of the embankment. Settlement was not uniform even at
the central part of the embankment, which could be due to the non-uniformity of the subsoil
(caused by non-uniform thickness of soft deposit, peat layer, etc.). Consolidation rate was
large at the initial part of time-settlement curve (Figure 5.5 and 5.6), the rate decreased largely
after 35 to 40 days, after which the rate more-or-Iess became constant with a negligible value.
Considering the average data of three central settlement plates of both trial sections after 200
days, the consolidation settlement was about (270+250+175+205)/4= 225 mm. On the other
hand, based on the laboratory consolidation test data, the estimated total consolidation
settlement would be about 480 mm (as described earlier). Of which, seventy percent (i.e., 480
x 0.70= 336 mm) would be bright about in 6 months. Comparing the field performance and
laboratory data based settlement estimation with keeping in mind the uncertainties involved in
the estimation, it can be concluded that the results are in good agreement.
Finally, the improvement in the subsoil due to preloading was investigated by conducting two
boreholes in two trial sections. Locations of these two boreholes are shown in Figure 3.1
(Chapter 3). SPT-N values were counted at various locations of each borehole. The
relationships between SPT-N value and depth below ground level obtained from trial sections
1 and 2 are plotted, respectively, in Figures 5.7.a and 5.7.b. In the same Figures, the SPT-N
values obtained by drilling boreholes at the nearby location are also plotted for comparison. It
84

L, CR
L1R1
L1
CL
250
250
200
200
150
I Rl6000 ~enl Plate.
Time, day
100
32675
Time, day
100 150
20188C R
6000 6000
avo L, C&R
R
R1
avo L1& R1
750 mm thick sand blanket
Single layer non oven Geote)(m-e
I l6000
50
50
L1
........................ - ......................... ..:.:.:.:.:.:.:.:.:.:.:.:.:.:.:.:.:.:.:.:.:-:.:.:.:-:.:.:.~~~??:~.:.:.:.:.:.:.:.:.:.:.:.:-:",:.:.:.:.:.:.:.:.:.:.:.:.
J\ I .
L1,~ /'~
I~~.
l~va;
ra". I I I
~ IR
c(\..,- . ~ I.--L\, avo•••• &
~-R
Figure 5.5.a: Settlement VS. time for trial section 1 with local sand blanket
Figure 5.5.b: Settlement VS. time for trial section 1 with blended sand blanket
o0.00
0.05
E 0.10...-cQ)
E 0.15Q):;::;-Q)(/) 0.20
0.25
0.30
00.00
0.05
0.10EC 0.15Q)
EQ)
0.20EQ)(/)
0.25
0.30
0.35

86
R
Lavo L,&R
C
250200
R1Settlement Plate
I6000
R6000
Time, day100 150
32675750 mm thick sand blanket
Single layer non oven Geotextile
50
L 1
.:.:.:.:.:.:.:.:-:.:.:.:.:.:.:.:.:.:.:.:.:.:-:.:.:.:.:.:.~~~~~:'S.:.:.:.:.:.:.:.:.:.:.:.:.:. :-:.:.:.:.:.:.:.:.:.:.:.
................ . .. . . . . . . . ... . . . . . . . . . . . . . . . . . . . . . . . . . . . . . . . . . .
......................................................... . . . . . . . . . . . . . . .. . .
Figure 5.6.a: Settlement vs. time for trial section 2 with local sand blanket
Figure 5.6.b: Settlement VS. time for trial section 2 with blended sand blanket
Time, day
0 50 100 150 200 2500.00
0.05E
R1C 0.10Q) avo L1 &EQ) R1.,Qi
0.15CIl j' ......1. L1
• • '1 • C
0.20 avo L,C&R
L
0.25 R
00.00
0.05
E...: 0.10c:Q)
EQ)
E 0.15Q)CIl
0.20
0.25

87
-+- Before preloading
__ After preloading
SPT-N value
Figure 5.7.b: Variation ofSPT-Nvalue vs. depth, before and afterpreloading for trail section 2
9
7.5
10.5
8 120 4 8 12
0
1.5
3
E 4.5
-50.
"0 6
o 4
0.00
1.50
Figure 5.7.a: Variation ofSPT-Nvalue vs. depth, before and afterpreloading for trail section I
-+- Before preloading
-.- After p reloading
SPT,N value
3.00
7.50
6.00
9.00
E'5' 450fr .o

CHAPTER 6
CONCLUSION ANDRECOMANDATIONS FOR FUTURE STUDY
6.1 General
Twenty four borehole data of this particular project were collected from the consulting firm
(Japan Overseas Consultant Co. Ltd - Nathan Associates Inc. - Bangladesh Consultants Ltd
JV) and the contractor firm (China National Overseas Engineering Corporation - COVEC) of
the project. Besides, 8 boreholes were drilled at various locations of the project area for this
particular research purpose. Boreholes were drilled along the center line of the under
construction road section from Mollahat to Noapara under Southwest Road Network
Development Project (SRNDP). Both disturbed and undisturbed samples were collected from
various depths of each borehole. Comprehensive laboratory tests were performed on these
samples. Attempt has been made to investigate the variation of the soil properties with depth
and to establish approximate correlation among different geotechnical properties of subsoil of
the study area.
6.2 Conclusions
• Soil profile of the study area has been established in eight sections (Km 10+000 to
Km 18+000). The project area is situated mostly at low laying area, passes through
marshy land; composed of organic substance or peat (0.3 m to I m depth) at the upper
0.5 m to 3 m depth (N-value ::; I) or more that caused by the decomposition of plants and
vegetations yield from Sundarban forest. Depth ranging from 6 m to 12 m, the soil is
composed of very soft to soft (N value <5) clayey silt or silty clay with medium organic
contents 7% - 12%. From 12 m to 20 m depth, the soil is medium to stiff (N::; 15) gray
to light brown colour clayey silt with small percentage of very fine sand and low organic
content (0% - 4%). From 20 m to 25 m depth, soil is light gray to gray colour, medium
dense to dense fine sand with silt. From 25 m to 35 m depth, the soil is light gray to gray
colour, dense to very dense silty fine sand or well graded fine sand (N-value 30 to >50).
• In the plasticity chart, 58 samples of cohesive soil from the study area is presented. Most
of the data falls above 'A' line, indicating organic clay of low to medium and medium to
high plasticity. A few data, however, falls below the A-line indicating cohesive silty soil
sample. These data are mainly samples from 0 m to 20 m depth. At higher depth from 20
88
m to 35 m, the soil is mainly coarse grained and is classified as SM, SW, SW-SM which
is mainly silty sand and sand-silt mixture or well-graded sand with little or no fines.
• Geotechnical properties of the area very with depth. In general, water content, Liquid
limit, and plasticity index, were found to decrease with the increase in soil depth. The
percentage of coarse material and SPT N-value has been found to increase with soil
depth.
• Correlations between SPT -N values of with qu are attempted to be established.
Expectedly, qu increases with the increase of N value. However, the influence of the
presence of organic content (OC) is of noticeable on the correlations between N value
and quoThe more the OC value, the flatter is the correlation, indicating that soil becomes
insensitive to the N value as organic content increases. (The relationship between qu and
SPT-N value can be expressed by the equation qu = 16.759 N-26.214 for organic content
<5%. This relationship for soil samples with organic content = 10 - 15% can be
expressed by the equation qu = 11.25 N-0.25 and that for soil samples with organic
content = 20 - 30% is qu = 1.7784 N+12.563. From these three equations it is seen that
at lower range ofN value qu is higher for samples with high organic content and it is low
at high range ofN value with comparison to low organic content soil sample.)
• Compression index (cc) was found to vary within a range of 0.156 to 0.628, while the
initial void ratio varying from 0.948 to 2.068. Influence of organic content on
compression index is significant for soil with organic content ranging from 10 - 15%.
The relationships between compression index, Cc and organic content (OC) are Cc=
0.0033(OC) + 0.2945(for OC: 0 - 5%), Cc= 0.0314 (OC) + 0.003 (for OC: 10 - 15%)
and Cc= 0.0261 (OC) - 0.2683 (for OC: 20 - 30%).
• Relationship between compression index and initial void ratio shows a trend of
increasing in the value of compression index with the increase of initial void ratio, This
relationship can be expressed as Cc= 0.3776 eO- 0.1507.
6.3 Recommendation for future study
In general the soil at Southwest zone of Bangladesh is very soft to soft organic soil or peat at
upper 6 m to 12 m depth. In other part of the country, the soil is also soft up to some extent as
reported by different researchers except some hills at Chittagong and Sylhet and terrace at
Modhupur, Barind and Lalmai.•

Soft soil deposit impose special problem in engineering design and construction. This research
work is confined mainly within the under construction road project SRNDP at Bagerhat
district. For shortage of time and equipment, the research work is limited to only soft soil
characterization work.
Research work on soft soil behavior under different stress condition may be carried out. for
further study at all over this area for .better performance of civil construction work. This work
can also be extended by incorporating the available in situ and laboratory test data of
Southwest zone of Bangladesh to up date the available soil database. Similar research work
can be carried out for other part ofthe country.
90

References:AASHTO Designation: T 99-95, Standard specification for The Moisture-Density Relations of
Soils Using a 2.5-kg (5.5-lb) Rammer and a 305-mm (l2in.) Drop
Ameen, S. F. (1985), "Geotechnical Characteristics of Dhaka Clay". M. Sc. Engineering
Thesis, Department of Civil Engineering, Bangladesh University of Engineering and
Technology, Dhaka.
ASTM, Designation: D 2487- 85, "Standard test method for Classification of Soils for
Engineering Purposes".
ASTM, Designation: D 2488- 84, "Standard Practice for Description and Identification of
Soils (Visual- Manual Procedure)".
ASTM, Designation: D 2974 - 87, "Standard test method for Moisture, Ash and Organic
Matter of Peat and other Organic Soils".
ASTM, Designation: D 421-58 & D 422-63, "Standard Method for Particle - size Analysis of
soils.
ASTM, Designation: D 2166-66, "Standard Test Method for Unconfined Compressive
Strength of cohesive soil.
ASTM, Designation: D 2435-70 Standard test Method for one-dimensional consolidation
properties of soils.
Bashar, A. (2000), "Geotechnical characterization of Dhaka Metropolitan area",
M. Engineering Thesis, Department of Civil Engineering, Bangladesh University of
Engineering and Technology, Dhaka.
Bowles, J.E. (1988), "Foundation Analysis and Design (4th and 5th edition)". McGRAW-HILL
International Edition, Civil Engineering Series.
Bowles, J.E. (1986), "Engineering Properties of Soils and Their Measurement (3rd edition)".
McGRAW -HILL Book Company.
Bramer, H. (1971), "Soil Survey Project, Bangladesh Soil Resources" UNDP/FAO, Rome.
Cox, J. B. (1981), "The Settlement of a 55 Km long Highway on Soft Bangkok Clay".
Proceedings of the Tenth International Conference on Soil Mechanics and Foundation
Engineering. XICSMFE - Stockholm 1981. pp. 101-104.
91

Craig, R F. (1986), "Soil Mechanics (Third Edition)", English Language Book SocietyNan
Nostrand Reinhold (UK), Chapter 7, "Consolidation Theory".
Dastidar, A.G. 1989. Report on ground treatment and foundations at Goran Phase I, Eastern
Housing Limited.
Eusufzai, S.H.K. (1970), "Soil profile across Dacca the capital city of East Pakistan", Proc.
the Second Southeast Asian Conference on Soil Engineering, held at Singapore.
Forrest, J.B. and MacFarlane, I.C. (1969): 'Field studies of response of peat to plate loading,'
Journal of the Soil Mechanics and Foundations Division, Proceedings of ASCE, Vol. 95,
SM4, pp. 949-967.
Goodman, L.J. and Lee, C.N. (1962): 'Laboratory and field data on engineering characteristics
of some peat soils,' Proceedings, 8th Muskeg Research Conference, National Research
Council ofCanda, ACSSM Technical Memo 74, Ottawa, pp. 107-129.
Hossain, M. (2002), "Graphosman World Atlas (Second Edition)", 3/3 - C, Purana Paltan,
Dhaka - 1000.
Hunt, T. 1976. Some geotechnical aspects of road construction in Bangladesh. Geotechnical
Engineering 7 (I): pp. 1-33.
Islam, M. S. (1999), "Strength and Deformation Anisotropy of Clays". M. Sc. Engineering
Thesis, Department of Civil Engineering, Bangladesh University of Engineering and
Technology, Dhaka.
Kabir, M.H., Abedin, M.Z., Siddique, A. & Akhtaruzzaman, M. 1992. Foundations for soft
soils in Bangladesh. Proc., Institute of Lowland Technology Seminar on Problems of Lowland
Development, Saga University, Saga, Japan, pp. 225-230.
Lamb, T.W. (2001), Soil Testing For Engineers", John Wiley & Sons. Inc.
Lambe, T.W. and Whitman, RV. (1979): 'Soil Mechanics,' John Wiley & Sons, Ins., 550p.
Lake, J.R (1960): 'Pore pressure and settlement measurements during small scale and
laboratory experiments to determine the effectiveness of vertical sand drains in peat,'
Proceedings, Conference on Pore pressure and suction in soils, Butterworths, London, pp.
103-107.
92

Mesri, G. and Godlewski, P. M. (1977), "Time and Stress Compressibility Interrelationship",
Journal of Geotechnical Engineering Division, ASCE, vol. 1m, No. GT5, May, 1977.
pp.417-429.
Master Plan Organization (1986), "Geology of Bangladesh", Technical Report NO.4.
MacFarlane, I.e. (1965): 'The consolidation of peat: A literature review,' Division of
Building Research Technical Paper No. 195, National Research Council of Canada 8393,
Division of Building Research, Ottawa.
Miyakawa, I. (1960): 'Some aspects of road construction in peaty or marshy areas in
Hokkaido, with particular reference to filling methods,' Civil Engineering Research Institute,
Hokkaido Development Bureau, Sapporo, Japan.
Morgan, J.P. & Mcintire, E.G., 1959. Quaternary geology of the Bengal Basin, East Pakistan
and India. Bull. ofthe Geol. Soc. of America. 70: pp. 319-342.
Patrick, J. F., Tunce, B. E., and Li - tus, L. (1992), "cJca Concept Applied to Compression of
Peat". Journal of Geotechnical and Geo-environmental Engineering, vol. 118, No.8, August,
1992, ASCE, pp. 1256-1263.
Peck, R., Hanson, W. E., and Thornburn, T. H. (2001), "Foundation Engineering (2nd
edition)". Wiley International Edition.
Razzaque, M.A. & A1amgir, M. 1999. Long-term settlement observation of a building in a
peat deposits of Bangladesh. Proc., Civil and Environmental Engineering Conf. New Frontiers
& Challenges, Bangkok, Thailand, Vol. 2 (part I): Geotechnical & Geo-environmental
Engineering, pp. 85-94.
Root, A.W. (1958): 'California expenence III construction of highways across marsh
deposits,' Bulletin 173, Highway research board, Washington, D.C., pp. 46-66.
Siddique, A., Safiullah, A. M. M., and Ansary, M. A. (2002). "Characteristic Features of Soft
Ground Engineering in Bangladesh". Coastal Geotechnical Engineering in Practice, Nakase
& Tsuchida (eds) @ 2002 swets & zeitlinger, Lisse, ISBN 905809 1511. pp. 231-248.
Serajuddin, M., Hai, M.A., Hossain, M.J. and Islam, M.M. (2001), "Characterization of
Uplifted Pleistocene Deposits in Dhaka City". Journal of Civil Engineering, The Institution of
Engineers, Bangladesh, vol. CE 29, No.2, 2001, pp. 167-186.
93r

Shea, P.H. (1955): 'Unusual foundation conditions in the Everglades,' Transactions, ASCE,
Vol. 120, pp. 92-102.
Taylor, D.W. (1948); 'Fundamentals of soil mechanics,' John Wiley and Sons, Inc., New
York.
Ward, W.H. (1948): 'A slip in a flood defense band constructed on a peat bog,' Proceedings,
2nd International Conference on Soil Mechanics and Foundation Engineering, Rotterdam, Vol.
2, pp. 19-23.
94
APPENDIX-A

Subsoil ChartBorehole BBH 1Location: Km 10+125
i'" SPT-N value C C'" w
(Nos. of blows per '" '">- 0"' w STRATA ENCOUNTERED 0 0-' f- :; 305 mm penetration) 0 0 ]w "' ~ 0 ~> ;; ~ 'S ~ Iw
0 ~ ~ ~ "-' ~ ~~ • >~ 0 .0" w ~ c- o:w 0:;. Z ., > g ;; 0 ::;u
"' Z'" f- " 'if 'if 'if" a- u '" ,:.::! "' s: 0 a-Cl .>- '" en
RL 2.75 m
1.5
4.50 Brownish gray to gray verYsoftto soft clayey SILT 3.0
-1.75 4.50 4.5
6.0Gray to deep gray medium to
4.50 stiff silt, trace sand and clay. 7.5
-6.25 9.00 9.0
10.5
12.0
13.5
9.00 gray colour medium to stiffsendy silt, trace clay. 15.0
16.5
-15.25 18.00 18.0
"'"'"''""" 34 19.5'''""""'"''",,"""" 33 21.0"""'"''",""""""" 23 22.5
>50 24.0
17.00 Light gray medium dense to 25.5dense sandy silt
27.0
28.5
30.0
31.5
33.0
34.5-32.25 35.00 35.0

Subsoil ChartBorehole CBH ILocation: Km 10+380
tSPT-N value C C'" (Nos. of blows per 305 '" ~'" '" "•...
0
~"' '" STRATA ENCOUNTERED mm penetration) 0 0..., •...0'" :>: ~ 0"' 0 "> :;: 1; ~ '2 ." " ri'" 0..., 00 '" " d '0 >
0 ~ 00 0 " '13 E!' or 0:'" '" ..J > g :;: 0 ::l cu :I: ~ ::l z "if. "if. "if.:> •...0 '" ~
,:.::! "' 0 '"" '" '"
RL. +0.638 m.
1.5
3.0
7.00Dark gray to black colour verysoft organic silt with clay
4.5
6.0-6.362 7.00
7.5
9.0
5.00Dark gray to gray colour stiffclayey silt, treace sand
10.5
-11.362 12.00 12.0
13.5
15.0
16.5
18.0
13.00Light gray very stiff sandy siltwith few clay
19.5
21.0
22.5
lll!l!l!l28 24.0
-24.362 25.00 30 25.0

Subsoil ChartBorehole CBH 2Location: Km 10+660
l'" SPT~N value C C
'" '" E .-•... (Nos. of blows per 305OJ '" 0 0
].., •... :E STRATA ENCOUNTERED u 0
'" OJ mm penetration) e u
"> " u 0
'" ::; " ~ '., "' " ci..,'"
~ <:> ~ ~ 0 >0 '" 0 '0 e." 0'
'" '" '" > ~ ::; 0 :.:; c:I: i2u I;: OJ~
'if: '" 'if:" u '" •0::J OJ 5: 0 •.Cl •... CC '"
RL.0.832
1.5
3.0
4.5
7.50gray colour very soft clayey silt,trace sand
6.0
-6.668 7.5 7.5
9.0
4.50gray colour medium to stiffsandy silt, trace clay
10.5
-11.168 12.00 12.0

- .......•.•f
\. ...
Subsoil ChartBorehole DBH 2Location: Km 10+930
t" SPT-N value " "" "' '""'•... (Nos. of blows per 305 c
'""' 0 C-l •... :< STRATA ENCOUNTEREDrnm penetration) u 0 ]"' "' u> :E i'i ~ u ""' " ~ .a "0
c-l ~ ~ " c • .5 "Q ~ 0 " .0 ~ >"' "' -l > 3" 0:u " ~ "' ~
:E 0"
•... ~ ~ ~Q '" s: ""' "' :t 0 '"" Q •... '" U>
RL. +2.198 m.
1.5
3.0
4.5
6.0
10.50Gray colour very soft to mediumclay silt, few sand 7.5
9.0
-8.302 to.510.5
12.0
4.50Gray colour stiff to very stiffsandy silt 13.5
-12.180 15.00 15.0""":,'""""""""'-:':''-''''''''' 22 16.5,,,,,.•.•.,,-,,""'"''"""':,..••.••.':•.•.••.,"" ..••.••." ..••, 24 18.0.•.....,,'-,.•.•.,
Light gray medium dense fine,...........••" ..••
11.00..••'•.•.•..••" ..••,
SAND with silt ..••,"':,"",....•.. ,':..: 29 19.5" .••..••.,',.••..••..••." .••..••.':," ..•." .••.",.••.,.••.':,:,'
30 21.0.••.,,',•.';,•.•" •.•,•.••.•.••..••.,•.•.••.•.•:•..........,•.•.••..••.,''-""", .••.':, 25 22.5.••.,.••.,,,•.•,,.••."•.•,'•.•,.••...••.••.,......•,""""",.••.,":..:
2' 24.0",:" ..•",,,••,:,',:,,.••.,.••..••.•.•,'..•':':,":,:,
-23.802 26.00 ":,"':,' 39 26.0

(I
7.5
6.0
9.0
3.0
1.5
4.5
Subsoil Chart
Dark gray to gray very soft to6.00 medium clayey silt, trace clay,
organic odor
2.00 Light gray to gray stiff to verystiff sandy silt
8.00
6.00
-7.108
i'" SPT-N value " "'" '" '"OJ f- (Nos. of blows per c
'"-' '" STRATA ENCOUNTERED 0 c ]f- ;; 305 mm penetration) u 0
'" OJ u> :< ~ ~
u "'" " .2 .= .~-' 1; ~ <:> c •~ 0 " • >" .0 e!' ~'" '" ..J >u :I: Q OJ ;;;: :< 0
'" f- '" -... -..." "- S f-::! OJ '" 0 "- 0Cl f- a> en
RL. +0.892 m.
Borehole CBA 3Location: Km 11+020

Subsoil ChartBorehole no. TBH 7Location: Kml1+025
i'"
" SPT-N value " "~" '" c "W f- (Nos. of blows per 305 0 0
~ f- '" u 0 ]:E STRATA ENCOUNTERED u
'" W mm penetration) ~ u v
~>=" "
0
'" v ~ 'c ." ;;~ ~ " 0 ~ '; >Cl '" ~ 0 ;; '0 ~ '" Z
'" '" ...l > g ="0 :::i 0: C
u :t z~
'J'. 'J'. '" 'J'. ":0 f- '" W • '"Cl Q. !,! " I~I~I~ E.'" w i': 0 Q. ° " "I'll" ° '"T.o "iT", ° 00 ~I?0
" Cl '" Ul Cl V) S ~ _ N ~ ~ ~- N N ~ ~
RL. +0.738
I>II 4 ~ llil 9I f-'-
5.00Gray colour soft to medium
Iclayey silt, trace sand ......... ~ .l£ / / /•••••••••••••••••••.•••••.• 5 ~
-4.26 5.00.••.•••••c-'-
•••••••••< 4 ~,.•.,.••.••,'"'''',.••,'.••",..,..,.••,",,:•.•.•• ,:,
Gray to light gray colour" .••,.•••••.••.••':,""':,""""" 8 ~5.00 soft to stiff clayey silt, trace ~~~~~~~~--.:::...-
sand ""':"'""',...,""',...," .,.."" ...•.•"~~~~~~~~-.2...- ~""""'."'''"',.••,...,
9.26 10.0 """, ...,...,...""""""" ..., 11 ~•••.••,,,.••,,.•• -..:....:...",,:.,•..... ,""" ...,".••",:" ..,..,..••.••.••.,'.••-....,,,••..•••
"'" .••" .••
~~~~~~~~...!.Q..••,-",,-,,"',..,,"" •••.••"".•••
Light gray colour stiff to,......,...",.••
\''''''''"""" 15 113.55.00 very stiff clayey silt, trace ""~~~~~
sand """" \"""""""""""" \.14.260 15.00 """" 21 15.0

Subsoil ChartBorehole no. TBH 1Location: Kmll+480
l" SPT-N value " "'"" OJ C '"OJ•... (Nos. of blows per 305 0 c ].J OJ u 0
f- :E STRATA ENCOUNTERED mm penetration) uOJ OJ ~ " ~> :E " .~ "0 "OJ " ••.J ~ ~ 0 .~ •• '5 > Z
" ~ 0 0 i'!' 0- s: 6OJ OJ .J > g :;; 0 :::;u :I: i:2 ~ ~ * * * * "" f-
"E-o-
" a.~ +1.•~H=I~ °TsT:;; ~H~I~OJ OJ 0 a. :! " +,To "I:<il~00
" 0 •... '" on " .. ~~ M M ••
RL. +0.818
••••••••
••••••••< ..2. ~
4.50Gray colour very soft to SOft» ••••clayey sill, trace sand ••••••••
••••••••2 ~«•••••••-3.682 4.50 ••.•••••..2. ~
•••••••••••••••• 1 ~••••••"""'"",..:,:"".....•..,"""
\"""' .."Gray to light gray colour
"",,....•.."'"•••.•••,'"""" 5 ~7.50 very soft to ediu clayey silt, '.••.."'"•••...••,'~,,,.•......,','
trace sand ":,,-,:,,,''''".•..,''•..,,,....•.. ,""',•....,"...-.,..........,' 3
~,....".......,'" --=--" ...•.....• "..••,..••..••.•.•,..••..••..••,••...••..••..••':...,"..•...••,'"..••..••,..••..••".....:,:•..,,..••,,,..••,"":..........".... 5 lQ:?............................, --=--''',..••.••..••..••••.,..••,,,..••,""':, ..••':•.•,..••,,:,..••,"",:,,-,: •.•.••
-11.182 12.00,...."....',.......4
~~~~~~~~~r---.:-,..••':,..••..••,'"'"..••..••..••..••,..••..••,..••..••,'"..••,..••,""..••,..••':,..••..••..••,3.00
Light gray colour ediu stiff """""""" 5 ~clayey silt, trace sand ~~~~~~--=-
"""""""""""""""" 1/""""""""""""""""
-14.182 15.00 """""""" 5 15.0U""""""""

]j"8u
.~o#.
~
~
~L2"'-..J.2..
~
...!.Q2.-
~
~
~
~
~
-!22..1.!.:Q.
E2.
~25.0
\
/
\27
17
30
25
SPT-N value(Nos. of blows per 305mm penetration)
19
":3gjoCO
..•...•...•...•...•...•...•."
............................" 30~~~~~~~..•...•...•...•...•...•...•."................................25~~~~~~~-=-..•...•...•...•...•...•...•."~~~~~~~~..•...•...•...•...•...•...•."~~~~~~.I!.-..•...•...•...•...•...•...•...•...•...•...•...•...•...•...•."............................" 30
Subsoil Chart
••••••••••.•••••2.-
........ -'--« -'--••.•.• 3
l~
STRATA ENCOUNTERED
Dark brown 10 dark gray soft organicclayey silt, trace fine sand, organic odor
5.00 Gray colour very loose to loosesilty fine sand
2.00
4.00 Dark gray to gray colour verysoft silt with little clay and fine
15.00 Gray to light gray colourmedium dense to dense silty fine
.n,," ,n,n
.
.,m ?OO
-24.373 25.00
RL. +0.627 m
Borehole BBH 3
Location: Km 11+766

Subsoil Chart.Borehole no. TBH 8Location: Kml1+915
i'" SPT-N value
E E!J
'" '" c !J
'" f- (Nos. of blows per 305 0 c
-' f- '" u 0 ]'" OJ " STRATA ENCOUNTERED mill penetration) ~ u v i> ~ .~ 0
'" :;0 v ~ @ ." -.-' '"~ () 0 ,;
., > Za ~ 0 -. eo' ~ 0:: C'" '" -' > ~ :;0 0 ::J:I: Zu f- " OJ 'r '" '" '" '" of" 0. U '" 6a OJ :2 0 f- I~I~ ~ oH'=::! 0. 0 ~ v °1~1f' ++ e:1" 0 "If'0 f- a> on a ~ ~ ~ ~ ~ ~ _ M
M M ~
RL +0.833
••••••••> 02..•..•....2- p 1/Gray'colour soft to medium••••••••5.00 •••••clayey silt, trace sand /..2- ~ / 1/
•••••• \••••••..... ~ ~
-4.16 5.00
••••••••;..•••••••
7 ~""''',,..•.,,...""""''''''''" ..:"",
Gray to light gray colour ':,""""", ..•.,'5.00 medium to stiff clayey silt,
, ....,,, ....,' 8 .22..~~~~~~~-=--trace sand "",..••,'"":,''- ..•.
""",,-,..,..,•......",:•.•""" -?- ..2:Q.",,:.••..••,-,"""':,""',..••,,:,,-,,,,:,
9.16 10.0 " ..••,"'- ..•. d,-""",..",'-""''''' 10 J!L5~~~~~~~~-:..:...""- ..•.'-":,"'-" .••...••,"',.•.•,"" ..••.••.••••,",..••" ..••,'.., EJl~~~~~~~,.••...••''- ..•.,'"'"..••..••,""""
Light gray colour stiff to•..,""" \""""
5.00 very stiff clayey silt, trace "'''''' 16 J..)l~~~~~~~~ 1\sand """"""""""""""""-14.160 15.00 """" 20 \ 15.0""""

Subsoil Chart
1'" SPT-N value E E
'" Ol ~ ~OJ
•... (Nos. of blows per 305 cOl 0 c ]-' I;j ::E STRATA ENCOUNTERED Q 0
Ol mm penetration) Q
> 6 ~ "::E Q "Ol " ~ '0 "0 l-' ~ " " """
~ 0 "~ '5 >
Cl '0 1." 0-Ol Ol ..J > :gu :I: z OJ
~::E 0 :.:;
:> f-< '" 'if. 'if. 'if.Cl 0. S! '"g2 OJ '" 0 0.
'" •... a> '"RL.l.022m
1.5
5.00Dark gray very soft clayey silt,trace fine sand. organic odor
3.0
4.5-3.978 5.00
6.0
5.50Dark gray soft to medium sandy 7.5silt, trace clay, organic odor
9.0
-9.478 10.5 to.5
Borehole CBH 4Location: Km 11+920

Subsoil ChartBorehole CDH 5Location: KIn 12+320
'" i"' SPT-Nvalue " "f- ~-' '" "' (Nos. of blows per 305 ~"' "' :;: 8TRA TA ENCOUNTERED rom penetration) 0 0 ]> f- i5
0 0
"' "' ~ "2 " 1-' :;: 00 " ~ ~" 00 " 0 • .. >"' i5 "' 0 " g .0 g ~ 0:u " i2 -' > :;: ;J
" b: Si ::! ~ '" " '" '" '" "" IT ~1:2::! "' " 0 ~ °H:2I~ :;1;qI:O: "1,,lp 0 ~ "II:" 0:; ~IV)0" f- '" 00 " M ~ ~ M ~~ ~~~
RL. +3.103 m
i I.
Light brown soft to medium stiff~ ~
3.00clayey silt
+0.103 3.00 3 ~
1.50 Black organic soft clayey silt, 1\trace clay
2 ~ \ lp-1.397 4.50
3 ~Dark gray to gray colour soft to
. 6.00 medium silt with few fine sand,trace clay 3 ~
5 9.5-
-6.897 10.00 5 10.0

Subsoil ChartBorehole CBH 6Location: Krn 12+600
"' i"'f- SPT-N value c "...l "' "' 1i::E (Nos. of blows per .-"' "' STRATA ENCOUNTERED 0 c ]> I;i l' 305 mm penetration) u c
"' ~u ~ N~
...l ::E en ~ u 0 .gCl en <::> 0
.2 :g "1':i "' 0 " ~ " ~ 0 > 2"' z .0 ~ 3"u :I: ...l > ::E Ii:::> '" "' ~
0f- U .;; :?- :?- :?- :?- d'
Cl •• "'::l "' s: 0 •• 01.., =:1:'31~1:q1:;: ir gl~l;;01..,1=: ~I"'I~ "I:" °1~1:"Q f- 0> en Q M"'" - N_ N M
RL. 0.830 m
•••••••> -'- 1--!1-
5.00Dark brown to black colour organic < -'- f--lQ-very soft clayey silt, trace sand
•••••••< -'- 02- --4.17 5.0{)
••••••3 ~
10.00Dark brown to brown colour very 2 ~soft to soft sandy silt, few clay
• ~~ ~-9.17 5.00
"- ~" .....•.,"--'2.. 1'. ...!.'!2-""'"""'",.••." ..•.,'
.••.••..••.".••."..""'" ~ ~""'"""' •.,'"'""•......,.••." .......••....•.,"':,'" .1Q... --'l2.."'-""",.••..••.,••.,,:..,...•,,"-',: .."',•..•.•.,.••."':,'''' ~ ~",:,''''" ....•..,.•••.,",.....•,..•",.••.,.••.,
..!?. ~"':,:•.•••.,,.••." .••.,' "-""'" .
Light gray to gray colour medium = "- l>15.0030 ~
dense to dense fine sand with silt iii /'/',. < f-l21.
1.25 " "- ~
J: \ ~
33 \~.35-24.170 25.00 25.0

I~
/
25.0
Subsoil Chart
Gray colour medium tostiff sandy silt, trace clay
Gray colour very soft sandysilt, trace clay
Dark gray colour very softsandy silt, trace clay
2.50
2.0
6.00
14 50 Light gray medium densed. silty fine sand, trace clay
l'"
SPT-N value C C
'" "' (Nos. of blows per ~ B,.."' "' STRATA ENCOUNTERED 305 nun penetration) 0 0 ]-' •... lO
u 0
"' "'u
> ~ u 0
"' ::E 1; 0 t! '2 ~0 'i-'
"'"
~ " 0 •.,;
"~ 0 " '0 1."
>
"'0- ;;: g
"' '" f;j ..J > ~ ::E 0 ;:Jg •... "' ~
a"- a"- a"- a"- d'
" •.~ '" "E-
"' "' 0 o IS l:;l Ig I" u "1;-::10 oH~ ~ "I~ "I:" sl~l:!:'" " ,.. " '" " M M ~ ~ ~ ~ N N
-6.924 8.00
-9.424 10.50
-23.924 25.00
RL.+1.076m
Borehole BBH 4Location: Km 12+850

Subsoil ChartBorehole eBR 7Location: KIn 13+215
iSPT-N value " "'" (Nos. of blows per ~ &
'" "'>- 0 0 ]"' "' STRATA ENCOUNTERED 305 nun penetration) u 0
-' f-< :; ~ u 0
"' "'u " 'i> ::;;
'"g .0 -c ""' <:J 0 ~ .5 >-' ~ ~ " .0 i:? 0-
Q ~ 0 " ::;; 0 ::; 0: 0"' -' > g"' :I: ?2 #. #. #."" au "' ~•:0 f-<
'" .,; ols]g0- uo I'" I", I:;; I~Q
"' ~0 ~ ,,1~1f' 01",1'"~"I~"llr::! Q co '"
""""'I"1rl -N ..,~~N N
RL+O.539rn
Black to deep brown colour ve~ .:: ~:::::2.5 soft organic soil ':::::::: -2- ~
-1.961 2.50
6.003 -lQ..
Dark brown to black colourorganic soft clayey silt with little
...Q.fine sand, organic odor 3
-5.461 6.00 4 ~
1 ~
Dark brown to dark gray colo i ...2"'-6.00 very soft to medium clayey silt::::::::few fine sand ::::::::
JQ2.••••••.••-.!...
•••••••••-11.461 12.00•••.•••• 2 ~" .•.•""""""." ...""",..•"':,":, c-l'- f\ ..Q2-,..•...•.,'",..•.••.,..•...•...•.",.....••,•.."':,',..•.~~~~~~~ ~",,:,'"".,":,'",..•...•...•.•••,'
J.22.~~~~~~~..•.,,'..,"'..,','-", ..•.
Gmy light medium...., ..........".... 2 ~13.00
to g<ay ~~~~~~~densed to densed silty fine sand ""'"""'",,"'" J!. ~""'"""'"""'""'"''",,'" 1Q... ~""'"""'""'"''"",,' 27 ~""'"
I 33 ~
-24.461 25.00 •34 25.0

Borehole CBH 8 Subsoil ChartLocation : Km 13+450
i'" SPT-N value C C
'" "' 2
"' f- (Nos. of blows per " 11-' "' STRATA ENCOUNTERED 0 ]i;l :; 305 mm penetration) u 0
"' u> 2; ~
""' :>: "u 0 'I-' '"
~ '" 0 ." ] -,;~ 0 -,; ~ >
" .0 a""' "' -' > ~
0- s::u :I: ~ "' ~
:>: 0 ;:;:0 I;: *' *' *' *' d'
" ~ '" <;
"' 0 a Is Ig I:::;I" ~ ol~lsgj " ":1cd '" ,,:I~I~ °l~'*1:"Cl f- '" en " M v v M v ~ _ ~ M
RL. 0.574 m.
II
1<11< 1 ....!2-I f--'--
Dark gray to gray very soft to I>4.50 medium clayey silt, trace ciay, I>organic odor 1><
1 ~
~3.926 4.50 5 ~ ,
2.50 Light gray to gray stiff 10very 15 ~stiff sandy silt
~6.926 7.50 1111Illl! 19 7.5
I
.
,-,

(
ic ~B cc B0 c
]u 0
Bu u
a .B"C
,C -,;~ d '5 >'0 2!' .S;:;: 0 ..l
"if'. "if'. "if'.
7.5
9.0
6.0
15.0
13.5
10.5
12.0
Subsoil Chart
Gray to light colour very6.00 stiffsandy sill, trace clay,
organic odor
Gray colour cdiu to stiff4.50 clayey sill,trace clay,
organic odor
-8.009 9.00
-14.009 15.00
'"SPT-N value
" "' (Nos. of blows per 305OJ
...-' •... "' STRATA ENCOUNTERED rom penetration)"' OJ :>.> :;: ;;"' r.:J "-' ~ '"
,0 '" 0 -,;"' "' ..l >U " i:2 OJ z::> t Ii " t0
"' OJ '" 0
'" '"... '" '"
RL.+O.99I..... .. .
1.5
Gray colour very soft clayey :::::4.50 sill, trace fine sand organic
odor ... 3.0
-3.509 4.50 4.5
Borehole TBH 2Location: Kro :13+650

Subsoil Chart
t-o: SPT-N value C C
'" "' (Nos. of blows perJJ JJl- e
"' "' STRATA ENCOUNTERED0 e ]..J f-< ;; 305 mm penetration) u 0
"' "'u
> " ~ ":;; .~ ""' 0 " il " "" " I..J ~ ~ " • .; >~ 0 "" "' ..J > g .13 e!' 3" 0::"' '" g :;; 0u ::l "" f-< '0"- '0"- '"'" ~•
" "' 0f-<
::! '" 0Cl I- eo en
RL. +1.832 m.
1.5
3.0
4.5
Dark gray colour very soft to 6.014.00 soft silty soil with clay and fine
sand, organic odor7.5
.9.0
10.5
12.0
13.5
-12.168 14.00
15.0
16.5
8.00Gray colour medium stiff sandysilt. trace clay 18.0
19.5
21.0
-20.168 22.00
22.5
4.00Gray colour dense to very densefine sand, few silt 24.0
-24.168 26.00 26.0
Borehole BBH 5Location: Km 13+850

Borehole CBH 9 Subsoil ChartLocation: Km 14+250
i0: SPT-N value '" '"'" oo •••
"'f- (Nos. of blows per 0 •••
-l f-oo STRATA ENCOUNTERED 0 0 ]:< 305 nun penetration)
u 0oo "'
u
> :E '"~ u "oo " ,\1 'E "0 " "'-l ~ ~ " " ~ '5 •• iCl ~ 0 •• '0 >
oo oo -l > I ~ .S!" 0:u ;I: i:2 :E 0 -l
" f- "' ~ '$ '$""
'$ aCl '" ~ '" -5 •gj "' 0 '" °121~lgl~ ~ ",I'llo oH=o ,,1~lo "llool~l~0 f- Ol on ~ " ~ ~ ~ ~ N ~
RL. +0.151 m.
7 ~.
« f-!--
> ~ ~6.00
Dark gray very soft organic ::::clayey silt 1< ~ ~
-5.849 6.00 < i-l- ~.:.:::::<> i-l- ...l2.
Dark gray to gray colour very < --'-- ~ \6.00 soft clayey silt, trace fine sand, <organic odor :::::::
1/ --'-- --.!.Q2.
*11.849 12.00 I ~ ~
~t3.00 Gray colour loose silty fine sand ~ 1/ I)-14.849 15.00 ~
~
50 ~11.00
Light gray dense to very dense 50 19.5
fine sand with little silt
35 I 21.0
53 I 22.5
42 ~
-25.849 26.00 47 26.0
•

Borehole BBH 6 Subsoil ChartLocation: Km 14+553
i'"
SPT-N value " ".
'" "' (Nos. of blows per ~ ~!-Ul "'0
-' f- STRATA ENCOUNTERED 305 mm penetration) 0 0 ]"' Ul
:;; ~ 0 0
> 0
"' :2 " 0 ~ ." :g ~ ,<",
-' 2; ~ " " ro " > iCl ~ 0 ".0 e!' 3" c:
"' "' ..J > I :2 0:t !:2u !- :;j ~ >"- >"- >"- >"-of:0 £
Cl 0- ~ olSI:olgl" ol:~dgUl 0 ~ ~IS"' 0- 0 ~ "il~ ° ~1"lo ';ll~'" Q !- '" on Cl N ~ ~ ~ ~ ~ N N
RL +{).452 ill
I>I> f-!- -'.2..
I»6.00
Gray very soft clayey silty, I» f-!- ~organic odor
I> I-!- ~
1<-5.548 6.00 1 ~""""",,""""""""""""""",,"""""" I-!Q.- f-22-"""",""""""""""""""""~ """""""""""""" ...!i.. ~"""""""""""""""""""""
Light gray loose to medium """"""" ~9.00 """"""" ...!!-dense fine sand with silt """"""",,""""""
"""""""""""""" ...!2. ~""""""""""""""""""""""""""""""""""" -.!2. ~""""""""""""""""""""""""""""-14.548 15.00 """"""" ---'.l ~ I d""""""""""""""""""""""""""""""""""" --.i? ~""""""""""""""""""""",,"""""" ~ ~,,""""""
""""""""""""""Light gray rnediurm dense to """""""10.00 """""""dense fine sand, few silt """""""""""""" 27 ~
ilL, 2!J!.
• B2
29 -'!QIi
-24.548 25.00 32 25.0

Subsoil ChartBorehole TBH 3Location: Km 14+800
t'" SPT-N value
;; ;;
'" "' B
'"•...
(Nos. of blows per 305 " 11-' •... "' 0 0 ]"' '"
:;: STRATA ENCOUNTERED 00mm penetration) ~ 0 )> :;: " "2 ""' 0 ~ "'-' ~ ~ 0 " ~ "~ 0 " " > 20 "'
.0 i'." C"
"' 0: ~..., > ~ :1 0 ;:; c:
u '" Z:0 •... ;f ;f >R ;f .;•• ~ '" '" £ •0 '" 0 oTN1 .•T~ ;r=d~l;! ~ ol~ls ~g o1~T~"' •• 0 s:1",1f' s:1s:lo'" Cl •... '" '" 0 M •• ~ M ~ ~
RL. +1.099I>>> ~ ~
Dark gray colour very soft »4.50 silty clay, trace sand,
••••••organic odor < .J.... .1.:!l-.> ...<
-3.401 4.50 <2- ~
<•••••••• 4 ~''''':,''........•..•.. ,'"
\Gray colour soft to ediu ""'"4.50
....••,,',..•,clayey silt, trace fine sand ""'""""" 1\":,',:,' 8
~~~~~::::::~,,-,-,••..,,,.••...•••••.••..••.,''''',•......" .•.•,.••..•.•,,-,:,,,,:,
-7.901 9.00",-,-",,,,,:,
19.0::::::::::::::...2-",..:",""•.•:", \" .••.,''-,,.••...••,.••..••.,,.••.•••,..•.,..,.••.•••,.••.•••,
) 110.5::~::::::::E.••.,'-...'..•••,",.••.••;,;,
6.00Gray to light gray stiff " .••.•••"....•.."":,,,-,-clayey silt, few sand ",..••""
.••..••.,"':•.• (",-""" 91
12.0"",,-, ~''''''''""'",.••.,""
\",•.•.••.,,,,,-:,:,""""""~~~~~~~ ~""'"",,'"""'"""'" /""'"
15.00 ""'"-13.901 ""'" 11 15.0

Borehole BBH 7 Subsoil ChartLocation: Km 15+052
i'" SPT-N value " "'" '" (Nos. of blows per '" 11"' f- 0
..J '" STRATA ENCOUNTERED 0 ]f- :;: 305 mm penetration) u 0'" '" u0> :t 6 ~ 'S 0'" " t! "0 " ri..J 1: 00 0 • '5 >Cl 00 " " '0 ~ C"'" 0 > g a:'" 0:: z :t 0 ;:J cU ..J
~=> f- " '" 1 a" a" ~ a" ~Cl •• U '" •'" "' '" 0 •• 01"1,,1,,1" ,,1,,1f' ol~T::;° <>1° "Ir ,,1:,,1°'" Cl f- Ol '" M " ~ M " ~ N N
__ N
RL.+O.735m.
I>1 e-!- --'.2-I:
5.00Dark gray very soft to soft
~
~organic clayey silt. trace sand
02--4.265 5.00 1
1< e-!- ~I:>I 1 ~ 1/5.50 Dark gray to gray clayey silt, 1< f--'-
trace fine sand. organic odor 1/> c2- ~rc-.9.765 10.50 »> 2 10.5 r1J j,
"""'""""'""",,""""'" ...!.!... 0.bQ.'''''''',,",,'""""""""""',,'" ...!."- ~""""""""''''''''"""" ...!.1i- ~"'''''''"""""""'""""'""""" ...!.!... ~",,"""""'"""""''''''''"""" 21 ..!!Q.
I 3' ~
I 36 .2!.:Qm 30 ~
23.00 Gray colour medium dense to. 32 -'!Qdense silty fine sand, trace clay II 30 ~
ilL EQ
I 30 ~
I 35 ~
I 35 .2!.1
II 32 ~
11 34 ~
.34.265 35.00 II 35 35.0

Subsoil Chart
i" SPT-N value C C
'" '" (Nos. of blows per 305 B B'"' cUl '" STRATA ENCOUNTERED 0 c
...1 •• :< mm penetration) u 0 ]'" Ul u> e u
::; " u ~'" u B ." 'i...1 ~ 0 " <ii
~ ~ 0 <ii ." ~ >Q '" ..l > g 0 ~ 0:'" :I: ?2 ::; 0u ~
~;:> •• * *Q •• ~:;l Ul 0
0 '"' " '"RL. +0.595 rn
1.5
6.00Dark gray organic very softclayey silt 3.0
4.5
-5.405 6.00 6.0Dark gray to gray colour
3.00 soft clayey silt, trace sand,organic odor 7.5
-8.405 9.00 9.0
10.5
6.00Gray colour stiff sandy silt,trace clay organic odor 12.0
13.5
-14.405 15.00 15.0
Borehole CBH 10Location: Km 15+200

7.5
3.0
6.0
1.5
4.5
Subsoil Chart
Gray colour soft to mediumclayey sill, trace sand
Light gray to dark gray5.00 colour medium to stiff
clayey silt, trace fine sand
9.0-9.897 10.00
20 10.5
5.00Gray colour very stiff siltwith fine sand, few clay
26 12.0
28 13.5
-14.897 15.00 25 15.0
i'" SPT-N value
;; ;;
'" O' ~t- SOJ O' (Nos. of blows per 305 0 c
~-' to ;:;; STRATA ENCOUNTERED u 0O' mm penetration) ~ u u> ::< ~ u 0OJ "
u ,j! .c :g "-' ~ 0
6 ~ 0 "d 0 >
" O'.0 f." .Sf
O' ..J > ~u ::c i:2 OJ z ::< 0 ..J::> t ;F. '" ;F.
u '" t: •" OJ :;: 0O'
'" " t- al <IJ
RL.-t{).103
-4.897 5.00
Borehole TBH 4Location: Km 15+500
5.00

~
'" SPT-N value " "'" "' ~f-< STRATA ENCOUNTERED (Nos. of blows per B"' "' 0 0
-' •... :E 305 mm penetration) 0 0 ]"' "' 0
> " e v
"' :E v g .~ ~ ~ 'i-' :?: ~ " ~c~
" ~ 0 .0 e." 0 >
"' "' .J > ~0- s: Z
u :I: i:2 :;j ~:E 0 :J eo.
=> •... s 'if- "" 'if- 'if- a" "- " •
"' 0 "- oT~T":;l '" "- OINlvl~H"I~I:!I;:~ ~T~I", ",I"T~o:lr ~I"I~'" f-< '" '" ~ ~ v v ~ ~ NN
RL.+O.215 m
.
10.0
Subsoil Chart
,:,,-,,,,,"":,,-,,," .•..••.-.,"",:,,-,,,,,~~~~~~~~17
Dark gray to gray very softto medium clayey silt, tracesand, organic odor
Gray colour loose tomedium densed silty finesand, trace clay
6.00
4.00
10.0
6.00-5.785
-9.785
Borehole DBH 8Location: Km 15+800

Borehole CBH 11 Subsoil ChartLocation : Km 16+000
SPT-N value i" (Nos. of blows per C C
" '" STRATA ENCOUNTERED2
~W I- 305 mm penetration) c
'" 0 ]..., I- ;; u 0
'" w u v;> ::E " ~
u , ~i'" COv .0 :g "..., '", ~
Q ~ '" 0 " .0 !!', >
'" .J > g .g- o:'" '" t;i ::E 0 .JU W
~" l- e< " $. $. $. $. aQ "- ~'" w 0 "- ol~I"lgl~ il" 'Clolf'ol~T~ ° ° S; '11~"1,,1:0" 0 l- cc Vl Q ~ v ~ ~ v N N
_ N ~
RL. -0.279m.
• ••••••• ..l ~1<7.00
Gray colour very soft clayey I ••••••• ..l ~silty, trace fine sand, I <orgamc odor :::::::
..l ~>i> 1 ~-6.265 7.00 1< -'-
ili,,~",~ __ ml E..3.00 stiff sandy silt, few clay 4 .2"'-
-9.265 10.00":,"':, 2.Q.. ~
J, ~"'"''""••.•""""'""''''''' ..2.. E:£.''''''''",,"""'"''""'" ..!2. ~""'",,,""''''',••.•
Gray medium dense to ""'"""'" ..12. ~10.00 dense silty fine sand, trace """••.•
'"''''""'"clay ""'"",,,,,,,~ ~"'''''''"'''''''""''''""'"",,,,,,~
18.0"""'""'''''''"'"'',,"'"
~""'" ...!22""'"-19.265 20.00 ""'"""",
IG: ~
29 .E2"',,'"""'"""'"Gray colour medium dense ""'" .2!. ~5.00 ''',,''
to dense fine sand trace silt ""'"""'"••.•",,"-24.265 25.00 '"'''' 40 25.0
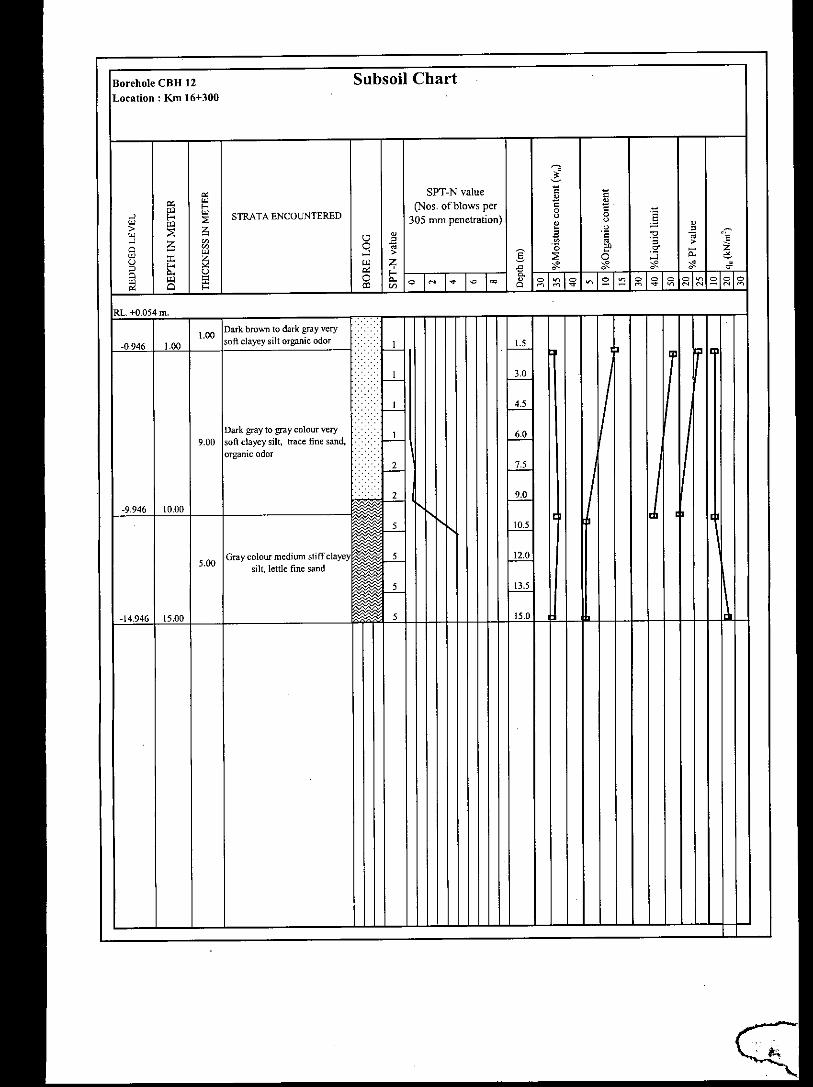
Borehole CBH 12 Subsoil ChartLocation: Km 16+300
i'" SPT-N value " "'" '" B
"'f-< (Nos. of blows per = E
-' '" =I;i :>0 STRATA ENCOUNTERED 305 mm penetration) u 0 ]'" u> :>: 15 ~ u u
'" u " ri-''"
~ <:) " '. :s! "" ~ 0 "~ • " >
'" '" ..J > ~'0 e." 0' Ii:
u '" ~ ~ ~;;; 0 :J ~
" f-< oS >R '" '">R d'
" 0.~
f-< • •"' 0 o IN I~ I~ 100
~ ~Isl~::l 0. u '1hlo '11"111" "I~",1:;lIp0 f-< al '" " ~ ~ ~ ~ ~ ~ N N _ N ~
RL. +0.054 m.
1.00Dark brown to dark gray very I>
-0.946 1.00 soft clay.ey silt organic odor
•••••••••f-!-- -.!.2.
< f-!-- ~«< j-L ~Dark gray to gray colour very > J--..!.- ~9.00 soft clayey silt, trace fine sand, >organic odor < J.2.- e-11..
•••••• 2 ~-9.946 10.00
5 I 10.5
5.00Gray colour medium stiff clayey 5 .B:Q.
silt, lettle fine sand
5 ~
-14.946 15.00 5 15.0

Borehole BBH 9Location: Km 16+667
Subsoil Chart

6.0
9.0
3.0
7.5
1.5
4.5
15.0
13.5
12.0
10.5
Subsoil Chart
Light gray to dark graycolour medium to stiffclayey silt, trace fine sand,organic odor
Gray colour very soft clayeysilt, trace fine sand
Gray to light gray medium5.00 stiff to very stiff clayey silt,
trace fine sand
-8.792 10.00
5.00
5.00
-3.792 5.00
-13.792 15.00
i'" SPT-N value
C C'" "' 1jf- .9
"' "' (Nos. of blows per 305 0 0 ]-' f- :E STRATA ENCOUNTERED u 0
"' "' nun penetration) ~ u"> :< " u~"' C " ~ .0 "0
-' l'~ " ~ .5
0 ~ 0 " .0 ~ >
"' "' -' > ~ ;5 0:u J: ~ oJ
~
:< 0:> f- t'- t'- t'-0 0. U '":;l oJ 5: 0
Q f- CO '"RL.+L208
Borehole TBH 5Location: Km 16+800

Subsoil Chart
1SPT~Nvalue E E
" ~'" "' (Nos. of blows per ~"' f- 0 0 ]"' STRATA ENCOUNTERED 305 mm penetration) u 0
.J b
'"u
"' "' e "> .~ 0
"' ::E'" " ii " ".J ~ " 0 >
Cl ~ ~ 0 ".0 e!'
"' "' .J > g ::E 0u '" ?2 ::l '1 te- te-~ bCl "" ~ b
"' "' 0""
c
" Cl f- CO V}
RL.+1.910 m
1.5
4.50Dark gray to gray colour soft to 3.0mediwn clayey silt, organic odo
-2.590 4.50 4.5
6.0
7.5
7.50Dark gray to gray colour 9.0medium sendy silt
10.5
-10.090 12.00 12.0
""""..,,""""""""""""'''''''''' 11 13.5"""""""""""""''''''''''''''''''''"""""""""""""''''' 14 15.0"""""""""""""'''''"""""""""""""'''''""""'''''' 17 16.5"""""""""""",,,,,,"""""""""""""""""""""""" 38 18.0""""""""
Gray colour medium dense to """"""""14.00 """"""""dense silty sand """"'''''''"""""""" 22 19.5
32 21.0
35 22.5
31 24.0
-24.090 26.00 28 26.0
Borehole CBH 13Location: Km 17+094

6.0
9.0
7.5
3.0
4.5
1.5
12.0
10.5
13.5
15.0
Subsoil Chart
Light gray to dark graycolour medium to stiffclayey silt, trace fine sand,organic odor
Light gray colour medium5.00 to very stiff clayey silt trace
fine sand
5.00
5.00 Gray colour very soft clayeysilt, trace fine sand
-8.792 10.00
-3.792 5.00
-13.792 15.00
t" SPT-N value " "'" w IIc- ~
"' w (Nos. of blows per 305 0 0 ]"""' 1;; ::E STRATA ENCOUNTERED0 0
w mm penetration) u> ::E i'i ~ u 0
w 0 ~ .~,
"""' ~ ~ '", .,;
0 ~ 0 .,; .0 ~ >w w ..., > ~ 0:u ;I; ~ ~
::E 0
" t :;l '0'- '0'-0 u ,...w "' 51 0 ••" 0 c- Ol '"
RL.+1.208
Borehole TBH 6Location: Km 17+370

i-I. '" SPT-N value C C'" OJ •••;.
(Nos. of blows per " 2'-' Ul OJSTRATA ENCOUNTERED 0 "f- :; 305 mm penetration) u 0 ]OJ Ul u> ~ v:< 1'; u 0OJ
"V ~ .0 ] 0; ~i-' ~ ~ 0 •'"
~ 0 0; '5 i'!' >OJ -J > ~c- o:OJ :I: Z :< 0 ::;u ::! z;0 f- '" "- "- "- "- d'"- u ~ '"'" Ul s: 0 fr ol=d~OJ "- 01"'1"1:;;1'" "hlo "1'1lp "I" "'I~I"'" Cl ;. CO '" '" M M ~ M ~ ~ N M - N M
RL. +1.087 m
;.>;.>;«<.;.;:;:;:;:;r-l- ...!i
I.....'..,
Dark brown to dark gray veryI ~5.00 soft to mediwn silt with little
clay, organic odor
7 ~-3.913 5.00
5 ~
8 f-Z2-7.00
Gray colour mediwn to stiff
1\sandy silt4 ~
"',"" I.~~~~~-2- ...!Q2."''''',
-10.913 12.00 '",,'''~
"""""""" 17 ~"""" ~'",,'''''''''''""""~~~~~rJ1- .122"",,""""""""" ....!1:Q~~~~~~~",,"",,,"'"~~~~~r--l2 ~"",,"
13.00Gray colour mediwn dense fine ",,""sand, little silt """"
~~~~~~ ~""""''''''''''''''''~~~~~~~r--!2 J.2J''''''''""""",,""
~~~~~~~~''''''''''''',''~~~~~~~...1Q I 22.5""''''"""".•..,.•...•..,,"~~~~~~~~-.B 124.0"".•..,,'""""""""-23.913 25.00 """" 20 25.0
Borehole CBH 14Location: Km 17+663
Subsoil Chart
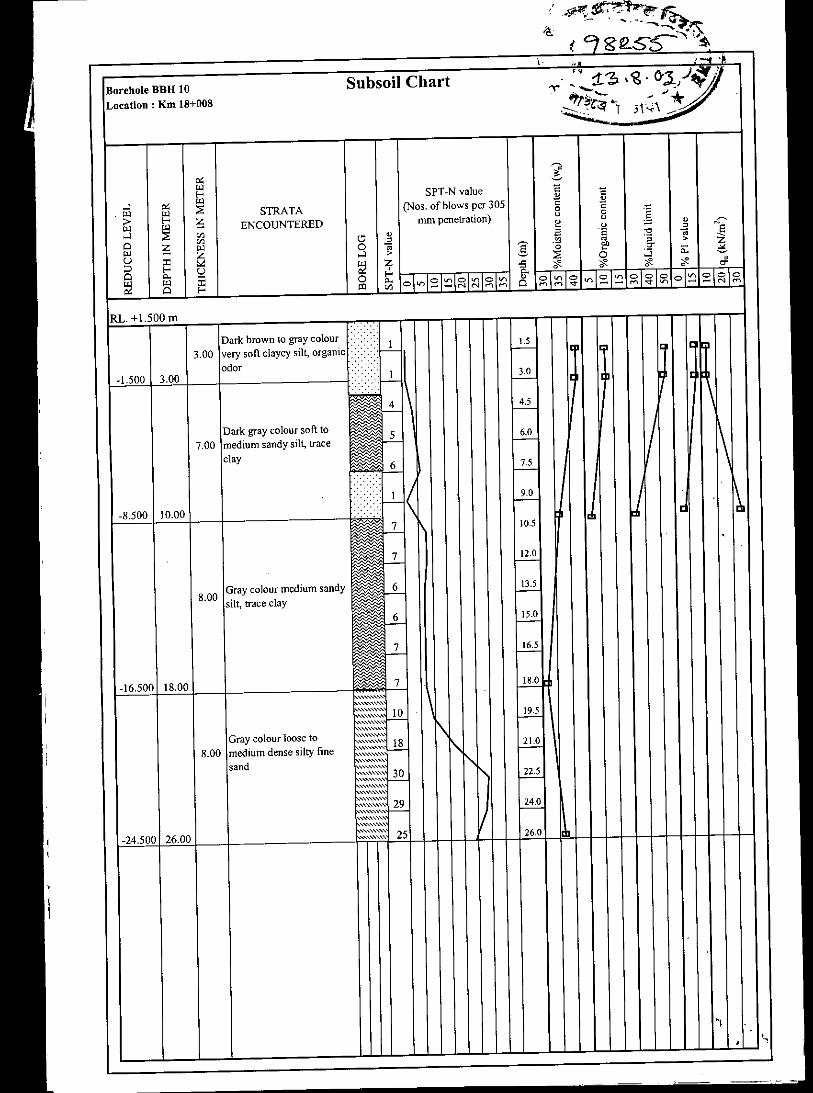
"I
Subsoil Chart
'" £oJ•... SPT-N value " "...l '"oJ ~:E (Nos. of blows per 305 '"oJ oJ STRATA 0 0
> •... is ENCOUNTERED mm penetration)u 0 ]
oJ oJ ~ u ~...l :E '" ~ iJ
.~ -aCl '" <:J 0 a
is oJ 0 ..• :g: .~ >oJ g
0 1!'u :I1
...l > :E 0 0:;0 •... u ~ ~ #- #-Cl c.. i~ oJ 0 c..
Cl •... co '"RL. +1.500m
Dark brown to gray colour 1.5
3.00 very soft clayey silt, organicodor
-1.500 3.003.0
4.5
Dark gray colour soft to 6.07.00 medium sandy silt, trace
clay 7.5
9.0
-8.500 10.0010.5
12.0
8.00Gray colour medium sandy 13.5
silt, trace clay15.0
16.5
-16.500 18.0018.0
",,''''''''''"",""""''',•••.. 10 19.5"'''''',,"'"''",,"'"
Gray colour loose to ""'" .••••••..
"''','' 18 21.0
8.00 medium dense silty fine "''''''"",,'"sand """'""",, .••••••..
,,"'''' 30 22.5"",'""""",,""'""",'" 29 24.0''''''''""'" .••••••..""".••••••..",,""
-24.500 26.00 '''''''' 25 26.0,,"''''
Borehole BBH 10Location: Km 18+008
Related Documents