Phylogeography of Scarabaeus (Pachysoma) Macleay (Scarabaeidae: Scarabaeinae). By Catherine Lynne Sole Submitted in partial fulfilment of the requirements for the degree Doctor of Philosophy (Entomology) in the Faculty of Natural and Agricultural Science Department of Zoology and Entomology University of Pretoria, Pretoria South Africa May 2005 University of Pretoria etd – Sole, C L (2005)

Welcome message from author
This document is posted to help you gain knowledge. Please leave a comment to let me know what you think about it! Share it to your friends and learn new things together.
Transcript

Phylogeography of Scarabaeus (Pachysoma) Macleay
(Scarabaeidae: Scarabaeinae).
By
Catherine Lynne Sole
Submitted in partial fulfilment of the requirements for the degree
Doctor of Philosophy
(Entomology)
in the Faculty of Natural and Agricultural Science
Department of Zoology and Entomology
University of Pretoria, Pretoria
South Africa
May 2005
UUnniivveerrssiittyy ooff PPrreettoorriiaa eettdd –– SSoollee,, CC LL ((22000055))

To David, Gillian, Michael and Ian with love……
“Do molecules and morphology give the same picture of the history of life, or two
or more distorted views of the same picture, or two quite different pictures?”
Patterson (1988)
UUnniivveerrssiittyy ooff PPrreettoorriiaa eettdd –– SSoollee,, CC LL ((22000055))

i
Phylogeography of Scarabaeus (Pachysoma) Macleay (Scarabaeidae:
Scarabaeinae).
Student: Catherine L. Sole1
Supervisors: Prof. Clarke H. Scholtz1 & Dr. Armanda D.S. Bastos1,2
Departments: 1Department of Zoology & Entomology, University of Pretoria, Pretoria,
0002, South Africa
2Mammal Research Institute (MRI), Department of Zoology & Entomology,
University of Pretoria, Pretoria, 0002, South Africa
Degree: Doctor of Philosophy (Entomology)
Abstract Scarabaeus (Pachysoma) consists of 13 flightless dung beetle species endemic to the arid
west coast of southern Africa. Scarabaeus (Pachysoma) are unique in their feeding and
foraging habits, in that they randomly search for dry dung/detritus which, when found, is
dragged forwards, and buried in a pre-constructed holding chamber, as opposed to the
convention of rolling it backwards. This action is repeated to provision the chamber after
which the nest is expanded to below the moisture line to allow the stored food to re-hydrate.
Poor vagility, taxonomic contention - seen in Scarabaeus taxonomy - and conservation
concern, made Scarabaeus (Pachysoma) an ideal group of beetles to study both the
phylogenetics and potential influences that anthropogenic and environmental changes have
had on structuring the species and populations thereof.
Both molecular and morphological data were used as individual datasets and
combined in a total evidence approach. Biogeographic inferences were made based on recent
detailed Namib biogeography and the ages of the species were estimated using the molecular
clock method. A phylogeographic study was done on three of the species of Scarabaeus
(Pachysoma) – S. (P.) hippocrates, S. (P.) gariepinus and S. (P.) denticollis - that had
previously shown south-north morphological clinal variation. Lastly, an attempt was made to
isolate microsatellite loci for Scarabaeus, in the hope of characterising genetic diversity
within and between populations of the same species.
Scarabaeus (Pachysoma) was found to be monophyletic within Scarabaeus and was
therefore classified as a derived subgenus thereof. Morphologically Scarabaeus (Pachysoma)
was shown to have 13 species while at a molecular level strong resolution for 11 of the 13
UUnniivveerrssiittyy ooff PPrreettoorriiaa eettdd –– SSoollee,, CC LL ((22000055))

ii
was obtained. S. (P.) hippocrates and S. (P.) glentoni formed a species complex the
hippocrates/glentoni complex. The combined phylogenetic tree showed good overall support
for all 13 species. Both the morphological and molecular data partition phylogenies show
congruence with the combined phylogeny, lending support for combining datasets.
Scarabaeus (Pachysoma) appears to have arisen 2.9 million years ago. The formation
of advective fog is a consistent water source for Desert dwelling organisms and appears to be
associated with Scarabaeus (Pachysoma) radiation into inhospitable areas. Analysis of gene
flow revealed large amounts of south-north movement, lending support for movement of
psammophilous taxa with their substratum, the barchan dune.
Population demographics of the three species, S. (P.) hippocrates, S. (P.) gariepinus
and S. (P.) denticollis, chosen for this study differed greatly except in areas of geographic
similarity. Major rivers appear to have acted as gene barriers, allowing for distinct genetic
entities to be identified within the three species. Phylogeographic partitioning was supported
by an AMOVA analysis. All three species were shown to have undergone historical
population expansion dating back to the Pleistocene era. Nested Clade Analysis indicated that
allopatric speciation; isolation by distance and continuous range expansion could be the
factors having affected overall population structure. Recent events show that human induced
factors, environmental barriers and reduced vagility have influenced the species population
structure.
Four potentially polymorphic loci were isolated for Scarabaeus using the FIASCO
protocol. Identification of at least one additional locus is needed in order to obtain statistical
significance for future studies directed at uncovering recent population dynamics.
Keywords: Scarabaeus, Cytochrome oxidase I, Morphology, Phylogeny, Combined,
Phylogeography, Namib Desert, Total Evidence, Microsatellites, Coleoptera
UUnniivveerrssiittyy ooff PPrreettoorriiaa eettdd –– SSoollee,, CC LL ((22000055))

iii
Acknowledgements
I would like to thank my parents, David and Gillian, for their unconditional support over the
last four and a half years. You never stopped believing in me, even though at some stages I
never believed completion of my PhD possible. My brother, Michael, thank you for all the
laughs and understanding, you brought a smile to my face when no other could. To my
husband, Ian, I thank you for your patience and tolerance. You stood by me when I needed it
most and never failed to amaze me with support and understanding.
I would like to thank my two supervisors, Clarke Scholtz and Armanda Bastos, for giving me
the opportunity of working with you both and for affording me the opportunity to work on
this phenomenal project and make it my own.
I would like to extend a special thanks to Wayne Delport, for his help with the microsatellites
and much of the population based analyses, without your guidance I was lost. Ute Kryger is
thanked for her help with analyses. Lindie Janse van Rensberg and Marié Warren are thanked
for the countless cups of tea and coffee over which many an informative discussion was had.
Paulette Bloomer is thanked for allowing me to complete laboratory work in her laboratory.
Carel Oosthuizen is thanked for all his help with the running of page gels and optimisation of
PCR’s.
Lastly I would like to thank Shaun Forgie, who mentored me over the first two years of this
project, you taught me much about dung beetle fauna and laboratory protocols. Vasily
Grebennikov and Claudia Medina are thanked for their advice, conversations and laughs.
Shaun, Vasily and Claudia came from all corners of the earth to South Africa to work on our
exceptional dung beetle fauna. Getting to know you made me a richer person in the ways of
others and for this I am grateful.
UUnniivveerrssiittyy ooff PPrreettoorriiaa eettdd –– SSoollee,, CC LL ((22000055))

iv
Disclaimer The present study is a continuation of a study done by James du Gueslin Harrison (1999), all
the morphological data was provided by him. Each of the chapters within this study, except
for Chapter 5, have been written up in paper format for different journals, hence the format
for each chapter may differ slightly.
UUnniivveerrssiittyy ooff PPrreettoorriiaa eettdd –– SSoollee,, CC LL ((22000055))

v
Table of contents Page Abstract ………………………………………………………………………… Acknowledgements …………………………………………………………….. Disclaimer………………………………………………………………………. Table of contents ……………………………………………………………….. Chapter 1: General Introduction ...…………………………………………….. Chapter 2: Phylogeography of the Namib Desert dung beetles Scarabaeus (Pachysoma) MacLeay (Coleoptera: Scarabaeidae)………………... Chapter 3: Testing for the congruence between morphological and molecular data partitions of Scarabaeus (Pachysoma) MacLeay (Scarabaeidae: Scarabaeinae)………………………………………. Chapter 4: Phylogeographic patterns of three species of Scarabaeus (Pachysoma) MacLeay (Scarabaeidae: Scarabaeinae) as inferred from gene genealogies and coalescent theory……….……………… Chapter 5: Isolation of Microsatellite markers from Scarabaeus (Pachysoma) MacLeay (Scarabaeidae: Scarabaeinae)…………………………….. Chapter 6: Conclusion …………………………………………………………. Appendix 1……………………………………………………………………… Appendix 2………………………………………………………………………
i - ii iii iv v 1 - 14 15 - 39 40 - 72 73 - 140 141 - 158 159 - 167 168 - 169 170 - 174
UUnniivveerrssiittyy ooff PPrreettoorriiaa eettdd –– SSoollee,, CC LL ((22000055))

1
Chapter I
___________________________________________________________________________
General Introduction:
Rationale for investigating the phylogeny and phylogeography of Scarabaeus
(Pachysoma) MacLeay (Scarabaeidae: Scarabaeinae).
Conservation Genetics, Pattern and Process
“The overarching aim of conservation biology is to protect biological diversity and the
processes that sustain it in the face of perturbations caused by human activity,” (Moritz,
2002). Challenges we face are therefore threefold, 1) our knowledge of pattern and process is
incomplete, 2) natural and anthropogenic change are bound to occur within a system and 3)
conflict between human societies and biological needs is inevitable and reconciliation will
only be achieved through trade-offs and priority setting (Moritz, 2002).
Conservation biology is therefore aptly described as a “crisis discipline.” The
magnitude of this crisis is evident by the large number of species being endangered or facing
extinction. Presently 713 species are categorised as extinct/extinct in the wild, 5483 species
are classified as critically endangered, endangered or vulnerable and 12,716 species as lower
risk/conservation dependent, near threatened, data deficient and least concern (according to
IUCN redlist of Threatened Status Category (2005): Summary for all Classes and Orders:
www.redlist.org). In an attempt to prevent crisis management we need to understand the
patterns and processes that conservation biology aims to describe by including detailed and
comprehensive studies of organisms to date (DeSalle & Amato, 2004). The idea, therefore, is
that conservation genetics aims at creating an accurate picture of pattern and process in the
endangered species.
Conservation biology thus far is expanding to incorporate many disciplines, which
allow for conservation biologists to more effectively address critical problems regarding the
management of endangered species and critical areas. Genetic information not only allows
for many conservation decisions to be placed in context but also adds unprecedented
precision and understanding to decision making (DeSalle & Amato, 2004).
The integration of demographic factors (biology of population growth and life
history) and genetic approaches often allow for strong inferences to be made regarding
conservation biology. Conservation genetics allows for the quantification of processes, such
as inbreeding depression, effective population size, minimum viable population size, levels of
genetic variation and gene flow, that may all affect endangered populations. Conservation
UUnniivveerrssiittyy ooff PPrreettoorriiaa eettdd –– SSoollee,, CC LL ((22000055))

2
decisions often rely on the designation of species boundaries, which in itself is a contentious
issue in both systematic and evolutionary biology. The delineation of conservation units -
environmentally significant units (ESU’s) and management units (MU’s) (Moritz, 1994a & b)
may help designate conservation priorities and are thought to be of paramount importance
while other units such as semi-species, incipient species and subspecies are thought to be of
lesser concern due to high levels of confusion surrounding their definitions. The challenge in
conservation genetics is to firstly integrate the genetic data with both biological and non-
biological data and secondly to use the results obtained from these studies in the
implementation of a successful conservation decision in the context of social, cultural and
political issues.
Phylogeography, Molecules and Morphology
Phylogeography is the study of genes and geography. By overlaying molecules and
geographic data over time and space, historical inferences about evolutionary processes at the
population level can be inferred (Avise, 2000). Inferences include the restriction of gene flow
by geographical and historical barriers, colonisation success of some lineages and the effects
of population bottlenecks (Diniz-Filho et al., 1999).
Phylogeography, by revealing divergent evolutionary lineages often overlooked by
traditional taxonomy and by identifying biotic processes, can help direct conservation biology
(DeSalle & Amato, 2004). A crisis discipline often sees periods of expansion for tools used to
solve problems that the crises pose. Proliferation of the technologies for genomics,
systematics and population biology over the past decade has been a key factor for the
integration of genetics into conservation biology (DeSalle & Amato, 2004).
DNA sequence data from the mitochondrial genome are being increasingly used to
estimate phylogenetic relationships between taxa. The use of DNA sequence data provides an
empirical means of understanding the processes governing the evolution and inheritance of
DNA. Mitochondrial genes are chosen for study as they are easy to manipulate, clonally
inherited, single copy, non recombining and abundant (Simon et al., 1994). Accurate
estimates of species limits are imperative for biodiversity assessments especially in areas of
endemism. Species are the basic units of biodiversity on which evolutionary biology focuses
(Puorto et al., 2001). Given the fact that morphology and molecules evolve at different rates,
these characters within the same taxa will have been exposed to similar vicariant
biogeography as well as climatic changes and will therefore exhibit similar histories.
UUnniivveerrssiittyy ooff PPrreettoorriiaa eettdd –– SSoollee,, CC LL ((22000055))

3
The overall availability of the number and diversity of characters is increasing at a
remarkable rate in phylogenetic studies. How, therefore, to successfully integrate molecular
and morphological data is one of the challenges of phylogenetics today. Different data sets
often exhibit similar topologies with differences restricted to the positions of a few taxa, so
may tell us different stories (Baum, 1992; Marshall, 1992). Three approaches have been
suggested when combining datasets: (1) separate analysis, where trees are estimated
separately from each partition, and the different estimates compared using taxonomic
congruence (Miyamoto & Fitch, 1995); (2) the total evidence approach, whereby all available
data are combined in a simultaneous analysis (Kluge, 1989); and (3) conditional data
combination, whereby only homogenous data partitions (estimated by a statistical test of
homogeneity) are combined in a simultaneous analysis (Bull et al., 1993; de Queiroz et al.,
1995). It is desirable to know, when combining data sets, how each data partition contributes
to the final tree topology. This can be achieved by comparing the overall tree topology with
the individual trees of each data partition (Creer et al., 2003).
Inferences in evolutionary history are often based on the determination of genetic
relatedness among individuals and the extent of the differences between them. The patterns of
relatedness are often a result of processes occurring over two time scales: evolutionary time
that encompasses broad-scale changes in prevailing environmental conditions, and ecological
time over which population processes (e.g. migration, local extinction and colonisation) occur
(Martin & Simon, 1990). Evolutionary biology, therefore, aims to unravel these interactions
and assess the importance of short- and long- term processes. Understanding of evolutionary
processes can be brought about by the study of closely related taxa representing a spectrum of
divergence levels (Martin & Simon, 1990).
Genetic structure of a population is generally a result of both biogeographical factors
and ongoing ecological and demographic processes (Carisio et al., 2004). Our understanding
of species formation from an evolutionary paradigm is based on the foundation of population
level comparisons. By examining the variation among populations, their historical
associations and the processes of genetic restructuring, what may have lead to speciation can
often be revealed (Wright, 1931).
Scarabaeus (Pachysoma) MacLeay (1821)
Dung beetles are probably the first insects to be considered divine. In ancient Egypt the
beetles were worshiped in the form of the solar deity, Khepera who controlled the sun’s daily
path across the sky, where the beetle represents the sun god ‘Ra’ and the ball the sun moving
UUnniivveerrssiittyy ooff PPrreettoorriiaa eettdd –– SSoollee,, CC LL ((22000055))

4
across the sky (Forgie, 2003). The rolling of the dung ball is one of the methods used by dung
beetles to move and process dung. Dung represents a patchy, ephemeral and limited food
source. These characteristics would have been the most probable factors allowing for the
diversity in morphology, behaviour and ecology presently seen. Although many species form
balls and roll them backwards with their hind limbs exceptions to this exist in that some
species drag preformed dung pellets/detritus forward (Scholtz, 1989; Philips et al., 2002)
while others may carry dung pellets with their front legs and sometimes heads (Halffter &
Matthews, 1966; Zunino et al., 1989; Philips et al., 2002).
Scarabaeus (Pachysoma) is a subgenus of the Scarabaeini (Scarabaeidae:
Scarabaeinae), a tribe whose members are found in moist savanna through to drier regions
including very hot dry deserts (Scholtz, 1989) of the Afrotropics and southern latitudes of the
Palaearctic. Scarabaeines predominantly feed on dung, but have also been known to feed on
humus, carrion and fungi (Scholtz & Chown, 1995). Scarabaeini are one of 12 tribes in the
Scarabaeinae that are differentiated in part by behavioural trichotomy between those that
breed inside the dung pad (endocoprids), those that bury the dung in preformed burrows at
the food source (paracoprids), and those that remove the dung and bury it some distance from
the food source (telecoprids) (Balthasar, 1963; Halffter & Edmonds, 1982; Scholtz & Holm,
1985; Hanski & Cambefort, 1991).
Members of Scarabaeus (Pachysoma) are flightless and have feeding and foraging
adaptations that are unique within the Scarabaeinae (Scholtz, 1989). Scarabaeus
(Pachysoma) is an exception to the conventional backward dung ball rolling of the
Scarabaeini. The beetles randomly move in search of dry dung pellets or plant matter
(detritus) which, when found, is gathered up and held in the long comb-like setae on the hind
limbs and dragged forwards to be buried in a preconstructed holding chamber (Scholtz, 1989;
Harrison, 1999). This is repeated to provision the holding chamber. The nest is then expanded
to below the moisture line (Scholtz, 1989). Moisture from the surrounding soil re-hydrates
the stored food supply making it suitable for consumption.
The Namaqualand and the Namib Desert
Scarabaeus (Pachysoma) distribution extends from just north of Cape Town, in South Africa,
to Walvis Bay, in Namibia and encompasses three distinct biomes. The southern tip
comprises the western extreme of the fynbos biome, the area up to the Orange River is
geographically considered to be Namaqualand and the section north of the Orange River to
Mossamedes in Angola is considered Namib Desert (van Zinderen Bakker, 1975; Rutherford
UUnniivveerrssiittyy ooff PPrreettoorriiaa eettdd –– SSoollee,, CC LL ((22000055))

5
& Westfall, 1994; Pickford & Senut, 1999). Widespread aridity on the west coast of Africa is
related to the up welling of cold surface water, the Benguela Current, and the continental rain
shadow – rain originates from moist air blown in from the Indian Ocean, east coast. Aridity
becomes more intense as one moves northward, culminating in the Namib Desert (Tankard &
Rogers, 1978). Rainfall is minimal but constant moisture is available to the fauna and flora
through the formation of coastal fog banks, which are wind blown up to 50km inland (Logon,
1960; Seely & Louw, 1980). Presently the Namib Desert is one of the driest parts of the
African continent and from a taxonomic point of view one of the richest deserts in the world
(van Zinderen Bakker, 1975). The evolutionary processes resulting in the great number of
endemic taxa points to a great age of the Namib with an undisturbed climatic history (van
Zinderen Bakker, 1975). However some physical, chemical and biological attributes suggest
that the aridity is youthful, developing progressively since the Miocene (Tankard & Rogers,
1978), indicating that relatively rapid radiation has occurred in most taxa found in this area.
Adaptations to the desert and flightlessness
The evolution of flight is thought to have contributed to the diversity and evolutionary
success of insects. Flight allows for certain benefits including dispersal, the successful
searching for mates, food and habitats (Roff, 1990, Scholtz, 2000). Contrary to these benefits
certain species have secondarily become flightless (Scholtz, 2000). Some of the factors said
to influence flightlessness are habitat persistence or environmental heterogeneity, geographic
variables, alternative modes of migration and taxonomic variation (Roff, 1990).
Deserts are thought to pose considerable constraints on organisms occurring there.
Many morphological, behavioural and physiological adaptations exist within desert animals
permitting them to survive under harsh conditions. For all desert arthropods living in arid
environments life is complicated by being small and having a relatively large surface area,
which in turn leads to rapid exchange of heat and water with the surrounding area (Nicolson,
1990).
A possible physiological advantage of wing loss is that it allows an insect to divert
energy associated with the wing and wing muscle development to some other use such as
increased fecundity. Wing muscles are relatively massive structures within insects
comprising 10 – 20% of the body mass of most insects (Roff, 1990). It has been shown that
many insects histolyse their wing muscles during egg production, leading us to believe that
this is a means to increase egg/sperm/offspring production, thereby increasing their overall
fecundity (Roff, 1990).
UUnniivveerrssiittyy ooff PPrreettoorriiaa eettdd –– SSoollee,, CC LL ((22000055))

6
Morphologically, flightlessness is associated with a secure joining of the elytra along
the midline. The fusion of the elytra creates a hermetically sealed chamber called the
subelytral cavity (Byrne & Duncan, 2003). This fusion of the elytra is thought to be a
modification to prevent water loss through evaporation (Chown et al., 1998; Scholtz, 2000).
Many desert beetles have a subelytral cavity with representatives being found in tenebrionids,
carabids and scarabs (Byrne & Duncan, 2003). Flightless beetles have been shown to exhibit
unidirectional tidal airflow (forward airflow, i.e. airflow from the posterior to the anterior
body) as opposed to the previously thought convention of respiratory airflow moving from
the anterior to posterior of the body (Duncan, 2003). The combination of tidal airflow and a
subelytral cavity has allowed for arid-dwelling beetles to reduce water loss by releasing
respiratory CO2 via a single mesothoracic spiracle into the atmosphere (Byrne & Duncan,
2003). In this way water loss is, therefore, confined to a small area of the total respiratory
system, with beetles losing up to 4% total water as opposed to 74% if all the spiracles were
exposed to the atmosphere (Duncan, 2002; Duncan, 2003).
The species of Scarabaeus (Pachysoma) feed on dry rodent or herbivore pellets
and/or detritus. Due to the dryness in the desert, rates of decay are slowed down considerably
so insects feeding on detritus, carcasses or the persistent parts of desert plants have their food
sources persist for long periods of time (Roff, 1990; Scholtz, 2000). Scarabaeus (Pachysoma)
beetles drag the dry dung or detritus to below the moisture line allowing for re-hydration
(Scholtz, 1989). Most beetles do not take advantage of the hygroscopic water absorption by
detritus as they feed only during the day, in which the detritus has only 2% water content. If
the beetles were to feed on the detritus when the fog was present they could be consuming
detritus containing 60% water (Nicolson, 1990). This could be one of two reasons for
Scarabaeus (Pachysoma) beetles dragging the dry dung or detritus to below the moisture line
prior to feeding on it. Another reason for feeding below the moisture line could be that they
are dependent on micro-organisms such as fungi and bacteria in the dry dung or detritus for
food but these need moisture for development (Scholtz pers. comm.).
Systematic concerns
The diversity we see today and the uniqueness of its components is one of the more
remarkable aspects of life. No two individuals in a sexually reproducing population are the
same, nor are any two populations, species or higher taxa. According to Mayr & Ashlock
(1991), ‘Taxonomy is the theory and practise of classifying organisms’ and much, if not all,
biological research is based on a sound phylogeny. Taxonomy s.l. serves not only to identify
UUnniivveerrssiittyy ooff PPrreettoorriiaa eettdd –– SSoollee,, CC LL ((22000055))
7
and classify organisms but also allows for the comparative study of organisms as well as the
role of lower and higher taxa in nature and evolutionary history (Mayr & Ashlock, 1991).
Delimiting a species is important for understanding many evolutionary mechanisms and
processes. Species are also used as the fundamental units of analysis in biogeography,
ecology, macroevolution and conservation biology (Sites & Marshall, 2003). Two goals for
systematic studies are to: 1) discover monophyletic groups at higher levels and 2) discover
lineages (i.e. species) at lower levels (Sites & Marshall, 2003). A good phylogeny is therefore
of paramount importance if good phylogeographic and population studies are to follow.
The genus Pachysoma was first described by MacLeay (1821). Pachysoma was
defined by aptery, absence of humeral calli, semi-contiguous mesocoxae and short
mesosterna (Ferreira, 1953). An evaluation by Holm & Scholtz (1979) concluded that these
characteristics were either due to convergence or were too variable and inconsistent to use as
the justification for a genus. In spite of this its generic status was maintained. The genus was
later synonomised with Scarabaeus Linnaeus, 1758 by Mostert & Holm (1982). Endrödy-
Younga (1989) and Scholtz (1989) questioned the synonymy of Pachysoma with Scarabaeus
as the former have a unique set of morphological and behavioural apomorphies including
unique feeding and foraging biology, a rounded body shape due to flightlessness and are
restricted to the south-west coast of Africa. In a recent phylogenetic analysis of Scarabaeus
(Pachysoma) by Harrison & Philips (2003) Pachysoma s.l forms a distinct clade within
Scarabaeus and is therefore considered a subgenus thereof.
Relevance of this study
Habitat destruction and or deterioration are arguably the greatest threats to insect diversity
(Samways, 1994). Scarabaeus (Pachysoma) occurs in the Succulent Karoo, Fynbos and
Desert biomes (Rutherford & Westfall, 1994). Within this large range the species exhibit
discontinuous distribution owing to their low vagility. Their distribution therefore consists of
pockets of isolated populations some of which are threatened by the removal of the natural
vegetation for large scale wheat farming in the south-western Cape, commercial development
on the West Coast for holiday and recreational purposes e.g. Lambert’s Bay and
Strandfontein, mining for diamonds and other minerals and by exotic plant invaders e.g. Port
Jackson (Acacia saligna) and Rooikrans (Acacia cyclops), modifying dune systems.
Furthermore, some of the species are potentially threatened through their collection and sale
to collectors (Harrison, 1999). Therefore, knowledge of their habitat requirements, taxonomy,
UUnniivveerrssiittyy ooff PPrreettoorriiaa eettdd –– SSoollee,, CC LL ((22000055))

8
behaviour and distribution is of vital importance for the initiation of conservation strategies to
ensure their survival.
Key Questions of this thesis:
Given the background above the objectives and key questions of the present study were: Chapter 2 - Phylogeography of the Namib Desert dung beetles Scarabaeus (Pachysoma)
MacLeay (Coleoptera: Scarabaeidae).
Key Questions
Q1. To resolve the relationships of the 13 species of Scarabaeus (Pachysoma) based
on mitochondrial cytochrome oxidase I.
Q2. To estimate the divergence times and ages of the species within Scarabaeus
(Pachysoma) and to relate these to past geological and climatic events
Chapter 3 - Testing for congruence between morphological and molecular characters of
Scarabaeus (Pachysoma) MacLeay (Coleoptera: Scarabaeidae).
Key questions:
Q1. To resolve the phylogenetic relationships between the 13 species of S.
(Pachysoma) using Parsimony and other methods based on both morphological and
molecular data partitions.
Q2. To test for monophyly of Scarabaeus (Pachysoma) within Scarabaeus
Q3. To test whether there is congruence between the morphological and molecular
datasets using the total evidence approach.
Chapter 4 - Phylogeographic patterns of Scarabaeus (Pachysoma) (Coleoptera:
Scarabaeidae) inferred from gene genealogies and coalescent theory.
Key Questions
Q1. To what degree has geographic isolation led to the genetic restructuring between
populations of the same species.
Q2. What is the extent of gene flow between populations of the same species and does
it correlate with patterns of geographic proximity?
Q3. Where geographically did Scarabaeus (Pachysoma) originate and how are the
populations of each species related to one another?
Q4 What are the effective/actual population sizes of the species in question?
UUnniivveerrssiittyy ooff PPrreettoorriiaa eettdd –– SSoollee,, CC LL ((22000055))

9
Chapter 5 – Isolation of microsatellite markers from Scarabaeus (Pachysoma) MacLeay
(Scarabaeidae: Scarabaeinae).
Key Questions
Q1. To successfully optimise the FIASCO enrichment protocol for the genus
Scarabaeus.
Q2. To design at least five polymorphic microsatellite loci for the genus Scarabaeus.
Chapter 6 – Concluding comments
Based on the key questions above the essence of this project was three-fold. It was:
firstly, to resolve the phylogenetic relationships between the 13 species of Scarabaeus
(Pachysoma); secondly, to elucidate phylogeographic patterns of the species through
inferences from historical population dynamics; and lastly to identify and delineate
genetically meaningful conservation units, environmentally significant units (ESU’s) and
management units (MU’s) (Moritz, 1994a & b) within the different species. This information
would be useful for developing sound conservation management recommendations, as they
would be based on a good phylogeny with both strong molecular and morphological
inferences as well as ecological data.
Thesis outline
Each of the chapters of this thesis has been compiled as a separate paper for publication
purposes. Chapter 2 has been published in the Journal of Biogeography and is formatted for
the journal. Chapter 3 has been submitted to Molecular Ecology. Chapter 3 and all the other
chapters were formatted for Molecular Ecology. Chapter 4 comprises three sub-chapters
based on the three species identified for population analysis. At the start of chapter 4 there is
a general introduction and methods used for each species, each sub-chapter has a short
introduction, results and discussion. Each chapter contains its own set of references and all
appendices can be found at the end of the thesis. Both the general introduction and conclusion
are tailored from the respective chapters, which give an overview of what to expect within the
thesis and what conclusions were drawn.
UUnniivveerrssiittyy ooff PPrreettoorriiaa eettdd –– SSoollee,, CC LL ((22000055))

10
References
Avise JC (2000) Phylogeography: The history and formation of species. Cambridge,
Massachusetts, London, England : Harvard University Press.
Balthasar V (1963) Monographie der Scarabaeidae und Aphodiidae der Palaearktischen und
Orientalischen Region (Coleoptera: Lamellicornia), vols 1-3. Verlag der
Tschechoslowakischen Akademie der Wissenschaft, Prague.
Baum BR (1992) Combining trees as a way of combining data sets for phylogenetic
inference, and the desirability of combining gene trees. Taxon, 41, 3-10.
Bull JJ, Huelsenbeck JP, Cunnigham CW, Swofford DL, Waddell PJ (1993) Partitioning and
combining data in phylogenetic analysis. Systematic Biology, 42, 384-397.
Byrne MJ, Duncan FD (2003) The role of the subelytral spiracles in respiration in the
flightless dung beetle Circellium bacchus. The Journal of Experimental Biology, 206,
1309-1318.
Carisio L, Cervalla P, Palestrini C, DelPero M, Rolando A (2004) Biogeographical patterns
of genetic differentiation in dung beetles of the genus Trypocopris (Coleoptera,
Geotrupidae) inferred from mtDNA and AFLP analysis. Journal of Biogeography,
31, 1149-1162.
Chown SL, Pistorius P, Scholtz CH (1998) Morphological correlates of flightlessness in
southern African Scarabaeinae (Coleoptera: Scarabaeidae): testing a condition of the
water conservation hypothesis. Canadian Journal of Zoology, 76, 1123-1133.
Creer S, Malhotra A, Thorpe RS (2003) Assessing the phylogenetic utility of four
mitochondrial genes and a nuclear intron in the Asian pit viper genus Trimeresurus:
separate, simultaneous and conditional data combination analyses. Molecular Biology
and Evolution, 20, 1240-1251.
De Queiroz A, Donoghue MJ, Kim J (1995) Separate versus combined analysis of
phylogenetic evidence. Annual Review of Ecological Systematics, 26, 657-681.
DeSalle R, Amato G (2004) The expansion of conservation genetics. Genetics Reviews, 5,
702-712.
UUnniivveerrssiittyy ooff PPrreettoorriiaa eettdd –– SSoollee,, CC LL ((22000055))

11
Diniz-Filho JAF, Fuchs S, Arias MC (1999) Phylogeographical autocorrelation of phenotypic
evolution in honeybees (Apis mellifera L.). Heredity, 83, 671-680.
Duncan FD (2002) The role of the subelytral cavity in the flightless dung beetle, Circellium
bacchus (F). European Journal of Entomology, 99, 253-258.
Duncan FD (2003) The role of the subelytral cavity in respiration in a tenebrionid beetle,
Onymacris multistriata (Tenebrionidae: Adesmiini). Journal of Insect Physiology, 49,
339-346.
Endrödy-Younga S (1989) The evolution of alternative life styles in Coleoptera. In:
Alternative Life-History Styles of Animals (ed. Bruton MN), pp. 317-327. The
Netherlands, Dordrecht, Kluwer Academic Publishers.
Ferreira MC (1953) Monografia dos Escarabaeídeos da África do Sul. Tribo-Scarabaeini. I
Parte Sub-tribo Pachysomides. Boletím da Sociedade de Estudos da Província de
Moçambique, 23, 1-85.
Forgie SA (2003) Phylogeny of the Scarabaeini (Coleoptera: Scarabaeidae). PhD Thesis,
University of Pretoria.
Halffter G, Matthews EG (1966) The natural history of dung beetles of the subfamily
Scarabaeinae (Coleoptera, Scarabaeidae). Folia Entomologica Mexicana, 12-14, 1-312.
Halffter G, Edmonds WD (1982) The nesting behaviour of dung beetles (Scarabaeinae): An
Ecological and Evolutive approach. Instituto De Ecología, México, D.F. Publication,
10, 1-176.
Hanski I, Cambefort Y (1991) Dung Beetle Ecology. New Jersey, Princeton University Press.
Harrison JduG (1999) Systematics of the endemic south-west African dung beetle genus
Pachysoma MacLeay (Scarabaeidae: Scarabaeinae). MSc Thesis, University of
Pretoria.
Harrison JduG, Philips TK (2003) Phylogeny of Scarabaeus (Pachysoma MacLeay) stat.
nov., and related flightless Scarabaeini (Scarabaeidae: Scarabaeinae). Annals of the
Transvaal Museum, 40, 47-71.
UUnniivveerrssiittyy ooff PPrreettoorriiaa eettdd –– SSoollee,, CC LL ((22000055))
12
Holm E, Scholtz CH (1979) A revision of the genus Pachysoma M'Leay with an evaluation
of the subtribe Pachysomina Ferreira and its genera (Coleoptera: Scarabaeidae).
Journal of the Entomological Society of South Africa, 42, 225-244.
Kluge AG (1989) A concern for evidence and a phylogenetic hypothesis of relationships
among Epicrates (Boidae, Serpentes). Systematic Zoology, 38, 7-25.
Linnaeus C (1758) Systema naturae per regna tria naturae, secundum classes, ordines,
genera, species, cum characteribus, differentiis, synonimus, locis. Ed. Decima,
reformata, vol 1. L. Salvii. Holmiae, 824 + iii p.
Logon RF (1960) The central Namib Desert, South West Africa. Publications of the National
Academy of Science, 758, 1-141.
MacLeay WS (1821) Horae Entomologicae: or essays on The Annulose Animals, Vol 1(2)
(London Bagster), 524pp + 3 pls.
Marshall CR (1992) Character analysis and the intergration of molecular and morphological
data in an understanding of Sand Dollar phylogeny. Molecular Biology and
Evolution, 9, 309-322.
Martin A, Simon C (1990) Differing levels of among- population divergence in the
mitochondrial DNA of periodical cicadas related to historical biogeography.
Evolution, 44, 1066-1080.
Mayr E, Ashlock PD (1991) Principles of Systematic Zoology. McGraw Hill, Incorporated.
Miyamoto MM, Fitch WM (1995) Testing species phylogenies and phylogenetic methods
with congruence. Systematic Biology, 44, 64-76.
Moritz C (1994a) Applications of mitochondrial DNA analysis in conservation: a critical
review. Molecular Ecology, 3, 401-411.
Moritz C (1994b) Defining evolutionary significant units for conservation. Trends in
Ecology and Evolution, 9, 373-375.
Moritz C (2002) Strategies to protect biological diversity and the evolutionary processes that
sustain it. Systematic Biology, 51, 238-254.
UUnniivveerrssiittyy ooff PPrreettoorriiaa eettdd –– SSoollee,, CC LL ((22000055))

13
Mostert LE, Holm E (1982) Notes on flightless Scarabaeina (Coleoptera: Scarabaeidae) with
a description of a new species. Cimbebasia, 5, 274-284.
Nicolson S (1990) Water relations of the Namib Tenebrionid beetles. In: Namib Ecology: 25
years of Namib Research (ed. Seely MK), pp. 173-178. Transvaal Museum
Monograph No. 7. Transvaal Museum, Pretoria.
Philips TK, Scholtz CH, Ocampo FC (2002) A phylogenetic analysis of the Eucraniini
(Coleoptera: Scarabaeidae: Scarabaeinae). Insect Systematics and Evolution, 33, 241-
252.
Pickford M, Senut B (1999) Geology and Palaeobiology of the central and southern Namib
Desert, southwestern Africa. Memoir, 18, 1-155.
Puorto G, Da Graça Salomão M, Theakston RDG, Thorpe RS, Warrell DA, Wüster W (2001)
Combining mitochondrial DNA sequences and morphological data to infer species
boundaries: phylogeography of lanceheaded pitvipers in the Brazilian Atlantic forest,
and the status of Bothrops pradoi (Squamata: Serpentes: Viperidae). Journal of
Evolutionary Biology, 14, 527-538.
Roff DA (1990) The evolution of flightlessness in insects. Ecological Monographs, 60, 389-
421.
Rutherford MC, Westfall RH (1994) Biomes of southern Africa: an objective categorization.
Memoirs of the Botanical survey of South Africa, 63, 415-425.
Samways MJ (1994) Insect Conservation Biology. Chapman & Hall, London.
Scholtz CH (1981) Aptery in Trox (Coleoptera: Trogidae): morphological changes and their
relationships to habitat. Journal of the Entomological Society of South Africa, 44, 83-
87.
Scholtz CH (1989) Unique foraging behaviour in Pachysoma (=Scarabaeus) striatum
Castelnau (Coleoptera: Scarabaeidae): an adaptation to arid conditions? Journal of
Arid Environments, 16, 305-313.
UUnniivveerrssiittyy ooff PPrreettoorriiaa eettdd –– SSoollee,, CC LL ((22000055))

14
Scholtz C H (2000) Evolution of flightlessness in Scarabaeoidea (Insecta, Coleoptera).
Mitteilungen aus dem Museum füer Naturkunde Berlin, Deutsche Entomologische
Zeitschrift, 47, 5-28.
Scholtz CH, Holm E (1985) Insects of Southern Africa. Butterworths, Professional Publishers
(Pty) Ltd.
Scholtz CH, Chown SL (1995) The evolution of habitat use and diet in the Scarabaeoidea: A
phylogenetic approach. In: Biology, Phylogeny and Classification of Coleoptera:
Papers celebrating the 80th birthday of Roy A. Crowson (eds. Pakaluk J, Slipinski
SA), pp.354-374. Museum I Instytut Zoologii PAN, Warszawa.
Seely MK, Louw GN (1980) First approximation of the effects of rainfall on the ecology and
energetics of a Namib Desert dune ecosystem. Journal of Arid Environments, 3, 23-
54.
Seely MK (eds) (1990) Namib Ecology 25 years of Namib Research. Transvaal Museum
Monograph No. 7, Transvaal Museum, Pretoria.
Simon C, Frati F, Benckenbach A, Crespi B, Liu H, Flook P (1994) Evolution, weighting,
and phylogenetic utility of mitochondrial gene sequences and a compilation of
conserved polymerase chain reaction primers. Annals of the Entomological Society
of America, 87, 652-701.
Sites J, Marshall JC (2003) Delimiting species: a renaissance issue in systematic biology.
Trends in Ecology and Evolution, 18, 462-471.
Tankard AJ, Rogers J (1978) Late Cenozoic palaeoenvironments on the west coast of
southern Africa. Journal of Biogeography, 5, 319-337.
Van Zinderen Bakker EM (1975) The origin and palaeoenvironment of the Namib Desert
biome. Journal of Biogeography, 2, 65-73.
Wright S (1931) Evolution in mendelian populations. Genetics, 16, 97-159.
Zunino M, Barbero E, Luzzatto M (1989) Food relocation behaviour in Eucraniina beetles
and the constraints of xeric environment. Tropical Zoology, 2, 235-240.
UUnniivveerrssiittyy ooff PPrreettoorriiaa eettdd –– SSoollee,, CC LL ((22000055))

15
Journal of Biogeography, 2005, 32, 75-84
Chapter II
________________________________________________________________________
Phylogeography of the Namib Desert dung beetles Scarabaeus (Pachysoma) MacLeay
(Coleoptera: Scarabaeidae)
Catherine L. Sole1, Clarke H. Scholtz1 and Armanda D. S. Bastos1, 2
1 Department of Zoology & Entomology, University of Pretoria, Pretoria, 0002, South Africa 2 Mammal Research Institute (MRI), Department of Zoology & Entomology, University of Pretoria, Pretoria, 0002,
South Africa
UUnniivveerrssiittyy ooff PPrreettoorriiaa eettdd –– SSoollee,, CC LL ((22000055))

16
Abstract
Aim Namib Biogeography in many instances remains reliant on advanced and detailed systematic studies.
This study attempts to combine molecular phylogenetic data, geology and palaeo-climatic data to, firstly,
resolve the relationships of the 13 morphological species of Scarabaeus (Pachysoma) and, secondly, to
relate their evolution to past climatic and geological events.
Location South Africa and Namibia
Methods Sequencing of an 1197 bp segment of the mitochondrial cytochrome oxidase I (COI) gene of the
13 species within Scarabaeus (Pachysoma) was undertaken. Analyses performed included Parsimony and
Maximum Likelihood as well as imposing a molecular clock.
Results The molecular phylogeny showed strong support for 11 of the 13 morphological species. The
remaining two species, S. (P.) glentoni and S. (P.) hippocrates, formed a complex and could not be
assigned specific status on the basis of the COI gene phylogeny. Strong support for the three species
formerly classified within the genus Neopachysoma was consistently obtained. The subgenus appears to
have arisen approximately 2.9 million years ago. Species within the subgenus arose at different times, with
the common ancestor to Neopachysoma and the hippocrates complex having evolved 2.65 and 2.4 million
years ago respectively. S. (P.) denticollis, S. (P.) rotundigenus, S. (P.) rodriguesi and S. (P.) schinzi are
some of the youngest species having diverged between 2 million and 600 000 years ago.
Main conclusions Scarabaeus (Pachysoma) is a derived monophyletic clade within the Scarabaeini. The
subgenus appears to be young in comparison with the age of the Namib Desert, which dates back to the
Miocene (ca 15 Ma). The psammophilous taxa are shown to disperse with their substratum and habitat,
barchan dunes. Clear south/north evolutionary gradients can be seen within the species of this subgenus,
which are consistent with the unidirectional wind regime. Species with a suite of mostly plesiomorphic
characters have a southerly distribution while their derived psammophilous relatives have central to
northern Namib distributions. Major rivers such as the Orange, Buffels and Holgat appear to be gene
barriers to certain species as well as areas of origin of speciation events.
Keywords Coleoptera, Scarabaeidae, Scarabaeus (Pachysoma), Aptery, Endemic, Namib Desert,
Biogeography, Phylogeny, Mitochondrial DNA, Cytochrome Oxidase I (COI).
UUnniivveerrssiittyy ooff PPrreettoorriiaa eettdd –– SSoollee,, CC LL ((22000055))

17
Introduction
Scarabaeus (Pachysoma) MacLeay (1821) represents a group of 13 atypical flightless dung
beetle species belonging to the ball-rolling Scarabaeini (Scarabaeidae: Scarabaeinae) that are
distributed along the west coast of southern Africa from Cape Town in South Africa (S33°56’-
E18°28’) to the Kuiseb River (S22°58’-E14°30’) in Namibia (Harrison et al., 2003). Individual
species, however, usually have very restricted distributions. Flightlessness has resulted in
atypical morphology in these species such as the absence of humeral calli, semi-contiguous
mesocoxae and short mesosterna (Harrison et al., 2003). Their biology is also highly unusual as
they feed on dry herbivore dung pellets and detritus that they drag forwards (Scholtz, 1989)
whereas their Scarabaeus relatives form balls from wet herbivore dung, which they roll
backwards. Their dung-burial activity also differs from other ball-rolling dung beetles.
Scarabaeus (Pachysoma) first locate food, dig a burrow, then forage repeatedly using polarized
light for orientation (Dacke et al., 2002), until they have collected sufficient dung fragments or
bits of detritus. Related rollers locate dung, form a ball at the source and roll it away to be buried
in a suitable place. Pachysoma species are restricted to sandy coastal habitats whereas
Scarabaeus species have a much wider habitat tolerance (Harrison & Philips, 2003). These
morphological and biological differences have led to contention about Pachysoma/Scarabaeus
taxonomy over the years. Pachysoma has been treated as a separate genus (Ferreira, 1953), as a
synonym of Scarabaeus (Mostert & Holm, 1982) and more recently, as a result of a morphology
based phylogenetic analysis of the tribe Scarabaeini, it has been accorded subgeneric status
(Harrison & Philips, 2003). It is hypothesized to be a monophyletic group and sister to the main
Scarabaeus sensu stricto lineage that radiated in the Namib Desert after the onset of hyper-
aridity in the region.
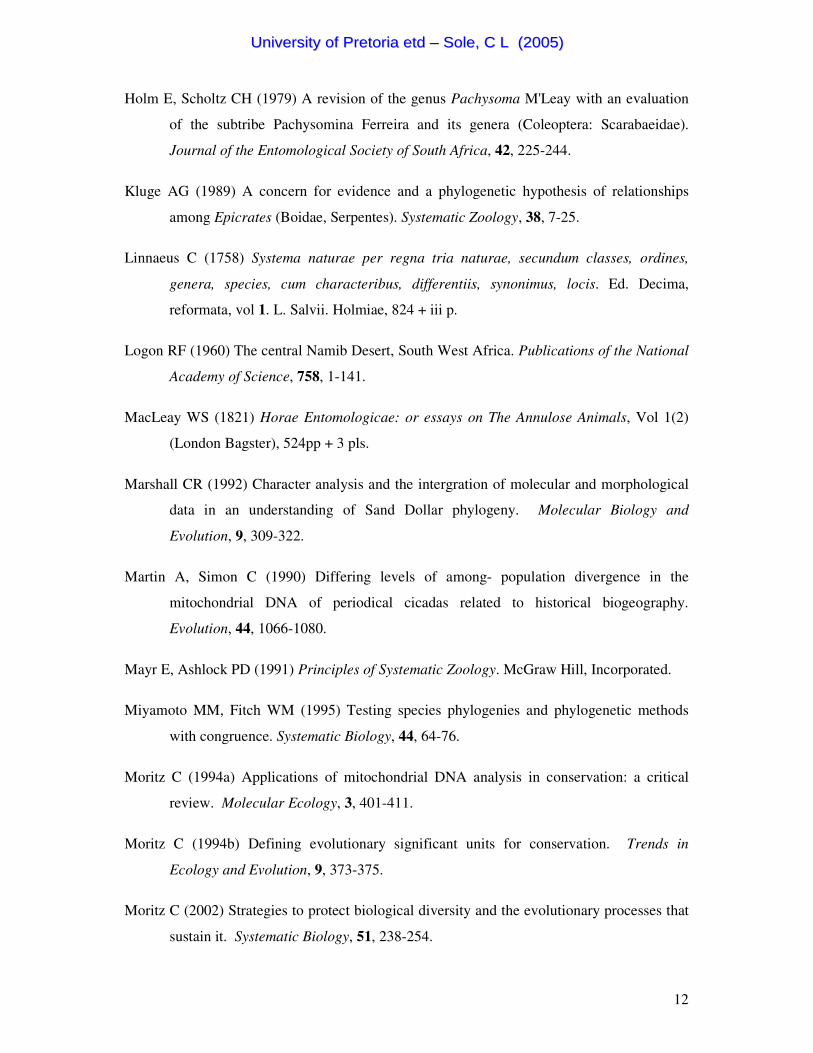
The narrow, low-lying, coastal strip between the Atlantic Ocean and the Great
Escarpment of southern Africa (Fig. 1) stretching from Cape Town in the south to the
Carunjamba River in Angola (S15°10’00” – E12°15’00”) extends over roughly 2000 km of arid,
sandy regions and encompasses three distinct biomes (Rutherford & Westfall, 1994). The
southern tip of this area comprises the western extreme of the Fynbos Biome and the enormously
species-rich Cape Floristic Region. The area up to the Orange River (S28°40’ – E16°30’), which
divides South Africa and Namibia, comprises elements of the Succulent Karoo Biome, and is
geographically considered to be Namaqualand. The area north of the Orange River and stretching
UUnniivveerrssiittyy ooff PPrreettoorriiaa eettdd –– SSoollee,, CC LL ((22000055))

18
into Angola is treated as Desert Biome and comprises the Namib Desert. Geologically, however,
the region from the Olifants River (S31°42’ – E18°11’) to the Carunjamba River is considered to
be the Namib Desert (Pickford & Senut, 1999). All three regions are characterized by a sandy
substrate and aridity, which has been maintained by the cold Benguela Current flowing up the
west coast of the continent since the Miocene, 15 million years ago (Mya) (Pickford & Senut,
1999). Aridity increases from south to north. The southern half falls in a winter rainfall regime
whilst the northern half receives rain in summer. Rainfall, however, is very low throughout the
region but moisture is available to plants and animals in the form of regular dense fogs (Seely &
Louw, 1980). The whole area is biologically characterized by exceptionally high plant and
animal endemicity. Many of the adaptations seen in animals and plants can be attributed to the
harsh conditions to which they are exposed.
Namib Desert beetles are amongst the animal groups with high endemicity and with a
suite of morphological, behavioural and physiological characters that adapt them to these
conditions (Endrödy-Younga, 1982; Crawford et al., 1990; Hanrahan & Seely, 1990; Nicolson
1990). Amongst these are several groups of Scarabaeoidea, including Scarabaeus (Pachysoma)
(Holm & Scholtz, 1979; Scholtz, 1989; Dacke et al., 2002; Harrison et al., 2003).
The Namib Desert has been an evolutionary hotspot since the Miocene because of
dramatic geological and climatic changes that have selected for taxa capable of withstanding
hyper-aridity and barren, mostly sandy, landscapes. The area is currently characterized by barren,
sand and gravel plains, extensive dune seas and rocky outcrops interspersed by wide beds of
ancient rivers. These westward-directed rivers cut deep courses across the Namib, apparently in
response to epeirogenic uplift in the Late Tertiary, possibly during the Pliocene 3-5 Mya (Ward
& Corbett, 1990). This resulted in the availability of considerable sediment for transporting back
onshore under the influence of the southerly palaeo-wind regime and arid climate. Since at least
Late Miocene times, southerly winds have dominated the climate of the near shore parts of the
southern Namib. Currently these winds are still some of the most persistent on earth (Pickford &
Senut, 1999). They have contributed significantly to depositing the massive sea of mobile sands
of the Central Namib, the 40 000 km2 Sossus Sand Formation or, as it is colloquially known, the
Namib Sand Sea.
UUnniivveerrssiittyy ooff PPrreettoorriiaa eettdd –– SSoollee,, CC LL ((22000055))
19
Figure 1. The Namib Desert, extending from the Olifants River, in South Africa, to the
Carunjamba River, in Angola, indicating specimen collection sites for this study.
UUnniivveerrssiittyy ooff PPrreettoorriiaa eettdd –– SSoollee,, CC LL ((22000055))

20
Although a recent morphological phylogeny of Scarabaeus (Pachysoma) exists
(Harrison & Philips, 2003) it is unable to answer questions regarding the age of lineages or
speciation events. However, radiation of the species and their biogeographical history may now
be inferred because a comprehensive history of the geology and palaeo-climate of the Namib
Desert is available (Pickford & Senut, 1999). In addition, molecular analyses allow estimates of
lineage ages by applying a molecular clock (Zuckerkandl & Pauling, 1965; Tajima, 1993).
Consequently, this study was aimed at resolving relationships between the 13 morphological
species of Scarabaeus (Pachysoma) at a molecular level and at estimating the divergence times
and ages of the species within the subgenus in relation to past geological and climatic events.
Methods
Representative taxa
In-group taxa - All 13 species of the subgenus Pachysoma were used to infer the phylogeny.
These are S. (P.) aesculapius (Olivier), S. (P.) bennigseni (Felsche), S. (P.) denticollis
(Péringuey), S. (P.) endroedyi Harrison, Scholtz & Chown, S. (P.) fitzsimonsi (Ferreira), S. ( P.)
gariepinus (Ferreira), S. ( P.) glentoni Harrison, Scholtz & Chown, S. (P.) hippocrates
(MacLeay), S. ( P.) rodriguesi (Ferreira), S. ( P.) rotundigenus (Felsche), S. ( P.) schinzi
(Fairmaire), S. (P.) striatus (Castelnau) and S. ( P.) valeflorae (Ferreira).
Out-group taxa – Two flighted Scarabaeus species, S. proboscideus and S. rugosus,
characterized in a separate study (Forgie, 2003), that occur sympatrically with Pachysoma, were
used. The phylogenetic relatedness of these taxa falls within the selection criteria discussed by
Nixon and Carpenter (1993) and by Wheeler (1990) to effectively polarize the in-group character
sets.
Sampling and nucleic acid extraction
Twelve of the 13 species of Scarabaeus (Pachysoma) were collected along the west coast of
southern Africa from the West Coast National Park in the Cape Province to the Kuiseb River just
south of Walvis Bay (Fig. 1), in Namibia (Summarized in Table 1). For each species,
individual’s representative of diverse localities, were collected, and preserved in absolute
ethanol. Two museum specimens of S. (P.) valeflorae were obtained from the National
UUnniivveerrssiittyy ooff PPrreettoorriiaa eettdd –– SSoollee,, CC LL ((22000055))

21
Collection of Insects (NCI) at the Agricultural Research Council (ARC) in Pretoria, South
Africa. Identification of three morphologically similar species, S. (P.) hippocrates, S. (P.)
endroedyi and S. (P.) glentoni, was confirmed by James du G Harrison of the Transvaal Museum
using male genitalia.
Where possible, at least three individuals per locality and per species were selected for
genetic characterization of the mitochondrial Cytochrome Oxidase subunit I (COI) gene (Avise
et al., 1987; Simon et al., 1994). For the specimens preserved in ethanol muscle tissue from the
thorax was used for DNA extraction whilst DNA from dried specimens was extracted from the
tarsus of one leg. DNA was ultimately extracted from 46 individuals representing the 13 species
(Table 1) using the Dneasy Tissue Kit (Qaigen).
Genomic amplification and nucleic sequence determination
Primers used for amplification of contemporary DNA were TL2–N-3014 and C1–J–1718 (Simon
et al., 1994), which target a 1345-bp fragment. For the dried museum material, Scarabaeus
(Pachysoma) specific primers were designed to amplify regions of between 300 and 600-bp.
Two forward primers - C-301-F and C-526-F - and two complimentary reverse primers - C-409-
R and C-602-R - were designed on the basis of aligned Scarabaeus (Pachysoma) sequences
generated in this study (all primers are summarized in Table 2).
PCR was performed using a Perkin Elmer Gene Amp 2400 in a final volume of 50µl
containing 20pmol of each primer, 10mM dNTP’s and 1 X buffer in the presence of 1 unit of
Taq DNA polymerase (Takara). BSA was added to improve the sensitivity of the reaction when
the dried material was amplified (Higuchi, 1991). Thermal cycling parameters comprised an
initial denaturation for 90 seconds at 94°C followed by 35 cycles of 94°C for 22 seconds, 48°C
for 30 seconds and 72°C for 90 seconds with a final elongation step at 72°C for 1 min. The
amplified COI gene products were purified from the tube using the High Pure PCR Product
Purification kit (Roche) according to manufacturer specifications.
Sequencing reactions were performed at an annealing temperature of 48°C with versions
2.0 and 3.0 of the Big Dye Terminator Cycle Sequencing Ready Reaction Kit (Perkin-Elmer).
Each amplicon was sequenced with the external PCR primers plus two internal primers, C1-J-
2183 and a modified version of C1-N-2329 (Simon et al., 1994; Table 2).
UUnniivveerrssiittyy ooff PPrreettoorriiaa eettdd –– SSoollee,, CC LL ((22000055))
22
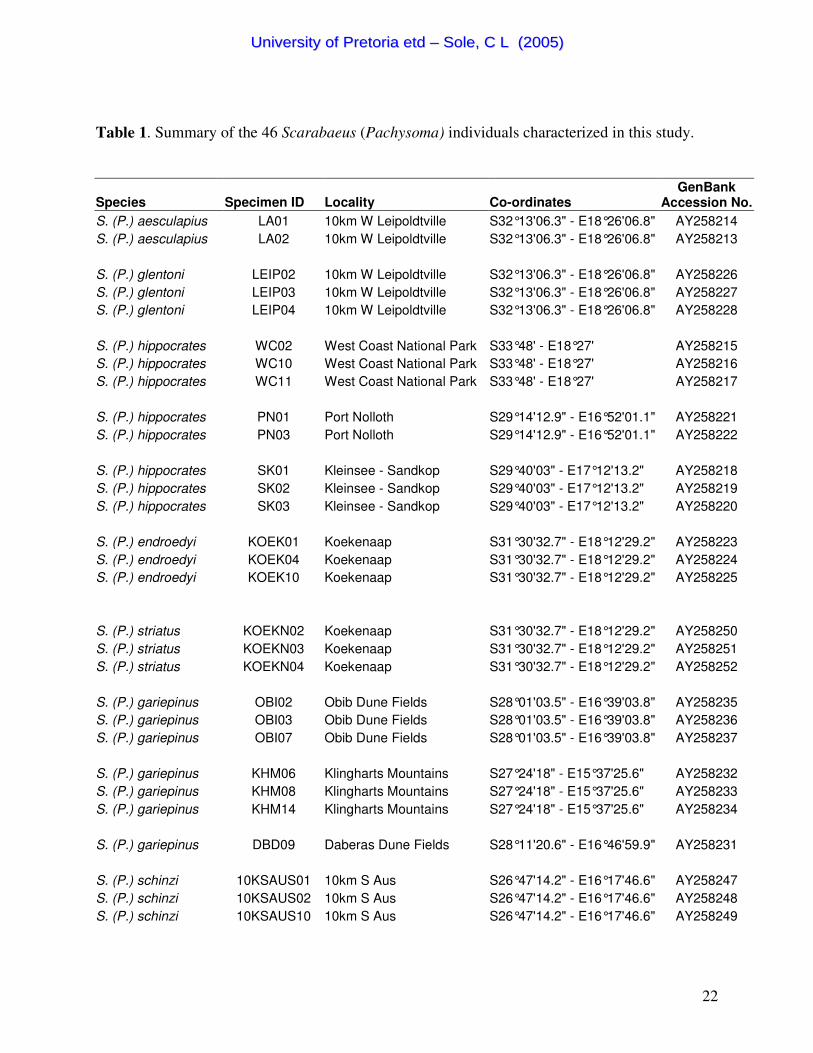
Table 1. Summary of the 46 Scarabaeus (Pachysoma) individuals characterized in this study.
Species Specimen ID Locality Co-ordinates GenBank
Accession No. S. (P.) aesculapius LA01 10km W Leipoldtville S32°13'06.3" - E18°26'06.8" AY258214 S. (P.) aesculapius LA02 10km W Leipoldtville S32°13'06.3" - E18°26'06.8" AY258213 S. (P.) glentoni LEIP02 10km W Leipoldtville S32°13'06.3" - E18°26'06.8" AY258226 S. (P.) glentoni LEIP03 10km W Leipoldtville S32°13'06.3" - E18°26'06.8" AY258227 S. (P.) glentoni LEIP04 10km W Leipoldtville S32°13'06.3" - E18°26'06.8" AY258228 S. (P.) hippocrates WC02 West Coast National Park S33°48' - E18°27' AY258215 S. (P.) hippocrates WC10 West Coast National Park S33°48' - E18°27' AY258216 S. (P.) hippocrates WC11 West Coast National Park S33°48' - E18°27' AY258217 S. (P.) hippocrates PN01 Port Nolloth S29°14'12.9" - E16°52'01.1" AY258221 S. (P.) hippocrates PN03 Port Nolloth S29°14'12.9" - E16°52'01.1" AY258222 S. (P.) hippocrates SK01 Kleinsee - Sandkop S29°40'03" - E17°12'13.2" AY258218 S. (P.) hippocrates SK02 Kleinsee - Sandkop S29°40'03" - E17°12'13.2" AY258219 S. (P.) hippocrates SK03 Kleinsee - Sandkop S29°40'03" - E17°12'13.2" AY258220 S. (P.) endroedyi KOEK01 Koekenaap S31°30'32.7" - E18°12'29.2" AY258223 S. (P.) endroedyi KOEK04 Koekenaap S31°30'32.7" - E18°12'29.2" AY258224 S. (P.) endroedyi KOEK10 Koekenaap S31°30'32.7" - E18°12'29.2" AY258225 S. (P.) striatus KOEKN02 Koekenaap S31°30'32.7" - E18°12'29.2" AY258250 S. (P.) striatus KOEKN03 Koekenaap S31°30'32.7" - E18°12'29.2" AY258251 S. (P.) striatus KOEKN04 Koekenaap S31°30'32.7" - E18°12'29.2" AY258252 S. (P.) gariepinus OBI02 Obib Dune Fields S28°01'03.5" - E16°39'03.8" AY258235 S. (P.) gariepinus OBI03 Obib Dune Fields S28°01'03.5" - E16°39'03.8" AY258236 S. (P.) gariepinus OBI07 Obib Dune Fields S28°01'03.5" - E16°39'03.8" AY258237 S. (P.) gariepinus KHM06 Klingharts Mountains S27°24'18" - E15°37'25.6" AY258232 S. (P.) gariepinus KHM08 Klingharts Mountains S27°24'18" - E15°37'25.6" AY258233 S. (P.) gariepinus KHM14 Klingharts Mountains S27°24'18" - E15°37'25.6" AY258234 S. (P.) gariepinus DBD09 Daberas Dune Fields S28°11'20.6" - E16°46'59.9" AY258231 S. (P.) schinzi 10KSAUS01 10km S Aus S26°47'14.2" - E16°17'46.6" AY258247 S. (P.) schinzi 10KSAUS02 10km S Aus S26°47'14.2" - E16°17'46.6" AY258248 S. (P.) schinzi 10KSAUS10 10km S Aus S26°47'14.2" - E16°17'46.6" AY258249
UUnniivveerrssiittyy ooff PPrreettoorriiaa eettdd –– SSoollee,, CC LL ((22000055))

23
S. (P.) fitzsimonzi GPS01 Namib Rand Road S25°32'19.4" - E16°16'29.9" AY258229 S. (P.) fitzsimonzi GPS02 Namib Rand Road S25°32'19.4" - E16°16'29.9" AY258230 S. (P.) denticollis NR05 Namib Rand S25°12'52.5" - E16°01'10" AY258255 S. (P.) denticollis NR06 Namib Rand S25°12'52.5" - E16°01'10" AY258256 S. (P.) denticollis LT12 Luderitz - Agate Beach S26°41'17.1" - E15°15'50.1" AY258253 S. (P.) denticollis LA11 Luderitz - Agate Beach S26°41'17.1" - E15°15'50.1" AY258254 S. (P.) rotundigenus NR03 Namib Rand S25°12'52.5" - E16°01'10" AY258241 S. (P.) rotundigenus NR05 Namib Rand S25°12'52.5" - E16°01'10" AY258242 S. (P.) rotundigenus NR11 Namib Rand S25°12'52.5" - E16°01'10" AY258243 S. (P.) bennigseni DBD01 Daberas Dune Fields S28°11'13.4" - E16°47'03.2" AY258238 S. (P.) bennigseni DBD02 Daberas Dune Fields S28°11'13.4" - E16°47'03.2" AY258239 S. (P.) bennigseni DBD04 Daberas Dune Fields S28°11'13.4" - E16°47'03.2" AY258240 S. (P.) rodriguesi GOB01 Gobabeb S23°39'53.1" - E15°12'48.1" AY258244 S. (P.) rodriguesi GOB02 Gobabeb S23°39'53.1" - E15°12'48.1" AY258245 S. (P.) rodriguesi GOB03 Gobabeb S23°39'53.1" - E15°12'48.1" AY258246 S. (P.) valeflorae RT01 Rotkop S26°43' - E15°23' AY258257 S. (P.) valeflorae RT02 Rotkop S26°43' - E15°23' AY258258
UUnniivveerrssiittyy ooff PPrreettoorriiaa eettdd –– SSoollee,, CC LL ((22000055))

24
Table 2. Summary of oligonucleotide primers used in this study.
Primer Primer sequence Length Position (§) Reference C1-J-1718 5' GGAGGATTTGGAAATTGATTAGTTCC 3' 26mer 1651-1676 Simon et al., 1994
C1-J-2183 5' CAACATTTATTTTGATTTTTTGG 3' 23mer 2219-2241 Simon et al., 1994
C1-N-2329 5' ACTGTA AATATGTGATGAGCTCA 3' 23mer 2287-2309 Simon et al., 1994 modified by
Forgie and Bloomer (unpubl.)
TL2-N-3014 5' TCCAATGCACTAATCTGCCATATTA 3' 25mer 3323-3302 Simon et al., 1994
C-301-F£ 5' CAACAGGAATAACTTTTGATCGTA 3' 25mer 2014-2039 Sole and Bastos, unpubl.
C-409-R£ 5' GATGTATTTAAR(A/G)TTTCGATCTGT 3' 25mer 2122-2147 Sole and Bastos, unpubl.
C-526-F£ 5' GGATTTGGR(A/G)ATAATTTCTCATAT 3' 23mer 2239-2262 Sole and Bastos, unpubl.
C-602-R£ 5' CCAATAGTTATTATAGCATAAAT 3' 23mer 2315-2338 Sole and Bastos, unpubl. £ Denotes the Pachysoma specific primers. § Refers to the corresponding position in Locusta migratoria (Genbank accession no. NC_001712).
UUnniivveerrssiittyy ooff PPrreettoorriiaa eettdd –– SSoollee,, CC LL ((22000055))

25
For the dried museum material up to six primers were used for amplification and
sequencing purposes. Both the external amplification primers and the three additional internal
forward and reverse primers, C1-J-2183 (Simon et al., 1994), C-301-F and C-409-R and,
where necessary, C-526-F, were used.
Phylogenetic analysis
Sequence chromatograms were visualized and edited in Chromas (Version 1.43) and were
subsequently aligned using Clustal X (Thompson et al., 1997). A homologous region of 1197
base pairs (bp) corresponding to nucleotide positions 1713-2910 of Locusta migratoria
Linneaus (Flook et al., 1995) was used for phylogenetic analysis. Both Maximum Parsimony
(MP) and Maximum Likelihood (ML) were used to infer the phylogenetic relationships
between the species of Scarabaeus (Pachysoma) (PAUP*4.08b; Swofford, 1998). An initial
un-weighted parsimony analysis of the sequences from all individuals was performed,
employing branch and bound searches and heuristic searches with 10 random addition
sequences for each of 1000 bootstrap replicates (Farrell, 2001).
A posteriori and a priori weighting schemes such as the successive approximations
weighting method (Farris, 1969; Park & Backlund, 2002) and positional weighting
(Huelsenbeck et al., 1994; Krajewski & King, 1996) were investigated. In the former
approach weights were applied according to the rescaled consistency index (RC), consistency
index (CI) and the retention index (RI), whilst with the latter, first, second and third base
positions were assigned weights of 4, 1 and 15.7, respectively.
In order to determine the model of sequence evolution, which best fits the COI data at
hand, hierarchical likelihood ratio tests were performed using Model Test 3.0 (Posada &
Crandall, 1998). Parameters from Model Test were used in a ML heuristic search in PAUP*
and nodal support was estimated following 500 bootstrap pseudoreplications.
To use genetic data to infer evolutionary rates the data needs to meet two criteria:
firstly, rates of genetic evolution among organismal lineages need to be consistent with a
molecular clock model and secondly, the availability of a reliable fossil record (Yoder et al.,
2000). Equality of evolutionary rates between lineages was assessed with Phyltest 2.0
(Kumar, 1996). In addition rate heterogeneity was investigated by comparing branch lengths
and log-likelihood ratios estimated in PAUP* on the most parsimonious tree using the
HKY85 model of sequence evolution, with and without the constraint of a molecular clock
(Hasegawa & Kishino, 1994). Divergence times were estimated from uncorrected pairwise -
UUnniivveerrssiittyy ooff PPrreettoorriiaa eettdd –– SSoollee,, CC LL ((22000055))

26
distances in MEGA version 2.1 (Kumar et al., 2001) and calibrated on arthropod mtDNA
where a 2.3% pair-wise divergence per million years is postulated (Brower, 1994).
Results
Of the 434 variable sites identified across the 46 taxa used in this study, 408 sites were
informative and 26 were singletons. The proportion of nucleotide mutations at first, second
and third base positions was 19 %, 5 % and 76 % respectively and base composition over the
1197 base pairs was 39.2 %, 16.1 %, 30.5 % and 14.2 % for T, C, A and G respectively
Maximum Likelihood and Maximum Parsimony Analyses
The un-weighted parsimony analysis resulted in three trees with a length of 1711, consistency
index (CI) of 0.381, a retention index (RI) of 0.742 and rescaled consistency index (RC) of
0.283. Weighted parsimony searches using CI, RI and RC resulted in the recovery of a single
most parsimonious tree, whereas, positional re-weighting did not improve resolution despite
accounting for saturation at the third base position. A single ML tree was obtained assuming
the GTR model (Rodriguez et al., 1990) with 52.4% invariant sites, a transition-transversion
ratio of 1.2 and a gamma distribution shape parameter of 0.77. Weighted parsimony analysis
using the rescaled consistency index gave a single tree of length 490.52, CI of 0.54, RI of
0.82 and RC of 0.45 (Fig. 2). This MP tree had a similar topology to those trees obtained
following Neighbour Joining (NJ), Minimum Evolution (ME) and ML analyses (results not
shown).
UUnniivveerrssiittyy ooff PPrreettoorriiaa eettdd –– SSoollee,, CC LL ((22000055))

27
Figure 2. Phylogram of COI gene phylogeny of Scarabaeus (Pachysoma). Parsimony tree
obtained following successive weighting using RC (tree length = 490.52, CI = 0.54 and RI =
0.82).
UUnniivveerrssiittyy ooff PPrreettoorriiaa eettdd –– SSoollee,, CC LL ((22000055))

28
The COI gene phylogeny (Fig. 2) reveals the presence of three distinct clades
(labelled I, II and III, respectively). Clade I, which has 79% bootstrap support, comprises 21
individuals, representative of six morphological species, namely S. (P.) hippocrates, S. (P.)
glentoni, S. (P.) aesculapius, S. (P.) endroedyi, S. (P.) valeflorae and S. (P.) schinzi.
Although there is high bootstrap support (between 94 % - and 100 %) for four of the six
morphological species in this clade, a single individual S. (P.) glentoniLEIPV03 does not
group with the other two representatives of this morphological species. Instead a species
complex comprising 11 individuals of S. (P.) glentoni and S. (P.) hippocrates, henceforth
referred to as the hippocrates/glentoni complex was recovered (95% bootstrap support).
Clade II supports four species (58% bootstrap support), S. (P.) fitzsimonzi, S. (P.) gariepinus,
S. (P.) bennigseni and S. (P.) striatus, each with 100% bootstrap support. Clade III supports
three species each with 100% bootstrap support, namely S. (P.) denticollis, S. (P.)
rotundigenus and S. (P.) rodriguesi, which were formerly placed in the genus Neopachysoma.
Numbers 1 through 3 (right hand side of Fig.2) correspond to the species occurring in
three areas differing in aridity as follows: Number 1; S. (P.) hippocrates, S. (P.) glentoni, S.
(P.) endroedyi and S. (P.) aesculapius occur within the Fynbos and Namaqualand south and
have the most southerly distribution of Scarabaeus (Pachysoma). Number 2; S. (P.)
fitzsimonzi, S. (P.) gariepinus, S. (P.) bennigseni, S. (P.) striatus, S. (P.) valeflorae and S. (P.)
schinzi corresponds to those species that occur across two biomes and occupy the central part
of the Scarabaeus (Pachysoma) distributional range, S. (P.) striatus occurs only in the
Namaqualand while S. (P.) fitzsimonzi, S. (P.) gariepinus, S. (P.) bennigseni, S. (P.)
valeflorae and S. (P.) schinzi can be found in the southern part of the Desert biome. Number
3; S. (P.) denticollis, S. (P.) rotundigenus and S. (P.) rodriguesi have the most northerly
Desert Biome distribution and are the three ultrapsammophilous species, and also those
species formerly classified as Neopachysoma (Clade III, Fig. 2).
Imposing a Molecular Clock
The likelihood of the tree with and without enforcing a molecular clock was -log 7205.1461
and –log 7167.44184 respectively. The difference was not significant according to the
likelihood ratio test (p<0.05). In addition, rate constancy could also not be rejected using
PHYLTEST (p < 0.05). As both results indicate that the molecular clock hypothesis cannot
be rejected, a rate of 2.3% sequence divergence per million years was used to infer a
molecular clock (Brower, 1994).
UUnniivveerrssiittyy ooff PPrreettoorriiaa eettdd –– SSoollee,, CC LL ((22000055))
29
The subgenus is estimated to have arisen about 2.9 million years ago. The hippocrates
complex (consisting of S. (P.) hippocrates, S. (P.) glentoni and S. (P.) endroedyi (Harrison et
al., 2003)), and S. (P.) aesculapius appear to have diverged approximately 2.66 Mya and
species of the former genus Neopachysoma appear to have diverged approximately 2.4 Mya.
The youngest species of Scarabaeus (Pachysoma) include S. (P.) schinzi, S. (P.) rodriguesi,
S. (P.) rotundigenus, S. (P.) denticollis, S. (P.) bennigseni, S. (P.) aesculapius and S. (P.)
fitzsimonzi, and are estimated to have arisen between 200 000 and 600 000 Ya.
Discussion
Palaeontological History
The ball-rolling dung beetles of the tribe Scarabaeini comprise 146 species belonging to five
genera and three subgenera. Their distribution extends throughout the Afrotropical region
(including Madagascar) and southern latitudes of the Palaearctic (Forgie, 2003).
Diversification of the Scarabaeini was thought to coincide with the radiation of both
Angiosperms (Eocene: 50 Mya) and mammalian herbivores (lower Oligocene: 35 Mya), with
a shift from saprophagy to mycetophagy to coprophagy by adults and larvae (Cambefort,
1991b; Scholtz & Chown, 1995). The Scarabaeini appear to have evolved during the
Cenozoic from ancient scarabaeoid lineages dating back to the lower Jurassic ca. 180 – 200
Mya (Crowson, 1981; Cambefort, 1991a; Scholtz & Chown, 1995). The flightless
Scarabaeini are monophyletic and contain the most derived members within the tribe with
Scarabaeus (Pachysoma) representing the most highly evolved of the lineages (Forgie,
2003).
Ideas about rates of evolution of the rich, endemic Namib fauna and flora fall broadly
into two schools of thought. Some authors argue that the desert must be very ancient
(Cretaceous) in order for the specialized fauna and flora to have had time to evolve. For
these scientists, the rates of evolution envisaged are extremely slow. For the second group
who consider that the desert is appreciably younger (Miocene), rates of evolution are
postulated to have been much more rapid (Pickford & Senut, 1999). However, the various
authors have essentially been arguing about different taxa and different hierarchical levels.
Some ancient lineages of Late Cretaceous proto-Namib desert ancestry are identifiable
amongst insects, for example Lepismatidae (Thysanura: Insecta) (Irish, 1990), but the fauna
associated with the post-Miocene Namib Desert Phase (Ward & Corbett, 1990) is logically
much younger. Now that we know the hyperaridity of the Namib is no older than the Middle
UUnniivveerrssiittyy ooff PPrreettoorriiaa eettdd –– SSoollee,, CC LL ((22000055))
30
Miocene (ca 15 Mya) (Pickford & Senut, 1999) it is evident that rates of evolution have been
orders of magnitude more rapid. This could therefore imply more severe selection pressures
and perhaps enhanced generation of genetic variability in desert environments, or a
combination of both (Pickford & Senut, 1999).
Biogeographical Inferences
Endr � dy-Younga (1978) coined the term “pocket speciation” to describe processes resulting
from the numerous small dunes and dune fields of Namib or Kalahari sand origins which
have been isolated from the main sand systems and occur throughout southern Namibia and
the northern Cape (Koch, 1962). Most of these are alluvial sands that originate at the mouths
of the large Tertiary rivers. Any separation of sand dunes from a major system could
constitute a vicariance event (Prendini, 2001). These isolated sand dunes are often
encountered in unlikely places on the flats and as deposits against mountain slopes. This sand
is clearly wind-blown from major dune fields, so the possibility exists that psammophilous
taxa may extend their distribution, following pockets of sand to their eventual destinations
and thus becoming completely isolated from main populations in time. Endrödy-Younga
(1982) provided evidence for this process by demonstrating that, over 11 years, barchan
dunes in the southern Namib moved considerable distances across gravel plains together with
their associated Tenebrionidae fauna. Dispersal of these species could be attributed not to the
movement of individuals but to the movement of their substratum and habitat, the dune. Clear
south to north evolutionary gradients in the majority of ultrapsammophilous taxa can be
adequately explained in terms of sand movement of barchan dunes, which have been shown
to move 10-100 m.yr-1 within historical time (Penrith, 1979; Prendini, 2001).
Due to the low, unpredictable rainfall in the Namib since the advent of hyperaridity in
the Miocene the fauna is and probably always has been, dependent on the regular, dense fogs
that represent virtually the only free water available to it (Seely & Louw, 1980). The fogs
have become frequent along the Namib coast since the Early Pleistocene (1.8.Mya) when
cold upwellings from the Benguela Current caused cold air that condenses to form fog in
contact with the warm air off the land (Pickford & Senut, 1999). This may have been the
main environmental parameter that permitted dispersal into, and subsequent radiation, in
areas that may have been inhospitable until then.
UUnniivveerrssiittyy ooff PPrreettoorriiaa eettdd –– SSoollee,, CC LL ((22000055))
31
Speciation Events
It is around the riverbeds and in the deep loose sand of the Sossus Sand Formation, that
speciation in Scarabaeus (Pachysoma) seems principally to have occurred. The rivers
probably presented barriers to the spread of some of the species during the Plio-Pleistocene,
and may have vicariously split populations of some others that lead to speciation events. The
areas around these riverbeds have high species numbers, and some still appear to be barriers
to further range expansion. Isolated populations that occur on sandy plains and in dune fields
interspersed by dry riverbeds, gravel plains and rocky outcrops represent the current
distribution of most species. Exceptions to this are the ultra-psammophilous species that
occur throughout much of the Namib Sand Sea (Harrison et al., 2003). As the dune fields
shifted and became more continuous through the southern and central Namib, so this allowed
for the movement of these isolated populations in a northerly direction. Psammophilous taxa
evolved subsequent to establishment of these systems, speciating after initial dispersal events
into an environment that had previously constituted a barrier. The older species seem to have
inhabited the Karoo (interior Cape Province of South Africa), the southern parts of Namibia
and/or the Kaokoveld (north-western Namibia). These are areas of rocky, not excessively
sandy substrates indicating that these conditions probably prevailed in much of the
Gondwana Desert (Irish, 1990).
The Olifants, Buffels, Holgat, Orange and Kuiseb Rivers (see Fig. 1), which still flow,
all affect Scarabaeus (Pachysoma) in some way. The Orange River appears to have been of
lesser or sporadic importance as a gene barrier, since many psammophilous southern Namib
species, for example S. (P.) gariepinus and S. (P.) bennigseni, occur on both sides of the
river. The boundary between related Namib and Namaqualand species lies further south at the
Holgat and Buffels Rivers (Irish, 1990). The Buffels River appears to be the southern limit
for S. (P.) gariepinus. The Holgat River appears to be the barrier to S. (P.) striatus from
extending its distribution northwards and S. (P.) bennigseni from moving southwards. S. (P.)
striatus, S. (P.) gariepinus and S. (P.) bennigseni probably speciated around the Olifants,
Buffels and Holgat Rivers, respectively and then moved northwards with the sand. The
evolution of S. (P.) endroedyi could have resulted from a vicariance event caused by the
Olifants River splitting the S. (P.) aesculapius population into two and thereby allowing for
the speciation of S. (P.) endroedyi (For detailed distribution maps of Scarabaeus
(Pachysoma) see Harrison et al., 2003).
Regarding the hippocrates/glentoni complex, S. (P.) glentoni is distributed along the
Olifants River, from Lambert’s Bay, inland to Clanwilliam as opposed to the wider
UUnniivveerrssiittyy ooff PPrreettoorriiaa eettdd –– SSoollee,, CC LL ((22000055))
32
distribution of S. (P.) hippocrates. In some localities they occur sympatrically. S. (P.)
glentoni prefer the firm vegetated sand of riverbanks and coastal hummocks while S. (P.)
hippocrates prefer soft to firm sand of coastal hummocks and hillocks on the periphery of
dune systems, and river beds and banks. S. (P.) hippocrates shows south/north morphological
clinal variation implying that the species might be undergoing speciation (Harrison et al.,
2003). Distances between populations of these two species can range from a few metres to
about 40km. The overall small distance between populations and the young age of S. (P.)
glentoni may underlie the lack of resolution of these two species with the molecular data.
Increasing the number of individuals from different localities of the two species and use of an
alternative gene marker may help resolve the species complex.
Inferences from the Molecular Clock
Phylogenetic analysis indicates that the psammophilous and ultrapsammophilous species of
Scarabaeus (Pachysoma), formerly placed in the genus Neopachysoma, are the most derived
and have the most northerly distribution in the Sossus Sand Formation which is consistent
with the findings of Irish (1990). One may therefore safely assume that psammophilous taxa
evolved from an older non-psammophilous ancestor (Irish, 1990). Three of the species of
Scarabaeus (Pachysoma) show distinct morphological south/north clinal variation, S. (P.)
hippocrates, S. (P.) gariepinus and S. (P.) denticollis (Harrison et al., 2003). The clear
south/north morphological clinal variation shows strong support for the movement of taxa
with the wind blown sand from the barchan dunes. The distribution of Scarabaeus
(Pachysoma) is halted at the Kuiseb River.
Rapid radiation of most of the species and/or their ancestors, between 2.35 Mya and
2.66 Mya, can clearly be seen within the subgenus and may be linked to the reliability of
regular fog in the Pleistocene. Formation of regular fogs would constitute a consistent and
reliable form of water. All of the species of Scarabaeus (Pachysoma) occur within the fog
belt except for S. (P.) schinzi, which is confined to the areas around Aus on the Huib-Hoch
Plateau, indicating it must be dependent on rainfall. This area is approximately 100km inland
from the coast. Rainfall increases while the fog decreases as one moves inland. As seen here
and in other insect groups (for examples see Irish, 1990), the distinction between coastal and
inland fauna is not absolute as coastal species penetrate inland due to the shared similarities
between the slips face/dune-crest habitats of the inland and coastal dunes. The reverse is not
true (inland species are absent from the coast). Historical separation appears to be the primary
cause of this east/west distributional gradient. One can clearly see the importance of coastal
UUnniivveerrssiittyy ooff PPrreettoorriiaa eettdd –– SSoollee,, CC LL ((22000055))
33
dunes as a species reservoir and a dispersal vessel, since wherever this sand and its associated
fauna have been blown inland, new taxa have evolved.
Acknowledgements
Shaun Forgie is thanked for his mentorship of C.S and for making out-group sequence data
available for this study. Jennifer Edrich, Ute Kryger and Vasily Grebennikov are thanked for
their many comments and help. The SA National Research Foundation funded this research
through support of CHS and a bursary to CS. NAMDEB, in Namibia, and De Beers, in South
Africa, are thanked for allowing CHS and CS to complete fieldwork in restricted mining
areas. The two anonymous referees are thanked for their valuable comments in making this a
better manuscript.
UUnniivveerrssiittyy ooff PPrreettoorriiaa eettdd –– SSoollee,, CC LL ((22000055))

34
References
Avise, J.C., Arnold, J., Ball, R.M., Bermingham, E., Lamb, T., Neigel, J.E., Reeb, C.A. &
Saunders, N.C. (1987) Intraspecific phylogeography: the mitochondrial DNA bridge
between population genetics and systematics. Annual Review of Ecological Systematics,
18, 489-522.
Brower, A.V.Z. (1994) Rapid morphological radiation and convergence among races of the
butterfly Helioconuius erato inferred from patterns of mitochondrial DNA evolution.
Proceedings of the National Academy of Science of the United States of America, 91,
6491-6495.
Cambefort, Y. (1991a) Biogeography and Evolution. In Dung Beetle Ecology (ed. By I.
Hanski and Y. Cambefort) pp. 57-74. Princeton University Press, Princeton.
Cambefort, Y. (1991b) Biogeography and Evolution. In Dung Beetle Ecology. (ed. by. I.
Hanski and Y. Cambefort) pp. 22-35. Princeton University Press, Princeton.
Crawford, C.S., Hanrahan, S.A. & Seely, M.K. (1990) Scale-related habitat use by
Physadesmia globosa (Coleoptera: Tenebrionidae) in a Riparian Desert Environment.
In Namib Ecology: 25 years of Namib research (ed. by M.K. Seely) pp. 135-142.
Transvaal Museum Monograph No. 7. Transvaal Museum, Pretoria.
Crowson, R.A. (1981) The Biology of the Coleoptera. Academic Press, London.
Dacke, M., Nordström, P., Scholtz, C.H., & Warrant, E.J. (2002) A specialized dorsal rim
area for polarized light detection in the compound eye of the scarab beetle Pachysoma
striatum. Journal of Complete Physiology A, 188, 211-216.
Endrödy-Younga, S. (1978) Coleoptera. Biogeography and Ecology of Southern Africa (ed.
By Werger, M.J.A), pp. 797-821. Junk, The Hague.
Endrödy-Younga, S. (1982) Dispersion and translocation of dune specialist Tenebrionids in
the Namib area. Cimbebasia (A), 5, 257-271.
UUnniivveerrssiittyy ooff PPrreettoorriiaa eettdd –– SSoollee,, CC LL ((22000055))

35
Farrell, B.D. (2001) Evolutionary assembly of the Milkweed Fauna: Cytochrome Oxidase I
and the age of Tetraopes beetles. Molecular Phylogenetics and Evolution, 18, 467-478.
Farris, J.S. (1969) A successive approximations approach to character weighting. Systematic
Zoology, 18, 374-385.
Ferreira, M.C. (1953) Monografia dos Escarabaeídeos da África do Sul. Tribo-Scarabaeini. I
Parte Sub-tribo Pachysomides. Boletím da Sociedade de Estudos da Província de
Moçambique, 23, 1-85.
Flook, P.K., Rowell, C.H. & Gellisen, G. (1995) The sequence organization and evolution of
Locusta migratoria mitochondrial genome. Journal of Molecular Ecology, 41, 928-941.
Forgie, S A. (2003) Phylogeny of the Scarabaeini (Coleoptera: Scarabaeidae). PhD Thesis,
University of Pretoria, Pretoria, South Africa.
Hanrahan, S.A. & Seely, M.K. (1990) Food and Habitat use by three Tenebrionid Beetles
(Coleoptera) in a Riparian Desert Environment. In Namib Ecology: 25 years of Namib
research (ed. by M.K. Seely) pp. 143-147. Transvaal Museum Monograph No. 7.
Transvaal Museum, Pretoria.
Harrison, J.du G. & Phillips, T.K. (2003) Phylogeny of Scarabaeus (Pachysoma) MacLeay
sta. nov., and related flightless Scarabaeini (Scarabaeidae: Scarabaeinae). Annals of the
Transvaal Museum, 40, 47-71.
Harrison, J.du.G., Scholtz, C.H. & Chown, S.L. (2003) A revision of the endemic south-
western African dung beetle subgenus Scarabaeus (Pachysoma) MacLeay, including
notes on other flightless Scarabaeini (Scarabaeidae: Scarabaeinae). Journal of Natural
History, 37, 305-355.
Hasegawa, M. & Kishino, H. (1994) Accuracies of the simple methods for estimating the
bootstrap probability of a Maximum-Likelihood tree. Molecular Biology and Evolution,
11, 142-145.
UUnniivveerrssiittyy ooff PPrreettoorriiaa eettdd –– SSoollee,, CC LL ((22000055))

36
Higuchi, R. (1992) Dr. Russ’s problem corner. Ancient DNA Newsletter. 1, 6-41.
Holm, E. and Scholtz, C.H. (1979) A revision of the genus Pachysoma M'Leay with an
evaluation of the subtribe Pachysomina Ferreira and its genera (Coleoptera:
Scarabaeidae). Journal of the Entomological Society of South Africa, 42, 225-244
Huelsenbeck, J.P., Swofford, D.L., Cunningham, C.W., Bult, J.J., & Waddell, P.J. (1994) Is
character weighting a panacea for the problem of data heterogeneity in phylogenetic
analysis? Systematic Biology, 43, 288-291.
Irish, J. (1990) Namib Biogeography, as exemplified mainly by the Lepmismatidae
(Thysanura: Insecta). In Namib Ecology: 25 years of namib Research (ed. M.K. Seely),
pp. 61-66. Transvaal Museum Monograph No. 7. Transvaal Museum, Pretoria
Koch, C. (1962) The Tenebrionidae of Southern Africa. Annals of the Transvaal Museum, 24,
61-106.
Krajewski, C. & King, D.G. (1996) Molecular divergence and phylogeny: rates and patterns
of cytochrome b evolution in cranes. Molecular biology and evolution, 13, 21-30.
Kumar, S. (1996) PHYLTEST: A program for testing phylogenetic hypothesis Version 2.
Kumar, S., Tamura, K., Jacobsen, I.B. & Nei, M. (2001) Molecular Evolutionary Genetic
Analysis Software. Bioinformatics, 17, 1244-1245.
MacLeay, W.S. (1821) Horae Entomologicae: or essays on The Annulose Animals. (London
Bagster), 1, 506-509.
Mostert, L.E. & Holm, E. (1982) Notes on the flightless Scarabaeina (Coleoptera:
Scarabaeidae) with a description of a new species. Cimbebasia (A), 5, 273-284.
UUnniivveerrssiittyy ooff PPrreettoorriiaa eettdd –– SSoollee,, CC LL ((22000055))

37
Nicolson, S. (1990) Water relations of the Namib Tenebrionid beetles. In Namib Ecology: 25
years of Namib Research (ed. M.K Seely), pp. 173-178. Transvaal Museum Monograph
No. 7, Transvaal Museum, Pretoria.
Nixon, K, C & Carpenter, J. M. (1993) On outgroups. Cladistics, 9, 413-426.
Park, K.R. & Backlund, A. (2002) Origin of the cyathium-bearing Euphorbieae
(Euphorbiaceae): phylogenetic study based on morphological characters. Botanical
Bulletin of Academia Sinica, 43, 57-62.
Penrith, M. -L. (1979) Revision of the western southern African Adesmiini (Coleoptera:
Tenebrionidae). Cimbebasia (A), 6, 125-164.
Pickford, M. & Senut, B. (1999) Geology and Palaeobiology of the central and southern
Namib Desert, southwestern Africa. Memoir, 18, 1-155.
Posada, D. & Crandall, K.A. (1998) Modeltest: testing the model of DNA substitution.
Bioinformatics, 14, 817-818.
Prendini, L. (2001) Systematics, evolution and biogeography of the southern African
burrowing scorpions, Opistophthalmus C.L Koch (Scorpiones, Scorpionidae).PhD
thesis, University of Cape Town.
Rodriguez, F., Oliver, J.F. & Medina, J.R. (1990) The general stochastic model of nucleotide
substitution. Journal of Theoretical Biology, 142, 485-501.
Rutherford, M.C. & Westfall, R.H. (1994) Biomes of southern Africa: an objective
categorization. Memoirs of the Botanical Survey of South Africa, 63, 1-94.
Scholtz, C.H. (1989) Unique foraging behaviour in Pachysoma (=Scarabaeus) striatum
Castelnau (Coleoptera: Scarabaeidae): an adaptation to arid conditions? Journal of Arid
Environments, 16, 305-313.
UUnniivveerrssiittyy ooff PPrreettoorriiaa eettdd –– SSoollee,, CC LL ((22000055))

38
Scholtz, C.H. & Chown, S L. (1995) The evolution of habitat use and diet in the
Scarabaeoidea: A phylogenetic approach. Biology, Phylogeny and Classification of
Coleoptera: Papers celebrating the 80th birthday of Roy A. Crowson (ed. by J. Pakaluk
and S.A. Slipinski), pp.354-374. Museum I Instytut Zoologii PAN, Warszawa.
Seely, M.K. & Louw, G.N. (1980) First approximation of the effects of rainfall on the
ecology and energetics of a Namib Desert dune ecosystem. Journal of Arid
Environments, 3, 23-54.
Simon, C., Frati, F., Benckenbach, A., Crespi, B., Liu, H., & Flook, P. (1994) Evolution,
weighting, and phylogenetic utility of mitochondrial gene sequences and a compilation
of conserved polymerase chain reaction primers. Annual Entomological Society of
America, 87, 652-701.
Swofford, D.L. (1998) PAUP*. Phylogentic Analysis using Parsimony, Beta version 4.0b1.
Computer program distributed by the Illinois Natural History Survey, Champaign, IL.
Tajima, F. (1993) Simple methods for testing the molecular evolutionary clock hypothesis.
Genetics, 135, 599-607.
Thompson, J.D., Gibson, T.J., Plewniak, F., Jeanmougin, F. & Higgins, D.G. (1997) The
ClustalX windows interface: flexible strategies for multiple sequence alignment aided
by quality analysis tools. Nucleic Acids Research, 24, 4876-4882.
Ward, J.D. & Corbett, I. (1990) Towards an Age for the Namib. In Namib Ecology: 25 years
of Namib research (ed. M.K. Seely) pp. 17-26. Transvaal Museum Monograph No. 7.
Transvaal Museum, Pretoria.
Wheeler, W.C. (1990) Nucleic acid sequence phylogeny and random outgroups. Cladistics, 6,
363-367.
Yoder, A. D, Rasoloarison, R. M., Goodman, S. M., Irwin, J.A., Atsalis, S., Ravosa, M. J.,
Ganzhorn, J. U. (2000) Remarkable species diversity in Malagasy mouse lemurs
(primates, Microcebus). Proceedings National Academy of Sciences, 97, 11325-11330.
UUnniivveerrssiittyy ooff PPrreettoorriiaa eettdd –– SSoollee,, CC LL ((22000055))

39
Zuckerkandl, E. & Pauling, L. (1965) Evolutionary divergence and convergence in proteins.
In Evolving Genes and Proteins (ed. V. Bryson and H.J. Vogel) pp. 97-166. Academic
Press New York.
UUnniivveerrssiittyy ooff PPrreettoorriiaa eettdd –– SSoollee,, CC LL ((22000055))

40
Chapter III
______________________________________________________________________________
Testing for congruence between morphological and molecular data partitions of
Scarabaeus (Pachysoma) (Scarabaeidae: Scarabaeinae).
Catherine L. Sole1, Armanda D. S. Bastos1, 2 and Clarke H. Scholtz1
1 Department of Zoology & Entomology, University of Pretoria, Pretoria, 0002, South Africa 2 Mammal Research Institute (MRI), Department of Zoology & Entomology, University of Pretoria, Pretoria, 0002,
South Africa
Running Title: Congruence between data partitions of Scarabaeus (Pachysoma) (Scarabaeidae:
Scarabaeinae).
UUnniivveerrssiittyy ooff PPrreettoorriiaa eettdd –– SSoollee,, CC LL ((22000055))

41
Abstract
Scarabaeus (Pachysoma) comprises 13 species endemic to the west coast of southern Africa. A
species level phylogenetic analysis was conducted using 64 morphological characters and 1197 bp of the
Cytochrome Oxidase I (COI) gene. All 13 in-group and eight out-group species were included in the
analyses. Morphological and molecular data sets were analysed both separately and combined, using the
total evidence approach. Strong support is shown for all 13 species within Scarabaeus (Pachysoma) and
its monophyly within Scarabaeus is confirmed. The COI sequence data had high inter- and intra-specific
sequence divergence as well as a high A/T bias. All trees generated using Parsimony, Maximum
Likelihood, Neighbor-Joining and Bayesian methods exhibited similar topologies. The morphological and
molecular data partition phylogenies showed congruence with the combined phylogeny, lending strong
support for combining datasets using total evidence. Phylogenetic trees based on combined data partitions
were relatively more resolved than those based on the individual data analyses. The relative contribution
of each data partition to individual nodes was assessed using Bremer and Partitioned Bremer Support. The
morphological dataset, though small, was not overshadowed by the large molecular dataset in the
combined analysis. A strong association between the phylogenies and geographic distribution over the
total Scarabaeus (Pachysoma) distribution was demonstrated. This study was contrasted with other
phylogenetic studies done on Scarabaeus (Pachysoma) as well as other insect orders. Lastly Scarabaeus
(Pachysoma) mtDNA variation was compared within and between the orders Coleoptera, Lepidoptera,
Hymenoptera and Diptera.
Keywords -Scarabaeidae, Scarabaeus, total evidence, cytochrome oxidase I, morphology, congruence
UUnniivveerrssiittyy ooff PPrreettoorriiaa eettdd –– SSoollee,, CC LL ((22000055))

42
Introduction
Scarabaeus (Pachysoma) MacLeay 1821 is a group of the tribe Scarabaeini (Scarabaeidae:
Scarabaeinae). Members of the Scarabaeini are found in moist savanna through drier regions to
very hot dry deserts (Scholtz, 1989) of the Afrotropics and southern latitudes of the Palaearctic.
The Scarabaeini comprise some 146 species of ball-rolling dung beetles belonging to two genera
(Forgie et al., 2005). Diversification of scarabaeines was thought to coincide with the
diversification of angiosperms and mammalian herbivores resulting in a shift of their feeding
habits from saprophagy and mycetophagy to coprophagy (Cambefort, 1991; Scholtz & Chown,
1995). Scarabaeines predominantly feed on dung, but have also been known to feed on humus,
carrion and fungi (Scholtz & Chown, 1995). Most scarabaeine species are adapted to open
habitats and feed on resources that are usually patchy and ephemeral. Although true food
specialisation is uncommon, it does exist. Scarabaeus (Sceliages) (Forgie et al., 2005), are
specialist necrophages where both adults and larvae feed only on dead millipedes (Forgie et al.,
2002) while the flightless Scarabaeus (Pachysoma) utilise dry dung pellets or detritus (Holm &
Scholtz, 1979; Scholtz, 1989). In contrast to feeding specialisation, generalist - Scarabaeus
(Scarabaeolus) contains species that will utilise dung or carrion - and opportunistic - Scarabaeus
rubripennis has been observed rolling pieces of millipede along as it would a dung ball (Mostert
& Scholtz, 1986) - feeders also exist within this tribe (Forgie et al., 2005).
MacLeay (1821) described the genera Pachysoma and Mnematium for all flightless
species of the Scarabaeini that occur in south-west and north Africa, respectively. The genus
Neopachysoma was created by Ferreira (1953) for the species of Pachysoma inhabiting the
central Namib Desert. Pachysoma was defined by aptery, absence of humeral calli, semi-
contiguous mesocoxae and short mesosterna (Ferreira, 1953). An evaluation by Holm & Scholtz
(1979) concluded that these characteristics were either due to convergence or were too variable
and inconsistent to use as the justification for a genus. They also found no justification for the
separation of Neopachysoma and Mnematium and consequently synonomised both with
Pachysoma. Pachysoma was tentatively maintained as a genus due to its unique biology.
However, the genus was later synonomised with the genus Scarabaeus Linnaeus (1758) by
Mostert & Holm (1982) an act that was questioned by Endrödy-Younga (1989) and Scholtz
(1989) because of Pachysoma’s unique set of morphological and behavioural apomorphies.
UUnniivveerrssiittyy ooff PPrreettoorriiaa eettdd –– SSoollee,, CC LL ((22000055))

43
Scarabaeus (Pachysoma) is represented by 13 species, endemic to the west coast of
southern Africa. Their southerly distribution begins near Cape Town, in South Africa (S33°56’-
E18°28’), with their northerly distribution being halted at the Kuiseb River (S22°58’-E14°30’),
in Namibia, which marks the end of the central Namib dune sea. Southern and eastern expansion
by Scarabaeus (Pachysoma) is confined by the Cape Fold Mountains and escarpments, which act
as topographical and climatic barriers (Harrison et al., 2003). Scarabaeus (Pachysoma) species
are, therefore, restricted to the arid or semi-arid sandy regions of south-western Africa and
psammophily is readily apparent as seen by the long setal hairs on the middle and hind limbs.
Little is known about their biology (Scholtz et al., 2004), but they are unique in their food
relocation strategy. They utilize dry dung pellets or detritus, which they randomly search for, and
bury in a pre-constructed burrow. Dry dung pellets or detritus are gathered up in the setal fringes
of their hind limbs and, dragged forward to be buried below the moisture line, in the pre-
constructed holding chamber (Holm & Scholtz, 1979; Scholtz, 1989; Harrison et al., 2003).
In a recent revision of Scarabaeus (Pachysoma) by Harrison & Philips (2003) the
phylogenetic validity of Pachysoma was evaluated using cladistic methods. Harrison & Philips
(2003) maintained the synonymy of Neopachysoma Ferreira with Pachysoma while Mnematium
MacLeay was regarded as a synonym of Scarabaeus. Pachysoma was confirmed as being a
distinct monophyletic clade within Scarabaeus and was therefore classified as a derived
subgenus thereof (Harrison et al., 2003; Forgie et al., 2005). Based on Harrison & Philips’s
(2003) phylogeny, Sole et al. (2005) re-examined Scarabaeus (Pachysoma) at a molecular level
using Cytochrome Oxidase I (COI) mitochondrial sequence data. Eleven of the 13 species were
supported at a molecular level with S. (P.) hippocrates and S. (P.) glentoni forming a species
complex. Scarabaeus (Pachysoma) was confirmed as being monophyletic within Scarabaeus.
The synonymy of Neopachysoma with Pachysoma was supported even though it is clearly a
distinct lineage within Scarabaeus (Pachysoma) (Sole et al., 2005; Forgie et al., 2005).
In this study we firstly, re-construct the phylogeny of Scarabaeus (Pachysoma) using
both morphological (Harrison et al., 2003) and molecular (Sole et al., 2005) data partitions and
secondly, by using the total evidence approach we test for congruence between the two data
partitions. In this way the relative overall contribution of these character sets to the combined
phylogeny could be assessed.
UUnniivveerrssiittyy ooff PPrreettoorriiaa eettdd –– SSoollee,, CC LL ((22000055))
44
Material and Methods
Taxa
In-group taxa - All 13 species of the subgenus Pachysoma were used to infer the phylogeny.
These are: S. (P.) aesculapius (Olivier), S. (P.) bennigseni (Felsche), S. (P.) denticollis
(Péringuey), S. (P.) endroedyi Harrison, Scholtz & Chown, S. (P.) fitzsimonsi (Ferreira), S. ( P.)
gariepinus (Ferreira), S. ( P.) glentoni Harrison, Scholtz & Chown, S. (P.) hippocrates
(MacLeay), S. ( P.) rodriguesi (Ferreira), S. ( P.) rotundigenus (Felsche), S. ( P.) schinzi
(Fairmaire), S. (P.) striatus (Castelnau) and S. ( P.) valeflorae (Ferreira).
Out-group taxa - The following species were included as they are atypical (see Table 1)
and their taxonomy was controversial in the past (Forgie et al., 2005): Scarabaeus
[Drepanopodus] proximus Janssens, Scarabaeus rugosus (Hausman), Scarabaeus [Neateuchus]
proboscideus (Guérin), Scarabaeus galenus (Westwood), Scarabaeus (Scarabaeolus)
rubripennis (Boheman), Scarabaeus (Sceliages) brittoni zur Strassen, Scarabaeus rusticus
(Boheman) and Scarabaeus westwoodi Harold all from the tribe Scarabaeini. The out-group
representatives were chosen based on relationships indicated by recent phylogenetic studies
(Harrison et al., 2003; Forgie et al., 2005) and taking into account selection criteria of Nixon &
Carpenter (1993).
All species mentioned above were included in the molecular, morphological and
combined data analyses. Synonyms of Scarabaeus used in this study are indicated in square
brackets and include Neateuchus Gillet (synonomised by Mostert & Scholtz, 1986),
Neopachysoma Ferreira (synonomised by Holm & Scholtz, 1979) and Drepanopodus Jannsens
(synonomised by Forgie et al., 2005). Table 2 includes all the species used in this study, the data
partitions used, the source of the data and accession numbers.
Phylogenetic Analysis
Statistics
The molecular data were subjected to preliminary sequence analyses prior to phylogenetic
analysis. The best model of sequence evolution, the proportion of invariable sites and the α
parameter of the distribution of rate variation among sites (Yang et al., 1994) �were estimated in
Modeltest 3.0 (Posada & Crandall, 1998). The average nucleotide and amino acid p-distances
UUnniivveerrssiittyy ooff PPrreettoorriiaa eettdd –– SSoollee,, CC LL ((22000055))
45
were calculated in MEGA version 2.1 (Kumar et al., 2001), within and between both out - and in
- group taxa. MEGA was also used to calculate sequence divergence values.
Molecular data
The total aligned molecular matrix consists of 1197 base pairs (bp), corresponds to bases 1713 to
2910 of the Cytochrome Oxidase I gene of Locusta migratoria Linneaus (Genbank Accession
No. NC_001712). A total of 54 individuals were used for this study, of which 46 (accession
numbers on GenBank AY258214 – AY258258) where in-group taxa and 8 identified as out-
group taxa. The laboratory procedures for amplifying and sequencing followed standard
protocols described previously (Sole et al., 2005). Sequences were aligned in Clustal X
(Thompson et al., 1997) and subsequent analyses were performed in PAUP*4.0b1 (Swofford,
1998).
Both Maximum Likelihood (ML) and Maximum Parsimony (MP) methods were used to
infer phylogenetic relationships between species. The robustness of the results was assessed by
means of bootstrap analysis (Felsenstein, 1985), using 1 000 pseudoreplicates and branch-and-
bound searching (nucleotides treated as unordered characters). A single representative from each
species was included in the ML analysis, except for S. (P.) glentoni for which two specimens
were included one of which no resolution had been previously obtained (see results below and
Chapter 2 (Sole et al., 2005) for details). The parameters estimated by Modeltest were used in a
Maximum Likelihood heuristic analysis with 1000 pseudoreplicates.
UUnniivveerrssiittyy ooff PPrreettoorriiaa eettdd –– SSoollee,, CC LL ((22000055))

46
Table 1. Summary of the wing status, feeding specialisation and modes of dung removal for the species used in this study.
Taxa Distribution Wing Status Feeding Specialisation Modes S. [Neateuchus] proboscideus (Guérin) Afrotropical (W South Africa, Kalahari) Macropterous wet dung Rolling S. [Neopachysoma] denticollis (Péringuey) Afrotropical (Namib desert) Apterous dry dung pellets/detritus Dragging S. [Neopachysoma] rodriguesi (Ferreira) Afrotropical (Namib desert) Apterous dry dung pellets/detritus Dragging S. [Neopachysoma] rotundigenus (Felsche) Afrotropical (Namib desert) Apterous dry dung pellets/detritus Dragging S. (Pachysoma) aesculapius Olivier Afrotropical (W South Africa) Apterous dry dung pellets/detritus Dragging S. (Pachysoma) hippocrates (MacLeay) Afrotropical (W South Africa) Apterous dry dung pellets/detritus Dragging S. (Pachysoma) glentoni Harrison, Scholtz & Chown Afrotropical (W Africa; south Olifants River ) Apterous dry dung pellets/detritus Dragging S. (Pachysoma) endroedyi Harrison, Scholtz & Chown Afrotropical (W Africa; north Olifants River) Apterous dry dung pellets/detritus Dragging S. (Pachysoma) striatus (Castelnau) Afrotropical (W South Africa) Apterous dry dung pellets/detritus Dragging S. (Pachysoma) gariepinus (Ferreira) Afrotropical (W Africa) Apterous dry dung pellets/detritus Dragging, Rolling S. (Pachysoma) bennigseni (Felsche) Afrotropical (W Africa) Apterous dry dung pellets/detritus Dragging S. (Pachysoma) schinzi (Fairmaire) Afrotropical (W Namibia) Apterous dry dung pellets/detritus Dragging S. (Pachysoma) valeflorae (Ferreira) Afrotropical (W Namibia) Apterous dry dung pellets/detritus Dragging S. (Pachysoma) fitzsimonzi (Ferreira) Afrotropical (W Namibia) Apterous dry dung pellets/detritus Dragging S. (Scarabaeolus) rubripennis (Boheman) Afrotropical (Namib desert) Macropterous opportunistic Rolling Scarabaeus galenus (Westwood) Afrotropical (Southern Africa) Macropterous wet dung pellets Carrying, Tunnelling, Pushing Scarabaeus rusticus (Boheman) Afrotropical (South Africa) Macropterous wet dung Rolling Scarabaeus westwoodi Harold Afrotropical (Southern + East Africa) Macropterous wet dung Rolling Scarabaeus rugosus (Hausman) Afrotropical (SW South Africa) Macropterous wet dung Rolling Scarabaeus (Sceliages) brittoni zur Strassen Afrotropical (W South Africa) Macropterous obligate necrophage Pushing Scarabaeus [Drepanopodus] proximus Jannsens Afrotropical ( South Africa) Macropterous wet dung Rolling
*Most species of Scarabaeini are adapted to open habitats and feed on resources that are patchy. True food specialisation in the tribe is uncommon but does occur, listed
above.
UUnniivveerrssiittyy ooff PPrreettoorriiaa eettdd –– SSoollee,, CC LL ((22000055))

47
Table 2. Summary of the species used in this study including where the data were obtained.
Taxa Tribe Morphology Molecular Accession Numbers S. [Neopachysoma] denticollis (Péringuey) Scarabaeini Harrison, 1999 Sole et al., 2005 See Text S. [Neopachysoma] rodriguesi Ferreira Scarabaeini Harrison, 1999 Sole et al., 2005 See Text S. [Neopachysoma] rotundigenus (Felsche) Scarabaeini Harrison, 1999 Sole et al., 2005 See Text S. (Pachysoma) aesculapius Olivier Scarabaeini Harrison, 1999 Sole et al., 2005 See Text S. (Pachysoma) hippocrates (MacLeay) Scarabaeini Harrison, 1999 Sole et al., 2005 See Text S. (Pachysoma) glentoni Harrison, Scholtz & Chown Scarabaeini Harrison, 1999 Sole et al., 2005 See Text S. (Pachysoma) endroedyi Harrison, Scholtz & Chown Scarabaeini Harrison, 1999 Sole et al., 2005 See Text S. (Pachysoma) striatus (Castelnau) Scarabaeini Harrison, 1999 Sole et al., 2005 See Text S. (Pachysoma) gariepinus (Ferreira) Scarabaeini Harrison, 1999 Sole et al., 2005 See Text S. (Pachysoma) bennigseni (Felsche) Scarabaeini Harrison, 1999 Sole et al., 2005 See Text S. (Pachysoma) schinzi (Fairmaire) Scarabaeini Harrison, 1999 Sole et al., 2005 See Text S. (Pachysoma) valeflorae (Ferreira) Scarabaeini Harrison, 1999 Sole et al., 2005 See Text S. (Pachysoma) fitzsimonzi (Ferreira) Scarabaeini Harrison, 1999 Sole et al., 2005 See Text S. (Scarabaeolus) rubripennis (Boheman) Scarabaeini Harrison, 1999 Sole et al., 2005 AF499763 S. [Neateuchus] proboscideus (Guérin) Scarabaeini Harrison, 1999 Sole et al., 2005 AF499757 Scarabaeus rusticus (Boheman) Scarabaeini Harrison, 1999 Forgie, 2003 AF499767 Scarabaeus westwoodi Harold Scarabaeini Harrison, 1999 Forgie, 2003 AF499769 Scarabaeus galenus (Westwood) Scarabaeini Harrison, 1999 Forgie, 2003 AF499764 Scarabaeus rugosus (Hausman) Scarabaeini Harrison, 1999 Forgie, 2003 AF499766 Scarabaeus (Sceliages) brittoni zur Strassen Scarabaeini Harrison, 1999 Forgie, 2003 AF499772 Scarabaeus [Drepanopodus] proximus Jannsens Scarabaeini Harrison, 1999 Sole, unpubl. AY965239
* The columns entitled molecular and morphology are data types that were used and the references in these columns indicate the source of the data
UUnniivveerrssiittyy ooff PPrreettoorriiaa eettdd –– SSoollee,, CC LL ((22000055))

48
Morphological data analysis
The raw morphological data for the analyses were obtained from Harrison & Philips (2003). The
morphological dataset comprised 64 characters of which 39 were external and 25 internal
characters; 16 were bipolar and 48 multi-state (see Appendix 1 for characters) (For details of the
morphological characters see Harrison & Philips, 2003). This morphological dataset which was
originally analysed in NONA v 2.0 (Goloboff, 1997) was re-analysed in PAUP* using
Parsimony analysis to determine the phylogenetic relationships between the species. The
parsimony analysis was re-weighted using the re-scaled consistency index (Farris, 1969) and
bootstrap analysis was used to assess the robustness of the results, using 1 000 pseudoreplicates
and branch-and-bound searching. All trees were rooted and characters were coded as unordered.
Combined data analysis
A total of 21 species, comprising a single individual from each taxon, was used for the combined
analysis. To compare the similarity of phylogenetic signal between different data partitions, the
partition homogeneity test was calculated across and between both data partitions in PAUP*,
with 1,000 replications (Farris et al., 1995; Creer et al., 2003). A Parsimony analysis was done,
in PAUP*, and re-weighted using the re-scaled consistency index after which 1000 bootstrap
replicates were performed (Felsenstein, 1985) with branch-and-bound searching.
TreeRot.v2 (Sorensen, 1999) was used to calculate total Bremer support (BS) values at
each node (Bremer, 1988) and to determine partitioned Bremer support (PBS) (Baker & DeSalle,
1997; Baker et al., 1998) values for each data partition in the combined parsimony tree. Different
datasets provide different amounts of support when combined. PBS, therefore, calculates the
amount of support each dataset contributes towards the complete combined phylogeny. PBS
values can be positive, negative or zero and their sum equals the value of the Bremer support for
that node. Positive values indicate that, within a combined data framework, a given partition
supports that particular node over any alternative relationships specified by the most
parsimonious tree(s) without that node. Negative values indicate that, again in a combined
analysis framework, the length of a partition is shorter on the topology of alternate tree(s) not
containing a given node and therefore contains contradictory evidence for that node (Baker et al.,
1998). Bremer support values were calculated using 20 unrestricted random addition sequences
per node.
UUnniivveerrssiittyy ooff PPrreettoorriiaa eettdd –– SSoollee,, CC LL ((22000055))

49
Bayesian Analysis
A Bayesian phylogenetic analysis for the combined and molecular datasets was performed with
MrBayes 3 (Huelsenbeck & Ronquist, 2001). The Bayesian analysis approximates the posterior
probability (Huelsenbeck et al., 2001) for a phylogenetic tree by successively altering the model
parameter values in a Markov Chain Monte Carlo (MCMC) procedure. A random tree and
parameter values are initially chosen and for each step in the chain a new combination of
topology and parameter values are either accepted or rejected according to the Metropolis-
Hastings-Green algorithm. Log-likelihood values are calculated for each topology combination
and recorded, once these have reached a plateau i.e. stabilised, the frequency at which a clade
appears among the sampled trees is then deemed an approximation of the posterior probability.
In order to efficiently traverse the parameter space, several chains are run simultaneously at
different designated theoretical temperatures. A heated chain moves more easily across a valley
and thereby prevents the chain being trapped at a local optimum.
The model for Bayesian analysis was selected with the likelihood-ratio test in Modeltest.
Four different analyses were run, beginning with random starting trees. For every analysis five
Markov Chains (four heated (temperature = 0.05) and one cold (temperature = 1)) where run for
3 000 000 generations with trees being sampled every 100th generation. Of the four analyses, 25
000 trees were used to determine a consensus phylogeny and posterior probability of the nodes
(Warren et al., 2003).
Results
Molecular dataset statistics
Modeltest selected the GTR model (Rodriguez et al., 1990) with proportion of invariable sites
and gamma distribution shape parameter estimated at 0.57 and 0.88, respectively. The within-
species sequence divergence ranged from as low as 0.8 % in S. (P.) schinzi to 5.7 %, 5.8 % and
6.3 % in S. (P.) hippocrates, S. (P.) glentoni and S. (P.) valeflorae, respectively (Table 3). The
average nucleotide pairwise distances within Scarabaeus (Pachysoma) ranged from 8 % to 15.3
%, while the average amino acid pairwise distance ranged from 1.3 % to 5.5 % (Table 4).
UUnniivveerrssiittyy ooff PPrreettoorriiaa eettdd –– SSoollee,, CC LL ((22000055))
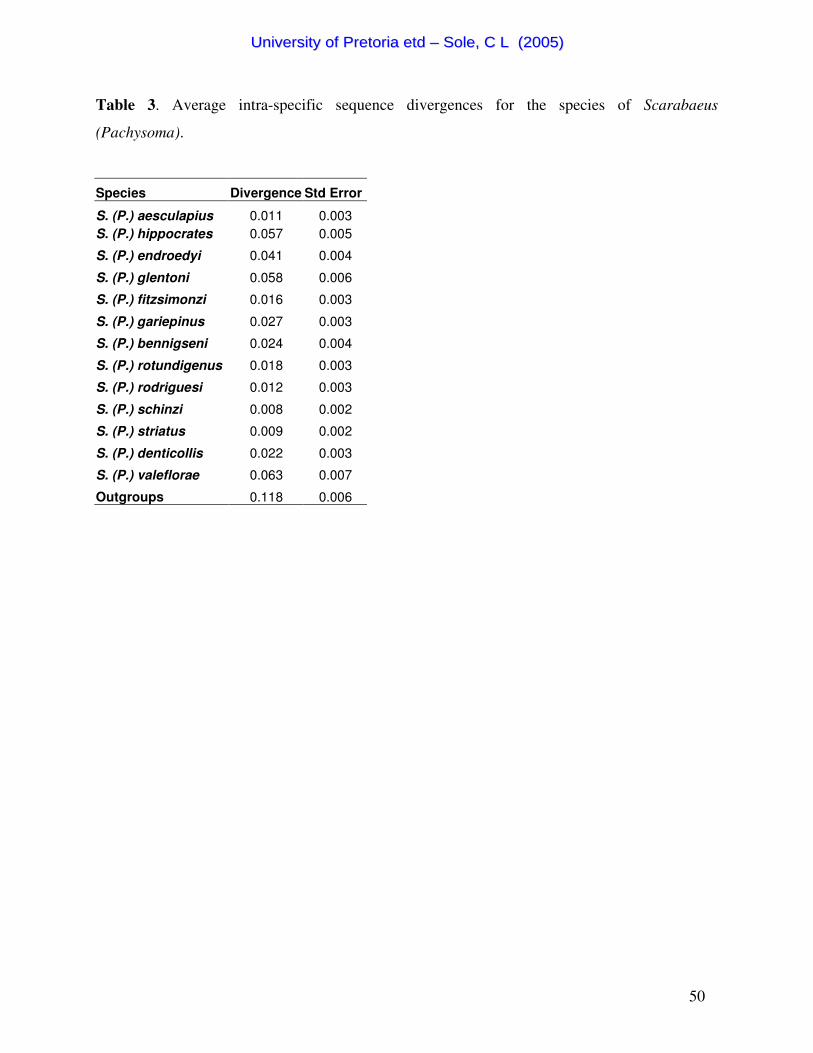
50
Table 3. Average intra-specific sequence divergences for the species of Scarabaeus
(Pachysoma).
Species Divergence Std Error
S. (P.) aesculapius 0.011 0.003 S. (P.) hippocrates 0.057 0.005
S. (P.) endroedyi 0.041 0.004
S. (P.) glentoni 0.058 0.006
S. (P.) fitzsimonzi 0.016 0.003
S. (P.) gariepinus 0.027 0.003
S. (P.) bennigseni 0.024 0.004
S. (P.) rotundigenus 0.018 0.003
S. (P.) rodriguesi 0.012 0.003
S. (P.) schinzi 0.008 0.002
S. (P.) striatus 0.009 0.002
S. (P.) denticollis 0.022 0.003
S. (P.) valeflorae 0.063 0.007
Outgroups 0.118 0.006
UUnniivveerrssiittyy ooff PPrreettoorriiaa eettdd –– SSoollee,, CC LL ((22000055))

51
Table 4. Average uncorrected nucleotide- (p) and amino acid- distances over all 54 individuals of S. (Pachysoma) analysed. The average
nucleotide p-distances are indicated in the bottom left of the table while the amino acid p-distances can be found at the top right hand corner.
Species 1 2 3 4 5 6 7 8 9 10 11 12 13 14 S. (P.) aesculapius 1 0.029 0.039 0.027 0.033 0.034 0.033 0.044 0.041 0.030 0.041 0.037 0.043 0.051
S. (P.) hippocrates 2 0.123 0.043 0.013 0.040 0.037 0.042 0.043 0.043 0.039 0.051 0.040 0.049 0.053
S. (P.) endroedyi 3 0.123 0.110 0.043 0.041 0.039 0.041 0.045 0.055 0.044 0.049 0.042 0.046 0.056
S. (P.) glentoni 4 0.120 0.080 0.105 0.038 0.035 0.039 0.040 0.042 0.038 0.049 0.037 0.047 0.051
S. (P.) fitzsimonzi 5 0.138 0.128 0.118 0.125 0.017 0.020 0.032 0.036 0.020 0.034 0.022 0.028 0.040
S. (P.) gariepinus 6 0.131 0.121 0.120 0.118 0.104 0.025 0.026 0.030 0.025 0.040 0.018 0.030 0.031
S. (P.) bennigseni 7 0.134 0.135 0.132 0.132 0.111 0.116 0.032 0.035 0.025 0.034 0.029 0.036 0.040
S. (P.) rotundigenus 8 0.153 0.139 0.136 0.144 0.124 0.126 0.144 0.026 0.036 0.041 0.022 0.039 0.038
S. (P.) rodriguesi 9 0.140 0.127 0.128 0.137 0.124 0.125 0.137 0.110 0.035 0.048 0.031 0.045 0.044
S. (P.) schinzi 10 0.137 0.123 0.120 0.127 0.114 0.130 0.134 0.136 0.127 0.033 0.028 0.031 0.043
S. (P.) striatus 11 0.141 0.142 0.133 0.141 0.127 0.122 0.138 0.145 0.151 0.133 0.045 0.044 0.054
S. (P.) denticollis 12 0.151 0.140 0.134 0.139 0.129 0.129 0.144 0.111 0.109 0.135 0.149 0.032 0.036
S. (P.) valeflorae 13 0.127 0.109 0.109 0.119 0.117 0.116 0.132 0.137 0.121 0.095 0.131 0.132 0.046 Outgroups 14 0.153 0.144 0.137 0.144 0.126 0.136 0.148 0.146 0.139 0.137 0.158 0.142 0.126
UUnniivveerrssiittyy ooff PPrreettoorriiaa eettdd –– SSoollee,, CC LL ((22000055))
52
Molecular data set
Of the 474 variable sites identified, 421 sites were parsimoniously informative and 53 were
singletons. The ratio of parsimoniously informative characters (421) to the number of
OTU’s/haplotypes (42) was very high and would have contributed to the good resolution of the
MP tree. The proportion of nucleotide mutations at first, second and third base positions was 19
%, 5 % and 76 % respectively and base composition over the 1 197 base pairs was 39.2 %, 16.1
%, 30.5 % and 14.2 % for T, C, A and G respectively.
The un-weighted parsimony analysis resulted in a single tree with a length of 2177, a
consistency index (CI) of 0.314, a retention index (RI) of 0.691, and a re-scaled consistency
index (RC) of 0.217 (Fig 1). A single Maximum Likelihood (ML) tree was obtained assuming
the GTR model with 57.2% invariant sites, a transition-transversion ratio of 1.2 and a gamma
distribution shape parameter of 0.88. The un-weighted MP tree had a similar topology to those
trees obtained following Neighbor Joining (NJ), Minimum Evolution (ME), ML and Bayesian
analyses (results not shown) confirming that the data were not sensitive to the underlying
assumptions of the different analysis methods.
The COI gene phylogeny (Fig. 1) reveals the presence of three distinct clades (labelled A,
B and C). Clade A comprises 21 individuals, representing six morphological species, namely S.
(P.) hippocrates, S. (P.) glentoni, S. (P.) aesculapius, S. (P.) endroedyi, S. (P.) valeflorae and S.
(P.) schinzi. There is high bootstrap support (between 85 % and 100 %) for four of the six
morphological species in this clade with a single individual, S. (P.) glentoniLEIPV03, not
grouping with the other two representatives of this morphological species. Instead, a species
complex comprising 11 individuals of S. (P.) glentoni and S. (P.) hippocrates (henceforth
referred to as the hippocrates/glentoni complex) was recovered. Clade B supports four species, S.
(P.) fitzsimonsi, S. (P.) bennigseni, S. (P.) striatus and S. (P.) gariepinus each with 100%
support. Clade C (100 % support) supports three species each with 100% bootstrap support,
namely S. (P.) denticollis, S. (P.) rotundigenus and S. (P.) rodriguesi.
UUnniivveerrssiittyy ooff PPrreettoorriiaa eettdd –– SSoollee,, CC LL ((22000055))

53
Figure 1. The single most Parsimonious tree of the COI gene phylogeny of Scarabaeus (Pachysoma)
with bootstrap values greater than 50 % indicated next to the relevant nodes. A, B and C indicate three
distinct clades within Scarabaeus (Pachysoma). Maximum Likelihood bootstrap values are in brackets.
UUnniivveerrssiittyy ooff PPrreettoorriiaa eettdd –– SSoollee,, CC LL ((22000055))

54
Morphological data set
Un-weighted analysis of the 64 characters (Appendix 1), of which 61 were informative, resulted
in 20 most parsimonious trees (length = 244, CI = 0.51, RI = 0.74, RC = 0.38). The re-weighted
parsimony analysis resulted in two most parsimonious trees (length = 77.447, CI = 0.696, RI =
0.888 and RC = 0.618), of which the strict consensus tree is shown in Figure 2. Scarabaeus
(Pachysoma) appears monophyletic within Scarabaeus with 100 % bootstrap support. All the
species within Scarabaeus (Pachysoma) appear monophyletic with relatively good bootstrap
support (between 50 % and 95 %) for all 13 species. S. (P.) schinzi and S. (P.) valeflorae are
sister species, with 60 % bootstrap support and appear as outliers to the other 11 species. S. (P.)
hippocrates, S. (P.) glentoni, S. (P.) endroedyi and S. (P.) aesculapius form a distinct group (91
% bootstrap support) within the Scarabaeus (Pachysoma) lineage. S. (P.) hippocrates and S. (P.)
glentoni form sister species, with 85 % bootstrap support.
Figure 3 shows a scanned copy of the tree taken directly out of Harrison & Philips
(2003). Harrison & Philips (2003) constructed the Parsimony tree in NONA v. 2.0 (Goloboff,
1997) and for details thereof see Harrison & Philips (2003). Scarabaeus (Pachysoma) is clearly
monophyletic within Scarabaeus. S. (P.) hippocrates and S. (P.) endroedyi are sister taxa S. (P.)
schinzi and S. (P.) valeflorae are sister species and do not fall as outliers as in the molecular
analysis. S. (P.) fitzsimonsi, S. (P.) bennigseni, S. (P.) striatus and S. (P.) gariepinus group
together and are central within the Scarabaeus (Pachysoma) lineage. S. (P.) denticollis, S. (P.)
rotundigenus and S. (P.) rodriguesi are sister to each other and form a distinct clade within
Scarabaeus (Pachysoma).
Combined Analysis
The partition homogeneity test (Farris et al., 1995) on the combined data (two partitions: COI
1197 bp and 64 morphological characters) indicated that the data partitions did not differ
significantly (p = 0.187 at p ≥ 0.05) and could therefore be combined. A heuristic search
produced two most parsimonious trees (length = 2058, CI = 0.34, RI = 0.40 and RC = 0.14). A
single most parsimonious tree was obtained by successive weighting using the re-scaled
consistency index (length = 237.107, CI = 0.541, RI = 0.742 and RC = 0.402) and is presented in
Figure 4. Bootstrap, Bremer and partitioned Bremer support values are also shown on Figure 4.
UUnniivveerrssiittyy ooff PPrreettoorriiaa eettdd –– SSoollee,, CC LL ((22000055))

55
The combined data analysis supports both the morphological and molecular analysis by
showing that Scarabaeus (Pachysoma) is a monophyletic lineage within Scarabaeus supported
by both high bootstrap and Bremer support (100 % bootstrap support and BS = 30) with both the
molecular and morphological data partitions contributing. The Scarabaeus (Pachysoma) lineage
shows three distinct clades (labelled A, B and C) as in the molecular data set analysis (Fig. 1).
Clade A supports six morphological species (80 % bootstrap support), namely S. (P.)
hippocrates, S. (P.) glentoni, S. (P.) aesculapius, S. (P.) endroedyi, S. (P.) valeflorae and S. (P.)
schinzi. S. (P.) hippocrates, S. (P.) glentoni, S. (P.) aesculapius and S. (P.) endroedyi form a
distinct lineage (100 % bootstrap) within this clade as in both the morphological and molecular
data partition analyses. S. (P.) hippocrates and S. (P.) glentoni form sister species (100 %
bootstrap and BS = 12), as do S. (P.) valeflorae and S. (P.) schinzi (99 % bootstrap and BS = 6).
S. (P.) aesculapius and S. (P.) endroedyi form sister species with 93 % bootstrap support. Group
B supports four monophyletic species, S. (P.) fitzsimonsi, S. (P.) gariepinus, S. (P.) bennigseni
and S. (P.) striatus (85 % bootstrap support, BS = 2). Group C supports three species, S. (P.)
denticollis, S. (P.) rotundigenus and S. (P.) rodriguesi, with 100% bootstrap support (BS = 17).
The molecular and morphological data partitions, according to the PBS, appear in most instances
to contribute equally to the whole phylogeny. There are however two instances where very large
support is obtained from the molecular dataset, Clade C (PBS = 16) and for S. (P.) hippocrates
and S. (P.) glentoni (PBS = 11) as sister species.
UUnniivveerrssiittyy ooff PPrreettoorriiaa eettdd –– SSoollee,, CC LL ((22000055))

56
Figure. 2. The Strict consensus Parsimony tree of the morphological data partition of Scarabaeus
(Pachysoma) with bootstrap values indicated.
UUnniivveerrssiittyy ooff PPrreettoorriiaa eettdd –– SSoollee,, CC LL ((22000055))
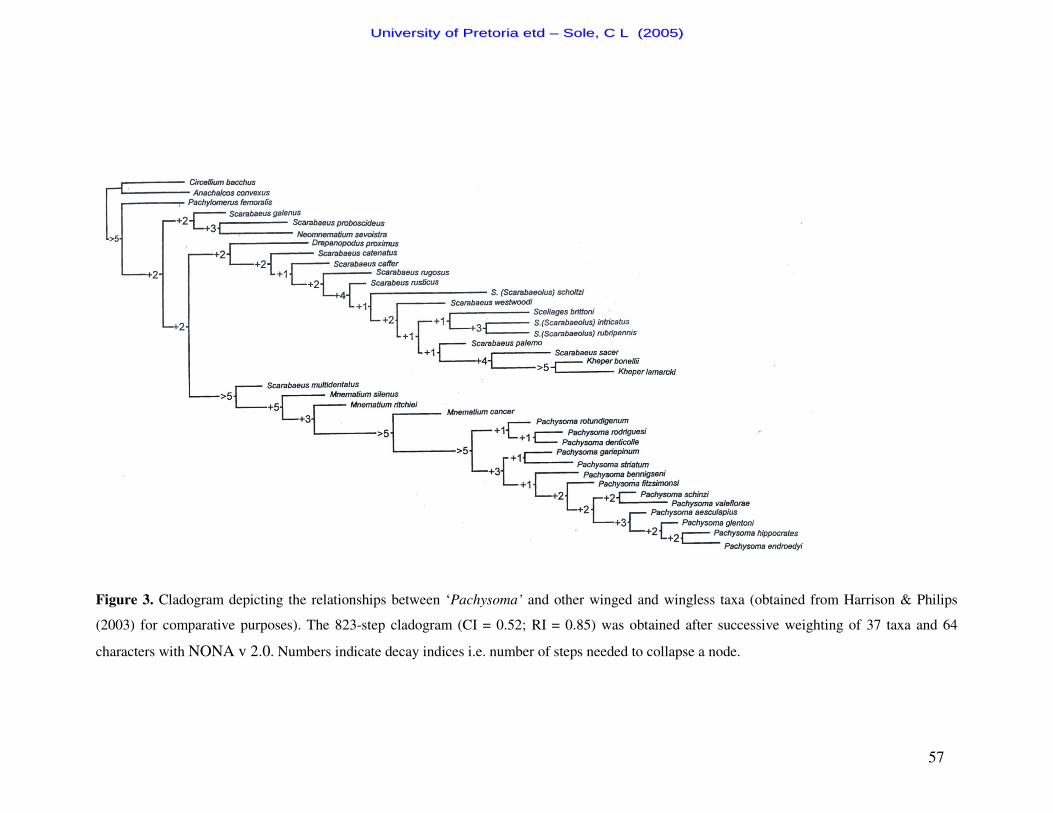
57
Figure 3. Cladogram depicting the relationships between ‘Pachysoma’ and other winged and wingless taxa (obtained from Harrison & Philips
(2003) for comparative purposes). The 823-step cladogram (CI = 0.52; RI = 0.85) was obtained after successive weighting of 37 taxa and 64
characters with NONA v 2.0. Numbers indicate decay indices i.e. number of steps needed to collapse a node.
UUnniivveerrssiittyy ooff PPrreettoorriiaa eettdd –– SSoollee,, CC LL ((22000055))

58
Figure 4. Parsimony tree of combined data partitions. Bootstrap values presented in bold black,
Bremer support values are in red and partitioned Bremer support (PBS) values in blue. For PBS
values the first value is that for the COI data partition and the second value that for the morphological
data partition. (A, B and C represent three clades within the Scarabaeus (Pachysoma) lineage, as seen
in the molecular phylogeny).
UUnniivveerrssiittyy ooff PPrreettoorriiaa eettdd –– SSoollee,, CC LL ((22000055))
59
Discussion
Data analysis
Phylogenetic relationships of Scarabaeus (Pachysoma) were reconstructed using both
molecular and morphological datasets. The expression of differences within a clade is related
to its history and to the environmental parameters within which it develops. Both the
morphological and COI data partitions display similar patterns between the relationships of
the species and have significant phylogenetic structure. It is interesting that such different
datasets provide strong phylogenetic signal as individual data partitions as well as when
combined. In addition, congruence among datasets is a strong indicator of support for
phylogenies based on individual datasets (Wheeler, 1995). Partitioned Bremer Support
(Baker & DeSalle, 1997) provides a means of assessing the contribution of molecular and
morphological data to the total support of the simultaneous analysis tree. It appeared that the
COI dataset lent more support to the overall tree topology of the combined dataset analysis.
However, despite the potential differences, consistent compatible trees were recovered which
suggest that the models used to analyse the data were adequate for recovering the correct
phylogenetic signal (Miyamoto & Fitch, 1995; Clark et al., 2001). Considering that the
partition homogeneity test was not significant, it would indicate that the combined dataset
maximises the amount of information gained by revealing the correct tree (Vogler & Pearson,
1997; Clark et al., 2001). Combining of datasets is under debate and a contentious issue
(Bull et al., 1993; de Queiroz et al., 1995; Miyamoto & Fitch, 1995; Funk et al., 1995b;
Huelsenbeck et al., 1996; Yoder et al., 2001). However the decision to combine datasets in
this study was conservative as similar trees were obtained from both the morphological and
molecular phylogenies, and the combined dataset improved resolution, lending strong support
for combining good datasets. This was reflected by the robust support for clades in both the
molecular and morphological data partition analyses, which was upheld by combining the
data partitions.
Differences between phylogenies based on different datasets
Even though it can clearly be seen that increased or better resolution is obtained by
combining datasets in this study certain differences do occur between the phylogenies. The
morphological phylogeny shows S. (P.) schinzi and S. (P.) valeflorae group almost as a
totally separate clade, which is a major difference between the phylogenies. The other
difference noted was the relationships of the central four species, S. (P.) fitzsimonsi, S. (P.)
gariepinus, S. (P.) bennigseni and S. (P.) striatus, to each other. S. (P.) hippocrates and S.
UUnniivveerrssiittyy ooff PPrreettoorriiaa eettdd –– SSoollee,, CC LL ((22000055))

60
(P.) glentoni appear to be sister taxa in all our analyses but not in the phylogeny of Harrison
& Philips (2003). These differences do not, however, detract from the fact that 13 good
species can be identified and Scarabaeus (Pachysoma) is a monophyletic lineage within
Scarabaeus. As morphological and genetic distinctiveness are not strictly correlated
discrepancies are often encountered between gene trees and species trees (Vink & Paterson,
2003).
Many studies to date have included combining of datasets, some combining only
different genes (i.e. mitochondrial and nuclear) while others combine genes with
morphology. Both the genes and morphology of a single individual are exposed to the same
environmental parameters but may respond differently in the way that these parameters are
dealt with. Different data types are independent indicators of a phylogeny and by combining
the unlinked data partitions one would hope to attain an overall similar picture of the
relationships relating to the relevant studied taxa. Different studies based on the total
evidence approach have shown that by combining different datasets as well as different
combinations of the overall available data better resolved trees are more often than not
obtained. For examples see Notothenioidei: Channichthyidae (Near et al., 2003), Aranae:
Lycosidae (Vink & Paterson, 2003), Diptera: Muscidae (Savage et al., 2004), Coleoptera:
Scarabaeidae (Cabrero-Sañudo & Zardoya, 2004) and Rodentia: Bathyergidae (Ingram et al.,
2004). Combining data partitions provides a means to discriminate amongst alternate
hypotheses posed within the group of interest.
Comparison with prior phylogenetic studies
a) Pachysoma vs. Pachysoma
The inferred trees provide robust evidence for the monophyly of Scarabaeus (Pachysoma),
supporting previous studies by Harrison & Philips (2003) and Forgie et al. (2005). All
phylogenetic estimates in the study support the traditional morphological phylogeny by
Harrison & Philips (2003). This is not surprising as Scarabaeus (Pachysoma) is a well-
studied group of dung beetles from a taxonomic point of view (MacLeay, 1821; Ferreira,
1953; Holm & Scholtz, 1979; Mostert & Holm, 1982; Endrödy-Younga, 1989; Harrison et
al., 2003; Sole et al., 2005).
Our results also generally concur with Davis’s (1990) phenogram which shows three
distinct groupings on the phenogram that correspond to the three clades revealed by the
molecular and combined analyses within Scarabaeus (Pachysoma), indicated by ‘A, B and C’
UUnniivveerrssiittyy ooff PPrreettoorriiaa eettdd –– SSoollee,, CC LL ((22000055))

61
(Figures 1 & 4, respectively). The species groups delineated by Davis (1990) were based on
28 coded characters described by Holm & Scholtz (1979) and are as follows:
I) S. (P.) aesculapius, S. (P.) hippocrates and S. (P.) schinzi = clades labelled
A on the combined and morphological phylogenies respectively
II) S. (P.) bennigseni, S. (P.) gariepinus, S. (P.) striatus and S. (P.) fitzsimonsi
= clades labelled B on the combined and morphological phylogenies
respectively
III) S. (P.) rodriguesi, S. (P.) denticollis and S. (P.) rotundigenus = clades
labelled C on the combined and morphological phylogenies respectively.
b) mtDNA variation in Pachysoma vs. other insect orders
Intra-genic variability in evolutionary rate, at lower level taxonomy, has received little
attention, but it appears that the evolutionary rates among portions of COI have remained
similar throughout much of insects’ evolutionary history (Lunt et al., 1996; Langor &
Sperling, 1997). The overall A-T content of the 1 197 bp region of the partial COI gene in
Scarabaeus (Pachysoma) is 69.7 %, which is at the lower end of the 68-76 % range reported
for other insects (reviewed by Lunt et al., 1996). The average intra-specific COI divergences
for Scarabaeus (Pachysoma) range between 0.8 and 6.3 % which are comparable to other
species of Coleoptera for example Pissodes species complex (Curculionidae) (0.5 - 7.5 %;
Langor & Sperling, 1997); Ophraella (Chrysomelidae) (3.8%; Funk et al., 1995a; Funk et al.,
1995b); Hypera postica (Gyllenhal) (Curculionidae) (3.1 %; Erney et al., 1996) and
Prodontria Broun (Scarabaeidae: Melolonthinae) (1.47 %; Emerson & Wallis, 1995). The
figures are also similar in other insect orders for example Papilio (Lepidoptera: Papilionidae)
(0 - 9 %; Sperling, 1993; Sperling & Harrison, 1994), Apis (Hymenoptera: Apidae) 0.15 -
1.70 %; Sittipraneed et al., 2001), Drosophila (Diptera: Drosophilidae) (1.5 - 10 %; Solignac
et al., 1986) and Anopheles (Diptera: Culicidae) (0.005 - 1.2 %; Sedaghat et al., 2003).
Comparison with these studies is cautioned, however, as the portions of mtDNA, the
assessment methods used (nucleotide data/RFLP), and the degree of relatedness of the clades
examined may all have differed between studies (Langor & Sperling, 1997). Recent
population bottlenecks, selective sweeps of favoured haplotypes or high variance among-
family reproductive success may tend to reduce mtDNA diversity within a species. Intra-
specific mtDNA variation and geographic distribution of genetic variation within a species
depend on both current and historical population structure as well as directional selection.
Species thought to have large population sizes and/or a subdivided population structure tend
UUnniivveerrssiittyy ooff PPrreettoorriiaa eettdd –– SSoollee,, CC LL ((22000055))

62
to maintain greater amounts of mtDNA variability either as nucleotide diversity within
populations or as sequence divergence between populations. All of the species of Scarabaeus
(Pachysoma), except S. (P.) schinzi and S. (P.) striatus, show relatively large intra-specific
sequence divergences. The species of Scarabaeus (Pachysoma) are clearly closely related and
exhibit both subdivided population structure, in that some of the populations of species occur
in isolated pockets within their distributional range, and others occur along continuous dune
fields in relatively large population sizes.
Inter-specific divergences for Scarabaeus (Pachysoma) range from 8 to 16 %, which
appear to be high compared with other families of Coleoptera (Cicindela (0.36 – 1.09 %;
Cicindelidae) (Vogler et al., 1993); Pissodes (6.0 – 7.5 %; Curculionidae) (Langor &
Sperling, 1997)) as well as when compared with other insect orders (Heliconius erato (3.4 %;
Lepidoptera) (Brower, 1994); Papilio (2 - 7.7 %; Lepidoptera) (Sperling & Harrison, 1994);
Feltia (0.5 - 4.8 %; Lepidoptera) (Sperling et al., 1996) and Drosophila (7.1 %; Diptera)
(Solignac et al., 1986). The mtDNA lineages appear, therefore, to have diverged to a level
comparable to that beyond where most sister species have attained reproductive isolation.
Consequently at the inter-species level the COI gene proved to be a strong phylogenetically
informative marker for distinguishing between species within Scarabaeus (Pachysoma)
(Jones & Gibbs, 1997).
mtDNA vs. ecological divergence in the hippocrates/glentoni complex
S. (P.) hippocrates and S. (P.) glentoni are morphologically very similar species and can only
be reliably identified based on their male genitalia and habitat preference (for details see
Harrison et al., 2003). The two species occur sympatrically with S. (P.) hippocrates having
wider habitat tolerance and geographic distribution - preferring vegetated soft to firm sand of
coastal hummocks and hillocks, the periphery of dune systems, and river beds and banks -
while S. (P.) glentoni is more localised and more of a habitat specialist - preferring firm
vegetated sand of river banks and coastal hummocks (Harrison et al., 2003). These two
species provide an interesting example of ecological divergence without mtDNA sequence
divergence. Two reasons can be given for mtDNA showing poor resolution at the
phylogenetic level. Firstly, ecological differentiation could be occurring at a faster rate than
mtDNA evolution. Secondly, the flow of mtDNA is relatively free, whereas alleles for genes
coding for ecological differences are anchored to local conditions. Evidence exists that
indicates that relatively fast ecological divergence contributes to poor mtDNA divergence
(Shapiro & Masuda, 1980; Sims, 1980; Sperling & Harrison, 1994), suggestive of the
UUnniivveerrssiittyy ooff PPrreettoorriiaa eettdd –– SSoollee,, CC LL ((22000055))

63
hippocrates/glentoni complex being a recent divergent event that has yet to show distinct
mtDNA divergence.
Insight into evolutionary hypotheses of Scarabaeus (Pachysoma)
The phylogenies show a strong geographic association in that the species that group together
within a clade have similar distributions. S. (P.) hippocrates, S. (P.) glentoni, S. (P.)
endroedyi and S. (P.) aesculapius have the most southerly distribution (Namaqualand based)
within the total Scarabaeus (Pachysoma) distribution as well as exhibit the most
plesiomorphic characters. S. (P.) fitzsimonsi, S. (P.) bennigseni, S. (P.) striatus and S. (P.)
gariepinus occur in the centre of the total Scarabaeus (Pachysoma) distribution. The most
derived species – S. (P.) denticollis, S. (P.) rotundigenus and S. (P.) rodriguesi – have the
most northerly distribution and are ultra-psammophilous and therefore well adapted to the
loose sand of the Namib Dune Sea.
Aridification would have placed high selection pressure on the xeric adapted winged
wet dung feeders. Three main solutions can be used to deal with aridity: increasing diurnal
flying efficiency by flying less and foraging faster, reducing body size and feeding on both
dung and carrion (Klok, 1994, Harrison & Philips, 2003). Scarabaeus (Pachysoma) are
flightless which would reduce water loss and energy costs and also exhibit the strategy of
feeding on dry dung/detritus (Scholtz, 1989; Klok, 1994; Harrison & Philips, 2003). Dryness
of the environment would result in slow rates of decay, hence insects feeding on detritus,
carcasses or on persistent plant parts would find that they would persist over long periods of
time (Roff, 1990; Scholtz, 2000). The combination of various factors, such as low or no
competition for dry dung/detritus, the stable environment and the morphological and
physiological constraints of surviving in a sandy xeric habitat may have resulted in the
evolution of the present Scarabaeus (Pachysoma) lineage (Scholtz, 1989; Klok, 1994; Chown
et al., 1998; Harrison & Philips, 2003).
Conclusion
Species richness, relative abundance of taxa, genetic and morphological diversity, and
ecological diversity are various concepts encompassed by biodiversity. Biodiversity is a
result of historical processes; therefore to study biodiversity, access to these patterns and
processes is needed. A start to understanding the history behind the diversity is a good
phylogeny, which was the reasoning behind this study. The major conclusion is that the
combined phylogeny obtained in this study supports both the morphological and molecular
UUnniivveerrssiittyy ooff PPrreettoorriiaa eettdd –– SSoollee,, CC LL ((22000055))

64
phylogenies. Results are dependant upon both the taxa sampled and the resolving ability of
the datasets. In combining the information the two datasets complement each other, and the
deficiencies thought to affect the overall result i.e. the small number of morphological
characters being overshadowed by the large molecular dataset, are compensated for by each
other. It would be advantageous in future studies to expand phylogenetic examination to
include nuclear ribosomal genes like 18S or nuclear protein coding genes like elongation
factor-1 α (Clark et al., 2001) as well as additional individuals from the hippocrates/glentoni
complex. We interpret the general agreement of reconstructions between data partitions as an
indicator of the validity for the combination of datasets.
Acknowledgements
NAMDEB, in Namibia, and De Beers, in South Africa, are thanked for allowing CS and CHS
to complete field work in restricted areas. James du G Harrison is thanked for making his
morphological data available. Shaun Forgie is thanked for certain out-group sequences. CS
was partially funded by the National Research Foundation (NRF). Bursaries from the
University of Pretoria and NRF are gratefully acknowledged.
UUnniivveerrssiittyy ooff PPrreettoorriiaa eettdd –– SSoollee,, CC LL ((22000055))

65
References
Baker RH, DeSalle R (1997) Multiple sources of character information and the phylogeny of
Hawaiian Drosophilids. Systematic Biology, 46, 654-673.
Baker RH, Yu X, DeSalle R (1998) Assessing the relative contribution of molecular and
morphological characters in simultaneous analysis trees. Molecular Phylogenetics
and Evolution, 9, 427-436.
Bremer K (1988) The limits of amino-acid sequence data in angiosperm phylogenetic
reconstruction. Evolution, 42, 795-803.
Brower AVZ (1994) Rapid morphological radiation and convergence among races of the
butterfly Heliconius erato inferred from patterns of mitochondrial DNA evolution.
Proceedings of the National Academy of Science of the United States of America, 91,
6491-6495.
Bull JJ, Huelsenbeck JP, Cunningham CW, Swofford DL, Waddell PJ (1993) Partitioning
and combining data in phylogenetic analysis. Systematic Biology, 42, 384-397.
Cabrero-Sañudo F-J, Zardoya R (2004) Phylogenetic relationships of Iberian Aphodiini
(Coleoptera: Scarabaeidae) based on morphological and molecular data. Molecular
Phylogenetics and Evolution, 31, 1084-1100.
Cambefort Y (1991) From Saprophagy to Coprophagy. In: Dung Beetle Ecology (eds. Hanski
I, Cambefort Y), pp. 22-35. Princeton University Press, Princeton.
Chown SL, Pistorius P, Scholtz CH (1998) Morphological correlates of flightlessness in
southern African Scarabaeinae (Coleoptera: Scarabaeidae): testing a condition of the
water conservation hypothesis. Canadian Journal of Zoology, 76, 1123-1133.
Clark TL, Meinke LJ, Foster JE (2001) Molecular phylogeny of Diabrotica beetles
(Coleoptera: Chrysomelidae) inferred from analysis of combined mitochondrial and
nuclear DNA sequences. Insect Molecular Biology, 10, 303-314.
UUnniivveerrssiittyy ooff PPrreettoorriiaa eettdd –– SSoollee,, CC LL ((22000055))

66
Creer S, Malhotra A, Thorpe RS (2003) Assessing the phylogenetic utility of four
mitochondrial genes and a nuclear intron in the Asian pit viper genus Trimeresurus:
separate, simultaneous and conditional data combination analyses. Molecular Biology
and Evolution, 20, 1240-1251.
Davis ALV (1990) Climatic change, habitat modification and relative age of dung beetle taxa
(Coleoptera: Scarabaeidae, Hydrophilidae, Histeridae, Staphylinidae) in the
southwestern Cape. PhD Thesis, University of Cape Town.
De Queiroz AM, Donoghue J, Kim J (1995) Separate versus combined analysis of
phylogenetic evidence. Annual Review of Ecological Systematics, 26, 657-681.
Emerson BC, Wallis GP (1995) Phylogenetic relationships of the Prodontria (Coleoptera;
Scarabaeidae; subfamily Melolonthinae), derived from sequence variation in the
mitochondrial cytochrome oxidase II gene. Molecular Phylogenetics and Evolution, 4,
433-447.
Endrödy-Younga S (1989) The evolution of alternative life styles in Coleoptera. In:
Alternative Life-history Styles of Animals (ed. Bruton MN), pp. 317-327. Dordrecht:
Kluwer Academic Publishers.
Erney SJ, Pruess KP, Danielson SD, Powers TO (1996) Molecular differentiation of Alfalfa
weevil strains (Coleoptera: Curculionidae). Annals of the Entomological Society of
America, 89, 804-811.
Farris JS (1969) A successive approximations approach to character weighting. Systematic
Zoology, 18, 374-385.
Farris JS, Källersjö M, Kluge AG, Bult C (1995) Testing significance of congruence.
Cladistics, 10, 315-319.
Felsenstein J (1985) Confidence limits on phylogenies: an approach using the bootstrap.
Evolution, 39, 783-791.
UUnniivveerrssiittyy ooff PPrreettoorriiaa eettdd –– SSoollee,, CC LL ((22000055))

67
Ferreira MC (1953) Monografia dos Escarabaeídeos da África do Sul. Tribo-Scarabaeini. I
Parte Sub-tribo Pachysomides. Boletím da Sociedade de Estudos da Província de
Moçambique, 23, 1-85.
Forgie SA (2003) Phylogeny of the Scarabaeini (Coleoptera: Scarabaeidae). PhD Thesis,
University of Pretoria.
Forgie SA, Grebennikov VV, Scholtz CH (2002) Revision of Sceliages Westwood, a
millipede-eating genus of southern African dung beetles (Coleoptera: Scarabaeidae).
Invertebrate Systematics, 16, 931-955.
Forgie SA, Philips TK, Scholtz CH (2005) Evolution of the Scarabaeini (Scarabaeidae:
Scarabaeinae). Systematic Entomology, 30, 60-97.
Funk DJ, Futuyma DJ, Orti G, Meyer A (1995a) A history of host associations and
evolutionary diversification for Ophraella (Coleoptera: Chrysomelidae): new
evidence from mitochondrial DNA. Evolution, 49, 1008-1017.
Funk DJ, Futuyma DJ, Orti G, Meyer A (1995b) Mitochondrial DNA sequences and multiple
data sets: a phylogenetic study of phytophagous beetles (Chrysomelidae: Ophraella).
Molecular Biology and Evolution, 12, 627-640.
Goloboff PA (1997) NONA Version 2.0 (For Windows). Computer software and
documentation. Published by the author, Instituto Miguel Lillo, Miguel Lillo 205, 400
Sierra Madre de Tucuman, Argentina.
Hanski I, Cambefort Y (eds) (1991) Dung Beetle Ecology. Princeton University Press,
Princeton.
Harrison JduG (1999) Systematics of the endemic south-west African dung beetle genus
Pachysoma MacLeay (Scarabaeidae: Scarabaeinae). MSc Thesis, University of
Pretoria.
UUnniivveerrssiittyy ooff PPrreettoorriiaa eettdd –– SSoollee,, CC LL ((22000055))

68
Harrison JduG, Phillips TK (2003) Phylogeny of Scarabaeus (Pachysoma MacLeay) sta.
nov., and related flightless Scarabaeini (Scarabaeidae: Scarabaeinae). Annals of the
Transvaal Museum, 40, 47-71.
Harrison JduG, Scholtz CH, Chown SL (2003) A revision of the endemic south-western
African dung beetle subgenus Scarabaeus (Pachysoma) MacLeay, including notes on
other flightless Scarabaeini (Scarabaeidae: Scarabaeinae). Journal of Natural History,
37, 305-355.
Holm E, Scholtz CH. (1979) A revision of the genus Pachysoma M'Leay with an evaluation
of the subtribe Pachysomina Ferreira and its genera (Coleoptera: Scarabaeidae).
Journal of the Entomological Society of South Africa, 42, 225-244.
Huelsenbeck JP, Bull JJ, Cunningham CW (1996) Combining data in phylogenetic studies.
Trends in Ecology and Evolution, 11, 152-158.
Huelsenbeck JP, Ronquist F (2001) MRBAYES: Bayesian inference of phylogenetic trees.
Bioinformatics, 17, 754 – 755.
Huelsenbeck JP, Ronquist F, Nielsen R, Rollback JP (2001) Bayesian inference of phylogeny
and its impact on evolutionary biology. Science, 294, 2310-2314.
Ingram CM, Burda H, Honeycut RL (2004) Molecular phylogenetics and taxonomy of the
African mole-rats, genus Cryptomys and the new genus Coetomys Gray, 1864.
Molecular Phylogenetics and Evolution, 31, 997-1014.
Jones DA, Gibbs HL (1997) Intra- and interspecific sequence variation in a portion of the
mitochondrial ND6 gene in Cuckoos. The Condor, 99, 815-818.
Klok JC (1994) Desiccation resistance in dung-feeding Scarabaeinae. MSc Thesis, University
of Pretoria.
Kumar S, Tamura K, Jacobsen IB, Nei M (2001) Molecular Evolutionary Genetic Analysis
Software. Bioinformatics, 17, 1244-1245.
UUnniivveerrssiittyy ooff PPrreettoorriiaa eettdd –– SSoollee,, CC LL ((22000055))

69
Langor DW, Sperling FAH (1997) Mitochondrial DNA sequence divergence in weevils of
the Pissodes strobi species complex (Coleoptera: Curculionidae). Insect Molecular
Biology, 6, 255-265.
Linnaeus C (1758) Systema naturae per regna tria naturae, secundum classes, ordines,
genera, species, cum characteribus, differentiis, synonimus, locis. Ed. Decima,
reformata, vol 1. L. Salvii. Holmiae, 824 + iii p.
Lunt DH, Zhang D-X, Szymura JM, Hewitt G.M (1996) The insect cytochrome oxidase I
gene: evolutionary patterns and conserved primers for phylogenetic studies. Insect
Molecular Biology, 5, 153-165.
MacLeay WS (1821) Horae Entomologicae: or essays on The Annulose Animals, Vol 1(2)
(London Bagster), 524pp + 3 pls.
Miyamoto MM, Fitch WM (1995) Testing the covarion hypothesis of molecular evolution.
Molecular Biology and Evolution, 12, 503-513.
Mostert LE, Holm E (1982) Notes on the flightless Scarabaeina (Coleoptera: Scarabaeidae)
with a description of a new species. Cimbebasia (A), 5, 273-284.
Mostert LE, Scholtz CH (1986) Systematics of the subtribe Scarabaeina (Coleoptera:
Scarabaeidae). Entomology Memoir, Department of Agriculture and Water Supply,
Republic of South Africa, 65, 1-25.
Near TJ, Pesavento JJ, Cheng CHC (2003) Mitochondrial DNA, morphology, and the
phylogenetic relationships of Antarctic icefishes (Notothenioidei: Channichthyidae).
Molecular Phylogenetics and Evolution, 28, 87-98.
Nixon KC, Carpenter JM (1993) On simultaneous analysis. Cladistics, 12, 221-241.
Posada D, Crandall KA (1998) Modeltest 3.0: testing the model of DNA substitution.
Bioinformatics, 14, 817-818.
UUnniivveerrssiittyy ooff PPrreettoorriiaa eettdd –– SSoollee,, CC LL ((22000055))

70
Rodriguez F, Oliver JF, Medina JR (1990) The general stochastic model of nucleotide
substitution. Journal of Theoretical Biology, 142, 485-501.
Roff DA (1990) The evolution of flightlessness in insects. Ecological Monographs, 60, 389-
421.
Savage J, Wheeler TA, Wiegman BM (2004) Phylogenetic analysis of the genus Thricops
Rondani (Diptera: Muscidae) based on molecular and morphological characters.
Systematic Entomology, 29, 395-414.
Scholtz CH (1989) Unique foraging behaviour in Pachysoma (=Scarabaeus) striatum
Castelnau (Coleoptera: Scarabaeidae): an adaptation to arid conditions? Journal of
Arid Environments, 16, 305-313.
Scholtz CH (2000) Evolution of flightlessness in Scarabaeoidea (Insecta, Coleoptera).
Mitteilungen aus dem Museum füer Naturkunde Berlin, Deutsche Entomologische
Zeitschrift, 47, 5-28.
Scholtz CH, Chown SL (1995) The evolution of habitat use and diet in the Scarabaeoidea: A
phylogenetic approach. In: Biology, Phylogeny and Classification of Coleoptera:
Papers celebrating the 80th birthday of Roy A. Crowson (eds. Pakaluk J, Slipinski
SA), pp.354-374. Museum I Instytut Zoologii PAN, Warszawa.
Scholtz CH, Harrison JduG, Grebennikov VV (2004) Dung beetle (Scarabaeus (Pachysoma))
biology and immature stages: reversal to ancestral states under desert conditions
(Coleoptera: Scarabaeidae)? Biolgical Journal of the Linnean Society, 83, 453-460.
Sedaghat MM, Linton Y-M, Nicolescu G, Smith L, Koliopoulos G, Zounos AK, Oshagi MA,
Vatandoost H, Harbach RE (2003) Morphological and molecular characterization of
Anopheles (Anopheles) sacharovi Favre, a primary vector of malaria in the middle
east. Systematic Entomology, 28, 241-256.
Shapiro AM, Masuda KK (1980) The opportunistic origin of a new citrus pest. California
Agriculture, 36, 4-5.
UUnniivveerrssiittyy ooff PPrreettoorriiaa eettdd –– SSoollee,, CC LL ((22000055))
71
Sims SR (1980) Diapause dynamics and host plant suitability of Papilio zelicaon
(Lepidoptera: Papilionidae). American Midland Naturalist, 103, 375-384.
Sittipraneed S, Sihanuntavong D, Klinbunga S (2001) Genetic differentiation of the honey
bee (Apis cerana) in Thailand revealed by polymorphism of a large subunit of
mitochondrial ribosomal DNA. Insect Sociaux, 48, 266-272.
Sole CL, Scholtz CH, Bastos ADS (2005) Phylogeography of the Namib Desert dung beetles
Scarabaeus (Pachysoma) MacLeay (Coleoptera: Scarabaeidae). Journal of
Biogeography, 32, 75-84.
Solignac M, Monnerot M, Mounolou J-C (1986) Mitochondrial DNA evolution in the
Melanogaster species subgroup of Drosophila. Journal of Molecular Evolution, 23,
31-40.
Sorenson MD (1999) TreeRot, version 2. Boston University, Boston, MA.
Sperling FAH (1993) Mitochondrial DNA variation and Haldane’s rule in the Papilio glaucas
and P. troilus species groups. Heredity, 70, 227-233.
Sperling FAH, Harrison RG (1994) Mitochondrial DNA variation within and between species
of the Papilio machaon group of swallowtail butterflies. Evolution, 48, 408-422.
Sperling F, Byers R, Hickey D (1996) Mitochondrial DNA sequence variation among
pheromotypes of the dingy cutworm, Feltia jaculifera (Gn.) (Lepidoptera: Noctuidae).
Canadian Journal of Zoology, 74, 2109-2117.
Swofford DL (1998) PAUP*. Phylogenetic Analysis using Parsimony, Beta version 4.0b1.
Computer program distributed by the Illinois Natural History Survey, Champaign, IL.
Thompson JD, Gibson TJ, Plewniak F, Jeanmougin F, Higgins DG (1997) The ClustalX
windows interface: flexible strategies for multiple sequence alignment aided by
quality analysis tools. Nucleic Acids Research, 24, 4876-4882.
UUnniivveerrssiittyy ooff PPrreettoorriiaa eettdd –– SSoollee,, CC LL ((22000055))

72
Vink CJ, Paterson AM (2003) Combined molecular and morphological phylogenetic analyses
of the New Zealand wolf spider genus Anoteropsis (Aranae: Lycosidae). Molecular
Phylogenetics and Evolution, 28, 576-587.
Vogler AP, DeSalle R, Assman T, Knisley CB, Schultz TD (1993) Molecular population
genetics of the endangered tiger beetle Cincindela dorsalis (Coleoptera: Cicindelidae).
Annals of the Entomogical Society of America, 86, 142-152.
Vogler AP, Pearson DL (1996) A molecular phylogeny of the Tiger Beetles (Cicindelidae):
congruence of mitochondrial and nuclear rDNA data sets. Molecular Phylogenetics
and Evolution, 6, 321-338.
Warren BH, Bermingham E, Bowie RCK, Prys-Jones RP, Thébaud C (2003) Molecular
phylogeography reveals island colonisation history and diversification of western
Indian Ocean sunbirds (Nectarinia: Nectariniidae). Molecular Phylogenetics and
Evolution, 29, 67-85.
Wheeler WC (1995) Sequence alignment, parameter sensitivity, and the phylogenetic
analysis of molecular data. Systematic Biology, 44, 321-331.
Yang Z, Goldman N, Friday A (1994) Comparison of models from nucleotide substitution
used in maximum-likelihood phylogenetic estimation. Molecular Biology and
Evolution, 11, 316-324.
Yoder AD, Irwin JA, Payseur BA (2001) Failure of the ILD to determine data combinability
for slow Loris phylogeny. Systematic Biology, 50, 408-424.
UUnniivveerrssiittyy ooff PPrreettoorriiaa eettdd –– SSoollee,, CC LL ((22000055))
73
Chapter IV
__________________________________________________________________________________
Phylogeographic patterns of Scarabaeus (Pachysoma) (Coleoptera: Scarabaeidae) as inferred
from gene genealogies and coalescent theory.
Catherine L. Sole1, Armanda D. S. Bastos1, 2 and Clarke H. Scholtz1
1 Department of Zoology & Entomology, University of Pretoria, Pretoria, 0002, South Africa 2 Mammal Research Institute (MRI), Department of Zoology & Entomology, University of Pretoria, Pretoria,
0002, South Africa
Running title: Phylogeography of Scarabaeus (Pachysoma) (Scarabaeidae: Scarabaeinae).
UUnniivveerrssiittyy ooff PPrreettoorriiaa eettdd –– SSoollee,, CC LL ((22000055))
74
Abstract
Mitochondrial cytochrome oxidase I (COI) sequence data were used to infer phylogeographic
patterns of three species of Scarabaeus (Pachysoma), a group of flightless dung beetles endemic to
the arid west coast of southern Africa. Nested clade analysis in conjunction with historical
demographic analysis allowed for the inference of historical bottlenecks followed by population
expansion in response to climatic oscillations. All three species exhibit high overall haplotype
diversity with no shared haplotypes between populations or collecting localities, refugia could,
therefore, not be identified. Recent events imply human induced, environmental barriers and reduced
vagility as having caused fragmentation, influencing the strong population structure seen in two of the
three species. Coalescence for each species was calculated and it was estimated that all three species
underwent population expansion within the Pleistocene era, in response to the formation of advective
fog. The neighbor-joining trees showed S. (P.) hippocrates as having four distinct populations, S. (P.)
gariepinus having three populations, two in South Africa and one in Namibia while S. (P.) denticollis
comprised a single population along a dune field continuum in Namibia. AMOVA analysis confirmed
the phylogenetic partitioning. Analysis of gene flow revealed a strong degree of south-north
movement, consistent with the unidirectional wind regime, with some movement occurring in a
southerly direction.
Keywords Scarabaeus, mitochondrial DNA, cytochrome oxidase I, Phylogeography, Namaqualand,
Namib Desert
UUnniivveerrssiittyy ooff PPrreettoorriiaa eettdd –– SSoollee,, CC LL ((22000055))
75
Introduction
Species consist of geographically structured populations, many of which have experienced
little or no genetic contact for long periods of time due to the limited dispersal abilities of the
individuals and/or as a result of habitat discontinuities (Carisio et al., 2004). In addition to
selective forces, factors that contribute to these associations are past events such as
colonisation history and current demography (Juan et al., 1998). By examining the variation
among populations, their historical associations and the processes of genetic restructuring that
may have lead to speciation, can often be revealed (Wright, 1931). Species complexes among
geographically isolated populations of polytypic species have great potential for historic
inferences (Kirchman et al., 2000). These geographically isolated populations represent the
extreme of spatial patterning and are therefore of particular interest (Kirchman et al., 2000).
Phylogeography is the study of the principles and processes governing the
geographical distributions of genealogical lineages, especially those within and amongst
closely related species (Avise, 2000). Elucidating the phylogeographic patterns within the
species of Scarabaeus (Pachysoma) will enable us to infer their evolutionary history, re-
construct colonisation routes and identify possible refugia. Furthermore, it will be possible to
identify and delineate genetically meaningful conservation units, evolutionary significant
units (ESU’s) and management units (MU’s) (Moritz, 1994a; b), within the different species.
This information will be useful for developing conservation management recommendations
for preserving species of Scarabaeus (Pachysoma).
Scarabaeus (Pachysoma) represents an excellent group to study the effects of
geographic isolation within species. The species are geographically isolated, occurring in
pockets of discontinuous populations on coastal sands from Cape Town (33°56’S – 18°28’E)
in South Africa to Walvis Bay (22°58’S – 14°30’E) in Namibia. Some of these areas are
currently under threat of both anthropogenic and environmental factors. Threats to the habitat
of Scarabaeus (Pachysoma) species come from the removal of the natural vegetation for
large scale wheat farming in the south western Cape, commercial development on the west
coast for holiday and recreational purposes e.g. Lambert’s Bay and Strandfontein, mining for
diamonds and other minerals as well as from exotic plant invaders modifying dune systems
e.g. Port Jackson (Acacia saligna) and Rooikrans (Acacia cyclops). Furthermore, some of the
species of Scarabaeus (Pachysoma) are potentially threatened as they are sought after by
collectors (Harrison, 1999).
The species of Scarabaeus (Pachysoma) range from 2 – 5 cm in length, with S. (P.)
denticollis and S. (P.) rodriguesi, representing the smallest and largest extremes in body size,
UUnniivveerrssiittyy ooff PPrreettoorriiaa eettdd –– SSoollee,, CC LL ((22000055))

76
respectively. Three species, S. (P.) hippocrates, S. (P.) gariepinus and S. (P.) denticollis
where selected for population based analyses as these species exhibited distinct south-north
morphological clinal variation (Harrison, 1999).
Cytochrome oxidase I (COI) sequence data are used in the present study for
comparisons within and between S. (P.) hippocrates, S. (P.) gariepinus and S. (P.) denticollis.
We addressed the following questions: Firstly, to what degree has geographic isolation led to
the genetic restructuring between populations of the same species? Secondly, what is the
extent of gene flow between populations of the same species and does it correlate with
patterns of geographic proximity? Thirdly, from which geographic location did the group
originate and how are the populations of each species related to one another? Finally, what
are the effective/actual population sizes of the species in question?
Materials and Methods
Population sampling, amplification and sequencing
For all three of the species, we sampled, where possible, a minimum of 10 individuals per
designated population. Each of the species was divided into populations based on
morphological and distributional data (Table 1). Total genomic DNA was extracted from 176
individuals from the thoracic muscle tissue and amplified using TL2–N-3014 and C1–J–1718
(Simon et al., 1994) targeting a 1345 base pair (bp) fragment. Thermal cycling parameters
comprised an initial denaturation for 90 seconds at 94°C followed by 35 cycles at 94°C for 22
seconds, 48°C for 30 seconds and 72°C for 90 seconds with a final elongation step at 72°C
for 1 min. Amplified COI products were purified from the tube using the High Pure PCR
Product Purification Kit (Roche) according to manufacturer specifications. An analysis of the
1197 bp region generated for 46 individuals of the 13 morphological species of Scarabaeus
(Pachysoma) (Sole et al., 2005) revealed that the 5’ end of the COI gene was the most
parsimoniously informative. Based on this we used only 960 bp from the 5’ end of the partial
COI gene for the present study. For this reason, each amplicon was sequenced with C1-J-
1718 and C1-J-2183 (Simon et al., 1994). Sequencing reactions were performed at an
annealing temperature of 48ºC with version 3.1 of the ABI Prism Big Dye Terminator Cycle
Sequencing Ready Reaction Kit (Perkin-Elmer). Nucleotide sequences were determined
through a capillary system on an ABI 3100 automated sequencer (Perkin-Elmer). Sequence
chromatograms were visualised and edited in Sequence Navigator (Perkin-Elmer).
UUnniivveerrssiittyy ooff PPrreettoorriiaa eettdd –– SSoollee,, CC LL ((22000055))

77
Analysis
Phylogenetic Analysis
Hierarchical likelihood ratio tests were performed using Modeltest 3.5 to determine the
model of sequence evolution that best fit the data at hand (Posada & Crandall, 1998).
Parameters such as the proportion of invariable sites and α� parameter of the gamma
distribution of rate variation among sites (Yang et al., 1994) were calculated in Modeltest.
MEGA version 2.1 (Kumar et al., 2001) was used to calculate the transition/transversion
(ti/tv) ratio. Maximum Parsimony (MP) (Kluge & Farris, 1969) and Maximum Likelihood
(ML) (Felesenstein, 1973, 1981) trees were obtained using PAUP* v. 4.08b (Swofford,
1998). For MP trees, we used heuristic searches with tree-bisection-reconnection (TBR) as
the branch-swapping algorithm and the nucleotides were treated as unordered characters. The
starting tree was obtained via stepwise addition with random addition of sequences with 10
replicates. ML analysis was performed as above, using the values obtained from Model Test
but given the computational time required no replicates were performed. The neighbor-
joining (NJ) (Satou & Nei, 1987) option in the computer program MEGA was used to re-
construct relationships between the populations within the three species with the model
selected from Modeltest. Support for all relationships was estimated using 1000 bootstrap
replicates (Felsenstein, 1985). Population assemblages within species were ascertained from
mid-point rooted trees. As all tree topologies from the different tree drawing options were
similar only the NJ trees are presented.
Molecular diversity
Mean nucleotide diversities within each population/assemblage were calculated with
Arlequin 2.000 (Schneider et al., 2000). Hierarchical structuring of genetic variation was
determined using AMOVA (Excoffier et al., 1992 new version: Schneider et al., 2000),
which produces Φ - statistics similar to the F - statistics of Wright (1951; 1965). Φct
describes the regional apportionment of genetic variation with respect to all haplotypes, Φsc
describes the apportionment of variation within the populations of a given region and Φst
characterises the variation between haplotypes in a single population relative to all haplotypes
(Barber, 1999). Analyses were performed independently of groupings designated by the
authors as well as on the assemblages identified from each neighbor-joining tree, to
determine the hypothesis that best fit the data. Levels of significance of Φst - statistics were
determined through 10,000 random permutation replicates (Schneider et al., 2000).
UUnniivveerrssiittyy ooff PPrreettoorriiaa eettdd –– SSoollee,, CC LL ((22000055))

78
Historical Population Dynamics
Distance-based methods (mismatch distribution in Arlequin 2.000, Schneider et al., 2000),
coalescence and maximum likelihood methods (LAMARC version 1.2.2 Kuhner et al., 2004;
MIGRATE version 1.7.6.1 Beerli & Felsenstein, 1999; 2001) were used to estimate effective
population size, exponential growth or shrinkage, time and rate of expansion and migration
rates within and among populations/assemblages.
Population growth/decline based on two models
Stepwise Expansion Model
The program Arlequin was used to calculate the mismatch distribution (frequency of pairwise
differences) between the haplotypes of a population. This evaluates the hypothesis of recent
population growth (Rogers & Harpending, 1992) with the underlying assumption that
population growth or decline leaves distinctive signatures on the DNA sequences compared
with constant population size. Recent growth should generate a unimodal distribution of
pairwise differences, but the exact mode of growth (exponential, stepwise or logistic) cannot
be distinguished (Rogers & Harpending, 1992). This distribution is then compared with that
expected under a model of population expansion (Rogers, 1995) calculating the estimator
expansion time (τ) and the mutation parameter (θ) (Schneider & Excoffier, 1999). A non-
linear least squares (Schneider & Excoffier, 1999) approach is used to estimate parameters
for the stepwise growth model: θ0 = 2µN0 (before expansion), θ1 = 2µN1 (after expansion)
and t = τ /2v (time of expansion, note v = mTµ which is the mutation rate for the entire DNA
sequence under study where mT is the number of nucleotides and µ is the mutation rate). N0
and N1 are the effective population sizes of females before and after population expansion
respectively.
For the COI data we estimated the mutation rate by following the procedure in
Rooney et al. (2001). Firstly, the number of nucleotide substitutions per site was estimated by
comparing the in-group (classified as one of the three species within this study) with its sister
taxa, (which was obtained from the phylogeny found in Sole et al., 2005; chapter 2) using the
formula d = (Tv + TvR)/mT, where Tv is the number of tranversions between the focal and
sister species, R is the ratio of transitions to transversions within the focal species and mT is
the length of the investigated DNA sequence. Secondly, the rate of nucleotide substitution (�)
per site, per lineage, per year was estimated by � = d/2T, where T stands for the divergence
time of the two compared species (this was estimated in MEGA using Brower, 1994; 2.3 %
UUnniivveerrssiittyy ooff PPrreettoorriiaa eettdd –– SSoollee,, CC LL ((22000055))

79
pairwise divergence per million years) - (Divergence estimates are under debate and
surrounded by much contention. However, the decision to use the molecular clock to estimate
divergence times in this study was conservative and used with caution (Graur & Martin,
2004)). Thirdly, it was possible to estimate mutation rate per nucleotide site, per generation
(µ) by solving the equation µ = γtg, where tg is generation time in years, which in this case
was taken to be a single generation per year. The mutation rate per haplotype (v) was
calculated by v = mTµ. Finally, the coalescence time (time to expansion) in generations was
calculated by t = τ/2v (Rogers & Harpending, 1992) and the coalescence time in years was
estimated by multiplying t with generation time.
Arlequin estimates approximate confidence intervals for θ0, θ1 and expansion time (τ)
- which are substituted into the above equations to solve for N0, N1 and t, respectively - by
parametric bootstrapping of 10,000 replicates. If population growth applies, the validity of
the stepwise expansion model is tested using the same bootstrap approach by a goodness of
fit statistic (P), representing the probability that the variance in the simulated dataset is equal
to or greater than that seen in the observed dataset. We also computed Harpending’s
Raggedness Index - R - and its significance in the same manner (Harpending, 1994).
Tajima’s (1983) estimate of θ, was estimated in Arlequin, while Fu’s (1994a, b)
UPBLUE estimate of θ, was estimated by Fu’s phylogenetic estimator of θ on line
(http://hgc.sph.uth.tmc.edu/cgi-bin/upblue.pl). Tajima’s estimate is based on the calculation
of the mean number of pairwise differences of the sequences, while Fu’s UPBLUE estimate
is calculated by incorporating the genealogical information of the sequences (Su et al., 2001).
Fu’s UPBLUE estimate puts emphasis on recent mutations, revealing recent population
processes, while Tajima’s estimate puts more weight on ancient mutations, reflecting past
population trends (Su et al., 2001). As θ = 2Nµ for the mitochondrial genome, the ratio of
population size change is correlated with θ given a constant mutation rate (µ). Comparing
Tajima's with Fu's UPBLUE estimate will give an idea of population size change in recent
time. In addition, Fu’s (1997) Fs test of neutrality was carried out in Arlequin. Although the
Fs was originally designed as a test of neutrality, it has utility as an estimator of population
growth (Smith & Farrell, 2005). The Fs value tends to be negative if there is an excess of
recent mutations (i.e. mutations that occur in a small number of individuals). A large negative
value indicates an excess of recent mutations an outcome that can be caused by either
population growth and/or selection (Su et al., 2001).
UUnniivveerrssiittyy ooff PPrreettoorriiaa eettdd –– SSoollee,, CC LL ((22000055))

80
Exponential Expansion Model
The program LAMARC version 1.2.2 was used to estimate population parameters based on
coalescence and maximum likelihood methods. LAMARC uses the Markov Chain Monte
Carlo (MCMC) approach with the Metropolis-Hastings genealogy sampler to search through
genealogies of which samples are taken at intervals from which to calculate a maximum
likelihood of theta (θ). LAMARC calculates estimates of population exponential growth or
decline, population size, recombination and migration rates. Ten short chains of 500 steps
each, which were followed by 2 long chains of 10,000 steps, sampled every 20th step and 4
heated chains were run at temperatures of 1, 1.3, 1.6 and 2. Each run was repeated 4 times to
ensure consistency of results. We used LAMARC to estimate theta (θ = 2Nf(µ)) and growth,
given as g (θnow = θt (-gt)) (or decline) rates for populations of the three species.
Migration
In order to evaluate the relationships among populations within species we used the program
MIGRATE version 1.7.6.1 to estimate both effective population sizes (θ = 2µNf) and
migration rates (M = 2mNf) (Beerli & Felesenstein, 1999; 2001). MIGRATE searches
through genealogy space using a likelihood ratio test and coalescent theory to estimate these
parameters. It makes use of the MCMC approach with the Metropolis Hastings Green
algorithm. It assumes constant effective population sizes for each population, but allows
various effective population sizes for different populations (Zheng et al., 2003). Values of
theta (θ) were estimated from the Fst-calculation. When using MIGRATE on our data we
used the population subdivisions from Table 1 for each species running each analysis
separately. Ten short chains with 1000 sampled genealogies and three long chains with
1,000,000 sampled genealogies each, were run. Heating was set to be active with four heated
chains at temperatures of 1.00, 1.33, 1.66 and 2.00. Five runs were repeated for each species’
dataset to check for consistency.
Network Estimation and Nested Clade Analysis
A haplotype network was estimated using statistical parsimony (Templeton et al., 1992) in
TCS version 1.18 (Clement et al., 2000). The method links haplotypes with smallest number
of differences as defined by a 95 % confidence limit. Loops (= reticulations) in the network,
which result from homoplasy in the data, were broken in accordance with the predictions
derived from coalescent theory: i) common haplotypes are more likely to be found at interior
UUnniivveerrssiittyy ooff PPrreettoorriiaa eettdd –– SSoollee,, CC LL ((22000055))

81
nodes of a cladogram, and rare haplotypes at the tips; ii) haplotypes represented by a single
individual are more likely to connect to haplotypes from the same population than to
haplotypes from different populations (Crandall & Templeton, 1993; Posada & Crandall,
2001).
Nested Clade Phylogeographical Analysis (NCPA; Templeton et al., 1995) was used
to infer population history in each of the three species. NCPA first tries to reject the null
hypothesis of no association between haplotype variation and geography and then attempts to
interpret the significant associations (Crandall & Templeton, 1993; Templeton et al., 1995).
The NCPA was constructed by hand, based on the parsimony network following the rules
given in Templeton & Singh (1993). Such a nested design treats haplotypes as “0-step
clades,” groups of haplotypes separated by a single mutation as “1-step clades,” groups of “1-
step clades” separated by a single mutation as a “2-step clade” and so on.
GEODIS v2.0 (Posada et al., 2000) was used to calculate NCPA distance measures
and their statistical significance. This method uses geographical distances between sampled
populations to calculate two basic statistics: Dc (clade distance) and Dn (nested clade
distance). Dc measures the average distance of all clade members from the geographical
centre of distribution. Dn measures how widespread a clade is in relation to the distribution of
its sister clades within the same nesting group. Random geographical distribution in
coalescent theory allows one to distinguish between tip (with one connection to the remaining
network) and interior (with two or more connections) clades by permutational tests of which
we performed 10,000. We used Templeton’s (2004) updated inference key to deduce the
cause of significant associations between haplotypes. This would allow us to distinguish
between historical (fragmentation, range expansion) and current (gene flow, genetic drift,
system of mating) processes responsible for the observed patterns of genetic variation
(Templeton et al., 1995).
The Mantel test (Mantel, 1967) was used to determine significant associations
between genetic distances obtained in MEGA and geographic distances between the
designated populations from Table 1. One thousand randomised permutations were
performed using Mantel version 2.0 (Liedlof, 1999).
UUnniivveerrssiittyy ooff PPrreettoorriiaa eettdd –– SSoollee,, CC LL ((22000055))

82
Table 1. Total number of individuals for each population and subpopulation. The populations
were designated according to geographic and morphological differences.
Species Population location Population individuals
Subpopulation individuals
S. (P.) denticollis Population - Koichab Pan (KP) 13
Koichab Pan 11
Luderitz 2
Population - Namib Rand (NR) 8
Tok Tokkie Trails 8
Population - Gobabeb (GB) 11
Gobabeb - 5km SE Homeb 11
S. (P.) gariepinus Population - Langhoogte to Kommagas Road (LK) 12
Langhoogte to Kommagas Road 12
Population - Holgat River (HR) 17
40km N Port Nolloth - Holgat River 17
Population (Namibia) - Hohenfells (HF) 13
Hohenfells Dunes 13
Population (Namibia) - Daberas/Obib Dunes (DO) 11
Road from Daberas to Obib Dunes 11
Population (Namibia) - Klinghardts Mountains (KM) 14
Klinghardts Mountains 14
S. (P.) hippocrates Population - Cape Town/Lamberts Bay (LA) 13
10km West of Leipoldtville 13
Population - Olifants/Green River (BV/KK) 9
Kommandokraal Farm (KK) 5
Koekenaap (BV) 4
Population - Green/Buffels River (SK) 20
Kleinsee - Sandkop 20
Population - Buffels River/Port Nolloth (PN) 11
1km North of Port Nolloth 11
UUnniivveerrssiittyy ooff PPrreettoorriiaa eettdd –– SSoollee,, CC LL ((22000055))

83
Chapter IV (a)
___________________________________________________________________________
Genetic structure, phylogeography and demography of S. (P.) hippocrates based on
inferences from Cytochrome Oxidase I
Introduction
The long-term persistence of many species is threatened by the loss of their natural habitat
caused by human activities. Remaining habitats are often small and isolated from each other
by less suitable habitat e.g. settlement areas, agriculture and roads. Isolation of local
populations and reduction of suitable habitat are potential negative effects of a fragmented
landscape. Causal factors of fragmentation may be human induced or environmental.
Isolation is of particular significance when considering taxa with limited dispersal ability as
they face an increased risk of extinction due to demographic and genetic factors.
Scarabaeus (Pachysoma) hippocrates represents a good species to evaluate the effects
of geographic isolation caused in some instances by natural barriers and in others by human
activities. S. (P.) hippocrates is one of the larger species of the flightless Scarabaeus
(Pachysoma) occurring from Bloubergstrand (S33°48’ – E18°27’), Cape Town, to Port
Nolloth (S29°15’ – E16°53’) in Namaqualand. S. (P.) hippocrates prefer vegetated soft to
firm sand of coastal hummocks and hillocks, the periphery of dune systems, riverbeds and
banks (Harrison, 1999). The species is shown to exhibit a gradual morphological cline along
this distribution with populations isolated by both natural and non-natural barriers. Habitat
modification threatens certain populations of S. (P.) hippocrates, specifically those occurring
at Port Nolloth, where the town is expanding into their habitat, and areas around Leipoldtville
and Kommandokraal, where farming communities exist.
Materials and Methods
See body of Chapter 4. The localities where S. (P.) hippocrates were collected for this study
are represented in Figure 1.
UUnniivveerrssiittyy ooff PPrreettoorriiaa eettdd –– SSoollee,, CC LL ((22000055))
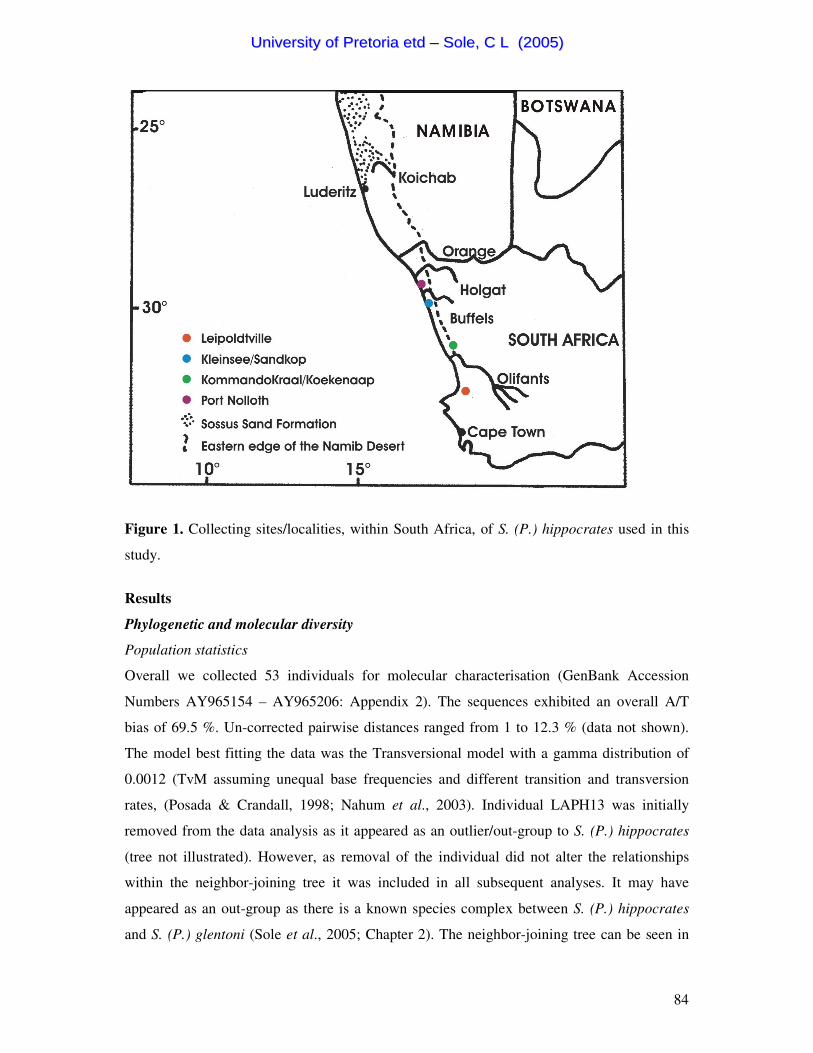
84
Figure 1. Collecting sites/localities, within South Africa, of S. (P.) hippocrates used in this
study.
Results
Phylogenetic and molecular diversity
Population statistics
Overall we collected 53 individuals for molecular characterisation (GenBank Accession
Numbers AY965154 – AY965206: Appendix 2). The sequences exhibited an overall A/T
bias of 69.5 %. Un-corrected pairwise distances ranged from 1 to 12.3 % (data not shown).
The model best fitting the data was the Transversional model with a gamma distribution of
0.0012 (TvM assuming unequal base frequencies and different transition and transversion
rates, (Posada & Crandall, 1998; Nahum et al., 2003). Individual LAPH13 was initially
removed from the data analysis as it appeared as an outlier/out-group to S. (P.) hippocrates
(tree not illustrated). However, as removal of the individual did not alter the relationships
within the neighbor-joining tree it was included in all subsequent analyses. It may have
appeared as an out-group as there is a known species complex between S. (P.) hippocrates
and S. (P.) glentoni (Sole et al., 2005; Chapter 2). The neighbor-joining tree can be seen in
UUnniivveerrssiittyy ooff PPrreettoorriiaa eettdd –– SSoollee,, CC LL ((22000055))

85
Figure 2 (drawn in MEGA using the TvM model), indicates four distinct groups into which
each population designated from Table 1 could be grouped. Parsimony and Maximum
Likelihood trees exhibited similar topologies to the neighbor-joining tree with and without
LAPH13 (results not shown).
Table 2 shows molecular diversity statistics obtained within each population as well
as an overall estimate for the species as a whole. Mean nucleotide diversity was high for the
Leipoldtville population and an order of magnitude lower in the other two populations where
estimates were obtained. Port Nolloth had a single haplotype therefore estimates for this
population were 0. Thirty-one haplotypes were identified among the four populations with
each population having its own unique set of haplotypes specific to each geographic region.
Accordingly, haplotype diversity expressed over the complete sample was relatively high (H
= 0.948 +/- 0.004).
Genetic differentiation among populations
An analysis of molecular variance (AMOVA) was performed to estimate the fixation index
using the optimal model of sequence evolution identified above. Analyses were performed
with the species as a single group with each population defined as a region. The results of
AMOVA revealed that 84.88 % of the variance resulted from among population differences
while 15.12 % of the variation could be attributed to within population variation. The fixation
index was high and significant at 0.849 (p < 0.001) indicating strong genetic differentiation
between the four populations (Table 3).
UUnniivveerrssiittyy ooff PPrreettoorriiaa eettdd –– SSoollee,, CC LL ((22000055))

86
Figure 2. Mid-point rooted neighbor-joining tree for COI sequence data of S. (P.) hippocrates.
Bootstrap values below 50 % were removed
UUnniivveerrssiittyy ooff PPrreettoorriiaa eettdd –– SSoollee,, CC LL ((22000055))

87
Table 2. Summary of general nucleotide diversity statistics over the 960 bp region of S. (P.) hippocrates
Species Assemblage N No. of
haplotypes Haplotype diversity
Nucleotide diversity
% Pairwise divergence
Variable Sites (V)
Parsimoniously Informative
Sites (PI) Singletons
(S) S. (P.) hippocrates Leipoldtville 13 12 0.987 (0.035) 0.056 (0.029) 0.002 - 0.008 KommadoKraal/Koekenaap 9 7 0.944 (0.070) 0.007 (0.004) 0.001 - 0.008 Kleinsee - Sandkop 20 11 0.926 (0.034) 0.008 (0.004) 0.001 - 0.024 Port Nolloth 11 1 0 0 0 Total 53 31 0.948 (0.021) 0.058 (0.003) 0.01 - 0.123 200 (20.83%) 133 (13.85%) 67 (6.98%) $ V, PI and S were only estimated for the overall dataset
Table 3. Summary of Fst statistics produced by AMOVA (Excoffier et al., 1992) for S. (P.) hippocrates.
Species Φst % P
S. (P.) hippocrates Among populations 84.88 <0.001
Within populations 15.12 <0.001
Fixation index 0.849 b P values were determined from 10000 random permutations.
UUnniivveerrssiittyy ooff PPrreettoorriiaa eettdd –– SSoollee,, CC LL ((22000055))

88
Demographic patterns based on the Stepwise and Exponential Expansion Models
Stepwise expansion model
Both tree topology (Fig. 2) and the mismatch distribution (Fig. 3) indicate recent sudden
demographic expansion for each of the three populations. The branches of the tree within
each population are small and similar in length suggesting a recent expansion in population
size and geographic range. The haplotypic data (mismatch distributions) showed similar uni-
model curves as expected in accordance with historically expanding populations. Both the
variance (sum of the squared deviation (SSD)) and Harpendings Raggedness Index (HRI)
suggested that the curves did not differ significantly under a model of population expansion.
Time of divergence
Using the 960 bp of the COI sequence we calculated the average number of nucleotide
substitutions per site (d) and obtained a value of d = 0.073. The divergence time between S.
(P.) hippocrates and S. (P.) endroedyi, which were shown to be sister taxa (see Sole et al.,
2005; Chapter 2), was estimated to have occurred 2.3 million years ago. This gives the
estimate of nucleotide substitutions per site per lineage per year (�) to be 0.073/(2 x
2,300,000) = 1.5 x 10 -8. The mutation rate per nucleotide site per generation (µ) would be 1.5
x 10 –8. The coalescence time was calculated from the (�) values in Table 4a,�in generations
for each population (see below), using a mutation rate per haplotype (v) of 1.4 x 10⁻⁵.
Based on the above calculated mutation rate and τ values of 5.655, 5.653 and 6.188
(Table 4a) the expansion of the Kommandokraal/Koekenaap and the Leipoldtville
populations appeared to have been around 202,000 generations/years ago, while the Kleinsee
- Sandkop population appeared to have undergone expansion at around 221,000
years/generations ago. Estimated effective female population size after expansion (N1) was an
order of magnitude higher than before expansion (N0) for all three populations with the
Kommandokraal/Koekenaap population having the lowest N0 of approximately 100,000
individuals.
Exponential expansion model
The exponential expansion model indicates rapid growth for two of the populations namely,
Kommandokraal/Koekenaap and Kleinsee - Sandkop having positive ‘g’ values (Table 4b).
The Leipoldtville population, however, shows a strong negative ‘g’ value indicating overall
population decline. Effective female population size estimated from theta (�) did not show
UUnniivveerrssiittyy ooff PPrreettoorriiaa eettdd –– SSoollee,, CC LL ((22000055))

89
large differences between populations but showed an overall tendency towards increasing
population numbers.
The UPBLUE estimates for all the populations are an order of magnitude smaller than
the Tajima’s estimates (UPBLUE/Tajima; Table 5), except in the
KommandoKraal/Koekenaap population, indicating that the Kleinsee - Sandkop and
Leipoldtville populations are declining, whilst KommandoKraal/Koekenaap has a stable
population. This is supported by Fu’s Fs statistics (Table 5) which are negative, but not
significantly so for all the populations, indicating that the populations are experiencing
minimal to no recent expansion.
Observed Simulated-2 0 2 4 6 8 10
Pairwise differences
(a) S. (P.) hippocrates population Leipoldtville
-2
0
2
4
6
8
10
12
14
16
18
20
Fre
quen
cy
-2
0
2
4
6
8
10
12
SSD = 0.019 (p = 0.191)HRI = 0.055 (p = 0.288)
UUnniivveerrssiittyy ooff PPrreettoorriiaa eettdd –– SSoollee,, CC LL ((22000055))
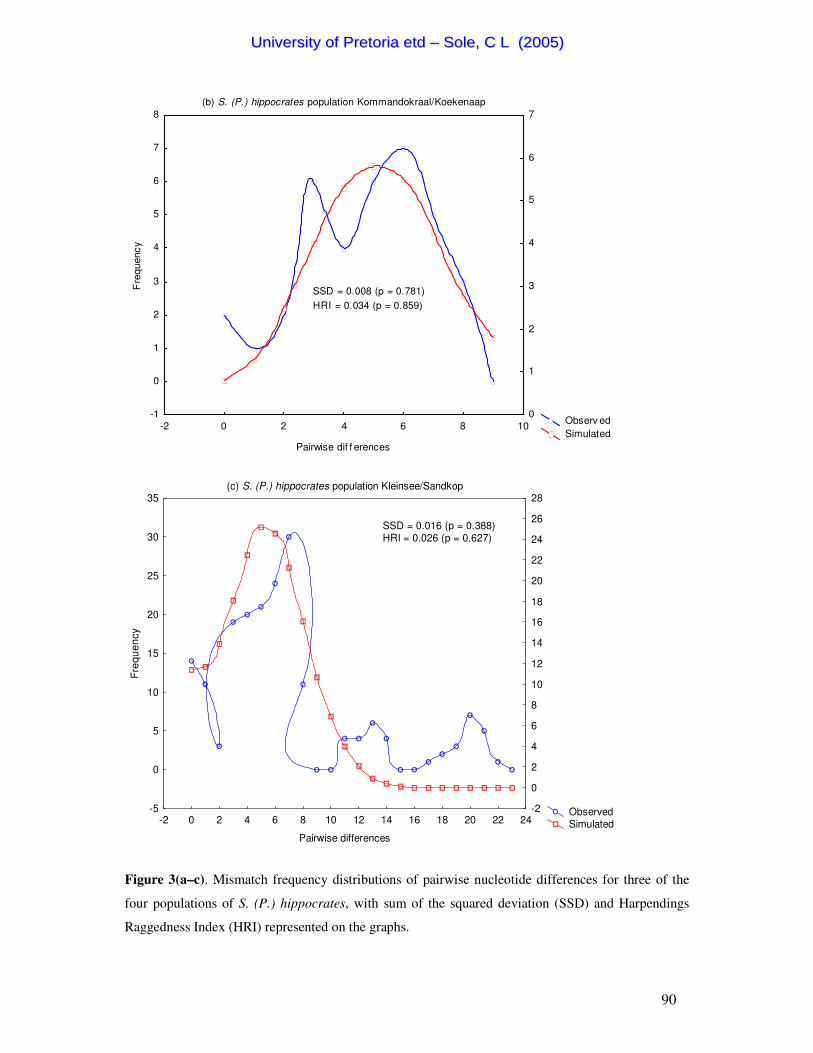
90
Observ ed Simulated
-2 0 2 4 6 8 10
Pairwise dif f erences
(b) S. (P.) hippocrates population Kommandokraal/Koekenaap
-1
0
1
2
3
4
5
6
7
8
Fre
quen
cy
0
1
2
3
4
5
6
7
SSD = 0.008 (p = 0.781)HRI = 0.034 (p = 0.859)
Observed Simulated-2 0 2 4 6 8 10 12 14 16 18 20 22 24
Pairwise differences
(c) S. (P.) hippocrates population Kleinsee/Sandkop
-5
0
5
10
15
20
25
30
35
Freq
uenc
y
-2
0
2
4
6
8
10
12
14
16
18
20
22
24
26
28
SSD = 0.016 (p = 0.388)HRI = 0.026 (p = 0.627)
Figure 3(a–c). Mismatch frequency distributions of pairwise nucleotide differences for three of the
four populations of S. (P.) hippocrates, with sum of the squared deviation (SSD) and Harpendings
Raggedness Index (HRI) represented on the graphs.
UUnniivveerrssiittyy ooff PPrreettoorriiaa eettdd –– SSoollee,, CC LL ((22000055))

91
Table 4. Estimated parameters for (a) Stepwise and (b) Exponential Expansion models of S. (P.) hippocrates a) Stepwise Expansion Model Stepwise Expansion Model Species Populaion τ τ τ τ θθθθ0 = 2µµµµN0 θθθθ1 = 2µµµµN1 t = ττττ/2v S. (P.) hippocrates Leipoldtville 5.655 0 6656.250 202,000 KommadoKraal/Koekenaap 5.653 0.003 52.598 201,900 Kleinsee - Sandkop 6.188 0.084 16.449 221,000 Port Nolloth 0 0 0 0 b) Exponential Expansion Model Exponential Expansion Model
Species Population θθθθ = 2µµµµNf g Nf
S. (P.) hippocrates Leipoldtville 0.0252 -19.439 840,000 KommadoKraal/Koekenaap 0.0293 765.972 980,000 Kleinsee - Sandkop 0.0169 74.623 564,000 Port Nolloth 0 0 0 Table 5. Summary of estimations of Tajima’s estimate�, Fu’s UPBLUE and Fu's Fs statistic of S. (P.) hippocrates Species Leipoldtville KommadoKraal/Koekenaap Kleinsee - Sandkop Port Nolloth S. (P.) hippocrates Tajima's estimate 40.078 5.476 9.839 0 Fu's UPBLUE 0.291 5.267 0.020 0 UPBLUE/Tajima 0.007 0.962 0.002 0 Fu's Fs -1.236 (ns) -1.366 (ns) -0.604 (ns) 0 $ ns = non-significant
UUnniivveerrssiittyy ooff PPrreettoorriiaa eettdd –– SSoollee,, CC LL ((22000055))
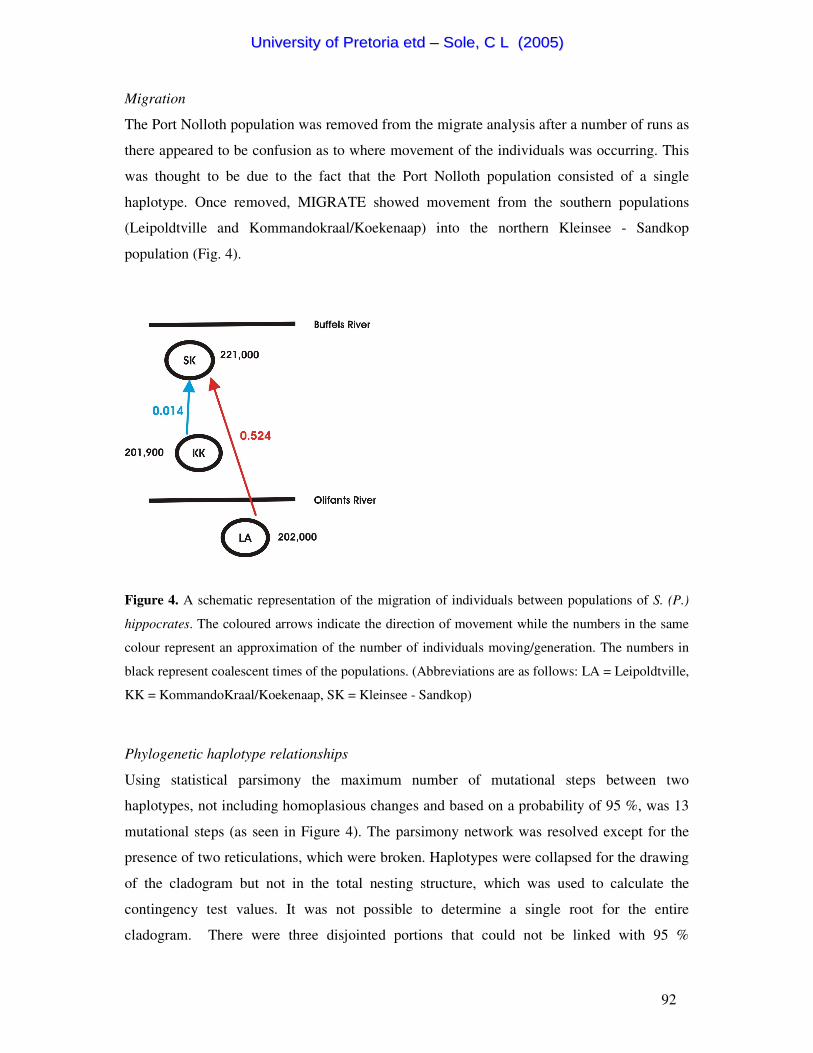
92
Migration
The Port Nolloth population was removed from the migrate analysis after a number of runs as
there appeared to be confusion as to where movement of the individuals was occurring. This
was thought to be due to the fact that the Port Nolloth population consisted of a single
haplotype. Once removed, MIGRATE showed movement from the southern populations
(Leipoldtville and Kommandokraal/Koekenaap) into the northern Kleinsee - Sandkop
population (Fig. 4).
Figure 4. A schematic representation of the migration of individuals between populations of S. (P.)
hippocrates. The coloured arrows indicate the direction of movement while the numbers in the same
colour represent an approximation of the number of individuals moving/generation. The numbers in
black represent coalescent times of the populations. (Abbreviations are as follows: LA = Leipoldtville,
KK = KommandoKraal/Koekenaap, SK = Kleinsee - Sandkop)
Phylogenetic haplotype relationships
Using statistical parsimony the maximum number of mutational steps between two
haplotypes, not including homoplasious changes and based on a probability of 95 %, was 13
mutational steps (as seen in Figure 4). The parsimony network was resolved except for the
presence of two reticulations, which were broken. Haplotypes were collapsed for the drawing
of the cladogram but not in the total nesting structure, which was used to calculate the
contingency test values. It was not possible to determine a single root for the entire
cladogram. There were three disjointed portions that could not be linked with 95 %
UUnniivveerrssiittyy ooff PPrreettoorriiaa eettdd –– SSoollee,, CC LL ((22000055))

93
confidence, namely clades 6-1, 6-2 and 11-1. Furthermore, haplotypes LA13, PN01 and
SK16 were separated from all other haplotypes by many mutational steps (14 - 109). Clades
6-1 and 11-1 were linked by 60 mutational steps while haplotype PN01 linked to these two
clades by 64 mutational steps. Haplotype SK16 and clade 6-2 linked into the entire network
with 65 mutational steps. Haplotype LA13 linked into the network with 109 steps. The
network confirms the results seen in previous analyses in that there are relatively high
divergence levels between the four populations, as the three disjointed portions represent the
haplotypes from a single population (Table 1) with PN01 being representative of the single
haplotype from 11 individuals from the Port Nolloth population.
Nested clade analysis did not reject the null hypothesis at the lower nesting levels, due
to the fact that these nesting levels did not have haplotypes from different geographic regions
in them. However, the contingency test showed significant geographical association of
genotypes contained within haplotype groups 12-1, 13-1 and 14-1 (Table 6). All the inference
events correspond to allopatric fragmentation of the populations, which would appear true as
the populations are isolated by natural barriers (rivers), human habitation, farming areas and
mining activities. There is no support for secondary contact between the populations as no
shared haplotypes are contained between the populations.
The Mantel test revealed no significant association between genetic and geographic
distances (g = 1.282, r = 0.458, p > 0.05). This indicated that an increase in geographic
distance did not necessarily correlate with a greater degree of genetic distinction.
UUnniivveerrssiittyy ooff PPrreettoorriiaa eettdd –– SSoollee,, CC LL ((22000055))

94
Figure 5. Statistical parsimony network and associated network design. Haplotypes are designated by letters,
which represent the population from where the haplotype came (as seen in Table 1) and numbers representing
the individual sequenced. The thickness of the connecting line corresponds to the number of mutational steps.
Ancestral haplotypes are represented by squares. The relative frequency at which the different haplotypes
occurred is indicated by different background colours, haplotypes with pink background occur 11 times, the
grey background four times, a blue background occurred three times and a green background occur twice. The
nested clades are represented from 4 - step clades upwards, as the mutations were only collapsed for drawing of
the cladogram and not for calculation of the nested clade. Dotted lines represent alternative ambiguous
connections.
UUnniivveerrssiittyy ooff PPrreettoorriiaa eettdd –– SSoollee,, CC LL ((22000055))

95
Table 6. Geographical nested clade analysis for S. (P.) hippocrates as inferred from Templeton (2004).
Haplotype group χχχχ2222 P-value Inference chain Clades within 12-1 28.000 <0.001 1-19-No Allopatric fragmentation - also observed at high clade level Clades within 13-1 39.000 <0.001 1-19-No Allopatric fragmentation - also observed at high clade level Clades within 14-1 53.333 <0.001 1-19-No Allopatric fragmentation - also observed at high clade level
UUnniivveerrssiittyy ooff PPrreettoorriiaa eettdd –– SSoollee,, CC LL ((22000055))

96
Discussion Demographic patterns
S. (P.) hippocrates exhibits a high degree of genetic polymorphism as seen by the high
overall haplotype diversity. Both the Stepwise and Exponential Expansion models show a
strong inclination for population growth from an ancestral bottlenecked population. As
expected, the four populations show appreciable mtDNA divergence in that strong support
for all four of the designated populations was obtained. Strong genetic structure between the
populations is clear in the highly significant fixation index value, as well as the high
maximum pairwise divergence value of 12.3 % (Table 2), indicative of a relatively long
historical separation.
The Mantel test shows no association between geographic and genetic distances hence
distance could be ruled out as the defining factor for the distinct genetic isolation present. The
most probable cause of genetic discontinuities displaying geographic disorientation could
therefore be attributed to extrinsic barriers to gene flow. Extrinsic factors contributing to the
genetic structure seen in S. (P.) hippocrates would be the Olifants and Holgat Rivers, Port
Nolloth (the town), large tracts of areas on which farming occurs, as seen in the Leipoldtville
and Kommandokraal areas, and mining at Kleinsee - Sandkop. This is clearly illustrated by
the fact that each of the factors mentioned above relates to a specifically identified
population. NCPA supports this by inferring allopatric fragmentation at all significant levels,
indicating that this species may be on its way to speciation.
Previous studies dealing with other insect taxa have shown that speciation events
have occurred in the sandy accumulations of river mouths in Namaqualand e.g. Thysanura
(Irish, 1990). Harrison (1999) showed quite clearly that S. (P.) endroedyi and S. (P.) glentoni
speciated around the Olifants River mouth with S. (P.) endroedyi occurring north of the
Olifants River and S. (P.) glentoni south of the Olifants River. Both these species occur
sympatrically with, and are sister to, S. (P.) hippocrates (Harrison & Philips, 2003; Sole et
al., 2005). The Holgat River has also been shown to be the boundary of the northern
distribution of S. (P.) hippocrates (Harrison et al., 2003). Anthropogenic influences can
clearly be seen in the Port Nolloth population where the town is encroaching into the coastal
dunes and destroying much of the available habitat. It would appear that anthropogenic
factors, occurring over the last 100 years, affect Leipoldtville and
Kommandokraal/Koekenaap populations in that individuals occur on disturbed farmland
while the Kleinsee - Sandkop population is affected by mining in the area.
UUnniivveerrssiittyy ooff PPrreettoorriiaa eettdd –– SSoollee,, CC LL ((22000055))

97
Rates of migration were estimated in an attempt to infer historical movements of
species. Movement appeared to be in a south-north direction consistent with the
unidirectional wind regime along the west coast. The Kleinsee - Sandkop population appears
to have undergone expansion earlier than the other two populations, which is in contrast to
the migration estimates as these show the Kleinsee - Sandkop population to be receiving
individuals from the other two populations as opposed to movement from the Kleinsee -
Sandkop population. However, as the expansion times between the populations appear small
with the difference between the earliest and the latest coalescent events being as little as
18,000 years ago it would appear that fragmentation of these populations occurred over a
similar time period after movement in a northerly direction. The coalescent events appear,
therefore to, have occurred at approximately 200,000 years ago thus dating back to the late
Pleistocene.
The modern semi-arid environment and winter rainfall within the south-western Cape
seen today dates back to the Pliocene. Fossil pollen studies indicate that two invasions of
temperate rain forest, and two wet intervals occurred between 33,000 and 45,000 years ago
(van Zinderen Bakker, 1975). These climatic oscillations could have caused the historical
population expansions seen in the genetic signal. The wet intervals were considered colder
periods and the transitional Namib, the area between the Olifants and Orange Rivers, and the
southern Namib, presently covered by gigantic dunes, would therefore have received more
rain during this period. Increased rainfall would have resulted in stream rejuvenation causing
an increase in the sediment source and giving rise to dune plumes occurring at the mouths of
many ephemeral rivers along the west coast (van Zinderen Bakker, 1975). This highlights the
importance of river mouths as barriers to gene flow and areas that could be designated as
refugia for population expansion events of flightless species. These Namaqualand dunes,
previously stabilised by vegetation, are extremely long and narrow and presently show signs
of being overridden by shifting un-vegetated barchanoid dunes, fed by the erosion of the
older coastal dunes (Tankard & Rogers, 1978).
Actual areas of refugia are difficult to identify, as there are no shared haplotypes
between populations indicative of a possible ancestral population. Ancestral haplotypes are
thought to be shared between, and widespread among populations (Avise et al., 1987).
Current population trends
Scarabaeus (Pachysoma) hippocrates occupy the southernmost area of the total Scarabaeus
(Pachysoma) distribution. Namaqualand is a winter-rainfall desert covering some 50,000km2
UUnniivveerrssiittyy ooff PPrreettoorriiaa eettdd –– SSoollee,, CC LL ((22000055))

98
- characterised by predictably low rainfall, and mild seasonal temperature changes (Cowling
et al., 1999; Colville et al., 2002) - and exhibits a high degree of endemism in both fauna and
flora. Namaqualand has not only recently been subject to extensive commercial and
subsistence grazing, resulting in significant vegetation change, soil erosion and the loss of
primary productivity (Colville et al., 2002), but also over past geological time major climatic
oscillations have occurred. A combination of these factors could, therefore, have structured
this species. Population fragmentation over geological time, leads to genetic divergence of
populations, while human induced fragmentation acts over a short period of time eroding
genetic diversity. The entire population has been fragmented by environmental factors over
time which have not decreased the genetic divergence. However, within the same species, the
Port Nolloth population shows a distinct loss of genetic diversity through human induced
fragmentation. This indicates that both population- and human- induced fragmentation have
affected this species as a whole.
Although both the stepwise and exponential expansion models indicate strong
population growth these increases in population sizes may be misleading. There is no
available census data for this species but considering current trends of species records and
habitat destruction it is far easier to infer that population numbers are declining (Moya et al.,
2004) and that S. (P.) hippcrates may be extinct in areas where it once occurred. This is
supported to some extend by the UPBLUE/Tajima estimates that show that two out of four
populations are in fact declining. However, it should be borne in mind that genetic signatures
of population growth can be misleading (Lavery et al., 1996). Fu’s UPBLUE estimator of θ
and Fs statistics may be an indicator that significant population growth is not occurring but
recent demographic events may be masked by earlier events. The genetic signal of growth
could, therefore, be an artefact of past demographic population increase as would have
occurred during the Pleistocene (Lavery et al., 1996). It has been shown that after rapid
population growth, subsequent periods of decline would have no great effect on the initial
pattern of growth unless there is a major prolonged bottleneck or until equilibrium is
approached (Lavery et al., 1996). As many species are not in equilibrium due to past
demographic events and the more recent events are undetectable, the results we obtain may
be misleading (Lavery et al., 1996).
Summary statistics show that S. (P.) hippocrates is a genetically and geographically
well structured species. Migration estimates show gene flow to be unidirectional from the
south to the north. Genetic diversity indicates that distinct genetic variability exists within
UUnniivveerrssiittyy ooff PPrreettoorriiaa eettdd –– SSoollee,, CC LL ((22000055))

99
and between the populations. Genetic patterns can be related to both past geological events as
well as recent fragmentation events.
In this case the anthropogenic and environmental forces discussed above are not
mutually exclusive and the combination thereof provides a plausible explanation for the
complex population demographic structure seen today.
UUnniivveerrssiittyy ooff PPrreettoorriiaa eettdd –– SSoollee,, CC LL ((22000055))

100
Chapter IV (b) ___________________________________________________________________________
Genetic structure, phylogeography and demography of S. (P.) gariepinus based on
inferences from Cytochrome Oxidase I
Introduction
Scarabaeus (Pachysoma) gariepinus are distributed from the Buffels River (S29°33’ –
E17°24’) in South Africa to the Agub Mountain (S26°59’ – E15°58’) in Namibia.
Interestingly, they occur both south and north of the Orange River with their distribution
covering two distinct biomes, Namaqualand, south of the Orange River, and the Namib
Desert, north of the Orange River. Many ecological factors are found to influence
distributional patterns of arthropods. These include temperature, rainfall, sand characteristics
and availability of food among others. Limited vagility and narrow ecological and
physiological tolerances may have promoted the present day distribution of S. (P.)
gariepinus. The presence of this endemic species in the southwest arid regions, the fact that
they exhibit south to north morphological clinal variation, are flightless with unique biology,
and occur on either side of the Orange River warrants investigation into their biogeography.
Size, elytral sculpture, indument and size of the mesepisternal protuberance were
found to vary within and between localities (Harrison, 1999). The populations south of the
Orange River are characterized by smaller body size and red indument, while the Namibian
populations are generally larger with their indument stained white to grey.
Materials and Methods
See general introduction to chapter. Details of specimen collection sites can be seen in Figure
6.
UUnniivveerrssiittyy ooff PPrreettoorriiaa eettdd –– SSoollee,, CC LL ((22000055))

101
Figure 6. Localities in both Namibia and South Africa where S. (P.) gariepinus was collected
for this study
Results Phylogenetic and Molecular diversity
Population statistics
A total of 67 individuals were used for molecular characterisation (GenBank Accession
numbers AY965087 – AY965153). The sequences exhibited an overall A/T bias of 69.10 %.
Gamma distribution for the data was estimated at 1.0041 with the proportion of invariable
sites being 0.7627, the transition/transversion ratio was 6.6 and the model best fitting the data
selected by Modeltest was Tamura-Nei. The neighbor-joining tree of 67 individuals (Fig. 7)
revealed three distinct assemblages. The first assemblage (labelled N; Fig. 7) had 100 %
bootstrap support and consisted exclusively of individuals from the three populations in
Namibia (Table 1). The second and third assemblages (labelled LK and HR; Fig. 7) had 100
% and 99 % bootstrap support, respectively and consisted of individuals from each of their
respective populations, Langhoogte/Kommagas and Holgat River (Table 1). These three
assemblages where each treated as distinct populations in further analyses. (Both the
UUnniivveerrssiittyy ooff PPrreettoorriiaa eettdd –– SSoollee,, CC LL ((22000055))

102
Parsimony and Maximum Likelihood trees exhibited similar topologies to the neighbor-
joining tree; data not presented).
Table 7 shows the molecular diversity statistics for each designated population from
Table 1, the population designations from the neighbor-joining tree and the species as a
whole. The sequenced COI fragment defined 62 unique haplotypes among the 67 individuals
investigated. Accordingly, haplotype diversity expressed over the complete sample was very
high (H = 0.997 +/- 0.004) (Table 7). All three assemblages contained numerous different
haplotypes and no evidence was found for certain haplotypes being specific to a geographic
region.
Genetic variation among populations
Mean nucleotide diversity was calculated across the three populations of the neighbor-joining
tree (Table 8). The results of AMOVA revealed that differences among the three defined
groups accounted for 49.6 % of the variance (Φct = 0.496; p = 0.001). A high and significant
Φst value of 0.704 (p = 0,001) indicated strong genetic structure between the three designated
populations. Pairwise comparisons between the Φst therefore clearly support the
distinctiveness of three populations. The remaining variation could be attributed to Φsc =
0.415 (among group within population variation) which was significant (p = 0.001),
accounting for 20.9 % of the overall variation.
UUnniivveerrssiittyy ooff PPrreettoorriiaa eettdd –– SSoollee,, CC LL ((22000055))

103
Figure 7. Mid-point rooted neighbor-joining tree for the COI sequence data of S. (P.) gariepinus.
Bootstrap values below 50 % were removed.
UUnniivveerrssiittyy ooff PPrreettoorriiaa eettdd –– SSoollee,, CC LL ((22000055))

104
Table 7. Summary of general diversity statistics of S. (P.) gariepinus
Species Assemblage N No. of
haplotypes Haplotype diversity
Nucleotide diversity
% Pairwise divergence
Variable sites (V)
Parsimoniously Informative
Sites (PI) Singletons
(S) S. (P.) gariepinus Langhoogte/Kommagas 12 8 0.909 (0.065) 0.026 (0.014) 0.004 - 0.039 Holgat River 17 16 0.993 (0.023) 0.023 (0.012) 0.001 - 0.035 Hohenfels 13 13 1.000 (0.030) 0.022 (0.012) 0.002 - 0.031 Daberas to Obib 11 11 1.000 (0.039) 0.038 (0.020) 0.001 - 0.063 Klingharts Mountains 14 14 1.000 (0.027) 0.042 (0.022) 0.001 - 0.065 Namibia assemblage 38 38 1.000 (0.000) 0.043 (0.021) 0.001 - 0.069 Total 67 62 0.997 (0.004) 0.057 (0.001) 0.001 - 0.103 64 (6.67%) 30 (3.13%) 34 (3.54%)
$ V, PI and S were only estimated for the overall dataset
Table 8. Summary of Fst statistics calculated by AMOVA (Excoffier et al., 1992) for S. (P.) gariepinus Species ΦΦΦΦst % P
S. (P.) gariepinus Among groups Φct 0.496 49.6 <0.001
Among groups within populations Φsc 0.415 20.9 <0.001
Within populations Φst 0.705 29.5 <0.001 b P values were determined from 10000 random permutations.
UUnniivveerrssiittyy ooff PPrreettoorriiaa eettdd –– SSoollee,, CC LL ((22000055))
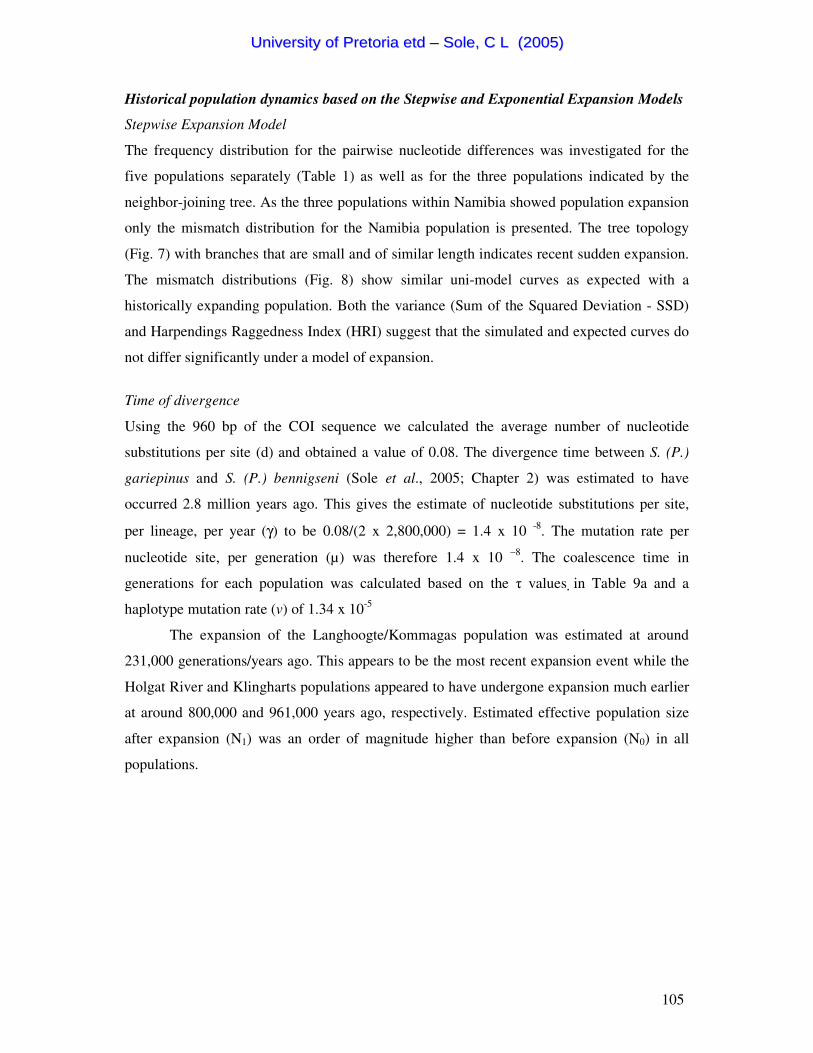
105
Historical population dynamics based on the Stepwise and Exponential Expansion Models
Stepwise Expansion Model
The frequency distribution for the pairwise nucleotide differences was investigated for the
five populations separately (Table 1) as well as for the three populations indicated by the
neighbor-joining tree. As the three populations within Namibia showed population expansion
only the mismatch distribution for the Namibia population is presented. The tree topology
(Fig. 7) with branches that are small and of similar length indicates recent sudden expansion.
The mismatch distributions (Fig. 8) show similar uni-model curves as expected with a
historically expanding population. Both the variance (Sum of the Squared Deviation - SSD)
and Harpendings Raggedness Index (HRI) suggest that the simulated and expected curves do
not differ significantly under a model of expansion.
Time of divergence
Using the 960 bp of the COI sequence we calculated the average number of nucleotide
substitutions per site (d) and obtained a value of 0.08. The divergence time between S. (P.)
gariepinus and S. (P.) bennigseni (Sole et al., 2005; Chapter 2) was estimated to have
occurred 2.8 million years ago. This gives the estimate of nucleotide substitutions per site,
per lineage, per year (γ) to be 0.08/(2 x 2,800,000) = 1.4 x 10 -8. The mutation rate per
nucleotide site, per generation (µ) was therefore 1.4 x 10 –8. The coalescence time in
generations for each population was calculated based on the � values �in Table 9a and a
haplotype mutation rate (v) of 1.34 x 10⁻⁵
The expansion of the Langhoogte/Kommagas population was estimated at around
231,000 generations/years ago. This appears to be the most recent expansion event while the
Holgat River and Klingharts populations appeared to have undergone expansion much earlier
at around 800,000 and 961,000 years ago, respectively. Estimated effective population size
after expansion (N1) was an order of magnitude higher than before expansion (N0) in all
populations.
UUnniivveerrssiittyy ooff PPrreettoorriiaa eettdd –– SSoollee,, CC LL ((22000055))

106
Observed Simulated
0 5 10 15 20 25 30 35 40
Pairwise dif f erences
(a) S. (P.) gariepinus population Langhoogte/Kommagas
-2
0
2
4
6
8
10
12
14
Fre
quen
cy
0.6
0.8
1.0
1.2
1.4
1.6
1.8
2.0
2.2
SSD = 0.076 (p = 0.007)HRI = 0.149 (P = 0.046)
Observed Simulated-5 0 5 10 15 20 25 30 35 40
Pairwise dif f erences
(b) S. (P.) gariepinus population Holgat River
-2
0
2
4
6
8
10
12
14
16
18
20
Fre
quen
cy
-2
0
2
4
6
8
10
12
SSD = 0.015 (p = 0.263)HRI = 0.014 (p = 0.729)
UUnniivveerrssiittyy ooff PPrreettoorriiaa eettdd –– SSoollee,, CC LL ((22000055))

107
(c ) S. (P.) gari epnu s Nam ibia Popu lation
Observed Similulated
-12 0 12 24 36 48 60 72
Pairwise dif f erences
-5
0
5
10
15
20
25
30
35
40
Fre
quen
cy
-2
0
2
4
6
8
10
12
14
16
18SSD = 0.0142 (p = 0.099)HRI = 0.009 (p = 0.041)
Figure 8 (a – c). Mismatch frequency distributions of pairwise nucleotide differences for the three
population assemblages of S. (P.) gariepinus, with sum of the squared deviation (SSD) and
Harpendings Raggedness Index (HRI) represented on the graphs.
Exponential Population Expansion
The exponential expansion model also indicated a rapid increase in effective population size
(positive ‘g’ value; Table 9b) for all populations. Effective female population size estimated
from θ differed markedly between populations with the Langhoogte/Kommagas population
having the smallest effective female population size. These values, however, showed a
consistent increase in population sizes.
The UPBLUE/Tajima estimate does not show a major recent increase in population
size for any of the populations (Table 10). The Holgat River has a slightly significant
negative Fs estimate, indicating a small possible increase in population size while the
Langhoogte/Kommagas population has a positive value for the Fs estimate, indicating no
recent increase in population size (Table 10). The Namibian population has a highly
significant negative value indicating recent mutations leading to population growth, which is
in contrast to the UPBLUE estimate.
UUnniivveerrssiittyy ooff PPrreettoorriiaa eettdd –– SSoollee,, CC LL ((22000055))
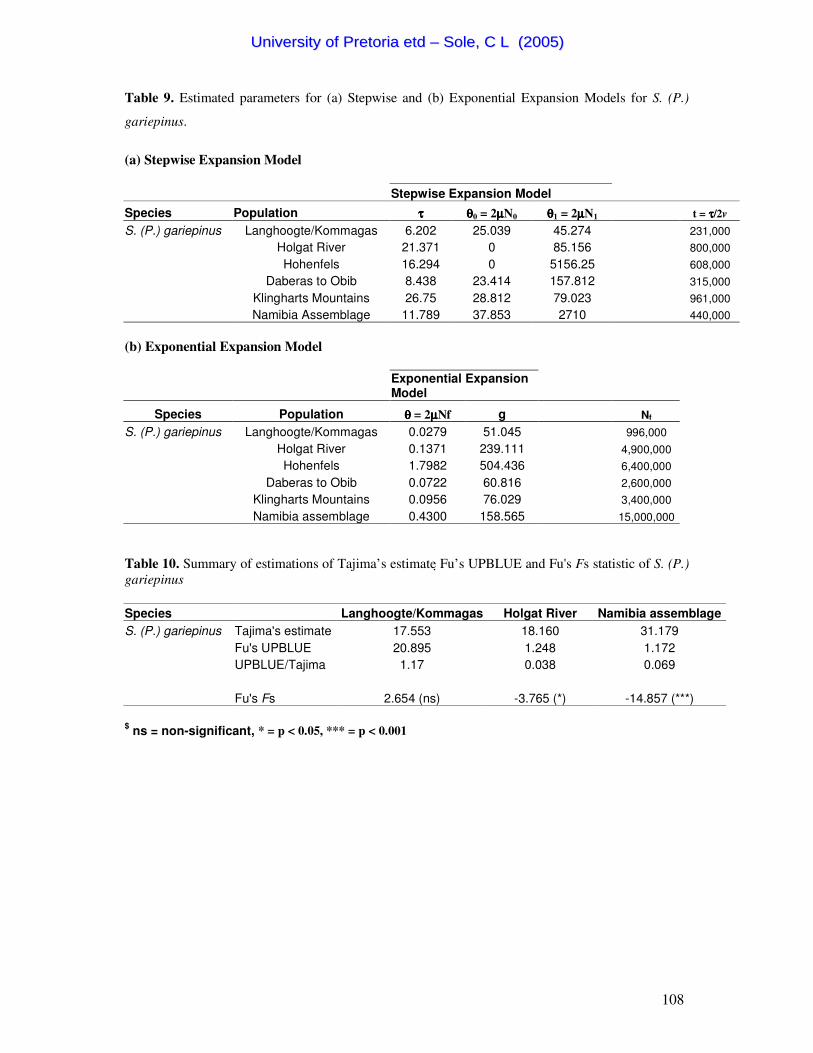
108
Table 9. Estimated parameters for (a) Stepwise and (b) Exponential Expansion Models for S. (P.)
gariepinus.
(a) Stepwise Expansion Model Stepwise Expansion Model
Species Population ττττ θθθθ0 = 2µµµµN0 θθθθ1 = 2µµµµN1 t = ττττ/2v S. (P.) gariepinus Langhoogte/Kommagas 6.202 25.039 45.274 231,000 Holgat River 21.371 0 85.156 800,000 Hohenfels 16.294 0 5156.25 608,000 Daberas to Obib 8.438 23.414 157.812 315,000 Klingharts Mountains 26.75 28.812 79.023 961,000 Namibia Assemblage 11.789 37.853 2710 440,000 (b) Exponential Expansion Model
Exponential Expansion Model
Species Population θθθθ = 2µµµµNf g Nf
S. (P.) gariepinus Langhoogte/Kommagas 0.0279 51.045 996,000 Holgat River 0.1371 239.111 4,900,000 Hohenfels 1.7982 504.436 6,400,000 Daberas to Obib 0.0722 60.816 2,600,000 Klingharts Mountains 0.0956 76.029 3,400,000 Namibia assemblage 0.4300 158.565 15,000,000 Table 10. Summary of estimations of Tajima’s estimate� Fu’s UPBLUE and Fu's Fs statistic of S. (P.) gariepinus Species Langhoogte/Kommagas Holgat River Namibia assemblage S. (P.) gariepinus Tajima's estimate 17.553 18.160 31.179 Fu's UPBLUE 20.895 1.248 1.172 UPBLUE/Tajima 1.17 0.038 0.069 Fu's Fs 2.654 (ns) -3.765 (*) -14.857 (***) $ ns = non-significant, * = p < 0.05, *** = p < 0.001
UUnniivveerrssiittyy ooff PPrreettoorriiaa eettdd –– SSoollee,, CC LL ((22000055))
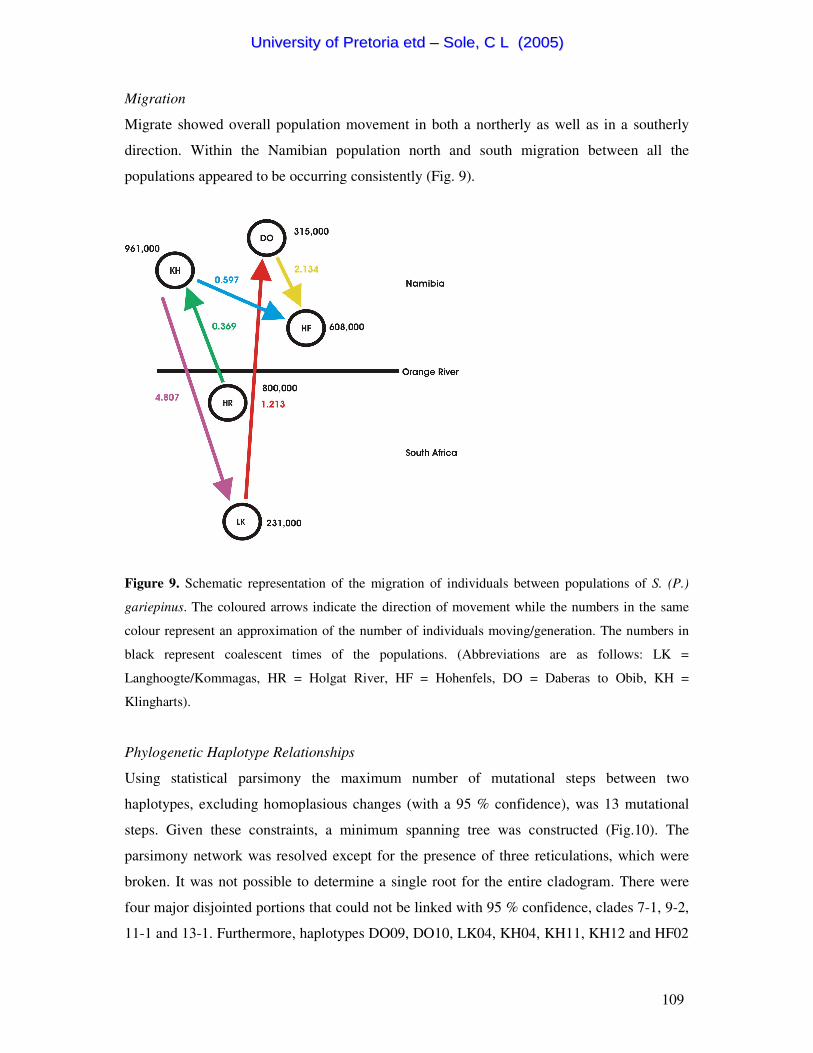
109
Migration
Migrate showed overall population movement in both a northerly as well as in a southerly
direction. Within the Namibian population north and south migration between all the
populations appeared to be occurring consistently (Fig. 9).
Figure 9. Schematic representation of the migration of individuals between populations of S. (P.)
gariepinus. The coloured arrows indicate the direction of movement while the numbers in the same
colour represent an approximation of the number of individuals moving/generation. The numbers in
black represent coalescent times of the populations. (Abbreviations are as follows: LK =
Langhoogte/Kommagas, HR = Holgat River, HF = Hohenfels, DO = Daberas to Obib, KH =
Klingharts).
Phylogenetic Haplotype Relationships
Using statistical parsimony the maximum number of mutational steps between two
haplotypes, excluding homoplasious changes (with a 95 % confidence), was 13 mutational
steps. Given these constraints, a minimum spanning tree was constructed (Fig.10). The
parsimony network was resolved except for the presence of three reticulations, which were
broken. It was not possible to determine a single root for the entire cladogram. There were
four major disjointed portions that could not be linked with 95 % confidence, clades 7-1, 9-2,
11-1 and 13-1. Furthermore, haplotypes DO09, DO10, LK04, KH04, KH11, KH12 and HF02
UUnniivveerrssiittyy ooff PPrreettoorriiaa eettdd –– SSoollee,, CC LL ((22000055))
110
were separated from all other haplotypes by many mutational steps (from 14 to 32).
Haplotypes DO09 and DO10 linked to clade 7-1 in 14 mutational steps while KH04 and
KH12 linked to clades 2-9 and 8-1 with 15 and 16 mutational steps, respectively. Clade 9-2
and haplotype KH11 linked to clade 9-1 with 18 mutational steps. Haplotypes HF02 and
LK04 link to clades 19-1 and 3-1 with 30 and 32 mutational steps, respectively. Clades 11-1
and 13-1 link with 45 mutational steps and the entire network links in 58 mutational steps.
The network shows two distinct clades, 14-1 and 12-1, indicating geographical
distinction and supporting the neighbor-joining tree. Clade 14-1 represents the South African
populations of S. (P.) gariepinus, with 13-1 representing the individuals from
Langhoogte/Kommagas and 11-1 those individuals from Holgat River. Clade 12-1 groups all
the individuals from the Namibia population together.
The contingency test showed strong geographical association of haplotypes between
clades 5-1, 9-1, 10-1, 14-1 and 15-1 (Table 11). The inference chain indicated restricted gene
flow with isolation by distance for clade 5-1. Both clades 9-1 and 10-1 indicate inadequate
geographic sampling which made it difficult to distinguish between continuous range
expansion, long distance colonisation and past fragmentation. Both clades 14-1 and 15-1
indicated allopatric fragmentation as the process responsible for the observed separation
between the two South African populations and the populations in South Africa and Namibia.
Secondary contact between the populations appears not to have occurred as no shared
haplotypes occur between the populations.
The Mantel test revealed a significant association between geographical and genetic
distances (g = 2.055, r = 0.6206, p < 0.025), indicating that an increase in distance was
related to an increase in the genetic distinctness of the populations.
UUnniivveerrssiittyy ooff PPrreettoorriiaa eettdd –– SSoollee,, CC LL ((22000055))

111
Figure 10. S. (P.) gariepinus statistical parsimony network and associated design. Haplotypes are designated
by letters representing which population the haplotype came from (as seen in Table 1) and the numbers
represent the individual sequenced. The thickness of the connection line indicates the number of mutational
steps. Dotted lines represent alternative ambiguous connections. Ancestral haplotypes are represented by
squares. Haplotypes with grey background are those that occurred three times and those with a blue background
occurred twice.
UUnniivveerrssiittyy ooff PPrreettoorriiaa eettdd –– SSoollee,, CC LL ((22000055))

112
Table 11. Results of the geographical nested clade analysis for S. (P.) gariepinus, inferences based on Templeton (2004) Haplotype group χχχχ2 P-value Inference chain Clades within 5-1 10.644 <0.05 1-no-2-no-11-no-17-yes-4-no Restricted gene flow with isolation by distance - applicable to lower clade levels only Clades within 9-1 24.000 <0.05 1-yes-19-yes-20-no Inadequate geographic sampling Clades within 10-1 32.926 <0.000 1-no-2-no-11-yes-12-yes-13-no-14-yes Sampling design inadequate to discriminate between contiguous range expansion, long distance colonisation and past fragmentation Clades within 14-1 29.000 <0.000 1-yes-19-no Allopatric fragmentation Clades within 15-1 67.000 <0.000 1-yes-19-no Allopatric fragmentation
UUnniivveerrssiittyy ooff PPrreettoorriiaa eettdd –– SSoollee,, CC LL ((22000055))

113
Discussion
Demographic patterns
Scarabaeus (Pachysoma) gariepinus exhibits a high degree of genetic polymorphism as can
be seen by the overall high haplotype diversity. Mitochondrial DNA divergence of S. (P.)
gariepinus shows strong support for three distinct populations correlating to distinct
geographic areas, a Namibian population and two populations in South Africa. The three-
population hypothesis shows strong genetic structure as seen by the high Φst value of
AMOVA as well as by the overall high sequence divergence (maximum of 10.3 %; Table 7).
This is indicative of a long historical separation and could be due to both extrinsic and
intrinsic factors.
Extrinsic factors such as environmental barriers contributing to the population
structure seen in the present study could be the Orange and Holgat Rivers, which may have
separated the populations in South Africa (Holgat River) from each other as well as from the
Namibian population (Orange River). Previous studies indicate that sandy pockets at river
mouths in Namaqualand (Endrödy-Younga, 1982a), sand accumulations in the lower Orange
River (Endrödy-Younga, 1982a; Penrith, 1984) and coastal/littoral dunes (Endrödy-Younga,
1978), specifically in the western Cape (Penrith, 1986) could act as possible areas of origin
for various psammophilous taxa. Nested clade analysis distinctly indicates that allopatric
fragmentation is the defining factor for the fragmentation between the
Langhoogte/Kommagas and Holgat River populations (clade 14-1) as well as between the
South African populations and the Namibian population (clade 15-1).
Alternatively, the population structure of S. (P.) gariepinus could be maintained by
intrinsic factors such as flightlessness, which results in reduced vagility. The Mantel test
shows a strong association between geographic and genetic distances, indicating distance as
an important factor for influencing the population structure. This is clearly supported by the
nested clade analysis, clade 5-1, which includes individuals from two Namibian populations,
namely Daberas/Obib and Hohenfels Dunes, where there is restricted gene flow due to
isolation by distance. Since the Namibian population occurs on a known dune field
continuum, clades 9-1 and 10-1 indicate inadequate sampling hence the need to increase
sampling along the complete dune system as opposed to discrete points as was done here.
This is important for understanding the apparent lack of structure within the Namibian
population.
UUnniivveerrssiittyy ooff PPrreettoorriiaa eettdd –– SSoollee,, CC LL ((22000055))
114
Both the mismatch distributions and the exponential expansion model indicate a
sudden historical increase in all population sizes. Effective female population size differed
markedly between the Stepwise and Exponential Expansion Models indicating the
importance of using these values as relative indicators and not precise estimates. However,
the trends identified across the historical estimation procedures were the same. Fu’s Fs
statistics show strong support within the Namibian population for overall recent population
growth but the UPBLUE estimate contradicts this. The UPBLUE/Tajima estimate shows the
Langhoogte/Kommagas and Holgat River populations to be stable with slight growth in the
Langhoogte/Kommagas population. Fu’s Fs statistic indicates a similar trend in the
Langhoogte/Kommagas population, in that there is no growth. In contrast to this the Fs
statistic for the Holgat River population is significantly negative indicating recent growth.
However, the contrast between the Stepwise and Exponential Expansion Models and Fu’s
UPBLUE/Tajima estimate and the Fs statistic is only apparent in that the two expansion
models infer population growth from historical/ancient processes whereas Fu’s methods infer
population parameters based on more recent mutational events.
Migration rates between populations were estimated in an attempt to infer historical
movements of the species. Overall it appeared there had been a large amount of movement
between populations. Movement occurred in a south-north direction, which is consistent with
previous hypotheses that indicate movement with the unidirectional wind regime (Endrödy-
Younga, 1982a; Sole et al., 2005) as well as in a north-south direction. Two populations
appear to have undergone expansion earlier than the others, the Klingharts Mountains and
Holgat River populations, 800,000 and 961,000 years ago, respectively. It would, therefore,
appear that the ancestor of what is seen today would have invaded the Namib by simply
moving from east to west or by remaining at a locality and adapting to the changing climate,
thereafter moving and radiating into other favourable habitats (Irish, 1990). The addition of
an extra locus (microsatellites/nuclear gene) would possibly allow for a clearer picture. The
amount of movement between populations appeared high for a group of flightless individuals.
This may show that under conditions of extreme environmental pressure or very favourable
periods the beetles will move over long distances. Contradictory to this is the fact that each
population has its own set of unique haplotypes indicating that individuals appear to remain
in a certain locality.
UUnniivveerrssiittyy ooff PPrreettoorriiaa eettdd –– SSoollee,, CC LL ((22000055))

115
Species boundaries and conservation issues
One of the most fundamental urges of mankind is to identify and name things (Mayr &
Ashlock, 1991). It has been suggested that the taxonomy of a group should be consistent with
its evolutionary history (Wiley, 1981; Frost & Hillis, 1990). Every species taxon in nature
consists of numerous local populations, which raises the problem of how to treat them
taxonomically. Adding dimensions of geography and time poses numerous additional
problems (Mayr & Ashlock, 1991). The mitochondrial DNA of S. (P.) gariepinus reveals
three distinct genetically isolated assemblages, which reflect different demographic histories.
All three assemblages are unique in the fact that they do not share haplotypes and have
probably been isolated for more than 200,000 years and may therefore warrant distinct
taxonomic status under various species concepts. In principle the three assemblages could be
defined as separate species based on the Phylogenetic species concept (Nixon & Wheeler,
1990) and Templeton’s cohesion species concept (Templeton, 2001), as it appears that there
has been no recent gene flow.
Moritz (1994a; b) identified units or targets for conservation by applying the principle
of conserving ecological and evolutionary processes in an attempt to conserve biogeography
(Moritz, 1999). It may be optimistic to attempt to conserve all the populations of a species
therefore one would ideally like to target the populations that will ensure a species remains
viable and able to survive in the short-term and diversify in the long-term. Moritz (1994a;
1999) describes these units or targets as Evolutionary Significant Units (ESUs) and
Management Units (MUs). ESUs he defines as having to be reciprocally monophyletic for
mtDNA alleles and to have shown significant divergence of allele frequencies at nuclear loci.
MUs are recognised as populations with significant divergence of allele frequencies at
nuclear or mitochondrial loci, regardless of phylogenetic distinctiveness of the alleles and are
the units used for population monitoring and demographic based studies (Moritz, 1994a).
According to these definitions the populations of S. (P.) gariepinus could be described as
MUs. These populations are connected by low levels of historical gene flow but are
functionally independent and would therefore need to be managed as individual entities,
forming part of an inclusive species.
UUnniivveerrssiittyy ooff PPrreettoorriiaa eettdd –– SSoollee,, CC LL ((22000055))

116
Chapter IV (c)
___________________________________________________________________________
Genetic structure, phylogeography and demography of S. (P.) denticollis based on
inferences from Cytochrome Oxidase I
Introduction
Phylogeographic structure is important for organisms with extensive ranges and complex
geographical patterns. When integrated with data on geographical distribution of morphology
and ecological variation such inferences can be used to test hypotheses of speciation
processes (Nice et al., 2005).
Many formerly continuous areas of natural habitats have been subdivided into smaller
habitat islands surrounded by human-altered environments (van Dongen et al., 1998).
Artificially divided populations often have a limited number of individuals interchanging
between sub-populations. The fewer individuals moving between populations the greater the
effect of genetic drift in that genetic diversity decreases within and increases between sub-
populations (van Dongen et al., 1998; Driscoll & Hardy, 2005). One would intuitively
assume that a species occurring within fragmented habitats would show decreased genetic
variation as opposed to those occurring over a continuous habitat.
Scarabaeus (Pachysoma) denticollis are restricted to the coastal and inland dunes of
the central Namib dune sea (see Figure 1), and are conserved within the Namib Naukluft
Park. The species occurs from Luderitz (S26°41’ - E15°15’) to Walvis Bay (S22°55’ –
E14°28’) and populations of this species exhibit individuals with elytral colours ranging from
orange to black with some showing a mix of the two colours (Scholtz, pers. obs.). The
individuals with the black elytra were previously described as a subspecies of S. (P.)
denticollis, P. denticollis penrithae (Harrison et al., 2003), but were synonomised, based on
morphology, with S. (P.) denticollis sensu stricto by Holm & Scholtz (1979).
Materials and Methods
See main body of chapter. Details of specimen collecting sites can be seen in Figure 11.
UUnniivveerrssiittyy ooff PPrreettoorriiaa eettdd –– SSoollee,, CC LL ((22000055))

117
Figure 11. Localities in Namibia where S. (P.) denticollis were collected for this study.
Results
Phylogenetic and Molecular Diversity
Population Statistics
Thirty-two individuals were used for molecular characterisation (Genbank Accession
numbers AY965207 – AY965238). The sequences exhibited an A/T bias of 69 %, which is
the same as that observed for the other two species investigated in this chapter. Of the 32
individuals studied 29 represented unique haplotypes with no evidence found for a haplotype
being specific to any geographic region (Table 12; which includes general molecular
diversity statistics). Accordingly, overall haplotype diversity expressed was high (H = 0.992
+/- 0.011), and intermediate to that within S. (P.) hippocrates and S. (P.) gariepinus.
Gamma distribution for the data was estimated at 0.3413 (which is intermediate to
that of the previous two species) with the proportion of invariable sites being 0.6791. The
transition/transversion ratio was 1.9 (estimated in MEGA) and the model best fitting the data
selected by Modeltest was Tamura-Nei. The neighbor-joining tree of 32 individuals can be
seen in Figure 12 and indicates two assemblages, namely 1 and 2. Assemblage 1 consists of
UUnniivveerrssiittyy ooff PPrreettoorriiaa eettdd –– SSoollee,, CC LL ((22000055))

118
individuals from all four localities and even though it appears that individuals from collecting
localities group together, the support thereof is poor allowing for no distinct population
designation within this assemblage. Assemblage 2 shows strong support for individuals from
two localities (namely Koichab Pan and Agate Beach). However, individuals from these two
localities also occur within assemblage 1. This as well as the fact that there are no shared
haplotypes between the collecting sites of S. (P.) denticollis may indicate that incomplete
lineage sorting has occurred i.e. speciation is in the process of occurring. S. (P.) denticollis is
therefore treated as a single population throughout this sub-chapter (Parsimony and
Maximum Likelihood trees exhibited similar topologies, data not shown).
Genetic differentiation among populations
Mean nucleotide diversity was calculated across the three collecting sites (Table 13). The
results of AMOVA revealed that 22.16 % of the variance resulted from the differences
among the three collecting sites, while 77.85 % of the variance resulted from differences
within collecting sites. The fixation index value (Φst = 0.222) was low but significantly so (p
< 0.001) indicating weak genetic structure between collecting sites.
UUnniivveerrssiittyy ooff PPrreettoorriiaa eettdd –– SSoollee,, CC LL ((22000055))

119
Figure 12. Mid-point rooted Neighbor-joining tree for the COI sequences of S. (P.)
denticollis. Bootstrap values below 50 % were removed.
UUnniivveerrssiittyy ooff PPrreettoorriiaa eettdd –– SSoollee,, CC LL ((22000055))

120
Table 12. Summary statistics of general nucleotide diversity over the 960 bp of S. (P.) denticollis
Species Assemblage N Number of haplotypes
Haplotype diversity
Nucleotide diversity
% Pairwise divergence
Variable sites (V)
Parsimoniously Informative Sites
(PI) Singletons
(S) S. (P.) denticollis Koichab Pan 13 13 1.000 (0.030) 0.020 (0.011) 0.003 - 0.035 Namib Rand 8 5 0.857 (0.108) 0.005 (0.003) 0.001 - 0.011 Gobabeb 11 11 1.000 (0.039) 0.013 (0.007) 0.004 - 0.024 Total 32 29 0.992 (0.011) 0.016 (0.008) 0.001 - 0.019 90 (9.375%) 48 (5%) 42 (4.375%) $ V, PI and S were only estimated for the overall dataset
Table 13. Summary of Fst statistics calculated by AMOVA (Excoffier et al., 1992) for S. (P.) denticollis Species ΦΦΦΦst % P S. (P.) denticollis Among collecting site variation 22.16 < 0.001 Within collecting site variation 77.84 < 0.001
Fixation index 0.222 < 0.001 b P values were determined from 10000 random permutations.
UUnniivveerrssiittyy ooff PPrreettoorriiaa eettdd –– SSoollee,, CC LL ((22000055))
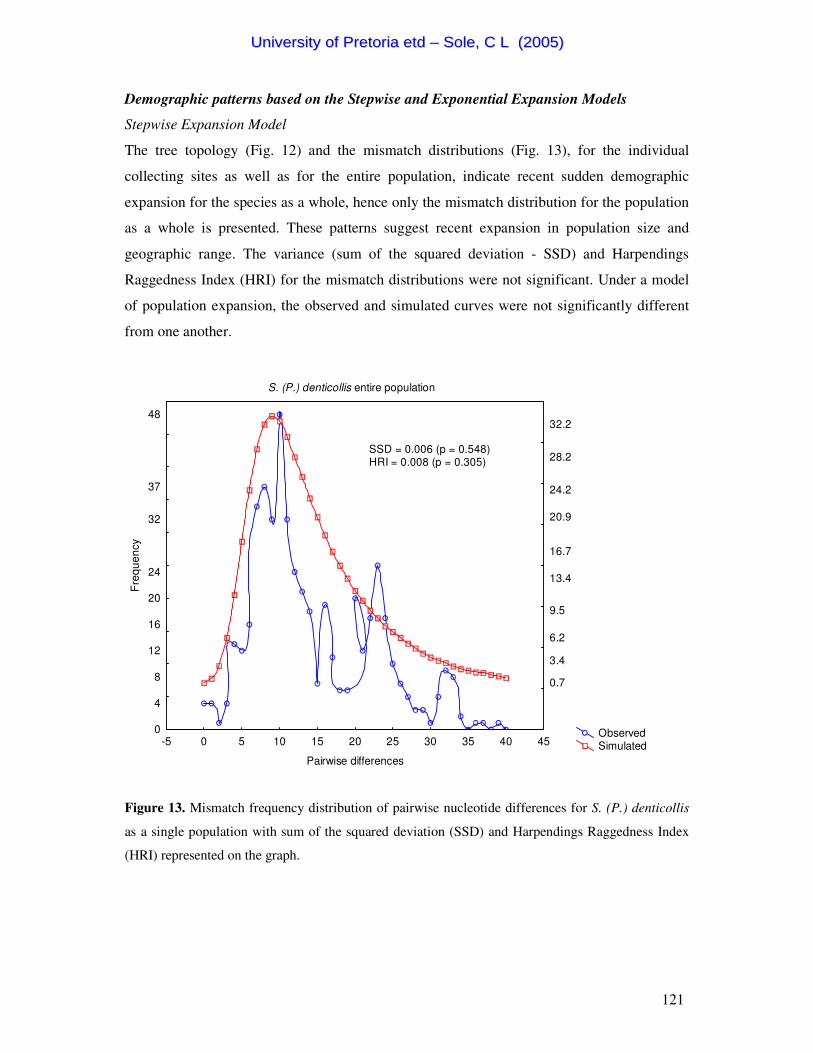
121
Demographic patterns based on the Stepwise and Exponential Expansion Models
Stepwise Expansion Model
The tree topology (Fig. 12) and the mismatch distributions (Fig. 13), for the individual
collecting sites as well as for the entire population, indicate recent sudden demographic
expansion for the species as a whole, hence only the mismatch distribution for the population
as a whole is presented. These patterns suggest recent expansion in population size and
geographic range. The variance (sum of the squared deviation - SSD) and Harpendings
Raggedness Index (HRI) for the mismatch distributions were not significant. Under a model
of population expansion, the observed and simulated curves were not significantly different
from one another.
S. (P.) denticollis entire population
Observed Simulated-5 0 5 10 15 20 25 30 35 40 45
Pairwise differences
0
4
8
12
16
20
24
32
37
48
Freq
uenc
y
0.7
3.4
6.2
9.5
13.4
16.7
20.9
24.2
28.2
32.2
SSD = 0.006 (p = 0.548)HRI = 0.008 (p = 0.305)
Figure 13. Mismatch frequency distribution of pairwise nucleotide differences for S. (P.) denticollis
as a single population with sum of the squared deviation (SSD) and Harpendings Raggedness Index
(HRI) represented on the graph.
UUnniivveerrssiittyy ooff PPrreettoorriiaa eettdd –– SSoollee,, CC LL ((22000055))

122
Time of divergence
The average number of nucleotide substitutions per site (d) was calculated to be 0.06.
Divergence time between S. (P.) denticollis and its sister species, S. (P.) rotundigenus (Sole
et al., 2005; chapter 2) was estimated at approximately 2.6 million years ago. This gives the
estimate of nucleotide substitutions per site, per lineage, per year (γ) to be 0.06/(2 x
2,600,000) = 1.1 x 10 –8 with the mutation rate per nucleotide site, per generation (µ) being
1.1 x 10 –8 and the mutation rate per haplotype (v) being 1.05 x 10⁻⁵. The coalescence time in
generations, for each population, was calculated using the τ values estimated by Arlequin
(Table 14a).
The earliest expansion event appeared to have occurred at the Gobabeb collecting site,
which was estimated at around 343,000 generations/years ago while the Koichab Pan site
appeared to have undergone recent expansion approximately 144,000 generations/years ago.
This is based on a τ value of 7.235 and 3.054 (Table 14a), respectively, and a mutation rate
per haplotype (v) of 1.06 x 10 –5 per COI (as calculated above). Estimated effective
population size after expansion (N1) was an order of magnitude higher than before expansion
(N0).
Exponential Expansion Model
All three collecting sites have high and positive ‘g’ values for the Exponential Expansion
Model. Koichab Pan and Gobabeb have the highest ‘g’ values while Namib Rand is slightly
lower. However, they all indicate historical population expansion. The effective female
population sizes were large (in the millions) for both Koichab Pan and Gobabeb while an
order of magnitude smaller for the Namib Rand collecting site (Table 14b)
UUnniivveerrssiittyy ooff PPrreettoorriiaa eettdd –– SSoollee,, CC LL ((22000055))

123
Table 14. Estimated parameters for (a) Stepwise and (b) Exponential Expansion Models for S. (P.) denticollis.
(a) Stepwise Expansion Model
Stepwise Expansion Model Species Collecting sites ττττ θθθθ0 = 2µµµµN0 θθθθ1 = 2µµµµN1 t = ττττ/2v S. (P.) denticollis Koichab Pan 3.054 21.785 4645.000 144,000 Namib Rand 5.961 0 10.013 281,000 Gobabeb 7.235 4.175 5712.500 343,000 Population as a whole 6.462 8.674 810.625 306,000
(b) Exponential Expansion Model
Exponential Expansion Model
Species Collecting sites θθθθ = 2µµµµNf g Nf
S. (P.) denticollis Koichab Pan 0.0873 180.209 4,000,000 Namib Rand 0.0123 405.484 560,000 Gobabeb 0.3837 638.549 17,000,000 Population as a whole 0.229 301.807 10,000,000
UUnniivveerrssiittyy ooff PPrreettoorriiaa eettdd –– SSoollee,, CC LL ((22000055))

124
The UPBLUE/Tajima estimate shows a two-fold increase in recent population size
(Table 15). Fu’s Fs statistic for the population as a whole was significantly negative,
indicating that the population is undergoing expansion, which is in direct contrast to the other
two species (Table 15).
Table 15. Summary of estimations of Tajima’s estimate� Fu’s UPBLUE and Fu's Fs statistic of S. (P.)
denticollis
Species Complete population S. (P.) denticollis Tajima's estimate 22.422 Fu's UPBLUE 60.695 UPBLUE/Tajima 2.718 Fu's Fs -7.315 (**) $ ** = p < 0.01
Migration
MIGRATE indicated ancestral movement was strongly in a northerly direction with no
evident movement to the south (Fig. 14).
Figure 14. A schematic representation of the migration of individuals between collecting
sites of S. (P.) denticollis. The coloured arrows indicate the direction of movement while the
numbers in the same colour represent an approximation of the number of individuals
moving/generation. The numbers in black represent coalescent times of the populations.
(Abbreviations are as follows: KP = Koichab Pan, NR = Namib Rand, GB = Gobabeb).
UUnniivveerrssiittyy ooff PPrreettoorriiaa eettdd –– SSoollee,, CC LL ((22000055))

125
Phylogenetic haplotype relationships
A 95 % parsimony cladogram was estimated for the mtDNA COI data (Fig 15) of S. (P.)
denticollis, with the maximum number of mutational steps between two haplotypes being 13.
The parsimony network was resolved except for the presence of four reticulations, which
were broken. There was, however, one disjoint portion within the network, represented by
clade 3-1 that could not be linked with 95 % confidence. In addition, haplotypes GO02, LA11
and LT12 were separated from the network by 14, 19 and 20 mutational steps respectively.
To simplify the nested diagram not all nesting levels were represented. Haplotypes were
collapsed for drawing the cladogram but not in the nesting structure that was used to calculate
the contingency test values. GO02 linked to clade 14-1 in 14 mutational steps and LA11 and
LT12 linked to clades 19-1 and 20-1 in 19 and 20 mutational steps, respectively. Clade 3-1
was linked by 25 mutational steps to clade 25-1 i.e. the entire cladogram.
The network shows two distinct clades in 3-1 and 25-1. Clade 3-1 consists of three
individuals from Koichab Pan, while clade 25-1 consists of the balance of the individuals
from all the sites sampled, including others from Koichab Pan. This supports the neighbor-
joining tree in that S. (P.) denticollis appears as a single population on a dune continuum. The
contingency test showed significant geographical association of haplotypes within clades 22-
1, 25-1 and 26-1. The inference chain (Table 16) indicates restricted gene flow due to
isolation by distance for clades 22-1 and 25-1. The inference for clade 26-1 indicates that the
population structure could be attributed to restricted gene flow or dispersal, with some long
distance dispersal over intermediate areas not occupied presently by the species, or that there
was past gene flow which has been followed by the extinction of intermediate populations.
Due to the small number of populations the Mantel test could not calculate whether
there were significant differences or not between the geographic and genetic distances
(Liedloff pers. comm.).
UUnniivveerrssiittyy ooff PPrreettoorriiaa eettdd –– SSoollee,, CC LL ((22000055))

126
Figure 15. S. (P.) denticollis statistical parsimony network and associated design. Haplotypes are designated by letters, which represent the population from where the haplotype
came (as seen in Table 1) and numbers representing the individual sequenced. The thickness of the connection line indicates the number of mutational steps. Dotted lines represent
alternative ambiguous connections. Ancestral haplotypes are represented by squares. Haplotypes with blue background occurred three times and those with a pink background
occurred twice.
UUnniivveerrssiittyy ooff PPrreettoorriiaa eettdd –– SSoollee,, CC LL ((22000055))
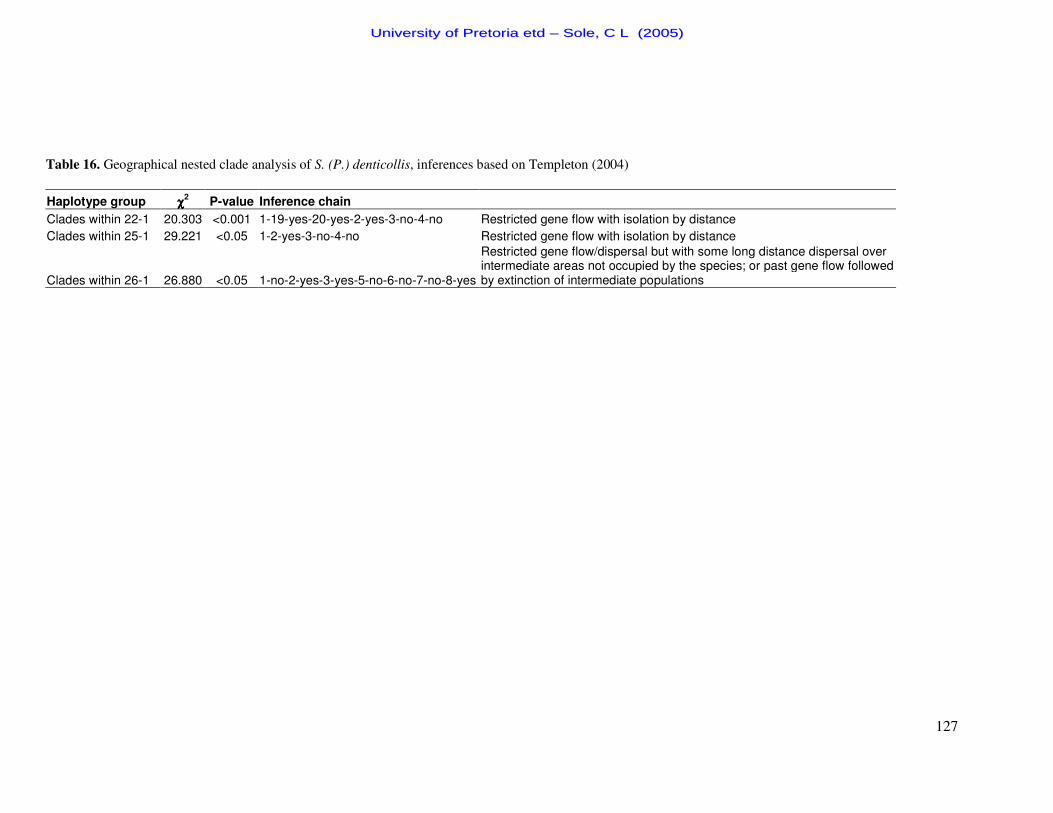
127
Table 16. Geographical nested clade analysis of S. (P.) denticollis, inferences based on Templeton (2004)
Haplotype group χχχχ2 P-value Inference chain Clades within 22-1 20.303 <0.001 1-19-yes-20-yes-2-yes-3-no-4-no Restricted gene flow with isolation by distance Clades within 25-1 29.221 <0.05 1-2-yes-3-no-4-no Restricted gene flow with isolation by distance
Clades within 26-1 26.880 <0.05 1-no-2-yes-3-yes-5-no-6-no-7-no-8-yes
Restricted gene flow/dispersal but with some long distance dispersal over intermediate areas not occupied by the species; or past gene flow followed by extinction of intermediate populations
UUnniivveerrssiittyy ooff PPrreettoorriiaa eettdd –– SSoollee,, CC LL ((22000055))
128
Discussion
Demographic patterns of S. (P.) denticollis as compared with S. (P.) hippocrates and S. (P.)
gariepinus
The partial mtDNA COI gene phylogeny of S. (P.) denticollis shows weak support for the
designation of distinct populations. Poor population structure is supported by a low fixation
index value, low within population variation as well as low range of within- and between-
population percent pairwise distances (Table 12; 0.4% – 2.3 %). This is in contrast to S (P.)
hippocrates and S. (P.) gariepinus which show strong population structure and have a larger
percent pairwise divergence range (1 – 12.3 %: Table 3 Chapter 4a and 0.1 – 10.3 % Table 7
Chapter 4b) as well as higher overall nucleotide diversity. Comparison of the percent
pairwise divergence and nucleotide diversity between the Namibian population of S. (P.)
gariepinus and S. (P.) denticollis, which both represent a dune field continuum population,
reveals that S. (P.) denticollis has much lower values for both parameters which is counter-
intuitive. Therefore, does landscape fragmentation increase genetic differentiation due to an
isolation effect? This study as well as previous ones indicates that rivers, towns, agricultural
fields, roads etc. present barriers to species movement by thinning the inhabited area, causing
isolation by distance. This study clearly demonstrates that genetic differentiation is higher in
species occurring within fragmented landscapes as opposed to those within a continuous
landscape. These results are in qualitative agreement with population genetics theory and
support the results seen by Knutsen et al. (2000) (Order: Coleoptera – Tenebrionidae),
Driscoll & Hardy (2005) (Order: Squamata – Agamid Lizards) and van Dongen et al. (1998)
(Order Lepidoptera – Geometridae). Population fragmentation affects the genetic structure of
a species and represents a potential threat to those species with reduced dispersal capabilities.
However, it has been argued that some degree of genetic isolation may be advantageous for
the conservation of genetic variation and that genetic diversity may be maintained if a
population is subdivided into sub-populations. Within a sub-population genetic variation will
decrease due to genetic drift but overall population genetic variation will be maintained as
different alleles will be preserved in different sub-populations (van Dongen et al., 1998).
Although elevated genetic variation is observed in two of the species there are implications in
that with reduced local and global populations effective population sizes and loss of
advantageous alleles or fixation of disadvantageous alleles could result in the ultimate
extinction of a species. This highlights the importance of understanding the patterns and
processes acting on and within a species. Both demographic and fine-scale genetic factors
need to be examined to reveal likely evolutionary processes acting on a population or sub-
UUnniivveerrssiittyy ooff PPrreettoorriiaa eettdd –– SSoollee,, CC LL ((22000055))
129
population and will provide a strong guide for conservation management decisions (Driscoll
& Hardy, 2005).
Recent versus historical population trends
S. (P.) denticollis appears on a continuum of dune fields from Koichab Pan all the way up the
west coast of Namibia to Gobabeb, with both recent and historical estimates showing an
increase in population size. There is historical movement in a northerly direction with the
Gobabeb collecting site having received individuals from both the Namib Rand as well as the
Koichab Pan collecting sites. This provides support for the hypothesis that individuals within
a species are moving with their substratum, the barchan dune, in conjunction with the
unidirectional wind regime. The Namibian assemblage of S. (P.) gariepinus shows similar
trends. The nested clade analysis indicates two processes that may have shaped the S. (P.)
denticollis population. Firstly it appears that S. (P.) denticollis has experienced restricted
gene flow due to isolation by distance, indicating that there is a minimum amount of recent
gene flow between collecting sites. The fact that this species is flightless coupled with their
large distributional range (extending over 400 km) would support the fact that their
movement between suitable habitats has been at a minimum. Absence of shared haplotypes
between the collecting sites may also be an indication that reduced gene flow is occurring. In
contrast to this, large population sizes, as indicated by both the Exponential and Stepwise
Expansion Models, could have reduced the probability of collecting individuals with
overlapping haplotypes. Secondly, it appears that when looking at the entire population,
extinction of intermediate populations may have occurred. Extinction of intermediate
populations could possibly be attributed to sub-standard habitat quality in intermediate areas,
environmental barriers and human induced changes occurring within their habitat. The Agate
Beach collecting site, which occurs near Luderitz, is clearly affected by recent mining
activities and an encroaching town. The genetic patterns of S. (P.) denticollis suggest that the
species is still expanding into new or formally occupied habitats - as seen in both Fu’s Fs and
UPBLUE statistics - followed by a period of stasis, during which isolation by distance and
intermediate population extinction are the causal factors attributed to species
phylogeography.
Incomplete lineage sorting vs. clinal variation
Slight morphological differences are visible between the individuals occurring in the most
southern and northern distribution of S. (P.) denticollis (Harrison et al., 2003). Elytral colour
UUnniivveerrssiittyy ooff PPrreettoorriiaa eettdd –– SSoollee,, CC LL ((22000055))
130
differentiation is also noted within this species, with some individuals having black elytra,
others a mix between black and orange and some individuals have orange elytra (Harrison et
al., 2003). The colour and morphological variation is clinal and is probably a response to a
selective environmental gradient (Barrowclough et al., 2005). The mtDNA variation within S.
(P.) denticollis is therefore inconsistent with the morphological clinal variation. Concordance
among different datasets often occurs over a long period of time. However, where rapid and
recent divergence (within the last 200,000 years for S. (P.) denticollis) has occurred
retardation of lineage sorting (i.e. incomplete lineage sorting) leading to the identification of
ESU’s or MU’s (Moritz, 1994a & b; Nice et al., 2005) becomes difficult. If the traits used to
define clinal variation were under selection, surveys of neutral variation would fail to detect
distinctive evolutionary lineages where adaptive differences already exist. Differences in life
history traits, ecological requirements, morphology and demographic characters would
constitute evolutionary significance of the individuals from the different collecting sites.
Therefore, ecological non-exchangeability could provide sufficient evidence for the
designation of the individual collecting sites as distinct evolutionary units under the strategy
posed by Crandall et al. (2000).
Implications for conservation of Scarabaeus (Pachysoma) species
Three distinct species of Scarabaeus (Pachysoma) have been studied here, all exhibiting
different population demographics with population demographic overlap seen in areas of
geographic similarity (as seen in the Namibian population of S. (P.) gariepinus and S. (P.)
denticollis as well as the South African populations of S. (P.) gariepinus and S. (P.)
hippocrates). The patterns of gene flow within the presented phylogeographic regions suggest
that the three species were each a single continuous population, possessing a relatively high
level of dispersal capabilities. This pattern suggests that the observed phylogeographic
patterns were probably due to the extinction of intermediate populations causing
fragmentation of the entire population. Extinction of intermediate populations could have
been caused by anthropogenic and environmental factors, as mentioned throughout the sub-
chapters. Physical barriers appear to have had an increased effect on the population structure
seen in S. (P.) gariepinus while anthropogenic factors appear to be affecting S. (P.)
hippocrates to a greater degree.
All three of these species were chosen as they exhibit south-north morphological
clinal variation and it has clearly been shown that extensive genetic variation occurs within
two of the species, S. (P.) hippocrates and S. (P.) gariepinus. There is strong evidence to
UUnniivveerrssiittyy ooff PPrreettoorriiaa eettdd –– SSoollee,, CC LL ((22000055))

131
suggest that selective changes are taking place and having an effect on population structure as
a whole.
The spatial scale of genetic differences indicates the scale at which conservation
should occur. If the species decline over areas spanning the distance between the populations
substantial genetic variation will be lost. A series of adequately sized reserves spanning the
collecting sites of each population would sample most of the genetic structure. However,
would these reserves sustain population perpetuity? In addition to conserving genetic
diversity, an important goal of conservation should be to maintain evolutionary processes.
Evolutionary processes, within all three species, appear to have been maintained by
population and range expansions followed by isolation and fragmentation leading to
subsequent divergence. A carefully maintained meta-population strategy may be required to
prevent biodiversity loss (Driscoll & Hardy, 2005).
Summary
All three species reported on in this chapter allow for contrasting as well as similar inferences
to be made. S. (P.) hippocrates and S. (P.) gariepinus exhibit strong population structure,
supported by AMOVA and high sequence divergence. S. (P.) denticollis shows poor
phylogenetic structure, as seen by the significantly low AMOVA and the low sequence
divergence. All three species exhibit high haplotype diversities with no overlap of haplotypes
between populations or collecting sites. Areas of refugia could therefore not be speculated
upon.
All three species show strong historical population expansion as seen by the Stepwise
and Exponential Expansion Models. Fu’s UPBLUE and Fs statistic indicates that S. (P.)
hippocrates and S. (P.) gariepinus are not undergoing present day expansion which is in line
with current species trends in that overall numbers are declining. However, as no present day
census data are available, this is difficult to substantiate. Recent events are therefore masked
by past events and the genetic signal observed could be misleading. S. (P.) denticollis shows
a strong trend towards recent range expansions after which a period of stasis occurred.
Extrinsic factors such as rivers and anthropogenic influences have affected all the
species in some way. The major rivers act as barriers causing fragmentation leading to
allopatric fragmentation with strong support obtained from the NPCA. Anthropogenic factors
affecting population structure include agriculture, town encroachment and mining activities
which all remove large tracts of suitable habitat leading to fragmentation of a species and in
some instances extinction of a population. Since Scarabaeus (Pachysoma) species are
UUnniivveerrssiittyy ooff PPrreettoorriiaa eettdd –– SSoollee,, CC LL ((22000055))
132
flightless and therefore exhibit reduced vagility this appears to have contributed to species
structure. NPCA analysis indicates that isolation by distance is a factor contributing to
species structure and this could be directly related to low or poor vagility. In contrast to this
the results of S. (P.) gariepinus and S. (P.) denticollis indicate that individuals have
historically moved between populations or collecting localities. The fact that the beetles have
clearly been shown to move in a south-north direction with the barchan dunes may be the
factor underlying the strong movement over large geographic distances. Coalescence of the
species is shown to have occurred during the Pleistocene era coincident with the onset of
hyper-aridity and the formation of advective fog, which is wind blown up to 50 km inland.
The formation of the fog would have allowed for a consistent source of water permitting the
species to inhabit previously inhospitable areas.
S. (P.) hippocrates and S. (P.) gariepinus show far higher genetic divergence as
opposed to S. (P.) denticollis. However counter-intuitive this may appear it is in line with
genetic theory, in that fragmentation of a landscape, and in turn a species’ populations
increases genetic variation. This has implications for conservation strategies being
implemented; as the variation in populations represents genetic material which if lost could
result in imminent extinction.
Acknowledgements Financial support received from the South African National Research Foundation (NRF) and
the University of Pretoria is gratefully acknowledged. NAMDEB, in Namibia, and De Beers,
in South Africa, are thanked for letting CS and CHS complete field work in restricted areas.
Adam Liedloff wrote the Mantel Nonparametric Test program and is thanked for his help
regarding data analysis of S. (P.) denticollis.
UUnniivveerrssiittyy ooff PPrreettoorriiaa eettdd –– SSoollee,, CC LL ((22000055))
133
References Avise JC, Arnold J, Martin Ball R, Birmingham E, Lamb T, Neigel JE, Reeb CA, Saunders
NC (1987) Intraspecific Phylogeography: the mitochondrial DNA bridge between
population genetics and systematics. Annual Review of Ecological Systematics, 18,
489-522.
Avise JC (2000) Phylogeography: The history and formation of species. Cambridge, London,
England, Harvard University Press.
Barber PH (1999) Patterns of gene flow and population genetic structure in the canyon
treefrog, Hyla arenicolor (Cope). Molecular Ecology, 8, 563-579.
Barrowclough GF, Groth JG, Mertz LA, Gutiérrez RJ (2005) Genetic structure, introgression,
and a narrow hybrid zone between northern and California spotted owls. Molecular
Ecology, 14, 1109-1120.
Beerli P, Felsenstein J (1999) Maximum-Likelihood estimation of migration rates and
effective population numbers in two populations using a coalscent approach.
Genetics, 152, 763-773.
Beerli P, Felsenstein J (2001) Maximum likelihood estimation of a migration matrix and
effective population sizes in n subpopulations by using a coalescent approach.
Proceedings of the National Academy of Sciences of the USA, 98, 4563-4568.
Brower AVZ (1994) Rapid morphological radiation and convergence among races of the
butterfly Heliconius erato inferred from patterns of mitochondrial DNA evolution.
Proceedings of the National Academy of Science of the United States of America, 91,
6491-6495.
Carisio L, Cervalla P, Palestrini C, DelPero M, Rolando A (2004) Biogeographical patterns
of genetic differentiation in dung beetles of the genus Trypocopris (Coleoptera,
Geotrupidae) inferred from mtDNA and AFLP analysis. Journal of Biogeography ,
31, 1149-1162.
Clement M, Posada D, Crandall KA (2000) TCS: a computer program to estimate gene
genealogies. Molecular Ecology, 9, 1657-1660.
UUnniivveerrssiittyy ooff PPrreettoorriiaa eettdd –– SSoollee,, CC LL ((22000055))

134
Colville J, Picker M.D, Cowling RM (2002) Species turnover of monkey beetles
(Scarabaeidae: Hopliini) along environmental and disturbance gradients in the
Namaqualand region of the succulent Karoo, South Africa. Biodiversity and
Conservation, 11, 243-264.
Cowling RM, Esler KJ, Rundel PW (1999) Namaqualand, South Africa – an overview of a
unique winter-rainfall desert ecosystem. Plant Ecology, 142, 3-21.
Crandall KA, Templeton AR (1993) Empirical tests of some predictions from coalescent
theory with applications to intraspecific phylogeny reconstruction. Genetics, 134,
959-969.
Crandall KA, Bininda-Edmonds ORP, Mace GM, Wayne RK (2000) Considering
evolutionary processes in conservation biology. Trends in Ecology and Evolution, 15,
290-295.
Driscoll DA, Hardy CM (2005) Dispersal and phylogeography of the agamid lizard
Amphibolurus nobbi in fragmented and continuous habitat. Molecular Ecology, 14,
1613-1629.
Endrödy-Younga S (1982a) Dispersion and translocation of dune specialist Tenebrionids in
the Namib area. Cimbebasia (A), 5, 257-271.
Endrödy-Younga S (1982b) The evidence of Coleoptera in dating the Namib Desert re-
examined. In: Palaeoecology of Africa and the surrounding islands, 15. (eds Coetzee
JA, van Zinden Bakker EM), pp. 217-223. AA Balkema, Rotterdam.
Endrödy-Younga S (1978) Coleoptera. In: Biogeography and ecology of Southern Africa.
(eds Werger MJA ), pp. 797-821. W Junk, The Hague.
Excoffier L, Smouse PE, Quattro JM (1992) Analysis of molecular variance inferred from
metric distances among haplotypes: Application to human mitochondrial DNA
restriction data. Genetics, 131, 479-491.
Felsenstein J (1973) Maximum likelihood and minimum-steps methods for estimating
evolutionary treesfrom data on discrete characters. Systematic Zoology, 22, 240-249.
UUnniivveerrssiittyy ooff PPrreettoorriiaa eettdd –– SSoollee,, CC LL ((22000055))
135
Felsenstein J (1981) Evolutionary trees from DNA sequences: a maximum likelihood
approach. Journal of Molecular Evolution, 17, 368-376.
Felsenstein J (1985) Confidence limits on phylogenies: an approach using the bootstrap.
Evolution, 39, 783-791.
Frost DR, Hillis DM (1990) Species in concept and practice: herpetological considerations.
Herpetologia, 46, 87-104.
Fu Y-X (1994a) A phylogenetic estimator of effective population size or mutation rate.
Genetics, 136, 685-692.
Fu Y-X (1994b) Estimating effective population size or mutation rate using the frequencies
of mutations of various classes in a sample of DNA sequences. Genetics, 138, 1375-
1386.
Fu Y-X (1997) Statistical tests of neutrality of mutations against population growth,
hitchhiking and background selection. Genetics, 147, 915-925.
Graur D, Martin W (2004) Reading the entrails of chickens: molecular timescales of
evolution and the illusion of precision. Trends in Genetics, 20, 80-86.
Harrison JduG (1999) Systematics of the endemic south-west African dung beetle genus
Pachysoma MacLeay (Scarabaeidae: Scarabaeinae). MSc Thesis, University of
Pretoria.
Harrison JduG, Phillips TK (2003) Phylogeny of Scarabaeus (Pachysoma MacLeay) sta.
nov., and related flightless Scarabaeini (Scarabaeidae: Scarabaeinae). Annals of the
Transvaal Museum, 40, 47-71.
Harrison JduG, Scholtz CH., Chown SL (2003) A revision of the endemic south-western
African dung beetle subgenus Scarabaeus (Pacgysoma) MacLeay, including notes on
other flightless Scarabaeini (Scarabaeidae: Scarabaeinae). Journal of Natural History,
37, 305-355.
Harpending RC (1994) Signature of ancient population growth in a low-resolution
mitochondrial DNA mismatch distribution. Human Biology, 66, 591-600.
UUnniivveerrssiittyy ooff PPrreettoorriiaa eettdd –– SSoollee,, CC LL ((22000055))
136
Holm E, Scholtz CH (1979) A revision of the genus Pachysoma M'Leay with an evaluation
of the subtribe Pachysomina Ferreira and its genera (Coleoptera: Scarabaeidae).
Journal of the Entomological Society of South Africa, 42, 225-244.
Irish J (1990) Namib Biogeography, as exemplified mainly by the Lepmismatidae
(Thysanura: Insecta). In: Namib Ecology: 25 years of Namib Research. (eds Seely
MK), pp. 61-66. Transvaal Museum Monograph No. 7. Transvaal Museum, Pretoria.
Juan C, Ibrahim KM, Oromi P, Hewitt GM (1998) The phylogeography of the darkling
beetle, Hegeter politus, in the eastern Canary Islands. The Royal Society of London,
265, 135-140.
Kirchman JJ, Whittingham LA, Sheldon FH (2000) Relationships among cave swallow
populations (Petrochelidon fulva ) determined by comparisons of microsatellite and
cytochrome b data. Molecular Phylogenetics and Evolution, 14, 107-121.
Kluge AG, Farris JS (1969) Quantitative phylogenetics and the evolution of anurans.
Systematic Zoology, 18, 1-32.
Knutsen H, Rukke BA, Jorde PE, Ims RA (2000) Genetic differentiation among populations
of the beetle Bolitophagus reticulates (Coleoptera: Tennebrionidae) in a fragmented
and a continuous landscape. Heredity, 84, 667-676.
Kuhner MK, Yamato J, Beerli P et al. (2004) LAMARC v 1.2.1. University of Washington,
http://evolution.gs.washington.edu/lamarc.html.
Kumar S, Tamura K, Jacobsen IB, Nei M (2001) Molecular Evolutionary Genetic Analysis
Software. Bioinformatics, 17, 1244-1245.
Lavery S, Moritz C, Fielder DR (1996) Genetic patterns suggest exponential population
growth in a declining species. Molecular Biology and Evolution, 13, 1106-1113.
Liedloff A (1999) Mantel nonparametric test calculator for Windows Version 2.00. School of
Natural Resource Sciences, Queensland University of Technology.
Mantel N (1967) The detection of disease clustering and a generalized regression approach.
Cancer research, 27, 209-220.
UUnniivveerrssiittyy ooff PPrreettoorriiaa eettdd –– SSoollee,, CC LL ((22000055))

137
Mayr E, Ashlock PD (1991) Principles of Systematic Zoology. McGraw Hill, Inc.
Moritz C (1994a) Defining evolutionary significant units for conservation. Trends in Ecology
and Evolution, 9, 373-375.
Moritz C (1994b) Applications of mitochondrial DNA analysis in conservation: a critical
review. Molecular Ecology, 3, 401-411.
Moritz C (1999) Conservation units and translocations: strategies for conserving evolutionary
processes. Hereditas, 130, 217-228.
Moya Ó, Contreras-Díaz HG, Oromí P, Juan C (2004) Genetic structure, phylogeography and
demography of two ground-beetle species endemic to Tenerife laurel forest (Canary
Islands). Molecular Ecology, 13, 3153-3167.
Nahum LA, Perreira SL, de Campos Fernandes FM, Matioli SR, Wajntal A (2003)
Diversification of Ramphastinae (Aves, Ramphastidae) prior to the
Cretaceous/Tertiary boundary as shown by molecular clock of mtDNA sequences.
Genetics and Molecular Biology, 26, 411-418.
Nice CC, Anthony N, Gelembiuk G, Raterman D, Ffrench-Constant R (2005) The history and
geography of diversification within the butterfly genus Lycaeides in North America.
Molecular Ecology, 14, 1741-1754.
Nixon KC, Wheeler QD (1990) An amplification of the phylogenetic species concept.
Cladistics, 6, 211-223.
Penrith M-L (1984) New taxa of Onymacris Allard, and relationships within the genus
(Coleoptera: Tenebrionidae). Annals of the Transvaal Museum, 33, 511-533.
Penrith M-L (1986) Revision of the Zophosini (Coleoptera: Tenebrionidae). Part 10. Key to
the subgenera, supplement, evolution and biogeography of the tribe, and catalogue.
Cimbebasia (A), 6, 417-502.
Posada D, Crandall KA (1998) Modeltest 3.0: testing the model of DNA substitution.
Bioinformatics, 14, 817-818.
UUnniivveerrssiittyy ooff PPrreettoorriiaa eettdd –– SSoollee,, CC LL ((22000055))
138
Posada D, Crandall KA (2001) Intraspecific gene genealogies: trees grafting into networks.
Trends in Ecology and Evolution, 16, 37-45.
Posada D, Crandall KA, Templeton AR (2000) GeoDis: A program for the Cladistic Nested
Analysis of the Geographical Distribution of Genetic Haplotypes. Molecular Ecology,
9, 487-488.
Rogers AR (1995) Population forecasting: do simple models outperform complex models?
Mathematical Population Studies, 5, 187-202.
Rogers AR, Harpending H (1992) Population growth makes waves in the distribution of
pairwise genetic differences. Molecular Biology and Evolution, 9, 552-569.
Rooney AP, Honeycutt RL, Derr JN (2001) Historical population size change of Bowhead
whales inferred from DNA sequence polymorphism data. Evolution, 55, 1678-1685.
Satou N, Nei M (1987) The neighbor-joining method: a new method for reconstructing
phylogenic trees. Molecular Biology and Evolution, 4, 406-425.
Schneider S, Excoffier L (1999) Estimation of demographic parameters from the distribution
of pairwise differences when the mutation rates vary among sites: Application to
human mitochondrial DNA. Genetics, 152, 1079-1089.
Schneider S, Roessli D, Excoffier L (2000) Arlequin, version 2.000. A Software for
Population Genetics Data Analysis. Genetics and Biometry Laboratory, University of
Geneva, Switzerland
Seely MK (eds) (1990) Namib Ecology 25 years of Namib Research. Transvaal Museum
Monograph No. 7, Transvaal Museum, Pretoria.
Simon C, Frati, F, Benckenbach A, Crespi B, Liu H, Flook P (1994) Evolution, weighting,
and phylogenetic utility of mitochondrial gene sequences and a compilation of
conserved polymerase chain reaction primers. Annals of the Entomological Soceity of
America, 87, 652-701.
Smith CI, Farrell BD (2005) Range expansions in the flightless longhorn cactus beetles,
Moneilema gigas and Moneilema armatum, in response to Pleistocene climate change.
Molecular Ecology, 14, 1025-1044.
UUnniivveerrssiittyy ooff PPrreettoorriiaa eettdd –– SSoollee,, CC LL ((22000055))
139
Sole CL, Scholtz CH, Bastos ADS (2005) Phylogeography of the Namib Desert dung beetles
Scarabaeus (Pachysoma) MacLeay (Coleoptera:Scarabaeidae). Journal of
Biogeography, 32, 75-84.
Sole CL (2005) The Phylogeography of Scarabaeus (Pachysoma). PhD Thesis, The
University of Pretoria.
Su B, Fu Y, Wang Y, Jin L, Chakraborty R (2001) Genetic diversity and population history
of the Red Panda (Ailurus fulgens) as inferred from mitochondrial DNA sequence
variations. Molecular Biology and Evolution, 13, 1070-1076.
Swofford DL (1998) PAUP*. Phylogentic Analysis using Parsimony, Beta version 4.0b1.
Computer program distributed by the Illinois Natural History Survey, Champaign, IL.
Tajima F (1983) Evolutionary relationships of DNA sequences in finite populations.
Genetics, 105, 437-460.
Tajima F (1989) Statistical method for testing the neutral mutation hypothesisy DNA
polymorphism. Genetics, 123, 597-601.
Tankard AJ, Rogers J (1978) Late Cenozoic palaeoenvironments on the west coast of
southern Africa. Journal of Biogeography, 5, 319-337.
Templeton AR (2001) Using phylogeographic analyses of gene trees to test species status and
processes. Molecular Ecology, 10, 779-791.
Templeton AR (2004) Statistical phylogeography: methods of evaluating and minimizing
inference errors. Molecular Ecology, 13, 1-23.
Templeton AR, Crandall KA, Sing CF (1992) A cladistic analysis of phenotypic associations
with haplotypes inferred from restriction endonuclease mapping and DNA sequence
data. III Cladogram estimation. Genetics, 132, 619-633.
Templeton AR, Sing CF (1993) A cladistic analysis of phenotypic associations with
haplotypes inferred from restriction endonuclease mapping. IV. Nested analysis with
cladogram uncertainty and recombination. Genetics, 134, 659-669.
UUnniivveerrssiittyy ooff PPrreettoorriiaa eettdd –– SSoollee,, CC LL ((22000055))
140
Templeton AR, Routman E, Phillips CA (1995) Separating populations structure from
population history: A cladistic analysis of the geographical distribution of
mitochondrial DNA haplotypes in Tiger Salamander, Ambystoma tigrinum. Genetics,
140, 767-782.
Van Dongen S, Backeljau T, Matthysen E, Dhondt AA (1998) Genetic population structure
of the winter moth (Operophtera brumata L.) (Lepidoptera, Geometridae) in a
fragmented landscape. Heredity, 80, 92-100.
Van Zinderen Bakker EM (1975) The origin and palaeoenvironment of the Namib Desert
biome. Journal of Biogeography, 2, 65-73.
Wiley J (1981) Phylogenetics: The theory and practise of phylogenetic systematics. New
York: John Wiley and Sons.
Wright S (1931) Evolution in mendelian populations. Genetics, 16, 97-159.
Wright S (1951) The genetical structure of populations. Annals of Eugenics, 15, 323-354.
Wright S (1965) The interpretation of population structure by F – statistics with special
regards to systems of mating. Evolution, 19, 395-420.
Yang Z, Goldman N, Friday A (1994) Comparison of models from nucleotide substitution
used in maximum-likelihood phylogenetic estimation. Molecular Biology and
Evolution, 11, 316-324.
Zheng X, Arbogast BS, Kenagy GJ (2003) Historical demography and genetic structure of
sister species: deermice (Peromyscus) in the North American temperate rain forest.
Molecular Ecology, 12, 711-724.
UUnniivveerrssiittyy ooff PPrreettoorriiaa eettdd –– SSoollee,, CC LL ((22000055))
141
Chapter V
___________________________________________________________________________
Isolation of microsatellite markers from Scarabaeus (Pachysoma) MacLeay
(Scarabaeidae: Scarabaeinae)
Abstract
In this section of the study the isolation of polymorphic microsatellite loci for the genus
Scarabaeus was attempted using the FIASCO protocol. The FIASCO protocol is an enrichment
protocol based on the ability to recover microsatellite DNA by PCR amplification, after selective
hybridisation. High quality genomic DNA is fragmented using a restriction enzyme (MseI) and then
ligated to a known adaptor (MseI AFLP). Following the fragmentation-ligation step the DNA is then
hybridised to specific selected 5’ biotinylated probes and bound to streptavidin coated beads. After the
hybridisation step and several washes to remove DNA that has bound non-specifically, the DNA is
eluted and recovered by PCR. Enriched DNA fragments are then cloned into a plasmid vector using a
restriction site on the known flanking regions. The resultant recombinant clones are in turn screened
for microsatellite repeats by directly sequencing them using primers specific for the vector.
Following the identification of clones containing repeats, primers are designed for marker
optimisation. This protocol was optimised for Scarabaeus and four out of six potential loci were
identified as being polymorphic with one being monomorphic and the other exhibiting unstable
amplification reactions.
UUnniivveerrssiittyy ooff PPrreettoorriiaa eettdd –– SSoollee,, CC LL ((22000055))

142
Introduction
“Microsatellite DNA” is the term used to describe tandem repeats of short sequence motifs
between two (di-nucleotide) and six (hexa-nucleotides) bases in length. These repeats are
arranged head to tail without interruption by any other base or motif and their functional
significance is unknown. Microsatellites have been found in every organism studied so far
and since they may be highly polymorphic are useful genetic markers. Adenine (A) and
thymine (T) di-nucleotide repeats are the most common microsatellites in all genomes;
however, they do show subtle differences in frequency distributions. Rates of mutation in
microsatellites are high compared to rates of point mutations in non-repetitive DNA regions.
High mutation rates in microsatellites are said to be due to either slipped strand mis-pairing
during replication, which is thought to be the predominant mechanism, or recombination
between DNA molecules (Hancock, 1999; Toth et al., 2000).
Slippage/slipped strand mis-pairing occurs during replication when the nascent DNA
strand dissociates from the template strand. When non-repetitive sequences are being
replicated there is only one way in which the nascent strand can re-anneal precisely to the
template strand before replication is recommenced. If the replicated sequence is repetitive the
nascent strand may re-anneal out of phase with the template strand. When replication is
continued after such a mis-annealing, the eventual nascent strand will be either shorter or
longer than the template strand (Hancock, 1999).
Recombination could potentially alter the length of microsatellites in two ways, by
unequal crossing-over or by gene conversion. Unequal crossing over results from crossover
between misaligned chromosome strands. Unequal crossover gives rise to a deletion in one
molecule and an insertion in the other. Gene conversion, which involves unidirectional
transfer of information by recombination, probably as a response to DNA damage, can
transfer sequence in an out of phase manner from one allele to another (Hancock, 1999).
The genetic architecture of a species can be interpreted as the result of historical
biogeographic factors as well as contemporary ecologies and behaviours of the organism
under investigation (Avise et al., 1987; Avise, 2000). Phylogeography is the study of the
principles and processes governing the geographical distributions of genealogical lineages,
especially those within and amongst closely related species. Phylogeography therefore deals
with historical and phylogenetic components of the spatial distributions of gene lineages.
Time and space are joint axes of phylogeography (Avise, 2000). The majority of
phylogeographic studies so far have employed mitochondrial DNA as the marker of choice,
but recent developments in the field recommend the synchronous usage of nuclear-based
UUnniivveerrssiittyy ooff PPrreettoorriiaa eettdd –– SSoollee,, CC LL ((22000055))

143
microsatellite markers (Avise, 1998) in order to check for congruence across several unlinked
loci with different genealogical pathways.
Different protocols exist for microsatellite isolation. Traditionally microsatellites were
isolated from partial genomic libraries of the species of interest which involved screening
several thousand clones through colony hybridisation with repeat containing probes
(Rassman et al., 1991). Although a simple method it can be tedious and very inefficient for
species with low microsatellite frequencies. While many remain faithful to the traditional
means of isolating microsatellites several other methods are being used with increased
frequency in an attempt to decrease the time invested in the isolation process while increasing
the yield of microsatellites. To avoid library construction and screening it was proposed to
modify the randomly amplified polymorphic DNA (RAPD: Williams et al., 1990) approach
by using either repeat-anchored random primers (Wu et al., 1994) or RAPD primers and
subsequent Southern hybridisation of the PCR bands with microsatellite probes (Richardson
et al., 1995). A second strategy, based on primer extension was also proposed for the
production of libraries rich in microsatellite repeats. This method involves a high number of
steps explaining the limited application and use by the scientific community (Ostrander et al.,
1992). A third class of isolation was based on selective hybridisation, which appeared to be a
very popular method for microsatellite isolation (Kijas et al., 1994). If the enrichment was
successful sequencing recombinant clones alone could then identify microsatellites. Time is
required to get the enrichment protocols running efficiently, but they are advantageous in that
they are fast, efficient, require only basic skills in molecular biology and limited laboratory
equipment as compared to that for traditional methods of microsatellite screening (for added
details of these procedures see Zane et al., 2002 and references therein). With this in mind,
and the fact that the selective hybridisation procedure had been used successfully in the
Genetics Department at the University of Pretoria, it was decided to use this protocol, to
isolate microsatellites, in preference to traditional or any other methods.
This part of the study was aimed at isolating microsatellites for the genus Scarabaeus.
To examine the genetic variation between the populations of the different species both
mitochondrial DNA and microsatellites need to be employed. The mitochondrial COI gene
reveals relatively older genetic structuring whereas the microsatellites are thought to reveal
more recent dynamics. The employment and use of DNA microsatellites is therefore expected
to reveal patterns of variation that would be undetectable by other molecular markers
(Kirchman et al., 2000). The primary goal of the molecular comparisons is to characterize
genetic diversity within and between populations of the same species.
UUnniivveerrssiittyy ooff PPrreettoorriiaa eettdd –– SSoollee,, CC LL ((22000055))

144
Methodology and Results
Taxonomic Samples
A single species, Scarabaeus (Pachysoma) gariepinus, was chosen from which to isolate
microsatellites, as it is found on both sides of the Orange River and it represented populations
that were more comprehensively sampled than the other species. Individuals were collected
from five designated populations (see Chapter 4; Table 1), two populations in South Africa,
Langhoogte/Kommagas and Holgat River, and three in Namibia, Hohenfels, Daberas/Obib
and Klingharts Mountains. A minimum of 10 individuals per population, where possible,
were collected otherwise as many individuals as possible were collected and stored in 99.8 %
ethanol.
Isolation of Microsatellites
Isolation of microsatellites was performed following Zane et al., (2002), the Fast Isolation by
AFLP of Sequences Containing Repeats (FIASCO protocol). This method is fast and simple
and relies on the efficient digestion-ligation reaction of the amplified fragment length
polymorphism (AFLP) procedure as described by Vos et al. (1995).
Total genomic DNA was extracted using the Roche High Pure PCR Template
Preparation Kit (Roche Diagnostics). The extracted genomic DNA was digested with MseI
and simultaneously ligated to MseI AFLP adaptor (5’ TAC TCA GGA CTC AT 3’/5’ GAC
GAT GAG TCC TGA G 3’). Digestion-ligation was performed on a Hybaid Multiblock for 3
hours at 37°C in a total volume of 25µl containing 25 – 250 ng of DNA, 10 x NEB 2 buffer,
25 mM DTT, 10 x BSA, 5 mM ATP, 10 U/µl MseI, 2000 U/µl NEB T4 DNA ligase and 50
µM MseI adaptor.
The digestion-ligation mixture was subsequently diluted 10 fold- with SABAX water
and amplified in a 20 µl reaction with adaptor specific primers (5’ CAT GAG TCC TGA
GTA AN 3’) henceforth referred to as MseI-N where ‘N’ equals A, C, G and T. The 20 µl
Polymerase Chain Reaction (PCR) contained 10 pmol MseI-N primer, 1.5 mM MgCL2, 1 X
Taq DNA polymerase buffer, 10 mM dNTP’s (200 µM) in the presence of 0.4 units Taq
DNA polymerase. Following optimisation, final thermal cycling parameters for S. (P.)
gariepinus comprised an initial denaturation for 2 minutes at 94°C followed by 22 cycles of
94°C for 30 seconds, 53°C for 60 seconds and 72°C for 60 seconds with a final elongation
step at 72°C for 7 minutes (Vos et al., 1995). A small amount of the PCR product (3 µl) was
electrophoresed on a 1.5 % agarose gel (Fig. 1). Clear DNA smears (lanes 1 & 2) indicated
that MseI cut the genomic DNA in fragments ranging from 250 to 1 200 base pairs (bp) in
UUnniivveerrssiittyy ooff PPrreettoorriiaa eettdd –– SSoollee,, CC LL ((22000055))

145
length. Figure 1 also shows an over-representation of fragments as seen by the dark distinct
band approximately 500 bp in size. This over-represented band is not ideal, as it is believed to
represent multi-copy sequences in the original genome.
Figure 1. Electrophoresis of the PCR products amplified with the MseI-N primers following the
digestion-ligation step. Lanes 1 & 2 contain 3 µl of PCR product. Product sizes range from 250 –
1200 bp in length.
In the AFLP protocol the MseI-N primer has a selective nucleotide at the 3’ end,
which matches the first nucleotide beyond the original restriction site, allowing for pre-
selective amplification. For this protocol all four primers are mixed (N = A, C, G, T) allowing
for the amplification of all fragments flanked by MseI sites, providing they have an
appropriate size for PCR. The advantage of this is that if undesired bands appear within the
PCR, one can go back one step and try different combinations of the selective primers, i.e.
remove one of the bases ‘A, C, G, T from the primer mix, and re-amplify, and in doing so
preclude amplification of the unwanted bands. Over representation of bands which probably
correspond to multi-copy sequences in the original genome are not favourable as they tend to
be carried over during enrichment and when cross-hybridised with the biotinylated probes
will represent a significant fraction of the obtained recombinant clones (Zane et al., 2002). A
single base (either A, C, G or T) from the MseI-N primer was systematically removed and
four different amplification reactions were preformed, the results of which can be seen in
Figure 2. The reaction lacking an over represented band can be seen in reaction 4 - lanes 3 &
UUnniivveerrssiittyy ooff PPrreettoorriiaa eettdd –– SSoollee,, CC LL ((22000055))

146
4 - (Fig. 2), which lacked the base ‘C’. All subsequent PCR’s using the MseI-N primer, were
therefore performed without the base ‘C’.
Figure 2. The four experimental amplification reactions (labelled from the top left) after the removal
of a single base A (reaction 1), T (reaction 2), G (reaction 3) and C (reaction 4).
The DNA from the PCR was then used as template for hybridisation to selected
biotinylated probes using the Travis Glen Protocol
(http://129.252.89.20/Msats/Microsatellites.html). The DNA-probe hybrid molecules were
prepared in the following way: 250 – 500 ng of the amplified DNA, 50 – 80 pmol of the
selected biotinylated probe made up to a total volume of 100 µl with 4.2 X SSC, 0.7 % SDS.
Probes were denatured at 95°C for 3 minutes followed by annealing at room temperature for
15 minutes. Three hundred µl of TEN100 were added to the prepared DNA-probe hybrid
molecules.
Table 1 shows the probes used in different combinations to isolate microsatellites.
Different probes can be combined in a single hybridisation reaction only if the designated
probes have the same length i.e. only di-nucleotide or only tri-nucleotide probes can be
combined in a single reaction.
UUnniivveerrssiittyy ooff PPrreettoorriiaa eettdd –– SSoollee,, CC LL ((22000055))

147
Table 1. Biotinylated probes used to isolate microsatellites.
Probes Length
(ca) 15 30mer
(ct) 8 16mer
(gc) 8 16mer
(tg)15 30mer
(ata)8 24mer
(gtg)5 15mer
(caa)5 15mer
(aca)5 15mer
(cga)5 15mer
(cca)5 15mer
(cat)5 15mer
(cac)5 15mer
(ccagt)10 40mer
(gaaa) 6 24mer
(tgtc) 6 24mer
(tatc) 6 24mer
(gata) 6 24mer
(cagc) 6 24mer
(tcca) 6 24mer
The DNA molecules attached to the biotinylated probes were captured using
Streptavidin coated beads (Streptavidin Magnetic Particles, Boehringer Mannheim) (Kandpal
et al., 1994;Kijas et al., 1994; Mcrae et al., 2005). Firstly, the beads were prepared by
washing 1 mg of beads three times in 500 µl TEN100 (10mM Tris-HCL, 1 mM EDTA, 100
mM NaCL at pH 7.5) after which they were re-suspended in 40 µl of TEN100. Ten µl of an
unrelated PCR product were added to the prepared beads so as to prevent non-specific
binding. The DNA-probe hybrid molecules were then added to the prepared beads and
allowed to incubate for 30 minutes at room temperature with constant gentle agitation.
The non-specific DNA was removed by 7 non-stringency and 7 stringency washes.
Non-stringency washes were performed by adding 400 µl of TEN1000 (10 mM Tris-HCL, 1
mM EDTA, 1M NaCL, at pH 7.5). The stringency wash was performed by adding 400 µl 0.2
SSC, 0.1 % SDS to the DNA. All washes were carried out at room temperature for 5 minutes,
recovering the DNA with magnetic field separation, except for the last stringency wash which
UUnniivveerrssiittyy ooff PPrreettoorriiaa eettdd –– SSoollee,, CC LL ((22000055))

148
was left at 40°C for 5 minutes. The last non-stringency and stringency washes were kept for
further amplification.
The DNA was then separated from the beads-probe complex by means of two
denaturation steps. The first step involved adding 50 µl of TE (10 mM Tris-HCL, 1 mM
EDTA at pH 8) prior to incubation at 95°C for 5 minutes, after which the supernatant was
removed and stored. The second step involved treating the beads with 12 µl of 0.15 M
NaOH, removing the supernatant and neutralizing it with 12µl of 0.1667 M acetic acid. TE
was then added to a final volume of 50 µl. The last non-stringency, stringency and two
elutions from the denaturation step should contain an increasing amount of DNA fragments
containing the repeat and should carry the MseI-N primer target at each end.
The DNA was then precipitated from the washing and denaturation steps by adding 1
volume of ethanol and sodium acetate (0.15 M final concentration) and then re-suspending in
50µl of water. The precipitated DNA was amplified in a 50 µl reaction containing 10 pmol
MseI-N primer, 2 mM MgCL2, 1 X Taq DNA polymerase buffer, 10mM dNTP’s (200 µM) in
the presence of 0.4 units Taq DNA polymerase. Thermal cycling parameters comprised an
initial denaturation for 2 minutes at 94°C followed by 35 cycles of 94°C for 30 seconds, 53°C
for 60 seconds and 72°C for 60 seconds with a final elongation step at 72°C for 7 minutes.
The PCR products from the washing and denaturation steps yielded a product with
smears above 200 bp with the last stringency wash yielding an order of magnitude less
product showing the distinct removal of non-specifically bound DNA. Figure 3 clearly
indicates that the more non-stringency and stringency washes done, the more non-specifically
bound DNA is removed. Figure 3 shows the effect of eight washes with lane 8 having the
least amount of DNA.
Figure 3. Amplification products of eight stringent wash steps, loaded in lanes 1-8. Lane 8 represents
the last stringency wash clearly indicating that the more washes done the more non-specifically bound
DNA was removed.
UUnniivveerrssiittyy ooff PPrreettoorriiaa eettdd –– SSoollee,, CC LL ((22000055))
149
Cloning and optimisation
Cloning of the PCR amplicons was carried out using the TOPO TA Cloning Kit for
Sequencing (Invitrogen). The PCR products from the two-denaturation steps were used as
they were considered the best candidates for producing a highly enriched library.
Pre-mixed agar media containing Ampicillin (Invitrogen) was used to prepare the agar
plates on which to grow up colonies. Pouring of the plates was done in a laminar flow cabinet
after which the plates were allowed to cool for 30 minutes. Colonies were plated out using 50
µl and 100 µl from each transformation and incubated upside down at 37°C for 12 – 16
hours. Colonies were then cultured for 16 – 24 hours in 1000 µl of LB Broth (Invitrogen
Corporation), containing 100 µg/ml of Ampicillin at 37°C, with constant agitation. Once the
colonies had been cultured 10 µl of the colony was added to 10 µl of SABAX water and
denatured at 96°C for 7 minutes. The balance (850 µl) of the cultured colony was added to
150 µl of glycerol, creating a 15 % glycerol solution for long-term storage at -80°C. One µl
of the denatured colony was amplified in a 50 µl reaction containing the following 10 pmol
of each of the T3 and T7 universal primers, 2 mM MgCL2, 1 X Taq DNA polymerase buffer,
10 mM dNTP’s (200 µM) in the presence of 0.4 units Taq DNA polymerase. Thermal cycling
parameters were the same as mentioned above. The colony PCR products when
electrophoresed on a 1.5 % agarose gel showed PCR products of different sizes (Fig. 4).
Different sized PCR products confirmed that vectors had different sized cloned
products incorporated into them. A total of 260 colonies were picked all of which were
sequenced. Sequencing reactions were performed at an annealing temperature of 53°C with
version 3.1 of the Big Dye Terminator Cycle Sequencing Ready Reaction Kit (Perkin-Elmer).
Each amplicon was sequenced with the T3 primer (Invitrogen) to screen for microsatellite
(Msat) repeats. Primer pairs flanking the microsatellite repeats were then designed using
Primer Designer 4 (Scientific and Educational Software). Of the 260 sequences a total of 15
possible repeat sequences were identified. These were narrowed down to six possibilities due
to either poor repeats or the inability to design primers suitable for amplifying the repeat
region (see Table 2 for microsatellite repeats).
UUnniivveerrssiittyy ooff PPrreettoorriiaa eettdd –– SSoollee,, CC LL ((22000055))
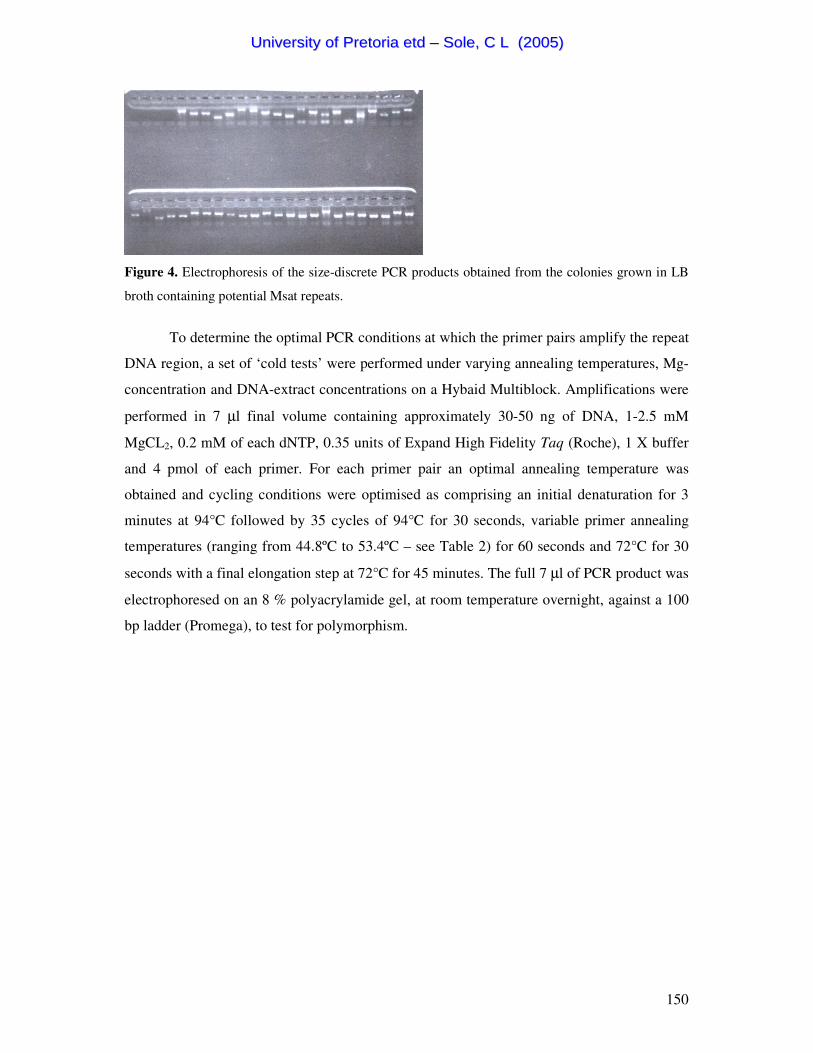
150
Figure 4. Electrophoresis of the size-discrete PCR products obtained from the colonies grown in LB
broth containing potential Msat repeats.
To determine the optimal PCR conditions at which the primer pairs amplify the repeat
DNA region, a set of ‘cold tests’ were performed under varying annealing temperatures, Mg-
concentration and DNA-extract concentrations on a Hybaid Multiblock. Amplifications were
performed in 7 µl final volume containing approximately 30-50 ng of DNA, 1-2.5 mM
MgCL2, 0.2 mM of each dNTP, 0.35 units of Expand High Fidelity Taq (Roche), 1 X buffer
and 4 pmol of each primer. For each primer pair an optimal annealing temperature was
obtained and cycling conditions were optimised as comprising an initial denaturation for 3
minutes at 94°C followed by 35 cycles of 94°C for 30 seconds, variable primer annealing
temperatures (ranging from 44.8ºC to 53.4ºC – see Table 2) for 60 seconds and 72°C for 30
seconds with a final elongation step at 72°C for 45 minutes. The full 7 µl of PCR product was
electrophoresed on an 8 % polyacrylamide gel, at room temperature overnight, against a 100
bp ladder (Promega), to test for polymorphism.
UUnniivveerrssiittyy ooff PPrreettoorriiaa eettdd –– SSoollee,, CC LL ((22000055))

151
Table 2. Potential microsatellites and primers designed to determine whether the loci were polymorphic or not.
Probes MSAT repeats Ta Clone Primers Polymorphic Name Sequence Tm Pos L 1. (ca)15(ct)8 (tg)24 53.4°C 27 tg36_f atg agt ggg tgt gtg tcg tg 61°C 36 20 Unreliable tg257_r tct tcc ttg gtc ttt att ttg g 57°C 257 22 Unreliable 2. (ata)8(gtg)5 (cta)12 51.3°C 31 ap42_f ggt cac gct tta gga cta ga 60°C 83 20 √ 3. (caa)5(aca)5(cga)5 ap42_r ggt tga taa ggt aga tgc cc 59°C 340 20 √ (tg)8 44.8°C 23 ap35_f1 gcc tct tcg agt att gtg 56°C 277 18 √ ap35_r1 cgt taa caa gga gct gca 60°C 399 18 √ (ca)5 cg (ca)7 62°C 13 ap25_f cgt gaa tcg acg acg tga aa 62°C 116 20 No ap25_r gtg tat gta tgt gcg ggt gt 62°C 181 20 No (ca)3 ta (ca)6 46.8°C 15 ap27_f cgt tat cac gcg ctc gca ca 68°C 254 20 √ ap27_r ccg tat ggt gcc gct tcc tt 67°C 334 20 √ (gggtt)3 gtgatgtgtt (gggtt)2 50°C 6 ap19_f cgt cag aga ggg tat gta ac 58°C 29 20 √ ap19_r cct atc ttg tag aca ggt gc 59°C 337 20 √
£ Ticks in the polymorphic column indicate that the locus was polymorphic
UUnniivveerrssiittyy ooff PPrreettoorriiaa eettdd –– SSoollee,, CC LL ((22000055))

152
Discussion
Microsatellites are found everywhere in both prokaryote and eukaryote genomes and are
present within coding and non-coding regions. Their distribution, however, is not
homogenous within a single genome due to different constraints on coding vs. non-coding
DNA (Toth et al., 2000), historical processes (Wilder & Hollocher, 2001) and possible
different functional roles of the repeats (Valle, 1993). The frequency of microsatellites also
varies across taxa, in terms of both absolute numbers of the loci and repeats (Hancock, 1999).
As microsatellites have a high mutability they are thought to play an important role in
genome evolution by creating and maintaining quantitative genetic variation (Toth et al.,
2000). The aim of this part of the study was to create a microsatellite library for Scarabaeus.
However, due to time constraints and technical problems encountered this goal was not
satisfactorily achieved.
Technical problems resulting in low yield of polymorphic loci were two-fold. Firstly,
problems were experienced with cloning the DNA fragments into the vector cells. This can
be seen by the small number of colonies that were available to select for growth (namely 260
across 10 different attempts). This contrasts markedly with the more than 400 colonies
obtained by P. Bloomer after three attempts with Avian DNA under the same laboratory
conditions and using the same reagents (pers. comm.). Probes based on the microsatellites
isolated from other families of Coleoptera were taken into account and used first when
attempting to increase the cloning success rate but this did not seem to solve the problem.
Different agar was tried in case the vector cells were sensitive to certain agar media. The
TOPO cloning manual suggested leaving the cloning reaction for different lengths of time to
allow for maximising the PCR products. Different combinations of these times were tried but
this did not improve the cloning reaction. The competent cells from the same kit were tested
using bird and mammal DNA to see whether the competent cells were of a poor quality.
However, both these sets of DNA produced a magnitude more clones on the agar as opposed
to beetle DNA. After trying different combinations of times, probes, agar and testing the
competent cells for competency it is concluded that Scarabaeus may be comparatively poor
in microsatellite repeats.
According to Zane et al. (2002) arthropod DNA does not appear to be microsatellite
rich and the general trend appears to be that the success rate for isolating positive repeats is
approximately 2 %. This is exceedingly low, indicating that the success rate achieved in this
study was not unrealistic particularly as the six good repeats obtained out of a total of 260
clones sequenced, works out at a 2.3 % success rate. Furthermore, approximately 50 % of
UUnniivveerrssiittyy ooff PPrreettoorriiaa eettdd –– SSoollee,, CC LL ((22000055))

153
positive clones (i.e. those containing repeat motifs) are eventually discarded due to a lack of
suitable sequence for primer design, or the absence of the repeat in the amplification product,
or due to unreliable amplification (Zane et al., 2002). It has been confirmed that four of the
six loci were polymorphic, a single one ((tg)24 repeat) exhibited unreliable amplification
while the last one was monomorphic. An additional consideration is that the expected
frequency of tri- and tetra- nucleotide repeats is below 1 % of any clone analysed across all
taxa (Zane et al., 2002).
The second problem we encountered was with the amplification step of a single locus,
the (tg)24 repeat, once the primers had been designed. In the ‘cold tests’ primer-specific
annealing temperatures, DNA and MgCl2 concentrations were identified, which gave the best
amplification of genomic DNA. In some instances, however, the PCR would give double
bands in one PCR and not in another using the same DNA and reagents, and under the same
cycling parameters. If one knows the length of the fragment amplified then should any double
bands occur that differ significantly in size, it could still in theory be possible to identify and
select the correct band containing the repeat, based on size. However, in most cases the bands
were too close together to permit adequate separation, hence it was not possible to ascertain
whether the repeat was polymorphic or not. The reason for temperamental PCR’s was
unknown. Different types of Taq DNA polymerase (i.e. High Fidelity, Supertherm,
Supertherm Gold and Biotools) were evaluated, between-thermal cycler variation was
avoided by using the same PCR machine for optimisation as for amplification, new reagents
were tried for PCR reactions and different individuals of the species were amplified but the
problem still persisted. As a last resort new primers were designed for this locus but this did
not seem to solve the problem.
In many cases obtaining ‘well behaved’ microsatellites requires considerable time and
effort and even then some microsatellites may still have null alleles or single primer pairs that
amplify more than a single locus (Meglécz et al., 2004). Difficulties arise during isolation
and characterisation of microsatellites leading to few well-resolved loci (Nève & Meglécz,
2000). Problems appear during the design of primers and setting up PCR conditions. Reasons
for the presence of null alleles and varying amplification intensities between individuals has
been largely speculated upon but suggestions are that the flanking regions of microsatellites
may be variable (Meglécz et al., 2004). A frequently observed problem is the amplification of
more than two bands with a single primer pair (Meglécz et al., 2004). Two possible reasons
primarily given are (i) the duplication or multiplication of microsatellite containing regions or
(ii) that microsatellites lie within a minisatellite repeat unit and have microsatellite length
UUnniivveerrssiittyy ooff PPrreettoorriiaa eettdd –– SSoollee,, CC LL ((22000055))
154
variations between the minisatellite repeat units. These problems appear to be common
within the order Lepidoptera (Meglécz et al., 2004), but we have experienced them within
Scarabaeus i.e. order Coleoptera, indicating that they may be more common across unrelated
taxa. However, as failed attempts at microsatellite isolation are generally not published, the
extent of the problem can only be speculated upon.
One of the major drawbacks of microsatellites is that they need to be isolated de novo
from most species being examined for the first time. Most microsatellites are found in non-
coding regions were the substitution rate is higher than in coding regions (Hancock, 1995).
To design ‘universal primers’ matching conserved regions is therefore often problematic
(Zane et al., 2002). Different taxa exhibit different preferences for microsatellite repeat types
(Lagercrantz et al., 1993) hence attempting amplification across the generic, familial or order
level in many instances proves fruitless.
The task of microsatellite isolation involves a large amount of effort in the time and
money invested in isolation, compared to the results obtained. One has to screen genomic
libraries with many appropriate probes, optimise amplification reactions at numerous steps,
design primers and eventually gene scan individuals from the respective species. The number
of positive clones (those containing microsatellite repeats) ranges from 12 % to as low as
0.04 % (Zane et al., 2002). Such isolation strategies will therefore only be successful in a
limited time in taxa with high numbers of repeats e.g. fish or if a low number of
microsatellite loci are needed.
Microsatellites are inherently unstable and undergo constant mutation. The abundance
of certain repeat types varies with the genomic region and their distribution is often
dependent on the taxonomic group examined (Hancock, 1996; Toth et al., 2000). Mean
density for microsatellites within a species varies widely for reasons unknown, and therefore
resulting in no a priori rule that can be forged for their predictability (Jarne & Lagoda, 1996).
Moreover, overall microsatellite content within a genome is often correlated to genome size
of the organism (Hancock, 1996). After taking all the above points into account the 18
months of laboratory work required to obtain four polymorphic loci exemplifies the amount
of the labour involved as well as the poor success rate in the isolation process. The number of
loci scored, degree of polymorphism of each locus and sample size are of paramount
importance for the statistical power of microsatellites to be effective (Zane et al., 2002).
With this in mind the process of optimising the loci will continue until such time as a
minimum of five or more good polymorphic loci are obtained with which to work.
UUnniivveerrssiittyy ooff PPrreettoorriiaa eettdd –– SSoollee,, CC LL ((22000055))

155
Microsatellite markers are excellent for population structure studies as they are highly
variable, more likely to be neutral than other genetic markers and the results are reproducible
(Jarne & Lagoda, 1996). These advantages tend to outweigh the long and expensive isolation
process and establishment of appropriate amplification conditions. Even though the problems
experienced, such as low microsatellite frequency and frequent PCR failure, do not appear to
be unique to Coleoptera i.e. they are seen in at least one other order of insects, Lepidoptera,
(Meglécz & Solignac, 1998), we are positive that with perseverance, repetition and patience,
successful isolation of microsatellite loci will be obtained that will provide the desired
statistical power to answer the original questions posed.
Acknowledgements
CS would like to thank Wayne Delport and Carel Oosthuizen from the MEEP laboratory
(Genetics Department, University of Pretoria) for their patience and advice over the past 18
months. Paulette Bloomer is thanked for making the MEEP lab available to CS for laboratory
work. The NRF and University of Pretoria are thanked for partial funding of this project.
UUnniivveerrssiittyy ooff PPrreettoorriiaa eettdd –– SSoollee,, CC LL ((22000055))
156
References
Avise JC, Arnold J, Martin Ball R, Birmingham E, Lamb T, Neigel JE, Reeb CA, Saunders
NC (1987) Intraspecific Phylogeography: the mitochondrial DNA bridge between
population genetics and systematics. Annual Review of Ecological Systematics, 18,
489-522.
Avise JC (1998) The history and purview of phylogeography: a personal reflection.
Molecular Ecology, 7, 371-379.
Avise JC (2000) Phylogeography: The history and formation of species. Cambridge,
Massachusetts, London, England : Harvard University Press.
Hancock JM (1995) The contribution of slippage-like processes to genome evolution. Journal
of Molecular Evolution, 41, 1038-1047.
Hancock JM (1996). Simple sequences and the expanding genome. Bioassays, 18, 12467-
12472.
Hancock JM (1999) Microsatellites and other simple sequences: genomic context and
mutational mechanisms. In: Microsatellites: Evolution and Application (eds.
Goldstein DB, Schlötterer C), Chp 1. Oxford University Press.
Jarne P, Lagoda PJL (1996) Microsatellites, from molecules to populations and back.
Trends in Ecology and Evolution, 11, 424-429.
Kandpal RP, Kandpal G, Weissman, SM (1994) Construction of libraries enriched for
sequence repeats and jumping clones, and hybridization selection for region-specific
markers. Proceedings of the National Academy of Science if the United States, 91,
88-92.
Kijas JM, Fowler JC, Garbett CA, Thomas MR (1994) Enrichment of microsatellites from the
citrus genome using biotinylated oligonucleotide sequences bound to streptavidin-
coated magnetic particles. Biotechniques, 16, 656-662.
Kirchman JJ, Whittingham LA, Sheldon FH (2000) Relationships among cave swallow
populations (Petrochelidon fulva ) determined by comparisons of microsatellite and
cytochrome b data. Molecular Phylogenetics and Evolution, 14, 107-121.
UUnniivveerrssiittyy ooff PPrreettoorriiaa eettdd –– SSoollee,, CC LL ((22000055))

157
Lagercrantz U, Ellergren H, Andersson L (1993) The abundance of various polymorphic
microsatellite motifs differs between plants and vertebrates. Nucleic Acid Research,
21, 1111-1115.
Mcrae SB, Emlen ST, Rubenstein DR, Bogdanowicz SM (2005) Polymorphic microsatellite
loci in a plural breeder, the grey-capped social weaver (Pseudonigrita arnaudi),
isolated with an improved enrichment protocol using fragment size selection.
Molecular Ecology Notes, online.
Meglécz E, Petenian F, Danchin E, Coeur D'Acier A, Rasplus J-Y, Faure E (2004) High
similarity between flanking regions of different microsatellites detected within each of
two species of Lepidoptera: Parnassius apollo and Euphydryas aurinia. Molecular
Ecology, 13, 1693-1700.
Meglécz E, Solignac M (1998) Microsatellite loci for Parnassius mnemosyne (Lepidoptera).
Hereditas, 128, 170-180.
Nève G, Meglécz E (2000) Microsatellite frequencies in different taxa. Trends in Ecology
and Evolution, 15, 376-378.
Ostrander EA, Jong PM, Rine J, Duyk G (1992) Construction of small-insert genomic DNA
libraries highly enriched for microsatellite repeat sequences. Proceedings of the
National Academy of Sciences of the USA, 89, 3419-3423.
Rassmann K, Schlötterer C, Tautz D (1991) Isolation of simple-sequence loci for use on
polymerase chain reaction-based DNA fingerprinting. Electrophoresis, 12, 113-118.
Richardson T, Cato S, Ramser J, Kahl G, Weising K (1995) Hybridization of microsatellites
to RAPD: a new source of polymorphic markers. Nucleic Acid Research, 23, 549-557.
Tóth G, Zoltán G, Jurka J (2000) Microsatellites in different Eukaryotic genomes: survey and
analysis. Genome Research, 10, 967-981.
Valle G (1993) TA-repeat microsatellites are closely associated with ARS consensus
sequences in yeast chromosome III. Yeast, 9, 753-759.
Vos P, Hogers R, Bleeker M, et al. (1995) AFLP: a new technique for DNA fingerprinting.
Nucleic Acids Research, 23, 4407-4414.
UUnniivveerrssiittyy ooff PPrreettoorriiaa eettdd –– SSoollee,, CC LL ((22000055))

158
Wilder J, Hollocher H (2001) Mobile elements and the genesis of microsatellites in
Dipterans. Molecular Biology and Evolution, 18, 384-392.
Williams JG, Kubelik AR, Livak KJ, Rafalski JA, Tingey SV (1990) DNA polymorphisms
amplified by arbitrary primers are useful as genetic markers. Nucleic Acids Research,
18, 6531-6535.
Wu K, Jones R, Danneberger L, Scolnik PA (1994) Detection of microsatellite
polymorphisms without cloning. Nucleic Acids Research, 22, 3257-3258
Zane L, Bargelloni L, Patarnello T (2002) Strategies for microsatellite isolation. Molecular
Ecology, 11, 1-16.
UUnniivveerrssiittyy ooff PPrreettoorriiaa eettdd –– SSoollee,, CC LL ((22000055))
159
Chapter VI
___________________________________________________________________________
Concluding comments on the phylogeny and phylogeographic patterns of Scarabaeus
(Pachysoma) MacLeay (Scarabaeidae: Scarabaeinae).
Throughout the preceding chapters I have attempted to identify species relationships at both a
morphological and molecular level and key patterns and processes in phylogeographic history
that may have shaped the population structure within Scarabaeus (Pachysoma) seen today. I
have also attempted to highlight conservation concerns based on some of the analyses done
and questions posed. In this chapter I therefore attempt to summarise the key findings of each
chapter and bring together the ideas and theories to identify the most important processes
affecting or having affected Scarabaeus (Pachysoma).
Phylogenetic history
Much contention has surrounded the taxonomy of Scarabaeus (Pachysoma) and related taxa
over the last 50 years. One of the primary aims of this study was therefore to produce an
estimate of Scarabaeus (Pachysoma) phylogeny using both molecular and morphological
data as individual datasets and then combined, in order to address whether the group was
monophyletic, how Pachysoma was related to Scarabaeus, whether Neopachysoma was a
valid genus and whether there were 13 good species within Pachysoma. The phylogenetic
analysis was conducted using 64 morphological characters (obtained from Harrison and
Philips (2003) and 1197 bp of the Cytochrome Oxidase I (COI) gene (Sole et al., 2005)).
Scarabaeus (Pachysoma) was found to be a monophyletic clade within Scarabaeus
and was therefore classified as a derived subgenus thereof (Harrison et al., 2003; Forgie et
al., 2005; Sole, 2005, Chapter 3). The synonymy of Neopachysoma with Pachysoma is
supported even though it is clearly a distinct lineage within Scarabaeus (Pachysoma) (Sole et
al., 2005; Forgie et al., 2005). Morphologically there were 13 good species within
Scarabaeus (Pachysoma). At a molecular level strong resolution was found for 11 of the 13
species with S. (P.) hippocrates and S. (P.) glentoni forming a species complex called the
hippocrates/glentoni complex. The phylogenetic tree produced from the combined dataset
showed strong support for all 13 species. The morphological and molecular data partition
phylogenies showed congruence with the combined phylogeny, lending strong support for
combining datasets using total evidence. Phylogenetic trees based on combined data
UUnniivveerrssiittyy ooff PPrreettoorriiaa eettdd –– SSoollee,, CC LL ((22000055))

160
partitions were relatively more resolved than those based on the individual data analyses.
Both the data partitions contributed to the overall combined phylogeny without the
morphological data being overshadowed by the large molecular dataset, indicating that both
the gene chosen as well as the characters had good resolving ability and were adequate for the
level of phylogenetic information required.
Phylogeographic history
Biogeographic inferences could be made due to a recent comprehensive history of the
geology and palaeo-climate of the Namib Desert being available (Pickford & Senut, 1999).
Speciation events and divergence times were estimated by applying a molecular clock, which
was based on Brower’s (1994) 2.3 % divergence per million years, to the molecular data. The
use of molecular data allowed for the relation of species age to past geological and climatic
events rendering a base from which to infer phylogeographic history of the species of
Scarabaeus (Pachysoma).
Scarabaeus (Pachysoma) is estimated to have arisen about 2.9 million years ago,
which appears to be young when compared with the age of the Namib Desert - dating back to
the Miocene (ca 15 Ma). A consistent and reliable source of water in the form of advective
fog (Nicolson, 1990), which is blown up to 50 km inland, can be associated with the radiation
of Scarabaeus (Pachysoma) into inhospitable areas along the west coast of southern Africa
(Logon, 1960; Seely & Louw, 1980; Nicolson, 1990; Pickford & Senut, 1999). Clear south-
north evolutionary gradients can be seen within the species of Scarabaeus (Pachysoma), that
are consistent with the unidirectional wind regime, indicating that the psammophilous taxa
disperse with their substratum and habitat the barchan dune (Penrith, 1979; Endrödy-Younga,
1982; Prendini, 2001). Major ancient rivers such as the Orange, Buffels and Holgat appear to
be gene barriers to certain species of ‘Pachysoma’ as well as areas of origin of speciation
events (Irish, 1990).
Strong geographic association can be seen within the phylogenies where species that
group together within the clades share similar distributions along the total Scarabaeus
(Pachysoma) distribution. Species with a suite of mostly plesiomorphic characters have a
southerly distribution while their derived psammophilous relatives have central to northern
Namib distributions.
UUnniivveerrssiittyy ooff PPrreettoorriiaa eettdd –– SSoollee,, CC LL ((22000055))
161
Population demographics
Three species of Scarabaeus (Pachysoma) were selected for detailed population studies,
based on the fact that they exhibited distinct south-north morphological clinal variation as
seen in the study by Harrison and Philips (2003). Using distance methods, basic population
analyses methods and coalescent theories (Schneider et al., 2000; Beerli & Felsenstein, 1999;
2001; Kuhner et al., 2004) an attempt was made to answer questions aimed at assessing
factors that could have contributed to the population structure exhibited by these species of
Scarabaeus (Pachysoma).
Three distinct species within Scarabaeus (Pachysoma) have been studied here, all
exhibiting very different population demographics with overlap seen in areas of geographic
similarity. S. (P.) hippocrates was shown to have four distinct populations in South Africa; S.
(P.) gariepinus had three populations, two in South Africa and one in Namibia and S. (P.)
denticollis was identified as a single population along a dune field continuum in Namibia.
The phylogeographic partitioning seen in the three species was supported by the AMOVA
analysis. All three species exhibit high overall haplotype diversity. Both the Stepwise
(Mismatch distributions) and Exponential (LAMARC) Expansion Models indicate strong
historical population expansion. Fu’s UPBLUE and Fs statistic values, indicative of recent
population parameters were not always significant for all populations throughout the three
species which may be an indicator that the present populations may not be undergoing
population expansion but instead are in a slight decline or are maintaining population
numbers. As recent events are shown to be masked by past trends giving rise to conflicting
results; species census data collected over a number of years should be conducted in order to
resolve this. Application of nested clade analysis (NCPA) (Templeton et al., 1995) indicated
allopatric speciation for those populations separated by environmental and anthropogenic
barriers – such as rivers and towns – while for the Namibia population of S. (P.) gariepinus
and the species S. (P.) denticollis isolation by distance and continuous range expansion could
be inferred as defining population structure.
Coalescence for each species was calculated and it was estimated that all three species
underwent population expansion within the late Pleistocene era. Analysis of gene flow
revealed a strong degree of south-north movement, consistent with the unidirectional wind
regime. Large numbers of individuals were shown to have moved between populations. A
high degree of historical gene flow indicates that the species were originally continuous
populations within the geographic region but extinction of the intermediate populations most
UUnniivveerrssiittyy ooff PPrreettoorriiaa eettdd –– SSoollee,, CC LL ((22000055))

162
likely occurred through both natural and human factors. Recent events therefore indicate that
human induced, environmental barriers and reduced vagility have had a major influence on
the population structure seen within these three species.
Conservation recommendations
Populations that show gradual geographic and individual variation at both a molecular and
morphological level make defining species delimitations problematic (Drotz & Saura, 2001).
Extensive molecular and morphological variation occurs across all three species. However to
delimit added species or sub-species based on molecular data would not be desirable and may
pose problems with regard to taxonomic concerns. It is clear that selective changes are
occurring within the populations and that sufficient mitochondrial divergence has occurred,
affecting overall population structure. If these changes are to continue to be observed and the
species conserved, conserving authorities need be made aware of the circumstances and each
population should be delineated as a Management Unit (Moritz, 1994a, b). Each population is
connected by low levels of gene flow and are functionally independent and therefore should
be managed as individual entities. To conserve every living creature is beyond our reach but
an effort needs to be made where we are aware of changes and threats occurring within
species and populations of species.
Isolation of Microsatellite markers
The aim behind this part of the project was to have a nuclear marker with which to compare
the mitochondrial COI sequences because, by combining and comparing the same analyses
on different genes a better overall picture could be obtained of the population demographics
of Scarabaeus (Pachysoma). A second objective behind isolating microsatellites was that as
these markers are often genus specific it would be interesting to use these powerful loci on
different species of the large and variable genus Scarabaeus, to answer additional taxonomic
and demographic questions that were posed throughout this thesis.
The FIASCO protocol was chosen over other methods of microsatellite isolation as it
is fast, efficient, requires only basic skills in molecular biology and limited laboratory
equipment as compared to that for traditional methods of microsatellite screening. The
FIASCO protocol is an enrichment protocol based on the ability to recover microsatellite
DNA by PCR amplification, after selective hybridisation (Zane et al., 2002). As
microsatellites need be isolated de novo this turned out to be a daunting and labour intensive
process and problems resulting in a low yield of polymorphic loci were two-fold. The first
UUnniivveerrssiittyy ooff PPrreettoorriiaa eettdd –– SSoollee,, CC LL ((22000055))
163
problem encountered was with cloning the DNA fragments into the vector cells for colony
growth. Probes were selected based on previous studies of Coleoptera where microsatellites
were isolated but this did not improve the cloning procedure. Different agar media were tried
in case the competent cells were sensitive to the agar, which they were not. Different time
combinations as suggested by the TOPO cloning manual were used and lastly the competent
cells were tested on both Avian and Mammalian DNA to test whether they were of poor
quality, which they were not. The second problem was encountered during optimisation of a
locus where consistent conflicting PCR results were obtained. In some instances the PCR’s
contained single bands while under the same conditions using the same reagents double
bands where obtained in a separate amplification reaction. These two problems were
identified in both the orders Coleoptera and Lepidoptera, indicating that they may be
common across unrelated taxa (Meglécz et al., 2004). However, as failed attempts at
microsatellite isolation are generally not published, the underlying cause of the problems
experienced can only be speculated upon. Despite these difficulties the FIASCO protocol was
optimised for Scarabaeus and four polymorphic microsatellite loci were successfully
isolated. However, for the analyses to be statistically powerful this is too few to
constructively work with, at least one extra locus is needed for the completion of this part of
the study.
Future research
Many possibilities for future research can be suggested from this study. I include only those
which will most enhance the research done and may be of particular interest.
The resolution of the hippocrates/glentoni complex has been an issue that needs to be
resolved. Morphologically these two species are very similar and can reliably be identified
based on male genitalia. By increasing the number of specimens and analysing a different
gene better phylogenetic resolution at a molecular level, should be obtained for these two
species.
An addition of a nuclear gene or genes such as a ribosomal gene - 18S/16S - or a protein-
coding gene - elongation factor-1 α -�would be of interest to be sequenced for
the population study, as this would support or refute the slightly conflicting results regarding
the biogeographic history of the group presented here. An added microsatellite locus needs to
be isolated to have at least five polymorphic loci so as to ensure the statistical power of the
UUnniivveerrssiittyy ooff PPrreettoorriiaa eettdd –– SSoollee,, CC LL ((22000055))

164
analyses is sufficient. The microsatellite data should be analysed and published in
conjunction with the mitochondrial COI data, so as to ascertain whether overlying patterns
exist between the two types of DNA. Once the microsatellite section of this study has been
completed these loci can and will hopefully be successfully used within other species of
Scarabaeus for similar and more detailed studies to elucidate phylogeographic and
demographic patterns.
UUnniivveerrssiittyy ooff PPrreettoorriiaa eettdd –– SSoollee,, CC LL ((22000055))
165
References
Beerli P, Felsenstein J (1999) Maximum-Likelihood estimation of migration rates and
effective population numbers in two populations using a coalscent approach.
Genetics, 152, 763-773.
Beerli P, Felsenstein J (2001) Maximum likelihood estimation of a migration matrix and
effective population sizes in n subpopulations by using a coalescent approach.
Proceedings of the National Academy of Sciences of the USA, 98, 4563-4568.
Brower AVZ (1994) Rapid morphological radiation and convergence among races of the
butterfly Helioconuius erato inferred from patterns of mitochondrial DNA evolution.
Proceedings of the National Academy of Science of the United States of America, 91,
6491-6495.
Drotz M, Saura A (2001) The species delimitation problem applied to the Agabus
bipustulatus complex (Coleoptera, Dytiscidae) in north Scanadanavia. Biological
Journal of the Linnean Society, 73, 11-22.
Endrödy-Younga S (1982) Dispersion and translocation of dune specialist Tenebrionids in
the Namib area. Cimbebasia (A), 5, 257-271.
Forgie SA, Philips TK, Scholtz CH (2005) Evolution of the Scarabaeini (Scarabaeidae:
Scarabaeinae). Systematic Entomology, 30, 60-97.
Harrison JduG, Philips TK (2003) Phylogeny of Scarabaeus (Pachysoma MacLeay) stat.
nov., and related flightless Scarabaeini (Scarabaeidae: Scarabaeinae). Annals of the
Transvaal Museum, 40, 47-71.
Harrison JduG, Scholtz CH., Chown SL (2003) A revision of the endemic south-western
African dung beetle subgenus Scarabaeus (Pacgysoma) MacLeay, including notes on
other flightless Scarabaeini (Scarabaeidae: Scarabaeinae). Journal of Natural History,
37, 305-355.
Irish J (1990) Namib Biogeography, as exemplified mainly by the Lepmismatidae
(Thysanura: Insecta). In: Namib Ecology: 25 years of Namib Research. (ed. Seely
MK), pp. 61-66. Transvaal Museum Monograph No. 7. Transvaal Museum, Pretoria.
UUnniivveerrssiittyy ooff PPrreettoorriiaa eettdd –– SSoollee,, CC LL ((22000055))

166
Kuhner MK, Yamato J, Beerli P et al. (2004) LAMARC v 1.2.1. University of Washington,
http://evolution.gs.washington.edu/lamarc.html.
Logon RF (1960) The central Namib Desert, South West Africa. Publications of the National
Academy of Science, 758, 1-141.
MacLeay WS (1821) Horae Entomologicae: or essays on The Annulose Animals, Vol 1(2)
(London Bagster), 524pp + 3 pls.
Meglécz E, Petenian F, Danchin E, Coeur D'Acier A, Rasplus J-Y, Faure E (2004) High
similarity between flanking regions of different microsatellites detected within each of
two species of Lepidoptera: Parnassius apollo and Euphydryas aurinia. Molecular
Ecology, 13, 1693-1700.
Moritz C (1994a) Applications of mitochondrial DNA analysis in conservation: a critical
review. Molecular Ecology, 3, 401-411.
Moritz C (1994b) Defining evolutionary significant units for conservation. Trends in
Ecology and Evolution, 9, 373-375.
Nicolson S (1990) Water relations of the Namib Tenebrionid beetles. In: Namib Ecology: 25
years of Namib Research (ed. Seely MK), pp. 173-178. Transvaal Museum
Monograph No. 7. Transvaal Museum, Pretoria.
Penrith M-L (1979) Revision of the western southern African Adesmiini (Coleoptera:
Tenebrionidae). Cimbebasia (A), 6, 125-164.
Pickford M, Senut B (1999) Geology and Palaeobiology of the central and southern Namib
Desert, southwestern Africa. Memoir, 18, 1-155.
Prendini, L. (2001) Systematics, evolution and biogeography of the southern African
burrowing scorpions, Opistophthalmus C.L Koch (Scorpiones, Scorpionidae). PhD
thesis, University of Cape Town.
Schneider S, Roessli D, Excoffier L (2000) Arlequin, version 2.000. A Software for
Population Genetics Data Analysis. Genetics and Biometry Laboratory, University of
Geneva, Switzerland.
UUnniivveerrssiittyy ooff PPrreettoorriiaa eettdd –– SSoollee,, CC LL ((22000055))

167
Seely MK, Louw GN (1980) First approximation of the effects of rainfall on the ecology and
energetics of a Namib Desert dune ecosystem. Journal of Arid Environments, 3, 23-
54.
Sole CL (2005) Phylogeography of Scarabaeus (Pachysoma) MacLeay (Scarabaeidae:
Scarabaeinae). PhD Thesis, University of Pretoria.
Sole CL, Scholtz CH, Bastos ADS (2005) Phylogeography of the Namib Desert dung beetles
Scarabaeus (Pachysoma) MacLeay (Coleoptera:Scarabaeidae). Journal of
Biogeography, 32, 75-84.
Templeton AR, Routman E, Phillips CA (1995) Separating populations structure from
population history: A cladistic analysis of the geographical distribution of
mitochondrial DNA haplotypes in Tiger Salamander, Ambystoma tigrinum. Genetics,
140, 767-782.
Zane L, Bargelloni L, Patarnello T (2002) Strategies for microsatellite isolation. Molecular
Ecology, 11, 1-16.
UUnniivveerrssiittyy ooff PPrreettoorriiaa eettdd –– SSoollee,, CC LL ((22000055))

168
Appendix 1. Character states, as defined by Harrison & Philips (2003), of the taxa used in the morphological and combined Parsimony analysis.
0 primitive; 1-5 derived (in sequence);? unknown character state; - not applicable character state.
TAXA Characters
_________________________________________________________________________________________________________ 0 1 2 3 4 5 6
01234567890 1234567890 1234567890 1234567890 1234567890 1234567890 123
_________________________________________________________________________________________________________
S. (Pachysoma) rodriguesi 01301100233 1022211230 3102401511 2003230111 0323141111 1131121211 111
S. (Pachysoma) rotundigenus 01301100233 1022211030 2102301011 0003230111 1313141111 1131121211 111
S. (Pachysoma) denticollis 01301100233 1022212230 3102301011 2003230111 0323141111 1131121211 111
S. (Pachysoma) bennigseni 01301100233 0011012032 0102300011 2003230111 0223141111 1131120211 111
S. (Pachysoma) gariepinus 02301100333 0001212031 0002300011 1013230011 0323141111 1131121211 111
S. (Pachysoma) striatus 0130-211333 0002210030 0002300001 1013230011 0323141111 1131121211 111
S. (Pachysoma) fitzsimonsi 02301100313 0001012032 0002301001 1103230011 0223141111 1131121211 111
S. (Pachysoma) schinzi 01321000111 0101020032 0002301001 0003230211 0223141111 1131121211 111
S. (Pachysoma) valeflorae 01331000111 0101021332 0102301001 0003230211 0113141111 1131121211 110
S. (Pachysoma) hippocrates 0131-211311 0122010130 0102400101 0203230211 0113141111 1131121211 111
S. (Pachysoma) endroedyi 0031-211311 0021010032 0002300111 0213230211 0103141111 1131121211 111
UUnniivveerrssiittyy ooff PPrreettoorriiaa eettdd –– SSoollee,, CC LL ((22000055))
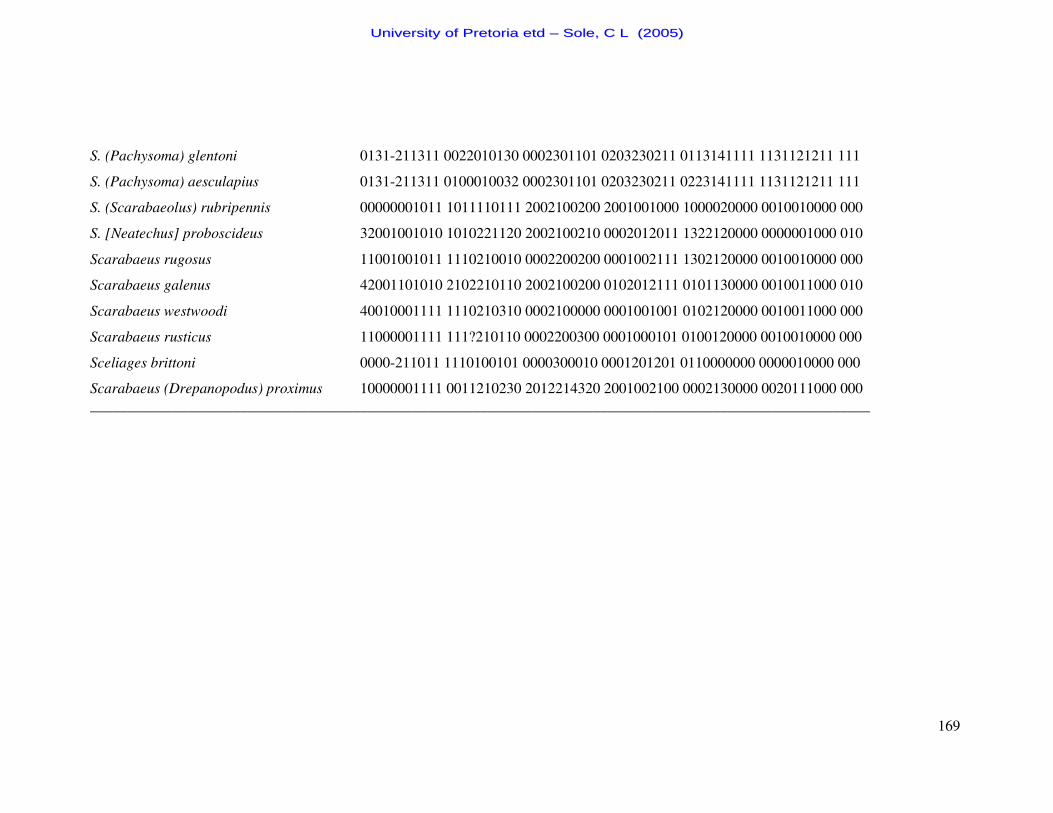
169
S. (Pachysoma) glentoni 0131-211311 0022010130 0002301101 0203230211 0113141111 1131121211 111
S. (Pachysoma) aesculapius 0131-211311 0100010032 0002301101 0203230211 0223141111 1131121211 111
S. (Scarabaeolus) rubripennis 00000001011 1011110111 2002100200 2001001000 1000020000 0010010000 000
S. [Neatechus] proboscideus 32001001010 1010221120 2002100210 0002012011 1322120000 0000001000 010
Scarabaeus rugosus 11001001011 1110210010 0002200200 0001002111 1302120000 0010010000 000
Scarabaeus galenus 42001101010 2102210110 2002100200 0102012111 0101130000 0010011000 010
Scarabaeus westwoodi 40010001111 1110210310 0002100000 0001001001 0102120000 0010011000 000
Scarabaeus rusticus 11000001111 111?210110 0002200300 0001000101 0100120000 0010010000 000
Sceliages brittoni 0000-211011 1110100101 0000300010 0001201201 0110000000 0000010000 000
Scarabaeus (Drepanopodus) proximus 10000001111 0011210230 2012214320 2001002100 0002130000 0020111000 000 ________________________________________________________________________________________________________
UUnniivveerrssiittyy ooff PPrreettoorriiaa eettdd –– SSoollee,, CC LL ((22000055))
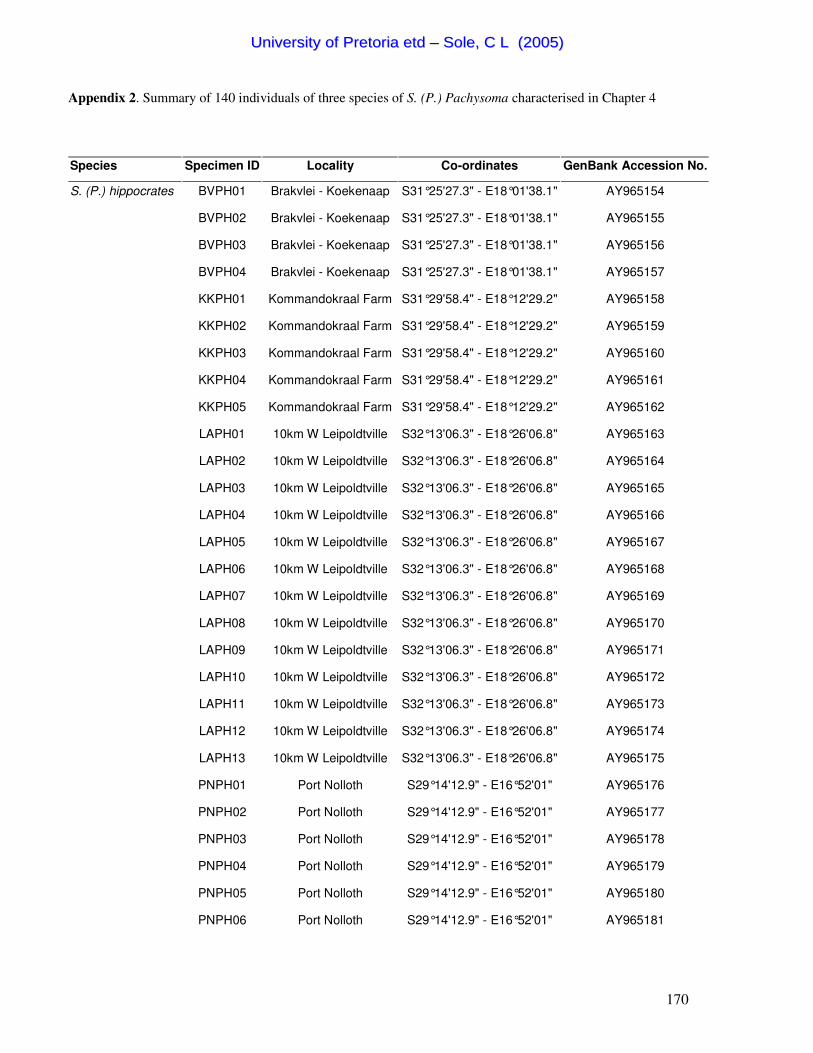
170
Appendix 2. Summary of 140 individuals of three species of S. (P.) Pachysoma characterised in Chapter 4
Species Specimen ID Locality Co-ordinates GenBank Accession No.
S. (P.) hippocrates BVPH01 Brakvlei - Koekenaap S31°25'27.3" - E18°01'38.1" AY965154
BVPH02 Brakvlei - Koekenaap S31°25'27.3" - E18°01'38.1" AY965155
BVPH03 Brakvlei - Koekenaap S31°25'27.3" - E18°01'38.1" AY965156
BVPH04 Brakvlei - Koekenaap S31°25'27.3" - E18°01'38.1" AY965157
KKPH01 Kommandokraal Farm S31°29'58.4" - E18°12'29.2" AY965158
KKPH02 Kommandokraal Farm S31°29'58.4" - E18°12'29.2" AY965159
KKPH03 Kommandokraal Farm S31°29'58.4" - E18°12'29.2" AY965160
KKPH04 Kommandokraal Farm S31°29'58.4" - E18°12'29.2" AY965161
KKPH05 Kommandokraal Farm S31°29'58.4" - E18°12'29.2" AY965162
LAPH01 10km W Leipoldtville S32°13'06.3" - E18°26'06.8" AY965163
LAPH02 10km W Leipoldtville S32°13'06.3" - E18°26'06.8" AY965164
LAPH03 10km W Leipoldtville S32°13'06.3" - E18°26'06.8" AY965165
LAPH04 10km W Leipoldtville S32°13'06.3" - E18°26'06.8" AY965166
LAPH05 10km W Leipoldtville S32°13'06.3" - E18°26'06.8" AY965167
LAPH06 10km W Leipoldtville S32°13'06.3" - E18°26'06.8" AY965168
LAPH07 10km W Leipoldtville S32°13'06.3" - E18°26'06.8" AY965169
LAPH08 10km W Leipoldtville S32°13'06.3" - E18°26'06.8" AY965170
LAPH09 10km W Leipoldtville S32°13'06.3" - E18°26'06.8" AY965171
LAPH10 10km W Leipoldtville S32°13'06.3" - E18°26'06.8" AY965172
LAPH11 10km W Leipoldtville S32°13'06.3" - E18°26'06.8" AY965173
LAPH12 10km W Leipoldtville S32°13'06.3" - E18°26'06.8" AY965174
LAPH13 10km W Leipoldtville S32°13'06.3" - E18°26'06.8" AY965175
PNPH01 Port Nolloth S29°14'12.9" - E16°52'01" AY965176
PNPH02 Port Nolloth S29°14'12.9" - E16°52'01" AY965177
PNPH03 Port Nolloth S29°14'12.9" - E16°52'01" AY965178
PNPH04 Port Nolloth S29°14'12.9" - E16°52'01" AY965179
PNPH05 Port Nolloth S29°14'12.9" - E16°52'01" AY965180
PNPH06 Port Nolloth S29°14'12.9" - E16°52'01" AY965181
UUnniivveerrssiittyy ooff PPrreettoorriiaa eettdd –– SSoollee,, CC LL ((22000055))
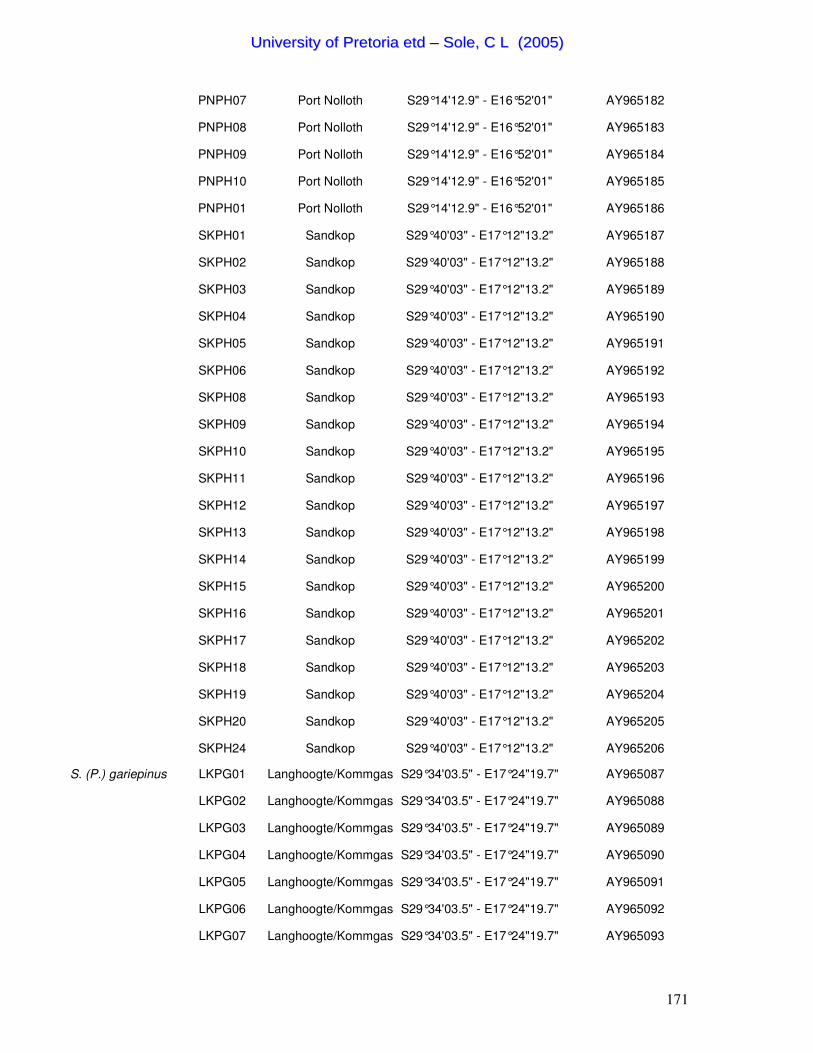
171
PNPH07 Port Nolloth S29°14'12.9" - E16°52'01" AY965182
PNPH08 Port Nolloth S29°14'12.9" - E16°52'01" AY965183
PNPH09 Port Nolloth S29°14'12.9" - E16°52'01" AY965184
PNPH10 Port Nolloth S29°14'12.9" - E16°52'01" AY965185
PNPH01 Port Nolloth S29°14'12.9" - E16°52'01" AY965186
SKPH01 Sandkop S29°40'03" - E17°12"13.2" AY965187
SKPH02 Sandkop S29°40'03" - E17°12"13.2" AY965188
SKPH03 Sandkop S29°40'03" - E17°12"13.2" AY965189
SKPH04 Sandkop S29°40'03" - E17°12"13.2" AY965190
SKPH05 Sandkop S29°40'03" - E17°12"13.2" AY965191
SKPH06 Sandkop S29°40'03" - E17°12"13.2" AY965192
SKPH08 Sandkop S29°40'03" - E17°12"13.2" AY965193
SKPH09 Sandkop S29°40'03" - E17°12"13.2" AY965194
SKPH10 Sandkop S29°40'03" - E17°12"13.2" AY965195
SKPH11 Sandkop S29°40'03" - E17°12"13.2" AY965196
SKPH12 Sandkop S29°40'03" - E17°12"13.2" AY965197
SKPH13 Sandkop S29°40'03" - E17°12"13.2" AY965198
SKPH14 Sandkop S29°40'03" - E17°12"13.2" AY965199
SKPH15 Sandkop S29°40'03" - E17°12"13.2" AY965200
SKPH16 Sandkop S29°40'03" - E17°12"13.2" AY965201
SKPH17 Sandkop S29°40'03" - E17°12"13.2" AY965202
SKPH18 Sandkop S29°40'03" - E17°12"13.2" AY965203
SKPH19 Sandkop S29°40'03" - E17°12"13.2" AY965204
SKPH20 Sandkop S29°40'03" - E17°12"13.2" AY965205
SKPH24 Sandkop S29°40'03" - E17°12"13.2" AY965206
S. (P.) gariepinus LKPG01 Langhoogte/Kommgas S29°34'03.5" - E17°24"19.7" AY965087
LKPG02 Langhoogte/Kommgas S29°34'03.5" - E17°24"19.7" AY965088
LKPG03 Langhoogte/Kommgas S29°34'03.5" - E17°24"19.7" AY965089
LKPG04 Langhoogte/Kommgas S29°34'03.5" - E17°24"19.7" AY965090
LKPG05 Langhoogte/Kommgas S29°34'03.5" - E17°24"19.7" AY965091
LKPG06 Langhoogte/Kommgas S29°34'03.5" - E17°24"19.7" AY965092
LKPG07 Langhoogte/Kommgas S29°34'03.5" - E17°24"19.7" AY965093
UUnniivveerrssiittyy ooff PPrreettoorriiaa eettdd –– SSoollee,, CC LL ((22000055))

172
LKPG08 Langhoogte/Kommgas S29°34'03.5" - E17°24"19.7" AY965094
LKPG09 Langhoogte/Kommgas S29°34'03.5" - E17°24"19.7" AY965095
LKPG10 Langhoogte/Kommgas S29°34'03.5" - E17°24"19.7" AY965096
LKPG11 Langhoogte/Kommgas S29°34'03.5" - E17°24"19.7" AY965097
LKPG12 Langhoogte/Kommgas S29°34'03.5" - E17°24"19.7" AY965098
HRPG01 Holgat River S28°56'15.2" - E16°46"55.4" AY965113
HRPG02 Holgat River S28°56'15.2" - E16°46"55.4" AY965114
HRPG03 Holgat River S28°56'15.2" - E16°46"55.4" AY965115
HRPG04 Holgat River S28°56'15.2" - E16°46"55.4" AY965116
HRPG05 Holgat River S28°56'15.2" - E16°46"55.4" AY965117
HRPG06 Holgat River S28°56'15.2" - E16°46"55.4" AY965118
HRPG07 Holgat River S28°56'15.2" - E16°46"55.4" AY965119
HRPG08 Holgat River S28°56'15.2" - E16°46"55.4" AY965120
HRPG09 Holgat River S28°56'15.2" - E16°46"55.4" AY965121
HRPG10 Holgat River S28°56'15.2" - E16°46"55.4" AY965122
HRPG11 Holgat River S28°56'15.2" - E16°46"55.4" AY965123
HRPG12 Holgat River S28°56'15.2" - E16°46"55.4" AY965124
HRPG13 Holgat River S28°56'15.2" - E16°46"55.4" AY965125
HRPG14 Holgat River S28°56'15.2" - E16°46"55.4" AY965126
HRPG15 Holgat River S28°56'15.2" - E16°46"55.4" AY965127
HRPG16 Holgat River S28°56'15.2" - E16°46"55.4" AY965128
HRPG17 Holgat River S28°56'15.2" - E16°46"55.4" AY965129
HFPG01 Hohenfels S28°30'29" - E16°36"58" AY965130
HFPG02 Hohenfels S28°30'29" - E16°36"58" AY965131
HFPG03 Hohenfels S28°30'29" - E16°36"58" AY965132
HFPG04 Hohenfels S28°30'29" - E16°36"58" AY965133
HFPG05 Hohenfels S28°30'29" - E16°36"58" AY965134
HFPG06 Hohenfels S28°30'29" - E16°36"58" AY965135
HFPG07 Hohenfels S28°30'29" - E16°36"58" AY965136
HFPG08 Hohenfels S28°30'29" - E16°36"58" AY965137
HFPG09 Hohenfels S28°30'29" - E16°36"58" AY965138
HFPG10 Hohenfels S28°30'29" - E16°36"58" AY965139
UUnniivveerrssiittyy ooff PPrreettoorriiaa eettdd –– SSoollee,, CC LL ((22000055))
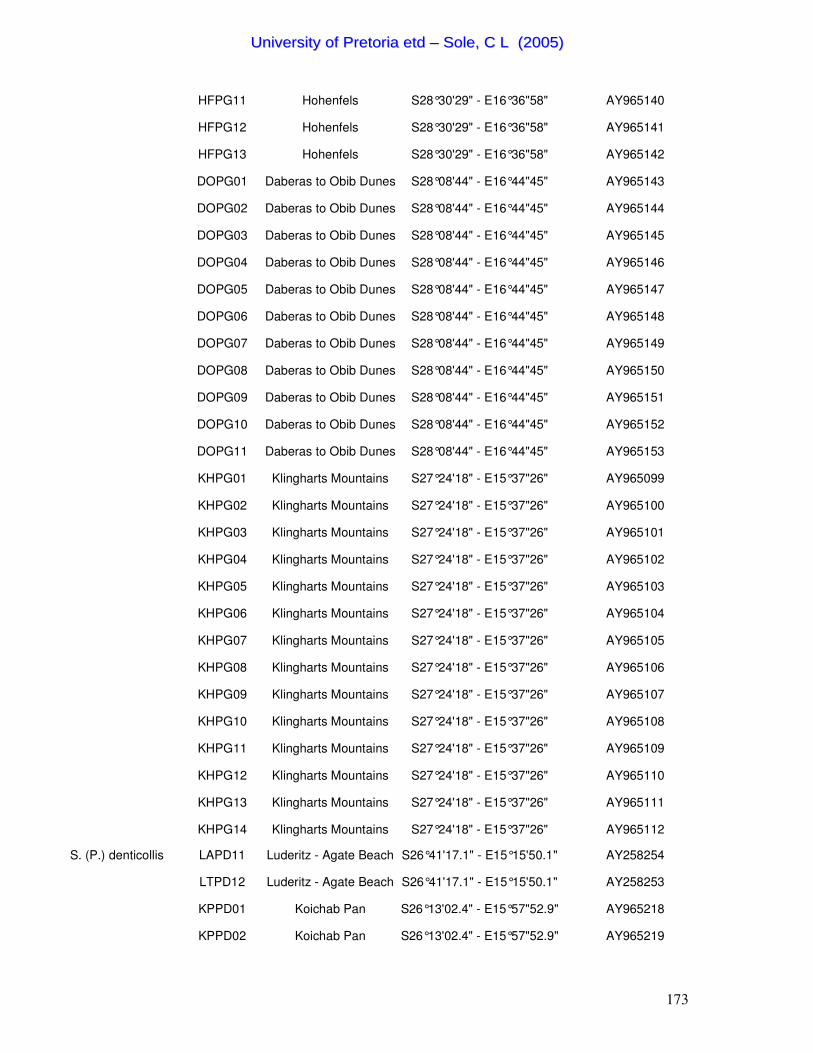
173
HFPG11 Hohenfels S28°30'29" - E16°36"58" AY965140
HFPG12 Hohenfels S28°30'29" - E16°36"58" AY965141
HFPG13 Hohenfels S28°30'29" - E16°36"58" AY965142
DOPG01 Daberas to Obib Dunes S28°08'44" - E16°44"45" AY965143
DOPG02 Daberas to Obib Dunes S28°08'44" - E16°44"45" AY965144
DOPG03 Daberas to Obib Dunes S28°08'44" - E16°44"45" AY965145
DOPG04 Daberas to Obib Dunes S28°08'44" - E16°44"45" AY965146
DOPG05 Daberas to Obib Dunes S28°08'44" - E16°44"45" AY965147
DOPG06 Daberas to Obib Dunes S28°08'44" - E16°44"45" AY965148
DOPG07 Daberas to Obib Dunes S28°08'44" - E16°44"45" AY965149
DOPG08 Daberas to Obib Dunes S28°08'44" - E16°44"45" AY965150
DOPG09 Daberas to Obib Dunes S28°08'44" - E16°44"45" AY965151
DOPG10 Daberas to Obib Dunes S28°08'44" - E16°44"45" AY965152
DOPG11 Daberas to Obib Dunes S28°08'44" - E16°44"45" AY965153
KHPG01 Klingharts Mountains S27°24'18" - E15°37"26" AY965099
KHPG02 Klingharts Mountains S27°24'18" - E15°37"26" AY965100
KHPG03 Klingharts Mountains S27°24'18" - E15°37"26" AY965101
KHPG04 Klingharts Mountains S27°24'18" - E15°37"26" AY965102
KHPG05 Klingharts Mountains S27°24'18" - E15°37"26" AY965103
KHPG06 Klingharts Mountains S27°24'18" - E15°37"26" AY965104
KHPG07 Klingharts Mountains S27°24'18" - E15°37"26" AY965105
KHPG08 Klingharts Mountains S27°24'18" - E15°37"26" AY965106
KHPG09 Klingharts Mountains S27°24'18" - E15°37"26" AY965107
KHPG10 Klingharts Mountains S27°24'18" - E15°37"26" AY965108
KHPG11 Klingharts Mountains S27°24'18" - E15°37"26" AY965109
KHPG12 Klingharts Mountains S27°24'18" - E15°37"26" AY965110
KHPG13 Klingharts Mountains S27°24'18" - E15°37"26" AY965111
KHPG14 Klingharts Mountains S27°24'18" - E15°37"26" AY965112
S. (P.) denticollis LAPD11 Luderitz - Agate Beach S26°41'17.1" - E15°15'50.1" AY258254
LTPD12 Luderitz - Agate Beach S26°41'17.1" - E15°15'50.1" AY258253
KPPD01 Koichab Pan S26°13'02.4" - E15°57"52.9" AY965218
KPPD02 Koichab Pan S26°13'02.4" - E15°57"52.9" AY965219
UUnniivveerrssiittyy ooff PPrreettoorriiaa eettdd –– SSoollee,, CC LL ((22000055))

174
KPPD03 Koichab Pan S26°13'02.4" - E15°57"52.9" AY965220
KPPD04 Koichab Pan S26°13'02.4" - E15°57"52.9" AY965221
KPPD05 Koichab Pan S26°13'02.4" - E15°57"52.9" AY965222
KPPD06 Koichab Pan S26°13'02.4" - E15°57"52.9" AY965223
KPPD07 Koichab Pan S26°13'02.4" - E15°57"52.9" AY965224
KPPD08 Koichab Pan S26°13'02.4" - E15°57"52.9" AY965225
KPPD09 Koichab Pan S26°13'02.4" - E15°57"52.9" AY965226
KPPD10 Koichab Pan S26°13'02.4" - E15°57"52.9" AY965227
KPPD11 Koichab Pan S26°13'02.4" - E15°57"52.9" AY965228
NRPD01 Namib Rand S25°12'52.5" - E16°01'10" AY965229
NRPD02 Namib Rand S25°12'52.5" - E16°01'10" AY965230
NRPD04 Namib Rand S25°12'52.5" - E16°01'10" AY965231
NRPD05 Namib Rand S25°12'52.5" - E16°01'10" AY258255
NRPD06 Namib Rand S25°12'52.5" - E16°01'10" AY258256
NRPD07 Namib Rand S25°12'52.5" - E16°01'10" AY965233
NRPD09 Namib Rand S25°12'52.5" - E16°01'10" AY965234
NRPD15 Namib Rand S25°12'52.5" - E16°01'10" AY965237
UUnniivveerrssiittyy ooff PPrreettoorriiaa eettdd –– SSoollee,, CC LL ((22000055))
Related Documents