Photoelectrochemical and photocatalytic properties of titanium (IV) oxide nanoparticulate layers Hana Bartkova a , Petr Kluson a, ⁎ , Lukas Bartek a , Martin Drobek a , Tomas Cajthaml b , Josef Krysa a a Institute of Chemical Technology - Prague, Technicka 5, 166 28 Prague 6, Czech Republic b Institute of Microbiology, Academy of Sciences of the Czech Republic, Videnska 1083, 142 20 Prague 4, Czech Republic Available online 1 April 2007 Abstract Titania nanostructured particles were produced by the sol–gel method in the reverse micelle environment treated thermally and by various extraction steps including supercritical carbon dioxide, subcritical water and their combinations. Thin films comprised of the organized nanoparticles were tested in photoelectrochemical and photocatalytic experiments. The former were configured for the open circuit potential measurements and evaluation of polarization curves and the corresponding photocurrents. Photocatalytic activities of the layered films were assessed by following decomposition of the methyl ester of stearic acid. Attention was also paid to evaluation of the extent of the surface wettability of the layers. The effect of content of residual surface carbon, extent of hydrophilic properties and presence of anatase structure were identified as essential parameters responsible for the enhanced photoactivity of the tested layers. On the other hand also layers treated without any thermal steps revealed certain level of photoactivity that might be of special importance in some specific applications. © 2007 Elsevier B.V. All rights reserved. Keywords: Sol–gel; Thin layers; Titania nanoparticles; Photocurrents; Reverse micelles 1. Introduction Titanium (IV) oxide nanoparticles are often used as thin films in photocatalysis and in photoelectrochemistry. Ideally, titanium (IV) oxide is a non-conductive material, however, due to point defects in its crystal lattice it behaves as a semicon- ductor activated by a photon flux of a wavelength (energy) corresponding to the value of the width of its forbidden band gap (∼ 365 nm, UV region) [1–5]. Specifically the sol–gel method in the reverse micelle envi- ronment represents a very suitable approach for directing nano- meter scale ordering of the TiO 2 particles formed by the involved reactions [1–5]. Following the ordering process, subsequent steps comprising removal of the organic content (micellar tem- plate) from the gel significantly affect the material's final struc- ture. In this case, either a thermal treatment could be used or the template could be extracted with supercritical carbon dioxide and/or subcritical water [6–9]. This paper is a continuation of our recent work [9] which was mainly focused on preparation and description of features of titania nanoparticulate layers produced in the manner described above. Here we mostly report on the evaluation of photocata- lytic and photoelectrochemical properties of the nanoparticulate layers. Photocatalytic activities of the layers were assessed by measuring the decomposition of the methyl ester of stearic acid under monochromatic irradiation by light in the UV region. In the set of experiments described below, the open circuit poten- tial was measured in a two electrode setup. Polarization curves and photocurrents were then obtained using the same electro- chemical cell with a modified three electrode arrangement and the sure source of UV light. Attention was also paid to eval- uation of the extent of the layers' surface wettability. 2. Experimental 2.1. Thin films As reported previously [9] reverse micelles of Triton X-100 (Aldrich, 99.99%) in cyclohexane (Aldrich, HPLC grade) were Thin Solid Films 515 (2007) 8455 – 8460 www.elsevier.com/locate/tsf ⁎ Corresponding author. Tel.: +420 220 44 4158; fax: +420 220 44 4340. E-mail address: [email protected] (P. Kluson). 0040-6090/$ - see front matter © 2007 Elsevier B.V. All rights reserved. doi:10.1016/j.tsf.2007.03.121

Welcome message from author
This document is posted to help you gain knowledge. Please leave a comment to let me know what you think about it! Share it to your friends and learn new things together.
Transcript
007) 8455–8460www.elsevier.com/locate/tsf
Thin Solid Films 515 (2
Photoelectrochemical and photocatalytic properties oftitanium (IV) oxide nanoparticulate layers
Hana Bartkova a, Petr Kluson a,⁎, Lukas Bartek a, Martin Drobek a,Tomas Cajthaml b, Josef Krysa a
a Institute of Chemical Technology - Prague, Technicka 5, 166 28 Prague 6, Czech Republicb Institute of Microbiology, Academy of Sciences of the Czech Republic, Videnska 1083, 142 20 Prague 4, Czech Republic
Available online 1 April 2007
Abstract
Titania nanostructured particles were produced by the sol–gel method in the reverse micelle environment treated thermally and by variousextraction steps including supercritical carbon dioxide, subcritical water and their combinations. Thin films comprised of the organizednanoparticles were tested in photoelectrochemical and photocatalytic experiments. The former were configured for the open circuit potentialmeasurements and evaluation of polarization curves and the corresponding photocurrents. Photocatalytic activities of the layered films wereassessed by following decomposition of the methyl ester of stearic acid. Attention was also paid to evaluation of the extent of the surfacewettability of the layers. The effect of content of residual surface carbon, extent of hydrophilic properties and presence of anatase structure wereidentified as essential parameters responsible for the enhanced photoactivity of the tested layers. On the other hand also layers treated without anythermal steps revealed certain level of photoactivity that might be of special importance in some specific applications.© 2007 Elsevier B.V. All rights reserved.
Keywords: Sol–gel; Thin layers; Titania nanoparticles; Photocurrents; Reverse micelles
1. Introduction
Titanium (IV) oxide nanoparticles are often used as thinfilms in photocatalysis and in photoelectrochemistry. Ideally,titanium (IV) oxide is a non-conductive material, however, dueto point defects in its crystal lattice it behaves as a semicon-ductor activated by a photon flux of a wavelength (energy)corresponding to the value of the width of its forbidden bandgap (∼365 nm, UV region) [1–5].
Specifically the sol–gel method in the reverse micelle envi-ronment represents a very suitable approach for directing nano-meter scale ordering of the TiO2 particles formed by the involvedreactions [1–5]. Following the ordering process, subsequentsteps comprising removal of the organic content (micellar tem-plate) from the gel significantly affect the material's final struc-ture. In this case, either a thermal treatment could be used or thetemplate could be extracted with supercritical carbon dioxideand/or subcritical water [6–9].
⁎ Corresponding author. Tel.: +420 220 44 4158; fax: +420 220 44 4340.E-mail address: [email protected] (P. Kluson).
0040-6090/$ - see front matter © 2007 Elsevier B.V. All rights reserved.doi:10.1016/j.tsf.2007.03.121
This paper is a continuation of our recent work [9] which wasmainly focused on preparation and description of features oftitania nanoparticulate layers produced in the manner describedabove. Here we mostly report on the evaluation of photocata-lytic and photoelectrochemical properties of the nanoparticulatelayers. Photocatalytic activities of the layers were assessed bymeasuring the decomposition of the methyl ester of stearic acidunder monochromatic irradiation by light in the UV region. Inthe set of experiments described below, the open circuit poten-tial was measured in a two electrode setup. Polarization curvesand photocurrents were then obtained using the same electro-chemical cell with a modified three electrode arrangement andthe sure source of UV light. Attention was also paid to eval-uation of the extent of the layers' surface wettability.
2. Experimental
2.1. Thin films
As reported previously [9] reverse micelles of Triton X-100(Aldrich, 99.99%) in cyclohexane (Aldrich, HPLC grade) were
8456 H. Bartkova et al. / Thin Solid Films 515 (2007) 8455–8460
used for the preparation of precursor gels by means of the sol–gel method. The alkoxide used was again titanium (IV) iso-propoxide (TIOP) (Aldrich, 99.99%) and the molar ratio ofwater to surfactant to TIOP 1:1:1 was kept constant throughoutthe experiments. Layer preparation (Table 1) included repeateddip coating followed by hydrothermal extraction (SW, 373 K,10 MPa) and/or extraction with supercritical carbon dioxide(SFE) as alternatives to the thermal treatment (TT, 673 K,stream of air for 2 h, 2 °C/min). A layer was also produced bysupporting P-25 (Degussa) titania particles. The layer based onthis commercial P-25 product was formed of a mixture of rutileand anatase phases, unlike other produced layers that were onlyof the anatase phase. This film was included entirely for roughcomparison due to its frequent appearance in similar photo-catalytic and photoelectrochemical tests. Either boron-silicatemicroscope slides or F:SnO2 conductive glass sheets (SolemsFrance, sheet resistivity: 10Ω/sq) were used as supports. Detailsof these preparation methodologies are available elsewhere[9–11].
2.2. Characterization, photoelectrochemical and photocataly-tic tests
For the estimation of the particle size and for evaluation of thecrystallographic phases X-ray diffraction was used (XRD, Rich.Seifert, Co.). Absorption edge positions of thin layers wereestimated [9] from the UV-vis (Helios Unicam) spectra. Theseedges were always located within a narrow interval 340–365 nm.Ellipsometry was carried out over the range of 195–850 nm inorder to determine film thickness (Plasmos SD 2300). 3D surfaceimages were obtained on an AFM microscope (Thericroscopes)and the images were then analyzed to estimate relative surfaceroughness (rms). Adsorption measurements were carried out (N2,77 K) on Asap 2010M (Micromeritics) with 40 individual slidesfor each run. The contact angle Θ was determined on the SeeSystem 6.0 apparatus with a CCD camera and the mathematicalevaluation software using the three point method for the circlecircumscription [12]. X-ray photoelectron spectroscopy (XPS)was employed to examine surface stoichiometries of the preparedsol–gel layers (ESCA 310, Gammadata Scientia).
The open circuit potential (Eoc) was measured in a two elec-trode configuration in which the layer represented the workingelectrode with a mercury/mercury sulphate at the referenceelectrode, this exhibited a potential of 407 mV (against SHE—
Table 1Codes of the thin layers and their further use
Code Preparation mode Electrochemical/photocatalytic
L1 SW 373 K Y/YL4 SW/SFE 373 K N/YL6 TT 673 K Y/YL7 P-25 423 K N/YL8 SW/TT 673 K N/Y
Identification notes: SW—hydrothermal treatment (10MPa, 373 K); SW/SFE—hydrothermal treatment (10 MPa, 373 K), extraction with supercritical CO2
(14 MPa, 373 K); TT—thermal treatment (673 K); P-25—prepared fromaqueous suspension of P-25 (Degussa); SW/TT—hydrothermal treatment (10MPa, 373 K), thermal treatment (673 K).
standard hydrogen electrode). Polarization curves and photo-currents were then measured using the same electrochemical cellwith a modified three electrode arrangement. In this case thetitania-containing layer served again as the working electrode,mercury/mercury sulphate as the reference electrode and aplatinum sheet was used as the counter electrode. The size of theworking electrode was limited to 1 cm2 (Teflon tape) and 0.1 Msolution of Na2SO4 was used as the electrolytic environment.All polarization curves were recorded during 4s/4s intervals ofUV irradiation/dark period (intensity 2.17 mW cm−2, maximumwavelength 365 nm).
At 365 nm (corresponding light energies 3.39 eV) the valueof absorption coefficient for the thin TiO2 film was obtained as3.25.106 m−1 [13]. It means that the maximum depth to whichthe UV light can penetrate can be estimated at 1.4 μm. Amountof light absorbed by the thin film was evaluated from the Eq. (1),
I ¼ I0e�al; ð1Þ
in which l represents the penetration length and α represents theabsorption coefficient for the TiO2 film. In this way absorptionof photon flux was evaluated for films of variable thickness (e.g.,for L6-TT; 2 layers, 62%; 3 layers, 77%; 4 layers, 86%).
The open circuit potential wasmeasured using aMetexM3850D apparatus and a Heka PG-310 potentiostat generated a well-defined applied potential (rate of potential increase 50 mV s−1).The data analysis was performed by using the ScopeView™ andPotPulse™ software packages. More details on the electrochem-ical methods are given elsewhere [10,11].
The oxidation of the methyl ester of stearic acid was em-ployed [14,15] to probe photocatalytic activity. A solution ofmethylstearate (MES, 99.5%, Fluka AG, solid crystals at normaltemperature, ρ=1.007 g cm−3, M=298.51 g mol−1) in hexane(Lichrosolv, Merck), c=0.05 mol l−1, was dropped (5 μl) ontothe surface of the titania film. The layers with deposited MESwere positioned on a bench located 75 mm distant from the UVsource. It was comprised of three monochromatic lamps (Narvablacklight UVA 18B) with a nominal electrical output of 18 Wper lamps and maximum emission at 365 nm. Samples fortesting were located in a region where the photon flux intensitywas 1.6 mW cm−2. Monitoring of the progress of the pho-tocatalytic reaction included a 5-min-long extraction of sampleswith MES in sealed extraction tubes in hexane in an ultrasonicbath followed by gas chromatographic analysis of the extractedsolutions (GC Shimadzu A17, capillary column CP-SIL 8CB-MS—5% phenylpolysiloxane and 95% dimethylpolysiloxane,30 m×0.25 mm×0.25 μm). In order to quantify degradationproducts, GC-MS analysis was employed (GC-MS Shimadzu QP2010, quadruple mass detector, capillary column DB 5–5% phe-nylpolysiloxane and 95% methylpolysiloxane, 60 m×0.32 mm×1 μm). It should be noted that the geometric area of the surfacescontaining MES was identical for all the layers. Also the surfacemorphology of the films tested (AFM) was comparable withexception of the L7 sample based on the P-25 particles. It wassuccessively verified that the areas of the chromatography peaksof standards prepared by dilution of 5 μl of the initial con-centrations of MES in 900 ml of hexane were identical with thoseobtained by extraction of MES deposited (same concentrations
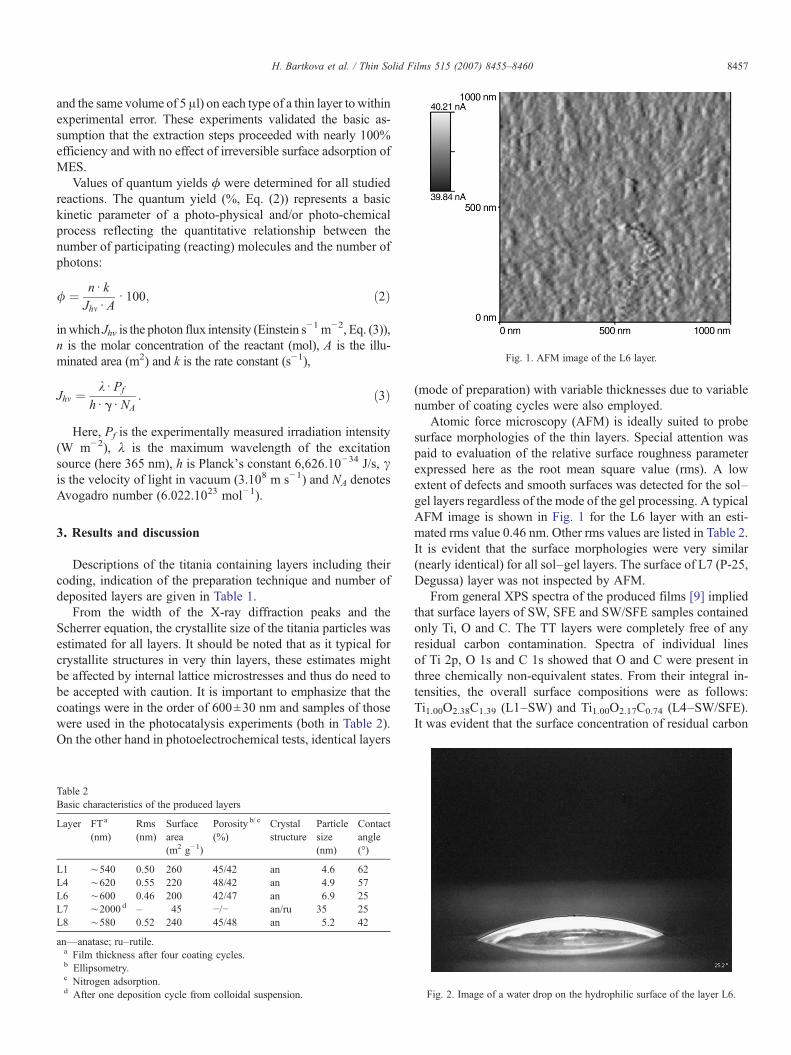
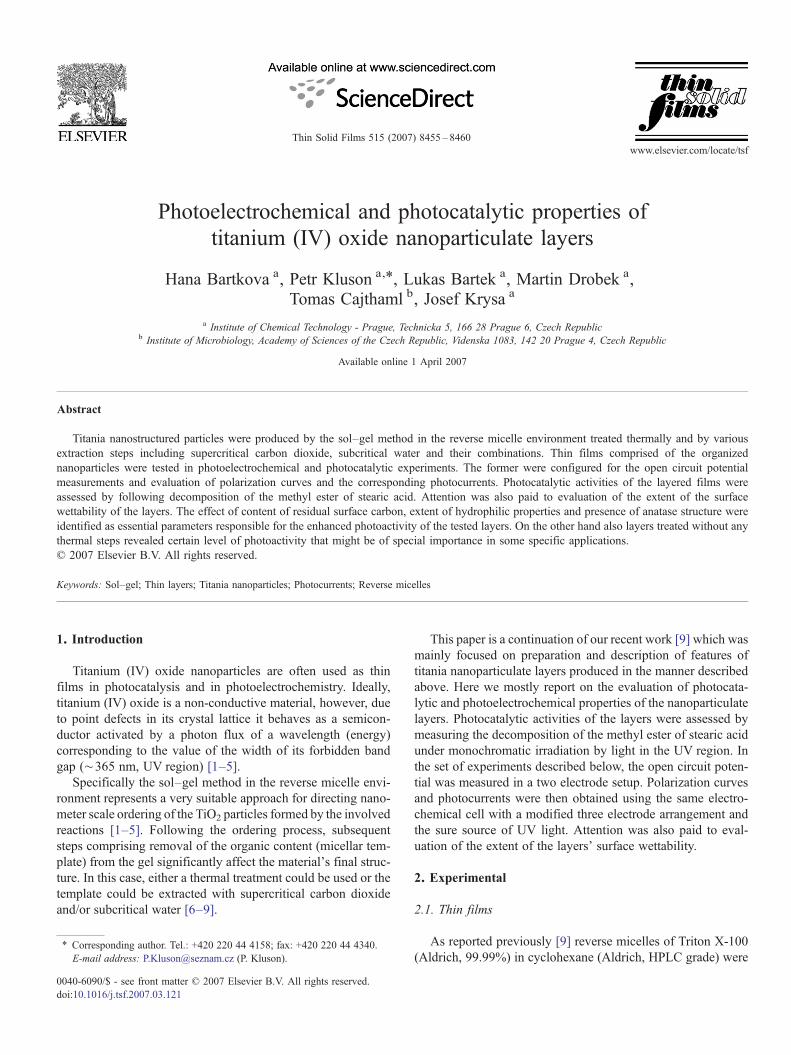
Fig. 1. AFM image of the L6 layer.
8457H. Bartkova et al. / Thin Solid Films 515 (2007) 8455–8460
and the same volume of 5 μl) on each type of a thin layer to withinexperimental error. These experiments validated the basic as-sumption that the extraction steps proceeded with nearly 100%efficiency and with no effect of irreversible surface adsorption ofMES.
Values of quantum yields ϕ were determined for all studiedreactions. The quantum yield (%, Eq. (2)) represents a basickinetic parameter of a photo-physical and/or photo-chemicalprocess reflecting the quantitative relationship between thenumber of participating (reacting) molecules and the number ofphotons:
/ ¼ nd kJhmd A
d 100; ð2Þ
in which Jhν is the photon flux intensity (Einstein s−1 m−2, Eq. (3)),
n is the molar concentration of the reactant (mol), A is the illu-minated area (m2) and k is the rate constant (s−1),
Jhm ¼ kd Pf
hd gd NA: ð3Þ
Here, Pf is the experimentally measured irradiation intensity(W m−2), λ is the maximum wavelength of the excitationsource (here 365 nm), h is Planck's constant 6,626.10−34 J/s, γis the velocity of light in vacuum (3.108 m s−1) and NA denotesAvogadro number (6.022.1023 mol−1).
3. Results and discussion
Descriptions of the titania containing layers including theircoding, indication of the preparation technique and number ofdeposited layers are given in Table 1.
From the width of the X-ray diffraction peaks and theScherrer equation, the crystallite size of the titania particles wasestimated for all layers. It should be noted that as it typical forcrystallite structures in very thin layers, these estimates mightbe affected by internal lattice microstresses and thus do need tobe accepted with caution. It is important to emphasize that thecoatings were in the order of 600±30 nm and samples of thosewere used in the photocatalysis experiments (both in Table 2).On the other hand in photoelectrochemical tests, identical layers
Table 2Basic characteristics of the produced layers
Layer FTa
(nm)Rms(nm)
Surfacearea(m2 g−1)
Porosity b/ c
(%)Crystalstructure
Particlesize(nm)
Contactangle(°)
L1 ∼540 0.50 260 45/42 an 4.6 62L4 ∼620 0.55 220 48/42 an 4.9 57L6 ∼600 0.46 200 42/47 an 6.9 25L7 ∼2000 d – 45 −/− an/ru 35 25L8 ∼580 0.52 240 45/48 an 5.2 42
an—anatase; ru–rutile.a Film thickness after four coating cycles.b Ellipsometry.c Nitrogen adsorption.d After one deposition cycle from colloidal suspension.
(mode of preparation) with variable thicknesses due to variablenumber of coating cycles were also employed.
Atomic force microscopy (AFM) is ideally suited to probesurface morphologies of the thin layers. Special attention waspaid to evaluation of the relative surface roughness parameterexpressed here as the root mean square value (rms). A lowextent of defects and smooth surfaces was detected for the sol–gel layers regardless of the mode of the gel processing. A typicalAFM image is shown in Fig. 1 for the L6 layer with an esti-mated rms value 0.46 nm. Other rms values are listed in Table 2.It is evident that the surface morphologies were very similar(nearly identical) for all sol–gel layers. The surface of L7 (P-25,Degussa) layer was not inspected by AFM.
From general XPS spectra of the produced films [9] impliedthat surface layers of SW, SFE and SW/SFE samples containedonly Ti, O and C. The TT layers were completely free of anyresidual carbon contamination. Spectra of individual linesof Ti 2p, O 1s and C 1s showed that O and C were present inthree chemically non-equivalent states. From their integral in-tensities, the overall surface compositions were as follows:Ti1.00O2.38C1.39 (L1–SW) and Ti1.00O2.17C0.74 (L4–SW/SFE).It was evident that the surface concentration of residual carbon
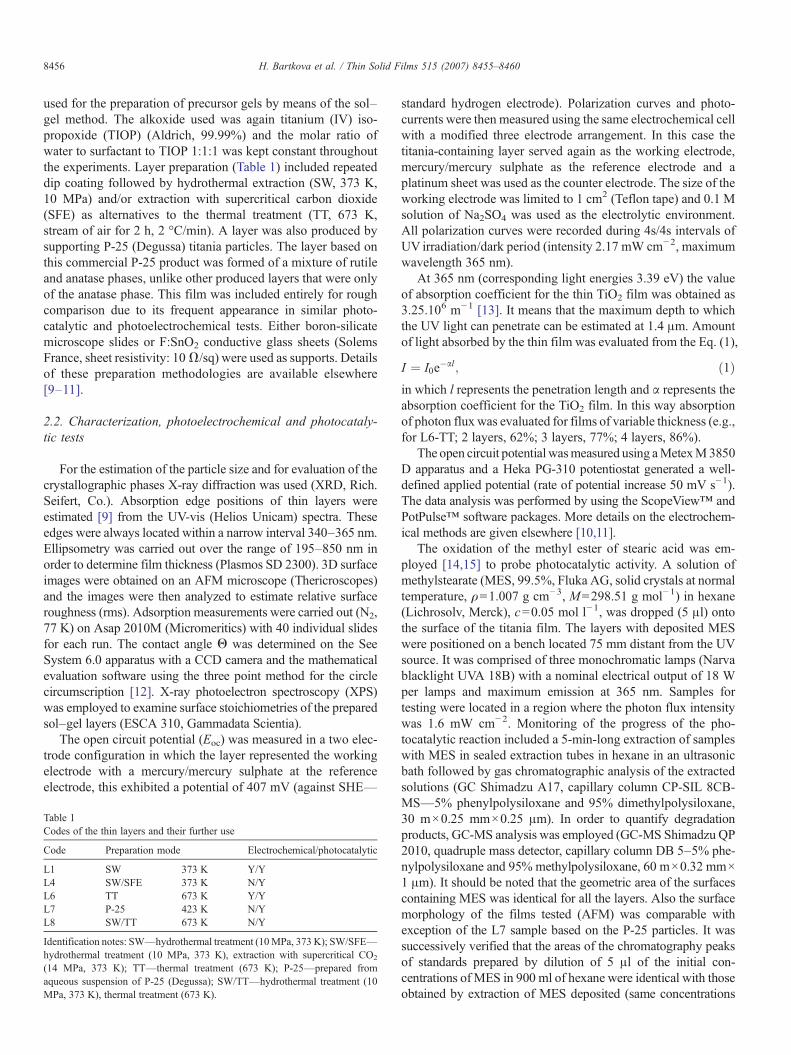
Fig. 2. Image of a water drop on the hydrophilic surface of the layer L6.
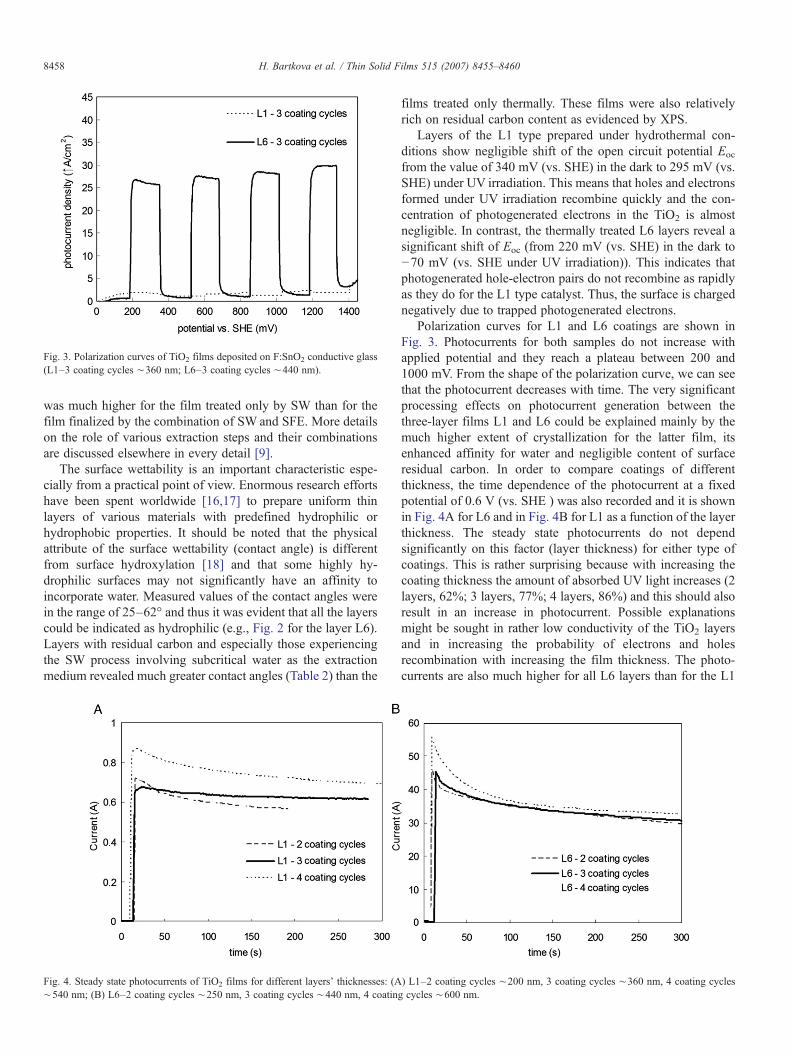
Fig. 3. Polarization curves of TiO2 films deposited on F:SnO2 conductive glass(L1–3 coating cycles ∼360 nm; L6–3 coating cycles ∼440 nm).
8458 H. Bartkova et al. / Thin Solid Films 515 (2007) 8455–8460
was much higher for the film treated only by SW than for thefilm finalized by the combination of SW and SFE. More detailson the role of various extraction steps and their combinationsare discussed elsewhere in every detail [9].
The surface wettability is an important characteristic espe-cially from a practical point of view. Enormous research effortshave been spent worldwide [16,17] to prepare uniform thinlayers of various materials with predefined hydrophilic orhydrophobic properties. It should be noted that the physicalattribute of the surface wettability (contact angle) is differentfrom surface hydroxylation [18] and that some highly hy-drophilic surfaces may not significantly have an affinity toincorporate water. Measured values of the contact angles werein the range of 25–62° and thus it was evident that all the layerscould be indicated as hydrophilic (e.g., Fig. 2 for the layer L6).Layers with residual carbon and especially those experiencingthe SW process involving subcritical water as the extractionmedium revealed much greater contact angles (Table 2) than the
Fig. 4. Steady state photocurrents of TiO2 films for different layers' thicknesses: (A∼540 nm; (B) L6–2 coating cycles ∼250 nm, 3 coating cycles ∼440 nm, 4 coatin
films treated only thermally. These films were also relativelyrich on residual carbon content as evidenced by XPS.
Layers of the L1 type prepared under hydrothermal con-ditions show negligible shift of the open circuit potential Eoc
from the value of 340 mV (vs. SHE) in the dark to 295 mV (vs.SHE) under UV irradiation. This means that holes and electronsformed under UV irradiation recombine quickly and the con-centration of photogenerated electrons in the TiO2 is almostnegligible. In contrast, the thermally treated L6 layers reveal asignificant shift of Eoc (from 220 mV (vs. SHE) in the dark to−70 mV (vs. SHE under UV irradiation)). This indicates thatphotogenerated hole-electron pairs do not recombine as rapidlyas they do for the L1 type catalyst. Thus, the surface is chargednegatively due to trapped photogenerated electrons.
Polarization curves for L1 and L6 coatings are shown inFig. 3. Photocurrents for both samples do not increase withapplied potential and they reach a plateau between 200 and1000 mV. From the shape of the polarization curve, we can seethat the photocurrent decreases with time. The very significantprocessing effects on photocurrent generation between thethree-layer films L1 and L6 could be explained mainly by themuch higher extent of crystallization for the latter film, itsenhanced affinity for water and negligible content of surfaceresidual carbon. In order to compare coatings of differentthickness, the time dependence of the photocurrent at a fixedpotential of 0.6 V (vs. SHE ) was also recorded and it is shownin Fig. 4A for L6 and in Fig. 4B for L1 as a function of the layerthickness. The steady state photocurrents do not dependsignificantly on this factor (layer thickness) for either type ofcoatings. This is rather surprising because with increasing thecoating thickness the amount of absorbed UV light increases (2layers, 62%; 3 layers, 77%; 4 layers, 86%) and this should alsoresult in an increase in photocurrent. Possible explanationsmight be sought in rather low conductivity of the TiO2 layersand in increasing the probability of electrons and holesrecombination with increasing the film thickness. The photo-currents are also much higher for all L6 layers than for the L1
) L1–2 coating cycles ∼200 nm, 3 coating cycles ∼360 nm, 4 coating cyclesg cycles ∼600 nm.
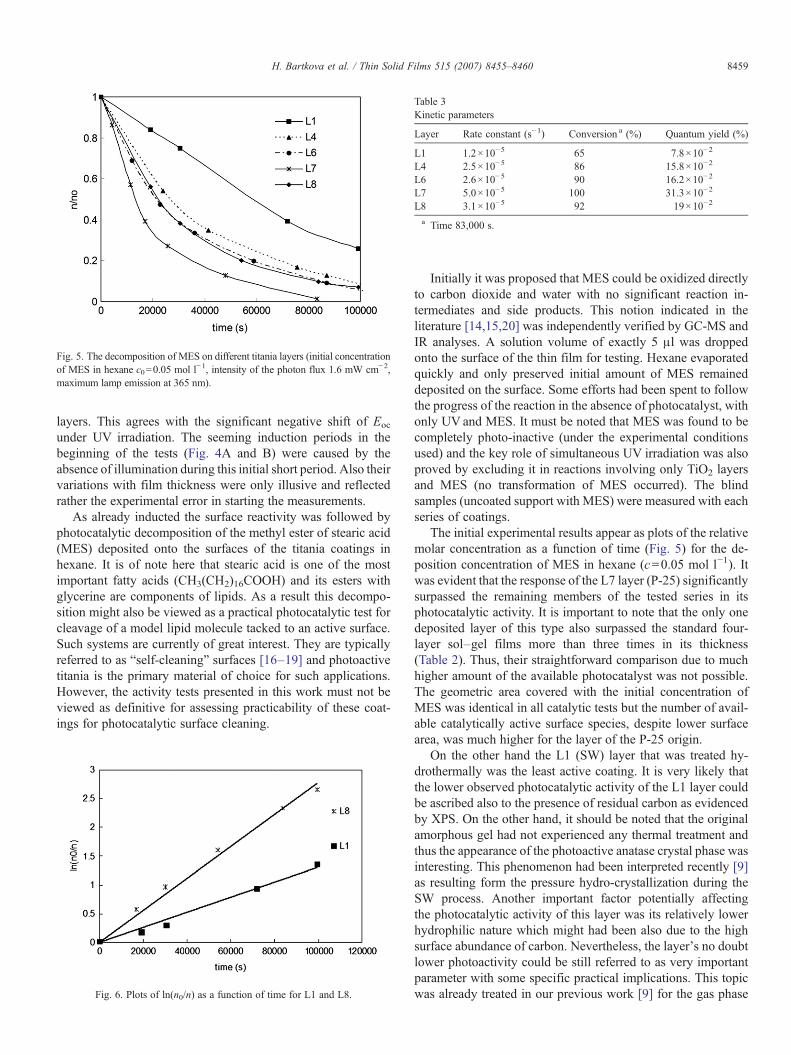
Fig. 5. The decomposition of MES on different titania layers (initial concentrationof MES in hexane c0=0.05 mol l−1, intensity of the photon flux 1.6 mW cm−2,maximum lamp emission at 365 nm).
Table 3Kinetic parameters
Layer Rate constant (s−1) Conversion a (%) Quantum yield (%)
L1 1.2×10⁻⁵ 65 7.8×10⁻²
L4 2.5×10⁻⁵ 86 15.8×10⁻²
L6 2.6×10⁻⁵ 90 16.2×10⁻²
L7 5.0×10⁻⁵ 100 31.3×10⁻²
L8 3.1×10⁻⁵ 92 19×10−2
a Time 83,000 s.
8459H. Bartkova et al. / Thin Solid Films 515 (2007) 8455–8460
layers. This agrees with the significant negative shift of Eoc
under UV irradiation. The seeming induction periods in thebeginning of the tests (Fig. 4A and B) were caused by theabsence of illumination during this initial short period. Also theirvariations with film thickness were only illusive and reflectedrather the experimental error in starting the measurements.
As already inducted the surface reactivity was followed byphotocatalytic decomposition of the methyl ester of stearic acid(MES) deposited onto the surfaces of the titania coatings inhexane. It is of note here that stearic acid is one of the mostimportant fatty acids (CH3(CH2)16COOH) and its esters withglycerine are components of lipids. As a result this decompo-sition might also be viewed as a practical photocatalytic test forcleavage of a model lipid molecule tacked to an active surface.Such systems are currently of great interest. They are typicallyreferred to as “self-cleaning” surfaces [16–19] and photoactivetitania is the primary material of choice for such applications.However, the activity tests presented in this work must not beviewed as definitive for assessing practicability of these coat-ings for photocatalytic surface cleaning.
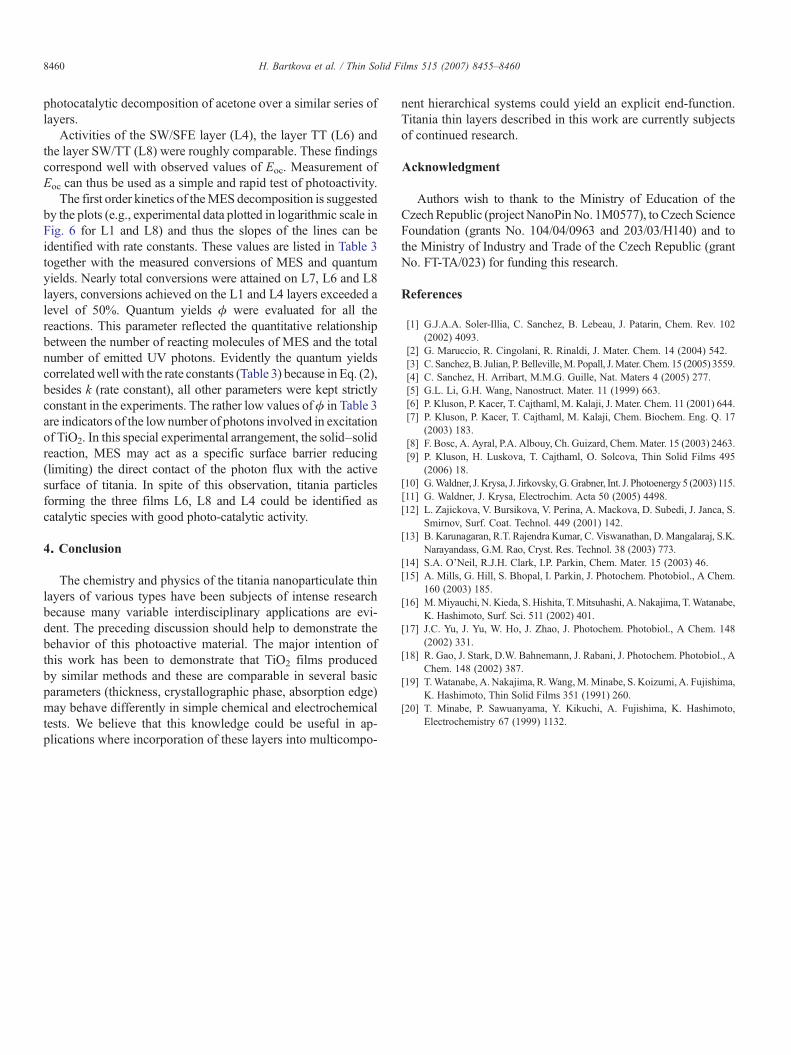
Fig. 6. Plots of ln(n0/n) as a function of time for L1 and L8.
Initially it was proposed that MES could be oxidized directlyto carbon dioxide and water with no significant reaction in-termediates and side products. This notion indicated in theliterature [14,15,20] was independently verified by GC-MS andIR analyses. A solution volume of exactly 5 μl was droppedonto the surface of the thin film for testing. Hexane evaporatedquickly and only preserved initial amount of MES remaineddeposited on the surface. Some efforts had been spent to followthe progress of the reaction in the absence of photocatalyst, withonly UV and MES. It must be noted that MES was found to becompletely photo-inactive (under the experimental conditionsused) and the key role of simultaneous UV irradiation was alsoproved by excluding it in reactions involving only TiO2 layersand MES (no transformation of MES occurred). The blindsamples (uncoated support with MES) were measured with eachseries of coatings.
The initial experimental results appear as plots of the relativemolar concentration as a function of time (Fig. 5) for the de-position concentration of MES in hexane (c=0.05 mol l−1). Itwas evident that the response of the L7 layer (P-25) significantlysurpassed the remaining members of the tested series in itsphotocatalytic activity. It is important to note that the only onedeposited layer of this type also surpassed the standard four-layer sol–gel films more than three times in its thickness(Table 2). Thus, their straightforward comparison due to muchhigher amount of the available photocatalyst was not possible.The geometric area covered with the initial concentration ofMES was identical in all catalytic tests but the number of avail-able catalytically active surface species, despite lower surfacearea, was much higher for the layer of the P-25 origin.
On the other hand the L1 (SW) layer that was treated hy-drothermally was the least active coating. It is very likely thatthe lower observed photocatalytic activity of the L1 layer couldbe ascribed also to the presence of residual carbon as evidencedby XPS. On the other hand, it should be noted that the originalamorphous gel had not experienced any thermal treatment andthus the appearance of the photoactive anatase crystal phase wasinteresting. This phenomenon had been interpreted recently [9]as resulting form the pressure hydro-crystallization during theSW process. Another important factor potentially affectingthe photocatalytic activity of this layer was its relatively lowerhydrophilic nature which might had been also due to the highsurface abundance of carbon. Nevertheless, the layer's no doubtlower photoactivity could be still referred to as very importantparameter with some specific practical implications. This topicwas already treated in our previous work [9] for the gas phase
8460 H. Bartkova et al. / Thin Solid Films 515 (2007) 8455–8460
photocatalytic decomposition of acetone over a similar series oflayers.
Activities of the SW/SFE layer (L4), the layer TT (L6) andthe layer SW/TT (L8) were roughly comparable. These findingscorrespond well with observed values of Eoc. Measurement ofEoc can thus be used as a simple and rapid test of photoactivity.
The first order kinetics of theMES decomposition is suggestedby the plots (e.g., experimental data plotted in logarithmic scale inFig. 6 for L1 and L8) and thus the slopes of the lines can beidentified with rate constants. These values are listed in Table 3together with the measured conversions of MES and quantumyields. Nearly total conversions were attained on L7, L6 and L8layers, conversions achieved on the L1 and L4 layers exceeded alevel of 50%. Quantum yields ϕ were evaluated for all thereactions. This parameter reflected the quantitative relationshipbetween the number of reacting molecules of MES and the totalnumber of emitted UV photons. Evidently the quantum yieldscorrelatedwell with the rate constants (Table 3) because in Eq. (2),besides k (rate constant), all other parameters were kept strictlyconstant in the experiments. The rather low values ofϕ in Table 3are indicators of the low number of photons involved in excitationof TiO2. In this special experimental arrangement, the solid–solidreaction, MES may act as a specific surface barrier reducing(limiting) the direct contact of the photon flux with the activesurface of titania. In spite of this observation, titania particlesforming the three films L6, L8 and L4 could be identified ascatalytic species with good photo-catalytic activity.
4. Conclusion
The chemistry and physics of the titania nanoparticulate thinlayers of various types have been subjects of intense researchbecause many variable interdisciplinary applications are evi-dent. The preceding discussion should help to demonstrate thebehavior of this photoactive material. The major intention ofthis work has been to demonstrate that TiO2 films producedby similar methods and these are comparable in several basicparameters (thickness, crystallographic phase, absorption edge)may behave differently in simple chemical and electrochemicaltests. We believe that this knowledge could be useful in ap-plications where incorporation of these layers into multicompo-
nent hierarchical systems could yield an explicit end-function.Titania thin layers described in this work are currently subjectsof continued research.
Acknowledgment
Authors wish to thank to the Ministry of Education of theCzechRepublic (projectNanoPinNo. 1M0577), to Czech ScienceFoundation (grants No. 104/04/0963 and 203/03/H140) and tothe Ministry of Industry and Trade of the Czech Republic (grantNo. FT-TA/023) for funding this research.
References
[1] G.J.A.A. Soler-Illia, C. Sanchez, B. Lebeau, J. Patarin, Chem. Rev. 102(2002) 4093.
[2] G. Maruccio, R. Cingolani, R. Rinaldi, J. Mater. Chem. 14 (2004) 542.[3] C. Sanchez, B. Julian, P. Belleville,M. Popall, J.Mater. Chem. 15 (2005) 3559.[4] C. Sanchez, H. Arribart, M.M.G. Guille, Nat. Maters 4 (2005) 277.[5] G.L. Li, G.H. Wang, Nanostruct. Mater. 11 (1999) 663.[6] P. Kluson, P. Kacer, T. Cajthaml, M. Kalaji, J. Mater. Chem. 11 (2001) 644.[7] P. Kluson, P. Kacer, T. Cajthaml, M. Kalaji, Chem. Biochem. Eng. Q. 17
(2003) 183.[8] F. Bosc, A. Ayral, P.A. Albouy, Ch. Guizard, Chem.Mater. 15 (2003) 2463.[9] P. Kluson, H. Luskova, T. Cajthaml, O. Solcova, Thin Solid Films 495
(2006) 18.[10] G.Waldner, J.Krysa, J. Jirkovsky,G.Grabner, Int. J. Photoenergy 5 (2003) 115.[11] G. Waldner, J. Krysa, Electrochim. Acta 50 (2005) 4498.[12] L. Zajickova, V. Bursikova, V. Perina, A. Mackova, D. Subedi, J. Janca, S.
Smirnov, Surf. Coat. Technol. 449 (2001) 142.[13] B. Karunagaran, R.T. Rajendra Kumar, C. Viswanathan, D.Mangalaraj, S.K.
Narayandass, G.M. Rao, Cryst. Res. Technol. 38 (2003) 773.[14] S.A. O'Neil, R.J.H. Clark, I.P. Parkin, Chem. Mater. 15 (2003) 46.[15] A. Mills, G. Hill, S. Bhopal, I. Parkin, J. Photochem. Photobiol., A Chem.
160 (2003) 185.[16] M.Miyauchi, N. Kieda, S. Hishita, T.Mitsuhashi, A. Nakajima, T.Watanabe,
K. Hashimoto, Surf. Sci. 511 (2002) 401.[17] J.C. Yu, J. Yu, W. Ho, J. Zhao, J. Photochem. Photobiol., A Chem. 148
(2002) 331.[18] R. Gao, J. Stark, D.W. Bahnemann, J. Rabani, J. Photochem. Photobiol., A
Chem. 148 (2002) 387.[19] T.Watanabe, A. Nakajima, R.Wang,M.Minabe, S. Koizumi, A. Fujishima,
K. Hashimoto, Thin Solid Films 351 (1991) 260.[20] T. Minabe, P. Sawuanyama, Y. Kikuchi, A. Fujishima, K. Hashimoto,
Electrochemistry 67 (1999) 1132.
Related Documents