Phosphorylation and Subcellular Localization of p27Kip1 Regulated by Hydrogen Peroxide Modulation in Cancer Cells Irene L. Iban ˜ ez 1,2 *, Candelaria Bracalente 1,2 , Cintia Notcovich 1 , Ivanna Tropper 3 , Beatriz L. Molinari 2,4 , Lucı´a L. Policastro 1,2 , Hebe Dura ´n 1,2,3 * 1 Departamento de Micro y Nanotecnologı ´a, Comisio ´ n Nacional de Energı ´a Ato ´ mica, San Martı ´n, Argentina, 2 Consejo Nacional de Investigaciones Cientı ´ficas y Te ´ cnicas, Buenos Aires, Argentina, 3 Escuela de Ciencia y Tecnologı ´a, Universidad Nacional de San Martı ´n, San Martı ´n, Argentina, 4 Departamento de Radiobiologı ´a, Comisio ´n Nacional de Energı ´a Ato ´ mica, San Martı ´n, Argentina Abstract The Cyclin-dependent kinase inhibitor 1B (p27Kip1) is a key protein in the decision between proliferation and cell cycle exit. Quiescent cells show nuclear p27Kip1, but this protein is exported to the cytoplasm in response to proliferating signals. We recently reported that catalase treatment increases the levels of p27Kip1 in vitro and in vivo in a murine model. In order to characterize and broaden these findings, we evaluated the regulation of p27Kip1 by hydrogen peroxide (H 2 O 2 ) in human melanoma cells and melanocytes. We observed a high percentage of p27Kip1 positive nuclei in melanoma cells overexpressing or treated with exogenous catalase, while non-treated controls showed a cytoplasmic localization of p27Kip1. Then we studied the levels of p27Kip1 phosphorylated (p27p) at serine 10 (S10) and at threonine 198 (T198) because phosphorylation at these sites enables nuclear exportation of this protein, leading to accumulation and stabilization of p27pT198 in the cytoplasm. We demonstrated by western blot a decrease in p27pS10 and p27pT198 levels in response to H 2 O 2 removal in melanoma cells, associated with nuclear p27Kip1. Melanocytes also exhibited nuclear p27Kip1 and lower levels of p27pS10 and p27pT198 than melanoma cells, which showed cytoplasmic p27Kip1. We also showed that the addition of H 2 O 2 (0.1 mM) to melanoma cells arrested in G1 by serum starvation induces proliferation and increases the levels of p27pS10 and p27pT198 leading to cytoplasmic localization of p27Kip1. Nuclear localization and post- translational modifications of p27Kip1 were also demonstrated by catalase treatment of colorectal carcinoma and neuroblastoma cells, extending our findings to these other human cancer types. In conclusion, we showed in the present work that H 2 O 2 scavenging prevents nuclear exportation of p27Kip1, allowing cell cycle arrest, suggesting that cancer cells take advantage of their intrinsic pro-oxidant state to favor cytoplasmic localization of p27Kip1. Citation: Iban ˜ ez IL, Bracalente C, Notcovich C, Tropper I, Molinari BL, et al. (2012) Phosphorylation and Subcellular Localization of p27Kip1 Regulated by Hydrogen Peroxide Modulation in Cancer Cells. PLoS ONE 7(9): e44502. doi:10.1371/journal.pone.0044502 Editor: Salvatore V. Pizzo, Duke University Medical Center, United States of America Received January 26, 2012; Accepted August 8, 2012; Published September 6, 2012 Copyright: ß 2012 Iban ˜ ez et al. This is an open-access article distributed under the terms of the Creative Commons Attribution License, which permits unrestricted use, distribution, and reproduction in any medium, provided the original author and source are credited. Funding: This work was partially supported by grants from the National Agency for Scientific and Technological Promotion (ANPCyT), Argentina (PICT 2007- 01628 and PICT 05-14330) and the non-profit organization Fundacio ´ n Florencio Fiorini. No additional external funding was received for this study. The funders had no role in study design, data collection and analysis, decision to publish, or preparation of the manuscript. Competing Interests: The authors have declared that no competing interests exist. * E-mail: [email protected] (ILI); [email protected] (HD) Introduction Cell cycle progression pathways are the endpoint of signaling cascades implicated in cell growth and cell proliferation. Cell cycle is tightly coordinated by sequential assembly and activation of phase- specific protein kinase complexes [1,2], formed by cyclins and cyclin-dependent kinases (CDKs), which are also regulated by the INK4 proteins and the CDK inhibitors (CDKIs). D-type cyclins are expressed throughout the cycle in response to mitogen stimulation [2]. Cyclin D-CDK4 and cyclin E-CDK2 complexes are required for the passage from G1 to S phase. The CDKI 1B (CDKN1B), also known as p27Kip1, was first identified as a critical negative regulator of CDK2 and G1/S cell cycle progression [2,3]. The levels of this CDKI are high in quiescent cells, fall in response to mitogenic stimulation, remain at threshold levels in proliferating cells, and increase again when mitogens are withdrawn [2]. In recent years, it was found that p27Kip1 is involved in the regulation of other processes such as cell migration [4] along with cell proliferation, differentiation and apoptosis [5]. Interestingly, this protein can exert both positive and negative functions on these processes [5]. The activities of p27Kip1 are controlled by its concentration, subcellular localization and phosphorylation status [5]. For example, the phosphorylation of p27Kip1 at serine 10 (S10) mediates p27Kip1 exportation to the cytoplasm [6–9], the phosphorylation at threonine 198 (T198) stabilizes the protein in the cytoplasm and increases p27Kip1-dependent cell motility [4] and the phosphorylation at threonine 187 (T187) points p27Kip1 as a target for proteolysis by polyubiquitination [9–11]. The phosphorylation of other sites of the protein impairs nuclear import of p27Kip1 and enhances the assembly of cyclin D1- CDK4 complex [9,12–15] or initiates the transition of p27Kip1 from inhibitor of cyclin E-CDK2 to substrate for proteolysis [16,17]. Alterations in p27Kip1 phosphorylation could lead to loss of stability, aberrant function or mislocalization of the protein which, in turn, could contribute to oncogenesis [5,9]. In this sense, PLOS ONE | www.plosone.org 1 September 2012 | Volume 7 | Issue 9 | e44502

Welcome message from author
This document is posted to help you gain knowledge. Please leave a comment to let me know what you think about it! Share it to your friends and learn new things together.
Transcript
Phosphorylation and Subcellular Localization of p27Kip1Regulated by Hydrogen Peroxide Modulation in CancerCellsIrene L. Ibanez1,2*, Candelaria Bracalente1,2, Cintia Notcovich1, Ivanna Tropper3, Beatriz L. Molinari2,4,
Lucıa L. Policastro1,2, Hebe Duran1,2,3*
1 Departamento de Micro y Nanotecnologıa, Comision Nacional de Energıa Atomica, San Martın, Argentina, 2 Consejo Nacional de Investigaciones Cientıficas y Tecnicas,
Buenos Aires, Argentina, 3 Escuela de Ciencia y Tecnologıa, Universidad Nacional de San Martın, San Martın, Argentina, 4 Departamento de Radiobiologıa, Comision
Nacional de Energıa Atomica, San Martın, Argentina
Abstract
The Cyclin-dependent kinase inhibitor 1B (p27Kip1) is a key protein in the decision between proliferation and cell cycle exit.Quiescent cells show nuclear p27Kip1, but this protein is exported to the cytoplasm in response to proliferating signals. Werecently reported that catalase treatment increases the levels of p27Kip1 in vitro and in vivo in a murine model. In order tocharacterize and broaden these findings, we evaluated the regulation of p27Kip1 by hydrogen peroxide (H2O2) in humanmelanoma cells and melanocytes. We observed a high percentage of p27Kip1 positive nuclei in melanoma cellsoverexpressing or treated with exogenous catalase, while non-treated controls showed a cytoplasmic localization ofp27Kip1. Then we studied the levels of p27Kip1 phosphorylated (p27p) at serine 10 (S10) and at threonine 198 (T198)because phosphorylation at these sites enables nuclear exportation of this protein, leading to accumulation andstabilization of p27pT198 in the cytoplasm. We demonstrated by western blot a decrease in p27pS10 and p27pT198 levelsin response to H2O2 removal in melanoma cells, associated with nuclear p27Kip1. Melanocytes also exhibited nuclearp27Kip1 and lower levels of p27pS10 and p27pT198 than melanoma cells, which showed cytoplasmic p27Kip1. We alsoshowed that the addition of H2O2 (0.1 mM) to melanoma cells arrested in G1 by serum starvation induces proliferation andincreases the levels of p27pS10 and p27pT198 leading to cytoplasmic localization of p27Kip1. Nuclear localization and post-translational modifications of p27Kip1 were also demonstrated by catalase treatment of colorectal carcinoma andneuroblastoma cells, extending our findings to these other human cancer types. In conclusion, we showed in the presentwork that H2O2 scavenging prevents nuclear exportation of p27Kip1, allowing cell cycle arrest, suggesting that cancer cellstake advantage of their intrinsic pro-oxidant state to favor cytoplasmic localization of p27Kip1.
Citation: Ibanez IL, Bracalente C, Notcovich C, Tropper I, Molinari BL, et al. (2012) Phosphorylation and Subcellular Localization of p27Kip1 Regulated byHydrogen Peroxide Modulation in Cancer Cells. PLoS ONE 7(9): e44502. doi:10.1371/journal.pone.0044502
Editor: Salvatore V. Pizzo, Duke University Medical Center, United States of America
Received January 26, 2012; Accepted August 8, 2012; Published September 6, 2012
Copyright: � 2012 Ibanez et al. This is an open-access article distributed under the terms of the Creative Commons Attribution License, which permitsunrestricted use, distribution, and reproduction in any medium, provided the original author and source are credited.
Funding: This work was partially supported by grants from the National Agency for Scientific and Technological Promotion (ANPCyT), Argentina (PICT 2007-01628 and PICT 05-14330) and the non-profit organization Fundacion Florencio Fiorini. No additional external funding was received for this study. The fundershad no role in study design, data collection and analysis, decision to publish, or preparation of the manuscript.
Competing Interests: The authors have declared that no competing interests exist.
* E-mail: [email protected] (ILI); [email protected] (HD)
Introduction
Cell cycle progression pathways are the endpoint of signaling
cascades implicated in cell growth and cell proliferation. Cell cycle is
tightly coordinated by sequential assembly and activation of phase-
specific protein kinase complexes [1,2], formed by cyclins and
cyclin-dependent kinases (CDKs), which are also regulated by the
INK4 proteins and the CDK inhibitors (CDKIs). D-type cyclins are
expressed throughout the cycle in response to mitogen stimulation
[2]. Cyclin D-CDK4 and cyclin E-CDK2 complexes are required
for the passage from G1 to S phase. The CDKI 1B (CDKN1B), also
known as p27Kip1, was first identified as a critical negative
regulator of CDK2 and G1/S cell cycle progression [2,3]. The
levels of this CDKI are high in quiescent cells, fall in response to
mitogenic stimulation, remain at threshold levels in proliferating
cells, and increase again when mitogens are withdrawn [2].
In recent years, it was found that p27Kip1 is involved in the
regulation of other processes such as cell migration [4] along with
cell proliferation, differentiation and apoptosis [5]. Interestingly,
this protein can exert both positive and negative functions on these
processes [5]. The activities of p27Kip1 are controlled by its
concentration, subcellular localization and phosphorylation status
[5]. For example, the phosphorylation of p27Kip1 at serine 10
(S10) mediates p27Kip1 exportation to the cytoplasm [6–9], the
phosphorylation at threonine 198 (T198) stabilizes the protein in
the cytoplasm and increases p27Kip1-dependent cell motility [4]
and the phosphorylation at threonine 187 (T187) points p27Kip1
as a target for proteolysis by polyubiquitination [9–11]. The
phosphorylation of other sites of the protein impairs nuclear
import of p27Kip1 and enhances the assembly of cyclin D1-
CDK4 complex [9,12–15] or initiates the transition of p27Kip1
from inhibitor of cyclin E-CDK2 to substrate for proteolysis
[16,17]. Alterations in p27Kip1 phosphorylation could lead to loss
of stability, aberrant function or mislocalization of the protein
which, in turn, could contribute to oncogenesis [5,9]. In this sense,
PLOS ONE | www.plosone.org 1 September 2012 | Volume 7 | Issue 9 | e44502

both loss of nuclear p27Kip1 and its cytoplasmic localization have
been proposed as prognostic marker for melanoma progression
and worse clinical outcome [18].
Extracellular Environment can Initiate Cell Cycle Divisionor Arrest by Activating or Deactivating Cyclin-CDKComplexes through Different Pathways
Reactive oxygen species (ROS) are capable of exerting different
effects on the cells according to their nature, localization and levels
[19]. Particularly, many types of mammalian cells can increase their
growth when exposed to moderate levels of hydrogen peroxide
(H2O2) and can induce apoptosis [20], terminal differentiation [21]
or cytotoxicity [20] if exposed to high levels of H2O2. Scavenging of
H2O2 in tumor cells either treated with exogenous catalase or
expressing transfected catalase inhibits cell proliferation [22–25]. It
is well documented that H2O2 is involved in signal transduction
pathways [26,27], e.g. increased levels of H2O2 induce mitogenic
signals, such as those related to Ras/extracellular signal-regulated
kinases 1 and 2 (ERK1/2) pathway, and stress-responsive signals,
such as those related to c-Jun N-terminal kinases (JNKs) and p38
mitogen-activated protein kinase (MAPK) pathways [26–28].
Moreover, ROS, and in particular H2O2, were also implied in
the modulation of receptor tyrosine kinases (RTK) [29] and
phosphatidylinositol 3-kinase (PI3K)/AKT [30] pathways.
It has been reported that fluctuations observed in the
intracellular redox state during cell cycle progression could link
oxidative metabolic processes to cell cycle regulation [31,32].
H2O2 fluctuations along the cell cycle were associated with the
regulation of cyclin D1 expression [33]. In contrast, removal of
endogenous H2O2 by overexpression of catalase and glutathione
peroxidase induces G0/G1 arrest [25] and decreases cell DNA
synthesis [34]. A recent study of our laboratory showed increased
levels of p27Kip1 in response to catalase treatment in a murine
model of squamous cell carcinoma in vitro and in vivo [35].
However, the mechanisms involved in this cell cycle protein
regulation by H2O2 have not been fully understood. Considering
that p27Kip1 was proposed as a prognostic biomarker for human
melanoma [18] and that these tumors exhibited a pro-oxidant
behavior due to an imbalance in the antioxidant system [36,37]
and to the melanin deregulation [38], human melanoma cells
become an interesting model in order to broaden our previous
results on H2O2 regulation of p27Kip1.
The aim of the present study was to evaluate the effects of the
modulation of H2O2 levels on G1/S transition and, in particular,
on the regulation of the CDKI protein, p27Kip1, in human
melanoma and melanocyte cell lines. We demonstrated the
intracellular relocalization of p27Kip1 after catalase or H2O2
treatments. This was associated with variations on the levels of
phosphorylated p27Kip1 at S10 (p27pS10) and T198 (p27pT198),
which play an important role in the regulation of the subcellular
localization of this protein. Results on p27Kip1 modulation were
extended to other human cancer cell types, colorectal carcinoma
and neuroblastoma cells. Our findings can provide a clue to
understand the effect of H2O2 on the modulation of a key
regulatory protein of G1/S transition with the consequent effect
on cell cycle and cell proliferation.
Results
Catalase Treatment Inhibits Melanoma Cell Proliferationby G1 Arrest
It has been suggested that cells with a permanent oxidative shift
in the redox status may undergo continuous proliferation that
could, in turn, be a crucial event in the appearance of the
malignant phenotype [23,39]. In this sense, the production of large
amounts of ROS and, in particular, H2O2, was reported in tumor
cell lines [23,40]. Catalase is an antioxidant enzyme that
decomposes H2O2 in water and oxygen. Taking into account
that H2O2 can diffuse across membranes, the addition of catalase
to the culture medium could produce a decrease in the
intracellular level of H2O2 reaching a corresponding lower steady
state concentration inside and outside the cell [26,33,35]. We
validated our model of melanoma cells treated with catalase added
to the culture medium by measuring the decrease in the levels of
ROS through 29, 79-dichlorodihydro-fluorescein diacetate
(DCFH-DA) assay (Figures 1A and 1B). This decrease in ROS
levels induced by catalase resulted in a significant inhibition
(p,0.01) of cell proliferation (Figure 2A). Moreover, A375 cells
overexpressing catalase (A375-CAT-E9) displayed low rate of cell
proliferation as compared with control cells (Figure 2B). This
clone, A375-CAT-E9, showed the lowest intracellular ROS levels
of the stable geneticin-resistant clones generated (Figure S1A) and
a significant decrease in these levels as compared to cells
transfected with an empty plasmid (A375-pcDNA3) or non-
transfected (A375 control) (Figures 1C and 1D). These results
agree with the higher levels of catalase expression and activity
observed in A375-CAT-E9 as compared with control cells (Figure
S1B and S1C).
In order to evaluate non-tumor and tumor cells in association
with their intracellular ROS levels, we analyzed melanocytes vs.
melanoma cells. Figure 2C shows the proliferation rate of PIG-1
melanocytes in comparison to A375 melanoma cells. We
confirmed that tumor cells exhibited higher intracellular levels of
ROS than their non-tumor counterpart in this melanoma/
melanocyte model (Figures 1E and 1F). No significant differences
in the levels of ROS and in the proliferation rate (Figure S2) were
observed between non treated and heat-inactivated catalase
treated cells in the melanoma model. Thus, heat-inactivated
catalase was used as control.
A significant G1 cell cycle arrest was found associated with the
inhibition of cell proliferation in melanoma cells treated with
catalase for 24 h (Figures 2D and 2E). Analogous results were
observed for A375-CAT-E9 vs. A375-pcDNA3 or A375 control
cells (Figures 2F and 2G). Melanocytes showed higher percentage
of cells in G1 phase and a lower percentage in S phase than
melanoma cells (Figures 2H and 2I).
Regarding the levels of the cyclins and CDKs involved in G1/S
transition, cyclin D1, cyclin E, CDK4 and CDK2, evaluated by
western blot, a significant decrease in cyclin D1 levels was
observed after H2O2 removal by catalase treatment or catalase
overexpression (Figure S3), in agreement with previous findings
[35,41].
Moreover, the signal for cyclin D1 detected by immunofluo-
rescence was extremely low in the nucleus of cells treated with
catalase and a significant decrease of the percentage of positive
nuclei was found in these cells as compared with control cells
(Figure S4). Melanoma cells exhibited higher amount of both
cyclin D1 levels and the percentage of positive nuclei for cyclin D1,
assessed by western blot and immunofluorescence than their non-
tumor counterpart PIG-1 (Figure S3 and S4), which would be
related to the increased levels of ROS and the percentage of A375
cells in S phase. No significant differences in cyclin E, CDK2 and
CDK4 levels were observed between catalase-treated and control
cells and between non-tumor and tumor cells (Figure S3). Thus,
the decrease in cyclin D1 levels observed would be involved in
G1/S arrest induced by catalase in A375 cells.
Regulation of p27Kip1 by H2O2 Modulation
PLOS ONE | www.plosone.org 2 September 2012 | Volume 7 | Issue 9 | e44502

Regulation of p27Kip1 by H2O2 Modulation
PLOS ONE | www.plosone.org 3 September 2012 | Volume 7 | Issue 9 | e44502
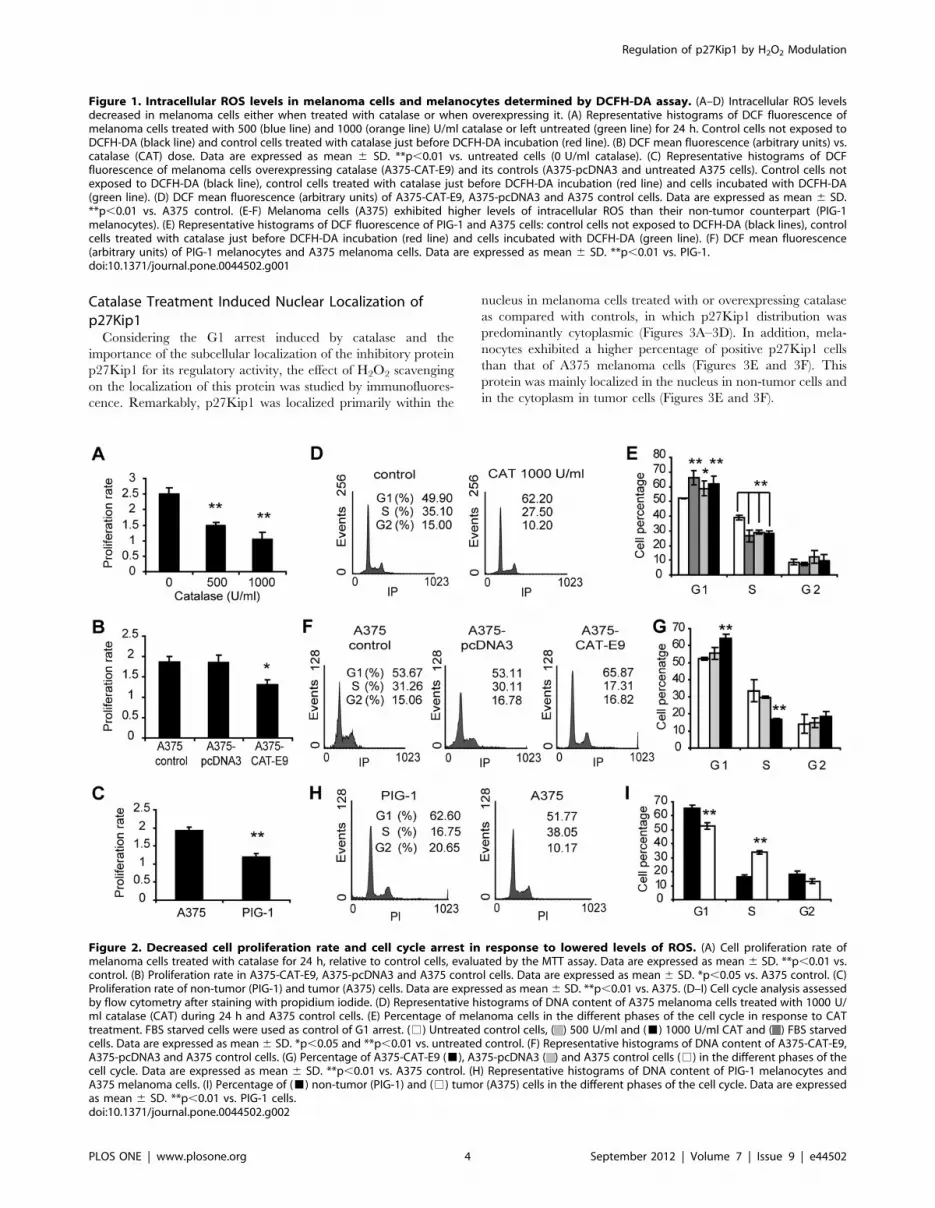
Catalase Treatment Induced Nuclear Localization ofp27Kip1
Considering the G1 arrest induced by catalase and the
importance of the subcellular localization of the inhibitory protein
p27Kip1 for its regulatory activity, the effect of H2O2 scavenging
on the localization of this protein was studied by immunofluores-
cence. Remarkably, p27Kip1 was localized primarily within the
nucleus in melanoma cells treated with or overexpressing catalase
as compared with controls, in which p27Kip1 distribution was
predominantly cytoplasmic (Figures 3A–3D). In addition, mela-
nocytes exhibited a higher percentage of positive p27Kip1 cells
than that of A375 melanoma cells (Figures 3E and 3F). This
protein was mainly localized in the nucleus in non-tumor cells and
in the cytoplasm in tumor cells (Figures 3E and 3F).
Figure 1. Intracellular ROS levels in melanoma cells and melanocytes determined by DCFH-DA assay. (A–D) Intracellular ROS levelsdecreased in melanoma cells either when treated with catalase or when overexpressing it. (A) Representative histograms of DCF fluorescence ofmelanoma cells treated with 500 (blue line) and 1000 (orange line) U/ml catalase or left untreated (green line) for 24 h. Control cells not exposed toDCFH-DA (black line) and control cells treated with catalase just before DCFH-DA incubation (red line). (B) DCF mean fluorescence (arbitrary units) vs.catalase (CAT) dose. Data are expressed as mean 6 SD. **p,0.01 vs. untreated cells (0 U/ml catalase). (C) Representative histograms of DCFfluorescence of melanoma cells overexpressing catalase (A375-CAT-E9) and its controls (A375-pcDNA3 and untreated A375 cells). Control cells notexposed to DCFH-DA (black line), control cells treated with catalase just before DCFH-DA incubation (red line) and cells incubated with DCFH-DA(green line). (D) DCF mean fluorescence (arbitrary units) of A375-CAT-E9, A375-pcDNA3 and A375 control cells. Data are expressed as mean 6 SD.**p,0.01 vs. A375 control. (E-F) Melanoma cells (A375) exhibited higher levels of intracellular ROS than their non-tumor counterpart (PIG-1melanocytes). (E) Representative histograms of DCF fluorescence of PIG-1 and A375 cells: control cells not exposed to DCFH-DA (black lines), controlcells treated with catalase just before DCFH-DA incubation (red line) and cells incubated with DCFH-DA (green line). (F) DCF mean fluorescence(arbitrary units) of PIG-1 melanocytes and A375 melanoma cells. Data are expressed as mean 6 SD. **p,0.01 vs. PIG-1.doi:10.1371/journal.pone.0044502.g001
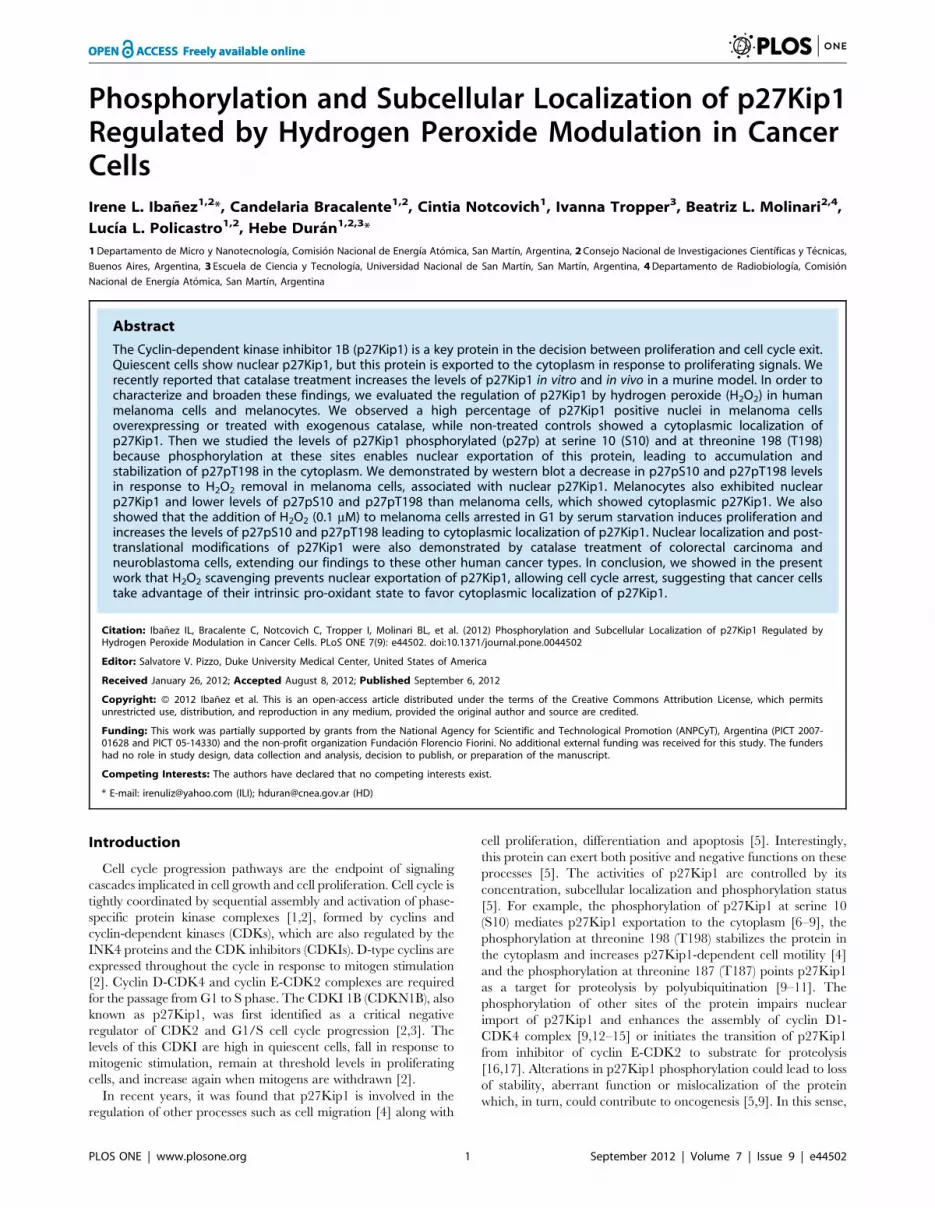
Figure 2. Decreased cell proliferation rate and cell cycle arrest in response to lowered levels of ROS. (A) Cell proliferation rate ofmelanoma cells treated with catalase for 24 h, relative to control cells, evaluated by the MTT assay. Data are expressed as mean 6 SD. **p,0.01 vs.control. (B) Proliferation rate in A375-CAT-E9, A375-pcDNA3 and A375 control cells. Data are expressed as mean 6 SD. *p,0.05 vs. A375 control. (C)Proliferation rate of non-tumor (PIG-1) and tumor (A375) cells. Data are expressed as mean 6 SD. **p,0.01 vs. A375. (D–I) Cell cycle analysis assessedby flow cytometry after staining with propidium iodide. (D) Representative histograms of DNA content of A375 melanoma cells treated with 1000 U/ml catalase (CAT) during 24 h and A375 control cells. (E) Percentage of melanoma cells in the different phases of the cell cycle in response to CATtreatment. FBS starved cells were used as control of G1 arrest. (%) Untreated control cells, ( ) 500 U/ml and (&) 1000 U/ml CAT and ( ) FBS starvedcells. Data are expressed as mean 6 SD. *p,0.05 and **p,0.01 vs. untreated control. (F) Representative histograms of DNA content of A375-CAT-E9,A375-pcDNA3 and A375 control cells. (G) Percentage of A375-CAT-E9 (&), A375-pcDNA3 ( ) and A375 control cells (%) in the different phases of thecell cycle. Data are expressed as mean 6 SD. **p,0.01 vs. A375 control. (H) Representative histograms of DNA content of PIG-1 melanocytes andA375 melanoma cells. (I) Percentage of (&) non-tumor (PIG-1) and (%) tumor (A375) cells in the different phases of the cell cycle. Data are expressedas mean 6 SD. **p,0.01 vs. PIG-1 cells.doi:10.1371/journal.pone.0044502.g002
Regulation of p27Kip1 by H2O2 Modulation
PLOS ONE | www.plosone.org 4 September 2012 | Volume 7 | Issue 9 | e44502

Figure 3. Nuclear localization of p27Kip1 in response to H2O2 scavenging and intrinsic low levels of H2O2. (A-F) Subcellular localizationof p27Kip1 evaluated by immunocytofluorescence. (A–B) Melanoma cells treated with 500 and 1000 U/ml catalase (CAT) for periods of 6 or 24 h orleft untreated. FBS starved cells were used as control of G1 arrest. (C–D) Catalase overexpression model (A375-CAT-E9 cells) vs. controls (A375-pcDNA3 and A375 control cells). (E-F) Non-tumor (PIG-1) vs. tumor (A375) cells. (A, C and E) Representative images of p27Kip1immunocytofluorescence showing the subcellular localization of the protein. DAPI: staining of nuclear DNA; p27Kip1: FITC staining of p27Kip1protein. (B, D and F) Percentage of positive (%) cytoplasms and positive (&) nuclei for p27Kip1 relative to the total number of counted cells. Data areexpressed as mean 6 SD. (B) **p,0.01 vs. control. (D) *p,0.05 and **p,0.01 vs. A375 control. (F) *p,0.05 and **p,0.01 vs. non-tumor cells. (G–H)Increased expression of nuclear p27Kip1 in A375 cells after 1000 U/ml catalase (CAT) treatment as compared with control A375 cells (treated with1000 U/ml heat-inactivated catalase, IN-CAT) for 24 h, detected by western blot of nuclear and cytosolic extracts (see Methods). (G) Representativeimmunoblot images are shown. C: Cytoplasmic extracts; N: Nuclear extracts. Actin and Ku-70 densitometric values were used to standardize forcytoplasmic and nuclear protein loading, respectively. (H) Relative densitometric values of (%) cytoplasmic and (&) nuclear p27Kip1 levels. Resultsare referred to control cells. Data are expressed as mean 6 SD. *p,0.05 vs. control.doi:10.1371/journal.pone.0044502.g003
Regulation of p27Kip1 by H2O2 Modulation
PLOS ONE | www.plosone.org 5 September 2012 | Volume 7 | Issue 9 | e44502
In order to confirm the effects of H2O2 scavenging on p27Kip1
localization observed by immunofluorescence, the levels of this
protein in nuclear and cytosolic extracts of melanoma cells treated
with catalase were evaluated by western blot. We demonstrated a
significant increase of p27Kip1 levels in nuclear extracts of cells
treated with catalase as compared with control (Figure 3G and
3H).
These results demonstrate the modulation of the intracellular
localization of p27Kip1 in the regulation of cell proliferation by
catalase and confirm our previous findings [35], extending those
results to human A375 cells. The persistence of p27Kip1 in the
nucleus induced by H2O2 removal would favor the blockage of cell
cycle at G1/S transition.
H2O2 Modulation Leads to Post-translationalModifications of p27Kip1
We also demonstrated a significant increase in the total levels of
p27Kip1 in response to catalase treatment or overexpression
assessed by western blot (Figure 4). This could be related to the
high levels of p27Kip1 observed in the nucleus of catalase treated
cells (Figure 3E). Moreover melanoma cells exhibited lower levels
of this inhibitory protein as compared to melanocytes (Figure 4).
Regarding western blot (Figure 4) and immunofluorescence
(Figure 3) results and considering that p27Kip1 levels, function
and localization are regulated by phosphorylations, the levels of
p27Kip1 phosphorylated at S10 (p27pS10), T198 (p27pT198) and
T187 (p27pT187) in response to H2O2 scavenging were evaluated
by western blot. The phosphorylation of p27Kip1 at S10 and
T198 is a key event for nuclear exportation of this protein and
progression of cell cycle and we demonstrated a significant
decrease in the levels of p27pS10 and p27pT198 in cells
overexpressing or treated with catalase as compared with controls
(Figure 4). Furthermore, PIG-1 melanocytes revealed lower levels
of p27pS10 and p27pT198 than their tumor counterpart
(Figure 4).
These findings suggest that reduced levels of H2O2 by catalase
prevent the phosphorylation of specific sites of p27Kip1 therefore
avoiding the nuclear exportation of the protein and leading to cell
cycle arrest through the accumulation of p27Kip1 in the nucleus.
In addition, the phosphorylation of p27Kip1 at T187, which is
involved in triggering proteolysis of this protein, was evaluated in
catalase-treated melanoma cells and no significant differences were
observed vs. untreated controls (Figure S5).
Considering that growth factors trigger H2O2 production that
leads to activation of signaling pathways governing cellular
proliferation [27], we evaluated how H2O2 is involved in the
modulation of p27Kip1 in G1-arrested A375 cells by FBS
starvation incubated with different levels of H2O2 for 24 h.
Figure 5A shows increased intracellular levels of ROS in a dose-
dependent manner in cells treated with 0.1–10 mM H2O2 in
comparison to FBS starved cells. It has been previously reported
that the application of 0.1–7 mM H2O2 to cultured cells results in
intracellular H2O2 levels of approximately 0.01–0.07 mM and
directly stimulates cell proliferation. On the other hand, increasing
amounts of cell death occur with applied concentrations of
H2O2$10 mM [reviewed in 26]. In our cellular model, incubation
of FBS starved cells with 0.1 mM H2O2 induced an increase in
proliferation rate in comparison to untreated FBS starved cells. On
the other hand, no effect in cell proliferation was observed with the
other doses of H2O2 used (Figure 5B). Cells treated with 0.1 mM
H2O2 exhibited a predominantly cytoplasmic p27Kip1 distribu-
tion; similar to cells incubated with 10% FBS while p27Kip1 was
found mainly in the nucleus in untreated FBS starved cells
(Figures 5C and 5D). The subcellular localization of this protein in
cells treated with 0.01 mM of H2O2 was comparable to the pattern
observed in FBS starved cells and the addition of 1–10 mM of
H2O2 to A375 FBS starved cells resulted in a similar percentage of
nuclear and cytoplasmic p27Kip1 (Figures 5C and 5D). Western
blots showed decreased levels of p27Kip1 in cells treated with
0.01 mM of H2O2 as compared to FBS starved cells and to cells
treated with 0.1–10 mM of H2O2 (Figures 5E and 5F). The levels
of p27pS10 and p27pT198 in cells treated with 0.1 mM of H2O2
increased as in cells incubated with 10% FBS while FBS starved
cells showed low levels of p27pS10 and p27pT198 (Figures 5E and
5F). On the contrary, no significant differences were found in the
levels of p27pT187 in cells treated with exogenous H2O2 (0.1 and
10 mM) as compared to both FBS starved and 10% FBS incubated
control cells (Figure S5). These findings suggest that H2O2 at a
mitogenic level of 0.1 mM for our cellular model regulates
p27Kip1 phosphorylation leading to cytoplasmic localization of
this protein and favoring cell proliferation.
Thus, we demonstrated that H2O2 would be implied in the
modulation of key regulatory post-translational modifications of
p27Kip1 protein in melanoma cells.
Catalase also Modulates Cell Proliferation and SubcellularLocalization of p27Kip1 in Colorectal Carcinoma andNeuroblastoma Cells
In order to extend the results observed for melanoma cells
treated with catalase to other human cancer cell types, we
evaluated cell proliferation, cell cycle and p27Kip1 intracellular
distribution in colorectal carcinoma (LoVo) and neuroblastoma
(Paju) cells. The characterization of our cellular models at ROS
level showed that LoVo cells exhibited lower intracellular ROS
levels than Paju and A375 cells (Figure S6). Interestingly, we
observed a low proliferation rate (p,0.01) for both LoVo and Paju
cells (Figure 6) in response to the reduced levels of ROS induced
by the addition of catalase to cell cultures (Figure 6). LoVo and
Paju cells treated with catalase for 24 h exhibited a significant G1
cell cycle arrest (Figure 6) associated with a decrease in cyclin D1
levels (Figure S7). In agreement with these results, the signal for
cyclin D1 detected by immunofluorescence was extremely low in
the nucleus of cells treated with catalase and a significant decrease
of the percentage of positive nuclei was found in these cells as
compared with control cells (Figure S8). No significant differences
in cyclin E, CDK2 and CDK4 levels were observed between
catalase-treated and non-treated cells (Figure S7).
Colorectal carcinoma and neuroblastoma cells treated with
catalase also showed p27Kip1 localized primarily within the
nucleus as compared with controls, in which p27Kip1 distribution
was predominantly cytoplasmic (Figures 7A and 7B show
treatments for 24 h and Figures S9A and S9B show treatments
for 6h). In addition, we demonstrated by western blot a significant
increase in the levels of p27Kip1 in response to catalase treatment
for both LoVo and Paju cells (Figures 7C and 7D treatments for
24 h and Figures S9C and S9D treatments for 6 h). Finally, we
reproduced a significant decrease in the levels of p27pS10 and
p27pT198 in colorectal carcinoma and neuroblastoma cells
treated with catalase as compared with controls (Figures 7C and
7D treatments for 24 h and Figures S9C and S9D treatments for
6 h).
These results confirmed and extended our previous findings. We
suggest that ROS decrease in different human cancer cells by
catalase regulates the subcellular localization of p27Kip1 avoiding
the phosphorylation of the protein at key sites (S10 and T198)
leading to the accumulation of p27Kip1 in the nucleus which
favors cell cycle arrest.
Regulation of p27Kip1 by H2O2 Modulation
PLOS ONE | www.plosone.org 6 September 2012 | Volume 7 | Issue 9 | e44502
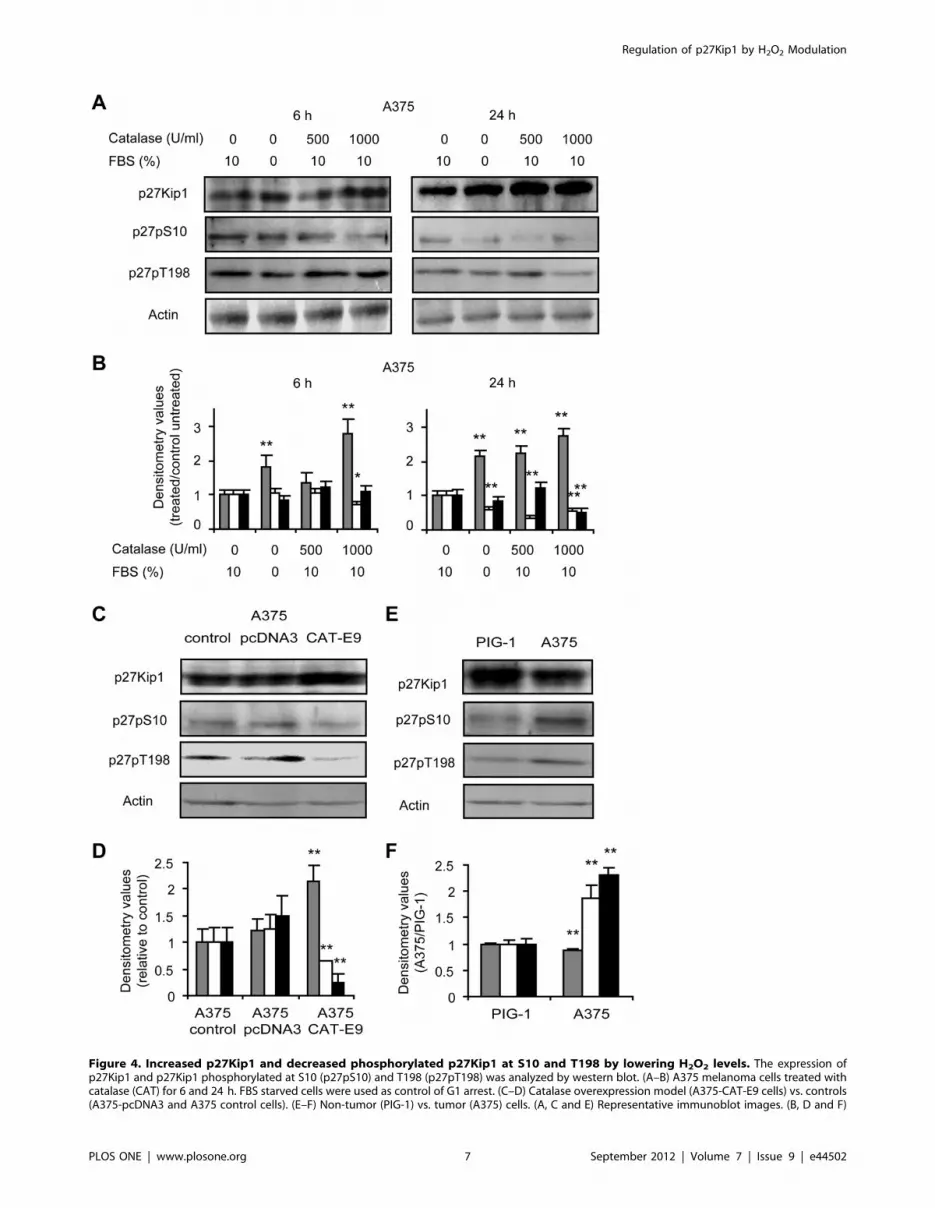
Figure 4. Increased p27Kip1 and decreased phosphorylated p27Kip1 at S10 and T198 by lowering H2O2 levels. The expression ofp27Kip1 and p27Kip1 phosphorylated at S10 (p27pS10) and T198 (p27pT198) was analyzed by western blot. (A–B) A375 melanoma cells treated withcatalase (CAT) for 6 and 24 h. FBS starved cells were used as control of G1 arrest. (C–D) Catalase overexpression model (A375-CAT-E9 cells) vs. controls(A375-pcDNA3 and A375 control cells). (E–F) Non-tumor (PIG-1) vs. tumor (A375) cells. (A, C and E) Representative immunoblot images. (B, D and F)
Regulation of p27Kip1 by H2O2 Modulation
PLOS ONE | www.plosone.org 7 September 2012 | Volume 7 | Issue 9 | e44502
Relative densitometric values of ( ) p27Kip1 levels, (%) p27pS10 and (&) p27pT198. Actin densitometric values were used to standardize for proteinloading. Results are referred to control without treatment (in B and D) and to non-tumor (PIG-1) cells (in F). Data are expressed as mean 6 SD. (B)*p,0.05 and **p,0.01 vs. untreated control. (D) **p,0.01 vs. A375 control. (F) **p,0.01 vs. non-tumor cells.doi:10.1371/journal.pone.0044502.g004
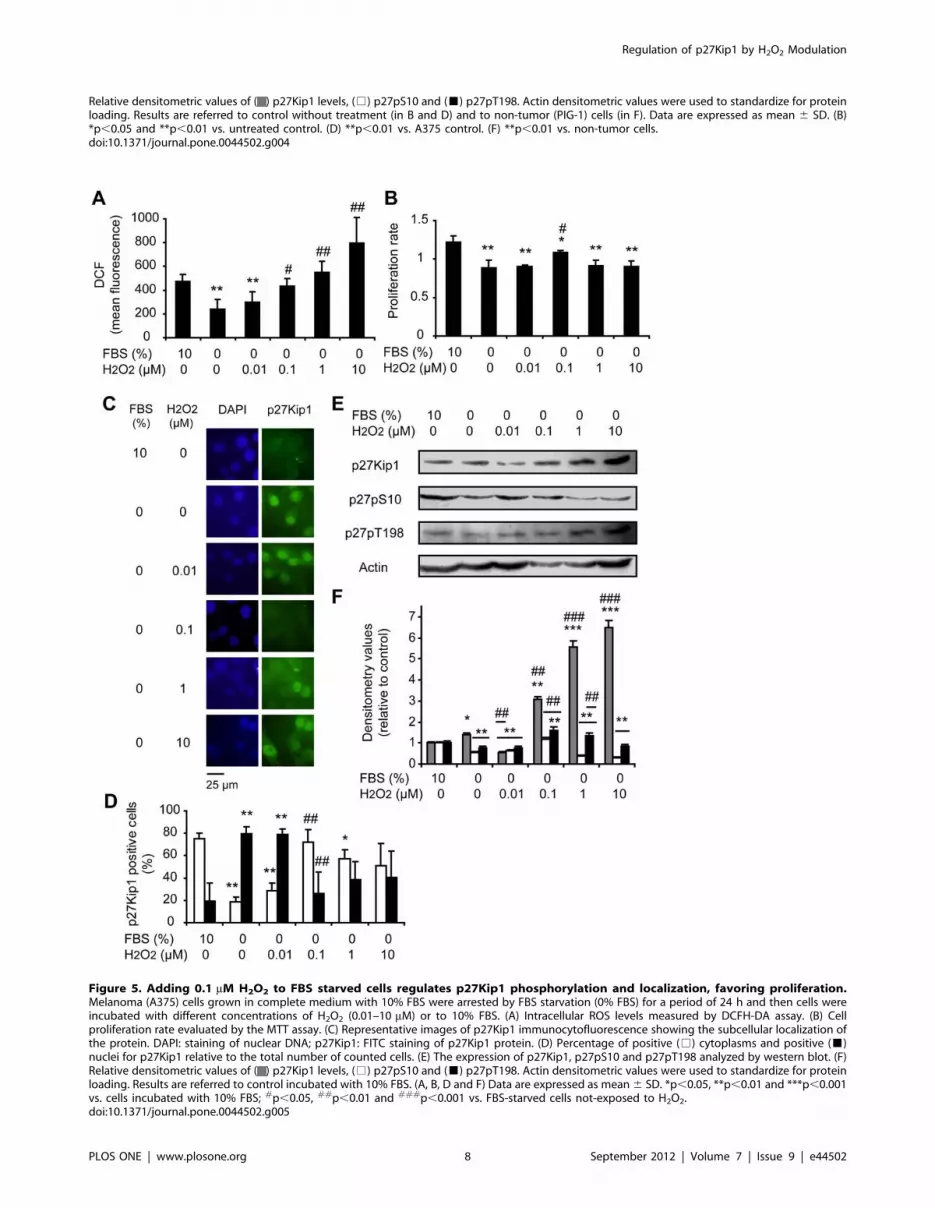
Figure 5. Adding 0.1 mM H2O2 to FBS starved cells regulates p27Kip1 phosphorylation and localization, favoring proliferation.Melanoma (A375) cells grown in complete medium with 10% FBS were arrested by FBS starvation (0% FBS) for a period of 24 h and then cells wereincubated with different concentrations of H2O2 (0.01–10 mM) or to 10% FBS. (A) Intracellular ROS levels measured by DCFH-DA assay. (B) Cellproliferation rate evaluated by the MTT assay. (C) Representative images of p27Kip1 immunocytofluorescence showing the subcellular localization ofthe protein. DAPI: staining of nuclear DNA; p27Kip1: FITC staining of p27Kip1 protein. (D) Percentage of positive (%) cytoplasms and positive (&)nuclei for p27Kip1 relative to the total number of counted cells. (E) The expression of p27Kip1, p27pS10 and p27pT198 analyzed by western blot. (F)Relative densitometric values of ( ) p27Kip1 levels, (%) p27pS10 and (&) p27pT198. Actin densitometric values were used to standardize for proteinloading. Results are referred to control incubated with 10% FBS. (A, B, D and F) Data are expressed as mean 6 SD. *p,0.05, **p,0.01 and ***p,0.001vs. cells incubated with 10% FBS; #p,0.05, ##p,0.01 and ###p,0.001 vs. FBS-starved cells not-exposed to H2O2.doi:10.1371/journal.pone.0044502.g005
Regulation of p27Kip1 by H2O2 Modulation
PLOS ONE | www.plosone.org 8 September 2012 | Volume 7 | Issue 9 | e44502
Discussion
In this study, we demonstrated a modification in the subcellular
localization of p27Kip1 mediated by changes in the phosphory-
lation of specific residues of this protein in response to H2O2 level
variations. The nuclear increase of p27Kip1 in melanoma cells
either overexpressing or treated with catalase was associated with a
decrease in the levels of the phosphorylated protein at S10 and
T198. These findings, combined with the decrease in cyclin D1
levels induced by H2O2 scavenging, would favor the cell cycle
arrest at G1 phase and the inhibition of cell proliferation. We also
demonstrated that the addition of H2O2 in a dose that induces
proliferation to FBS starved cells increases the levels of p27pS10
and p27pT198 leading to cytoplasmic localization of this protein.
The other human cancer cells, derived from colorectal carcinoma
and neuroblastoma, used in our study, showed a similar response
to catalase treatment, extending the results observed for melanoma
cells. In addition, melanocytes, which exhibited low levels of ROS
as compared with melanoma cells, showed decreased levels of
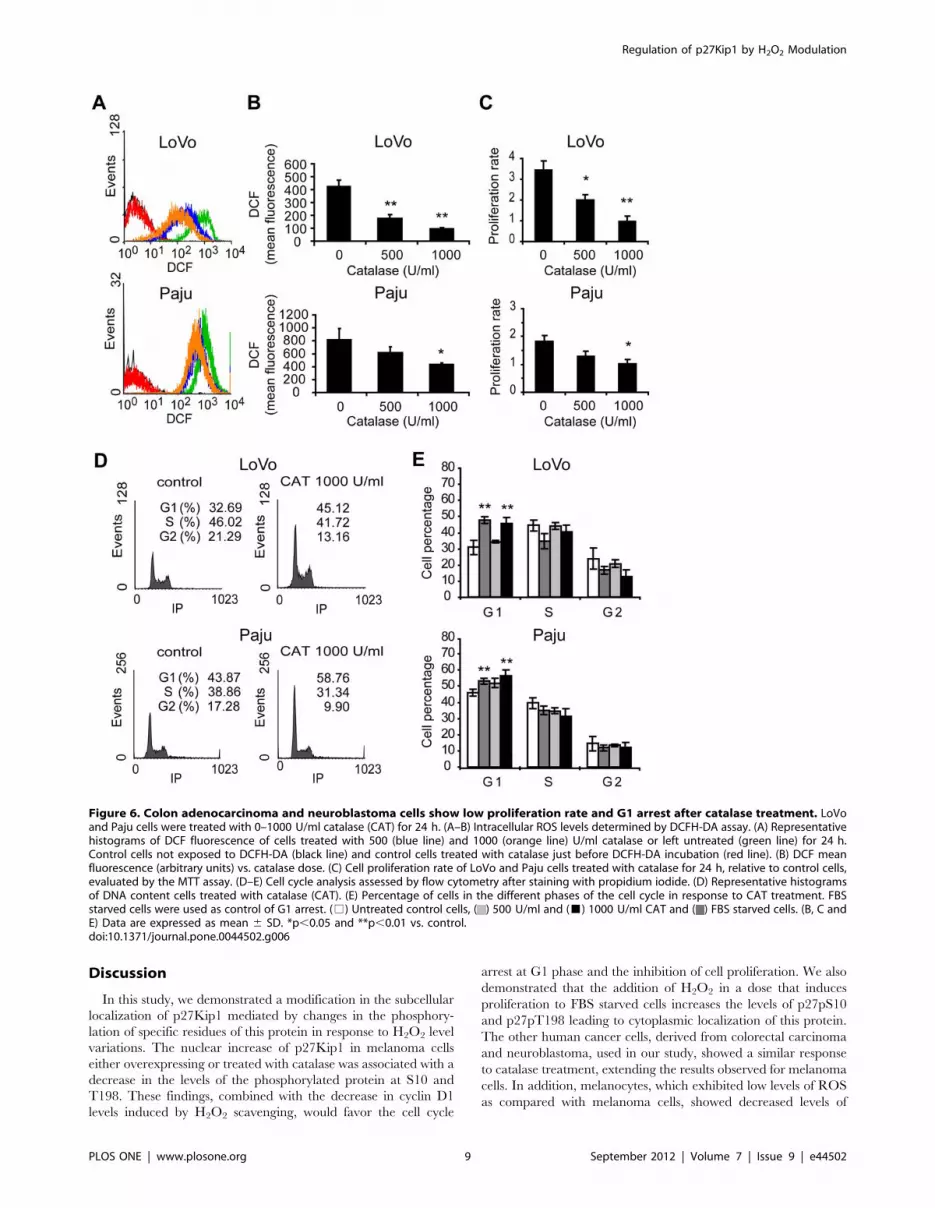
Figure 6. Colon adenocarcinoma and neuroblastoma cells show low proliferation rate and G1 arrest after catalase treatment. LoVoand Paju cells were treated with 0–1000 U/ml catalase (CAT) for 24 h. (A–B) Intracellular ROS levels determined by DCFH-DA assay. (A) Representativehistograms of DCF fluorescence of cells treated with 500 (blue line) and 1000 (orange line) U/ml catalase or left untreated (green line) for 24 h.Control cells not exposed to DCFH-DA (black line) and control cells treated with catalase just before DCFH-DA incubation (red line). (B) DCF meanfluorescence (arbitrary units) vs. catalase dose. (C) Cell proliferation rate of LoVo and Paju cells treated with catalase for 24 h, relative to control cells,evaluated by the MTT assay. (D–E) Cell cycle analysis assessed by flow cytometry after staining with propidium iodide. (D) Representative histogramsof DNA content cells treated with catalase (CAT). (E) Percentage of cells in the different phases of the cell cycle in response to CAT treatment. FBSstarved cells were used as control of G1 arrest. (%) Untreated control cells, ( ) 500 U/ml and (&) 1000 U/ml CAT and ( ) FBS starved cells. (B, C andE) Data are expressed as mean 6 SD. *p,0.05 and **p,0.01 vs. control.doi:10.1371/journal.pone.0044502.g006
Regulation of p27Kip1 by H2O2 Modulation
PLOS ONE | www.plosone.org 9 September 2012 | Volume 7 | Issue 9 | e44502
p27pS10 and p27pT198 and nuclear localization of the protein in
association with a low proliferation rate.
The difference in intracellular ROS levels observed among the
tumor cell lines studied herein agrees with a previous work by
Szatrowski et al [40] that reported higher levels of H2O2 in several
melanoma, neuroblastoma, ovarian carcinoma cell lines and one
type of colon carcinoma cells compared to other colon carcinoma
cell line and breast and pancreatic carcinoma cells, which showed
similar H2O2 levels to those of normal cells. Considering the
increased levels of ROS observed in A375 melanoma cells as
compared to PIG-1 melanocytes, we generated a model of catalase
overexpression with A375 cells. The presence of higher levels of
ROS in tumor cells than their non-tumor counterpart observed
herein is in agreement with other reports [23–24,42–45]. In a
previous report [23], we demonstrated that H2O2 scavenging
resulted in a significant inhibition of cell proliferation in tumor
cells of different origin [23] and we showed herein that catalase
treatment or overexpression induced an arrest in the G1 phase of
the cell cycle. Our results are consistent with the association
between G1 arrest and decreased ROS levels reported in other
experimental conditions [35,46–49].
Growth factors trigger H2O2 production that leads to activation
of signaling pathways governing cellular proliferation, such as
mitogen-activated protein kinases (MAPKs) [27]. This could
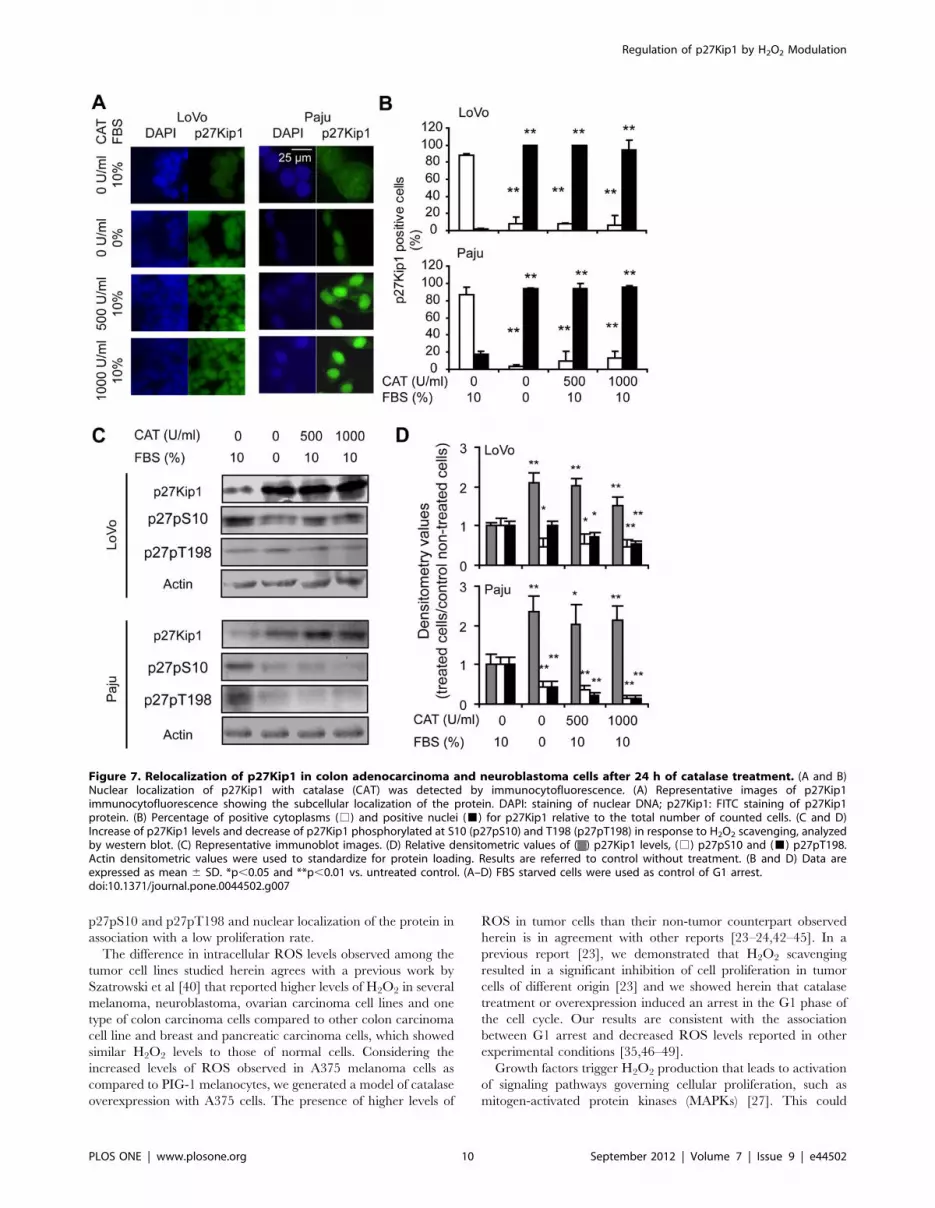
Figure 7. Relocalization of p27Kip1 in colon adenocarcinoma and neuroblastoma cells after 24 h of catalase treatment. (A and B)Nuclear localization of p27Kip1 with catalase (CAT) was detected by immunocytofluorescence. (A) Representative images of p27Kip1immunocytofluorescence showing the subcellular localization of the protein. DAPI: staining of nuclear DNA; p27Kip1: FITC staining of p27Kip1protein. (B) Percentage of positive cytoplasms (%) and positive nuclei (&) for p27Kip1 relative to the total number of counted cells. (C and D)Increase of p27Kip1 levels and decrease of p27Kip1 phosphorylated at S10 (p27pS10) and T198 (p27pT198) in response to H2O2 scavenging, analyzedby western blot. (C) Representative immunoblot images. (D) Relative densitometric values of ( ) p27Kip1 levels, (%) p27pS10 and (&) p27pT198.Actin densitometric values were used to standardize for protein loading. Results are referred to control without treatment. (B and D) Data areexpressed as mean 6 SD. *p,0.05 and **p,0.01 vs. untreated control. (A–D) FBS starved cells were used as control of G1 arrest.doi:10.1371/journal.pone.0044502.g007
Regulation of p27Kip1 by H2O2 Modulation
PLOS ONE | www.plosone.org 10 September 2012 | Volume 7 | Issue 9 | e44502
explain the decrease in ROS levels observed in FBS starved cells in
our melanoma model. Previously, we demonstrated decreased
ROS levels in FBS starved squamous carcinoma cells [35]. We
also observed that 0.1 mM of H2O2 added to FBS starved A375
cells induced cell proliferation and it has been previously reported
[26] that this dose results in a 10 nanomolar intracellular
concentration of H2O2 and directly stimulates cell proliferation.
On the contrary, the addition of both lower and higher H2O2
concentrations did not produce changes in cell proliferation. Stone
and Yang [26] reviewed that doses around or higher than 10 mM
of H2O2 applied to cell cultures are associated with cell death
increase or, at least, with initially growth arrest, which may be
followed by growth promoting adaptation to oxidative stress. They
also reported that 0.01 mM of H2O2 added to cell cultures results
in intracellular H2O2 levels of ,1 nM which are extremely low to
detect any cellular response [26]. However, the precise transition
points for cellular responses to oxidative stress may vary due to cell
type and culture conditions [26]. A375 cells exhibited intrinsic
high levels of ROS combined with increased proliferation rate;
perhaps those levels of ROS were bordering cytotoxicity and the
addition of 1–10 mM of H2O2 induced the activation of other
signaling pathways related to stress response. Intracellular levels of
ROS become critical when cells are committed to proliferate [50].
In this sense, in our melanoma model we showed the inhibition of
cell growth by decreasing the physiological levels required to
induce signals to proliferate and on the other hand by adding
supraphysiological levels of H2O2 that would induce stress signals.
It has been previously demonstrated that ROS are involved in
promoting mitogenesis by modulating cyclin D1 levels [33]. In
agreement with Brar et al [41], in our cellular models, we found a
decrease in the protein levels of cyclin D1 associated with the
inhibition of proliferation induced by decreasing ROS levels with
catalase, which could be related to the modulation of ERK1/2
activity [47,48]. Moreover, we found low nuclear signal of cyclin
D1 and a significant diminution of the percentage of positive
nuclei for this protein in response to H2O2 scavenging revealed by
immunofluorescence, suggesting that ROS levels diminution by
catalase would favor cyclin D1 degradation. On the other hand,
we have not observed differences in cyclin E, CDK2 and CDK4
levels between catalase-treated and non-treated cells and between
non-tumor and tumor cells.
Considering p27Kip1, it plays a crucial role in cell cycle
regulation by virtue of its ability to respond to modifications in the
growth environment of the cell, integrating diverse signals into a
final decision between proliferation and cell cycle exit [2,3]. This
protein remains in the nucleus in quiescent cells, but it is exported
to the cytoplasm in response to proliferating signals [3], where it
can be degraded or stabilized to be involved in the regulation of
other processes such as cell migration [4]. In the present study, we
demonstrated a modulation on the levels of this regulatory protein
and a differential intracellular localization depending on ROS
levels. The scavenging of H2O2 by catalase induced an increase in
the levels of p27Kip1 and the nuclear localization of the protein,
while control proliferating cells showed mainly cytoplasmic
localization of this protein. Moreover, we demonstrated that
p27Kip1 exhibited a predominantly cytoplasmic distribution in
FBS starved melanoma cells exposed to a proliferating dose of
H2O2 (0.1 mM). It has been reported that the oncogenic activation
of RTK, PI3K, SRC, or Ras-MAPK pathways cooperate to
inactivate p27Kip1, accelerate its proteolysis or change its
intracellular localization in human cancers through modifications
in p27Kip1 phosphorylation [5]. Thus, considering that H2O2 has
been described as mediator of RTK/Ras, MAPKs, PI3K/AKT
and non-receptor tyrosine kinases pathways [51], cell treatment
with H2O2 in a proliferating dose would induce the nuclear export
or degradation of p27Kip1 while the scavenging of H2O2 would
be preventing these effects maintaining this protein at the nucleus.
Regarding p27Kip1 phosphorylations, this protein may be
phosphorylated at multiple sites [3]. Most of these post-transla-
tional modifications are on threonine and serine residues [9] and
phosphorylations on tyrosine residues have recently been reported
[16,17]. Taking into account that we demonstrated changes in the
subcellular distribution of p27Kip1 in response to H2O2 modu-
lation, we studied the levels of p27pS10 and p27pT198 because
phosphorylation of p27Kip1 at those sites in proliferating cells,
enables its nuclear exportation [6,8,9], leading to accumulation of
p27pT198 in the cytoplasm [4,9]. We demonstrated a decrease in
the levels of p27pS10 and p27pT198 in response to H2O2 removal
in tumor cells of different origin. In addition, melanocytes
exhibited lower levels of p27Kip1 phosphorylated at those sites
than their tumor counterpart. Other authors reported the
involvement of AKT and p90 ribosomal S6 kinase (RSK1) in
the phosphorylation of p27Kip1 at T198 [9,52] and AKT and
human kinase interacting stathmin (hKIS) in the phosphorylation
of the protein at S10 [53,54]. Interestingly, all of these kinases take
part in signaling pathways regulated by ROS [30,51,55]. Thus,
these data suggest that H2O2 blockage would avoid nuclear
exportation of p27Kip1 by modulating the phosphorylation of
specific sites, leading to the cell cycle arrest through the
accumulation of this protein in the nucleus. Moreover, preliminary
results of our laboratory showed a decrease in AKT1 and hKIS
gene expression in A375 cells treated with catalase in comparison
to non-treated cells (unpublished data), which could be associated
to the decrease on p27pS10 and p27pT198. On the other hand,
the addition of H2O2 to FBS starved cells at a proliferating dose of
0.1 mM led to an increase in p27pS10 and p27pT198 levels
associated to a cytoplasmic distribution of p27Kip1 and these
findings confirmed the involvement of H2O2 in the modulation of
key regulatory post-translational modifications of p27Kip1 pro-
tein. Subcellular distribution, levels and phosphorylation status of
p27Kip1 in cells treated with higher doses of exogenous H2O2
than 0.1 mM might suggest that these concentrations in our
melanoma model could be implied in other cellular processes
related to the oxidative stress response.
Unlike other well characterized tumor suppressors, p27Kip1 is
rarely mutated or deleted in human cancers [5,9]. Rather it is
frequently deregulated: p27Kip1 protein levels are reduced (due to
accelerated proteolysis or impaired translation) or the protein
suffers sequestration in cyclin D-CDK complexes or is mislocalized
to the cytoplasm [5,9]. Cytoplasmic p27Kip1 was associated to
invasive and metastatic tumors [56,57]. Phosphorylations of
p27Kip1 at S10 and T198 play a decisive role in the nuclear
export of the protein and in its permanency in the cytoplasm
where p27Kip1 would perform other activities, such as those
related to cell motility [4,57]. Interestingly, in this study, we found
an increase in p27pT198 levels in melanoma cells treated with
high doses of H2O2 (1–10 mM) and this phosphorylation site is
involved in stabilization of the protein at the cytoplasm, while the
increase in p27pS10 was only found for the proliferating dose of
H2O2. These findings suggest that p27pS10 rather than p27pT198
would be mainly involved in the proliferating effect of 0.1 mM
H2O2 in our melanoma model. In this regard, Schiappacassi et al
[58] recently showed that p27Kip1 phosphorylation at T198 does
not affect cell proliferation while this event is important in cell
motility regulation. The phosphorylation of this protein on T187
by cyclin E-CDK2 complex targets p27Kip1 for ubiquitin-
dependent proteolysis [9–11]. In our melanoma cellular model,
non significant differences were observed in p27pT187 levels after
Regulation of p27Kip1 by H2O2 Modulation
PLOS ONE | www.plosone.org 11 September 2012 | Volume 7 | Issue 9 | e44502

ROS modulation, both by addition or scavenging of H2O2, which
is consistent with the fact that no variations were observed on
cyclin E and CDK2 levels after catalase treatment. This suggests
that the mechanisms that control p27Kip1 levels by proteolysis are
not affected by ROS levels and our findings support the hypothesis
that the pro-oxidant levels of melanoma cells allow the nuclear
exportation and stabilization of p27Kip1 in the cytoplasm by its
phosphorylation on S10 and T198 due to ROS-regulated signaling
pathways, such as, PI3K/AKT pathway.
Considering our results in relation to the fact that most cancer
cells exhibit high levels of ROS, we suggest another mechanism by
which cancer cells, such as the types studied herein, taking
advantage of their intrinsic ROS levels would favor cell
proliferation and malignant features, altering p27Kip1 subcellular
localization through an increase in the levels of p27pS10 and
p27pT198. These phosphorylations lead to cytoplasmic localiza-
tion and stabilization of the protein which, in turn, has been
associated with increased malignancy. In this sense, Bottini et al.
demonstrated a cytoplasmic accumulation of p27Kip1 in colorec-
tal cancer specimens of patients with poor outcomes for cancer-
related relapse and survival [59]. A recent study of tissue
microarrays of human melanocytic lesions by Chen et al. also
revealed that nuclear p27Kip1 expression was reduced in primary
melanomas compared with dysplastic nevi and further reduced in
metastatic melanoma, whereas the cytoplasmic p27Kip1 was
increased in primary and metastatic melanomas compared with
dysplastic nevi [18].
Our study of both nuclear levels and cytoplasmic mislocalization
of p27Kip1 by H2O2 modulation contributes in some manner to
the understanding of the potential prognostic and predictive value
of the protein, as it was recently noted by Wender et al [57], since
reduced nuclear p27Kip1 increases proliferation, and cytoplasmic
p27Kip1 would drive tumor cell invasion.
Materials and Methods
Cell Lines and CultureThe following human cell lines were used: PIG-1 [60], A375
[44,61], LoVo [44] and Paju [62,63]. PIG-1 melanocytes and
melanoma A375 cells were kindly provided by Dr. I.C. Le Poole
(Departments of Pathology, Microbiology and Immunology,
Oncology Institute, Loyola University, Maywood, Illinois, USA)
and Dr. E. Medrano (Huffington Center on Aging, Departments
of Molecular & Cellular Biology and Dermatology, Baylor College
of Medicine, Houston, Texas, USA) respectively. Colorectal
carcinoma LoVo cells (CCL-229) were kindly donated by Dr. O.
Podhajcer (Laboratorio de Terapia Celular y Molecular, Funda-
cion Instituto Leloir, Buenos Aires, Argentina). Neuroblastoma
Paju cells were provided by Dr. E. Rivera (Laboratorio de
Radioisotopos, Facultad de Farmacia y Bioquımica, Universidad
de Buenos Aires, Argentina). PIG-1 cells were grown in 254
medium (Cascade Biologics) supplemented with Human Melano-
cyte Growth Supplement (HMGS, Cascade Biologics). A375 and
LoVo cells were maintained in 50:50 of DMEM/Ham’s F12
(Invitrogen, Argentina). A375 medium was also supplemented
with 17.6 mg/ml ascorbic acid (Sigma), 150 mg/ml pyruvic acid
(Sigma), 300 mg/ml galactose (Sigma) and 5 mg/ml insulin. Paju
cells were maintained in RPMI-1640 (Invitrogen, Argentina). All
media were supplemented with 50 U/ml penicillin, 50 mg/ml
streptomycin and 10% (v/v) FBS (NatoCor, Cordoba, Argentina)
and cells were grown at 37uC in a 5% CO2 humidified
atmosphere. Cells were regularly tested to be mycoplasma-free.
Treatments and Generation of a Catalase-overexpressionModel
For H2O2 scavenging experiments, cells were incubated with 0–
1000 U/ml catalase (Sigma) added to complete culture medium
for periods of 6 or 24 h. A solution of catalase in phosphate
buffered saline (PBS) sterilized by filtration was prepared fresh just
before addition to the medium. Control cells were non-treated or
treated with a solution of 1000 U/ml of heat-inactivated catalase
in PBS. In order to obtain a catalase-overexpression model, A375
cells were stably transfected with a construct containing the
pcDNA3 expression vector and the cDNA coding for human
catalase (CAT-pcDNA3), using Lipofectamine 2000 (Invitrogen,
Argentina) as previously described [23]. Control cells were
transfected with empty pcDNA3 vector. For selection of stable
transfectants, geneticin (1000 mg/ml, Sigma) was added to the cell
medium 24 h after transfection and maintained for 3 weeks
changing the medium with geneticin every two days. Geneticin-
resistant clones were obtained by dilution cloning.
For experiments with exogenous H2O2, after 24 h of FBS
starvation, cells were incubated with rising concentrations of H2O2
(0.01–10 mM) or 10% of FBS added to the medium for a period of
24 h.
Determination of ROS LevelsIn order to validate and characterize our cellular models of
H2O2 scavenging, both by exogenous treatments with catalase and
by overexpression of this enzyme, the levels of ROS, the
expression (Methods S1) and the activity of catalase (Methods
S1) were determined.
The levels of intracellular ROS were determined by 29, 79-
dichlorodihydro-fluorescein diacetate (DCFH-DA, Molecular
Probes) assay as previously described [35]. Briefly, cells treated
with catalase for 24 h or stably transfected with CAT-pcDNA3 or
transfected with the empty vector or left untreated (controls) were
washed twice with PBS and incubated with 10 mM DCFH-DA in
PBS at 37uC for 30 min, protected from light. After incubation,
cells were washed with PBS, harvested with trypsin/EDTA and
evaluated by flow cytometry (FACSCalibur, Becton Dickinson).
Ten thousand cells were measured for each experimental
condition. The DCFH-DA assay is widely used for the measure-
ment of H2O2 levels but other intracellular ROS can oxidize the
probe, and in order to appraise the specificity of H2O2
determination by this technique, control cells were treated with
1000 U/ml catalase throughout the assay, added just before
DCFH-DA incubation [35]. Data were analyzed with WinMDI
software. Three experiments were performed with triplicates per
each experimental condition. This DCFH-DA assay was also used
to determine ROS levels in FBS starved cells treated with rising
concentrations of H2O2 or 10% FBS added to the medium for a
period of 24 h.
Cell Growth and Cell Cycle AnalysisThe 3-(4,5-dimethylthiazol-2-y1)-2,5-diphenyltetrazolium bro-
mide (MTT) growth assay [64] was performed at 24 h post-
treatment in cells of our models of H2O2 scavenging (treated with
catalase or transfected with CAT-pcDNA3) growing in 24-well
plates as previously described [23,35]. Control cells were left
untreated, transfected with empy vector or incubated with heat-
inactivated catalase. Results were expressed as proliferation rate.
All experiments were performed at least three times with
quadruplicate measurement per condition.
Cell cycle analysis was performed by propidium iodide (PI)
staining. Subconfluent cells with or without catalase treatment for
Regulation of p27Kip1 by H2O2 Modulation
PLOS ONE | www.plosone.org 12 September 2012 | Volume 7 | Issue 9 | e44502

24 h or transfected with CAT-pcDNA3 or empty vector were
trypsinized, collected by centrifugation, and washed with ice-cold
PBS before fixing in 96% ethanol at 4uC. Fixed cells were
resuspended in 0.2 ml PBS containing 50 mg/ml RNase I (Sigma)
and 60 mg/ml PI (Sigma). FBS starved cells were used as control of
G1 arrest. The number of cells in the different phases of the cell
cycle was determined by flow cytometry (FACSCalibur, Becton
Dickinson). Ten thousand cells were measured per experimental
condition and analyzed with WinMDI and Cylchred software.
Three experiments were performed with triplicates per experi-
mental condition.
Detection of p27Kip1 by ImmunocytofluorescenceSubconfluent cell cultures grown in 60 mm dishes were fixed in
4% (w/v) paraformaldehyde in PBS for 15 min. Cells were then
washed with PBS, permeabilized with 0.5% (v/v) Triton X-100 in
PBS for 15 min, washed and blocked with 5% (v/v) FBS in PBS
for 30 min. Cells were incubated overnight at 4uC with the
polyclonal anti-p27Kip1 (M-197, Santa Cruz Biotechnology)
antibody, 1:300 in PBS, washed and incubated with secondary
FITC-conjugated anti-rabbit IgG (Sigma) for 1 h in the dark at
room temperature. Finally, the samples were washed, counter-
stained and mounted with 1 mg/ml 49,6-diamidine-29-phenylin-
dole (DAPI, Sigma) in an antifade solution in the dark. Cells were
examined in an Olympus BX51 epifluorescence microscope
utilizing immersion oil with a 100X (UPlanApo 100 X/1.35 oil)
objective lens. For each treatment condition, FITC and DAPI
images were serially captured by a CCD camera (Olympus DP70)
and more than 50 fields containing approximately 20 cells each
were stored. A code number was given to each image. Random
sampling methods were used to select the images and all the cells
in each selected image were screened. An average of 250 cells was
evaluated per experimental condition. Total cells, positive cells,
positive cytoplasms and positive nuclei for p27Kip1 were counted
by eye by two scorers and results were crosschecked. FBS starved
cells were used as control of G1 arrest. Three independent
experiments were performed with triplicates per condition.
This method was used in a similar way to detect cyclin D1 by
immunofluorescence (Methods S2).
Determination of p27Kip1 and Phosphorylated p27Kip1by Western Blot
Cells were treated with catalase or H2O2 or left untreated for 6
or 24 h. In the catalase-overexpression model cells were
transfected with the CAT-pcDNA3 or with the empty vector.
Cells incubated with heat-inactivated catalase were also used as a
negative control. FBS starved cells were used as control of G1
arrest. In order to obtain the whole protein extract and the
cytoplasmic and nuclear protein fractions, cells were washed twice
and scraped in 1 ml PBS. A 0.2 ml aliquot was centrifuged and
cells were incubated on ice for 30 min in RIPA lysis buffer (Sigma)
containing the Halt protease and phosphatase inhibitor cocktail
(Thermo Scientific) for the whole extract. The remaining aliquot
was centrifuged and cells were lysed in 70 ml of extraction buffer
(10 mM Hepes, 0.2 M sucrose, 15 mM KCl, 2 mM EDTA,
pH 7.6). After 10 min of 2200 rpm centrifugation, the supernatant
containing cytoplasmic proteins was collected. In order to obtain
the nuclear proteins, the pellet was resuspended in 30 ml of
extraction buffer with 5% glycerol and left 40 min at 4uC,
vortexing every 5 min. After 10 min of centrifugation at
12000 rpm, the nuclear proteins were collected from the
supernatant.
The protein yield was quantified by the DC Protein Assay
Reagent (BioRad) based on the Lowry protocol. Samples were
separated by SDS polyacrylamide (Promega) gel electrophoresis,
transferred to nitrocellulose membranes (Hybond ECL Mem-
brane, Amersham Biosciences, GE Healthcare) and immuno-
blotted by appropriate antibodies.
The antibodies against p27Kip1 (M-197), phosphorylated
p27Kip1 protein at serine 10 and threonine 198: p27pS10 (Ser
10-R), p27p198 (Thr 198), Ku-70 (G-7) and actin (I-19) were
purchased from Santa Cruz Biotechnology. The primary antibod-
ies were detected using horseradish peroxidase-linked donkey anti-
rabbit IgG (Amersham, GE Healthcare) or anti-goat IgG (Santa
Cruz Biotechnology) and visualized by the ECL detection system
(Amersham Biosciences, GE Healthcare). Quantification was
performed by densitometric scanning with the NIH Image J
software. Actin densitometric values were used to standardize for
both the whole and cytoplasmic protein extracts loading and Ku-
70 densitometric values were used to standardize for nuclear
protein loading. Three independent experiments were performed
with duplicates per experimental condition.
The detection of the other G1/S regulatory proteins and
p27Kip1 phosphorylated at T187 by western blot is described in
Methods S3.
Statistical AnalysisData are presented as mean 6 SD. Significant changes were
assessed using two-tailed Student’s t-test to compare two sets of
data and one-way analysis of variance to compare three or more
sets of data followed by Tukey’s multiple comparisons test to
determine significant differences between group means. P-values
less than 0.05 were considered significant for all tests.
Supporting Information
Figure S1 Characterization of the catalase-overexpres-sion model. (A) Clone A375-CAT-E9 showed the lowest
intracellular ROS levels of the stable geneticin-resistant clones
generated. DCF mean fluorescence (arbitrary units) of A375 cells
stably transfected with a construct containing the pcDNA3
expression vector and the cDNA coding for human catalase
(A375-CAT). Control cells were either transfected with empty
pcDNA3 vector (A375-pcDNA3) or left non-transfected (A375
control). (B) Increased levels of catalase in clone A375-CAT-E9 as
compared with A375-pcDNA3 or A375 control, determined by
western blot. (C) Higher catalase activity of A375-CAT-E9 cells
than control ones (A375-pcDNA3 or A375 control). (A and C)
Data are expressed as mean 6 SD. **p,0.01 vs. A375 control.
(TIF)
Figure S2 Cells treated with heat-inactivated catalaseexhibited no significant differences with non treatedcells. (A) The levels of ROS were measured by the DCFH-DA
assay and (B) the proliferation rate by the MTT assay. A375
melanoma cells were treated with 1000 U/ml of catalase (CAT) or
1000 U/ml heat-inactivated catalase (IN-CAT) in PBS for 24 h or
left untreated (control). Data are expressed as mean 6 SD.
*p,0.05 and **p,0.01 vs. A375 control.
(TIF)
Figure S3 Cyclin D1 levels decreased in response toH2O2 scavenging and intrinsic low levels of H2O2. The
expression of cyclins and CDKs of G1/S was analyzed by western
blot. (A and D) Melanoma cells treated with catalase (CAT) for 6
and 24 h. FBS starved cells were used as control of G1 arrest. (B
and E) Catalase overexpression model (A375-CAT-E9 cells) vs.
controls (A375-pcDNA3 and A375 control cells). (C and F) Non-
tumor (PIG-1) vs. tumor (A375) cells. (A–C) Representative
Regulation of p27Kip1 by H2O2 Modulation
PLOS ONE | www.plosone.org 13 September 2012 | Volume 7 | Issue 9 | e44502

western blot images. (D–F) Relative densitometric values of cyclins
and CDKs. Actin densitometric values were used to standardize
for protein loading. Data are expressed as mean 6 SD. (D)
*p,0.05 and **p,0.01 vs. control untreated. (E) *p,0.05 vs.
A375 control (F) **p,0.01 vs. non-tumor cells.
(TIF)
Figure S4 Immunocytofluorescence confirmed the de-crease in cyclin D1 in response to catalase treatment inmelanoma cells. Monoclonal anti-cyclin D1 (A-12, Santa Cruz
Biotechnology) antibody, 1:300 in PBS, and secondary FITC-
conjugated anti-mouse IgG (Sigma) were used for immunocyto-
fluorescence technique. (A–B) Melanoma cells treated with 500
and 1000 U/ml catalase (CAT) for periods of 6 or 24 h or left
untreated. FBS starved cells were used as control of G1 arrest. (C–
D) Catalase overexpression model (A375-CAT-E9 cells) vs.
controls (A375-pcDNA3 and A375 control cells). (E–F) Non-
tumor (PIG-1) vs. tumor (A375) cells. (A, C and E) Representative
images of cyclin D1 immunocytofluorescence showing the
subcellular localization of the protein. DAPI: staining of nuclear
DNA; Cyclin D1: FITC staining of cyclin D1 protein. (B, D and F)
Percentage of positive cells for cyclin D1 relative to the total
number of counted cells. Data are expressed as mean 6 SD. (B)
**p,0.01 vs. untreated control. (D) **p,0.01 vs. A375 control. (F)
**p,0.01 vs. non-tumor cells.
(TIF)
Figure S5 Phosphorylation of p27Kip1 on T187 is notmodulated by H2O2 in melanoma cells. Melanoma (A375)
cells grown in complete medium with 10% FBS were arrested by
FBS starvation (0% FBS) for a period of 24 h or left untreated and
then cells were incubated with different concentrations of H2O2
(0.1 or 10 mM) or to 10% FBS. Untreated cells were incubated
with catalase 500 or 1000 U/ml. The expression of p27Kip1 and
p27pT187 were analyzed by western blot. (A) Representative
immunoblot images. (B) Relative densitometric values of
p27pT187 referred to p27Kip1. Actin densitometric values were
used to standardize for protein loading. Results are referred to
control incubated with 10% FBS.
(TIF)
Figure S6 Intracellular ROS levels in tumor cells ofdifferent origin determined by DCFH-DA assay. Colorec-
tal carcinoma cells (LoVo) exhibited lower intracellular ROS levels
than neuroblastoma (Paju) and melanoma (A375) cells. (A)
Representative histograms of DCF fluorescence: control cells not
exposed to DCFH-DA (&), control cells treated with catalase just
before DCFH-DA incubation ( ) and cells incubated with DCFH-
DA ( ). (B) DCF mean fluorescence (arbitrary units) of tumor cells.
Data are expressed as mean 6 SD. **p,0.01 vs. A375 cells.
(TIF)
Figure S7 Decrease of cyclin D1 by catalase was alsofound in colon adenocarcinoma and neuroblastomacells. The expression of cyclins and CDKs of G1/S was analyzed
by western blot in (A and C) LoVo and (B and D) Paju cells treated
with catalase (CAT) for 6 and 24 h. FBS starved cells were used as
control of G1 arrest. (A and B) Representative western blot images.
(C and D) Relative densitometric values of cyclins and CDKs.
Actin densitometric values were used to standardize for protein
loading. Data are expressed as mean 6 SD. **p,0.01 vs. control
untreated.
(TIF)
Figure S8 Low signal of cyclin D1 after catalasetreatment in LoVo and Paju cells by immunocytofluor-escence. See Methods S2 for immunocytofluorescence tech-
nique. (A) Representative images of cyclin D1 immunocytofluor-
escence showing the subcellular localization of the protein in
tumor cells treated with 500 and 1000 U/ml catalase (CAT) for
periods of 6 or 24 h compared to untreated controls. FBS starved
cells were used as control of G1 arrest. DAPI: staining of nuclear
DNA; Cyclin D1: FITC staining of cyclin D1 protein. (B)
Percentage of positive cells for cyclin D1 relative to the total
number of counted cells. Data are expressed as mean 6 SD.
**p,0.01 vs. untreated control.
(TIF)
Figure S9 Relocalization of p27Kip1 in colon adenocar-cinoma and neuroblastoma cells after 6 h of catalasetreatment. (A and B) Nuclear localization of p27Kip1 induced
by catalase (CAT) was detected by immunocytofluorescence. (A)
Representative images of p27Kip1 immunocytofluorescence
showing the subcellular localization of the protein. DAPI: staining
of nuclear DNA; p27Kip1: FITC staining of p27Kip1 protein. (B)
Percentage of positive cytoplasms (%) and positive nuclei (&) for
p27Kip1 relative to the total number of counted cells. (C and D)
Increase of p27Kip1 levels and decrease of p27Kip1 phosphor-
ylated at S10 (p27pS10) and T198 (p27pT198) in response to
H2O2 scavenging, analyzed by western blot. (C) Representative
immunoblot images. (D) Relative densitometric values of ( )
p27Kip1 levels, (%) p27pS10 and (&) p27pT198. Actin
densitometric values were used to standardize for protein loading.
Results are referred to control without treatment. (B and D) Data
are expressed as mean 6 SD. *p,0.05 and **p,0.01 vs.
untreated control. (A–D) FBS starved cells were used as control
of G1 arrest.
(TIF)
Methods S1 Catalase expression determination bywestern blot and measurement of catalase activity.
(DOC)
Methods S Detection of cyclin D1 by immunocyto-fluorescence.
(DOC)
Methods S3 Determination of G1/S regulatory proteinsand p27Kip1 phosphorylated at T187 by western blot.
(DOC)
Acknowledgments
The authors are grateful to Andrea C. Cruz for proofreading their work
and advising them on the use of the English language and to the members
of Departamento de Radiobiologıa, Comision Nacional de Energıa
Atomica, for their valuable assistance and continuous support. ILI thanks
her present supervisor, Dr. Ariel Chernomoretz (CONICET, UBA) for his
advice and guidance. The authors want to dedicate this work to the
memory of Dr. Estela Medrano.
Author Contributions
Conceived and designed the experiments: ILI HD. Performed the
experiments: ILI CB CN IT. Analyzed the data: ILI CB CN IT HD.
Contributed reagents/materials/analysis tools: BLM LLP HD. Wrote the
paper: ILI HD. Discussed the manuscript: ILI CB CN IT BLM LLP HD.
Regulation of p27Kip1 by H2O2 Modulation
PLOS ONE | www.plosone.org 14 September 2012 | Volume 7 | Issue 9 | e44502
2

References
1. Elledge SJ (1996) Cell cycle checkpoints: preventing an identity crisis. Science274: 1664–1672.
2. Sherr CJ (1996) Cancer cell cycles. Science 274: 1672–1677.
3. Borriello A, Cucciola V, Oliva A, Zappia V, Della Ragione F (2007) p27Kip1
metabolism: a fascinating labyrinth. Cell Cycle 6: 1053–1061.
4. Larrea MD, Hong F, Wander SA, da Silva TG, Helfman D, et al. (2009) RSK1drives p27Kip1 phosphorylation at T198 to promote RhoA inhibition and
increase cell motility. Proc. Natl. Acad. Sci. USA 106: 9268–9273.
5. Chu IM, Hengst L, Slingerland JM (2008) The Cdk inhibitor p27 in humancancer: prognostic potential and relevance to anticancer therapy. Nat. Rev.
Cancer 8: 253–267.
6. Rodier G, Montagnoli A, Di Marcotullio L, Coulombe P, Draetta GF, et al.
(2001) p27 cytoplasmic localization is regulated by phosphorylation on Ser10
and is not a prerequisite for its proteolysis. EMBO J. 20: 6672–6682.
7. Connor MK, Kotchetkov R, Cariou S, Resch A, Lupetti R, et al. (2003) CRM1/
Ran-mediated nuclear export of p27(Kip1) involves a nuclear export signal andlinks p27 export and proteolysis. Mol. Biol. Cell 14: 201–213.
8. Ishida N, Hara T, Kamura T, Yoshida M, Nakayama K, et al. (2002)
Phosphorylation of p27Kip1 on serine 10 is required for its binding to CRM1and nuclear export. J. Biol. Chem. 277: 14355–14358.
9. Larrea MD, Wander SA, Slingerland JM (2009) p27 as Jekyll and Hyde:regulation of cell cycle and cell motility. Cell Cycle 8: 3455–3461.
10. Vlach J, Hennecke S, Amati B (1997) Phosphorylation-dependent degradation of
the cyclin-dependent kinase inhibitor p27. EMBO J. 16: 5334–5344.
11. Sheaff RJ, Groudine M, Gordon M, Roberts JM, Clurman BE (1997) Cyclin E-
CDK2 is a regulator of p27Kip1. Genes Dev. 11: 1464–1478.
12. Liang J, Zubovitz J, Petrocelli T, Kotchetkov R, Connor MK, et al. (2002) PKB/
Akt phosphorylates p27, impairs nuclear import of p27 and opposes p27-
mediated G1 arrest. Nat. Med. 8: 1153–1160.
13. Shin I, Yakes FM, Rojo F, Shin NY, Bakin AV, et al.(2002) PKB/Akt mediates
cell-cycle progression by phosphorylation of p27(Kip1) at threonine 157 andmodulation of its cellular localization. Nat. Med. 8: 1145–1152.
14. Viglietto G, Motti ML, Bruni P, Melillo RM, D’Alessio A, et al. (2002)
Cytoplasmic relocalization and inhibition of the cyclin-dependent kinaseinhibitor p27(Kip1) by PKB/Akt-mediated phosphorylation in breast cancer.
Nat. Med. 8: 1136–1144.
15. Larrea MD, Liang J, Da Silva T, Hong F, Shao SH, et al. (2008)Phosphorylation of p27Kip1 regulates assembly and activation of cyclin D1-
Cdk4. Mol. Cell. Biol. 28: 6462–6472.
16. Grimmler M, Wang Y, Mund TM, Cilensek Z, Keidel EM, et al. (2007) Cdk-
inhibitory activity and stability of p27Kip1 are directly regulated by oncogenictyrosine kinases. Cell 128: 269–280.
17. Chu I, Sun J, Arnaout A, Kahn H, Hanna W, et al. (2007) p27 phosphorylation
by Src regulates inhibition of cyclin E-Cdk2. Cell 128: 281–294.
18. Chen G, Cheng Y, Zhang Z, Martinka M, Li G (2011) Prognostic significance of
cytoplasmic p27 expression in human melanoma. Cancer Epidemiol Biomarkers
Prev. 20: 2212–2221.
19. Davies KJ (2000) Oxidative stress, antioxidant defenses, and damage removal,
repair, and replacement systems. IUBMB Life 50: 279–289.
20. Antunes F, Cadenas E (2001) Cellular titration of apoptosis with steady state
concentrations of H2O2: submicromolar levels of H2O2 induce apoptosis
through Fenton chemistry independent of the cellular thiol state. Free Radic.Biol. Med. 30: 1008–1018.
21. Carreras MC, Converso DP, Lorenti AS, Barbich M, Levisman DM, et al.(2004) Mitochondrial nitric oxide synthase drives redox signals for proliferation
and quiescence in rat liver development. Hepatology 40: 157–166.
22. Arnold RS, Shi J, Murad E, Whalen AM, Sun CQ, et al. (2001) Hydrogenperoxide mediates the cell growth and transformation caused by the mitogenic
oxidase Nox1. Proc. Natl. Acad. Sci. USA 98: 5550–5555.
23. Policastro L, Molinari B, Larcher F, Blanco P, Podhajcer OL, et al. (2004)
Imbalance of antioxidant enzymes in tumor cells and inhibition of proliferation
and malignant features by scavenging hydrogen peroxide. Mol. Carcinog. 39:103–113.
24. Laurent A, Nicco C, Chereau C, Goulvestre C, Alexandre J, et al. (2005)Controlling tumor growth by modulating endogenous production of reactive
oxygen species. Cancer Res. 65: 948–956.
25. Onumah OE, Jules GE, Zhao Y, Zhou L, Yang H, et al. (2009) Overexpressionof catalase delays G0/G1- to S-phase transition during cell cycle progression in
mouse aortic endothelial cells. Free Radic. Biol. Med. 46: 1658–1667.
26. Stone JR, Yang S (2006) Hydrogen peroxide: a signaling messenger. Antioxid.
Redox Signal. 8: 243–270.
27. Cakir Y. Ballinger SW (2005) Reactive species-mediated regulation of cellsignaling and the cell cycle: the role of MAPK. Antioxid. Redox Signal. 7: 726–
740.
28. Benhar M, Engelberg D, Levitzki A (2002) ROS, stress-activated kinases andstress signaling in cancer. EMBO Rep. 3: 420–425.
29. Behrend L, Henderson G, Zwacka RM (2003) Reactive oxygen species inoncogenic transformation. Biochem. Soc. Trans. 31: 1441–1444.
30. Burhans WC, Heintz NH (2009) The cell cycle is a redox cycle: linking phase-
specific targets to cell fate. Free Radic. Biol. Med. 47: 1282–1293.
31. Menon SG, Sarsour EH, Spitz DR, Higashikubo R, Sturm M, et al. (2003)
Redox regulation of the G1 to S phase transition in the mouse embryo fibroblast
cell cycle. Cancer Res. 63: 2109–2117.
32. Sarsour EH, Kumar MG, Chaudhuri L, Kalenand AL, Goswami PC (2009)
Redox control of the cell cycle in health and disease. Antioxid. Redox Signal. 11:
2985–3011.
33. Burch PM, Heintz NH (2005) Redox regulation of cell-cycle re-entry: cyclin D1
as a primary target for the mitogenic effects of reactive oxygen and nitrogen
species. Antioxid. Redox Signal. 7: 741–751.
34. Felty Q, Singh KP, Roy D (2005) Estrogen-induced G1/S transition of G0-
arrested estrogen-dependent breast cancer cells is regulated by mitochondrial
oxidant signaling. Oncogene 24: 4883–4893.
35. Ibanez IL, Policastro LL, Tropper I, Bracalente C, Palmieri MA, et al. (2011)
H2O2 scavenging inhibits G1/S transition by increasing nuclear levels of
p27KIP1. Cancer Lett. 305: 58–68.
36. Picardo M, Grammatico P, Roccella F, Grandinetti M, del Porto G, et al. (1996)
Imbalance in the antioxidant pool in melanoma cells and normal melanocytes
from patients with melanoma. J Invest Dermatol 107(3): 322–326.
37. Ibanez IL, Notcovich C, Policastro LL and Duran H (2011). Reactive Oxygen
Species in the Biology of Melanoma. In: Yohei Tanaka, editor. Breakthroughs in
Melanoma Research, InTech. 1–30.
38. Gidanian S, Mentelle M, Meyskens FL, Jr., Farmer PJ (2008) Melanosomal
damage in normal human melanocytes induced by UVB and metal uptake–a
basis for the pro-oxidant state of melanoma. Photochem Photobiol 84(3): 556–
564.
39. McCord JM (1995) Superoxide radical: controversies, contradictions, and
Paradoxes. Proc. Soc. Exp. Biol. Med. 209: 112–117.
40. Szatrowski TP, Nathan CF (1991) Production of large amounts of hydrogen
peroxide by human tumor cells. Cancer Res. 51: 794–798.
41. Brar SS, Kennedy TP, Whorton AR, Sturrock AB, Huecksteadt TP, et al.(2001)
Reactive oxygen species from NAD(P)H:quinone oxidoreductase constitutively
activate NF-kappaB in malignant melanoma cells. Am. J. Physiol. Cell. Physiol.
280: C659–C676.
42. Toyokuni S, Okamoto K, Yodoi J, Hiai H (1995) Persistent oxidative stress in
cancer. FEBS Lett. 358: 1–3.
43. Kondo S, Toyokuni S, Iwasa Y, Tanaka T, Onodera H, et al. (1999) Persistent
oxidative stress in human colorectal carcinoma, but not in adenoma. Free Radic.
Biol. Med. 27: 401–410.
44. Policastro LL, Ibanez IL, Duran HA, Soria G, Gottifredi V, et al. (2009)
Suppression of cancer growth by nonviral gene therapy based on a novel reactive
oxygen species-responsive promoter. Mol. Ther. 17: 1355–1364.
45. Aykin-Burns N, Ahmad IM, Zhu Y, Oberley LW, Spitz DR (2009) Increased
levels of superoxide and H2O2 mediate the differential susceptibility of cancer
cells versus normal cells to glucose deprivation. Biochem J. 418: 29–37.
46. Martın V, Herrera F, Garcıa-Santos G, Antolın I, Rodriguez-Blanco J, et al.
(2007) Signaling pathways involved in antioxidant control of glioma cell
proliferation. Free Radic. Biol. Med. 42: 1715–1722.
47. Preston TJ, Muller WJ, Singh G (2001) Scavenging of extracellular H2O2 by
catalase inhibits the proliferation of HER-2/Neu-transformed rat-1 fibroblasts
through the induction of a stress response. J. Biol. Chem. 276: 9558–9564.
48. Weber JD, Raben DM, Phillips PJ, Baldassare JJ (1997) Sustained activation of
extracellular-signal-regulated kinase 1 (ERK1) is required for the continued
expression of cyclin D1 in G1 phase. Biochem. J. 326: 61–68.
49. Menon SG, Sarsour EH, Kalen AL, Venkataraman S, Hitchler MJ, et al. (2007)
Superoxide signaling mediates N-acetyl-L-cysteineinduced G1 arrest: regulatory
role of cyclin D1 and manganese superoxide dismutase. Cancer Res. 67: 6392–
6399.
50. Deng X, Gao F, May WS Jr. (2003) Bcl2 retards G1/S cell cycle transition by
regulating intracellular ROS. Blood 102: 3179–85.
51. Valko M, Leibfritz D, Moncol J, Cronin MT, Mazur M, et al. (2007) Free
radicals and antioxidants in normal physiological functions and human disease.
Int. J. Biochem. Cell Biol. 39: 44–84.
52. Roux PP, Richards SA, Blenis J (2003) Phosphorylation of p90 ribosomal S6
kinase (RSK) regulates extracellular signal-regulated kinase docking and RSK
activity. Mol. Cell Biol. 23: 4796–4804.
53. Nacusi LP, Sheaff RJ (2006) Akt1 sequentially phosphorylates p27kip1 within a
conserved but non-canonical region. Cell Div. 1: 11.
54. Boehm M, Yoshimoto T, Crook MF, Nallamshetty S, True A, et al. (2002) A
growth factor-dependent nuclear kinase phosphorylates p27(Kip1) and regulates
cell cycle progression. EMBO J. 21: 3390–3401.
55. Abe J, Okuda M, Huang Q, Yoshizumi M, Berk BC (2000) Reactive oxygen
species activate p90 ribosomal S6 kinase via Fyn and Ras. J. Biol. Chem. 275:
1739–1748.
56. Denicourt C, Saenz CC, Datnow B, Cui XS, Dowdy SF(2007) Relocalized
p27Kip1 tumor suppressor functions as a cytoplasmic metastatic oncogene in
melanoma. Cancer Res. 67: 9238–43.
57. Wander SA, Zhao D, Slingerland JM (2011) p27: a barometer of signaling
deregulation and potential predictor of response to targeted therapies. Clin
Cancer Res. 17: 12–8.
Regulation of p27Kip1 by H2O2 Modulation
PLOS ONE | www.plosone.org 15 September 2012 | Volume 7 | Issue 9 | e44502

58. Schiappacassi M, Lovisa S, Lovat F, Fabris L, Colombatti A, et al. (2011) Role of
T198 Modification in the Regulation of p27Kip1 Protein Stability and Function.
PLoS ONE 6: e17673.
59. Bottini C, Platini F, Rinaldi M, Leutner M, Alabiso O, et al. (2009) p27Kip1 is
inactivated in human colorectal cancer by cytoplasmic localization associated
with activation of Akt/PKB. Int J Oncol. 34(1): 69–77.
60. Le Poole IC, Van den Berg FM, Van den Wijngaard RM, Galloway DA, Van
Amstel PJ, et al. (1997) Generation of a human melanocyte cell line by
introduction of HPV16 E6 and E7 genes. In Vitro Cell Dev. Biol. Anim. 33: 42–
49.
61. Chen D, Xu W, Bales E, Colmenares C, Conacci-Sorrell M, et al. (2003) SKI
activates Wnt/beta-catenin signaling in human melanoma. Cancer Res. 63:6626–6634.
62. Poso H, Karvonen E, Suomalainen H, Andersson LC (1984) A human
neuroblastoma cell line with an altered ornithine decarboxylase. J. Biol. Chem,259: 12307–12310.
63. Zhang K, Westberg J, Holta E, Andersson L (1996) BCL2 regulates neuraldifferentiation. Proc. Natl. Acad. Sci. USA 93: 4504–4508.
64. Liu Y, Peterson DA, Kimura H, Schubert D (1997) Mechanism of cellular 3-
(4,5-dimethylthiazol-2-y1)-2,5-diphenyltetrazolium bromide (MTT) reduction. J.Neurochem. 69: 581–593.
Regulation of p27Kip1 by H2O2 Modulation
PLOS ONE | www.plosone.org 16 September 2012 | Volume 7 | Issue 9 | e44502
Related Documents