Processing Abilities Associated with Phonologic and Orthographic Skills in Adult Learning Disability QUERY SHEET Q1: Au: Pls, provide date Q2: Au: Pls. complete ref Q3: Au: Figure is very poor quality will need new files

Welcome message from author
This document is posted to help you gain knowledge. Please leave a comment to let me know what you think about it! Share it to your friends and learn new things together.
Transcript
Processing Abilities Associated with Phonologic and Orthographic Skills in Adult Learning Disability
QUERY SHEET
Q1: Au: Pls, provide dateQ2: Au: Pls. complete refQ3: Au: Figure is very poor quality will need new files
1
Journal of Clinical and Experimental Neuropsychology, 27:1–11, 2005Copyright © Taylor & Francis Ltd.ISSN: 1380-3395DOI: 10.1080/138033990520197
Journal of Clinical and Experimental Neuropsychology275Taylor & FrancisTaylor and Francis 325 Chestnut StreetPhiladelphiaPA191061380-3395NCENTaylor & Francis Ltd.3636110.1080/1380339905201972005128D. Osmon et al.Processing Skills in Learning Disability
Processing Abilities Associated with Phonologic and Orthographic Skills in Adult Learning Disability
DAVID C. OSMON, MICHELLE M. BRAUN, ANDELIZABETH A. PLAMBECK
University of Wisconsin-Milwaukee, Milwaukee, WI, USA
Measures of orthographic and phonologic skills were related to co-normed WoodcockJohnson-Revised (WJ-R) cognitive measures in 138 college age, learning problemadults. Only orthographic deficits were associated with a processing disorder(p<.001). Selective processing abilities were associated with phonologic (p<.001,∆adj R2=.053) and orthographic (p<.001, ∆adj R2=.047) skills after removal of vari-ance associated with general intelligence. Analyses found common processing abilitiesacross both phonologic and orthographic skills for WJ-R visual processing (–Gv) andshort-term memory processing factors (Gsm) (p<.001). Cluster analysis established aphonologic deficit and a double deficit (phonologic and orthographic) group. Discus-sion relates results to the differences between adult and child reading decoding defi-cits, the lack of a selective orthographically impaired subtype of dyslexia, and theevidence of visual processing compensation for reading problems.
Introduction
Recent research has provided mixed evidence on at least three important questions regardingthe factors underlying adult reading ability. First, although it is well known that readingconsists of at least two neuropsychological abilities (orthography, involving the visualperceptual skill of reading, and phonology, involving the auditory perceptual skill of read-ing; Bowers, Sunseth, & Golden, 1999; Galaburda, 1994; Pugh et al. 2001; Wolf, 1999),to what extent are these processes interdependent? Second, do visual perceptual abilitiesunderlie orthographic processing? Third, is there support for the finding that adults relymore on orthographic versus phonological processes in reading? Examination of theseissues, as discussed below, are vital to informing our understanding of the cognitivecomponents and potential treatment of reading disability.
Researchers have demonstrated independent orthographic-visual or phonologic-auditorydeficits in young poor readers (Morris et al., 1998; Wolf, 1999) and have shown thatorthographic and phonological skills are core components of reading ability (e.g., dyslexicswith a single deficit in orthographic skill performed as poorly on several aspects of read-ing as a group with a single deficit in phonologic skill; Wolf, 1999). It has been furtherdemonstrated that deficits in both phonological awareness and serial naming tasks (com-ponents of orthographic processing) are the strongest predictors of reading problems(Catts, 1996). In fact, Wolf (1999), in examining three groups of impaired readers, foundthat the most impaired had dual deficits in orthographic and phonologic skills (the two
Address correspondence to David C. Osmon, Ph.D., Department of Psychology, University ofWisconsin-Milwaukee, 2441 E. Hartford Ave, Milwaukee, WI 53211. E-mail: [email protected]
Accepted Q1
Q3
5
10
15
20
25
30
35
NCEN363611.fm Pag e 1 M o nday , April 11, 2005 10:59 AM
2 D. Osmon et al.
remaining groups had a single deficit in either orthographic or phonologic skills). As aresult, Wolf (1999) postulated a Double Deficit hypothesis, recognizing serial namingspeed deficits (components of orthographic processing) as a core problem equal in impor-tance to phonologic difficulties in dyslexia.
Investigation of the cognitive components underlying orthography and phonologymay be especially useful to our understanding of the etiology and treatment of dyslexia.Overall, relatively more is known about the underlying aspects of phonological as opposedto orthographic deficits in dyslexia: phonological deficits have been linked to auditoryperceptual processing disorders (Evans, Floyd, McGrew, & Leforgee, 2002; Tallal, 1980;Wagner & Torgesen, 1987), and deficits on the auditory processing factor (Ga) of theWoodcock Johnson-Revised (WJ-R) battery have been associated with dyslexia in generaland phonologic deficits in particular (Vanderwood, McGrew, Flanagan, & Keith, 2001).
Although few researchers have investigated the existence of a processing disorderunderlying orthographic deficits, there is converging evidence to justify an examination ofvisual perceptual skills as they relate to orthographic processing. For example, Seidenbergand Tanenhaus (1979), in their study on the facilitation of rhyme detection by orthographicsimilarity (e.g., pie-tie faster than rye-tie), showed the importance of visual perceptual def-icits in understanding reading problems. In addition, Bowers, Golden, Kennedy, & Young(1994) connected naming speed deficits with visual perceptual ability and found that serialnaming accounted for variance in orthographic skills above and beyond variance related tophonologic skills and level of print exposure. Visual processing deficits in dyslexia havealso been observed in a variety of other tasks, including: (a) low level visual perceptualtasks (visual flicker fusion; Talcott et al., 1998) and spatial frequency gratings (Martin &Lovegrove, 1987); (b) complex visual perceptual tasks (Wolf, Bowers, & Biddle, 2000),which have an even greater relationship to orthographic deficits than do low level visual per-ceptual deficits (suggesting that orthographic deficits are linked to a higher level intellectualprocessing disorder); (c) homophone tasks (e.g., which can be eaten: meet, meat?:Hultquist, 1997); and (d) orthographic choice and embedded word tests (Hultquist, 1997).Overall, results of such studies have led to the consensus that implicit knowledge of thevisual regularities in orthography are poorly developed in those who are slow to identifyletters and words (Manis, Doi, & Bhadha 2000).
Despite the evidence for visual processing deficits in dyslexia, Evans, et al. (2002)found that visual processing (WJ-R Gv) was unrelated to reading problems in children,and other research suggests visual processing may be a strength. For example, Siegel,Share, and Geva (1995) showed dyslexics performed superior to normal readers on anorthographic task requiring judgment of the word-like quality of nonsense words with legalor illegal letter combinations (e.g., which looks most like it could be a word: flik-fkil?).Since performance on this task requires the ability to detect regularities in letter combinations,visual whole word recognition ability assumes an important role in explaining dyslexics’better performance.
Conflicting findings with regard to visual processing skills suggest the possibility thatsubgroups of dyslexics exist, some with visual processing deficits and others with visualprocessing strengths. Such a division in visual ability between dyslexic groups might rea-sonably be expected to worsen as progress through school ensues and individuals divergein compensatory practices. As a result of this divergence, dyslexic adults may showgreater variance in visual-orthographic performance than dyslexic children. Some evi-dence suggests the dual deficits of dyslexia develop along a trajectory with orthographicskills developing later than phonologic skills. For example, it has been demonstrated thatphonologic skills are more predictive of reading difficulty in early grade school years and
40
45
50
55
60
65
70
75
80
85
NCEN363611.fm Pag e 2 M o nday , April 11, 2005 10:59 AM
Processing Skills in Learning Disability 3
orthographic skills are more predictive of reading difficulty in later school years (Badian,2001), especially as word recognition skills become automatic and fluent with practice(van der Leij & van Daal, 1999). In addition, there is evidence of a decreasing relationshipbetween phonologic and orthographic skills over the first few years of schooling (Wolf et al.2000) so that as reading skills develop and become automatic, phonologic and ortho-graphic skills separate into independent processes. Furthermore, it has been shown thatautomatic visual-orthographic skills become more associated with reading comprehensionover time (Perfetti, 1985). In addition to the importance of phonologic and orthographicskills, several researchers have demonstrated the importance of short-term memory andworking memory to reading (Evans, et al. 2002; Mann & Lieberman, 1984; Swanson, 1989).
Overall, despite the mixed evidence for visual perceptual deficits in dyslexia and thepossibility that adults may exhibit different underlying cognitive weaknesses than childrenin regard to reading impairment (i.e., more orthographic than phonological impairment),little research has utilized a comprehensive multifactorial intelligence battery to evaluatevisual processing weaknesses/strengths underlying orthographic skill in adults with read-ing deficits. Examination of this issue, in the context of a concurrent examination of thecomponent underlying phonological processing, would provide information about (a) therelative importance of phonological versus orthographic processes in adult reading disor-der, and (b) the cognitive components underlying phonological and orthographic skills.
For the present study, measures of orthographic and phonologic skills were chosenfrom the Woodcock-Johnson-Revised (WJ-R) battery. The advantage of the WJ-R batterylies in its co-normed measures of both cognitive processing abilities and reading achieve-ment (Garcia & Stafford, 2000) so that underlying processing disorders may be examined.Additionally, the WJ-R assesses the full range of intellectual abilities based on the theoret-ical approach of Cattell-Horn-Carroll (McGrew, Flanagan, Keith, & Vanderwood, 1997).
Reading achievement measures included the WJ-R Word Attack (WA) task, predom-inantly taxing phonologic skills, and the Letter Word Identification (LWI) task, predomi-nantly taxing orthographic skills. The choice of WA relied upon the widely acknowledgedpractice of using tasks of nonsense word reading to measure phonologic skill (orthographyis typically of limited use in pronouncing an unfamiliar word). However, it is recognizedthat intimate familiarity with the orthography of a language does allow one to construct ananalogy between known words and the nonsense word and, thereby, to facilitate pronunci-ation (Baron, 1979). In this way, even though nonsense word reading tasks like WA aremainstream measures of phonology, orthography can influence phonology so that evenWA has orthographic components, allowing correlations between WA and LWI (Bowers,Steffy, & Tate, 1988).
The WJ-R LWI task was utilized as a primary orthographic measure due to its highcorrelation with orthographic tasks (Manis et al., 2000) and its better prediction than WAby serial naming tasks (Bowers et al. 1988). The seven factors of the WJ-R cognitive batterywere chosen as the measures of processing ability underlying reading achievement (McGrewet al. 1997) because the WJ-R comprehensively surveys the seven Horn-Cattell-Carroll-proposed factors of intelligence (long-term retrieval, short-term memory, processing speed,auditory processing, visual processing, crystallized intelligence, and fluid intelligence).
The current study attempted to evaluate whether processing disorders in college ageadults underlie the dual deficits associated with dyslexia. The following hypotheses weremade based on the Double Deficit model of reading disability:
1. Based upon the accepted relationship of phonologic awareness to reading, it was predictedthat lower scores on the WJ-R auditory processing factor (Ga) would be related to WA.
90
95
100
105
110
115
120
125
130
135
NCEN363611.fm Pag e 3 M o nday , April 11, 2005 10:59 AM
4 D. Osmon et al.
2. Based upon the growing literature demonstrating an association between orthographicskill and reading, it was predicted that the WJ-R visual processing factor (Gv) would berelated to LWI performance with poorer Gv scores in the LWI deficit group.
3. Based upon the demonstrated relationship between primary memory and general read-ing ability, it was predicted that the WJ-R short-term memory processing factor (Gsm)would be related to both LWI and WA performance with poorer Gsm scores in both theLWI and WA deficit groups.
4. Based upon the theory that general verbal-conceptual ability relates to reading compre-hension via the direct visual route, it was predicted that the WJ-R crystallized intelli-gence factor (Gc) would be related to LWI performance with poorer Gc scores in theLWI deficit group.
5. Consistent with past findings, it was predicted that specific intellectual processes wouldcontribute to orthographic and phonologic aspects of reading above and beyond thecontribution of general intelligence. Furthermore, it was predicted that Ga wouldexplain unique variance in phonologic skill and that Gv and Gc would explain uniquevariance in orthographic skill while Gsm would contribute to both phonologic andorthographic skills.
6. By inference from conflictual past findings of both visual strengths and weaknesses indyslexics, it was predicted that subtypes of adult poor readers would exist with differingvisual processing abilities.
Method
Participants
Participants were 138 students (63 males and 75 females) at an urban university consecu-tively referred for an assessment of learning disability (LD). Ages ranged from 18 to 54years (M = 27.57 SD = 9.78), and because all were currently enrolled in college, educationranged from 12–18 years (M = 14.17; SD = 1.63). Summary measures of intelligence(WJ-R Broad Cognitive Ability) revealed a mean of 97 (SD=11) and a mean WJ-R BroadReading score of 96 (SD=17) with mean WJ-R Letter Word Identification of 95 (SD=18)and WJ-R Word Attack of 91 (SD=20). The sample was 90% Caucasian, 7% African-American, and 3% multiracial. Exclusionary criteria consisted of a diagnosis of psychosisor a neurological condition including traumatic brain injury for which hospitalizationoccurred. All participants were treated in accordance with university regulations regardinghuman research subjects. For purposes of comparison, participants were divided into fourgroups composed of good (scores >85) and poor scores (scores<86) separately for WAand LWI. Twenty-eight participants were in the low WA/low LWI group (13 males; 15females), 11 participants were in the low LWI/high WA (6 males; 5 females), 16 were inthe high LWI/low WA (9 males; 7 females), and 83 were in the high LWI/high WA (37males; 46 females). Age and education did not significantly differ between groups (F[1,137]=.09-1.70, p>05; F[1, 137]=.04-1.90, p>05, respectively).
Procedure
All participants underwent a broad-based neuropsychological evaluation consisting ofapproximately seven hours of testing broken over two days of testing approximately oneweek apart. The examiner was not aware of hypotheses. Tasks were administered in afixed order.
140
145
150
155
160
165
170
175
NCEN363611.fm Pag e 4 M o nday , April 11, 2005 10:59 AM
Processing Skills in Learning Disability 5
Measures
Woodcock Johnson-Revised. The WJ-R was designed to evaluate a wide range of neuropsy-chologically-relevant abilities, based on the information-processing approach of the Horn-Cattell-Carroll theory of intelligence (Flanagan, Genshaft, & Harrison, 1997). Participantscompleted the standard and supplemental Tests of Cognitive Ability and Achievement. Mea-sures used in the present study included the seven factors of intelligence, the general compositefactor of intelligence, and two achievement measures, as described below: 1) Glr (long-termretrieval), 2) Gsm (short-term memory), 3) Gs (processing speed), 4) Ga (auditory process-ing), 5) Gv (visual processing), 6) Gc (crystallized intelligence), 7) Gf (fluid intelligence),8) BCAStandard (broad cognitive factor of intelligence), 9) Word Attack (phonologic measureof reading achievement), and 10) Letter Word Identification (orthographic measures of read-ing achievement). The BCAStd is a cluster score derived from these seven standard subtests,and represents a general measure of intellectual ability. In addition, participants completedthe three math subtests in the Tests of Achievement that make up the BM composite score.These included Calculation, which requires completion of written math problems; AppliedProblems, which requires solutions to word problems; and Quantitative Concepts, which con-sists of rapid simple arithmetic. Raw scores across all subtests were age corrected.
Results
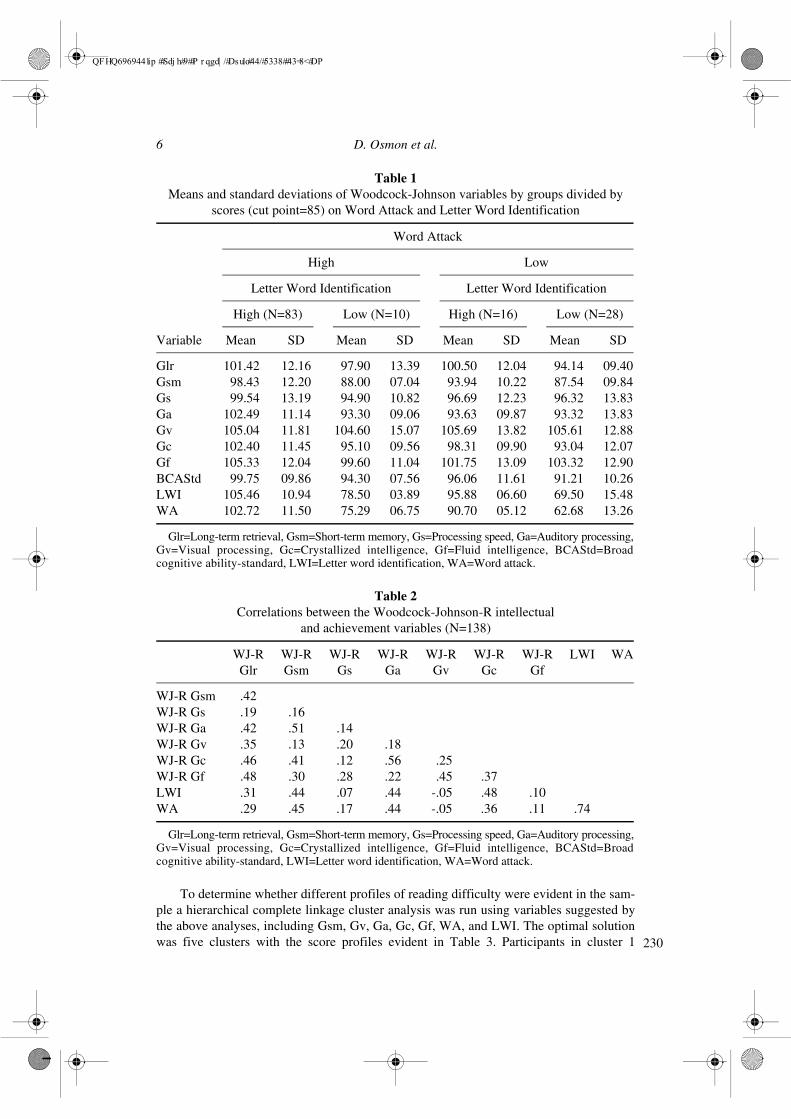
Table 1 shows the mean scores and standard deviations by group; Table 2 shows generallymoderate correlations between the seven intelligence factors and moderately high correla-tions, sharing approximately 54% of the sample variance, between LWI and WA.
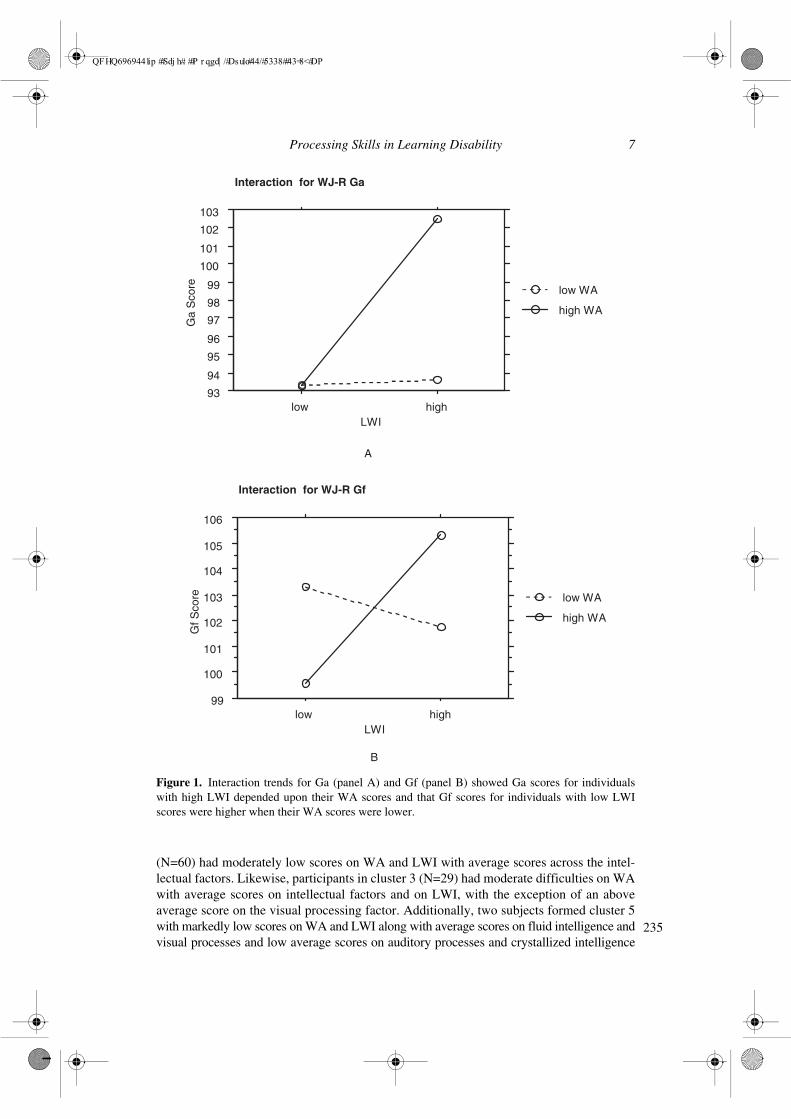
To explore the relationship of WA and LWI to intellectual performance, 2 (high vs.low LWI scores) x 2 (high vs. low WA scores) factorial ANOVAs were computed onintellectual factors. Main effects for LWI were evident on Gsm (F[1, 133]=10.65, p<.002),Gc (F[1, 133]=5.89, p<.02), and BCAStd (F[1, 133]=5.02, p<.03). Trends toward signifi-cant effects were evident on Glr (F[1, 133]=3.37, p<.07) and Ga (F[1, 133]=3.85, p<.06)for LWI and a trend for Ga (F[1, 133]=3.34, p<.07) on WA. There were no other signifi-cant main effects for WA, and there were no significant interactions, although trends forinteractions were present on Ga (F[1, 133]=3.37, p<.07) and Gf (F[1, 133]=1.68, p<.2).These trends are evident in Figure 1. Specifically, those with poor LWI scores had virtu-ally identical Ga scores (93.32 vs. 93.30) regardless of their WA scores while those withhigh LWI scores had significantly different Ga scores (93.63 vs. 102.49), depending upontheir WA scores. In contrast, individuals with poor LWI scores had better Gf scores (99.60vs. 103.32) when their WA scores were poor while those with good LWI scores had betterGf scores (105.33 vs. 101.75) when their WA scores were good.
Because intellectual factors were correlated, stepwise multiple regression was used todetermine which factors predicted unique variance in the predominantly phonological pro-cesses of WA and the greater orthographic processes of LWI. In order to measure uniquespecific variance BCAStd was forced into the regressions to take out general intellectualvariance. A total of 29.0% of the variance in WA was predicted by BCAStd (F[1,135]=24.06, p<.001, adjR2=.145), –Gv (F[2, 134]=19.77, p<.001, change in adjR2=.071),Ga (F[3, 133]=17.69, p<.001, change in adjR2=.053), and Gsm (F[4, 132]=14.67, p<.001,change in adjR2=.021). A total of 32.1% of the variance in LWI was predicted by BCAStd(F[1, 135]=28.50, p<.001, adjR2=.169), –Gv (F[2, 134]=23.50, p<.001, change in adjR2=.080),Gc (F[3, 133]=20.09, p<.001, change in adjR2=.047), and Gsm (F[4, 132]=17.09, p<.001,change in adjR2=.025).
180
185
190
195
200
205
210
215
220
225
NCEN363611.fm Pag e 5 M o nday , April 11, 2005 10:59 AM
6 D. Osmon et al.
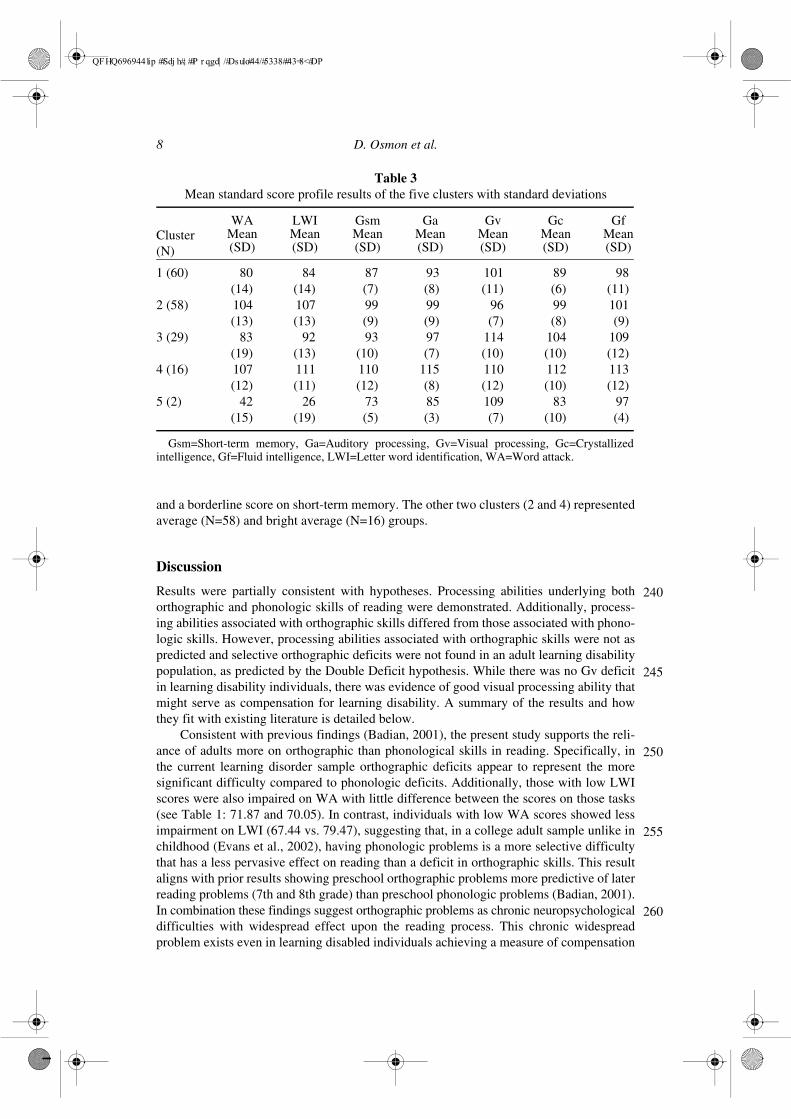
To determine whether different profiles of reading difficulty were evident in the sam-ple a hierarchical complete linkage cluster analysis was run using variables suggested bythe above analyses, including Gsm, Gv, Ga, Gc, Gf, WA, and LWI. The optimal solutionwas five clusters with the score profiles evident in Table 3. Participants in cluster 1
Table 1Means and standard deviations of Woodcock-Johnson variables by groups divided by
scores (cut point=85) on Word Attack and Letter Word Identification
Variable
Word Attack
High Low
Letter Word Identification Letter Word Identification
High (N=83) Low (N=10) High (N=16) Low (N=28)
Mean SD Mean SD Mean SD Mean SD
Glr 101.42 12.16 97.90 13.39 100.50 12.04 94.14 09.40Gsm 98.43 12.20 88.00 07.04 93.94 10.22 87.54 09.84Gs 99.54 13.19 94.90 10.82 96.69 12.23 96.32 13.83Ga 102.49 11.14 93.30 09.06 93.63 09.87 93.32 13.83Gv 105.04 11.81 104.60 15.07 105.69 13.82 105.61 12.88Gc 102.40 11.45 95.10 09.56 98.31 09.90 93.04 12.07Gf 105.33 12.04 99.60 11.04 101.75 13.09 103.32 12.90BCAStd 99.75 09.86 94.30 07.56 96.06 11.61 91.21 10.26LWI 105.46 10.94 78.50 03.89 95.88 06.60 69.50 15.48WA 102.72 11.50 75.29 06.75 90.70 05.12 62.68 13.26
Glr=Long-term retrieval, Gsm=Short-term memory, Gs=Processing speed, Ga=Auditory processing,Gv=Visual processing, Gc=Crystallized intelligence, Gf=Fluid intelligence, BCAStd=Broadcognitive ability-standard, LWI=Letter word identification, WA=Word attack.
Table 2Correlations between the Woodcock-Johnson-R intellectual
and achievement variables (N=138)
WJ-RGlr
WJ-RGsm
WJ-RGs
WJ-RGa
WJ-RGv
WJ-RGc
WJ-RGf
LWI WA
WJ-R Gsm .42WJ-R Gs .19 .16WJ-R Ga .42 .51 .14WJ-R Gv .35 .13 .20 .18WJ-R Gc .46 .41 .12 .56 .25WJ-R Gf .48 .30 .28 .22 .45 .37LWI .31 .44 .07 .44 -.05 .48 .10WA .29 .45 .17 .44 -.05 .36 .11 .74
Glr=Long-term retrieval, Gsm=Short-term memory, Gs=Processing speed, Ga=Auditory processing,Gv=Visual processing, Gc=Crystallized intelligence, Gf=Fluid intelligence, BCAStd=Broadcognitive ability-standard, LWI=Letter word identification, WA=Word attack.
230
NCEN363611.fm Pag e 6 M o nday , April 11, 2005 10:59 AM
Processing Skills in Learning Disability 7
(N=60) had moderately low scores on WA and LWI with average scores across the intel-lectual factors. Likewise, participants in cluster 3 (N=29) had moderate difficulties on WAwith average scores on intellectual factors and on LWI, with the exception of an aboveaverage score on the visual processing factor. Additionally, two subjects formed cluster 5with markedly low scores on WA and LWI along with average scores on fluid intelligence andvisual processes and low average scores on auditory processes and crystallized intelligence
Figure 1. Interaction trends for Ga (panel A) and Gf (panel B) showed Ga scores for individualswith high LWI depended upon their WA scores and that Gf scores for individuals with low LWIscores were higher when their WA scores were lower.
99
100
101
102
103
104
105
106
GfS
core
low highLWI
high WA
low WA
Interaction for WJ-R Gf
93
94
95
96
97
98
99
100
101
102
103
Ga
Sco
re
low highLWI
high WA
low WA
Interaction for WJ-R Ga
A
B
235
NCEN363611.fm Pag e 7 M o nday , April 11, 2005 10:59 AM
8 D. Osmon et al.
and a borderline score on short-term memory. The other two clusters (2 and 4) representedaverage (N=58) and bright average (N=16) groups.
Discussion
Results were partially consistent with hypotheses. Processing abilities underlying bothorthographic and phonologic skills of reading were demonstrated. Additionally, process-ing abilities associated with orthographic skills differed from those associated with phono-logic skills. However, processing abilities associated with orthographic skills were not aspredicted and selective orthographic deficits were not found in an adult learning disabilitypopulation, as predicted by the Double Deficit hypothesis. While there was no Gv deficitin learning disability individuals, there was evidence of good visual processing ability thatmight serve as compensation for learning disability. A summary of the results and howthey fit with existing literature is detailed below.
Consistent with previous findings (Badian, 2001), the present study supports the reli-ance of adults more on orthographic than phonological skills in reading. Specifically, inthe current learning disorder sample orthographic deficits appear to represent the moresignificant difficulty compared to phonologic deficits. Additionally, those with low LWIscores were also impaired on WA with little difference between the scores on those tasks(see Table 1: 71.87 and 70.05). In contrast, individuals with low WA scores showed lessimpairment on LWI (67.44 vs. 79.47), suggesting that, in a college adult sample unlike inchildhood (Evans et al., 2002), having phonologic problems is a more selective difficultythat has a less pervasive effect on reading than a deficit in orthographic skills. This resultaligns with prior results showing preschool orthographic problems more predictive of laterreading problems (7th and 8th grade) than preschool phonologic problems (Badian, 2001).In combination these findings suggest orthographic problems as chronic neuropsychologicaldifficulties with widespread effect upon the reading process. This chronic widespreadproblem exists even in learning disabled individuals achieving a measure of compensation
Table 3Mean standard score profile results of the five clusters with standard deviations
Cluster(N)
WA LWI Gsm Ga Gv Gc GfMean Mean Mean Mean Mean Mean Mean(SD) (SD) (SD) (SD) (SD) (SD) (SD)
1 (60) 80 84 87 93 101 89 98(14) (14) (7) (8) (11) (6) (11)
2 (58) 104 107 99 99 96 99 101(13) (13) (9) (9) (7) (8) (9)
3 (29) 83 92 93 97 114 104 109(19) (13) (10) (7) (10) (10) (12)
4 (16) 107 111 110 115 110 112 113(12) (11) (12) (8) (12) (10) (12)
5 (2) 42 26 73 85 109 83 97(15) (19) (5) (3) (7) (10) (4)
Gsm=Short-term memory, Ga=Auditory processing, Gv=Visual processing, Gc=Crystallizedintelligence, Gf=Fluid intelligence, LWI=Letter word identification, WA=Word attack.
240
245
250
255
260
NCEN363611.fm Pag e 8 M o nday , April 11, 2005 10:59 AM
Processing Skills in Learning Disability 9
(enough to enter college). Furthermore, these college students probably receive con-sistent exposure to printed materials; therefore, attaining significant automaticity inreading.
As previously mentioned, the present study found no evidence for a selective ortho-graphic deficit subgroup of dyslexia, as predicted by the Double Deficit hypothesis andas seen in younger problem readers (Wolf & Bowers, 1999). The present cluster analy-sis, using adult problem learners, identified only two distinct subtypes of dyslexia.There was evidence for a selective single phonologic deficit subtype (cluster 3) and adouble deficit subtype (clusters 1 and 5). It would appear that orthographic deficit istypically accompanied by phonologic deficit in adult dyslexics. In the past this kind ofresult has been argued as evidence that phonologic deficit is primary (Stanovich & Siegel,1994), although recent work has shown that orthographic and phonologic deficits areindependent and contribute uniquely in childhood and adolescent reading disorder(Wolf et al., 2000). Further research is necessary to understand the differences betweenthe orthographic difficulties seen in studies with children and the current adult sample.It is possible that the current sample is unusual or that the LWI task is not an adequatemeasure of orthographic difficulties.
The present findings also revealed commonalities in the processing abilities underlyingboth phonologic and orthographic decoding skills. Specifically, short-term/working memoryability and visual processing ability were associated with reading problems whether ortho-graphic or phonologic deficits were present. As suggested by past studies (e.g., Swanson1989) and shown in the current results, short-term/working memory deficits generallyrelate to reading skill and contribute unique variance above and beyond general intelli-gence in explaining both phonologic and orthographic processes in reading. Similarly,visual processing ability contributes unique variance in explaining both phonologic andorthographic processes in reading even when accounting for the contribution of generalintelligence. However, visual ability does not differentiate between good and poor phono-logic or orthographic skills. Instead, it appears to serve a compensatory function as sug-gested by some past findings (Siegel et al., 1995). Thus, good visual ability wasconsistently seen in all subtypes of dyslexics, even in the most severely impaired readers(i.e., cluster 5), and visual ability in the disabled clusters was better than the non-disabledaverage cluster (2) and almost equal to the bright average cluster (4). Some evidence forcompensation was also seen in fluid intelligence (Gf).
Limitations of the present study include a small sample of problem readers, use of apopulation with limited generalizability (college students), determination of reading prob-lems based on cut-off test scores (versus a clinical diagnosis of dyslexia), and the use of acontaminated measure of orthographic processing (i.e., LWI). Given the contamination ofphonologic and orthographic processes, especially likely in the LWI task, the possibilityexists that the more pervasive effect of LWI on reading could be due as much to phono-logic as orthographic issues or to a combination of the two effects. Replication of the cur-rent study with a more selective measure of orthographic skills (e.g., Rapid AutomaticNaming, Embedded Word test, Homophone Choice task, etc.) and a larger sample ofproblem readers would be important in verifying the conclusions of the present study.Additionally, given the descriptive nature of cluster analysis, replication of the clusters isimportant in both a similar sample and a broader sample that generalizes beyond collegestudents with learning disability. In addition to addressing these limitations, suggestionsfor future research include addressing the lack of evidence for a single deficit orthograph-ically impaired subtype of adult dyslexics and exploring the role of visual processingstrengths in this phenomenon.
265
270
275
280
285
290
295
300
305
310
NCEN363611.fm Pag e 9 M o nday , April 11, 2005 10:59 AM
10 D. Osmon et al.
References
Badian, N. A. (2001). Phonological and orthographic processing: Their roles in reading prediction.Annals of Dyslexia, 51, 179–202.
Baron, J. (1979). Orthographic and word-specific mechanisms in children’s reading of words. ChildDevelopment, 50, 60–72.
Bowers, P. G., Golden, J., Kennedy, A., and Young, A. (1994). Limits upon orthographic knowledgedue to processes indexed by naming speed. In V. W.
Bowers, P. G., Steffy, R. & Tate, E. (1988). Comparison of the effects of IQ control methods on mem-ory and naming speed predictors of reading disability. Reading Research Quarterly, 23, 304–319.
Bowers, P. G., Sunseth, K., & Golden, J. (1999). The route between rapid naming and readingprogress. Scientific Studies of Reading, 3, 31–53.
Catts, H. W. (1996). Defining dyslexia as a developmental language disorder: An expanded view.Topics in Language Disorders, 16, 14–29.
Evans, J. J., Floyd, R. G., McGrew, K. S., & Leforgee, M. H. (2002). The relations between mea-sures of Cattell-Horn-Carroll (CHC) cognitive abilities and reading achievement during child-hood and adolescence. School Psychology Review, 31, 246–262.
Flanagan, D. P., Genshaft, J. L., & Harrison, P. L. (1997). Contemporary intellectual assessment:Theories, tests, and issues. New York: The Guilford Press.
Galaburda, A. M. (1994). Developmental dyslexia and animal studies: At the interface between cog-nition and neurology. Cognition, 50, 133–149.
Garcia, G. M., & Stafford, M. E. (2000). Prediction of reading by Ga and Gc specific cognitive abil-ities for low-SES White and Hispanic English-speaking children.Psychology in the Schools, 37,227–235.
Hultquist, A. M. (1997). Orthographic processing abilities of adolescents with dyslexia. Annals ofDyslexia, 47, 89–114.
Manis, F. R., Doi, L. M., & Bhadha, B. (2000). Naming speed, phonological awareness, and ortho-graphic knowledge in second graders. Journal of Learning Disabilities, 33, 325–333.
Mann, V. A., & Lieberman, I. Y. (1984). Phonological awareness and verbal short-term memory.Journal of Learning Disabilities, 17, 592–599.
Martin, F., and Lovegrove, W. (1987). Flicker contrast sensitivity in normal and specifically dis-abled readers. Neuropsychologia, 22, 72–77.
McGrew, K. S., Flanagan, D. P., Keith, T. Z., & Vanderwood, M. (1997). Beyond g: The impact ofGf-Gc specific cognitive abilities research on the future use and interpretation of intelligence testsin the schools. School Psychology Review, 26, 189–210.
Morris, R. D., Stuebing, K. K., Fletcher, J. M., Shaywitz, S. E., Lyon, G. R., Shankweiler, D. P. et al.(1998). Subtypes of reading disability: Variability around a phonological core. Journal of Educa-tional Psychology, 90(3), 347–373.
Perfetti, C.A. (1985). Reading ability. New York: Oxford University Press.Pugh, K. R., Mencl, W. E., Jenner, A. R., Katz, L., Frost, S. J., Ren Lee, J. et al. (2001). Neurobiological
studies of reading and reading disability. Journal of Communication Disorders, 34, 479–492.Seidenberg, M. S. & Tanenhaus, M. K. (1979). Orthographic effects on rhyme monitoring. Journal
of Experimental Psychology: Human Learning and Memory, 5, 546–554.Siegel, L. S., Share, D., & Geva, E. (1995). Evidence for superior orthographic skills in dyslexics.
Psychological Science, 6(4), 250–254.Stanovich, K.E. & Siegel, L. S. (1994). Phenotypic performance profiles of children with reading
disabilities: A regression based approach to the phonological-core variable-difference model.Journal of Educational Psychology, 89, 114–127.
Swanson, H. L. (1989). Verbal coding deficits in learning-disabled readers: A multiple stage model.Educational Psychology Review, 1, 235–277.
Talcott, J. B., Hansen, P. C., Willis-Owen, C., McKinnell, I. W., Richardson, A. J., & Stein J. F.(1998). Visual magnocellular impairment in adult developmental dyslexics. Neuro-Ophthalmology,20, 187–201.
Q2
315
320
325
330
335
340
345
350
355
360
NCEN363611.fm Pag e 10 M o nday , April 11, 2005 10:59 AM
Processing Skills in Learning Disability 11
Tallal, P. (1980). Auditory temporal perception, phonics, and the reading disabilities in children.Brain and Language, 9, 182–199.
van der Leji, A. & van Daal, V. H. P. (1999). Automatization aspects of dyslexia: Speed limitationsin word identification, sensitivity to increasing task demands, and orthographic compensation.Journal of Learning Disabilities, 32 (5), 417–428.
Vanderwood, M. L., McGrew, K. S., Flanagan, D. P., & Keith, T. Z. (2001). The contribution ofgeneral and specific cognitive abilities to reading achievement. Learning & Individual Differ-ences, 13, 159–188.
Wagner, R. K., & Torgesen, J. K. (1987). The nature of phonological processing and its causal rolein the acquisition of reading skills. Psychological Bulletin, 101, 192–212.
Wolf, M. (1999). What time may tell: Towards a new conceptualization of developmental dyslexia.Annals of Dyslexia, 49, 3–28.
Wolf, M., Bowers, P. G. (1999). The double-deficit hypothesis for the developmental dyslexias.Journal of Educational Psychology, 91(3), 415–438.
Wolf, M., Bowers, P. G., & Biddle, K. (2000). Naming-speed processes, timing, and reading: A con-ceptual review. Journal of Learning Disabilities, 33, 387–407.
365
370
375
NCEN363611.fm Pag e 11 M o nday , April 11, 2005 10:59 AM
Related Documents