Phoenix Dr. Peter Linneman Linneman Associates November 15, 2017

Welcome message from author
This document is posted to help you gain knowledge. Please leave a comment to let me know what you think about it! Share it to your friends and learn new things together.
Transcript

Phoenix
Dr. Peter LinnemanLinneman AssociatesNovember 15, 2017

5
7
9
11
13
15
17
19
21
23
1970 1975 1980 1985 1990 1995 2000 2005 2010 2015
$ Tr
illio
ns
Actual Trend (1969-2007)
Actual vs. Trend Real GDP:Still A Huge Gap Due To SF Housing
Data points through Q2 2017
$3.2 T
2
0
10
20
30
40
50
60
70
1980 1986 1992 1998 2004 2010 2016
$ Th
ousa
ndds
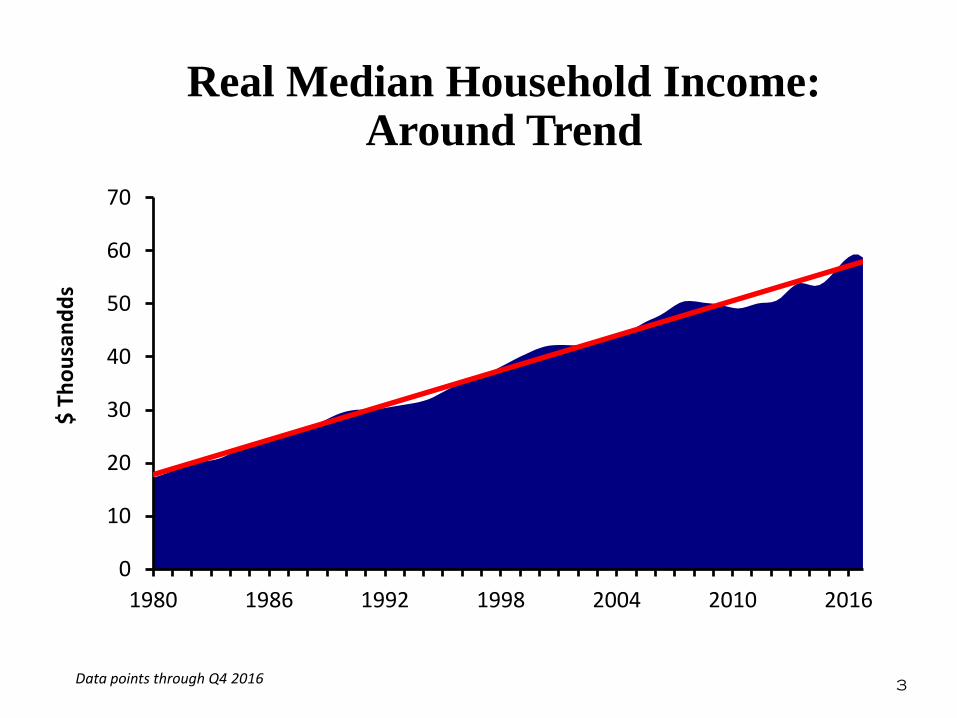
Real Median Household Income:Around Trend
Data points through Q4 2016 3

0
20
40
60
80
100
120
140
160
1977 1982 1987 1992 1997 2002 2007 2012 2017
Consumer Confidence Index: Post-Election Pop Continues
4Data points through September 2017

80
85
90
95
100
105
110
1986 1990 1994 1998 2002 2006 2010 2014
Small Business Optimism Index: Post-Election Surge Continues
5Data points through September 2017

0
50
100
150
200
250
300
1985 1989 1993 1997 2001 2005 2009 2013 2017
Economic Policy Uncertainty Index: Remarkably Muted
Data points through September 2017

0
200
400
600
800
1,000
1,200
1,400
1,600
1,800
2,000
1980 1984 1988 1992 1996 2000 2004 2008 2012 2016
$ Bi
llion
s
Profits After Tax Distributed Profits
Real Corporate Profits:High But Tough To Grow
Data points through Q2 2017

Private Sector Employment:All Time High
0
20
40
60
80
100
120
140
1939 1946 1954 1961 1969 1976 1984 1991 1999 2006 2014
Mill
ions
Pre-Recession Peak
8Data points through September 2017
0
5
10
15
20
25
30
1969 1974 1979 1984 1989 1994 1999 2004 2009 2014
Perc
ent
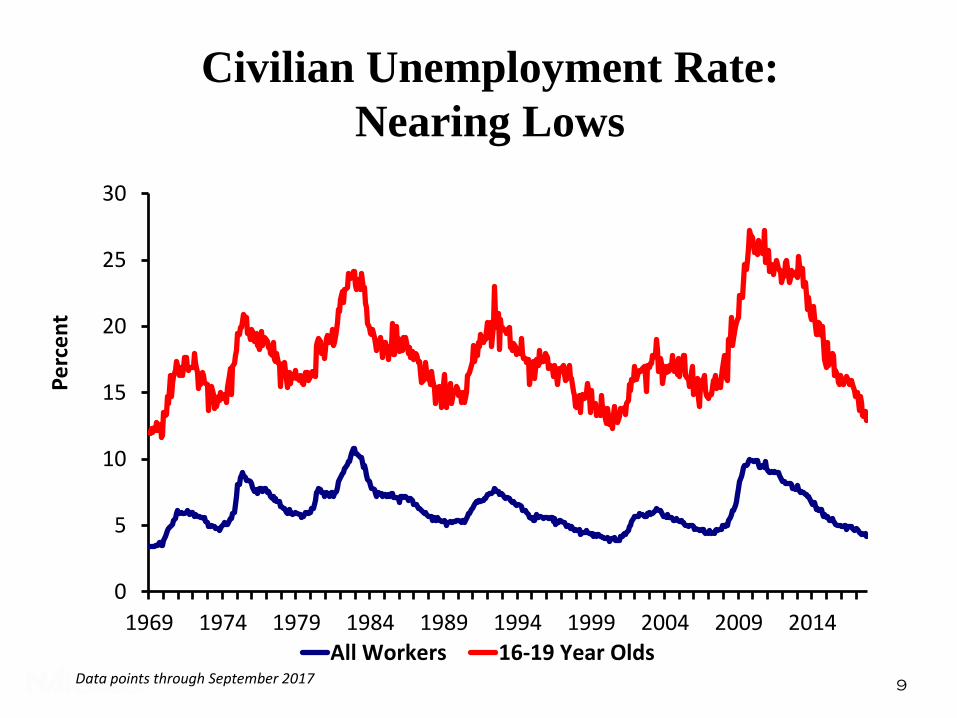
All Workers 16-19 Year Olds
Civilian Unemployment Rate: Nearing Lows
9Data points through September 2017
0
100
200
300
400
500
600
700
800
1967 1973 1980 1987 1994 2001 2008 2015
Thou
sand
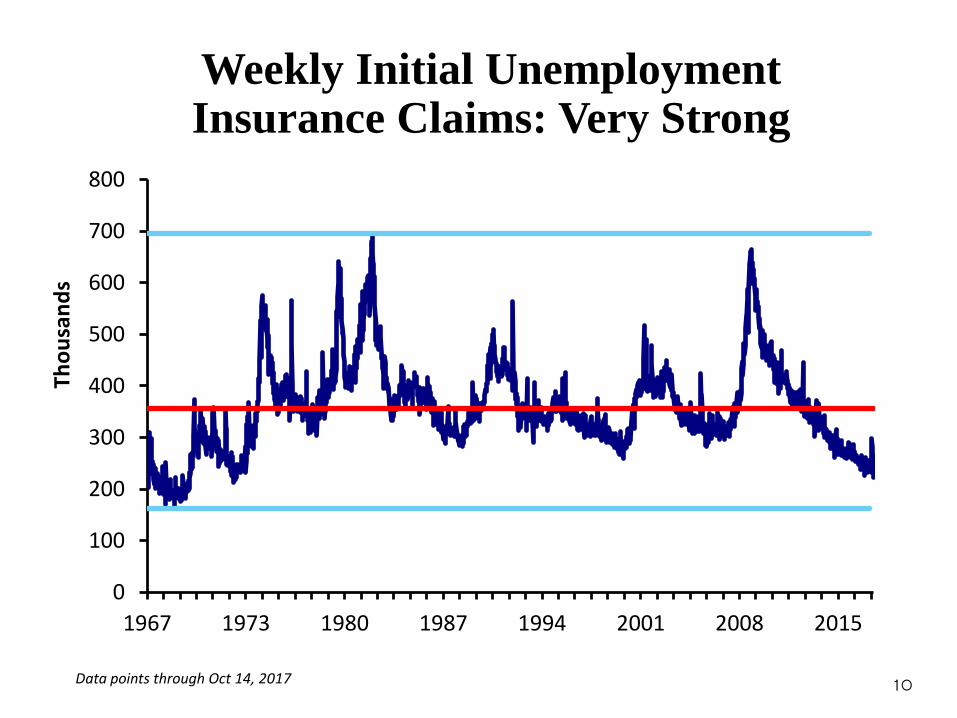
sWeekly Initial Unemployment Insurance Claims: Very Strong
Data points through Oct 14, 2017 10
64
66
68
70
72
74
76
78
80
1960 1965 1970 1975 1980 1985 1990 1995 2000 2005 2010 2015
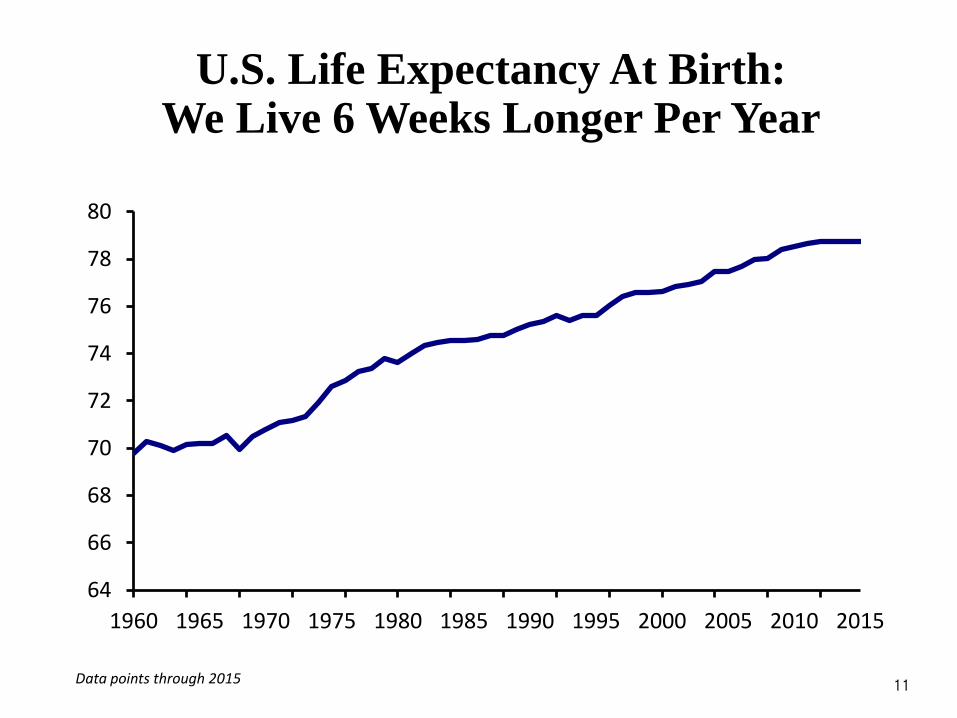
Data points through 2015 11
U.S. Life Expectancy At Birth:We Live 6 Weeks Longer Per Year

Labor Force Participation Rate 65+:And Choose To Work Longer
10
12
14
16
18
20
22
1964 1969 1974 1979 1984 1989 1994 1999 2004 2009 2014
Perc
ent
12Data points through September 2017
-15
-10
-5
0
5
10
15
20
25
1957 1963 1969 1975 1981 1987 1993 1999 2005 2011
Perc
ent
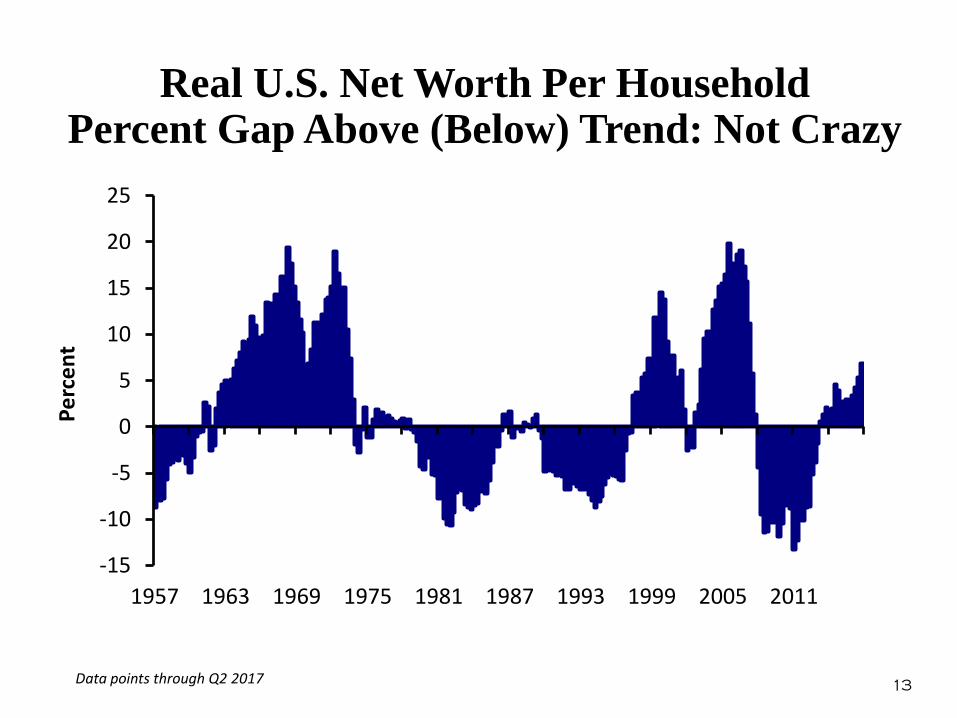
Real U.S. Net Worth Per HouseholdPercent Gap Above (Below) Trend: Not Crazy
13Data points through Q2 2017

50
75
100
125
150
1986 1989 1992 1995 1998 2001 2004 2007 2010 2013 2016
Perc
ent
Household Debt As Percent of Disposable Personal Income: Low Burden
14Data points through Q2 2017
0.0
0.5
1.0
1.5
2.0
2.5
3.0
3.5
4.0
2006 2008 2010 2012 2014 2016
$ Tr
illio
ns
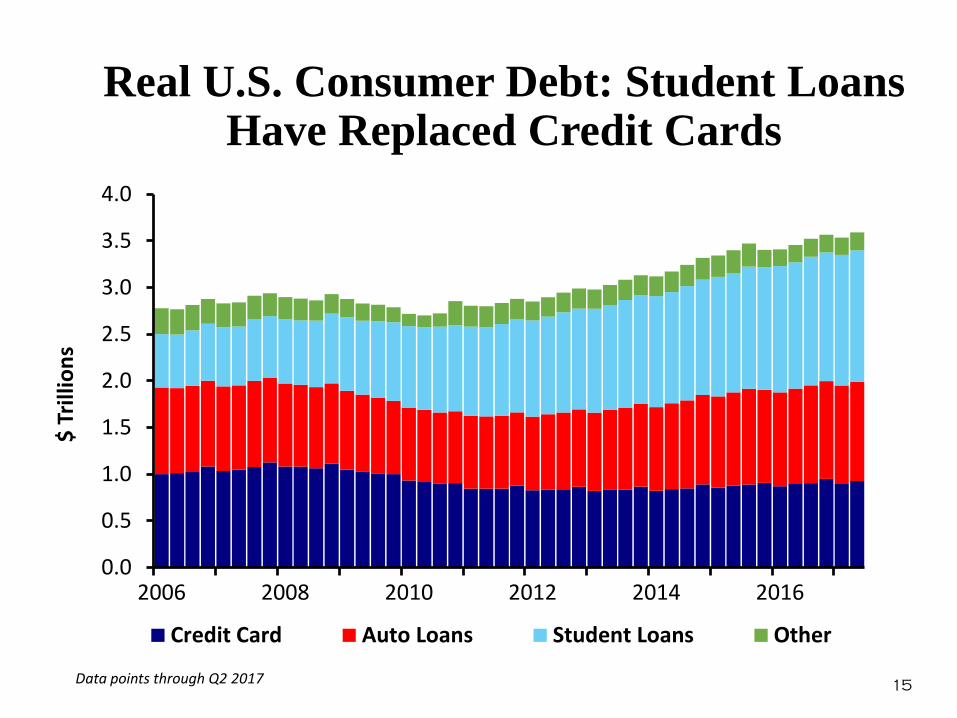
Credit Card Auto Loans Student Loans Other
Real U.S. Consumer Debt: Student Loans Have Replaced Credit Cards
15Data points through Q2 2017

0
1
2
3
4
5
6
2001 2003 2005 2007 2009 2011 2013 2015 2017
Perc
ent
30-Day T-Bill 10-Year Treasury
Treasury Yields: Low Rates Kill The Economy, By Killing Housing And Cash Hoarding
Data points through September 2017
1.0
1.1
1.2
1.3
1.4
1.5
1.6
2004 2006 2008 2010 2012 2014 2016
$ Tr
illio
ns (S
AAR)
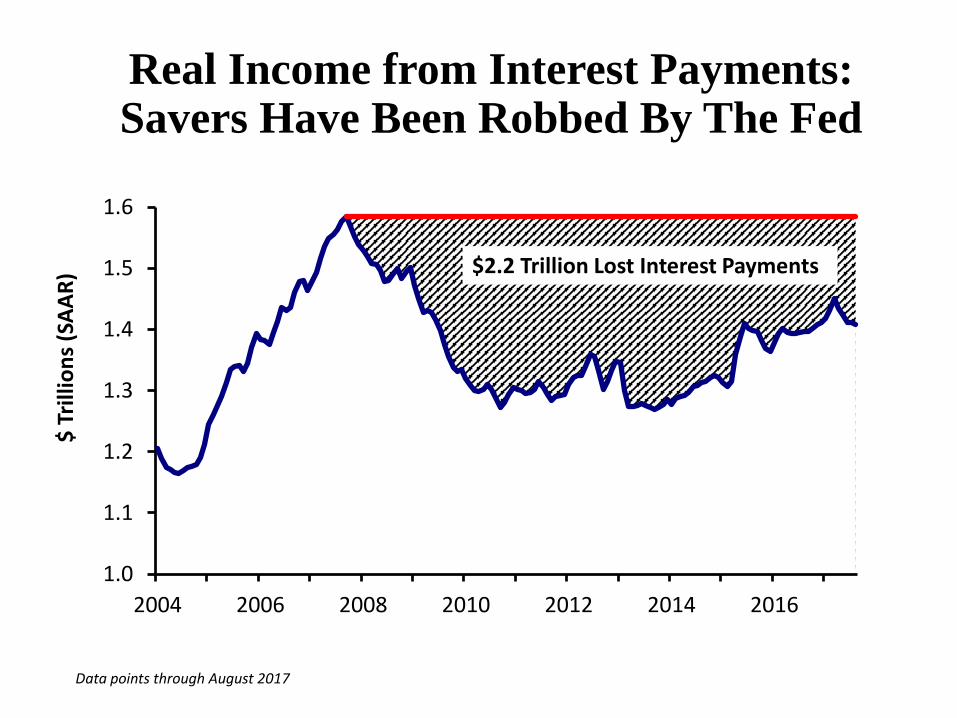
Real Income from Interest Payments: Savers Have Been Robbed By The Fed
$2.2 Trillion Lost Interest Payments
Data points through August 2017
-0.5
0.0
0.5
1.0
1.5
2.0
2.5
3.0
3.5
4.0
4.5
1952 1959 1967 1974 1982 1989 1997 2004 2012
$ Tr
iillio
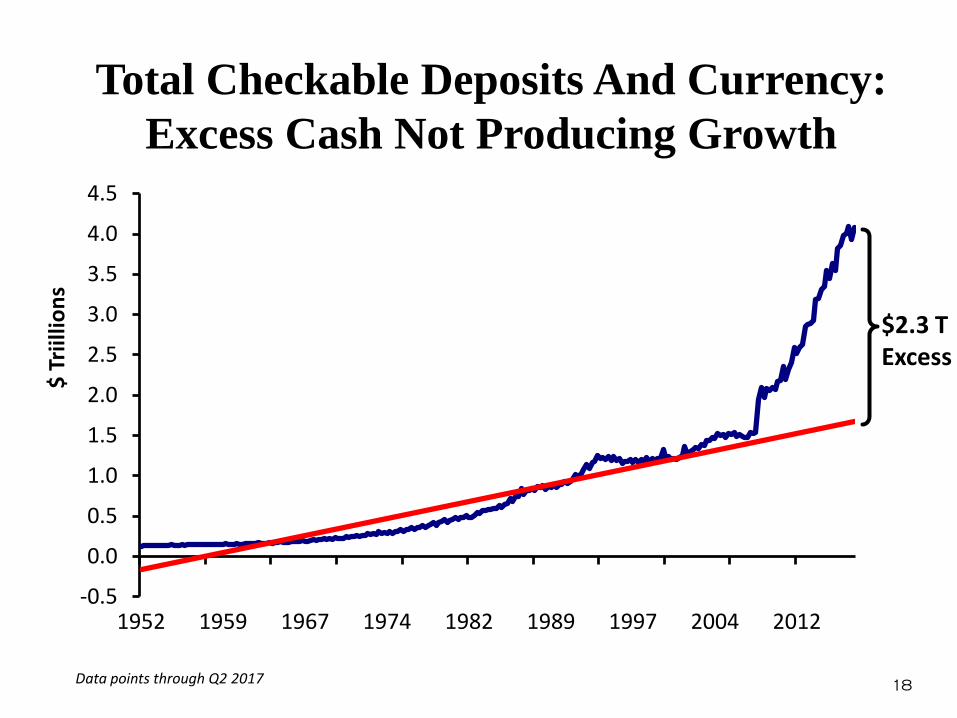
nsTotal Checkable Deposits And Currency:
Excess Cash Not Producing Growth
18Data points through Q2 2017
$2.3 TExcess

-1,200
-1,000
-800
-600
-400
-200
0
2002 2004 2006 2008 2010 2012 2014 2016
Thou
sand
sCumulative Shortage of Multifamily Starts:
Still High
931 KGap
Data points through September 2017
0
200
400
600
800
1,000
1,200
1,400
1,600
1,800
2,000
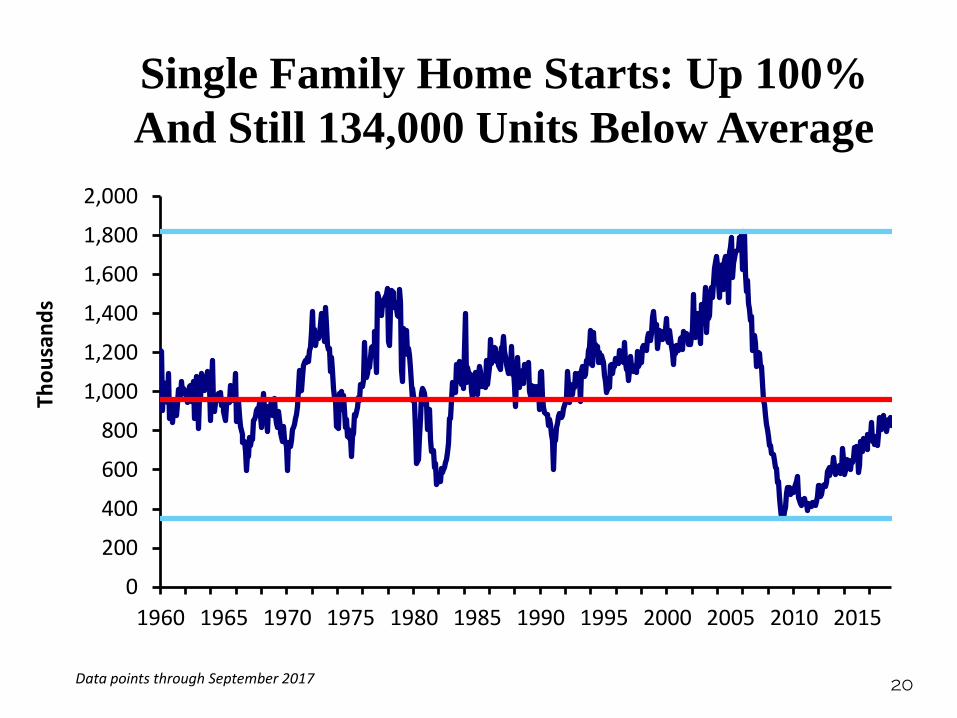
1960 1965 1970 1975 1980 1985 1990 1995 2000 2005 2010 2015
Thou
sand
sSingle Family Home Starts: Up 100% And Still 134,000 Units Below Average
20Data points through September 2017

-3,000
-2,000
-1,000
0
1,000
2,000
3,000
2002 2004 2006 2008 2010 2012 2014 2016
Thou
sand
s
Cumulative Shortage of Single-Family Starts: Huge And Growing
Compared to 1971-2001 Average. Data points through September 2016
2.8 MGap
21
0
50
100
150
200
250
300
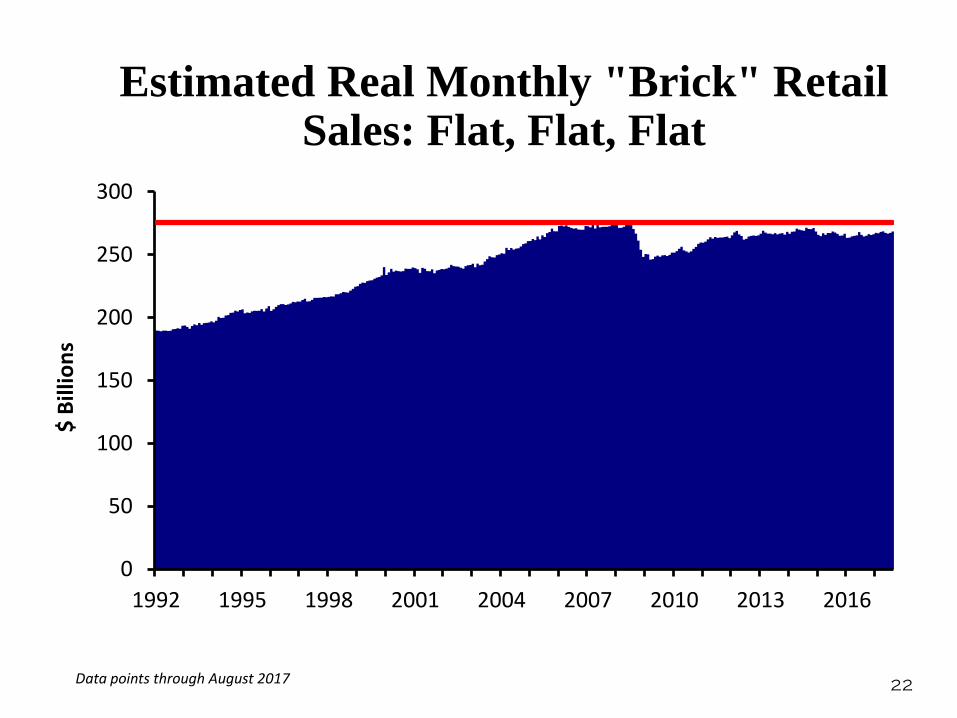
1992 1995 1998 2001 2004 2007 2010 2013 2016
$ Bi
llion
sEstimated Real Monthly "Brick" Retail
Sales: Flat, Flat, Flat
22Data points through August 2017
-202468
1012141618
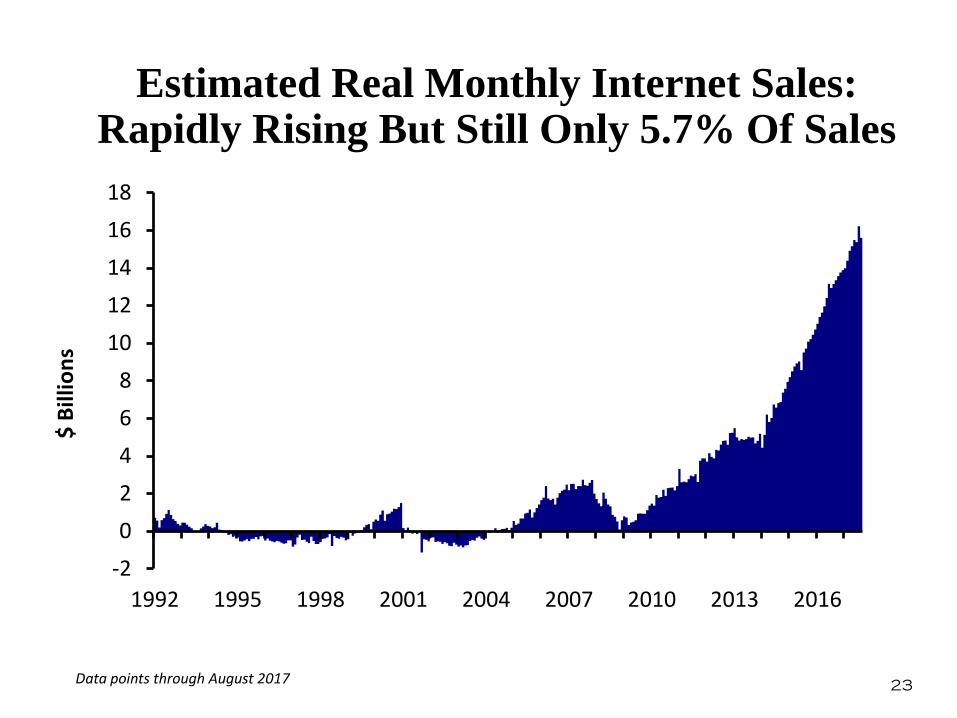
1992 1995 1998 2001 2004 2007 2010 2013 2016
$ Bi
llion
sEstimated Real Monthly Internet Sales:
Rapidly Rising But Still Only 5.7% Of Sales
23Data points through August 2017

Average Age of U.S. Passenger Cars & Light Vehicles: Back On Trend
9.0
9.5
10.0
10.5
11.0
11.5
12.0
2002 2004 2006 2008 2010 2012 2014 2016
Age
in Y
ears
24Data points through 2016

-
5
10
15
20
25
30
1984 1989 1994 1999 2004 2009 2014
$ Tr
illio
ns
Potential Bank Loans Actual Bank Loans
Bank Unused Loan Capacity: Still Lots Of Lending Capacity
25Data points through September 2017
15.1 T

0.0
0.5
1.0
1.5
2.0
2.5
3.0
3.5
4.0
4.5
1947 1954 1962 1969 1977 1984 1992 1999 2007 2014
$ Tr
illio
ns
Commercial & Industrial Mortgages
Real Loans Held by Banks: Lending To Real Estate But Below Peak
26Data points through Q3 2017
0
25
50
75
100
125
150
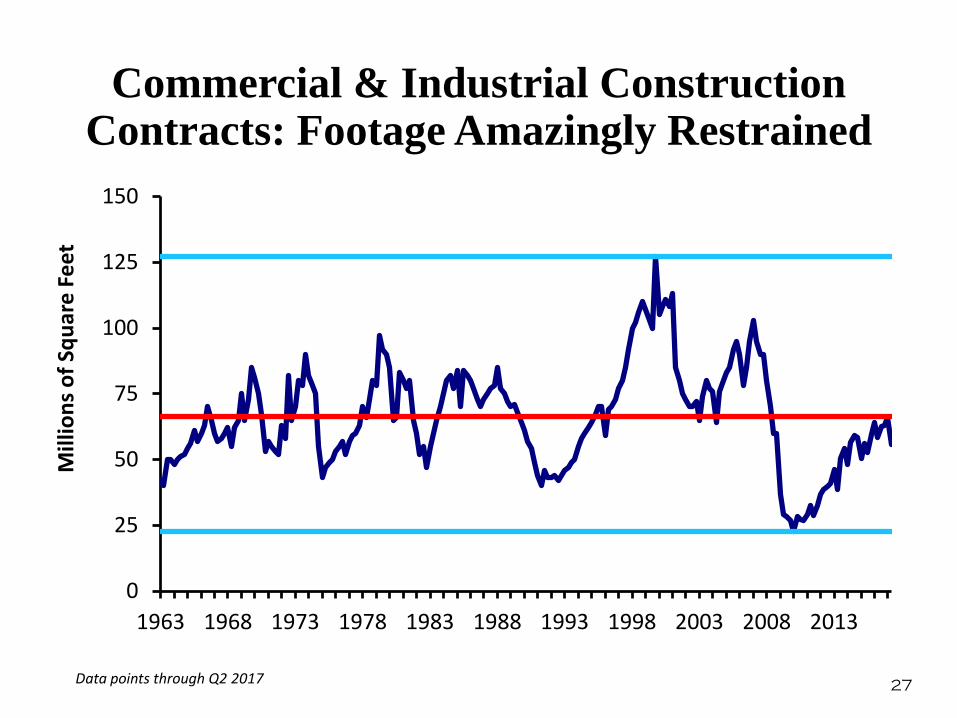
1963 1968 1973 1978 1983 1988 1993 1998 2003 2008 2013
Mill
ions
of S
quar
e Fe
etCommercial & Industrial Construction
Contracts: Footage Amazingly Restrained
27Data points through Q2 2017

0
100
200
300
400
500
600
700
1 17 33 49 65 81 97 113 129 145 161
Basi
s Poi
nts
Multifamily
Easy Tight Easy Easy
Tigh
t
REIT Implied Cap Rate Spread over 10-Year Treasury: Not Crazy
28Data points through September 2017
0
300
600
900
1200
1500
1800
2100
2400
2700
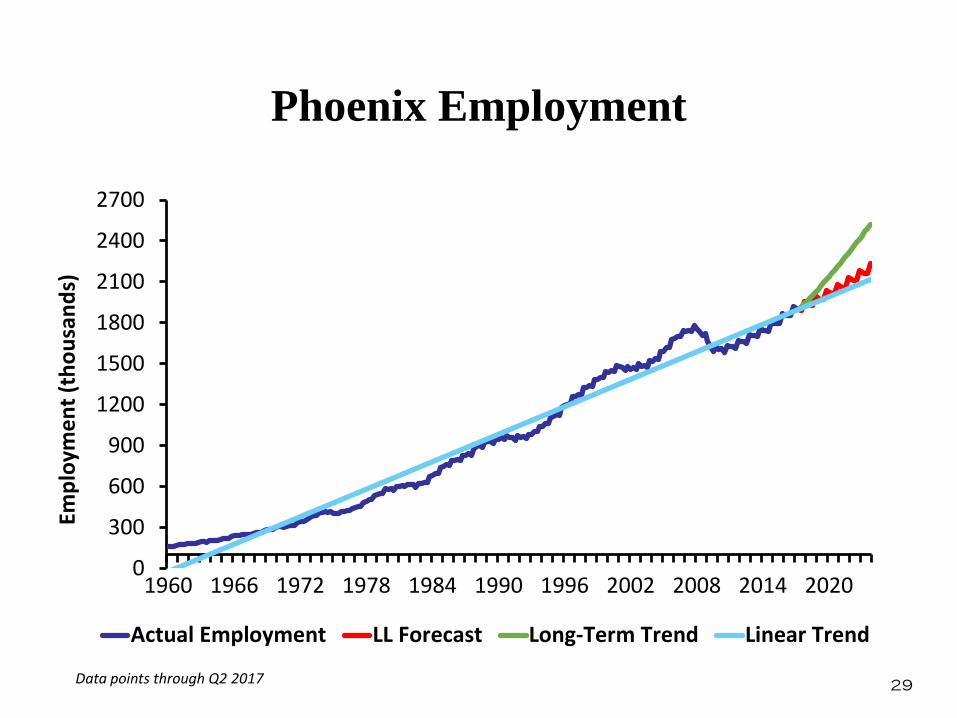
1960 1966 1972 1978 1984 1990 1996 2002 2008 2014 2020
Empl
oym
ent (
thou
sand
s)
Actual Employment LL Forecast Long-Term Trend Linear Trend
Phoenix Employment
Data points through Q2 2017 29
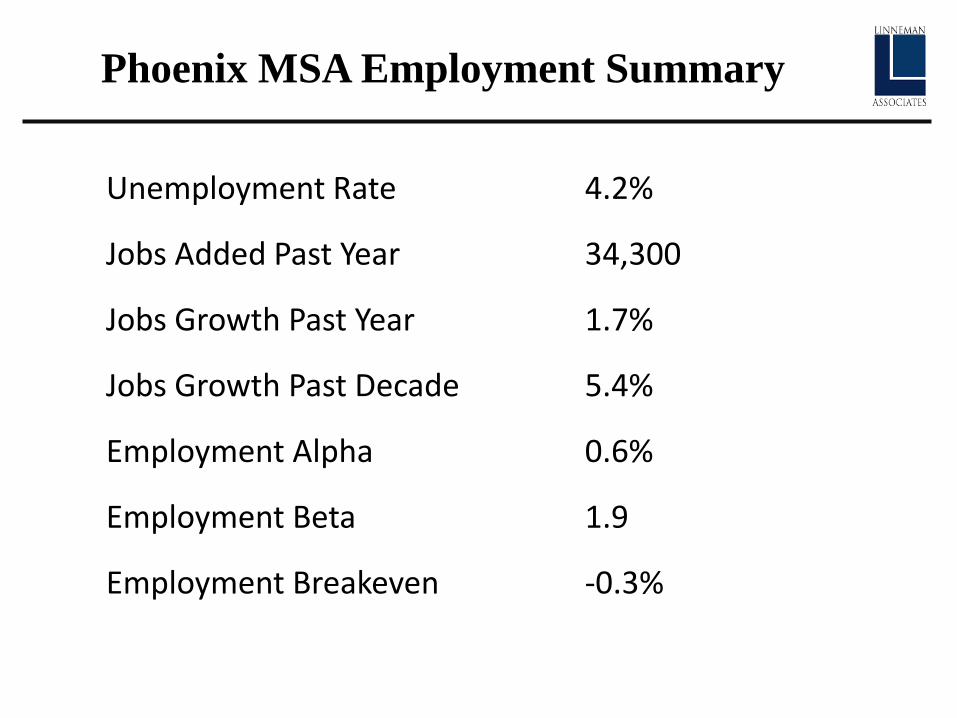
Phoenix MSA Employment Summary
Unemployment Rate 4.2%
Jobs Added Past Year 34,300
Jobs Growth Past Year 1.7%
Jobs Growth Past Decade 5.4%
Employment Alpha 0.6%
Employment Beta 1.9
Employment Breakeven -0.3%

For Now Lots Of Canaries Are Still Chirping
• PIK Debt
• Massive mortgage growth
• Spec development boom
• First replaces mezz
• Mezz replaces equity
• Narrow spreads and rising LTVs
• Record buyout deals
• Empty space worth more than full space
Related Documents