Philosophers on Philosophy: The 2020 PhilPapers Survey ∗ David Bourget and David Chalmers November 1, 2021 1 Introduction What are the philosophical views of contemporary professional philosophers? And how do these views change over time? In November 2009, we carried out the first PhilPapers Survey. We surveyed 931 philoso- phers from 99 philosophy departments in the Australia, Canada, continental Europe, New Zealand, the US, and the UK on their answers to 30 philosophical questions. The results of this survey were published as “What Do Philosophers’ Believe?” 1 and have been widely discussed. In October 2020, we carried out a follow-up survey: the 2020 PhilPapers Survey. It was intended to make at least three additional contributions. First: the 2020 Survey allowed longitudinal comparisons of results in 2009 and 2020, giving information about how the views of professional philosophers have changed over time. Second: the target population for the survey was enlarged from faculty members of 99 selected departments in a few selected countries, to a broader group including English- language-publishing philosophers from around the world. This allows broader information about views within the English-speaking philosophical community. Third: the list of questions was expanded from 30 questions to 100 questions, allowing information about a broader range of philosophical topics. As we argued in “What Do Philosophers Believe?”, surveys like this can play at least three roles within philosophy. First, today’s sociology is tomorrow’s history, and these results may be of some use to future historians of philosophy. Second, philosophers often appeal to sociological claims about the distributions of views among philosophers, for example in justifying which views should be taken seriously, and it makes sense for these claims to be well-grounded. Third, if philosophy has any tendency to converge to the truth, then ∗ This is an early draft. Feedback and suggestions for further analyses are welcome. Thanks to the staff of the Centre for Digital Philosophy, the many philosophers who helped develop and beta test the survey, and the many philosophers who took the time to answer the survey. 1 David Bourget and David J. Chalmers, ”What Do Philosophers Believe”, Philosophical Studies 170(3): 465-500, 2014 1

Welcome message from author
This document is posted to help you gain knowledge. Please leave a comment to let me know what you think about it! Share it to your friends and learn new things together.
Transcript

Philosophers on Philosophy:
The 2020 PhilPapers Survey∗
David Bourget and David Chalmers
November 1, 2021
1 Introduction
What are the philosophical views of contemporary professional philosophers? And how do
these views change over time?
In November 2009, we carried out the first PhilPapers Survey. We surveyed 931 philoso-
phers from 99 philosophy departments in the Australia, Canada, continental Europe, New
Zealand, the US, and the UK on their answers to 30 philosophical questions. The results
of this survey were published as “What Do Philosophers’ Believe?”1 and have been widely
discussed.
In October 2020, we carried out a follow-up survey: the 2020 PhilPapers Survey. It was
intended to make at least three additional contributions.
First: the 2020 Survey allowed longitudinal comparisons of results in 2009 and 2020,
giving information about how the views of professional philosophers have changed over
time.
Second: the target population for the survey was enlarged from faculty members of
99 selected departments in a few selected countries, to a broader group including English-
language-publishing philosophers from around the world. This allows broader information
about views within the English-speaking philosophical community.
Third: the list of questions was expanded from 30 questions to 100 questions, allowing
information about a broader range of philosophical topics.
As we argued in “What Do Philosophers Believe?”, surveys like this can play at least
three roles within philosophy. First, today’s sociology is tomorrow’s history, and these results
may be of some use to future historians of philosophy. Second, philosophers often appeal
to sociological claims about the distributions of views among philosophers, for example in
justifying which views should be taken seriously, and it makes sense for these claims to
be well-grounded. Third, if philosophy has any tendency to converge to the truth, then
∗This is an early draft. Feedback and suggestions for further analyses are welcome. Thanks to the staffof the Centre for Digital Philosophy, the many philosophers who helped develop and beta test the survey,and the many philosophers who took the time to answer the survey.
1David Bourget and David J. Chalmers, ”What Do Philosophers Believe”, Philosophical Studies 170(3):465-500, 2014
1

philosophers’ views might provide some guidance about the truth of philosophical views.
It is not clear whether philosophy tends to converge to the truth, so we don’t make the
third claim about guidance, but surveys can clearly play the first two roles in philosophical
practice.
We begin by describing the methodology for the survey, including the target population
and the questions. We then go on to discuss the main results of the 2020 survey, the
longitudinal comparison to the 2009 survey, and correlations between answers to the survey.
We end with a discussion of selection bias in the group of respondents and of correcting
results to remove this bias.
2 Methodology
The PhilPapers Survey was conducted online from October 15, 2020 to November 16, 2020.
Full details on the methods and the results can be found on the survey website at sur-
vey2020.philpeople.org.
2.1 Target population
In the 2009 survey, we were restricted to a relatively small group of departments (based
mainly on rankings and faculty lists from the Philosophical Gourmet Report) as this is
where we had the most information. In 2020, the PhilPeople database includes information
on philosophers and philosophy departments around the world (with strongest coverage on
English-speaking and English-publishing philosophers), so we could survey a broader and
more representative group.
After a period of consultation, we decided on a target group including (1) in Australia,
Canada, Ireland, New Zealand, the UK, and the US: all regular faculty members (tenure-
track or permanent) in BA-granting philosophy departments with four or more members
(according to the PhilPeople database); and (2) in all other countries: English-publishing
philosophers in BA-granting philosophy departments with four or more English-publishing
faculty members. Here an English-publishing philosopher is someone with one or more
publications in the PhilPapers database with a wide range of English-language journals
and book publishers. We restricted to English-publishing philosophers as we do not have
adequate information on philosophers who do not publish in English, and the majority of
our questions are drawn from English-language traditions.
For meaningful longitudinal comparisons, we also designated a “2009-comparable depart-
ments” target group of 100 departments in the same regions as the 2009 survey, based largely
on rankings (all Ph.D.-granting departments with a 2017-2018 Philosophical Gourmet Re-
port score of 1.9 or above, plus two leading departments with MA programs and a selected
group of European departments based on expert recommendations). This group was used
only for longitudinal comparisons.
After data entry and cleanup, our target population included 7685 philosophers, includ-
ing 6112 in group (1) and 1573 in group (2). The 2009-comparable target group included
2
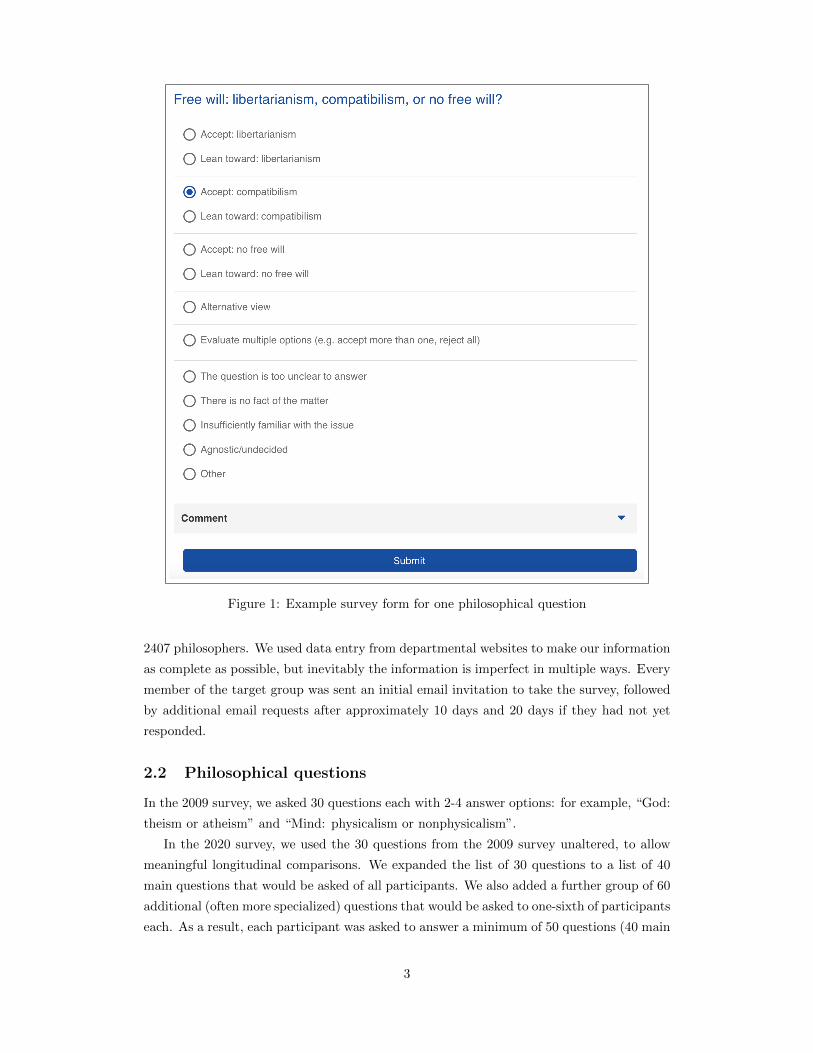
Figure 1: Example survey form for one philosophical question
2407 philosophers. We used data entry from departmental websites to make our information
as complete as possible, but inevitably the information is imperfect in multiple ways. Every
member of the target group was sent an initial email invitation to take the survey, followed
by additional email requests after approximately 10 days and 20 days if they had not yet
responded.
2.2 Philosophical questions
In the 2009 survey, we asked 30 questions each with 2-4 answer options: for example, “God:
theism or atheism” and “Mind: physicalism or nonphysicalism”.
In the 2020 survey, we used the 30 questions from the 2009 survey unaltered, to allow
meaningful longitudinal comparisons. We expanded the list of 30 questions to a list of 40
main questions that would be asked of all participants. We also added a further group of 60
additional (often more specialized) questions that would be asked to one-sixth of participants
each. As a result, each participant was asked to answer a minimum of 50 questions (40 main
3

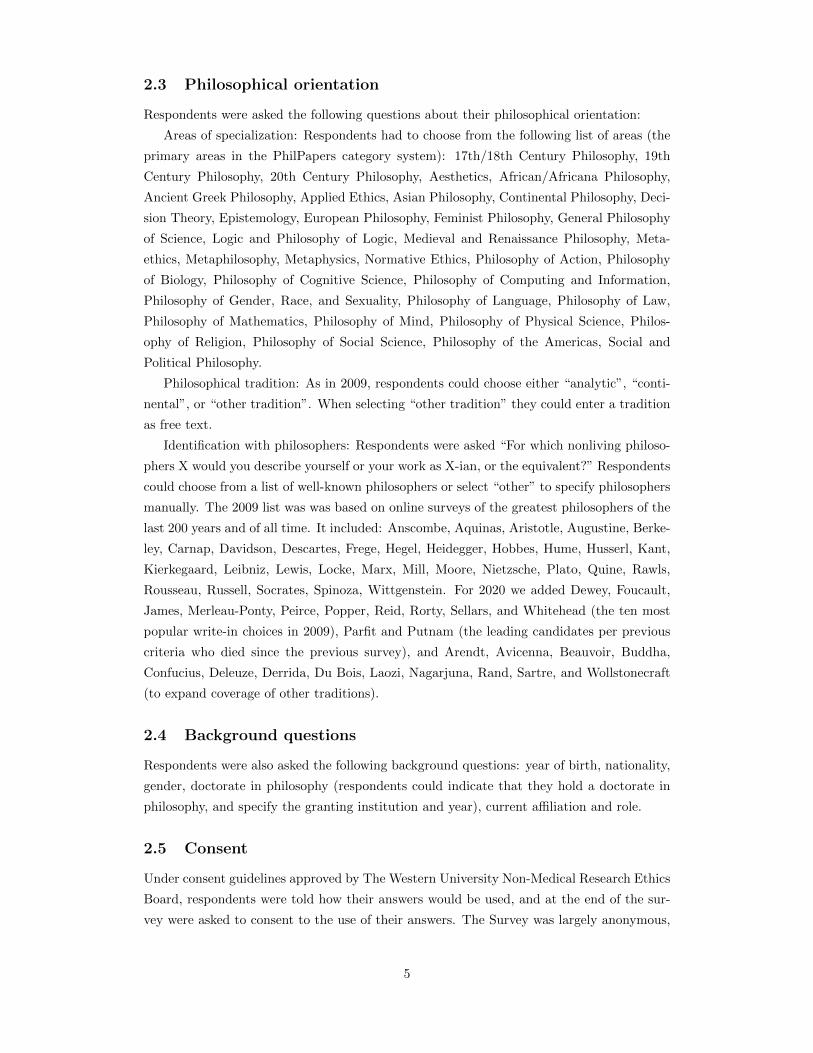
Figure 2: Selecting combinations of answers
questions and 10 additional questions). Participants were also given the option of answering
some or all of the other 50 additional questions if they chose to, with a maximum of 100
philosophical questions per participant.
We determined the 70 new questions through an extended period of consultation, includ-
ing consultation with PhilPapers editors and extended discussion on social media including
PhilPeople, Facebook, and philosophy blogs. We also had a lengthy period of beta testing
the survey questions and the survey interface with PhilPapers editors using the interface.
We aimed for questions that covered many areas of philosophy, that worked in the multiple
choice format, and that would be familiar to at least half of our target population.
The 100 resulting questions included approximately 50 questions drawn from metaphysics
and epistemology (broadly construed), 30 questions drawn from value theory, 9 from the
philosophy of science, logic, and mathematics, 6 from the history of philosophy, and 5 from
metaphilosophy.
As in 2009, we did not include any questions drawn from non-Western and non-analytic
traditions, as it proved too difficult to find questions from these traditions that met the
familiarity and multiple-choice constraints. We attempted to include some new questions
reflecting philosophy as it stands in 2020 (adding two questions each about gender and race,
for example), but we acknowledge an overall bias toward certain relatively traditional issues
in the analytic and English-speaking canons. In retrospect, we could have done more to
reflect the diversity of contemporary philosophy. In future surveys, we will try to do so.
As in 2009, we allowed respondents to indicate that they “accept” or “lean toward” a
view, and we allowed a range of other options. The options are shown in figure 1. We
changed the 2009 answer options slightly to allow respondents more fine-grained options in
endorsing multiple answers. Where the 2009 survey just had an option for “Accept both”
(binary questions) or “Accept more than one” (ternary questions), the 2020 survey allowed
respondents to accept, reject, or lean toward or against each answer separately if they chose
to (as shown on figure 2). We also allowed respondents to write in alternative answers if
they chose to.
4
2.3 Philosophical orientation
Respondents were asked the following questions about their philosophical orientation:
Areas of specialization: Respondents had to choose from the following list of areas (the
primary areas in the PhilPapers category system): 17th/18th Century Philosophy, 19th
Century Philosophy, 20th Century Philosophy, Aesthetics, African/Africana Philosophy,
Ancient Greek Philosophy, Applied Ethics, Asian Philosophy, Continental Philosophy, Deci-
sion Theory, Epistemology, European Philosophy, Feminist Philosophy, General Philosophy
of Science, Logic and Philosophy of Logic, Medieval and Renaissance Philosophy, Meta-
ethics, Metaphilosophy, Metaphysics, Normative Ethics, Philosophy of Action, Philosophy
of Biology, Philosophy of Cognitive Science, Philosophy of Computing and Information,
Philosophy of Gender, Race, and Sexuality, Philosophy of Language, Philosophy of Law,
Philosophy of Mathematics, Philosophy of Mind, Philosophy of Physical Science, Philos-
ophy of Religion, Philosophy of Social Science, Philosophy of the Americas, Social and
Political Philosophy.
Philosophical tradition: As in 2009, respondents could choose either “analytic”, “conti-
nental”, or “other tradition”. When selecting “other tradition” they could enter a tradition
as free text.
Identification with philosophers: Respondents were asked “For which nonliving philoso-
phers X would you describe yourself or your work as X-ian, or the equivalent?” Respondents
could choose from a list of well-known philosophers or select “other” to specify philosophers
manually. The 2009 list was was based on online surveys of the greatest philosophers of the
last 200 years and of all time. It included: Anscombe, Aquinas, Aristotle, Augustine, Berke-
ley, Carnap, Davidson, Descartes, Frege, Hegel, Heidegger, Hobbes, Hume, Husserl, Kant,
Kierkegaard, Leibniz, Lewis, Locke, Marx, Mill, Moore, Nietzsche, Plato, Quine, Rawls,
Rousseau, Russell, Socrates, Spinoza, Wittgenstein. For 2020 we added Dewey, Foucault,
James, Merleau-Ponty, Peirce, Popper, Reid, Rorty, Sellars, and Whitehead (the ten most
popular write-in choices in 2009), Parfit and Putnam (the leading candidates per previous
criteria who died since the previous survey), and Arendt, Avicenna, Beauvoir, Buddha,
Confucius, Deleuze, Derrida, Du Bois, Laozi, Nagarjuna, Rand, Sartre, and Wollstonecraft
(to expand coverage of other traditions).
2.4 Background questions
Respondents were also asked the following background questions: year of birth, nationality,
gender, doctorate in philosophy (respondents could indicate that they hold a doctorate in
philosophy, and specify the granting institution and year), current affiliation and role.
2.5 Consent
Under consent guidelines approved by The Western University Non-Medical Research Ethics
Board, respondents were told how their answers would be used, and at the end of the sur-
vey were asked to consent to the use of their answers. The Survey was largely anonymous,
5
although respondents were given the option to make their answers public eventually. Re-
spondents were also told that their answers would be retained for use in possible follow-up
surveys, and that any question could be skipped if they are uncomfortable in answering.
3 Main survey results
Of the main target population of 7685 philosophers, 1785 (23%) completed the survey. Of
these, 522 completed exactly 50 questions, 338 completed 51-99, and 925 completed all 100.
An additional 487 initially gave their consent but did not complete the survey.
Of the 2009-comparable population of 2407 philosophers, 648 (27%) completed the sur-
vey. Of these, 193 completed exactly 50 questions, 116 completed 51-99, and 339 completed
all 100.
The results presented below are results for all questions answered by all respondents
who completed the survey. These results are therefore subject to possible selection bias
both among respondents to the survey and among respondents who chose to complete more
than 50 questions. We discuss and analyze these sorts of selection bias in section 7.
3.1 Main questions
The results for the main 40 questions are shown below. 30 of these questions overlap with
the questions from the 2009 PhilPapers Survey and 10 are new. Each of these 40 questions
was presented to all 1785 survey respondents. The figures below include all respondents
except those who indicated “insufficiently familiar with the issue” or who indicated “skip”
to skip the question.
Note that the results below should not be longitudinally compared to the main results
presented in the 2009 PhilPapers Survey paper, for three main reasons. First, the 2020
population is much broader (not restricted to 99 departments). Second, the 2020 survey
made it easier to endorse multiple answers than the 2009 survey. Third, the main results
presented in the 2009 paper included respondents who skipped the question or checked
“insufficiently familiar”, whereas the results below exclude those respondents.
For meaningful longitudinal comparisons, see section 5, where we present 2020 results
that are more directly comparable to the 2009 results (restricting to 2009-comparable de-
partments, exclusive answers, and including skip/unfamiliar answers under “other”).
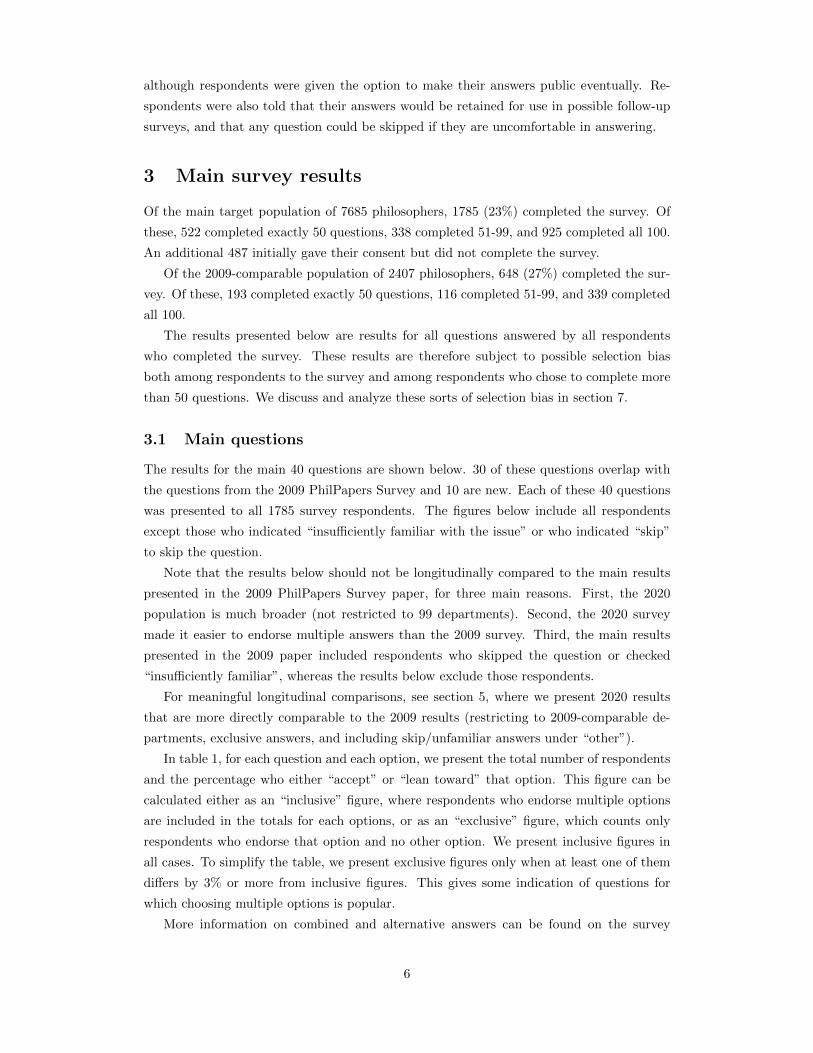
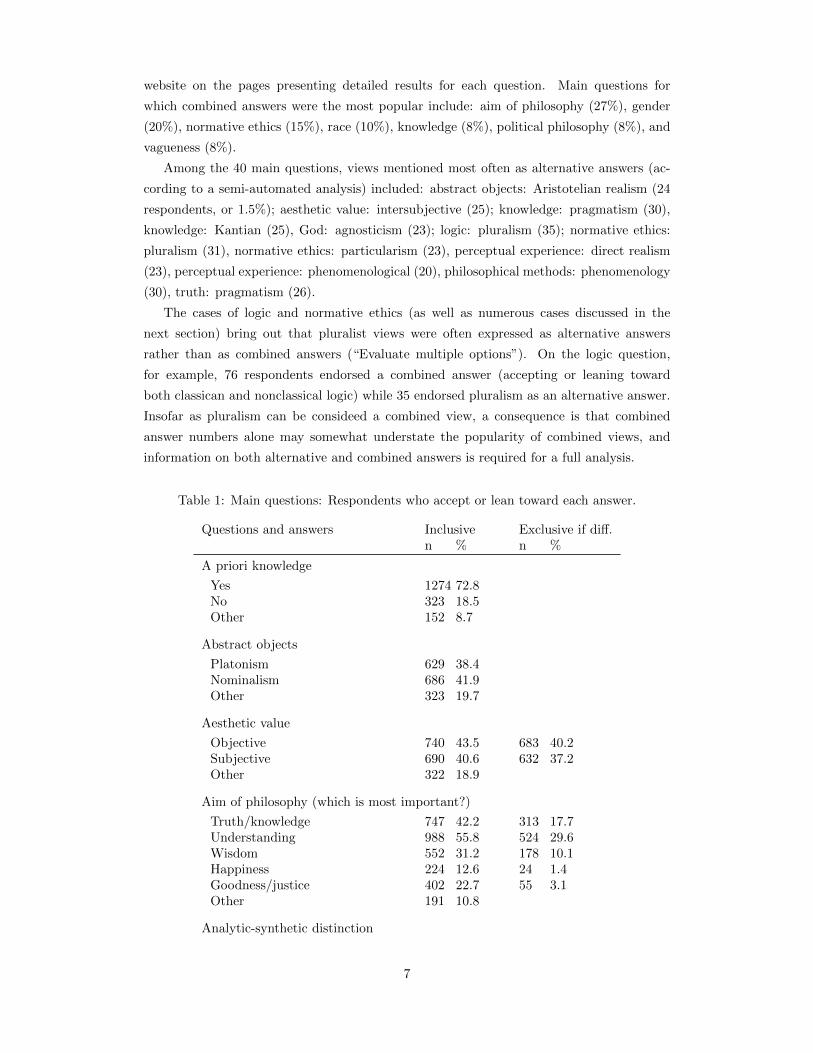
In table 1, for each question and each option, we present the total number of respondents
and the percentage who either “accept” or “lean toward” that option. This figure can be
calculated either as an “inclusive” figure, where respondents who endorse multiple options
are included in the totals for each options, or as an “exclusive” figure, which counts only
respondents who endorse that option and no other option. We present inclusive figures in
all cases. To simplify the table, we present exclusive figures only when at least one of them
differs by 3% or more from inclusive figures. This gives some indication of questions for
which choosing multiple options is popular.
More information on combined and alternative answers can be found on the survey
6
website on the pages presenting detailed results for each question. Main questions for
which combined answers were the most popular include: aim of philosophy (27%), gender
(20%), normative ethics (15%), race (10%), knowledge (8%), political philosophy (8%), and
vagueness (8%).
Among the 40 main questions, views mentioned most often as alternative answers (ac-
cording to a semi-automated analysis) included: abstract objects: Aristotelian realism (24
respondents, or 1.5%); aesthetic value: intersubjective (25); knowledge: pragmatism (30),
knowledge: Kantian (25), God: agnosticism (23); logic: pluralism (35); normative ethics:
pluralism (31), normative ethics: particularism (23), perceptual experience: direct realism
(23), perceptual experience: phenomenological (20), philosophical methods: phenomenology
(30), truth: pragmatism (26).
The cases of logic and normative ethics (as well as numerous cases discussed in the
next section) bring out that pluralist views were often expressed as alternative answers
rather than as combined answers (“Evaluate multiple options”). On the logic question,
for example, 76 respondents endorsed a combined answer (accepting or leaning toward
both classican and nonclassical logic) while 35 endorsed pluralism as an alternative answer.
Insofar as pluralism can be consideed a combined view, a consequence is that combined
answer numbers alone may somewhat understate the popularity of combined views, and
information on both alternative and combined answers is required for a full analysis.
Table 1: Main questions: Respondents who accept or lean toward each answer.
Questions and answers Inclusive Exclusive if diff.n % n %
A priori knowledge
Yes 1274 72.8No 323 18.5Other 152 8.7
Abstract objects
Platonism 629 38.4Nominalism 686 41.9Other 323 19.7
Aesthetic value
Objective 740 43.5 683 40.2Subjective 690 40.6 632 37.2Other 322 18.9
Aim of philosophy (which is most important?)
Truth/knowledge 747 42.2 313 17.7Understanding 988 55.8 524 29.6Wisdom 552 31.2 178 10.1Happiness 224 12.6 24 1.4Goodness/justice 402 22.7 55 3.1Other 191 10.8
Analytic-synthetic distinction
7

Questions and answers Inclusive Exclusive if diff.n % n %
Yes 1064 62.5No 439 25.8Other 203 11.9
Eating animals and animal products (is it permissi-ble to eat animals and/or animal products in ordi-nary circumstances?)
Omnivorism (yes and yes) 847 48.0Vegetarianism (no and yes) 467 26.5Veganism (no and no) 324 18.4Other 174 9.9
Epistemic justification
Internalism 579 35.7 493 30.4Externalism 819 50.5 735 45.3Other 292 18.0
Experience machine (would you enter?)
Yes 219 13.3No 1262 76.9Other 160 9.7
External world
Idealism 117 6.6Skepticism 96 5.4Non-skeptical realism 1403 79.5Other 172 9.8
Footbridge (pushing man off bridge will save five ontrack below, what ought one do?)
Push 382 22.0Don’t push 975 56.0Other 382 22.0
Free will
Compatibilism 1040 59.2Libertarianism 331 18.8No free will 197 11.2Other 200 11.4
Gender
Biological 480 29.0 250 15.1Psychological 356 21.5 71 4.3Social 1043 63.1 711 43.0Unreal 70 4.2 27 1.6Other 245 14.8
God
Theism 335 18.9Atheism 1185 66.9Other 248 14.0
8

Questions and answers Inclusive Exclusive if diff.n % n %
Knowledge claims
Contextualism 805 54.6Relativism 80 5.4Invariantism 376 25.5Other 241 16.4
Knowledge
Empiricism 756 43.9 642 37.3Rationalism 577 33.5 461 26.8Other 475 27.6
Laws of nature
Humean 486 31.3Non-humean 844 54.3Other 231 14.9
Logic
Classical 759 53.6 689 48.7Non-classical 374 26.4 308 21.8Other 342 24.2
Meaning of life
Subjective 570 33.0 489 28.3Objective 553 32.1 476 27.6Nonexistent 278 16.1 257 14.9Other 407 23.6
Mental content
Internalism 399 26.4 332 21.9Externalism 880 58.1 815 53.8Other 297 19.6
Meta-ethics
Moral realism 1067 62.1Moral anti-realism 449 26.1Other 202 11.8
Metaphilosophy
Naturalism 777 50.2Non-naturalism 482 31.1Other 296 19.1
Mind
Physicalism 900 51.9Non-physicalism 556 32.1Other 276 15.9
Moral judgment
Cognitivism 1133 69.3Non-cognitivism 339 20.7Other 169 10.3
9

Questions and answers Inclusive Exclusive if diff.n % n %
Moral motivation
Internalism 586 41.0Externalism 562 39.3Other 315 22.0
Newcomb’s problem
One box 334 31.2Two boxes 418 39.0Other 323 30.2
Normative ethics
Deontology 558 32.1 343 19.7Consequentialism 532 30.6 373 21.4Virtue ethics 644 37.0 436 25.0Other 316 18.2
Perceptual experience
Disjunctivism 207 15.6 183 13.8Qualia theory 200 15.1 176 13.3Representationalism 520 39.3 478 36.1Sense-datum theory 66 5.0 51 3.9Other 372 28.1
Personal identity
Biological view 308 19.1 252 15.6Psychological view 705 43.7 637 39.4Further-fact view 240 14.9 216 13.4Other 429 26.6
Philosophical progress (is there any?)
None 68 3.8A little 827 46.6A lot 740 41.7Other 149 8.4
Political philosophy
Communitarianism 419 27.3 339 22.1Egalitarianism 677 44.0 588 38.3Libertarianism 206 13.4 158 10.3Other 315 20.5
Proper names
Fregean 458 36.1Millian 491 38.7Other 323 25.5
Race
Biological 308 18.7 189 11.5Social 1046 63.4 871 52.8Unreal 248 15.0 188 11.4Other 219 13.3
10

Questions and answers Inclusive Exclusive if diff.n % n %
Science
Scientific realism 1222 72.4Scientific anti-realism 254 15.0Other 217 12.8
Teletransporter (new matter)
Survival 555 35.2Death 631 40.1Other 390 24.8
Time
A-theory 306 27.2B-theory 429 38.2Other 406 36.2
Trolley problem (five straight ahead, one on sidetrack, turn requires switching, what ought one do?)
Switch 1101 63.4Don’t switch 231 13.3Other 407 23.4
Truth
Correspondence 844 51.4 794 48.3Deflationary 403 24.5 365 22.2Epistemic 167 10.2 144 8.8Other 276 16.8
Vagueness
Epistemic 346 24.2 233 16.3Metaphysical 298 20.8 217 15.2Semantic 746 52.1 609 42.6Other 223 15.6
Zombies
Inconceivable 264 16.4Conceivable but not pos. 588 36.5Metaphysically possible 393 24.4Other 362 22.5
Philosophical methods (which methods are the mostuseful/important?)
Reject/lean against
Conceptual analysis 1229 70.9 201 11.6Conceptual engineering 684 39.5 357 20.6Empirical philosophy 1040 60.0 251 14.5Experimental philosophy 565 32.6 623 35.9Formal philosophy 962 55.5 223 12.9Intuition-based philosophy 857 49.5 503 29.0Linguistic philosophy 800 46.2 373 21.5Other 124 7.2
11

3.2 Additional questions
Of the 60 additional questions, one-sixth of the 1785 respondents, or about 300 respondents,
were presented with the question as part of their mandatory 50 questions. Typically, another
800 respondents (45%) were presented with the question by answering additional questions,
for a total of around 1100 respondents (62%) presented with the question. The figures below
include these respondents, excluding those who chose to skip the question or who indicated
“insufficiently familiar”. As before, the results are subject to selection bias, discussed in
section 7.
Additional questions for which combined answers were the most popular include: argu-
ments for theism (18%), method in history (15%), response to skepticism (8%), method in
political philosophy (7%), Wittgenstein (7%), and units of selection (7%).
Views mentioned most often as alternative answers included: arguments for theism: none
(32 respondents, or 3.2%)), consciousness: hylomorphism (12), foundations of mathematics:
Platonism (15), method in history of philosophy: both (15), method in political philosophy:
both (13), statue and lump: nihilism (10), units of selection: multilevel selection (29), units
of selection: groups (11), well-being: hybrid (13): Wittgenstein: neither (29), Wittgenstein:
both (14). As in the previous section, it is evident that combined views (e.g. ”both”,
”hybrid”, ”multilevel”) were often expressed by alternative answers as well as by combined
answers.
Table 2: Additional questions: Respondents who accept or lean toward each answer.
Questions and answers Inclusive Exclusive if diff.n % n %
Abortion (first trimester, no special circumstances)
Permissible 917 81.7Impermissible 147 13.1Other 61 5.4
Aesthetic experience
Perception 193 28.2 171 25.0Pleasure 97 14.2 76 11.1Sui generis 255 37.2 245 35.8Other 167 24.4
Analysis of knowledge
Justified true belief 242 23.6Other analysis 330 32.2No analysis 314 30.6Other 142 13.9
Arguments for theism (which argument is strongest?)
Cosmological 214 20.9 170 16.6Design 181 17.7 142 13.9Ontological 91 8.9 70 6.8
12

Questions and answers Inclusive Exclusive if diff.n % n %
Pragmatic 146 14.2 119 11.6Moral 96 9.4 65 6.3Other 258 25.2
Belief or credence (which is more fundamental?)
Belief 237 30.6Credence 242 31.3Neither 151 19.5Other 149 19.3
Capital punishment
Permissible 199 17.7Impermissible 843 75.1Other 80 7.1
Causation
Counterfactual/difference-making 332 37.2 298 33.4Process/production 201 22.5 167 18.7Primitive 183 20.5 169 18.9Nonexistent 37 4.1 34 3.8Other 184 20.6
Chinese room
Understands 184 17.8Doesn’t understand 692 67.1Other 154 14.9
Concepts
Nativism 241 28.1 200 23.3Empiricism 432 50.3 387 45.1Other 215 25.1
Consciousness
Dualism 224 22.0 204 20.0Eliminativism 46 4.5 39 3.8Functionalism 337 33.0 301 29.5Identity theory 136 13.3 117 11.5Panpsychism 77 7.5 62 6.1Other 232 22.7
Continuum hypothesis (does it have a determinatetruth-value?)
Determinate 180 37.7Indeterminate 137 28.7Other 161 33.7
Cosmological fine-tuning (what explains it?)
Design 140 17.3Multiverse 122 15.1Brute fact 259 32.1No fine-tuning 175 21.7Other 144 17.8
13

Questions and answers Inclusive Exclusive if diff.n % n %
Environmental ethics
Anthropocentric 376 42.2Non-anthropocentric 451 50.7Other 79 8.9
Extended mind
Yes 488 51.3No 353 37.1Other 112 11.8
Foundations of mathematics
Constructivism/intuitionism 92 15.3 82 13.7Formalism 37 6.2 31 5.2Logicism 71 11.8 62 10.3Structuralism 127 21.2 107 17.8Set-theoretic 92 15.3 78 13.0Other 206 34.3
Gender categories
Preserve 201 20.4Revise 500 50.9Eliminate 160 16.3Other 150 15.3
Grounds of intentionality
Causal/teleological 249 34.7 214 29.8Inferential 68 9.5 48 6.7Interpretational 108 15.1 87 12.1Phenomenal 90 12.6 72 10.0Primitive 98 13.7 89 12.4Other 160 22.3
Hard problem of consciousness (is there one?)
Yes 623 62.4No 297 29.8Other 79 7.9
Human genetic engineering
Permissible 680 64.2Impermissible 206 19.5Other 171 16.1
Hume (what is his view?)
Skeptic 318 36.5 252 28.9Naturalist 479 54.9 413 47.4Other 138 15.8
Immortality (would you choose it?)
Yes 500 44.9No 460 41.3Other 151 13.6
14

Questions and answers Inclusive Exclusive if diff.n % n %
Interlevel metaphysics (which is the most useful?)
Grounding 218 29.1 167 22.3Identity 86 11.5 51 6.8Realization 157 21.0 106 14.2Supervenience 185 24.7 138 18.4Other 212 28.3
Justification
Coherentism 225 23.7 182 19.2Infinitism 19 2.0 14 1.5Nonreliabilist foundationalism 239 25.2 207 21.8Reliabilism 319 33.6 274 28.8Other 207 21.8
Kant (what is his view?)
One world 328 45.4Two worlds 252 34.9Other 145 20.1
Law
Legal positivism 244 39.5Legal non-positivism 278 45.0Other 99 16.0
Material composition
Nihilism 47 8.2Restrictivism 201 35.0Universalism 157 27.4Other 173 30.1
Metaontology
Heavyweight realism 272 38.6Deflationary realism 198 28.1Anti-realism 84 11.9Other 152 21.6
Method in history of philosophy (which do you pre-fer?)
Analytic/rational reconstruction 569 60.8 402 42.9Contextual/historicist 416 44.4 251 26.8Other 112 12.0
Method in political philosophy (which do you pre-fer?)
Ideal theory 255 32.4 176 22.4Non-ideal theory 456 58.0 377 48.0Other 148 18.8
Mind uploading (brain replaced by digital emulation)
Survival 279 27.5Death 551 54.2
15

Questions and answers Inclusive Exclusive if diff.n % n %
Other 187 18.4
Moral principles
Moral generalism 537 54.6Moral particularism 332 33.7Other 127 12.9
Morality
Non-naturalism 272 26.6 248 24.2Naturalist realism 324 31.6 288 28.1Constructivism 213 20.8 181 17.7Expressivism 109 10.6 84 8.2Error theory 54 5.3 40 3.9Other 119 11.6
Normative concepts (which is most fundamental?)
Fit 63 7.3 43 5.0Ought 122 14.2 91 10.6Reasons 219 25.4 185 21.5Value 322 37.4 282 32.8Other 211 24.5
Ought implies can
Yes 682 62.9No 307 28.3Other 98 9.0
Philosophical knowledge (is there any?)
None 40 3.6A little 361 32.5A lot 624 56.2Other 90 8.1
Plato (what is his view?)
Knowledge only of forms 335 52.8Knowledge also of concrete things 179 28.2Other 122 19.2
Politics
Capitalism 323 29.5 286 26.1Socialism 580 53.0 532 48.6Other 211 19.3
Possible worlds
Abstract 583 54.8Concrete 49 4.6Nonexistent 319 30.0Other 116 10.9
Practical reason
Aristotelian 344 38.7 305 34.3Humean 272 30.6 251 28.3
16

Questions and answers Inclusive Exclusive if diff.n % n %
Kantian 168 18.9 141 15.9Other 143 16.1
Principle of sufficient reason
True 336 35.9False 428 45.7Other 173 18.5
Properties
Classes 89 11.5Immanent universals 160 20.6Transcendent universals 154 19.8Tropes 119 15.3Nonexistent 63 8.1Other 226 29.1
Propositional attitudes
Dispositional 250 31.5 205 25.8Phenomenal 55 6.9 35 4.4Representational 369 46.5 325 40.9Nonexistent 28 3.5 26 3.3Other 150 18.9
Propositions
Sets 68 8.4Structured entities 311 38.3Simple entities 56 6.9Acts 66 8.1Nonexistent 125 15.4Other 203 25.0
Quantum mechanics
Collapse 95 17.1 82 14.7Hidden-variables 122 21.9 104 18.7Many-worlds 108 19.4 95 17.1Epistemic 71 12.8 63 11.3Other 178 32.0
Race categories
Preserve 77 8.2Revise 305 32.3Eliminate 381 40.4Other 196 20.8
Rational disagreement (can two people with the sameevidence rationally disagree?)
Non-permissivism 193 19.4Permissivism 698 70.2Other 104 10.5
Response to external-world skepticism (which isstrongest?)
17

Questions and answers Inclusive Exclusive if diff.n % n %
Abductive 206 22.1 160 17.2Contextualist 100 10.7 72 7.7Dogmatist 125 13.4 94 10.1Epistemic externalist 176 18.9 136 14.6Semantic externalist 78 8.4 50 5.4Pragmatic 212 22.8 170 18.3Other 160 17.2
Semantic content (which expressions are context-dependent?)
Minimalism (no more than a few) 73 9.4Moderate contextualism (interme-
diate)409 52.5
Radical contextualism (most or all) 199 25.5Other 102 13.1
Sleeping beauty (woken once if heads, woken twice iftails, credence in heads on waking?)
One-third 119 27.7One-half 80 18.6Other 229 53.4
Spacetime
Relationism 284 45.4Substantivalism 172 27.5Other 169 27.0
Statue and lump
One thing 288 30.1Two things 400 41.8Other 269 28.1
Temporal ontology
Presentism 135 18.4Eternalism 293 39.9Growing block 125 17.0Other 183 24.9
Theory of reference
Causal 406 46.3 360 41.0Descriptive 194 22.1 149 17.0Deflationary 132 15.1 123 14.0Other 189 21.6
Time travel
Metaphysically possible 401 42.3Metaphysically impossible 389 41.0Other 158 16.7
True contradictions
Impossible 660 71.4Possible but non-actual 44 4.8
18

Questions and answers Inclusive Exclusive if diff.n % n %
Actual 115 12.4Other 108 11.7
Units of selection
Genes 297 43.5 225 33.0Organisms 294 43.1 223 32.7Other 159 23.3
Values in science (is ideal scientific reasoning neces-sarily sensitive or insensitive to non-epistemic val-ues?)
Necessarily value-free 170 17.7Necessarily value-laden 423 44.0Can be either 299 31.1Other 69 7.2
Well-being
Hedonism/experientialism 123 12.7 98 10.1Desire satisfaction 180 18.6 146 15.1Objective list 514 53.2 483 49.9Other 194 20.1
Wittgenstein (which do you prefer?)
Early 237 24.6 200 20.8Late 554 57.5 515 53.5Other 166 17.2
Other minds (for which groups are some membersconscious?)
Reject/lean against
Adult humans 1039 95.1 2 0.2Cats 967 88.6 43 3.9Fish 713 65.3 161 14.7Flies 377 34.5 419 38.4Worms 264 24.2 509 46.6Plants 79 7.2 870 79.7Particles 22 2.0 973 89.1Newborn babies 921 84.3 53 4.9Current ai systems 37 3.4 900 82.4Future ai systems 428 39.2 293 26.8Other 51 4.7
4 Demographics
4.1 Geography
Each respondent is associated with up to three countries: nationality, country of PhD,
country of affiliation. The USA is far ahead on all three lists, followed by the UK, followed by
19

Table 3: Nationality and country of primary affiliation
Nationality Respondents
USA 859UK 163Canada 127Germany 89Australia 59Italy 38Sweden 29New Zealand 24Netherlands 22Spain 20Israel 18Belgium 13France 13Denmark 12Poland 11Switzerland 11Ireland 11Norway 10Austria 9Brazil 9Finland 7Colombia 6Romania 5Portugal 5Greece 5Other 64No answer 146
Country of affiliation Respondents
USA 1004UK 203Canada 123Australia 73Germany 56Sweden 34Netherlands 34Italy 24Spain 23New Zealand 20Israel 18Norway 15Brazil 12Switzerland 12Singapore 12Hong Kong 12Belgium 11Denmark 10Austria 10France 10Poland 9Ireland 8South Africa 6Mexico 5Other 45No answer 13
Australia, Canada, and Germany in varying orders, and then numerous European countries.
The leading non-European countries (aside from Australia, Canada, NZ, and the US) were
Israel, Brazil, and Colombia (nationality), and Israel, Brazil, Singapore, Hong Kong, South
Africa, and Mexico (affiliation).
4.2 Gender and age
Just over 20% of respondents who indicated gender indicated gender: female, while about
0.5% indicated gender: other, with the rest indicating gender: male. The most common
decade of birth was the 1970s, followed by the 1980s and the 1960s.
4.3 Philosophical orientation
The most common areas of specialization (in order) were epistemology, metaphysics, norma-
tive ethics, and philosophy of mind. A large majority of respondents specified an analytic
orientation, followed by continental orientation, and write-in choices including pragmatism,
history, and a number identifying with multiple orientations. On identification with non-
living philosophers, the leaders included Aristotle, Hume, Kant, Wittgenstein, Lewis, and
20

Table 4: Country of PhD
Country of PhD Respondents
USA 835UK 162Australia 51Canada 49Germany 40Netherlands 17Sweden 14Spain 10Belgium 8Italy 6Switzerland 5Other 30No answer 540
Figure 3: Decade of birth
0 100 200 300 400 500
1990s
1980s
1970s
1960s
1950s
1940s
1930s
No answer
500
424
395
209
62
23
6
166
21

Table 5: Gender
Gender Respondents
Male 1365Female 357Prefer not to say 25Other gender 9No answer 29
Table 6: Philosophical traditions
Philosophical traditions Respondents
Analytic 1430Other tradition 169Continental 113Both 17Pragmatism 13History 5Aristotelian 3No answer 73
Quine, with many write-in options included.
5 Longitudinal analysis
In this section we compare the 2020 results for the 30 main questions to the 2009 results.
For this purpose, we restrict the 2020 results to the target group of 100 2009-comparable
departments in Australasia, Europe, and North America. As explained in section 2, the
2009-comparable departments, like the target departments in the 2009 survey, were selected
based largely on rankings.
It should be noted that the “2009-comparable department” group differs systematically
from the broader target population in a number of respects. Demographically, it includes
a higher proportion of UK-based philosophers and analytic-tradition philosophers than the
target population. Philosophically, it includes a lower proportion of theists, along with many
other differences evident in comparing 2020 results in table 1 (all departments) to table 9
(2009-comparable departments).
For longitudinal purposes, we use “exclusive” rather than “inclusive” answer figures:
that is, we exclude respondents who endorse multiple options. Exclusive answers were
used in presenting our 2009 results, so using them here maximizes continuity with existing
familiar results. Furthermore, inclusive answers were handled somewhat differently in 2009
and 2020, so using exclusive answers maximizes comparability of the results. Using them
should make no difference to relative results on binary questions (though absolute results are
lower in some cases, as multiple options could be chosen more easily in 2020 than in 2009).
On nonbinary questions, this method sets aside fine-grained information about respondents
who endorse some but not all of the options; but since this fine-grained information was
not available in the 2009 survey, it would be hard to use it for longitudinal purposes. We
22
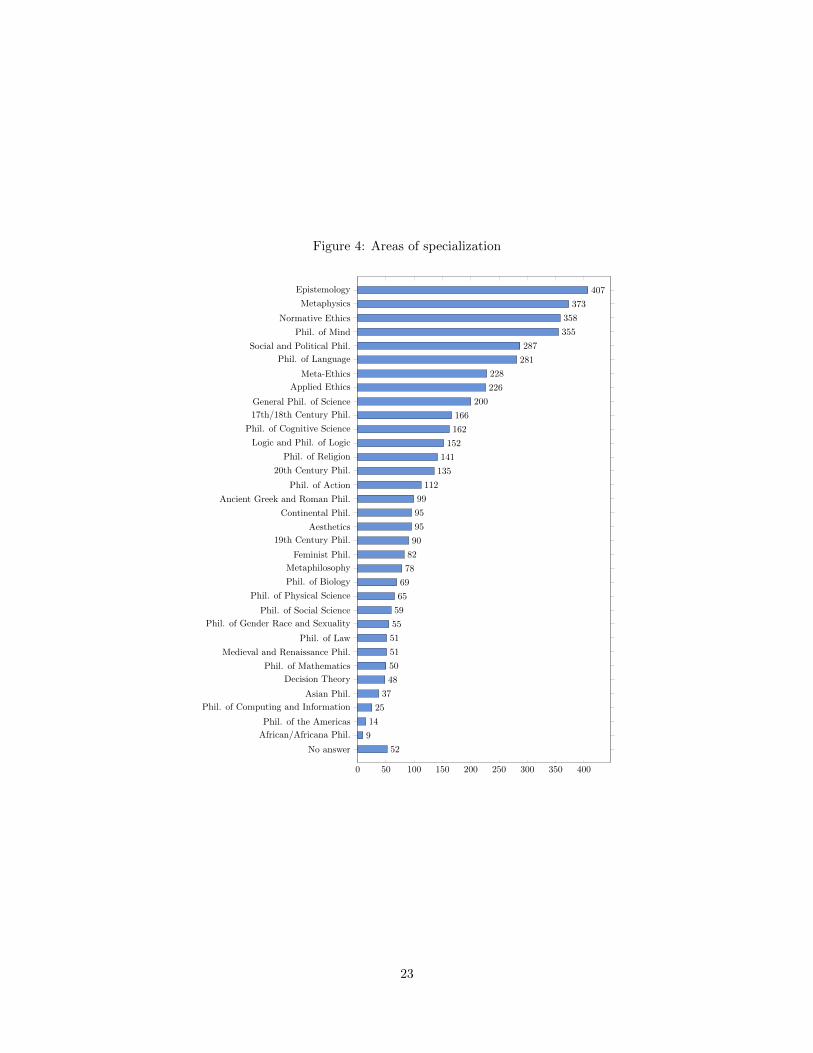
Figure 4: Areas of specialization
0 50 100 150 200 250 300 350 400
Epistemology
Metaphysics
Normative Ethics
Phil. of Mind
Social and Political Phil.
Phil. of Language
Meta-Ethics
Applied Ethics
General Phil. of Science
17th/18th Century Phil.
Phil. of Cognitive Science
Logic and Phil. of Logic
Phil. of Religion
20th Century Phil.
Phil. of Action
Ancient Greek and Roman Phil.
Continental Phil.
Aesthetics
19th Century Phil.
Feminist Phil.
Metaphilosophy
Phil. of Biology
Phil. of Physical Science
Phil. of Social Science
Phil. of Gender Race and Sexuality
Phil. of Law
Medieval and Renaissance Phil.
Phil. of Mathematics
Decision Theory
Asian Phil.
Phil. of Computing and Information
Phil. of the Americas
African/Africana Phil.
No answer
407
373
358
355
287
281
228
226
200
166
162
152
141
135
112
99
95
95
90
82
78
69
65
59
55
51
51
50
48
37
25
14
9
52
23

Table 7: Philosophers most identified with
Aristotle (238) Davidson (44) Sellars (16)Hume (221) Leibniz (41) Nagarjuna (15)Kant (188) Anscombe (39) Du Bois (13)Wittgenstein (117) Nietzsche (39) Rorty (13)Lewis (117) Moore (39) Sartre (13)Quine (107) Hegel (38) Berkeley (12)Frege (95) Heidegger (34) Austin (9)Carnap (80) Locke (33) Wollstonecraft (9)Russell (80) Husserl (33) Grice (8)Plato (74) Spinoza (32) Derrida (8)Rawls (71) Reid (32) Whitehead (7)Mill (67) Merleau-Ponty (28) Rousseau (7)Aquinas (56) Foucault (27) Sidgwick (7)Marx (52) Beauvoir (26) Confucius (7)Socrates (49) Peirce (26) Ramsey (6)Descartes (48) Augustine (23) Buddha (6)James (47) Kierkegaard (22) Zhuangzi (6)Parfit (46) Arendt (18) Schopenhauer (6)Dewey (45) Popper (18) Deleuze (5)Putnam (44) Hobbes (16) Dummett (5)
have also included “skip” and “insufficiently familiar” answers as “other” answers in this
context, to maximize continuity with how results were presented in 2009.
Our main longitudinal measure is the swing toward or against a position on the survey,
defined as its relative strength in 2020 minus its relative strength in 2009. The relative
strength of a position on a survey is defined as the percentage of respondents who endorse
it exclusively, minus the average percentage of respondents who endorse other options ex-
clusively (averaged across all other options). There is no perfect measure of swing when
more than two options are present, but our definition has the nice feature that all swings
on a given question sum to zero. Furthermore, in cases where all positions increase by the
same amount (5%, say), as discussed above, the swing toward each position will be zero.
The biggest swings toward any position from 2009 to 2020 are shown on table 8.
We also have the information to longitudinally compare results over the same people
in 2009 and 2020: that is, over 2009 respondents in the target group who also responded
in 2020 (regardless of whether they were in the target group in 2020). We have included
these “same people” results with a corresponding swing, to shed light on the issue of how
individual views may change over time. The biggest swings for this longitudinal comparison
can be found in table 9.
The survey website includes some further longitudinal comparisons, including compar-
isons across “same departments” (the 2009 departments in both 2009 and 2020) . It also
includes comparisons using “weighted scores” (0 for rejecting a view, 0.25 for leaning against
it, 0.5 for other, 0.75 for leaning toward it, 1 for accepting it), which are more fine-grained
than the current percentages which in effect assign 0 for the first three options and 1 for the
last two.
24

Table 8: Largest swings from 2009 to 2020 across comparable departments.
Answer SwingLogic: non-classical 13.4Knowledge claims: invariantism -11.2Moral motivation: externalism 8.7Laws of nature: Humean 8.5A priori knowledge: yes 8.5Knowledge claims: contextualism 7.6Aesthetic value: subjective 6.9Trolley problem: don’t switch 6.3Meta-ethics: moral realism 5.4Free will: compatibilism 5.3
Table 9: Largest swings from 2009 to 2020 across the same people (target 2009 respondentswho also responded in 2020).
Answer SwingTrolley problem: don’t switch 11.9Logic: non-classical 9.5Moral judgment: non-cognitivism 8.3Knowledge claims: invariantism -8.2Abstract objects: Platonism 7.7Normative ethics: virtue ethics 6.5Knowledge claims: contextualism 6.1Normative ethics: consequentialism -5.9Free will: no free will -5.9Metaphilosophy: naturalism 5.6
25

Table 10: Longitudinal comparison
Qs and As Comparable departments Same people09% 20% ch. Swng 09% 20% ch. Swng
A priori knowledgeYes 71.1 74.8 ⇑3.7 ⇑8.5 73.9 71.5 ⇓2.4 ⇓3.0No 18.4 13.6 ⇓4.8 ⇓8.5 16.0 16.6 ⇑0.6 ⇑3.0Other 10.5 11.6 10.1 11.9
Abstract objectsPlatonism 39.3 37.2 ⇓2.1 ⇓1.2 37.1 39.5 ⇑2.4 ⇑7.7Nominalism 37.7 36.7 ⇓1.0 ⇑1.2 39.5 34.1 ⇓5.4 ⇓7.7Other 23.0 26.1 23.4 26.4
Aesthetic valueObjective 41.0 37.8 ⇓3.2 ⇓6.9 36.8 36.2 ⇓0.6 ⇑3.0Subjective 34.5 38.1 ⇑3.6 ⇑6.9 39.8 36.2 ⇓3.6 ⇓3.0Other 24.5 24.1 23.4 27.6
Analytic-synthetic distinctionYes 64.9 63.7 ⇓1.2 ⇑5.3 65.0 64.1 ⇓0.9 ⇑3.9No 27.1 20.7 ⇓6.4 ⇓5.3 26.7 22.0 ⇓4.7 ⇓3.9Other 8.0 15.6 8.3 13.9
Epistemic justificationInternalism 26.4 27.9 ⇑1.5 ⇑1.4 30.0 30.6 ⇑0.6 ⇑3.6Externalism 42.7 42.9 ⇑0.2 ⇓1.4 43.6 40.7 ⇓2.9 ⇓3.6Other 30.9 29.2 26.4 28.7
External worldIdealism 4.3 4.0 ⇓0.3 ⇓0.8 2.7 4.2 ⇑1.5 ⇑2.2Skepticism 4.8 4.3 ⇓0.5 ⇓1.1 5.9 6.5 ⇑0.6 ⇑0.9Non-skeptical realism 81.6 83.2 ⇑1.6 ⇑1.9 81.9 79.8 ⇓2.1 ⇓3.1Other 9.3 8.5 9.5 9.5
Free willCompatibilism 59.1 62.8 ⇑3.7 ⇑5.3 60.8 62.0 ⇑1.2 ⇑3.9Libertarianism 13.7 12.8 ⇓0.9 ⇓1.7 12.2 12.2 — ⇑2.1No free will 12.2 10.0 ⇓2.2 ⇓3.6 14.8 9.5 ⇓5.3 ⇓5.9Other 15.0 14.4 12.2 16.3
GodTheism 14.6 12.5 ⇓2.1 ⇓3.5 10.1 10.7 ⇑0.6 ⇑2.1Atheism 72.8 74.2 ⇑1.4 ⇑3.5 78.6 77.2 ⇓1.4 ⇓2.1Other 12.6 13.3 11.3 12.1
KnowledgeEmpiricism 35.0 33.0 ⇓2.0 ⇓2.9 36.2 35.9 ⇓0.3 ⇑2.7Rationalism 27.8 28.7 ⇑0.9 ⇑2.9 30.3 27.3 ⇓3.0 ⇓2.7Other 37.2 38.3 33.5 36.8
Knowledge claimsContextualism 40.1 42.4 ⇑2.3 ⇑7.6 39.2 40.1 ⇑0.9 ⇑6.1Relativism 2.9 2.6 ⇓0.3 ⇑3.6 4.2 2.4 ⇓1.8 ⇑2.1Invariantism 31.1 21.0 ⇓10.1 ⇓11.2 31.5 22.8 ⇓8.7 ⇓8.2Other 25.9 34.0 25.1 34.7
Laws of natureHumean 24.7 24.4 ⇓0.3 ⇑8.5 25.2 25.8 ⇑0.6 ⇑3.9Non-humean 57.1 48.3 ⇓8.8 ⇓8.5 52.5 49.3 ⇓3.2 ⇓3.9
26

Qs and As Comparable departments Same people09% 20% ch. Swng 09% 20% ch. Swng
Other 18.2 27.3 22.3 24.9
LogicClassical 51.6 39.8 ⇓11.8 ⇓13.4 52.5 44.5 ⇓8.0 ⇓9.5Non-classical 15.4 17.0 ⇑1.6 ⇑13.4 13.6 15.1 ⇑1.5 ⇑9.5Other 33.0 43.2 33.9 40.4
Mental contentInternalism 20.0 18.2 ⇓1.8 ⇓0.8 19.9 21.1 ⇑1.2 ⇑4.5Externalism 51.1 50.2 ⇓0.9 ⇑0.8 51.3 48.1 ⇓3.2 ⇓4.5Other 28.9 31.6 28.8 30.8
Meta-ethicsMoral realism 56.4 59.9 ⇑3.5 ⇑5.4 54.9 56.4 ⇑1.5 ⇑4.5Moral anti-realism 27.7 25.8 ⇓1.9 ⇓5.4 30.6 27.6 ⇓3.0 ⇓4.5Other 15.9 14.3 14.5 16.0
MetaphilosophyNaturalism 49.8 43.2 ⇓6.6 ⇓3.4 47.5 49.0 ⇑1.5 ⇑5.6Non-naturalism 25.9 22.7 ⇓3.2 ⇑3.4 27.0 22.8 ⇓4.2 ⇓5.6Other 24.3 34.1 25.5 28.2
MindPhysicalism 56.5 57.4 ⇑0.9 ⇑2.2 61.1 59.3 ⇓1.8 ⇓2.4Non-physicalism 27.1 25.8 ⇓1.3 ⇓2.2 24.3 24.9 ⇑0.6 ⇑2.4Other 16.4 16.8 14.6 15.8
Moral judgmentCognitivism 65.7 63.4 ⇓2.3 ⇓2.9 69.1 62.9 ⇓6.2 ⇓8.3Non-cognitivism 17.0 17.6 ⇑0.6 ⇑2.9 16.6 18.7 ⇑2.1 ⇑8.3Other 17.3 19.0 14.3 18.4
Moral motivationInternalism 34.9 29.6 ⇓5.3 ⇓8.7 34.7 32.6 ⇓2.1 —Externalism 29.8 33.2 ⇑3.4 ⇑8.7 34.7 32.6 ⇓2.1 —Other 35.3 37.2 30.6 34.8
Newcomb’s problemOne box 21.3 20.1 ⇓1.2 ⇓1.0 23.1 21.7 ⇓1.4 —Two boxes 31.4 31.2 ⇓0.2 ⇑1.0 35.0 33.5 ⇓1.5 —Other 47.3 48.7 41.9 44.8
Normative ethicsDeontology 25.9 22.5 ⇓3.4 ⇓2.2 22.8 20.8 ⇓2.0 ⇓0.6Consequentialism 23.6 21.3 ⇓2.3 ⇓0.7 29.4 23.7 ⇓5.7 ⇓5.9Virtue ethics 18.2 18.2 — ⇑2.9 16.0 18.7 ⇑2.7 ⇑6.5Other 32.3 38.0 31.8 36.8
Perceptual experienceDisjunctivism 11.0 11.1 ⇑0.1 ⇑1.8 9.2 8.6 ⇓0.6 ⇑1.2Qualia theory 12.2 10.8 ⇓1.4 ⇓0.3 16.6 12.2 ⇓4.4 ⇓4.0Representationalism 31.5 28.9 ⇓2.6 ⇓1.9 28.2 28.5 ⇑0.3 ⇑2.4Sense-datum theory 3.1 2.2 ⇓0.9 ⇑0.4 3.6 2.4 ⇓1.2 ⇑0.4Other 42.2 47.0 42.4 48.3
Personal identityBiological view 16.9 15.3 ⇓1.6 ⇓3.0 17.5 17.5 — ⇑0.5Psychological view 33.6 37.0 ⇑3.4 ⇑4.6 35.6 37.7 ⇑2.1 ⇑3.6Further-fact view 12.2 11.6 ⇓0.6 ⇓1.6 10.7 7.7 ⇓3.0 ⇓4.0
27

Qs and As Comparable departments Same people09% 20% ch. Swng 09% 20% ch. Swng
Other 37.3 36.1 36.2 37.1
Proper namesFregean 28.7 27.0 ⇓1.7 ⇑0.6 27.6 25.5 ⇓2.1 ⇓0.9Millian 34.5 32.3 ⇓2.2 ⇓0.6 35.9 34.7 ⇓1.2 ⇑0.9Other 36.8 40.7 36.5 39.8
ScienceScientific realism 75.1 73.6 ⇓1.5 ⇓0.5 76.3 73.6 ⇓2.7 ⇓1.5Scientific anti-realism 11.6 10.6 ⇓1.0 ⇑0.5 11.6 10.4 ⇓1.2 ⇑1.5Other 13.3 15.8 12.1 16.0
TeletransporterSurvival 36.2 36.0 ⇓0.2 ⇓3.4 39.5 35.9 ⇓3.6 ⇓4.5Death 31.1 34.3 ⇑3.2 ⇑3.4 32.9 33.8 ⇑0.9 ⇑4.5Other 32.7 29.7 27.6 30.3
TimeA-theory 15.5 13.9 ⇓1.6 ⇓3.7 13.6 13.9 ⇑0.3 ⇑3.6B-theory 26.3 28.4 ⇑2.1 ⇑3.7 30.3 27.0 ⇓3.3 ⇓3.6Other 58.2 57.7 56.1 59.1
Trolley problemSwitch 68.2 66.2 ⇓2.0 ⇓6.3 74.8 67.4 ⇓7.4 ⇓11.9Don’t switch 7.6 11.9 ⇑4.3 ⇑6.3 6.2 10.7 ⇑4.5 ⇑11.9Other 24.2 21.9 19.0 21.9
TruthCorrespondence 50.8 44.4 ⇓6.4 ⇓5.1 48.1 46.3 ⇓1.8 ⇑0.6Deflationary 24.8 23.8 ⇓1.0 ⇑2.9 29.4 24.6 ⇓4.8 ⇓3.9Epistemic 6.9 5.4 ⇓1.5 ⇑2.2 4.7 4.7 — ⇑3.3Other 17.5 26.4 17.8 24.4
ZombiesInconceivable 16.0 13.1 ⇓2.9 ⇓1.9 18.7 16.0 ⇓2.7 ⇓1.6Conceivable but not
pos.35.6 36.9 ⇑1.3 ⇑4.5 35.9 32.3 ⇓3.6 ⇓3.0
Metaphysically possible 23.3 19.9 ⇓3.4 ⇓2.6 20.2 21.7 ⇑1.5 ⇑4.6Other 25.1 30.1 25.2 30.0
6 Correlations
To calculate correlations, we first assigned a variable for each main answer option to a main
question. Its value for a respondent ranges from -2 to 2 depending on whether the respondent
rejects, leans toward rejecting, is neutral on (”agnostic”, ”too unclear to answer”, or ”no
fact of the matter”), leans toward accepting, or accepts the position corresponding to the
option. When a respondent selects “Accept: X” or “Lean toward: X” in the main interface
without evaluating multiple options, we consider that they also reject or lean against the
other options respectively. When they evaluate multiple options, we use those evaluations
separately. Respondents who gave answers falling under “other” but that are not considered
neutral were left out of correlation calculations for all relevant pairs of variables.
For demographic and orientation questions, each possible answer (e.g., “AOS: Feminist
28

philosophy”) was assigned a variable whose value is 2 for a respondent who selected that
answer, 0 for respondents who specified another answer, and N/A for respondents who
skipped the question.
We calculated the Pearson correlation coefficient for every pair of variables in the study.
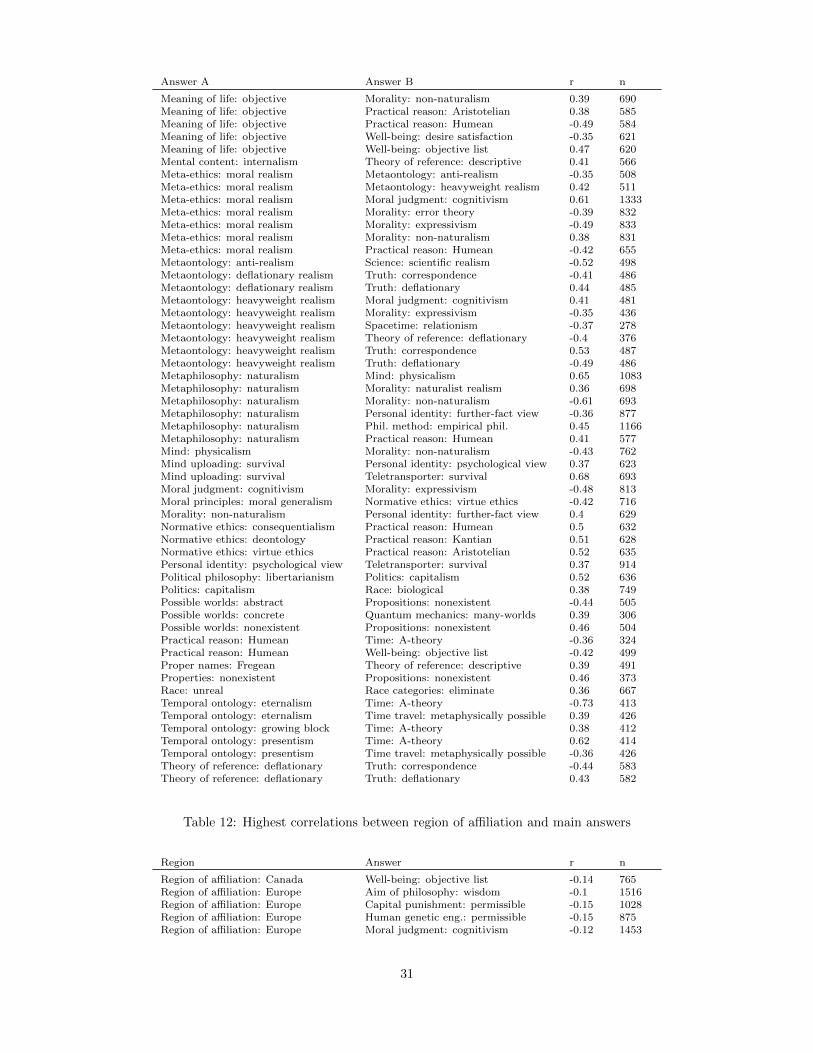
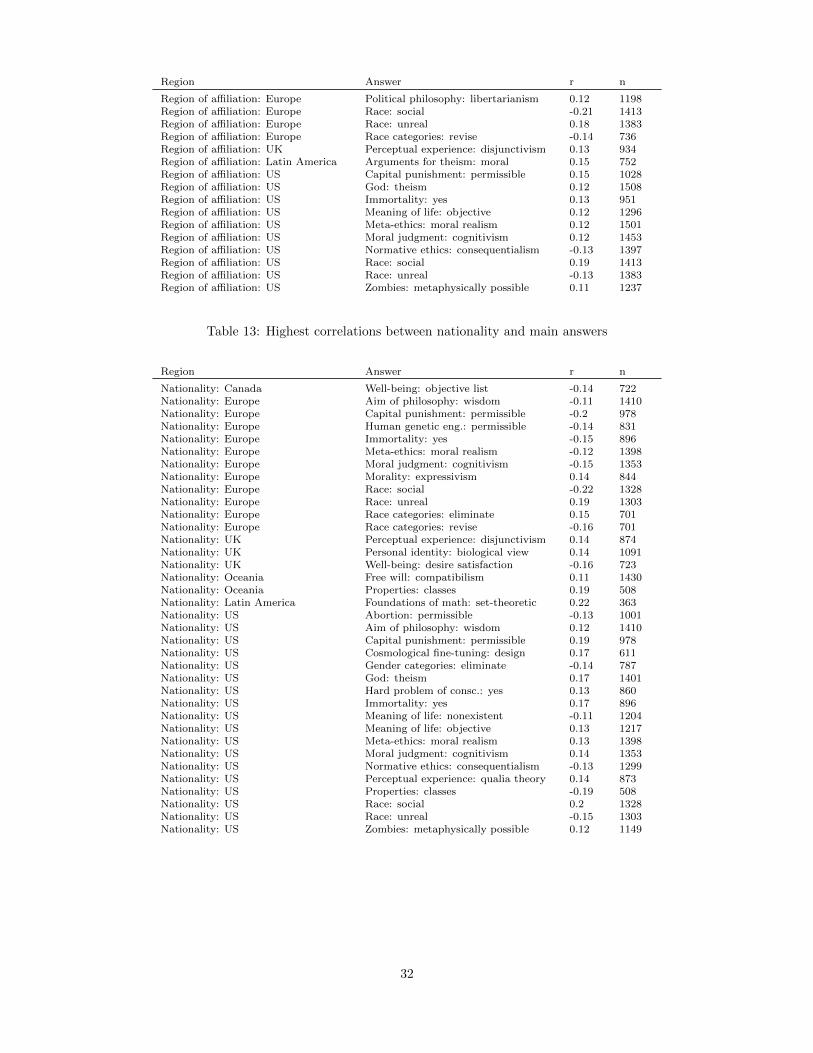
Tables 10-16 show the most correlated (or anti-correlated) variables across main answers,
main answers and geographic variables, main answers and year of birth, and main answers
and gender.
Table 11: Highest correlations between main answers
Answer A Answer B r n
A priori knowledge: yes Analytic-synthetic distinction: yes 0.51 1398A priori knowledge: yes Knowledge: empiricism -0.36 1156Abortion: permissible Consciousness: dualism -0.46 661Abortion: permissible Cosmological fine-tuning: brute fact 0.35 540Abortion: permissible Cosmological fine-tuning: design -0.74 542Abortion: permissible Free will: compatibilism 0.35 943Abortion: permissible Free will: libertarianism -0.45 940Abortion: permissible Gender: biological -0.36 840Abortion: permissible Gender: social 0.37 846Abortion: permissible Gender categories: preserve -0.44 687Abortion: permissible God: theism -0.68 932Abortion: permissible Human genetic eng.: permissible 0.38 746Abortion: permissible Immortality: yes -0.36 782Abortion: permissible Meaning of life: objective -0.45 817Abortion: permissible Metaphilosophy: naturalism 0.44 787Abortion: permissible Mind: physicalism 0.44 896Abstract objects: Platonism Consciousness: dualism 0.38 649Abstract objects: Platonism Knowledge: empiricism -0.45 996Abstract objects: Platonism Meta-ethics: moral realism 0.39 1159Abstract objects: Platonism Metaontology: heavyweight realism 0.39 458Abstract objects: Platonism Morality: non-naturalism 0.36 700Abstract objects: Platonism Possible worlds: nonexistent -0.36 757Abstract objects: Platonism Properties: transcendent universals 0.55 478Abstract objects: Platonism Propositions: nonexistent -0.49 514Abstract objects: Platonism Propositions: structured entities 0.36 515Aesthetic value: objective Cosmological fine-tuning: design 0.39 525Aesthetic value: objective Meaning of life: objective 0.55 1098Aesthetic value: objective Meaning of life: subjective -0.38 1099Aesthetic value: objective Meta-ethics: moral realism 0.51 1236Aesthetic value: objective Metaontology: heavyweight realism 0.36 455Aesthetic value: objective Moral judgment: cognitivism 0.38 1174Aesthetic value: objective Practical reason: Humean -0.4 608Aesthetic value: objective Well-being: objective list 0.41 636Arguments for theism: cosmological Cosmological fine-tuning: design 0.38 444Chinese room: understands Consciousness: dualism -0.37 572Concepts: nativism Knowledge: empiricism -0.39 517Consciousness: dualism Cosmological fine-tuning: design 0.56 465Consciousness: dualism Free will: libertarianism 0.43 720Consciousness: dualism God: theism 0.47 693Consciousness: dualism Grounds of intentionality: primitive 0.36 385Consciousness: dualism Hard problem of consc.: yes 0.39 612Consciousness: dualism Meaning of life: objective 0.41 619Consciousness: dualism Metaphilosophy: naturalism -0.55 622Consciousness: dualism Mind: physicalism -0.73 712Consciousness: dualism Morality: non-naturalism 0.51 582Consciousness: dualism Personal identity: further-fact view 0.36 586Consciousness: dualism Zombies: metaphysically possible 0.41 622Consciousness: functionalism Cosmological fine-tuning: design -0.36 465Consciousness: functionalism Mind: physicalism 0.47 714Cosmological fine-tuning: brute fact God: theism -0.39 592Cosmological fine-tuning: design Free will: compatibilism -0.37 615
29

Answer A Answer B r n
Cosmological fine-tuning: design Free will: libertarianism 0.54 614Cosmological fine-tuning: design Gender categories: preserve 0.42 432Cosmological fine-tuning: design God: theism 0.78 592Cosmological fine-tuning: design Human genetic eng.: permissible -0.36 492Cosmological fine-tuning: design Immortality: yes 0.39 518Cosmological fine-tuning: design Meaning of life: objective 0.58 524Cosmological fine-tuning: design Meaning of life: subjective -0.36 526Cosmological fine-tuning: design Meta-ethics: moral realism 0.36 596Cosmological fine-tuning: design Metaphilosophy: naturalism -0.55 530Cosmological fine-tuning: design Mind: physicalism -0.53 581Cosmological fine-tuning: design Morality: non-naturalism 0.43 498Cosmological fine-tuning: design Personal identity: further-fact view 0.39 478Cosmological fine-tuning: design Personal identity: psychological view -0.36 480Cosmological fine-tuning: design Practical reason: Aristotelian 0.39 397Cosmological fine-tuning: multiverse Quantum mechanics: many-worlds 0.57 258Eating animals/products of: om-nivorism
Environmental ethics: anthropocentric 0.36 745
Epistemic justification: internalism Justif.: nonreliabilist found. 0.45 644Epistemic justification: internalism Justif.: reliabilism -0.47 647Epistemic justification: internalism Mental content: internalism 0.46 1052Experience machine: yes Well-being: objective list -0.35 694External world: non-skeptical realism Metaontology: anti-realism -0.36 517External world: non-skeptical realism Science: scientific realism 0.36 1376Footbridge: push Normative ethics: consequentialism 0.46 1133Footbridge: push Trolley problem: switch 0.35 1221Foundations of math: cons/intuit Metaontology: anti-realism 0.43 232Free will: libertarianism God: theism 0.49 1347Free will: libertarianism Metaphilosophy: naturalism -0.41 1139Free will: libertarianism Mind: physicalism -0.45 1319Gender: biological Gender categories: preserve 0.47 733Gender: biological Race: biological 0.45 1239Gender: social Gender categories: preserve -0.45 745Gender: social Gender categories: revise 0.36 748Gender: social Race: social 0.45 1254Gender categories: eliminate Race categories: eliminate 0.41 598Gender categories: preserve Politics: capitalism 0.4 593Gender categories: preserve Race: biological 0.35 743Gender categories: preserve Race categories: preserve 0.4 597Gender categories: revise Race categories: revise 0.45 597God: theism Human genetic eng.: permissible -0.4 774God: theism Immortality: yes 0.37 857God: theism Meaning of life: objective 0.53 1165God: theism Metaphilosophy: naturalism -0.51 1102God: theism Mind: physicalism -0.55 1289God: theism Morality: non-naturalism 0.37 794God: theism Practical reason: Humean -0.35 643God: theism Principle of sufficient reason: true 0.38 670Grounds of intentionality:causal/teleo.
Theory of reference: causal 0.4 379
Grounds of intentionality: phenomenal Propositional attitudes: phenomenal 0.4 371Hard problem of consc.: yes Mind: physicalism -0.35 797Justif.: nonreliabilist found. Morality: non-naturalism 0.35 553Knowledge: empiricism Laws of nature: Humean 0.37 980Knowledge: empiricism Metaontology: heavyweight realism -0.35 419Knowledge: empiricism Metaphilosophy: naturalism 0.47 951Knowledge: empiricism Mind: physicalism 0.37 1079Knowledge: empiricism Morality: non-naturalism -0.38 663Knowledge: empiricism Practical reason: Humean 0.37 558Laws of nature: Humean Meaning of life: objective -0.36 1019Laws of nature: Humean Meta-ethics: moral realism -0.35 1170Laws of nature: Humean Practical reason: Humean 0.39 592Logic: classical True contradictions: actual -0.35 613Logic: classical True contradictions: impossible 0.38 613Meaning of life: objective Meta-ethics: moral realism 0.49 1169Meaning of life: objective Metaphilosophy: naturalism -0.45 983Meaning of life: objective Mind: physicalism -0.42 1122Meaning of life: objective Moral judgment: cognitivism 0.37 1122
30
Answer A Answer B r n
Meaning of life: objective Morality: non-naturalism 0.39 690Meaning of life: objective Practical reason: Aristotelian 0.38 585Meaning of life: objective Practical reason: Humean -0.49 584Meaning of life: objective Well-being: desire satisfaction -0.35 621Meaning of life: objective Well-being: objective list 0.47 620Mental content: internalism Theory of reference: descriptive 0.41 566Meta-ethics: moral realism Metaontology: anti-realism -0.35 508Meta-ethics: moral realism Metaontology: heavyweight realism 0.42 511Meta-ethics: moral realism Moral judgment: cognitivism 0.61 1333Meta-ethics: moral realism Morality: error theory -0.39 832Meta-ethics: moral realism Morality: expressivism -0.49 833Meta-ethics: moral realism Morality: non-naturalism 0.38 831Meta-ethics: moral realism Practical reason: Humean -0.42 655Metaontology: anti-realism Science: scientific realism -0.52 498Metaontology: deflationary realism Truth: correspondence -0.41 486Metaontology: deflationary realism Truth: deflationary 0.44 485Metaontology: heavyweight realism Moral judgment: cognitivism 0.41 481Metaontology: heavyweight realism Morality: expressivism -0.35 436Metaontology: heavyweight realism Spacetime: relationism -0.37 278Metaontology: heavyweight realism Theory of reference: deflationary -0.4 376Metaontology: heavyweight realism Truth: correspondence 0.53 487Metaontology: heavyweight realism Truth: deflationary -0.49 486Metaphilosophy: naturalism Mind: physicalism 0.65 1083Metaphilosophy: naturalism Morality: naturalist realism 0.36 698Metaphilosophy: naturalism Morality: non-naturalism -0.61 693Metaphilosophy: naturalism Personal identity: further-fact view -0.36 877Metaphilosophy: naturalism Phil. method: empirical phil. 0.45 1166Metaphilosophy: naturalism Practical reason: Humean 0.41 577Mind: physicalism Morality: non-naturalism -0.43 762Mind uploading: survival Personal identity: psychological view 0.37 623Mind uploading: survival Teletransporter: survival 0.68 693Moral judgment: cognitivism Morality: expressivism -0.48 813Moral principles: moral generalism Normative ethics: virtue ethics -0.42 716Morality: non-naturalism Personal identity: further-fact view 0.4 629Normative ethics: consequentialism Practical reason: Humean 0.5 632Normative ethics: deontology Practical reason: Kantian 0.51 628Normative ethics: virtue ethics Practical reason: Aristotelian 0.52 635Personal identity: psychological view Teletransporter: survival 0.37 914Political philosophy: libertarianism Politics: capitalism 0.52 636Politics: capitalism Race: biological 0.38 749Possible worlds: abstract Propositions: nonexistent -0.44 505Possible worlds: concrete Quantum mechanics: many-worlds 0.39 306Possible worlds: nonexistent Propositions: nonexistent 0.46 504Practical reason: Humean Time: A-theory -0.36 324Practical reason: Humean Well-being: objective list -0.42 499Proper names: Fregean Theory of reference: descriptive 0.39 491Properties: nonexistent Propositions: nonexistent 0.46 373Race: unreal Race categories: eliminate 0.36 667Temporal ontology: eternalism Time: A-theory -0.73 413Temporal ontology: eternalism Time travel: metaphysically possible 0.39 426Temporal ontology: growing block Time: A-theory 0.38 412Temporal ontology: presentism Time: A-theory 0.62 414Temporal ontology: presentism Time travel: metaphysically possible -0.36 426Theory of reference: deflationary Truth: correspondence -0.44 583Theory of reference: deflationary Truth: deflationary 0.43 582
Table 12: Highest correlations between region of affiliation and main answers
Region Answer r n
Region of affiliation: Canada Well-being: objective list -0.14 765Region of affiliation: Europe Aim of philosophy: wisdom -0.1 1516Region of affiliation: Europe Capital punishment: permissible -0.15 1028Region of affiliation: Europe Human genetic eng.: permissible -0.15 875Region of affiliation: Europe Moral judgment: cognitivism -0.12 1453
31
Region Answer r n
Region of affiliation: Europe Political philosophy: libertarianism 0.12 1198Region of affiliation: Europe Race: social -0.21 1413Region of affiliation: Europe Race: unreal 0.18 1383Region of affiliation: Europe Race categories: revise -0.14 736Region of affiliation: UK Perceptual experience: disjunctivism 0.13 934Region of affiliation: Latin America Arguments for theism: moral 0.15 752Region of affiliation: US Capital punishment: permissible 0.15 1028Region of affiliation: US God: theism 0.12 1508Region of affiliation: US Immortality: yes 0.13 951Region of affiliation: US Meaning of life: objective 0.12 1296Region of affiliation: US Meta-ethics: moral realism 0.12 1501Region of affiliation: US Moral judgment: cognitivism 0.12 1453Region of affiliation: US Normative ethics: consequentialism -0.13 1397Region of affiliation: US Race: social 0.19 1413Region of affiliation: US Race: unreal -0.13 1383Region of affiliation: US Zombies: metaphysically possible 0.11 1237
Table 13: Highest correlations between nationality and main answers
Region Answer r n
Nationality: Canada Well-being: objective list -0.14 722Nationality: Europe Aim of philosophy: wisdom -0.11 1410Nationality: Europe Capital punishment: permissible -0.2 978Nationality: Europe Human genetic eng.: permissible -0.14 831Nationality: Europe Immortality: yes -0.15 896Nationality: Europe Meta-ethics: moral realism -0.12 1398Nationality: Europe Moral judgment: cognitivism -0.15 1353Nationality: Europe Morality: expressivism 0.14 844Nationality: Europe Race: social -0.22 1328Nationality: Europe Race: unreal 0.19 1303Nationality: Europe Race categories: eliminate 0.15 701Nationality: Europe Race categories: revise -0.16 701Nationality: UK Perceptual experience: disjunctivism 0.14 874Nationality: UK Personal identity: biological view 0.14 1091Nationality: UK Well-being: desire satisfaction -0.16 723Nationality: Oceania Free will: compatibilism 0.11 1430Nationality: Oceania Properties: classes 0.19 508Nationality: Latin America Foundations of math: set-theoretic 0.22 363Nationality: US Abortion: permissible -0.13 1001Nationality: US Aim of philosophy: wisdom 0.12 1410Nationality: US Capital punishment: permissible 0.19 978Nationality: US Cosmological fine-tuning: design 0.17 611Nationality: US Gender categories: eliminate -0.14 787Nationality: US God: theism 0.17 1401Nationality: US Hard problem of consc.: yes 0.13 860Nationality: US Immortality: yes 0.17 896Nationality: US Meaning of life: nonexistent -0.11 1204Nationality: US Meaning of life: objective 0.13 1217Nationality: US Meta-ethics: moral realism 0.13 1398Nationality: US Moral judgment: cognitivism 0.14 1353Nationality: US Normative ethics: consequentialism -0.13 1299Nationality: US Perceptual experience: qualia theory 0.14 873Nationality: US Properties: classes -0.19 508Nationality: US Race: social 0.2 1328Nationality: US Race: unreal -0.15 1303Nationality: US Zombies: metaphysically possible 0.12 1149
32

Table 14: Highest correlations between region of PhD and main answers
Region Region r n
Region of PhD: Canada Analysis of knowledge: justified truebelief
0.17 645
Region of PhD: Europe Meta-ethics: moral realism -0.14 1052Region of PhD: Europe Political philosophy: libertarianism 0.14 818Region of PhD: Europe Race: social -0.15 970Region of PhD: UK Analysis of knowledge: justified true
belief-0.15 645
Region of PhD: UK Analysis of knowledge: no analysis 0.21 644Region of PhD: UK Perceptual experience: disjunctivism 0.18 661Region of PhD: Oceania Morality: error theory 0.16 650Region of PhD: Oceania Practical reason: Humean 0.17 537Region of PhD: Oceania Proper names: Fregean 0.15 668Region of PhD: Oceania Properties: classes 0.21 388Region of PhD: Oceania True contradictions: possible but non-
actual0.17 589
Region of PhD: US God: theism 0.15 1054Region of PhD: US Knowledge: empiricism -0.14 858Region of PhD: US Meaning of life: objective 0.14 902Region of PhD: US Meta-ethics: moral realism 0.13 1052Region of PhD: US Moral judgment: cognitivism 0.13 1022Region of PhD: US Properties: classes -0.21 388Region of PhD: US Race: social 0.14 970
Table 15: Highest correlations between year of birth and main answers
Answer r n
Eating animals/products of: veganism 0.26 1445Eating animals/products of: omnivorism -0.24 1447External-world skepticism: dogmatist 0.21 699Interlevel metaphysics: grounding 0.2 495Gender: biological -0.2 1263Race: social 0.2 1305Time travel: metaphysically possible 0.19 726Gender: social 0.16 1276External-world skepticism: semantic externalist 0.16 697Phil. method: conceptual engineering 0.15 1468Morality: non-naturalism 0.15 828Immortality: yes 0.15 890Phil. method: empirical phil. 0.14 1468Phil. method: formal philosophy 0.13 1468Race: biological -0.13 1305Race: unreal -0.12 1281
Table 16: Highest correlations between gender:female and main answers
Answer r n
Material composition: nihilism 0.2 390Politics: capitalism -0.2 845External-world skepticism: pragmatic 0.19 738Environmental ethics: anthropocentric -0.17 788Gender: social 0.17 1349Race: social 0.17 1383Eating animals/products of: omnivorism -0.16 1533Immortality: yes -0.16 932Morality: constructivism 0.16 874Gender: biological -0.15 1334Capital punishment: permissible -0.15 1012Eating animals/products of: vegetarianism 0.14 1535
33

Answer r n
Gender categories: preserve -0.14 799Values in science: necessarily value-laden 0.14 862Laws of nature: Humean 0.14 1291Race: biological -0.14 1382External world: idealism 0.13 1543Truth: epistemic 0.13 1322Trolley problem: switch -0.13 1290Eating animals/products of: veganism 0.13 1531Footbridge: push -0.12 1312External world: non-skeptical realism -0.1 1540
Table 17: Highest correlations between areas of specialization and main answers
AOS Answer r n
17th/18th Century Phil. Consciousness: panpsychism 0.18 77517th/18th Century Phil. Practical reason: Kantian 0.16 72619th Century Phil. External world: idealism 0.21 155019th Century Phil. Justif.: coherentism 0.17 72619th Century Phil. True contradictions: impossible -0.17 80419th Century Phil. Truth: correspondence -0.15 1331Ancient Greek and Roman Phil. Normative ethics: virtue ethics 0.15 1375Ancient Greek and Roman Phil. Political philosophy: communitarian-
ism0.16 1181
Ancient Greek and Roman Phil. Practical reason: Aristotelian 0.26 729Ancient Greek and Roman Phil. Practical reason: Humean -0.22 728Applied Ethics Analysis of knowledge: no analysis -0.15 867Asian Phil. Consciousness: panpsychism 0.2 775Asian Phil. Material composition: nihilism 0.21 399Continental Phil. External world: idealism 0.18 1550Continental Phil. Justif.: infinitism 0.17 716Continental Phil. Method hist. phil.: analytic/rational
reconstruction-0.21 807
Continental Phil. Mind: physicalism -0.16 1420Continental Phil. Propositional attitudes: representa-
tional-0.22 630
Continental Phil. Science: scientific realism -0.19 1433Continental Phil. True contradictions: actual 0.19 804Continental Phil. True contradictions: impossible -0.21 804Decision Theory Mind uploading: survival 0.16 815Decision Theory Politics: capitalism 0.15 864Decision Theory Practical reason: Humean 0.22 728Epistemology Justif.: coherentism -0.15 726Epistemology Justif.: nonreliabilist found. 0.18 725Epistemology Knowledge claims: contextualism -0.19 1202Epistemology Knowledge claims: invariantism 0.16 1199Epistemology External-world skepticism: dogmatist 0.16 740General Phil. of Science Knowledge: empiricism 0.16 1213General Phil. of Science Phil. method: intuition-based -0.17 1570General Phil. of Science Principle of sufficient reason: true -0.16 744Logic and Phil. of Logic Phil. method: formal philosophy 0.19 1570Logic and Phil. of Logic Wittgenstein: early 0.15 783Medieval and Renaissance Phil. Abortion: permissible -0.3 1046Medieval and Renaissance Phil. Arguments for theism: cosmological 0.2 752Medieval and Renaissance Phil. Causation: primitive 0.16 692Medieval and Renaissance Phil. Cosmological fine-tuning: brute fact -0.17 643Medieval and Renaissance Phil. Cosmological fine-tuning: design 0.33 644Medieval and Renaissance Phil. Free will: libertarianism 0.17 1513Medieval and Renaissance Phil. God: theism 0.27 1479Medieval and Renaissance Phil. Material composition: restrictivism 0.22 399Medieval and Renaissance Phil. Mind uploading: survival -0.16 815Medieval and Renaissance Phil. Practical reason: Aristotelian 0.27 729Medieval and Renaissance Phil. Practical reason: Humean -0.21 728Medieval and Renaissance Phil. Practical reason: Kantian -0.16 726Medieval and Renaissance Phil. Principle of sufficient reason: true 0.16 744
34

AOS Answer r n
Medieval and Renaissance Phil. Propositions: acts 0.17 596Meta-Ethics Interlevel metaphysics: grounding 0.21 522Meta-Ethics Phil. method: intuition-based 0.16 1570Metaphilosophy Interlevel metaphysics: identity 0.24 515Metaphysics Abstract objects: Platonism 0.18 1281Metaphysics Continuum hypothesis: determinate 0.24 308Metaphysics Cosmological fine-tuning: design 0.17 644Metaphysics Extended mind: yes -0.17 828Metaphysics Justif.: coherentism -0.21 726Metaphysics Justif.: nonreliabilist found. 0.18 725Metaphysics Knowledge: empiricism -0.16 1213Metaphysics Material composition: nihilism -0.22 399Metaphysics Metaontology: anti-realism -0.2 538Metaphysics Metaontology: deflationary realism -0.23 539Metaphysics Metaontology: heavyweight realism 0.3 541Metaphysics Method hist. phil.: analytic/rational
reconstruction0.19 807
Metaphysics Morality: constructivism -0.17 883Metaphysics Properties: classes -0.18 536Metaphysics External-world skepticism: pragmatic -0.19 749Metaphysics Science: scientific realism 0.15 1433Metaphysics Spacetime: relationism -0.25 450Metaphysics Temporal ontology: eternalism 0.2 543Metaphysics Temporal ontology: growing block -0.21 541Metaphysics Truth: epistemic -0.18 1327Metaphysics Wittgenstein: early 0.2 783Normative Ethics Moral principles: moral generalism 0.2 844Phil. of Biology Propositional attitudes: nonexistent 0.17 616Phil. of Cognitive Science Consciousness: dualism -0.18 774Phil. of Cognitive Science Grounds of intentionality:
causal/teleo.0.18 545
Phil. of Cognitive Science Hard problem of consc.: yes -0.17 899Phil. of Cognitive Science Justif.: nonreliabilist found. -0.15 725Phil. of Cognitive Science Metaphilosophy: naturalism 0.21 1225Phil. of Cognitive Science Mind: physicalism 0.21 1420Phil. of Cognitive Science Phil. method: empirical phil. 0.22 1570Phil. of Cognitive Science Phil. method: experimental philoso-
phy0.15 1570
Phil. of Language Abstract objects: Platonism 0.15 1281Phil. of Language Phil. method: linguistic philosophy 0.23 1570Phil. of Language Possible worlds: nonexistent -0.16 929Phil. of Language Principle of sufficient reason: true -0.18 744Phil. of Language External-world skepticism: contextu-
alist0.18 737
Phil. of Mind Perceptual experience: sense-datumtheory
-0.15 918
Phil. of Mind Properties: tropes 0.19 538Phil. of Religion Abortion: permissible -0.44 1046Phil. of Religion Aesthetic value: objective 0.16 1342Phil. of Religion Arguments for theism: cosmological 0.15 752Phil. of Religion Capital punishment: permissible 0.18 1024Phil. of Religion Causation: counterfactual/difference-
making-0.18 701
Phil. of Religion Causation: primitive 0.21 692Phil. of Religion Chinese room: understands -0.16 861Phil. of Religion Consciousness: dualism 0.3 774Phil. of Religion Consciousness: functionalism -0.23 776Phil. of Religion Cosmological fine-tuning: brute fact -0.26 643Phil. of Religion Cosmological fine-tuning: design 0.53 644Phil. of Religion Cosmological fine-tuning: multiverse -0.2 644Phil. of Religion Cosmological fine-tuning: no fine-
tuning-0.2 640
Phil. of Religion Free will: compatibilism -0.23 1516Phil. of Religion Free will: libertarianism 0.29 1513Phil. of Religion Gender: social -0.15 1364Phil. of Religion Gender categories: preserve 0.21 813Phil. of Religion Gender categories: revise -0.15 816
35

AOS Answer r n
Phil. of Religion God: theism 0.43 1479Phil. of Religion Immortality: yes 0.26 946Phil. of Religion Laws of nature: Humean -0.15 1286Phil. of Religion Meaning of life: nonexistent -0.16 1265Phil. of Religion Meaning of life: objective 0.26 1281Phil. of Religion Meaning of life: subjective -0.17 1283Phil. of Religion Meta-ethics: moral realism 0.16 1476Phil. of Religion Metaontology: heavyweight realism 0.2 541Phil. of Religion Metaphilosophy: naturalism -0.3 1225Phil. of Religion Mind: physicalism -0.24 1420Phil. of Religion Morality: constructivism -0.17 883Phil. of Religion Morality: non-naturalism 0.24 879Phil. of Religion Personal identity: further-fact view 0.18 1142Phil. of Religion Personal identity: psychological view -0.18 1153Phil. of Religion Politics: capitalism 0.2 864Phil. of Religion Practical reason: Aristotelian 0.15 729Phil. of Religion Principle of sufficient reason: true 0.21 744Phil. of Religion Semantic content: minimalism 0.16 666Phil. of Religion Well-being: objective list 0.17 758Social and Political Phil. Justif.: coherentism 0.15 726Social and Political Phil. Morality: constructivism 0.16 883Social and Political Phil. Normative ethics: deontology 0.17 1372Social and Political Phil. Political philosophy: communitarian-
ism-0.2 1181
Social and Political Phil. Political philosophy: egalitarianism 0.17 1184
7 Selection bias
Selection bias arises when the group who responds to a survey question is not a random
sample of the target population. In our survey, selection bias takes two forms. First,
the philosophers who respond to the survey at all (completing at least 50 questions and
consenting) are not a random sample of the target population. We call this respondent bias.
Second, respondents have the option to complete more than 50 (up to 100) questions, and
the group who do so are not a random sample of the overall group of respondents. We call
this enthusiast bias.
The results presented in section 2 are subject to respondent bias and enthusiast bias,
so they cannot be considered accurate guides to the distribution of views in our target
population as a whole. To use survey responses to assess the distribution of views in our
target population as a whole, we need to correct for respondent bias and enthusiast bias.
Enthusiast bias: Enthusiast bias does not affect the 40 main questions, which all respon-
dents answered as part of their 50 mandatory questions. It affects only the 60 additional
questions.
To correct for enthusiast bias on these questions, we can simply restrict our analysis to
those “First 50” respondents who answered these questions as part of their 50 mandatory
questions. This group should be a random sample of respondents as a whole. This infor-
mation is shown in table 21 under the “F50” column. Enthusiast bias is reflected in the
difference between the “All” column and the “F50” column.
We can also assess enthusiast bias by calculating correlations between the number of
questions answered by a respondent and their various answers to questions. The highest
correlations are shown in table 18.
36
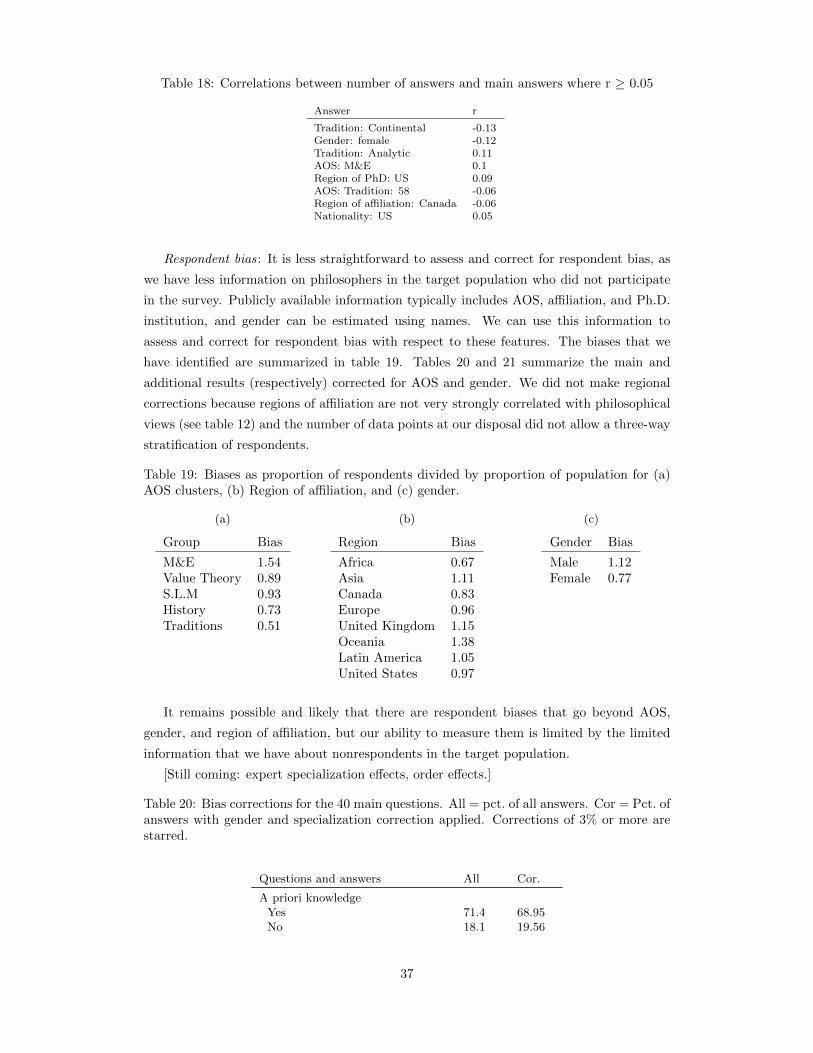
Table 18: Correlations between number of answers and main answers where r ≥ 0.05
Answer r
Tradition: Continental -0.13Gender: female -0.12Tradition: Analytic 0.11AOS: M&E 0.1Region of PhD: US 0.09AOS: Tradition: 58 -0.06Region of affiliation: Canada -0.06Nationality: US 0.05
Respondent bias: It is less straightforward to assess and correct for respondent bias, as
we have less information on philosophers in the target population who did not participate
in the survey. Publicly available information typically includes AOS, affiliation, and Ph.D.
institution, and gender can be estimated using names. We can use this information to
assess and correct for respondent bias with respect to these features. The biases that we
have identified are summarized in table 19. Tables 20 and 21 summarize the main and
additional results (respectively) corrected for AOS and gender. We did not make regional
corrections because regions of affiliation are not very strongly correlated with philosophical
views (see table 12) and the number of data points at our disposal did not allow a three-way
stratification of respondents.
Table 19: Biases as proportion of respondents divided by proportion of population for (a)AOS clusters, (b) Region of affiliation, and (c) gender.
(a)
Group Bias
M&E 1.54Value Theory 0.89S.L.M 0.93History 0.73Traditions 0.51
(b)
Region Bias
Africa 0.67Asia 1.11Canada 0.83Europe 0.96United Kingdom 1.15Oceania 1.38Latin America 1.05United States 0.97
(c)
Gender Bias
Male 1.12Female 0.77
It remains possible and likely that there are respondent biases that go beyond AOS,
gender, and region of affiliation, but our ability to measure them is limited by the limited
information that we have about nonrespondents in the target population.
[Still coming: expert specialization effects, order effects.]
Table 20: Bias corrections for the 40 main questions. All = pct. of all answers. Cor = Pct. ofanswers with gender and specialization correction applied. Corrections of 3% or more arestarred.
Questions and answers All Cor.
A priori knowledgeYes 71.4 68.95No 18.1 19.56
37

Questions and answers All Cor.
Abstract objectsPlatonism 35.2 32.53Nominalism 38.4 39.29
Aesthetic valueObjective 41.5 40.13Subjective 38.7 39.05
Analytic-synthetic distinctionYes 59.6 57.5No 24.6 25.05
KnowledgeEmpiricism 42.4 42.39Rationalism 32.3 31.06
Epistemic justificationInternalism 32.4 30.19Externalism 45.9 45.05
Free willCompatibilism 58.3 57.83Libertarianism 18.5 18.34No free will 11.0 10.56
GodTheism 18.8 19.08Atheism 66.4 64.94
External worldIdealism 6.6 8.02Skepticism 5.4 5.78Non-skeptical realism 78.6 75.24 *
Knowledge claimsContextualism 45.1 46.78Relativism 4.5 4.47Invariantism 21.1 18.43
Laws of natureHumean 27.2 27.39Non-humean 47.3 44.97
LogicClassical 42.5 39.76Non-classical 21.0 21.29
Mental contentInternalism 22.4 21.68Externalism 49.3 46.13 *
Meta-ethicsMoral realism 59.8 57.74Moral anti-realism 25.2 25.43
MetaphilosophyNaturalism 43.5 42.0Non-naturalism 27.0 26.68
Mind
38

Questions and answers All Cor.
Physicalism 50.4 48.53Non-physicalism 31.1 31.17
Moral motivationInternalism 32.8 33.81Externalism 31.5 29.86
Moral judgmentCognitivism 63.5 60.72Non-cognitivism 19.0 18.97
Newcomb’s problemOne box 18.7 17.35Two boxes 23.4 21.18
Normative ethicsDeontology 31.3 30.83Consequentialism 29.8 28.7Virtue ethics 36.1 38.34
Perceptual experienceDisjunctivism 11.6 11.05Qualia theory 11.2 10.91Representationalism 29.1 26.56Sense-datum theory 3.7 3.85
Personal identityBiological view 17.3 16.43Psychological view 39.5 39.46Further-fact view 13.4 12.73
Political philosophyCommunitarianism 23.5 24.46Egalitarianism 37.9 38.8Libertarianism 11.5 10.75
Proper namesFregean 25.7 24.36Millian 27.5 24.4 *
ScienceScientific realism 68.5 64.74 *Scientific anti-realism 14.2 15.97
TeletransporterSurvival 31.1 30.09Death 35.4 33.73
TimeA-theory 17.1 16.07B-theory 24.0 21.27
Trolley problemSwitch 61.7 58.64 *Don’t switch 12.9 12.84
TruthCorrespondence 47.3 44.02 *Deflationary 22.6 21.84Epistemic 9.4 10.88
39

Questions and answers All Cor.
ZombiesInconceivable 14.8 14.0Conceivable but not pos. 32.9 32.66Metaphysically possible 22.0 20.19
Aim of philosophyTruth/knowledge 41.8 40.18Understanding 55.4 54.6Wisdom 30.9 32.97Happiness 12.5 13.44Goodness/justice 22.5 23.92
Eating animals and animal productsOmnivorism (yes and yes) 47.5 46.9Vegetarianism (no and yes) 26.2 26.75Veganism (no and no) 18.2 18.48
Experience machineYes 12.3 13.03No 70.7 68.3
FootbridgePush 21.4 20.19Don’t push 54.6 53.14
GenderBiological 26.9 27.89Psychological 19.9 20.93Social 58.4 59.88Unreal 3.9 3.77
Meaning of lifeSubjective 31.9 31.71Objective 31.0 30.23Nonexistent 15.6 15.83
Philosophical progressNone 3.8 4.88A little 46.3 46.76A lot 41.5 38.28 *
Philosophical methodsConceptual analysis 68.9 69.47Conceptual engineering 38.3 36.63Empirical philosophy 58.3 57.37Experimental philosophy 31.7 31.36Formal philosophy 53.9 50.38 *Intuition-based philosophy 48.0 45.36Linguistic philosophy 44.8 43.46
RaceBiological 17.3 16.69Social 58.6 59.42Unreal 13.9 14.48
VaguenessEpistemic 19.4 18.64Metaphysical 16.7 17.15Semantic 41.8 38.69 *
40

Questions and answers All Cor.
Table 21: Bias corrections for the additional questions. All = pct. of all answers. F50 =pct. of answers among respondents’ mandatory questions (the first 50). Cor = F50 withgender and specialization correction. Corrections of 3% or more are starred.
Questions and answers All F50 Cor.
AbortionPermissible 77.7 79.0 77.71Impermissible 12.5 12.7 12.92
Aesthetic experiencePerception 17.2 16.9 16.15Pleasure 8.6 9.4 8.97Sui generis 22.7 21.6 23.8
Analysis of knowledgeJustified true belief 21.4 22.9 24.93Other analysis 29.2 32.5 30.49No analysis 27.8 25.7 22.66 *
Arguments for theismCosmological 18.8 14.9 14.18Design 15.9 13.6 12.51Ontological 8.0 8.0 9.1Pragmatic 12.8 13.3 15.49Moral 8.4 10.2 10.9
Belief or credenceBelief 20.8 22.6 21.8Credence 21.2 20.5 20.3Neither 13.2 12.1 10.75
Capital punishmentPermissible 17.1 17.1 15.46Impermissible 72.4 73.9 75.37
CausationCounterfactual/difference-making 28.9 32.8 32.17Process/production 17.5 16.6 16.44Primitive 15.9 15.3 13.63Nonexistent 3.2 3.1 2.77
Chinese roomUnderstands 16.0 16.2 14.23Doesn’t understand 60.0 60.1 59.57
ConceptsNativism 21.4 22.0 21.55Empiricism 38.4 40.9 42.12
ConsciousnessDualism 19.4 17.9 15.12Eliminativism 4.0 4.2 4.0Functionalism 29.2 30.9 28.89Identity theory 11.8 11.1 9.64Panpsychism 6.7 6.2 8.0
41

Questions and answers All F50 Cor.
Continuum hypothesisDeterminate 16.2 16.6 15.06Indeterminate 12.3 10.2 9.77
Cosmological fine-tuningDesign 12.2 9.2 8.51Multiverse 10.7 12.5 12.83Brute fact 22.6 25.2 25.17No fine-tuning 15.3 15.4 15.03
Environmental ethicsAnthropocentric 32.9 30.7 31.56Non-anthropocentric 39.4 37.5 38.69
Extended mindYes 43.1 44.1 42.6No 31.2 27.1 25.68
Foundations of mathematicsConstructivism/intuitionism 8.2 10.2 10.87Formalism 3.3 2.1 2.32Logicism 6.3 4.6 3.37Structuralism 11.3 14.4 14.36Set-theoretic 8.2 8.1 6.64
Gender categoriesPreserve 17.4 17.2 15.14Revise 43.2 48.3 48.42Eliminate 13.8 17.2 18.66
Grounds of intentionalityCausal/teleological 21.9 21.9 20.61Inferential 6.0 5.8 5.34Interpretational 9.5 11.9 12.75Phenomenal 7.9 7.7 9.92Primitive 8.6 10.0 9.82
Hard problem of consciousnessYes 54.6 56.0 54.63No 26.0 23.2 25.01
Human genetic engineeringPermissible 58.8 56.3 53.14 *Impermissible 17.8 17.3 19.75
HumeSkeptic 28.0 30.4 30.27Naturalist 42.2 39.5 44.11 *
ImmortalityYes 43.3 36.7 35.27No 39.9 44.1 45.86
Interlevel metaphysicsGrounding 19.3 17.2 14.88Identity 7.6 7.8 6.26Realization 13.9 16.2 14.83Supervenience 16.4 17.9 16.95
Justification
42

Questions and answers All F50 Cor.
Coherentism 19.4 24.7 27.66Infinitism 1.6 2.8 2.98Nonreliabilist found. 20.7 17.4 14.37 *Reliabilism 27.6 29.1 26.03 *
KantOne world 28.8 33.2 36.68 *Two worlds 22.1 22.5 23.18
LawLegal positivism 21.8 22.4 23.6Legal non-positivism 24.8 26.5 27.11
Material compositionNihilism 4.1 6.1 4.97Restrictivism 17.7 15.5 13.49Universalism 13.9 11.3 9.02
MoralityNon-naturalism 23.8 24.8 24.4Naturalist realism 28.4 27.7 27.45Constructivism 18.7 20.1 22.3Expressivism 9.5 10.5 8.11Error theory 4.7 5.1 4.54
MetaontologyHeavyweight realism 24.0 24.2 20.36 *Deflationary realism 17.5 18.8 17.76Anti-realism 7.4 6.1 6.4
Method in history of philosophyAnalytic/rational reconstruction 49.3 49.8 50.05Contextual/historicist 36.0 45.5 47.76
Method in political philosophyIdeal theory 22.3 23.7 24.19Non-ideal theory 39.9 43.1 45.92
Mind uploadingSurvival 25.0 24.7 25.13Death 49.4 51.7 51.92
Moral principlesMoral generalism 46.3 43.8 43.82Moral particularism 28.6 31.0 31.99
Normative conceptsFit 5.7 4.3 4.81Ought 11.0 9.7 9.66Reasons 19.7 24.8 27.72Value 28.9 29.8 29.79
Other mindsAdult humans 89.3 91.8 90.78Cats 83.1 83.9 81.84Fish 61.3 61.8 60.18Flies 32.4 32.7 34.67Worms 22.7 22.4 23.99Plants 6.8 7.0 7.91Particles 1.9 1.2 0.97
43

Questions and answers All F50 Cor.
Newborn babies 79.1 83.0 81.74Current ai systems 3.2 3.3 3.94Future ai systems 36.8 37.9 35.21
Ought implies canYes 59.3 56.7 57.24No 26.7 27.3 28.07
Philosophical knowledgeNone 3.4 3.6 4.23A little 31.0 32.1 33.01A lot 53.5 54.9 53.27
PlatoKnowledge only of forms 29.8 29.2 32.79 *Knowledge also of concrete things 15.9 17.9 19.83
PoliticsCapitalism 28.1 25.3 23.75Socialism 50.5 50.7 54.28 *
Possible worldsAbstract 50.0 51.3 47.25 *Concrete 4.2 3.2 2.05Nonexistent 27.4 25.6 28.8 *
Practical reasonAristotelian 30.3 32.9 34.72Humean 23.9 25.3 25.06Kantian 14.8 15.8 16.15
Principle of sufficient reasonTrue 29.9 31.5 31.7False 38.0 38.8 38.41
PropertiesClasses 7.9 11.0 10.43Immanent universals 14.3 18.2 16.62Transcendent universals 13.7 16.5 14.57Tropes 10.6 7.9 7.27Nonexistent 5.6 3.1 3.83
Propositional attitudesDispositional 22.2 21.6 20.54Phenomenal 4.9 4.2 5.39Representational 32.7 30.9 24.75 *Nonexistent 2.5 1.9 2.88
PropositionsSets 5.9 5.5 4.74Structured entities 27.2 25.4 22.88Simple entities 4.9 7.1 6.26Acts 5.8 5.8 6.72Nonexistent 10.9 10.6 11.1
Quantum mechanicsCollapse 8.5 6.8 6.1Hidden-variables 11.0 9.2 8.69Many-worlds 9.7 8.2 8.53Epistemic 6.4 6.1 5.79
44

Questions and answers All F50 Cor.
Race categoriesPreserve 6.5 8.3 7.87Revise 25.8 27.2 28.93Eliminate 32.3 33.3 33.83
Response to external-world skepticismAbductive 18.1 16.2 15.8Contextualist 8.8 9.3 8.58Dogmatist 11.0 10.0 8.25Epistemic externalist 15.5 16.9 16.0Semantic externalist 6.9 9.0 8.06Pragmatic 18.7 17.6 20.06
Rational disagreementNon-permissivism 16.7 16.6 18.58Permissivism 60.5 65.1 62.26
Semantic contentMinimalism (no more than a few) 6.4 5.7 4.79Moderate contextualism (interme-
diate)35.7 37.7 36.66
Radical contextualism (most orall)
17.3 16.8 18.08
Sleeping beautyOne-third 10.5 11.3 9.78One-half 7.1 6.8 5.88
SpacetimeRelationism 25.1 24.7 29.05 *Substantivalism 15.2 14.4 10.48 *
Statue and lumpOne thing 25.4 25.6 25.41Two things 35.3 37.4 34.17 *
Temporal ontologyPresentism 12.1 11.0 8.88Eternalism 26.3 25.3 21.55 *Growing block 11.2 10.1 10.45
Theory of referenceCausal 35.9 37.0 32.99 *Descriptive 17.2 17.0 14.72Deflationary 11.7 11.3 11.39
Time travelMetaphysically possible 34.9 34.6 30.97 *Metaphysically impossible 33.9 35.5 39.05 *
True contradictionsImpossible 58.5 54.2 44.78 *Possible but non-actual 3.9 5.4 5.35Actual 10.2 9.0 9.73
Units of selectionGenes 26.3 27.9 27.52Organisms 26.0 26.9 28.43
Values in science
45

Questions and answers All F50 Cor.
Necessarily value-free 15.3 17.2 15.58Necessarily value-laden 38.0 40.7 42.69Can be either 26.8 27.2 26.62
Well-beingHedonism/experientialism 10.7 11.0 11.06Desire satisfaction 15.6 17.9 16.19Objective list 44.7 44.1 43.4
WittgensteinEarly 20.7 19.8 18.58Late 48.4 49.0 50.23
46
Related Documents