PhD thesis STUDY OF THE LIGAND-DEPENDENT DYSREGULATION OF PPARγ: ADVERSE OUTCOME PATHWAYS DEVELOPMENT AND MOLECULAR MODELLING MERILIN AL SHARIF 2016

Welcome message from author
This document is posted to help you gain knowledge. Please leave a comment to let me know what you think about it! Share it to your friends and learn new things together.
Transcript

PhD thesis
STUDY OF THE LIGAND-DEPENDENT
DYSREGULATION OF PPARγ:
ADVERSE OUTCOME PATHWAYS DEVELOPMENT
AND MOLECULAR MODELLING
MERILIN AL SHARIF
2016

Bulgarian Academy of Sciences
Institute of Biophysics and Biomedical Engineering
Department of QSAR and Molecular Modelling
STUDY OF THE LIGAND-DEPENDENT DYSREGULATION OF PPARγ:
ADVERSE OUTCOME PATHWAYS DEVELOPMENT
AND MOLECULAR MODELLING
A DISSERTATION SUBMITTED FOR THE DEGREE OF
DOCTOR OF PHILOSOPHY
MERILIN MAZEN AL SHARIF
SUPERVISORS:
ASSOC. PROF. IVANKA TSAKOVSKA, PhD
AND
CORR. MEMBER OF BAS, PROF. ILZA PAJEVA, DSc
Sofia
2016

2
ACKNOWLEDGEMENTS
I would like to express my heartfelt gratitude to my parents, who supported me, and incented
me to strive towards my goal, for their understanding and encouragement in every possible way.
I deeply appreciate and acknowledge my erudite professors from the Faculty of Biology, Sofia
University “St. Kliment Ohridski”, who laid the foundations for my career development.
I am sincerely thankful to my supervisors Assoc. Prof. Ivanka Tsakovska, PhD, and Corr.
Member of BAS, Prof. Ilza Pajeva, DSc, for their excellent guidance, for the immense
knowledge they gave me and for allowing me to grow as a research scientist. I would especially
like to thank specialist Petko Alov for his expert contribution, influence and care during the
entire course of my PhD.
I would also like to thank the rest of my thesis committee: Prof. Stefka Taneva, DSc; Prof. Irini
Doytchinova, DSc; Prof. Mariela Odjakova, PhD, and Assoc. Prof. Vessela Vitcheva, PhD, for
their insightful comments and suggestions as well as for the encouragement.
My special thanks are extended to the Institute of Biophysics and Biomedical Engineering –
BAS and the Department of QSAR and Molecular Modelling as well as to our foreign partners
within the SEURAT-1 cluster for the fruitful and enriching collaboration.
Last but not least, the funding from the European Community’s 7th Framework Program
COSMOS Project (grant n°266835) and from the Ministry of Education, Youth and Science,
Bulgaria (grant n°D01-169/14.07.2014) is gratefully acknowledged.
Thank you for making me more than I am.
Merilin Al Sharif
2016

3
TABLE OF CONTENTS
ACKNOWLEDGEMENTS 2
ABBREVIATIONS 6
INTRODUCTION 11
CHAPTER 1. LITERATURE REVIEW 14
1.1. Replacement, Reduction and Refinement (3Rs) of animal testing:
MoA/AOP framework and in silico approaches
14
1.1.1. The advent of predictive toxicology 14
1.1.2. MoA/AOP approach 18
1.1.3. In silico approaches in predictive toxicology 25
1.2. Peroxisome proliferator-activated receptor γ (PPARγ) and non-
alcoholic fatty liver disease (NAFLD)
33
1.2.1. Hepatotoxicity and NAFLD 33
1.2.2. PPARγ 36
1.2.2.1. Biology of PPARγ 36
1.2.2.2. PPARγ ligands and NAFLD 38
1.2.2.3. Molecular modelling of PPARγ 42
AIM AND TASKS OF THE PhD THESIS 45
CHAPTER 2. DATA AND METHODS 46
2.1. OECD principles for AOP development and evaluation 46
2.2. Molecular modelling approaches and QSAR 49
2.2.1. Collection and processing of the structural and biological data 49
2.2.1.1. Biological data used 49
2.2.1.2. Structure preparation 51
2.2.1.3. Protein preparation 66
2.2.2. Protein-ligand interactions 67
2.2.2.1. General principles 67
2.2.2.2. Analysis of the receptor-ligand interactions 76
2.2.3. Pharmacophore modelling 77
2.2.3.1. Pharmacophore concept – general view 77
2.2.3.2. Pharmacophore model development and validation 79
2.2.4. 3D QSAR (CoMSIA) modelling 81

4
2.2.4.1. CoMFA and CoMSIA approaches 81
2.2.4.2. PLS analysis to build 3D QSAR model – general considerations 84
2.2.4.3. CoMSIA model development 88
2.2.4.3.1. Alignment of structures and calculation of fields 88
2.2.4.3.2. Model development and validation 89
2.2.5. Docking procedure 90
2.2.5.1. Docking – general view 90
2.2.5.2. Docking in the ligand-binding domain of PPARγ 93
CHAPTER 3. RESULTS AND DISCUSSION 94
3.1. Prosteatotic AOPs 94
3.1.1. Data harvesting and analysis 94
3.1.2. Description of the AOPs 96
3.1.2.1. PPARγ Ligand-Dependent Activation in Hepatocytes 98
3.1.2.2. PPARγ Ligand-Dependent Inhibition in Adipocytes 108
3.1.3. Evaluation of the hepatic AOP 112
3.1.4. The developed AOPs – general analysis and comparison with the
AOPs published in the AOP-KB
115
3.2. PPARγ ligands’ dataset 118
3.3. Molecular modelling studies 120
3.3.1. Analysis of the deposited PPARγ-ligand complexes 121
3.3.2. Processing of the PPARγ-ligands’dataset 122
3.3.3. Analysis of the PPARγ LBD and the ligand-receptor interactions 123
3.3.4. Pharmacophore-based Virtual Screening to predict PPARγ full
agonists
128
3.3.4.1. Pharmacophore model development 128
3.3.4.2. VS protocol development and validation 133
3.3.5. 3D QSAR modelling to predict pEC50 of PPARγ full agonists 134
3.3.5.1. Dataset processing and structure alignment 136
3.3.5.2. Model generation and validation 136
3.3.6. Integration of the developed pharmacophore-based VS protocol
in battery approaches supporting risk assessment
141
3.3.6.1. Prediction of Dual PPARγ/LXR binders 142
3.3.6.2. Prediction of piperonyl butoxide 143

5
SUMMARY 145
CONTRIBUTIONS 147
DECLARATION FOR ORIGINALITY OF THE RESULTS 148
LITERATURE 149
PUBLICATIONS AND ACTIVITIES RELATED TO THE PhD THESIS 185
PUBLICATIONS 185
CONTRIBUTIONS TO INTERNATIONAL SCIENTIFIC EVENTS 187
CONTRIBUTIONS TO NATIONAL SCIENTIFIC EVENTS 190
PARTICIPATION IN SCIENTIFIC PROJECTS/GRANTS 190
APPENDIX A. SUPPLEMENTARY MATERIAL 191
APPENDIX B. AOP EVALUATION TABLE 208

6
ABBREVIATIONS
%max, percent efficacy in relation to the maximum efficacy of a reference compound
(Q)SAR, (quantitative) structure-activity relationship
∆G or ∆E, change in the free energy formation of the ligand-receptor complex
∆H, enthalpy
∆S, entropy
3Rs, replacement, reduction and refinement of animal testing
Acc, acceptor
ACC, acetyl-CoA carboxylase
Acc2, projected acceptor
ADIPOQ, adiponectin
Ad-PPARγ, adenovirus-mediated transfection of PPARγ
AF1, activation function domain 1
AF2, activation function domain 2
AhR, aryl hydrocarbon receptor
AMPK, 5'-adenosine monophosphate-activated protein kinase
Ani, anion
AO, adverse outcome effect
AOP, adverse outcome pathway
AOP-KB, AOP Wiki Knowledge Base
aP2, adipose fatty acid binding protein
ApoCIV, apolipoprotein C IV
Aro, aromatic
BHK21 ATCC CCL10, baby hamster kidney cell line from the American Type Culture
Collection
C, cellular level
CAR, constitutive androstane receptor
CAS, chemical abstracts service
Cat, cation
CD, normal chow diet
CM, community level
CoMFA, Comparative Molecular Field Analysis

7
CoMSIA, Comparative Molecular Similarity Indices Analysis
COS-1 and COS-7, CV-1 in origin, with SV40 genetic material
COSMOS, Integrated In Silico Models for the Prediction of Human Repeated Dose Toxicity of
COSMetics to Optimise Safety
cSDEP, the estimated cross-validated standard error at the specified critical point
CSRML, Chemical Subgraphs and Reactions Markup Language
CV-1, simian - Cercopithecus aethiops or normal African green monkey kidney Fibroblast
Cells
DBD, DNA-binding domain
DGAT1, diglyceride acyltransferase 1
DGAT2, diglyceride acyltransferase 2
Don, donor
Don2, projected donor
dq/dr, the slope of qcv2 at the specified critical point with respect to the correlation of the original
dependent variables versus the perturbed dependent variables
DUD-E database, a database of useful decoys: enhanced
e, efficacy
EC, environmental contamination
EC50, effective concentration (the concentration of a drug that gives half-maximal response)
Emax, maximal efficacy
ER, estrogen receptor
EX, exposure
FA, fatty acids
FABP4, fatty acid binding protein 4 (synonym of aP2)
FABPpm, plasma membrane fatty acid binding protein
FAS, fatty acid synthase
FASEs. fatty acid synthesising enzymes
FAT/CD36, fatty acid translocase/cluster determinant 36
FAT/UPs, fatty acid transport/uptake related proteins
FDA CFSAN’s CERES, Chemical Evaluation and Risk Estimation System at the U.S. Food
and Drug Administration, Center for Food Safety and Applied Nutrition
FN, false negative
FP, false positive

8
FSP27/CIDE-C, fat-specific protein 27/cell death-inducing DFF45-like effector
FXR, farnesoid X receptor
GR, glucocorticoid receptor
H, helix
HB, hydrogen bond
HCC, hepatocellular carcinoma
HEK293, human embryonic kidney 293 cell line
HepG2, human liver hepatocellular carcinoma cell line
HFD, high-fat diet
HSCs, hepatic stellate cells
Huh-7, human liver hepatocellular carcinoma cell line
Hyd, hydrophobic
HydA, hydrophobic atom
I, individual level
IC50, half maximal inhibitory concentration
Kd, dissociation constant
KEs, key events
Ki, inhibitory constant
L, ligand
LBD, ligand-binding domain
LD, lipid droplet
LDAPs, lipid droplet associated proteins
LOO, leave-one-out cross-validation
LPL, lipoprotein lipase
LXR, liver X receptor
M, molecular level
MGAT1, monoacylglycerol O-acyltransferase 1
MIE, molecular initiating event
ML, metal ligator
ML2, projected metal ligator
MM, molecular modelling
MoA, mode of action
NAFL, non-alcoholic fatty liver

9
NAFLD, non-alcoholic fatty liver disease
NASH, non-alcoholic steatohepatitis
NFkB, nuclear factor – kappaB
Nopt, optimal number of PLS components
NR1C3, nuclear receptor subfamily 1, group C, member 3 (synonym of PPARγ)
O, organelle level
OECD, Organisation for Economic Co-operation and Development
oRepeatTox DB, oral repeated dose toxicity database
P, population level
PDB, Protein Data Bank
PiN, ring projection
PiR, pi-ring
Plin 1, 2 and 4, Perilipins 1, 2, and 4
PLS, partial least squares analysis
PPARα, peroxisome proliferator-activated receptor α
PPARγ, peroxisome proliferator-activated receptor γ
PXR, pregnane X receptor
Q2, the expected value of q2 at the specified critical point for r2yy' (the correlation of the
scrambled responses with the unperturbed data)
qAOP, quantitative AOP
qcv2, cross-validated coefficient
R, gas constant
R, receptor
R', the response of a tissue to some stimulus
RAR, retinoic acid receptor
RDT, repeated dose toxicity
RL, receptor-ligand complex
RMSD, root-mean-square deviation
rpred2, predictive correlation coefficient
RT-PCR, real time polymerase chain reaction
RXRα, retinoid X receptor alpha
S, stimulus
SCD1, stearoyl-CoA desaturase1

10
SEE, standard error of estimate
SEPcv, cross-validated standard error of prediction
SEURAT-1, Safety Evaluation Ultimately Replacing Animal Testing
SLC 27A2, solute carrier family 27 fatty acid transporter member 2
SLC 27A5, solute carrier family 27 fatty acid transporter member 5
SOP, source to outcome pathway
SREBP-1, sterol regulatory element-binding protein-1
StDev*Coeff, the standard deviation of the 3D field at each grid point multiplied by the 3D
QSAR coefficient
T, tissue level
TG, triglycerides
TGSEs, triglyceride synthesising enzymes
TN, true negative
ToP, toxicity pathway
TP, true positive
TZDs, thiazolidinediones
VLDL, very low-density lipoprotein
VS, virtual screening
WoE, weight-of-evidence
WT, wild type
y, fractional receptor occupancy
α, intrinsic activity
The current PhD thesis contains 48 figures, 20 tables and 306 references.

11
INTRODUCTION
Since ancient times till nowadays, people’s quests for self-awareness, natural lifestyle and
combat with the oncoming diseases and epidemics have given impetus to the development of
many scientific fields related to human health. One of them is biomedical engineering – an
interdisciplinary field combining medicine, toxicology, pharmacology, biochemistry,
molecular biology, physics, chemistry, methods of structure analysis, mathematical and
engineering methods.
Even Hippocrates used to claim that the human organism is related to the environment, which
influences its natural life functions. Unfortunately, mankind’s desire for more material wealth,
comfort and luxury in everyday life has brought about today's over-industrialized world,
generating a number of adverse effects and influences on living systems. For the last century,
tons of xenobiotics have flooded the Earth and its biosphere in the form of chemical weapons,
industrial pollutants, pharmaceuticals and cosmetics, thus posing a serious risk to the stability
and functioning of biosystems and to human health in particular. Therefore, qualitative and
quantitative characterizations of potential toxins are crucial moments in health risk analysis and
assessment.
The founder of toxicology, Paracelsus, defines very clearly the quantity aspects of the adverse
effects, postulating that "the dose makes the poison." Establishing quantitative structure-activity
relationships, molecular modelling, and elucidating the specific mode of action of potential
toxins are among the modern approaches of computational (predictive) toxicology.
In line with the 3Rs principles of replacement, reduction and refinement of animal toxicity
testing, the current PhD thesis is focused on the development of alternative in silico approaches
supporting hazard identification and characterisation related to repeated dose hepatotoxicity.
The toxicity-induced liver injury, in particular the non-alcoholic fatty liver disease (NAFLD),
represents a special interest. NAFLD involves a spectrum of liver pathologies
(steatosis/steatohepatitis/fibrosis) increasing the incidence of liver cirrhosis and hepatocellular
carcinoma. Nuclear-receptor disruption has been considered one of the potential mechanisms
involved in the development of NAFLD. Among the receptors reported to be potentially
involved in disease development and progression is the peroxisome proliferator-activated
receptor gamma (PPARγ). PPARγ is a transcriptional regulator from the nuclear receptor
superfamily which:

12
is expressed in multiple tissues: mainly in white and brown adipose tissue but also in
intestines, liver, kidneys, retina, immunologic system (bone marrow, lymphocytes,
monocytes and macrophages) and muscles (to a lesser extent);
regulates crucial cellular pathways, related to: adipogenesis (adipocyte proliferation and
differentiation), lipid and glucose homeostasis, inflammatory responses, vascular
biology and placental development;
is an attractive therapeutic target for the treatment of a wide spectrum of diseases:
metabolic diseases, especially hyperglycemia; cardiovascular disorders; inflammatory
and auto-immune diseases: multiple sclerosis, inflammatory bowel diseases,
rheumatoid arthritis; cancer; Alzheimer’s disease; age-related macular degeneration;
skin-related disorders; addiction control – in terms of substances (alcohol, nicotine,
opioids or cocaine) or addictive behavior (kleptomania and others).
The potential for an adverse prosteatotic effect of PPARγ full agonists has been explored
through the Mode of Action/Adverse Outcome Pathway (MoA/AOP) methodology by
systematisation and analysis of the available scientific knowledge. The study involves the
development of two AOPs with different molecular initiating events (MIEs): PPARγ inhibition
in adipocytes and PPARγ full activation in hepatocytes as well as a weight-of-evidence (WoE)
evaluation of key events with an emphasis on the array of assays supporting the outlined
biochemical and histological disease markers. The complex nature of the inter-tissue cross-talks
and their description within the AOP framework is discussed in the light of the link adipose
tissue-related disorders – NAFLD.
For the MIE in hepatocytes (PPARγ full activation), a dataset with structural and biological
(binding affinity, potency, and relative efficacy) data for more than 400 full and partial agonists
was generated from PDB (http://www.rcsb.org/) and literature sources. It is publicly available
(http://biomed.bas.bg/qsarmm/) and serves as a source of data for in silico modelling.
Further, an analysis of the PPARγ-full agonist complexes available in PDB was performed to
derive a pharmacophore model of PPARγ full agonists. The model was incorporated in a virtual
screening (VS) procedure to predict PPARγ full agonism of compounds.

13
A successful integration of the VS procedure in two battery approaches is discussed as an
example for the supportive role of the in silico predictive models complementing each other in
the process of hazard identification.
A 3D QSAR model to predict the PPARγ full agonists’ potency (transactivation activity EC50)
was developed as an improvement over previously reported ones, based on the largest and
structurally diverse training set used so far. Emphasis is given on the mechanistically justified
selection of the dependent variable.
The developed AOPs and predictive models provide a mechanistically justified rationale for
the screening of potential prosteatotic chemicals and their prioritisation for further testing.
This work is a part of an in silico strategy for predicting potential hepatotoxicity of cosmetic
ingredients (COSMOS project, http://www.cosmostox.eu).

14
CHAPTER 1. LITERATURE REVIEW
1.1. Replacement, Reduction and Refinement (3Rs) of animal testing: MoA/AOP
framework and in silico approaches
1.1.1. The advent of predictive toxicology
Modern toxicology is based on the concept of the 3Rs, defined as Replacement, Reduction and
Refinement of animal testing. Since first proposed by Russel and Burch in 1959 (Russell and
Burch, 1959), these principles have gained wide acceptance, being embedded in national and
international legislation regulating the use of animals in scientific procedures and driving
the establishment of national 3R centres (NC3Rs; Törnqvist et al., 2014) (Figure 1).
Figure 1. Main tasks related to the three Rs principles
This historical paradigm shift stems from safety, ethical and economic issues and it is expected
to ensure the robustness and reproducibility of the experiments, increasing the human
relevance of the model systems in a more humane, time- and cost-saving manner. It is driven
by the advent of science and technology, and is strongly dependent on data sharing and
knowledge exchange, which in the ideal scenario delivers high quality experimental data,
acquired and reported according to unified and commonly accepted protocols and formats
(NC3Rs; Burden et al, 2014; ENV/JM/MONO(2013)6; Gocht et al., 2015).

15
The establishment of alternatives to animal testing involves: pathways approaches in
toxicology; systems biology; computational chemistry; bioinformatics and mathematical
modelling. All of them power the development of and/or benefit from a variety of new
technologies that could be classified in a different manner. Depending on the considered level
of biological organisation, there are three main groups of technologies: (i) molecular level
(“omics”-based technologies generating genomic (genotyping, gene expression, and
epigenomic), proteomic, and metabolomic/metabonomic biomarkers), (ii) tissue/organ levels
(3D cell cultures, bioreactors, artificial organs), (iii) organism/multisystem levels (micro-flow
chips: tissue-on-a-chip / human-on-a-chip) (Burden et al, 2014; Fowler, 2012; Rabinowitz et
al., 2008; Huh et al., 2011; Altex Proceedings, 2014). Individually or in a combination, they are
known to support main aspects of risk assessment (Figure 2) such as: 1) hazard identification,
2) hazard characterisation, 3) exposure assessment and 4) risk characterisation in the light of
various toxicological endpoints (topical toxicity, repeated dose toxicity, skin sensitisation,
endocrine disruption, reproductive and developmental toxicology, genotoxicity /
carcinogenicity, inhalation toxicology) and levels of exposure (bioavailability,
bioaccumulation, ecotoxicology) ( FAO/WHO, 2008; WHO, 2009a).
The generation of a wide spectrum of new methods and the growing number of toxicity-related
databases is a prerequisite for the development of superior approaches based on alternative
models (in vitro and in silico) that being involved in the so-called intelligent (integrated) testing
strategies or also expert systems will be able to predict the adverse effects of chemicals, thus
replacing in vivo toxicity testing (Adler et al., 2011). Such measures are believed to bring
benefits for human safety assessments like: (i) reduced uncertainty and increased relevance, (ii)
robustness, (iii) reduced cost and time, (iv) higher humanity, (v) adequacy to the legislative
requirements within regulations (Burden et al, 2014). Achieving these goals is a continuous and
dynamic process that is running at the interface of scientific advancement and legislative
requirements, with all positives and negatives of the collective effort it depends on.

16
Figure 2. The main steps in risk assessment and their definitions by the Food and Agriculture
Organisation/World Health Organisation (FAO/WHO, 2008).
Therefore, the role of the large-scale collaborative initiatives in tuning the scientific approach
according to the regulatory demands has become central. An example of such an initiative is
SEURAT-1 (Safety Evaluation Ultimately Replacing Animal Testing, http://www.seurat-
1.eu/). Working towards animal free chronic toxicity testing, the European FP7 Research
Initiative SEURAT-1 adopted a framework focused on better understanding of human adverse
health effects related to the repeated exposure to chemicals, exploring the precise MoA/AOP
of the toxicants. SEURAT-1 was launched on 1 January 2011 as a cluster, composed of seven
projects (http://www.seurat-1.eu/). One of them is the COSMOS Project, focused on the
development of mechanism-based in silico tools to predict the risk of chronic toxicity induced

17
by cosmetic ingredients, in accordance with the full EU marketing ban of cosmetics tested on
animals since 2013 (Regulation 1223/2009/EC OJ L 342, 22.12.2009, p. 59; COM(2013) 135 final)
and other legislation such as the EU REACH and Biocides Regulations and the general 3Rs
Principles (Richarz et al., 2014). The current PhD thesis includes a case study performed within
the COSMOS Project.

18
1.1.2. MoA/AOP approach
Historically, among the earliest published scientific papers dealing with MoA of a given
compound is “On Digitalis: Its Mode of Action and its Use” by Fothergill JM in 1871
(Fothergill, 1871). This work includes suggestions for possible initiating mechanisms and
extensively describes the observed adverse effects related to digitalis administration. This
exemplifies the general principle “Primum non nocere” (First, do no harm) outlined within the
Hippocratic Oath, which is implemented in the current drug development strategies. However,
consumers’ safety issues have gone far beyond the domain of pharmaceuticals, considering the
continuously increasing spectrum of xenobiotics they are exposed to. This has strengthened the
role of the mechanism-based understanding of the undesired health effects, making it one of the
pillars of modern predictive toxicology.
The work on the MoA in animals of the U.S. Environmental Protection Agency (U.S. EPA,
1999) and the WHO’s International Programme on Chemical Safety (IPCS) (Sonich-Mullen et
al., 2001), followed by further initiatives of the International Life Sciences Institute Risk
Sciences Institute (ILSI RSI) (Meek et al., 2003; Seed et al., 2005) and IPCS (Boobis et al.,
2006; Boobis et al., 2008), grew into a mode of action/human relevance analysis framework,
whose principles, in combination with multiple existing assays and the systems biology
approach, became the heart of the AOP concept (ENV/JM/MONO(2013)6). Further, the
Organisation for Economic Co-operation and Development initiated an AOP development
programme (OECD, www.oecd.org/chemicalsafety/testing/adverse-outcome-pathways-
molecular-screening-and-toxicogenomics.htm) to support the OECD Test Guidelines
programme, QSAR (quantitative structure-activity relationship) project and Hazard Assessment
activities. According to the OECD’s definition, the AOP methodology is “an approach which
provides a framework to collect, organise and evaluate relevant information on chemical,
biological and toxicological effect of chemicals”. It integrates a variety of in chemico, in vitro
and in silico approaches to potentiate the systematisation, analysis and exchange of knowledge
as well as the establishment of reliable expert systems to support decision making (Figure 3).

19
Figure 3. Integration of the alternative models/methods development within the MoA/AOP
framework to support decision making in risk assessment: SOP – source to outcome pathway,
AOP – adverse outcome pathway, MoA – mode of action, ToP – toxicity pathway, EC –
environmental contamination, EX – exposure, MIE – molecular initiating event, KEs – key
events at M – molecular level, O – organelle level, C – cellular level, T – tissue level, AO –
adverse outcome effect at O/S – organ/system level, I – individual level, P – population level,
CM – community level. Dark grey boxes mean that the corresponding level is by definition
included in the unit, light boxes are the theoretical extension(s) of the given unit, and white
boxes mean that the level is not covered by the unit (adapted from ENV/JM/MONO(2013)6).

20
Within this concept, the so-called source to outcome pathway covers all steps from
environmental contamination to adverse effects at the community level (U.S. EPA, 2005) and
incorporates three main units: AOP, MoA and toxicity pathway. However, the heart of the AOP
approach is the comprehensive understanding of the MoA of particular chemical initiator(s)
triggering a cascade of sequential events: MIE and multiple downstream key events (KEs)
related to biologically significant perturbations at all levels of organisation and finally ending
with particular adverse outcome (AO) effect, where compensatory mechanisms and feedback
loops are overcome.
In particular, the MIE involves a direct interaction of a chemical with a specific target
biomolecule (e.g. DNA-binding, protein oxidation, or receptor/ligand interaction) initiating the
toxicity pathway (Villeneuve and Garcia-Reyero, 2011; Schultz, p. c.;
ENV/JM/MONO(2011)8). The last is enclosed within the MoA but lacks a direct link to an
apical effect as it covers the key events to the cellular level (Krewski et al., 2010; Watanabe et
al., 2011). In fact, the key events, being biological markers by their nature, represent the main
intermediate elements of the AOP as they are: (i) toxicologically relevant to the AO; (ii)
experimentally observable and quantifiable; (iii) evolving between the MIE and the AO
(ENV/JM/MONO(2011)8; U.S. EPA, 2005; Boobis et al., 2008; ENV/JM/MONO(2008)35.).
Although MoA goes further to the organ response, its cornerstone remains the presence of
robust experimental observations and mechanistic data supporting the key events (World Health
Organisation, 2009b). The site of action also represents a key anchor in the MoA/AOP
development and could be interpreted in view of the different levels of biological organisation
from the target biological molecule or a more specific site on it (e.g. the ligand binding domain
of a receptor) to a particular cell or tissue type in which the molecular initiating event takes
place (Schultz, p. c.). Therefore, an AOP may go beyond the confines of a single organ or a
system as it represents “a sequence of events from the exposure of an individual or population
to a chemical substance through a final adverse (toxic) effect at the individual level (for human
health) or population level (for ecotoxicological endpoints).” (ENV/JM/MONO(2013)6). The
adverse effect itself represents an impairment of functional/compensatory capacity or an
increase in susceptibility to other influences. This effect is caused by a change in the
morphology, physiology, growth, development, reproduction, or lifespan of an organism,
system, or (sub)population (IPCS, 2004; Keller et al., 2012 ; ENV/JM/MONO(2013)6). Often,
the terms endpoint and adverse effect are used interchangeably. This stems from some common

21
elements in their definitions. However, the term endpoint includes various in chemico, in vitro
or in vivo observed chemical or biological properties (hydrophobicity, electrophilicity, lethality,
carcinogenicity, immunological responses, organ effects, developmental and reproductive
effects, etc.) used in regulatory assessments of chemicals. A more precise definition within the
MoA/AOP concept involves two types of endpoints: (i) apical (final) endpoint – directly
measured whole-organism outcomes (gross changes) of exposure in in vivo tests, generally
death, reproductive failure, or developmental dysfunction (ENV/JM/MONO(2011)8;
Villeneuve and Garcia-Reyero, 2011; North American Free Trade Agreement NAFTA, 2011),
which is closer to if not the same as adverse effect/adverse outcome and (ii) non-apical endpoint
– occurring at suborganism-level, i.e. at a level of biological organisation below that of the
apical endpoint related to in vitro responses, biomarkers, genomics (Villeneuve and Garcia-
Reyero, 2011; Schultz, p. c.), which is more likely an intermediate event.
Currently, within the OECD’s initiative for chemical safety, the ongoing development of AOPs
is organised in 37 main projects (http://www.oecd.org/chemicalsafety/testing/projects-adverse-
outcome-pathways.htm, last access: 19 August 2015). The statistics clearly demonstrate the
recent advent of the field, which is obviously progressing at a good pace (Figure 4a, 4b).
Twenty out of 37 projects have already been included in the Adverse Outcome Pathways
Knowledge Base (AOP-KB, last access: 19 August 2015) presenting 91 different AOPs, which
are classified as: (i) AOPs ready for commenting and currently under OECD Extended
Advisory Group on Molecular Screening and Toxicogenomics review (14); (ii) AOPs ready for
commenting and open for general comments (3); (iii) AOPs under development (74). The
majority of them are still under development (Figure 5). The MIEs are related to a variety of
target biomolecules – proteins (receptors, transporters, enzymes) and DNA, involving a non-
covalent disruption (activation, inhibition) of their function or covalent modifications triggering
mutagenesis or oxidative stress. The wide range of final endpoints covers organ- and system-
specific adverse effects. Figure 6 summarises the distribution of AOs with respect to the
affected organs/systems. When the effects are too complex/fuzzy to be related to a particular
target organ/system or when they are involved in mutagenesis, embryotoxicity or disruption in
the normal metabolism/energy balance, they are classified as indefinable.

22
Figure 4. Distribution of the AOP-related projects within the OECD initiative (AOP-KB, AOP
Wiki Knowledge Base) by (a) years and (b) country leaders.
Obviously, hepatotoxicity is among the most frequent adverse effects within the reported AOPs.
Recently, the dysregulations of several nuclear receptors, including: LXR, PXR, AhR, PPARs
(subtypes α and γ), ER, FXR, CAR, GR and RAR, have been proposed as possible MIEs leading
to liver steatosis, which not only underlines the role of this class of transcriptional regulators
but also raises the question with the AOPs’ networking (Landesmann et al., 2012; Mellor et al.,
2015). The general understanding is that a single AOP may link only one particular MIE with
a single adverse effect.

23
Figure 5. Distribution of the AOPs in the AOP-KB according to their status (nd – no data)
The evolution of the linear AOPs toward networks of many cross-related pathways is rooted in
the fact that a particular MIE may lead to several intermediate events and/or final outcomes
and, conversely, several MIEs may share common downstream events. The networking of the
AOPs depends on the degree of organisation of the collected knowledge, while their
quantification – on the extent of evaluation of the quantitative relationships between all events.
Once a qualitative AOP is established, it may be further evaluated quantitatively.

24
Figure 6. Distribution of the AOPs in the AOP-KB by target organ (nd – no data)
According to the OECD’s Guidance document on developing and assessing adverse outcome
pathways (or simply OECD’s guideline), the quantitative AOP (qAOP) is one where the
methods for assessing the key events have been identified and sufficient data generated to
identify the applicability domain, threshold values and/or the response relationships with other
key events.
Thus the more explored, the more complex and quantifiable become the networks established
to meet the challenges of risk assessment, in particular: (1) priority setting for further testing,
(2) hazard identification, and (3) classification and labelling. The potential of AOPs to become
a basis for the development of an integrated approach to testing and assessment or an integrated
testing strategy for toxicity endpoints is enclosed in their central role in channelling the
development and/or refinement of chemical categories, in vitro and ex vivo assays for direct
detection of chemical effects or responses at the cellular or higher levels of biological
organisation as well as screening assays for targets related to the molecular initiating events
identified (ENV/JM/MONO(2011)8).

25
1.1.3. In silico approaches in predictive toxicology
Computational modelling is emerging as an indispensable bridging element in the modern
science, which links theory and experiment by simulating and predicting the behaviour of real-
world systems, processes and phenomena. It is suggested that methodological advancements
(i.e. the progress in computer technologies, computational chemistry, cheminformatics,
statistical and machine-learning approaches) are the main drivers of the rise and development
of predictive toxicology, which emphasises the strong interdisciplinarity of this modern
scientific field (Figure 7) (Cronin and Livingstone, 2004; Cherkasov et al., 2014). In view of
the demands of risk assessment and regarding the complexity of biological systems, exploration
of the mechanisms of toxicity is a challenging task. Therefore, computational toxicology is
foreseen as a perspective alternative of the traditional toxicity testing, offering a wide spectrum
of in silico approaches addressing toxicokinetics or toxicodynamics by various (Q)SARs (SAR
heuristic, chemotypes alerts, 2D QSAR) and molecular modelling (MM) methods
(pharmacophore modelling, docking, 3D QSAR) (Figure 8) (Cronin, 2010; Combes, 2012;
Hartung and Hoffmann, 2009; Patlewicz et al., 2013; Cherkasov et al., 2014; Geenen et al.,
2009; EFSA, 2014; Rabinowitz et al., 2008). Moreover, the in silico tools have been underlined
as a potential important element of the integrated testing strategies defined by Blaauboer et al.
as “any approach to the evaluation of the toxicity, which serves to reduce, refine or replace an
existing animal procedure, and which is based on the use of two or more of the following:
physicochemical, in vitro, human (e.g. epidemiological, clinical case reports), and animal data
(where unavoidable), and computational methods, such as (quantitative) structure-activity
relationships ([Q]SAR) and biokinetic models” (Blaauboer et al., 1999). The role of QSAR in
safety assessment of food, cosmetics, and industrial chemicals has been established for decades,
being integrated in multiple areas of environmental research and regulation. There is an
increasing tendency for application of QSAR methods in screening, testing prioritisation,
pollution prevention initiatives, green chemistry, hazard identification, and risk assessment.
(Cronin and Livingstone, 2004; Patlewicz et al., 2013; Cherkasov et al., 2014).

26
Figure 7. Timeline of key events driving the rise of predictive toxicology (adapted from Cronin
and Livingstone, Predicting chemical toxicity and fate, 2004)

27
Figure 8. Classification of main computational toxicology methods.
Among the number of endpoints with regulatory importance, modelling repeated–dose toxicity
(RDT) is a daunting task dealing with the delayed effects of multiple or repeated administration
of chemicals, their accumulation in tissues or other mechanisms of homeostasis perturbation
(Krewski et al., 2010). By definition, RDT comprises adverse general toxicological effects
which occur as a result of repeated daily dosing with or exposure to a substance for a specified
period up to the expected lifespan of the test species (ECHA, 2013). Although challenged by
the multi MoA nature of this endpoint and thus represented by limited and mostly local
(Q)SARs (Patlewicz et al, 2013), the pathway-based alternative approaches are able to
overcome the limitations of the traditional in vivo repeated dose toxicity tests (Prieto, et al.,
2011; Cronin et al., 2012). Examples of in silico models for RDT were summarised by Adler et
al., 2011 (Table 1).

28
Table 1. Summary of repeated dose toxicity related in silico methods (adapted from Adler et al., 2012); * R&D, optimisation, prevalidation,
validation, regulatory acceptance; ** Maximum recommended therapeutic dose
Alternative tests
available
Part of
mechanism
covered
Area(s) of
application
Status * Comments Estimated time until entry into
pre-validation
TOPKAT Predicts LOAEL
for chronic toxicity
Prioritisation/
screening Optimised
No formal validation necessary,
methods have to follow the
OECD principles for the
validation of QSARs for
regulatory purposes
DEREK Hepatotoxicity Hazard
identification Optimised
Not quantitative – predicts potential
hepatotoxicity (yes/no answer) Formal validation not necessary
DEREK
DEREK hERG
channel inhibition –
cardiotoxicity
Hazard
identification Optimised
Not quantitative – predicts potential
hERG inhibition (yes/no answer) Formal validation not necessary
LAZAR
(Maunz and Helma
2008)
Predicts MRTD for
chronic
toxicity **
Prioritisation/
screening Optimised
Developed using data on
pharmaceuticals
from clinical trials
Formal validation not necessary
Garcia-Domenech et al.
(2006)
Predicts LOAEL
for chronic toxicity
Prioritisation/
screening Optimised Major work needed to develop software
for wider use Formal validation not necessary
Mazzatorta et al.
(2008)
Predicts LOAEL
for chronic toxicity
Prioritisation/
screening Optimised
Major work needed to develop software
for wider use Formal validation not necessary
Matthews et al.
(2004a, b)
Predicts MRTD for
chronic
toxicity **
Prioritisation/
screening Optimised
Major work needed to develop software
for wider use Formal validation not necessary

29
Cherkasov et al. have summarised the general conditions one or more of which are necessary
for successful application of QSAR in modelling toxicity: “(i) compounds within the training
set are structurally similar (i.e. congeneric), implying that a single target-mediated mechanism,
even if unknown, is more likely; (ii) the toxicity endpoint being modelled is either non-target
specific (e.g. narcosis in aquatic toxicity due to membrane concentration effects), or a subject
to relatively well-understood chemical reactivity principles (e.g. electrophilic theory of
carcinogenicity); (iii) the toxicity endpoint is linked to a well-defined molecular target (e.g.
estrogen receptor) or phenotype (e.g. cleft palate malformation, or liver tumours in rats); or (iv)
toxicity data are available for a sufficiently large number of diverse chemicals to capture all or
most of the possible structure-activity associations, representing multiple possible adverse
outcome pathways within the same dataset (e.g. genotoxicity)” (Cherkasov et al., 2014). In
November 2004, the 37th OECD's Joint Meeting of the Chemicals Committee and the Working
Party on Chemicals, Pesticides and Biotechnology
(http://www.oecd.org/env/ehs/organisationoftheenvironmenthealthandsafetyprogramme.htm)
agreed on the OECD Principles for the Validation, for Regulatory Purposes, of (Q)SAR Models.
These principles are as follows:
“To facilitate the consideration of a (Q)SAR model for regulatory purposes, it should be
associated with the following information:
1. a defined endpoint;
2. an unambiguous algorithm;
3. a defined domain of applicability;
4. appropriate measures of goodness-of-fit, robustness and predictivity;
5. a mechanistic interpretation, if possible.”
There are numerous advantages of in silico methods compared with in vitro and especially in
vivo approaches (Valerio, 2009; Combes, 2012):
higher throughput
less expensive
less time consuming
constant optimisation possible
higher reproducibility if the same model is used

30
low compound synthesis, laboratory equipment and facilities requirements
potential to reduce the use of animals
very useful for compound prioritisation
appropriate for being incorporated into decision-trees and expert systems with the
capability of predicting a wide range of endpoints and properties, including
bioavailability, biodegradation and toxicity
usually based on a mechanism of action related to toxicity endpoint
readily amenable to being incorporated into test batteries comprising models with
complementary and overlapping applicability domains
However, a range of disadvantages should be also considered toward their full acceptance by
end-users (toxicologists, regulators, industry): (Weaver and Gleeson, 2008; Valerio, 2009;
Combes, 2012):
quality and transparency of training set experimental data
transparency of the program (what is being modelled)
descriptors sometimes confusing
applicability domain sometimes limited or not clear
complex terminology and poorly understood procedures sometimes used
ADME features, especially metabolism, not taken into account
carcinogenicity prediction does not work on non-genotoxic compounds
Within the AOP continuum, the level of application of the predictive models is a function of:
(i) their inherent uncertainties rooted in the quality of the experimental data and the limitations
of the particular in silico approaches and (ii) the level of the confidence in the AOP – e.g. the
presence and the relevance of scientific evidence supporting each event (Figure 9)

31
Figure 9. Domains of application of the predictive models according to the matrix
uncertainty/data requirements in relation to the AOP continuum (adapted from Bal-Price, et al.,
2015).
While the (Q)SAR modelling approaches (Figure 8) are widely used in the field of predictive
toxicology (ENV/JM/MONO(2007)2; ECHA, 2008), the application of MM techniques for
such needs is still in its infancy, albeit its well established role in drug design. Computer aided
drug design has extensively exploited MM for more than three decades, saving resources and
time by directing the synthesis of highly selective, specific and potent ligands of particular
therapeutic targets. Such strategy generally involves exploration of key intermolecular
interactions which are central for both therapeutic and toxic effects. That explains why MM
approaches have also proved helpful in estimating potential toxicity related to ligand-dependent
dysregulation of key biomolecules (nucleic acids or proteins) crucial for downstream
metabolic/signalling pathways. Therefore, at the interface of drug discovery and risk
assessment, we may find common molecular mechanisms and apply unified in silico
techniques. However, a number of differences in goals, chemical spaces and tasks have to be
overcome for the successful transfer of MM approaches toward solving safety issues.

32
While the aim of drug discovery is to screen for a molecule with well characterised target, mode
of action and desired activity, risk assessment is expected to evaluate more complex, sometimes
mixed and less well understood toxic outcomes, considering both exposure and various
interaction mechanisms in the context of possible chemical initiators. Moreover, the span of the
chemical-activity domain is a function of the mode of action (therapeutic or adverse) to be
modelled, which means that the complex and often cross-related adverse effects suggest a larger
spectrum of structures, range of activities and may depend on strong or weak interactions with
targets in both a specific and a nonspecific manner. The focus of such expertise shifts from
reducing the number of molecules incorrectly predicted as potential drug candidates (false
positives) toward narrowing the pool of harmful chemicals that are underestimated (false
negatives). Yet, the main difference is the ultimate purpose of the screening approaches, e.g.
lead generation and optimisation in the rational drug design versus mechanism elucidation,
prioritisation, and safety assessment in the predictive toxicology (Cherkasov et al., 2014;
Rabinowitz et al., 2008).

33
1.2. Peroxisome proliferator-activated receptor γ (PPARγ) and non-alcoholic fatty
liver disease (NAFLD)
1.2.1. Hepatotoxicity and NAFLD
The better assessment of repeated dose toxicity in hepatic, cardiac, renal, neuronal, muscle and
skin tissues implies great research efforts (Landesmann et al., 2012; Adler et al., 2010). Among
them hepatotoxicity is an endpoint that has recently drawn significant interest (Hengstler et al.,
2012; Vinken et al., 2012).
Liver is a frequent target for toxicity as it is central in the metabolism of the xenobiotics and
thus is highly exposed to many potentially toxic substances. It is also responsible for the
maintenance of the whole body lipid homeostasis, meeting the energy demands of the extra-
hepatic tissues. Therefore, it is important to note that its primary function is fat redistribution
in contrast to the adipose tissue (another key organ related to lipid exchange), which is mainly
involved in the storage of fatty acids (Figure 10).
Direct hepatocyte damage, hepatic tumour, and/or accumulation of lipids or phospholipids
(fatty liver disorder) are common reasons for liver injury and thus important hepatotoxic
endpoints. The NAFLD is a medical condition which includes non-alcoholic fatty liver (NAFL
or liver steatosis) and non-alcoholic steatohepatitis (NASH) and may progress to fibrosis,
cirrhosis and hepatocellular carcinoma (HCC) (Figure 11) (Sass et al., 2005; Bedogni et al.,
2010). As this pathology is a common cause of chronic liver injury, its pathogenesis is of
particular interest in view of the application of MoA/AOP framework to repeated-dose
hepatotoxicity endpoints. NAFLD is the most common cause of liver disease worldwide, with
a prevalence of 20%-40% in Western populations (Bedogni et al., 2004; Rusu et al, 2015) and
between 20-30% in Europe (World Gastroenterology Organisation Global Guidelines, 2012).
The prevalence increases to 58% in overweight individuals and can be as high as 98% in non-
diabetic obese individuals (Machado et al., 2006). Generally, some 12-40% of the patients
diagnosed with NAFL develop NASH and nearly 15% of these demonstrate progression to
cirrhosis (Bhatia et al., 2012).
Disruption of the normal functionality of PPARγ by chemical initiators has been recently
proposed as one of the possible MIEs related to the early manifestation of NAFLD (liver
steatosis), characterised by excessive hepatic lipid accumulation (Sass et al., 2005; Landesmann
et al., 2012).

34
Figure 10. Overview on the complementary roles of hepatic and adipose tissues in the context
of lipid homeostasis: FAT/CD36 – fatty acid translocase/cluster determinant 36; FABPpm –
plasma membrane fatty acid binding protein; SLC 27A2 and SLC 27A5 – solute carrier family
27 fatty acid transporters (member 2 and member 5); FA – fatty acids; TG – triglycerides;
VLDL – very low-density lipoprotein; LPL – lipoprotein lipase; LD – lipid droplet.

35
Figure 11. Progression of NAFLD (NAFL and NASH) to fibrosis, cirrhosis and hepatocellular
carcinoma (HCC)

36
1.2.2. PPARγ
1.2.2.1.Biology of PPARγ
The PPARγ also known as NR1C3 (nuclear receptor subfamily 1, group C, member 3) is a
ligand-activated transcription factor from the steroid-thyroid hormone superfamily (Nuclear
Receptors Nomenclature Committee, 1999). It is a part of the PPAR family (including also the
PPARα and PPARβ/δ isotypes) and is expressed mainly in white and brown adipose tissue but
also in intestines, liver, kidneys, retina, immunologic system (bone marrow, lymphocytes,
monocytes and macrophages) and muscles (to a lesser extent). PPARγ is central in the
regulation of crucial cellular pathways related to adipogenesis (adipocyte proliferation and
differentiation), lipid and glucose homeostasis, inflammatory responses, vascular biology and
placental development (Virtue and Vidal-Puig, 2010; Azhar, 2010; Fournier et al., 2007.;
Grygiel-Górniak, 2014; Brown and Plutzky, 2007; Ahmadian et al., 2013). While several
transrepression strategies have been reported for the genomic control of the adaptive
inflammatory responses (Luconi et al., 2010), the PPARγ-mediated transactivation of genes
associated with lipid transport, metabolism, storage, and adipogenesis is governed by a well-
defined single mechanism (Costa et al., 2010; Luconi et al., 2010). The latter involves
heterodimerisation with another nuclear receptor, the retinoid X receptor alpha (RXRα), DNA
binding at the promoter regions of target genes and stabilisation of the active PPARγ
conformation by diverse endogenic lipid metabolites, including eicosanoids and fatty acids or
synthetic agonists like rosiglitazone (Figure 12) (Gampe et al., 2000; Chandra et al., 2008;
Costa et al., 2010;;). Thus agonist-induced corepressor dissociation, accompanied by the
permanent exposure of the coactivator binding surface, permits coactivator recruitment
necessary for transcription initiation (Nolte et al., 1998; Brown and Plutzky, 2007; Batista et
al., 2015).
The PPARγ 2 isoform, predominantly expressed in adipocytes, has thirty amino acids more at
the N-terminus than PPARγ 1, and it is available in multiple tissues, including liver (Ahmadian
et al., 2013; Chandra et al., 2008). However, the two isoforms bear the common domain
structure of the nuclear hormone receptors with an N-terminal AF-1 (activation function 1)
domain, involved in the interaction with cofactors and the ligand-independent transactivation;
a DBD (DNA binding domain), which is highly conserved among nuclear receptors; a hinge
region with high flexibility, which guarantees nuclear localisation and cofactor docking; and a

37
C-terminal LBD/AF-2 (ligand binding domain/activation function 2), which participates in the
ligand-binding, ligand-dependent transactivation, coactivator recruitment and corepressor
release (Figure 13) (Azhar, 2010; Ahmadian et al., 2013).
Figure 12. The mechanism of PPARγ-mediated transactivation.
Figure 13. PPARγ functional domain organisation: AF1 – activation function domain 1, DBD
– DNA-binding domain, hinge, LBD – ligand-binding domain, AF2 – activation function
domain 2.

38
1.2.2.2.PPARγ ligands and NAFLD
The most notable natural PPARγ ligands are eicosanoids and related compounds, including
lipoxygenase (LOX) products – hydroxyoctadecadienoic acids (9- and 13-HODE) and 15-
hydroxyeicosatetraenoic acid (15-HETE), and cyclooxygenase (COX) products –
prostaglandins (PG), e.g. PGJ2 and its derivative 15-deoxy-∆12–14-PGJ2 (15d-PGJ2), which is
involved in adipogenesis, anti-tumororogenesis and modulation of inflammation (Bishop-
Bailey and Wray, 2003; Nosjean and Boutin, 2002). Anti-cancer effects are reported also for
PUFAs like mainly docosahexaenoic acid and eicosapentaenoic acid) (Trombetta et al., 2007;
Edwards et al., 2004; Sun et al., 2005; Sun et al., 2008) while other natural PPARγ ligands are
claimed to ameliorate obesity-related metabolic dysfunction (long-chain monounsaturated fatty
acids (LC-MUFAs) like C20:1 and C22:1 isomers) (Yang et al., 2013) and to increase glucose
uptake and insulin sensitivity (phytanic acid) (Heim et al., 2002). Triterpenoids are also among
the natural PPARγ ligands. (Weng et al., 2013; Jingbo et al., 2015).
Because of its wide tissue distribution and important regulatory role, PPARγ is also an attractive
therapeutic target for multiple synthetic ligands. In a systematic review on patents (2008-2012)
for therapeutic modulators of PPARs, Lamers et al. proposed an overview over possible future
indications of PPARγ ligands: metabolic diseases; especially hyperglycemia; cardiovascular
disorders; inflammatory and auto-immune diseases: multiple sclerosis, inflammatory bowel
diseases, rheumatoid arthritis; cancer; Alzheimer’s disease; age-related macular degeneration;
skin related disorders; addiction control (in terms of substances (alcohol, nicotine, opioids or
cocaine) or addictive behaviour (kleptomania and others)) (Lamers et al., 2012). Altogether,
these emphasise the increasing actuality of PPARγ ligands’ safety evaluation.
Troglitazone, rosiglitazone and pioglitazone are among the most studied anti-diabetic PPARγ
ligands from the thiazolidinediones (TZDs) class and their mechanism of therapeutic action is
well known (Day, 1997; Grossman and Lessem, 1997). These ligands sharing a common
scaffold (Figure 14) are known to induce conformational changes involved in the receptor
activation (Berger et al., 1996). Interestingly, apart from activating PPARγ, troglitazone has
been shown to induce its expression and nuclear translocation in MCF-7 cells examined by
confocal microscopy (Weng et al., 2013).

39
Figure 14. Main substructures within the common TZDs’ scaffold (adapted from Guasch et al.,
2012; Lamers et al., 2012; Scheen, 2001)
Studies show that binding to the helix12 (H12) of the receptor involves formation of key
hydrogen bonds (HBs) with particular residues (Ser289, His323, His449 and Tyr473), thus
driving the conformational change of H12 required for full agonist activity (Bruning et al.,
2007). This molecular event lies in the PPARγ-mediated: (i) adipocyte differentiation from
fibroblasts, associated with increased uptake, storage and potentially catabolism of circulating
lipids and carbohydrates; (ii) production of adipose-derived factors with potential insulin-
sensitising activity; (iii) increased glucose uptake and decreased gluconeogenesis in liver;
(iv) increase in skeletal muscles’ glucose uptake, oxidation and glycogenesis; and (v) reduction

40
of the circulating levels and/or actions of insulin resistance-causing adipose-derived factors
(e.g. TNFα); all of which synergistically restore the glycemic balance (Berger and Moller, 2002;
Grossman and Lessem, 1997; Semple et al., 2006; Chawla et al., 1994; Garg, 2004; Gee et al.,
2014).
Apart from the therapeutic potential of TZDs, several adverse effects were reported, which led
to the withdrawal of rosiglitazone (fluid retention/oedema, weight gain, bone loss, adverse
hepatic effects and increased incidence of cardiovascular events) and troglitazone (hepatoxicity
due to significant ROS-mediated damage of mitochondrial DNA) from the market (Pan et al.,
2006; Moya et al., 2010; Chigurupati et al., 2015; Viccica et al., 2010; Graham et al., 2010;
Nissen et al., 2010; Shen et al., 2012; Rachek et al., 2009). Pharmacological treatment of
NAFLD is still evolving with vitamin E and pioglitazone being the only approved drugs as of
now (Agrawal and Duseja, 2014). Therefore, the concerns for adversity underlined the necessity
of additional studies treating the role of PPARγ activation in other tissues, especially in terms
of the possible risk for their ligand-induced adipogenic transformation and its secondary effects
at a system level (Teboul et al., 1995). Some authors report a correlation between this MIE and
the development of NAFLD (Rull et al., 2014; Kus et al., 2011; Hemmeryckx et al., 2013) while
others underline the therapeutic potential of receptors’ modulation in reversing the progression
of this disease (Le and Loomba, 2012; Rogue et al., 2014). Thus, a debate on the impact of
PPARγ activation on NAFLD still exists and its double-edged role has been extensively
reviewed (Tailleux et al., 2012; Ables, 2012). However, as synthetic PPARγ ligands are
primarily categorised based on their transactivation activity into full and partial agonists
(Kouskoumvekaki et al., 2013), the understanding that PPARγ full agonists hold more negatives
than positives is out of debate (Merk and Schubert-Zsilavecz, 2012), and there is a firm
tendency toward development of novel ligands: partial agonists (Chigurupati et al., 2015),
multitargeted cooperative agonists (dual- and pan-PPAR) (Wang et al., 2014; Fiévet et al.,
2006; Gonzalez et al., 2007), non-agonists (Choi et al., 2014; Kamenecka et al., 2011) and even
antagonists of the receptor (Marciano et al., 2015). Moreover, partial PPARγ activation, as well
as dual or pan-PPAR activation, has been shown to be beneficial for liver structure and
functioning (Souza-Mello, 2015).
Apart from pharmaceuticals, hormone nuclear receptors are claimed as primary targets of
various non-drug endocrine disrupting chemicals since their natural ligands are small, lipoidal

41
molecules (i.e. steroid hormones, fatty acids and their derivatives) which can be mimicked by
many environmental chemicals. Among PPAR activators are xenobiotics such as: industrial and
consumer chemicals, pesticides, and environmental contaminants (Rogue et al., 2010;
ENV/JM/MONO(2012)23; Landesmann et al., 2012). Furthermore, PPARs signaling pathways
have been considered as a separate axis in the context of endocrine disruption by exogenous
chemicals, and there have been reviewed general aspects of the assessment of such
dysregulation, including: PPAR transactivation reporter assays, microarray analyses of livers
of exposed animals, cell-based assays (adipocyte differentiation) and apical endpoints (lipid
accumulation, weight gain in chronically exposed animals) (ENV/JM/MONO(2012)23). In
view of the multiple roles of PPARγ in maintaining energy and metabolism homeostasis and
regarding the potency-related variations in the physiological effects of its activators, in silico
analysis of the PPARγ full agonistic effect is of specific interest in the field of toxicology. That
explains the significant efforts which have been made for understanding and predicting the
binding to and activation of PPARγ.

42
1.2.2.3.Molecular modelling of PPARγ
In view of the increased therapeutic interest on modulation of PPARγ activity, the prevalence
of the drug design related studies (Al-Najjar et al., 2011; Carrieri et al., 2013; Dixit et al., 2008;
Guasch et al., 2012a; Liao et al., 2004; Lu et al., 2006; Rücker et al., 2006; Shah et al., 2008;
Guasch et al., 2011; Vedani et al., 2007) over those treating predictive toxicology issues
(Vedani et al., 2007) can be expected. The in silico studies on PPARγ are focused on 2D (Al-
Najjar et al., 2011; Carrieri et al., 2013; Dixit et al., 2008), 3D (Carrieri et al., 2013; Guasch et
al., 2011; Guasch et al., 2012a; Liao et al., 2004; Lu et al., 2006; Shah et al., 2008; Sundriyal et
al., 2009) or 6D QSAR (Vedani et al., 2007) analysis and pharmacophore modelling (Al-Najjar
et al., 2011; Carrieri et al., 2013; Lu et al., 2006; Guasch et al., 2011; Sohn et al., 2013, Sharma
et al., 2014). The latter has outlined mainly hydrophobic and some hydrogen-bond
donor/acceptor features, varying in the total number of pharmacophoric points (between 3 and
7), by means of ligand- and/or structure-based modelling (Markt et al., 2007; Carrieri et al.,
2013; Goebel et al., 2010; Sohn et al.; 2011, Guasch et al., 2012b; Sohn et al., 2013). The
pharmacophore models have been applied for SAR analysis (Pingali et al., 2008; Goebel et al.,
2010; Xiao et al., 2014) or combined with a separate step of molecular docking within a virtual
screening (VS) procedure (Guasch et al., 2011; Sohn et al.; 2011, Sohn et al., 2013; Fakhrudin
et al., 2012). However, most of the PPARγ-related pharmacophore-based studies have been
particularly applied for design of dual PPARα/γ agonists (Pingali et al., 2008) or
identification/analysis of partial PPARγ agonists (Goebel et al., 2010; Guasch et al., 2011;
Fakhrudin et al., 2012). This illustrates the prevailing tendency toward the discovery of novel
drug-like PPARγ agonists to serve as lead molecules (Markt et al., 2008; Sohn et al. 2011, Sohn
et al.; 2013, Fakhrudinet al., 2012; Guasch et al., 2012b; Guasch et al., 2013; Lewis et al., 2015).
The studies targeted toward distinguishing between full and partial agonists are few. Among
them are the reports of Vidović et al., who identified a partial agonist-like ligand cluster within
a binding mode similarity dendrogram based on an analysis of co-crystallised PPARγ
modulators (Vidović et al., 2011), Guash et al., who developed separate pharmacophore models
for full and partial agonists of PPARγ, applied them for a virtual screening of natural ligands
with partial agonism (Guasch et al., 2012a) and performed 3D QSAR modelling, particularly
of PPARγ full agonists (Guasch et al., 2012b), and Lewis et al., who selected criteria for filtering
the full agonism activity type (Lewis et al., 2015).

43
Therapeutic application has also been the driving stimulus for 3D QSAR modelling studies.
The developed models have been based on dependent variables such as: potency
(transactivation activity) – pEC50 (Carrieri et al., 2013; Guasch et al., 2012a; Rücker et al.,
2006; Shah et al., 2008; Sundriyal et al., 2009) or binding affinity – pIC50 (Al-Najjar et al.,
2011; Guasch et al., 2012a; Rücker et al., 2006) or pKi (Liao et al., 2004; Rücker et al., 2006;
Vedani et al., 2007) values of PPARγ agonists. It should be noted that most of the 3D QSAR
models are based on pEC50 values. Although considered more interesting from a
pharmacological point of view, potency data is hard to be modelled due to its complex nature.
Transactivation activity involves not only receptor binding but also its activation and a sequence
of downstream molecular events culminating with expression of a target reporter protein
(Rücker et al., 2006). The last is the quantifiable event within the corresponding assay (usually
Luciferase transcriptional reporter gene assay) which reflects the variations in the levels of
protein expression as a function of the structural diversity of the chemical initiators.
Interestingly, some authors use an additive dependent variable called “sum of biological
activities” (pEC50) to build 3D QSAR models for dual (γ/δ or α/δ) and pan (α/γ/δ) PPAR
agonists (Shah et al., 2008; Sundriyal et al., 2009). The number of compounds within the
training sets varies between 22 and 77 with training to test set (tr/ts) ratio in the range from 5:1
to 1:1. Briefly, the generalised diapasons of some reported statistical parameters are as follows:
Nopt = 2 – 10, q2 = 0.549 – 0.744, r2pred = 0.150 – 0.336. The fields most frequently involved in
the developed 3D QSAR models are steric and electrostatic. In particular, there is a prevalence
in the number of the pEC50 based models with 22 to 95 compounds (total set) and 19-28
(training sets), a tr/ts ratio from 1:1 to 3:1, q2 between 0.549 and 0.744 and steric and
electrostatic fields involved–. However, no r2pred values are reported. Among the pEC50 based
3D QSAR models possessing the fullest array of statistical parameters the highest q2cv
is 0.633
(SEPcv = 0.017, Nopt = 5, tr/ts = 19/4, steric and electrostatic fields) (Shah et al., 2008). Although
the current pEC50 based models are statistically poorer compared with those involving pIC50 or
pKi values, predicting potency is mechanistically justified because the input data is observed in
the biologically relevant in vitro model system of the MIE (PPARγ activation) and is directly
related to the earliest downstream key events – increased levels of an array of target proteins,
outlined in the developed liver AOP and discussed later.

44
Based on the literature review presented above, the following conclusions can be made:
1. Predictive toxicology is a new promising field that has many advantages.
2. MoA/AOP framework is a powerful approach that organises the existing knowledge
and underlines both data gaps to be explored and key events to be comprehensively
analysed.
3. NAFLD is a complex pathological condition that is crucial for the chronic liver injury,
and thus predicting potential prosteatotic activity of chemicals is a key element in the
strategy for minimising the risk for such adverse effect.
4. Full PPARγ agonists can be associated with various adverse effects, including liver
toxicity.
5. In silico tools for modelling MIEs are pivotal for optimising safety assessment but they
strongly depend on the available experimental data.
6. Currently, there is no report on PPARγ-related toxicophore (pharmacophore) model for
the purposes of predictive toxicology since the focus of the pharmacophore-based
approaches is the discovery of partial PPARγ or dual PPARα/γ agonists for therapeutic
applications.
7. Many of the PPARγ-related 3D QSAR models published in the scientific literature
address the transactivation activity as a dependent variable, albeit its complexity, and
thus suffer from poorer statistical performance as compared to the binding affinity-
based models. Among them only one is particularly focused on full agonists.

45
AIM AND TASKS OF THE PhD THESIS
Based on the conclusions above, the following aim and tasks were outlined.
AIM
The aim of this PhD thesis is the application of MoA/AOP concepts and computational
toxicology methods to understand and predict the role of PPARγ ligand-dependent
dysregulation in the development of NAFLD.
TASKS
1. Development of AOP to connect in a logical sequence of events PPARγ ligand-
dependent dysregulation (MIE) and NAFLD (adverse effect)
1.1. Collection of the existing knowledge and description of the AOP
1.2. Evaluation of key events
2. In silico study of the MIE
2.1. Data collection, curation and organisation of representative sets of biologically
active compounds and ligand-receptor complexes for evaluation of toxicity
pathways and for in silico prediction of biological effects
2.2. Molecular modelling analysis of the interactions in crystallographic structures of
protein-ligand complexes
2.3. Development of an integrated in silico approach for chemical hazard identification
and prioritisation, combining pharmacophore and 3D QSAR models to screen for
potentially prosteatotic PPARγ full agonists and to predict their transactivation
activity

46
CHAPTER 2. DATA AND METHODS
2.1. OECD principles for AOP development and evaluation
AOP development and evaluation is a continuous process which involves not only collection
and analysis of scientific evidence but also AOP networking and quantification. Regarding the
starting point for AOP development, two different approaches are available:
(i) a ‘bottom-up approach’ which uses chemistry and mechanistic information for
hazard identification;
(ii) a ‘top-down approach’ which starts with the knowledge about the final adverse
outcomes produced by well studied substances to develop chemical categories
with a particular mode-of-action (Sonich-Mullin et al., 2001).
However, the OECD principles for establishing and assessing such logical sequence of events,
are common for both approaches and are shown within the general workflow in Figure 15.
There are 5 categories for the evaluation of the weight-of-evidence (WoE) that OECD proposes
when assessing the scientific value of the described key events (Table 2). They consider
estimation of both the extent of development of the assay applied for experimental observation
of the key event under evaluation and the mechanistical justification for the established causal
relationship between the event and the adverse effect (ENV/JM/MONO(2013)6).

47
Figure 15. Main stages in developing and assessing AOPs (ENV/JM/MONO(2013)6).

48
Table 2. OECD classification of weight-of-evidence (ENV/JM/MONO(2013)6).
Weight-of-
Evidence
Extent of Development of Assay for the Key
Event / Intermediate Effect
Relationship Between Key
Event and Apical Endpoint
Very Strong
OECD Guideline test or an assay that has
progressed through a minimum of
prevalidation.
A large database of results for relevant
chemicals supportive of the relationship
between the key event and the apical endpoint.
Clear and unequivocal
relationship and mechanistic
basis for it.
Strong
A well developed assay, available in a form
that could allow it to be submitted for
prevalidation.
A database of results for relevant chemicals
supportive of the relationship between the key
event and the apical endpoint.
General agreement that there
is a strong relationship and a
mechanistic basis for it.
Moderate
A robust and reliable method published in the
peer-reviewed literature.
A database of results for relevant chemicals
supportive of the relationship between the key
event and the apical endpoint.
An understanding that there
is a relationship and a
probable mechanistic basis
for it.
Weak
An assay is available but is in the process of
development.
A small number of chemicals supportive of the
relationship between the key event and the
apical endpoint.
An understanding that there
is some evidence of a
relationship and a plausible
mechanistic basis for it.
Very Weak The key event is identified but no assay is
available.
Hypothetical or literature
based.

49
2.2. Molecular modelling approaches and QSAR
2.2.1. Collection and processing of the structural and biological data
To collect the necessary data for PPARγ ligands, the following sources were used: PDB
(www.rcsb.org, Berman et al., 2000) and ChEMBL (https://www.ebi.ac.uk/chembl/; Bento et
al., 2014) databases as well as the NIH PubMed system
(http://www.ncbi.nlm.nih.gov/pubmed).
2.2.1.1.Biological data used
Generally, there are several main criteria in selecting the biological data regarding its quality
and consistency as well as the performance of the experiment (Höltje at al., 2004):
(i) preferably identical experimental conditions
(ii) common mechanism/binding mode of the tested compounds
(iii) experimentally confirmed lack of activity where suggested
(iv) in vitro experimental setting only1
(v) at least 3 orders of magnitude span in the biological activities
(vi) exact 3D structural data
(vii) exclusion of stereochemically undefined mixtures (mixtures of enantiomers or
diastereomers)
Applying all these rules is quite challenging in predictive toxicology. Often, experimental data
suffers from intra- and inter-laboratory variations even when a standard protocol has been
followed. Sometimes, the 3D structure of the ligands is not crystallised although there is at least
one member of a reported chemical series that is deposited in the Protein Data Bank (PDB) and
may serve as a template. The stereochemistry issue is also disputable as there are studies that
involve corrective coefficients or rely on some mechanism-justified criteria for selecting a
particular isomer instead of excluding data for racemic mixtures.
1 Achieving real equilibrium is suggested only for in vitro experiments since all other test systems undergo time-
dependent changes, being cross-related with other biochemical processes (e.g. membrane permeation) and
affected by transport phenomena and diffusion gradients.

50
In addition, OECD outlined some key principles for endpoint selection in its Guidance
document on the validation of QSAR models, as follows (ENV/JM/MONO(2007)2):
1. The endpoint should be defined by providing detailed information on the test protocols
which were used to generate the training set data, especially with respect to factors
which impact variability, knowledge of uncertainties, and possible deviations from
standardised test guidelines.
2. Differences in the protocols that experimentally measure the described endpoint should
not lead to markedly different values of the endpoint.
3. Differences within a protocol (e.g. media, reagents) should not lead to differences that
cannot be rationalised (e.g. impact of hardness within a fish LC50 study).
4. The chemical domain of the (Q)SAR should be contained within the chemical domain
of the test protocol.
5. The endpoint being predicted by a (Q)SAR should be the same as the endpoint measured
by a defined test protocol that is relevant for the purposes of the chemical assessment.
6. A well-defined endpoint should reflect differences between chemical structures.
The collected biological data used in the modelling studies (transactivation activity, EC50) was
additionally processed in two steps for the CoMSIA modelling:
(i) transformation to pEC50 values;
(ii) pEC50 values’ selection by favouring human over animal data and calculation of
the mean pEC50 were necessary for each of the reference compounds (farglitazar,
rosiglitazone and pioglitazone) that have been tested on human and animal cell
lines by different research groups.

51
2.2.1.2.Structure preparation
Depending on the input data, three main procedures were applied in the structures’ generation:
(i) For ligands with correct IUPAC names available in the literature source, SMILES
were generated through NCI/CADD SIR (http://cactus.nci.nih.gov) or University
of Cambridge OPSIN (http://opsin.ch.cam.ac.uk) services.
(ii) For ligands without IUPAC names available in the source or with
incorrect/unresolvable IUPAC names, SMILES codes were generated from
similar structures that were modified accordingly; IUPAC names were obtained
through ChemAxon's chemicalize.org service (http://www.chemicalize.org).
(iii) For ligands with the PPARγ complexes deposited in PDB, ligand structures were
extracted from the complexes, they were neutralised through the Wash procedure
in MOE platform v. 2014.0901, (CCG Inc., http://www.chemcomp.com), and
their stereochemistry was fixed where necessary.
The data processing step involved convertion of all SMILES codes to “inchified” SMILES by
Openbabel 2.3.2 (http://openbabel.org, CLI parameters: -ismi -osmi -xI), generation of InChi
keys to be used as connection table names and conversion of the binding affinity and
transactivation activity data to micromolar concentrations.
As explained in greater detail in Section 3.3.2., a subset of 170 PPARγ full agonists fitting the
requirements for modelling purposes was selected from the initial dataset. This structurally
diverse subset included ligands with relative efficacy ≥ 70% and/or PDB ligands with
substructures matching the features of the developed PPARγ full agonists’ pharmacophore
(Tsakovska et al., 2014). Detailed information regarding the ligands retrieved from PDB and
used for modelling is provided in Table S.1., Appendix A. Supplementary Material.
The selected modelling subset of 170 ligands encompasses data reported in PDB and in the
literature. Among the 15 different homologous series collected (Table 3):
(i) eight contain a PPARγ ligand with a crystal structure deposited in the PDB that
was used as a template in structure generation;
(ii) one contains a PPARα ligand used as a template;
(iii) six do not contain resolved PDB ligands and the corresponding structures were
built either directly or from structurally similar PDB ligands.

52
The ligands’ stereochemistry was adjusted as reported in the literature sources. Racemic
mixtures were not excluded from the modelling set, but S stereoisomers were used instead,
since this is the commonly accepted active form (Rücker et al., 2006; Shah et al., 2008). The
protonation state of the ligands, if not reported in the PDB complexes, was assigned according
to the predominant forms of the structures at pH = 7.4, as explored in ACD/Labs Percepta suite
2015 (ACD Inc.). When for a given compound the calculated proportions of the protonation
states equaled, the corresponding forms were suggested to coexist and thus considered as
different ligands. Structure minimisation was further performed with the MMFF94s force field,
including electrostatics using the MM platform MOE (MOE, v. 2014.0901).

53
Table 3. PPARγ ligands selected for modelling: research group, molecular scaffold, numbers and PDB identifiers. * 1a – Bènardeau et al., 2009;
1b – Grether et al., 2009; 1c – Kuhn et al., 2006; 2a – Casimiro-Garcia et al., 2008; 2b – Casimiro-Garcia et al., 2009; 3 – Ohashi et al., 2013; 4a –
Otake et al., 2011a; 4b – Otake et al., 2011b; 4c – Otake et al., 2012; 5a – Sauerberg et al., 2002; 5b – Sauerberg et al., 2003; 5c – Sauerberg et al.,
2005; 6a – Devasthale et al., 2007, 6b – Zhang et al., 2009 and 6c – Ye et al., 2010., 7 – Cronet et al., 2001; 8 – Gampe et al., 2000; 9 – Xu et al.,
2001; 10a – Mahindroo et al., 2005; 10b – Mahindroo et al., 2006a; 10c – Mahindroo et al., 2006b; 10d –Lin et al., 2009; 11 – DOI:
10.2210/pdb2xkw/pdb; 12 – Ohashi et al., 2011; 13 – Kuwabara et al., 2012. Indices a, b, and c correspond to different papers of one and the same
research group designated by a number.
DATA SOURCE TEMPLATES FOR STRUCTURE
GENERATION
Research
group * Scaffold used in the source paper
Ligands
(number)
PDB
complex
code
PDB
ligand
code
Comment
1a
10 3G9E RO7

54
1b
12 3FEJ CTM

55
1c
17 2GTK 208
2a
12 2Q8S L92

56
2b
3 3IA6 UNT
3
10 3VSO EK1
4a
10 no no

57
4b
9 no no
4c
25 no no
5a
13 1KNU YPA
5b 2 no no 1KNU/ YPA used
as a template
5c 3 no no 1KNU/ YPA used
as a template

58
6a
12 no no 1FM9/570 used as a
template
6b
11 3BC5 ZAA

59
6c
9 3KDU NKS
NKS used only as a
template, however,
not included in the
modelling dataset
since 3KDU is a
complex of PPARα
7
1 1I7I AZ2

60
8
1 1FM6 BRL
1 1FM9 570

61
9
1 1K74 544
10a
1 2ATH 3EA

62
10b
1 2F4B EHA
10c
1 2HWR DRD

63
10d
1 3GBK 2PQ
11
1 2XKW PIB

64
12
1 3AN3 M7S
1 3AN4 M7R

65
13
1 3VJI J53

66
2.2.1.3.Protein preparation
The “Protonate 3D” tool within the MM platform of MOE v. 2014.0901 (CCG Inc.) was used
to prepare the initial structures of PPARγ. That involved assignment of the correct ionisation
states and addition of the hydrogen atoms in the X-ray protein structures by determining:
(i) the rotamers of –SH, –OH, –CH3 and –NH3 groups in Cys, Ser, Tyr, Thr, Met, Lys;
(ii) the ionisation states of acids and bases in Arg, Asp, Glu, Lys, His;
(iii) the tautomers of imidazoles (His) and carboxylic acids (Asp, Glu);
(iv) the protonation state of metal ligand atoms in Cys, His, Asp, Glu, etc.;
(v) the ionisation state of metals;
(vi) the element identities in His and the terminal amides (Asn, Gln).
Based on the generalized Born/volume integral electrostatics model within this application, an
optimisation of the titration free energies of all titratable groups was performed at
physiologically relevant conditions (temperature: 310 K; pH = 7.4; ion concentration: 0.152
mol/L).

67
2.2.2. Protein-ligand interactions
2.2.2.1.General principles
Molecular interaction and recognition are the primary events governing each biochemical
process within a cell or an organism. In particular, complex formation between small molecules
and their macromolecular targets is a frequent initiating event related to chemical-induced organ
toxicity. The reversibility of receptor-ligand (RL) complex formation is rooted in the non-
covalent nature of the driving interactions and is characterised by the rate constant of the
forward reaction kforward and the rate constant of the backward reaction kbackward:
Eq. 1
A simplified illustration of such a relationship, disregarding migration of a ligand to the active
site, activation of second-messenger transduction processes or interaction with the solvent and
additional molecules, is presented in Figure 16.
Figure 16. Interaction-energy diagram for the reversible receptor-ligand complex formation:
∆E – overall change in energy for the interaction; ∆Ea and ∆Ed – activation energies for the
association and dissociation processes, respectively; R – receptor; L – ligand; RL – receptor-
ligand complex. Adapted from Raffa et al., 2003 and Schneider et al., 2008.
RLLRforward
backward
k
k

68
The thermodynamical aspect of the receptor-ligand interactions is centred on the change in the
free energy formation of the ligand-receptor complex ∆G as defined by Gibbs in 1873 and the
general principle that a spontaneous occurrence of a receptor-ligand complex is possible if its
overall energy level is lower than that of the free molecules. The “Gibbs energy” summarises
the free energy changes associated with the electrostatic, non-polar and hydrophobic
interactions which occur between the two molecules, and entropy costs associated with the
interaction and is given by the Gibbs-Helmholtz equation:
Eq. 2
with ∆G giving the change in the free energy of binding, T – the temperature in Kelvin and the
enthalpic and entropic contributions to ∆G designated by ∆H and ∆S, respectively. The change
in enthalpy (∆H) indicates the molecular forces involved in the receptor-ligand interaction
characterised by formation and disruption of: hydrogen-bonds; electrostatic (e.g. ionic, polar);
arene-arene (both electrostatic and hydrophobic) and dispersive (vdW) interactions (Table 4)
(Schneider et al., 2008; Andrews, 1993).
Table 4. Non-covalent intra- and intermolecular interactions; r – distance separating the
interacting particles
Type of the interaction / effect Strength Strength proportional to
ion – ion Very strong r-1
ion – dipole Strong r-2
vdW dipole – dipole Moderately strong r-3
vdW ion – induced dipole Weak r-4
vdW dipole – induced dipole Very weak r-6
vdW London dispersion forces
(induced dipole – induced dipole) Very weak r-6
hydrogen bond Moderately strong the electronegativity of the H-
donor and the H-acceptor
hydrophobic Moderately strong
the size of the lipophilic surface
area shed by the ligand in the
complex
STHG

69
The electrostatic interactions include ion-ion, ion-dipole and dipole-dipole interactions.
Although the ion-ion interactions seem to be the most important for the ligands in view
of the predominantly anionic (carboxylate, phosphate) or cationic (e.g. aliphatic amino)
forms of their functional groups at physiological pH, the weaker ion-dipole and dipole-
dipole interactions are more prevalent. This is due to the wider occurrence of bond,
group or molecule dipole moments resulting from electronegativity differences. The
inductive interactions (ion-induced dipole and dipole-induced dipole) are commonly
characterised by intra- or intermolecular charge redistribution. While the first can be
related either to the ligand or the receptor molecule (polarisation), the second reflects
the charge transfer between the ligand and the receptor. Special cases of electrostatic
interactions are the cation – π, and π – π (arene – arene) interactions.
The dispersive interactions (London forces) occur between non-polar molecules,
particularly at short intramolecular distances, and are rooted in the dipole moments
generated from the movement of electrons around the nuclei. The total contribution of
these interactions can be very significant, albeit their individual weakness, and is
generally governed by attractive dispersion and short-range repulsive forces.
The HB donor/acceptor interactions in most cases are best described as electrostatic
ones. The most significant biologically relevant hydrogen-bond interactions involve the
oxygen and nitrogen atoms of the carboxyl, hydroxyl, carbonyl, amino, imino and amido
groups participating in the establishment of the tertiary structure of proteins and nucleic
acids as well as in the complex formation with their corresponding ligands.
Carboxylates are better HB acceptors than amides, ketones or ionised carboxyls, while
substituted ammonium ions are better HB donors than unsubstituted ammonium ions or
trigonal donors. This is explained by the fact that the greater is the electrostatic character
of the groups sharing the hydrogen atom, the stronger is the HB formed (Andrews,
1993).
The hydrophobic effect is a major driving force of receptor-ligand associations. The
change in entropy (∆S), which reflects the change in the degrees of freedom
(“uncertainty”) of the molecular system, is governed by this effect. Generally, the loss
of degrees of freedom of the receptor and the ligand during complex formation is

70
countered by an increase in entropy, resulting from the release of receptor- and ligand-
bound water molecules into the bulk solvent. Since the water molecules cannot form
polar contacts with the hydrophobic protein surfaces, they are forced to adopt an
entropically unfavourable ordered structure. The release from these strained structures
significantly increases their degrees of freedom (∆S, entropic contribution) and
hydrogen bonding with bulk water molecules (∆H, enthalpic contribution), which
additionally contributes to an overall negative change in free energy. The contribution
of the hydrophobic effect in many cases is approximately proportional to the size of the
lipophilic surface area shed by the ligand in the complex (Schneider et al., 2008).
∆G is related to the binding constant Ki by the equation:
Eq. 3
with R being the gas constant. This relation links the free energy change to the aforementioned
rate constants (kforward and kbackward) since Ki is a synonym of the dissociation constant Kd and is
inversely related to the equilibrium constant Keq:
Eq. 4
Eq. 5
The biochemical competition assays are among the most frequent experimental approaches for
estimation of the dissociation constant Kd of a ligand. Generally, this involves measuring the
displacement of a known reference ligand from the receptor where the stronger displacement is
related to higher binding affinity of the tested compound (hence the term “inhibition constant”,
Ki). Typically, radioactive reference ligands are used (e.g. in a scintillation proximity assay), or
the displacement is coupled to a detectable fluorescence signal (e.g. in a fluorescence
polarisation binding assay). Several concentrations of the test compound are used to determine
the one at which the competing ligand displaces 50% of the specific binding of the reference
ligand (e.g. the IC50 value) (Figure 17).
LR
RL
k
kK
backward
forward
eq
RL
LRKK di
iKRTG ln

71
Figure 17. Competition curve for a test ligand in a receptor binding assay. The IC50 value is
obtained from the turning point of the curve. The fraction of the reference ligand that is not
displaced by the test ligand is designated as non-specific binding (NS). Adapted from Schneider
et al., 2008.
The Cheng-Prussoff equation is used in the estimation of the Ki of the test compound based on
the Kd reference value for binding of the reference ligand and the IC50 determined in the binding
assay:
Eq. 6
where [L] is the concentration of the reference ligand used in the assay. However, these apparent
Ki values may not reflect the “true” Ki values of the tested compounds (Schneider et al., 2008).
reference
d
i
K
L
ICK
][1
50

72
According to the classical receptor theory developed by Clark (1933), it was assumed that the
effect of a drug was proportional to the fraction of receptors it occupied in such a manner that
occupation of all receptors was necessary for achieving the maximal effect.
Eq. 7
Adopting such understanding for the receptor-ligand interactions would produce the following
equation:
Eq. 8
where E is the effect, Emax is the maximal effect, [L] is the concentration of the free ligand and
[L]/(Kd + [L]) is the fraction of the receptors that is occupied by ligand.
Based on the linear relationship between occupancy and response, three main cases can be
considered:
(i) [L] << Kd → E = Emax * [L] / Kd Eq. 8.1
(effect depends on [L] linearly)
(ii) [L] >> Kd → E = Emax Eq. 8.2
(effect does not depend on [L])
(iii) [L] = Kd → E = Emax / 2 Eq. 8.3
According to case (iii), the concentration at which the ligand is half-maximally effective
(pEC50) is equal to its pKd (Figure 18).
LK
LEE
d
max
effectRLLRforward
backward
k
k

73
For the nuclear receptors that are transcriptional regulators of target genes, the estimation of
EC50 is often performed by transactivation reporter gene assays (for example, Luciferase assay),
measuring the transactivation activity of the ligand. The resulting sigmoidal log dose-effect
curve is the most helpful graphical representation for comparing the relative potencies and
efficacies of agonists (Figure 19a).
In reality, however, the relationship occupancy-response is non-linear since signal
amplification is triggered in-between as a cascade of intermediate molecular events. As a result,
the observed EC50 for response is significantly shifted to the left of the Kd for receptor
occupancy (Figure 19b).
Figure 18. A log[L]-response curve reveals a sigmoidal relationship between occupancy and
response, such that, in the absence of negative or positive cooperativity, 10% to 90% response
occurs over approximately a 100-fold range of agonist concentration, “centred” about the EC50
for the agonist (Ross, 1996).

74
Figure 19. Agonists vary in terms of potency and efficacy. (a) Ligands K and L are equal in
their potency, which is superior to that of ligands M and N. At the same time, ligands L and N
are more efficacious than K and M, which are partial agonists. (b) Because occupancy is often
not directly related to response and signal transduction cascades between receptor binding,
effector activation, and the observed response amplifies the initial stimulus, dose-response
curves often fall to the left of the receptor-occupancy profiles. Adapted from Ross (1996).
The nonlinear relationships were addressed first by Ariens (1954), who introduced the term
“intrinsic activity” to describe the observation that some drugs did not elicit a maximal
response, albeit the apparently maximal receptor occupancy:
Eq. 9
where E is the effect, α – the intrinsic activity and DR – the concentration of the drug-receptor
complexes.
In order to reflect the property of an agonist, Stephenson (1956) introduced the term efficacy
and further advanced the concept to the following relationship:
Eq. 10
Eq. 11
DRE
SfR '
eyS

75
where R' is the response of a tissue to some stimulus (S) which depends on the efficacy (e) and
the fractional receptor occupancy (y).
It is postulated that the agonist’s potency is determined by its efficacy, together with the affinity
for its receptors. Moreover, the drug’s characteristics, the properties of its receptor and of the
target tissue (e.g. drug’s distribution and metabolism, tissue-specific levels of the receptor,
coupling the receptor occupancy to the final response) have their contributions to the variations
in the ligands’ effects in different tissues. The current form of the equation is:
Eq.12
where intrinsic activity (α) is equal to the relative efficacy of the ligand compared to the
reference compound, thus being a convenient criterion for classification of full agonists, partial
agonists and antagonists (Figure 20).
Figure 20. Application of intrinsic activity for discriminating between ligands with different
types of action.
However, the relative efficacy calculated in percents (%max) is the most often reported value
for a series of tested ligands. Since IC50, EC50 and %max values are relatively easy to obtain,
these are determined in first-pass screening campaigns and Ki values are determined during
later stages.
LK
LfSfE
d
agoniststrongest
agonist
E
E
_max
max,

76
2.2.2.2.Analysis of the receptor-ligand interactions
The PPARγ-ligand complexes were analysed using the MOE tool “Ligand Interactions” (MOE,
v. 2014.0901). This application allows for identification of a number of interactions (hydrogen
bonds, salt bridges, hydrophobic interactions, cation-π, sulphur-lone pair, halogen bonds and
solvent exposure) between the ligand and the receptor-interacting entities as HB residues, close,
but non-bonded residues (approaching the ligand but not having any strong interactions, i.e.
HBs), solvent molecules and ions. The probability criteria considered in the identification of
the HB donor-acceptor interactions were based on a large training set. The default HB scores
(in percentages) and HB directionality were applied.

77
2.2.3. Pharmacophore modelling
2.2.3.1.Pharmacophore concept – general view
In 1909 Paul Ehrlich used the term pharmacophore in the sense of "a molecular framework that
carries (phoros) the essential features responsible for a drug's (pharmacon) biological activity"
(Ehrlich, 1909). Therefore, the pharmacophore could be considered as a 3D model describing
the type and location of the binding interactions between a ligand and its target receptor.
According to the IUPAC definition: "A pharmacophore is an ensemble of steric and electronic
features that is necessary to ensure the optimal supramolecular interactions with a specific
biological target and to trigger (or block) its biological response.", where the term
supramolecular stands for non-covalent (Wermuth et al., 1998). The pharmacophoric features
characterise the nature of a particular property rather than be associated with a specific chemical
structure, thus one feature may integrate different chemical groups sharing the same property,
for example: hydrogen bond donor, hydrogen bond acceptor, hydrophobic, and positively and
negatively ionised areas.
Pharmacophore modelling involves generation of a pharmacophore hypothesis for the binding
interactions in a particular active site and could be ligand-, target- or complex-based, depending
on the type of the available data (Figure 21). The computerised representation of a hypothesised
pharmacophore (pharmacophore query) could be used to screen virtual compound libraries for
novel ligands, to filter conformer databases, e.g. output from molecular docking runs, for
biologically active conformations (MOE, v. 2014.0901).
Figure 21. Main approaches for generating pharmacophore queries depending on the input data.

78
A toxicophore concept overlaps with the understanding for pharmacophore and is defined as
the ensemble of steric and electronic features that is necessary to ensure the optimal
intermolecular interaction with a specific biological target molecule, which results in the
manifestation of a specific toxic effect (ENV/JM/MONO(2007)2). What is specific here is that
the substructural features (toxicophores) are particularly associated with toxicity by a specific
interaction and disruption of one or more subcellular components: (i) receptors; (ii) enzymes;
or (iii) macromolecules such as proteins and DNA. Moreover, it is accepted that a chemical
with a toxicophore could possess other toxicophores for the same or different toxicities, and it
might also contain a region involved in prevention of its toxicity (biophobe) (Combes, 2012).

79
2.2.3.2.Pharmacophore model development and validation
The pharmacophore was developed using the “Pharmacophore Query Editor” tool in MOE. The
set of query features was created from three main categories ligand annotation points that are
automatically detected in MOE (MOE, v. 2014.0901):
(i) atom annotations, located directly on an atom of a molecule and typically
indicating a function related to protein-ligand binding: the H-bond donor (Don),
the H-bond acceptor (Acc), cation (Cat), anion (Ani), metal ligator (ML) and
hydrophobic atom (HydA);
(ii) projected annotations, located along an implicit lone pair or implicit hydrogen
directions and used to annotate the location of possible partners for a hydrogen
bond or a metal ligation, or a possible R-group atom locations: projected donor
(Don2), projected acceptor (Acc2), projected metal ligator (ML2) and ring
projection (PiN);
(iii) centroid annotations (including bioisosteres), located at the geometric centre of a
subset of the atoms of a molecule: aromatic (Aro), pi-ring (PiR) and hydrophobic
(Hyd).
After selection of the annotation points that were relevant to the pharmacophore, they were
given a non-zero radius that encoded the permissible variation in the pharmacophore query’s
geometry. This extra parameter converted these points into query features.
The predictive power of the developed model was evaluated on the basis of four classes of
compounds (Table 5) and following the Cooper’s statistics (Table 6) (Gleeson et al., 2012;
ENV/JM/MONO(2007)2):
Table 5. Contingency table: TP – true positive, FN – false negative, FP – false positive, TN –
true negative. Adapted from Gleeson et al., 2012 and ENV/JM/MONO(2007)2.
Assigned class
Toxic Non-toxic Marginal totals
Observed
(in vivo)
class
Active TP FN TP + FN
Non-active FP TN FP + TN
Marginal totals TP + FP FN + TN TP + FP + FN + TN

80
Table 6. Definitions of the Cooper statistics. Adapted from Gleeson et al., 2012 and
ENV/JM/MONO(2007)2.
Statistic Formula Definition
Sensitivity
(True Positive rate) TP/(TP+FN)
fraction of active chemicals
correctly assigned
Specificity
(True Negative rate) TN/(TN+FP)
fraction of non-active chemicals
correctly assigned
Concordance or
Accuracy (TP+TN)/(TP+FP+TN+FN)
fraction of chemicals correctly
assigned
Positive Predictivity TP/(TP+FP)
fraction of chemicals correctly
assigned as active out of the active
assigned chemicals
Negative Predictivty TN/(TN+FN)
fraction of chemicals correctly
assigned as non-active out of the
non-active assigned chemicals
False Positive
(over-classification)
rate
FP/FP + TN
1-specificity
fraction of non-active chemicals
that are falsely assigned to be
active
False Negative
(under-classification)
rate
FN/TP + FN
1-sensitivity
fraction of active chemicals that
are falsely assigned to be non-
active

81
2.2.4. 3D QSAR (CoMSIA) modelling
2.2.4.1.CoMFA and CoMSIA approaches
The three-dimetional quantitative structure-activity relationship approach (3D QSAR) aims at
establishing a correlation between the variations in the biological activity and the 3D properties
of a series of structurally and biologically characterised molecules (Figure 22).
Figure 22. The spatial fingerprints of numerous field properties can be calculated at a lattice as
in the approaches related to CoMFA which use the changes in the shapes and strengths of the
non-covalent interaction fields (steric – S, electrostatic – E, etc.) surrounding the ligands (L1,
L2, etc.) to explain the differences in their biological activity (BA).
Preliminary pharmacophore modelling is a reasonable first step in such a study since generation
and alignment of bioactive molecular conformations is a prerequisite for robust and reliable
analysis. The aligned molecules are located in a cubic grid simulating the active site. There, the
gradual changes of the ligands’ interaction properties are mapped by evaluating the potential
energy at regularly spaced grid points surrounding the structures.

82
In the standard application of CoMFA, two potentials, namely, the steric potential as a Lennard-
Jones function and the electrostatic potential as a simple Coulomb function are used, providing
only the enthalpic contributions of the free energy (Höltje at al., 2004). Therefore, the CoMFA
approach bears several limitations:
(i) Entropic influences seem to be neglected or insufficiently covered as their
contributions to the binding affinity are more difficult to describe.
(ii) The steepness of Lennard-Jones potential close to the van der Waals surface
results in a dramatic change of the potential energy at the vicinal grid points.
(iii) The singularities at the atomic positions that the Lennard-Jones and Coulomb
potentials produce unacceptably large values. To overcome this problem, the
potential evaluations are performed within regions that are outside the molecules
and are restricted by arbitrarily fixed cutoff values. Since the two potentials (e.g.
Lennard-Jones and Coulomb) differ in their slopes, these cutoff values are
exceeded for the different terms at different distances from the molecules. Thus
the loss of information for one of the fields is inevitable during their additional
arbitrary adjustment for simultaneous evaluation (Figure 23).
(iv) The graphical representation is difficult to interpret since the resulting contour
maps are discontinuous due to the cutoff settings and the steepness of the
potentials close to the molecular surfaces.
A CoMSIA approach has been proposed to overcome these problems by:
(i) including entropic influences through a field, considering the differences in
hydrophobic surface contributions;
(ii) replacement of the Lennard-Jones and Coulomb potentials by a Gaussian-type
function (no singularities) so that no arbitrary definition of cutoff limits is required
and the indices can be calculated at all grid points (Figure 23).
In CoMSIA analysis, the comparison between all mutual pairs of molecules is indirectly
evaluated via the similarity of each molecule j of the data set with a common probe atom which
is systematically placed at the intersections (grid point q) of a regularly spaced surrounding
lattice (usually a grid spacing of 1 Å):

83
Eq. 13
where the similarity indices AF,k between the compounds of interest and the probe atom are
calculated on the basis of the summation index (i) over all atoms of the molecule j under
investigation; the actual value of the physicochemical property k of atom i (Wi,k); the probe
atom with charge +1, radius 1 Å, and hydrophobicity +1 (Wprohe,k); the attenuation factor (α);
and the mutual distance between the probe atom at grid point q and the atom i of the test
molecule (riq). Large values of α will result in a strong attenuation of the distance-dependent
consideration of molecular similarity.
The steric, electrostatic, hydrophobic, and hydrogen-bond donor and acceptor properties,
which are supposed to contribute mostly to the binding affinity, are used to calculate the fields
of similarity indices. For these properties, distance dependence, described by the significantly
smoothened Gaussian-type functional form, is equivalently handled. By analogy with the
CoMFA approach, the numerical data tables are subjected to a subsequent PLS analysis (Klebe,
1994; Klebe, 1998).
Figure 23. Comparison between the steeper slopes of the Lennard-Jones and Coulomb
potentials (CoMFA) and the smoother Gaussian function (CoMSIA), avoiding any singularities
and cutoff values. Adapted from Klebe (1998).
2
,,, )( iqr
ki
j
kprobe
q
kF ewwjA

84
2.2.4.2.PLS analysis to build 3D QSAR model – general considerations
PLS analysis is a multivariate statistical technique that is able to extract a weak signal dispersed
over many variables even when the number of similarity indices’ values exceeds the number of
compounds. This is possible because the various similarity indices are intercorrelated and many
are unrelated to biological activity (Figure 24) (Höltje at al., 2004).
Figure 24. Scheme of the PLS analysis principle: t – latent variables for the X block (Sij, Eij,
Hij, Aij, Dij – steric, electrostatic, hydrophobic, HB acceptor and HB donor field variables of
molecule i in the grid point j); u – latent variables for the Y block (BAi - logarithms of relative
affinities or other biological activities). The solid lines in X- and Y-space (the 3D plots) are the
principle components, and the dashed lines represent the PLS vectors. These are slightly skewed
to account for the correlation between the two data blocks. Adapted from Kubinyi, 1993, 1998.

85
Because of the multiple variables on which PLS operates, data over-fitting is expected. This
implies PLS models’ validation, which is performed by a “leave-one-out” (LOO)
crossvalidation (Figure 25).
Figure 25. Cross-validation procedure; PRESS = (yexp i – y pred i)2, where yexp i is the
experimental (observed) value of the dependent variable, and ypred i – the predicted value of the
dependent variable. Adapted from Kubinyi, 1993.

86
The procedure is also used to determine the optimal number of components. The latter suggests
that for each model, one of the compounds, in turn, is excluded from the modelling set and its
activity is predicted from the model developed without it. When each compound has been
predicted once, the observed and predicted potencies are used for the calculation of the qcv2
value (square of the cross-validated correlation coefficient) and the standard deviation of error
prediction value (SDEP, or SEP) according to the following equations:
Eq. 14
Eq. 15
where N = number of compounds, A = number of components, (Kubinyi, 1993; Höltje at al.,
2004).
The optimal number of components Nopt is determined by selecting the smallest SEP and the
biggest q2cv and is subsequently used to derive the final regression 3D QSAR model,
characterised by r2pred (Kubinyi, 1993):
Eq. 16
where
= experimental (observed) biological activity of the test set
= predicted biological activity of the test set
= mean value of the experimental (observed) biological activity in the training set
The sensitivity of the model to chance correlations can be additionally investigated by a Y-
randomisation test and by progressive scrambling. In Y-randomisation the best QSAR model
is derived on the basis of randomly permuted target activity values, leaving the X-space
untouched and preserving the original descriptor selection procedure.
i
mean
cvyy
PRESSq
i
2
exp
2
)(1
1
AN
PRESSSEP
2
expexp
2
exp2
)(
)(1
traintest
testtest
pred
predyy
yyr
test
predy
testyexp
trainyexp

87
By repeatedly performing this procedure, an array of models is generated with a lower quality
standing from the deliberately destroyed structure-activity relationship (Wold and Eriksson,
1995; Baumann et al., 2004). In the progressive scrambling, however, a range of small
perturbations is introduced into the Y-space of the model by the scrambling of the responses
only within quantiles rather than across the full range (Clark et al., 2001). The statistical
parameter used for evaluating the robustness and the predictivity of the PLS model are
summarised in Table 7:
Table 7. General statistical parameters related to progressive scrambling analysis
Parameter Description
Q2
The predictivity of the model after potential effects of redundancy have been
removed, i.e. the expected value of q2 at the specified critical point for r2yy' (the
correlation of the scrambled responses with the unperturbed data)
cSDEP The estimated cross-validated standard error at the specified critical point
dq/dr
The slope of q2 – the cross-validated correlation coefficient evaluated at the
specified critical point with respect to the correlation of the original dependent
variables versus the perturbed dependent variables

88
2.2.4.3.CoMSIA model development
2.2.4.3.1. Alignment of structures and calculation of fields
The spatial alignment of the structures (170 compounds as described in Section 2.2.1.2.) was
performed using their docking poses in the PPARγ ligand binding domain that were obtained
in a VS procedure developed within this study (Section 4.3.4.2.) and the experimental bioactive
conformers for the ligands extracted from the PDB complexes. Visual inspection against the
template structure and consideration of the docking score (the smallest negative scores
preferred) were the criteria driving the final conformer selection for each ligand out of 10 best
poses selected after its docking. The template was either the corresponding PDB ligand used as
a scaffold in the structure generation or the ligand UNT from 3IA6 PDB complex. The latter
was considered appropriate, in view of its high potency (pEC50 = 7.886) and relative efficacy
(103%), as well as its representativeness with respect to the typical for the full agonists
structural features (Casimiro-Garcia et al, 2009; Mahindroo et al., 2005). The alignment of the
whole set against the ligand UNT (3IA6 PDB complex) was performed based on substructures
that fit to the 4 feature PPAR pharmacophore model described in Section 3.3.4.1. (Tsakovska
et al., 2014) and using the “Fit Atoms” procedure in MM software suite SYBYL-X v. 2.1
(Certara USA, Inc.) The aligned structures were subjected to 3D QSAR modelling, using the
CoMSIA (Comparative Molecular Similarity Indices Analysis) approach within SYBYL. The
electrostatic, steric, hydrogen bond donor, hydrogen bond acceptor, and hydrophobic fields
were calculated using the default CoMSIA settings.

89
2.2.4.3.2. Model development and validation
In order to establish a correlation between the ligands’ potency (pEC50) and the similarity
indices for the calculated fields, structures were split into a training set used to build multiple
CoMSIA models and a test set to externally validate the best one. The PLS was used in the
CoMSIA modelling and a Leave-One-Out (LOO) cross-validation analysis was performed for
evaluating the models’ robustness. The best model was selected based on the following
statistical characteristics: cross-validated correlation coefficient, q2cv; optimal number of PLS
components, Nopt; and cross-validated standard error of prediction, SEPcv. The non-cross-
validated model (characterised by the correlation coefficient, r2, standard error of estimate, SEE,
and the F-value) was obtained for the best cross-validated model with Nopt, followed by external
validation by prediction of the pEC50 values of a predefined test set of full agonists and
calculation of the predictive r2 (r2pr). Two categories of compounds were excluded from the set
of 170 agonists: (i) applicability domain outliers, identified with the "extent of extrapolation"
approach (Tropsha et al., 2003; Netzeva et al., 2005) as implemented in Enalos domain leverage
node (Melagraki et al., 2009) in the KNIME analytics platform (Berthold et al., 2007) and (ii)
response outliers, identified in the analysis of residuals.

90
2.2.5. Docking procedure
2.2.5.1.Docking – general view
Docking is a structure-based method that allows for a precise calculation of the position and
orientation of a potential ligand in a receptor-binding site and for prediction of the free energy
of binding. The docking algorithm within MOE (MOE, v. 2014.0901) involves several stages,
as shown in Figure 26.
Figure 26. Stages in the docking algorithm (adapted from MOE, v. 2014.0901)

91
First, an array of conformations is generated by applying a collection of preferred torsion angles
to the rotatable bonds. No alternation is induced regarding either the bonds’ lengths and angles,
or the geometry of the rings. Then, a placement of the generated conformers is performed,
which results in a collection of poses with characteristic scores, assigned by the applied
placement method. Several methods can be used for pose rescoring with the general
understanding that the good poses are supposed to receive low scores. The refinement of the
poses follows two possible methods based on either an explicit molecular mechanics force field
or a grid-based energetics. A pharmacophore constrain may be applied to the final poses, which
requires the selection of the pharmacophore placement method. When the ligand is placed using
pharmacophore’s features, volume constraints are applied as a final filter but are ignored during
the placement stage. The latter is characterised by the following assumptions:
(i) If there are more than two pharmacophore features and they do not lie on or close
to a straight line, the pharmacophore search engine is used to orient the ligand.
(ii) If the pharmacophore features lie on or very close to a line, the ligand is anchored
by the pharmacophore features and rotated in such a way that a third atom matches
an alpha site point.
(iii) If all pharmacophore features lie at a point or very close to one point, the ligand is
first anchored at that point. Then, two more atoms on the ligand are matched to
two alpha site points to orient the ligand.
(iv) Since the ligand pose changes upon refinement, if there is a refinement stage, the
pharmacophore constraints are loosened for placement.
(v) If a pharmacophore search returns too few hits, the pharmacophore constraints are
further loosened so that more hits are obtained.
Finally, several alternative scoring schemes are provided to rescore the resulted poses. The
assignment of reliable docking scores is crucial for the overall docking algorithm (MOE, v.
2014.0901). The scoring functions are expected to reflect the binding free energies driving the
complex formation in order to guarantee the correct prediction of the biological activity.
Generally, there are three main groups of scoring functions: empirical scoring functions, force
field based functions and knowledge-based potential of mean force.

92
In VS the scoring functions are used: (i) as a fitness function in the optimisation placement of
the ligand during the docking process; (ii) as criteria for ranking the output poses after docking
is completed. Different functions could be applied for the two purposes, although one and the
same is usually utilised (Höltje at al., 2004). One example is the London dG scoring function,
which estimates the free energy of binding of the ligand from a given pose by summing several
terms:
Eq. 17
where c represents the average gain/loss of rotational and translational entropy; Eflex is the
energy due to the loss of flexibility of the ligand (calculated from ligand topology only); fHB
measures geometric imperfections of hydrogen bonds and takes a value in [0,1]; cHB is the
energy of an ideal hydrogen bond; fM measures geometric imperfections of metal ligations and
takes a value in [0,1]; cM is the energy of an ideal metal ligation; and Di is the desolvation energy
of atom i. The difference in desolvation energies is calculated according to the formula:
Eq. 18
where A and B are the protein and/or ligand volumes with atom i belonging to volume B; Ri is
the solvation radius of atom i (taken as the OPLS-AA van der Waals sigma parameter plus 0.5
Å); and ci is the desolvation coefficient of atom i. The coefficients {c,cHB,cM,ci} are fitted from
~400 x-ray crystal structures of protein-ligand complexes with available experimental pKi data.
Atoms are categorised into about a dozen atom types for the assignment of the ci coefficients.
The triple integrals are approximated using Generalized Born integral formulas (MOE, v.
2014.0901).
atomsi
iM
ligm
MHB
bondsh
HBflex DfcfcEcG
BuBAu
iii duuduuRcD663

93
2.2.5.2.Docking in the ligand-binding domain of PPARγ
The ligands (structures prepared according Section 2.2.1.2.) were docked into the binding site
of the prepared protein structure. The binding pocket of the receptor was specified by using the
atoms of the co-crystallised ligand (BRL, or rosiglitazone) of the used PDB complex (PDB ID
1FM6). The virtual screening protocol was applied with a placement method based on a
pharmacophore. Then, a rescoring with London dG scoring function was applied to score the
poses of the docked ligands (MOE, v. 2014.0901) without subsequent refinement and second
rescoring. The highly scored poses of each ligand with a negative value of the scoring function
only were kept (Figure 27).
Figure 27. Settings for the docking procedure

94
CHAPTER 3. RESULTS AND DISCUSSION
3.1. Prosteatotic AOPs
3.1.1. Data harvesting and analysis
Experimental data from studies on hepatocytes and adipocytes were collected and analysed to
investigate the possible relationship between PPARγ ligand binding and the development of
NAFLD. This involved screening and ranking of more than 300 papers retrieved from NIH
PubMed system (http://www.ncbi.nlm.nih.gov/pubmed) according to the following criteria:
(i) completeness in the description of the model system: type of experiment (in vivo
or in vitro), species or cell line used, and genetic properties of the studied subjects
which could support a causal link between the MIE and the adverse outcome;
(ii) relevance of the presented experimental evidence to the link KE-AO: availability
of qualitative/quantitative data underlining biochemical and histological markers
of NAFLD;
(iii) relevance of the presented experimental evidence to the link MIE-KE: availability
of qualitative/quantitative data related to the PPARγ-dependent changes in the
levels of already identified biochemical and/or histological NAFLD markers;
(iv) availability of appropriate experimental systems approximating the chemical
initiation step: experimentally-induced (by diet, pharmacological treatment, or
genetic techniques) changes in PPARγ activity and/or expression.
The core set of literature sources was selected based on the availability of information for at
least two of the pillars within an AOP, e.g. MIE, intermediate KE and AO, and experimental
evidence for their relationship, qualitative or quantitative. This initial pool was further extended
by an additional more specific literature search on the causal link between PPARγ
dysregulation, the levels of its target proteins, and their corresponding toxicity pathways. The
final set of 72 papers, among which 26 are reviews, is organised in several categories (Table
S.2., Appendix A. Supplementary Material) in relation to the studied subjects (human
patients, human cell cultures, animals in vivo, and animal cell cultures) and the experimental
approaches (PPARγ overexpression, PPARγ overexpression and pharmacological treatment;
PPARγ knockout/knockdown; PPARγ knockout/knockdown and pharmacological treatment;

95
pharmacological treatment; diet manipulation; gene manipulation of PPARγ upstream proteins;
gene manipulation of PPARγ upstream proteins and pharmacological treatment). The papers
dealing with the AOP methodology, reviews, and research articles containing background
information (receptor structure, up- and downstream proteins’ functions, etc.) are given in the
last two columns of the table. Figure 28 summarises the data in Supplementary table S.3. The
analysis of the selected papers served as a basis for building the blocks in the proposed AOPs.
Figure 28. Major categories of (a) subjects and (b) experimental approaches in the selected
papers.

96
3.1.2. Description of the AOPs
Collecting scientific evidence for the relationship between PPARγ signaling and NAFLD was
the first step in the development of AOP. The involvement of the receptor in this pathology has
been well studied (Lee et al., 2012; He et al., 2011; Videla and Pettinelli, 2012; Nagasaka et al.,
2012; Matsusue, 2012; Okumura, 2011). In vitro and in vivo animal data supporting the role of
hepatic PPARγ in the regulation of target lipogenic genes and triglycerides’ levels was collected
from different experimental settings: receptor overexpression and/or activation, liver-specific
knockout/knockdown of the PPARγ gene. While receptor suppression in liver had been shown
to correlate with reduced target genes’ expression and lowered levels of NAFLD biomarkers,
severe liver steatosis and hepatocyte proliferation had been linked to PPARγ upregulation (Lee
et al., 2012; Morán-Salvador et al., 2011; Satoh et al., 2013; Yamazaki et al., 2011; Panasyuk
et al., 2012). In the present study, data on PPARγ gene nucleotide variations affecting hepatic
steatosis, and causing partial lipodystrophy was also considered as strong evidence for the
relevance of the receptor to the considered adverse effect (Costa et al., 2010; Semple et al.,
2006). AOP development implied analysis of three domains of knowledge by:
(i) identification of the chemical space – known chemical initiators or chemical
classes reported as prosteatotic;
(ii) analysis of the MIE: qualitative – by defining the mechanism, the site of action at
molecular and higher levels, the key interactions involved; and quantitative –
through establishing relationship between the structures of the chemical initiators
and the experimental data from in vitro model system of the MIE;
(iii) characterisation of the AO, e.g. biomarkers at molecular, cellular, tissue, organ
and system levels that are relevant to the MIE and the pathology.
On the basis of the collected evidence, the group of the PPARγ full agonists was outlined as
prosteatotic and represents the applicability domain of the in silico studies discussed later.
Further, two sites of action were considered with different MIEs, respectively – PPARγ
inhibition in adipocytes and activation in hepatocytes (Al Sharif et al., 2014). Therefore, the
two described AOPs include tissue-specific key events related to pathology-relevant
biomarkers (Figure 29).

97
Figure 29. Proposed AOPs from tissue-specific ligand-dependent PPARγ dysregulation to
NAFLD: LDAPs – lipid droplet associated proteins; FAT/UPs – fatty acid transport/uptake
related proteins; TGSEs – triglyceride synthesising enzymes; FASEs – fatty acid synthesising
enzymes; FSP27/CIDE-C – fat-specific protein 27/cell death-inducing DFF45-like effector;
Plin 1, 2, 4 – Perilipins 1, 2, and 4; ApoCIV – apolipoprotein C IV; aP2 – adipose fatty acid
binding protein; FAT/CD36 (or just CD36) – fatty acid translocase/cluster determinant 36; FAS
– fatty acid synthase; ACC – acetyl-CoA carboxylase; SCD1 – stearoyl-CoA desaturase1;
MGAT1 – monoacylglycerol O-acyltransferase 1; DGAT1 – diglyceride acyltransferase 1;
DGAT2 – diglyceride acyltransferase 2; ADIPOQ – adiponectin; HCC – hepatocellular
carcinoma.

98
3.1.2.1.PPARγ Ligand-Dependent Activation in Hepatocytes
For the proposed AOP initiating with PPARγ activation, the rationale behind the selection of
the corresponding MIE lies on the reports of prosteatotic effects of PPARγ agonists (synthetic:
rosiglitazone and pioglitazone; endogenous: palmitate, oleate, eicosanoids) and/or liver PPARγ
overexpression models (Lee et al., 2012; Morán-Salvador et al., 2011; Videla and Pettinelli,
2012; Okumura, 2011; Maciejewska et al., 2015) as well as the anti-steatotic effects of PPARγ
antagonists (BADGE, GW9662), hepatocyte-specific PPARγ knockout/knockdown (Sos et al.,
2011; Okumura, 2011), or PPARγ downregulation (He et al., 2015). Although small molecules
are the principle initiators of the AOP, studies on PPARγ expression levels were considered as
appropriate as the ligand-induced activation of the receptor correlates with qualitative
estimations of NAFLD biomarkers. This is justified by the fact that PPARγ is subjected to
positive feed-back regulation (Ratushny et al., 2012; Wakabayashi et al., 2009), thus agonist-
triggered induction of its own expression is an expected element of the effectuation chain and
causes signal amplification.
The toxicity pathways identified within this AOP involve increased synthesis of proteins,
responsible for fatty acids’:
(i) uptake – lipid transport/binding proteins ApoCIV, aP2, Caveolin 1, FAT/CD36
(Zhu et al., 2011; Lee et al., 2012; Morán-Salvador et al., 2011; Satoh et al., 2013;
Yamazaki et al., 2011; Sos et al., 2011; Li et al., 2013; Kumadaki et al., 2011;
Gaemers et al., 2011; Larter et al., 2009; Bai et al., 2011; Kim et al., 2008; Larter
et al., 2008);
(ii) de novo synthesis – the enzymes FAS, ACC, SCD1;
(iii) esterification – the enzymes MGAT1, DGAT1, DGAT2 (Lee et al., 2012; Morán-
Salvador et al., 2011; Li et al., 2013; Kumadaki et al., 2011; Larter et al., 2009);
(iv) storage – the lipid droplet associated proteins FSP27/ CIDE-C, Plins (1, 2, 4),
Caveolin 1 (Li et al., 2013; He at al., 2011; Matsusue, 2012; Flach et al., 2011;
Matsusue, 2010; Bai et al., 2011).
Among the target proteins whose upregulation is relevant to the liver AOP, the most completely
characterised were selected for further data summation and analysis. Thus quantitative data was
collected for one lipid droplet associated protein (FSP27) and two proteins related to fatty acid
uptake and intracellular transport (CD36 and aP2), regarding their expression levels in different

99
experimental conditions supporting the MIE (Section 3.1.3.). Further, the relevance of CD36
to the AOP was placed in the focus of a detailed analysis.
The FA translocase/cluster determinant 36 (FAT/CD36) protein, from the class B scavenger
receptor family, is involved in the uptake of oxidised low-density lipoproteins (in macrophages)
and fatty acids (in adipocytes, skeletal and heart myocytes). It is well known that the three main
membrane structures where CD36 is incorporated are the cell surface caveolae, the intracellular
vesicles and the mitochondria. The last is the place of interaction between CD36 and carnitine
palmitoyl transferase 1, the key enzyme regulating mitochondrial fatty acids transport and
oxidation. Mitochondrial CD36 content has been shown to correlate with mitochondrial fatty
acids oxidation in human muscle and to increase upon rosiglitazone treatment (Ring et al., 2006;
Ehehalt et al., 2008; Su and Abumrad, 2009). On the other hand, the relocalisation of CD36
from mitochondria to the cellular membrane is among the mechanisms driving the shift from
normal to insulin resistant myocytes through excessive fatty acids uptake (Glatz, 2015). It is
possible, therefore, for PPARγ full agonists to affect the prosteatotic CD36 localisation in, or
redirection toward the cell membrane by elevating its expression levels in hepatocytes.
Furthermore, possible implication of plasma soluble CD36 as a new biomarker of insulin
resistance, carotid atherosclerosis, and fatty liver has been suggested (Handberg et al., 2012).
A study involving two hundred and twenty-seven NAFLD and eighty-five patients with a
histologically normal liver supported the increased serum sCD36 as an independent factor
associated with advanced steatosis in NAFLD with a significant correlation between hepatic
CD36 and serum sCD36 levels (García-Monzón et al., 2014). The relevance of CD36 is further
increased in view of the multiple transcriptional regulators of the translocase, such as cytosolic
aryl hydrocarbon receptor (AhR), pregnane X receptor (PXR), liver X receptor (LXR), and
PPARγ (He et al., 2011).
Although PPARγ-mediated elevation of CD36 mRNA and protein levels has been clearly
related to the adipogenic transformation of liver and exacerbation of steatosis (Zhu et al., 2011;
Yamazaki et al., 2011; Larter et al., 2008), consideration of the alternative mechanisms and the
extent to which they may distract from the postulated AOP is required for the complete AOP
assessment (ENV/JM/MONO(2013)6). Generally, the dysregulation of each of the outlined
nuclear receptors can affect the CD36 expression. Moreover, PXR is known as a transcriptional
regulator of PPARγ, while PPARγ and LXR regulate their expressions reciprocally (Chawla et
al., 2001; Geng et al., 2015).

100
While AOP networking could reflect such cross-relations, the asymmetric positive feed-back
activation that is characteristic for each one of these receptors is neglected by definition. The
role of CD36 hepatic overexpression in linking the AOP anchors – PPARγ dysregulation and
NAFLD is justified by the growing scientific evidence for these relationships (Table 8).

101
Table 8. Main findings extracted from selected scientific papers supporting the prosteatogenic role of FAT/CD36 in the AOP from PPARγ
dysregulation to NAFLD. Legend: Bold, in vitro experiments; CD, control diet; HFD, high-fat diet; endpoints: empty cells, endpoint not
determined; +, increase; −, decrease; 0, no effect; 1, controls taken for 100%; 0/+ and 0/− are used in cases where a clear-cut decision about the
reported effects could not be made
Species PPARγ related strain
characteristics Diet
Experiment
type
Gene
manipulation
Pharmacological treatment Endpoints
Ref agent type PPARγ CD36
NAFLD
biomarkers
human NASH patients + + Zhu et
al., 2011
mouse
wild type HFD + +
Le et al.,
2012
liver PPARγ deficient line HFD 0 0
wild type CD PPARγ
transfected + + +
liver PPARγ deficient line CD PPARγ
transfected + + +
mouse
hepatocytes PPARγ
transfected
+ + +
rosiglitazone synthetic agonist + ++ ++
palmitate endogenous
metabolite + ++ ++

102
mouse
functional PPARγ HFD + + +
Morán-
Salvador
et al.,
2011
PPARγ knockout HFD 0/+ 0/+ 0/+
mouse
functional PPARγ
tissue slices
oleic acid endogenous agonist +
functional PPARγ rosiglitazone synthetic agonist +
PPARγ knockout oleic acid endogenous agonist 0
PPARγ knockout rosiglitazone synthetic agonist 0
functional PPARγ
hepatocytes
BADGE synthetic antagonist –
functional PPARγ oleic acid +
BADGE
endogenous agonist
+
synthetic antagonist
0/+
mouse
Insulin-resistant mice CD + + + Satoh et
al., 2013 control mice CD pioglitazone synthetic agonist 0
Insulin-resistant mice CD pioglitazone synthetic agonist 0 + ++
mouse
wild type HFD -
safflower oil 0/+ 0 0/+
Yamazaki
et al.,
2011
wild type HFD - butter + + +
wild type HFD -
safflower oil
PPARγ2
knockdown + 0/+ 0/+
wild type HFD - butter PPARγ2
knockdown + 0/+ 0/+
wild type CD PPARγ
transfected + + +

103
mouse
JAK2L-thyrosine kinase
deficient CD + ++ ++
Sos et al.,
2011 wild type CD GW9662 synthetic antagonist 0 0 0
JAK2L-thyrosine kinase
deficient CD GW9662 synthetic antagonist + + +
mouse
liver SMS2-
overexpressing
transgenic line
CD + 0/+
Li et al.,
2013
lSMS2-deficient
knockout line CD – 0/–
wild type HFD 1 1 +
liver SMS2-
overexpressing
transgenic line
HFD + + ++
lSMS2-deficient
knockout line HFD – – –
liver SMS2-
overexpressing
transgenic line
HFD GW9662 synthetic antagonist –
human
huh7
hepatoma
cells
ceramide endogenous
suppressor – –

104
mouse
wild type CD
Fbw7
knockdown + + ++
Kumadak
i et al,
2011
wild type CD
Fbw7/PPARγ
2 double
knockdown
0/– 0/+ +
wild type CD
Fbw7
transfected – – 0/–
mouse wild type hepatocytes Fbw7
knockdown + + +
mouse
wild type HFD + + + Gaemers
et al.,
2011 wild type
HFD, liquid,
overfeeding ++ ++ ++
mouse
wild type HFD 0/+ 0/+ 0/+
Larter et
al., 2009
obese,
hypercholesterolemic,
diabetic foz/foz mice
CD
+ + 0/+
obese,
hypercholesterolemic,
diabetic foz/foz mice
HFD + ++ +

105
The proposed mechanism of the CD36 mediated toxicity pathway is illustrated in Figure 30
and involves the following steps: gene transcription is suppressed by corepressor binding to the
PPARγ-RXRα heterodimer in the absence of PPARγ agonists (1); ligand-induced
conformational changes lead to receptor activation, corepressor release and coactivator
recruitment necessary for transcription initiation (2); CD36 overexpression and translocation to
the plasma membrane markedly increase the hepatic uptake and esterification of free fatty acids
(3–6), resulting in excessive and ectopic TG storage in lipid droplets (7).
Figure 30. Model of ligand-dependent PPARγ activation as a potential MIE for liver steatosis
through CD36 mediated excessive FA uptake and consequent hepatic TG accumulation.
(1) PPARγ-RXRα heterodimer interacting with the PPARγ response elements (PPRE-N-PPRE)
and transcriptional corepressor complex; (2) ligand-activated PPARγ-RXRα heterodimer with
a transcriptional coactivator complex and RNA polymerase II; (3) rough endoplasmic
reticulum; (4) Golgi complex; (5) FAT/CD36; (6) plasma fatty acid binding protein (in blue)
carrying fatty acid (in orange); (7) growing lipid droplet storing triglycerides and coated with
LD associated proteins; (8) mitochondria; (9) bile canaliculus.

106
Defining uncertainties, inconsistencies and data gaps is another criterion for evaluating the
confidence in AOP, in particular for the assessment of key events. In the case with the long-
chain FAs transmembrane passage, the earlier hypothesis suggested the cooperative action of
two proteins: FABPpm (plasma membrane fatty acid binding protein) – the receptor that
facilitates the diffusion of the fatty acid-albumin complex through the unstirred fluid layer, and
FAT/CD36 – mediating the fatty acids flip-flop across the bilayer (Chabowski et al., 2007).
Later, real-time fluorescence measurements questioned the classification of CD36 as a simple
transporter since a mechanism based on rate increase of fatty acids incorporation intoTGs
instead of catalysing their translocation across the plasma membrane was proposed. However,
the relevance of CD36 for TG accumulation is out of debate, since a study on HEK293 cells
overexpressing CD36 has shown the uptake-mediated accumulation of more and larger LDs
(Xu et al., 2013).
One of the central elements in the AOP concept is directing the design of alternative risk
assessment strategy by suggesting reliable in vitro and/or in silico predictive models for each
key event along the pathway. On the basis of the collected scientific evidence for the CD36-
mediated fatty acids uptake, measuring the chemical-induced changes in the levels of CD36
(mRNA and/or protein) in cultured hepatocytes can be used in in vitro screening for prosteatotic
compounds. However, AOP quantification is necessary in order to estimate the dose-response
cutoffs relevant to a real exposure scenario.
Cumulatively, the toxicity pathways involving increased fatty acids’ uptake, synthesis,
esterification, and storage in lipid droplets lead to an increased number or size of the lipid
droplets, e.g. microvesicular or macrovesicular steatosis (Lee et al., 2012; Satoh et al., 2013;
Yamazaki et al., 2011; Sos et al., 2011). Among the organ responses of the excessive fat
deposition is the significant hepatomegaly (Sos et al., 2011; Li et al., 2013; Kumadaki et al.,
2011). The lipid droplets, which are central histological markers of the disease, are
metabolically active organelles involved in the cellular homeostasis, rather than only lipid
storage depots in the state of hyperlipidemic stress (Manteiga et al., 2013; Guo et al., 2009). A
shift toward lipolysis of the content of overloaded lipid droplets induces lipotoxicity which is a
prerequisite for the inflammation characteristic for NASH (Sos et al., 2011; Gaemers et al.,
2011). Predicting the progression from NAFLD to NASH is another key aspect of
understanding the severity of the pathology and its driving molecular mechanisms.

107
Recently, Yamada et al. (2015) have examined one hundred and three patients diagnosed with
NAFLD (simple steatosis: 63, NASH: 40) and reported differential gene expression when
comparing the two groups of patients, outlining the progression from simple steatosis to NASH.
In particular, increased expression of PPARγ and its target proteins – SCD1 and FAS correlated
significantly with the hepatocellular ballooning score. The correlation between the lobular
inflammation score and SCD1 levels has also been shown to be significant with a rise in the
gene expression during the progress of inflammation in the liver tissue.
Such studies underline the necessity of further monitoring and evaluation of the individual
levels of multiple target proteins in pursuit of the biomarkers that are specific to separate stages
of the disease development.

108
3.1.2.2.PPARγ Ligand-Dependent Inhibition in Adipocytes
The developed adipose tissue AOP initiated with PPARγ inhibition is supported by a growing
body of evidence that points toward the relevance of this MIE to the considered adverse effect
(Figure 29). The receptor, whose isoform 2 is predominantly expressed in the adipocytes, is
claimed to be a master regulator of adipogenesis (at the stage of terminal differentiation) as it
is necessary (Barak et al., 1999; Kubota et al., 1999; Rosen et al., 1999) and sufficient
(Tontonoz et al., 1994; Hu et al., 1995; Shao and Lazar, 1997) for establishing the adipocyte
phenotype, by regulating the levels of particular metabolic genes and adipokines (Hwang et al.,
1997; Rosen and MacDougald, 2006; Lefterova and Lazar, 2009). The role of PPARγ ligands
in the regulation of fatty acid uptake into adipocytes and adipocyte differentiation has been
shown for thiazolidinediones and other insulin-sensitising agents that are potent receptor’s
agonists (Grossman and Lessem, 1997). Such lipid sequestration into the adipose tissue lowers
the circulating levels of triglycerides and free fatty acids, thus preventing the excessive hepatic
lipid uptake and the secondary lipotoxicity in the liver (Rogue et al., 2010; Musso et al., 2009;
Park CY and Park SW, 2012). Ligand-induced reduction in adipogenesis and lipid accumulation
has been observed in experiments on 3T3-L1 preadipocytes involving cyclic phosphatidic acid,
a highly specific endogenous PPARγ antagonist (Tsukahara et al., 2010), and scoparone – a
PPARγ inhibitor that has been reported to suppress the rosiglitazone-mediated overexpression
of its target genes to a level near the one observed in cells treated with GW9662 (Noh et al.,
2013).
The effects observed upon PPARγ loss of function strongly support the relevance of the tissue-
specific receptor’s suppression for the selected adverse outcome since naturally occurring
mutations in human PPARγ-coding sequence have been found to cause lipodystrophy.
Cumulating data have been reviewed, supporting the axis PPARγ-deficiency/knockout –
impaired adipogenesis as well as its significance for the subsequent elevated levels of plasma
free FAs and TGs, and decreased plasma leptin and adiponectin levels, leading to lipodystrophy,
insulin resistance and hypotension (Azhar, 2010). The lowered lipid storage capacity due to
underdevelopment of adipose tissue has been shown to induce deposition of TG and acyl-CoA
in insulin-sensitive tissues, causing not only insulin resistance but often hepatosteatosis (Virtue
et al., 2010; Semple et al., 2006). The prosteatotic impairment of the normal function of the
adipose tissue has been evidenced by experiments involving adipose tissue loss in JAK2L mice
(Sos et al., 2011) and in mouse models of severe lipodystrophy (He at al., 2013; Chen et al.,

109
2012). On the contrary, the application of antisense oligonucleotide targeting a suppressor of
the PPARγ activation (drosophila tribbles homologue 3) has been reported as a PPARγ-
dependent mechanism for improving insulin sensitivity through increasing the white adipose
tissue mass by 70%. The primary role of PPARγ has been additionally verified by cotreatment
with its antagonist (BADGE), reversing the observed effects (Weismann et al., 2011).
The decreased expression of adiponectin is among the key events outlined within this AOP,
based on findings that hypoadiponectinemia is strongly associated with a decreased PPARγ
expression in adipocytes, development of hepatic steatosis and insulin resistance in obese
adolescents. In particular, adiponectin and PPARγ2 expressions have been reported to correlate
positively and an inverse relationship has been shown between the adiponectin plasma levels
and the hepatic fat content (Kursawe et al., 2010). The massive fat redistribution toward liver
due to reduced adiponectin secretion has been confirmed by experiments with foz/foz mice
(Larter et al., 2009). As for the strength of the relationship between the MIE and the adiponectin
downregulation – the link is supported by studies on the 4-hydroxynonenal-induced activation
and upregulation of PPARγ in parallel with the increased adiponectin gene expression both
suppressed by T0070907 treatment (PPARγ antagonist) (Wang et al., 2012) as well as the
stimulating effects of the eicosapentaenoic acid and its metabolite 15d-PGJ3 on the
adiponectin’s secretion in 3T3-L1 adipocytes, claimed to be partially mediated by PPARγ
(Lefils-Lacourtablaise et al., 2013).
These effects find their mechanistical explanation in the fact that adiponectin is a hormone
known to be exclusively expressed in adipocytes and to influence liver lipid metabolism
through its hepatic adiponectin receptors 1 and 2 (also PPARγ-regulated proteins). Upon lack
of adiponectin, an impaired hepatic β-oxidation of fatty acids is expected by lowered activation
of PPARα and AMPK (5'-adenosine monophosphate-activated protein kinase). Normally,
adiponectin regulates the AMPK phosphorylation, necessary for the reduction of malonyl-CoA-
mediated inhibition of β-oxidation and for lowering the triglyceride synthesis via suppression
of SREBP-1 (Sterol regulatory element-binding protein-1) (Anderson and Borlak, 2008).
Decreased PPARγ transactivation activity is also the mechanism involved in the reduced
expression of lipid-droplet associated proteins as well as of important transporters in the
adipocytes. The remodeling of the lipid droplets (fragmentation, shrinkage, expansion, and/or
fusion) is governed by their protein composition. The same holds true for the metabolism of

110
their lipid contents since lowered levels of some PPARγ targets (FSP27/CIDEC and Plin1) are
known to drive the increased lipolysis and release of free fatty acids from the adipocytes to the
circulation – a prerequisite for insulin resistance and abnormal hepatic lipid deposition
(Manteiga et al., 2013; Lefils-Lacourtablaise et al., 2013).
The role of the fatty acids’ uptake/transport is outlined by several studies on compounds
(scoparone and extracts from Zanthoxylum piperitum DC and Petalonia binghamiae thalli) and
microorganisms (lactic acid bacteria isolated from Korean pickled fish) suppressing in vitro
adipocytes differentiation and accumulation of triglycerides by lowering the expression of
PPARγ (Gwon et al., 2012; Patk et al., 2013) and its target proteins aP2 and CD36/FAT (Noh
et al., 2013; Kang et al., 2010; Patk et al., 2013). Nuclear factor erythroid 2-related factor 2 has
been shown to suppress lipid accumulation in white adipose tissue and adipogenesis as well as
to induce insulin resistance and hepatic steatosis in Lep (ob/ob) mice. It has been related to the
downregulation of PPARγ and aP2 in mouse embryonic fibroblasts (Xu et al., 2012).
Inflammatory and immune responses, in particular NFkB-mediated ones, are among the cellular
processes under the transrepressive PPARγ control by: (i) direct interaction with NFkB,
preventing its binding to specific responsive elements on target genes; (ii) competing for
common coactivators; or (iii) blocking the pro-inflammatory stimulus-induced clearance of
corepressor complexes on target genes (Luconi et al., 2010; Rogue et al., 2010; Liao et al.,
2012). PPARγ activation by resolvin D1 in lung and by bezafibrate in white adipose tissue has
been shown to mediate their anti-inflammatory effects (Liao et al., 2012; Magliano et al., 2013).
The transition from steatosis to NASH is claimed to coincide with major changes in adipose
tissue. A relationship between its metabolic function and inflammatory state has been shown in
overfeeding mouse models of NAFLD. The increased expression of inflammation markers and
the lowered PPARγ, adiponectin, CD36 and aP2 expression in white adipose tissue have been
reported as strong evidence supporting the understanding that chronic inflammation, increased
cytokine production and altered adipokine secretion of white adipose tissue as well as its
decreased lipid storage capacity and increased lipid outflow are the driving mechanism behind
the metabolic changes and the lipotoxicity in peripheral tissues/organs (Gaemers et al., 2011).
Decreased adiponectin secretion and increased free fatty acids’ redistribution toward the liver
have been outlined as key events bridging the possible toxicity pathways in the adipocytes and
the final outcome in the liver. The elevated hepatic lipid uptake, impaired mitochondrial
oxidation and increased synthesis of fatty acids cumulatively leads to excessive triglyceride

111
accumulation and is a prerequisite for hepatocellular injury associated with hepatic lipotoxicity
(Anderson and Borlak, 2008; Neuschwander-Tetri, 2010), oxidative stress and inflammation
observed in NASH (Serviddio et al., 2013).

112
3.1.3. Evaluation of the hepatic AOP
A weight-of-evidence was performed for the hepatic AOP, based on two main criteria: (i) the
extent of development of the assay supporting a given event and (ii) the relationship between
the AOP anchor points MIE-KEs-AO. The following key events within the hepatic AOP were
analysed (Appendix B.AOP evaluation table):
(i) MIE
(ii) LD associated proteins
(iii) FA transport proteins
(iv) increased FA uptake
(v) increased TG storage
(vi) increased number or size of LD
(vii) NAFLD at tissue and organ level
According to the performed analysis, the most applied assays reflect mRNA and protein levels
of PPARγ and its targets, histological markers of NAFLD, hepatic TG content, organ effects
and serum levels of markers for liver injury. It is important to note that variations in gene
expression are often supported by biochemical or histological confirmation of their relevance
to the apical endpoint. Most of the assays (Figure 31) are not only robust and reliable methods
published in the peer-reviewed literature but also in a form that could allow them to be
submitted for prevalidation. However, we did not score the corresponding events as “Strong”
but as “Moderate”, because the relationships between them and the apical endpoint were not
strong and the mechanistic basis was rather probable (Appendix B. AOP evaluation table).
The involvement of FSP27 and CD36 in the regulation of fatty acids metabolism and fate has
already been discussed (Sections 3.1.2.1. and 3.1.2.2.). The other outlined transporter – the
fatty acid binding protein 4 (FABP4, aP2) is known to bind specific ligands in the cytosol and
to be engaged with their delivery to PPARγ in the nucleus, thus facilitating the ligand-dependent
enhancement of the receptor’s transcriptional activity (Ayers et al., 2007).

113
Figure 31. Distribution of the scientific evidence by type of assays.
In Figure 32, data for high-fat diet induced changes in the expression are summarised. The
colour code corresponds to different literature sources and experimental settings. However, a
mixed etiology of the observed effect could be expected since the inductive role of dietary fatty
acids could simultaneously act on PPARγ and other nuclear receptors.
Figure 32. Effect of natural ligands (mainly from diet) on the mRNA levels of PPARγ and
some of its targets. General experiment type: wild type + high-fat diet (variants) + quantitative
RT-PCR analysis. Exceptions: a – in vitro treatment with ceramide (endogenous suppressor);
b – PPRAγ deficient line; c – microarray analysis; d – semiquantitative RT-PCR; e – obese,
hypercholesterolemic, diabetic line (Supplementary table S.3.).

114
Additionally, data for genetic manipulations or cell lines with specific genetic background that
are related to PPARγ overexpression, knockdown, positive or negative regulation by upstream
acting proteins was collected (Figure 33).
Figure 33. Effect of genetic manipulation and/or genetic background on the mRNA and protein
levels of PPARγ and some of its targets. General experiment type: PPARγ up- or
downregulation + normal chow diet + quantitative RT-PCR analysis. Exceptions: a – high-fat
diet; b – microarray analysis; c – Western blot; d – semiquantitative RT-PCR (Supplementary
table S.4.).
At a molecular level we can clearly see the correlation between the availability of PPARγ and
its targets. The bars that go outside the plot area stand for knockdown or overexpression data
where the normalisation versus zero level produced infinite number. The effects illustrated in
Figure 32 and Figure 33 support the local interconnections between the MIE and the respective
molecular intermediate events, although some of them are associated with the apical endpoint
within the source literature by additional histological observations.

115
3.1.4. The developed AOPs – general analysis and comparison with the AOPs published
in the AOP-KB
The complexity of the NAFLD, considered as a spectrum of pathological phenotypes, makes
the precise definition of the apical endpoint a challenging task. Studies on the interaction of
miRNAs and PPARγ supported the involvement of the receptor in the regulation of triglyceride
homeostasis and in the development of hepatic steatosis as a mechanism protecting the
extrahepatic tissues from triglyceride accumulation and insulin resistance (Kurtz et al., 2014;
Albert et al., 2014). Moreover, there is a general understanding that steatosis can be reversible
(Vanni et al., 2010; Tailleux et al., 2012). From that point of view, it can be assumed that
steatosis is more likely an adaptive response which by definition is not supposed to be outlined
within an AOP neither as a key event nor as an adverse effect. However, fatty liver is both
among the prerequisites for disease aggravation and a part of the NASH phenotype,
histologically characterised by steatosis, lobular inflammation, hepatocellular ballooning and
fibrosis (Takahashi and Fukusato, 2014). If we choose NASH to be the adverse effect in the
AOP and consider liver steatosis as one of the histological manifestations of the pathology, then
we could represent it as a key event or a non-apical endpoint, preceding the adverse effect. This
issue raises the question of the integration of other progressive stages like cirrhosis and
hepatocellular carcinoma and their place in a possible AOP network since patients suffering
from NASH are particularly predisposed to such outcomes (Wang et al, 2015).
Another inherent limitation of the AOPs is the fact that feedback loops are ignored. This means
that the well known positive feedback regulation of PPARγ is not considered. However, as
already discussed in the section for protein-ligand interactions, the shifting of the observed
ligand’s potency toward a lower EC50 value as compared to its expected magnitude is rooted in
signal amplification. Thus, if ligand-indiced activation of the receptor is involved in its own
overexpression, it would result in a different dose-response profile. Another phenomenon that
is expected to power the signal amplification is the synergistic action of PPARγ, LXR and PXR,
which share common target proteins and/or metabolic pathways involved in the pathogenesis
of the selected AO. Moreover, as already discussed, PPARγ and LXR are shown to be targets
of PXR as well as to upregulate each other reciprocally (Chawla et al., 2001; Geng et al., 2015).

116
While AOP networking may solve problems like multi-stage disease representation and cross-
relation between parallel signaling pathways, another problem stemming from the complex
tissue composition of liver has to be overcome. Since PPARγ-mediated events take place in
each of the cell types presented in this organ – hepatocytes, macrophages, hepatic stellate cells
(HSCs), defining the individual cell type specific pathways’ contributions would bring us a step
closer to a more reliable, cumulative predictive model of the organ effect. It is well known that
in macrovesicular steatosis the abnormally large LDs, the cellular stress and the morphological
changes in the hepatocytes are prerequisites for congestion of the sinusoids, thereby impairing
the sinusoidal blood flow. This triggers a pro-inflammatory cascade, which is further enhanced
by the complex cross-talk of the sinusoidal epithelial cells, HSCs and activated Kupffer cells,
causing congestion, infiltration of lymphocytes and local release of pro-inflammatory cytokines
(Sahini and Borlak, 2014). Further, when the lipid storage capacity of the hepatocytes is
exceeded, an elevated cytoplasmic lipid oxidation additionally aggravates the inflammatory
state of the organ (Alkhouri and McCullough, 2012; Povero and Feldstein, 2016).
On the contrary, PPARγ activation in macrophages is more likely related to the suppression of
inflammatory responses while its downregulation in HSCs is considered pro-fibrotic. Whether
the anti-inflammatory (in macrophages) and anti-fibrotic (in HSCs) effects of PPARγ activation
would be able to compensate the prosteatotic hepatocyte-related events depends on the time of
exposure to the chemical initiator, its bioavailability, the feedback/feedforeward regulatory
mechanisms, the parallel metabolic pathways regulated by other steatosis-relevant nuclear
receptors and the inter-cellular signaling. Therefore, consideration of the individual
contributions and cross-talks of the events in different cell types within the same organ could
adequately reflect the dynamics and the magnitude of liver toxicity. At the current state of
development of the two AOPs, the principles for AOP simplification and the unfilled data-gaps
on synergic/interfering mechanism involved in the total individual response suggest
quantitative deviations from the real pathway dynamics.
Among the 91 AOPs proposed in the AOP-KB, 12 have a common intercept with key elements
of the AOPs reported in the current PhD thesis (Figure 34).

117
Figure 34. Distribution of the AOPs reported in AOP-KB by key anchors related to the
prosteatotic AOPs discussed in the PhD thesis.
None of these except one, namely “LXR Activation to Liver Steatosis”, matches both the
studied here MIE (PPARγ activation/inhibition) and AO (liver steatosis). However, the
mentioned AOP is focused on LXR, while the PPARγ activation was wrongly classified as
MIE, since by definition an AOP consists of only one MIE and one adverse outcome (AO)
connected by a sequence of key intermediate events. Although the activation of LXR and
PPARγ trigger pathways with several common intermediate events and a shared AO, noa direct
relation between these MIEs,outlined in the graphical representation of the AOP
(https://aopkb.org/aopwiki/index.php/Aop:34). On the other hand, we proposed a complete
sequence of events for two PPARγ related AOPs, with weight-of-evidence (WoE) evaluation
of key events within the liver-initiated AOP and in silico modelling of its MIE. Moreover, the
proposed by us AOP triggered by PPARγ activation is one of the few pathways supported by
such in silico models.
In summary, it has been proposed that the ligand-induced disruption of the PPARγ activity may
lead to NAFLD. The toxicity pathways related to this AO are tissue and cell type specific, thus
two different AOP have been developed for the PPARγ inhibition in adipocytes and its
activation in hepatocytes. Among the evaluated key events, lipid uptake/transport was
underlined as the most significant toxicity pathway within the hepatic AOP.

118
3.2. PPARγ ligands’ dataset
A dataset of PPARγ ligands was collected for the modelling purposes. Totally, data for 452
structures was harvested from the Protein Data Bank (PDB) (www.rcsb.org, Berman et al.,
2000) and from 32 literature sources, 18 of which deposited a single structure in Protein Data
Bank (PDB), 2 – two structures, 1 – three structures, and 11 – no structure. These structures
represent 439 different PPARγ ligands. Among them, 5 are standards for PPARγ full agonists,
and there is more than one reported experimental measurement (rosiglitazone – 8; pioglitazone
– 4; farglitazar – 2; ragaglitazar – 2; tesaglitazar – 2). The structures were generated as described
in Section 2.2.1.2. The dataset is publicly available at http://biomed.bas.bg/qsarmm/ and
includes information about:
1. 2D connection table of the ligand named by its InChi key.
2. SMILES code of the ligands (Open Babel v. 2.3.2 generated "inchified" SMILES).
3. IUPAC names of the ligands.
4. Trivial name of the ligand (where present in the sources).
5. PDB complex and ligand codes (for the complexes deposited in Protein Data Bank by
the cited authors).
6. PDB code of the ligand found in Protein Data Bank (even if no complex(es) are
deposited in Protein Data Bank by the cited authors).
7. Ligand name / notation in the data source.
8. Data source.
9. Binding affinity data (IC50), error, comments.
10. Transactivation activity data (EC50), error, comments.
11. Relative transactivation efficacy (% max), error, comments.
12. Reference compound used in the relative transactivation efficacy calculation.
13. Species and cell line used in the activity/efficacy determination.
14. Assay names of: (i) in vitro binding assays – radioligand binding assay or fluorescence
polarisation binding assay for measuring ligands’ binding affinity; (ii) cell-based
luciferase transcriptional reporter gene assay – used for evaluating the effect of the
ligand-dependent PPARγ activation on the expression of a target reporter protein
(transactivation activity, potency) and for establishing the percent response in relation
to the maximum response of a reference compound (relative transactivation efficacy).

119
15. Training/test set assignment for the compounds used in 3D QSAR modelling: since the
protonation states of the modelled ligands differ from those of the neutral forms
presented in this dataset, for some structures two protonation states were shown to
coexist and were considered as different ligands in the modelling study (Al Sharif et al.,
2016)
The distribution of the collected ligands according to the different human/animal cell lines used
for measuring potency and the relative efficacy toward PPARγ is shown in Figure 35 and
summarised in Table S.5., Appendix A. Supplementary Material.
Figure 35. PPARγ agonists’ dataset: distribution of the ligands according to the cell line and
their relative efficacy toward PPAR. Numbers 1-7 indicate the different species and cell lines:
1 – hamster/kidney (BHK21 ATCC CCL10), 2-4 – monkey/kidney (COS-1, COS-7, CV-1,
respectively), 5 – human/kidney (HEK293), 6 and 7 – human/liver (HepG2, Huh-7,
respectively)
In summary, the PPARγ agonists’ dataset that has been collected and curated was based on the
precise reflection of reported experimental settings. The constructed high quality dataset is
suitable for modelling purposes and as a source for building a well organised information pool
available on-line.

120
3.3. Molecular modelling studies
Based on the established causal relationship within the proposed AOPs, the study was logically
directed toward molecular modelling of the MIE to develop a mechanistically justified
predictive in silico approach. Taking into consideration that the prosteatotic genomic activity
of PPARγ is specifically triggered by full agonists but not by partial agonists (Chigurupati et
al., 2015), and in view of the prevalence of PPARγ-agonist crystallographic complexes over
such with antagonists, the modelling strategy was focused on an in silico study of the hepatic
MIE (PPARγ full activation) as a reliable early signal for hazard identification. This required
an analysis of the available data for full agonists (e.g. binding mode, efficacy range) and
determined the choice of molecular modelling approaches to be applied for development of a
pharmacophore-based virtual screening (VS) procedure and 3D QSAR models (Figure 36).
Figure 36. Molecular modelling workflow to study PPARγ full activation: step 1 – VS to
predict full agonists and step 2 – 3D QSAR modelling to predict their potency.

121
3.3.1. Analysis of the deposited PPARγ-ligand complexes
A set of PPARγ-ligand complexes with biological data for the ligands (Table S.6., Appendix
A.Supplementary material) was constructed, based on data extracted from the PDB and
ChEMBL databases (last access: 15 February 2014) (Gaulton et al., 2012). It included 120
complexes of the human PPARγ receptor with binding affinity (Ki, Kd, IC50) and transactivation
activity (EC50) data for the corresponding ligands. Complexes differed in terms of the type
and/or the number of the bound ligand(s), in case there were any (Figure 37a). Some of the
complexes had two ligands simultaneously occupying the LBD (Waku et al., 2010; Itoh et al.,
2008; Li et al., 2008). Variations also occurred in the type of the non-ligand component,
depending on the presence of additional protein subunit(s) or a cofactor as well as the absence
of a ligand (apoform) (Figure 37b). Only the complexes of PPARγ agonists were selected for
subsequent processing and analysis.
Figure 37. Distribution of the structures according to the type of: (a) the bound ligands; (b) the
non-ligand component.

122
3.3.2. Processing of the PPARγ-ligands’dataset
Selection of a modelling set of 170 ligands out of 439 PPARγ full and partial agonists was
performed by:
(i) data gaps removal;
(ii) selection of the full agonists, avoiding duplicates and data uncertainties;
(iii) stereochemical adjustment (S stereoisomers were preferred when potency of
racemic mixtures was reported).
A cornerstone in the data processing was the ligands’ filtering by type of agonism. Therefore,
one of the three proposed thresholds for PPARγ full agonists’ relative efficacy had to be
selected:
(i) According to Henke et al. (1998), full agonists are those compounds that elicit in
average at least 70% activation of PPARγ as compared to rosiglitazone.
(ii) According to Acton et al. (2005), ligands reaching 20–60% of rosiglitazone’s
maximal activation are deemed partial agonists; therefore %max > 60 could be
associated with full agonism.
(iii) According to Bruning et al. (2007), transactivation which is more than 80% as
compared to rosiglitazone should be considered full, less than 50% – partial, and
between 50% and 80% – intermediate.
Relative efficacy of 70% was considered as a reasonable cutoff for selecting only the full
agonists as it is less restrictive toward marginal efficacy and still relevant to the chemical
domain of interests.

123
3.3.3. Analysis of the PPARγ LBD and the ligand-receptor interactions
The PPARγ LBDs were subjected to 3D-protonation at appropriate physiological conditions to
assign the correct ionisation state and positions of the missing H-atoms. Then the LBDs were
superposed by the C-alpha atoms on a template structure using the “Protein superpose” tool in
MOE, and the root-mean-square deviation (RMSD) values were recorded. The X-ray structure
of the PPARγ-rosiglitazone complex (PDB ligand ID BRL; complex ID 1FM6; Gampe et al.,
2000) was selected for a template since:
(i) the complex represents a physiologically relevant arrangement of agonist-bond
LBDs of human RXRα and PPARγ as a heterodimer interacting with coactivator
peptides;
(ii) the PPARγ ligand (rosiglitazone) is among the most potent PPARγ full agonists
(Supplementary table S.6.), thus bearing structural determinants appropriate for
the pharmacophore modelling;
(iii) the residue span of the crystallised PPARγ subunit encloses the full length of the
LBD (Pro206-Tyr477);
(iv) the complex has the lowest resolution (2.1 Å) compared to the rest of the other
PPARγ-rosiglitazone complexes – 4EMA, 3DZY, 2PRG, 3CS8, (Liberato et al.,
2012; Chandra at al., 2008; Nolte at al., 1998; Li et al., 2008a), excluding the
complex with PDB ID 1ZGY (resolution 1.80 Å; Li et al., 2005) , which lacks the
RXRα LBD and, thus, is not a comprehensive representation of the physiological
conditions of interest.
Altogether, these considerations make the selected PDB complex a mechanistically justified
template for superposition. Since the preliminary superposition on the D-chain produced better
RMSDs than the X-chain of the the 1FM6 complex, the latter was used for the final overlay of
all bioactive conformations of the PPARγ full agonists. In order to estimate the possible impact
of the crystal packing forces on the X-ray ligand conformation, the last was relaxed using the
MMFF94s force field and compared with the original structure as extracted from the 1FM6
complex. The superposition on all heavy atoms and on the heteroatoms only (Figure 38)
revealed just slight deviations with RMSDs of 0.388 Å and 0.377 Å, respectively.

124
Figure 38. Superposed conformers of rosiglitazone: the X-ray structure as extracted from the
complex 1FM6 (in atom type colour) and after optimisation by the MMFF94s force field
(carbon atoms are coloured in green). The structures are superposed on the heteroatoms, and
the distances between the oxygen atoms in the thiazolidine ring are shown in Å.
As for the heteroatoms relevant to the specific receptor-ligand interactions, albeit the distances
between the oxygen atoms (0.34 and 0.45 Å), the nitrogen atoms in the thiazolidine rings were
fully overlaid. These results suggested a lack of any significant “tension” in the X-ray
conformation, which was further supported by the results of a heavy atoms’ superposition,
comparing the rosiglitazone’s structures extracted from all available complexes (range of the
RMSDs: 0.18–0.58 Å; template: rosiglitazone structure from 1FM6 complex, D chain)
(Supplementary table S.6.). The ligand X-ray structures represent stable bioactive
conformations as had been previously underlined upon optimisation of X-ray complexes of
another nuclear receptor (human estrogen receptor α) at different levels of protein flexibility
(Pencheva et al., 2012). The superposition of 58 full and partial agonists on the PPARγ LBD is
shown in Figure 39a. Figure 39b illustrates the large (~1300 Å3; Nolte et al., 1998), ligand-
occupied binding pocket outlined by its surface (within 4.5 Å of the ligand atoms).
The binding pocket has a complex Y-like shape with the so called arms I, II and III, thus
allowing for various binding modes and multiple ligands’ accommodation. The ligand entry,
located between H3 and the β-sheet region, does not coincide with either of the arms but is
directed toward their anchor point. Within Arm I, the polar parts of the ligands are directed to
H12, which has proved to be crucial for coactivators binding. The analysis of the protein-ligand
interactions within the complexes of the nine most active agonists has outlined the amino acid
residues forming the receptor-binding pocket (Figure 40).

125
Figure 39. (a) 58 PPARγ agonists superposed in the ligand binding pocket of the receptor on
the template complex PDB ID 1FM6 with rosiglitazone (in space-filled rendering and C-atoms
coloured in magenta); the other ligands are rendered in lines and coloured according to the atom
type; (b) surface map of the binding site (in constant grey colouring) of all agonists and
rosiglitazone (in magenta); the different residue colouring designates participation in one of the
three “arms” within the binding site: Arm I – green; Arm II – cyan; Arm III – yellow; the
entrance to the pocket (outlined with a black dotted line) is located between the arms; the protein
backbone is rendered in a ribbon and coloured according to the secondary structure: helix – red;
strand – yellow; turn – blue; loop – white; H1–H12 assign the order of the helices in the PPARγ
LBD structure.
Indicators for the ligand-driven flexibility of the binding pocket are the sixteen residues
detected to participate in protein-ligand interactions in only one or two complexes. Among the
48 residues, 19 are common for the binding sites of all agonists, with Ser289, His323, His449
and Tyr473 (shown in red) involved in hydrogen bond formation. These interactions are
illustrated in Figure 41 of rosiglitazone in the PPARγ complex 1FM6 and GW409544 (PDB
ligand ID 544) in complex 1K74 (Xu et al., 2001).
a b

126
Figure 40. The protein-ligand interaction fingerprints of the nine most active (according to the
EC50 values in Supplementary table S.6.) agonists evinces the number of occurrences of the
amino acids involved in the agonists’ contacts with the receptor binding pocket; in red – the
amino acids that were identified to form hydrogen bonds (HBs) with the most active agonists.
Figure 41. Ligand-interaction diagrams of (a) rosiglitazone and (b) GW409544 within the
binding pocket of PPARγ.
a b

127
Different binding modes were suggested for the full and partial agonists (Bruning et al, 2007)
and our inspection of the binding pocket of all complexes has confirmed this observation,
emphasising the H12 independent activation of PPARγ by the partial agonists (Figure 42).
Figure 42. Binding poses of three full agonists (BRL – rosiglitazone; 544 – GW409544 and
570 – farglitazar; in magenta) and three partial agonists (MRL24, SR145, SR147; in green)
within the PPARγ binding pocket (template complex 1FM6).

128
3.3.4. Pharmacophore-based Virtual Screening to predict PPARγ full agonists
3.3.4.1.Pharmacophore model development
The full agonists’ complexes selected for pharmacophore modelling were superposed on the
template structure 1FM6. Within the range of the calculated RMSD values (0.44 – 1.58 Å;
Supplementary table S.6.), the complexes were distributed in such a manner that the majority
of them shared the interval 0.8–1.2 Å as shown in Figure 43.
Figure 43. Histogram of the RMSD values (X-axis) of superposed PPARγ-full agonist
complexes (Y-axis).
In view of the well aligned helices that enclose the binding site, the observed deviations are to
a greatest extent due to the flexibility of the loop between H2' and H3 (Figure 39a). This could
be rooted in the possible adaptive function of the loop that assists the accommodation of
differentially shaped and/or sized ligands, thus maintaining unchanged the positions of the
helices in the PPARγ binding site. The stability of the pocket upon ligand binding guaranteed
the reliable alignment of the superposed ligands involved in pharmacophore generation. Seven
important pharmacophore features were outlined, based on the three most active agonists –
rosiglitazone (PDB ID 1FM6), compound 544 (PDB ID 1K74) and compound 570 (PDB ID
1FM9) (Figure 44).

129
Figure 44. Pharmacophore model of PPARγ full agonists. The features that describe the less
restrictive 4/5 point pharmacophore model are surrounded by a dotted line.
They represent two main types of interactions: HB and ionic interactions associated with four
polar atoms and functional groups (F1, F2, F4 and F6); and hydrophobic and/or aromatic effects
characteristic for three structural elements (F3, F5 and F7). The relative spatial localisation of
the latter is crucial for the overall topology of the ligand, which remains anchored within Arms
I and II through the terminal features F5 and F7 and is stabilised by the bridging F3. The explicit
contribution of the HB and ionic interactions is indirectly mediated by the
hydrophobic/aromatic ones which enable the optimal ligand pose into the pocket to ensure
protein-ligand interactions that are direct (F1, F2, and F4) or mediated by a water molecule
(F6). Details on the mechanistical interpretation of the pharmacophore features are summarised
in Table 9.

130
Table 9. Description of the pharmacophore features in the pharmacophore model of the full
PPARγ agonists: Don – donor; Acc – acceptor; Hyd – hydrophobic; Aro – aromatic.
Pharmacophore
feature Location Interactions
F1: Don/Acc Arm I
Participates in HB interactions (donor and acceptor) with
residues His449 (H11) and Tyr473 (H12); responsible for
the direct interaction with H12 and stabilises its active
position
F2: Acc Arm I
Participates in HB interactions (acceptor) with Ser289 (H3),
His323(H5), Tyr 327 (H5); responsible for the stabilisation
of H12 in an active position
F3: Hyd/Aro Arm I Fits to the hydrophobic environment; stabilises the positions
of F1 and F2 features
F4: Don/Acc Arm II
Can participate in HB interactions directly or mediated by
water molecules with Ser342 (H5), Cys285 (H3) and Arg
288 (H3); stabilises the pose of the ligand into the pocket
F5: Hyd/Aro Arm II Fits to the hydrophobic environment; stabilises the pose of
the ligand into the pocket
F6: Don/Acc Arm I Can participate in HB interactions mediated by water;
stabilises the pose of the ligand into the pocket
F7: Hyd/Aro Arm I Fits to the hydrophobic environment; stabilises the pose of
the ligand into the pocket
For this restrictive pharmacophore model based on the most potent full agonists of PPARγ,
further evaluation was performed. A set of 20 full agonists was carefully selected from PDB
along with the corresponding potency data (EC50 values), based on experimental evidence for
full agonistic activity.

131
A visual inspection of the full agonists as superposed on the 7 pharmacophore features resulted
in the generation of substructure-based fingerprints (Table 10) and led to the following
assumptions:
(i) features F1 or/and F2 and F3 could be outlined as mandatory for full agonism;
(ii) at least one of the features that stabilise the position of the ligand in the pocket (in
Arm II – F4 and/or F5 or in Arm I – F6 or/and F7) is necessary for the full agonism.
Since the level of correspondence of the 20 agonists to the 7 feature pharmacophore was related
to their activity, the less restrictive 4/5-point pharmacophore model that was built is expected
to cover a larger applicability domain (Figure 44). Among the previously outlined structural
features related to HB and ionic interactions, F1 and F2 were selected as essential within the
full agonists’ set and F4 – as optional, while the pool of the hydrophobic and aromatic
substructures was represented by F3 and F5 only.
A detailed investigation of the 20 full agonists’ complexes and the apo-form (1PRG; Nolte et
al., 1998) was performed, regarding the HB interactions between H12 and its vicinity, including
protein-protein and protein-ligand ones (Supplementary table S.7.), leading to the following
conclusions:
(i) a number of ligands interact directly with H12 through HBs (e.g. 544, 570, BRL,
ZAA), thus fitting with the F1 feature;
(ii) for ligands like M7R, M7S, S44, J53 no interactions are identified with H12;
instead, they interact with H3 and/or H5, fitting in this way with the F2 feature;
(iii) unique HBs that take place in complexes only and are not observed in the apo-forms
have been found to connect H12 to H3, H4, and H5, thus stabilising its active
position (e.g. Ile472 (H12) with Lys319 (H4), Lys474 (after H12) with Lys319
(H4), Tyr477 (after H12) with Glu324 (H5), Hys466 (between H10/11 and H12)
with Gln 286 (H3); Supplementary table S.7., highlighted lines);
(iv) for the most active agonists, the H12 stabilising ligand-induced interactions that
possibly facilitate coactivator recruitment include: the HB contacts between H12
and H4 as well as those between H12 and H3, which prevail in ligands without F1.

132
Table 10. Evaluation of the pharmacophore model on a dataset of full agonists:
F1–F7, pharmacophore features; +/−, the presence or absence of the particular pharmacophore
feature in the particular chemical structure; EC50, transactivation activity; the complexes are
ordered according to their EC50 values (the lowest value considered when the interval data are
reported).
Complex
PDB ID
Ligand
PDB ID
Pharmacophore features EC50
(nM) F1 F2 F3 F4 F5 F6 F7
1K74 544 + + + + + + + 0.2–2.7
1FM9 570 + + + + + + + 0.339–6
1FM6 BRL + + + + + − − 2.4–2880
3AN4 M7R − + + + + − − 3.6
3BC5 ZAA + − + + + + − 4
3IA6 UNT + + + + + − − 13
1I7I AZ2 + + + − − − + 13–3528
3G9E RO7 + + + + + − − 21
3AN3 M7S − + + + + − − 22
2ZNO S44 − + + + + − − 41–70
3GBK 2PQ + + + + + − − 50
3VJI J53 − + + − + − − 58
2F4B EHA + − + − + − − 70
2Q8S L92 + + + + + − − 140
1KNU YPA + + + + + − + 170
3FEJ CTM + + + − + − + 210
2HWR DRD + + + − + − − 210
2ATH 3EA + + + − + − − 230
1NYX DRF + + + − + − − 570–600
2GTK 208 + + + + + − + 760
2XKW P1B + + + + + − − 1125

133
3.3.4.2.VS protocol development and validation
Further, a predictive model for PPARγ full agonists was developed as a MOE-based (MOE, v.
2014.0901) VS protocol of three steps: (i) protein preparation (Section 2.2.1.3.), (ii) docking
of the ligands into the PPARγ binding site (Section 2.2.5.2.) and (iii) pharmacophore-based
generation and filtering of the full agonists’ poses (Tsakovska et al., 2014).
VS protocol validation was performed by the docking of structures from different datasets,
using the 5-point pharmacophore model to establish:
(i) Model sensitivity of 85%, where 144 out of 170 PPARγ full agonists selected from the
previously collected dataset were correctly predicted as full agonists.
(ii) Model specificity of 44% in relation to the partial agonists, where 38 out of 87 PPARγ
partial agonists retrieved from the initial dataset of PPARγ ligands did not pass the filter
and were correctly classified as not being full agonists.
(iii) Model specificity of 77% in relation to decoys, where 1949 out of 2527 randomly
selected decoys were correctly classified as not being full agonists. Decoys are
compounds resembling the receptor binders’ physicochemical properties but at the same
time topologically dissimilar to minimise the likelihood of actual binding. The random
selection of the subset involved extraction of each 10th structure after removal of
duplicates from the full set of 25867 PPARγ decoys in DUD-E database (Directory of
Useful Decoys – Enhanced, http://dude.docking.org, Mysinger et al., 2012).
While the prediction model for PPARγ full agonists has high sensitivity when discriminating
binders from non-binders, discrimination between full and partial agonists is relatively low. The
last could be explained by the poorly defined structural differentiation between the two types
of agonists sharing the same PPARγ ligand binding pocket. However, for the purposes of the
screening, the relatively high number of false positive hits is an acceptable limitation of the
approach since its priority is the successful restriction of potentially hepatotoxic PPARγ full
agonists.
In summary, the developed pharmacophore model outlines important structural features that are
characteristic for PPARγ full agonists. The developed VS protocol is based on a docking
algorithm with a pharmacophore filter which involves 5 essential features, thus allowing the
identification of the PPARγ full agonists. It is the first step of a combined in silico approach for
prediction of potential chemical initiators of NAFLD, presented schematically in Figure 36.
The second step of this alternative approach is discussed in detail in the next section.

134
3.3.5. 3D QSAR modelling to predict pEC50 of PPARγ full agonists
The development of a scientifically sound 3D QSAR model based on the AOP with hepatic
MIE implied a careful selection of the dependent variable in order to be:
(i) interpretable in view of the theoretical basis and the inherent limitations of the
selected 3D QSAR approach, namely CoMSIA;
(ii) well established, regarding previous modelling attempts;
(iii) biologically relevant to the outlined within the AOP qualitative relationship
between PPARγ activation/upregulation and the transcription of its target
prosteatotic proteins;
(iv) publicly accepted as a toxicological endpoint.
Although the ligand-induced in vitro transactivation (expressed as potency, EC50) covers a
series of events, from receptor activation to multiple downstream molecular events triggering
gene expression, it starts with receptor binding and thus is expected to be related to the change
in the free energy of ligand-receptor complex formation, which is necessary for the CoMSIA
modelling. Moreover, the involvement of transactivation activity in computational models has
been underlined as both challenging in view of its complex nature and biologically relevant as
this endpoint may reflect, in a more complete manner, the molecular determinants of a given
pathology (Rücker et al., 2006; Sundriyal et al., 2009). In particular, the toxicity pathways
related to the overexpressed PPARγ target proteins are suggested to synergistically drive the
NAFLD development and progression as described in the AOP (Section 3.1.2.1.). Therefore,
in silico prediction of PPARγ ligands’ transactivation activity is a mechanistically justified
rationale for the screening and prioritisation for further testing of potential prosteatotic
chemicals. The latter is also supported by the OECD conceptual framework, which includes
PPAR transactivation reporter assays among the most promising assays to detect and
characterise the chemical effects on the PPAR signaling pathway. These assays are going to be
considered for incorporation into new or existing Test Guidelines for the detection of endocrine
disrupting chemicals after their refinement and validation (ENV/JM/MONO(2012)23).
A multistep workflow (Figure 45) presents the whole 3D QSAR modelling process described
below.

135
Figure 45. The 3D QSAR modelling workflow to predict the potency of PPARγ full agonists.

136
3.3.5.1.Dataset processing and structure alignment
The 1st step of the full agonists’ selection was performed (Figure 45) according to the criteria
in Section 3.3.2. The modelling set of 170 ligands from 6 research groups’ publications
included structures and potency data measured in human (77 ligands) or animal (93 ligands)
cell lines. At the 2nd step of the modelling workflow, a structure alignment was performed
according to the procedures described in Section 2.2.4.3.1. with a 4-feature pharmacophore
used as a filter of the generated docking poses. This approach was expected to reproduce the
most probable bioactive conformers as well. Based on a preliminary 3D QSAR analysis on the
whole dataset and following the criteria defined in Section 2.2.4.3.2., 48 outliers were excluded.
3.3.5.2.Model generation and validation
Since the general performance measures of the preliminary CoMSIA analyses on separated
human and animal data were similar, the final analysis covered a combined data set in which
nearly 40% of the structures had been tested on human cell lines.
After the outliers’ removal, the 3rd step, outlined in Figure 45, was splitting the remaining
structures into a training set (n=83) assembled to include structures from all selected research
groups with a broad structural variety and a wide range of activities (pEC50 = 5.4 – 9.1) and a
test set (n=39) with the remaining compounds of similar structural variability and pEC50 range
(pEC50 = 5.5 – 8.1). The robust external validation of the developed model is guaranteed by the
relatively high number of the test compounds (about half of the training set). Detailed structural
and experimental data regarding the modelled compounds can be found at
http://biomed.bas.bg/qsarmm/.
The best CoMSIA model included electrostatic, hydrogen bond acceptor and hydrophobic
fields. Its robustness was evaluated through LOO cross-validation procedure based on the cross-
validated coefficient qcv2 = 0.610, the optimal number of principle components Nopt = 7, and
the cross-validated standard error of prediction, SEPCV = 0.505.

137
While the statistical parameters are comparable with other pEC50-based models for PPARγ full
agonists, the training set considered in this study is the largest of any published. Therefore, a
broader applicability domain is achieved by the structural diversity of the modelled compounds,
covering as much as possible the available structural data in PDB and the literature.
Ten Y-randomisations were performed to further evaluate the probability of generating a good
model by chance. The resulting low average q2cv = -0.114 and high SEPcv = 0.824 underlined
the acceptability of the proposed CoMSIA model. For large redundant datasets the q2cv obtained
from LOO cross-validation may give a false sense of confidence, because a “near-by” molecule
with very similar descriptor values to those of each of the omitted molecules is likely to remain
in the training data (SYBYL-X, 2013). Therefore, the model’s sensitivity to small systemic
perturbations of the response variable was assessed by progressive scrambling (maximum: 20
bins, minimum: two bins and critical point: 0.85). The main indications for the robustness of
the original unperturbed model are the Q2 and the dq/dr. Since the introduced noise makes the
parameter Q2 quite conservative, a value of Q2 above 0.35 is an indication for the robustness of
the model. As for the dq/dr – stable models have slopes near unity (SYBYL-X, 2013). Thus,
the resulting statistical parameters (Q2 = 0.437, cSDEP = 0.598, dq/dr = 1.06) further confirmed
the stability of the developed CoMSIA model.
At the 4th step, the predictive power of the obtained model was evaluated by external validation
and was estimated by the predictive correlation coefficient rpred2 = 0.552 with training (83) to
test set (39) ratio approx. 2:1.
The obtained rpred2 of the model is comparable to q2
cv and demonstrates a good stability of the
predictions in the context of the intra- and inter-laboratory variations in the methodology for
measuring the biological data as well as the complex nature of the dependent variable.
Figure 46 presents a plot of the predicted pEC50 values obtained by the optimal non-cross-
validation 3D QSAR model versus the experimentally observed pEC50 values for the training
and the test set compounds.

138
Figure 46. Predicted (pEC50 predicted) vs. observed pEC50 (pEC50 observed) values for training
(83) and test (39) set compounds. Regression statistics: r2 – determination coefficient; SEE –
standard error of estimate, F (1, 120) – F-ratio between explained and unexplained variance for
the given number of degrees of freedom at 95% level of significance.
The similar fractional contributions of the CoMSIA fields to the differences in the
transactivation activity (electrostatic – 0.293, hydrogen bond acceptor – 0.346, hydrophobic –
0.360) indicate that the model is not dominated by any of the three fields. The role of the
electrostatic effects has been already emphasised by other authors (Shah et al., 2008; Sundriyal
et al., 2009). As for the hydrogen bond acceptor and hydrophobic fields, this is the first pEC50-
based 3D QSAR model to explicitly outline their involvement in the pEC50 data variations.

139
The parity between the three types of interactions is not a simple function of their individual
contributions but also reflects their synergistic influence on receptor activation. The ligand-
receptor interactions are mainly governed by the hydrogen bond acceptor and the electrostatic
fields. However, the stabilising role of the hydrophobic effects for the occupancy of the ligand
binding domain of PPARγ in terms of optimal orientation and distances of the ligand to key
amino acid residues remains significant. These effects have their indirect contribution in driving
the electrostatic interactions over the whole interface area and in particular for establishing
specific donor-acceptor interactions between the receptor activation helix H12 and the
electronegative substructures of the full agonists. Thus, not the simple additivity but the
complex interplay between multiple molecular interactions lies in the full agonist-induced
stabilisation of the active receptor conformation.
We further analysed the contour maps of our 3D QSAR model and traced out the
correspondence between the most contributing CoMSIA molecular fields and the identified
pharmacophore features. The contours were estimated by the actual values of the model
StDev*Coeff (the standard deviation of the 3D field at each grid point multiplied by the 3D
QSAR coefficient) and the contour levels were defined based on the analysis of the field
distribution histograms (SYBYL-X, 2013). These maps allow for recognition of regions within
the area occupied by the ligands that suggest a particular property field important for the
modelled activity.
The analysis of the field contributions allows the characterisation of those spacial features that
are mostly responsible for the differences in the observed transactivation activity within the
studied series of compounds. This is a good basis for their comparison to the pharmacophore
model (Figure 47). As seen in the figure, there is a good correspondence between the
encapsulated regions of the properties (Figure 47 a, b and c) and the pharmacophore features
(Figure 47d). The relevance of the features F5 and F7 is supported by the corresponding
favoured areas (Figure 47a; in orange) in the hydrophobic field contour map. The absence of a
contour in the area of the pharmacophore feature F3 can be explained by the broad presence of
a hydrophobic ring substructure in the compounds within the training set. Further, the
appearance of an additional favoured hydrophobic contour in the region between features F1
and F2 outlines the role of a cyclic substructure common for the most active ligands that
stabilises the position of the functional groups corresponding to F1 and F2 and thus leads to
increased transactivation activity.

140
The favoured electrostatic field contour (Figure 47c; in pink) defines a region where the
increased positive charge will result in increased activity, while the disfavoured cyan area
suggests that a more negative charge is related to higher activity, instead. These regions
perfectly match the donor or/and acceptor features (F1, F2) outlined in the pharmacophore
model. In addition, the favoured acceptor contours (Figure 47b; in blue) underline the
relevance of features F1, F2 and F4.
Figure 47. Contour maps (StDev*Coeff) of the favoured/disfavoured CoMSIA fields: (a)
hydrophobic (orange/violet at 0.0175/-0.0220 kcal/mol), (b) hydrogen bond acceptor (blue/red
at 0.0365/-0.0542 kcal/mol) and (c) electrostatic (pink/cyan at 0.0338/-0.0706 kcal/mol);
(d) 7-feature pharmacophore of PPARγ full agonists (shown for comparison). Superimposed
onto the maps is the structure of the most active compound (farglitazar,
http://biomed.bas.bg/qsarmm/), rendered in sticks and coloured according to the atom type.

141
3.3.6. Integration of the developed pharmacophore-based VS protocol in battery
approaches supporting risk assessment
The developed VS protocol was successfully combined with in silico strategies developed in
different research groups (Tsakovska et al, 2015; Fioravanzo et al., 2015; Vitcheva et al., 2015)
that were focused on:
(i) Consensus molecular modelling of LXRα receptor: Ensemble docking,
e-Pharmacophore, fingerprints-based similarity;
(ii) SAR analysis: KNIME workflow (WF) for nuclear receptors (NRs)-mediated liver
steatosis alerts (http://knimewebportal.cosmostox.eu/) and ToxPrint Chemotypes
Analysis, identifying chemotypes for liver steatosis (Chemotyper,
https://chemotyper.org, Yang et al., 2015).
They aimed to identify dual PPARγ/LXR binders and/or to propose an integrated approach to
evaluate the prosteatotic potential of predicted PPARγ full agonist. The study showed that
molecular modelling and pathology-relevant mining of in vivo toxicity data combined with
substructure analysis succesfully complement each other within the AOP framework (steps 1
to 4, Figure 48).
Figure 48. General scheme of the AOP-driven development, validation and integration of in
silico approaches in expert systems. Modified from Fioravanzo et al. (2015).
Screening of liver toxicity databases was performed to identify potential dual PPARγ/LXRα
binders (JRC dataset) or PPARγ full agonists (COSMOS DB). The final aim was to prioritise
compounds of potential concern for liver toxicity.

142
3.3.6.1.Prediction of Dual PPARγ/LXR binders
The JRC case-study dataset included 97 compounds selected for the JRC SEURAT-1 level 2
case study. Among them, 75% were positive (POS) reference chemicals (e.g. experimentally
proven to be hepatotoxic). The shaded compounds (Table 11) were the hits from the combined
application of the rules for structural features and physico-chemical ranges within the KNIME
NRs WF with the VS protocol for PPARγ full agonists and the LXR consensus model.
Interestingly, sulindac, methotrexate and amodiaquine were classified as dual PPARγ/LXR
binders, increasing further their priority for ultimate testing as potential prosteatogenes. Thus,
in addition to the already suggested cross-relations between the PPARγ and LXR liver steatosis
AOPs (e.g. shared intermediate key events and adverse outcome as well as reciprocal
transcriptional regulation), common chemical initiators of the MIEs were identified.
Table 11. JRC case-study dataset chemicals predicted as potential PPARγ full agonists by the
VS protocol. The shaded compounds are hits from a battery approach including the VS
protocol; the underlined hits are identified as dual PPARγ/LXR binders; NEG – not hepatotoxic
compounds; POS – hepatotoxic compounds.
CAS Name Hepatotoxicity
111025-46-8 Pioglitazone NEG
16110-51-3 Cromolyn NEG
33369-31-2 Zomepirac NEG
36505-84-7 Buspirone NEG
38194-50-2 Sulindac POS
51-03-6 Piperonyl butoxide POS
59-05-2 Methotrexate POS
7261-97-4 Dantrolene POS
86-42-0 Amodiaquine POS

143
3.3.6.2.Prediction of piperonyl butoxide
The VS protocol was further combined with the independently performed mechanistic mining
of available in vivo toxicity data followed by an analysis based on ToxPrint chemotypes
(developed by Altamira LLC for FDA CFSAN’s CERES). By definition, chemotype is a
structural fragment encoded for connectivity and, where required, for physicochemical and
electronic properties of atoms, bonds, fragments, and even a whole molecule (Yang et al.,
2015). Therefore, the chemotype approach represents a ligand-based screening, driven by
empirical prediction of the pathological condition, based on the identification of particular
substructures. The procedure was applied to the oRepeatTox DB, part of the COSMOS database
(publicly available at: http://cosmosdb.cosmostox.eu) developed within the COSMOS Project.
The chemotype analysis matched the substructural fragments present in the chemicals
associated with liver steatosis/steatohepatitis/fibrosis with the predefined library of ToxPrint
chemotypes. At the same time, the chemicals associated with liver
steatosis/steatohepatitis/fibrosis were run through the VS protocol developed. Piperonyl
butoxide was identified as a hit through both analyses. Thus it was predicted as a potential
prosteatotic PPARγ full agonist (Al Sharif et al., 2016).
This result is a trigger for the development of a next generation in silico predictor – the 3D
chemotypes for liver steatosis. That involves: (i) coding the essential pharmacophore points as
particular substructures extracted from the PPARγ full agonists dataset; (ii) determining the
distances between the essential pharmacophoric points; (iii) based on (i) and (ii), coding the
disconnected graphs with the spatial distances. At this stage the steps (i) and (ii) have been
covered (Table 12).
Table 12. Distances (Å) between the essential pharmacophoric points within the PPAR full
agonists
Feature F1-F2 F1-F3 F1-F5 F2-F3 F2-F5 F3-F5
Average, Å 2.76 6.4 13.1 5.8 13.1 9.3
minmax, Å 1.93.4 4.99.2 11.215.5 4.47.3 10.815.4 7.111.7

144
The results above demonstrate that the mechanistically justified integration of multiple
approaches (AOPs, molecular modelling, pharmacophore, docking, 3D QSAR and
chemotypes) could explain and predict in a more complete manner the complex biological
responses characterising the repeated dose toxicity, thus reducing the information gaps and
uncertainties that would result from their individual application.

145
SUMMARY
In summary, the work presented in this thesis has exploited a variety of predictive toxicology
methods (pharmacophore modelling, docking, and 3D QSAR analysis) in combination with
AOP development in order to investigate the PPARγ-mediated hepatotoxicity and to develop
an integrated in silico approach supporting hazard identification and characterisation.
On the basis of the collected and systemised experimental evidence, two AOPs focused on the
relationship PPARγ dysregulation – NAFLD have been developed, outlining tissue-specific
cascades of events initiated by a ligand-induced receptor activation (in liver) or inhibition (in
adipose tissue). Moreover, quantitative data have been collected, regarding key events in the
liver AOP. The causal relationships within the proposed AOPs underline the relevance of the
selected MIEs and emphasise the anchor points for further in vitro/in silico exploration. The
hepatic AOP, addressing a particular domain of chemical initiators (PPARγ full agonists),
became a solid mechanistical basis for the development of predictive models of the MIE as well
as their integration in combined approaches.
The structural and biological data for PPARγ full and partial agonists harvested from PDB,
ChEMBL and literature sources have resulted in the largest publicly available PPARγ ligands
dataset (http://biomed.bas.bg/qsarmm/). It offers high quality data, organised for modelling
purposes.
The comprehensive analysis of the key PPARγ-ligand interactions has been performed within
the purposefully selected crystallographic complexes, affirming the molecular determinants for
the studied MIE and allowing for the development of a pharmacophore model of PPARγ full
agonists. Its use within an algorithm for docking into the PPARγ binding pocket produced the
core element of a thoroughly validated virtual screening (VS) procedure for identification of
full agonists. The successful application of the proposed VS protocol in combination with LXR-
based models and chemotype-based read across procedure allowed for the prioritisation of
potential prosteatotic chemicals acting as dual PPARγ/LXR binders and for the prediction of
the possible mode of action (PPARγ full agonism) of the hepatotoxic piperonyl butoxide.
Using the developed pharmacophore-based docking and the collected full agonists data, a 3D
QSAR model has been derived. The CoMSIA approach has been used to correlate the changes
in the structures to the variations in their transactivation activities.

146
The reported goodness-of-fit, robustness and predictivity of the established quantitative
structure-activity relationship evidenced the reliability of the model necessary for its regulatory
acceptance, while the size and the structural diversity of the training set characterised the
superiority of the model’s applicability domain compared to previously reported ones.
On the basis of the developed hepatic AOP and predictive molecular models, a mechanistically
justified combined in silico approach has been proposed to screen for potential prosteatotic
chemicals acting through PPARγ full activation (pharmacophore-based VS) and to predict their
potency based on characteristic hydrophobic, HB acceptor and electrostatic CoMSIA fields (3D
QSAR model).
The developed pathways, dataset and combined in silico approach constitute a solid
fundamental for further exploration, knowledge transfer and applicability by:
(i) AOP refinement and introduction to OECD; (ii) generation of proposals for regulatory
assays, which is based on the outlined key events; (iii) development of an enriched PPARγ
ligands’ database; (iv) further toxicological validation of the developed models against
experimentally observed prosteatotic compounds and (v) 3D chemotypes development and
validation.

147
CONTRIBUTIONS
1. Two tissue-specific AOPs (in liver and in adipose tissue) were developed to link the
PPARγ ligand-dependent dysregulation with NAFLD.
Key events within the liver AOP were quantitatively evaluated and the data gaps for
further in vitro exploration were outlined.
The proposed AOPs are a basis for the development of in silico models to predict
PPARγ ligand-dependent dysregulation and key events in the AOPs.
2. A dataset with structural and biological data for PPARγ agonists was harvested,
curated and released. It is the most complete and largest publicly available dataset of
PPARγ agonists (freely available at http://biomed.bas.bg/qsarmm/).
3. A pharmacophore model of PPARγ full agonists was build and used for the
development of VS protocol.
The developed VS protocol was successfully applied for the prediction of PPARγ full
agonistic activity of compounds.
The VS protocol was combined with molecular modelling approaches to predict
potential dual PPARγ/LXR binders for prioritisation of chemicals of higher concern in
view of the expected synergy in their prosteatotic effects.
The VS protocol was combined with a chemotype-based read across procedure within
an integrated battery approach to predict prosteatotic effects of chemicals and to get an
insight into the possible mechanism of the toxic effect (PPARγ full agonism).
4. A 3D QSAR (CoMSIA) model was developed to predict the transactivation activity of
PPARγ full agonists. The model is a good improvement over the previously published
ones as it is based on the largest and most structurally diverse dataset, ensuring
enlargement of the addressed applicability domain. The statistical parameters
resulting from the comprehensive validation performed qualify it as reliable for
predictive purposes.
5. A two-step in silico approach combining the developed VS protocol and 3D QSAR
model is proposed for screening and prioritisation of potential prosteatotic ligands.

148
DECLARATION FOR ORIGINALITY OF THE RESULTS
I declare that this thesis contains original results obtained within my own research work (with
the support and the collaboration of my supervisors). The results that are obtained, reported,
and/or published by other scientists, are properly cited in detail in the bibliography.
This thesis has not been submitted for a degree in another higher school, university or research
institute.

149
LITERATURE
37th OECD's Joint Meeting of the Chemicals Committee and the Working Party on Chemicals,
Pesticides and Biotechnology, Paris November 17–19, 2004
(http://www.oecd.org/env/ehs/organisationoftheenvironmenthealthandsafetyprogramme.htm)
Ables GP. Update on pparγ and nonalcoholic Fatty liver disease. PPAR Res.
2012;2012:912351. doi: 10.1155/2012/912351. Epub 2012 Aug 16. PubMed PMID:
22966224; PubMed Central PMCID: PMC3431124.
ACD/Labs Percepta suite 2015; Advanced Chemistry development, Inc.,
http://www.acdlabs.com/products/percepta/
Acton JJ 3rd, Black RM, Jones AB, Moller DE, Colwell L, Doebber TW, Macnaul KL, Berger
J, Wood HB. Benzoyl 2-methyl indoles as selective PPARgamma modulators. Bioorg
Med Chem Lett. 2005 Jan 17;15(2):357-62. PubMed PMID: 15603954.
Adler S, Basketter D, Creton S, Pelkonen O, van Benthem J, Zuang V, Andersen KE, Angers-
Loustau A, Aptula A, Bal-Price A, Benfenati E, Bernauer U, Bessems J, Bois FY,
Boobis A, Brandon E, Bremer S, Broschard T, Casati S, Coecke S, Corvi R, Cronin M,
Daston G, Dekant W, Felter S, Grignard E, Gundert-Remy U, Heinonen T, Kimber I,
Kleinjans J, Komulainen H, Kreiling R, Kreysa J, Leite SB, Loizou G, Maxwell G,
Mazzatorta P, Munn S, Pfuhler S, Phrakonkham P, Piersma A, Poth A, Prieto P, Repetto
G, Rogiers V, Schoeters G, Schwarz M, Serafimova R, Tähti H, Testai E, van Delft J,
van Loveren H, Vinken M, Worth A, Zaldivar JM. Alternative (non-animal) methods
for cosmetics testing: current status and future prospects-2010. Arch Toxicol. 2011
May;85(5):367-485. doi: 10.1007/s00204-011-0693-2. Epub 2011 May 1. Review.
PubMed PMID: 21533817.
Adverse Outcome Pathway Knowledge Base (AOP-KB), https://aopkb.org/ (last access: 19
August 2015)
Agrawal S, Duseja A. Nonalcoholic Fatty Liver Disease--The Clinician's Perspective. Trop
Gastroenterol. 2014 Oct-Dec;35(4):212-21. PubMed PMID: 26349165.
Ahmadian M, Suh JM, Hah N, Liddle C, Atkins AR, Downes M, Evans RM. PPARγ signaling
and metabolism: the good, the bad and the future. Nat Med. 2013 May;19(5):557-66.
doi: 10.1038/nm.3159. Epub 2013 May 7. Review. PubMed PMID: 23652116; PubMed
Central PMCID: PMC3870016.

150
Al Sharif M, Alov P, Vitcheva V, Pajeva I, Tsakovska I. Modes-of-Action Related to Repeated
Dose Toxicity: Tissue-Specific Biological Roles of PPAR γ Ligand-Dependent
Dysregulation in Nonalcoholic Fatty Liver Disease. PPAR Res. 2014;2014:432647. doi:
10.1155/2014/432647. Epub 2014 Mar 18. Review. PubMed PMID: 24772164;
PubMed Central PMCID: PMC3977565.
Al Sharif M, Tsakovska I, Pajeva I, Alov P, Fioravanzo E, Bassan A, Kovarich S, Yang C,
Mostrag-Szlichtyng A, Vitcheva V, Worth AP, Richarz AN, Cronin MTD, The
Application of Molecular Modelling in the Safety Assessment of Chemicals: A Case
Study on Ligand-Dependent PPARγ Dysregulation, Toxicology, 2016, doi:
10.1016/j.tox.2016.01.009.
Albert JS, Yerges-Armstrong LM, Horenstein RB, Pollin TI, Sreenivasan UT, Chai S, Blaner
WS, Snitker S, O'Connell JR, Gong DW, Breyer RJ 3rd, Ryan AS, McLenithan JC,
Shuldiner AR, Sztalryd C, Damcott CM. Null mutation in hormone-sensitive lipase gene
and risk of type 2 diabetes. N Engl J Med. 2014 Jun 12;370(24):2307-15. doi:
10.1056/NEJMoa1315496. Epub 2014 May 21. PubMed PMID: 24848981; PubMed
Central PMCID: PMC4096982.
Alkhouri N, McCullough AJ. Noninvasive Diagnosis of NASH and Liver Fibrosis Within the
Spectrum of NAFLD. Gastroenterol Hepatol (N Y). 2012 Oct;8(10):661-8. PubMed
PMID: 24683373; PubMed Central PMCID: PMC3969008.
Al-Najjar BO, Wahab HA, Tengku Muhammad TS, Shu-Chien AC, Ahmad Noruddin NA,
Taha MO. Discovery of new nanomolar peroxisome proliferator-activated receptor γ
activators via elaborate ligand-based modeling. Eur J Med Chem. 2011 Jun;46(6):2513-
29. doi: 10.1016/j.ejmech.2011.03.040. Epub 2011 Mar 25. PubMed PMID: 21482446.
Altex Proceedings of the 9th World Congress on Alternatives and Animal Use in the Life
Sciences, 24-28 August 2014, Prague, Czech Republic, Volume 3, No. 1., 2014, ISSN
2194-0479.
Anderson N, Borlak J. Molecular mechanisms and therapeutic targets in steatosis and
steatohepatitis. Pharmacol Rev. 2008 Sep;60(3):311-57. doi: 10.1124/pr.108.00001.
Review. PubMed PMID: 18922966.
Andrews PR, Drug-receptor interactions in 3D QSAR, In Kubinyi H, (Ed.) 3D QSAR in Drug
Design: Vol Drug Design: Volume 1: Theory Methods and Applications, ESCOM,
Leiden, 1993, ISBN 90-72199-14-6

151
Ariens EJ. Affinity and intrinsic activity in the theory of competitive inhibition. I. Problems
and theory. Arch Int Pharmacodyn Ther. 1954 Sep 1;99(1):32-49. PubMed PMID:
13229418.
Ayers SD, Nedrow KL, Gillilan RE, Noy N. Continuous nucleocytoplasmic shuttling underlies
transcriptional activation of PPARgamma by FABP4. Biochemistry. 2007 Jun
12;46(23):6744-52. Epub 2007 May 22. PubMed PMID: 17516629.
Azhar S. Peroxisome proliferator-activated receptors, metabolic syndrome and cardiovascular
disease. Future Cardiol. 2010 Sep;6(5):657-91. doi: 10.2217/fca.10.86. Review.
PubMed PMID: 20932114; PubMed Central PMCID: PMC3246744.
Bai L, Jia Y, Viswakarma N, Huang J, Vluggens A, Wolins NE, Jafari N, Rao MS, Borensztajn
J, Yang G, Reddy JK. Transcription coactivator mediator subunit MED1 is required for
the development of fatty liver in the mouse. Hepatology. 2011 Apr;53(4):1164-74. doi:
10.1002/hep.24155. Erratum in: Hepatology. 2011 Sep 2;54(3):1114. PubMed PMID:
21480322; PubMed Central PMCID: PMC3076129.
Bal-Price A, Crofton KM, Sachana M, Shafer TJ, Behl M, Forsby A, Hargreaves A,
Landesmann B, Lein PJ, Louisse J, Monnet-Tschudi F, Paini A, Rolaki A, Schrattenholz
A, Suñol C, van Thriel C, Whelan M, Fritsche E. Putative adverse outcome pathways
relevant to neurotoxicity. Crit Rev Toxicol. 2015 Jan;45(1):83-91. doi:
10.3109/10408444.2014.981331. Review. PubMed PMID: 25605028.
Barak Y, Nelson MC, Ong ES, Jones YZ, Ruiz-Lozano P, Chien KR, Koder A, Evans RM.
PPAR gamma is required for placental, cardiac, and adipose tissue development. Mol
Cell. 1999 Oct;4(4):585-95. PubMed PMID: 10549290.
Batista MR, Martínez L. Conformational Diversity of the Helix 12 of the Ligand Binding
Domain of PPARγ and Functional Implications. J Phys Chem B. 2015 Dec
17;119(50):15418-29. doi: 10.1021/acs.jpcb.5b09824. Epub 2015 Dec 3. PubMed
PMID: 26598113.
Baumann, K.; Stiefl, N. J. Comput. Aided Mol. Des. 2004, 18, 549
Bedogni G, Bellentani S. Fatty liver: how frequent is it and why?. Ann Hepatol. 2004; 3: 63-
65; Starley BQ, Calcagno CJ, Harrison SA. Nonalcoholic fatty liver disease and
hepatocellular carcinoma: a weighty connection. Hepatology. 2010 May;51(5):1820-32.
doi: 10.1002/hep.23594. Review. PubMed PMID: 20432259.
Bénardeau A, Benz J, Binggeli A, Blum D, Boehringer M, Grether U, Hilpert H, Kuhn B, Märki
HP, Meyer M, Püntener K, Raab S, Ruf A, Schlatter D, Mohr P. Aleglitazar, a new,

152
potent, and balanced dual PPARalpha/gamma agonist for the treatment of type II
diabetes. Bioorg Med Chem Lett. 2009 May 1;19(9):2468-73. doi:
10.1016/j.bmcl.2009.03.036. Epub 2009 Mar 14. PubMed PMID: 19349176.
Bento AP, Gaulton A, Hersey A, Bellis LJ, Chambers J, Davies M, Krüger FA, Light Y, Mak
L, McGlinchey S, Nowotka M, Papadatos G, Santos R, Overington JP. The ChEMBL
bioactivity database: an update. Nucleic Acids Res. 2014 Jan;42(Database
issue):D1083-90. doi: 10.1093/nar/gkt1031. Epub 2013 Nov 7. PubMed PMID:
24214965; PubMed Central PMCID: PMC3965067
Berger J, Bailey P, Biswas C, Cullinan CA, Doebber TW, Hayes NS, Saperstein R, Smith RG,
Leibowitz MD. Thiazolidinediones produce a conformational change in peroxisomal
proliferator-activated receptor-gamma: binding and activation correlate with
antidiabetic actions in db/db mice. Endocrinology. 1996 Oct;137(10):4189-95. PubMed
PMID: 8828476
Berger J, Moller DE. The mechanisms of action of PPARs. Annu Rev Med. 2002;53:409-35.
Review. PubMed PMID: 11818483.
Berman HM, Westbrook J, Feng Z, Gilliland G, Bhat TN, Weissig H, Shindyalov IN, Bourne
PE. The Protein Data Bank. Nucleic Acids Res. 2000 Jan 1;28(1):235-42. PubMed
PMID: 10592235; PubMed Central PMCID: PMC102472.
Berthold, M. R.; Cebron, N.; Dill, F.; Gabriel, T. R.; Kötter, T.; Meinl, T.; Ohl, P.; Sieb, C.;
Thiel, K.; Wiswedel, B. KNIME: The Konstanz Information Miner. In Studies in
Classification, Data Analysis, and Knowledge Organisation (GfKL 2007); Springer,
2007
Bhatia LS, Curzen NP, Calder PC, Byrne CD. Non-alcoholic fatty liver disease: a new and
important cardiovascular risk factor? Eur Heart J. 2012 May;33(10):1190-200. doi:
10.1093/eurheartj/ehr453. Epub 2012 Mar 8. Review. PubMed PMID: 22408036.
Bishop-Bailey D, Wray J. Peroxisome proliferator-activated receptors: a critical review on
endogenous pathways for ligand generation. Prostaglandins Other Lipid Mediat. 2003
Apr;71(1-2):1-22. Review. PubMed PMID: 12749590.;
Blaauboer BJ, Barratt MD, Houston JB. The Integrated Use of Alternative Methods in
Toxicological Risk Evaluation - ECVAM Integrated Testing Strategies Task Force
Report 1. Altern Lab Anim. 1999 Mar-Apr;27(2):229-37. PubMed PMID: 25426587.

153
Boobis AR, Cohen SM, Dellarco V, McGregor D, Meek ME, Vickers C, Willcocks D, Farland
W. IPCS framework for analyzing the relevance of a cancer mode of action for humans.
Crit Rev Toxicol. 2006 Nov-Dec;36(10):781-92. PubMed PMID: 17118728.
Boobis AR, Doe JE, Heinrich-Hirsch B, Meek ME, Munn S, Ruchirawat M, Schlatter J, Seed
J, Vickers C. IPCS framework for analyzing the relevance of a noncancer mode of action
for humans. Crit Rev Toxicol. 2008;38(2):87-96. doi: 10.1080/10408440701749421.
Review. PubMed PMID: 18259981.
Brown JD, Plutzky J. Peroxisome proliferator-activated receptors as transcriptional nodal
points and therapeutic targets. Circulation. 2007 Jan 30;115(4):518-33. Review.
PubMed PMID: 17261671.
Bruning JB, Chalmers MJ, Prasad S, Busby SA, Kamenecka TM, He Y, Nettles KW, Griffin
PR. Partial agonists activate PPARgamma using a helix 12 independent mechanism.
Structure. 2007 Oct;15(10):1258-71. PubMed PMID: 17937915.
Bugge A, Mandrup S. Molecular Mechanisms and Genome-Wide Aspects of PPAR Subtype
Specific Transactivation. PPAR Res. 2010;2010. pii: 169506. doi:
10.1155/2010/169506. Epub 2010 Aug 31. PubMed PMID: 20862367; PubMed Central
PMCID: PMC2938449.
Burden N, Mahony C, Müller BP, Terry C, Westmoreland C, Kimber I. Aligning the 3Rs with
new paradigms in the safety assessment of chemicals. Toxicology. 2015 Apr 1;330:62-
6. Review. PubMed PMID: 25932488.
Burgermeister E, Seger R. MAPK kinases as nucleo-cytoplasmic shuttles for PPARgamma.
Cell Cycle. 2007 Jul 1;6(13):1539-48. Epub 2007 May 18. Review. PubMed PMID:
17611413.
Carrieri A, Giudici M, Parente M, De Rosas M, Piemontese L, Fracchiolla G, Laghezza A,
Tortorella P, Carbonara G, Lavecchia A, Gilardi F, Crestani M, Loiodice F. Molecular
determinants for nuclear receptors selectivity: chemometric analysis, dockings and site-
directed mutagenesis of dual peroxisome proliferator-activated receptors α/γ agonists.
Eur J Med Chem. 2013 May;63:321-32. doi: 10.1016/j.ejmech.2013.02.015. Epub 2013
Feb 24. PubMed PMID: 23502212.
Casimiro-Garcia A, Bigge CF, Davis JA, Padalino T, Pulaski J, Ohren JF, McConnell P, Kane
CD, Royer LJ, Stevens KA, Auerbach B, Collard W, McGregor C, Song K. Synthesis
and evaluation of novel alpha-heteroaryl-phenylpropanoic acid derivatives as

154
PPARalpha/gamma dual agonists. Bioorg Med Chem. 2009 Oct 15;17(20):7113-25.
doi: 10.1016/j.bmc.2009.09.001. Epub 2009 Sep 6. PubMed PMID: 19783444.
Casimiro-Garcia A, Bigge CF, Davis JA, Padalino T, Pulaski J, Ohren JF, McConnell P, Kane
CD, Royer LJ, Stevens KA, Auerbach BJ, Collard WT, McGregor C, Fakhoury SA,
Schaum RP, Zhou H. Effects of modifications of the linker in a series of
phenylpropanoic acid derivatives: Synthesis, evaluation as PPARalpha/gamma dual
agonists, and X-ray crystallographic studies. Bioorg Med Chem. 2008 May
1;16(9):4883-907. doi: 10.1016/j.bmc.2008.03.043. Epub 2008 Mar 20. PubMed PMID:
18394907.
Chabowski A, Górski J, Luiken JJ, Glatz JF, Bonen A. Evidence for concerted action of
FAT/CD36 and FABPpm to increase fatty acid transport across the plasma membrane.
Prostaglandins Leukot Essent Fatty Acids. 2007 Nov-Dec;77(5-6):345-53. Review.
PubMed PMID: 18240411.
Chandra V, Huang P, Hamuro Y, Raghuram S, Wang Y, Burris TP, Rastinejad F. Structure of
the intact PPAR-gamma-RXR- nuclear receptor complex on DNA. Nature. 2008 Nov
20;456(7220):350-6. doi: 10.1038/nature07413. PubMed PMID: 19043829; PubMed
Central PMCID: PMC2743566.
Chawla A, Boisvert WA, Lee CH, Laffitte BA, Barak Y, Joseph SB, Liao D, Nagy L, Edwards
PA, Curtiss LK, Evans RM, Tontonoz P. A PPAR gamma-LXR-ABCA1 pathway in
macrophages is involved in cholesterol efflux and atherogenesis. Mol Cell. 2001
Jan;7(1):161-71. PubMed PMID: 11172721.
Chawla A, Schwarz EJ, Dimaculangan DD, Lazar MA. Peroxisome proliferator-activated
receptor (PPAR) gamma: adipose-predominant expression and induction early in
adipocyte differentiation. Endocrinology. 1994 Aug;135(2):798-800. PubMed PMID:
8033830.
Chen W, Chang B, Saha P, Hartig SM, Li L, Reddy VT, Yang Y, Yechoor V, Mancini MA,
Chan L. Berardinelli-seip congenital lipodystrophy 2/seipin is a cell-autonomous
regulator of lipolysis essential for adipocyte differentiation. Mol Cell Biol. 2012
Mar;32(6):1099-111. doi: 10.1128/MCB.06465-11. Epub 2012 Jan 23. PubMed PMID:
22269949; PubMed Central PMCID: PMC3295006.
Cherkasov A, Muratov EN, Fourches D, Varnek A, Baskin II, Cronin M, Dearden J, Gramatica
P, Martin YC, Todeschini R, Consonni V, Kuz'min VE, Cramer R, Benigni R, Yang C,
Rathman J, Terfloth L, Gasteiger J, Richard A, Tropsha A. QSAR modeling: where have

155
you been? Where are you going to? J Med Chem. 2014 Jun 26;57(12):4977-5010. doi:
10.1021/jm4004285. Epub 2014 Jan 6. PubMed PMID: 24351051; PubMed Central
PMCID: PMC4074254.;
Chigurupati S, Dhanaraj SA, Balakumar P. A step ahead of PPARγ full agonists to PPARγ
partial agonists: therapeutic perspectives in the management of diabetic insulin
resistance. Eur J Pharmacol. 2015 May 15;755:50-7. doi: 10.1016/j.ejphar.2015.02.043.
Epub 2015 Mar 5. Review. PubMed PMID: 25748601.
Choi SS, Kim ES, Koh M, Lee SJ, Lim D, Yang YR, Jang HJ, Seo KA, Min SH, Lee IH, Park
SB, Suh PG, Choi JH. A novel non-agonist peroxisome proliferator-activated receptor
γ (PPARγ) ligand UHC1 blocks PPARγ phosphorylation by cyclin-dependent kinase 5
(CDK5) and improves insulin sensitivity. J Biol Chem. 2014 Sep 19;289(38):26618-29.
doi: 10.1074/jbc.M114.566794. Epub 2014 Aug 6. PubMed PMID: 25100724; PubMed
Central PMCID: PMC4176243.
Clark AJ, The Mode of Action of Drugs on Cells, London: Edward Arnold, 1933
Clark, R.D., Sprous, D.G. and Leonard, J.M., In Ho¨ ltje, H.-D. and Sippl, W. (Eds.), Rational
Approaches to Drug Design, Prous Science, Barcelona, Spain, 2001, pp. 475– 485.
COM(2013) 135 final, Communication from the Commission to the European Parliament and
the Council on the animal testing and marketing ban and on the state of play in relation
to alternative methods in the field of cosmetics, Brussels, 11.3.2013
Combes RD. In silico methods for toxicity prediction. Adv Exp Med Biol. 2012; 745:96-116.
doi: 10.1007/978-1-4614-3055-1_7. Review. PubMed PMID: 22437815.
Costa V, Gallo MA, Letizia F, Aprile M, Casamassimi A, Ciccodicola A. PPARG: Gene
Expression Regulation and Next-Generation Sequencing for Unsolved Issues. PPAR
Res. 2010;2010. pii: 409168. doi: 10.1155/2010/409168. Epub 2010 Sep 8. PubMed
PMID: 20871817; PubMed Central PMCID: PMC2943117.
Cronet P, Petersen JF, Folmer R, Blomberg N, Sjöblom K, Karlsson U, Lindstedt EL, Bamberg
K. Structure of the PPARalpha and -gamma ligand binding domain in complex with AZ
242; ligand selectivity and agonist activation in the PPAR family. Structure. 2001
Aug;9(8):699-706. PubMed PMID: 11587644.
Cronin M T D and Livingstone D J, Predicting chemical toxicity and fate, CRC Press, ISBN 0-
415-27180-0 2004
Cronin M T D and Richarz A N, Mode of action working group: use of mode of action related
to repeated dose systemic toxicity—a framework for capturing Information, in Towards

156
the Replacement of In Vivo Repeated Dose Systemic Toxicity TestIng, T. Gocht andM.
Schwarz, Eds., vol. 2,pp. 284–289, 2012.
Cronin M., In Silico Toxicology Principles And Applications, 2010, ISBN 13: 9781849730044
Day C. Thiazolidinediones: a new class of antidiabetic drugs. Diabet Med. 1999 Mar;16(3):179-
92. Review. PubMed PMID: 10227562.
Dixit A, Saxena AK. QSAR analysis of PPAR-gamma agonists as anti-diabetic agents. Eur J
Med Chem. 2008 Jan;43(1):73-80. Epub 2007 Mar 18. PubMed PMID:17482722.
Ebdrup S, Pettersson I, Rasmussen HB, Deussen HJ, Frost Jensen A, Mortensen SB, Fleckner
J, Pridal L, Nygaard L, Sauerberg P. Synthesis and biological and structural
characterization of the dual-acting peroxisome proliferator-activated receptor
alpha/gamma agonist ragaglitazar. J Med Chem. 2003 Apr 10;46(8):1306-17. PubMed
PMID: 12672231.
ECETOC (2007). Intelligent testing strategies in ecotoxicology: mode of action approach for
specifically acting chemicals. Technical Report 102. Brussels, Belgium.
ECHA (2008), Guidance on information requirements and chemical safety assessment Chapter
R.6: QSARs and grouping of chemicals, May, 2008.
ECHA (2013), Guidance on Information Requirements and Chemical Safety Assessment,
Chapter R. 7a-Endpoint Specific Guidance, ECHA, Helsinki, Finland, 2013.
Edwards IJ, Berquin IM, Sun H, O'Flaherty JT, Daniel LW, Thomas MJ, Rudel LL, Wykle RL,
Chen YQ: Differential effects of delivery of omega-3 fatty acids to human cancer cells
by low-density lipoproteins versus albumin. Clin Cancer Res 2004, 10(24):8275–8283.
EFSA (2014), Appendix. A – In silico methods for environmental fate and (eco)toxicity In
Technical report on a systematic procedure for the identification of emerging chemical
risks in the food and feed chain, European Food Safety Authority supporting
publication, 2014: EN-547
Ehehalt R, Sparla R, Kulaksiz H, Herrmann T, Füllekrug J, Stremmel W. Uptake of long chain
fatty acids is regulated by dynamic interaction of FAT/CD36 with
cholesterol/sphingolipid enriched microdomains (lipid rafts). BMC Cell Biol. 2008 Aug
13;9:45. doi: 10.1186/1471-2121-9-45. PubMed PMID: 18700980; PubMed Central
PMCID: PMC2533316.
Ehrlich P, Present status of chemotherapy, Ber. Dtsch. Chem. Ges., 1909, 42, 17–47
.

157
European Food Safety Authority (EFSA),TECHNICAL REPORT: A systematic procedure for
the identification of emerging chemical risks in the food and feed chain Appendix. A -
In silico methods for environmental fate and (eco)toxicity), Parma, Italy, 2014, EFSA
supporting publication 2014:EN-547
Fakhrudin N, Ladurner A, Atanasov AG, Heiss EH, Baumgartner L, Markt P, Schuster D,
Ellmerer EP, Wolber G, Rollinger JM, Stuppner H, Dirsch VM. Computer-aided
discovery, validation, and mechanistic characterisation of novel neolignan activators of
peroxisome proliferator-activated receptor gamma. Mol Pharmacol. 2010
Apr;77(4):559-66. doi: 10.1124/mol.109.062141. Epub 2010 Jan 11. PubMed PMID:
20064974; PubMed Central PMCID: PMC3523390.
FAO/WHO (2008) Codex Alimentarius Commission procedural manual, 18th ed. Rome, Food
and Agriculture Organization of the United Nations, Codex Alimentarius Commission
(ftp://ftp.fao.org/codex/Publications/ProcManuals/Manual_18e.pdf)
Fiévet C, Fruchart JC, Staels B. PPARalpha and PPARgamma dual agonists for the treatment
of type 2 diabetes and the metabolic syndrome. Curr Opin Pharmacol. 2006
Dec;6(6):606-14. Epub 2006 Sep 14. Review. PubMed PMID: 16973418.
Fioravanzo Е, Kovarich С, Bassan А, Ciacci А, Al Sharif М, Pajeva I, Alov P, Richarz AN,
Worth AP, Palczewska A, Steinmetz FP, Yang C, Tsakovska I (2015) Use of molecular
modelling approaches for the evaluation of potential binding to nuclear receptors
involved in liver steatosis, SEURAT-1 Final Symposium, 4 December 2015, Brussels,
Belgium
Flach RJ, Qin H, Zhang L, Bennett AM. Loss of mitogen-activated protein kinase phosphatase-
1 protects from hepatic steatosis by repression of cell death-inducing DNA
fragmentation factor A (DFFA)-like effector C (CIDEC)/fat-specific protein 27. J Biol
Chem. 2011 Jun 24;286(25):22195-202. doi: 10.1074/jbc.M110.210237. Epub 2011
Apr 26. PubMed PMID: 21521693; PubMed Central PMCID: PMC3121364.
Fothergill JM. On Digitalis: Its Mode of Action and its Use. Br Med J. 1871 Jul 1;2(548):5-7.
PubMed PMID: 20746286; PubMed Central PMCID: PMC2261609.
Fournier T, Tsatsaris V, Handschuh K, Evain-Brion D. PPARs and the placenta. Placenta. 2007
Feb-Mar;28(2-3):65-76. Epub 2006 Jul 10. Review. PubMed PMID: 16834993.
Fowler BA. Biomarkers in toxicology and risk assessment. EXS. 2012;101:459-70. doi:
10.1007/978-3-7643-8340-4_16. Review. PubMed PMID: 22945579.

158
Gaemers IC, Stallen JM, Kunne C, Wallner C, van Werven J, Nederveen A, Lamers WH.
Lipotoxicity and steatohepatitis in an overfed mouse model for non-alcoholic fatty liver
disease. Biochim Biophys Acta. 2011 Apr;1812(4):447-58. doi:
10.1016/j.bbadis.2011.01.003. Epub 2011 Jan 7. PubMed PMID: 21216282.
Gampe RT Jr, Montana VG, Lambert MH, Miller AB, Bledsoe RK, Milburn MV, Kliewer SA,
Willson TM, Xu HE. Asymmetry in the PPARgamma/RXRalpha crystal structure
reveals the molecular basis of heterodimerization among nuclear receptors. Mol Cell.
2000 Mar;5(3):545-55. PubMed PMID: 10882139.
García-Monzón C, Lo Iacono O, Crespo J, Romero-Gómez M, García-Samaniego J, Fernández-
Bermejo M, Domínguez-Díez A, Rodríguez de Cía J, Sáez A, Porrero JL, Vargas-
Castrillón J, Chávez-Jiménez E, Soto-Fernández S, Díaz A, Gallego-Durán R, Madejón
A, Miquilena-Colina ME. Increased soluble CD36 is linked to advanced steatosis in
nonalcoholic fatty liver disease. Eur J Clin Invest. 2014 Jan;44(1):65-73. doi:
10.1111/eci.12192. Epub 2013 Nov 23. PubMed PMID: 24134687.
Garg A. Acquired and inherited lipodystrophies. N Engl J Med. 2004 Mar 18;350(12):1220-34.
Review. PubMed PMID: 15028826.
Gaulton A, Bellis LJ, Bento AP, Chambers J, Davies M, Hersey A, Light Y, McGlinchey S,
Michalovich D, Al-Lazikani B, Overington JP. ChEMBL: a large-scale bioactivity
database for drug discovery. Nucleic Acids Res. 2012 Jan;40(Database issue):D1100-7.
doi: 10.1093/nar/gkr777. Epub 2011 Sep 23. PubMed PMID: 21948594; PubMed
Central PMCID: PMC3245175.
Gee VM, Wong FS, Ramachandran L, Sethi G, Kumar AP, Yap CW. Identification of novel
peroxisome proliferator-activated receptor-gamma (PPARγ) agonists using molecular
modeling method. J Comput Aided Mol Des. 2014 Nov;28(11):1143-51. doi:
10.1007/s10822-014-9791-6. Epub 2014 Aug 29. PubMed PMID: 25168706.
Geenen S, Taylor PN, Snoep JL, Wilson ID, Kenna JG, Westerhoff HV. Systems biology tools
for toxicology. Arch Toxicol. 2012 Aug;86(8):1251-71. doi: 10.1007/s00204-012-
0857-8. Epub 2012 May 9. Review. PubMed PMID: 22569772.; Hartung T, Hoffmann
S. Food for thought ... on in silico methods in toxicology. ALTEX. 2009;26(3):155-66.
PubMed PMID: 19907903.;
Geng T, Xia L, Russo S, Kamara D, Cowart LA. Prosteatotic genes are associated with
unsaturated fat suppression of saturated fat-induced hepatic steatosis in C57BL/6 mice.

159
Nutr Res. 2015 Sep;35(9):812-22. doi: 10.1016/j.nutres.2015.06.012. Epub 2015 Jul 2.
PubMed PMID: 26277244.
Glatz JF. Lipids and lipid binding proteins: a perfect match. Prostaglandins Leukot Essent Fatty
Acids. 2015 Feb;93:45-9. doi: 10.1016/j.plefa.2014.07.011. Epub 2014 Jul 19. Review.
PubMed PMID: 25154384.
Gleeson MP, Modi S, Bender A, Robinson RL, Kirchmair J, Promkatkaew M, Hannongbua S,
Glen RC. The challenges involved in modeling toxicity data in silico: a review. Curr
Pharm Des. 2012;18(9):1266-91. Review. PubMed PMID: 22316153.
Gocht T, Berggren E, Ahr HJ, Cotgreave I, Cronin MT, Daston G, Hardy B, Heinzle E,
Hescheler J, Knight DJ, Mahony C, Peschanski M, Schwarz M, Thomas RS, Verfaillie
C, White A, Whelan M. The SEURAT-1 approach towards animal free human safety
assessment. ALTEX. 2015;32(1):9-24. doi: http://dx.doi.org/10.14573/altex.1408041.
Epub 2014 Nov 5. PubMed PMID: 25372315.
Goebel M, Wolber G, Markt P, Staels B, Unger T, Kintscher U, Gust R. Characterisation of
new PPARgamma agonists: benzimidazole derivatives-importance of positions 5 and 6,
and computational studies on the binding mode. Bioorg Med Chem. 2010 Aug
15;18(16):5885-95. doi: 10.1016/j.bmc.2010.06.102. Epub 2010 Jul 3. PubMed PMID:
20656494.
Gonzalez IC, Lamar J, Iradier F, Xu Y, Winneroski LL, York J, Yumibe N, Zink R, Montrose-
Rafizadeh C, Etgen GJ, Broderick CL, Oldham BA, Mantlo N. Design and synthesis of
a novel class of dual PPARgamma/delta agonists. Bioorg Med Chem Lett. 2007 Feb
15;17(4):1052-5. Epub 2006 Nov 15. PubMed PMID: 17129725.
Graham DJ, Ouellet-Hellstrom R, MaCurdy TE, Ali F, Sholley C, Worrall C, Kelman JA. Risk
of acute myocardial infarction, stroke, heart failure, and death in elderly Medicare
patients treated with rosiglitazone or pioglitazone. JAMA. 2010 Jul 28;304(4):411-8.
doi: 10.1001/jama.2010.920. Epub 2010 Jun 28. PubMed PMID: 20584880.
Greenberg AS, Coleman RA, Kraemer FB, McManaman JL, Obin MS, Puri V, Yan QW,
Miyoshi H, Mashek DG. The role of lipid droplets in metabolic disease in rodents and
humans. J Clin Invest. 2011 Jun;121(6):2102-10. doi: 10.1172/JCI46069. Epub 2011
Jun 1. Review. PubMed PMID: 21633178; PubMed Central PMCID: PMC3104768.
Grether U, Bénardeau A, Benz J, Binggeli A, Blum D, Hilpert H, Kuhn B, Märki HP, Meyer
M, Mohr P, Püntener K, Raab S, Ruf A, Schlatter D. Design and biological evaluation

160
of novel, balanced dual PPARalpha/gamma agonists. ChemMedChem. 2009
Jun;4(6):951-6. doi: 10.1002/cmdc.200800425. PubMed PMID: 19326383.
Grossman SL, Lessem J. Mechanisms and clinical effects of thiazolidinediones. Expert Opin
Investig Drugs. 1997 Aug;6(8):1025-40. PubMed PMID: 15989661.
Grygiel-Górniak B. Peroxisome proliferator-activated receptors and their ligands: nutritional
and clinical implications--a review. Nutr J. 2014 Feb 14;13:17. doi: 10.1186/1475-2891-
13-17. Review. PubMed PMID: 24524207; PubMed Central PMCID: PMC3943808.
Guasch L, Sala E, Castell-Auví A, Cedó L, Liedl KR, Wolber G, Muehlbacher M, Mulero M,
Pinent M, Ardévol A, Valls C, Pujadas G, Garcia-Vallvé S. Identification of
PPARgamma partial agonists of natural origin (I): development of a virtual screening
procedure and in vitro validation. PLoS One. 2012;7(11):e50816. doi:
10.1371/journal.pone.0050816. Epub 2012b Nov 30. PubMed PMID: 23226391;
PubMed Central PMCID: PMC3511273.
Guasch L, Sala E, Mulero M, Valls C, Salvadó MJ, Pujadas G, Garcia-Vallvé S. Identification
of PPARgamma partial agonists of natural origin (II): in silico prediction in natural
extracts with known antidiabetic activity. PLoS One. 2013;8(2):e55889. doi:
10.1371/journal.pone.0055889. Epub 2013 Feb 6. PubMed PMID: 23405231; PubMed
Central PMCID: PMC3566095.
Guasch L, Sala E, Valls C, Blay M, Mulero M, Arola L, Pujadas G, Garcia-Vallvé S. Structural
insights for the design of new PPARgamma partial agonists with high binding affinity
and low transactivation activity. J Comput Aided Mol Des. 2011 Aug;25(8):717-28. doi:
10.1007/s10822-011-9446-9. Epub 2011 Jun 21. PubMed PMID: 21691811.
Guasch L, Sala E, Valls C, Mulero M, Pujadas G, Garcia-Vallvé S. Development of docking-
based 3D-QSAR models for PPARgamma full agonists. J Mol Graph Model. 2012a
Jun;36:1-9. doi: 10.1016/j.jmgm.2012.03.001. Epub 2012 Mar 14. PubMed PMID:
22503857.
Guo Y, Cordes KR, Farese RV Jr, Walther TC. Lipid droplets at a glance. J Cell Sci. 2009 Mar
15;122(Pt 6):749-52. doi: 10.1242/jcs.037630. PubMed PMID: 19261844; PubMed
Central PMCID: PMC2714424.
Gwon SY, Ahn JY, Kim TW, Ha TY. Zanthoxylum piperitum DC ethanol extract suppresses
fat accumulation in adipocytes and high fat diet-induced obese mice by regulating
adipogenesis. J Nutr Sci Vitaminol (Tokyo). 2012;58(6):393-401. PubMed PMID:
23419397.

161
Handberg A, Højlund K, Gastaldelli A, Flyvbjerg A, Dekker JM, Petrie J, Piatti P, Beck-Nielsen
H; RISC Investigators. Plasma sCD36 is associated with markers of atherosclerosis,
insulin resistance and fatty liver in a nondiabetic healthy population. J Intern Med. 2012
Mar;271(3):294-304. doi: 10.1111/j.1365-2796.2011.02442.x. Epub 2011 Sep 14.
PubMed PMID: 21883535.
Hartung T, Hoffmann S. Food for thought ... on in silico methods in toxicology. ALTEX.
2009;26(3):155-66. PubMed PMID: 19907903.
He J, Lee JH, Febbraio M, Xie W. The emerging roles of fatty acid translocase/CD36 and the
aryl hydrocarbon receptor in fatty liver disease. Exp Biol Med (Maywood). 2011
Oct;236(10):1116-21. doi: 10.1258/ebm.2011.011128. Epub 2011 Sep 1. Review.
PubMed PMID: 21885479.
He Q, Li JK, Li F, Li RG, Zhan GQ, Li G, Du WX, Tan HB. Mechanism of action of
gypenosides on type 2 diabetes and non-alcoholic fatty liver disease in rats. World J
Gastroenterol. 2015 Feb 21;21(7):2058-66. doi: 10.3748/wjg.v21.i7.2058. PubMed
PMID: 25717238; PubMed Central PMCID: PMC4326140.
He Z, Zhu HH, Bauler TJ, Wang J, Ciaraldi T, Alderson N, Li S, Raquil MA, Ji K, Wang S,
Shao J, Henry RR, King PD, Feng GS. Nonreceptor tyrosine phosphatase Shp2
promotes adipogenesis through inhibition of p38 MAP kinase. Proc Natl Acad Sci U S
A. 2013 Jan 2;110(1):E79-88. doi: 10.1073/pnas.1213000110. Epub 2012 Dec 10.
PubMed PMID: 23236157; PubMed Central PMCID: PMC3538237.
Heim M, Johnson J, Boess F, Bendik I, Weber P, Hunziker W, Fluhmann B: Phytanic acid, a
natural peroxisome proliferator-activated receptor (PPAR) agonist, regulates glucose
metabolism in rat primary hepatocytes. FASEB J 2002, 16(7):718–720.
Hemmeryckx B, Gaekens M, Gallacher DJ, Lu HR, Lijnen HR. Effect of rosiglitazone on liver
structure and function in genetically diabetic Akita mice. Basic Clin Pharmacol Toxicol.
2013 Nov;113(5):353-60. doi: 10.1111/bcpt.12104. Epub 2013 Jul 11. PubMed PMID:
23789962.
Hengstler JG, Marchan R, Leist M. Highlight report: towards the replacement of in vivo
repeated dose systemic toxicity testing. Arch Toxicol. 2012 Jan;86(1):13-5. doi:
10.1007/s00204-011-0798-7. PubMed PMID: 22187068.
Henke BR, Blanchard SG, Brackeen MF, Brown KK, Cobb JE, Collins JL, Harrington WW Jr,
Hashim MA, Hull-Ryde EA, Kaldor I, Kliewer SA, Lake DH, Leesnitzer LM, Lehmann
JM, Lenhard JM, Orband-Miller LA, Miller JF, Mook RA Jr, Noble SA, Oliver W Jr,

162
Parks DJ, Plunket KD, Szewczyk JR, Willson TM. N-(2-Benzoylphenyl)-L-tyrosine
PPARgamma agonists. 1. Discovery of a novel series of potent antihyperglycemic and
antihyperlipidemic agents. J Med Chem. 1998 Dec 3;41(25):5020-36. PubMed PMID:
9836620.
Höltje HD, Sippl W, Rognan D, Folkers D, Molecular Modeling: Basic Principles and
Applications, 3rd Revised edition, WILEY-VCH Verlag GmbH & Co. KGaA, 2004,
ISBN: 978-0-471-47878-2
http://biomed.bas.bg/qsarmm/
http://cactus.nci.nih.gov
http://cosmosdb.cosmostox.eu
http://knimewebportal.cosmostox.eu/
https://www.ebi.ac.uk/chembl/
Hu E, Tontonoz P, Spiegelman BM. Transdifferentiation of myoblasts by the adipogenic
transcription factors PPAR gamma and C/EBP alpha. Proc Natl Acad Sci U S A. 1995
Oct 10;92(21):9856-60. PubMed PMID: 7568232; PubMed Central
PMCID:PMC40901.
Huh D, Hamilton GA, Ingber DE. From 3D cell culture to organs-on-chips. Trends Cell Biol.
2011 Dec;21(12):745-54. doi: 10.1016/j.tcb.2011.09.005. Epub 2011 Oct 25. Review.
PubMed PMID: 22033488; PubMed Central PMCID: PMC4386065.
Hwang CS, Loftus TM, Mandrup S, Lane MD. Adipocyte differentiation and leptin expression.
Annu Rev Cell Dev Biol. 1997;13:231-59. Review. PubMed PMID: 9442874.
IPCS (2004) Risk assessment terminology. Geneva, World Health Organisation, International
Programme on Chemical Safety.
Itoh T, Fairall L, Amin K, Inaba Y, Szanto A, Balint BL, Nagy L, Yamamoto K, Schwabe JW.
Structural basis for the activation of PPARgamma by oxidized fatty acids. Nat Struct
Mol Biol. 2008 Sep;15(9):924-31. PubMed PMID: 19172745; PubMed Central
PMCID: PMC2939985.
Houck KA, Richard AM, Judson RS, Martin MT, Reif DM, and Shah I, ToxCast: predicting
toxicity potential through high-throughput bioactivity profiling In High-Throughput
ScreenIng Methods in Toxicity TestIng, P. Steinberg, Ed., pp. 1–31, JohnWiley & Sons,
Hoboken, NJ, USA, 2013.
Kamenecka TM, Busby SA, Kumar N, Choi JH, Banks AS, Vidovic D, Cameron MD, Schurer
SC, Mercer BA, Hodder P, Spiegelman BM, Griffin PR. Potent Anti-Diabetic Actions

163
of a Novel Non-Agonist PPARγ Ligand that Blocks Cdk5-Mediated Phosphorylation.
2011 Jul 5 [updated 2013 Mar 7]. Probe Reports from the NIH Molecular Libraries
Program [Internet]. Bethesda (MD): National Center for Biotechnology Information
(US); 2010-. Available from http://www.ncbi.nlm.nih.gov/books/NBK143191/PubMed
PMID: 23762958.
Kang SI, Kim MH, Shin HS, Kim HM, Hong YS, Park JG, Ko HC, Lee NH, Chung WS, Kim
SJ. A water-soluble extract of Petalonia binghamiae inhibits the expression of
adipogenic regulators in 3T3-L1 preadipocytes and reduces adiposity and weight gain
in rats fed a high-fat diet. J Nutr Biochem. 2010 Dec;21(12):1251-7. doi:
10.1016/j.jnutbio.2009.11.008. Epub 2010 Mar 23. PubMed PMID: 20332066.
Kawano Y, Cohen DE. Mechanisms of hepatic triglyceride accumulation in non-alcoholic fatty
liver disease. J Gastroenterol. 2013 Apr;48(4):434-41. doi: 10.1007/s00535-013-0758-
5. Epub 2013 Feb 9. Review. PubMed PMID: 23397118; PubMed Central PMCID:
PMC3633701.
Keller DA, Juberg DR, Catlin N, Farland WH, Hess FG, Wolf DC, Doerrer NG. Identification
and characterisation of adverse effects in 21st century toxicology. Toxicol Sci. 2012
Apr;126(2):291-7. doi: 10.1093/toxsci/kfr350. Epub 2012 Jan 19. PubMed PMID:
22262567; PubMed Central PMCID: PMC3307604.
Kim E, Li K, Lieu C, Tong S, Kawai S, Fukutomi T, Zhou Y, Wands J, Li J. Expression of
apolipoprotein C-IV is regulated by Ku antigen/peroxisome proliferator-activated
receptor gamma complex and correlates with liver steatosis. J Hepatol. 2008
Nov;49(5):787-98. doi: 10.1016/j.jhep.2008.06.029. Epub 2008 Sep 7. PubMed PMID:
18809223; PubMed Central PMCID: PMC2644636.
Klebe G, Abraham U, Mietzner T. Molecular similarity indices in a comparative analysis
(CoMSIA) of drug molecules to correlate and predict their biological activity. J Med
Chem. 1994 Nov 25;37(24):4130-46. PubMed PMID: 7990113.
Klebe G, Comparative molecular similarity indices analysis: CoMSIA, In Kubinyi H, Folkers
G and Martin YC (Eds.) 3D QSAR in Drug Design: Vol 3, Kluwer Academic
Publishers, Dordrecht, Boston, London, 1998, p. 87-104
Kouskoumvekaki, I.; Petersen, R.K.; Fratev, F.; Taboureau, O.; Nielsen, T.E.; Oprea, T.I.;
Sonne, S.B.; Flindt, E.N.; Jónsdóttir, S.Ó.; Kristiansen, K. Discovery of a Novel
Selective PPARγ Ligand with Partial Agonist Binding Properties by Integrated in
Silico/in Vitro Work Flow. J. Chem. Inf. Model. 2013, 53, 923–937.

164
Krewski D., Acosta D. Jr., Andersen M., Anderson H., Bailar J.C. 3rd, Boekelheide K., Brent
R., Charnley G., Cheung V.G., Green S. Jr, Kelsey K.T., Kerkvliet N.I., Li A.A.,
McCray L., Meyer O., Patterson R.D., Pennie W., Scala R.A., Solomon G.M., Stephens
M., Yager J., Zeise L., 2010. Toxicity testing in the 21st century: a vision and a strategy.
J. Toxicol. Environ. Health. B. Crit. Rev. 13, 51-138. doi:
10.1080/10937404.2010.483176
Kubinyi H, Comparative molecular field analysis (CoMFA). In: SchleyerP.V.R., Allinger NL,
Clark T, Gasteiger J, Kollman P., Schaefer HF, Schreiner PR III, editors. The
Encyclopedia of Computational Chemistry. Chichester, UK: John Wiley & Sons; p.
448–460, 1998
Kubinyi H, QSAR: Hansch Analysis and Related Approaches, In Mannhold R, Krogsgaard-
Larsen P, Timmerman H (Eds.) Methods and principles in medicinal chemistry ; Vol.
I), Weinheim- ; New York ; Basil ; Cambridge ; Tokyo : VCH, 1993
Kubota N, Terauchi Y, Miki H, Tamemoto H, Yamauchi T, Komeda K, Satoh S, Nakano R,
Ishii C, Sugiyama T, Eto K, Tsubamoto Y, Okuno A, Murakami K, Sekihara H,
Hasegawa G, Naito M, Toyoshima Y, Tanaka S, Shiota K, Kitamura T, Fujita T, Ezaki
O, Aizawa S, Kadowaki T, et al. PPAR gamma mediates high-fat diet-induced adipocyte
hypertrophy and insulin resistance. Mol Cell. 1999 Oct;4(4):597-609. Larter CZ, Yeh
MM, Williams J, Bell-Anderson KS, Farrell GC. MCD-induced steatohepatitis is
associated with hepatic adiponectin resistance and adipogenic transformation of
hepatocytes. J Hepatol. 2008 Sep;49(3):407-16. doi: 10.1016/j.jhep.2008.03.026. Epub
2008 Apr 30. PubMed PMID: 18534710. PubMed PMID: 10549291.
Kuhn B, Hilpert H, Benz J, Binggeli A, Grether U, Humm R, Märki HP, Meyer M, Mohr P.
Structure-based design of indole propionic acids as novel PPARalpha/gamma co-
agonists. Bioorg Med Chem Lett. 2006 Aug 1;16(15):4016-20. Epub 2006 Jun 5.
PubMed PMID: 16737814.
Kumadaki S, Karasawa T, Matsuzaka T, Ema M, Nakagawa Y, Nakakuki M, Saito R, Yahagi
N, Iwasaki H, Sone H, Takekoshi K, Yatoh S, Kobayashi K, Takahashi A, Suzuki H,
Takahashi S, Yamada N, Shimano H. Inhibition of ubiquitin ligase F-box and WD
repeat domain-containing 7α (Fbw7α) causes hepatosteatosis through Krüppel-like
factor 5 (KLF5)/peroxisome proliferator-activated receptor γ2 (PPARγ2) pathway but
not SREBP-1c protein in mice. J Biol Chem. 2011 Nov 25;286(47):40835-46. doi:

165
10.1074/jbc.M111.235283. Epub 2011 Sep 12. PubMed PMID: 21911492; PubMed
Central PMCID: PMC3220464.
Kursawe R, Narayan D, Cali AM, Shaw M, Pierpont B, Shulman GI, Caprio S. Downregulation
of ADIPOQ and PPARγ2 gene expression in subcutaneous adipose tissue of obese
adolescents with hepatic steatosis. Obesity (Silver Spring). 2010 Oct;18(10):1911-7.
doi: 10.1038/oby.2010.23. Epub 2010 Feb 18. PubMed PMID: 20168312; PubMed
Central PMCID: PMC3898705.
Kurtz M, Capobianco E, Careaga V, Martinez N, Mazzucco MB, Maier M, Jawerbaum A.
Peroxisome proliferator-activated receptor ligands regulate lipid content, metabolism,
and composition in fetal lungs of diabetic rats. J Endocrinol. 2014 Feb 10;220(3):345-
59. doi: 10.1530/JOE-13-0362. Print 2014 Mar. PubMed PMID: 24389592.
Kus V, Flachs P, Kuda O, Bardova K, Janovska P, Svobodova M, Jilkova ZM, Rossmeisl M,
Wang-Sattler R, Yu Z, Illig T, Kopecky J. Unmasking differential effects of
rosiglitazone and pioglitazone in the combination treatment with n-3 fatty acids in mice
fed a high-fat diet. PLoS One. 2011;6(11):e27126. doi: 10.1371/journal.pone.0027126.
Epub 2011 Nov 3. PubMed PMID: 22073272; PubMed Central PMCID: PMC3207833.
Kuwabara N, Oyama T, Tomioka D, Ohashi M, Yanagisawa J, Shimizu T, Miyachi H.
Peroxisome proliferator-activated receptors (PPARs) have multiple binding points that
accommodate ligands in various conformations: phenylpropanoic acid-type PPAR
ligands bind to PPAR in different conformations, depending on the subtype. J Med
Chem. 2012 Jan 26;55(2):893-902. doi: 10.1021/jm2014293. Epub 2012 Jan 10.
PubMed PMID: 22185225.
Lamers C, Schubert-Zsilavecz M, Merk D. Therapeutic modulators of peroxisome proliferator-
activated receptors (PPAR): a patent review (2008-present). Expert Opin Ther Pat. 2012
Jul;22(7):803-41. doi: 10.1517/13543776.2012.699042. Epub 2012 Jun 15. Review.
PubMed PMID: 22697317.
Landesmann B., Goumenou M., Munn S., and Whelan M., Description of prototype modes-of-
action related to repeated dose toxicity, Reference Report By the Joint Research Centre
of the European Commission, Institute for Health and Consumer Protection, 2012.
Larter CZ, Yeh MM, Van Rooyen DM, Teoh NC, Brooling J, Hou JY, Williams J, Clyne M,
Nolan CJ, Farrell GC. Roles of adipose restriction and metabolic factors in progression
of steatosis to steatohepatitis in obese, diabetic mice. J Gastroenterol Hepatol. 2009

166
Oct;24(10):1658-68. doi: 10.1111/j.1440-1746.2009.05996.x. PubMed PMID:
19788606.
Le TA, Loomba R. Management of Non-alcoholic Fatty Liver Disease and Steatohepatitis. J
Clin Exp Hepatol. 2012 Jun;2(2):156-73. doi: 10.1016/S0973-6883(12)60104-2. Epub
2012 Jul 21. PubMed PMID: 25755424; PubMed Central PMCID: PMC3940181.;
Lee YJ, Ko EH, Kim JE, Kim E, Lee H, Choi H, Yu JH, Kim HJ, Seong JK, Kim KS, Kim JW.
Nuclear receptor PPARγ-regulated monoacylglycerol O-acyltransferase 1 (MGAT1)
expression is responsible for the lipid accumulation in diet-induced hepatic steatosis.
Proc Natl Acad Sci U S A. 2012 Aug 21;109(34):13656-61. doi:
10.1073/pnas.1203218109. Epub 2012 Aug 6. PubMed PMID: 22869740; PubMed
Central PMCID: PMC3427113.
Lefils-Lacourtablaise J, Socorro M, Géloën A, Daira P, Debard C, Loizon E, Guichardant M,
Dominguez Z, Vidal H, Lagarde M, Bernoud-Hubac N. The eicosapentaenoic acid
metabolite 15-deoxy-δ(12,14)-prostaglandin J3 increases adiponectin secretion by
adipocytes partly via a PPARγ-dependent mechanism. PloS One. 2013 May
29;8(5):e63997. doi: 10.1371/journal.pone.0063997. Print 2013. PubMed PMID:
23734181; PubMed Central PMCID: PMC3666990.
Lefterova MI, Lazar MA. New developments in adipogenesis. Trends Endocrinol Metab. 2009
Apr;20(3):107-14. doi: 10.1016/j.tem.2008.11.005. Epub 2009 Mar 9. Review. PubMed
PMID: 19269847.
Lewis SN, Garcia Z, Hontecillas R, Bassaganya-Riera J, Bevan DR. Pharmacophore modeling
improves virtual screening for novel peroxisome proliferator-activated receptor-gamma
ligands. J Comput Aided Mol Des. 2015 May;29(5):421-39. doi: 10.1007/s10822-015-
9831-x. Epub 2015 Jan 24. PubMed PMID: 25616366; PubMed Central PMCID:
PMC4395532.
Li Y, Choi M, Suino K, Kovach A, Daugherty J, Kliewer SA, Xu HE. Structural and
biochemical basis for selective repression of the orphan nuclear receptor liver receptor
homolog 1 by small heterodimer partner. Proc Natl Acad Sci U S A. 2005 Jul
5;102(27):9505-10. Epub 2005 Jun 23. PubMed PMID: 15976031; PubMed Central
PMCID: PMC1157103.
Li Y, Dong J, Ding T, Kuo MS, Cao G, Jiang XC, Li Z. Sphingomyelin synthase 2 activity and
liver steatosis: an effect of ceramide-mediated peroxisome proliferator-activated
receptor γ2 suppression. Arterioscler Thromb Vasc Biol. 2013 Jul;33(7):1513-20. doi:

167
10.1161/ATVBAHA.113.301498. Epub 2013 May 2. PubMed PMID: 23640498;
PubMed Central PMCID: PMC3784343.
Li Y, Kovach A, Suino-Powell K, Martynowski D, Xu HE. Structural and biochemical basis
for the binding selectivity of peroxisome proliferator-activated receptor gamma to PGC-
1alpha. J Biol Chem. 2008a Jul 4;283(27):19132-9. doi: 10.1074/jbc.M802040200.
Epub 2008 May 9. PubMed PMID: 18469005; PubMed Central PMCID: PMC2441548.
Li Y, Zhang J, Schopfer FJ, Martynowski D, Garcia-Barrio MT, Kovach A, Suino-Powell K,
Baker PR, Freeman BA, Chen YE, Xu HE. Molecular recognition of nitrated fatty acids
by PPAR gamma. Nat Struct Mol Biol. 2008b Aug;15(8):865-7. doi:
10.1038/nsmb.1447. Epub 2008 Jul 6. PubMed PMID: 18604218; PubMed Central
PMCID: PMC2538624.
Liao C, Xie A, Zhou J, Shi L, Li Z, Lu XP. 3D QSAR studies on peroxisome proliferator-
activated receptor gamma agonists using CoMFA and CoMSIA. J Mol Model. 2004
Jun;10(3):165-77. Epub 2004 Mar 12. PubMed PMID: 15022104.
Liao Z, Dong J, Wu W, Yang T, Wang T, Guo L, Chen L, Xu D, Wen F. Resolvin D1 attenuates
inflammation in lipopolysaccharide-induced acute lung injury through a process
involving the PPARγ/NF-κB pathway. Respir Res. 2012 Dec 2;13:110. doi:
10.1186/1465-9921-13-110. PubMed PMID: 23199346; PubMed Central PMCID:
PMC3545883.
Liberato MV, Nascimento AS, Ayers SD, Lin JZ, Cvoro A, Silveira RL, Martínez L, Souza PC,
Saidemberg D, Deng T, Amato AA, Togashi M, Hsueh WA, Phillips K, Palma MS,
Neves FA, Skaf MS, Webb P, Polikarpov I. Medium chain fatty acids are selective
peroxisome proliferator activated receptor (PPAR) γ activators and pan-PPAR partial
agonists. PLoS One. 2012;7(5):e36297. doi: 10.1371/journal.pone.0036297. Epub 2012
May 23. PubMed PMID: 22649490; PubMed Central PMCID: PMC3359336.
Lin CH, Peng YH, Coumar MS, Chittimalla SK, Liao CC, Lyn PC, Huang CC, Lien TW, Lin
WH, Hsu JT, Cheng JH, Chen X, Wu JS, Chao YS, Lee HJ, Juo CG, Wu SY, Hsieh HP.
Design and structural analysis of novel pharmacophores for potent and selective
peroxisome proliferator-activated receptor gamma agonists. J Med Chem. 2009 Apr
23;52(8):2618-22. doi: 10.1021/jm801594x. PubMed PMID: 19301897.
Lu Y, Guo Z, Guo Y, Feng J, Chu F. Design, synthesis, and evaluation of 2-
alkoxydihydrocinnamates as PPAR agonists. Bioorg Med Chem Lett. 2006 Feb
15;16(4):915-9. Epub 2005 Nov 21. PubMed PMID: 16300944.

168
Luconi M, Cantini G, Serio M. Peroxisome proliferator-activated receptor gamma
(PPARgamma): Is the genomic activity the only answer? Steroids. 2010 Aug-Sep;75(8-
9):585-94. doi: 10.1016/j.steroids.2009.10.012. Epub 2009 Nov 10. Review. PubMed
PMID: 19900469.
Machado M, Marques-Vidal P, Cortez-Pinto H. Hepatic histology in obese patients undergoing
bariatric surgery. J Hepatol. 2006 Oct;45(4):600-6. Epub 2006 Jul 25. PubMed PMID:
16899321.
Maciejewska D, Ossowski P, Drozd A, Ryterska K, Jamioł-Milc D, Banaszczak M,
Kaczorowska M, Sabinicz A, Raszeja-Wyszomirska J, Stachowska E. Metabolites of
arachidonic acid and linoleic acid in early stages of non-alcoholic fatty liver disease-A
pilot study. Prostaglandins Other Lipid Mediat. 2015 Sep;121(Pt B):184-9. doi:
10.1016/j.prostaglandins.2015.09.003. Epub 2015 Sep 25. PubMed PMID: 26408952.
Magliano DC, Bargut TC, de Carvalho SN, Aguila MB, Mandarim-de-Lacerda CA, Souza-
Mello V. Peroxisome proliferator-activated receptors-alpha and gamma are targets to
treat offspring from maternal diet-induced obesity in mice. PLoS One. 2013 May
20;8(5):e64258. doi: 10.1371/journal.pone.0064258. Print 2013. PubMed PMID:
23700465; PubMed Central PMCID: PMC3658968.
Mahindroo N, Huang CF, Peng YH, Wang CC, Liao CC, Lien TW, Chittimalla SK, Huang WJ,
Chai CH, Prakash E, Chen CP, Hsu TA, Peng CH, Lu IL, Lee LH, Chang YW, Chen
WC, Chou YC, Chen CT, Goparaju CM, Chen YS, Lan SJ, Yu MC, Chen X, Chao YS,
Wu SY, Hsieh HP. Novel indole-based peroxisome proliferator-activated receptor
agonists: design, SAR, structural biology, and biological activities. J Med Chem. 2005
Dec 29;48(26):8194-208. PubMed PMID: 16366601.
Mahindroo N, Peng YH, Lin CH, Tan UK, Prakash E, Lien TW, Lu IL, Lee HJ, Hsu JT, Chen
X, Liao CC, Lyu PC, Chao YS, Wu SY, Hsieh HP. Structural basis for the structure-
activity relationships of peroxisome proliferator-activated receptor agonists. J Med
Chem. 2006b Oct 19;49(21):6421-4. PubMed PMID: 17034149.
Mahindroo N, Wang CC, Liao CC, Huang CF, Lu IL, Lien TW, Peng YH, Huang WJ, Lin YT,
Hsu MC, Lin CH, Tsai CH, Hsu JT, Chen X, Lyu PC, Chao YS, Wu SY, Hsieh HP.
Indol-1-yl acetic acids as peroxisome proliferator-activated receptor agonists: design,
synthesis, structural biology, and molecular docking studies. J Med Chem. 2006a Feb
9;49(3):1212-6. PubMed PMID: 16451087.

169
Manteiga S, Choi K, Jayaraman A, Lee K. Systems biology of adipose tissue metabolism:
regulation of growth, signaling and inflammation. Wiley Interdiscip Rev Syst Biol Med.
2013 Jul-Aug;5(4):425-47. doi: 10.1002/wsbm.1213. Epub 2013 Feb 13. Review.
PubMed PMID: 23408581.
Marciano DP, Kuruvilla DS, Boregowda SV, Asteian A, Hughes TS, Garcia-Ordonez R, Corzo
CA, Khan TM, Novick SJ, Park H, Kojetin DJ, Phinney DG, Bruning JB, Kamenecka
TM, Griffin PR. Pharmacological repression of PPARγ promotes osteogenesis. Nat
Commun. 2015 Jun 12;6:7443. doi: 10.1038/ncomms8443. PubMed PMID: 26068133;
PubMed Central PMCID: PMC4471882.
Markt P, Petersen RK, Flindt EN, Kristiansen K, Kirchmair J, Spitzer G, Distinto S, Schuster
D, Wolber G, Laggner C, Langer T. Discovery of novel PPAR ligands by a virtual
screening approach based on pharmacophore modeling, 3D shape, and electrostatic
similarity screening. J Med Chem. 2008 Oct 23;51(20):6303-17. doi:
10.1021/jm800128k. Epub 2008 Sep 27. PubMed PMID: 18821746.
Markt P, Schuster D, Kirchmair J, Laggner C, Langer T. Pharmacophore modeling and parallel
screening for PPAR ligands. J Comput Aided Mol Des. 2007 Oct-Nov;21(10-11):575-
90. Epub 2007 Oct 25. PubMed PMID: 17960326.
Matsusue K. [Novel mechanism for hepatic lipid accumulation: a physiological role for hepatic
PPARγ-fsp27 signal]. Yakugaku Zasshi. 2012;132(7):823-9. Review. Japanese.
PubMed PMID: 22790028.
Matsusue K. A physiological role for fat specific protein 27/cell death-inducing DFF45-like
effector C in adipose and liver. Biol Pharm Bull. 2010;33(3):346-50. Review. PubMed
PMID: 20190390.
Meek ME, Bucher JR, Cohen SM, Dellarco V, Hill RN, Lehman-McKeeman LD, Longfellow
DG, Pastoor T, Seed J, Patton DE. A framework for human relevance analysis of
information on carcinogenic modes of action. Crit Rev Toxicol. 2003;33(6):591-653.
Review. PubMed PMID: 14727733.
Melagraki, G., Afantitis, A., Sarimveis, H., Koutentis, P.A., Kollias, G., Igglessi-Markopoulou,
O., 2009. Predictive QSAR workflow for the in silico identification and screening of
novel HDAC inhibitors. Mol. Diversity 13, 301–311. doi:10.1007/s11030-009-9115-2
Mellor CL, Steinmetz FP, Cronin MT. The identification of nuclear receptors associated with
hepatic steatosis to develop and extend adverse outcome pathways. Crit Rev Toxicol.
2015 Oct 9:1-15. [Epub ahead of print] PubMed PMID: 26451809.

170
Merk D, Schubert-Zsilavecz M. Nuclear receptors as pharmaceutical targets: rise of FXR and
rebirth of PPAR? Future Med Chem. 2012 Apr;4(5):587-8. doi: 10.4155/fmc.12.8.
PubMed PMID: 22458677.
MOE (Molecular Operating Environment), version 2014.0901; Chemical Computing Group
Inc., 2015, http://www.chemcomp.com.
Morán-Salvador E, López-Parra M, García-Alonso V, Titos E, Martínez-Clemente M,
González-Périz A, López-Vicario C, Barak Y, Arroyo V, Clària J. Role for PPARγ in
obesity-induced hepatic steatosis as determined by hepatocyte- and macrophage-
specific conditional knockouts. FASEB J. 2011 Aug;25(8):2538-50. doi: 10.1096/fj.10-
173716. Epub 2011 Apr 19. PubMed PMID: 21507897.
Mostrag-Szlichtyng, A.S et al. (2014) Poster presented at SOT 53rd Annual Meeting, 24–27
March 2014, Phoenix, Arizona, USA
Moya, M.; Gómez-Lechón, M.J.; Castell, J.V.; Jover, R. Enhanced steatosis by nuclear receptor
ligands: A study in cultured human hepatocytes and hepatoma cells with a characterised
nuclear receptor expression profile. Chem. Biol. Interact. 2010, 184, 376–387.
Mueller, J.J., Schupp, M., Unger, T., Kintscher, U., Heinemann, U. Binding Diversity of
Pioglitazone by Peroxisome Proliferator-Activated Receptor-Gamma.
doi:10.2210/pdb2xkw/pdb
Musso G, Gambino R, Cassader M. Recent insights into hepatic lipid metabolism in non-
alcoholic fatty liver disease (NAFLD). Prog Lipid Res. 2009 Jan;48(1):1-26. doi:
10.1016/j.plipres.2008.08.001. Epub 2008 Sep 9. Review. PubMed PMID: 18824034.
Mysinger MM, Carchia M, Irwin JJ, Shoichet BK. Directory of useful decoys, enhanced (DUD-
E): better ligands and decoys for better benchmarking. J Med Chem. 2012 Jul
26;55(14):6582-94. doi: 10.1021/jm300687e. Epub 2012 Jul 5. PubMed PMID:
22716043; PubMed Central PMCID: PMC3405771.
Nagasaka H, Miida T, Inui A, Inoue I, Tsukahara H, Komatsu H, Hiejima E, Fujisawa T,
Yorifuji T, Hiranao K, Okajima H, Inomata Y. Fatty liver and anti-oxidant enzyme
activities along with peroxisome proliferator-activated receptors γ and α expressions in
the liver of Wilson's disease. Mol Genet Metab. 2012 Nov;107(3):542-7. doi:
10.1016/j.ymgme.2012.08.004. Epub 2012 Aug 11. PubMed PMID: 22940187.
NC3Rs (https://www.nc3rs.org.uk/the-3rs)
Netzeva, T.I., Worth, A., Aldenberg, T., Benigni, R., Cronin, M.T., Gramatica, P., Jaworska,
J.S., Kahn, S., Klopman, G., Marchant, C.A., Myatt, G., Nikolova-Jeliazkova, N.,

171
Patlewicz, G.Y., Perkins, R., Roberts, D., Schultz, T., Stanton, D.W., van de Sandt, J.J.,
Tong, W., Veith, G., Yang, C., 2005. Current status of methods for defining the
applicability domain of (quantitative) structure-activity relationships. The report and
recommendations of ECVAM Workshop 52. Altern Lab Anim. 33, 155-173
Neuschwander-Tetri BA. Hepatic lipotoxicity and the pathogenesis of nonalcoholic
steatohepatitis: the central role of nontriglyceride fatty acid metabolites. Hepatology.
2010 Aug;52(2):774-88. doi: 10.1002/hep.23719. Review. PubMed PMID: 20683968.
Nissen SE et al. Rosiglitazone revisited. An updated meta analysis of risk for myocardial
infarction and cardiovascular mortality. Arch Intern Med
doi:10.1001/archinternmed.2010.207.
Noh JR, Kim YH, Hwang JH, Gang GT, Yeo SH, Kim KS, Oh WK, Ly SY, Lee IK, Lee CH.
Scoparone inhibits adipocyte differentiation through down-regulation of peroxisome
proliferators-activated receptor γ in 3T3-L1 preadipocytes. Food Chem. 2013 Nov
15;141(2):723-30. doi: 10.1016/j.foodchem.2013.04.036. Epub 2013 Apr 19. PubMed
PMID: 23790840.
Nolte, R.T.; Wisely, G.B.; Westin, S.; Cobb, J.E.; Lambert, M.H.; Kurokawa, R.; Rosenfeld,
M.G.; Willson, T.M.; Glass, C.K.; Milburn, M.V. Ligand binding and co-activator
assembly of the peroxisome proliferator-activated receptor-gamma. Nature 1998, 395,
137–143.
North American Free Trade Agreement (NAFTA), Technical Working Group on Pesticides
(TWG). (2011). (Quantitative) Structure Activity Relationship ((Q)SAR) Guidance
Document.
Nosjean O, Boutin JA. Natural ligands of PPARgamma: are prostaglandin J(2) derivatives
really playing the part? Cell Signal. 2002 Jul;14(7):573-83. Review. PubMed PMID:
11955950.
Nuclear Receptors Nomenclature Committee. A unified nomenclature system for the nuclear
receptor superfamily. Cell. 1999 Apr 16;97(2):161-3. PubMed PMID: 10219237.
OECD (2007), Guidance document on the validation of (quantitative)structure-activity
relationships [(Q)SAR] models, OECD Environment Health and Safety Publications
Series on Testing and Assessment No. 69, OECD, Paris, France,
ENV/JM/MONO(2007)2.

172
OECD (2008). Report of the Second Survey on Available Omics Tools. OECD Environment,
Health and Safety Publications Series on Testing and Assessment No. 100.
ENV/JM/MONO(2008)35.
OECD (2011). Report of the Workshop on Using Mechanistic Information in Forming
Chemical Categories. OECD Environment, Health and Safety Publications Series on
Testing and Assessment No. 138. ENV/JM/MONO(2011)8.
OECD (2012) Detailed review paper on the state of the science on novel in vitro and in vivo
screening and testing methods and endpoints for evaluating endocrine disruptors Series
on Testing & Assessment No. 178, ENV/JM/MONO(2012)23;
OECD (2013), Guidance Document on Developing and Assessing Adverse Outcome Pathways,
Series on Testing and Assessment No. 184, OECD, Paris, France,
ENV/JM/MONO(2013)6.
OECD (www.oecd.org/chemicalsafety/testing/adverse-outcome- pathways-molecular-
screening-and-toxicogenomics.htm)
OECD, List of projects on the Adverse Outcome Pathways development programme workplan
(http://www.oecd.org/chemicalsafety/testing/projects-adverse-outcome-pathways.htm;
last access: 19 August 2015)
Ohashi M, Oyama T, Nakagome I, Satoh M, Nishio Y, Nobusada H, Hirono S, Morikawa K,
Hashimoto Y, Miyachi H. Design, synthesis, and structural analysis of phenylpropanoic
acid-type PPARγ-selective agonists: discovery of reversed stereochemistry-activity
relationship. J Med Chem. 2011 Jan 13;54(1):331-41. doi: 10.1021/jm101233f. Epub
2010 Dec 3. PubMed PMID: 21128600.
Ohashi M, Oyama T, Putranto EW, Waku T, Nobusada H, Kataoka K, Matsuno K, Yashiro M,
Morikawa K, Huh NH, Miyachi H. Design and synthesis of a series of α-benzyl
phenylpropanoic acid-type peroxisome proliferator-activated receptor (PPAR) gamma
partial agonists with improved aqueous solubility. Bioorg Med Chem. 2013 Apr
15;21(8):2319-32. doi: 10.1016/j.bmc.2013.02.003. Epub 2013 Feb 14. PubMed PMID:
23490155.
Okumura T. Role of lipid droplet proteins in liver steatosis. J Physiol Biochem. 2011
Dec;67(4):629-36. doi: 10.1007/s13105-011-0110-6. Epub 2011 Aug 17. Review.
PubMed PMID: 21847662.

173
Pan, H.J.; Lin, Y.; Chen, Y.E.; Vance, D.E.; Leiter, E.H. Adverse hepatic and cardiac responses
to rosiglitazone in a new mouse model of type 2 diabetes: Relation to dysregulated
phosphatidylcholine metabolism. Vascul. Pharmacol. 2006, 45, 65–71.
Panasyuk G, Espeillac C, Chauvin C, Pradelli LA, Horie Y, Suzuki A, Annicotte JS, Fajas L,
Foretz M, Verdeguer F, Pontoglio M, Ferré P, Scoazec JY, Birnbaum MJ, Ricci JE,
Pende M. PPARγ contributes to PKM2 and HK2 expression in fatty liver. Nat Commun.
2012 Feb 14;3:672. doi: 10.1038/ncomms1667. PubMed PMID: 22334075; PubMed
Central PMCID: PMC3293420.
Park CY, Park SW. Role of peroxisome proliferator-activated receptor gamma agonist in
improving hepatic steatosis: Possible molecular mechanism. J Diabetes Investig. 2012
Mar 28;3(2):93-5. doi: 10.1111/j.2040-1124.2012.00204.x. PubMed PMID: 24843551;
PubMed Central PMCID: PMC4020725.
Park JE, Oh SH, Cha YS. Lactobacillus plantarum LG42 isolated from gajami ik-hae inhibits
adipogenesis in 3T3-L1 adipocyte. Biomed Res Int. 2013;2013:460927. doi:
10.1155/2013/460927. Epub 2013 Feb 28. PubMed PMID: 23555088; PubMed Central
PMCID: PMC3600254.
Patlewicz G, Ball N, Booth ED, Hulzebos E, Zvinavashe E, Hennes C. Use of category
approaches, read-across and (Q)SAR: general considerations. Regul Toxicol
Pharmacol. 2013 Oct;67(1):1-12. doi: 10.1016/j.yrtph.2013.06.002. Epub 2013 Jun 11.
PubMed PMID: 23764304.; Gleeson MP, Modi S, Bender A, Robinson RL, Kirchmair
J, Promkatkaew M, Hannongbua S, Glen RC. The challenges involved in modeling
toxicity data in silico: a review. Curr Pharm Des. 2012;18(9):1266-91. Review. PubMed
PMID: 22316153.;
Pencheva T, Jereva D, Miteva MA, Pajeva I. Post-docking optimization and analysis of protein-
ligand interactions of estrogen receptor alpha using AMMOS software. Curr Comput
Aided Drug Des. 2013 Mar;9(1):83-94. PubMed PMID: 23106778.
Pingali H, Jain M, Shah S, Makadia P, Zaware P, Goel A, Patel M, Giri S, Patel H, Patel P.
Design and synthesis of novel oxazole containing 1,3-dioxane-2-carboxylic acid
derivatives as PPAR alpha/gamma dual agonists. Bioorg Med Chem. 2008 Aug
1;16(15):7117-27. doi: 10.1016/j.bmc.2008.06.050. Epub 2008 Jun 28. PubMed PMID:
18625559.

174
Polvani S, Tarocchi M, Galli A. PPARγ and Oxidative Stress: Con(β) Catenating NRF2 and
FOXO. PPAR Res. 2012;2012:641087. doi: 10.1155/2012/641087. Epub 2012 Mar 5.
PubMed PMID: 22481913; PubMed Central PMCID: PMC3317010.
Povero D, Feldstein AE. Novel Molecular Mechanisms in the Development of Non-Alcoholic
Steatohepatitis. Diabetes Metab J. 2016 Feb;40(1):1-11. doi: 10.4093/dmj.2016.40.1.1.
Review. PubMed PMID: 26912150; PubMed Central PMCID: PMC4768045.
Prieto P., Testai E., Cronin M., and Mahony C., Current state of the art in repeated dose systemic
toxicity testing, in Towards the Replacement of In Vivo Repeated Dose Systemic
Toxicity TestIng, T. Gocht and M. Schwarz, Eds., vol. 1, pp. 38–46, 2011.
Rabinowitz JR, Goldsmith MR, Little SB, Pasquinelli MA. Computational molecular modeling
for evaluating the toxicity of environmental chemicals: prioritising bioassay
requirements. Environ Health Perspect. 2008 May;116(5):573-7. doi:
10.1289/ehp.11077. PubMed PMID: 18470285; PubMed Central PMCID:
PMC2367647
Rachek LI, Yuzefovych LV, Ledoux SP, Julie NL, Wilson GL. Troglitazone, but not
rosiglitazone, damages mitochondrial DNA and induces mitochondrial dysfunction and
cell death in human hepatocytes. Toxicol Appl Pharmacol. 2009 Nov 1;240(3):348-54.
doi: 10.1016/j.taap.2009.07.021. Epub 2009 Jul 24. PubMed PMID: 19632256; PubMed
Central PMCID: PMC2767118.
Raffa RB, Chapter 3: Experimental Approaches to Determine the Thermodynamics of Protein-
Ligand Interactions, In Böhm HJ and Schneider G (Eds.) Protein-Ligand Interactions:
From Molecular Recognition to Drug Design, Wiley-VCH, Weinheim, 2003, p. 51-72
Ratushny AV, Saleem RA, Sitko K, Ramsey SA, Aitchison JD. Asymmetric positive feedback
loops reliably control biological responses. Mol Syst Biol. 2012 Apr 24;8:577. doi:
10.1038/msb.2012.10. PubMed PMID: 22531117; PubMed Central PMCID:
PMC3361002.
Regulation 1223/2009/EC of the European Parliament and of the Council of 30 November 2009
on cosmetic products, OJ L 342, 22.12.2009, p. 59.
Richarz A.-N., Berthold M. N., Fioravanzo E.,. Neagu D,. Péry A. R. R, Worth A. P., Yang C.
and Cronin M. T. D., II-7-504 Computational approaches for the safety assessment of
cosmetics-related chemicals: results from the COSMOS Project, Abstracts of the 9th
World Congress, Prague, 2014, Volume 3, No. 1, ISSN 2194-0479.

175
Ring A, Le Lay S, Pohl J, Verkade P, Stremmel W. Caveolin-1 is required for fatty acid
translocase (FAT/CD36) localization and function at the plasma membrane of mouse
embryonic fibroblasts. Biochim Biophys Acta. 2006 Apr;1761(4):416-23. Epub 2006
Apr 19. PubMed PMID: 16702023.
Rogue A, Anthérieu S, Vluggens A, Umbdenstock T, Claude N, de la Moureyre-Spire C,
Weaver RJ, Guillouzo A. PPAR agonists reduce steatosis in oleic acid-overloaded
HepaRG cells. Toxicol Appl Pharmacol. 2014 Apr 1;276(1):73-81. doi:
10.1016/j.taap.2014.02.001. Epub 2014 Feb 15. PubMed PMID: 24534255.
Rogue A, Spire C, Brun M, Claude N, Guillouzo A. Gene Expression Changes Induced by
PPAR Gamma Agonists in Animal and Human Liver. PPAR Res. 2010;2010:325183.
doi: 10.1155/2010/325183. Epub 2010 Oct 19. PubMed PMID: 20981297; PubMed
Central PMCID: PMC2963138.
Rosen ED, MacDougald OA. Adipocyte differentiation from the inside out. Nat Rev Mol Cell
Biol. 2006 Dec;7(12):885-96. Review. PubMed PMID: 17139329.
Rosen ED, Sarraf P, Troy AE, Bradwin G, Moore K, Milstone DS, Spiegelman BM, Mortensen
RM. PPAR gamma is required for the differentiation of adipose tissue in vivo and in
vitro. Mol Cell. 1999 Oct;4(4):611-7. PubMed PMID: 10549292.
Ross E, Chapter 2. Pharmacodynamics: Mechanisms of Drug Action and the Relationship
Between Drug Concentration and Effect in Goodman & Gilman's The pharmacological
basis of therapeutics, 9-th edition, McGraw-Hill Co., New York, 1996.
Rücker C, Scarsi M, Meringer M. 2D QSAR of PPARgamma agonist binding and
transactivation. Bioorg Med Chem. 2006 Aug 1;14(15):5178-95. Epub 2006 May 2.
PubMed PMID: 16650995.
Rull A, Geeraert B, Aragonès G, Beltrán-Debón R, Rodríguez-Gallego E, García-Heredia A,
Pedro-Botet J, Joven J, Holvoet P, Camps J. Rosiglitazone and fenofibrate exacerbate
liver steatosis in a mouse model of obesity and hyperlipidemia. A transcriptomic and
metabolomic study. J Proteome Res. 2014 Mar 7;13(3):1731-43. doi:
10.1021/pr401230s. Epub 2014 Jan 30. PubMed PMID: 24479691.;
Russell WMS, Burch RL (1959) The Principles of Humane Experimental Technique,
London:Methuen, London, 1959. (http://altweb.jhsph.edu/pubs/books/humane_exp/chap1a)
Rusu E, Enache G, Jinga M, Dragut R, Nan R, Popescu H, Parpala C, Homentcovschi C,
Nitescu M, Stoian M, Costache A, Posea M, Rusu F, Jinga V, Mischianu D, Radulian
G. Medical nutrition therapy in non-alcoholic fatty liver disease - a review of literature.

176
J Med Life. 2015 Jul-Sep;8(3):258-62. Review. PubMed PMID: 26351523; PubMed
Central PMCID: PMC4556902.
Sahini N, Borlak J. Recent insights into the molecular pathophysiology of lipid droplet
formation in hepatocytes. Prog Lipid Res. 2014 Apr;54:86-112. doi:
10.1016/j.plipres.2014.02.002. Epub 2014 Mar 6. Review. PubMed PMID: 24607340.
Sass DA, Chang P, Chopra KB. Nonalcoholic fatty liver disease: a clinical review. Dig Dis Sci.
2005 Jan;50(1):171-80. Review. PubMed PMID: 15712657.
Satoh H, Ide N, Kagawa Y, Maeda T. Hepatic steatosis with relation to increased expression of
peroxisome proliferator-activated receptor-γ in insulin resistant mice. Biol Pharm Bull.
2013;36(4):616-23. Epub 2013 Feb 2. PubMed PMID: 23386130.
Sauerberg P, Bury PS, Mogensen JP, Deussen HJ, Pettersson I, Fleckner J, Nehlin J,
Frederiksen KS, Albrektsen T, Din N, Svensson LA, Ynddal L, Wulff EM, Jeppesen L.
Large dimeric ligands with favorable pharmacokinetic properties and peroxisome
proliferator-activated receptor agonist activity in vitro and in vivo. J Med Chem. 2003
Nov 6;46(23):4883-94. PubMed PMID: 14584939.
Sauerberg P, Mogensen JP, Jeppesen L, Svensson LA, Fleckner J, Nehlin J, Wulff EM,
Pettersson I. Structure-activity relationships of dimeric PPAR agonists. Bioorg Med
Chem Lett. 2005 Mar 1;15(5):1497-500. PubMed PMID: 15713415.
Sauerberg P, Pettersson I, Jeppesen L, Bury PS, Mogensen JP, Wassermann K, Brand CL,
Sturis J, Wöldike HF, Fleckner J, Andersen AS, Mortensen SB, Svensson LA,
Rasmussen HB, Lehmann SV, Polivka Z, Sindelar K, Panajotova V, Ynddal L, Wulff
EM. Novel tricyclic-alpha-alkyloxyphenylpropionic acids: dual PPARalpha/gamma
agonists with hypolipidemic and antidiabetic activity. J Med Chem. 2002 Feb
14;45(4):789-804. PubMed PMID: 11831892.
Scheen AJ. Hepatotoxicity with thiazolidinediones: is it a class effect? Drug Saf.
2001;24(12):873-88. Review. PubMed PMID: 11735645.
Schneider G, Baringhaus KH, Kubinyi H (Foreword by), Molecular Design: Concepts and
Applications, Wiley-VCH Verlag GmbH & Co. KGaA, 2008, ISBN: 978-3-527-31432-
4
Schultz, T.W. (2010). Adverse outcome pathways: A way of linking chemical structure to in
vivo toxicological hazards. In: Cronin, M.T.D. and Madden, J.C. eds., In Silico
Toxicology: Principles and Applications, The Royal Society of Chemistry, Cambridge,
UK, pp. 346-371.

177
Schultz, p. c., cited in OECD (2013) ENV/JM/MONO(2013)6 as Schultz, personal
communication
Schupp M, Lazar MA. Endogenous ligands for nuclear receptors: digging deeper. J Biol Chem.
2010 Dec 24;285(52):40409-15. doi: 10.1074/jbc.R110.182451. Epub 2010 Oct 18.
Review. PubMed PMID: 20956526; PubMed Central PMCID: PMC3003339.
Seed J, Carney EW, Corley RA, Crofton KM, DeSesso JM, Foster PM, Kavlock R, Kimmel G,
Klaunig J, Meek ME, Preston RJ, Slikker W Jr, Tabacova S, Williams GM, Wiltse J,
Zoeller RT, Fenner-Crisp P, Patton DE. Overview: Using mode of action and life stage
information to evaluate the human relevance of animal toxicity data. Crit Rev Toxicol.
2005 Oct-Nov;35(8-9):664-72. Review. PubMed PMID: 16417033.
Semple RK, Chatterjee VK, O'Rahilly S. PPAR gamma and human metabolic disease. J Clin
Invest. 2006 Mar;116(3):581-9. Review. PubMed PMID: 16511590; PubMed Central
PMCID: PMC1386124.
Serviddio G, Bellanti F, Vendemiale G. Free radical biology for medicine: learning from
nonalcoholic fatty liver disease. Free Radic Biol Med. 2013 Dec;65:952-68. doi:
10.1016/j.freeradbiomed.2013.08.174. Epub 2013 Aug 29. Review. PubMed PMID:
23994574.
SEURAT-1 (http://www.seurat-1.eu)
Shah P, Mittal A, Bharatam PV. CoMFA analysis of dual/multiple PPAR activators. Eur J Med
Chem. 2008 Dec;43(12):2784-91. doi: 10.1016/j.ejmech.2008.01.017. Epub 2008 Jan
30. PubMed PMID: 18321611.
Shao D, Lazar MA. Peroxisome proliferator activated receptor gamma, CCAAT/enhancer-
binding protein alpha, and cell cycle status regulate the commitment to adipocyte
differentiation. J Biol Chem. 1997 Aug 22;272(34):21473-8. PubMed PMID: 9261165.
Sharma MC. Prospective QSAR-based prediction models with pharmacophore studies of
oxadiazole-substituted α-isopropoxy phenylpropanoic acids on with dual activators of
PPARα and PPARγ. Interdiscip Sci. 2014 Sep 2. [Epub ahead of print] PubMed PMID:
25183350.
Shen C, Meng Q, Zhang G. Species-specific toxicity of troglitazone on rats and human by gel
entrapped hepatocytes. Toxicol Appl Pharmacol. 2012 Jan 1;258(1):19-25. doi:
10.1016/j.taap.2011.10.020. Epub 2011 Nov 6. PubMed PMID: 22085495.

178
Sohn YS, Lee Y, Park C, Hwang S, Kim S, Baek A, Son M, Suh JK,
Kim HH, and Lee KW. Peroxisome Proliferator-Activated Receptor Agonist Design
Bull. Korean Chem. Soc. 2011, Vol. 32, No. 1 201 DOI 10.5012/bkcs.2011.32.1.201
Sohn YS, Park C, Lee Y, Kim S, Thangapandian S, Kim Y, Kim HH, Suh JK, Lee KW. Multi-
conformation dynamic pharmacophore modeling of the peroxisome proliferator-
activated receptor γ for the discovery of novel agonists. J Mol Graph Model. 2013
Nov;46:1-9. doi: 10.1016/j.jmgm.2013.08.012. Epub 2013 Aug 22. PubMed PMID:
24104184.
Sonich-Mullin C, Fielder R, Wiltse J, Baetcke K, Dempsey J, Fenner-Crisp P, Grant D, Hartley
M, Knaap A, Kroese D, Mangelsdorf I, Meek E, Rice JM, Younes M; International
Programme on Chemical Safety. IPCS conceptual framework for evaluating a mode of
action for chemical carcinogenesis. Regul Toxicol Pharmacol. 2001 Oct;34(2):146-52.
PubMed PMID: 11603957.
Sos BC, Harris C, Nordstrom SM, Tran JL, Balázs M, Caplazi P, Febbraio M, Applegate MA,
Wagner KU, Weiss EJ. Abrogation of growth hormone secretion rescues fatty liver in
mice with hepatocyte-specific deletion of JAK2. J Clin Invest. 2011 Apr;121(4):1412-
23. doi: 10.1172/JCI42894. Erratum in: J Clin Invest. 2011 Aug 1;121(8):3360. Dosage
error in article text. PubMed PMID: 21364286; PubMed Central PMCID:
PMC3069761.
Souza-Mello V. Peroxisome proliferator-activated receptors as targets to treat non-alcoholic
fatty liver disease. World J Hepatol. 2015 May 18;7(8):1012-9. doi:
10.4254/wjh.v7.i8.1012. PubMed PMID: 26052390; PubMed Central PMCID:
PMC4450178
Stephenson RP. A modification of receptor theory. Br J Pharmacol Chemother. 1956
Dec;11(4):379-93. PubMed PMID: 13383117; PubMed Central PMCID: PMC1510558.
Su X, Abumrad NA. Cellular fatty acid uptake: a pathway under construction. Trends
Endocrinol Metab. 2009 Mar;20(2):72-7. doi: 10.1016/j.tem.2008.11.001. Epub 2009
Jan 29. Review. PubMed PMID: 19185504; PubMed Central PMCID: PMC2845711.
Sun H, Berquin IM, Edwards IJ: Omega-3 polyunsaturated fatty acids regulate syndecan-1
expression in human breast cancer cells. Cancer Res 2005, 65(10):4442–4447.
Sun H, Berquin IM, Owens RT, O'Flaherty JT, Edwards IJ: Peroxisome proliferator-activated
receptor γ-mediated up-regulation of syndecan-1 by n-3 fatty acids promotes apoptosis
of human breast cancer cells. Cancer Res 2008, 68(8):2912–2919.

179
Sundriyal S, Bharatam PV. 'Sum of activities' as dependent parameter: a new CoMFA-based
approach for the design of pan PPAR agonists. Eur J Med Chem. 2009 Jan;44(1):42-53.
doi: 10.1016/j.ejmech.2008.03.014. Epub 2008 Mar 28. PubMed PMID: 18448203.
SYBYL-X, version 2.1, Tripos International, 2013, https://www.certara.com/
Tailleux A, Wouters K, Staels B. Roles of PPARs in NAFLD: potential therapeutic targets.
Biochim Biophys Acta. 2012 May;1821(5):809-18. doi: 10.1016/j.bbalip.2011.10.016.
Epub 2011 Oct 25. Review. PubMed PMID: 22056763.
Takahashi Y, Fukusato T. Histopathology of nonalcoholic fatty liver disease/nonalcoholic
steatohepatitis. World J Gastroenterol. 2014 Nov 14;20(42):15539-48. doi:
10.3748/wjg.v20.i42.15539. Review. PubMed PMID: 25400438; PubMed Central
PMCID: PMC4229519.
Teboul L, Gaillard D, Staccini L, Inadera H, Amri EZ, Grimaldi PA. Thiazolidinediones and
fatty acids convert myogenic cells into adipose-like cells. J Biol Chem. 1995 Nov
24;270(47):28183-7. PubMed PMID: 7499310.
Tontonoz P, Hu E, Spiegelman BM. Stimulation of adipogenesis in fibroblasts by PPAR gamma
2, a lipid-activated transcription factor. Cell. 1994 Dec 30;79(7):1147-56. Erratum in:
Cell 1995 Mar 24;80(6):following 957. PubMed PMID: 8001151.
Törnqvist E, Annas A, Granath B, Jalkesten E, Cotgreave I, Öberg M. Strategic focus on 3R
principles reveals major reductions in the use of animals in pharmaceutical toxicity
testing. PLoS One. 2014 Jul 23;9(7):e101638. doi: 10.1371/journal.pone.0101638.
eCollection 2014. PubMed PMID: 25054864; PubMed Central PMCID: PMC4108312.
TOX21 (http://www.epa.gov/ncct/Tox21/)
Trombetta A, Maggiora M, Martinasso G, Cotogni P, Canuto RA, Muzio G: Arachidonic and
docosahexaenoic acids reduce the growth of A549 human lung-tumor cells increasing
lipid peroxidation and PPARs. Chem Biol Interact 2007, 165(3):239–250.
Tropsha, A., Gramatica, P., Gombar, V., 2003. The importance of being earnest: validation is
the absolute essential for successful application and interpretation of QSPR models.
QSAR Comb. Sci. 2, 69–77. doi: 10.1002/qsar.200390007
Tsakovska I, Al Sharif M, Alov P, Diukendjieva A, Fioravanzo E, Cronin MT, Pajeva I.
Molecular modelling study of the PPARγ receptor in relation to the mode of
action/adverse outcome pathway framework for liver steatosis. Int J Mol Sci. 2014 May
5;15(5):7651-66. doi: 10.3390/ijms15057651. PubMed PMID: 24857909; PubMed
Central PMCID: PMC4057697.

180
Tsakovska I, Al Sharif M, Fioravanzo E, Bassan A, Kovarich S, Vitcheva V, Mostrag-
Szlichtyng A, Yang C, Steinmetz F, Cronin M (2015) In silico approaches to support
liver toxicity screening of chemicals: Case study on molecular modelling of ligands -
nuclear receptors interactions to predict potential steatogenic effects. 51st Congress of
the European Societies of Toxicology (EUROTOX), 13-16 September 2015, Porto,
Portugal
Tsukahara T, Tsukahara R, Fujiwara Y, Yue J, Cheng Y, Guo H, Bolen A, Zhang C, Balazs L,
Re F, Du G, Frohman MA, Baker DL, Parrill AL, Uchiyama A, Kobayashi T,
Murakami-Murofushi K, Tigyi G. Phospholipase D2-dependent inhibition of the
nuclear hormone receptor PPARgamma by cyclic phosphatidic acid. Mol Cell. 2010
Aug 13;39(3):421-32. doi: 10.1016/j.molcel.2010.07.022. PubMed PMID: 20705243;
PubMed Central PMCID: PMC3446787.
U.S. EPA (U.S. Environmental Protection Agency). (1999) Guidelines for carcinogen risk
assessment (review draft). Risk Assessment Forum, Washington, DC. NCEA-F-0644.
Available from: http://www.epa.gov/ncea/raf/cancer.htm
Valerio LG Jr. In silico toxicology for the pharmaceutical sciences. Toxicol Appl Pharmacol.
2009 Dec 15;241(3):356-70. doi: 10.1016/j.taap.2009.08.022. Epub 2009 Aug 28.
Review. PubMed PMID: 19716836.
Vanni E, Bugianesi E, Kotronen A, De Minicis S, Yki-Järvinen H, Svegliati-Baroni G. From
the metabolic syndrome to NAFLD or vice versa? Dig Liver Dis. 2010 May;42(5):320-
30. doi: 10.1016/j.dld.2010.01.016. Epub 2010 Mar 6. Review. PubMed PMID:
20207596.
Vedani A, Descloux AV, Spreafico M, Ernst B. Predicting the toxic potential of drugs and
chemicals in silico: a model for the peroxisome proliferator-activated receptor gamma
(PPAR gamma). Toxicol Lett. 2007 Aug 30;173(1):17-23. Epub 2007 Jun 20. PubMed
PMID: 17643875.
Viccica G, Francucci CM, Marcocci C. The role of PPARγ for the osteoblastic differentiation.
J Endocrinol Invest. 2010;33(7 Suppl):9-12. Review. PubMed PMID: 20938219.
Videla LA, Pettinelli P. Misregulation of PPAR Functioning and Its Pathogenic Consequences
Associated with Nonalcoholic Fatty Liver Disease in Human Obesity. PPAR Res.
2012;2012:107434. doi: 10.1155/2012/107434. Epub 2012 Dec 9. PubMed PMID:
23304111; PubMed Central PMCID: PMC3526338.
Vidović D, Busby SA, Griffin PR, Schürer SC. A combined ligand- and structure-based virtual
screening protocol identifies submicromolar PPARγ partial agonists. ChemMedChem.

181
2011 Jan 3;6(1):94-103. doi: 10.1002/cmdc.201000428. PubMed PMID: 21162086;
PubMed Central PMCID: PMC3517154.
Villeneuve DL, Garcia-Reyero N. Vision & strategy: Predictive ecotoxicology in the 21st
century. Environ Toxicol Chem. 2011 Jan;30(1):1-8. doi: 10.1002/etc.396. PubMed
PMID: 21182100.
Vinken M, Pauwels M, Ates G, Vivier M, Vanhaecke T, Rogiers V. Screening of repeated dose
toxicity data present in SCC(NF)P/SCCS safety evaluations of cosmetic ingredients.
Arch Toxicol. 2012 Mar;86(3):405-12. doi: 10.1007/s00204-011-0769-z. Epub 2011
Oct 29. PubMed PMID: 22038139.
Virtue S, Vidal-Puig A. Adipose tissue expandability, lipotoxicity and the Metabolic
Syndrome--an allostatic perspective. Biochim Biophys Acta. 2010 Mar;1801(3):338-
49. doi: 10.1016/j.bbalip.2009.12.006. Epub 2010 Jan 6. Review. PubMed PMID:
20056169.
Vitcheva V, Mostrag-Szlichtyng A, Sacher O, Bienfait B, Shwab C, Tzakovska I, Al Sharif M,
Pazeva I, Yang C(2015) In vivo data mining and in silico metabolic profiling to predict
diverse hepatotoxic phenotypes: Case study of piperonyl butoxide. 51st Congress of the
European Societies of Toxicology (EUROTOX), 13-16 September 2015, Porto,
Portugal
Wakabayashi K, Okamura M, Tsutsumi S, Nishikawa NS, Tanaka T, Sakakibara I, Kitakami J,
Ihara S, Hashimoto Y, Hamakubo T, Kodama T, Aburatani H, Sakai J. The peroxisome
proliferator-activated receptor gamma/retinoid X receptor alpha heterodimer targets the
histone modification enzyme PR-Set7/Setd8 gene and regulates adipogenesis through a
positive feedback loop. Mol Cell Biol. 2009 Jul;29(13):3544-55. doi:
10.1128/MCB.01856-08. Epub 2009 May 4. PubMed PMID: 19414603; PubMed
Central PMCID: PMC2698772.
Waku T, Shiraki T, Oyama T, Maebara K, Nakamori R, Morikawa K. The nuclear receptor
PPARγ individually responds to serotonin- and fatty acid-metabolites. EMBO J. 2010
Oct 6;29(19):3395-407. doi: 10.1038/emboj.2010.197. Epub 2010 Aug 17. PubMed
PMID: 20717101; PubMed Central PMCID: PMC2957204.
Wang XJ, Zhang J, Wang SQ, Xu WR, Cheng XC, Wang RL. Identification of novel
multitargeted PPARα/γ/δ pan agonists by core hopping of rosiglitazone. Drug Des
Devel Ther. 2014 Nov 7;8:2255-62. doi: 10.2147/DDDT.S70383. eCollection 2014.
PubMed PMID: 25422585; PubMed Central PMCID: PMC4232041.;
Wang Y, Liu Z, Zou W, Hong H, Fang H, Tong W. Molecular regulation of miRNAs and
potential biomarkers in the progression of hepatic steatosis to NASH. Biomark Med.

182
2015 Nov;9(11):1189-200. doi: 10.2217/bmm.15.70. Epub 2015 Oct 28. PubMed
PMID: 26506944.
Wang Z, Dou X, Gu D, Shen C, Yao T, Nguyen V, Braunschweig C, Song Z. 4-
Hydroxynonenal differentially regulates adiponectin gene expression and secretion via
activating PPARγ and accelerating ubiquitin-proteasome degradation. Mol Cell
Endocrinol. 2012 Feb 26;349(2):222-31. doi: 10.1016/j.mce.2011.10.027. Epub 2011
Nov 10. PubMed PMID: 22085560; PubMed Central PMCID: PMC3594100.
Watanabe KH, Andersen ME, Basu N, Carvan MJ 3rd, Crofton KM, King KA, Suñol C,
Tiffany-Castiglioni E, Schultz IR. Defining and modeling known adverse outcome
pathways: Domoic acid and neuronal signaling as a case study. Environ Toxicol Chem.
2011 Jan;30(1):9-21. doi: 10.1002/etc.373. PubMed PMID: 20963854.
Weaver S, Gleeson MP. The importance of the domain of applicability in QSAR modeling. J
Mol Graph Model. 2008 Jun;26(8):1315-26. doi: 10.1016/j.jmgm.2008.01.002. Epub
2008 Jan 18. PubMed PMID: 18328754.
Weismann D, Erion DM, Ignatova-Todorava I, Nagai Y, Stark R, Hsiao JJ, Flannery C,
Birkenfeld AL, May T, Kahn M, Zhang D, Yu XX, Murray SF, Bhanot S, Monia BP,
Cline GW, Shulman GI, Samuel VT. Knockdown of the gene encoding Drosophila
tribbles homologue 3 (Trib3) improves insulin sensitivity through peroxisome
proliferator-activated receptor-γ (PPAR-γ) activation in a rat model of insulin resistance.
Diabetologia. 2011 Apr;54(4):935-44. doi: 10.1007/s00125-010-1984-5. Epub 2010
Dec 29. PubMed PMID: 21190014; PubMed Central PMCID: PMC4061906.
Wermuth, CG , Ganellin, CR , Lindberg, P , Mitscher, LA, Glossary of Terms Used in
Medicinal Chemistry (IUPAC Recommendations 1998); Pure & Appl. Chem. 70:5
(1998) 1129–1143.
Wold, S; Eriksson, L. In Chemometric Methods in Molecular Design; van de Waterbeemd, H.,
Ed.; VCH: Weinheim, 1995; pp 309–318. 59.
World Gastroenterology Organisation Global Guidelines. Nonalcoholic Fatty Liver Disease
and Nonalcoholic Steatohepatitis, 2012.
WHO, World Health Organisation (2009a), Chapter 2 Risk Assessment and its Role in Risk
Analysis In Environmental Health Criteria 240: Principles and Methods for the Risk
Assessment of Chemicals in Food. WHO, Geneva,
http://www.who.int/foodsafety/publications/chemical-food/en/
WHO, World Health Organisation (2009b), Annex 1: Glossary of Terms, page A-24 In
Environmental Health Criteria 240: Principles and Methods for the Risk Assessment of

183
Chemicals in Food. WHO, Geneva,
http://www.who.int/foodsafety/publications/chemical-food/en/
Xiao B, Su M, Kim EL, Hong J, Chung HY, Kim HS, Yin J, Jung JH. Synthesis of PPAR-γ
activators inspired by the marine natural product, paecilocin A. Mar Drugs. 2014 Feb
13;12(2):926-39. doi: 10.3390/md12020926. PubMed PMID: 24531188; PubMed
Central PMCID: PMC3944523.
Xu HE, Lambert MH, Montana VG, Plunket KD, Moore LB, Collins JL, Oplinger JA, Kliewer
SA, Gampe RT Jr, McKee DD, Moore JT, Willson TM. Structural determinants of
ligand binding selectivity between the peroxisome proliferator-activated receptors. Proc
Natl Acad Sci U S A. 2001 Nov 20;98(24):13919-24. Epub 2001 Nov 6. PubMed PMID:
11698662; PubMed Central PMCID: PMC61142.
Xu J, Kulkarni SR, Donepudi AC, More VR, Slitt AL. Enhanced Nrf2 activity worsens insulin
resistance, impairs lipid accumulation in adipose tissue, and increases hepatic steatosis
in leptin-deficient mice. Diabetes. 2012 Dec;61(12):3208-18. doi: 10.2337/db11-1716.
Epub 2012 Aug 30. PubMed PMID: 22936178; PubMed Central PMCID:
PMC3501889.
Xu S, Jay A, Brunaldi K, Huang N, Hamilton JA. CD36 enhances fatty acid uptake by
increasing the rate of intracellular esterification but not transport across the plasma
membrane. Biochemistry. 2013 Oct 15;52(41):7254-61. doi: 10.1021/bi400914c. Epub
2013 Oct 3. PubMed PMID: 24090054.
Yamada K, Mizukoshi E, Sunagozaka H, Arai K, Yamashita T, Takeshita Y, Misu H, Takamura
T, Kitamura S, Zen Y, Nakanuma Y, Honda M, Kaneko S. Characteristics of hepatic
fatty acid compositions in patients with nonalcoholic steatohepatitis. Liver Int. 2015
Feb;35(2):582-90. doi: 10.1111/liv.12685. Epub 2014 Oct 10. PubMed PMID:
25219574.
Yamazaki T, Shiraishi S, Kishimoto K, Miura S, Ezaki O. An increase in liver PPARγ2 is an
initial event to induce fatty liver in response to a diet high in butter: PPARγ2 knockdown
improves fatty liver induced by high-saturated fat. J Nutr Biochem. 2011 Jun;22(6):543-
53. doi: 10.1016/j.jnutbio.2010.04.009. Epub 2010 Aug 30. PubMed PMID: 20801631.
Yang C, Tarkhov A, Marusczyk J, Bienfait B, Gasteiger J, Kleinoeder T, Magdziarz T, Sacher
O, Schwab CH, Schwoebel J, Terfloth L, Arvidson K, Richard A, Worth A, Rathman J.
New publicly available chemical query language, CSRML, to support chemotype
representations for application to data mining and modeling. J Chem Inf Model. 2015
Mar 23;55(3):510-28. doi: 10.1021/ci500667v. Epub 2015 Feb 19. PubMed PMID:
25647539.; https://chemotyper.org

184
Yang ZH, Miyahara H, Iwasaki Y, Takeo J, Katayama M: Dietary supplementation with long-
chain monounsaturated fatty acids attenuates obesity-related metabolic dysfunction and
increases expression of PPAR gamma in adipose tissue in type 2 diabetic KK-Ay mice.
Nutr Metab (Lond) 2013, 10(1):16.
Yu S, Matsusue K, Kashireddy P, Cao WQ, Yeldandi V, Yeldandi AV, Rao MS, Gonzalez FJ,
Reddy JK. Adipocyte-specific gene expression and adipogenic steatosis in the mouse
liver due to peroxisome proliferator-activated receptor gamma1 (PPARgamma1)
overexpression. J Biol Chem. 2003 Jan 3;278(1):498-505. Epub 2002 Oct 24. PubMed
PMID: 12401792.
Zhang H, Ryono DE, Devasthale P, Wang W, O'Malley K, Farrelly D, Gu L, Harrity T, Cap
M, Chu C, Locke K, Zhang L, Lippy J, Kunselman L, Morgan N, Flynn N, Moore L,
Hosagrahara V, Zhang L, Kadiyala P, Xu C, Doweyko AM, Bell A, Chang C,
Muckelbauer J, Zahler R, Hariharan N, Cheng PT. Design, synthesis and structure-
activity relationships of azole acids as novel, potent dual PPAR alpha/gamma agonists.
Bioorg Med Chem Lett. 2009 Mar 1;19(5):1451-6. doi: 10.1016/j.bmcl.2009.01.030.
Epub 2009 Jan 15. PubMed PMID: 19201606.
Zhu L, Baker SS, Liu W, Tao MH, Patel R, Nowak NJ, Baker RD. Lipid in the livers of
adolescents with nonalcoholic steatohepatitis: combined effects of pathways on
steatosis. Metabolism. 2011 Jul;60(7):1001-11. doi: 10.1016/j.metabol.2010.10.003.
Epub 2010 Nov 13. PubMed PMID: 21075404.

185
PUBLICATIONS AND ACTIVITIES RELATED TO THE PhD THESIS
PUBLICATIONS
SCIENTIFIC PAPERS IN JOURNALS WITH IMPACT FACTOR
1. Al Sharif M, Tsakovska I, Pajeva I, Alov P, Fioravanzo E, Bassan A, Kovarich S, Yang
C, Mostrag-Szlichtyng A, Vitcheva V, Worth AP, Richarz AN, Cronin MTD, The
Application of Molecular Modelling in the Safety Assessment of Chemicals: A Case Study
on Ligand-Dependent PPARγ Dysregulation, Toxicology, 2016, doi:
10.1016/j.tox.2016.01.009.
IF = 3.621 (2014)
2. Al Sharif M, Alov P, Vitcheva V, Pajeva I, Tsakovska I. Modes-of-action related to
repeated dose toxicity: tissue-specific biological roles of PPARγ ligand-dependent
dysregulation in nonalcoholic fatty liver disease, PPAR Research (a special issue PPARs
and Metabolic Syndrome), 2014, Article ID 432647.
IF = 2.509 (2014)
3 citations in:
Mellor CL, Steinmetz FP, Cronin MT. The identification of nuclear receptors associated with
hepatic steatosis to develop and extend adverse outcome pathways, Crit Rev Toxicol. 2016
Feb;46(2):138-52. doi: 10.3109/10408444.2015.1089471
Barbosa AM, Francisco PC, Motta K, Chagas TR, dos Santos C, Rafacho A, Nunes E. Fish
Oil Supplementation Attenuates the Changes in the Plasma Lipids Caused by Dexamethasone
Treatment in Rats, Appl Physiol Nutr Metab, 2015, doi: 10.1139/apnm-2015-0487
V. Zuang,B. Desprez, J. Barroso, S. Belz, E. Berggren,, C. Bernasconi, J.Bessems, S.e Bopp,
S. Casati, S. Coecke, R. Corvi, C. Dumont, V. Gouliarmou, C. Griesinger, M. Halder, A.
Janusch-Roi, A. Kienzler, B. Landesmann, F. Madia, A. Milcamps, S. Munn, A. Price, P.
Prieto, M. Schäffer, J. Triebe, C. Wittwehr, A. Worth, M. Whelan.. EURL ECVAM status
report on the development, validation and regulatory acceptance of alternative methods and
approaches, European Union, 2015, pp. 1-114

186
3 Tsakovska I., Al Sharif M, Alov P, Diukendjieva A, Fioravanzo E, Cronin M.T.D, Pajeva
I. Molecular modelling study of PPARγ receptor in relation to the mode of action / adverse
outcome pathway framework for liver steatosis. Int. J. Mol. Sci. 2014, 15, 7651-7666.
(ISSN 1422-0067).
IF = 2.862 (2014)
2 citations in:
Defining Molecular Initiating Events in the Adverse Outcome Pathway Framework for Risk
Assessment By: Allen, Timothy E. H.; Goodman, Jonathan M.; Gutsell, Steve; et al.
CHEMICAL RESEARCH IN TOXICOLOGY Volume: 27 Issue: 12 Pages: 2100-2112
Published: DEC 2014
Zuang V, Desprez B, Barroso J, Belz S, Berggren E, Bernasconi C, Bessems J, Bopp S, Casati
S, Coecke S, Corvi R, Dumont C, Gouliarmou V, Griesinger C, Halder M, Janusch-Roi A,
Kienzler A, Landesmann B, Madia F, Milcamps A, Munn S, Price A, Prieto P, Schäffer M,
Triebe J, Wittwehr C, Worth A, Whelan M. EURL ECVAM status report on the development,
validation and regulatory acceptance of alternative methods and approaches, European
Union, 2015, pp. 1-114.
REPORTS IN PROCEEDINGS
1. Al Sharif M, Alov P, Tsakovska I, Pajeva I. (2015) In silico modelling of full PPARγ
agonists: a step towards liver steatosis risk assessment, International Conference Of Young
Scientists, 11 – 12 June 2015, Plоvdiv, Bulgaria, Scientific Researches of the
Union of Scientists in Bulgaria – Plovdiv, Series G. Medicine, Pharmacy and Dental
medicine, Vol. XVII, p. 182-186, ISSN1311-9427
ABSTRACTS IN JOURNAL PROCEEDINGS
1. Tsakovska I, Al Sharif M, Fioravanzo E, Bassan A, Kovarich S, Vitcheva V, Mostrag-
Szlichtyng A, Yang C, Steinmetz F, Cronin M (2015) In silico approaches to support liver
toxicity screening of chemicals: Case study on molecular modelling of ligands–nuclear
receptors interactions to predict potential steatogenic effects. Toxicology Letters 238
Supplement: S173 IF = 3.262 (2014)
2. Vitcheva V, Al Sharif M, Tsakovska I, Alov P, Mostrag-Szlichtyng A, Cronin MTD, Yang
C, Pajeva I (2014) Description of the MoA/AOP linked with PPARgamma receptor
dysregulation leading to liver fibrosis. Toxicology Letters 229 Supplement: S49
IF = 3.262 (2014)

187
3. Diukendjieva A, Al Sharif M, Alov P, Tsakovska I, Pajeva I (2014) PPARγ agonists and
liver steatosis: mode-of-action characterisation and in silico study, Journal of Biomedical
and Clinical Research, vol.7, n.1, suppl.1, p.39
4. Al Sharif M, Tsakovska I, Alov P, Vitcheva V, Pajeva I (2014) PPARγ-related hepatotoxic
mode-of-action: quantitative characterization and in silico study of the molecular initiating
event involving receptor activation. Altex Proceedings 3, 1/14: 56-57
IF = 5.467 (2014)
5. Al Sharif M, Alov P, Cronin M, Fioravanzo E, Tsakovska I, Vitcheva V, Worth A, Yang
C, Pajeva I (2013) Toward better understanding of liver steatosis MoA: Molecular
modelling study of PPAR gamma receptor. Toxicology Letters 221 Supplement: S85
IF = 3.262 (2014)
1 citation in:
Sullivan KM, Manuppello JR, Willett CE. Building on a solid foundation: SAR and QSAR as a
fundamental strategy to reduce animal testing. SAR QSAR Environ Res. 2014, 25: 357-365.
CONTRIBUTIONS TO INTERNATIONAL SCIENTIFIC EVENTS
POSTERS
1. Fioravanzo Е, Kovarich С, Bassan А, Ciacci А, Al Sharif М, Pajeva I, Alov P, Richarz
AN, Worth AP, Palczewska A, Steinmetz FP, Yang C, Tsakovska I (2015) Use of
molecular modelling approaches for the evaluation of potential binding to nuclear receptors
involved in liver steatosis, SEURAT-1 Final Symposium, 4 December 2015, Brussels,
Belgium
2. Tsakovska I, Al Sharif M, Fioravanzo E, Bassan A, Kovarich S, Vitcheva V, Mostrag-
Szlichtyng A, Yang C, Steinmetz F, Cronin M (2015) In silico approaches to support liver
toxicity screening of chemicals: Case study on molecular modelling of ligands - nuclear
receptors interactions to predict potential steatogenic effects. 51st Congress of the
European Societies of Toxicology (EUROTOX), 13-16 September 2015, Porto, Portugal
3. Vitcheva V, Mostrag-Szlichtyng A, Sacher O, Bienfait B, Shwab C, Tzakovska I, Al Sharif
M, Pazeva I, Yang C(2015) In vivo data mining and in silico metabolic profiling to predict
diverse hepatotoxic phenotypes: Case study of piperonyl butoxide. 51st Congress of the
European Societies of Toxicology (EUROTOX), 13-16 September 2015, Porto, Portugal
4. Tsakovska I, Kovarich S, Bassan A, Ciacci A, Al Sharif M, Pajeva I, Alov P, Cronin MTD,
Worth A, Palczewska A, Steinmetz FP, Yang C, Fioravanzo E (2015) Modelling studies to

188
support the prediction of molecular initiating events for liver steatosis: LXR and PPARγ
binding, SEURAT-1 Fifth Annual Meeting, 21-22 January 2015, Barcelona, Spain
5. Jereva D, Al Sharif M, Diukendjieva A, Alov P, Pencheva T, Tsakovska I., Pajeva I (2014)
Nuclear ERα and PPARγ: receptor- and ligand-based analysis. 16th Congress of the
European Neuroendocrine Association, 10-13 September 2014, Sofia, Bulgaria, Book of
Abstracts - Basic Metabolism, Abstract-ID: 564, p. 88 (Poster award)
6. Vitcheva V, Al Sharif M, Tsakovska I, Alov P, Mostrag-Szlichtyng A, Cronin MTD, Yang
C, Pajeva I (2014) Description of the MoA/AOP linked with PPARgamma receptor
dysregulation leading to liver fibrosis. 50th Congress of the European Societies of
Toxicology (EUROTOX), 7-10 September 2014, Edinburgh, Scotland, UK
7. Tsakovska I, Al Sharif M, Alov P, Vitcheva V, Fioravanzo E, Mostrag-Szlichtyng A, Yang
C, Cronin MTD, Pajeva I (2014) In silico ligand screening based on a pharmacophore
model of PPARγ full agonists. 16Th International Workshop on Quantitative Structure-
Activity Relationships in Environmental and Health Sciences, 16-20 June 2014, Milan,
Italy
8. Kovarich S, Al Sharif M, Alov P, Bassan A, Cronin MTD, Fioravanzo E, Mostrag-
Szlichtyng A, Pajeva I, Tsakovska I, Vitcheva V, Worth AP, Yang C (2014) Molecular
Modelling Studies of LXR and PPAR gamma Receptors in Relation to the MoA/AOP
Framework for Liver Steatosis. SEURAT-1 4th Annual Meeting, 5-6 February 2014,
Barcelona, Spain
9. Tsakovska I, Jereva D, Al Sharif M, Alov P, Diukendjieva A, Pencheva T, Fioravanzo E,
Cronin M, Worth A, Yang C, Pajeva I (2013) Structure- and ligand-based analysis of
ligand-nuclear receptor ERα and PPARγ complexes. CMTPI-2013 - 7th International
Symposium on Computational Methods in Toxicology and Pharmacology Integrating
Internet Resources, 8–11 October 2013, Seoul, Korea
10. Tsakovska I, Al Sharif M, Diukendjieva A, Alov P, Vitcheva V, Fioravanzo E, Cronin M,
Worth A, Yang C, Pajeva I (2013) From PPARγ аctivation to liver steatosis: adverse
outcome pathways description and molecular modelling study. CMTPI-2013 - 7th
International Symposium on Computational Methods in Toxicology and Pharmacology
Integrating Internet Resources, 8–11 October 2013, Seoul, Korea
11. Al Sharif M, Alov P, Cronin M, Fioravanzo E, Tsakovska I, Vitcheva V, Worth A, Yang
C, Pajeva I (2013) Toward better understanding of liver steatosis MoA: Molecular
modelling study of PPAR gamma receptor. 49th Congress of the European Societies of
Toxicology (EUROTOX), 2 September 2013, Interlaken, Switzerland

189
ORAL PRESENTATIONS
1. Al Sharif M, Alov P, Tsakovska I, Pajeva I. (2015) Study of the ligand-dependent
dysregulation of PPARγ – adverse outcome pathways and molecular modelling. Humboldt
Kolleg, Bulgarian-German Scientific Cooperation: Past, Present and Future, 26 – 28
November 2015, Sofia, Bulgaria, Book of abstracts, p. 36
2. Al Sharif M, Alov P, Tsakovska I, Pajeva I. (2015) In silico screening approach to predict
liver toxicity of potential PPARγ agonists. 2nd International Conference on Natural
Products Utilization: from Plant to Pharmacy Shelf (ICNPU), 14 – 17 October 2015,
Plоvdiv, Bulgaria, Book of abstracts, SL-9, p. 46 (Oral presentation award)
3. Al Sharif M, Tsakovska I, Alov P, Pajeva P, Fioravanzo E, Bassan A, Kovarich S,
Mostrag-Szlichtyng A, Vitcheva V, Yang C (2015) From PPARγ ligand dependent
dysregulation to liver steatosis: MoA description and molecular modelling study. CMTPI-
2015 - 8th International Symposium on Computational Methods in Toxicology and
Pharmacology Integrating Internet Resources, 21-25 June 2015, Chios, Greece
4. Al Sharif M, Alov P, Tsakovska I, Pajeva I. (2015) In silico modelling of full PPARγ
agonists: a step towards liver steatosis risk assessment, International Conference Of Young
Scientists, 11 – 12 June 2015, Plоvdiv, Bulgaria
5. Al Sharif M, Tsakovska I, Alov P, Vitcheva V, Pajeva I (2014) PPARγ-related hepatotoxic
mode-of-action: quantitative characterisation and in silico study of the molecular initiating
event involving receptor activation. 9th World Congress on Alternatives and Animal Use
in the Life Sciences, 24-28 August 2014, Prague, Czech Republic, Abstract in ALTEX
proceedings, Volume 3, No. 1., Theme II Predictive toxicology, Session II Pathways
approaches in toxicology: 1c-212, p. 56-57, ISSN 2194-0479.
6. Al Sharif M, Tsakovska I, Alov P, Vitcheva V, Pajeva I. COSMOS General Assembly
Meeting, Erlangen’2014
7. Al Sharif M, Tsakovska I, Alov P, Vitcheva V, Pajeva I. COSMOS General Assembly
Meeting, Milan’2014
8. Al Sharif M, Tsakovska I, Alov P, Vitcheva V, Pajeva I. COSMOS General Assembly
Meeting, Barcelona’2014
9. Al Sharif M, Tsakovska I, Alov P, Vitcheva V, Pajeva I. COSMOS General Assembly
Meetings, Ljubljana’2013

190
CONTRIBUTIONS TO NATIONAL SCIENTIFIC EVENTS
POSTERS
1. Diukendjieva A, Al Sharif M, Alov P, Tsakovska I, Pajeva I, PPARγ agonists and liver
steatosis: mode-of-action characterisation and in silico study, VII-th National Congress of
Pharmacology, 17 – 19 October 2014, Medical University Pleven, Bulgaria
PRESENTATIONS
1. Al Sharif M, Tsakovska I, Alov P, Vitcheva V, Pajeva I (2014) From ligand-dependent
dysregulation of PPARγ to nonalcoholic fatty liver disease. Scientific session for students
and young scientists "Biomedicine and Quality of Life", 2 October 2014, IBPhBME-BAS,
Sofia, Bulgaria, Book of abstracts, p. 24
2. Al Sharif M, Tsakovska I, Alov P, Vitcheva V, Pajeva I (2013) Modes-of-action related
to repeated dose toxicity: from PPARγ ligand-dependent dysregulation to non-alcoholic
fatty liver disease, 8th Workshop "Biоlogical activity of metals, synthetic compounds and
natural products", 27-29 November 2013, Sofia, Bulgaria, Proceedings ofthe
eighthworkshop on biological activity of metals, synthetic compounds and natural
products, Edited by: Dimitar Kadiysky and Radostina Alexandrova, D01., p.108-109, ISSN
2367 – 5683
PARTICIPATION IN SCIENTIFIC PROJECTS/GRANTS
1. EU Project n° 266835 (“Integrated in silico models for the prediction of human repeated
dose toxicity of cosmetics to optimise safety (COSMOS)”) - Research project funded by
the European Community’s 7th Framework Program (FP7/2007-2013) and from Cosmetics
Europe
2. Project BG051PO001-3.3.06-0040 "Establishment of interdisciplinary teams of young
scientists in the field of fundamental and applied research relevant to medical practice",
implemented with financial support of the operative program Human Resources
Development" financed by the European Social Fund of the European Union

191
APPENDIX A. SUPPLEMENTARY MATERIAL
Table S.1. PPARγ ligands retrieved from PDB (nd % max – no data for relative efficacy)
Complex
PDB ID
Ligand
PDB ID
In the
dataset Scaffold Comment Ref.
3BC5 ZAA no yes nd % max Zhang et al., 2009
3G9E RO7 no yes 67 % max Bénardeau et al., 2009
3KDU NKS no yes PPARα ligand Li et al., 2010
3VSO EK1 no yes nd %max Ohashi et al., 2013
1FM9 570 yes yes Gampe et al., 2000
1KNU YPA yes yes Sauerberg et al., 2002
2GTK 208 yes yes Kuhn et al., 2006
2Q8S L92 yes yes Casimiro-Garcia et al., 2008
3FEJ CTM yes yes Grether et al., 2009
3IA6 UNT yes yes Casimiro-Garcia et al., 2009
1FM6 BRL yes no Gampe et al., 2000
1NYX DRF yes no Ebdrup et al., 2003.
2XKW P1B yes yes Mueller et al.,
DOI:10.2210/pdb2xkw/pdb
1I7I AZ2 yes no nd %max Cronet et al., 2001
1K74 544 yes no nd %max Xu et al., 2001
2ATH 3EA yes no nd %max Mahindroo et al., 2005
2F4B EHA yes no nd %max Mahindroo et al., 2006a
2HWR DRD yes no nd %max Mahindroo et al., 2006b
3AN3 M7S yes no nd %max Ohashi et al., 2011
3AN4 M7R yes no nd %max Ohashi et al., 2011
3GBK 2PQ yes no nd %max Lin et al., 2009
3VJI J53 yes no nd %max Kuwabara et al., 2012

192
Table S.2. Classification of the selected papers according to the experimental subjects and approaches: HP – human patients; HC – human cell
culture; Aiv – animal in vivo; AC – animal cell culture; PPARγ↑ – PPARγ overexpression; PPARγ↑ + PT – PPARγ overexpression and
pharmacological treatment; PPARγ↓ – PPARγ knockout / knockdown; PPARγ↓ + PT – PPARγ knockout / knockdown and pharmacological
treatment; PT – pharmacological treatment; DM – diet manipulation; GMup – gene manipulation of PPARγ upstream proteins; GMup + PT – gene
manipulation of PPARγ upstream proteins and pharmacological treatment; AOPP – AOP-related papers; BP – Background-related papers
Experimental subject Experimental approach
AOPP BP Ref HP HC Aiv AC PPARγ↑
PPARγ↑
+ PT
PPARγ↓ PPARγ↓
+ PT
PT DM GMup GMup
+ PT Krewski et al., 2010
ECHA, 2013
Prieto et al., 2011
Cronin and Richarz, 2012
ENV/JM/MONO(2013)6
Sass et al., 2005
Landesmann et al., 2012
Virtue and Vidal-Puig, 2010
Azhar, 2010
Fournier et al., 2007
Costa et al., 2010
Luconi et al., 2010
Ahmadian et al., 2013
Chandra et al., 2008
Zhu et al., 2011
Lee et al., 2012
Morán-Salvador et al., 2011
Satoh et al., 2013
Yamazaki et al., 2011
Sos et al., 2011
Li et al., 2013
Kumadaki et al., 2011

193
Experimental subject Experimental approach
AOPP BP Ref HP HC Aiv AC PPARγ↑
PPARγ↑
+ PT
PPARγ↓ PPARγ↓
+ PT
PT DM GMup GMup
+ PT Gaemers et al., 2011
Larter et al., 2009
He et al., 2011
Kawano and Cohen, 2013
Videla and Pettinelli, 2012
Nagasaka et al., 2012
Matsusue, 2012
Okumura, 2011
Panasyuk et al., 2012
Semple et al., 2012
Flach et al., 2011
Matsusue, 2010
Bai et al., 2011
Kim et al., 2008
Larter et al., 2008
Handberg et al., 2012
Ring et al., 2006
Ehehalt et al., 2008
Su and Abumrad, 2009
Chabowski et al., 2007
Xu et al., 2013
Manteiga et al., 2013
Guo et al., 2009
Rogue et al., 2010
Musso et al., 2009
Park and Park, 2012
He et al., 2013
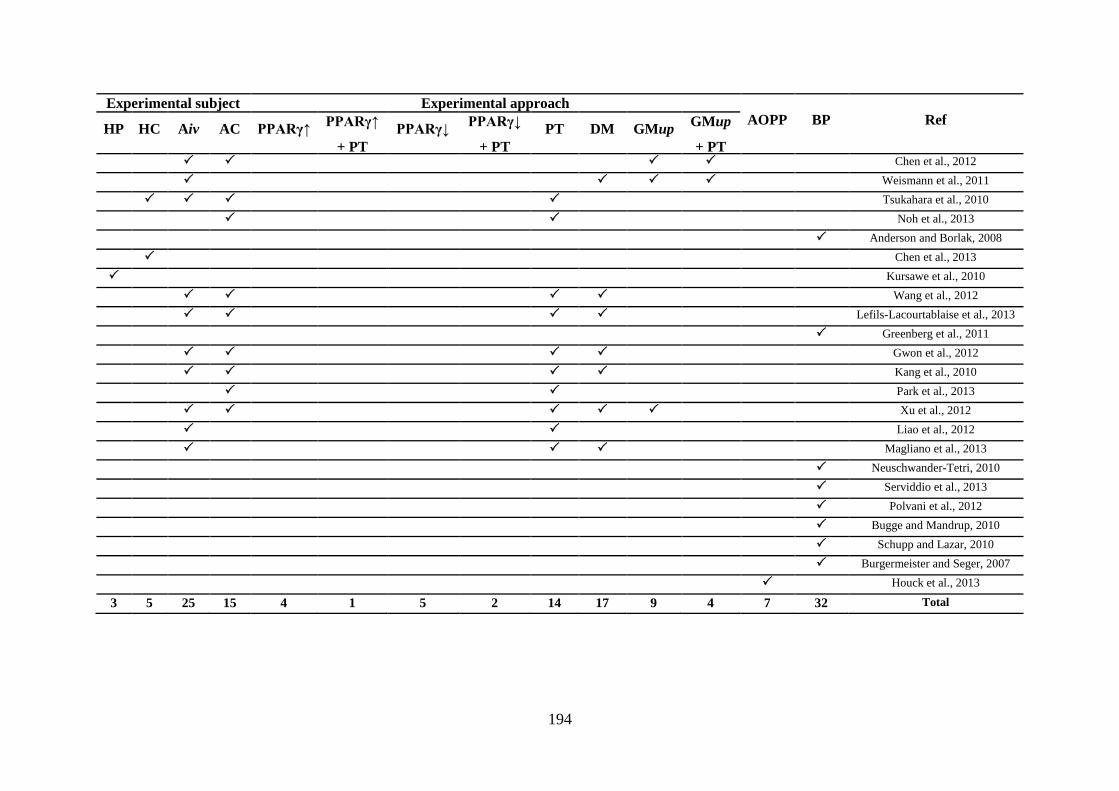
194
Experimental subject Experimental approach
AOPP BP Ref HP HC Aiv AC PPARγ↑
PPARγ↑
+ PT
PPARγ↓ PPARγ↓
+ PT
PT DM GMup GMup
+ PT Chen et al., 2012
Weismann et al., 2011
Tsukahara et al., 2010
Noh et al., 2013
Anderson and Borlak, 2008
Chen et al., 2013
Kursawe et al., 2010
Wang et al., 2012
Lefils-Lacourtablaise et al., 2013
Greenberg et al., 2011
Gwon et al., 2012
Kang et al., 2010
Park et al., 2013
Xu et al., 2012
Liao et al., 2012
Magliano et al., 2013
Neuschwander-Tetri, 2010
Serviddio et al., 2013
Polvani et al., 2012
Bugge and Mandrup, 2010
Schupp and Lazar, 2010
Burgermeister and Seger, 2007
Houck et al., 2013
3 5 25 15 4 1 5 2 14 17 9 4 7 32 Total

195
Table S.3. Effect of natural ligands (mainly from diet) on the mRNA levels of PPARγ and some of its targets: WT – wild type; HFD – high-fat
diet; CD – normal chow diet; qRT-PCR – quantitative reverse transcription polymerase chain reaction; sRT-PCR – semiquantitative RT-PCR; wks
– weeks; * – endogenous suppressor.
PPARγ-related genetic
background
Diet /
Pharmacological
treatment*
Assay
Fold change
Normalisation Ref
PPARγ FSP27 CD36 aP2
huh7 hepatoma cells ceramide* qRT-PCR -2.32 -1.93 -2.21 vs vehicle Li et al.,
2013
WT HFD qRT-PCR 4.30 5.00 5.42 3.00
normalised expression -
represent the mean ± SD diet
effect
Lee et al.,
2012
liver PPARγ-deficient line HFD qRT-PCR -2.00 1.24 8.19 1.92
normalised expression -
represent the mean ± SD diet
effect
Lee et al.,
2012
WT HFD Microarray 13.00 2.71 2.36 HFD vs CD Lee et al.,
2012
liver PPARγ-deficient line HFD Microarray 13.00 -1.02 3.38 HFD vs CD Lee et al.,
2012
WT HFD (safflower oil);
10 wks qRT-PCR 1.84 1.22 HFD vs CD; 10 wks
Yamazaki et
al., 2011
WT HFD (butter);
10 wks qRT-PCR 10.00 6.57 HFD vs CD; 10 wks
Yamazaki et
al., 2011
WT HFD (safflower oil) qRT-PCR 2.39 1.91 HFD butter vs CD; knockdown
5 days
Yamazaki et
al., 2011

196
PPARγ-related genetic
background
Diet /
Pharmacological
treatment*
Assay
Fold change
Normalisation Ref
PPARγ FSP27 CD36 aP2
WT HFD (butter) qRT-PCR 2.98 1.38 HFD butter vs CD); knockdown
5 days
Yamazaki et
al., 2011
WT HFD, 3 wks qRT-PCR 2.09 1.52 vs CD WT; PPARγ/18S –
normalisation
Gaemers et
al., 2011
WT
HFD (liquid,
overfed);
3 wks
qRT-PCR 3.34 18.44 vs CD WT; PPARγ/18S –
normalisation
Gaemers et
al., 2011
WT HFD sRT-PCR 1.81 vs WT CD Larter et al.,
2009
obese,
hypercholesterolemic,
diabetic foz/foz mice
HFD sRT-PCR 1.25 vs foz CD Larter et al.,
2009
WT HFD Microarray 1.48 vs WT CD Larter et al.,
2009
obese,
hypercholesterolemic,
diabetic foz/foz mice
HFD Microarray 1.70 vs foz CD Larter et al.,
2009

197
Table S.4. Effect of genetic manipulation and/or genetic background on the mRNA and protein levels of PPARγ and some of its targets: Ad-
PPARγ2 – adenovirus-mediated transfection of PPARγ2; GFP – adenovirus-mediated transfection of green fluorescent protein.
PPARγ-related genetic
background
PPARγ-related
genetic
manipulation
Diet Assay
Fold change Normalisation
Ref
PPARγ FSP27 CD36 aP2
liver SMS2-
overexpressing
transgenic line
PPARγ
upregulation HFD qRT-PCR 2.09 5.82 3.70 vs HFD WT
Li et al.,
2013
lSMS2-deficient
knockout line
PPARγ
downregulation HFD qRT-PCR -3.23 -2.56 -1.92 vs HFD WT
Li et al.,
2013
liver PPARγ-deficient
line CD qRT-PCR
-
1000.00 7.00
Lee et al.,
2012
wild type PPARγ-
transfected CD qRT-PCR 60.83 7.14 1000.00
Lee et al.,
2012
liver PPARγ-deficient
line
PPARγ-
transfected CD qRT-PCR 1000.00 24.00 1000.00
Lee et al.,
2012
liver PPARγ-deficient
line CD qRT-PCR -40.19 -3.21 -5.02 -1.67
normalised expression -
represent the mean ± SD
gene effect
Lee et al.,
2012
liver PPARγ-deficient
line HFD qRT-PCR -346.00 -12.97 -3.33 -2.62
normalised expression -
represent the mean ± SD
gene effect
Lee et al.,
2012
wild type PPARγ-
transfected CD Microarray 19.15 2.57 20.48 Ad-PPARγ2 vs Ad-GFP
Lee et al.,
2012
liver PPARγ-deficient
line
PPARγ-
transfected CD Microarray 12.16 7.97 26.37 Ad-PPARγ2 vs Ad-GFP
Lee et al.,
2012

198
PPARγ-related genetic
background
PPARγ-related
genetic
manipulation
Diet Assay
Fold change Normalisation
Ref
PPARγ FSP27 CD36 aP2
liver PPARγ-deficient
line CD
Western
blot 1.00 -2.00
Lee et al.,
2012
liver PPARγ-deficient
line
PPARγ-
transfected CD
Western
blot -2.73 -1.86
Lee et al.,
2012
wild type
PPARγ2
knockdown;
5 days
CD qRT-PCR -2.17 -1.45
CD
(knockdown/functional);
5 days
Yamazaki
et al., 2011
wild type
PPARγ2
knockdown;
5 days
HFD
(safflower
oil)
qRT-PCR -1.46 -1.13
HFD saf
(knockdown/functional);
5 days
Yamazaki
et al., 2011
wild type
PPARγ2
knockdown;
5 days
HFD
(butter) qRT-PCR -1.89 -1.77
HFD butt
(knockdown/functional);
5 days
Yamazaki
et al., 2011
wild type PPARγ2-
transfected CD qRT-PCR 85.30 17.30
CD (WT/PPARγ2-
transfected)
Yamazaki
et al., 2011
Lit-con CD qRT-PCR 5.54 8.81 Sos et al.,
2011
Con-JAK2L CD qRT-PCR 6.06 15.73 Sos et al.,
2011
Lit-JAK2L CD qRT-PCR 6.17 9.00 Sos et al.,
2011
wild type Fbw7
knockdown CD qRT-PCR 4.32 2.58 3.72 2.05 vs CD WT
Kumadaki
et al., 2011
wild type
Fbw7
knockdown in
litteramates
CD qRT-PCR 12.30 4.43 vs CD WT Kumadaki
et al., 2011

199
PPARγ-related genetic
background
PPARγ-related
genetic
manipulation
Diet Assay
Fold change Normalisation
Ref
PPARγ FSP27 CD36 aP2
wild type Fbw7
knockdown CD qRT-PCR 2.36 5.24 2.15 vs CD WT
Kumadaki
et al., 2011
wild type
Fbw7/PPARγ2 -
double
knockdown
CD qRT-PCR -1.24 -1.11 1.34 vs CD WT Kumadaki
et al., 2011
wild type Fbw7
transfected CD qRT-PCR -1.14 -2.56 -1.51 vs CD WT
Kumadaki
et al., 2011
obese,
hypercholesterolemic,
diabetic foz/foz mice
CD sRT-PCR 2.51 vs WT CD Larter et
al., 2009
obese,
hypercholesterolemic,
diabetic foz/foz mice
HFD sRT-PCR 1.73 vs WT HFD Larter et
al., 2009
obese,
hypercholesterolemic,
diabetic foz/foz mice
CD Microarray 1.99 vs WT CD Larter et
al., 2009
obese,
hypercholesterolemic,
diabetic foz/foz mice
HFD Microarray 2.27 vs WT HFD Larter et
al., 2009
PPARα -/- PPARγ1-
transfected CD Microarray 22.70 11.50 6.80 66.50
Yu et al.,
2003

200
Table S.5. PPARγ ligands dataset: distribution of the ligands according to the experimental
subject and the relative efficacy toward PPARγ (nd – no data).
Range of
the %max
Hamster
/ kidney
Monkey
/ kidney
Human
/ kidney
Human
/ liver № of
ligands
pEC50
data BHK21
ATCC
CCL10
COS-1 COS-7 CV-1 HEK293 HepG2 Huh-7
≥ 70% max 51 42 13 10 48 20 0 184 184
< 70% max 27 1 2 2 34 87 0 153 153
nd 5 1 1 2 13 7 64 95 93
total
by cell line 83 44 16 14 95 114 64
432 430
total
by species 83 74 273
total
human and
animal
data
157 273

201
Table S.6. Information about PPARγ-full agonist complexes extracted from PDB: complex ID,
ligand (agonist) ID, activity data of the PPARγ agonists extracted from PDB and CheMBL
databases; RMSD values are recorded after the superposition of all extracted agonist-PPARγ
complexes on the template structure from the 1FM6 complex.
Complex
PDB ID
Ligand
PDB ID
Biological activity
RMSD EC50
(nM)
Ki
(nM)
Kd
(nM)
IC50
(nM)
1K74 544 0.2–2.7 1 1.07
1FM9 570 0.339–6 1–1.1 25–217 0.44
1FM6 BRL 2.4–2880 8–440 7–4980 30–2000 0
(template)
3AN4 M7R 3.6 1.20
3BC5 ZAA 4 5 1.51
3IA6 UNT 13 3 0.85
1I7I AZ2 13–3528 18–200 200–350 1.01
3G9E RO7 21 19 0.63
3AN3 M7S 22 1.06
2ZNO S44 41–70 1.15
3GBK 2PQ 50 1.03
3VJI J53 58 1.04
2F4B EHA 70 50 1.01
2Q8S L92 140 140 0.85
1KNU YPA 170 170 1.58
3FEJ CTM 210 740 740 0.62
2HWR DRD 210 0.79
2ATH 3EA 230 152–
152.05 0.90
2XKW P1B 1125 1.03
1NYX DRF 570–600 90 92 1.15
2GTK 208 760 250 0.67

202
Table S.7. Analysis of the HB contacts between amino acids in H12 and in other helices and
between full agonists and the receptor in the LBD of the 21 PPAR complexes extracted from
PDB; 1PRG, apo-form.
Complex
PDB ID
Ligand
PDB ID
HBs between amino acids in the vicinity of H12 HBs between ligand
and receptor
AA1 AA2 PHF AA SE
AA SE AA SE
1K74 544
Glu460 H10/11_H12 Arg357 H6_H7 F1 Tyr473 H12
Ile472 H12 Lys319 H4 F1 His449 H10/11
Lys474 H12_ Lys319 H4 F2 His323 H5
Tyr477 H12_ Glu324 H5 F2 Ser289 H3
1FM9 570
Glu460 H10/11_H12 Arg357 H6_H7 F1 Tyr473 H12
Ile472 H12 Lys319 H4 F1 His449 H10/11
Lys474 H12_ Lys319 H4 F2 His323 H5
Tyr477 H12_ Glu324 H5 F2 Ser289 H3
His449 H10/11 Lys367 H7
Lys367 H7 Phe363 loop in H7
1FM6 BRL
Glu460 H10/11_H12 Arg357 H6_H7 F1 His449 H10/11
Arg357 H6_H7 Glu276 H2'_H3 F2 His323 H5
Ile472 H12 Lys319 H4 F2 Ser289 H3
Lys474 H12_ Lys319 H4
Tyr477 H12_ Glu324 H5
3AN4 M7R
Glu460 H10/11_H12 Arg357 H6_H7 F2 His323 H5
Arg357 H6_H7 Glu276 H2'_H3 F2 Tyr327 H5
Ser464 H10/11_H12 Gln286 H3 F4 Cys285 H3
Leu465 H10/11_H12 Gln286 H3
His466 H10/11_H12 Gln286 H3
Ile472 H12 Lys319 H4
Lys474 H12_ Lys319 H4
His449 H10/11 Lys367 H7
Lys367 H7 Phe363 loop in H7
3BC5 ZAA
Ser464 H10/11_H12 Gln283 H3 F1 Tyr473 H12
His466 H10/11_H12 Gln286 H3 F1 His449 H10/11
Asp475 H12 Lys319 H4

203
Complex
PDB ID
Ligand
PDB ID
HBs between amino acids in the vicinity of H12 HBs between ligand
and receptor
AA1 AA2 PHF AA SE
AA SE AA SE
His449
Lys367
H10/11
H7
Lys367
Phe363
H7
turn in H7
3IA6 UNT
Glu460 H10/11_H12 Arg357 H6_H7 F1 Tyr473 H12_
Arg357 H6_H7 Glu276 H2'_H3 F1 His449 H10/11
His466 H10/11_H12 Gln286 H3 F2 His323 H5
Ile472 H12 Lys319 H4 F2 Ser289 H3
His449
Lys367
H10/11
H7
Lys367
Phe363
H7
loop in H7
1I7I AZ2
His466 H10/11_H12 Gln286 H3 F1 Tyr473 H12
Gln470 H12 Lys474 H12_ F1 His449 H10/11
Ile472 H12 Lys319 H4 F2 His323 H5
Lys474 H12_ Lys319 H4 F2 Ser289 H3
His449
Lys367
H10/11
H7
Lys367
Phe363
H7
loop in H7
3G9E RO7
Glu460 H10/11_H12 Arg357 H6_H7 F1 Tyr473 H12
Arg357 H6_H7 Lys358 H6_H7 F1 His449 H10/11
Arg357 H6_H7 Glu276 H2'_H3 F2 His323 H5
Met463 H10/11_H12 Lys275 H2'_H3 F2 Ser289 H3
His466 H10/11_H12 Gln286 H3
Ile472 H12 Lys319 H4
Lys474 H12_ Lys319 H4
His449 H10/11 Lys367 H7
Lys367 H7 Phe363 H7
Arg397 H8_H9 Glu324 H5
Asp396 H8_H9 Arg443 H10/11
3AN3 M7S
Glu460 H10/11_H12 Arg357 H6_H7 F2 Tyr327 H5
Ser464 H10/11_H12 Gln286 H3 F4 Cys285 H3
Leu465 H10/11_H12 Gln286 H3 F4 Ser342 H5_H6
His466 H10/11_H12 Gln286 H3
Ile472 H12 Lys319 H4
Lys474 H12_ Lys319 H4

204
Complex
PDB ID
Ligand
PDB ID
HBs between amino acids in the vicinity of H12 HBs between ligand
and receptor
AA1 AA2 PHF AA SE
AA SE AA SE
Leu476 H12_ Tyr320 H4
His449
Lys367
H10/11
H7
Lys367
Phe363
H7
loop in H7
2ZNO S44
Glu460 H10/11_H12 Thr459 H10/11 F4 Cys285 H3
Arg357 H6_H7 Glu276 H2'_H3
Ile472 H12 Lys319 H4
Glu471 H12 Lys319 H4
Lys474 H12_ Lys319 H4
His449 H10/11 Lys367 H7
Lys367 H7 Phe363 turn in H7
3GBK 2PQ
Glu460 H10/11_H12 Arg357 H6_H7 F1 Tyr473 H12
Arg357 H6_H7 Glu276 H2'_H3 F1 His449 H10/11
His466 H10/11_H12 Gln286 H3 F2 His323 H5
Ile472 H12 Lys319 H4 F2 Ser289 H3
Tyr477 H12_ Glu324 H5
Arg397 H8_H9 Glu324 H5
Asp396 H8_H9 Arg443 H10/11
His449
Lys367
H10/11
H7
Lys367
Phe363
H7
H7
3VJI J53
Glu460 H10/11_H12 Arg357 H6_H7 F2 Tyr327 H5
Ser464 H10/11_H12 Gln286 H3 F4 Cys285 H3
Leu465 H10/11_H12 Gln286 H3
Ile472 H12 Lys319 H4
Lys474 H12_ Lys319 H4
His449
Lys367
H10/11
H7
Lys367
Phe363
H7
loop in H7
Arg397 H8_H9 Glu324 H5
Arg443 H10/11 Glu324 H5
2F4B EHA
Glu460 H10/11_H12 Arg357 H6_H7 F1 Tyr473 H12
Glu460 H10/11_H12 Thr459 H10/11 F1 His449 H10/11
Arg357 H6_H7 Glu276 H2'_H3

205
Complex
PDB ID
Ligand
PDB ID
HBs between amino acids in the vicinity of H12 HBs between ligand
and receptor
AA1 AA2 PHF AA SE
AA SE AA SE
Ile472 H12 Lys319 H4
Lys474 H12_ Lys319 H4
Tyr477 H12_ Glu324 H5
Arg397 H8_H9 Glu324 H5
Asp396 H8_H9 Arg443 H10/11
His449
Lys367
H10/11
H7
Lys367
Phe363
H7
turn in H7
2Q8S L92
Glu460 H10/11_H12 Arg357 H6_H7 F1 Tyr473 H12
Ser464 H10/11_H12 Gln283 H3 F2 His323 H5
Ile472 H12 Lys319 H4 F4 Tyr327 H5
Glu471 H12 Lys319 H4
His449
Lys367
H10/11
H7
Lys367
Phe363
H7
turn in H7
Arg397 H8_H9 Glu324 H5
1KNU YPA
Glu460 H10/11_H12 Arg357 H6_H7 F1 Tyr473 H12
Arg357 H6_H7 Glu276 H2'_H3 F1 His449 H10/11
Met463 H10/11_H12 Gln283 H3 F2 His323 H5
Leu465 H10/11_H12 Gln286 H3 F2 Ser289 H3
His466 H10/11_H12 Gln286 H3
Asp475 H12_ Lys319 H4
Ile472 H12 Lys319 H4
His449
Lys367
H10/11
H7
Lys367
Phe363
H7
loop in H7
Arg397 H8_H9 Glu324 H5
3FEJ CTM
Glu460 H10/11_H12 Arg357 H6_H7 F1 Tyr473 H12
Asp462 H10/11_H12 Lys275 H2'_H3 F1 His449 H10/11
Arg357 H6_H7 Glu276 H2'_H3 F2 His323 H5
His466 H10/11_H12 Gln286 H3 F2 Ser289 H3
Ile472 H12 Lys319 H4 F4 Arg288 H3
Lys474 H12_ Lys319 H4

206
Complex
PDB ID
Ligand
PDB ID
HBs between amino acids in the vicinity of H12 HBs between ligand
and receptor
AA1 AA2 PHF AA SE
AA SE AA SE
His449
Lys367
H10/11
H7
Lys367
Phe363
H7
loop in H7
Arg397 H8_H9 Glu324 H5
Asp396 H8_H9 Arg443 H10/11
2HWR DRD
Glu460 H10/11_H12 Arg357 H6_H7 F2 His323 H5
Arg357 H6_H7 Glu276 H2'_H3 F2 Ser289 H3
His466 H10/11_H12 Gln286 H3
Ile472 H12 Lys319 H4
Lys474 H12_ Lys319 H4
Arg397 H8_H9 Glu324 H5
Asp396 H8_H9 Arg443 H10/11
2ATH 3EA
Thr459 H10/11_H12 Val455 H10/11 F1 Tyr473 H12_
Glu460 H10/11_H12 Arg357 H6_H7
Arg357 H6_H7 Glu276 H2'_H3
Asp462 H10/11_H12 Gln286 H3
His466 H10/11_H12 Phe287 H3
Lys474 H12_ Tyr320 H4
His449 H10/11 Lys367 H7
Arg397 H8_H9 Glu324 H5
Asp396 H8_H9 Arg443 H10/11
2XKW P1B
Glu460 H10/11_H12 Arg357 H6_H7
Arg357 H6_H7 Glu276 H2'_H3
Ser464 H10/11_H12 Gln286 H3
His466 H10/11_H12 Gln286 H3
Ile472 H12 Lys319 H4
Lys474 H12_ Lys319 H4
Leu476 H12_ Tyr320 H4
His449
Lys367
H10/11
H7
Lys367
Phe363
H7
loop in H7
Arg397 H8_H9 Glu324 H5
Asp396 H8_H9 Arg443 H10/11

207
Complex
PDB ID
Ligand
PDB ID
HBs between amino acids in the vicinity of H12 HBs between ligand
and receptor
AA1 AA2 PHF AA SE
AA SE AA SE
Arg443 H10/11 Glu324 H5
1NYX DRF
Glu460 H10/11_H12 Arg357 H6_H7 F1 Tyr473 H12_
Ser464 H10/11_H12 Gln286 H3 F2 His323 H5
Asp475 H12_ Tyr320 turn in H4
His449 H10/11 Lys367 H7
Met364 H6_H7 Lys367 H7
Arg 397 H8_H9 Glu324 H5
2GTK 208
Glu460 H10/11_H12 Arg357 H6_H7 F1 Tyr473 H12
Arg357 H6_H7 Glu276 H2'_H3 F1 His449 H10/11
His466 H10/11_H12 Gln286 H3 F2 His323 H5
Ile472 H12 Lys319 H4 F2 Ser289 H3
Lys474 H12_ Lys319 H4
His449
Lys367
H10/11
H7
Lys367
Phe363
H7
loop in H7
Arg397 H8_H9 Glu324 H5
Asp396 H8_H9 Arg443 H10/11
1PRG
chain A
Glu460 H10/11_H12 Arg357 H6_H7
Arg357 H6_H7 Glu276 H2'_H3
Leu468 H12 His466 H10/11_H12
Asp475 H12_ Gln454 H10/11
Arg397 H8_H9 Glu324 H5
Asp396 H8_H9 Lys438 turn in
H10/11
Met364 loop in H7 Lys367 H7
Lys367 H7 Phe363 loop in H7
Ser289 H3 Cys285 H3
1PRG
chain B
Glu471
His449
H12
H10/11
Lys474
Lys367
H12_
H7
Arg397 H8_H9 Glu324 H5
Asp396 H8_H9 Lys438 H10/11

208
APPENDIX B. AOP EVALUATION TABLE
The table, containing the data for the AOP evaluation, is available in electronic format onto
the CD attached to the inside cover (Appendix_B_AOP_evaluation_table.xls).

Related Documents