Universidad Politécnica de Cartagena Department of Information and Communication Technologies Ph.D. Thesis Analysis and Evaluation of In-home Networks Based on HomePlug-AV Power Line Communications Pedro José Piñero Escuer 2014

Welcome message from author
This document is posted to help you gain knowledge. Please leave a comment to let me know what you think about it! Share it to your friends and learn new things together.
Transcript

Universidad Politécnica de Cartagena
Department of Information and Communication Technologies
Ph.D. Thesis
Analysis and Evaluation of In-homeNetworks Based on HomePlug-AVPower Line Communications
Pedro José Piñero Escuer
2014


Universidad Politécnica de Cartagena
Department of Information and Communication Technologies
Ph.D. Thesis
Analysis and Evaluation of In-homeNetworks Based on HomePlug-AVPower Line Communications
Author
Pedro José Piñero Escuer
Supervisors
Josemaría Malgosa Sanahuja
Pilar Manzanares López
Cartagena, 2014


A Natalia y a mis padres,
por su apoyo durante estos años

Abstract
Not very long time ago, in-home networks (also called domestic networks) were only used
to share a printer between a number of computers. Nowadays, however, due to the huge
amount of devices present at home with communication capabilities, this definition has
become much wider. In a current in-home network we can find, from mobile phones with
wireless connectivity, or NAS (Network Attached Storage) devices sharing multimedia
content with high-definition televisions or computers.
When installing a communications network in a home, two objectives are mainly pur-
sued: Reducing cost and high flexibility in supporting future network requirements. A
network based on Power Line Communications (PLC) technology is able to fulfill these
objectives, since as it uses the low voltage wiring already available at home, it is very easy
to install and expand, providing a cost-effective solution for home environments. There
are different PLC standards, being HomePlug-AV (HomePlug Audio-Video, or simply
HPAV) the most widely used nowadays. This standard is able to achieve transmission
rates up to 200 Mpbs through the electrical wiring of a typical home.
The main objective of this thesis is to provide new ideas to improve the performance
of PLC technology based in-home networks, using as starting point the HPAV standard.
A network based on this technology uses a centralized architecture, in which the most
important part of the network intelligence is concentrated in a single device, the Central
Coordinator (CCo). Hence, most of the modifications proposed in this work will try to im-
prove this particular device, which can even become a multi-technology central manager,
able to combine interfaces of different technologies to improve the network performance.
Initially, it is presented a detailed analysis of HPAV performance in some scenarios
typically found in a home environment. It was done through simulation and by experimen-
tation using real devices. To obtain the former results, it was designed a HPAV simulator
which implements the physical (PHY) and medium access control (MAC) layers of the
standard, together with a traffic modeling module which implements the services most
commonly found in a home network. This simulation tool was used both in these initial
measurements and to evaluate the standard modifications that are proposed in this work.
This analysis provides two main results. Firstly, it was found that when a real PHY
model is used together with the CSMA/CA MAC protocol the simulation results were
very different to those obtained with previously presented mathematical models of this
protocol. Hence, it was proposed a new model that considers these effects. Next, some
areas of the technology which could be improved were identified. The rest of the thesis
I

Abstract
was then centered around proposing solutions to these weaknesses.
The first weakness solved is related to unicast data transmission. PLC medium is fre-
quency selective and time variant, and it presents a remarkable variation among locations
or depending on the connected loads. Even in a single link, the channel capacities be-
tween transmitter and receiver can be very asymmetric. In such environments, the use of
TCP as transport protocol presents serious problems, since it defines some of its param-
eters according to the Round Trip Time (RTT). Alternatively, the use of Fountain codes
for reliable data transmission in these environments was proposed. These codes allow to
transmit information without a feedback channel, overcoming in this way the problems
related to the variability of the channel. Different experiments were performed compar-
ing both solutions, concluding that in PLC based networks the performance achieved by
Fountain codes outperforms the results obtained with a TCP-based application.
In addition, Fountain codes were also used for another application. In home environ-
ments, it is very common to find more than one available technology to deploy a network
(Wi-Fi, Ethernet, PLC, etc). Therefore, an application that makes possible the aggrega-
tion of different interfaces would be very useful, as it will provide higher bandwidth, fault
tolerance and load balancing. The Linux Kernel contains a driver (Bonding) which allows
Ethernet interfaces aggregation. However, it is not prepared for asymmetric interfaces
aggregation and even less for variable capacity technologies like PLC or Wi-Fi. In this
work, it is presented a modification of this driver which uses Fountain codes to solve the
problems that may arise when asymmetric interfaces are aggregated.
On another note, multicast communications in the actual HPAV standard versions
presents serious problems. This is because, although PLC medium is broadcast by na-
ture, the Orthogonal Frequency Division Multiplexing (OFDM) modulation used at PHY
layer is always point to point.Therefore, multicast communications are carried out as suc-
cessive point-to-point transmissions to the different members of the group. This tech-
nique clearly degrades the performance of multicast services as the number of receivers
increases. In this work, they have been proposed two alternative algorithms. The first one
consists of using a common tone map for all the multicast group members. This tone map
corresponds to the modulation parameters obtained for the client with the worst channel
conditions. This algorithm has been traditionally discarded in OFDM systems because
of its poor performance. However, in contrast to other technologies (like wireless for ex-
ample), channel responses in a given PLC network exhibit significant correlation among
them. This reduces the differences among the users, improving the performance of this
algorithm. In addition, another technique which uses an optimization algorithm to max-
imize the multicast bit rate is also evaluated, obtaining that its use can be suitable when
the number of multicast clients is high.
Finally, due to the properties of PLC medium, cross-layer technique are eliciting a big
interest. These algorithms are based in the information sharing between adjacent layers
in the OSI model to improve the system behavior. In this work, it has been proposed
an extension of the HPAV CSMA/CA algorithm which modifies the protocol parameters
using PHY layer information and the QoS requirements of the upper-layer services. In
this way, priority access to the channel can be provided to the nodes with QoS problems,
improving the whole network performance. This algorithm has been evaluated through
simulation in a typical home environment with very promising results.
II

Resumen
No hace mucho tiempo, las redes in-home (también denominadas redes domésticas) úni-
camente se utilizaban para interconectar los diferentes ordenadores de una vivienda, de
manera que pudieran compartir una impresora entre ellos. Hoy en día, sin embargo, esta
definición es mucho más amplia debido a la gran cantidad de dispositivos existentes en la
vivienda con capacidad de conectarse a una red para transmitir y recibir información. En
una red in-home actual, podemos encontrar desde teléfonos móviles equipados con conec-
tividad WI-FI a dispositivos NAS (Network Attached Storage), utilizados para almacenar
información, imágenes o videos en red, que a su vez pueden ser transferidos a televisiones
de alta definición u ordenadores.
A la hora de instalar una red de comunicaciones en una vivienda, se persiguen princi-
palmente dos objetivos, reducir el coste de instalación y conseguir una gran flexibilidad de
cara a futuras ampliaciones. Una red basada en tecnología PLC (Power Line Communi-
cations) cumple estos requisitos ya que, al utilizar la infraestructura de cableado eléctrico
existente en la vivienda, es muy sencilla y económica de instalar y ampliar. Dentro de la
tecnología PLC existen diferentes estándares, siendo HomePlug-AV (HomePlug Audio-
Video o símplemente HPAV) el más extendido en la actualidad para la instalación de redes
domésticas. Este estándar permite alcanzar velocidades de transmisión de hasta 200Mbps
a través de los cables de baja tensión de una vivienda convencional.
El objetivo principal de esta tesis doctoral es aportar nuevas ideas que mejoren las
prestaciones de las redes in-home basadas en la tecnología PLC, utilizando como base
el estándar Homeplug-AV. Estas redes utilizan una arquitectura centralizada, en la que la
mayor parte de la inteligencia de red está concentrada en un coordinador central (CCo,
por sus siglas en inglés). Por lo tanto, la mayor parte de las modificaciones propuestas
irán encaminadas a mejorar dicho dispositivo, que podrá llegar a convertirse en un gestor
de red capaz de manejar conjuntamente interfaces de diferentes tecnologías.
En primer lugar, se presenta un análisis detallado del comportamiento del estándar en
diferentes situaciones que se pueden producir de manera común en una red doméstica.
Este análisis se realizó tanto con dispositivos reales como mediante simulación. Para el
segundo tipo de medidas, se diseñó un simulador de la tecnología HomePlug que imple-
menta el nivel físico y el nivel MAC de la misma, junto con modelos de los servicios
más utilizados en entornos domésticos. Este simulador se utilizó tanto para estas me-
didas iniciales como para evaluar las diferentes modificaciones del estándar propuestas
posteriormente en este trabajo.
III

Resumen
Este análisis proporcionó dos resultados significativos. En primer lugar, se comprobó
que al introducir un modelo real de nivel físico al protocolo CSMA/CA utilizado a nivel
MAC se producían resultados muy diferentes a los presentados en los modelos publicados
hasta ese momento. Por ello, se propuso un modelo matemático que incorporaba dichos
efectos. En segundo lugar, se identificaron diferentes áreas de la tecnología que eran
susceptibles de mejora. El resto de la tesis se centró entonces en la mejora de dichos
punto débiles
El primero de estos puntos débiles está relacionado con las transmisión de datos uni-
cast. El medio PLC es selectivo en frecuencia y muy dependiente del tiempo y de la
localización de las estaciones. Incluso es posible que, en un mismo enlace, la capacidad
de los enlaces ascendente y descendente sea distinta. En estos entornos, la utilización
del protocolo de transporte TCP presenta serios problemas, ya que define gran parte de
sus parámetros en función del Round Trip time (RTT) del enlace. Como alternativa se
pensó en los códigos Fountain. Este tipo de codificación de fuente permite realizar trans-
misiones fiables de datos sin necesidad de utilizar un canal de retorno, evitando de esta
forma los problemas derivados de las asimetrías de la red. Se realizaron varios experi-
mentos comparando ambas soluciones, y se comprobó que las prestaciones de este tipo de
codificaciones superan al protocolo TCP a la hora de transmitir ficheros de manera fiable
a través de las redes PLC.
Además, los códigos Fountain también se utilizaron para el diseño de otra aplicación.
Es muy común que en un escenario doméstico haya disponible más de una tecnología (Wi-
Fi, Ethernet, PLC, etc). Tenemos por tanto que una aplicación capaz de integrar interfaces
de diferentes tecnologías podría ser muy útil en estos entornos, ya que se podría conseguir
un mayor ancho de banda, mayor tolerancia a errores, balanceo de carga, etc. El kernel
de Linux dispone de un módulo denominado Bonding que permite agrupar diferentes
interfaces Ethernet. Sin embargo, no está preparado para agrupar interfaces de diferentes
tecnologías, y mucho menos para tecnologás de capacidad variable como es el caso de
PLC o de las comunicaciones inalámbricas. Por ello, se realizó una modificación de
dicho driver utilizando para ello los códigos Fountain, que solucionan los problemas que
se pueden producir debido a las variaciones de capacidad.
Por otra parte, con la actual versión del estándar HomePlug AV, las comunicaciones
multicast presentan unas prestaciones muy pobres. Esto es debido a que, a pesar de que el
canal PLC es broadcast, la naturaleza de la modulación OFDM (Ortogonal Frequency Di-
vision Multiplexing) que se utiliza a nivel físico es punto a punto. Esto hace que las trans-
misiones simultáneas a un grupo de receptores se traduzcan automáticamente en sucesivas
transmisiones punto a punto a los diferentes miembros del grupo. Con esta técnica, la ca-
pacidad efectiva de transmisiónmulticast disminuye de manera muy importante a medida
que aumenta el número de receptores. En este trabajo se han propuesto dos técnicas al-
ternativas. La primera consiste en la utilización de un mapa de tonos común para todos
los miembros del grupo multicast, asignado a estas comunicaciones los parámetros de
modulación del cliente con las peores condiciones de canal. Este algoritmo ha sido tradi-
cionalmente descartado en los sistemas OFDM por sus bajas prestaciones. Sin embargo,
la correlación existente entre los diferentes canales de una red PLC hace que su com-
portamiento sea mucho mejor. Además, se propuso un segundo algoritmo que utilizaba
técnicas de optimización para maximizar la tasa de comunicación multicast, obteniendo
IV

Resumen
un mejor comportamiento cuando el número de clientes es elevado.
Por último, en redes de capacidad física variable, como es el caso de las redes PLC,
las técnicas cross-layer están despertando un gran interés. Este tipo de algoritmos están
basado en la compartición de información entre diferentes capas de la estructura OSI para
mejorar el comportamiento del sistema. En este trabajo se ha propuesto un algoritmo que
modifica los parámetros del protocolo CSMA/CA de nivel MAC utilizando información
de nivel físico y los requerimientos de QoS del servicio de niveles superiores. De esta
forma se consigue dar prioridad en el acceso al medio a los clientes con problemas de
QoS, mejorando de esta forma del comportamiento de la red. Este algoritmo ha sido
evaluado mediante simulación en un escenario doméstico típico, comprobando que ofrece
unos resultados muy prometedores.
V


Agradecimientos
Esta tesis doctoral es el resultado de casi cinco años de trabajo. El camino hasta finalizarla
ha sido largo, con muchos altibajos. Si todo ha terminado bien, ha sido sin duda por la
inestimable ayuda de mucha gente, a la que me gustaría dedicar estas líneas.
La primera parte de estos agradecimientos es sin lugar a dudas para mis directores
de tesis, Josemaría y Pilar. Muchas gracias por vuestro apoyo durante estos años y por
vuestra confianza en mi. También quiero dar las gracias a Juan Pedro, por su colaboración
en este trabajo.
De igual forma, muchas gracias a todos los compañeros, becarios y profesores, de la
Universidad Politécnica de Cartagena con los que he compartido estos años y que me han
hecho muy grata mi etapa allí.
También quiero dar las gracias a los miembros del grupo de trabajo en PLC de la
Universidad de Málaga por sus aportaciones y por su ayuda durante mi estancia en tierras
andaluzas.
En el ámbito personal, quiero dar las gracias a mi familia, porque sin su apoyo en los
momentos difíciles me hubiera sido imposible acabar este trabajo.
Muchas gracias también a mis amigos, tanto a los de toda la vida como a los de mi
etapa en Cartagena, a los que tengo que agradecer su apoyo y el aportarme esos momentos
de desconexión que algunas veces me hacían tanta falta.
Por último, muchas gracias a Natalia por estar a mi lado todos estos años. Por com-
partir conmigo los momentos buenos e intentar alegrarme siempre en los malos.
Esta tesis no hubiera sido posible sin todos vosotros.
VII


This Ph.D. Thesis has been supported by the Fundación Séneca, Agencia de Ciencia y
Tecnología de la Región de Murcia, with the FPI pre-doctoral fellowship 13251/FPI/09
(from January 2009 to May 2011). It has also been supported by the MINECO/FEDER
Project Grant TEC2010-21405-C02-02/TCM (CALM) and also by the framework of “Pro-
grama de Ayudas a Grupos de Excelencia de la Región de Murcia”, funded by Fundación
Séneca (Plan Regional de Ciencia y Tecnología 2007/2010).
IX


Contents
1 Introduction 1
1.1 Home networks . . . . . . . . . . . . . . . . . . . . . . . . . . . . . . . 1
1.2 Technologies . . . . . . . . . . . . . . . . . . . . . . . . . . . . . . . . 2
1.2.1 Wired solutions . . . . . . . . . . . . . . . . . . . . . . . . . . . 2
1.2.2 Wireless solutions . . . . . . . . . . . . . . . . . . . . . . . . . 2
1.2.3 No-New-Wires solutions . . . . . . . . . . . . . . . . . . . . . . 3
1.3 Power line communications standards . . . . . . . . . . . . . . . . . . . 5
1.3.1 HomePlug-AV . . . . . . . . . . . . . . . . . . . . . . . . . . . 5
1.3.2 DS2/UPA . . . . . . . . . . . . . . . . . . . . . . . . . . . . . . 6
1.3.3 HD-PLC . . . . . . . . . . . . . . . . . . . . . . . . . . . . . . 6
1.3.4 IEEE 1901 . . . . . . . . . . . . . . . . . . . . . . . . . . . . . 7
1.4 Objectives . . . . . . . . . . . . . . . . . . . . . . . . . . . . . . . . . . 7
1.5 Structure and main contributions of this thesis . . . . . . . . . . . . . . . 9
2 HomePlug-AV Standard 11
2.1 Introduction . . . . . . . . . . . . . . . . . . . . . . . . . . . . . . . . . 11
2.2 Data plane . . . . . . . . . . . . . . . . . . . . . . . . . . . . . . . . . . 11
2.2.1 PHY layer . . . . . . . . . . . . . . . . . . . . . . . . . . . . . . 11
2.2.2 MAC layer . . . . . . . . . . . . . . . . . . . . . . . . . . . . . 15
2.2.3 Convergence layer . . . . . . . . . . . . . . . . . . . . . . . . . 17
2.3 Control plane . . . . . . . . . . . . . . . . . . . . . . . . . . . . . . . . 17
2.3.1 Connection Manager . . . . . . . . . . . . . . . . . . . . . . . . 17
2.3.2 Central Coordinator . . . . . . . . . . . . . . . . . . . . . . . . 18
2.4 MediaXtreme Extension . . . . . . . . . . . . . . . . . . . . . . . . . . 19
3 HomePlug-AV Networks Simulator 21
3.1 Overview . . . . . . . . . . . . . . . . . . . . . . . . . . . . . . . . . . 21
3.2 Channel Generator . . . . . . . . . . . . . . . . . . . . . . . . . . . . . 23
3.3 PHY layer . . . . . . . . . . . . . . . . . . . . . . . . . . . . . . . . . . 26
3.4 MAC layer . . . . . . . . . . . . . . . . . . . . . . . . . . . . . . . . . 26
3.5 Upper-layer services . . . . . . . . . . . . . . . . . . . . . . . . . . . . 27
3.5.1 Data Transfer . . . . . . . . . . . . . . . . . . . . . . . . . . . . 27
XI

CONTENTS
3.5.2 Video Streaming . . . . . . . . . . . . . . . . . . . . . . . . . . 27
3.5.3 Video-conference . . . . . . . . . . . . . . . . . . . . . . . . . . 28
3.5.4 VoIP . . . . . . . . . . . . . . . . . . . . . . . . . . . . . . . . . 28
3.5.5 Network Gaming . . . . . . . . . . . . . . . . . . . . . . . . . . 29
3.6 Statistical Analysis . . . . . . . . . . . . . . . . . . . . . . . . . . . . . 29
3.7 Validation . . . . . . . . . . . . . . . . . . . . . . . . . . . . . . . . . . 30
3.8 Publications . . . . . . . . . . . . . . . . . . . . . . . . . . . . . . . . . 32
4 HomePlug AV Networks Analysis 33
4.1 Real measurements . . . . . . . . . . . . . . . . . . . . . . . . . . . . . 33
4.1.1 Unicast communications . . . . . . . . . . . . . . . . . . . . . . 34
4.1.2 Multicast communications . . . . . . . . . . . . . . . . . . . . . 37
4.2 Simulation . . . . . . . . . . . . . . . . . . . . . . . . . . . . . . . . . . 39
4.2.1 Network service planning . . . . . . . . . . . . . . . . . . . . . 40
4.3 Mathematical Modeling . . . . . . . . . . . . . . . . . . . . . . . . . . . 43
4.4 Analysis conclusions . . . . . . . . . . . . . . . . . . . . . . . . . . . . 48
4.5 Publications . . . . . . . . . . . . . . . . . . . . . . . . . . . . . . . . . 49
5 Fountain Codes 51
5.1 Introduction . . . . . . . . . . . . . . . . . . . . . . . . . . . . . . . . . 51
5.2 Description . . . . . . . . . . . . . . . . . . . . . . . . . . . . . . . . . 52
5.2.1 Random Linear Codes . . . . . . . . . . . . . . . . . . . . . . . 52
5.2.2 LT Codes . . . . . . . . . . . . . . . . . . . . . . . . . . . . . . 53
5.2.3 Raptor Codes . . . . . . . . . . . . . . . . . . . . . . . . . . . . 55
5.2.4 Online Codes . . . . . . . . . . . . . . . . . . . . . . . . . . . . 56
5.3 Implementation details . . . . . . . . . . . . . . . . . . . . . . . . . . . 58
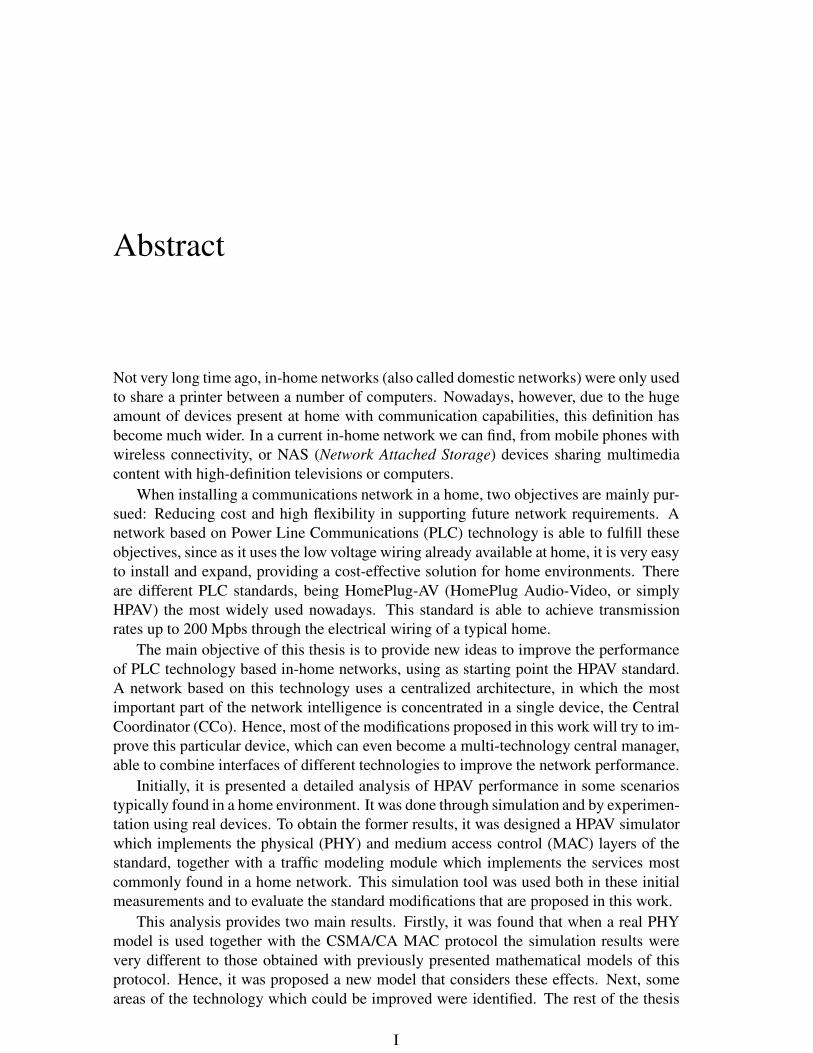
5.4 Reliable data transmission . . . . . . . . . . . . . . . . . . . . . . . . . 59
5.5 Asymmetric interfaces aggregation . . . . . . . . . . . . . . . . . . . . . 61
5.6 Publications . . . . . . . . . . . . . . . . . . . . . . . . . . . . . . . . . 67
6 Multicast 69
6.1 Introduction . . . . . . . . . . . . . . . . . . . . . . . . . . . . . . . . . 69
6.2 Multicast Communications Algorithms . . . . . . . . . . . . . . . . . . . 70
6.2.1 Multicast communications in the HPAV standard . . . . . . . . . 70
6.2.2 Greatest Common Tonemap (GCT) . . . . . . . . . . . . . . . . 71
6.2.3 Aggregated Multicast Bit rate Maximization (AMBM) . . . . . . 71
6.3 Evaluation . . . . . . . . . . . . . . . . . . . . . . . . . . . . . . . . . . 74
6.3.1 Effect of the correlation among channels . . . . . . . . . . . . . 74
6.3.2 Performance of the AMBM algorithm . . . . . . . . . . . . . . . 75
6.3.3 Video streaming evaluation . . . . . . . . . . . . . . . . . . . . . 76
6.4 Publications . . . . . . . . . . . . . . . . . . . . . . . . . . . . . . . . . 78
7 Cross-Layer extension of HPAV CSMA/CA algorithm 79
7.1 Introduction . . . . . . . . . . . . . . . . . . . . . . . . . . . . . . . . . 79
7.2 Optimal HPAV CSMA/CA contention window size . . . . . . . . . . . . 80
7.2.1 Overview . . . . . . . . . . . . . . . . . . . . . . . . . . . . . . 80
XII

CONTENTS
7.2.2 Analysis . . . . . . . . . . . . . . . . . . . . . . . . . . . . . . 80
7.3 Cross-layer protocol extension . . . . . . . . . . . . . . . . . . . . . . . 83
7.3.1 Protocol overview . . . . . . . . . . . . . . . . . . . . . . . . . 83
7.3.2 Modeling the Effect of the Contention Window Size Modification 85
7.3.3 Proposed algorithm . . . . . . . . . . . . . . . . . . . . . . . . . 86
7.4 Implementation challenges . . . . . . . . . . . . . . . . . . . . . . . . . 88
7.4.1 Computational complexity . . . . . . . . . . . . . . . . . . . . . 88
7.4.2 Standard modifications . . . . . . . . . . . . . . . . . . . . . . . 90
7.5 Evaluation . . . . . . . . . . . . . . . . . . . . . . . . . . . . . . . . . . 91
7.6 Publications . . . . . . . . . . . . . . . . . . . . . . . . . . . . . . . . . 94
8 Conclusions 95
8.1 Conclusions . . . . . . . . . . . . . . . . . . . . . . . . . . . . . . . . . 95
8.2 Future work . . . . . . . . . . . . . . . . . . . . . . . . . . . . . . . . . 97
A HPAV Simulator Software Description 99
A.1 Introduction . . . . . . . . . . . . . . . . . . . . . . . . . . . . . . . . . 99
A.2 PHY Layer . . . . . . . . . . . . . . . . . . . . . . . . . . . . . . . . . 99
A.3 MAC Layer . . . . . . . . . . . . . . . . . . . . . . . . . . . . . . . . . 101
B Random Variate Generation 103
B.1 Introduction . . . . . . . . . . . . . . . . . . . . . . . . . . . . . . . . . 103
B.2 Exponential Exp(a) . . . . . . . . . . . . . . . . . . . . . . . . . . . . . 103
B.3 Normal N(µ,σ2) . . . . . . . . . . . . . . . . . . . . . . . . . . . . . . . 104
B.4 Beta B(p,q) . . . . . . . . . . . . . . . . . . . . . . . . . . . . . . . . . 104
B.5 Gamma GAM(k,θ) . . . . . . . . . . . . . . . . . . . . . . . . . . . . . 105
B.6 Extreme EXT(a,b) . . . . . . . . . . . . . . . . . . . . . . . . . . . . . . 105
B.7 Lognormal LN(θ, τ 2) . . . . . . . . . . . . . . . . . . . . . . . . . . . . 106
C List of Acronyms 107
XIII


List of Figures
1.1 HPAV beacon period structure. . . . . . . . . . . . . . . . . . . . . . . . 6
1.2 IEEE 1901 standard architecture. . . . . . . . . . . . . . . . . . . . . . . 7
1.3 Thesis structure. . . . . . . . . . . . . . . . . . . . . . . . . . . . . . . . 9
2.1 HomePlug-AV system architecture . . . . . . . . . . . . . . . . . . . . . 12
2.2 HomePlug-AV transmission mask . . . . . . . . . . . . . . . . . . . . . 13
2.3 HomePlug-AV transceiver . . . . . . . . . . . . . . . . . . . . . . . . . 14
2.4 HomePlug-AV network structure. No communication between AVLN1
(A,B,C) and AVLN2 (D,E) nodes, but CCos work in coordinated mode to
avoid interference. . . . . . . . . . . . . . . . . . . . . . . . . . . . . . 15
2.5 Timing sequence for the transmission of MAC frames . . . . . . . . . . . 16
3.1 Simulator structure . . . . . . . . . . . . . . . . . . . . . . . . . . . . . 22
3.2 Simplified network topology used by the channel generator . . . . . . . . 24
3.3 PLC Channel response long-term variations . . . . . . . . . . . . . . . . 24
3.4 Example of measured and generated channels . . . . . . . . . . . . . . . 25
3.5 ON/OFF model comparison with real traces . . . . . . . . . . . . . . . . 27
3.6 Average throughput evolution versus the simulation time . . . . . . . . . 30
3.7 Average PHY bitrate evolution analysis . . . . . . . . . . . . . . . . . . 31
3.8 Overall simulator validation results . . . . . . . . . . . . . . . . . . . . . 32
4.1 Laboratory test-bed schematic. R, S and T represent the three different
electrical phases respectively. . . . . . . . . . . . . . . . . . . . . . . . . 34
4.2 Modems used in the experiments . . . . . . . . . . . . . . . . . . . . . . 35
4.3 Variable channel capacity analysis . . . . . . . . . . . . . . . . . . . . . 37
4.4 Throughput for different distances using Gigabit PLC and HPAV (95%
confidence intervals) . . . . . . . . . . . . . . . . . . . . . . . . . . . . 38
4.5 Multicast transmission results in a real scenario . . . . . . . . . . . . . . 39
4.6 Total network throughput and one client throughput versus the number
HPAV active stations . . . . . . . . . . . . . . . . . . . . . . . . . . . . 40
4.7 Normalized throughput and number of collisions versus the number of
HPAV stations . . . . . . . . . . . . . . . . . . . . . . . . . . . . . . . . 41
4.8 Delay, Jitter and Latency evolution versus the number of HPAV stations . 42
XV

LIST OF FIGURES
4.9 MAC latency CDF versus the number of HPAV active stations (AS) . . . 42
4.10 State transition diagram of HPAV CSMA/CA backoff procedure under
saturated conditions. Extracted from [Chung et al., 2006] . . . . . . . . . 44
4.11 Throughput under saturated conditions . . . . . . . . . . . . . . . . . . . 47
4.12 Throughput and Delay under unsaturated conditions for 10 contending
stations . . . . . . . . . . . . . . . . . . . . . . . . . . . . . . . . . . . 47
5.1 LT codes codification graph . . . . . . . . . . . . . . . . . . . . . . . . . 53
5.2 LT decoding procedure . . . . . . . . . . . . . . . . . . . . . . . . . . . 54
5.3 Online codes structure . . . . . . . . . . . . . . . . . . . . . . . . . . . 57
5.4 Online codes protocol header . . . . . . . . . . . . . . . . . . . . . . . . 58
5.5 Wireshark plugin . . . . . . . . . . . . . . . . . . . . . . . . . . . . . . 59
5.6 Duration of TCP and Online Codes sessions in a scenario with two (back-
ground) data flows sharing the channel. . . . . . . . . . . . . . . . . . . 60
5.7 Duration of TCP and Online Codes sessions in a scenario with four (back-
ground) data flows sharing the channel. . . . . . . . . . . . . . . . . . . 61
5.8 Illustration of the packet dispersion technique. . . . . . . . . . . . . . . . 63
5.9 Sequential steps of the measurement procedure. . . . . . . . . . . . . . . 64
5.10 Bandwidth Estimation Histograms. . . . . . . . . . . . . . . . . . . . . . 65
5.11 MAC layer transmission rate. Energy efficient bulb connected to the low
tension network at 8 secs. . . . . . . . . . . . . . . . . . . . . . . . . . . 66
5.12 Bandwidth Estimation Histogram after noise source connection. . . . . . 66
5.13 Duration of TCP and Fountain Codes sessions. The confidence interval
has been set to 95%. . . . . . . . . . . . . . . . . . . . . . . . . . . . . . 67
6.1 Throughput and delay obtained with the standard HPAV algorithm and the
GCT based version . . . . . . . . . . . . . . . . . . . . . . . . . . . . . 74
6.2 Comparison between AMBM and GCT algorithms . . . . . . . . . . . . 76
6.3 MPEG-2 throughput, latency and packet losses obtained with the standard
HPAV and the GCT based version, with and without background traffic . 77
7.1 Throughput obtained with the original HPAV CSMA/CA algorithm and
with the optimal contention window extension versus the number of active
stations in the network . . . . . . . . . . . . . . . . . . . . . . . . . . . 81
7.2 Mean contention window size selected for a successful transmission ver-
sus number of contending stations . . . . . . . . . . . . . . . . . . . . . 82
7.3 MAC throughput estimator evaluation . . . . . . . . . . . . . . . . . . . 84
7.4 Algorithm timing sequence . . . . . . . . . . . . . . . . . . . . . . . . . 86
7.5 Channel access rate variation for the different nodes . . . . . . . . . . . . 87
7.6 Latency and jitter evolution for different stations of the evaluation sce-
nario along with their corresponding thresholds. Vertical lines represent
the changes in the network configuration indicated in Section 7.5. . . . . 92
7.7 Packet losses percentage evolution for MPEG-4 stations . . . . . . . . . . 93
7.8 PSNR and MOS for MPEG-4 services estimated from the packet losses . 93
A.1 MAC module software structure . . . . . . . . . . . . . . . . . . . . . . 102
XVI

LIST OF FIGURES
B.1 Gamma variate generator evaluation . . . . . . . . . . . . . . . . . . . . 105
XVII


List of Tables
2.1 ROBO Modes . . . . . . . . . . . . . . . . . . . . . . . . . . . . . . . . 14
2.2 HPAV CSMA parameters as functions of Priority . . . . . . . . . . . . . 17
3.1 HPAV MAC layer parameters. . . . . . . . . . . . . . . . . . . . . . . . 26
3.2 MPEG-2 model Lognormal distribution parameters . . . . . . . . . . . . 28
3.3 MPEG-4 model Gamma distribution parameters . . . . . . . . . . . . . . 29
3.4 Gaming traffic parameters . . . . . . . . . . . . . . . . . . . . . . . . . 29
4.1 Channel capacity with different electrical devices connected to the power
line. 95% confidence intervals . . . . . . . . . . . . . . . . . . . . . . . 36
4.2 Probability of exceeding maximum frame latency requirements for differ-
ent number of active stations . . . . . . . . . . . . . . . . . . . . . . . . 41
4.3 Physical transmission rates for CSMA/CA mathematical model evaluation 46
6.1 QoS requirements for an MPEG-2 streaming service . . . . . . . . . . . 77
7.1 Service parameter limits for good QoS (from [Szigeti and Hattingh, 2005]) 91
7.2 MOS estimation from video PSNR for MPEG-4 services . . . . . . . . . 92
XIX


Chapter1Introduction
Abstract- This chapter provides an overview of the basic concepts that will be cov-
ered in this thesis. First of all, home networks will be defined and the main tech-
nologies that can be used to deploy them will be detailed. After that, as this work is
centered on Power Line Communications, the characteristics of most popular stan-
dards for this technology will be addressed. Finally, the objectives of this thesis and
its structure are summarized.
1.1 Home networks
Nowadays, there is an increasing number of devices at home equipped with communi-
cation capabilities. From computers and mobile phones to traditional home appliances,
all of them can be interconnected to share information or simply can be connected to the
Internet through the home access point. For these reasons, home networks (also called
in-home networks) are growing in complexity and scalability and, correspondingly, in
their implementation challenges, eliciting a significant interest in both the industry and
the scientific community.
According to the Consumer Electronics Association (CEA), an in-home network can
be defined as follows: “A home network interconnects electronic products and systems,
enabling remote access to, and control of those products and systems, as well as any other
available content such as music, video or data”. This definition is quite tied to residential
services but in fact, in-home networks can be easily extended to other similar scenarios
like Small-Medium Enterprises (SME), for example. As can be seen, these networks can
be used for a wide range of applications, which include [Zahariadis, 2003]:
• Home Communication Services. They will permit the Internet access sharing from
multiple home PCs and Internet appliances, and the use of voice and video commu-
nication systems, like Voice Over IP (VoIP) or video-conference.
• Home Entertainment Services. The popularity of entertainment services, such as
music and video streaming, and even online computer gaming is growing exponen-
tially in the last years. These services will benefit from a good in-home network,
causing the users to improve their quality of experience.
1

Chapter 1. Introduction
• Home Automation. In-home networks will be key for the development of smart
homes. It will be possible, for example, to turn on the house heating system or to
start the oven to cook the food before arriving home.
• Home Security. Security and anti-theft systems are also a very interesting applica-
tion, since the technologies used to deploy these networks facilitate the implemen-
tation of security services. The users will be able, for example, to monitor their
homes remotely or receive an automatic e-mail if something happens. Moreover,
they could also install babysitting or health-care services.
By enabling all these possibilities, in-home networks are likely to play a highly impor-
tant role in what is being called the Internet of Things (IoT). This new paradigm is based
precisely in the interaction and cooperation of the different devices around us every day to
achieve common goals [Atzori et al., 2010]. Therefore, the advances in home networking
technologies will be key for the adequate development of this Future Internet.
1.2 Technologies
Several technologies can be used to deploy a home network. Traditional approaches, like
wired and wireless technologies, are the most used nowadays. However, the recently in-
troduced no-new-wires solutions, which use existing infrastructures at homes to lay out
the network, are capturing a significant market share. In this section, the main character-
istics of these technologies are described.
1.2.1 Wired solutions
The main standard in this category is Ethernet, which predominant form is Fast-Ethernet
(IEEE 802.3u) or even Giga-Ethernet (802.3ab). It offers bit-rates up to 1 Gbps while
guaranteeing the stability and security of the network. However, the use of this technology
often requires the installation of a structured wiring infrastructure, which may be costly
in most cases.
1.2.2 Wireless solutions
The most interesting technologies in this category are the 802.11x family. From 802.11b,
which operates in the 2.4 GHz band and provides a maximum data rate of 11 Mbps, to the
recently introduced 802.11n, that offers bit-rates up to 300Mbps by using Multiple Input
Multiple Output (MIMO) and interface aggregation technologies at physical layer.
The best benefit of using wireless networks is the freedom to move around while main-
taining network connectivity. However, although these solutions are the most extended
nowadays, they are not free of some problems:
• Range. The typical range of a common 802.11 network is on the order of tens
of meters. This can be enough for small houses, but may be insufficient in larger
residences. To obtain additional range, repeaters or additional access points are
needed.
2

1.2. Technologies
• Security. Wireless networks require very tight security to avoid unauthorized ac-
cess to the information. Most of these networks already use very complex secure
encryption techniques, but some others still use algorithms with recognized weak-
nesses.
• Reliability. Like any radio frequency transmission, wireless networking signals
are subject to a wide variety of complex propagation effects. Moreover, as the
number of wireless networks increases, the frequency band is more saturated and
some interference effects may appear.
1.2.3 No-New-Wires solutions
No-new-wires technologies are those that make use of existing wiring infrastructures in a
building to lay out the network. This category includes technologies that use the telephone
line, the CATV operators coaxial cable or the low voltage power grid to exchange data.
Below, the most representative solutions in this category are detailed.
Power line communications
Power line communications (PLC) have become one of the most interesting alternatives
for home networking. Networks based on this technology are easy to install and expand
as they use the low-voltage wiring installed in the building (220 volts in Europe, 120 volts
in America). Therefore, they provide a cost-effective solution for home communications.
PLC market solutions can be divided into two categories: Narrowband and Broad-
band [Ferreira et al., 2011]. Usually, Narrowband PLC (NB-PLC) refers to low band-
width communication. This technology uses the frequency band below 500kHz and it
provides data rates of tens of kpbs. Meanwhile, Broadband PLC (BPL) utilizes a much
wider frequency band, typically between 2MHz and 30MHz, and it allows data rates of
hundreds of Mbps. BPL technologies are mainly used today for home networking, as this
application requires high speed data rates. On the other hand, NB-PLC technology is used
in control and monitoring markets, like smart metering, street lighting, renewable energy
generation, etc.
It is necessary to take into account that there are several aspects of the PLC medium
that make it difficult to share resources fairly. The main problems that PLC systems face
are:
• Channel distortion. PLC channel is frequency selective and time variant, and ex-
hibits a remarkable variation among locations, according to the network topology,
the type of wires, and connected loads. Even in a specific in-home network, differ-
ent characteristics can be found depending on the selected transmission path or the
status of the electrical appliances.
• Noise. This technology suffers from high levels of noise that come from many
sources, like light dimmers, motors, power supplies, etc. Because many of these
noise sources are tied to human activity, the amount of noise on the power line will
vary by time of day.
3

Chapter 1. Introduction
• Interference. Electromagnetic compatibility (EMC) with existing services is also
an important problem in PLC. Power lines were not designed for carrying high
frequency signals like the used for home networking. They behave as more or
less efficient antennas for signals around 30MHz, causing interference with other
services that share the same frequency band. Therefore, very low power signals
should be used at these frequencies.
Because of all these problems, the implementation of a powerline communications
standard has proven to be a very difficult task. Different solutions have been released in
the last years, each of them with advantages and disadvantages. The main characteristics
of the most extended specifications for BPL based home networking will be described in
the next section.
CATV coaxial communications
The most extended standard for home networking through the coaxial lines installed at
home is the one developed by the Multimedia over Coax Alliance (MoCA) [Moc, 2014].
MoCA is an association which include important telecommunication companies like Intel,
Cisco Systems or Samsung. Its first specification was released in 2006 and only few
months later the first compliant device was brought onto the market.
The last version of the standard, MoCA 2.0, was released in 2010. It achieves a maxi-
mum physical bitrate of 1.4 Gbps, which means a MAC throughput of around 700 Mbps,
by using RF signals with an operating frequency range from 500 to 1.650 MHz. This high
capacity, together with its low latency (around 5 milliseconds under good channel condi-
tions), make this technology a very promising alternative for home networks deployment.
Moreover, in contrast to other technologies like PLC, it is free of noise and interference
thanks to the coaxial cable shield.
However, this technology has two important drawbacks. Firstly, at least in the majority
of European countries, the number of points of connection with the cable network in a
house is very limited. Even in USA, although MoCA ensure that 90% of houses have
a CATV infrastructure, recent studies show that, in fact, this percentage hardly reach
the 30%. Moreover, most of CATV installations include amplification devices that are not
designed for MoCA frequencies. In these cases, the devices should be replaced or avoided
through different RF components like splitters and mixers.
Phone line communications
As in the previous case, the most extended standard in this area was developed by an
association of companies. It is named Home Phoneline Networking Alliance (HPNA)
[Hpn, 2014]. They release the first version of the HPNA standard for home networking
over phoneline infrastructure in 1998.
The last version of this specification, HPNA 3.1 (also known as G.9954), was released
by the International Telecommunication Union (ITU) in 2007. The main improvement of
this version is the use of the coaxial infrastructure together with the phoneline in order to
achieve better communication rates. Although according to the standard it offers physical
data rates up to 320 Mbps, the real field tests have shown that its rate is near 100 Mbps.
4

1.3. Power line communications standards
This capacity fall is mainly caused by the poor state of the phoneline infrastructure. This
fact, but above all the limited number of connection points, have supposed an important
limitation for the expansion of this technology.
1.3 Power line communications standards
Although broadband power line communications have proven to be a very interesting al-
ternative for home networks deployment, there is an important factor that is delaying the
wider adoption of this technology: the slow development of standards. The standardiza-
tion process was initially carried out by groups of companies, which created incompatible
specifications that usually cannot coexist in the same area. However, by the end of 2011,
the IEEE1901 universal standard for broadband over power line was released and, nowa-
days, many of these companies are bringing to market products compatible with this spec-
ification. The main characteristics of the most extended standard for BPL are described
below.
1.3.1 HomePlug-AV
HomePlug Audio-Video (HPAV) is a specification developed by the HomePlug Powerline
Alliance [Hpa, 2014], which was released in 2005. It is an evolution of the HomePlug 1.0,
the first specification on the alliance which was presented in 2001.
The HPAV Physical (PHY) layer operates in the frequency range of 2 - 28 MHz and
provides a 200 Mbps channel rate and a 150 Mbps information rate. It uses Orthogonal
Frequency Division Multiplexing (OFDM) modulation and a powerful Turbo Convolu-
tional Coding (TCC).
At Medium Access Control (MAC) layer, it provides two kinds of communication
services: Carrier Sense Multiple Access/Collision Avoidance (CSMA/CA) and Time Di-
vision Multiple Access (TDMA). The former provides a contention-free service for ap-
plications with high Quality of Service (QoS) requirements, while the CSMA/CA service
provides a connectionless, prioritized contention service for best-effort applications.
To efficiently provide both kinds of communication service, HPAV implements a flex-
ible, centrally-managed architecture. The central manager is called Central Coordinator
(CCo). The CCo establishes a beacon period and accommodates both the contention free
and the contention-based periods (see Figure 1.1. Note that, for better adaptation to the
channel, the CCo fits these periods inside a 50 Hz AC period). The CCo broadcasts a
beacon frame at the beginning of each beacon period, which is used to communicate the
scheduling within the beacon period.
HPAV is the most extended standard nowadays, with over 180 certified Homeplug
products on the market at this time [Pro, 2014]. Moreover, the Homeplug Powerline Al-
liance has recently release an evolution of this standard, Homeplug-AV2 [Yonge, 2013],
that extends the channel data rate up to 1Gbps by extending the used frequency band while
being compatible with HPAV and IEEE 1901. Since this thesis is mainly focused on this
standard, it will be explained in depth in the next chapter.
5


Chapter 1. Introduction
standard uses a centralized network architecture, in which the main aspects of network
intelligence are managed by the CCo. Therefore, the proposed changes mainly affect to
this device, that can even become a multi-technology central manager, able to combine
interfaces of different technologies to improve the communications. To this end, our first
task was to perform a detailed analysis of the technology, accomplishing the following
partial aims:
• PLC Channel characterization. The first step of this work was the characteriza-
tion of the PLC channel. This study was mainly focused on the effects caused by
different home appliances in the communications performance.
• HPAV network simulator. To better evaluate the different proposals made in this
thesis, it was needed a HPAV network simulator. After the channel characterization,
it was developed an accurate tool that simulate both the physical and the mac layers
of this technology. This tool was the result of a collaborative effort with the PLC
working group of the University of Malaga.
• Network analysis. The next step was the performance evaluation of HPAV technol-
ogy in a domestic scenario. This evaluation includes unicast and multicast commu-
nications and it was made through simulation and real measurements. In this part,
the main issues related to the use of this technology to deploy a home network were
identified. The rest of the thesis was focused on implementing solutions to these
problems.
As said before, different weaknesses of this technology were identified in the experi-
ments performed to evaluate the PLC technology in a domestic scenario. In order to solve
them, we have proposed some improvements for the HPAV standard which will signifi-
cantly increase the whole network performance. These improvements can be divided into
three different groups:
• Fountain codes. There are several aspects of the PLC channel that make difficult
the communications, such as time-varying behavior or the broadcast nature of the
channel. In this environment, Fountain codes [MacKay, 2005] can provide impor-
tant advantages that worth to be studied. In addition, these codes can be used to
transmit information through asymmetric interfaces. This feature is very interest-
ing, since eventually would allow the CCo to use interfaces of different technologies
together as a single logical link to improve the network performance. An important
objective of this thesis has been to propose and evaluate different uses of Fountain
codes in home networking.
• Multicast communications. Many of the services traditionally used in home net-
works require multicast communications, e.g. music and video streaming, online
computer gaming, gaming consoles, or even video conferencing. However, OFDM
based technologies do not implement real multicast data transmission due to the
modulation properties. In this thesis some new ways of implementing multicast
communications over these networks are presented and evaluated.
8


Chapter 1. Introduction
• Homeplug-AV CSMA/CA Evaluation in a Real In-Building Scenario, IEEE Com-
munications Letters, 2011
In order to solve the problems found in the previous chapter analysis, different im-
provements of the HPAV standard are proposed along the rest of chapters of the thesis.
All of them are easy to implement and they only require small modifications of the current
technology version. These changes have been divided into three different areas: Fountain
codes, multicast communications and cross-layer techniques.
The use of Fountain Codes in HPAV networks is addressed in chapter 5. They are
used to increase the data throughput in highly disturbed environments and to aggregate
asymmetric interfaces. This chapter is mainly supported by the following publications
[Muñoz et al., 2011][Piñero et al., 2011][Montoro et al., 2011]:
• Rateless Codes for Reliable Data Transmission over HomePlug AV Based In-Home
Networks, International Conference on Software and Data Technologies (ICSOFT
2009, Revised Selected Papers published in Communications in Computer and In-
formation Science series)
• Rateless codes for heterogeneous in-home interfaces aggregation, IEEE Interna-
tional Symposium on Power Line Communications and Its Applications (ISPLC
2011)
• An Implementation of a Highly Accurate Timestamping System Embedded in the
Linux Kernel and its Application to Capacity Estimation, International Conference
on Software and Data Technologies (ICSOFT 2011)
Multicast communications experiments are presented in chapter 6, where the multicast
problem is carefully described and different solutions are compared through simulation.
This work has been published in [Piñero et al., 2014][Piñero et al., 2012]:
• Analysis and improvement of multicast communications in HomePlug-AV based in-
home networks, Computer Networks, 2014
• Evaluation of a New Proposal for Efficient Multicast Transmission in HomePlug-
AV Based In-Home Networks, Lecture Notes of the Institute for Computer Sciences,
Social Informatics and Telecommunications Engineering, 2012.
Next, the use of cross-layer techniques to improve the HPAV CSMA/CA algorithm is
evaluated in chapter 7, being the obtained results published in [Pinero et al., 2014]:
• Homeplug-AV CSMA/CA Cross-layer Extension for QoS Improvement of Multime-
dia Services, IEEE Communications Letters, 2014
Finally, the main conclusions derived from the work are summarized in chapter 8,
where future works are also discussed.
10

Chapter2HomePlug-AV Standard
Abstract- In this chapter, the main features of the HomePlug-AV standard for broad-
band power line communications are described. It is given an introduction to the dif-
ferent elements of the system architecture, describing the solutions adopted in each
one to overcome the problems generated by the harsh conditions of PLC channel.
2.1 Introduction
HomePlug-AV [Hpa, 2007] is a standard developed by the Homeplug Powerline Alliance
with the purpose of providing enough capacity to support broadband Internet access and
the distribution of high-quality audio and video contents [Afkhamie et al., 2005a]. It is an
evolution of its predecessor, HomePlug 1.0, which was released by the alliance in 2003.
The system architecture is shown in Figure 2.1. As can be seen, the system is divided
into two clearly differentiated parts: Data Plane and Control Plane. The former is related
to data management and it provides the traditional layered approach, with a PHY layer,
a MAC layer and a Convergence Layer (CL). On the other hand, the specification has
chosen to define the control plane as a monolithic entity, called Connection Manager
(CM), since its primary function is the management of the different connections from
higher layer applications. Although in the figure appears a Central Coordinator module,
this entity only will be active in one -and only one- station in a single HPAV network.
2.2 Data plane
2.2.1 PHY layer
The PHY layer operates in the frequency range of 2-28 MHz. It uses OFDM modulation,
which is based on simultaneous transmission of a large number of orthogonal carriers
with a very narrow bandwidth. Specifically, 1.155 carriers from 1.8Mhz to 30Mhz are
used in HPAV, so the separation between carriers is approximately 24.4KHz. However,
some of these carriers coincide with radio amateur emission bands and cannot be used,
which brings the total of usable carriers down to 917. Figure 2.2 shows the attenuation
11


2.3. Control plane
Table 2.2: HPAV CSMA parameters as functions of Priority
Priorities CA3,CA2 Priorities CA1,CA0
BPC=0 DC=0 W=7 DC=0 W=7
BPC=1 DC=1 W=15 DC=1 W=15
BPC=2 DC=3 W=15 DC=3 W=31
BPC>2 DC=15 W=31 DC=15 W=63
are composed of a header and one or more PBs. In all cases, the receiver selectively
acknowledges the PBs. Those that are not positively acknowledged are retransmitted
during the next channel access of the station. A MAC frame is not considered as received
until all of its PBs have been received correctly.
2.2.3 Convergence layer
The CL acts as a interface between the applications in the Higher Layer Entity (HLE)
and the HPAV stack. It receives data frames from the Data Service Access Point (SAP),
applies the required format changes, and redirects them to the appropriate destination in
the MAC layer. In addition, it performs the functions described below:
• Classification. The CL take incoming frames from the application and determines
the connection which they are associated to. This step is done by using a rules set
generated when the connection is created.
• QoS Monitoring. The CL gathers statistics about each application performance and
passes them to the CM. In this way, the CM is able to verify if the system satisfy
the QoS requirements required by service level.
• Auto-Connect Service. This optional service provides support for applications that
start transmission without specifying QoS parameters. In this case, the connection
is automatically established with specific QoS parameters based on the recognition
of the data stream characteristics.
• Smoothing. The last optional feature in the CL is a point-to-point smoothing of the
data stream. This service consist in a delay compensation and jitter control of the
data packets before sending them to the corresponding application. In this way, a
better user experience is achieved.
2.3 Control plane
2.3.1 Connection Manager
The main part of the control plane is the Connection Manager, which main function is
the management of the different connections from the HLE. When an application opens a
17

Chapter 2. HomePlug-AV Standard
connection, it provides a Connection Specification (CSPEC), that details its QoS require-
ments. The CM is responsible for evaluating that CSPEC and setting up the appropriate
connection in conjunction with the CM in the station at the other end of the connection
and with the CCo. It is Connection Manager’s responsibility to ensure that the appropriate
mechanisms are used in order to provide to the application the required QoS parameters.
Another important task performed by the CM is the estimation and maintenance of
the Tone Map. To this end, the CM invokes a procedure that is divided into two phases:
Initial channel estimation and Dynamic channel estimation.
The initial channel estimation is invoked by the transmitter when there is data to trans-
mit and it does not have any valid tone map. During this procedure the transmitter sends
one or more frames to the receiver, who uses them to estimate the channel characteristics
and designate a default tone map. This tone map may be used by the transmitter anywhere
in the AC line cycle. Then, the receiver sends this tone map back to the transmitter. Once
the transmitter have a valid tone map, it starts the transmission of data frames to the re-
ceiver. Using these data frames, the receiver is able to obtain updates to the default tone
map or to generate new tone maps. These new tone maps are usually only valid at specific
intervals of the AC line cycle. This procedure is called Dynamic Channel Estimation.
2.3.2 Central Coordinator
When a HPAV station is powered on, it performs a Power-on Discovery procedure. If it
hears an existing AVLN, it attempts to join it. If it does not hear an existing AVLN, it will
form its own network by becoming the CCo and broadcasting a beacon with a specific
NID. In this case, the station activates the CCo module in its control plane.
After that, the CCo attempts to learn the topology of its AVLN and of any neigh-
boring AVLNs. To achieve this, it starts a Discover Beacon procedure, which consist in
periodically sending a frame with information about the station itself and the AVLN to
which it belongs. Each station that hears these frames adds the contained information to
the Discovered Stations List (DSL). However, if the information is related to a differ-
ent AVLN, the station adds the information about the other network to the Discovered
Networks List (DNL). The CCo periodically asks each station about its DSL and DNL
and uses the information to create a topology map. If during this procedure a station that
would be a better CCo is discovered, the handover of CCo functions to that station is
negotiated.
Besides transmitting the beacon frame, the CCo also performs bandwidth management
functions. It receives connection requests from the stations, which are scheduled depend-
ing on the QoS parameters and the network status. Moreover, when a connection cannot
be allocated because of bandwidth limitations, the CCo rejects it to avoid compromising
the QoS of existing connections.
Finally, the last subject controlled by the CCo is the network security. It controls the
access to the AVLN and ensures the privacy of the data exchanged between the stations.
The security is provided by means of a single encryption algorithm (128-bit AES) and a
single hash function (SHA-256).
18

2.4. MediaXtreme Extension
2.4 MediaXtreme Extension
In order to achieve better performance, an extension of the HPAV standard has been pro-
posed by BroadCom corporation [bro, 2014]. It consist in two technologies called Me-
diaXtreme and Xtendnet. The former is used to achieve up to 882 Mbps PHY rate and
with the second the nodes can act as repeaters, increasing the network coverage and the
throughput between distant devices.
MediaXtream technology basically consists in extending the operation band of HPAV
up to 300MHz. However, because of EMC regulations, very low power levels should be
used, causing the MediaXtreme band to rapidly vanish in long distances. Modems im-
plementing this technology are completely interoperable with traditional HPAV devices,
since this new band is only used if both, transmitter and receiver modems, have this capa-
bility.
To deal with the coverage problem, it is proposed an intelligent routing technology,
known as Xtendnet. This technology monitors the QoS and the link rates to determine
the best options for information delivery, and to try to ensure that each node is reachable.
For each node in a network, Xtendnet can decide if it acts as a normal node or as a
repeating node or as both. If a node is configured as a repeating node, it will regenerate
and reamplify received signals for improved signal coverage.
19


Chapter3HomePlug-AV Networks Simulator
Abstract- In this chapter, a network simulator for power line communications based
in Homeplug-AV technology is presented. The simulator implements both the PHY
and the MAC layers, along with a traffic generator which emulates the behavior of
most frequently used services in home networks. Therefore, this simulator is a very
powerful tool for the analysis of HPAV home networks and the evaluation of the
improvements of the standard proposed in this thesis.
3.1 Overview
The particular characteristics of the PLC channel make very difficult the development of
a PLC network simulator. In fact, nowadays, there are no simulators that implement both
the physical and the MAC layers of the HPAV standard. Because of that, the evaluation of
HPAV protocols in the literature is usually performed by the simplification of the physical
layer [Yoon et al., 2008][Kim et al., 2008].
The development of an accurate HPAV simulator was a key aspect to reach the differ-
ent objectives of this thesis. Firstly, it was needed a tool to analyze the performance of an
HPAV in-home network in order to obtain the main limitations of the technology. Then, it
was also used to implement the proposed enhancements of the standard and to assess how
much improved its performance.
In this chapter, it is presented a PLC network simulator based in the HPAV technol-
ogy, which is the result of a collaboration with the PLC research group of the University
of Málaga [PLC, 2014]. The simulator implements both, the PHY and the MAC layer,
and also a traffic generator which includes the services most used in home networks. It
uses the channel model proposed in [Canete et al., 2011] and the OFDM system described
in [Afkhamie et al., 2005b][Latchman et al., 2005]. The MAC layer implementation is
based in the CSMA/CA protocol detailed in [Chung et al., 2006]. Although, according to
the standard, HPAV also provides a TDMA service, it is not available in most commer-
cial modems. Therefore, in this first version of the simulator, only CSMA/CA contention
service is implemented. However, as detailed below, the modular design of the simulator
facilitates the later addition of the TDMA service.
The structure of the simulator is shown in Figure 3.1. As seen, the simulator consists
21


3.2. Channel Generator
• Jitter. Variability over time of the MAC delay. It has been computed according to
the definition given in RFC 3550 [Schulzrinne et al., 2003]:
J(i) = J(i− 1) +1
16(|D(i)−D(i− 1)| − J(i− 1)) . (3.1)
• Latency. Time spent by a frame to cross the whole system, from its arrival to the
transmitter station buffer to its fully reception at the destination.
• Frame Errors. Frame losses caused by a transmitter station buffer overflow (buffer
size is limited to 1 MB).
Simulation modes
To complete the different objectives of this thesis, the simulator has been coded to offer
three different working modes:
• Normal. In the normal mode, the output parameters are calculated in a per-second
scale. The results provided in each case are averaged within that second.
• Instantaneous values. In this case, the instantaneous latency, delay and jitter for
each transmitted frame are saved. This mode is off by default due to the huge size
of the output files.
• Multicast p-to-p. When this mode is on, the first station acts as a multicast server,
sending data to the other stations. The data is sent as described in the HPAV stan-
dard, i.e. data is sent to each client sequentially using point to point transmissions.
This mode can be used together with any of the previously presented ones.
3.2 Channel Generator
The channel response generator is based on the simplified bottom-up model proposed in
[Canete et al., 2011]. It considers the indoor power grid as a set of multiple transmission
lines interconnected and ended in different impedance values. The link between each pair
of stations is represented by a simplified structure consisting of a main path from which
three stubs are deployed, as shown in Figure 3.2. Similarly, a reduced set of impedance
values is considered. This simplified topology is not intended to model the whole layout of
the indoor grid, but only the equivalent network seen from the transmitter to the receiver.
This model, although simple, is very realistic.
Two versions of this channel generator has been implemented within this thesis. The
former, which was presented in [Pinero et al., 2011a], was able to generate long-term vari-
ations in the generated channels. It is achieved by changing the impedance function con-
nected to a randomly selected socket at the instants indicated in the simulation configura-
tion. Moreover, each time a long-term variation in the impedance is generated, the noise
can be changed too. In this way, a connection/disconnection of a home appliance in the
network can be simulated. Figure 3.3 represents a channel response with five long-term
23


3.2. Channel Generator
2 4 6 8 10 12 14 16 18 20-80
-70
-60
-50
-40
-30
-20
-10
frequency (MHz)
|H(f
)| (
dB
)
(a) Measured in an apartment
2 4 6 8 10 12 14 16 18 20-80
-70
-60
-50
-40
-30
-20
-10
frequency (MHz)
|H(f
)| (
dB
)
(b) Uncorrelated channels obtained with first sim-
ulator version
2 4 6 8 10 12 14 16 18 20-80
-70
-60
-50
-40
-30
-20
-10
frequency (MHz)
|H(f
)| (
dB
)
(c) Correlated channels obtained with the pro-
posed channel generator
Figure 3.4: Example of measured and generated channels
seen, differences among the channels in Figure 3.4 (c) are more realistic than among the
channels in Figure 3.4 (b). This correlation cannot be achieved by means of any of the sta-
tistical channel models proposed in the literature, which generate uncorrelated channels.
Compared to other bottom-up models, in which correlation among channels is the natural
result of the grid layout, this strategy releases the user from the burden task of defining
the in-home grid for each considered network.
Regarding the Noise Generator, noise at each communication end is composed of
three terms that are assumed to be stationary: background noise, a set of narrowband in-
terferences affecting to a set of carriers in the HPAV band and two periodic asynchronous
impulsive noise components with frequencies 26.3 kHz and 48.9 kHz, respectively. Three
noise scenarios, which differ in the power of the different noise terms, have been defined:
heavily, medium and weakly disturbed. Each time the channel generator is called, it ran-
domly selects one of these scenarios. In this way, it is achieved a variability in the channel
capacity that is observed in real scenarios.
25

Chapter 3. HomePlug-AV Networks Simulator
Table 3.1: HPAV MAC layer parameters.
Parameter Value Parameter Value
max_FL 2501.12 µs Response Timeout 140.48 µs
CIFS 100 µs RIFS 30.72 µs
PRS0 35.84 µs PRS1 35.84 µs
PB Payload 512 bytes PB Head 8 bytes
Frame Payload 1500 bytes Frame Head 26 bytes
3.3 PHY layer
The physical layer simulates a pulse-shaped and windowed OFDM system as the one
defined in the Homeplug-AV standard. The system parameters have been drawn from
[Afkhamie et al., 2005b][Latchman et al., 2005]. To speed up simulations, the channel
coding block has been substituted by a constant coding gain. This substitution is widely
accepted in the related bibliography. The value of that gain is selected depending of the
coding block type and the characteristics of the system noise. In this case, a gain of 12 dBhas been selected (nevertheless, the 16/21 code rate is taken into account). The number of
bits per carrier is computed using the expression given in [Chung and Goldsmith, 2001],
which implicitly assumes that both the noise and distortion are Gaussian. To compensate
for the two aforementioned approximations, a 3 dB system margin has been included. The
Bit Error Rate (BER) is fixed to 10−5.
3.4 MAC layer
As said before, the present version of the simulator only implements the contention service
based on CSMA/CA. For this layer, it has been developed a custom event-driven simulator
of this protocol that uses the parameter values shown in Table 3.1.
Figure 2.5, shown in chapter 2, depicts an example of the timing sequence for the
transmission of frames on the medium. An important restriction on the sequence is the
maximum frame transmission time in each channel access (MAX_FL), which cannot
exceed 2501.12 µs, including the RIFS. Therefore, the amount of bytes transmitted by a
station depends on its PHY layer rate. Each time a node gets the channel for transmission,
it gets its instantaneous channel capacity from the data generated by the PHY layer simu-
lator to calculate the number of PBs it can transmit. These PB can independently fail due
to the existing BER, and in this case, they are retransmitted in the next channel access.
A MAC frame is not considered as received until all of its PBs have been acknowledged.
Therefore, the lost of a PB turns into a delay growth.
26


Chapter 3. HomePlug-AV Networks Simulator
An I-frame is made up of a single uncompressed video frame, and its content is unrelated
to the preceding and the following frames. On the other hand, P-frames and B-frames use
motion-compensated prediction. P-frames are based on the previous frame and B-frames
are based on previous and future frames. A group of coded frames is called a Group-of-
Pictures, or GOP in short. The GOP structure defines the number and the temporal order
of P and B frames between two successive I frames.
The MPEG-2 model implemented in this work [Krunz and Hughes, 1995] suggests
the following GOP structure: IBBPBBPBBPBBPBB. In addition, the size of the different
frame types follows a Lognormal distribution (eq. 3.2) with the parameters shown in table
3.2. A film is divided into a set of scenes, and each scene has a number of GOPs that is
exponentially distributed with mean 10. Consecutive I frames in the same scene have
exactly the same size of the first I frame. The transmission rate is set to 30 fps.
f (x) =1
xσ√2 · π
e−(lnx−µ)2/2σ2
(3.2)
Table 3.2: MPEG-2 model Lognormal distribution parameters
Frame type SDTV Rate HDTV Rate
I-frame µ = 800 Kbits σ = 240 Kbits µ = 3.2 Mbits σ = 960 Kbits
P-frame µ = 240 Kbits σ = 160 Kbits µ = 960 Kbits σ = 640 Kbits
B-frame µ = 80 Kbits σ = 24 Kbits µ = 24 Kbits σ = 96 Kbits
3.5.3 Video-conference
Video-conference service is based on the MPEG-4 video codec, which model is proposed
in [Koumaras et al., 2005]. This codec uses a GoP composed of I, B and P frames, with
30 fps and the following structure: IPBPBPBPBPBPB. In this case, the size of the frames
is shorter than in MPEG-2 codec due to the improved compressing process. In MPEG-4
model, the frame size distribution fits to a Gamma distribution:
f (x) =
xk−1 · e−x/θ
θk·Γ(k)x > 0
0 otherwise
(3.3)
where Γ represents the Gamma function. Finally, Table 3.3 shows the Gamma distri-
bution parameters depending on the video quality.
3.5.4 VoIP
VoIP service has been implemented using the G729 codec based model proposed in
[Hassan H., 2005]. This model characterizes the VoIP traffic as an ON/OFF model, where
28

3.6. Statistical Analysis
Table 3.3: MPEG-4 model Gamma distribution parameters
Frame type SDTV Rate HDTV Rate
I-frame θ = 9.013 k = 12240 θ = 45.06 k = 12240
P-frame θ = 2.812 k = 11880 θ = 14.06 k = 11880
B-frame θ = 1.665 k = 9660 θ = 8.325 k = 9660
Table 3.4: Gaming traffic parameters
Parameter Server (per client) Client
Interarrival time Extreme (a=55, b=6) Deterministic (40 ms)
Packet Size Extreme (a=120, b=36) Extreme (a=80, b=5.7)
both, the active period (talk spurt) and the inactive period (silence) are exponentially dis-
tributed with mean values of 0.35 and 0.65 seconds respectively. During the ON period,
the source sends 70 bytes frames at regular intervals of 30 ms.
3.5.5 Network Gaming
Network gaming traffic is becoming one of the most used multimedia services in home
networks. The analysis of this traffic is also very interesting because of its restrictive time
constraints. A traffic model for this service is proposed in [Färber, 2002]. This model is
based on a client-server architecture, where the server traffic increases with the number of
clients. The Extreme probability distribution (shown in eq. 3.4) is used to generate both
client and server traffics. The parameters of the distribution are shown in table 3.4.
f (x) =1
be−
x−ab · e−e−
x−ab
(3.4)
3.6 Statistical Analysis
As explained above, the simulation tool generates a random topology (i.e. attenuation
and noise) each time it is executed. In addition, in a single realization, the results are
averaged during the simulation time. Hence, it is important to obtain how many different
simulations and how long they should be to obtain reliable statistical results.
To obtain the required simulation time, a realization with three stations (each of them
with a different channel capacity) was performed for a long time. It was analyzed the
time required by the averaged throughput to become stable (with an statistical error less
than 1%). The obtained results are shown in Figure 3.6. As can be seen, this time is very
similar in all the stations, being approximately 200 seconds.
Then, the required number of simulations was obtained by studying the mean PHY
bitrate of a station versus the number of simulations. Figure 3.7 shows five different
29


Chapter4HomePlug AV Networks Analysis
Abstract- In this chapter, the experiments made to analyze the HPAV based in-home
networks are detailed. These tests are mainly divided into two groups: real mea-
surements and simulations. Through the first set of measurements, the particularities
of HPAV in unicast and multicast communications will be evaluated. Simulation
has been used to test some aspects of the standard that cannot be checked from real
measurements and also to validate the simulator itself. In addition, from the results
obtained in both cases, it is proposed a model that emulates the influence of the PHY
layer in the CSMA/CA protocol behavior. Finally, the conclusions of the experi-
ments are listed, identifying some aspects of the standard that could be improved,
which will be addressed in the remaining chapters of this thesis.
4.1 Real measurements
In this section, the laboratory tests performed to analyze the PLC communication channels
will be described. This set of experiments was divided into two groups: Unicast and
Multicast. In each case, different experiments were performed to help us to understand
the particularities of the medium.
All the presented experiments have been made using a laboratory test-bed, which has
been designed to be quite similar to a real in-home scenario. It consists of 15 computers
divided into 5 groups as shown in Figure 4.1. The groups are connected to different
electrical phases, which are isolated enough to assume that an in-building environment is
emulated (each group represents a different home). Moreover, the computers of the same
phase are separated by different distances, emulating in this way the different link lengths
of a typical home.
To perform the tests, PLE200 HomePlug AV Ethernet adapters of Linksys has been
used (see Figure 4.2 (a)). These adapters connect the Ethernet device of a computer to the
220 V power line. The HPAV implementation details in these devices are not known, but
from our characterization measurements, it can be extracted that they work in CSMA/CA-
only mode, not implementing the TDMA service.
In addition, some experiments were performed to test the MediaXtream extension
described in chapter 2. In this case, two F5D4076 Belkin modems, which implement
33


4.1. Real measurements
(a) Linksys PLE200 HPAV device (b) Belkin F5D4076 MediaXtream
device
Figure 4.2: Modems used in the experiments
complete capacity restoration, the modem needs about 5 minutes, because of that, it is not
shown in the figure. The connection of the mobile charger causes a descend in the SNR
in that link. Specifically, the rectifier included in this device causes a periodic impulsive
noise each time the electrical signal reach zero. Therefore, HPAV devices should adapt
their TM to reduce the packet losses. After the disconnection of the charger, the channel
adaptation procedure is able to modify the TM again to recover the maximum data rate
but, according to the HPAV standard, this increment is slow to achieve a better adaptation
to the network conditions.
This experiment has been repeated with other electronic devices. Table 4.1 represents
the link capacity obtained for each one. Among the most usual devices, the mobile charger
and energy efficient light bulb are the noisiest. The former because of the reason described
above, and the efficient light bulb because of it uses a switched-mode power supply that
causes harmonics in the HPAV frequency band. On the other hand, a simple extension
lead (without any connected devices) reduces the capacity to 72 Mbps, not because of the
noise but the impedance mismatch effect caused by the new branch.
Effects of the simultaneous combination of several devices were also evaluated (see
Table 4.1). Firstly, it can be concluded that several devices of the same type do not reduce
the SNR more than one of them. On the other hand, the combination of different devices
generates different effects in function of how they are mixed. The reason of that is strictly
related to the frequencies affected by the devices.
Next, the objective of the following experiments is to prove that the connection of
a noise source does not affect in the same way to all the stations in the HPAV network,
causing assimetries in the communications. The experiments were made in a HPAV net-
work with three computers (PC15, PC13 and PC12). Firstly, the transmission capacities
between the three HPAV modems, were measured in a noise-free scenario, being close to
87 Mbps. Later, a device that is known to cause a high performance degradation (a mobile
phone charger) was connected next to PC12, and the capacities of the links were measured
again. The results are graphically represented in Figure 4.3(b). It can be observed that the
35

Chapter 4. HomePlug AV Networks Analysis
Table 4.1: Channel capacity with different electrical devices connected to the power line.
95% confidence intervals
Device Channel capacity [Mbps]
Without noise 86.921 ± 0.131
Mobile phone charger 60.600 ± 0.458
Laptop 84.045 ± 0.253
Wishk 82.236 ± 0.824
Heater 83.884 ± 0.142
Multimedia hard disk 86.379 ± 0.229
PC screen 76.303 ± 0.141
Electric heater 59.061 ± 0.780
Reading lamp 79.519 ± 0.118
Extension lead 72.106 ± 0.125
Energy efficient light bulb 57.058 ± 0.726
Charger + Reading lamp + Electric heater 40.654 ± 0.448
Charger + Reading lamp 54.310 ± 0.473
Charger + Electric heater 43.155 ± 0.724
Reading lamp + Electric heater 57.694 ± 0.476
Reading lamp + Reading lamp 74.552 ± 0.285
Charger + Charger 57.092 ± 1.252
connection of the new device at second 6 causes a very important reduction of the PC15-
PC12 transmission rate but it does not affect the capacity of the PC15-PC13 connection.
When the device is disconnected at second 12, the capacity of the link increases and it
will reach its initial value. It is important to remark that the two transmission represented
in the figure are not simultaneous, although in both cases the noise pattern is the same.
Therefore, it has been proved that HPAV networks have several effects of asymmetries:
whereas some HPAV devices have a correct operation, others can suffer a reduction in
their transmission capacities. These asymmetries can even affect to a single link. For
example, in this case, the transmission rate of the PC12-PC15 link remains close to 87
Mbps when the mobile phone charger is connected.
It is important to remark that, in all the described experiments, the packet losses are
close to zero. This is because the modem implements a flow control mechanism to limit
the traffic from the PC under bad PLC channel conditions. To check this, a sniffer capture
was performed in the transmitter PC, obtaining that the modem is sending MAC Pause
frames [IEE, 1997] to indicate the Ethernet interface not to send more frames to avoid
buffer overflow.
The last set of experiments have the purpose of evaluating the HPAV MediaXtream
extension (named Gigabit PLC modems), in particular the distance in which this tech-
nology is useful. To evaluate the variation of the UDP throughput with the distance, two
F5D4076 modems were connected in an isolated scenario by wires of different lengths.
The same experiments were performed with two PLE200 HPAV modems. Figure 4.4
shows the obtained results. As can be seen, a strong dependence on distance is observed
36


4.3. Mathematical Modeling
4.3 Mathematical Modeling
After analyzing the behavior of the CSMA/CA protocol used in HPAV, the results were
compared with [Yoon et al., 2008][Chung et al., 2006], which are two of the most rele-
vant previous works in this area. It was found that the existing mathematical models for
this protocol do not consider the variable physical layer capacity of this kind of networks.
In them, it is assumed that the physical transmission rate of all the pairs is equal to the
maximum transmission rate allowed by the medium. As can be extracted from the pre-
vious results, the PHY rate has an important impact in the CSMA/CA performance that
worth to be studied. To this end, it was decided to use the developed simulator to extend
the existing models.
The starting point in this study is [Chung et al., 2006], where the CSMA/CA back-
off procedure under saturated conditions (all the stations have frames for transmitting
immediately after a successful frame transmission) is mathematically modeled as a tridi-
mensional Markov chain (see Figure 4.10). The state is defined by the following tuple
(BPC(t),DC(t),BC(t)), where each variable denotes the stochastic process representing the
values of the corresponding counter at the beginning of the slot t. Moreover, pb and p are
the probabilities of sense the medium busy and the probability of a collision respectively.
It is assumed that the network is composed of n stations. In this case, these probabilities
have the same value, which can be expressed as follows:
pb = p = 1− (1− τ)n−1 (4.1)
where τ is the probability that a station transmits a frame in a slot. In this algorithm, all
the station transmits when BC counter reaches 0. Therefore τ can be calculated by using
the following expression:
τ =
m∑
i=1
Mi−1∑
j=0
Pi,j,0 (4.2)
wherem and Mi−1 are the maximum values of BPC and DC respectively and Pi,j,k is the
steady state probability for theMarkov chain, which solution is presented in the referenced
paper.
Using these expressions, the throughput under saturated conditions can be expressed
as:
Ssat =PtrPsE[NPayload]
(1− Ptr)σ + Ptr(PsTs + (1− Ps)Tc)(4.3)
where Ptr is the probability that at least one station transmits a frame, Ps is the probability
that a station successfully transmits a frame, E[Npayload] is the average payload size, σ is
the duration of an idle slot and Ts and Tc are the average times that the medium is busy
due to a successful frame transmission and due to a collision, respectively. The Ptr and
Ps values are shown below:
Ptr = 1− (1− τ)n
Ps = nτ(1−τ)n−1
Ptr
(4.4)
43

Chapter 4. HomePlug AV Networks Analysis
In addition, taking into account that a collision is detected when the sending station
does not receive an acknowledgment (ACK):
Ts = PRS0 + PRS1 +HEAD + Tfrasuc +RIFS + Tres + CIFSTc = PRS0 + PRS1 +HEAD + Tfracol + CIFS
(4.5)
Figure 4.10: State transition diagram of HPAV CSMA/CA backoff procedure under satu-
rated conditions. Extracted from [Chung et al., 2006]
44

4.3. Mathematical Modeling
where Tfrasuc and Tfracol indicate the mean frame transmission time in a successful trans-
mission and in a collision, respectively, Tres indicates the acknowledgment frame duration
and HEAD denotes the HPAV head time, whose duration is independent of the transmis-
sion rate.
Proposed extension
Authors of [Chung et al., 2006] assume that the physical transmission rate of the contend-
ing stations is constant and equal to the maximum rate allowed by the medium (i.e. 150.19
Mbps). Therefore, Tfrasuc, Tfracol and E[Npayload] are constant too. However, in the real
world the physical transmission rates of the contending station are usually different and
lower than 150.19 Mbps. Therefore, these parameters are not constant. In this case, the
values of these parameters can be obtained using the following expressions:
E[NPayload] =1
N
N∑
i=1
Li =
=1
N
N∑
i=1
⌊Ci(Max_FL−RIFS)
PBsize⌋ · PBsize (4.6)
where Li is the amount of bits that the station i transmits each time it can access to the
shared channel, N is the number of contending stations, Ci is the physical rate from the
station i to the destination and PBsize is the physical block size.
Tfrasuc =
N∑
i=1
pt(i)Li
Ci=
1
N
N∑
i=1
Li
Ci(4.7)
where pt(i) represents the transmission probability of station i. Note that, under saturatedconditions, all the contending stations have the same opportunities to access the channel.
Finally, Tfracol is determined by the worst of each two stations which are colliding.
Without lost of generality, the collision of only two stations has been considered (a higher
order collision is quite unlikely). Thus,
Tfracol =N∑
i=1
N∑
j=1
pc(i, j) ·max(Li
Ci
,Lj
Cj
) (4.8)
where pc(i, j) represents the collision probability between stations i and j. Since the
collision procedure is memoryless, its probability is given by:
pc(i, j) =
1
(N2 )if i 6= j
0 if i = j(4.9)
The proposed model can be simplified (with a minimum loss of accuracy) assuming
that the transmitted information is a multiple of the PBsize. In this case, the parameters
Tfracol and Tfrasuc remain constant, being E[NPayload] the only variable parameter:
Tfracol = Tfrasuc = Max_FL−RIFS
45

Chapter 4. HomePlug AV Networks Analysis
Table 4.3: Physical transmission rates for CSMA/CA mathematical model evaluation
Station CPHY (Mbps)
1 100.029
2 109.629
3 108.771
4 100.781
5 95.668
6 118.415
7 82.264
8 98.756
9 114.359
10 113.634
E[NPayload] =(Max_FL− RIFS)
N
N∑
i=1
Ci (4.10)
In the same way, [Chung et al., 2006] also provides a procedure to obtain the through-
put under unsaturated conditions. It is assumed that the arrival of frames to each station
follows a Poisson process with arrival rate λ. In this case, the throughput under unsatu-
rated conditions is obtained through numerical methods which use the same parameters
than in the saturation analysis. Therefore, the proposed extension can also be applied to
this scenario.
The proposed model has been validated and compared to the original one using the
simulator described in the previous chapter. The simulation scenario is composed of ten
HPAV stations. Table 4.3 shows the physical transmission rates of the transmitter-receiver
pairs. These values have been obtained using the uncorrelated channel generator and no
long term variations in the channel response have been simulated.
In a first experiment, the frame arrival rate is high enough to assume saturation condi-
tions. Figure 4.11 shows the total network throughput values when clients join the network
in the order indicated in Table 4.3. As can be seen, the obtained throughput values are
rather worse when real physical transmission rates are considered. As said before, in the
original model all the stations are considered to achieve the maximum physical transmis-
sion rate, and as consequence they transmit the maximum amount of bits in each channel
access. However, when real physical rates are considered, less bits are transmitted in
each access. This fact causes the total MAC throughput to be lower than in the original
model. The proposed model is also validated since analytical and simulation results are
quite similar.
Note that the arrival of a new station does not necessarily involve a reduction of the
total MAC throughput. In fact, it can even produce a throughput improvement. This is
due to a pair of facts. First of all, the frame transmission time is fixed by the HPAV
standard, and therefore, the faster stations can transmit more bits in each access than the
slower ones. On the other hand, due to the CSMA/CA medium access control, under
saturated conditions all the stations have the same opportunities to access the channel. As
a consequence, when a fast station is connected, it can turn into a total network throughput
46


Chapter 4. HomePlug AV Networks Analysis
stations. This is a logical result, since all the stations have frames to transmit after a
successful transmission and will always compete for the channel. Hence, the time de-
lay between two channel accesses experienced by a station will not depend on the number
frames transmitted by a station in a single channel access but on the number of contending
stations.
In the unsaturated scenario, the results obtained for the MAC delay are different. As
shown in Figure 4.12(b), the delay experiences a big increment when the saturation is
achieved, being the value in this point similar to that obtained in the saturated model.
4.4 Analysis conclusions
From all the experiments performed in this chapter, several conclusions can be extracted.
Regarding the real measurements, it can be inferred that:
• HPAV PHY layer exhibits a remarkable variation, which depends on the network
topology, the type of wires and the devices connected to the electrical network. This
variability can cause very important changes in the MAC layer throughput, which
can experience a reduction of 30% with the only connection of a home appliance to
the grid. Moreover, these changes can only affect to a part of the network, obtaining
important asymmetries even in a simple link. However, these effects do not cause
an increase in the packet losses, since theMAC flow control algorithm implemented
in the modems limits the traffic from the PC under bad PLC channel conditions.
• Multicast communications are implemented as consecutive point-to-point transmis-
sions, done in a way transparent to the end user. With this technique, the effective
multicast capacity is significantly reduced when number of clients is high. More-
over, the MAC flow control does not work properly in this situation, causing a high
number of packet losses.
In addition, from the simulations results, it can be concluded that:
• It has been proved that the simulator is a very powerful tool to evaluate the perfor-
mance of services with QoS requirements and to implement cross-layer solutions,
since it implements both PHY and MAC layers of HPAV standard.
• It has been proposed a model that is able to emulate the effects of the variations at
PHY layer in the CSMA/CA protocol. The model accuracy has been evaluated with
the simulator, obtaining good results.
With these results, it was decided that there were three areas that worth a detailed
study: The use of Fountain codes for reliable data transmission, the proposal of solutions
to improve the multicast communications and the implementation of cross-layer protocols
to build a “PHY-aware” MAC. By including these enhancements in the HPAV CCo, the
whole HPAV system performance can be significantly improved. Some of these function-
alities can be directly tested in the real test-bed. However, others require modifications in
the standard, so they must be evaluated by simulation.
48

4.5. Publications
4.5 Publications
The work developed in this chapter has been partially published in the following refer-
ences:
• P.J. Piñero, J. Malgosa, P. Manzanares, J.P. Muñoz, Homeplug-AV CSMA/CA Eval-
uation in a Real In-Building Scenario, IEEE Communications Letters, Vol 15, No.
6, pp. 683-685, 2011
49


Chapter5Fountain Codes
Abstract- Fountain codes are a class of source codes which are able to provide reli-
able communications without a feedback channel. Because of the properties of the
PLC channel, these codes can be very useful in networks based on this technology.
Concretely, two different applications will be presented, one for reliable data trans-
mission and another for aggregation of asymmetric interfaces. In the first case, they
could be used to overcome the limitations of TCP in shared mediums, and in the sec-
ond, the use of this codification technique will allow the combination of interfaces of
different technologies to improve the whole home network performance.
5.1 Introduction
The main idea behind Fountain codes (also known as rateless codes) [MacKay, 2005]
is that the transmitter acts like a fountain of water, which is able to produce an infinite
number of water drops (coded packets). The receiver represents a bucket that needs to
collect a certain number of these water drops to be able to decode the information. The
main advantage of these codes is that the receiver can obtain the information regardless of
which coded packets it has collected. Therefore, Fountain codes should have the following
properties:
• A transmitter can generate a potentially infinite amount of encoded packets from
the original data.
• A receiver can decode a message that would require K packets from any set of K ′
encoded packets, forK ′ slightly larger thanK.
The most important implementations of Fountain codes are LT codes, Raptor codes
and Online Codes. LT codes were the first practical realization of a fountain code. The
only drawback of these codes is that their encoding and decoding costs scale as KlogeK,
where K is the file size. Raptor codes are an evolution of LT that achieve linear cost for
encoding and decoding. Finally, Online Codes are a free-software alternative to Raptor
codes that also achieve linear cost for both operations.
There are lots of application of Fountain codes in digital communications although the
most important are:
51

Chapter 5. Fountain Codes
• Multicast. In multicast communications, each receiver experiences losses indepen-
dently to the others’. Therefore, the number of control packets to recover all these
lost packets can be very high. Through the use of Fountain codes this problem is
solved, even allowing a receiver to start the reception of a message with a certain
delay.
• Parallel download. Fountain codes can also be very useful in a scenario where a
receiver downloads a file from various sources at the same time (for example in
P2P networks). Through them, each source can generate a stream of coded packets
independently, and the receiver only needs a number of packets without care of their
origin.
• Video streaming. One of the most common problems in video streaming is the
delay caused by retransmissions. Through the use of Fountain codes this problem
is solved since the receiver only needs to wait for the needed number of packets
to recover the image, without being aware of losses. In fact, Raptor codes has
been adopted as encoding technique for Digital Video Broadcasting (DVB) in IPTV
services [Stockhammer et al., 2011].
In this chapter, two different uses of these codes in PLC networks will be evaluated:
Reliable data transmission and aggregation of asymmetric interfaces. The first one makes
use of these codes to overcome the limitations of TCP protocol in PLC networks, in which
the variable capacity and the shared medium access cause a reduction in TCP perfor-
mance. In the second set of experiments, it will be shown that the use of this codification
technique allows the combination of interfaces of different technologies to improve the
in-home network performance.
5.2 Description
5.2.1 Random Linear Codes
Random Linear Codes (RLC) are the most simple implementation of a Fountain Code.
The procedure to transmit a message composed of k packets is as follows:
1. In each clock cycle (called n), the transmitter generates an array with k random bits
(Gnk).
2. The coded packet (tn) is obtained by XOR-ing the source packets for which Gnk is
1.
3. The generated bit array for each packet is saved, creating a binary generator matrix
(G).
By using this procedure, the receiver is able to obtain the source packets by inverting
the generator matrix:
52


5.2. Description
short, it can disappear and cause a fail in the decoding process. Ideally, a good solution
to this problem is that the Ripple is only composed of one packet at each iteration. Using
this condition, Luby proposes the Ideal Soliton Distribution (ρ(.)) shown below:
ρ (d) =
1k
d = 1
1d(d−1)
d = 2, ..., k
(5.2)
However, this distribution does not work properly in real scenarios, since the mean
value of the Ripple size is one, and a small variance can cause the failure of the decoding
process. To solve this problem, the Robust Soliton Distribution (µ(.)) is proposed. To
obtain this distribution, it is defined R = c · ln(k/δ) ·√k, where δ is the decoding process
failure probability, c is a positive constant, and τ (d) is defined as:
τ (d) =
Rdk
d = 1, ..., kR− 1
R·ln(R/δ)k
d = kR
0 d = kR+ 1, ..., k
(5.3)
With all these parameters, µ(.) is obtained as follows:
β =∑
∀d
τ(d) + ρ(d) (5.4)
µ(d) =τ(d) + ρ(d)
β∀d ∈ 1...k (5.5)
Using this degree distribution, only k·β coded packets are needed in order to guarantee
a successful decoding probability of 1−δ . It can be also shown that this distribution fulfillall the conditions that have been detailed for LT codes. In addition, the c parameter can be
adjusted to modify the behavior of the process. A high c value decreases the mean degree
of the coded packets, increasing the probability of successful decoding but also increasing
the number of packets needed to start this process. If c value is low, the opposite behavioris achieved.
5.2.3 Raptor Codes
As seen before, LT codes has non-linear decoding time. Raptor codes [Shokrollahi, 2006]
are a extension of LT codes which achieve linear coding/decoding times. This codification
technique is able to recover a message composed of k source packets from k(1− ǫ) codedpackets with a probability of 1−δ, where ǫ = 4δ(1−4δ). Each coded packet is generatedthroughO(ln(1/ǫ))mathematical operations while the whole source message is recovered
with O(k · ln(1/ǫ)) operations.The main idea behind this technique is the concatenation of a traditional FEC code
(Reed-Solomon, Turbo-Codes, Tornado, etc) with a “weak” LT code. The “weak” LT code
55

Chapter 5. Fountain Codes
does not allow the recovering of all source packets, which should be recovered through
the concatenated FEC decoding. Assuming that a message composed of k source packets
is transmitted with a Raptor encoder, the first step is the use of a FEC encoder, to generate
n intermediate packets. Then, these n packets are the input of the LT encoder, that gener-
ates a infinite amount of coded packets. Meanwhile, in the receiver side, these steps are
performed in reverse order to recover the information.
To design a Raptor code, the first step is to choose the degree distribution of the LT
encoder. To this end, the author proposes a variation of the Soliton Distribution (Ω(.)):
ΩD(x) =1
µ+ 1
[
µx+D∑
i=2
xi
i(i− 1)+
xD+1
D
]
(5.6)
The next step is the selection of a FEC code. In [Shokrollahi, 2006] the author shows
that this outer code should fulfill the following conditions:
• Its information rate should be R = (1− ǫ/2)/(1 + ǫ).
• The number of intermediate packets generated should be n = [k/(1− R)].
The most used FEC encoders are Low Density Parity Check (LDPC) and Tornado
codes, or even a combination of them.
5.2.4 Online Codes
Online Codes [Maymounkov and Mazieres, 2003] are characterized by two parameters εand q. The receiver can recover the original message from any (1 + 3ε)K coded blocks
(also called check blocks) with a success probability determined by of 1− (ε/2)q+1.
The structure of Online Codes is depicted in Figure 5.3. The encoding process is
divided into two layers, the inner code and the outer code. The inner code is in charge of
generating the check blocks. Every check block is computed as the XOR operation of dblocks uniformly chosen from the message (d represents the degree of the check block).
The probability that d = i is given by a specific probability distribution ρi:
ρ1 = 1− (1 + 1/F )
(1 + ǫ)(5.7)
ρi =(1 + ρ1)F
(F − 1)i(i− 1)i = 2, 3, ..., F (5.8)
where F is given by
F =ln(ǫ2/4)
ln(1− ǫ/2)(5.9)
However, due to the random selection of the message blocks, some of themmay not be
selected in the inner coding process, for example the third input block in Figure 5.3. One
solution to this problem is to add a preliminary coding process (called outer coding) which
generates 0.55qǫK auxiliary blocks from the original message. The message blocks that
56


5.4. Reliable data transmission
Figure 5.5: Wireshark plugin
Finally, to facilitate the protocol implementation and the results extraction procedure,
a Wireshark plugin was created. The plugin (called dissector) creation process is well
documented in the application website [wir, 2014]. A snapshot of the protocol traffic
capture is shown in Figure 5.5. As can be seen, the content of header fields is shown in
the protocol info section, to facilitate the post-processing of the results.
5.4 Reliable data transmission
Although in the previous chapter it was said that the flow control implemented in the
modems causes packet losses to be close to zero, there are still some situations where
the modems lose some frames. Two examples of those situations are highly saturated
environments, where the number of collisions can be very high, and environments with
high asynchronous impulsive noise conditions. In traditional networks, to overcome these
losses, the TCP protocol is used. However, TCP protocol does not perform correctly in
PLC networks due to the following reasons [Francis et al., 2012]:
• Random losses. TCP was designed for Ethernet networks and it assumes that all
packet losses are caused by congestion. Therefore, after a packet loss is detected,
the protocol launches the congestion avoiding mechanisms that could considerably
reduce the network throughput.
• Contention. When TCP protocol is used, the communication is bidirectional. There-
fore, transmitter and receiver have to compete for the channel to transmit data and
ACK packets respectively. This causes an increment in the number of collision,
even increasing the previously described effect.
• Variable Round Trip Time (RTT). Most of TCP timeouts are defined according to
the RTT. However, in PLC network this RTT is very time-variant, causing duplicate
retransmissions or the assignment of very high timeout values that can affect to the
protocol performance.
59
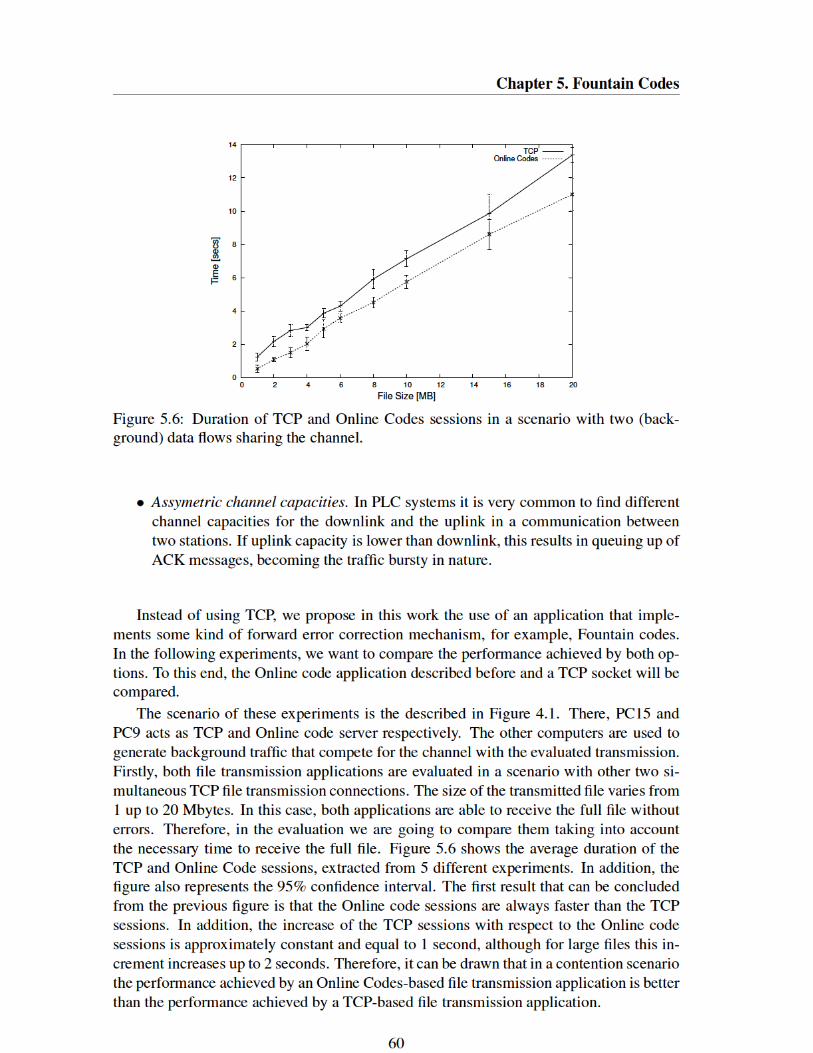


Chapter 5. Fountain Codes
Bonding Driver modification
The Linux bonding driver provides a method for aggregating multiple network interfaces
into a single logical bonded interface. This driver provides seven different workingmodes.
Among them, the most interesting one is the Round-Robin mode, which transmits the
packets using the aggregated interfaces in a sequential order. With this mode, load bal-
ancing and fault tolerance are achieved. However, when different technology interfaces
are aggregated, the module must transmit by all the interfaces at the worst rate (i.e., the
minimum rate) in order to avoid packet disordering.
To develop a driver that works properly with asymmetric interfaces a modification of
the Round-Robin mode is proposed. A new variable is defined within the main structure
of the module to store the minimum transmission rate among the aggregated interfaces.
This variable is used to determine the amount of packets that each interface will transmit.
Concretely, in each turn, the driver will transmit by each interface a number of packets
equal to the times that its transmission rate exceeds the minimum transmission rate.
Note that, for variable capacity technologies, it is necessary to periodically measure
the channel capacity in order to update the packets distribution (or even to eliminate an
interface if it fails). This capacity measurement procedure has to be as fast as possible
and it should avoid sending too much information to not affect other stations in shared
channels, such as PLC or Wireless. The capacity measurement procedure used in this
work is explained below.
However, this packet distribution update only solves the long term capacity variations,
and there are other short term problems that can seriously affect to the data transmission
when this driver is used:
• Packet losses due to an unpredictable and short-term phenomenon, such as impul-
sive noise in PLC channels, or due to collisions in the shared channel.
• Packet disordering due to capacity variations between two bandwidth measures.
In order to overcome these problems, the use of fountain codes is proposed in this
work.
Bandwidth Measurement Procedure
In order to configure the Round-Robin parameter, a link capacity measurement of the ag-
gregated links is needed. Since some of the technologies that can be aggregated provide
variable capacity links, this bandwidth estimation procedure has to be periodically exe-
cuted. In this work, a completely integrated tool that uses packet dispersion techniques
for estimating these capacities has been developed. This tool provides an efficient and
accurate capacity measure of each of the aggregated links.
The capacity measurement system lays in packet dispersion concepts. The basics of
the packet dispersion techniques were originally proposed in [Jacobson, 1988]. In this
paper, it is discussed the feasibility of obtaining the capacity of one link using the infor-
mation of the interarrival time of two packets sent through that link if they are injected
back-to-back, i.e., if there is no time separation within transmissions of the individual
62


5.5. Asymmetric interfaces aggregation
0
20
40
60
80
100
0 100 200 300 400 500
Measure
s (
%)
Capacity (Mbps)
(a) Fast-Ethernet
0
20
40
60
80
100
0 100 200 300 400 500
Measure
s (
%)
Capacity (Mbps)
(b) PLC
Figure 5.10: Bandwidth Estimation Histograms.
present some wrong values. However, by repeating the bandwidth estimation procedure
five times the correct bandwidth value can be obtained in a precise way.
A histogram representation was chosen because no much precision is needed. The
selected capacity will be the central value of the most repeated histogram column, and the
packet distribution is obtained through the following expression:
pi =
⌊
Bi
W
⌋
(5.13)
were Bi is the bandwidth of the ith interface and W is the worst bandwidth value
between the considered interfaces. Applying procedure, in the presented experiment the
driver will transmit three packets by the PLC interface and one by the Fast-Ethernet inter-
face in each turn.
Once the packet distribution was obtained, the modified bonding driver was evaluated
through a Raw Socket. A huge amount of data was transmitted by each interface sepa-
rately and by the bonded interface. In both cases, the data rate at the receiver side was
measured using WireShark. In order to obtain more realistic results, a noise source (i.e. a
energy-efficient bulb) was connected to an outlet near to the PLC modem to cause a fast
transmission rate fading. The results are showed in Fig. 5.11, where it can be seen that
the transmission rate achieved by the bonding interface is higher than the rate achieved by
the other interfaces separately. The bandwidth obtained with the original bonding driver
is also showed. As expected, it transmits by each interface at the lowest rate, achieving a
bandwidth rather worse than the obtained with the modified driver. Note that it is not pos-
sible to transmit by each interface separately and by the bonded interface at the same time.
Therefore, the results were obtained at different times but connecting the noise source at
the same instant.
The bandwidth estimation procedure is periodically executed. Therefore, some time
after the noise source connection, the system is able to check the new PLC capacity
65


Chapter6Multicast
Abstract- Homeplug AV implements an inefficient multicast mechanism in which
these communications are carried out as successive point-to-point transmissions. In
this chapter, the limitations of this approach will be analyzed and new algorithms that
improve the multicast performance of the standard will be proposed and evaluated
using the previously presented simulator. They are firstly compared in terms of their
physical bit rate. Finally, their capacity to deliver a video streaming service is also
assessed.
6.1 Introduction
Multicast communications are very important in shared medium networks, like PLC.
Thanks to multicast technology it is possible to transmit an information flow to a (prob-
ably great) set of receivers using only one transmission flow. Otherwise, collisions and
delays would frustrate the provision of the service. There are not a lot of services that are
multicast in nature, but most of the used in in-home and in-building scenarios are, like for
example IPTV or digital-radio.
As it was previously said and corroborated through real measurements, HPAV does
not implement real multicast data transmission. This is because its bit-loaded OFDM
physical layer has been designed to exploit the frequency selectivity of the channel, which
is a very link dependent feature. Therefore, multicast transmissions in HPAV networks are
implemented as a set of consecutive point-to-point transmissions that are carried out in a
transparent way to end users.
The multicast problem has been widely explored in wireless scenarios, and some so-
lutions have been recently proposed. They can be divided into two categories: Solutions
that try to minimize the total power consumption under the fixed system throughput con-
straint [Kim et al., 2007][Wu et al., 2010], and solutions that maximize the total system
throughput under the power consumption constraint [Suh and Mo, 2008] [Liu et al., 2008]
[Bakanoglu et al., 2010]. However, these results cannot be directly applied to PLC, since
the maximum Power Spectral Density (PSD) is the most restrictive constraint in this tech-
nology. In fact, all carriers are transmitted at the maximum power level allowed by the
PSD mask. Hence, decreasing the power level used in one carrier does not allow increas-
69

Chapter 6. Multicast
ing it in another one. On the other hand, the contributions to this area in PLC networks
are very limited. To the our best knowledge, the only relevant contribution related to mul-
ticast communications in these networks can be found in [Maiga et al., 2010], where the
use of pre-coded OFDM is proposed. This solution improves the multicast throughput but
requires significant changes at the physical layer, which discards it as a real alternative for
the HPAV standard.
Moreover, these works only evaluate the physical layer transmission rates, but do not
consider their implications at higher layer services. A common feature of the aforemen-
tioned multicast works is that they have been accomplished in wireless scenarios or using
PLC channel models that generate uncorrelated channels. Nevertheless, all the links es-
tablished in a given in-home PLC network share a common network layout, which causes
the channels to exhibit some degree of correlation. This correlation has been tradition-
ally neglected because it has no influence on the physical layer analysis in point-to-point
communications. However, it cannot be disregarded when assessing multicast algorithms,
since their performance is strongly dependent on the differences among the involved chan-
nels. The larger the dissimilarities among them, the poorer the multicast performance.
In this chapter, it will be evaluated the performance of multicast communications in
a HPAV network using the previously presented network simulator. It will be shown that
it can be significantly improved by means of the classical multicast algorithm in which
the number of bits per carrier is determined by the user with the worst SNR. In addition,
a more elaborated multicast algorithm is proposed for scenarios with higher number of
users. Finally, it will be assessed the performance of a video streaming service using the
multicast strategy implemented in the HPAV standard and a modified version that includes
the classical multicast algorithm.
6.2 Multicast Communications Algorithms
6.2.1 Multicast communications in the HPAV standard
In order to send a multicast frame to a multicast group, the current version of the HPAV
standard sends one point-to-point frame to each member of the multicast group. This
technique clearly degrades the performance of multicast services as the number of re-
ceivers increases. Its effective multicast transmission bit rate can be calculated by means
of expression (6.1). Since transmissions are serially accomplished, the time required to
accomplish the multicast transmission, TM , is the sum of the transmission times of the
M multicast clients, tm, with m = 1...M . Therefore, assuming that the transmitted data
has size L, and that the channel conditions remain invariable during the transmissions, the
inverse of the multicast bit rate, CM , will be the sum of the inverse of the different clients
bit rates, Cm.
TM =M∑
m=1
tm ⇒ CM =L
TM=
L∑M
m=1 tm⇒ 1
CM=
∑Mm=1 tmL
=M∑
m=1
1
Cm(6.1)
As it will be shown below in this chapter, this poor performance can be improved
with a multicast algorithm that selects a common tone map for all the multicast clients.
70

6.2. Multicast Communications Algorithms
This is the most straightforward multicast strategy and will be referred to as Greatest
Common Tonemap (GCT). Although its performance in PLC networks is much better
than in wireless environment, it still decreases rapidly when the number of user increases.
Therefore, a new algorithm is proposed to tackle situations with a relatively high number
of users, e.g., in a hotel floor. This algorithm will be referred to as Aggregated Multicast
Bitrate Maximization (AMBM).
6.2.2 Greatest Common Tonemap (GCT)
In this technique, the constellation used in each carrier will be that of the multicast user
with the worst SNR in the corresponding frequency band. Let us denote by bm,k the num-
ber of bits per symbol that the mth user would use in carrier k in a single-user scenario.
The number of bits per multicast symbol in carrier k, bk, is computed as
bk = minm
(bm,k) form = 1...M, (6.2)
and the multicast bit rate is
CM =1
T
N∑
k=1
bk, (6.3)
where T is the OFDM symbol period and N is the number of OFDM carriers (917 in
HPAV).
This algorithm is implemented at the physical layer and could be added to the HPAV
standard with minimum changes. It is the simplest multicast algorithm and it has been
widely evaluated in wireless networks obtaining poor performance [Suh and Mo, 2008].
Because of this fact, it has been traditionally discarded also for PLC. However, in con-
trast to wireless network, where users experience independent fading, channel responses
in a given PLC network exhibit significant correlation among them. This reduces the
differences among the SNR experienced by different users in a given sub-band. As a con-
sequence, the performance of the algorithm is significantly better than in scenarios where
channels from different users are uncorrelated. To the authors’ best knowledge, this fact
has not been previously considered in the literature.
6.2.3 Aggregated Multicast Bit rate Maximization (AMBM)
The objective of this algorithm is to maximize the aggregated multicast bit rate at the
physical layer. This is done at the expense of achieving different bit rate for each mul-
ticast user. Therefore, retrieving information in these circumstances requires the use of
some kind of coding in higher layers, which will be discussed at the end of this section.
Hence, the suitability of this algorithm for PLC will depend on the trade-off between the
gain achieved at the physical layer and the overhead introduced by the selected coding
technique. Since the bit rate gain at the physical layer (with respect to the GCT) increases
with the number of users, this strategy will be useful in scenarios with high number of
users.
71

Chapter 6. Multicast
The aggregated multicast bit rate can be improved by solving the optimization algo-
rithm shown in expression (6.4). The function ρm,k indicates whether the mth client will
use carrier k, ρm,k = 1, or not, ρm,k = 0, in the multicast transmissions.
max
M∑
m=1
N∑
k=1
bk · ρm,k
subject to bk =minm
(bm,k · ρm,k) ∀ρm,k = 1, m = 1...M. (6.4)
In this case, it is difficult to obtain an unique multicast bit rate value in order to com-
pare it with the previous algorithms, because the algorithm assigns a different bit rate
for each multicast user. In this paper, we consider that the multicast bit rate (CM ) can
be computed as the average amount of multicast information delivered in a given time
period,
CM =1
MT
M∑
m=1
N∑
k=1
bk · ρm,k, (6.5)
which is larger than (6.1) and (6.3), as it will be shown later in this paper.
It is important to note that the AMBM algorithm is a non-linear integer programming
problem, because of the “min” operator. As a consequence, it becomes an NP-hard prob-
lem with (B ·M)N possible solutions, where B is the number of different values that bkmight take, i.e. the number of different constellations. In our problem B = 7 (HPAV uses
constellations with 1, 2, 3, 4, 6, 8 and 10 bits/symbol) and N = 917 as detailed in chapter2. Hence, even for a scenario with only two users, it yields to 14917 possible solutions.
It must be also highlighted that, even assuming that the problem might be formulated
as an Integer Linear Programming (ILP) problem, the computational complexity would
be extremely high because of the large number of carriers. Moreover, the time required
to solve an ILP problem does not depend only on the number of variables, but also on
the constraints and constants of the problem. Hence, even for a fixed number of clients
and carriers, the time needed to solve the problem is not deterministic, but depends on the
quality of the involved links. Because of these pitfalls, suboptimal approaches based on
Linear Programming (LP) are commonly used. However, while LP has reduced solving
times, it leads to non-integer values of that, when rounded, might lead to solutions that are
far from the optimum one. Hence, the following greedy algorithm is proposed to solve it:
For k = 1...N do:
1. Sort the values of bm,k, deleting duplicated elements. The resulting list, r, representsall the possible values that can be assigned to bk.
2. For each element ri ∈ r, calculate the sum of the number of bits per symbol that
the different clients would obtain in the considered carrier if ri is finally used as thenumber of transmitted bits. This magnitude can be denoted by Bk and is obtained
by multiplying ri by the number of clients with bm,k >= ri, which is denoted by
N(ri). It should be taken into account that ρn,k = 0 if ri > bm,k , i.e., themth client
will not use carrier k.
72

6.2. Multicast Communications Algorithms
3. Select the value of ri that provides the highest Bk.
An example is given below to illustrate the procedure. For simplicity, only three
carriers, denoted as k0, k1, k2, are considered in an scenario with M = 4 clients. The
single-user tone map of the different users are b1,k = [3, 4, 6], b2,k = [6, 5, 9], b3,k =[6, 2, 7], b4,k = [9, 5, 9]. Hence, for k0, r = [3, 6, 9] and the following results are obtained
when the second and third steps of the algorithm are executed,
• r1 = 3⇒ Bk0 = 3 ·N(3) = 3 · 4 = 12,
• r2 = 6⇒ Bk0 = 6 ·N(6) = 6 · 3 = 18,
• r3 = 9⇒ Bk0 = 9 ·N(9) = 9 · 1 = 9.
Since the highest bit rate is achieved when client 1 does not use carrier k0, it resultsthat ρm,k0 = [0, 1, 1, 1]. The number of bits that the clients would extract from each
multicast symbol is bn,k0 · ρm,k0 = [0, 6, 6, 6].In the same way, for k1, the obtained results are:
• r1 = 2⇒ Bk1 = 2 ·N(2) = 2 · 4 = 8,
• r2 = 4⇒ Bk1 = 4 ·N(4) = 4 · 3 = 12,
• r2 = 5⇒ Bk1 = 5 ·N(5) = 5 · 2 = 10.
Therefore, bn,k1 · ρm,k1 = [4, 4, 0, 4]. Finally, using the same procedure, bn,k2 · ρm,k2 =[6, 6, 6, 6].
With these results, the number of bits per symbol obtained for each client is:
• b1,k = [0, 4, 6] = 10,
• b2,k = [6, 4, 6] = 16,
• b3,k = [6, 0, 6] = 12,
• b4,k = [6, 4, 6] = 16,
If the GCT algorithm is applied in the same scenario, the results would be b1,k =b2,k = b3,k = b4,k = [3, 2, 6] = 11. As expected, with the AMBM algorithm the clients
with the best channel conditions obtain better results at the expense of reducing the bitrate
of clients with bad conditions. This is in contrast to the results obtained with the GCT
algorithm, where all the clients obtain the same bitrate to the detriment of clients with
good SNR. On the other hand, the AMBM algorithm usually leads to different physical
bit rates for each multicast client. As a consequence, a higher layer coding must be used
to manage this asymmetry. Different alternatives can be used to this end, but the most
well-known are the MDC (Multiple Description Coding) [Goyal, 2001] and the Fountain
codes.
73

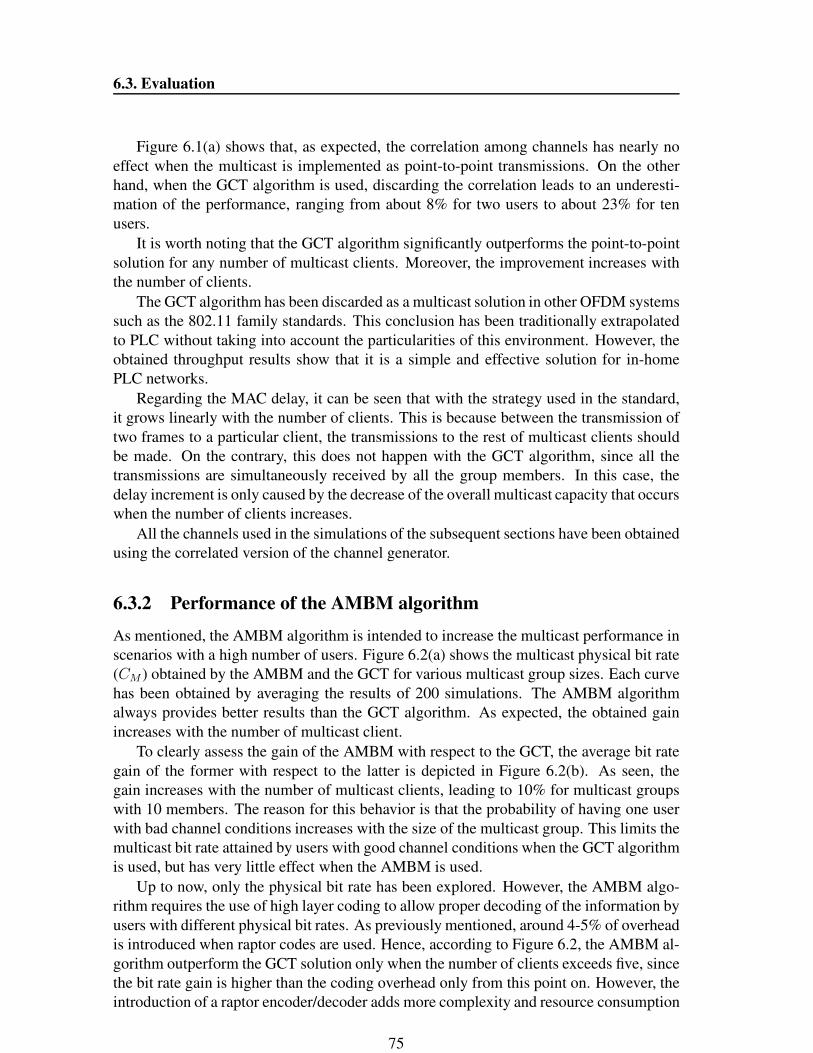
6.3. Evaluation
Figure 6.1(a) shows that, as expected, the correlation among channels has nearly no
effect when the multicast is implemented as point-to-point transmissions. On the other
hand, when the GCT algorithm is used, discarding the correlation leads to an underesti-
mation of the performance, ranging from about 8% for two users to about 23% for ten
users.
It is worth noting that the GCT algorithm significantly outperforms the point-to-point
solution for any number of multicast clients. Moreover, the improvement increases with
the number of clients.
The GCT algorithm has been discarded as a multicast solution in other OFDM systems
such as the 802.11 family standards. This conclusion has been traditionally extrapolated
to PLC without taking into account the particularities of this environment. However, the
obtained throughput results show that it is a simple and effective solution for in-home
PLC networks.
Regarding the MAC delay, it can be seen that with the strategy used in the standard,
it grows linearly with the number of clients. This is because between the transmission of
two frames to a particular client, the transmissions to the rest of multicast clients should
be made. On the contrary, this does not happen with the GCT algorithm, since all the
transmissions are simultaneously received by all the group members. In this case, the
delay increment is only caused by the decrease of the overall multicast capacity that occurs
when the number of clients increases.
All the channels used in the simulations of the subsequent sections have been obtained
using the correlated version of the channel generator.
6.3.2 Performance of the AMBM algorithm
As mentioned, the AMBM algorithm is intended to increase the multicast performance in
scenarios with a high number of users. Figure 6.2(a) shows the multicast physical bit rate
(CM ) obtained by the AMBM and the GCT for various multicast group sizes. Each curve
has been obtained by averaging the results of 200 simulations. The AMBM algorithm
always provides better results than the GCT algorithm. As expected, the obtained gain
increases with the number of multicast client.
To clearly assess the gain of the AMBM with respect to the GCT, the average bit rate
gain of the former with respect to the latter is depicted in Figure 6.2(b). As seen, the
gain increases with the number of multicast clients, leading to 10% for multicast groups
with 10 members. The reason for this behavior is that the probability of having one user
with bad channel conditions increases with the size of the multicast group. This limits the
multicast bit rate attained by users with good channel conditions when the GCT algorithm
is used, but has very little effect when the AMBM is used.
Up to now, only the physical bit rate has been explored. However, the AMBM algo-
rithm requires the use of high layer coding to allow proper decoding of the information by
users with different physical bit rates. As previously mentioned, around 4-5% of overhead
is introduced when raptor codes are used. Hence, according to Figure 6.2, the AMBM al-
gorithm outperform the GCT solution only when the number of clients exceeds five, since
the bit rate gain is higher than the coding overhead only from this point on. However, the
introduction of a raptor encoder/decoder adds more complexity and resource consumption
75


Chapter 6. Multicast
ets are lost). On the other hand, the modified HPAV that includes the GCT algorithm
achieves good performance in both cases (with and without background traffic) with up to
ten multicast clients. In the figure, it can be seen that the results offered by this algorithm
perfectly fits with the traffic offered by the MPEG-2 encoder.
6.4 Publications
The work developed in this chapter has been partially published in the following refer-
ences:
• P.J. Piñero, J.A. Cortes, J. Malgosa, F.J. Ca nete, P. Manzanares, L. Diez, Analy-
sis and improvement of multicast communications in HomePlug-AV based in-home
networks, Computer Networks, Vol 62, pp. 89-100, 2014
• P.J. Piñero, J. Malgosa, P. Manzanares, J.P. Muñoz, Evaluation of a New Pro-
posal for Efficient Multicast Transmission in HomePlug-AV Based In-Home Net-
works, Lecture Notes of the Institute for Computer Sciences, Social Informatics
and Telecommunications Engineering, Vol. 82, pp. 58-70, 2012.
78

Chapter7Cross-Layer extension of HPAV
CSMA/CA algorithm
Abstract- This chapter proposes a cross-layer extension of the CSMA/CA protocol
used in HPAV. The objective is to allocate more bandwidth to nodes with QoS needs
by giving them more channel access opportunities. An easy way to do this is by
appropriately modifying the contention window size of the participants considering
both the QoS requirements of the upper-layer services and the physical layer restric-
tions. The presented algorithm has been mathematically modeled and evaluated by
means of simulation. Furthermore, the issues related to its implementation in real
HPAV devices are addressed.
7.1 Introduction
As said in previous chapters, most commercial HPAV modems only implement a con-
tention based service based on CSMA/CA at MAC layer. Therefore, when the num-
ber of stations present in the network is high, an excessive degradation of the QoS can
be perceived by the end user. In the last years, several papers have been published
that try to improve this aspect of HPAV networks. For example, in [Yoon et al., 2008]
[Kriminger and Latchman, 2011], the CSMA/CA contention window size is optimized in
order to obtain better QoS results. In addition, in mediums like PLC, cross-layer tech-
niques have recently elicited much interest in the scientific community. These techniques
allow the use of information of different layers (physical layer or upper layers) at MAC
layer to improve the network performance. For example, [Papaioannou and Pavlidou, 2008]
proposes a cross-layer optimization in the TDMA slots assignment procedure. However,
to the best of our knowledge, there are not any publications about the application of cross-
layer techniques to HPAV CSMA/CA protocol.
This chapter addresses the design and evaluation of a cross-layer extension for the
HPAV CSMA/CA algorithm. It modifies the contention window size of the different
clients using both physical layer information and the QoS requirements of the upper-layer
services, obtaining in this way better results than any previously presented extension of
the HPAV CSMA/CA standard version. The performance of this optimization technique
79

Chapter 7. Cross-Layer extension of HPAV CSMA/CA algorithm
has been evaluated with the HPAV simulator presented in chapter 3. This simulation
tool implements both physical and MAC layers of the standard, which makes it ideal for
evaluating cross-layer protocols.
7.2 Optimal HPAV CSMA/CA contention window size
7.2.1 Overview
Based on the Markovian model of the HPAV CSMA/CA protocol described in chapter 4,
[Kriminger and Latchman, 2011] proposes an optimization of the contention window size
(W ) that improves the protocol performance for a large number of users1. To maximize
the throughput, it is presented a constant contention window based scheme in which Wmust grow linearly with the number of stations present in the network (n) while the DCcounter should always be initialized to a constant value. The constants which determine
the linear relation betweenW and n will depend on the value selected for the DC counter.
Different combinations of these values are tested in the referenced paper, being the best
results obtained with values shown in eq. (7.1).
W (n) = 5 · n+ 10 for DC = 3 (7.1)
It is necessary to remark that the approximations taken to obtain this algorithm are
only valid for a large number of active stations. Therefore, it is important to corroborate
the exact number from which this algorithm obtains good results. To that end, both algo-
rithms, the original an the optimal contention window size extension, are compared using
the previously presented simulator. Figure 7.1 shows the evolution of the total network
throughput under saturation conditions as the number of active stations increases. As can
be seen, the reference algorithm outperforms the standard version of the protocol for a
number of users higher than four. Since the number of active stations in a home network
is usually higher than this value, it will be the starting point for the cross-layer exten-
sion proposed in this paper. However, it could also be applied to the standard CSMA/CA
algorithm without any problem.
Both, this algorithm and the cross-layer extension proposed in this chapter are man-
aged by the network Central Coordinator (CCo). According to HPAV standard, this node
has a complete knowledge of the network and controls different aspects, such as the time
allocated for CSMA/CA use or the TDMA scheduling. Hence, it should also manage the
contention window of the different nodes.
7.2.2 Analysis
As it will be explained later, to adequately execute the presented algorithm it is needed
an estimation of the QoS perceived by the upper layer service depending on the physical
layer bitrate. The throughput could be used in this purpose but, to accurately calculate it,
1From now on we shall refer to the HPAV CSMA/CA algorithm as standard and to the extension pro-
posed in [Kriminger and Latchman, 2011] as reference.
80


7.3. Cross-layer protocol extension
the “Variable Overhead” (Ov) terms in each frame transmission can be calculated as fol-
lows:
O = Of +Ov(n) +Oh = PRS0 + PRS1 +RIFS + ACK + CIFS + 13 · σ + 37.05 =35.84 + 35.84 + 30.72 + 140.48 + 100 + 13 · 35.84 + 37.05 = 845.95µs
(7.7)
As before, assuming the worst case, the overhead percentage can be calculated as
follows:
O(%) =845.95
845.95 +MAXFL − RIFS·100 =
845.95
845.95 + 2501.12− 30.72·100 = 25.50%
(7.8)
Then, by applying a security factor, the total overhead is approximately a 26%. Hence,
the MAC throughput of a node when the optimal algorithm is used can be calculated using
the following expression:
Si ∼ (1− 0.26) · Ci
n= 0.74 · Ci
n∀i ∈ 1...K (7.9)
where Ci is the physical bitrate of the considered node and n is the number of active
stations in the network.
Finally, to check that all the assumptions are adequate for a generic case, Figure 7.3
shows the evolution of the throughput under saturated conditions of one station as a func-
tion of the number of contending stations. It shows both the results obtained by simulation
and the estimated values obtained from the deduced expression, supposing that all the sta-
tions have a physical layer capacity of 116 Mbps (Mean PHY bitrate of the stations after
averaging 50 simulations according to Figure 3.7). As can be seen, it has been obtained
a good estimator of the station throughput in the range of 4 to 15 stations, while the error
obtained for a smaller number of stations is not very high.
7.3 Cross-layer protocol extension
7.3.1 Protocol overview
The main idea behind this cross-layer extension of the HPAV CSMA/CA protocol is the
regulation of channel access through the modification of the contention window size of
a set of stations. In other words, it reduces the window size of the stations with QoS
problems, while it increases the window size of the rest of the stations. In this way,
the resources can be more fairly distributed, giving more channel-access possibilities to
stations with QoS problems. It is performed completely at MAC layer, but it needs the
QoS requirements of the upper layer services and the physical layer capacity.
The protocol starts when a node suffers a QoS degradation, which can be caused by a
drop of its physical capacity or because a new node has arisen to compete for the channel.
In order to detect this degradation, the nodes define a lower and an upper threshold of the
maximum admissible values for latency and jitter in different application layer services.
83


7.3. Cross-layer protocol extension
7.3.2 Modeling the Effect of the Contention Window Size Modifica-
tion
With the goal of accurately determining how to modify the contention window size of the
safe and critical nodes, a mathematical model has been designed. The gain G, defined as
the increase (or decrease) in the probability to win a channel access in a node due to the
decrease (or increase) of its contention window size will be obtained. Consider a network
of K stations, each one with a contention window size Wi. The Ui variable maintains
the BC counter value that each station obtains for a particular channel access. Therefore,
Ui ∈ [1,Wi] with P (Ui) = 1/Wi (for convenience, we will use the interval [1,Wi] insteadof [0,Wi − 1]). After the random backoff procedure, the channel access is obtained by
the node with the lowest Ui value. Taking station 1 as reference, and without loss of
generality, its channel access probability P (win) can be calculated as follows:
P (win) = P (U1 < min(U2, ..., UK)) (7.11)
For simplicity, we define m = min(U2, ..., UK). Applying the Total Probability law in
(7.11),
P (win) =
W∑
i=2
P (win|m = i) · P (m = i) =
W∑
i=2
i− 1
W· P (m = i) =
E[m]− 1
W
(7.12)
The same analysis can be made when the reference node decreases its contention
window size by one. In this case U1 ∈ [1,W − 1] and Ui ∈ [1,W ] ∀i ≥ 2. Thus,
P (win) =W∑
i=2
P (win|m = i) · P (m = i) =
W∑
i=2
i− 1
W − 1· P (m = i) =
E[m]− 1
W − 1
(7.13)
The gain G obtained when a node decreases its contention window size can be easily
calculated by dividing (7.12) by (7.13):
G =W
W − 1= 1 +∆G⇒ ∆G =
1
W − 1(7.14)
obtaining a positive increase∆G which is inversely proportional to the new window size.
On the other hand, the gain obtained when the reference node increases its contention
window size can be calculated similarly (in this case the gain is negative):
G =W
W + 1= 1 +∆G⇒ ∆G = − 1
W + 1(7.15)
It is necessary to consider that the gains have been obtained assuming that, excepting
the reference node, the rest of the nodes have the same Wi = W ∀i 6= 1. However, it
85


Chapter 7. Cross-Layer extension of HPAV CSMA/CA algorithm
the number of safe nodes is the same as the number of critical nodes. Therefore, if at an
instant of time there are two or maybe three critical nodes, it will be required no more
than two or three safe nodes. On the other hand, nodes transmitting raw data from services
without QoS have not restrictions and can be always selected as safe nodes. Accordingly,
the number of safe nodes needed with QoS restrictions is very small. Therefore, the
restriction that the lower threshold should be far enough of the upper threshold dominates
to the restrition of that it must be also greater enough to guarantee that there will be
enough safe nodes.
There are many possibilities for the lower threshold value, but 70% satisfies the above
restrictions. Using this value we have checked in our simulations that no safe nodes be-
come critical during the algorithm execution and simultaneously there are always enough
safe nodes to guarantee that the algorithm works fine. However, it is necessary to remark
that different values can be selected depending on the evaluated system or the expected
algorithm behavior.
Furthermore, to consider that a station is over a threshold, the 1% of frames should
be over it. This 1% value was selected because in most of the QoS related literature
[Szigeti and Hattingh, 2005], it is considered that the service fails when more than 1% of
frames are above their corresponding QoS maximum admissible value (for example when
more than 1% of frames have a latency over 150 ms for a real time service). Therefore, we
consider this 1% adequate to evaluate when a parameter is above a predefined threshold.
7.4 Implementation challenges
The issues related to the implementation of this algorithm in a real HPAV device will be
addressed in this section. They can be divided into two different aspects:
• Computational complexity. Evaluation of the complexity of the algorithm, checking
if it can be executed in real time mode.
• Standard modifications. Required changes in the HPAV standard to implement the
algorithm. This is an important consideration because if major changes are required
the algorithm implementation could be unfeasible.
7.4.1 Computational complexity
To evaluate the computational complexity of the proposed cross-layer mechanism, a par-
ticular implementation will be chosen, demonstrating that it could be executed in real time
in a embedded system. It is important to remark that embedded software development is
out of the scope of this thesis. The proposed solution may not be the optimal one, but is a
possible one, and it is enough to test the feasibility of the algorithm implementation.
During the AET time period, the CCo is waiting for alarms (step 1 of the procedure):
for each received(Alarmi) do
MACi ∈ C∆Gcrit += 1/(Wi + 1)
88

7.4. Implementation challenges
end for
The MAC address of the alarm’s issuer is added into the C set and the accumulated
gain obtained by reducing its windows size is calculated. Here, the complexity of the
algorithm is mainly due to the arithmetic division. The most common algorithms to di-
vide a couple of numbers in real microprocessors are the Newton-Raphson, Goldschmidt
and SRT [Soderquist and Leeser, 1997]. The first two are in fact equivalents and have
quadratic convergence (which means that the number of accurate digits in the estimation
of quotient doubles at each iteration) and SRT exhibits only linear convergence. However,
SRT allows to overlap the components of the division step. In addition, it is also possible
to substitute multiplications by logical mask and shifting bits. The algorithm election is
not easy since it is an architecture decision. An in depth study about the complexity of
these algorithms can be found in [Oberman and Flynn, 1997]. Looking carefully table 2
of that reference, it can be inferred that, for a very cheap hardware (embedded systems
are), a good approximation of the number of machine cycles needed for a division is 25.
However, a real implementation of our design could assume that since the amount of val-
ues for Wi is small (from 5 up to 100), it could be feasible to pre-calculate all possible
1/(Wi−1) and store them in ROM. In this case, the complexity of the division is reduced
to the cost of a single memory access.
When the AET period has finished, it is time to classify the rest of the terminals
according to their QoS:
for i← 1 toK − C do
RequestFor(Ci, SBWi, 1%)if 1% | SBWi > 0.74Ci/K then
MACi ∈ Belse
MACi ∈ SputInOrderedTable(Wi)
end if
end for
The subroutine putInOrderedTable(Wi) storesWi in ascendant order, and also stores
the values 1/(Wi − 1) and the accumulated gain of safe nodes. The table can be easily
implemented using linked chains. In this case, the computational complexity is mainly
due to the sorting algorithm. This complexity is well studied in [Knuth, 1998]. The easi-
est sorting algorithm consists of comparing the new value with the first one, next with the
second one, and so forth until a location is found. If the location is not found, the new
value goes to the last position. Therefore, in the worst case, the classification algorithm
requires as many comparisons as the number of contending stations. Another good solu-
tion for sorting is the Binary Search, due to it presents a logarithmic convergence. Since
the number of contending station in a PLC in-home network will be around ten, the first
algorithm is extremely simple to implement and in our case, and it has not real complexity.
The next steps of the algorithm (steps 2 to 5) do not have any operator with a remark
complexity:
89

Chapter 7. Cross-Layer extension of HPAV CSMA/CA algorithm
for i← 1 to 5 do
for j ← 1 to C do
Wi −−end for
form← 1 to sizeOf(OrderedTable) do
if ∆Gcrit > GetTableValue(∆Gsafe) thenWm ++
end if
end for
end for
for i← 1 to C ∪ S do
SendTo(Wi)end for
Hence, the proposed algorithm has a type P computational complexity (deterministic
polynomial time). That is, if the number of contending stations is n, its execution time
is O(nx), for some x. Assigning a weight to each type of operation, it is possible to cal-
culate it. In the worst case (all stations generate an alarm), the first set of instructions is
O(n). The second set is O(n2) since although the function PutInOrderedTable has lin-ear complexity (O(n)), it is inside of a loop of size n. Finally, the last sets of instructionsare serialized loops of size n (assuming always the worst case), so the complexity isO(n).As a consequence, the overall algorithm has O(n2) complexity. In conclusion, from these
results, there is not any reason why the proposed procedure can not be run in real-time
mode within a PLC modem, since in our case the value of n will be small in most cases.
7.4.2 Standard modifications
As said in previous sections, the proposed cross-layer algorithm is performed completely
at MAC layer. Hence, it is important to find out how the information required by the
algorithm can be available in this layer in a real HPAV device. This information basically
consists on the physical layer bitrate and the QoS requirements of the upper-layer services,
and can be passed to the MAC layer using the following mechanisms already defined in
HPAV standard:
• When the upper layer starts an application, the convergence layer of HPAV identifies
the type of service and opens a connection in the MAC layer using the HPAV M1
interface. During the connection opening procedure, it is exchanged a parameter
called CSPEC, which contains information related to the QoS parameters of the
service. This parameter can be used to transmit the QoS limits required by the
proposed cross-layer algorithm.
• The PHY layer interface has a function to launch a channel estimation procedure.
Through this procedure, the parameters of this particular channel are calculated and
returned to the MAC layer, which can use them to determine the physical bitrate.
On the other hand, as described in the protocol overview, when the CCo receives an
alarm and the algorithm starts, it asks the involved nodes for some required parameters.
90

7.5. Evaluation
Then, the needed modification is only the adding of some new control messages to launch
the alarms and to communicate this information to the CCo. However, this modification
does not involve important changes in theMAC layer, so we consider that it can be applied
without major compatibility issues.
7.5 Evaluation
For purposes of evaluation, a typical in-home scenario composed of seven HPAV stations
is assumed. Two stations run TCP data transmissions, two other stations run a HDTV
MPEG-2 video streaming service, two others run an MPEG-4 HDTV service, and the last
one runs a VoIP service. The parameters to evaluate the QoS for these services are shown
in Table 7.1. They are used to define the thresholds of the stations. TCP data transmission
service has no QoS limits since it is a best-effort service, not generating any alarm.
Two different scenarios are evaluated. In the first one, a station suddenly comes to
compete for the channel. Concretely, one of the stations running a TCP service is not
present at the start of the simulation, appearing at second 100, causing a performance
degradation and consequently the start of the proposed cross-layer mechanism. Figure
7.6 shows the instantaneous latency and jitter of the VoIP and the two MPEG-4 stations,
respectively. The whole system starts with the reference algorithm. Then, at t = 100s, thejoining of the station causes a QoS deterioration in the MPEG-4 services. After that, the
system runs for 100 seconds without the cross-layer mechanism. The values of the eval-
uated parameters before solving the degradation can be observed in this interval. Then,
at t = 200 s, the proposed algorithm is activated. After four iterations (approximately 40
seconds), a good solution for all the stations is achieved. Note that the two MPEG-4 sta-
tions are the critical nodes and the VoIP service is considered a border node. At t = 300s, the TCP session finishes. Consequently, after 10 seconds without any packet over the
lower threshold, the algorithm should restore the initial conditions. However, this event
has been delayed to t = 400 s to better show the results.
In this point, it is interesting to evaluate how the end-user perceives these changes. To
this end, the QoE can be a very useful metric. Assuming that the packets received with a
latency or jitter over the QoS requirements are considered lost, the evolution of the packet
losses can be seen in Figure 7.7. In this case, only the MPEG-4 services are represented
since VoIP service does not lose any packet. As can be seen, after the arriving of the new
station, the losses in the MPEG-4 services increase considerably, but they are reduced
Table 7.1: Service parameter limits for good QoS (from [Szigeti and Hattingh, 2005])
Service Latency JitterEstimated Packet Loss
Bandwidth Probability
VoIP 150 ms 10 ms 8 Kbps 1%
MPEG-4 150 ms 30 ms 5 Mbps 1%
MPEG-2 3 s - 12 Mbps 1%
91

Chapter 7. Cross-Layer extension of HPAV CSMA/CA algorithm
0
0 05
0 1
0 15
0 2
0 100 200 300 400 500
La
ten
cy (
s)
Time (s)
Alarm zoneSecure zone
(a) Latency VoIP
0
0 05
0 1
0 15
0 2
0 100 200 300 400 500
La
ten
cy (
s)
Time (s)
Alarm zoneSecure zone
(b) Latency MPEG-4 (I)
0
0 05
0 1
0 15
0 2
0 100 200 300 400 500
La
ten
cy (
s)
Time (s)
Alarm zoneSecure zone
(c) Latency MPEG-4 (II)
0
0 01
0 02
0 03
0 04
0 05
0 100 200 300 400 500
Jitte
r (s
)
Time (s)
Alarm zoneSecure zone
(d) Jitter VoIP
0
0 01
0 02
0 03
0 04
0 05
0 100 200 300 400 500
Jitte
r (s
)
Time (s)
Alarm zoneSecure zone
(e) Jitter MPEG-4 (I)
0
0 01
0 02
0 03
0 04
0 05
0 100 200 300 400 500
Jitte
r (s
)
Time (s)
Alarm zoneSecure zone
(f) Jitter MPEG-4 (II)
Figure 7.6: Latency and jitter evolution for different stations of the evaluation scenario
along with their corresponding thresholds. Vertical lines represent the changes in the
network configuration indicated in Section 7.5.
when the algorithm is activated, disappearing after the algorithm execution.
The relation between these losses and the video PSNR is given in [Frnda et al., 2013]
[Rozhon et al., 2014]:
PSNR = a + b · Ln(X) (7.17)
whereX represent the packet loss in % and a, b are variable parameters which depend
on the evaluated service (a = 22.19, b = −2.29442 for MPEG-4). As can be seen, this
equation cannot evaluate PSNR when there are no packet losses. The PSNR evolution
calculated using the previous expression is shown in Figure 7.8 (a). When losses are 0,
the PSNR value is considered 40 dB, which is a typical value for standard MPEG-4 videos
and enough to obtain a high reference QoE.
Table 7.2: MOS estimation from video PSNR for MPEG-4 services
PSNR (dB) MOS
> 37 5 (Excellent)
31− 37 4 (Good)
25− 31 3 (Fair)
20− 25 2 (Poor)
< 20 1 (Bad)
92


Chapter 7. Cross-Layer extension of HPAV CSMA/CA algorithm
proposed algorithm, the tolerance to the channel degradation increases. These stations
run correctly the services with a physical bitrate of only 33 Mbps, that corresponds to an
increase of the tolerated degradations of a 25%.
7.6 Publications
The work developed in this chapter has been partially published in the following refer-
ences:
• P.J. Piñero, J. Malgosa, P. Manzanares, J.P. Muñoz,Homeplug-AV CSMA/CA Cross-
layer Extension for QoS Improvement of Multimedia Services, IEEE Communica-
tions Letters, 2014
94

Chapter8Conclusions
Abstract- This chapter summarizes the main conclusions obtained during the re-
alization of this thesis and outlines some issues which can be addressed in future
related works.
8.1 Conclusions
As said in the beginning of this thesis, in-home networks are key to the adequate de-
velopment of the Future Internet (also known as Internet of Things). One of the most
important factors to ensure the pervasiveness of these infrastructures is the existence of
adequate technologies that facilitate their installation and maintenance. Among the dif-
ferent alternatives present on the market nowadays, this work has been centered on PLC
(PowerLine Communications), analyzing its main drawbacks and proposing, as far as is
possible, solutions to them.
The first part of the thesis consists of a detailed evaluation of the HomePlug AV stan-
dard, which is the most popular PLC technology at present. This analysis comprises two
steps: Real Measurements and Simulation. In the first part, real modems were used to
evaluate the performance of the standard for unicast and multicast communications in dif-
ferent network configurations. The second part of this analysis consists of a vast set of
simulations performed with the simulation tool that is presented in chapter 3. This tool
includes a realistic PLC channel generator and considers the physical and the MAC layers
defined in the standard. Hence, the performance of the HPAV MAC layer can be accom-
plished over realistic channel conditions. The proposed simulator has been employed to
evaluate the performance of in-home networks as a function of the number of active sta-
tions. The throughput of each station and the overall network throughput, the delay, the
jitter and the number of collisions per seconds have been obtained. The first main conclu-
sion of this work is that the developed simulator can be used as a tool for in-home network
planning. As an example, it has been used to planning high and standard definition TV
services over the in-home network.
Other conclusion was the high influence of the PHY layer bitrate over the MAC layer
performance. To our best knowledge this fact was not adequately studied in the PLC
bibliography. In fact, the models of MAC layer published in the literature assume that
95

Chapter 8. Conclusions
the PHY transmission rate of all the pairs is equal to the maximum transmission rate
allowed by the medium. At the end of chapter 4, it is presented an extension of one of the
more accepted models of the HPAV CSMA/CA algorithm, which considers real physical
capacities for the different stations in the network. This model was also validated using
the simulator.
Furthermore, it was decided from the results that there were three areas in HPAV
standard that could be improved: problems in unicast communications under conges-
tion conditions, the performance of multicast communications and the implementation
of cross-layer protocols to build a MAC layer aware of the particular characteristics of
the PHY and upper-layer services. These problems are addressed in chapters 5, 6 and 7
respectively.
The first improved aspect is related to unicast communications. As can be extracted
from the results presented in chapter 4, PLC technology presents some particularities
that can significantly reduce the TCP protocol performance. To solve these problems,
the use of Fountain codes was proposed. The characteristics of these codes make them
ideal for PLC environments. Therefore, a protocol based on Fountain codes to achieve
reliable data transmission over PLC networks was implemented. The results obtained
in this experiments were positive, showing that the implemented protocols offered better
performance than TCP protocol in raw data transmission.
In addition, the properties of the Fountain Codes also make them ideal to aggregate
different communication flows into one flow with a better performance. This idea was
very interesting for one of the main objectives of this thesis, the evolution of the HPAV
CCo to an in-home network coordinator able to manage interfaces of different technolo-
gies. To this end, a linux driver that permits the aggregation of heterogeneous in-home
interfaces was developed. This driver employs a bandwidth estimation procedure based
on packet dispersion and uses Fountain codes to overcome the problems generated by
variable-capacity technologies like PLC. It was evaluated by combining a PLC modem
and an Ethernet interface, showing that the aggregated interface offered better perfor-
mance than the other two interfaces when used separately.
The HPAV multicast problems are addressed in chapter 6. The developed simulator is
firstly used to assess the performance of standard HPAVmulticast communications. Since
the standard HPAV transforms a IP multicast transmission into consecutive point-to-point
transmissions, the attained bitrate decreases very rapidly as the number of users increases.
Presented results show that this poor performance can be notably increased with the quite
simple strategy of using a common tone map for all the different multicast clients. This
technique has been traditionally discarded because of the poor performance it achieves in
wireless scenarios. However, the correlation among the power line channels established in
a given network makes it useful for in-home PLC networks. Moreover, another technique
based in the aggregated multicast bitrate maximization is also proposed and evaluated.
This technique, combined with Fountain codes, was found as a good solution for large
multicast group sizes, like hotels or offices. Finally, the common tone map technique was
also compared to the standard for a video steaming service delivery, offering much better
results.
The use of cross-layer techniques to improve the HPAV MAC layer performance is
evaluated in chapter 7. These techniques have been traditionally used in the TDMA ser-
96

8.2. Future work
vice, but in this work, a cross-layer extension of the CSMA/CA algorithm is presented.
It uses information from both the physical and the upper-layer services to adapt the con-
tention window size of the different clients when there are QoS problems. The presented
protocol has been evaluated in two in-home scenarios, where the appearance of a new sta-
tion or a bitrate drop (due to a change in the noise conditions) may cause QoS problems in
some nodes. In both cases, the presented cross-layer extension shows good results, clearly
outperforming any previously presented extension of the HPAV CSMA/CA standard ver-
sion.
8.2 Future work
The results obtained in this thesis point to several interesting directions for future work:
• Algorithms implementation. Since during this thesis we have collaborated with
Broadcom corporation, it may be possible to implement some of the algorithms
proposed in real devices. Concretely, the most interesting alternatives are Multicast
techniques and the CSMA/CA cross-layer extension.
• TDMA. The simulation tool developed in this work only implements CSMA/CA
service at MAC layer. Nowadays, however, the TDMA service is implemented in
most commercial modems, being very useful to assure QoS of very restrictive ap-
plications. One obvious future work is the implementation of this service in the
simulator. With it, some algorithms related to TDMA slot assignments can be de-
veloped.
• In-home network coordinator. The ultimate aim of this work is the design of a
in-home network coordinator. This device should be able to manage interfaces of
different technologies, assuring the end-to-end QoS. In the PLC interface, it would
act as the CCo with all the features developed in this thesis. Some preliminary steps
toward the design of this device have been taken in this thesis, but it is still a lot of
work to do in this area.
97


AppendixAHPAV Simulator Software Description
A.1 Introduction
In this appendix it is explained in more detail the software architecture of the HPAV
simulator described in chapter 3. Basically, this simulator is divided into two parts: PHY
and MAC layers. The former includes both the channel generator and the modulator
module. It outputs the PHY layer bitrate for each pair of the stations of the network. On
the other hand, the MAC layer module performs an event-driven simulation of the HPAV
CSMA/CA protocol, also including all the functionality related to traffic generation.
A.2 PHY Layer
The PHY layer module has been developed under Matlab environment. It is mainly di-
vided into two separated submodules: channel generator and OFDM modulator (infor-
mation about its structure can be found in [PLC, 2014]). In order to use this module, a
configuration file should be created. Through this file, some important parameters, like
the frequency range, the number of points of the generated channel response (N), the
impedance of the transmitter and the receiver, etc. are configured. In our case, the output
of this module will be composed of N=2048 points in the frequency range from 0.1 to
37.5 MHz. An impedance of 50Ω were selected for both, the transmitter and the receiver.
For the rest of parameters, the default values are chosen (see channel generator user-guide
in [PLC, 2014]).
As described in chapter 3, two versions of channel generator submodule were em-
ployed in this thesis. The first one was able to simulate long-term variations in one sta-
tion’s channel. It is called through the following function:
[H,f,net,dist]=PLC_channel_generator_MAC(M)
As can be seen, the number of long-term variations (M) should be indicated as input.
On the other hand, the outputs of the function are:
• H (NxM). Complex frequency response of the generated channels.
99

Chapter A. HPAV Simulator Software Description
• f. Frequency vector.
• net. Data structure that contains the network topology, including the selected
impedance and the length of the wires.
• dist. Link distance between transmitter and receiver nodes.
As example, Figure 3.3 shows the result of generating a channel with M = 4 long-
term variations. These results can be interpreted as the channel responses of a particular
station when there are four changes in the network topology (caused for example by a
home appliance connection/disconnection).
With the second version, the correlation existing among the channels established in a
home scenario can be modeled. Up to n channels (for n different stations) inside the same
“home” can be generated by using the following function:
[H,f,net,dist]=PLC_channel_generator_MAC(n)
The outputs of this function are similar to those obtained in the first channel generator
version. The only difference is the dist variable, which in this case is a (1xn) vector,including the different distances obtained for the n channels. Figure 3.4(c) shows the
result of generating n = 4 correlated channels, which can correspond to the channel
responses observed by four different stations placed in the same home scenario.
Regarding the OFDM modulator submodule, it obtains the PHY layer bitrate of a
station from its channel response and its noise. As said in chapter 3, three noise profiles
have been defined: heavily, medium and weakly disturbed. To obtain this PHY bitrate the
following function should be used:
[R,b] = simulador_OFDM_conform_envent(H,Noise,BER)
The inputs for this function are the channel response (H) of the evaluated channel, the
noise profile (“baj”, “med” or “alt”) options and the BER required by the system, which
in HPAV is 10−5. The outputs are the PHY bitrate (R) and the bit loading algorithm (b),which is a vector containing the number of bits assigned for each HPAV carrier.
For example, to obtain a ten-clients scenario using the second version of the channel
generator, the following pseudo-code can be used, where the noise profile is randomly
selected for each channel:
n_stations = 10config[H, f, net, dist] = PLC_channel_generator_MAC(n_stations)for i← 1 to n_stations don_r = ceil(3 · rand())if n_r == 1 then[R, b] = simulador_OFDM_conform_envent(H, baj, 10−5)
else if n_r == 2 then[R, b] = simulador_OFDM_conform_envent(H,med, 10−5)
else
100

A.3. MAC Layer
[R, b] = simulador_OFDM_conform_envent(H, alt, 10−5)end if
end for
A.3 MAC Layer
The MAC layer module is a C-based program which performs an event-driven simulation
of the HPAV CSMA/CA. It takes as input the PHY bitrates of the different stations and
the scenario description, and generates a detailed report for each of these stations with the
evolution of the main parameters related to the service QoS.
The program structure overview can be seen in Figure A.1, where the different pro-
gram modules and the interconnection between them are presented. The functionality
associated to each of these modules is:
• Events. Event types definitions and event list management.
• Buffer. Generic buffer implementation.
• Rand. Random number generation. The supported distribution and the methods
used to generate the random variables is described in Appendix B.
• Frame_Generator. Traffic generation module which contains models for the ser-
vices most commonly found in a home network.
• Station. Functionality related to the HPAV stations, like the management of the data
frames.
• Sim_csma. Auxiliar functions needed in the main program, like file initialization or
CSMA/CA counters management.
• HPAV_simulator. Main program.
To launch a simulation, the main program should be called with the following input
parameters:
HPAVSimulator –length SIM_TIME –file PHY_FILES –time TIME_FILE –n_sim NSIM
The meaning of these parameters is:
• SIM_TIME. Total simulation time.
• PHY_FILE. Text file containing the paths to the files containing the PHY bitrate of
the different stations.
• TIME_FILE. Text file containing the limits of the different time regions if long-term
variations in the channels are considered.
101

Chapter A. HPAV Simulator Software Description
Figure A.1: MAC module software structure
• NSIM. Simulation number for batch executions.
In addition, if a point-to-point multicast simulation is performed, the number of multicast
clients and the path to their PHY bitrate files should be introduced using the –n_multicast
and -file_multicast parameters.
As output, the program generates a text file called “(NSIM)_(NCLIENT).out” for each
station, which contains the station throughput, delay, latency and jitter as a function of the
simulation time. The outputs for the different simulations can be analyzed with a script to
obtain the desired statistic values.
Finally, the complete procedure to launch a simulation is composed of the following
steps:
1. Generate the PHY bitrates for the stations and save them into different files. Gener-
ate the input text file with the paths to them.
2. Configure the Client.xml file with the desired scenario configuration. It should
be indicated the number of stations and the service characteristics. The available
services can be found in frame_generator.h file.
3. Create the TIME_FILE with the adequate time regions. Note that if no long-term
variations in the channel are simulated, this file only contains a time region which
limit should be equal or higher than the simulation time.
4. Launch the MAC layer simulator. This could be done using a launcher script with
the following functionality:
sim_time=200
for i← 1 to n_sim do
HPAVSimulator –length $sim_time –file simulation$i_files.txt–time timeRegions.txt –n_sim $imv *.out ./Resultados
end for
./AnalyzeResults ./Resultados
102

AppendixBRandom Variate Generation
B.1 Introduction
Different traffic models for the most common services used in a domestic environment
were presented in chapter 3. However, generating a random variable with a specific prob-
ability distribution sometimes is not a trivial task.
Random variable generators invariably use as their starting point a random number
generator U(0, 1), which distribution is shown in eq. B.1. The objective is to transform
one or more uniform random variables in an efficient way to obtain a variable with the
desired distribution. The methods used in this work to generate the models are presented
in this appendix.
FU(u) =
0 if x ≤ 0u if 0 < x < 11 if x ≥ 1
(B.1)
B.2 Exponential Exp(a)
The exponential distribution (whose distribution function is shown in eq. B.2) is used to
generate the time separation between frames when the Poisson traffic model is used.
F (x) =
1− e−xa if x ≥ 0
0 if x < 0(B.2)
The way of generating a exponentially distributed random variables is widely pre-
sented in related bibliography, since it is one of the classic examples for the well-known
Inverse Transform technique [Cheng, 1998]. A random variable with this distribution can
be obtained by solving u = F (x) for x:
x = F−1(u) = −a · ln(1− u) (B.3)
where u is the random number generator U(0, 1).
103

Chapter B. Random Variate Generation
B.3 Normal N(µ,σ2)
The well-known Normal distribution with mean µ and variance σ2 has the following PDF:
f(x) =1√2πσ2
· e[
−(x−µ)2
2σ2
]
(B.4)
while it does not have a closed form for the CDF.
Since this is a very used distribution, there are lots of methods to generate Normally
distributed variables. In this work, the polar version of the Box-Muller algorithm proposed
in [Box and Muller, 1958] was selected, because it is very simple and fast:
while True do
Generate U1, U2, U(0, 1) variatesLet V1 = 2 · U1 − 1, V2 = 2 · U2 − 1,W = V1
2 + V22
ifW < 1 then
Let Y =(
−2·ln(W )W
)1/2
return X1 = µ+ σ · V1 · Y and X2 = µ+ σ · V2 · Yend if
end while
As can be seen, each time the method is executed it returns a pair of independent
Normal variates. If only one is needed, just X1 can be returned.
B.4 Beta B(p,q)
Although the Beta distribution does not appear in the traffic models description, it is
needed to generate Gamma distributed variates as it will be shown below. The PDF of
this distribution is:
f(x) =
xp−1·(1−x)q−1
B(p,q)if 0 < x < 1
0 otherwise(B.5)
where B(p,q) is the Beta function and p, q > 0 are shape parameters:
B(p, q) =
∫ 1
0
zp−1 · (1− z)q−1dz (B.6)
There are different methods to generate Beta distributed variables depending on the
values of the shape parameters. For the required case (p, q < 1), the following method
proposed in [Cheng, 1998] was selected:
repeat
Generate U, V , U(0, 1) variatesLet Y = U1/p, Z = V 1/q
until Y + Z > 1return X = Y
Y+Z
104

Chapter B. Random Variate Generation
F (x) = e−e−x−ab
(B.7)
To obtain an algorithm to generate random variates that follow this distribution, the
inverse transform method can be applied. The result in this case is:
x = F−1(u) = −b · ln[−ln(U)] + a (B.8)
B.7 Lognormal LN(θ, τ 2)
The sizes of the frames in the MPEG-2 service follows a Lognormal distribution, whose
PDF was presented in eq. 3.2. To generate random variables which follow this distribu-
tion, it could be used the property that if Y is normally distributedN(µ, σ2), thenX = eY
is lognormally distributed LN(µ, σ2). Hence, the following algorithm could be applied:
Let Y = N(µ, σ)return X = eY
Note that µ and σ2 are related to the mean and variance of the lognormal, θ and τ 2
respectively, by the formulas:
µ = lnθ2√
θ2 + τ 2(B.9)
σ2 = lnθ2 + τ 2
θ2(B.10)
Therefore, µ and σ should be calculated before using the previously presented algo-
rithm.
106

AppendixCList of Acronyms
ADTDM Advanced Dynamic Time Division Multiplexing
AFE Analog Front End
AGC Automatic Gain Control
AMBM Aggregated Multicast Bitrate Maximization
AVLN In-home AV Logical Network
AWGN Additive White Gaussian Noise
BC Backoff Counter
BER Bit Error Rate
BPC Backoff Procedure Counter
BPL Broadband PLC
BSC Backoff Stage Counter
BTC Backoff Time Counter
CCo Central Coordinator
CDF Cumulative Distribution Function
CEA Consumer Electronics Association
CIFS Contention InterFrame Space
CL Convergence Layer
CM Connection Manager
CPE Customer Premise Equipment
107

Chapter C. List of Acronyms
CSMA/CA Carrier Sense Multiple Access/Collision Avoidance
CSPEC Connection Specification
DC Deferral Counter
DNL Discovered Networks List
DSL Discovered Stations List
DVB Digital Video Broadcasting
EMC Electromagnetic compatibility
FEC Forward Error Correction
GCT Greatest Common Tonemap
HE Head End
HLE Higher Layer Entity
HPAV HomePlug Audio-Video
HPNA Home Phoneline Networking Alliance
ILP Integer Linear Programming
ISP Inter-System Protocol
ITU International Telecommunication Union
LDPC Low Density Parity Check
LP Linear Programming
MAC Medium Access Control
MDC Multiple Description Coding
MIMO Multiple Input Multiple Output
MoCA Multimedia over Coax Alliance
MPDU MAC Protocol Data Unit
NB-PLC Narrowband PLC
NEK Network Encryption Key
NID Network Identifier
OFDM Orthogonal Frequency Division Multiplexing
108

PB Physical Block
PDF Probability Density Function
PHY Physical
PLC Power line communications
PLCP Physical Layer Convergence Protocol
PLR Packet Loss Ratio
PPDU PHY Protocol Data Unit
PRS Priority Resolution Slot
PSD Power Spectral Density
QoS Quality of Service
RIFS Response InterFrame Space
RLC Random Linear Codes
ROBO Robust Modulation
RTT Round Trip Time
SAP Service Access Point
SME Small-Medium Enterprises
SNR Signal-To-Noise Ratio
TCC Turbo Convolutional Coding
TCM Trellis Coded Modulation
TDMA Time Division Multiple Access
TM Tone Map
UPA Universal Powerline Alliance
VoIP Voice Over IP
109


Bibliography
[IEE, 1997] (1997). IEEE standards for local and metropolitan area networks. IEEE
Std 802.3x-1997 and IEEE Std 802.3y-1997 (Supplement to ISO/IEC 8802-3: 1996;
ANSI/IEEE Std 802.3, 1996 Edition), pages 0–324.
[Hpa, 2007] (2007). HomePlug AV standard. HomePlug power line alliance.
[bro, 2014] (2014). Broadcom power line communications solutions. http://www.
broadcom.com/products/Broadband-Carrier-Access/Powerline-Communications-
Solutions/. Accessed: March 2014.
[HDP, 2014] (2014). HD-PLC alliance. http://www.hd-plc.org/. Accessed: March, 2014.
[Hpn, 2014] (2014). Home phoneline networking alliance. http://www.homepna.org/.
Accessed: March, 2014.
[Pro, 2014] (2014). Homeplug certified products. http://www.homeplug.org/certified_
products/. Accessed: March, 2014.
[Hpa, 2014] (2014). HomePlug powerline alliance. http://www.homeplug.org/. Ac-
cessed: March, 2014.
[imp, 2014] (2014). Implementation of online codes. http://sourceforge.net/projects/
onlinecodes/. Accessed: March, 2014.
[kti, 2014] (2014). Linux cross reference. source code of the header containing ktime.
http://www.lxr.free-electrons.com/source/include/linux/ktime.h,. Accessed: March
2014.
[afp, 2014] (2014). Linux cross reference. source code of the linux raw socket family.
http://lxr.free-electrons.com/source/net/packet/af-packet.c. Accessed: March 2014.
[bon, 2014] (2014). The linux foundation: Bonding. http://www.linuxfoundation.org/
collaborate/workgroups/networking/bonding. Accessed: March, 2014.
[Moc, 2014] (2014). Multimedia over coaxial alliance. http://www.mocalliance.org/. Ac-
cessed: March, 2014.
111

BIBLIOGRAPHY
[PLC, 2014] (2014). PLC working group of the university of malaga. http://www.plc.
uma.es. Accessed: March, 2014.
[wir, 2014] (2014). Wireshark network protocol analyzer. http://www.wireshark.org/.
Accessed: March, 2014.
[Afkhamie et al., 2005a] Afkhamie, K., Katar, S., Yonge, L., and Newman, R. (2005a).
An overview of the upcoming HomePlug AV standard. In Power Line Communications
and Its Applications, 2005 International Symposium on, pages 400–404.
[Afkhamie et al., 2005b] Afkhamie, K., Latchman, H., Yonge, L., Davidson, T., and
Newman, R. (2005b). Joint optimization of transmit pulse shaping, guard interval
length, and receiver side narrow-band interference mitigation in the HomePlug AV
OFDM system. In Signal Processing Advances in Wireless Communications, 2005
IEEE 6th Workshop on, pages 996–1000.
[Atzori et al., 2010] Atzori, L., Iera, A., and Morabito, G. (2010). The Internet of Things:
A survey. Comput. Netw., 54(15):2787–2805.
[Bakanoglu et al., 2010] Bakanoglu, K., Mingquan, W., Hang, L., and Saurabh, M.
(2010). Adaptive resource allocation in multicast OFDMA systems. In Wireless Com-
munications and Networking Conference (WCNC), 2010 IEEE, pages 1–6.
[Berrou and Glavieux, 1996] Berrou, C. and Glavieux, A. (1996). Near optimum error
correcting coding and decoding: Turbo-codes. Communications, IEEE Transactions
on, 44(10):1261–1271.
[Box and Muller, 1958] Box, G. E. P. and Muller, M. E. (1958). A note on the generation
of random normal deviates. Annals of Mathematical Statistics, 29:610–611.
[Canete et al., 2011] Canete, F., Cortes, J., Diez, L., and Entrambasaguas, J. (2011). A
channel model proposal for indoor power line communications. CommunicationsMag-
azine, IEEE, 49(12):166–174.
[Cheng, 1998] Cheng, R. (1998). Random variate generation. In Banks, J., editor, Hand-
book of Simulation, pages 139–172. Wiley.
[Chung et al., 2006] Chung, M. Y., Jung, M.-H., Lee, T.-J., and Lee, Y. (2006). Perfor-
mance analysis of HomePlug 1.0 MAC with CSMA/CA. Selected Areas in Communi-
cations, IEEE Journal on, 24(7):1411–1420.
[Chung and Goldsmith, 2001] Chung, S. T. and Goldsmith, A. (2001). Degrees of free-
dom in adaptive modulation: A unified view. IEEE Trans. Commun, 49:1561–1571.
[Cortes et al., 2014] Cortes, J., Canete, F., Diez, L., and Torres, L. (2014). Oriented
comparison of indoor plc channel models. In preparation.
[Färber, 2002] Färber, J. (2002). Network game traffic modelling. In Proceedings of the
1st workshop on Network and system support for games, pages 53–57.
112

BIBLIOGRAPHY
[Ferreira et al., 2011] Ferreira, H., Lampe, L., Newbury, J., and Swart, T. (2011). Power
Line Communications: Theory and Applications for Narrowband and Broadband
Communications over Power Lines. Wiley.
[Francis et al., 2012] Francis, B., Narasimhan, V., Nayak, A., and Stojmenovic, I. (2012).
Techniques for enhancing tcp performance in wireless networks. In Distributed Com-
puting Systems Workshops (ICDCSW), 2012 32nd International Conference on, pages
222–230.
[Frnda et al., 2013] Frnda, J., Voznak, M., Rozhon, J., and Mehic, M. (2013). Prediction
model of QoS for triple play services. In Telecommunications Forum (TELFOR), 2013
21st, pages 733–736.
[Goyal, 2001] Goyal, V. (2001). Multiple description coding: compression meets the
network. Signal Processing Magazine, IEEE, 18(5):74–93.
[Gross et al., 2004] Gross, J., Klaue, J., Karl, H., and Wolisz, A. (2004). Cross-layer
optimization of OFDM transmission systems for MPEG-4 video streaming. Computer
Communications, 27:1044–1055.
[Harfoush et al., 2009] Harfoush, K., Bestavros, A., and Byers, J. (2009). Measuring
capacity bandwidth of targeted path segments. IEEE/ACM Trans. Netw., 17(1):80–92.
[Hassan H., 2005] Hassan H., Garcia J.M., B. O. (2005). Generic modeling of multime-
dia traffic sources. In 3rd InternationalWorking Conference on PerformanceModelling
and Evaluation of Heterogeneous Networks.
[Jacobson, 1988] Jacobson, V. (1988). Congestion avoidance and control. SIGCOMM
Comput. Commun. Rev., 18(4):314–329.
[Jain, 1991] Jain, R. (1991). Art of Computer Systems Performance Analysis Techniques
For Experimental Design Measurements Simulation And Modeling. John Wiley &
Sons.
[Kim et al., 2007] Kim, J., Kwon, T., and Cho, D.-H. (2007). Resource allocation scheme
for minimizing power consumption in OFDM multicast systems. Communications
Letters, IEEE, 11(6):486–488.
[Kim et al., 2008] Kim, M.-S., Son, D.-M., Ko, Y.-B., and Kim, Y.-H. (2008). A simula-
tion study of the PLC-MAC performance using Network Simulator-2. In Power Line
Communications and Its Applications, 2008. ISPLC 2008. IEEE International Sympo-
sium on, pages 99–104.
[Knuth, 1998] Knuth, D. E. (1998). The Art of Computer Programming, Volume 3: (2nd
Ed.) Sorting and Searching. Addison Wesley Longman Publishing Co., Inc., Redwood
City, CA, USA.
[Koumaras et al., 2005] Koumaras, H., Skianis, C., Gardikis, G., and Kourtis, A. (2005).
Analysis of H. 264 video encoded traffic. In Proceedings of the 5th International
Network Conference (INC2005), pages 441–448.
113

BIBLIOGRAPHY
[Kriminger and Latchman, 2011] Kriminger, E. and Latchman, H. (2011). Markov chain
model of homeplug CSMA MAC for determining optimal fixed contention window
size. In Power Line Communications and Its Applications (ISPLC), 2011 IEEE Inter-
national Symposium on, pages 399–404.
[Krunz and Hughes, 1995] Krunz, M. and Hughes, H. (1995). A traffic model for MPEG-
Coded VBR streams. In In Proc. of the ACM Sigmetrics/Performance Conference,
pages 47–55.
[Latchman et al., 2005] Latchman, H., Afkhamie, K., Katar, S., Mashburn, B., Newman,
R., and Yonge, L. (2005). High speed multimedia home networking over powerline.
NCTA technical papers, pages 9–22.
[Li and Liu, 2003] Li, B. and Liu, J. (2003). Multirate video multicast over the internet:
an overview. Network, IEEE, 17(1):24–29.
[Liu et al., 2008] Liu, J., Chen, W., Cao, Z., and Letaief, K. (2008). Dynamic power and
Sub-carrier allocation for OFDMA-based wireless multicast systems. In Communica-
tions, 2008. ICC ’08. IEEE International Conference on, pages 2607–2611.
[Luby, 2002] Luby, M. (2002). LT codes. In Proceedings of the 43rd Symposium on
Foundations of Computer Science, pages 271–280.
[Luby et al., 2007] Luby, M., Watson, M., Gasiba, T., and Stockhammer, T. (2007). High-
quality video distribution using power line communication and aplication layer forward
error correction. In Power Line Communications and Its Applications, 2007. ISPLC
’07. IEEE International Symposium on, pages 431–436.
[MacKay, 2005] MacKay, D. J. C. (2005). Fountain codes. Communications, IEE Pro-
ceedings, 152(6):1062–1068.
[Maiga et al., 2010] Maiga, A., Baudais, J., and Helard, J. F. (2010). Subcarrier, bit and
time slot allocation for multicast precoded OFDM systems. In Communications (ICC),
2010 IEEE International Conference on, pages 1–6.
[Maymounkov and Mazieres, 2003] Maymounkov, P. and Mazieres, D. (2003). Rateless
codes and big downloads. In Peer-to-Peer Systems II, volume 2735 of Lecture Notes in
Computer Science, pages 247–255.
[Miras, 2002] Miras, D. (2002). Network QoS Needs of Advanced Internet Applications:
A Survey. Technical report.
[Montgomery and Runger, 2003] Montgomery, D. C. and Runger, G. C. (2003). Applied
Statistics and Probability for Engineers. John Wiley and Sons.
[Montoro et al., 2011] Montoro, D., Malgosa, J., Piñero, P. J., Muñoz, J. P., and Man-
zanares, P. (2011). Accurate packet timestamping on linux platforms for precise ca-
pacity estimation - an implementation of a highly accurate timestamping system em-
bedded in the linux kernel and its application to capacity estimation. In International
Conference on Software and Data Technologies (ICSOFT), pages 137–142.
114

BIBLIOGRAPHY
[Muñoz et al., 2011] Muñoz, J., Piñero, P., Malgosa, J., Manzanares, P., and Sanchez, J.
(2011). Rateless codes for reliable data transmission over HomePlug AV based in-
home networks. In Software and Data Technologies: 4th International Conference,
ICSOFT 2009. Revised Selected Papers, volume 50 of Communications in Computer
and Information Science, pages 181–191. Springer Berlin Heidelberg.
[Oberman and Flynn, 1997] Oberman, S. F. and Flynn, M. J. (1997). Division algorithms
and implementations. IEEE transactions on computers, 46(8):833–854.
[Papaioannou and Pavlidou, 2008] Papaioannou, A. and Pavlidou, F.-N. (2008). A cross-
layer scheduling scheme for multimedia services over power line networks. In Power
Line Communications and Its Applications, 2008. ISPLC 2008. IEEE International
Symposium on, pages 58–63.
[Pinero et al., 2011a] Pinero, P., Cortes, J., Canete, F., Diez, L., Manzanares, P., and
Malgosa, J. (2011a). A realistic HomePlug-AV simulator for in-home network ser-
vices planning. In Global Telecommunications Conference (GLOBECOM 2011), 2011
IEEE, pages 1–5.
[Pinero et al., 2011b] Pinero, P., Malgosa, J., Manzanares, P., and Munoz, J. (2011b).
Homeplug-AV CSMA/CA evaluation in a real in-building scenario. Communications
Letters, IEEE, 15(6):683–685.
[Pinero et al., 2014] Pinero, P., Malgosa, J., Manzanares, P., and Munoz, J. (2014).
Homeplug-AV CSMA/CA cross-layer extension for qos improvement of multimedia
services. Communications Letters, IEEE, Accepted for publication.
[Piñero et al., 2014] Piñero, P., Cortés, J., Malgosa, J., Cañete, F., Manzanares, P., and
Díez, L. (2014). Analysis and improvement of multicast communications in HomePlug
AV-based in-home networks. Computer Networks, 62(0):89 – 100.
[Piñero et al., 2012] Piñero, P., Malgosa, J., Manzanares, P., and Muñoz, J. (2012). Eval-
uation of a new proposal for efficient multicast transmission in HomePlug AV based
in-home networks. In IT Revolutions, volume 82 of Lecture Notes of the Institute for
Computer Sciences, Social Informatics and Telecommunications Engineering, pages
58–70. Springer Berlin Heidelberg.
[Piñero et al., 2011] Piñero, P. J., Montoro, D., Malgosa, J., Manzanares, P., and Muñoz,
J. P. (2011). Rateless codes for heterogeneous in-home interfaces aggregation. In
Power Line Communications and Its Applications (ISPLC), 2011 IEEE International
Symposium on, pages 243–248.
[Rozhon et al., 2014] Rozhon, J., Rezac, F., Slachta, J., and Voznak, M. (2014). Voice
and image quality prediction in IP networks. International Journal of Communication
Networks and Information Security. Under Review.
[Schulzrinne et al., 2003] Schulzrinne, H., Casner, S., Frederick, R., and Jacobson, V.
(2003). RFC 3550: RTP: A Transport Protocol for Real-Time Applications. Technical
report.
115

BIBLIOGRAPHY
[Shokrollahi, 2006] Shokrollahi, A. (2006). Raptor codes. Information Theory, IEEE
Transactions on, 52(6):2551–2567.
[Soderquist and Leeser, 1997] Soderquist, P. and Leeser, M. (1997). Division and square
root: choosing the right implementation. Micro, IEEE, 17(4):56–66.
[Stockhammer et al., 2011] Stockhammer, T., Heiles, J., and Lüken, J. (2011). DVB-
IPTV content download services–overview and use cases. Multimedia Tools Appl.,
pages 533–555.
[Suh and Mo, 2008] Suh, C. andMo, J. (2008). Resource allocation for multicast services
in multicarrier wireless communications. Wireless Communications, IEEE Transac-
tions on, 7(1):27–31.
[Szigeti and Hattingh, 2005] Szigeti, T. and Hattingh, C. (2005). End-to-End QoS Net-
work Design: Quality of Service in LANs, WANs, and VPNs. Cisco Press.
[Wu et al., 2010] Wu, B., Shen, J., and Xiang, H. (2010). Resource allocation with mini-
mum transmit power in multicast OFDM systems. Systems Engineering and Electron-
ics, Journal of, 21(3):355–360.
[Yonge, 2013] Yonge, L. (2013). An overview of the HomePlug AV2 technology. Journal
of Electrical and Computer Engineering, 2013.
[Yoon et al., 2008] Yoon, S.-G., Jeongkyun, Y., and Bahk, S. (2008). Adaptive contention
window mechanism for enhancing throughput in HomePlug AV networks. In Con-
sumer Communications and Networking Conference, 2008. CCNC 2008. 5th IEEE,
pages 190–194.
[Zahariadis, 2003] Zahariadis, T. (2003). Home Networking Technologies and Standards.
Artech House Inc.
116
Related Documents