PP10551/09/2011(028936) 15 November 2010 OSK Research | See important disclosures at the end of this report 1 MALAYSIA EQUITY Investment Research Daily IPO Note Jason Yap +60 (3) 9207 7698 [email protected] Petronas Chemicals Group A Rising Star SUBSCRIBE Target RM5.51 IPO Price RM5.04 Enlarged Share Capital / Par Value 8.0bn shares/RM0.10 Indicative Listing Date 26 November 2010 Listing Sought Main Board Major Shareholders (post- IPO) Petronas 69.0% IPO Details Shares (m) Retail offering: Malaysian public - Bumiputera 80.0 - Non-Bumiputera 80.0 Directors 0.4 Employees 123.5 Customers 9.1 Total retail 293.0 Institutional offering: MITI approved Bumiputera investors 920.0 Other investors 1267.0 Total institutional 2,187.0 Total 2,480.0 Offer for sale consists of 1,780m existing shares. Utilisation of Proceeds RMm Expansion of business 2,239.0 Working capital 1,200.0 Listing expenses 96.0 Total 3,535.0 Petronas Chemicals Group (Petronas Chemicals) is a leading integrated petrochemical producer in the South-East Asia (SEA) region. Its key competitive advantage lies in its reliable and attractively priced gas feedstock supply from Petronas Group. However, its performance can be cyclical given the nature of the industry it operates in. We initiate coverage with a Subscribe / Buy call with some 9% upside to our fair value. SEA’s leading integrated petrochemical producer. Petronas Chemicals is the largest producer of methanol by volume in South-East Asia (SEA) and the 4 th largest in the world. It is also SEA’s largest producer of ethylene glycols as well as the 3 rd largest producer of urea and low density polyethylene (LDPE) in SEA by volume. The group also holds the distinction of being the market leader in Malaysia’s petrochemical industry based on its urea, glycols and methanol sales. Competitive edge in having reliable and cheap gas feedstock. Firstly, producing petrochemicals using gas (ethane) is more cost effective than with oil (naphtha). Secondly, the gas price paid by Petronas Chemicals is close to that paid by its Middle Eastern peers, which is considered the lowest in the industry. In fact, both Petronas Group and Petronas Chemicals have a strong symbiotic relationship whereby Petronas Chemicals sources its feedstock exclusively from Petronas. However, petrochemical is a cyclical industry. According to market research firm Nexant, the duration between 2 peak cycles is 6-11 years. Currently, the industry’s short term outlook is a bleak one, but it expects to see gradual recovery in the industry’s utilization rates and margins starting from 2011 and peaking in 2015. This recovery would be driven by the Asia Pacific markets, where growth rates are higher compared to developed markets due to the lower level of material substitution for petrochemicals. Increasingly, petrochemicals are used to substitute basic materials like wood, glass, metals, paper and card in the packaging, automotive and construction industries, since they offer higher performance but at lower cost. Initiate with Subscribe / Buy recommendation. Our target price for the company is RM5.51 based on a PER of 16x FY12 EPS. From the financial angle, we like the company’s strong backing from Petronas Group, especially in terms of low feedstock’ prices, and its attractive dividend payout ratio of 50%, which is the highest versus that of its close peers. FYE Mar (RMm) FY08 FY09 FY10 FY11f FY12f Revenue 12855.0 12367.0 12203.0 12699.5 13609.4 Net Profit 3925.0 2818.0 2199.0 2248.7 2756.1 % chg y-o-y - -28.2 -22.0 2.3 22.6 Consensus - - EPS (sen) 49.1 35.2 27.5 28.1 34.5 DPS (sen) - - - 14.1 17.2 Dividend yield (%) - - - 2.8 3.4 ROE (%) 26.4 17.9 12.9 12.4 14.1 ROA (%) 18.3 12.1 8.2 7.8 9.1 PER (x) 10.3 14.3 18.3 17.9 14.6 BV/share (RM) 1.86 1.97 2.13 2.27 2.45 P/BV (x) 2.7 2.6 2.4 2.2 2.1 EV/ EBITDA (x) 4.9 6.3 6.2 5.9 5.3

Welcome message from author
This document is posted to help you gain knowledge. Please leave a comment to let me know what you think about it! Share it to your friends and learn new things together.
Transcript

PP10551/09/2011(028936) 15 November 2010
OSK Research | See important disclosures at the end of this report 1
MALAYSIA EQUITYInvestment Research
Daily
IPO Note Jason Yap +60 (3) 9207 7698 [email protected]
Petronas Chemicals Group
A Rising Star
SUBSCRIBE Target RM5.51 IPO Price RM5.04
Enlarged Share Capital / Par Value
8.0bn shares/RM0.10
Indicative Listing Date
26 November 2010
Listing Sought
Main Board
Major Shareholders (post- IPO)
Petronas 69.0%
IPO Details Shares (m)
Retail offering: Malaysian public - Bumiputera 80.0 - Non-Bumiputera 80.0 Directors 0.4 Employees 123.5 Customers 9.1 Total retail 293.0 Institutional offering: MITI approved Bumiputera investors
920.0
Other investors 1267.0 Total institutional 2,187.0 Total 2,480.0
Offer for sale consists of 1,780m existing shares.
Utilisation of Proceeds RMm
Expansion of business 2,239.0 Working capital 1,200.0 Listing expenses 96.0 Total 3,535.0
Petronas Chemicals Group (Petronas Chemicals) is a leading integratedpetrochemical producer in the South-East Asia (SEA) region. Its key competitiveadvantage lies in its reliable and attractively priced gas feedstock supply fromPetronas Group. However, its performance can be cyclical given the nature of theindustry it operates in. We initiate coverage with a Subscribe / Buy call with some 9%upside to our fair value.
SEA’s leading integrated petrochemical producer. Petronas Chemicals is the largestproducer of methanol by volume in South-East Asia (SEA) and the 4th largest in the world. It is also SEA’s largest producer of ethylene glycols as well as the 3rd largest producer of urea and low density polyethylene (LDPE) in SEA by volume. The group also holds the distinction of being the market leader in Malaysia’s petrochemical industry based on its urea, glycols and methanol sales. Competitive edge in having reliable and cheap gas feedstock. Firstly, producing petrochemicals using gas (ethane) is more cost effective than with oil (naphtha). Secondly, the gas price paid by Petronas Chemicals is close to that paid by its Middle Eastern peers,which is considered the lowest in the industry. In fact, both Petronas Group and Petronas Chemicals have a strong symbiotic relationship whereby Petronas Chemicals sources its feedstock exclusively from Petronas. However, petrochemical is a cyclical industry. According to market research firm Nexant, the duration between 2 peak cycles is 6-11 years. Currently, the industry’s short term outlook is a bleak one, but it expects to see gradual recovery in the industry’s utilization rates and margins starting from 2011 and peaking in 2015. This recovery would be driven by the Asia Pacific markets, where growth rates are higher compared to developed markets due to the lower level of material substitution for petrochemicals. Increasingly, petrochemicals are used to substitute basic materials like wood, glass,metals, paper and card in the packaging, automotive and construction industries, since they offer higher performance but at lower cost. Initiate with Subscribe / Buy recommendation. Our target price for the company is RM5.51 based on a PER of 16x FY12 EPS. From the financial angle, we like the company’s strong backing from Petronas Group, especially in terms of low feedstock’ prices, and its attractive dividend payout ratio of 50%, which is the highest versus that of its close peers.
FYE Mar (RMm) FY08 FY09 FY10 FY11f FY12f Revenue 12855.0 12367.0 12203.0 12699.5 13609.4 Net Profit 3925.0 2818.0 2199.0 2248.7 2756.1 % chg y-o-y - -28.2 -22.0 2.3 22.6 Consensus - - EPS (sen) 49.1 35.2 27.5 28.1 34.5 DPS (sen) - - - 14.1 17.2 Dividend yield (%) - - - 2.8 3.4 ROE (%) 26.4 17.9 12.9 12.4 14.1 ROA (%) 18.3 12.1 8.2 7.8 9.1 PER (x) 10.3 14.3 18.3 17.9 14.6 BV/share (RM) 1.86 1.97 2.13 2.27 2.45 P/BV (x) 2.7 2.6 2.4 2.2 2.1 EV/ EBITDA (x) 4.9 6.3 6.2 5.9 5.3
OSK Research
OSK Research | See important disclosures at the end of this report 2
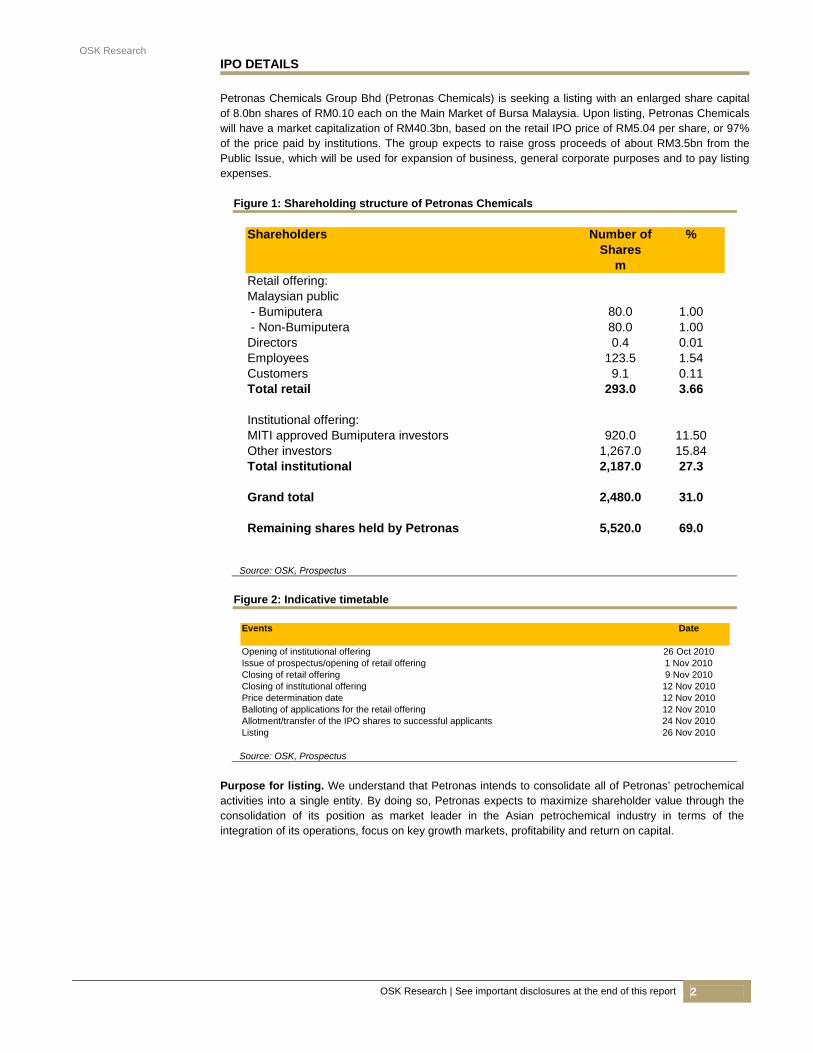
IPO DETAILS
Petronas Chemicals Group Bhd (Petronas Chemicals) is seeking a listing with an enlarged share capital
of 8.0bn shares of RM0.10 each on the Main Market of Bursa Malaysia. Upon listing, Petronas Chemicalswill have a market capitalization of RM40.3bn, based on the retail IPO price of RM5.04 per share, or 97% of the price paid by institutions. The group expects to raise gross proceeds of about RM3.5bn from the Public Issue, which will be used for expansion of business, general corporate purposes and to pay listing expenses.
Figure 1: Shareholding structure of Petronas Chemicals
Shareholders Number of %
Sharesm
Retail offering:Malaysian public - Bumiputera 80.0 1.00 - Non-Bumiputera 80.0 1.00Directors 0.4 0.01Employees 123.5 1.54Customers 9.1 0.11Total retail 293.0 3.66
Institutional offering:MITI approved Bumiputera investors 920.0 11.50Other investors 1,267.0 15.84Total institutional 2,187.0 27.3
Grand total 2,480.0 31.0
Remaining shares held by Petronas 5,520.0 69.0
Source: OSK, Prospectus
Figure 2: Indicative timetable
Events Date
Opening of institutional offering 26 Oct 2010Issue of prospectus/opening of retail offering 1 Nov 2010Closing of retail offering 9 Nov 2010Closing of institutional offering 12 Nov 2010Price determination date 12 Nov 2010Balloting of applications for the retail offering 12 Nov 2010Allotment/transfer of the IPO shares to successful applicants 24 Nov 2010Listing 26 Nov 2010
Source: OSK, Prospectus
Purpose for listing. We understand that Petronas intends to consolidate all of Petronas’ petrochemical activities into a single entity. By doing so, Petronas expects to maximize shareholder value through the consolidation of its position as market leader in the Asian petrochemical industry in terms of the integration of its operations, focus on key growth markets, profitability and return on capital.

OSK Research
OSK Research | See important disclosures at the end of this report 3
PETRONAS CHEMICALS COMPANY BACKGROUND
Petronas Chemicals is the leading integrated petrochemical producer in Malaysia and also one of the largest petrochemical producers in the SEA region. With more than 25 years of experience in thepetrochemical industry, the group is primarily involved in the manufacturing, marketing and selling of a diversified range of petrochemical products which include olefins, polymers, fertilizers, methanol and other basic chemical and derivative products. The group has a total production capacity of over 11m tonnes pa.Today, its 2 major operating business segments are: 1) olefins and polymers, and 2) fertilizers and methanol. The group operates through 2 integrated petrochemical complexes (IPC) in the east of Peninsular Malaysia (Kertih and Gebeng) as well as 3 manufacturing complexes - in Gurun, Bintulu and Labuan. Finally, it also has a PVC plant in Vietnam. Petronas Chemicals stands out as the largest producer of methanol by volume in SEA and 4th largest in the world. It is also the largest producer of ethylene glycols in SEA, and the 3rd largest producer of urea and low density polyethylene (LDPE) in SEA by volume. It is also the market leader in the Malaysian petrochemicals industry based on sales of urea,glycols and methanol.
Figure 3: The group’s key milestones
Year Key Milestones
1985 ASEAN Bintulu Fertilizer commenced first commercial production of ammonia and urea in the Bintulucomplex.
1995 Polyethylene Malaysia commenced production of polyethylene
2000 BASF Petronas Chemicals's Acrylic Acid complex fully operational
2002 Optimal Companies' olefins plant, glycols plant and chemical plant commenced operations
2009 Mega Methanol plant in Labuan commissionedDow Chemical's interest in the Optimal Companies' JV acquired
2010 BP Chemicals' interest in Polyethylene Malaysia and Ethylene Malaysia acquired
Source: OSK, Prospectus

OSK Research
OSK Research | See important disclosures at the end of this report 4
GROUP STRUCTURE Petronas Chemicals has 17 100%-owned subsidiaries and majority-owned subsidiaries, and 5 associates and JV entities. Its 2 main operating segments are olefins and polymers, and fertilizers and methanol. Petronas Chemicals also owns 100% of and operates Kertih Port, which provides port services in connection with the sale and distribution of its petrochemical products. Finally, it also owns 100% of MITCO, who co-ordinates its marketing and sales activities with production.
Figure 4: Petronas Chemicals’ olefins and polymers segment
OLEFINS AND POLYMERS BUSINESS SEGMENT
MTBE MALAYSIA
PolypropyleneMalaysia
Vinyl Chloride (Malaysia)
PETLIN Ethylene Malaysia
Aromatics Malaysia Phu My OPTIMAL
Olefins
OPTIMAL Chemicals
OPTIMAL Glycols
Polyethlene Malaysia
BASF PETRONAS Chemicals
IdemitsuSM
100%100% 100% 100% 100% 100%
60% 87.5% 70% 93.11% 88%
40% 30%
Source: Prospectus
Figure 5: Petronas Chemicals’ fertilisers and methanol segment
FERTILISERS AND METHANOL BUSINESS SEGMENT
ASEANBintulu Fertilizer
PETRONASMethanol
BP PETRONAS Acetyls
PETRONASAmmonia
PETRONAS Fertilizer
MITCOKertih Port
Kertih Terminals
Malaysian NPK
Fertilizer
100% 100% 100% 100% 100%
40%20%
30%
63.47%
Source: Prospectus
OSK Research
OSK Research | See important disclosures at the end of this report 5
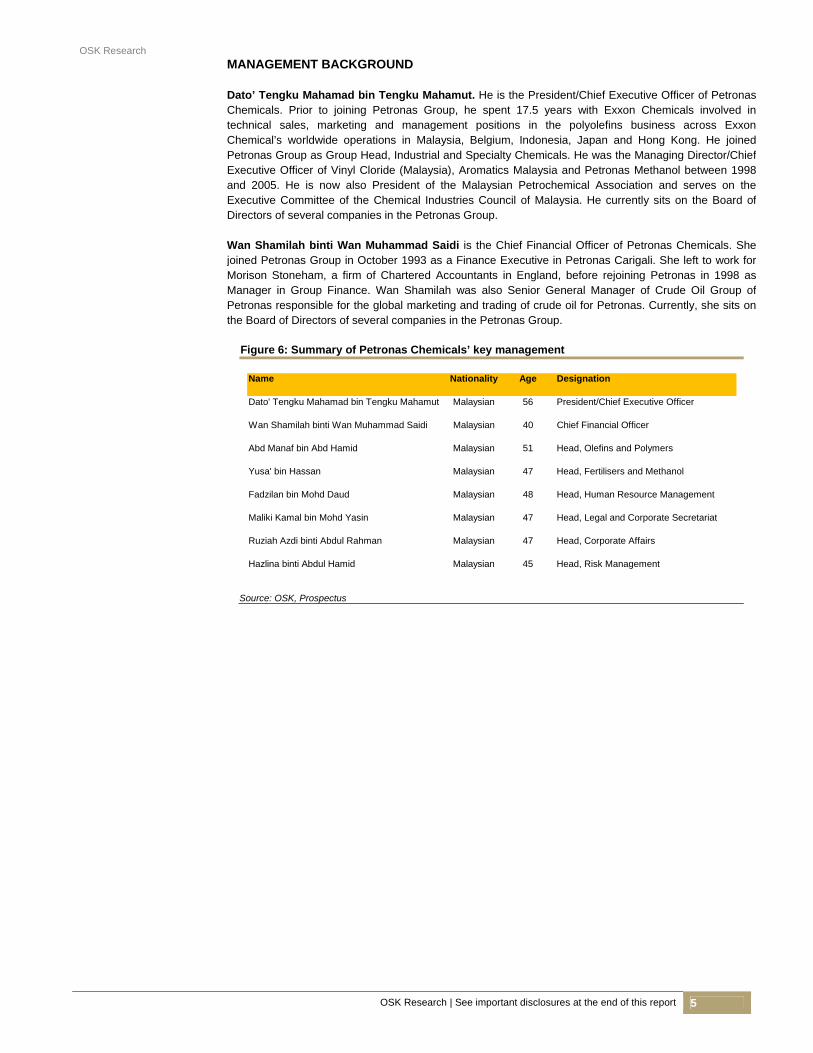
MANAGEMENT BACKGROUND Dato’ Tengku Mahamad bin Tengku Mahamut. He is the President/Chief Executive Officer of Petronas Chemicals. Prior to joining Petronas Group, he spent 17.5 years with Exxon Chemicals involved in technical sales, marketing and management positions in the polyolefins business across ExxonChemical’s worldwide operations in Malaysia, Belgium, Indonesia, Japan and Hong Kong. He joined Petronas Group as Group Head, Industrial and Specialty Chemicals. He was the Managing Director/ChiefExecutive Officer of Vinyl Cloride (Malaysia), Aromatics Malaysia and Petronas Methanol between 1998and 2005. He is now also President of the Malaysian Petrochemical Association and serves on theExecutive Committee of the Chemical Industries Council of Malaysia. He currently sits on the Board ofDirectors of several companies in the Petronas Group. Wan Shamilah binti Wan Muhammad Saidi is the Chief Financial Officer of Petronas Chemicals. She joined Petronas Group in October 1993 as a Finance Executive in Petronas Carigali. She left to work for Morison Stoneham, a firm of Chartered Accountants in England, before rejoining Petronas in 1998 as Manager in Group Finance. Wan Shamilah was also Senior General Manager of Crude Oil Group of Petronas responsible for the global marketing and trading of crude oil for Petronas. Currently, she sits onthe Board of Directors of several companies in the Petronas Group.
Figure 6: Summary of Petronas Chemicals’ key management
Name Nationality Age Designation
Dato' Tengku Mahamad bin Tengku Mahamut Malaysian 56 President/Chief Executive Officer
Wan Shamilah binti Wan Muhammad Saidi Malaysian 40 Chief Financial Officer
Abd Manaf bin Abd Hamid Malaysian 51 Head, Olefins and Polymers
Yusa' bin Hassan Malaysian 47 Head, Fertilisers and Methanol
Fadzilan bin Mohd Daud Malaysian 48 Head, Human Resource Management
Maliki Kamal bin Mohd Yasin Malaysian 47 Head, Legal and Corporate Secretariat
Ruziah Azdi binti Abdul Rahman Malaysian 47 Head, Corporate Affairs
Hazlina binti Abdul Hamid Malaysian 45 Head, Risk Management
Source: OSK, Prospectus

OSK Research
OSK Research | See important disclosures at the end of this report 6
PRINCIPAL ACTIVITIES 2 main business segments. Petronas Chemicals has 2 main business segments, including: 1) olefins and polymers, and 2) fertilizers and methanol. The olefins and polymers business dominates the group’sproduct mix, contributing 70%-75% of its revenue, while the balance 25%-30% is mainly contributed by its fertilizers and methanol business. In the olefins and polymers segment, Petronas Chemicalsmanufactures and sells a wide product range, ranging from ethylene and propylene which are used asbasic feedstock for intermediate products such as ethylene oxide, ethylene glycol, butanol chemicals and various ethylene oxide derivatives, including some basic and high performance chemicals while in thefertilizers and methanol segment, it produces and sells methanol and a range of nitrogen phosphate andcompound fertilizers.
Figure 7: Petronas Chemicals’ revenue breakdown
‐
2,000
4,000
6,000
8,000
10,000
12,000
FY08 FY09 FY10 FY11f FY12f
RM'm
Olefins & Polymer Fertilisers & Methanol Others
Source: OSK, Petronas Chemicals
Ethane and propane the main feedstock for olefins and polymer products. These are supplied to the plants through the Peninsular Gas Utilisation (PGU) pipeline to produce ethylene and propylene. Once produced, these chemicals will be supplied to its other plants to be used in downstream productionprocesses. For example, ethylene is used as feedstock to manufacture polyethylene (HDPE, LLDPE andLDPE), VCM, ethylene glycols and styrene monomer while propylene is the feedstock used together with oxogas and ammonia, which is supplied from its ammonia plant in Kertih IPC to produce butanolchemicals.
Figure 8: Olefins and polymers
MTBE
VCM VCM
PVC PVC
Phu My PVC
PVC
LDPE
Feedstock supply
Associates
Olefins and Polymers Business Segments
PETRONAS Methanol
Methanol
PETRONAS
PROPANE, BUTANE
MTBE Malaysia
MTBE
PROPYLENE
N‐BUTANE
ETHANE
Etylene Malaysia
ETHYLENE
Polypropylene Malaysia
Polypropylene
Acrylics / OXO‐ALCOHOL/BUTANEDIOL
POLYPROPYLENE
ACRYLICS
OXO‐ALCOHOLIC
BUTANEDIOL
PETRONAS
LLDPE/HDPE
COMPOUNDSOPTIMAL Olefins
ETHYLENE
PROPYLENE
Polvethvlene Malaysia
LLDPHE/HDPE
COMPOUNDS
HEAVY NAPHTHA PARAXYLENE BENZENE
Aromatics Malaysia
OPTIMAL Glycols
ETHYLENE OXIDE/GLYCOLS
OPTIMAL Chemicals
BUTANOL/CHEMICALS
BASF Petronas Chemicals
PARAXYLENE BENZENE
PETRONAS Ammonia
OXOGAS AMMONIA
PETRONAS Penapisan
(Terengganu)
ETHYLENE GLYCOLS
BUTANOL CHEMICALS
PETRONAS
PROPANE PETUN
LDPE
Vinyl Chloride (Malaysia)
Idemitsu SM
STYRENE MONOMER STYRENE MONOMER
PROPYLENE
N‐BUTANE
PROPYLENE
VCM
ETHYLENE
ETHYLENE
PROPYLENE
ETHYLENE OXIDE
Source: Prospectus

OSK Research
OSK Research | See important disclosures at the end of this report 7
Methane and hydrogen the main feedstock for fertilizers and methanol products. Both feedstocks are derived from natural gas supplied by Petronas. Methanol is primarily produced at its 2 methanol plantsin Labuan using natural gas as feedstock. Once produced, it is either sold to third parties or supplied to its plant in Gebeng IPC whereby the methanol will be used as feedstock for the production of MTBE. BesidesLabuan, methanol is also being produced at its production complex in Gurun. Urea and ammonia areproduced in Gurun and Bintulu using natural gas as feedstock.
Figure 9: Fertilizers and methanol
PETRONAS / PETRONAS
Carigali PETRONAS Methanol Methanol
Natural Gas
PETRONAS ASEAN Bintulu Fertilizer UREA AMMONIA
NATURAL GAS
PETRONAS PETRONAS FERTILIZER
NATURAL GAS
ETHYLENE MALAYSIA,
AROMATICS MALAYSIA,
PETRONAS PENAPISAN
(TERENGGANU) PETRONAS AMMONIA
HYDROGEN
UREA
AMMONIA
Methanol
MTBE Malaysia
MTBE
PROPYLENE
N‐BUTANE
UREA
AMMONIA
METHANOL
UREA AMMONIA
AMMONIA
CARBON MONOXIDE
OXOGAS
AMMONIA
METHANOL
Jointly Controlled Entity
Olefins and Polymers Business Segment
Feedstock supply
OPTIMAL CHEMICALS
ETHYLENE GLYCOL
OTHER CHEMICALS
BP PETRONAS ACETYLS
ACETIC ACID
Methanol
OXOGAS AMMONIA CARBON MONOXIDE
ACETIC ACID
Source: Prospectus

OSK Research
OSK Research | See important disclosures at the end of this report 8
PRODUCTION FACILITIES Strategic location in Malaysia. Except for its PVC plant in Ho Chi Minh, Vietnam, all its other productionfacilities are located in Malaysia, as shown in the diagram below.
Figure 10: Location of Petronas Chemicals’ production facilities
Source: Prospectus
Natural gas channeled through pipelines. Petronas Gas has been processing natural gas sourced offshore Terengganu since 1984. This natural gas is transmitted through its PGU pipeline system to end-users in the power, industrial and commercial sectors in Peninsular Malaysia, as well as power plants inSingapore. All of Petronas Chemicals’ facilities have dedicated pipelines that supply it with feedstock. KERTIH IPC Background. The Kertih IPC is located on the east coast of Peninsular Malaysia and mainly consists ofethane-based petrochemical projects. The facilities here include: 1) 2 ethylene crackers; 2) 2 polyethyleneplants; 3) 1 ethylene oxide/ethylene glycol plant; 4) 1 multi-unit derivatives plant; 5) Vinyl chloride monomer (VCM) and polyvinyl chloride (PVC) plants; 6) ammonia/synthesis gas plants; 7) 1 acetic acidplant, and 8) 1 aromatics complex. Petronas Chemicals owns and operates all these plants. Feedstocks. The main feedstocks are ethane, propane and heavy naphtha. The gas feedstock isdelivered through the PGU network while the heavy naphtha is delivered through another dedicatedpipeline directly from the oil refinery operated by Petronas Penapisan Terengganu. Other infrastructures. The Kertih Port is wholly-owned by Petronas Chemicals and has 6 berths that can accommodate chemical tankers of up to 50k dwt. Also, there is a 86km dedicated railway systemconnecting this Kertih IPC to Kuantan Port. Finally, Kertih Terminal - a JV between Petronas, Dialog andVopak - terminal provides centralized services for the handling, storage and distribution of feedstock,intermediates and finished products from the Kertih IPC.

OSK Research
OSK Research | See important disclosures at the end of this report 9
Figure 11: Kertih IPC
Source: Prospectus
OSK Research
OSK Research | See important disclosures at the end of this report 10
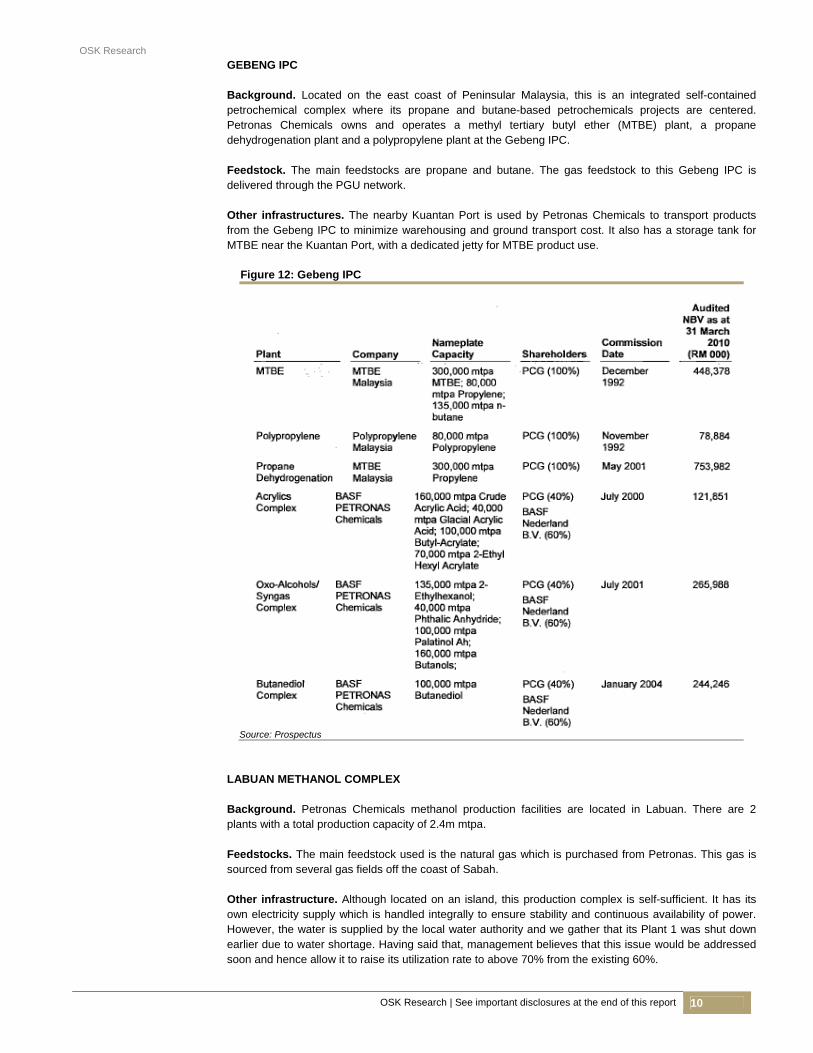
GEBENG IPC Background. Located on the east coast of Peninsular Malaysia, this is an integrated self-contained petrochemical complex where its propane and butane-based petrochemicals projects are centered. Petronas Chemicals owns and operates a methyl tertiary butyl ether (MTBE) plant, a propanedehydrogenation plant and a polypropylene plant at the Gebeng IPC. Feedstock. The main feedstocks are propane and butane. The gas feedstock to this Gebeng IPC is delivered through the PGU network. Other infrastructures. The nearby Kuantan Port is used by Petronas Chemicals to transport productsfrom the Gebeng IPC to minimize warehousing and ground transport cost. It also has a storage tank forMTBE near the Kuantan Port, with a dedicated jetty for MTBE product use.
Figure 12: Gebeng IPC
Source: Prospectus
LABUAN METHANOL COMPLEX Background. Petronas Chemicals methanol production facilities are located in Labuan. There are 2plants with a total production capacity of 2.4m mtpa. Feedstocks. The main feedstock used is the natural gas which is purchased from Petronas. This gas issourced from several gas fields off the coast of Sabah. Other infrastructure. Although located on an island, this production complex is self-sufficient. It has its own electricity supply which is handled integrally to ensure stability and continuous availability of power.However, the water is supplied by the local water authority and we gather that its Plant 1 was shut down earlier due to water shortage. Having said that, management believes that this issue would be addressedsoon and hence allow it to raise its utilization rate to above 70% from the existing 60%.

OSK Research
OSK Research | See important disclosures at the end of this report 11
Figure 13: Labuan methanol complex
Source: Prospectus
Figure 14: Other plants
Source: Prospectus
Reasonable capacity utilization rate. The average utilization rate for all its plants is 75% to 80%. Usually, all its plants operate non-stop throughout the year except during periods of scheduledmaintenance or unscheduled shutdowns.

OSK Research
OSK Research | See important disclosures at the end of this report 12
SUPPLIERS Petronas the main supplier. The primary feedstocks for Petronas Chemicals are ethane, propane,methane, butane and heavy naphtha and they are supplied by Petronas Group. In fact, there are no other supplier who accounted more than 10% of its total purchase since 2008. These feedstocks supplied byPetronas Group are on a fixed term basis although the pricing may differ among the supply contracts.Nevertheless, we understand that the price paid for these feedstocks are more attractive than the existing market price.
Figure 15: Main raw materials supplied by Petronas
Source: Prospectus
CUSTOMERS Targeting the local and international markets. Petronas Chemicals’ sales to the local market accounted for 45%-57% of total sales from 2008-2010. Also, due to the diversity of its customers, no single customer contributes more than 10% of total revenue, which minimizes the risk of relying on a fewcustomers. The domestic market. The group’s 550 customers in Malaysia comprise distributors, traders and manufacturers serving the packaging, household, construction and agricultural markets as well asmanufacturers of industrial products. Also, Petronas Chemicals is the sole producer of granular urea in the domestic fertilizer market for direct application in the agriculture sector.
Figure 16: Target market of petrochemical industry
Agricultural32%
Packaging19%
Construction15%
Transportation11%
Textile9%
Others14%
Source: OSK, Petronas Chemicals
The international market. Petronas Chemicals exports to about 900 customers in more than 25 countries. Its major markets are SEA, North East Asia, the Indian subcontinent, Australia and NewZealand. However, due to strong competition from its international peers, Petronas Chemicals needs to becompetitive in terms of product pricing, quality, reliability as well as flexible on delivery to its customers. Also, in order to be more customer oriented, it has overseas representatives in China, Indonesia, India,Philippines, Thailand, Vietnam, United Arab Emirates and South Africa to reach and service customers more effectively.
OSK Research
OSK Research | See important disclosures at the end of this report 13
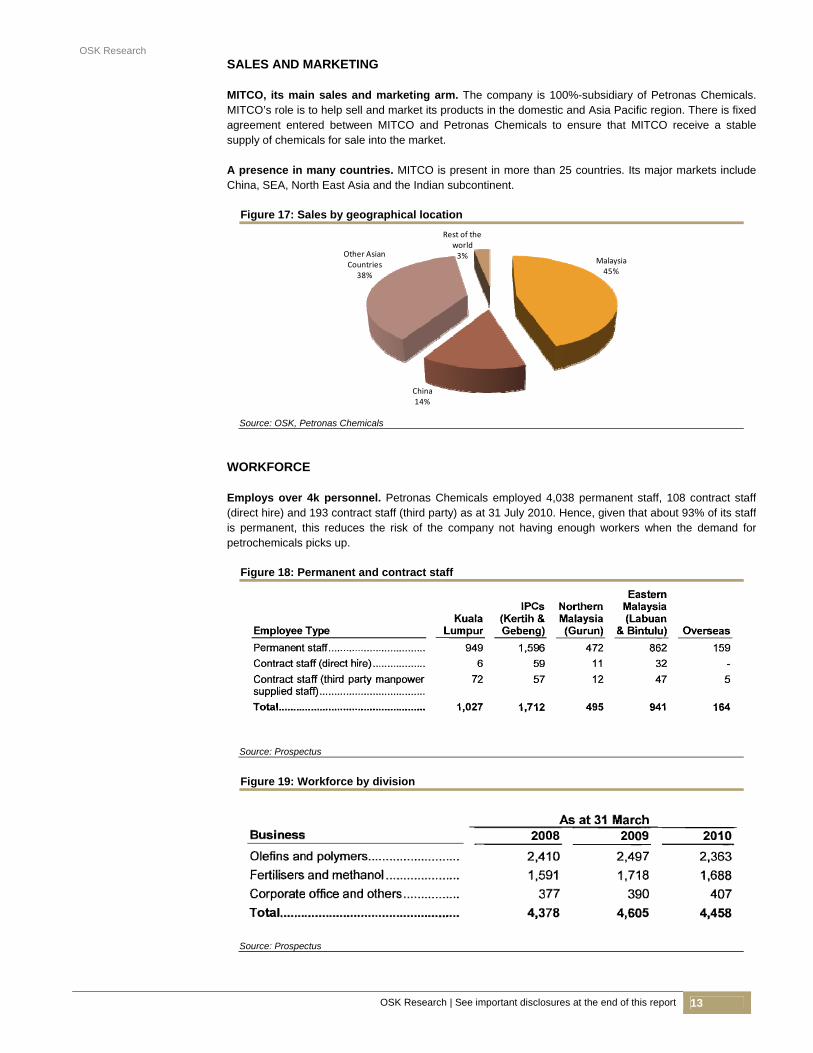
SALES AND MARKETING MITCO, its main sales and marketing arm. The company is 100%-subsidiary of Petronas Chemicals.MITCO’s role is to help sell and market its products in the domestic and Asia Pacific region. There is fixed agreement entered between MITCO and Petronas Chemicals to ensure that MITCO receive a stablesupply of chemicals for sale into the market. A presence in many countries. MITCO is present in more than 25 countries. Its major markets includeChina, SEA, North East Asia and the Indian subcontinent.
Figure 17: Sales by geographical location
Malaysia45%
China14%
Other Asian Countries
38%
Rest of the world3%
Source: OSK, Petronas Chemicals
WORKFORCE Employs over 4k personnel. Petronas Chemicals employed 4,038 permanent staff, 108 contract staff(direct hire) and 193 contract staff (third party) as at 31 July 2010. Hence, given that about 93% of its staffis permanent, this reduces the risk of the company not having enough workers when the demand forpetrochemicals picks up.
Figure 18: Permanent and contract staff
Source: Prospectus
Figure 19: Workforce by division
Source: Prospectus

OSK Research
OSK Research | See important disclosures at the end of this report 14
COMPETITION 4 major competitors reviewed. Although there are many chemical producers in the world, weunderstand from Petronas Chemicals’ analyst briefing that the group recognizes 4 peers which have similar businesses and a product mix that is close to its own. These companies are: 1) Saudi BasicIndustries Corporation (Sabic); 2) Formosa Petrochemical Corporation (Formosa); 3) PTT Chemical Plc(PTT Chemical), and 4) Reliance Industries Ltd (Reliance). Also, we have included 2 other peers, Honamand LG from South Korea, for comparison.
Figure 20: Top 10 South-East Asia producers of olefins (ethylene & propylene)
Company Capacity
000 MT p.aPTT Group 2,600 Petronas Chemicals 1,500 ExxonMobil 1,400 SCG Group 1,350 Titan 1,250 Shell/QPI 1,200 Sumitomo 1,000 Chandra Asri 900 Pertamina 300 Star Refinery 100
Source: OSK, Prospectus
Sabic, Saudi Arabia. The company was established in 1976 and began production in 1981. It is one of the world’s leading manufacturers of chemicals, fertilizers, plastics and metals. In comparison with its peers, it is one of the world’s 5 largest petrochemical manufacturers with notable products like ethylene, ethylene glycol, methanol, MTBE and polyethylene. It is a public company based in Riyadh in which the Saudi Arabian government owns 70% of its shares while the remaining 30% is held by private investors. It has offices across the globe including Middle East/Africa, Americas, Europe and Asia. Sabic has more than 33k employees and operations in more than 40 countries. Formosa, Taiwan. The company, established in 1992, is the largest olefins producer in Taiwan. Its olefin products are mostly sold to companies within the Formosa Group. Overall, it is in the business of refining crude oil, selling refined petroleum products and producing and selling olefins (including ethylene,propylene, butadiene and BTX) from its naphtha cracking operations. It also sells electricity, steam andcertain other products generated from its co-generation power plants. Today, Formosa is the only privately owned oil refinery in Taiwan and that country’s 2nd largest gasoline and gasoil producer. Its refined petroleum products are both sold domestically and in overseas markets. PTT Chemical, Thailand. The company was formed from the merger of 2 major petrochemical players in Thailand, namely the National Petrochemical Public Company Ltd and Thai Olefins Public Company Ltd PTT Chemical was registered in 2005 and is now Thailand’s largest producer of olefins and related downstream products. This fully -integrated petrochemical manufacturer’s core products are ethylene and propylene. Its other downstream petrochemical products include polyethylene, ethylene oxide andethylene glycol. Reliance, India. The company is one of India's largest private-sector companies. It was founded as a textiles company but successfully completed a backward integration strategy later to transform itself into one of India's largest private-sector petrochemicals companies. Its petrochemicals division is fully integrated and produces a variety of petrochemicals which include polymers, polyester, polyester intermediates and a few others. In fact, some of the chemicals produced are used to support its textile operation, which it focuses particularly on the production of polyester fabrics. Honam, South Korea. Honam Petrochemical Corporation is one of the largest ethylene producers inSouth Korea. The company, incorporated in 1976, today produces petrochemicals which include polyethylene, polypropylene, functional resins and basic petrochemicals. Recently, it proposed to acquire 100% of Titan Chemicals Group Bhd at RM2.35/share.

OSK Research
OSK Research | See important disclosures at the end of this report 15
LG, South Korea. LG Petrochemical Co Ltd manufactures and markets petrochemical products such asethylene, propylene, butadiene, benzene, toluene, xylene, benxene, propane, pentane, phenol, acetone,high-density polyethylene, nonaromatic raffinate, and mixed xylene. The company was formerly known as Lucky Petrochemical Co and was founded in 1978. A local rival in Titan Chemicals Group Bhd. Malaysia’s petrochemical industry is dominated by 2 major producers, namely Petronas Chemicals and Titan, although Shell Chemicals does command a smallportion of the market. The main difference between Petronas Chemicals and Titan is Petronas Chemicalsuses low priced gas feedstock as well as produces a wider petrochemical products compared to Titan, which uses naphtha as feedstock and focuses on the production of olefins and polyolefins. ShellChemicals, on the other hand, is active in propylene production via refinery integration.
Figure 21: Production capacity of local competitors
Source: Prospectus
Figure 22: Domestic market share
Petronas Chemicals
53%
Titan43%
Shell4%
Note: Total capacity is 2.9m MT p.a. in 2009 Source: OSK, Prospectus

OSK Research
OSK Research | See important disclosures at the end of this report 16
PETROCHEMICAL INDUSTRY – TIMING OF CYCLES IS CRUCIAL A cyclical industry. The petrochemical industry is quite cyclical. A typical cycle starts with demand building up, which in turn prompts petrochemical manufacturers to increase production capacity. This will lead to over-capacity in the industry and hence poor utilization rates as well as product pricing pressure. It would take a pick-up in demand before a new cycle starts. Based on a survey conducted by Nexant, theduration between 2 peak cycles is between 6 and 11 years as there are also many factors influencing this timeframe, such as the health of the global economy and so on. Short term outlook bleak, but it’s just a cycle. Nexant expects the petrochemical industry to remain under pressure as further capacity is forecast in the immediate term. However, it also sees a gradual recovery in the industry in terms of utilization rates and margins starting from 2011 and peaking in 2015. To recap, the previous major peak was reached in 2006/2007.
Figure 23: Petrochemical industry cyclical nature
Source: Prospectus, Nexant
Recovery starting from 2011 driven by Asia Pacific. Starting from 2H10, there appears to be a recovery in the petrochemical industry, beginning with inventory restocking as buyers had been conservative in their inventory holdings prior to 2H10 owing to the global economic crisis. Also going into 2011, there is less capacity start-up being scheduled, which would in turn support the pricing and margins of chemical products.
Figure 24: Net imports of major petrochemical products in 2015f
Source: Prospectus, Nexant
OSK Research
OSK Research | See important disclosures at the end of this report 17
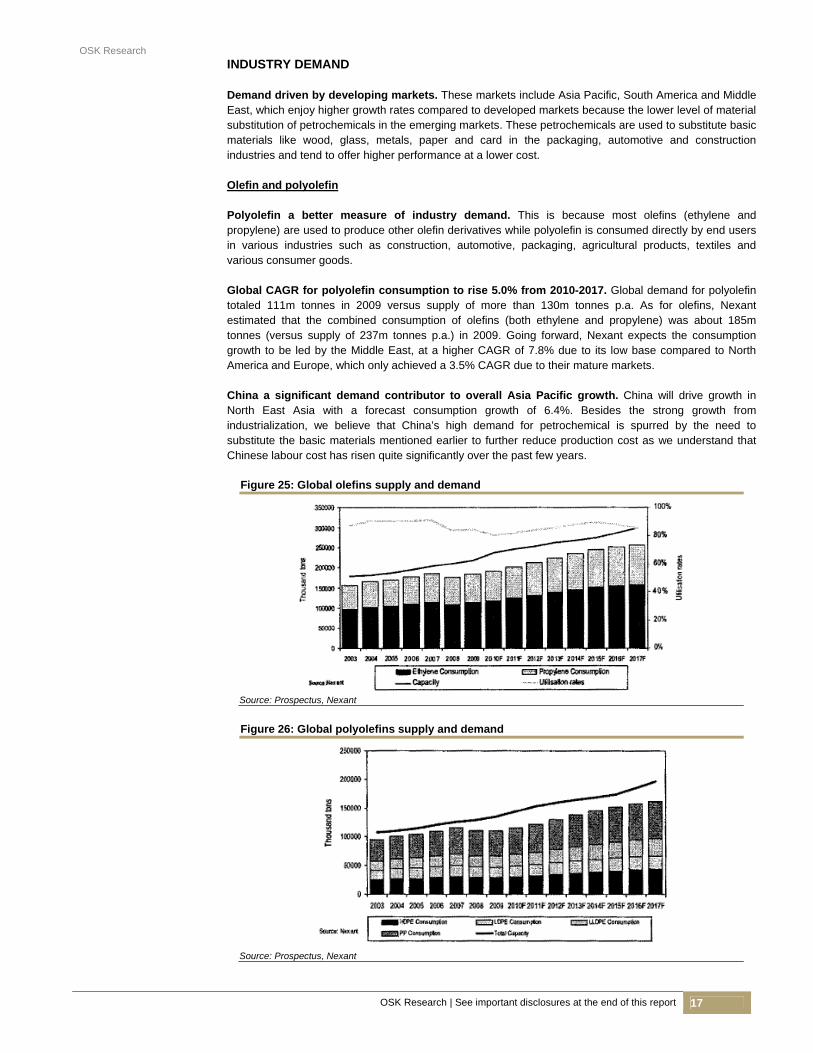
INDUSTRY DEMAND Demand driven by developing markets. These markets include Asia Pacific, South America and Middle East, which enjoy higher growth rates compared to developed markets because the lower level of materialsubstitution of petrochemicals in the emerging markets. These petrochemicals are used to substitute basic materials like wood, glass, metals, paper and card in the packaging, automotive and construction industries and tend to offer higher performance at a lower cost. Olefin and polyolefin Polyolefin a better measure of industry demand. This is because most olefins (ethylene and propylene) are used to produce other olefin derivatives while polyolefin is consumed directly by end usersin various industries such as construction, automotive, packaging, agricultural products, textiles and various consumer goods. Global CAGR for polyolefin consumption to rise 5.0% from 2010-2017. Global demand for polyolefin totaled 111m tonnes in 2009 versus supply of more than 130m tonnes p.a. As for olefins, Nexant estimated that the combined consumption of olefins (both ethylene and propylene) was about 185mtonnes (versus supply of 237m tonnes p.a.) in 2009. Going forward, Nexant expects the consumption growth to be led by the Middle East, at a higher CAGR of 7.8% due to its low base compared to North America and Europe, which only achieved a 3.5% CAGR due to their mature markets. China a significant demand contributor to overall Asia Pacific growth. China will drive growth in North East Asia with a forecast consumption growth of 6.4%. Besides the strong growth from industrialization, we believe that China’s high demand for petrochemical is spurred by the need to substitute the basic materials mentioned earlier to further reduce production cost as we understand that Chinese labour cost has risen quite significantly over the past few years.
Figure 25: Global olefins supply and demand
Source: Prospectus, Nexant
Figure 26: Global polyolefins supply and demand
Source: Prospectus, Nexant

OSK Research
OSK Research | See important disclosures at the end of this report 18
Ethylene Glycol Asia Pacific dominates demand. The Asia Pacific market makes up about 72% of global ethylene glycoldemand. This chemical is a major raw material used in the production of polyester fibre and resin. It is itself produced from ethylene oxide. Global demand in 2009 totaled 18m tonnes (versus supply of about25m tonnes, and is expected to grow at a CAGR of 4%-5% from 2010-2017. The key consumption driver is the textile market, in which polyester commands a strong share based on cost on performance versus other fibres.
Figure 27: Global ethylene glycol supply and demand
Source: Prospectus, Nexant
Methanol Growth driven by new and emerging applications. The global annual methanol demand of about 45m tonnes (versus supply of about 87.6m tonnes) and expected to grow at a 9% CAGR over the period of 2010-2017. Methanol is either used as a chemical feedstock or in fuel related markets. If used aschemical feedstock, it would form formaldehyde, which is used in producing resins (glues) for the use in binding plywood and chipboard. On the other hand, fuel related use, it forms methyl tertiary butyl ether (MTBE)
Figure 28: Global methanol supply and demand
Source: Prospectus, Nexant
Asia Pacific is one of the global largest markets for methanol. This region consumed about 24m tonnes in 2009, with the high consumption driven by China. In fact, Nexant forecasts that demand growthin China is about 15% CAGR from the 2010-2017 period.

OSK Research
OSK Research | See important disclosures at the end of this report 19
Urea Demand fuelled by global GDP and population growth. Fertilizer growth is mainly driven by food consumption on the back of GDP and population growth. The increased demand for fertilizer will drive demand for ammonia and urea. Urea is the primarily source of nitrogen for corp nutrition. It is also used in the production of certain resins such as melamine and urea formaldehyde resin, which is used as wood glue in the particle board, chipboard and plywood industries. The global demand for urea is about 150m tonnes (versus supply of about 187.3m tonnes). Going forward, the growth in urea demand would likely come from developing regions where population growth is the fastest and where farming techniques are being improved and industrialized via increased use of fertilizers, which include China and India. As for North America and Europe, we expect these regions to exhibit limited growth due to their slower population growth and well-developed agricultural industries.
Figure 29: Global urea supply and demand
Source: Prospectus, Nexant

OSK Research
OSK Research | See important disclosures at the end of this report 20
INDUSTRY SUPPLY Olefins and polyolefins New supply of olefin mainly from Middle East and Asia Pacific. The total global olefin capacity isestimated to be around 237m tonnes p.a. The Middle East is expected to increase global olefin capacity by about 10m tonnes a year. This expansion is of course primarily driven by low cost gas in the region. China tops the 2nd largest new olefin supply. Nexant forecasts that China alone will contribute about 6m tonnes of new olefins capacity annually from 2010-2015, supported by available feedstock from the local coal reserves and new refinery investments (naphtha). To recap, coal based projects are now beingpromoted by the Chinese government to reduce the nation’s dependence on oil-based products. Minimal new capacity from US, Europe and Japan. In comparison with the Middle East and Asia Pacific, the US, Europe and Japan have been going through rationalization of their older and higher costplants and this trend is expected to continue over the next few years. Hence, this had led to minimal new capacities coming out from these countries. In fact, we understand that there is going to be about 1m MTof olefins capacity to be closed in US and Europe between 2010-2015.
Figure 30: Olefins capacity changes forecast
Country 2010 2015F CAGR
m' MT m' MT %North America 51.1 50.6 -0.21South America 9.4 16.8 12.43Western Europe 40.2 40.4 0.13Middle East/Africa 36.3 48.8 6.13Central & Eastern Europe 10.9 13.6 4.49Other Asia 8.7 13.1 8.53North East Asia 65.7 71.6 1.75South East Asia 15.1 19.2 5.00
Source: OSK, Prospectus, Nexant
New capacity from elsewhere. Besides China, major new capacity investments are also being made in India, Thailand and Singapore although the incremental amount may not be significant. In the longer term, Nexant expects Vietnam and Indonesia to make significant new capacity investments but the SEA market is forecast to grow at a CAGR of 5% from 2010-2017, adding about 4m tonnes in new capacity annually. Malaysia a small contributor to global olefin capacity. Malaysia’s total olefin capacity is about 2.9m tonnes, contributed by 3 companies, namely Petronas Chemicals, Titan and Shell Chemicals. PetronasChemicals holds the majority capacity share with an estimated share of 53% of the domestic market, followed by Titan at 43% and the balance 4% by Shell Chemicals.
Figure 31: Polyolefins Top 10 South East Asia Producers
Company Capacity
000 MT p.aPTT Group 1,580 Titan Chemicals 1,480 SCG Group 1,450 ExxonMobil 930 Sumitomo/Shell 810 Petronas Chemicals 600 Chevron Phillips 400 Tri Polyta 390 JG Summmit Petrochemicals 390 Chandra Asri 350
Source: OSK, Prospectus, Nexant

OSK Research
OSK Research | See important disclosures at the end of this report 21
Ethylene Glycol New capacity from Asia Pacific and Middle East. This new capacity is linked to wider olefin complexes which are typically constructed with upstream integration into ethylene oxide. Nexant expects the high capacity addition in 2010 to reduce global utilization rates significantly to below 80%. New capacity ofsome 3.5m tonnes is expected to come onstream by 2010, bringing the annual global capacity to about 25m tonnes. Small contribution from SEA producers. The region’s annual capacity of only about 1.1m tonnes is supplied by 4 companies, namely Petronas Chemicals, PTT, EG Singapore (JV between Shell Chemicalsand Mitsubishi) and PolyChem (Indonesia). Methanol More supply from the China. Currently, annual global methanol supply totals 87.6m tonnes. Going forward, China is expected to add another 28m tonnes a year of new capacity between 2009 and 2015. The new projects in China will be based on coal feedstock. Besides China, we expect regions with accessto cheaper natural gas such as the Middle East, South America and SEA to expand capacity too. Producers fragmented. In 2009, the top 20 producers only accounted for about 30% of the global methanol capacity while the remaining 70% comprised a highly fragmented group of largely small coalbased producers in China. Petronas Chemicals has an annual production capacity of about 2.4m tonnes and is currently ranked 4th in the world.
Figure 32: Methanol capacity changes forecast
Country 2010 2015F CAGR
m' MT m' MT %North America 1.1 0.5 -14.91South America 13.3 14.9 2.29Western Europe 2.9 3.3 2.64Middle East/Africa 18.5 27.1 7.88Central & Eastern Europe 4.7 6.1 5.36Other Asia 1.4 1.0 -8.00North East Asia 41.2 52.7 8.78South East Asia 4.4 4.4 0.00
Source: OSK, Prospectus, Nexant
Urea Supply to exceed demand. The global supply of urea is estimated at about 187.3m tonnes a year but even though supply still exceeds demand, there is an estimated new capacity of about 9m tonnes a year coming on stream by 2011. This excess capacity is expected to further pressure margins and utilization rates.
Figure 33: Urea capacity changes forecast
Country 2010 2015F CAGR
m' MT m' MT %North America 10.8 9.2 -3.05South America 8.9 12.3 6.78Western Europe 5.6 3.4 -9.44Middle East/Africa 26.1 36.4 6.87Central & Eastern Europe 23.1 23.4 0.28Other Asia 22.5 24.6 1.75North East Asia 66.1 67.9 0.5South East Asia 21.2 24.7 3.04
Source: OSK, Prospectus, Nexant
OSK Research
OSK Research | See important disclosures at the end of this report 22
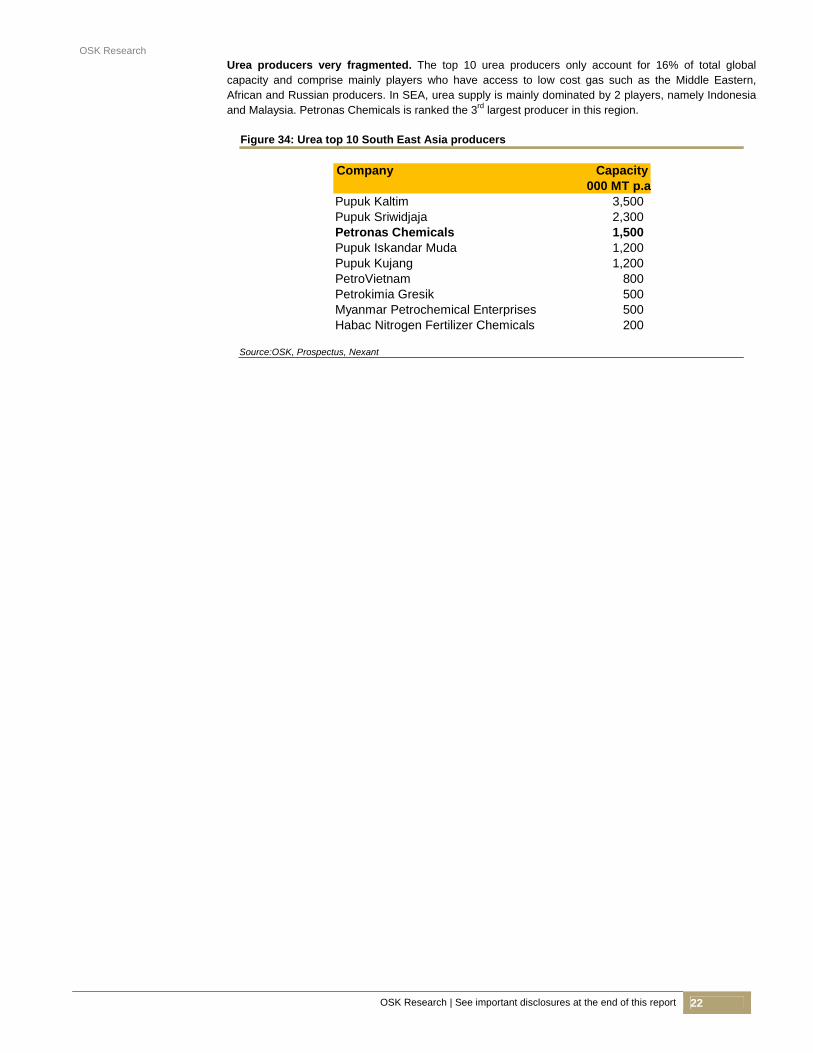
Urea producers very fragmented. The top 10 urea producers only account for 16% of total globalcapacity and comprise mainly players who have access to low cost gas such as the Middle Eastern,African and Russian producers. In SEA, urea supply is mainly dominated by 2 players, namely Indonesia and Malaysia. Petronas Chemicals is ranked the 3rd largest producer in this region.
Figure 34: Urea top 10 South East Asia producers
Company Capacity
000 MT p.aPupuk Kaltim 3,500 Pupuk Sriwidjaja 2,300 Petronas Chemicals 1,500 Pupuk Iskandar Muda 1,200 Pupuk Kujang 1,200 PetroVietnam 800 Petrokimia Gresik 500 Myanmar Petrochemical Enterprises 500 Habac Nitrogen Fertilizer Chemicals 200
Source:OSK, Prospectus, Nexant

OSK Research
OSK Research | See important disclosures at the end of this report 23
MARGINS – DRIVEN BY FEEDSTOCK COSTS Middle Eastern producers have cost advantage. Compared with the other world producers, the Middle Eastern producers incur the lowest olefin cost, whereby ethane is supplied to them at a price fixed below the market price since they have linkages to the energy market. Besides lower feedstock, the Middle East players also have the advantage of lower average utility costs, lower capex associated costs and good economies of scale production. According to Nexant, a typical new ethylene plant constructed in Middle East has about 1.2m tonnes p.a, which usually double the size of the typical ethylene cracker in operationin Europe, US and Asia Pacific. Petronas Petrochemicals’ margin should be quite comparable to Middle East producers. This is because Petronas Petrochemicals’ gas feedstock such as ethane, which makes up about 60% of its total production cost, is purchased from Petronas Group at attractive prices. Hence, this gives it an edge over its non-Middle Eastern peers as we believe its other costs such as energy and utilities, depreciation, staff costs and so on are quite comparable between producers. We believe the Middle East producers capture a slightly higher EBITDA margin of over 50% compared to Petronas Chemicals’ 40% and above due to feedstock price advantage. The other gas based petrochemical producer in the region is PTT Chemicalbut its margin is still lower than Petronas Chemicals’.
Figure 35: EBITDA margin trend of Petronas Chemicals and its peers between ‘07-‘09
0%
10%
20%
30%
40%
50%
60%
Petronas Chemicals
Sabic Formosa PTT Chemical Reliance
2007
2008
2009
Source: OSK, Petronas Chemicals
Figure 36: Petronas Chemicals has higher EBITDA margin over peers between ‘07-‘09
Company Average
EBITDAPetronas Chemicals 40%Sabic 33%PTT Chemical 25%Reliance 16%Formosa 11%
Source: OSK, Petronas Chemicals
Petrochemical industry still affected by oversupply. The industry has been experiencing a downturn in profitability following a period of good margins from 2005 to 2007. Since that time, margins had fallen in tandem with the decline in global GDP and the sharp increase in incremental petrochemical supplywhereby net ethylene capacity had increased by 11m tonnes a year between 2008 and 2010 while consumption grew only about 9m tonnes during this period. In the next 6 to 9 months, we believe that product margins will remain under pressure as further capacity is expected to come onstream. Industry should recover starting from 2H11. This is on the expectation that there will be fewer capacity start ups scheduled during this period. The estimated new ethylene addition in 2011 is about 5m tonnes compared to 11k tonnes in 2010. Also, the combined new additional capacity for both ethylene and propylene of 18m tonnes in 2010 is expected to fall to 6m tonnes by 2014, resulting in an expected margin peak in 2015, after which the industry believes that the down-cycle will return due to the rush in capacity expansion to capitalize on the attractive margin.
OSK Research
OSK Research | See important disclosures at the end of this report 24
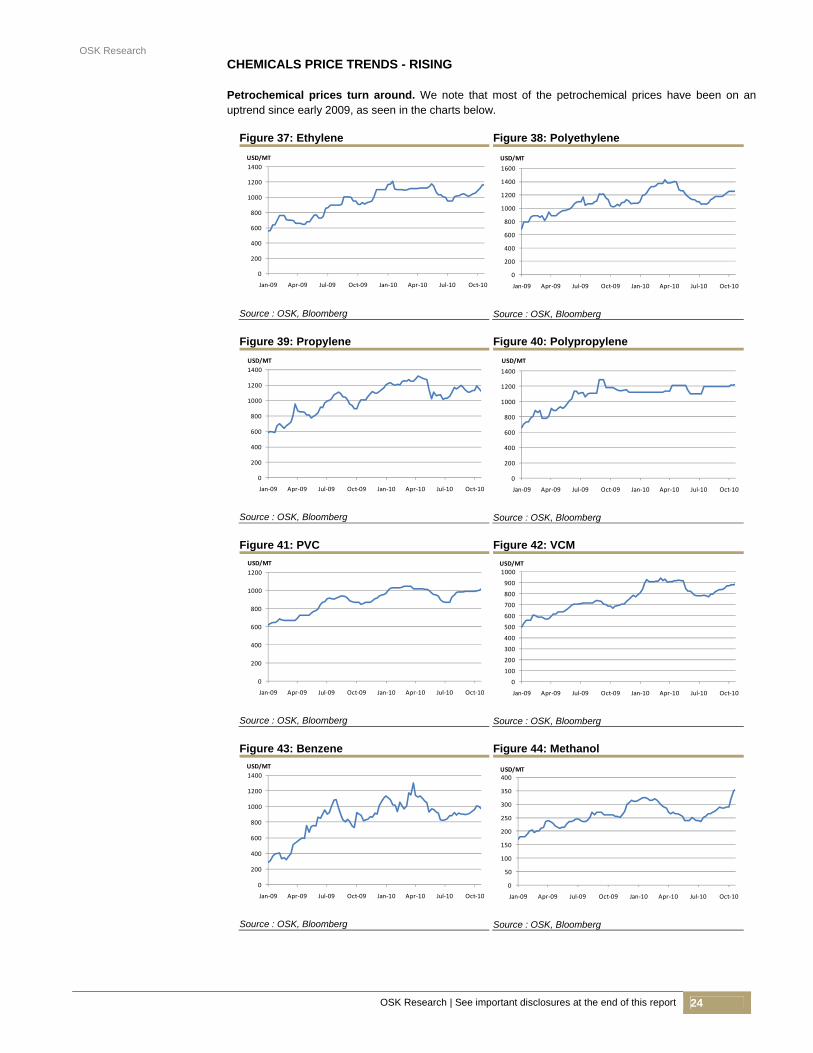
CHEMICALS PRICE TRENDS - RISING Petrochemical prices turn around. We note that most of the petrochemical prices have been on an uptrend since early 2009, as seen in the charts below.
Figure 37: Ethylene Figure 38: Polyethylene
0
200
400
600
800
1000
1200
1400
Jan‐09 Apr‐09 Jul‐09 Oct‐09 Jan‐10 Apr‐10 Jul‐10 Oct‐10
USD/MT
Source : OSK, Bloomberg
0
200
400
600
800
1000
1200
1400
1600
Jan‐09 Apr‐09 Jul‐09 Oct‐09 Jan‐10 Apr‐10 Jul‐10 Oct‐10
USD/MT
Source : OSK, Bloomberg
Figure 39: Propylene Figure 40: Polypropylene
0
200
400
600
800
1000
1200
1400
Jan‐09 Apr‐09 Jul‐09 Oct‐09 Jan‐10 Apr‐10 Jul‐10 Oct‐10
USD/MT
Source : OSK, Bloomberg
0
200
400
600
800
1000
1200
1400
Jan‐09 Apr‐09 Jul‐09 Oct‐09 Jan‐10 Apr‐10 Jul‐10 Oct‐10
USD/MT
Source : OSK, Bloomberg
Figure 41: PVC Figure 42: VCM
0
200
400
600
800
1000
1200
Jan‐09 Apr‐09 Jul‐09 Oct‐09 Jan‐10 Apr‐10 Jul‐10 Oct‐10
USD/MT
Source : OSK, Bloomberg
0
100
200
300
400
500
600
700
800
900
1000
Jan‐09 Apr‐09 Jul‐09 Oct‐09 Jan‐10 Apr‐10 Jul‐10 Oct‐10
USD/MT
Source : OSK, Bloomberg
Figure 43: Benzene Figure 44: Methanol
0
200
400
600
800
1000
1200
1400
Jan‐09 Apr‐09 Jul‐09 Oct‐09 Jan‐10 Apr‐10 Jul‐10 Oct‐10
USD/MT
Source : OSK, Bloomberg
0
50
100
150
200
250
300
350
400
Jan‐09 Apr‐09 Jul‐09 Oct‐09 Jan‐10 Apr‐10 Jul‐10 Oct‐10
USD/MT
Source : OSK, Bloomberg
OSK Research
OSK Research | See important disclosures at the end of this report 25
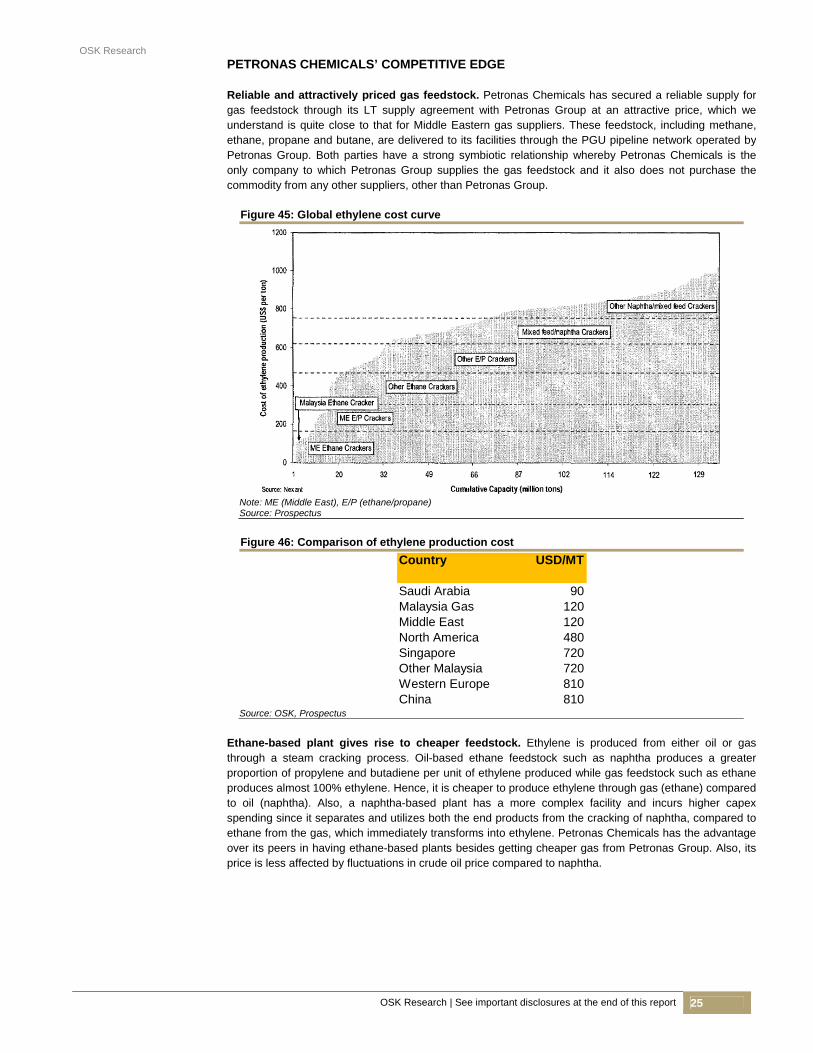
PETRONAS CHEMICALS’ COMPETITIVE EDGE Reliable and attractively priced gas feedstock. Petronas Chemicals has secured a reliable supply for gas feedstock through its LT supply agreement with Petronas Group at an attractive price, which we understand is quite close to that for Middle Eastern gas suppliers. These feedstock, including methane, ethane, propane and butane, are delivered to its facilities through the PGU pipeline network operated by Petronas Group. Both parties have a strong symbiotic relationship whereby Petronas Chemicals is the only company to which Petronas Group supplies the gas feedstock and it also does not purchase thecommodity from any other suppliers, other than Petronas Group.
Figure 45: Global ethylene cost curve
Note: ME (Middle East), E/P (ethane/propane) Source: Prospectus
Figure 46: Comparison of ethylene production cost
Country USD/MT
Saudi Arabia 90Malaysia Gas 120Middle East 120North America 480Singapore 720Other Malaysia 720Western Europe 810China 810
Source: OSK, Prospectus
Ethane-based plant gives rise to cheaper feedstock. Ethylene is produced from either oil or gas through a steam cracking process. Oil-based ethane feedstock such as naphtha produces a greater proportion of propylene and butadiene per unit of ethylene produced while gas feedstock such as ethaneproduces almost 100% ethylene. Hence, it is cheaper to produce ethylene through gas (ethane) comparedto oil (naphtha). Also, a naphtha-based plant has a more complex facility and incurs higher capex spending since it separates and utilizes both the end products from the cracking of naphtha, compared to ethane from the gas, which immediately transforms into ethylene. Petronas Chemicals has the advantage over its peers in having ethane-based plants besides getting cheaper gas from Petronas Group. Also, its price is less affected by fluctuations in crude oil price compared to naphtha.

OSK Research
OSK Research | See important disclosures at the end of this report 26
Figure 47: Impact of crude oil pricing on ethylene production cost
Source: Prospectus
A leader in South East Asia. Petronas Chemicals is one of the largest petrochemical producers in this region, with some of its notable characteristics set out in the company background section below. Strategic location. Both the Kertih and Gebeng IPCs form a petrochemical hub on the east coast ofPeninsular Malaysia that connects to the seaports for marine transportation to international locations through the rail and road networks. Malaysia is itself strategically located between the trade lines of Asia and Europe. Huge customer base. Petronas Chemical has about 550 customers in Malaysia and 900 customers in over 25 countries internationally. This reduces its risks on relying on a few large customers and alsoallows the group to easily sell new chemical products in the future given that it already has establishedmarkets. Strong strategic partnerships with the other global petrochemical players. Some of its notable petrochemical partners are BASF, Dow Chemical, Sasol Limited, BP Chemicals, Mitsubishi Corporationand Idemitsu Kosan. These partnerships allow Petronas Chemicals to widen its access to international markets as well as obtain technology and production knowhow while its partners benefit from its attractively priced feedstock and integrated production facilities in Malaysia. Riding on Petronas’ strong reputation. Given that Petronas is the largest shareholder of Petronas Chemicals, the group can ride on the principal shareholder’s well established brand name in the industry. Meeting mass market needs via diversified product portfolio. In comparison with some of its peers which only concentrate on commodity chemical production, Petronas Chemical, after having undergone vertical integration in the past, has today a highly diversified product portfolio. Now, the group is capable of producing a full range of products along each of the methane, ethane, propane and butane value chains as well as from upstream olefins through to downstream intermediate and derivative chemicals. Big enough to be fully integrated. This integration allows it to achieve production efficiency, minimizingboth logistics costs and product wastage between each step of the production chain. Ultimately, this willlead to lower fixed costs/product unit.

OSK Research
OSK Research | See important disclosures at the end of this report 27
INVESTMENT RISKS Cyclical changes in the petrochemical industry. The operating environment of the industry is quite cyclical whereby it is affected by periods of tight supply when utilization rates and margins are high thenfollowed by a period of oversupply as a result of significant capacity additions to the industry. Demand and supply subject to economic conditions. The industry is affected by global economic conditions whereby during the economic crisis, it will experience a down-cycle as demand weakens. This is followed by declining usage of fertilizers, resins, adhesives, plastics, textiles, packaging materials and other industrial and consumer products. Natural gas price hike of minimal concern for Petronas Chemicals. This is mainly because it hasa LT agreement with Petronas to buy feedstock on an agreed fixed priced and is unlikely to be subject to a price hike. Strong competition. There are many competitors in this business whereby some have bigger scale ofoperations and greater financial resources than Petronas Chemicals. Hence, there are times where a price war will emerge and erode margins. Anti-dumping by some countries. For example, the export of methanol to China by suppliers from theMiddle East and Asia-Pacific is subject to anti-dumping investigation by the Chinese authorities. Forex risks. We understand that a substantial portion of Petronas Chemicals’ revenue is dominated in USD. Hence, the weakening of USD against MYR will hit both its topline and bottomline. Complex and hazardous business. Given that petrochemical operations are complex and involve theproduction and transportation of highly flammable, explosive and toxic materials, there is always risk offires, explosions, release of toxic fumes, death, property damage or environmental damage. STRATEGY GOING FORWARD Consolidating its petrochemical activities. The purpose of this move is to have a centralized management so that all the petrochemical activities within the group can be co-ordinated more efficientlyand effectively to enable the group to respond faster to market needs. This also helps in achieving economies of scale in production, which will bring down cost per unit. Expanding its product range. Petronas Chemicals intends to go further downstream as these petrochemical products can fetch better margin. This move is in line with the group’s objective to increase its profitability level as well as capture new target markets to expand its global presence. Raising production capacity. We gather from the analyst briefing that Petronas plans to set up a fertilizer plant in Sabah estimated to cost about USD1bn. Also, it may set up an integrated refinery and petrochemical complex in Peninsular Malaysia but this is still in the early stage and no capex is being estimated as yet. Finally, it may increase its production capacity by venturing further with its JV partners. Merger and acquisition opportunities. This is part of its plan to expand its presence further in and outside the Asia Pacific market.

OSK Research
OSK Research | See important disclosures at the end of this report 28
VALUATION AND RECOMMENDATION Initiate with Subscribe / Buy recommendation. We are initiating coverage on Petronas Chemicals with a Subscribe / Buy recommendation. Our target price for the company is RM5.51, based on a PER of 16x FY12 EPS. This PER is slightly above its close peer average of 15x as we believe the company deservessuch valuations since it gets strong support from Petronas Group, especially in terms of low feedstock prices, which make up closed to 40% of its total cost. Also, Petronas Chemicals pays an attractive dividend payout ratio of 50%, which is considered the highest compared with peers like Sabic, at 41%, PTT Chemical (30%) and Reliance (12%). Other plus points are its competitive edge over its peers, as discussed in the earlier section of this report. Hence, we are initiating coverage on Petronas Chemicals with a BUY recommendation.
Figure 48: Peers valuation
Company Bloomberg Mkt Cap PER FY1 PER FY2
Ticker (USD'm) (x) (x)
Sabic Basic Industries Corporation SABIC AB 82400 15 13Reliance Industries Ltd RIL IN 82364 17 14Formosa Petrochemical Corp 6505 TT 27302 23 20LG Chem Ltd 051910 KP 22928 12 12Petronas Chemicals Group Bhd - 13032 18 15PTT Chemical PCL PTTCH TB 8323 23 14
Average 18 15
Source: OSK, Bloomberg
OSK Research
OSK Research | See important disclosures at the end of this report 29
EARNINGS FORECAST
`
FYE Mar (RMm) FY08 FY09 FY10 FY11f FY12f
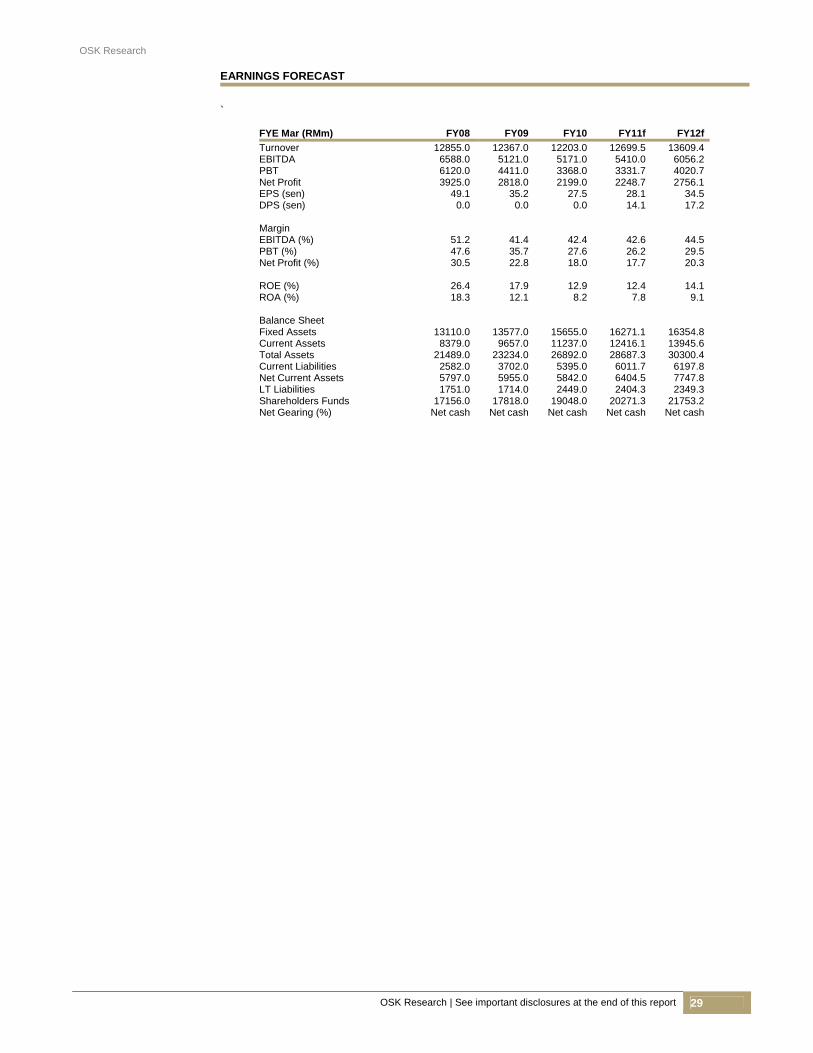
Turnover 12855.0 12367.0 12203.0 12699.5 13609.4EBITDA 6588.0 5121.0 5171.0 5410.0 6056.2PBT 6120.0 4411.0 3368.0 3331.7 4020.7Net Profit 3925.0 2818.0 2199.0 2248.7 2756.1EPS (sen) 49.1 35.2 27.5 28.1 34.5DPS (sen) 0.0 0.0 0.0 14.1 17.2 Margin EBITDA (%) 51.2 41.4 42.4 42.6 44.5PBT (%) 47.6 35.7 27.6 26.2 29.5Net Profit (%) 30.5 22.8 18.0 17.7 20.3 ROE (%) 26.4 17.9 12.9 12.4 14.1ROA (%) 18.3 12.1 8.2 7.8 9.1 Balance Sheet Fixed Assets 13110.0 13577.0 15655.0 16271.1 16354.8Current Assets 8379.0 9657.0 11237.0 12416.1 13945.6Total Assets 21489.0 23234.0 26892.0 28687.3 30300.4Current Liabilities 2582.0 3702.0 5395.0 6011.7 6197.8Net Current Assets 5797.0 5955.0 5842.0 6404.5 7747.8LT Liabilities 1751.0 1714.0 2449.0 2404.3 2349.3Shareholders Funds 17156.0 17818.0 19048.0 20271.3 21753.2Net Gearing (%) Net cash Net cash Net cash Net cash Net cash

OSK Research
OSK Research | See important disclosures at the end of this report 30
SK Research Guide to Investment Ratings Buy: Share price may exceed 10% over the next 12 months
Trading Buy: Share price may exceed 15% over the next 3 months, however longer-term outlook remains uncertain
Neutral: Share price may fall within the range of +/- 10% over the next 12 months
Take Profit: Target price has been attained. Look to accumulate at lower levels
Sell: Share price may fall by more than 10% over the next 12 months
Not Rated (NR): Stock is not within regular research coverage All research is based on material compiled from data considered to be reliable at the time of writing. However, information and opinions expressed will be subject to change at short notice, and no part of this report is to be construed as an offer or solicitation of an offer to transact any securities or financial instruments whether referred to herein or otherwise. We do not accept any liability directly or indirectly that may arise from investment decision-making based on this report. The company, its directors, officers, employees and/or connected persons may periodically hold an interest and/or underwriting commitments in the securities mentioned. Distribution in Singapore This research report produced by OSK Research Sdn Bhd is distributed in Singapore only to “Institutional Investors”, “Expert Investors” or “Accredited Investors” as defined in the Securities and Futures Act, CAP. 289 of Singapore. If you are not an “Institutional Investor”, “Expert Investor” or “Accredited Investor”, this research report is not intended for you and you should disregard this research report in its entirety. In respect of any matters arising from, or in connection with, this research report, you are to contact our Singapore Office, DMG & Partners Securities Pte Ltd (“DMG”). All Rights Reserved. No part of this publication may be used or re-produced without expressed permission from OSK Research. Published and printed by :- OSK RESEARCH SDN. BHD. (206591-V) (A wholly-owned subsidiary of OSK Investment Bank Berhad)
Chris Eng
Kuala Lumpur Hong Kong Singapore Jakarta Shanghai
Hong Kong Office OSK Securities Hong Kong Ltd.
12th Floor, World-Wide House
19 Des Voeux Road Central, Hong Kong
Tel : +(852) 2525 1118 Fax : +(852) 2810 0908
Malaysia Research Office OSK Research Sdn. Bhd.
6th Floor, Plaza OSK Jalan Ampang
50450 Kuala Lumpur Malaysia
Tel : +(60) 3 9207 7688 Fax : +(60) 3 2175 3202
Singapore Office DMG & Partners
Securities Pte. Ltd. 20 Raffles Place
#22-01 Ocean Towers Singapore 048620
Tel : +(65) 6533 1818 Fax : +(65) 6532 6211
Shanghai Office OSK (China) Investment
Advisory Co. Ltd. Room 6506, Plaza 66
No.1266, West Nan Jing Road 200040 Shanghai
China Tel : +(8621) 6288 9611 Fax : +(8621) 6288 9633
Jakarta Office PT OSK Nusadana Securities
Indonesia Plaza Lippo, 14th Floor,
Jln. Jend. Sudirman Kav 25, Jakarta 12920
Indonesia Tel : +(6221) 520 4599 Fax : +(6221) 520 4598
Related Documents