Industry Overview PETRONAS GROUP Financial Results Announcement Financial Year ended 31 March 2011 F8

Welcome message from author
This document is posted to help you gain knowledge. Please leave a comment to let me know what you think about it! Share it to your friends and learn new things together.
Transcript

Industry Overview
PETRONAS GROUP Financial Results Announcement
Financial Year ended 31 March 2011
F8
EMBARGO The information contained herein may only be
released after 6.00 p.m. on 8 June 2011

Industry Overview
Cautionary Statement Forward-looking statements involve inherent risks and uncertainties. Should one or more of these or other uncertainties or risks materialise, actual results may vary materially from those estimated, anticipated or projected. Specifically, but without limitation, capital costs could increase, projects could be delayed, and anticipated improvements in capacity, performance or profit levels might not be fully realised. Although PETRONAS believes that the expectations of its management as reflected by such forward-looking statements are reasonable based on information currently available to it, no assurances can be given that such expectations will prove to have been correct. Accordingly, you are cautioned not to place undue reliance on the forward-looking statements, which speak only as of the date they are made. PETRONAS undertakes no obligation to update or revise any of them, whether as a result of new information, future developments or otherwise. All rights reserved. No part of this document may be reproduced, stored in a retrieval system or transmitted in any form or by any means (electronic, mechanical, photocopying, recording or otherwise) without the permission of the copyright owner. PETRONAS makes no representation or warranty, whether expressed or implied, as to the accuracy or completeness of the facts presented. PETRONAS disclaims responsibility from any liability arising out of reliance on the contents of this publication. ©2010 PETROLIAM NASIONAL BERHAD (PETRONAS)

Industry Overview
PETRONAS GROUP Financial Results Announcement
Macro & Industry Overview Dato’ Shamsul Azhar Abbas
President & CEO, PETRONAS

Global Recovery Hindered - shock wave of events from geo political unrest to natural disasters.
Increase in energy and other commodity prices have put upward pressure on headline inflation, triggering global monetary tightening.
The need to be in a “Constant State of Preparedness”.
PETRONAS’ Growth Agenda remains intact to capture opportunities from rising long term demand for oil and gas.
RM 300 billion 5 year planned Capital Expenditure intact to sustain production levels with some growth along our Integrated Value Chain.
Additional Financial Resources required for M & As to drive material Growth and outpace escalating costs to enhance PETRONAS’ global positioning.
MACRO & INDUSTRY OVERVIEW
The face of UNCERTAINTIES Macro Overview
Page 1

15.0 18.0
13.0
7.0 10.0
18.0 18.0
15.0
15.0 13.0
24.0 28.0
22.0
15.9 17.5
FY 06/07 FY 07/08 FY 08/09 FY 09/10 FY10/11
Return on Average Capital Employed (ROACE), %
PETRONAS Group (RM billion) FY
Key Financial Indicators FY 09/10 FY 10/11 +/-
Revenue 210.8 241.2 14.4%
Gross Profit 82.4 97.8 18.7%
Profit For the Period 45.5 63.0 38.5%
EBITDA 83.3 107.9 29.5%
EBITDA Margin 39.5% 44.7% n/a
PETRONAS Group - strong underlying performance
PETRONAS IOC NOC
PETRONAS’ FINANCIAL PERFORMANCE
Group Revenue continues to improve with higher crude prices and volume sold.
EBITDA Margin rose to 44.7%
despite rising costs and the negative impact of strengthening Ringgit vs. the US Dollar.
Total assets improved by 6.8%
mainly due to higher PPE and cash proceeds obtained from the IPO of PCGB and MHB.
Overall performance improved
reflected in the increase of ROACE from 15.9% to 17.5%.
Page 2
Financial Highlights
Note: 1. PPE : Property, plant & equipment 2. ROACE is calculated based on NOPAT which excludes
IPO Gains for PETRONAS, IOCs and NOCs

Anchored on imperatives of:
Ensuring greater Ownership & Accountability
Elevating Governance & Transparency to international standards
Focusing resources to Core Business activities
Establishing clear and visible Succession Planning & Leadership Development
Achievements to date:
A pro-active and effective Board that provides strategic stewardship in steering the course for PETRONAS’ growth
PETRONAS’ group wide corporate restructuring that is driving desired behavioural changes
More transparent practices such as Quarterly Media Briefings
Dynamic & Meritocratic HR policies adapting to the needs of a globally diverse workforce. Robust Talent & Performance Management with commensurating rewards and consequences
PETRONAS TRANSFORMATION
Page 3
PETRONAS Corporate Enhancement Programme
To Enhance Robustness & Re-Energise Growth Momentum

Exploration & Production
Page 4
ACHIEVEMENTS
Malaysia and International – actively pursued with innovative solutions
Group Resource Replenishment Ratio of 2.5x compared to 1.1x last year
Awarded the first Risk Service Contract (RSC) for Berantai field to a consortium comprising Petrofac, Kencana Energy and Sapura Energy Ventures in January 2011
In Malaysia, 11 new PSCs were awarded compared to 4 last year
Sanctioned 2 new Enhanced Oil Recovery (EOR) projects; Tapis and Guntong with ExxonMobil Exploration and Production Malaysia Inc
5 new Petroleum Arrangements signed internationally
Exited Ethiopia and Timor Lesté, divesting Pakistan

Page 5
Gas & Power
ACHIEVEMENTS
Focused on security of supply for the Nation’s Energy Requirements
Announced the LNG Regasification Terminal project to be completed by July 2012
Executed Final Investment Decision (FID) on Gladstone LNG Project in Australia in January 2011
Maintained world class operating performance for gas processing plants and transmission reliability rates of 99.60% and 99.99%, respectively
Higher LNG sales volume of 26.3 MT compared to 25.1 MT last year

Page 6
Downstream & Others Mega Integrated Project – Malaysia as Regional Petrochemical Hub
ACHIEVEMENTS
Announced project RAPID, an integrated refinery and petrochemical hub in Johor
Embarked on a new fertilizer plant in Sabah
Successful listing of PETRONAS Chemicals Group Bhd (PCGB) in November 2010
Successful listing of Malaysia Marine and Heavy Engineering Holdings Bhd (MHB) in October 2010
MHB entered into an MOU for the proposed acquisition of Sime Darby Engineering’s Pasir Gudang Yard

Pursue a 3.5% CAGR production growth over 5 years
Resource Replenishment Ratio > 1 on a 3 year rolling average basis
Maximise value creation and growth within Malaysia
High grade portfolio of international assets
Anchor capability building on EOR & CO2 development
Explore new play types
Secure supply and maximise value of gas within Malaysia
Strengthen and grow LNG position in Asia Pacific and Atlantic
Establish and grow energy trading in Europe
Grow power and renewable business
Strengthen presence in selected markets and pursue opportunistic growth in
attractive markets
Rationalise non-value adding assets
Grow refining and petrochemical capacity and product range
Build global trading and marketing portfolio
GROWTH IMPERATIVES
Page 7
Key Strategies and Plans
Gas & Power
Exploration & Production
Downstream
Charting PETRONAS’ growth direction and momentum …

GLOBAL ENERGY CHAMPION
Positioned to compete with top industry players
Driven by resilience, supported by robustness and nimbleness to capitalise on opportunities
A Trusted Partner, leveraging on strengths and resources with Industries Best
Explore scope of business beyond conventional plays
CAPEX Quantum will be intensified to outpace rising costs, upgrade asset integrity, enhance yield of
existing/legacy assets, drive growth and venture into more challenging/green field plays such as EOR, Deep Water, Unconventional, etc
Significant CAPEX allocation for downstream expansion will enhance PETRONAS’ Integrated Value Chain
Balancing Resource Allocation and Requirements are KEY SUCCESS FACTORS in driving LONG TERM SUPERIOR PERFORMANCE
… towards being a Global Energy Champion
GLOBAL ENERGY CHAMPION known for its RESILIENCE and DISTINCTIVENESS
PETRONAS’ Aspiration
PRESIDENT’S MESSAGE
Page 8

Industry Overview
PETRONAS GROUP Financial Results Announcement
Financial Highlights Datuk George Ratilal
Executive Vice President
Finance

55
65
75
85
95
105
Apr - Jun2009
Jul - Sep2009
Oct - Dec2009
Jan - Mar2010
Apr - Jun2010
Jul - Sep2010
Oct - Dec2010
Jan-March2011
WTI Brent Tapis OSP
2.60
2.80
3.00
3.20
3.40
3.60
3.80
4.00
4.20
4.40
Mar 09 Jun 09 Sep 09 Dec 09 Mar 10 Jun 10 Sep 10 Dec 10 Mar 11
USD/MYR
FINANCIAL HIGHLIGHTS
PETRONAS Group continues to deliver strong underlying performance Financial Highlights
Benchmark crude prices showed an upward trend backed by robust demand & concerns over
supply…
Q4 PETRONAS Group (RM billion) FY
FY 09/10 FY 10/11 +/- Key Financial Indicators FY 09/10 FY 10/11 +/-
59.2 65.6 10.8% Revenue 210.8 241.2 14.4%
21.7 28.4 30.9% Gross Profit 82.4 97.8 18.7%
22.1 27.3 23.5% EBITDA 83.3 107.9 29.5%
15.6 20.8 33.3% Profit Before Taxation (PBT) 67.3 90.5 34.5%
9.0 12.4 37.8% NOPAT 44.5 52.6 18.2%
26.4% 31.7% n/a Return on Revenue (ROR) 31.9% 37.5% n/a
Page 10
USD/Bbl
Note: WTI = West Texas Intermediate OSP = Official Selling Price Source : Crude Oil Group Report
Note: NOPAT : Net Profit After Tax excluding finance cost, share of profits or associates and jointly controlled entities, net IPO Gains and other-non operating income and expenses; ROR : Based on PBT; EBITDA: Consists of PBT, minority interests with the addition of amounts previously deducted for depreciation, amortization and impairment loss on property, plant and equipment and intangible assets and financing costs, and the exclusion of interest income.
Financials: Rounded up to 1 decimal place (RM billion).
…whilst Ringgit strengthened against USD…
Source : Bloomberg
Revenue for the year increased by 14.4% y-o-y driven by higher prices for all products and higher volume for major products amidst improved economic growth despite strengthening of Ringgit Malaysia against US Dollar.
EBITDA for the year, included a net gain of RM9.2 billion arising from the IPO of
PCGB and MHB. Excluding the said gain, EBITDA increased by 18.5%, in line with higher revenue.
ROR for the year is 37.5% despite rising costs which reflects stronger prices and the Group’s continuous drive for operational efficiencies.

45.4
3.2 2.3 2.4 0.5
53.8
FY 09/10 E&P Gas& Power
Downstream Corporate& Others
FY 10/11
RM
bill
ion
E&P Gas & Power
Downstream Corporate & Others
81.5
53.6
115.4
21.0 93.3
64.0
130.0
19.1
30.8 34.0
8.9 11.2
4.8
7.2 0.9
1.4
FY 09/10 FY 10/11
FINANCIAL HIGHLIGHTS Revenue & NOPAT
Analysis
Note: Gross Revenue and Gross NOPAT include both third party and inter-segments transactions Financials: Rounded up to 1 decimal place (RM billion).
RM
bill
ion
Page 11
45.4 53.8
Gross NOPAT by Business Segment Gross Revenue by Business Segment
RM 271.5 billion RM 306.4 billion
FY 10/11 FY 09/10
Corporate & Others Gas & Power Downstream E&P
Movement in Gross NOPAT by Business Segments Higher prices and robust demand resulted in improved performance
for all core businesses.
Gross revenue increased by 12.9% with Downstream Business being the biggest revenue contributor at 42.4% of total Gross Revenue.
Gross NOPAT for the business segments increased by RM8.4 billion for the year with the highest incremental contribution coming from E&P Business.
Gross Revenue and NOPAT strengthened on the back of higher prices and robust demand

103.7 106.1
36.3 49.2
(30.0 ) (6.5 ) (0.9 )
16.8
FY 09/10 Cash fromOperations
Capex Dividends toGovernment
Dividends toMI
OtherInvesting
IPO FY 10/11
FINANCIAL HIGHLIGHTS
Group’s Balance Sheet remains healthy Financial Highlights Balance Sheet &
Cash Flows
PETRONAS Group (RM billion) 31 March 2010
Restated
31 March 2011
+/- Selected Balance Sheet Highlights
Property, Plant & Equipment (PPE) 189.5 191.6 1.1%
Total Assets 410.9 439.0 6.8%
Shareholder’s Funds 242.9 263.8 8.6%
Borrowings 51.9 47.8 (7.9%)
ROTA 11.1% 12.3% n/a
Return on Average Capital Employed (ROACE) 15.9% 17.5% n/a
Gearing 16.2% 13.9% n/a
Page 12
Note: 1. ROTA: Based on NPAT; 2. ROACE: based on NOPAT; divided by average shareholders’ equity and long term debt during the year. 3. Financials: Rounded up to 1 decimal place (RM billion).
Balance Sheet remains robust with PPE and total assets growing at 1.1% and 6.8% respectively, driven by the Group’s expansion strategy.
ROTA & ROACE increased to 12.3% and 17.5% respectively due to higher profit for the year.
Cash from Operations was RM70.8 billion compared to RM56.1 billion in the previous year, representing an increase of 26.2% mainly due to better earnings.
CAPEX accounts to RM34.9 billion mainly spent towards intensifying exploration and production activities and continuing EOR/IOR efforts.
Dividend payment to Government amounts to RM30 billion.
Changes in Group Cash Balance
RM
Bill
ion
140.0 155.3
Fund & Other Investments
Cash and cash equivalents
70.8 (34.9)

20.2 20.2 18.3 16.3 17.7
31.1 35.8
31.9 29.5 28.1
48.2 49.3
41.5 39.5
40.9
44.7
FY 06/07 FY 07/08 FY 08/09 FY 09/10 FY10/11
EBITDA / Revenue, %
22.1
22.1
18.2
13.4 15.7
23.0
21.5
19.8
12.7
14.4
25.9
28.1
23.0
11.1
18.5
20.6
FY 06/07 FY 07/08 FY 08/09 FY 09/10 FY10/11
Return on Total Assets (ROTA), %
19.5 18.2 18.3
21.4 18.8
31.2
27.5
31.5 31.6 28.0
17.4 15.8 15.9 16.2
13.9
FY 06/07 FY 07/08 FY 08/09 FY 09/10 FY10/11
Gearing Ratio, %
Industry Benchmarking
FINANCIAL HIGHLIGHTS
Note:
1. Results of oil majors (IOCs) and national oil companies (NOCs) were adjusted to the same financial period to PETRONAS based on publicly available information.
2. PETRONAS’ financial year end based on 31 Mar.
3. IOCs = ExxonMobil, Chevron, RD Shell & Total SA ;
4. NOCs = Petrobras, PetroChina , Rosneft & Statoil ASA
5. ROACE is calculated based on NOPAT which excludes IPO Gains for PETRONAS, IOC and NOC
PETRONAS’ improved performance is in line with big players of the industry
Page 13 WITH IPO Gain IOC NOC PETRONAS
15.0
18.0 13.0
7.0
10.0
18.0 18.0
15.0
15.0 13.0
24.0
28.0
22.0
15.9 17.5
FY 06/07 FY 07/08 FY 08/09 FY 09/10 FY10/11
Return on Average Capital Employed (ROACE)5, %
Improvement in the market forces had delivered favorable results to all players in the industry.
As a result, our competitors successfully improved their performance translated by higher EBITDA Margin, ROACE and ROTA whilst reducing their gearing.
PETRONAS’ own performance was also in trend with our competitors, indicating another year of resilient performance by the Group.

Exploration and
Production Business Dato’ Wee Yiaw Hin
Executive Vice President
Exploration & Production

E&P Highlights
EXPLORATION & PRODUCTION BUSINESS
Awarded first Risk Service Contract (RSC) for Berantai field as a new petroleum arrangement solution
157 ventures in Malaysia and International operations, with 17 new ventures secured during the year
Achieved total production of 2,132 kboe/d, 24% of which was contributed by International operations
Total group discovered resources stands at 28.3 Bboe, up by 4% from FY 09/10 Group Overall Resource Replenishment Ratio of 2.5x for combined oil and gas resources
Strong financial performance with NOPAT of RM 34.0 billion, 10% increase from FY 09/10
E&P business continues to deliver strong performance and is geared for growth
Page 15

Financial Highlights E&P business registered strong financial performance with increase in Revenue & NOPAT by 14% & 10% respectively
EXPLORATION & PRODUCTION BUSINESS
Q4 Key Financial Indicators FY
FY 09/10 FY 10/11 +/- RM billion FY 09/10 FY 10/11 +/-
22.6 27.2 20% Revenue 81.5 93.3 14%
5.6 10.4 86% NOPAT 30.8 34.0 10%
Revenue RM Bil
64.4 74.0
17.1 19.3
FY 09/10 FY 10/11
Malaysia International
81.5 93.3
NOPAT RM Bil
26.4 28.4
4.4 5.6
FY 09/10 FY 10/11
Malaysia International
30.8 34.0
Higher revenue and NOPAT for FY10/11 attributable to higher realised price for crude and condensate.
International operations account for 21% of total revenue.
Increase in NOPAT for both Malaysia and International operations by 8% and 27% respectively.
Page 16

Acquisition of blocks in Venezuela, Australia and Brunei
Divesting 3 International countries as part of portfolio high-grading
5 first production from Vietnam Pearl & Topaz, Sudan Teng Mish Mish, Muda Jeng-A and JDA MDD Project (MTJDA)
All 4 ventures in Iraq achieved Pre-Development Plan approval and on track to achieve FCP in 2012 and 2013
Addition of resources through discoveries in Uzbekistan, Sudan and Vietnam and IOR in Sudan
Operators Ventures Country
Africa Region 21 8
South East Asia 30 5
Central Asia 7 3
Middle East 6 3
Arctic 6 1
Others 5 3
75 23
EXPLORATION & PRODUCTION BUSINESS
Operational Highlights
International
Malaysia
11 new PSCs awarded
First Risk Service Contract (RSC) for Berantai field
New PITA tax incentives to drive exploration and development of challenging resources
3 first production from new fields
10 exploration discoveries
2 major enhance recovery projects sanctioned
3 pipeline replacements completed
Operators Total PSCs
PETRONAS Carigali 32
Shell 12
Murphy 6
ExxonMobil 5
Talisman 5
Newfield 4
Nippon 2
Lundin 4
BHP Biliton 2
Others 10
82
E&P business remains vibrant amidst challenging environment
Page 17

EXPLORATION & PRODUCTION BUSINESS Malaysia entitlement remains intact despite decrease in production, while International entitlement was affected by PSC effect of higher oil price
Production
1,631 1,614
637 518
FY 09/10 FY 10/11
Malaysia International
Higher Malaysia gas offtake from customer.
Crude natural depletion in Malaysia and Sudan.
Lower International gas from expiry of Iran service contract and reservoir performance in Egypt.
2,268 2,132
Total Production (kboe/d)
535 512
122 115
974 987
FY 09/10 FY 10/11
Crude Condensate Gas
1,631 1,614
Malaysia Production by Hydrocarbon Type (kboe/d)
239 225
26 27
272 266
100
FY 09/10 FY 10/11
Crude Condensate Gas Iran Gas
637
518
International Production by Hydrocarbon Type (kboe/d)
PETRONAS Share
1,112 1,112
PETRONAS Share
345 328
PETRONAS Share
1,457 1,440
Page 18 Note: kboe/d = kilo barrels of oil per day
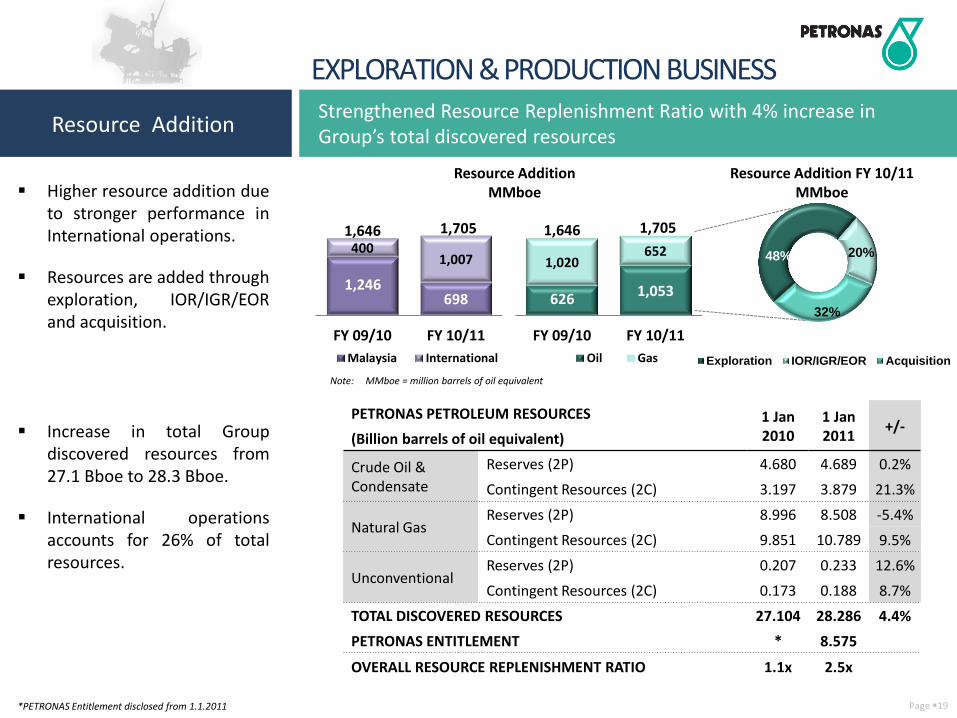
EXPLORATION & PRODUCTION BUSINESS Strengthened Resource Replenishment Ratio with 4% increase in Group’s total discovered resources
Resource Addition
48% 20%
32%
Exploration IOR/IGR/EOR Acquisition
1,246 698
400 1,007
FY 09/10 FY 10/11
Malaysia International
1,646 1,705
Resource Addition FY 10/11 MMboe
Resource Addition MMboe
626 1,053
1,020 652
FY 09/10 FY 10/11
Oil Gas
1,646 1,705
Higher resource addition due to stronger performance in International operations.
Resources are added through exploration, IOR/IGR/EOR and acquisition.
Increase in total Group discovered resources from 27.1 Bboe to 28.3 Bboe.
International operations accounts for 26% of total resources.
PETRONAS PETROLEUM RESOURCES 1 Jan 2010
1 Jan 2011
+/- (Billion barrels of oil equivalent)
Crude Oil & Condensate
Reserves (2P) 4.680 4.689 0.2%
Contingent Resources (2C) 3.197 3.879 21.3%
Natural Gas Reserves (2P) 8.996 8.508 -5.4%
Contingent Resources (2C) 9.851 10.789 9.5%
Unconventional Reserves (2P) 0.207 0.233 12.6%
Contingent Resources (2C) 0.173 0.188 8.7%
TOTAL DISCOVERED RESOURCES 27.104 28.286 4.4%
PETRONAS ENTITLEMENT * 8.575
OVERALL RESOURCE REPLENISHMENT RATIO 1.1x 2.5x
*PETRONAS Entitlement disclosed from 1.1.2011 Page 19
Note: MMboe = million barrels of oil equivalent
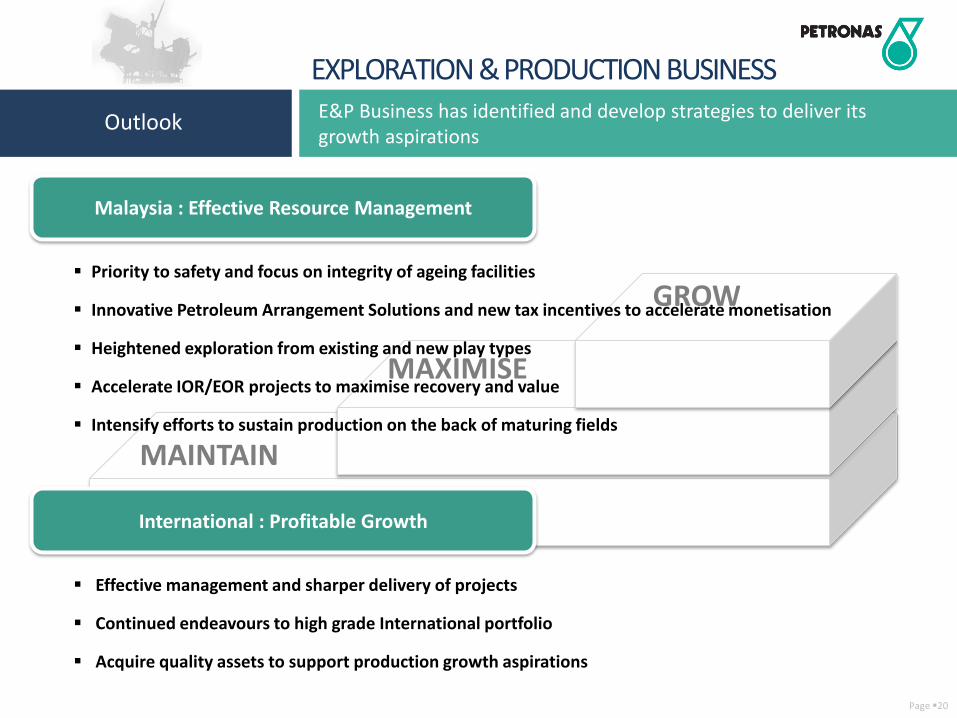
EXPLORATION & PRODUCTION BUSINESS
MAINTAIN
MAXIMISE
GROW
E&P Business has identified and develop strategies to deliver its growth aspirations
Outlook
Malaysia : Effective Resource Management
Priority to safety and focus on integrity of ageing facilities
Innovative Petroleum Arrangement Solutions and new tax incentives to accelerate monetisation
Heightened exploration from existing and new play types
Accelerate IOR/EOR projects to maximise recovery and value
Intensify efforts to sustain production on the back of maturing fields
Effective management and sharper delivery of projects
Continued endeavours to high grade International portfolio
Acquire quality assets to support production growth aspirations
International : Profitable Growth
Page 20
Gas & Power Business
Datuk Anuar Ahmad
Executive Vice President
Gas & Power

Key Messages Profitable year for G&P despite operational challenges
At RM11.2 billion, registered 26% increase in NOPAT compared to last financial year.
Faced continuing challenges to meet Peninsular Malaysia gas demand with tight gas supply from offshore Peninsular.
Going forward, initiatives are being undertaken to ensure security of gas supply for Malaysia.
Gas processing and transmission continue to be operating at world class standards.
At 24.34 million tonnes, PLC achieved highest LNG production level.
Page 13
GAS & POWER BUSINESS
Page 21

Financial Highlights Registered improved financial results in FY10/11
Q4 Key Financial Indicators FY
FY 09/10 FY 10/11 +/- RM billion FY 09/10 FY 10/11 +/-
16.8 17.9 6.5% Revenue 53.6 64.0 19.4%
3.2 1.0 -68.8% NOPAT 8.9 11.2 25.8%
GAS & POWER BUSINESS
Source : Japan Tariff Association, Platts & Bloomberg
FY10/11 FY 09/10
Infrastructure, Utilities & Power
Global LNG
Revenue
15.6
11.5
-4.4
-2.6
-10 -5 0 5 10 15 20
FY 10/11
FY 09/10
NOPAT
Global LNG Infrastructure, Utilities & Power
RM 8.9 billion
RM53.6 billion
37.6
16.0 17.1
RM64.0 billion
46.9
Revenue of RM64.0 billion was 19% higher than last year, on the back of higher LNG prices and volumes sold.
NOPAT for the year stood at RM11.2 billion, 26% higher than last year, in line with revenue growth.
RM 11.2 billion
Page 22
50
60
70
80
90
100
110
Q1FY09/10
Q2FY09/10
Q3FY09/10
Q4FY09/10
Q1FY10/11
Q2FY10/11
Q3FY10/11
Q4FY10/11
USD
/bb
l
JCC (USD/bbl)

Higher LNG volume sold on the back of 5% increased PLC production
PETRONAS LNG COMPLEX SALES FY 10/11
LNG volume brought to market (million tonnes)
Operational Highlights LNG
At 26.3 million tonnes, LNG sales for the year was higher compared to last year, driven by higher volumes from PETRONAS LNG Complex (PLC) in Bintulu.
PETRONAS LNG Ltd (PLL) continues to effectively play its role as system balancer by handling 0.8 million tonnes over and above its trading volume.
PLC achieved its highest LNG production volume for the year as a result of improved operational performance.
Exports of LNG from Bintulu were shipped mainly to Japan at 60%, South Korea at 18% and Taiwan at 13%.
60% 18%
13%
5% 4%
Japan S. Korea Taiwan China Others
GAS & POWER BUSINESS
22.8 23.9
FY 09/10 FY 10/11
PETRONAS LNG Complex Egyptian LNG Traded Volume
25.1
26.3
23.9 MT
0.4
0.4
2.0 1.9
Page 23
1,176 1,087
787 819
125 141
FY 09/10 FY 10/11
POWER NON-POWER EXPORTGPP = Gas Processing Plants , PGU = Peninsular Gas Utilisation
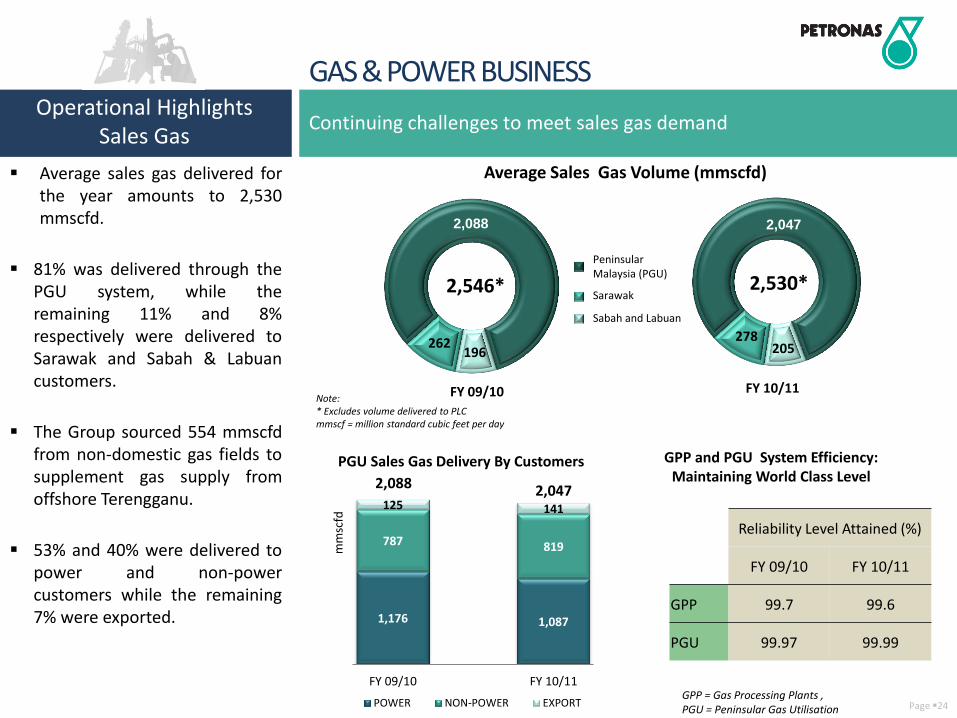
Average sales gas delivered for the year amounts to 2,530 mmscfd.
81% was delivered through the PGU system, while the remaining 11% and 8% respectively were delivered to Sarawak and Sabah & Labuan customers.
The Group sourced 554 mmscfd from non-domestic gas fields to supplement gas supply from offshore Terengganu.
53% and 40% were delivered to power and non-power customers while the remaining 7% were exported.
GPP and PGU System Efficiency: Maintaining World Class Level
PGU Sales Gas Delivery By Customers
Continuing challenges to meet sales gas demand
GAS & POWER BUSINESS Operational Highlights
Sales Gas
mm
scfd
2,088 2,047
2,088
FY 09/10
196 262
2,047
FY 10/11
205 278
Average Sales Gas Volume (mmscfd)
2,546* 2,530* Sarawak
Peninsular Malaysia (PGU)
Sabah and Labuan
Reliability Level Attained (%)
FY 09/10 FY 10/11
GPP 99.7 99.6
PGU 99.97 99.99
Note: * Excludes volume delivered to PLC mmscf = million standard cubic feet per day
Page 24

GAS & POWER BUSINESS Key Milestones &
Achievements In FY10/11 Gas & Power achieved numerous key milestones
March 2011 EPCC awarded for the Kimanis Power Plant (KPP) project
January 2011 Front End Engineering Design (FEED) contract signed for the Floating LNG (FLNG) project
January 2011 Achieved Final Investment Decision (FID) for the Gladstone LNG (GLNG) Project
January 2011 EPCIC awarded for the first Re-gasification Terminal (RGT) in Peninsular
November 2010 EPCC awarded for the Plant Rejuvenation & Revamp 2 (PRR2) project in PGB
Page 25

GAS & POWER BUSINESS
Moving Forward
Secure and maximise value of gas within Malaysia
Strengthen and grow LNG position in Asia Pacific and Atlantic
Establish and grow energy trading in Europe
Grow power and renewable business
Aim to deliver PETRONAS’ long term sustainable growth …
Page 26

Downstream Business Datuk Wan Zulkiflee Wan Ariffin
Executive Vice President
Downstream

External Environment High price environment amidst global economic recovery
DOWNSTREAM BUSINESS
Global economic growth in FY10/11 generally contributed by improved demand mainly from the emerging economies.
Crude and petroleum products prices moved in tandem with the improved market conditions and trended sharply upwards mainly due to the weaker US Dollar and geopolitical tensions in the Middle East and North Africa during the second half of the financial year.
Petrochemical prices were also higher attributable to the strong demand for major products.
60
70
80
90
100
110
120
130
Jan - Mar2010
Apr - June2010
Jul - Sep2010
Oct - Dec2010
Jan - Mar2011
Gasoil ULG95Brent Tapis OSP
Crude & Petroleum Product Prices
USD
/Bb
l
Source : Platts Note: Product prices Mean of Platts Singapore
(MOPS) , Official Selling Price (OSP)
- 100 200 300 400 500
Oct - Dec2009
Jan - Mar2010
Apr - June2010
Jul - Sep2010
Oct - Dec2010
Jan - Mar2011
Methanol IPEX
Urea
Petrochemical Prices
600 800
1,000 1,200 1,400 1,600 1,800
Ethylene PP
Source : ICIS, CMAI
USD
/mt
-10
10
30
50
70
90
110
130
150
-8
-6
-4
-2
0
2
4
6
8
Q42007
Q12008
Q22008
Q32008
Q42009
Q12009
Q22009
Q32009
Q42010
Q12010
Q22010
Q32010
Q42011
World oil demand growth (LHS) World GDP growth (LHS) Brent (RHS)
Source: CIRU, MF, IHS CERA, Bloomberg
USD/ barrel % y-o-y World GDP growth, world oil demand and Brent prices
Page 28

DOWNSTREAM BUSINESS Sustaining refinery operational excellence whilst optimising production economics
Refining
Malaysian refineries achieved higher utilisation rate y-o-y contributed by higher volumes post Malaysian Refining Company’s revamp and capacity expansion.
The Durban refinery recorded lower utilisation rate due to prolonged scheduled shutdown.
Total refineries utilisation rate is at par with the average global refinery utilisation rate, while Malaysian refineries trended higher at 91%.
97 97
86 91
92 86 81 82
FY 07/08 FY 08/09 FY 09/10 FY 10/11
Malaysian Refineries Total Refineries Average Global
Refinery Utilisation (%)
104.0
34.1
107.6
26.8
Malaysian Refineries Overseas Refinery
FY 09/10 FY 10/11
Crude Refining Volume (million bbl)
Source : BP Statistical Review of World Energy 2010, IHS CERA Note: FY07/08 is based on average Global Utilisation rate from year 2000 until 2007
Page 29

Sales volume grew 6% y-o-y in tandem with the economic recovery.
Volume growth was in all segments with 42% coming from Retail, represented by the global service stations network.
Increased number of service stations contributed mainly by Engen’s acquisition of Chevron’s assets in 7 Sub-Saharan African countries whilst in Malaysia, the network expanded by 30 stations to keep pace with competition.
Downstream Marketing Strengthening market leadership in selected markets
163.5
69.4 48.1 46.0
175.9
72.9 48.9 54.1
Total Retail Commercial Others
FY 09/10 FY 10/11
Sales Volume by Segment (million bbl)
Note : ‘Others’ includes Lubricants, Aviation & LPG segments
50.4
49.6
Sales Volume by Geography (%)
Malaysia
International
FY10/11
DOWNSTREAM BUSINESS
Global Retail Presence by Region – Number of Service Stations
FY09/10 FY10/11 +/-
Malaysia 925 955 30
International 1,684 1,775 91
Global Retail Presence 2,609 2,730 121
Page 30

DOWNSTREAM BUSINESS
Delivered higher sales volume despite lower utilisation rate Petrochemicals
Overall, plant utilisation rate for the year was slightly lower mainly due to shutdowns of some plants.
However, higher sales volume was achieved for the year mainly due to additional volume from newly acquired subsidiaries, Optimal Glycols (Malaysia) Sdn Bhd, Optimal Chemicals (Malaysia) Sdn Bhd and Polyethylene (Malaysia) Sdn Bhd.
1.7
6.2
1.8
6.7
Q4 Q4 YTD
FY 09/10 FY 10/11
Total Sales Volume (million tonnes)
82.5 81.0
Nexant
Utilisation Rate (%)
FY 09/10 FY 10/11
Note : Based on Nexant
Page 31

Petrochemical 9%
Refining & Trading
56%
Downstream Marketing
35%
Revenue contribution by Business Segment – FY10/11
Petrochemical 40%
Refining & Trading
39%
Downstream Marketing
21%
NOPAT contribution by Business Segment – FY10/11
Key Financial Highlights Full year profits increased by 50% reflecting strong results across all business segments
DOWNSTREAM BUSINESS
Q4 Key Financial Indicators FY
FY 09/10 FY 10/11 +/- RM billion FY 09/10 FY 10/11 +/-
31.7 34.6 9.1% Revenue 115.4 130.0 12.7%
1.2 2.1 75.0% NOPAT 4.8 7.2 50.0%
Revenue rose by 13% y-o-y driven by higher crude and product prices coupled with higher petroleum products sales volume.
NOPAT improved by 50% y-o-y due to better margins realised.
Refining and Trading segment contributed approximately 56% of the Downstream revenue whilst Petrochemical Business contributed about 40% of the total Downstream NOPAT.
Page 32

Strategic Initiatives achieved in FY 2010/11
DOWNSTREAM BUSINESS
Collaboration with BASF to study expansion into high value specialty chemicals (MOU signed December 2010)
Strengthened downstream marketing presence in selected markets:
Acquired Chevron’s retail assets in 7 sub-Sahara African countries and Shangdong St. Maria Lubricating Oil Company Limited in China
Growing lubricant volumes through service fill lubricant supply to Mercedes OEM and strengthening the brand via development of Fluid Technology Solution™ (FTS) for Mercedes GP team in Formula 1
Positioning Downstream Business to deliver higher sustainable value
Listed PETRONAS Chemicals Group Berhad (PCGB)
Restructured global marketing and trading of crude oil and petroleum products under a single entity
Enhanced risk management system on trading
Business Enhancement
Growth
Page 33

DOWNSTREAM BUSINESS
Project RAPID in Johor
Fertilizer Plant in Sabah Growing lubricant business
Ensuring safe and reliable operations
Sustaining operational excellence, benchmarked to
world-class standards Active Portfolio Management
Business Enhancement
Growth
Downstream Business focus will be on… Moving Forward
Page 34

Summary In conclusion…
The high price environment contributed favourably to Downstream Business
Utilisation rates for the refineries and petrochemical plants can be further improved
Downstream registered a commendable 50% increase in NOPAT y-o-y
Strategically grew marketing volumes in selected markets globally
Safety continues to be our top priority
DOWNSTREAM BUSINESS
Page 35

Industry Overview
PETRONAS GROUP Financial Results Announcement
Q&A
Industry Overview
PETRONAS GROUP Financial Results Announcement
Thank You
Related Documents