Welcome message from author
This document is posted to help you gain knowledge. Please leave a comment to let me know what you think about it! Share it to your friends and learn new things together.
Transcript

2
Page
Persistent
Systems
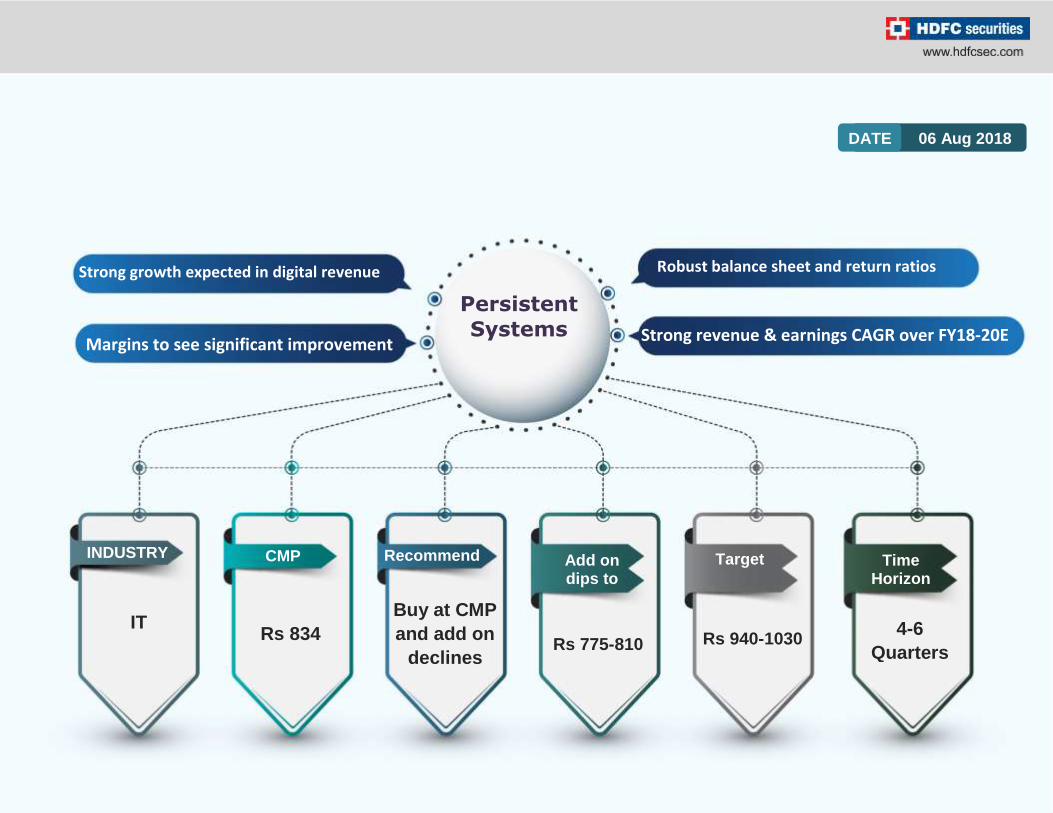
INDUSTRY CMP Recommend Add on dips to
Target Time Horizon
DATE 06 Aug 2018
IT
Rs 834
Buy at CMP
and add on
declines Rs 775-810 Rs 940-1030
4-6
Quarters
Robust balance sheet and return ratios Strong growth expected in digital revenue
Margins to see significant improvement
Strong revenue & earnings CAGR over FY18-20E
3
Page
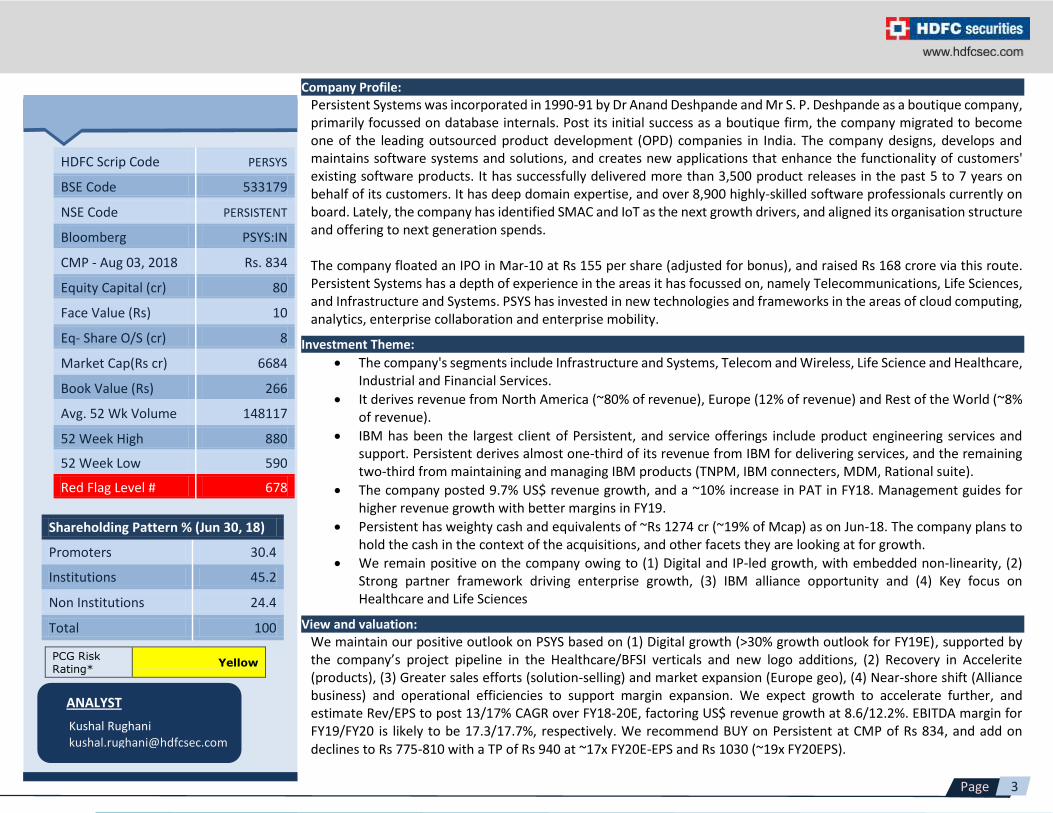
HDFC Scrip Code PERSYS
BSE Code 533179
NSE Code PERSISTENT
Bloomberg PSYS:IN
CMP - Aug 03, 2018 Rs. 834
Equity Capital (cr) 80
Face Value (Rs) 10
Eq- Share O/S (cr) 8
Market Cap(Rs cr) 6684
Book Value (Rs) 266
Avg. 52 Wk Volume 148117
52 Week High 880
52 Week Low 590
Red Flag Level # 678
Shareholding Pattern % (Jun 30, 18)
Promoters 30.4
Institutions 45.2
Non Institutions 24.4
Total 100
PCG Risk Rating*
Yellow
ANALYST
Kushal Rughani [email protected]
Company Profile:
Persistent Systems was incorporated in 1990-91 by Dr Anand Deshpande and Mr S. P. Deshpande as a boutique company, primarily focussed on database internals. Post its initial success as a boutique firm, the company migrated to become one of the leading outsourced product development (OPD) companies in India. The company designs, develops and maintains software systems and solutions, and creates new applications that enhance the functionality of customers' existing software products. It has successfully delivered more than 3,500 product releases in the past 5 to 7 years on behalf of its customers. It has deep domain expertise, and over 8,900 highly-skilled software professionals currently on board. Lately, the company has identified SMAC and IoT as the next growth drivers, and aligned its organisation structure and offering to next generation spends. The company floated an IPO in Mar-10 at Rs 155 per share (adjusted for bonus), and raised Rs 168 crore via this route. Persistent Systems has a depth of experience in the areas it has focussed on, namely Telecommunications, Life Sciences, and Infrastructure and Systems. PSYS has invested in new technologies and frameworks in the areas of cloud computing, analytics, enterprise collaboration and enterprise mobility.
Investment Theme:
The company's segments include Infrastructure and Systems, Telecom and Wireless, Life Science and Healthcare, Industrial and Financial Services.
It derives revenue from North America (~80% of revenue), Europe (12% of revenue) and Rest of the World (~8% of revenue).
IBM has been the largest client of Persistent, and service offerings include product engineering services and support. Persistent derives almost one-third of its revenue from IBM for delivering services, and the remaining two-third from maintaining and managing IBM products (TNPM, IBM connecters, MDM, Rational suite).
The company posted 9.7% US$ revenue growth, and a ~10% increase in PAT in FY18. Management guides for higher revenue growth with better margins in FY19.
Persistent has weighty cash and equivalents of ~Rs 1274 cr (~19% of Mcap) as on Jun-18. The company plans to hold the cash in the context of the acquisitions, and other facets they are looking at for growth.
We remain positive on the company owing to (1) Digital and IP-led growth, with embedded non-linearity, (2) Strong partner framework driving enterprise growth, (3) IBM alliance opportunity and (4) Key focus on Healthcare and Life Sciences
View and valuation:
We maintain our positive outlook on PSYS based on (1) Digital growth (>30% growth outlook for FY19E), supported by the company’s project pipeline in the Healthcare/BFSI verticals and new logo additions, (2) Recovery in Accelerite (products), (3) Greater sales efforts (solution-selling) and market expansion (Europe geo), (4) Near-shore shift (Alliance business) and operational efficiencies to support margin expansion. We expect growth to accelerate further, and estimate Rev/EPS to post 13/17% CAGR over FY18-20E, factoring US$ revenue growth at 8.6/12.2%. EBITDA margin for FY19/FY20 is likely to be 17.3/17.7%, respectively. We recommend BUY on Persistent at CMP of Rs 834, and add on declines to Rs 775-810 with a TP of Rs 940 at ~17x FY20E-EPS and Rs 1030 (~19x FY20EPS).
4
Page
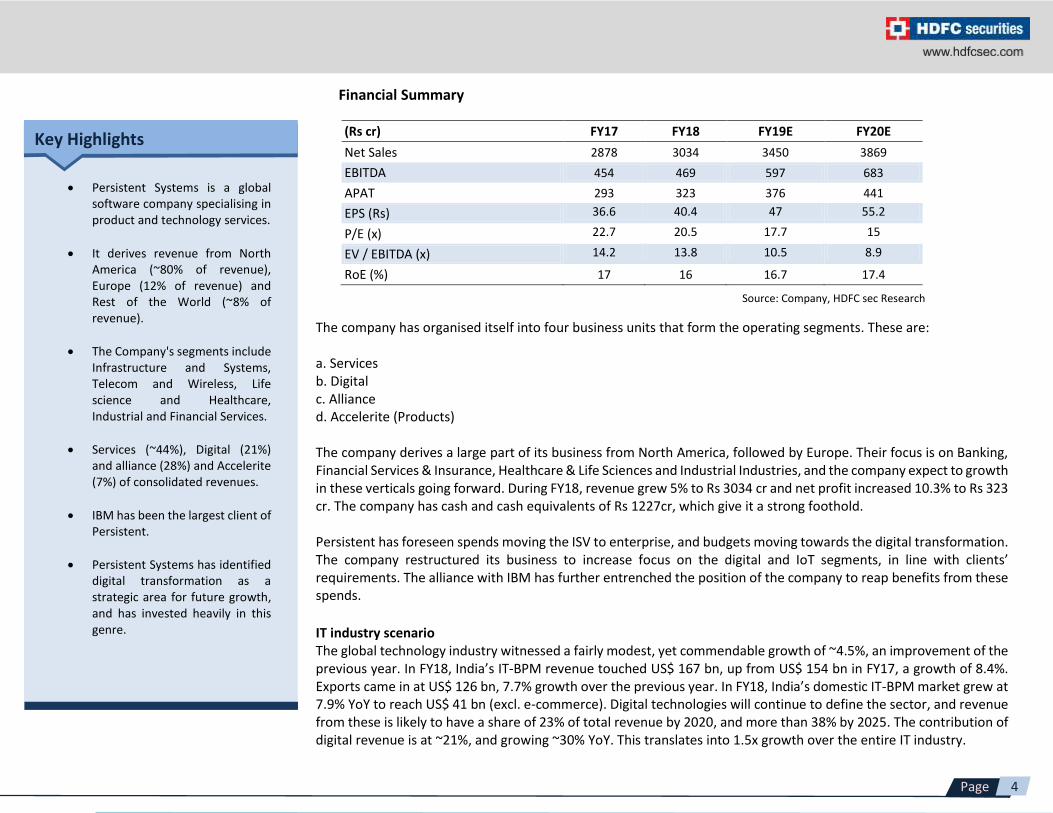
Financial Summary
(Rs cr) FY17 FY18 FY19E FY20E
Net Sales 2878 3034 3450 3869
EBITDA 454 469 597 683
APAT 293 323 376 441
EPS (Rs) 36.6 40.4 47 55.2
P/E (x) 22.7 20.5 17.7 15
EV / EBITDA (x) 14.2 13.8 10.5 8.9
RoE (%) 17 16 16.7 17.4
Key Highlights
Persistent Systems is a global software company specialising in product and technology services.
It derives revenue from North America (~80% of revenue), Europe (12% of revenue) and Rest of the World (~8% of revenue).
The Company's segments include Infrastructure and Systems, Telecom and Wireless, Life science and Healthcare, Industrial and Financial Services.
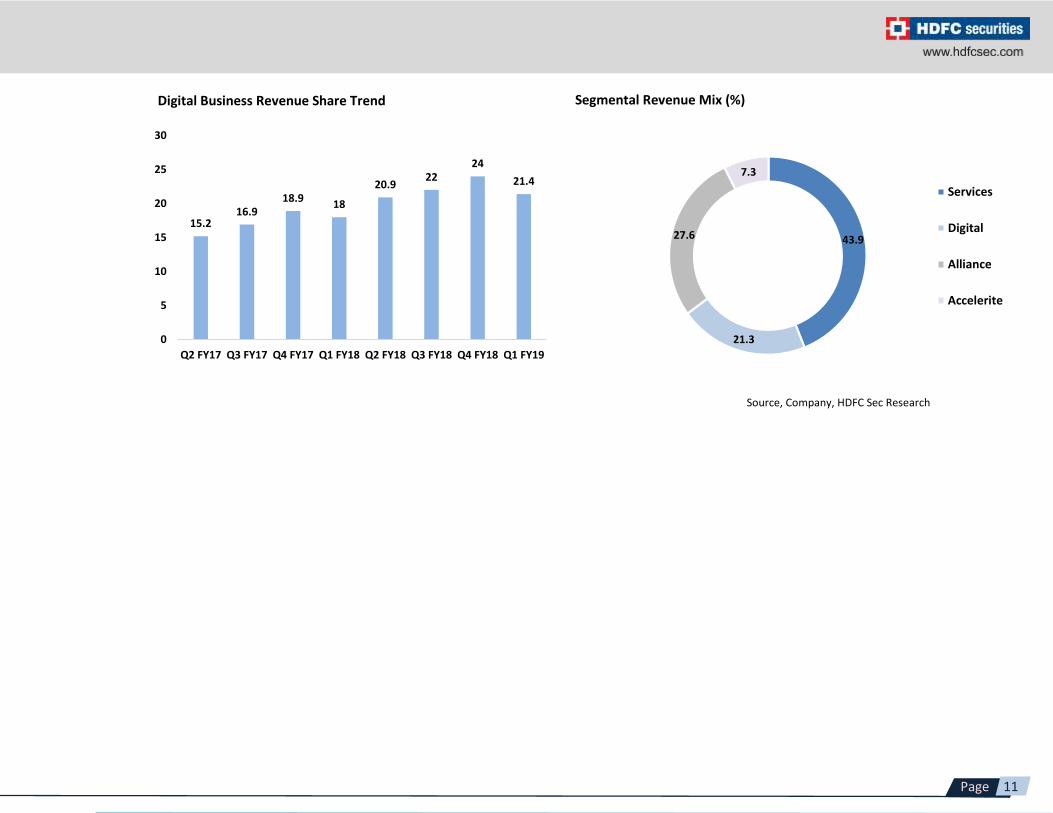
Services (~44%), Digital (21%) and alliance (28%) and Accelerite (7%) of consolidated revenues.
IBM has been the largest client of Persistent.
Persistent Systems has identified digital transformation as a strategic area for future growth, and has invested heavily in this genre.
Source: Company, HDFC sec Research
The company has organised itself into four business units that form the operating segments. These are: a. Services b. Digital c. Alliance d. Accelerite (Products) The company derives a large part of its business from North America, followed by Europe. Their focus is on Banking, Financial Services & Insurance, Healthcare & Life Sciences and Industrial Industries, and the company expect to growth in these verticals going forward. During FY18, revenue grew 5% to Rs 3034 cr and net profit increased 10.3% to Rs 323 cr. The company has cash and cash equivalents of Rs 1227cr, which give it a strong foothold. Persistent has foreseen spends moving the ISV to enterprise, and budgets moving towards the digital transformation. The company restructured its business to increase focus on the digital and IoT segments, in line with clients’ requirements. The alliance with IBM has further entrenched the position of the company to reap benefits from these spends.
IT industry scenario The global technology industry witnessed a fairly modest, yet commendable growth of ~4.5%, an improvement of the previous year. In FY18, India’s IT-BPM revenue touched US$ 167 bn, up from US$ 154 bn in FY17, a growth of 8.4%. Exports came in at US$ 126 bn, 7.7% growth over the previous year. In FY18, India’s domestic IT-BPM market grew at 7.9% YoY to reach US$ 41 bn (excl. e-commerce). Digital technologies will continue to define the sector, and revenue from these is likely to have a share of 23% of total revenue by 2020, and more than 38% by 2025. The contribution of digital revenue is at ~21%, and growing ~30% YoY. This translates into 1.5x growth over the entire IT industry.
5
Page
The last two years have been very exciting in terms of technological changes. The Indian IT-BPM industry is facing some challenges in terms of methods to tackle political changes, be it increased protectionism across the globe that has resulted in the tightening of the labour market or difficulty in procuring visas. Owing to this, there is a slowdown in decision making and investment. On the technology front, IoT and AI/ML are becoming mainstream globally. The industry has to take note of this, and provide valuable services in these areas. Blockchain is also an exciting technology, and its implication can be huge if it is realised to its full potential. However, India continues to be the world’s top outsourcing destination owing to its unique value proposition. Indian service providers have significant opportunity, as digital technologies continue to be embedded in an ever-widening range of products and services. The market is well set to reach US$ 200-225 bn by 2020, and US$ 350-400 bn by 2025. At the same time, challenges around economic volatility, protectionism, competition, labour mobility and inertia will be major factors to be tackled by the concerned stakeholders. The Digital business, Blockchain, Internet of Things (IoT), and AI/ML projects will be key growth drivers going forward. To channelise investments better, the company has decided to broadly focus on the following technology areas: 1. Cloud Computing: Cloud Computing technology has become mainstream, and Persistent is working with other companies that are building cloud infrastructure. PSYS is also investing in building tools and services to provide turnkey solutions to customers to move and operate systems in the cloud. 2. Data, Artificial Intelligence and Machine Learning: With a deep understanding of data, the company continues to lead the way in building new AI and ML-based solutions for its customers. 3. Identity Management and Security: In a world where every action of a user is being tracked by different systems and applications, the security of personal data is most critical for every enterprise and user. The company continues to make its customers’ applications secure with its in-depth expertise of various identity management platforms from partners, and its products like Neuro and Sentient. 4. Internet of Things (IoT): The connectivity of systems has grown exponentially, and people are looking beyond just the need to monitor and manage devices remotely. They are now looking at innovative ways to monetise these connected devices. The company, along with its partners, continues to innovate in this space and help its customers as they foray into the world of devices. Industry specialisation PSYS is focussing on the markets of three industries: Financial Services, Healthcare & Life Sciences and Industrial IoT. This, along with Software 4.0, the methodology for building next-generation software which brings together the tools, techniques and processes to build a software-driven business, places the company on a robust platform for future growth. Financial services The financial services industry has been a front-runner when it comes to technology adoption. From automation and electronic user devices such as ATMs to online banking and electronic payments, this sector has stayed ahead of the digital curve. As the world moves towards increasing digitalisation, the increased convenience and interconnectivity between devices, systems and platforms is empowering the world of finance to a level of sophistication that it has never witnessed before.
6
Page
PSYS is leveraging technical expertise and experience to help customers move to the real-time service level. The company has built multiple solutions and accelerators that are not only helping to satisfy existing customers in the financial services space, but also acquire new customers and penetrate more markets. The company has invested early in Blockchain technology. This gives it the leverage vis-à-vis some competitors to push its products to existing and prospective clients. Healthcare & Life Sciences: As with many other industries, the Healthcare industry is also going through major disruptions. Most organisations are now looking to partner with technology firms to help accelerate the transformation journey. Company is also focusing on the same to reap benefits in the coming years. Industrial IoT: The advent of the Industrial Internet of Things (IIoT) is dubbed as the fourth industrial revolution. The IIoT revolution is enabled by the advances in electronic hardware, network connectivity, data storage, analytics and cloud infrastructure. Less expensive and more powerful hardware is empowering smart sensors, wireless network and gateways. The company believes that the core capabilities of M2M communication, video surveillance and real-time analytics are key building blocks of Industrial IoT. Using these, it has built systems for applications such as robot failure detection, smart meter analytics security automation, oilfield data monitoring, instrument calibration and remote shop floor monitoring. Persistent’s smart city solutions leverage IBM Watson IoT to ingest a vast amount of sensor data, crowd sourced data, enterprise data and third party city-centric data. This simplifies and improves citizen experience, promotes local business, simplifies the delivery of city utilities or services, and implements ideas of new governance. Financial highlights for FY18 PSYS had a strong year, with revenue registering a growth of 9.7% in Dollar terms and 5.4% in INR. The revenue for the year was Rs 3,033.7 cr (US$ 470.5 mn) as compared to Rs 2,878.4 cr (US$ 429 mn) for the previous year. While services revenue grew 13.3%, IP-led revenue posted a marginal rise. The lower-than-expected growth in IP-led revenue was primarily on account of a decline of IP led revenue in the Alliance segment during the last quarter of the year, and the discontinuation of two products within the Accelerite portfolio. PSYS acquired PARX, a Salesforce-certified Platinum Partner in Aug-17 in order to strengthen its European portfolio. This helped the company to increase the share of revenue from Europe to 7.5% from 5.5% in the previous year. The Enterprise customers saw a significant growth of 32.8%. The share of revenue from Enterprise customers now stands at 34.5% as compared to 28.5% in the previous year. In spite of unfavourable foreign exchange conditions, strong operating efficiencies, enabled PSYS to show marginal growth in its operating profit. EBITDA was at Rs 468.7 cr as compared to Rs 453.9 cr in FY17, registering an increase of 3.3%. Operating margin came in at 15.4% for FY18 as compared to 15.8% in FY17.
7
Page
PAT increased 10.3% to Rs 323 cr for the year. Outstanding hedges at the end of FY18 stood at US$ 103 mn, at an average rate of Rs 66.95 per US$. Cash and equivalents increased to 1,227 cr from Rs 941 cr at the end of the previous year. The company is focussing on optimising costs and focussing on improving productivity-per-salesperson. Initiatives towards increasing the pipeline and conversion rate including new products will help it realise return on investments made over the last two years. Key Highlights for the quarter (Q1FY19) Persistent Systems (PSYS) posted strong revenue growth (Alliance business-led comprising 32.1% of revenue), and in-line operating performance. Revenue came in at US$ 123.6 mn, 5.7/9.4% qoq/yoy led by sharp growth in the Alliance business. Digital (21.4% of rev) declined (impacted by a delay in new projects), but a sharp recovery is expected going ahead. EBITDA margin saw a 203 bps jump to 16.8%, supported by gross margin expansion of 95bps qoq and G&A leverage of 110bps qoq. The company posted APAT of Rs 87cr, +16.3% YoY.
On account of a realignment of businesses across verticals, the QoQ differences is not directly comparable. The Alliance business posted a robust growth of 39.6% qoq. Services, Digital & Accelerite businesses declined 3.6%, 5.8% and 14.8% qoq, respectively. A strong pipeline and re-organisation of sales is expected to drive growth in the Accelerite business. Net employees’ count fell by 74, resulting in a total of 8,902 employees. Total cash and investments as on Jun-18 stood at Rs 1274 cr. Venturing out to new geographies Currently, the company derives ~80% of its revenue from North America, and ~12% from Europe as of end-Q1FY19. Persistent is expending its business in Europe, as is evident from the acquisition of PARX, a Salesforce Certified Platinum Partner in the DACH market of Germany, Austria, and Switzerland. The management wishes to reduce the company’s dependence on a particular geographic region, and have a diversified global portfolio. North America and Europe make up for ~92% of the revenue, which leaves immense potential for growth for the company to expand into newer geographies in the future. PSYS has development centres in Mexico and Israel, apart from various locations in the US. Growth stemming from strong alliances PSYS has alliances and tie-ups with various companies in the industries where they look to deliver complete solutions to the client by combining the expertise and recognising the synergies between the two companies. By partnering with various platform providers, PSYS sells and distributes the partner’s products to its own customers. For example, PSYS has partnered with Appian to design and deploy enterprise-grade process automation experience at speed, leveraging existing investments in IT, and bringing in the best-of-breed solutions in security, AI/ML, chatbots, and cloud-based data integration to the enterprise. They have another such alliance with IBM, where they work with customers to optimise the power of IBM’s AI and Cognitive, Cloud, Continuous Engineering and IoT expertise for their software-driven transformations, and help exploit the full potential of their investment in IBM products and solutions. In Q1FY19, the Alliance business comprised 32.1% of the total revenue, up 32% qoq. This shows tremendous growth potential and stability of earnings owing to the large portfolio in this segment.
8
Page
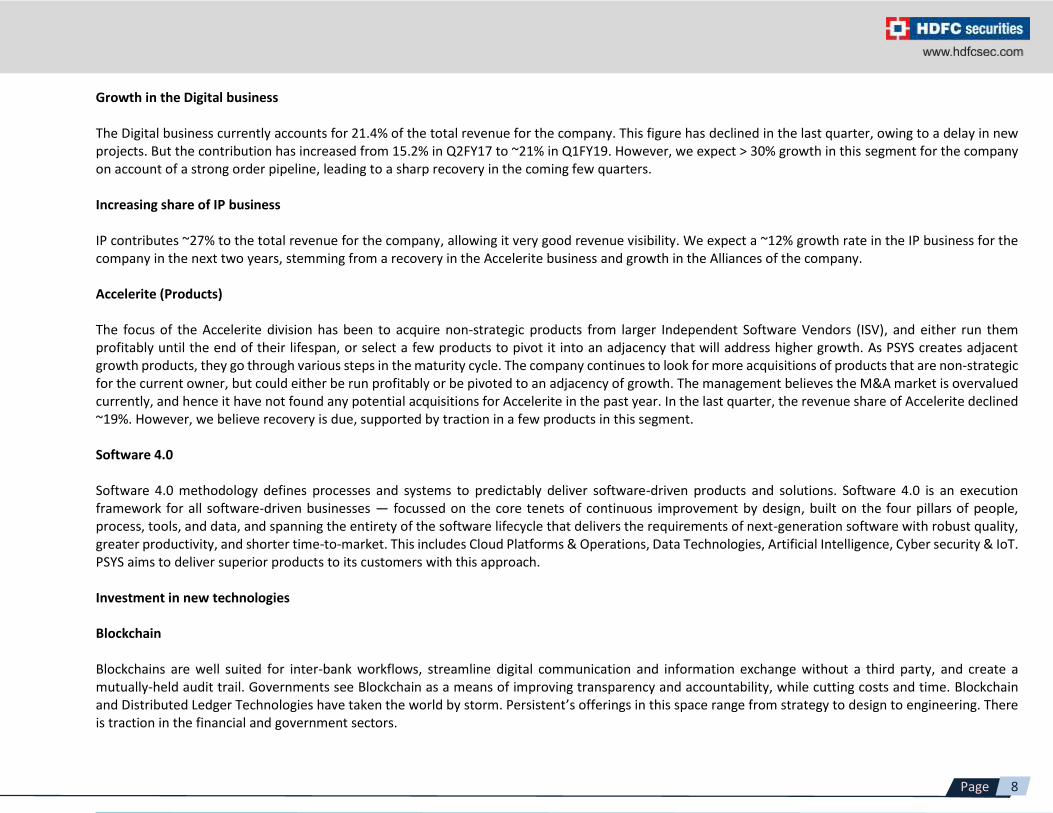
Growth in the Digital business The Digital business currently accounts for 21.4% of the total revenue for the company. This figure has declined in the last quarter, owing to a delay in new projects. But the contribution has increased from 15.2% in Q2FY17 to ~21% in Q1FY19. However, we expect > 30% growth in this segment for the company on account of a strong order pipeline, leading to a sharp recovery in the coming few quarters. Increasing share of IP business IP contributes ~27% to the total revenue for the company, allowing it very good revenue visibility. We expect a ~12% growth rate in the IP business for the company in the next two years, stemming from a recovery in the Accelerite business and growth in the Alliances of the company. Accelerite (Products) The focus of the Accelerite division has been to acquire non-strategic products from larger Independent Software Vendors (ISV), and either run them profitably until the end of their lifespan, or select a few products to pivot it into an adjacency that will address higher growth. As PSYS creates adjacent growth products, they go through various steps in the maturity cycle. The company continues to look for more acquisitions of products that are non-strategic for the current owner, but could either be run profitably or be pivoted to an adjacency of growth. The management believes the M&A market is overvalued currently, and hence it have not found any potential acquisitions for Accelerite in the past year. In the last quarter, the revenue share of Accelerite declined ~19%. However, we believe recovery is due, supported by traction in a few products in this segment. Software 4.0 Software 4.0 methodology defines processes and systems to predictably deliver software-driven products and solutions. Software 4.0 is an execution framework for all software-driven businesses — focussed on the core tenets of continuous improvement by design, built on the four pillars of people, process, tools, and data, and spanning the entirety of the software lifecycle that delivers the requirements of next-generation software with robust quality, greater productivity, and shorter time-to-market. This includes Cloud Platforms & Operations, Data Technologies, Artificial Intelligence, Cyber security & IoT. PSYS aims to deliver superior products to its customers with this approach. Investment in new technologies Blockchain Blockchains are well suited for inter-bank workflows, streamline digital communication and information exchange without a third party, and create a mutually-held audit trail. Governments see Blockchain as a means of improving transparency and accountability, while cutting costs and time. Blockchain and Distributed Ledger Technologies have taken the world by storm. Persistent’s offerings in this space range from strategy to design to engineering. There is traction in the financial and government sectors.
9
Page
Multiomics Multiomics is believed to deliver precision medicine. These studies require processing exabytes of data, and are pushing the limits of compute and data-processing capabilities. Persistent has extensive expertise in big data analytics and management, and works with companies across the life sciences industry. PSYS is collaborating with universities and research laboratories to build tools and software to analyse the extensive amount of data being generated. We believe investment in these technologies by the management would pay off in the years to come. This also shows the constant R&D taking place in the company, giving them an edge over competitors that will drive future growth. Valuations
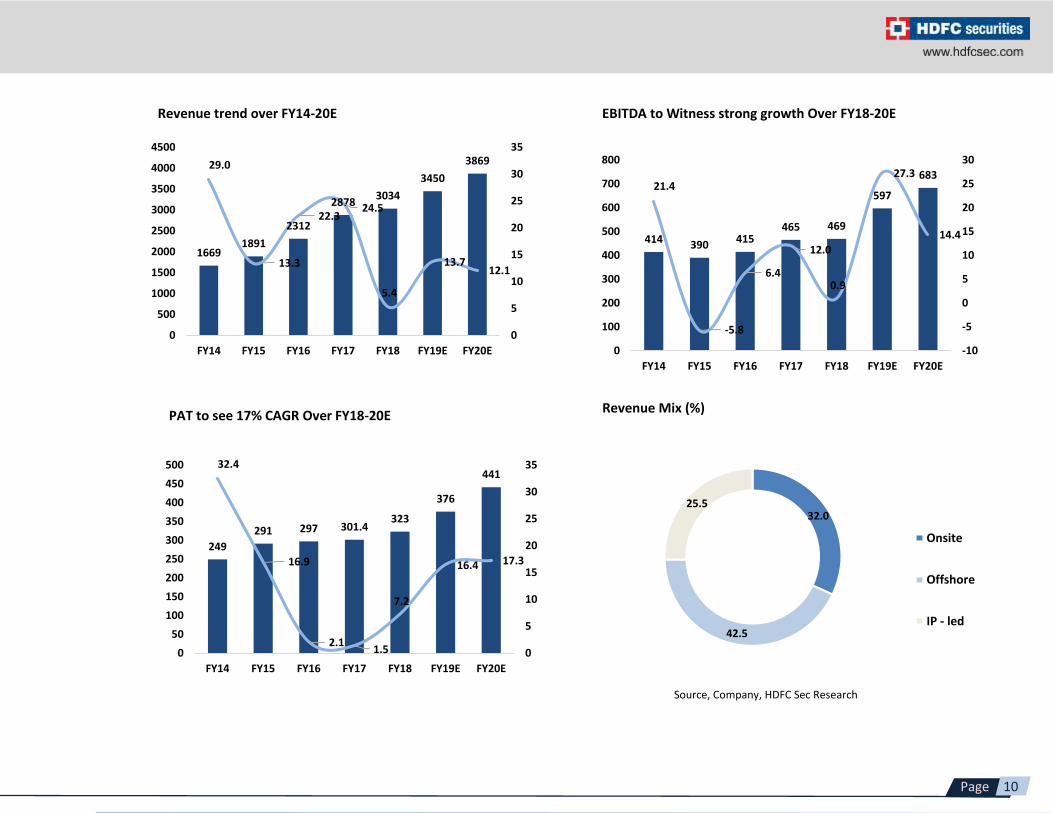
Persistent’s profile will continue to exhibit volatility based on its high non-linear model and business seasonality (stronger 1Q-3Q). We maintain our positive outlook on PSYS based on (1) Digital growth (>30% growth outlook for FY19E), supported by a project pipeline in the Healthcare/BFSI verticals and new logo additions, (2) Recovery in Accelerite, supported by traction in ‘ShareInsights’, ‘Neuro’ and ‘Sentient’ IPs, (3) Greater sales efforts (solution-selling) and market expansion (Europe geo), (4) Near-shore shift (Alliance business) and operational efficiencies to support margin expansion, and (5) Attractive valuations (relative to midcap peers). The company posted 9.7% revenue growth in US$ terms, and ~10% increase in PAT for FY18. We expect growth to accelerate further, and estimate Rev/EPS at 10/17% CAGR over FY18-20E, factoring US$ rev growth at 8.6/12.2%. EBITDA margin for FY19/FY20 is likely to come in at 17.3/17.7%, respectively. We recommend BUY on Persistent at CMP of Rs 834, and add on declines to Rs 775-810 with TP of Rs 940, at ~17x FY20E-EPS and Rs 1030 (~19x FY20EPS).
Key risks: Changing technology In the last few years, there has been a significant change in the way people are using technology and building software. Cloud-based platforms are providing better abstractions for software development, and this has resulted in reducing the effort required to build software. With improved productivity in software development, customers are building software faster with smaller teams and lower costs. High sensitivity to foreign currency The company derives most of its revenue in foreign currency, while a major part of its expenses is incurred in INR. This exposes the company to the risk of fluctuations in foreign currency rates. Data Privacy & Information Security This is a big risk for the company in the light of recent allegations on some big organisations. Since PSYS handles lots of data, the company will always be prone to a breach in security.
10
Page
414 390 415465 469
597
68321.4
-5.8
6.4
12.0
0.9
27.3
14.4
-10
-5
0
5
10
15
20
25
30
0
100
200
300
400
500
600
700
800
FY14 FY15 FY16 FY17 FY18 FY19E FY20E
16691891
2312
28783034
3450
386929.0
13.3
22.324.5
5.4
13.712.1
0
5
10
15
20
25
30
35
0
500
1000
1500
2000
2500
3000
3500
4000
4500
FY14 FY15 FY16 FY17 FY18 FY19E FY20E
29
1628
27
North
East
West
South
29
32
26
22 21 23
3331
22 21 2224
0
5
10
15
20
25
30
35
40
FY15 FY16 FY17 FY18 FY19E FY20E
Revenue trend over FY14-20E EBITDA to Witness strong growth Over FY18-20E
32.0
42.5
25.5
Onsite
Offshore
IP - led
249
291 297 301.4323
376
44132.4
16.9
2.11.5
7.2
16.4 17.3
0
5
10
15
20
25
30
35
0
50
100
150
200
250
300
350
400
450
500
FY14 FY15 FY16 FY17 FY18 FY19E FY20E
PAT to see 17% CAGR Over FY18-20E Revenue Mix (%)
Source, Company, HDFC Sec Research
11
Page
43.9
21.3
27.6
7.3
Services
Digital
Alliance
Accelerite
15.216.9
18.918
20.922
24
21.4
0
5
10
15
20
25
30
Q2 FY17 Q3 FY17 Q4 FY17 Q1 FY18 Q2 FY18 Q3 FY18 Q4 FY18 Q1 FY19
Digital Business Revenue Share Trend Segmental Revenue Mix (%)
Source, Company, HDFC Sec Research
12
Page
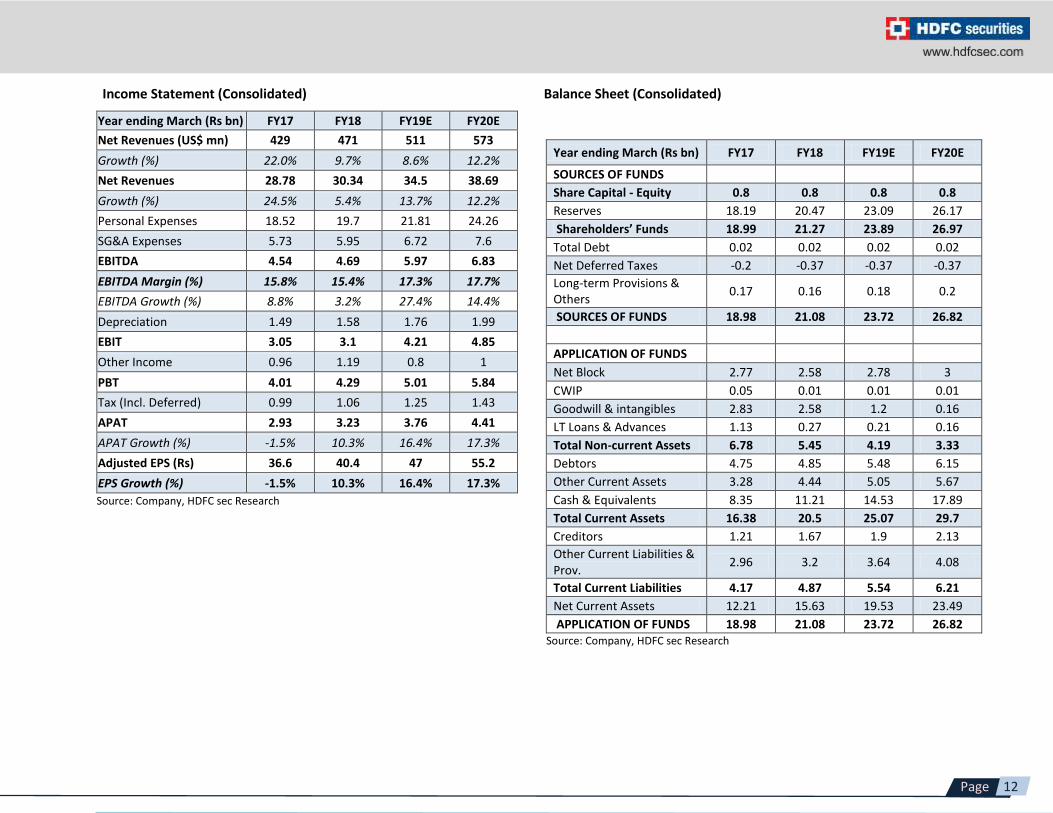
Income Statement (Consolidated) Balance Sheet (Consolidated)
Year ending March (Rs bn) FY17 FY18 FY19E FY20E
SOURCES OF FUNDS
Share Capital - Equity 0.8 0.8 0.8 0.8
Reserves 18.19 20.47 23.09 26.17
Shareholders’ Funds 18.99 21.27 23.89 26.97
Total Debt 0.02 0.02 0.02 0.02
Net Deferred Taxes -0.2 -0.37 -0.37 -0.37
Long-term Provisions & Others
0.17 0.16 0.18 0.2
SOURCES OF FUNDS 18.98 21.08 23.72 26.82
APPLICATION OF FUNDS
Net Block 2.77 2.58 2.78 3
CWIP 0.05 0.01 0.01 0.01
Goodwill & intangibles 2.83 2.58 1.2 0.16
LT Loans & Advances 1.13 0.27 0.21 0.16
Total Non-current Assets 6.78 5.45 4.19 3.33
Debtors 4.75 4.85 5.48 6.15
Other Current Assets 3.28 4.44 5.05 5.67
Cash & Equivalents 8.35 11.21 14.53 17.89
Total Current Assets 16.38 20.5 25.07 29.7
Creditors 1.21 1.67 1.9 2.13
Other Current Liabilities & Prov.
2.96 3.2 3.64 4.08
Total Current Liabilities 4.17 4.87 5.54 6.21
Net Current Assets 12.21 15.63 19.53 23.49
APPLICATION OF FUNDS 18.98 21.08 23.72 26.82 Source: Company, HDFC sec Research
Year ending March (Rs bn) FY17 FY18 FY19E FY20E
Net Revenues (US$ mn) 429 471 511 573
Growth (%) 22.0% 9.7% 8.6% 12.2%
Net Revenues 28.78 30.34 34.5 38.69
Growth (%) 24.5% 5.4% 13.7% 12.2%
Personal Expenses 18.52 19.7 21.81 24.26
SG&A Expenses 5.73 5.95 6.72 7.6
EBITDA 4.54 4.69 5.97 6.83
EBITDA Margin (%) 15.8% 15.4% 17.3% 17.7%
EBITDA Growth (%) 8.8% 3.2% 27.4% 14.4%
Depreciation 1.49 1.58 1.76 1.99
EBIT 3.05 3.1 4.21 4.85
Other Income 0.96 1.19 0.8 1
PBT 4.01 4.29 5.01 5.84
Tax (Incl. Deferred) 0.99 1.06 1.25 1.43
APAT 2.93 3.23 3.76 4.41
APAT Growth (%) -1.5% 10.3% 16.4% 17.3%
Adjusted EPS (Rs) 36.6 40.4 47 55.2
EPS Growth (%) -1.5% 10.3% 16.4% 17.3%
Source: Company, HDFC sec Research
13
Page
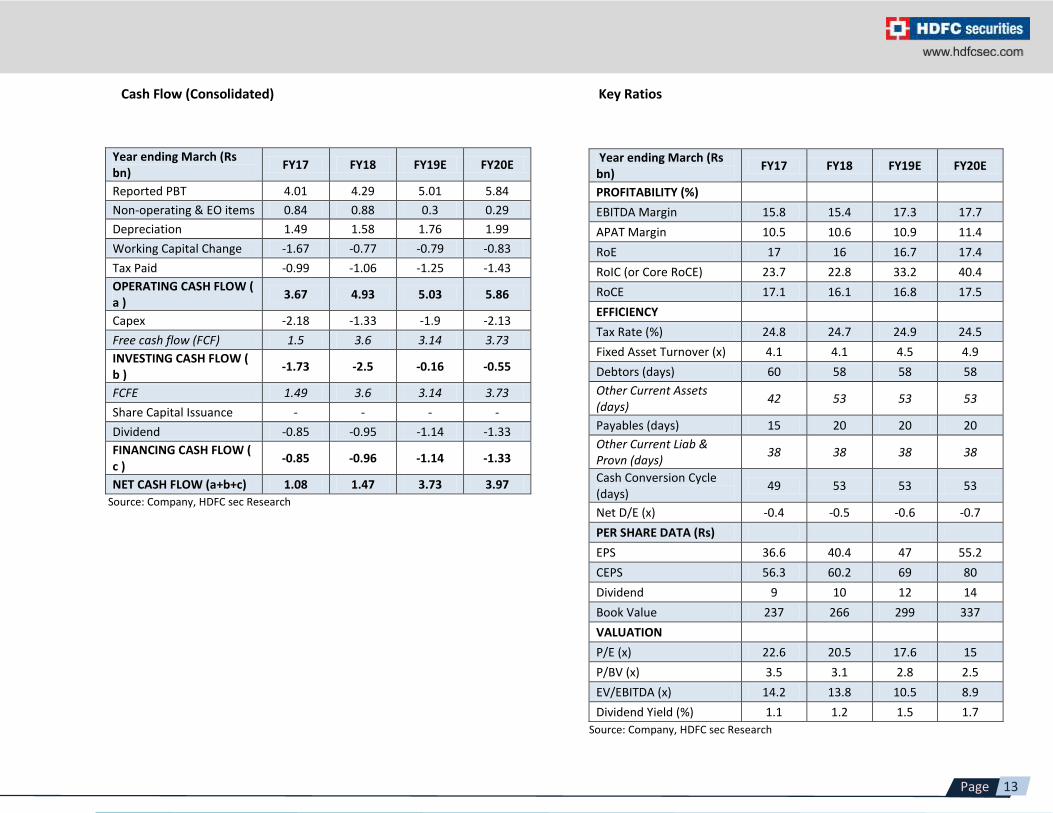
Cash Flow (Consolidated) Key Ratios
Year ending March (Rs bn)
FY17 FY18 FY19E FY20E
Reported PBT 4.01 4.29 5.01 5.84
Non-operating & EO items 0.84 0.88 0.3 0.29
Depreciation 1.49 1.58 1.76 1.99
Working Capital Change -1.67 -0.77 -0.79 -0.83
Tax Paid -0.99 -1.06 -1.25 -1.43
OPERATING CASH FLOW ( a )
3.67 4.93 5.03 5.86
Capex -2.18 -1.33 -1.9 -2.13
Free cash flow (FCF) 1.5 3.6 3.14 3.73
INVESTING CASH FLOW ( b )
-1.73 -2.5 -0.16 -0.55
FCFE 1.49 3.6 3.14 3.73
Share Capital Issuance - - - -
Dividend -0.85 -0.95 -1.14 -1.33
FINANCING CASH FLOW ( c )
-0.85 -0.96 -1.14 -1.33
NET CASH FLOW (a+b+c) 1.08 1.47 3.73 3.97
Source: Company, HDFC sec Research
Year ending March (Rs bn)
FY17 FY18 FY19E FY20E
PROFITABILITY (%)
EBITDA Margin 15.8 15.4 17.3 17.7
APAT Margin 10.5 10.6 10.9 11.4
RoE 17 16 16.7 17.4
RoIC (or Core RoCE) 23.7 22.8 33.2 40.4
RoCE 17.1 16.1 16.8 17.5
EFFICIENCY
Tax Rate (%) 24.8 24.7 24.9 24.5
Fixed Asset Turnover (x) 4.1 4.1 4.5 4.9
Debtors (days) 60 58 58 58
Other Current Assets (days)
42 53 53 53
Payables (days) 15 20 20 20
Other Current Liab & Provn (days)
38 38 38 38
Cash Conversion Cycle (days)
49 53 53 53
Net D/E (x) -0.4 -0.5 -0.6 -0.7
PER SHARE DATA (Rs)
EPS 36.6 40.4 47 55.2
CEPS 56.3 60.2 69 80
Dividend 9 10 12 14
Book Value 237 266 299 337
VALUATION
P/E (x) 22.6 20.5 17.6 15
P/BV (x) 3.5 3.1 2.8 2.5
EV/EBITDA (x) 14.2 13.8 10.5 8.9
Dividend Yield (%) 1.1 1.2 1.5 1.7
Source: Company, HDFC sec Research
14
Page
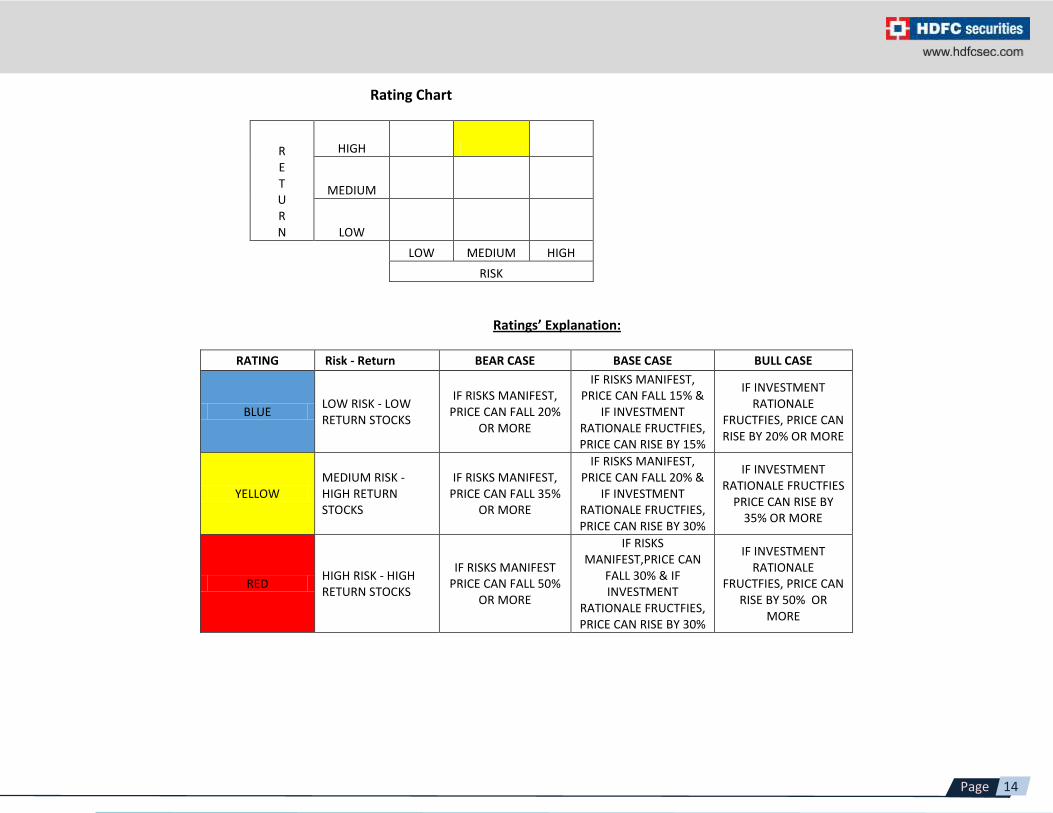
Rating Chart
R E T U R N
HIGH
MEDIUM
LOW
LOW MEDIUM HIGH
RISK
Ratings’ Explanation:
RATING Risk - Return BEAR CASE BASE CASE BULL CASE
BLUE LOW RISK - LOW RETURN STOCKS
IF RISKS MANIFEST, PRICE CAN FALL 20%
OR MORE
IF RISKS MANIFEST, PRICE CAN FALL 15% &
IF INVESTMENT RATIONALE FRUCTFIES, PRICE CAN RISE BY 15%
IF INVESTMENT RATIONALE
FRUCTFIES, PRICE CAN RISE BY 20% OR MORE
YELLOW MEDIUM RISK - HIGH RETURN STOCKS
IF RISKS MANIFEST, PRICE CAN FALL 35%
OR MORE
IF RISKS MANIFEST, PRICE CAN FALL 20% &
IF INVESTMENT RATIONALE FRUCTFIES, PRICE CAN RISE BY 30%
IF INVESTMENT RATIONALE FRUCTFIES
PRICE CAN RISE BY 35% OR MORE
RED HIGH RISK - HIGH RETURN STOCKS
IF RISKS MANIFEST PRICE CAN FALL 50%
OR MORE
IF RISKS MANIFEST,PRICE CAN
FALL 30% & IF INVESTMENT
RATIONALE FRUCTFIES, PRICE CAN RISE BY 30%
IF INVESTMENT RATIONALE
FRUCTFIES, PRICE CAN RISE BY 50% OR
MORE
15
Page
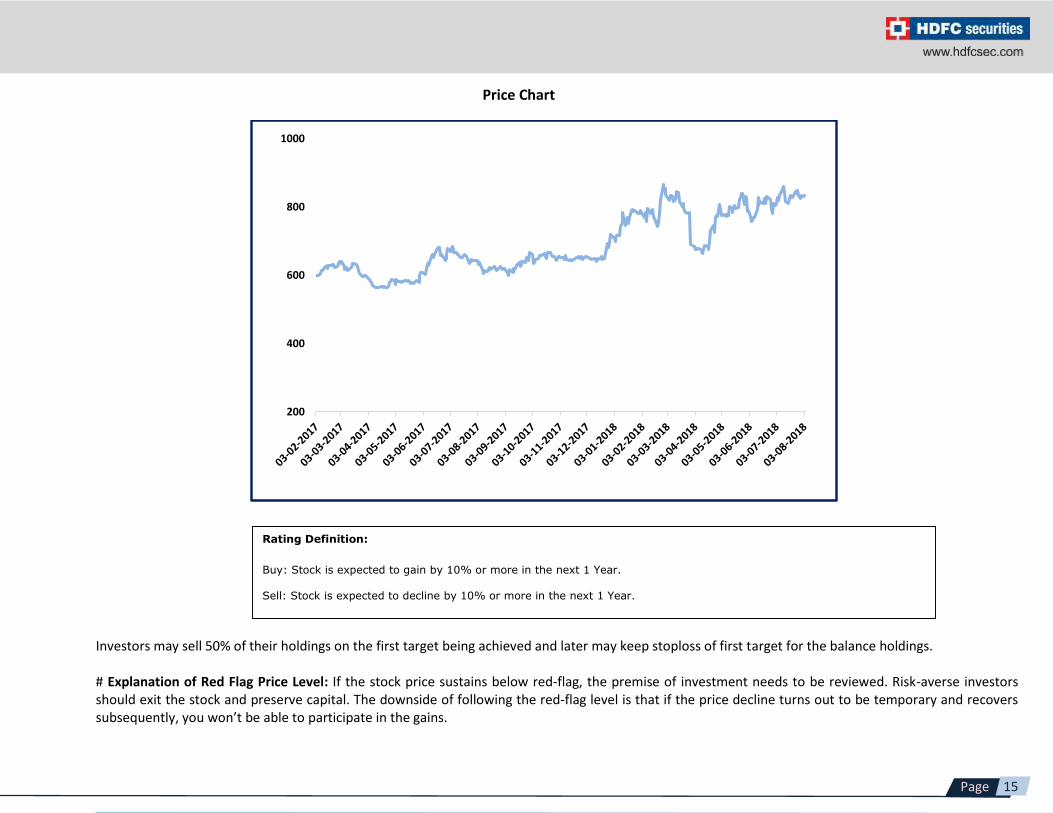
Price Chart
Investors may sell 50% of their holdings on the first target being achieved and later may keep stoploss of first target for the balance holdings. # Explanation of Red Flag Price Level: If the stock price sustains below red-flag, the premise of investment needs to be reviewed. Risk-averse investors should exit the stock and preserve capital. The downside of following the red-flag level is that if the price decline turns out to be temporary and recovers subsequently, you won’t be able to participate in the gains.
200
400
600
800
1000
Rating Definition:
Buy: Stock is expected to gain by 10% or more in the next 1 Year. Sell: Stock is expected to decline by 10% or more in the next 1 Year.
16
Page
Research Analyst: Kushal Rughani ([email protected]) HDFC securities Limited, I Think Techno Campus, Building - B, "Alpha", Office Floor 8, Near Kanjurmarg Station, Opp. Crompton Greaves, Kanjurmarg (East), Mumbai 400 042 Phone: (022) 3075 3400 Fax: (022) 2496 5066 Website: www.hdfcsec.com Email:[email protected]. Compliance Officer: Binkle R. Oza Email: [email protected] Phone: (022) 3045 3600
Disclosure: I, (Kushal Rughani, MBA), authors and the names subscribed to this report, hereby certify that all of the views expressed in this research report accurately reflect our views about the subject issuer(s) or securities. HSL has no material adverse disciplinary history as on the date of publication of this report. We also certify that no part of our compensation was, is, or will be directly or indirectly related to the specific recommendation(s) or view(s) in this report. Research Analyst or his/her relative or HDFC Securities Ltd. does not have any financial interest in the subject company. Also Research Analyst or his relative or HDFC Securities Ltd. or its Associate does not have beneficial ownership of 1% or more in the subject company at the end of the month immediately preceding the date of publication of the Research Report. Further Research Analyst or his relative or HDFC Securities Ltd. or its associate does not have any material conflict of interest. Any holding in stock – No HDFC Securities Limited (HSL) is a SEBI Registered Research Analyst having registration no. INH000002475. Disclaimer: This report has been prepared by HDFC Securities Ltd and is meant for sole use by the recipient and not for circulation. The information and opinions contained herein have been compiled or arrived at, based upon information obtained in good faith from sources believed to be reliable. Such information has not been independently verified and no guaranty, representation of warranty, express or implied, is made as to its accuracy, completeness or correctness. All such information and opinions are subject to change without notice. This document is for information purposes only. Descriptions of any company or companies or their securities mentioned herein are not intended to be complete and this document is not, and should not be construed as an offer or solicitation of an offer, to buy or sell any securities or other financial instruments. This report is not directed to, or intended for display, downloading, printing, reproducing or for distribution to or use by, any person or entity who is a citizen or resident or located in any locality, state, country or other jurisdiction where such distribution, publication, reproduction, availability or use would be contrary to law or regulation or what would subject HSL or its affiliates to any registration or licensing requirement within such jurisdiction. If this report is inadvertently send or has reached any individual in such country, especially, USA, the same may be ignored and brought to the attention of the sender. This document may not be reproduced, distributed or published for any purposes without prior written approval of HSL. Foreign currencies denominated securities, wherever mentioned, are subject to exchange rate fluctuations, which could have an adverse effect on their value or price, or the income derived from them. In addition, investors in securities such as ADRs, the values of which are influenced by foreign currencies effectively assume currency risk. It should not be considered to be taken as an offer to sell or a solicitation to buy any security. HSL may from time to time solicit from, or perform broking, or other services for, any company mentioned in this mail and/or its attachments. HSL and its affiliated company (ies), their directors and employees may; (a) from time to time, have a long or short position in, and buy or sell the securities of the company(ies) mentioned herein or (b) be engaged in any other transaction involving such securities and earn brokerage or other compensation or act as a market maker in the financial instruments of the company(ies) discussed herein or act as an advisor or lender/borrower to such company (ies) or may have any other potential conflict of interests with respect to any recommendation and other related information and opinions. HSL, its directors, analysts or employees do not take any responsibility, financial or otherwise, of the losses or the damages sustained due to the investments made or any action taken on basis of this report, including but not restricted to, fluctuation in the prices of shares and bonds, changes in the currency rates, diminution in the NAVs, reduction in the dividend or income, etc. HSL and other group companies, its directors, associates, employees may have various positions in any of the stocks, securities and financial instruments dealt in the report, or may make sell or purchase or other deals in these securities from time to time or may deal in other securities of the companies / organizations described in this report.
HSL or its associates might have managed or co-managed public offering of securities for the subject company or might have been mandated by the subject company for any other assignment in the past twelve months. HSL or its associates might have received any compensation from the companies mentioned in the report during the period preceding twelve months from t date of this report for services in respect of managing or co-managing public offerings, corporate finance, investment banking or merchant banking, brokerage services or other advisory service in a merger or specific transaction in the normal course of business. HSL or its analysts did not receive any compensation or other benefits from the companies mentioned in the report or third party in connection with preparation of the research report. Accordingly, neither HSL nor Research Analysts have any material conflict of interest at the time of publication of this report. Compensation of our Research Analysts is not based on any specific merchant banking, investment banking or brokerage service transactions. HSL may have issued other reports that are inconsistent with and reach different conclusion from the information presented in this report. Research entity has not been engaged in market making activity for the subject company. Research analyst has not served as an officer, director or employee of the subject company. We have not received any compensation/benefits from the subject company or third party in connection with the Research Report.
This report is intended for non-Institutional Clients only. The views and opinions expressed in this report may at times be contrary to or not in consonance with those of Institutional Research or PCG Research teams of HDFC Securities Ltd. and/or may have different time horizons
HDFC Securities Limited, SEBI Reg. No.: NSE-INB/F/E 231109431, BSE-INB/F 011109437, AMFI Reg. No. ARN: 13549, PFRDA Reg. No. POP: 04102015, IRDA Corporate Agent License No.: HDF 2806925/HDF C000222657, SEBI Research Analyst Reg. No.: INH000002475, CIN - U67120MH2000PLC152193
Related Documents