April 9, 2019 Shree Cement Ltd. Catalysts in place for further growth… CMP INR 18,846 Initiating Coverage – Neutral SKP Securities Ltd www.skpsecurities.com Page 1 of 33 Key Share Data Face Value (INR) 10.0 Equity Capital (INR Mn) 348.4 Market Cap (INR Mn) 656,615.5 52 Week High/Low (INR) 19260/13125 6 months Avg. Daily Volume (NSE) 24,491 BSE Code 500387 NSE Code SHREECEM Reuters Code SHCM.NS Bloomberg Code SRCM:IN Shareholding Pattern (as on Dec 2018) Source: Company 64.8% 5.8% 13.1% 16.3% Promoter MFs FIIs Puiblic & Other Particulars FY18 FY19E FY20E FY21E Net Sales 98,331.0 120,935.7 149,915.6 169,874.2 Growth (%) 14.4% 23.0% 24.0% 13.3% EBITDA 24,727.5 27,331.5 36,729.3 42,638.4 PAT 13,841.5 12,059.4 16,138.6 19,641.6 Growth (%) 3.4% -12.9% 33.8% 21.7% EPS (INR) 397.3 346.1 463.2 563.8 BVPS (INR) 2553.6 2851.7 3230.9 3674.7 Key Financials (INR Million) Particulars FY18 FY19E FY20E FY21E P/E (x) 41.9 54.4 40.7 33.4 P/BVPS (x) 6.5 6.6 5.8 5.1 Mcap/Sales (x) 5.9 5.4 4.4 3.9 EV/EBITDA (x) 23.9 24.3 17.9 15.2 ROCE (%) 12.8% 10.5% 14.4% 15.5% ROE (%) 15.6% 12.1% 14.3% 15.3% EBITDA Mar (%) 25.1% 22.6% 24.5% 25.1% PAT Mar (%) 14.1% 10.0% 10.8% 11.6% Debt - Equity (x) 0.4 0.3 0.3 0.3 Key Financials Ratios Source: Company, SKP Research 1 Yr price performance Shree; vis-à-vis BSE SENSEX -20% -10% 0% 10% 20% 2-Apr-18 23-Apr-18 14-May-18 4-Jun-18 25-Jun-18 16-Jul-18 6-Aug-18 27-Aug-18 17-Sep-18 8-Oct-18 29-Oct-18 19-Nov-18 10-Dec-18 31-Dec-18 21-Jan-19 11-Feb-19 4-Mar-19 25-Mar-19 Shree BSE SENSEX Company Background Shree Cement Ltd (Shree), promoted by Mr. H M Bangur, Managing Director, is India's fourth largest cement manufacturer, with ~8% market share, sold under “Shree Jung Rodhak, Bangur, Rockstrong and Roofon” brands. It has total cement manufacturing capacity of 41.9 mn tpa (MTPA) spread across North (~58%), East (~13%), Central (~12%) and South (~7%) India and UAE (10%) and co-generation power capacity of 639.7 MW including 126 MW from waste heat recovery system (WHRS). Shree is the largest cement producer in North India, with a capacity of 24.3 MTPA, enjoying ~24% market share. The Company also started commercial sale of power in FY09, contributing ~5% to sales in FY18. Investment Rationale New capacities and geographies to aid above-industry volume growth Shree demonstrated a differentiated expansion strategy, with regular capacity additions at higher frequency but of smaller magnitude. This enabled it to (1) expand systematically as per market demand, (2) achieve faster project turnaround and quick stabilization, and (3) drive growth with minimum pressure on balance sheet. Over the last few years, Shree has strengthened its market presence by entering into eastern and southern markets, thus, diversifying away from vagaries of regional demands. Recently, the Company has commissioned 3 MTPA cement grinding unit in Karnataka (south) and has planned to add 5.5 MTPA in east by H1FY20, which will reduce its capacity concentration in the north to less than 50%. The eastern and southern region is expected to witness sustained demand recovery driven by rejuvenated housing and infrastructure development, thereby, resulting in better volumes and realization. Consequently, Shree is expected to grow volumes at ~1.4-1.5x industry growth. Supply concerns receding; increasing entry barriers limit fragmentation and consolidation of capacities to support prices In zeal to gain market share, aggressive manufacturers added robust capacity, leading to overcapacity, and utilisations collapsing to 65% in 2018 from peak of 83% in 2008. Off-late, country’s cement sector is passing through a phase of aggressive consolidation, resulting in top 5 groups controlling ~52% of the industry capacity, aiding reduced competition and better pricing power. Also, indirect entry barriers like land acquisition, high capital cost, securing raw materials like lime stones and increasing gestation period due to regulatory clearances may slow the pace of fresh capacity additions. This will result into better utilisation and improved realization. The growth in cement demand has always had a positive correlation to the GDP growth with long‐term average correlation of 0.9-1.2x of GDP. Shree has substantial limestone reserve which is critical to address the Company’s expansion plan, particularly under the dynamic regulatory environment. Cost leadership to provide competitive advantage Shree is among lowest cost, cement producer, and enjoys superior profitability due to (a) best energy efficiency on account of early adoption of pet coke, WHRS, alternate fuel & raw material (AFR’s) and a 100% captive power plant, (b) economies of scale due to large scale operations and single location largest kiln in the north, and (c) pioneer status in split grinding strategy, thereby, saving logistics cost. The operating efficiency gives the Company a significant cost advantage vs. peers in the environment of subdued demand, lower utilisations and rising costs. Therefore, Shree’s strong focus on operating efficiencies has led to production cost which are almost at ~15-20% discount to tier-I players. Balance sheet strength and positive cash flow to fund future capex Due to smaller periodic expansions, Shree’s balance sheet strength was not diluted in the past. We believe this will continue going forward too. Capex cost for Shree continues to be ~20% lower than the industry average given (a) the Company’s organic model of growth without additional debt, (b) scope for higher brownfield expansions, (c) ability to garner critical resources (land, limestone) by overcoming regulatory hurdles (d) securing equipment at competitive rates with quick utilization ramp-up, and (e) replicating capacity designs by in-house team. Thus, Shree’s cost competence and balance sheet strength make it favorably placed for growth, going forward. Shree is expected to generate cash flow from operations of ~88 bn over FY19E-21E vs. its capex need of only ~Rs 30 bn, thereby, driving growth without impacting balance sheet strength. It is expected to maintain its debt/equity low at ~0.3x, going forward. Valuation With Government’s thrust on infrastructure development, leadership in North with hi gh entry barriers, strong brand pull coupled with robust distribution network, retail-centric business model, raw material security with cost leadership, diversifying growth in eastern and southern market and enhancing return ratios, augurs well for Shree. Therefore, we believe, its premium multiple is expected to sustain, which can be supported by thin liquidity and meagre non-institutional holdings. We have valued the stock on the basis of 15x of FY21E EBITDA (equivalent to replacement cost of ~USD 180/tn). Currently at Rs 18,846, we feel that the stock is adequately priced, based on current fundamentals. Pending triggers for a fresh re-rating or a stronger conviction, we are Neutral on the stock. Analysts: Anik Das Tel No: +91-33-40077020 E-mail: [email protected]

Welcome message from author
This document is posted to help you gain knowledge. Please leave a comment to let me know what you think about it! Share it to your friends and learn new things together.
Transcript

April 9, 2019
Shree Cement Ltd.
Catalysts in place for further growth…
CMP INR 18,846 Initiating Coverage – Neutral
SKP Securities Ltd www.skpsecurities.com Page 1 of 33
Key Share Data
Face Value (INR) 10.0
Equity Capital (INR Mn) 348.4
Market Cap (INR Mn) 656,615.5
52 Week High/Low (INR) 19260/13125
6 months Avg. Daily Volume (NSE) 24,491
BSE Code 500387
NSE Code SHREECEM
Reuters Code SHCM.NS
Bloomberg Code SRCM:IN Shareholding Pattern (as on Dec 2018)
Source: Company
64.8%
5.8%
13.1%
16.3%Promoter
MFs
FIIs
Puiblic & Other
Particulars FY18 FY19E FY20E FY21E
Net Sales 98,331.0 120,935.7 149,915.6 169,874.2
Growth (%) 14.4% 23.0% 24.0% 13.3%
EBITDA 24,727.5 27,331.5 36,729.3 42,638.4
PAT 13,841.5 12,059.4 16,138.6 19,641.6
Growth (%) 3.4% -12.9% 33.8% 21.7%
EPS (INR) 397.3 346.1 463.2 563.8
BVPS (INR) 2553.6 2851.7 3230.9 3674.7
Key Financials (INR Million)
Particulars FY18 FY19E FY20E FY21E
P/E (x) 41.9 54.4 40.7 33.4
P/BVPS (x) 6.5 6.6 5.8 5.1
Mcap/Sales (x) 5.9 5.4 4.4 3.9
EV/EBITDA (x) 23.9 24.3 17.9 15.2
ROCE (%) 12.8% 10.5% 14.4% 15.5%
ROE (%) 15.6% 12.1% 14.3% 15.3%
EBITDA Mar (%) 25.1% 22.6% 24.5% 25.1%
PAT Mar (%) 14.1% 10.0% 10.8% 11.6%
Debt - Equity (x) 0.4 0.3 0.3 0.3
Key Financials Ratios
Source: Company, SKP Research
1 Yr price performance Shree; vis-à-vis BSE SENSEX
-20%
-10%
0%
10%
20%
2-A
pr-
18
23-A
pr-
18
14-M
ay-1
8
4-J
un
-18
25-J
un-1
8
16-J
ul-1
8
6-A
ug-1
8
27-A
ug
-18
17-S
ep
-18
8-O
ct-
18
29-O
ct-
18
19-N
ov-1
8
10-D
ec-1
8
31-D
ec-1
8
21-J
an-1
9
11-F
eb-1
9
4-M
ar-
19
25-M
ar-
19
Shree BSE SENSEX
Company Background
Shree Cement Ltd (Shree), promoted by Mr. H M Bangur, Managing Director, is India's fourth largest cement manufacturer, with ~8% market share, sold under “Shree Jung Rodhak, Bangur, Rockstrong and Roofon” brands. It has total cement manufacturing capacity of 41.9 mn tpa (MTPA) spread across North (~58%), East (~13%), Central (~12%) and South (~7%) India and UAE (10%) and co-generation power capacity of 639.7 MW including 126 MW from waste heat recovery system (WHRS). Shree is the largest cement producer in North India, with a capacity of 24.3 MTPA, enjoying ~24% market share. The Company also started commercial sale of power in FY09, contributing ~5% to sales in FY18.
Investment Rationale New capacities and geographies to aid above-industry volume growth
Shree demonstrated a differentiated expansion strategy, with regular capacity additions at higher frequency but of smaller magnitude. This enabled it to (1) expand systematically as per market demand, (2) achieve faster project turnaround and quick stabilization, and (3) drive growth with minimum pressure on balance sheet.
Over the last few years, Shree has strengthened its market presence by entering into eastern and southern markets, thus, diversifying away from vagaries of regional demands. Recently, the Company has commissioned 3 MTPA cement grinding unit in Karnataka (south) and has planned to add 5.5 MTPA in east by H1FY20, which will reduce its capacity concentration in the north to less than 50%. The eastern and southern region is expected to witness sustained demand recovery driven by rejuvenated housing and infrastructure development, thereby, resulting in better volumes and realization. Consequently, Shree is expected to grow volumes at ~1.4-1.5x industry growth.
Supply concerns receding; increasing entry barriers limit fragmentation and consolidation of capacities to support prices
In zeal to gain market share, aggressive manufacturers added robust capacity, leading to overcapacity, and utilisations collapsing to 65% in 2018 from peak of 83% in 2008. Off-late, country’s cement sector is passing through a phase of aggressive consolidation, resulting in top 5 groups controlling ~52% of the industry capacity, aiding reduced competition and better pricing power. Also, indirect entry barriers like land acquisition, high capital cost, securing raw materials like lime stones and increasing gestation period due to regulatory clearances may slow the pace of fresh capacity additions. This will result into better utilisation and improved realization.
The growth in cement demand has always had a positive correlation to the GDP growth with long‐term average correlation of 0.9-1.2x of GDP. Shree has substantial limestone reserve which is critical to address the Company’s expansion plan, particularly under the dynamic regulatory environment.
Cost leadership to provide competitive advantage
Shree is among lowest cost, cement producer, and enjoys superior profitability due to (a) best energy efficiency on account of early adoption of pet coke, WHRS, alternate fuel & raw material (AFR’s) and a 100% captive power plant, (b) economies of scale due to large scale operations and single location largest kiln in the north, and (c) pioneer status in split grinding strategy, thereby, saving logistics cost. The operating efficiency gives the Company a significant cost advantage vs. peers in the environment of subdued demand, lower utilisations and rising costs. Therefore, Shree’s strong focus on operating efficiencies has led to production cost which are almost at ~15-20% discount to tier-I players.
Balance sheet strength and positive cash flow to fund future capex
Due to smaller periodic expansions, Shree’s balance sheet strength was not diluted in the past. We believe this will continue going forward too. Capex cost for Shree continues to be ~20% lower than the industry average given (a) the Company’s organic model of growth without additional debt, (b) scope for higher brownfield expansions, (c) ability to garner critical resources (land, limestone) by overcoming regulatory hurdles (d) securing equipment at competitive rates with quick utilization ramp-up, and (e) replicating capacity designs by in-house team. Thus, Shree’s cost competence and balance sheet strength make it favorably placed for growth, going forward.
Shree is expected to generate cash flow from operations of ~88 bn over FY19E-21E vs. its capex need of only ~Rs 30 bn, thereby, driving growth without impacting balance sheet
strength. It is expected to maintain its debt/equity low at ~0.3x, going forward. Valuation
With Government’s thrust on infrastructure development, leadership in North with high entry barriers, strong brand pull coupled with robust distribution network, retail-centric business model, raw material security with cost leadership, diversifying growth in eastern and southern market and enhancing return ratios, augurs well for Shree. Therefore, we believe, its premium multiple is expected to sustain, which can be supported by thin liquidity and meagre non-institutional holdings.
We have valued the stock on the basis of 15x of FY21E EBITDA (equivalent to replacement cost of ~USD 180/tn). Currently at Rs 18,846, we feel that the stock is adequately priced, based on current fundamentals. Pending triggers for a fresh re-rating or a stronger conviction, we are Neutral on the stock.
Analysts: Anik Das
Tel No: +91-33-40077020
E-mail: [email protected]
Shree Cement Ltd.
SKP Securities Ltd www.skpsecurities.com Page 2 of 33
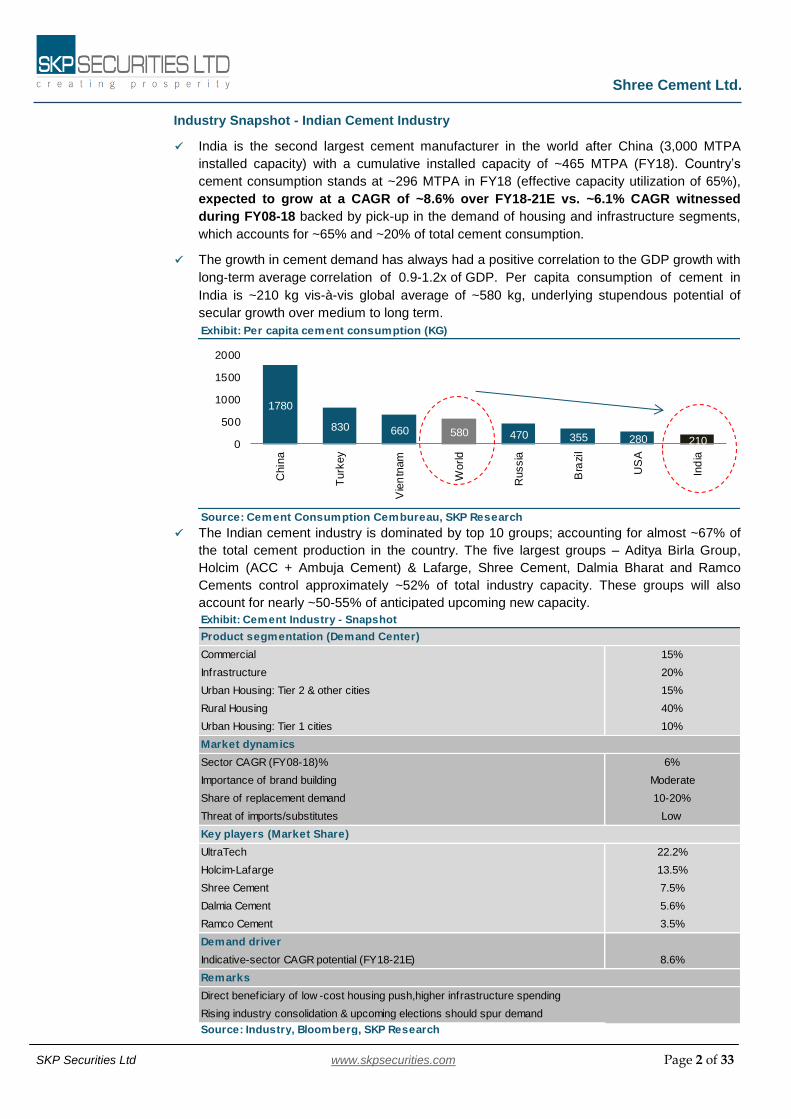
Exhibit: Per capita cement consumption (KG)
Source: Cement Consumption Cembureau, SKP Research
1780
830 660 580 470 355 280 2100
500
1000
1500
2000
Chin
a
Turk
ey
Vie
ntn
am
World
Russia
Bra
zil
US
A
Ind
ia
Exhibit: Cement Industry - Snapshot
Commercial 15%
Infrastructure 20%
Urban Housing: Tier 2 & other cities 15%
Rural Housing 40%
Urban Housing: Tier 1 cities 10%
Sector CAGR (FY08-18)% 6%
Importance of brand building Moderate
Share of replacement demand 10-20%
Threat of imports/substitutes Low
UltraTech 22.2%
Holcim-Lafarge 13.5%
Shree Cement 7.5%
Dalmia Cement 5.6%
Ramco Cement 3.5%
Demand driver
Indicative-sector CAGR potential (FY18-21E) 8.6%
Source: Industry, Bloomberg, SKP Research
Product segmentation (Demand Center)
Direct beneficiary of low -cost housing push,higher infrastructure spending
Rising industry consolidation & upcoming elections should spur demand
Market dynamics
Key players (Market Share)
Remarks
Industry Snapshot - Indian Cement Industry
India is the second largest cement manufacturer in the world after China (3,000 MTPA
installed capacity) with a cumulative installed capacity of ~465 MTPA (FY18). Country’s
cement consumption stands at ~296 MTPA in FY18 (effective capacity utilization of 65%),
expected to grow at a CAGR of ~8.6% over FY18-21E vs. ~6.1% CAGR witnessed
during FY08-18 backed by pick-up in the demand of housing and infrastructure segments,
which accounts for ~65% and ~20% of total cement consumption.
The growth in cement demand has always had a positive correlation to the GDP growth with
long‐term average correlation of 0.9-1.2x of GDP. Per capita consumption of cement in
India is ~210 kg vis-à-vis global average of ~580 kg, underlying stupendous potential of
secular growth over medium to long term.
The Indian cement industry is dominated by top 10 groups; accounting for almost ~67% of
the total cement production in the country. The five largest groups – Aditya Birla Group,
Holcim (ACC + Ambuja Cement) & Lafarge, Shree Cement, Dalmia Bharat and Ramco
Cements control approximately ~52% of total industry capacity. These groups will also
account for nearly ~50-55% of anticipated upcoming new capacity.

Shree Cement Ltd.
SKP Securities Ltd www.skpsecurities.com Page 3 of 33
(MTPA) FY18 FY19E FY20E FY21E Company FY18 FY19E FY20E FY21E
Installed capacity 102 102 104 108 Asian Cement 1.5
Effective capacity 101 101 103 106 JK Cement 2.0
y-o-y (%) 6 0 2 3 JK Lakshmi
Volumes 72 75 79 80 Shree Cement
Utilisation (%) 71 74 77 75 Shree Cement 3.6
y-o-y change (%) -6 4 3 -2 Ultratech Cement 3.5
Total 5.1 2.0 3.5
Source: Industry,SKP Research Source: Industry,SKP Research
Exhibit: North – Cement utilisation to rise to 75% by FY21E Exhibit: No major capacity addition in FY19-FY21E
Exhibit: Geographical distribution of cement manufacturers
Source: Industry, UltraTech investor presentation, SKP Research,*Based on capacity
Cem
ent
Industr
y
SOUTH 153 MTPATamil Nadu, Andhra Pradesh & Karnataka
33%
NORTH 102 MTPARajasthan, Punjab, Haryana & the NCR 22%
EAST & North East 88 MTPAWest Bengal,
Chhattisgarh, Orissa & Jharkhand
19%
WEST 60 MTPA Maharashtra, Gujarat 13%
CENTRAL 60 MTPAUttar Pradesh, Madhya
Pradesh 13%
Installed Capacity Key Markets *Market Composition
Cement Industry - Geographical distribution
Considering the bulky nature of cement, the industry is influenced by regional rather than
national demand-supply dynamics. Due to varying levels of infrastructure/real
estate/industrial development in different regions, companies operating in developing
states/regions are better placed. To some extent, there is also inter-regional movement of
cement. Andhra Pradesh is the leading state with 40 large cement plants, followed by Tamil
Nadu and Rajasthan having 21 and 20 plants, respectively.
Northern region - Cement capacity utilisation to improve by 400 bps over FY18-21E
Cement capacity in North region stands at ~102 MTPA in FY18 from ~22 MTPA in FY01
with Rajasthan alone accounting for ~65-70% of total capacity due to better availability of
limestone mines (Rajasthan accounts for ~12% of the country’s limestone reserves). The
market is currently dominated by Shree Cement and UltraTech, both collectively
accounting for ~48% of the total capacity. Going forward, we estimate incremental
demand of 8 MTPA as against incremental supply of 5.5 MTPA over FY18-FY21E.
Central region - utilisation to increase over FY18-FY21E
Cement capacity in central region has increased from ~19 MTPA in FY01 to ~60 MTPA
in FY18. Overall 10 players are operating in the region with five players accounting for
~81% of the total capacity. Post expansion of UltraTech’s capacity in the central region,
the Company will have a mammoth share of ~36.7% by FY21E from ~29% in FY18.
Shree Cement Ltd.
SKP Securities Ltd www.skpsecurities.com Page 4 of 33
(MTPA) FY18 FY19E FY20E FY21E Company FY18 FY19E FY20E FY21E
Installed capacity 60 68 72 75 ACC 3.0
Effective capacity 53 60 63 65 JK Cement 1.5
y-o-y chg (%) -2 13 5 4 Mangalam Cement
Volumes 40 43 47 51 UltraTech Cement 7.6
Utilisation (%) 76% 72% 75% 78% Wonder Cement 2.0
y-o-y change (%) 2 -5 4 4
Total 0 7.6 3.5 3.0
Source: Industry,SKP Research Source: Industry,SKP Research
Exhibit: Central – Utilisation to increase by 2% over FY19-FY21E Exhibit: No major capacity addition in FY19-FY21E
(MTPA) FY18 FY19E FY20E FY21E Company FY18 FY19E FY20E FY21E
Installed capacity 60 65 67 74 Century Textiles 1.2
Effective capacity 59 63 66 72 JK Cement Ltd 0.7
y-o-y chg (%) 5 7 4 9 JK Lakshmi
Volumes 39 42 43 50 JSW 1.2 2.3
Utilisation (%) 66 67 66 70 Penna Cement 1.0
y-o-y change (%) -5 1 -2 6 Sanghi Industries 4.0
Shree Cement 2.0
Ultratech Cement 1.2
Wonder Cement 2.0
Total 2.4 4.2 2.7 6.3
Source: Industry,SKP Research Source: Industry,SKP Research
Exhibit: New players are entering into West market in
FY19E-FY21E Exhibit: West - Utilisation to remain flat over FY19E- FY21E
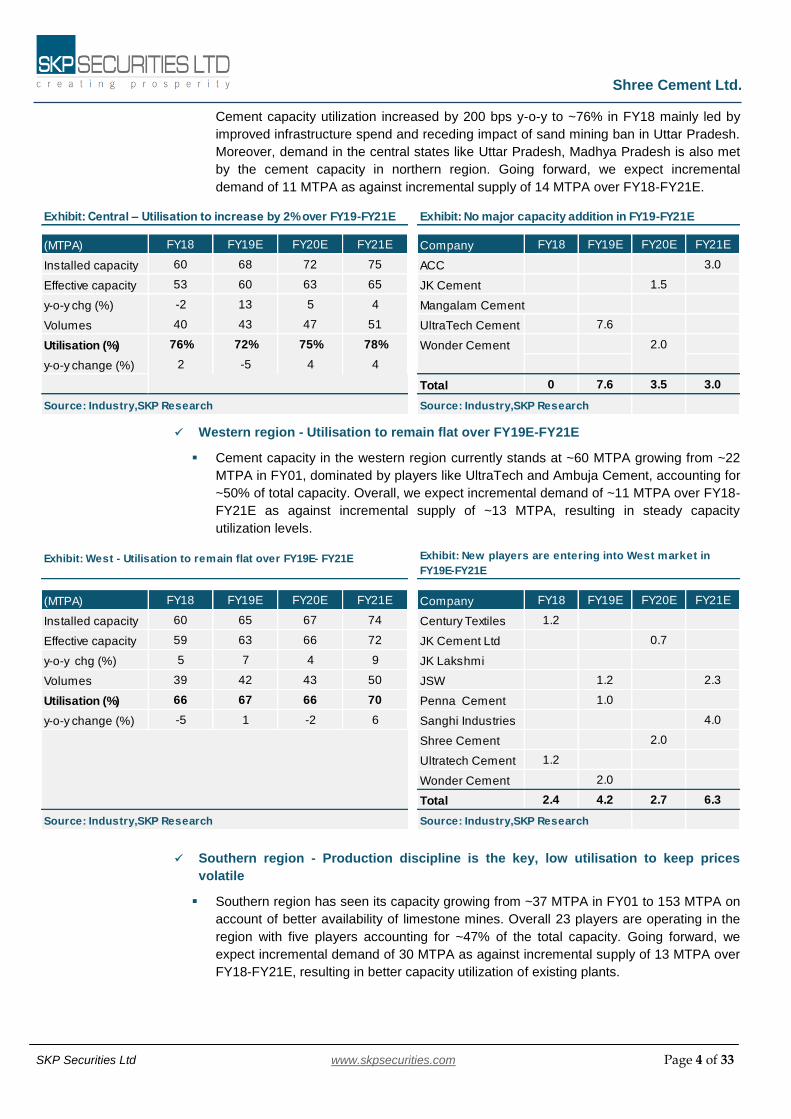
Cement capacity utilization increased by 200 bps y-o-y to ~76% in FY18 mainly led by
improved infrastructure spend and receding impact of sand mining ban in Uttar Pradesh.
Moreover, demand in the central states like Uttar Pradesh, Madhya Pradesh is also met
by the cement capacity in northern region. Going forward, we expect incremental
demand of 11 MTPA as against incremental supply of 14 MTPA over FY18-FY21E.
Western region - Utilisation to remain flat over FY19E-FY21E
Cement capacity in the western region currently stands at ~60 MTPA growing from ~22
MTPA in FY01, dominated by players like UltraTech and Ambuja Cement, accounting for
~50% of total capacity. Overall, we expect incremental demand of ~11 MTPA over FY18-
FY21E as against incremental supply of ~13 MTPA, resulting in steady capacity
utilization levels.
Southern region - Production discipline is the key, low utilisation to keep prices
volatile
Southern region has seen its capacity growing from ~37 MTPA in FY01 to 153 MTPA on
account of better availability of limestone mines. Overall 23 players are operating in the
region with five players accounting for ~47% of the total capacity. Going forward, we
expect incremental demand of 30 MTPA as against incremental supply of 13 MTPA over
FY18-FY21E, resulting in better capacity utilization of existing plants.

Shree Cement Ltd.
SKP Securities Ltd www.skpsecurities.com Page 5 of 33
(MTPA) FY18 FY19E FY20E FY21E Company FY18 FY19E FY20E FY21E
Installed capacity 153 162 166 166 Chettinad 2.5
Effective capacity 150 159 163 163 JSW 3.0
YoY chg (%) -4 6 3 0 KCP 1.5
Volumes 88 103 112 118 My Home
Utilisation (%) 59% 65% 69% 73% Nagarjuna Cement 0.8
y-o-y change (%) 7 11 6 5 Penna Cement 2
Ramco Cements 0.2 1.1
SGC 1.3 0.5
Shree Cement 3.0
Tamilnadu Cements 1.0
Total 4.0 8.8 4.1
Source: Industry,SKP Research Source: Industry,SKP Research
Exhibit: South – Utilisation to see uptick Exhibit: Few capacity additions expected over FY19E-FY21E
(MTPA) FY18 FY19E FY20E FY21E Company FY18 FY19E FY20E FY21E
Installed capacity 88 93 99 106 ACC 0 0 0 0
Effective capacity 83 88 93 100 Dalmia Bharat 0 0 0 2.6
y-o-y chg (%) 14 5 6 7 EMAMI Cement 0 3.8 0 0
Volumes 57 62 70 80 Shree Cement 2 0.9 2 2
Utilisation (%) 68 71 75 80 JK Lakshmi Cement 1 0 0.8 0
y-o-y change (%) -6 3 6 7 JSW 2.4 0 1.2 1.2
STAR 0 0 0 1
Ramco Cement 0 0 2 0
Ultratech Cement 0.3 0 0 0
Total 5.7 4.7 6.0 6.8
Source: Industry,SKP Research Source: Industry,SKP Research
Exhibit: East & North East - Utilisation to increase over FY19-
FY21E
Exhibit: More grinding unit additions expected in FY19E-
FY21E
Eastern & North Eastern region – Higher capacity utilization to improve prices
Over the next two years the region is expected to witness capacity addition of ~18 MTPA
from ~88 MTPA to ~106 MTPA. UltraTech, Dalmia Bharat, ACC, Nirma Cement and
Shree accounts for ~70% of the market. Post expansion of Dalmia Bharat in the East, the
Company will become the market leader with ~21% capacity share by FY21E. Despite
huge capacity expansion in pipeline, utilization levels in East is bound to remain on a
higher side due to better housing demand, higher infrastructure spends and receding
impact of sand mining issues in Bihar. Going forward, we expect incremental demand of
23 MTPA as against incremental supply of ~18 MTPA over FY18-FY21E.
Industry - Cost drivers
The cost structure for cement sector is skewed towards variable cost with only 20%
being fixed. Of the variable cost, raw material (limestone, gypsum and fly ash) cost
accounts for just ~15-18% while, power and fuel along with freight cost comprises ~50%-
55%. Hence, efficiencies in terms of energy consumption and freight optimization are
very important to maintain costs.

Shree Cement Ltd.
SKP Securities Ltd www.skpsecurities.com Page 6 of 33
Source: The Indian Bureau of Mines,SKP Research Source: The Indian Bureau of Mines,SKP Research
Exhibit: Limestone resource positioning Exhibit: Production of Limestone (By Region)
25%
36%
14%12% 12%
0%
5%
10%
15%
20%
25%
30%
35%
40%
North South East andNorth East
West Central
Exhibit: Output of different raw material to cement
Items OPC PPC PSC
Clinker 95% 65% 45%
Gypsum 5% 5% 5%
Flyash - 30% -
Slag - - 50%
Margin for Manufacturer Lowest Higher Highest
Source: Industry, SKP Research
Limestone availability remains a key
Limestone is the primary raw material in cement manufacturing. Other raw material includes flyash, gypsum and slag. Raw material costs could vary by the mix of cement sold. Shree and Ambuja stand out on raw material costs owing to adequate access to limestone and fly ash.
India has limestone reserves of ~203 bn tonnes which is expected to last for 35-40 years.
Within the Country, reserves are concentrated in seven major clusters – Satna (M.P.),
Chanderria (Rajasthan), Nalagonda (Telangana), Gulbarga (Karnataka), Yerraguntla
(Andhra Pradesh), Chandrapur (Maharashtra), and Bilaspur (Chhattisgarh) and the top 5
states contribute to ~64% of limestone production. While there are concerns about the
limited availability of limestone, some large and mid-tier Companies have acquired
additional limestone reserves to aid their cement capacity additions in future. Shree has
substantial limestone reserves which is critical to address the Company’s
expansion plan, particularly under the dynamic regulatory environment.
However, limestone can be substituted with other materials namely Flyash or Slag, which
will still provide the strength but to a lesser extent. The threshold limit of mixing Flyash is
maximum 35%.
Fly ash/slag is sourced from steel or power companies at relatively low price, hence cost
mainly includes transport cost which in turn depends on the lead distance to the plant. To
maintain sufficient and timely supply of fly ash/slag, cement companies are looking at
JVs with power/steel companies.
There are various varieties of Cement depending on the composition of materials,
namely OPC (ordinary portland cement), PPC (portland pozzolana cement) and PSC
(portland slag cement). At this juncture, PPC comprises 56% while OPC comprises 34%
and PSC adds up the residual.
Shree Cement Ltd.
SKP Securities Ltd www.skpsecurities.com Page 7 of 33
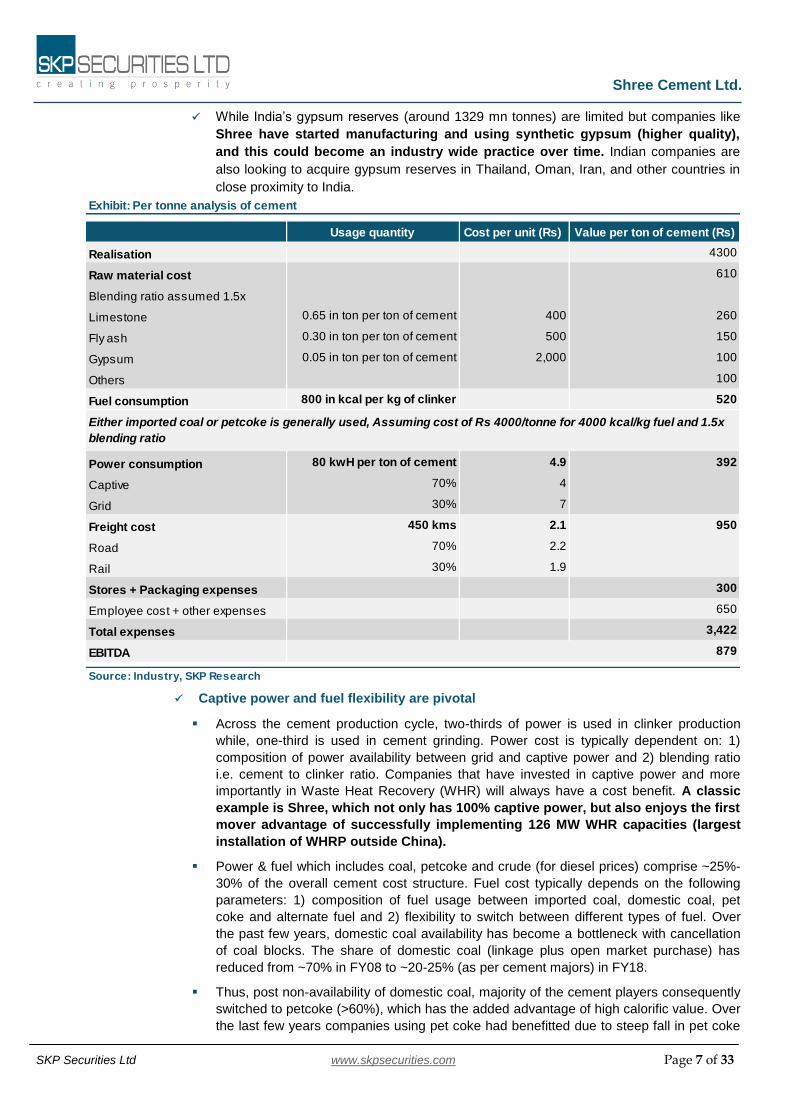
Exhibit: Per tonne analysis of cement
Usage quantity Cost per unit (Rs) Value per ton of cement (Rs)
Realisation 4300
Raw material cost 610
Blending ratio assumed 1.5x
Limestone 0.65 in ton per ton of cement 400 260
Fly ash 0.30 in ton per ton of cement 500 150
Gypsum 0.05 in ton per ton of cement 2,000 100
Others 100
Fuel consumption 800 in kcal per kg of clinker 520
Power consumption 80 kwH per ton of cement 4.9 392
Captive 70% 4
Grid 30% 7
Freight cost 450 kms 2.1 950
Road 70% 2.2
Rail 30% 1.9
Stores + Packaging expenses 300
Employee cost + other expenses 650
Total expenses 3,422
EBITDA 879
Source: Industry, SKP Research
Either imported coal or petcoke is generally used, Assuming cost of Rs 4000/tonne for 4000 kcal/kg fuel and 1.5x
blending ratio
While India’s gypsum reserves (around 1329 mn tonnes) are limited but companies like
Shree have started manufacturing and using synthetic gypsum (higher quality),
and this could become an industry wide practice over time. Indian companies are
also looking to acquire gypsum reserves in Thailand, Oman, Iran, and other countries in
close proximity to India.
Captive power and fuel flexibility are pivotal
Across the cement production cycle, two-thirds of power is used in clinker production
while, one-third is used in cement grinding. Power cost is typically dependent on: 1)
composition of power availability between grid and captive power and 2) blending ratio
i.e. cement to clinker ratio. Companies that have invested in captive power and more
importantly in Waste Heat Recovery (WHR) will always have a cost benefit. A classic
example is Shree, which not only has 100% captive power, but also enjoys the first
mover advantage of successfully implementing 126 MW WHR capacities (largest
installation of WHRP outside China).
Power & fuel which includes coal, petcoke and crude (for diesel prices) comprise ~25%-
30% of the overall cement cost structure. Fuel cost typically depends on the following
parameters: 1) composition of fuel usage between imported coal, domestic coal, pet
coke and alternate fuel and 2) flexibility to switch between different types of fuel. Over
the past few years, domestic coal availability has become a bottleneck with cancellation
of coal blocks. The share of domestic coal (linkage plus open market purchase) has
reduced from ~70% in FY08 to ~20-25% (as per cement majors) in FY18.
Thus, post non-availability of domestic coal, majority of the cement players consequently
switched to petcoke (>60%), which has the added advantage of high calorific value. Over
the last few years companies using pet coke had benefitted due to steep fall in pet coke
Shree Cement Ltd.
SKP Securities Ltd www.skpsecurities.com Page 8 of 33
Exhibit: Diesel prices decline by 10% from the peak Exhibit: Coal prices down by 15% from peak
Exhibit: Petcoke prices moderating
Source: Industry,SKP Research
0
30
60
90
120
150
Sep
-13
Ja
n-1
4
Ma
y-1
4
Sep
-14
Ja
n-1
5
Ma
y-1
5
Sep
-15
Ja
n-1
6
Ma
y-1
6
Sep
-16
Ja
n-1
7
Ma
y-1
7
Sep
-17
Ja
n-1
8
Ma
y-1
8
Sep
-18
Ja
n-1
9
Australian Coal Price (USD/MT)
10
4
10
4
88 10
0
10
0
10
2
94
86 9
6
10
4
11
0
10
2
95 10
8
11
6
11
2
11
3
10
8
11
3
11
5
12
5
12
5
10
8
98
94
95
93 97
0
30
60
90
120
150
Dec-
16
Feb
-17
Apr-
17
Jun-1
7
Aug-1
7
Oct-17
Dec-
17
Feb
-18
Apr-
18
Jun-1
8
Aug-1
8
Oct-18
Dec-
18
Feb
-19
Average Petcoke prices (USD/t)
0.0
20.0
40.0
60.0
80.0
100.0
Fe
b-0
8
Sep
-08
Apr-
09
No
v-0
9
Ju
n-1
0
Ja
n-1
1
Aug
-11
Ma
r-12
Oct-
12
Ma
y-1
3
De
c-1
3
Ju
l-1
4
Fe
b-1
5
Sep
-15
Apr-
16
No
v-1
6
Ju
n-1
7
Ja
n-1
8
Aug
-18
Ma
r-19
Indian Diesel price - Delhi (Rs/Ltr)
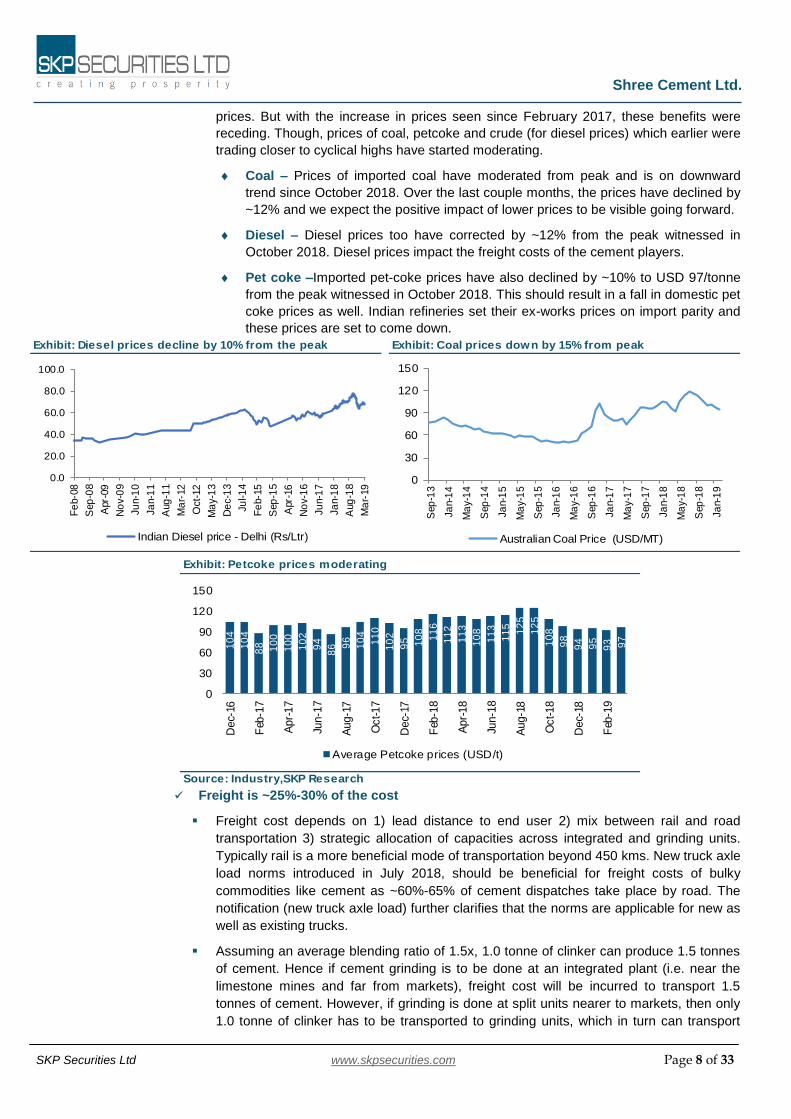
prices. But with the increase in prices seen since February 2017, these benefits were
receding. Though, prices of coal, petcoke and crude (for diesel prices) which earlier were
trading closer to cyclical highs have started moderating.
Coal – Prices of imported coal have moderated from peak and is on downward
trend since October 2018. Over the last couple months, the prices have declined by
~12% and we expect the positive impact of lower prices to be visible going forward.
Diesel – Diesel prices too have corrected by ~12% from the peak witnessed in
October 2018. Diesel prices impact the freight costs of the cement players.
Pet coke –Imported pet-coke prices have also declined by ~10% to USD 97/tonne
from the peak witnessed in October 2018. This should result in a fall in domestic pet
coke prices as well. Indian refineries set their ex-works prices on import parity and
these prices are set to come down.
Freight is ~25%-30% of the cost
Freight cost depends on 1) lead distance to end user 2) mix between rail and road
transportation 3) strategic allocation of capacities across integrated and grinding units.
Typically rail is a more beneficial mode of transportation beyond 450 kms. New truck axle
load norms introduced in July 2018, should be beneficial for freight costs of bulky
commodities like cement as ~60%-65% of cement dispatches take place by road. The
notification (new truck axle load) further clarifies that the norms are applicable for new as
well as existing trucks.
Assuming an average blending ratio of 1.5x, 1.0 tonne of clinker can produce 1.5 tonnes
of cement. Hence if cement grinding is to be done at an integrated plant (i.e. near the
limestone mines and far from markets), freight cost will be incurred to transport 1.5
tonnes of cement. However, if grinding is done at split units nearer to markets, then only
1.0 tonne of clinker has to be transported to grinding units, which in turn can transport

Shree Cement Ltd.
SKP Securities Ltd www.skpsecurities.com Page 9 of 33
Exhibit: Demand/supply model over FY08-FY21E
NorthCentralWesternSouthEast
Source: Ultratech Presentation, SKP Research
198 216
276 3
10 328 3
63
376 402
417
428 456
473 492
507
164
178 203
214
230
243
249
257
269
272 296 325 351 379
34 38
73 9
6
98 1
20
127 145
148
156
160
148
141
128
83% 82%
74%69% 70%
67% 66%64% 65% 64%
65%69%
71%75%
0%
10%
20%
30%
40%
50%
60%
70%
80%
90%
0
100
200
300
400
500
600
FY08 FY09 FY10 FY11 FY12 FY13 FY14 FY15 FY16 FY17 FY18 FY19E FY20E FY21E
Actual- effective capacity (MTPA) Demand (MTPA) Surplus capacity (MTPA) Utilisations (%)
Incremental Supply ‐ 258 MTPA> Demand ‐ 132 MTPA Supply ‐51 MTPA> Demand ‐84 MTPA
Industry capacity more than doubled in last decade.Around 55 million tons capacity added in last 3 y ears Demand picked up in FY18.
Surplus capacity in the sector ~ 160 million tonnes
1.5 tonnes of cement to the markets. Shree is the leader here as well, since they have
strategically placed smaller split grinding units across all their addressable
markets and hence have the lowest freight cost per ton across the players.
Demand - supply mismatch to moderate
India’s cement sector is favourably placed to benefit from the multiple tailwinds: rising
demand, improving utilisations and subsiding cost inflation. After a spurt in capacity
additions (over FY11-18, India's cement industry saw ~138 MTPA of capacity additions - at
an average of ~19 MTPA/year, significantly above incremental cumulative demand of ~83
MTPA) witnessed during the last decade; during which the industry capacity has almost
doubled to ~465 MTPA, the pace of new capacity addition has considerably slowed down
on account of volatile earnings, stretched balance sheets of certain players and higher costs
of funding.
As a result, we believe ~40%-45% of the FY19-21E pipeline capacity (~35-40 MTPA) will be
delayed, thus, improving the demand-supply dynamics. We estimate demand could record
~8% CAGR over the same period (~54 MTPA in absolute demand), translating to an
improvement in utilization rates – from ~65% in FY18 to ~75% in FY21E.
Industry’s clinker capacity addition a better parameter to gauge actual cement production
Clinker capacity addition in FY18 has been the lowest in the past decade. We believe
clinker utilization would be a better parameter to gauge actual cement production rather
than cement utilization as few of the capacities may be just grinding units to optimise logistic
costs, to enter new markets etc. While there was hardly any gap between cement and
clinker utilization till FY17, the hiatus increased in FY18-19E and is likely to widen by FY21E
and even higher going ahead. This is mainly due to the fact that while 42 MTPA capacities
are being added over FY18-FY19E, clinker capacity additions are likely to be around 9
MTPA.
Moreover, one can safely conclude, anchored by slim capacity addition pipeline over the
next two years as announced by companies and orders placed with equipment

Shree Cement Ltd.
SKP Securities Ltd www.skpsecurities.com Page 10 of 33
(MTPA) FY16 FY17 FY18 FY19E FY20E FY21E
Clinker capacity- effective 296 305 314 319 327 340
Blending ratio 1.4 1.4 1.4 1.4 1.4 1.4
Maximum cement production capacity- effective 420 434 448 456 467 486
Clinker utilisation- effective capacity (%) 67 67 71 77 80 81
Cement utilisation- effective capacity (%) 65 64 65 69 71 75
Source: Industry, SKP Research
All-India
Exhibit: Clinker utilisation likely to be higher
Exhibit: Cement plant construction costs inching up Exhibit: Time required to set up a cement plant
Source: Industry, FL Smidth, SKP Research Source: Industry, FL Smidth, SKP Research
Equipment, 45%
Land and mining
rights, 19%
Captiv e power , 10%
Others, 7%
Erection , 8%
Civ il works, 10%
0
10
20
30
40
50
60
70
80
Greenfield Brownfield Greenfield Brownfield
5 years ago Current
Land EPC Construction
Months
manufacturers, that the industry’s clinker utilization will rise from ~71% in FY18 to 81% by
FY21E.
Entry barrier - High initial capital outlay & long gestation periods have elongated the duration of a cement project
The cost of setting up a cement plant has nearly doubled over the past seven years.
Furthermore, the lead time for establishing a cement plant in India has increased from three
to four years to approx six years due to challenges in acquiring land and delays in
regulatory clearances. In the recent past, companies have announced projects at an
average cost of USD 110-130/tonne for a Greenfield integrated project, while for a
brownfield grinding project the average cost announced was USD 50/tonne.
The industry has also witnessed some escalation in the costs of equipment and land. A
cement plant with 1 MTPA of capacity/annum requires ~ 200 hectares of land. Assuming an
80% capacity utilization rate and a price of Rs 300 per bag, a cement plant would barely
earn its cost of capital. Therefore, this will curtail new supply plans in the long term.
Furthermore, with substantial capacity additions over the last five years, many mid-tier
Indian cement companies have stretched their balance sheets. Hence, we believe they are
unlikely to undertake incremental capacity additions in the coming years unless they start to
see growing returns for their existing plants.
Increase in limestone costs as mines auctioned at material premium
The process of acquiring limestone mines, which is the key raw material in cement
production, has undergone a significant change post MMDR (Amendment) Act, 2015. As
limestone is one among the ‘notified’ minerals under the act, licensing of mines has to go
through a compulsory bidding process, which creates a level playing field for all cement
players. It also creates an additional cost burden, which shaves away profitability.
Players have been aggressively bidding in limestone block auctions, with winning bids at
recent auctions going as high as 125% of the value of the mineral. The top five players in
the industry have won over ~50% of the 2.80 bn tonnes of limestone reserves, while new
Shree Cement Ltd.
SKP Securities Ltd www.skpsecurities.com Page 11 of 33
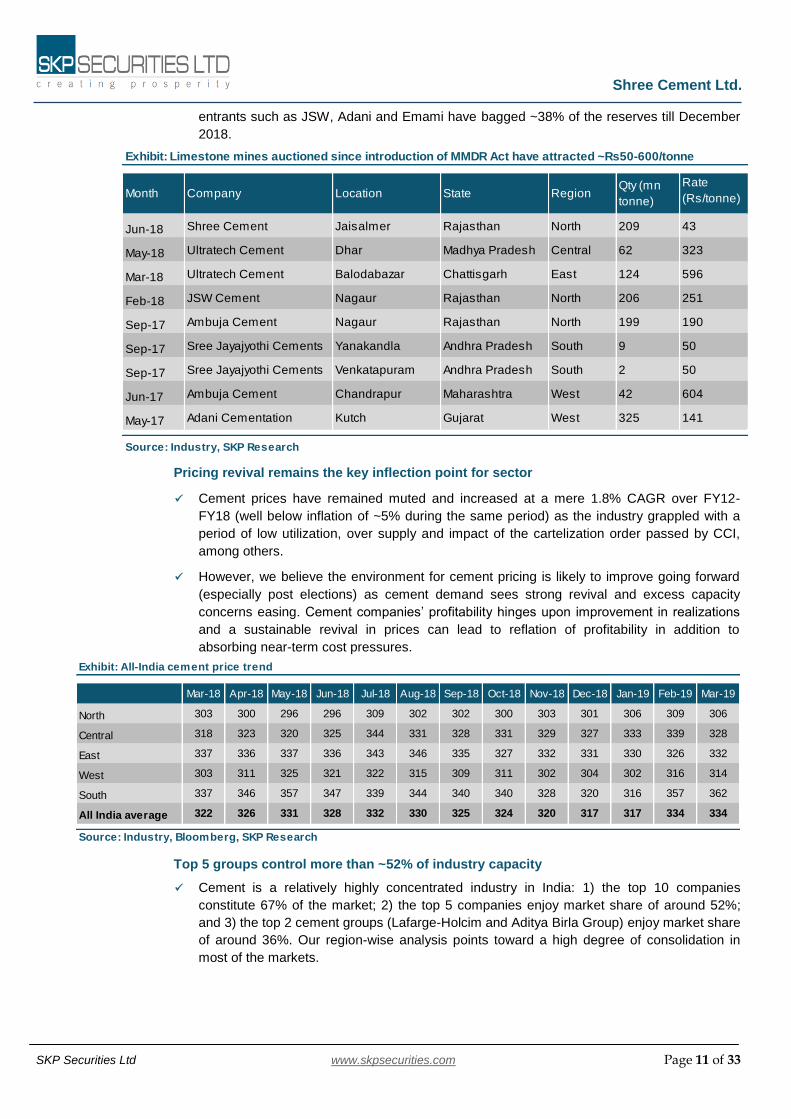
Exhibit: Limestone mines auctioned since introduction of MMDR Act have attracted ~Rs50-600/tonne
Jun-18 Shree Cement Jaisalmer Rajasthan North 209 43
May-18 Ultratech Cement Dhar Madhya Pradesh Central 62 323
Mar-18 Ultratech Cement Balodabazar Chattisgarh East 124 596
Feb-18 JSW Cement Nagaur Rajasthan North 206 251
Sep-17 Ambuja Cement Nagaur Rajasthan North 199 190
Sep-17 Sree Jayajyothi Cements Yanakandla Andhra Pradesh South 9 50
Sep-17 Sree Jayajyothi Cements Venkatapuram Andhra Pradesh South 2 50
Jun-17 Ambuja Cement Chandrapur Maharashtra West 42 604
May-17 Adani Cementation Kutch Gujarat West 325 141
Source: Industry, SKP Research
MonthQty (mn
tonne)
Rate
(Rs/tonne)Company Location State Region
Exhibit: All-India cement price trend
Mar-18 Apr-18 May-18 Jun-18 Jul-18 Aug-18 Sep-18 Oct-18 Nov-18 Dec-18 Jan-19 Feb-19 Mar-19
North 303 300 296 296 309 302 302 300 303 301 306 309 306
Central 318 323 320 325 344 331 328 331 329 327 333 339 328
East 337 336 337 336 343 346 335 327 332 331 330 326 332
West 303 311 325 321 322 315 309 311 302 304 302 316 314
South 337 346 357 347 339 344 340 340 328 320 316 357 362
All India average 322 326 331 328 332 330 325 324 320 317 317 334 334
Source: Industry, Bloomberg, SKP Research
entrants such as JSW, Adani and Emami have bagged ~38% of the reserves till December
2018.
Pricing revival remains the key inflection point for sector
Cement prices have remained muted and increased at a mere 1.8% CAGR over FY12-
FY18 (well below inflation of ~5% during the same period) as the industry grappled with a
period of low utilization, over supply and impact of the cartelization order passed by CCI,
among others.
However, we believe the environment for cement pricing is likely to improve going forward
(especially post elections) as cement demand sees strong revival and excess capacity
concerns easing. Cement companies’ profitability hinges upon improvement in realizations
and a sustainable revival in prices can lead to reflation of profitability in addition to
absorbing near-term cost pressures.
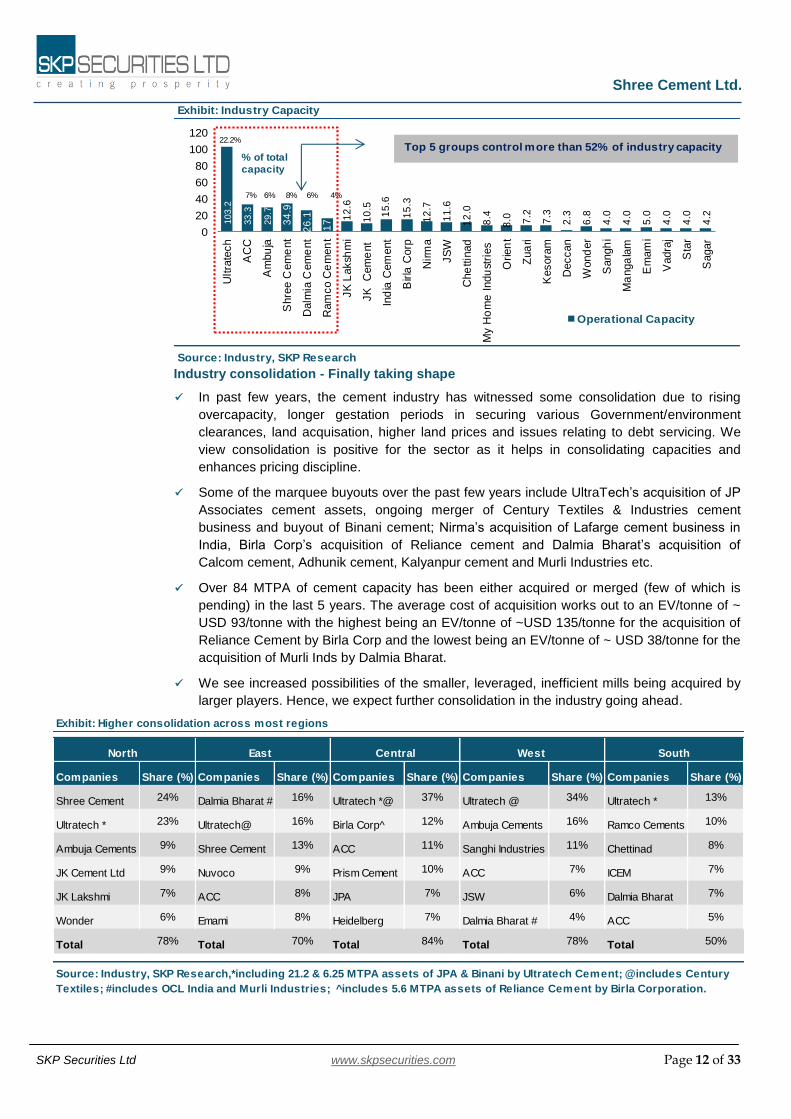
Top 5 groups control more than ~52% of industry capacity
Cement is a relatively highly concentrated industry in India: 1) the top 10 companies
constitute 67% of the market; 2) the top 5 companies enjoy market share of around 52%;
and 3) the top 2 cement groups (Lafarge-Holcim and Aditya Birla Group) enjoy market share
of around 36%. Our region-wise analysis points toward a high degree of consolidation in
most of the markets.
Shree Cement Ltd.
SKP Securities Ltd www.skpsecurities.com Page 12 of 33
Exhibit: Higher consolidation across most regions
Companies Share (%) Companies Share (%) Companies Share (%) Companies Share (%) Companies Share (%)
Shree Cement 24% Dalmia Bharat # 16% Ultratech *@ 37% Ultratech @ 34% Ultratech * 13%
Ultratech * 23% Ultratech@ 16% Birla Corp^ 12% Ambuja Cements 16% Ramco Cements 10%
Ambuja Cements 9% Shree Cement 13% ACC 11% Sanghi Industries 11% Chettinad 8%
JK Cement Ltd 9% Nuvoco 9% Prism Cement 10% ACC 7% ICEM 7%
JK Lakshmi 7% ACC 8% JPA 7% JSW 6% Dalmia Bharat 7%
Wonder 6% Emami 8% Heidelberg 7% Dalmia Bharat # 4% ACC 5%
Total 78% Total 70% Total 84% Total 78% Total 50%
Source: Industry, SKP Research,*including 21.2 & 6.25 MTPA assets of JPA & Binani by Ultratech Cement; @includes Century
Textiles; #includes OCL India and Murli Industries; ^includes 5.6 MTPA assets of Reliance Cement by Birla Corporation.
North East Central West South
Exhibit: Industry Capacity
Source: Industry, SKP Research
10
3.2
33.3
29.7
34
.9
26
.1
17 1
2.6
10
.5
15
.6
15
.3
12
.7
11
.6
12
.0
8.4
8.0 7.2
7.3
2.3
6.8
4.0
4.0
5.0
4.0
4.0
4.2
0
20
40
60
80
100
120
Ultra
tech
AC
C
Am
bu
ja
Shre
e C
em
ent
Dalm
ia C
em
ent
Ram
co C
em
en
t
JK
Laksh
mi
JK
C
em
ent
Ind
ia C
em
ent
Birla
Corp
Nirm
a
JS
W
Che
ttin
ad
My H
om
e I
ndu
stri
es
Orien
t
Zua
ri
Kesora
m
Deccan
Wond
er
Sangh
i
Ma
nga
lam
Em
am
i
Vadra
j
Sta
r
Sagar
Operational Capacity
22.2%
7% 6% 8% 6% 4%
% of total
capacity
Top 5 groups control more than 52% of industry capacity
Industry consolidation - Finally taking shape
In past few years, the cement industry has witnessed some consolidation due to rising
overcapacity, longer gestation periods in securing various Government/environment
clearances, land acquisation, higher land prices and issues relating to debt servicing. We
view consolidation is positive for the sector as it helps in consolidating capacities and
enhances pricing discipline.
Some of the marquee buyouts over the past few years include UltraTech’s acquisition of JP
Associates cement assets, ongoing merger of Century Textiles & Industries cement
business and buyout of Binani cement; Nirma’s acquisition of Lafarge cement business in
India, Birla Corp’s acquisition of Reliance cement and Dalmia Bharat’s acquisition of
Calcom cement, Adhunik cement, Kalyanpur cement and Murli Industries etc.
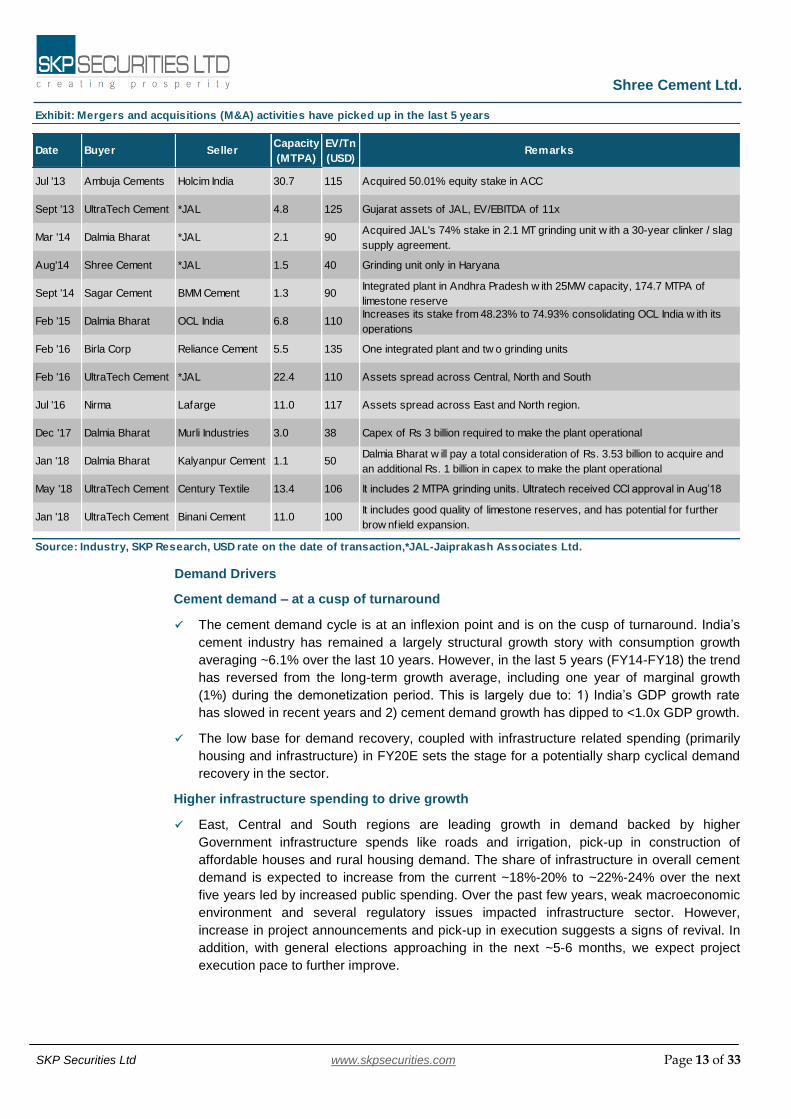
Over 84 MTPA of cement capacity has been either acquired or merged (few of which is
pending) in the last 5 years. The average cost of acquisition works out to an EV/tonne of ~
USD 93/tonne with the highest being an EV/tonne of ~USD 135/tonne for the acquisition of
Reliance Cement by Birla Corp and the lowest being an EV/tonne of ~ USD 38/tonne for the
acquisition of Murli Inds by Dalmia Bharat.
We see increased possibilities of the smaller, leveraged, inefficient mills being acquired by
larger players. Hence, we expect further consolidation in the industry going ahead.
Shree Cement Ltd.
SKP Securities Ltd www.skpsecurities.com Page 13 of 33
Exhibit: Mergers and acquisitions (M&A) activities have picked up in the last 5 years
Date Buyer Seller Capacity
(MTPA)
EV/Tn
(USD)Remarks
Jul '13 Ambuja Cements Holcim India 30.7 115 Acquired 50.01% equity stake in ACC
Sept '13 UltraTech Cement *JAL 4.8 125 Gujarat assets of JAL, EV/EBITDA of 11x
Mar '14 Dalmia Bharat *JAL 2.1 90Acquired JAL's 74% stake in 2.1 MT grinding unit w ith a 30-year clinker / slag
supply agreement.
Aug'14 Shree Cement *JAL 1.5 40 Grinding unit only in Haryana
Sept '14 Sagar Cement BMM Cement 1.3 90Integrated plant in Andhra Pradesh w ith 25MW capacity, 174.7 MTPA of
limestone reserve
Feb '15 Dalmia Bharat OCL India 6.8 110Increases its stake from 48.23% to 74.93% consolidating OCL India w ith its
operations
Feb '16 Birla Corp Reliance Cement 5.5 135 One integrated plant and tw o grinding units
Feb '16 UltraTech Cement *JAL 22.4 110 Assets spread across Central, North and South
Jul '16 Nirma Lafarge 11.0 117 Assets spread across East and North region.
Dec '17 Dalmia Bharat Murli Industries 3.0 38 Capex of Rs 3 billion required to make the plant operational
Jan '18 Dalmia Bharat Kalyanpur Cement 1.1 50Dalmia Bharat w ill pay a total consideration of Rs. 3.53 billion to acquire and
an additional Rs. 1 billion in capex to make the plant operational
May '18 UltraTech Cement Century Textile 13.4 106 It includes 2 MTPA grinding units. Ultratech received CCI approval in Aug’18
Jan '18 UltraTech Cement Binani Cement 11.0 100It includes good quality of limestone reserves, and has potential for further
brow nfield expansion.
Source: Industry, SKP Research, USD rate on the date of transaction,*JAL-Jaiprakash Associates Ltd.
Demand Drivers Cement demand – at a cusp of turnaround
The cement demand cycle is at an inflexion point and is on the cusp of turnaround. India’s
cement industry has remained a largely structural growth story with consumption growth
averaging ~6.1% over the last 10 years. However, in the last 5 years (FY14-FY18) the trend
has reversed from the long-term growth average, including one year of marginal growth
(1%) during the demonetization period. This is largely due to: 1) India’s GDP growth rate
has slowed in recent years and 2) cement demand growth has dipped to <1.0x GDP growth.
The low base for demand recovery, coupled with infrastructure related spending (primarily
housing and infrastructure) in FY20E sets the stage for a potentially sharp cyclical demand
recovery in the sector.
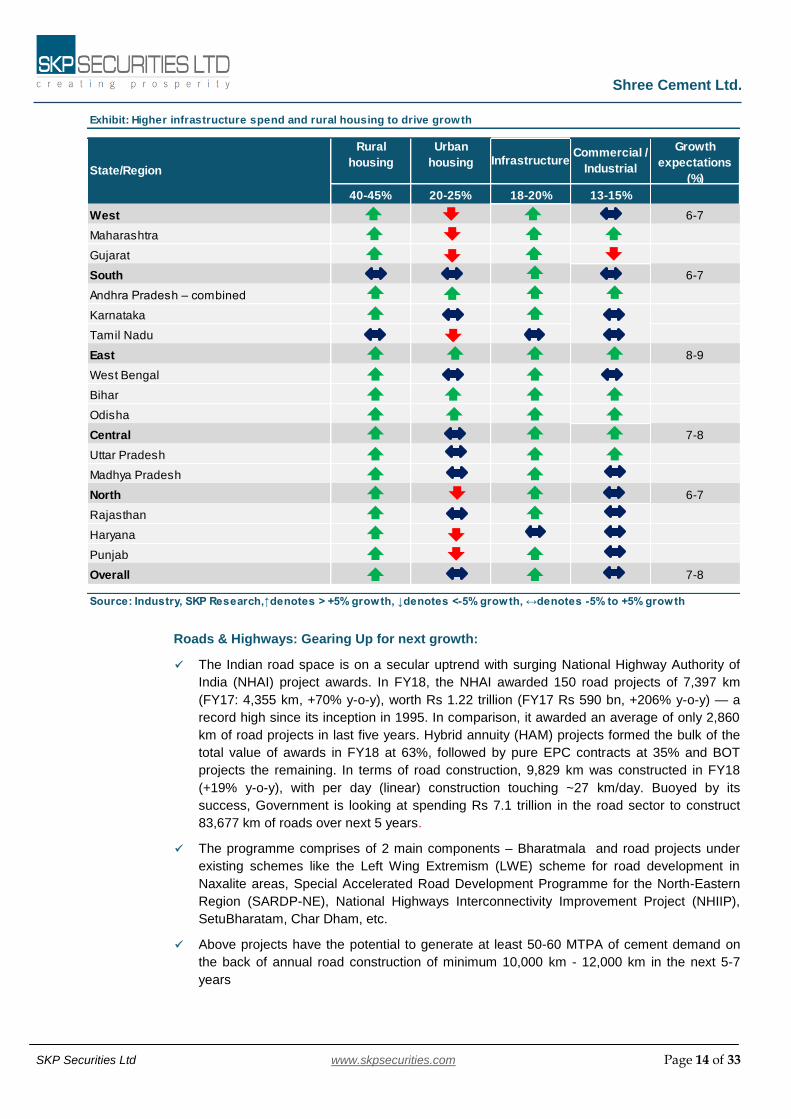
Higher infrastructure spending to drive growth
East, Central and South regions are leading growth in demand backed by higher
Government infrastructure spends like roads and irrigation, pick-up in construction of
affordable houses and rural housing demand. The share of infrastructure in overall cement
demand is expected to increase from the current ~18%-20% to ~22%-24% over the next
five years led by increased public spending. Over the past few years, weak macroeconomic
environment and several regulatory issues impacted infrastructure sector. However,
increase in project announcements and pick-up in execution suggests a signs of revival. In
addition, with general elections approaching in the next ~5-6 months, we expect project
execution pace to further improve.
Shree Cement Ltd.
SKP Securities Ltd www.skpsecurities.com Page 14 of 33
West
Maharashtra
Gujarat
South
Andhra Pradesh – combined
Karnataka
Tamil Nadu
East
West Bengal
Bihar
Odisha
Central
Uttar Pradesh
Madhya Pradesh
North
Rajasthan
Haryana
Punjab
Overall
Source: Industry, SKP Research,↑denotes > +5% growth, ↓denotes <-5% growth, ↔denotes -5% to +5% growth
6-7
6-7
8-9
7-8
6-7
7-8
Exhibit: Higher infrastructure spend and rural housing to drive growth
State/Region
Rural
housing
Urban
housing InfrastructureCommercial /
Industrial
Growth
expectations
(%)
40-45% 20-25% 18-20% 13-15%
Roads & Highways: Gearing Up for next growth:
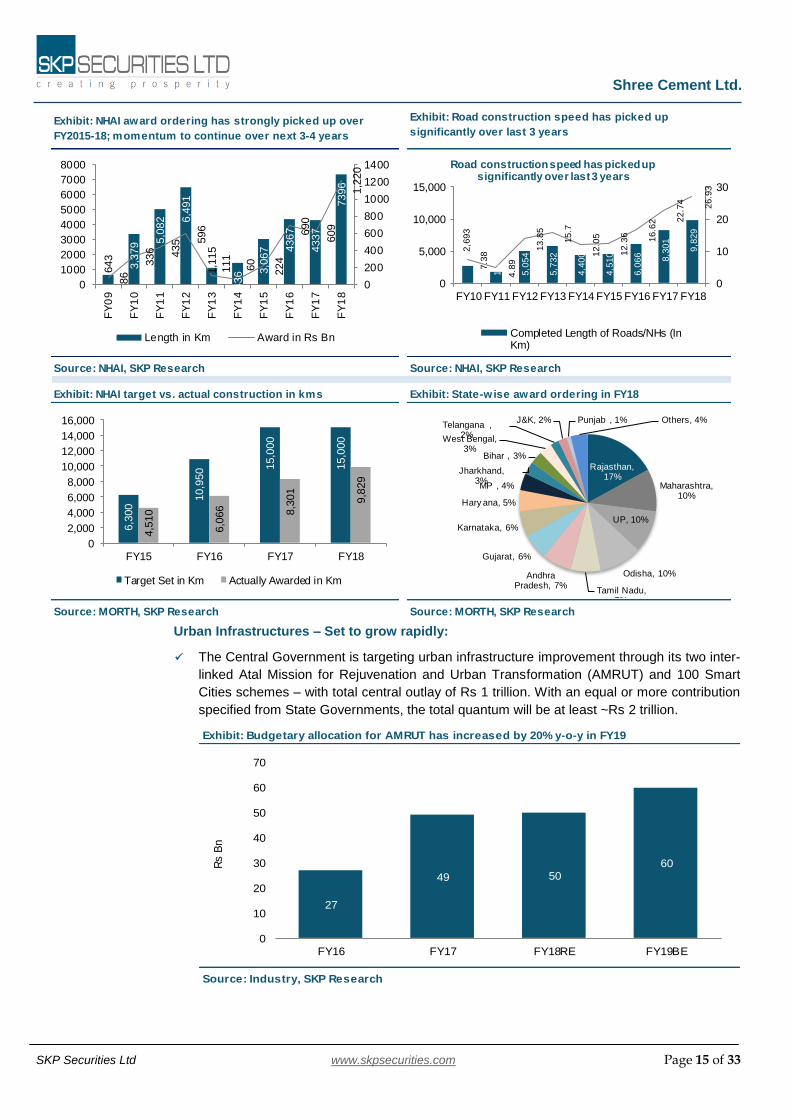
The Indian road space is on a secular uptrend with surging National Highway Authority of
India (NHAI) project awards. In FY18, the NHAI awarded 150 road projects of 7,397 km
(FY17: 4,355 km, +70% y-o-y), worth Rs 1.22 trillion (FY17 Rs 590 bn, +206% y-o-y) — a
record high since its inception in 1995. In comparison, it awarded an average of only 2,860
km of road projects in last five years. Hybrid annuity (HAM) projects formed the bulk of the
total value of awards in FY18 at 63%, followed by pure EPC contracts at 35% and BOT
projects the remaining. In terms of road construction, 9,829 km was constructed in FY18
(+19% y-o-y), with per day (linear) construction touching ~27 km/day. Buoyed by its
success, Government is looking at spending Rs 7.1 trillion in the road sector to construct
83,677 km of roads over next 5 years.
The programme comprises of 2 main components – Bharatmala and road projects under
existing schemes like the Left Wing Extremism (LWE) scheme for road development in
Naxalite areas, Special Accelerated Road Development Programme for the North-Eastern
Region (SARDP-NE), National Highways Interconnectivity Improvement Project (NHIIP),
SetuBharatam, Char Dham, etc.
Above projects have the potential to generate at least 50-60 MTPA of cement demand on
the back of annual road construction of minimum 10,000 km - 12,000 km in the next 5-7
years
Shree Cement Ltd.
SKP Securities Ltd www.skpsecurities.com Page 15 of 33
Source: NHAI, SKP Research Source: NHAI, SKP Research
Exhibit: NHAI target vs. actual construction in kms Exhibit: State-wise award ordering in FY18
Source: MORTH, SKP Research Source: MORTH, SKP Research
Exhibit: NHAI award ordering has strongly picked up over
FY2015-18; momentum to continue over next 3-4 years
Exhibit: Road construction speed has picked up
significantly over last 3 years
643
3,3
79 5
,082 6,4
91
1,1
15
1,4
36 3
,067 4
367
4337
7396
86
336 435 5
96
111
60
224
690
609
1,2
20
0
200
400
600
800
1000
1200
1400
0
1000
2000
3000
4000
5000
6000
7000
8000
FY
09
FY
10
FY
11
FY
12
FY
13
FY
14
FY
15
FY
16
FY
17
FY
18
Length in Km Award in Rs Bn
2,6
93
1,7
86
5,0
54
5,7
32
4,4
00
4,5
10
6,0
66 8,3
01
9,8
29
7.3
8
4.8
9
13.8
5
15.7
12.0
5
12.3
6
16.6
2 22.7
4
26.9
3
0
10
20
30
0
5,000
10,000
15,000
FY10 FY11 FY12 FY13 FY14 FY15 FY16 FY17 FY18
Road construction speed has picked up significantly over last 3 years
Completed Length of Roads/NHs (InKm)
6,3
00
10,9
50 1
5,0
00
15,0
00
4,5
10
6,0
66 8,3
01
9,8
29
0
2,000
4,000
6,000
8,000
10,000
12,000
14,000
16,000
FY15 FY16 FY17 FY18
Target Set in Km Actually Awarded in Km
Rajasthan, 17%
Maharashtra, 10%
UP, 10%
Odisha, 10%
Tamil Nadu, 7%
Andhra Pradesh, 7%
Gujarat, 6%
Karnataka, 6%
Hary ana, 5%
MP , 4%
Jharkhand, 3%
Bihar , 3%
West Bengal, 3%
Telangana , 2%
J&K, 2% Punjab , 1% Others, 4%
Source: Industry, SKP Research
Exhibit: Budgetary allocation for AMRUT has increased by 20% y-o-y in FY19
27
49 5060
0
10
20
30
40
50
60
70
FY16 FY17 FY18RE FY19BE
Rs B
n
Urban Infrastructures – Set to grow rapidly:
The Central Government is targeting urban infrastructure improvement through its two inter-
linked Atal Mission for Rejuvenation and Urban Transformation (AMRUT) and 100 Smart
Cities schemes – with total central outlay of Rs 1 trillion. With an equal or more contribution
specified from State Governments, the total quantum will be at least ~Rs 2 trillion.
Shree Cement Ltd.
SKP Securities Ltd www.skpsecurities.com Page 16 of 33
Source: Ministry of Rural Development, SKP Research Source: Union Budget, SKP Research
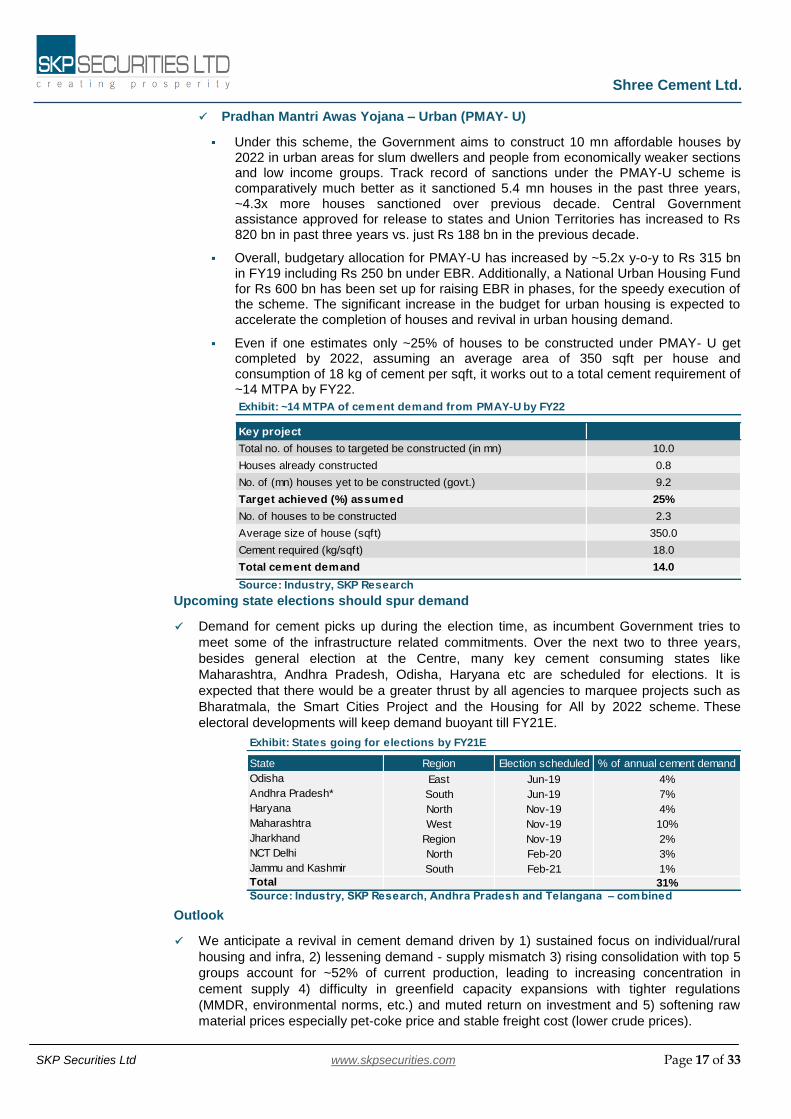
Exhibit: Budgetary allocation under PMAY-G increased by
43% y-o-y in FY19
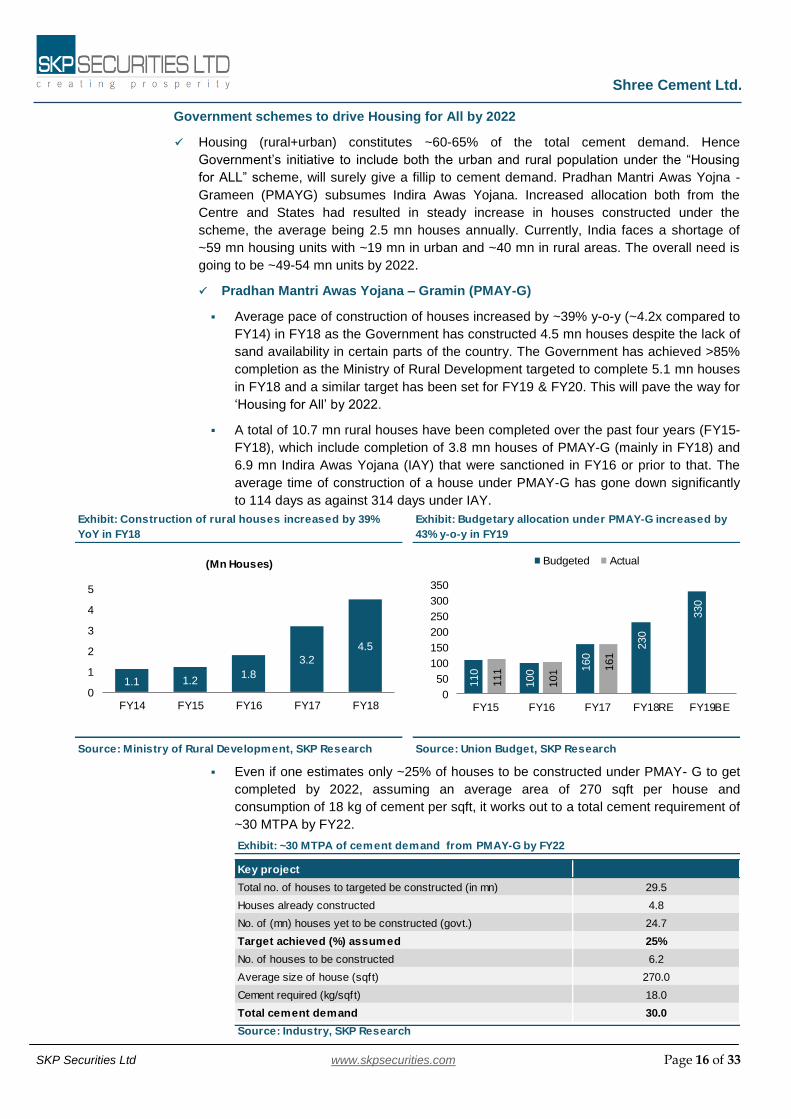
Exhibit: Construction of rural houses increased by 39%
YoY in FY18
1.1 1.21.8
3.2
4.5
0
1
2
3
4
5
FY14 FY15 FY16 FY17 FY18
(Mn Houses)
110
100 1
60
230
330
111
101 1
61
0
50
100
150
200
250
300
350
FY15 FY16 FY17 FY18RE FY19BE
Budgeted Actual
Exhibit: ~30 MTPA of cement demand from PMAY-G by FY22
Key project
Total no. of houses to targeted be constructed (in mn) 29.5
Houses already constructed 4.8
No. of (mn) houses yet to be constructed (govt.) 24.7
Target achieved (%) assumed 25%
No. of houses to be constructed 6.2
Average size of house (sqft) 270.0
Cement required (kg/sqft) 18.0
Total cement demand 30.0
Source: Industry, SKP Research
Government schemes to drive Housing for All by 2022
Housing (rural+urban) constitutes ~60-65% of the total cement demand. Hence
Government’s initiative to include both the urban and rural population under the “Housing
for ALL” scheme, will surely give a fillip to cement demand. Pradhan Mantri Awas Yojna -
Grameen (PMAYG) subsumes Indira Awas Yojana. Increased allocation both from the
Centre and States had resulted in steady increase in houses constructed under the
scheme, the average being 2.5 mn houses annually. Currently, India faces a shortage of
~59 mn housing units with ~19 mn in urban and ~40 mn in rural areas. The overall need is
going to be ~49-54 mn units by 2022.
Pradhan Mantri Awas Yojana – Gramin (PMAY-G)
Average pace of construction of houses increased by ~39% y-o-y (~4.2x compared to
FY14) in FY18 as the Government has constructed 4.5 mn houses despite the lack of
sand availability in certain parts of the country. The Government has achieved >85%
completion as the Ministry of Rural Development targeted to complete 5.1 mn houses
in FY18 and a similar target has been set for FY19 & FY20. This will pave the way for
‘Housing for All’ by 2022.
A total of 10.7 mn rural houses have been completed over the past four years (FY15-
FY18), which include completion of 3.8 mn houses of PMAY-G (mainly in FY18) and
6.9 mn Indira Awas Yojana (IAY) that were sanctioned in FY16 or prior to that. The
average time of construction of a house under PMAY-G has gone down significantly
to 114 days as against 314 days under IAY.
Even if one estimates only ~25% of houses to be constructed under PMAY- G to get
completed by 2022, assuming an average area of 270 sqft per house and
consumption of 18 kg of cement per sqft, it works out to a total cement requirement of
~30 MTPA by FY22.
Shree Cement Ltd.
SKP Securities Ltd www.skpsecurities.com Page 17 of 33
Exhibit: ~14 MTPA of cement demand from PMAY-U by FY22
Key project
Total no. of houses to targeted be constructed (in mn) 10.0
Houses already constructed 0.8
No. of (mn) houses yet to be constructed (govt.) 9.2
Target achieved (%) assumed 25%
No. of houses to be constructed 2.3
Average size of house (sqft) 350.0
Cement required (kg/sqft) 18.0
Total cement demand 14.0
Source: Industry, SKP Research
Exhibit: States going for elections by FY21E
State Region Election scheduled % of annual cement demand
Odisha East Jun-19 4%
Andhra Pradesh* South Jun-19 7%
Haryana North Nov-19 4%
Maharashtra West Nov-19 10%
Jharkhand Region Nov-19 2%
NCT Delhi North Feb-20 3%
Jammu and Kashmir South Feb-21 1%
Total 31%
Source: Industry, SKP Research, Andhra Pradesh and Telangana – combined
Pradhan Mantri Awas Yojana – Urban (PMAY- U)
Under this scheme, the Government aims to construct 10 mn affordable houses by 2022 in urban areas for slum dwellers and people from economically weaker sections and low income groups. Track record of sanctions under the PMAY-U scheme is comparatively much better as it sanctioned 5.4 mn houses in the past three years, ~4.3x more houses sanctioned over previous decade. Central Government assistance approved for release to states and Union Territories has increased to Rs 820 bn in past three years vs. just Rs 188 bn in the previous decade.
Overall, budgetary allocation for PMAY-U has increased by ~5.2x y-o-y to Rs 315 bn in FY19 including Rs 250 bn under EBR. Additionally, a National Urban Housing Fund for Rs 600 bn has been set up for raising EBR in phases, for the speedy execution of the scheme. The significant increase in the budget for urban housing is expected to accelerate the completion of houses and revival in urban housing demand.
Even if one estimates only ~25% of houses to be constructed under PMAY- U get completed by 2022, assuming an average area of 350 sqft per house and consumption of 18 kg of cement per sqft, it works out to a total cement requirement of ~14 MTPA by FY22.
Upcoming state elections should spur demand
Demand for cement picks up during the election time, as incumbent Government tries to
meet some of the infrastructure related commitments. Over the next two to three years,
besides general election at the Centre, many key cement consuming states like
Maharashtra, Andhra Pradesh, Odisha, Haryana etc are scheduled for elections. It is
expected that there would be a greater thrust by all agencies to marquee projects such as
Bharatmala, the Smart Cities Project and the Housing for All by 2022 scheme. These
electoral developments will keep demand buoyant till FY21E.
Outlook
We anticipate a revival in cement demand driven by 1) sustained focus on individual/rural
housing and infra, 2) lessening demand - supply mismatch 3) rising consolidation with top 5
groups account for ~52% of current production, leading to increasing concentration in
cement supply 4) difficulty in greenfield capacity expansions with tighter regulations
(MMDR, environmental norms, etc.) and muted return on investment and 5) softening raw
material prices especially pet-coke price and stable freight cost (lower crude prices).
Shree Cement Ltd.
SKP Securities Ltd www.skpsecurities.com Page 18 of 33
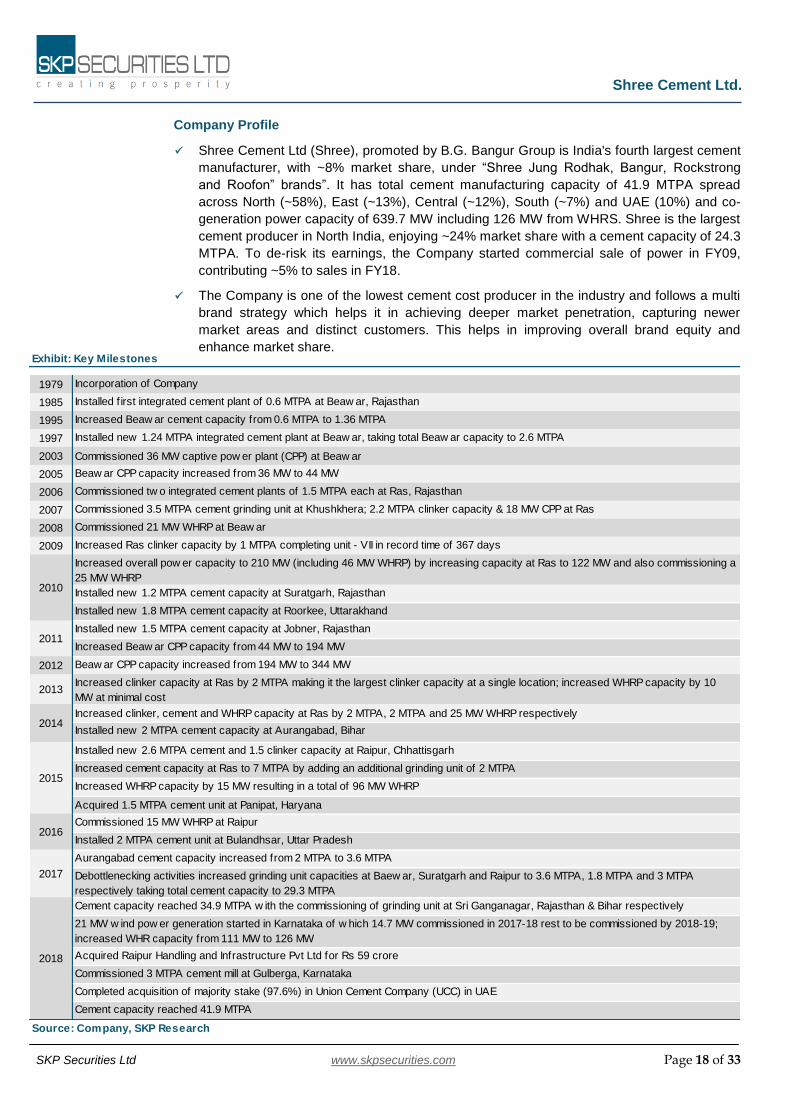
Exhibit: Key Milestones
1979 Incorporation of Company
1985 Installed f irst integrated cement plant of 0.6 MTPA at Beaw ar, Rajasthan
1995 Increased Beaw ar cement capacity from 0.6 MTPA to 1.36 MTPA
1997 Installed new 1.24 MTPA integrated cement plant at Beaw ar, taking total Beaw ar capacity to 2.6 MTPA
2003 Commissioned 36 MW captive pow er plant (CPP) at Beaw ar
2005 Beaw ar CPP capacity increased from 36 MW to 44 MW
2006 Commissioned tw o integrated cement plants of 1.5 MTPA each at Ras, Rajasthan
2007 Commissioned 3.5 MTPA cement grinding unit at Khushkhera; 2.2 MTPA clinker capacity & 18 MW CPP at Ras
2008 Commissioned 21 MW WHRP at Beaw ar
2009 Increased Ras clinker capacity by 1 MTPA completing unit - VII in record time of 367 days
Increased overall pow er capacity to 210 MW (including 46 MW WHRP) by increasing capacity at Ras to 122 MW and also commissioning a
25 MW WHRP
Installed new 1.2 MTPA cement capacity at Suratgarh, Rajasthan
Installed new 1.8 MTPA cement capacity at Roorkee, Uttarakhand
Installed new 1.5 MTPA cement capacity at Jobner, Rajasthan
Increased Beaw ar CPP capacity from 44 MW to 194 MW
2012 Beaw ar CPP capacity increased from 194 MW to 344 MW
2013Increased clinker capacity at Ras by 2 MTPA making it the largest clinker capacity at a single location; increased WHRP capacity by 10
MW at minimal cost
Increased clinker, cement and WHRP capacity at Ras by 2 MTPA, 2 MTPA and 25 MW WHRP respectively
Installed new 2 MTPA cement capacity at Aurangabad, Bihar
Installed new 2.6 MTPA cement and 1.5 clinker capacity at Raipur, Chhattisgarh
Increased cement capacity at Ras to 7 MTPA by adding an additional grinding unit of 2 MTPA
Increased WHRP capacity by 15 MW resulting in a total of 96 MW WHRP
Acquired 1.5 MTPA cement unit at Panipat, Haryana
Commissioned 15 MW WHRP at Raipur
Installed 2 MTPA cement unit at Bulandhsar, Uttar Pradesh
Aurangabad cement capacity increased from 2 MTPA to 3.6 MTPA
Debottlenecking activities increased grinding unit capacities at Baew ar, Suratgarh and Raipur to 3.6 MTPA, 1.8 MTPA and 3 MTPA
respectively taking total cement capacity to 29.3 MTPA
Cement capacity reached 34.9 MTPA w ith the commissioning of grinding unit at Sri Ganganagar, Rajasthan & Bihar respectively
21 MW w ind pow er generation started in Karnataka of w hich 14.7 MW commissioned in 2017-18 rest to be commissioned by 2018-19;
increased WHR capacity from 111 MW to 126 MW
Acquired Raipur Handling and Infrastructure Pvt Ltd for Rs 59 crore
Commissioned 3 MTPA cement mill at Gulberga, Karnataka
Completed acquisition of majority stake (97.6%) in Union Cement Company (UCC) in UAE
Cement capacity reached 41.9 MTPA
Source: Company, SKP Research
2017
2018
2010
2011
2014
2016
2015
Company Profile
Shree Cement Ltd (Shree), promoted by B.G. Bangur Group is India's fourth largest cement
manufacturer, with ~8% market share, under “Shree Jung Rodhak, Bangur, Rockstrong
and Roofon” brands”. It has total cement manufacturing capacity of 41.9 MTPA spread
across North (~58%), East (~13%), Central (~12%), South (~7%) and UAE (10%) and co-
generation power capacity of 639.7 MW including 126 MW from WHRS. Shree is the largest
cement producer in North India, enjoying ~24% market share with a cement capacity of 24.3
MTPA. To de-risk its earnings, the Company started commercial sale of power in FY09,
contributing ~5% to sales in FY18.
The Company is one of the lowest cement cost producer in the industry and follows a multi
brand strategy which helps it in achieving deeper market penetration, capturing newer
market areas and distinct customers. This helps in improving overall brand equity and
enhance market share.

Shree Cement Ltd.
SKP Securities Ltd www.skpsecurities.com Page 19 of 33
Source: Company, SKP Research,*Includes UAE capacity of 4 MTPA
Exhibit : Capacity Over the Last 5 years
Year- 2014Installed capacity: 17.5 MTPA
Year- 2019E*Installed capacity: 41.9 MTPA
#7 plants in #3 states #11 plants in #7 states
Capacity has doubled in last 4 years
Over the years, Shree has transformed itself from being a regional player (north India) to
currently having presence in east, central and now south India by following small but regular
organic and inorganic expansions. From FY14 till date, the Company has multiplied its
capacity by 2.4x from 17.5 MTPA to currently 41.9 MTPA by adding 10.8 MTPA capacity in
north and central, followed by 6.6 mtpa capacity in east and 3 mtpa capacity in south.
Lately, Shree has established its footprint in UAE with acquisition of Union Cement
Company (UCC) having 4 MTPA cement capacity at an enterprise value (EV) of Rs 19.5 bn.
The Company has a track record of completing projects within time periods, much lower
than the industry standards, thereby optimizing on both cost and time. Though, incremental
capacity additions especially Greenfield will come at a higher cost due to challenges in
acquiring land coupled with higher land prices and securing long term availability of
limestone, particularly under the dynamic regulatory environment.
Revenue Mix
Shree has three business segments viz. cement, clinker and Power. Cement vertical
contributes ~90%+ of total sales whereas clinker and power vertical contributes ~8-10% of
total sales.
Exhibit: Revenue Mix - (%)
FY14 FY15 FY16 FY17 FY18 FY19E FY20E FY21E
Cement 89.5% 88.6% 90.4% 92.4% 94% 93.0% 94.3% 94.9%
Clinker 0.7% 1.7% 0.2% 1.6% 2% 1.9% 1.9% 1.9%
Power Sales 9.8% 9.8% 9.4% 6.0% 4% 5.1% 3.7% 3.2%
Source: Company, SKP Research

Shree Cement Ltd.
SKP Securities Ltd www.skpsecurities.com Page 20 of 33
Parameter Cement Power Clinker
Key competitors
Demand drivers
Credit Rating
Source: Company, SKP Research
Key risks
2%
2%
Exhibit : Shree Cement Limited - Business Mix
Geographic presence
Sales grow th (FY14-FY18 – 4-yr CAGR)
Sales forecast (FY18-FY21 – 3-yr CAGR)
4%
3%
Revenue contribution (FY18) 94%
(14%) (12% grow th in volume and 2% grow th in realization CAGR).
(20%) (17% grow th in volume and 3% grow th in realization CAGR).
Capital Allocation
North (~58%), East (~13%), Central (~12%), South (~7%) and UAE (10%).
Shree is India's fourth largest cement manufacturer, w ith ~8% market share, and a total
manufacturing capacity of 41.9 MTPA. It is also the largest cement producer in North India,
enjoying ~24% market share w ith a cement capacity of 24.3 MTPA. The north plant is strategically
located in central Rajasthan from w here it caters to entire Rajastha, NCR and Haryana at
economical logistic cost. Off late, the Company has forayed into eastern markets by setting up an
integrated unit at Chattisgarh and grinding unit at Bihar. It is also venturing into South markets
through a green filed expansion at Gulbarga, Karnataka.
Shree has been prudent in capital allocation. Unlike majority cement players, w herein capital
deployment is for servicing debt/equity, Shree cement’s capital allocation is for putting cement
capacities—w here cash ROCE >30%. Shree is enhanced capacity over FY14-18, more than 2x at
capital cost of $60-90/tonne (peers take anyw here betw een $100 and $160/tonne and 2x Shree’s
delivery time). A shorter payback compounds cash flow s faster, w hich is again deployed in
business to enhance market share w ithout dilution.
Revenue contribution (FY21E)
Market position
Aditya Birla Group, Holcim-Lafarge, Dalmia Bharat and Ramco Cements.
Direct beneficiary of low -cost housing push, higher infrastructure spending, rising industry
consolidation & upcoming elections should spur demand.
Government’s failure to revive infrastructure projects.
A substantial increase in operating cost.
95%
CARE Ratings assigned CARE A1+ rating in view of long and satisfactory track record of the
company.
Clinker capacity
Shree total clinker capacity stands at 23.4 MTPA spread across north (15.4 MTPA), east
(5.2 MTPA) and south (2.8 MTPA). The Company has no plans of adding another clinker
capacity for new grinding units. Though, 5.2 MTPA east clinker capacity with some
debottlenecking will cater to 14 MTPA of grinding capacity.
Overall cement-to-clinker ratio for Shree is at 1.45x while, in the east the ratio is at 2x due to
higher sales of blended cement. The new grinding unit in Pune of 2 mtpa will likely source
clinker from Karnataka plant.
Exhibit: Clinker capacity
Source: Company, SKP Research
15.4
5.2
2.8
23.4
North East South Total Capacity
MTPA
Shree Cement Ltd.
SKP Securities Ltd www.skpsecurities.com Page 21 of 33
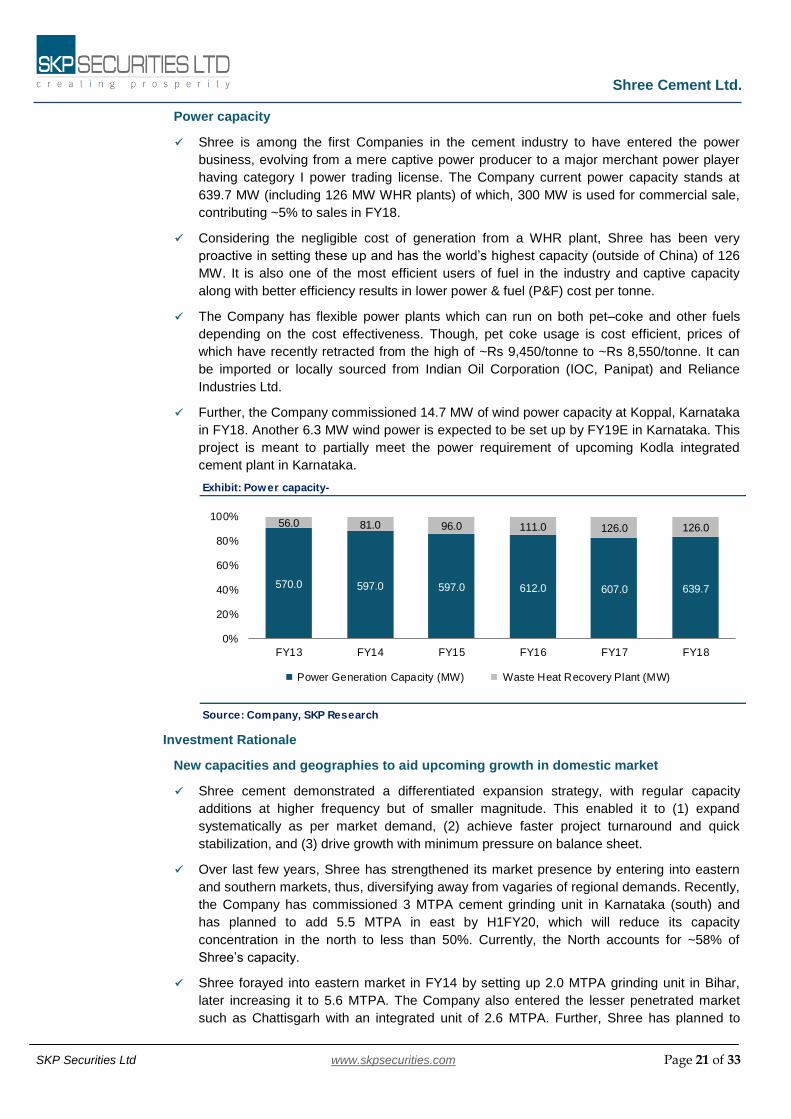
Exhibit: Power capacity-
Source: Company, SKP Research
570.0 597.0 597.0 612.0 607.0 639.7
56.0 81.0 96.0 111.0 126.0 126.0
0%
20%
40%
60%
80%
100%
FY13 FY14 FY15 FY16 FY17 FY18
Power Generation Capacity (MW) Waste Heat Recovery Plant (MW)
Power capacity
Shree is among the first Companies in the cement industry to have entered the power
business, evolving from a mere captive power producer to a major merchant power player
having category I power trading license. The Company current power capacity stands at
639.7 MW (including 126 MW WHR plants) of which, 300 MW is used for commercial sale,
contributing ~5% to sales in FY18.
Considering the negligible cost of generation from a WHR plant, Shree has been very
proactive in setting these up and has the world’s highest capacity (outside of China) of 126
MW. It is also one of the most efficient users of fuel in the industry and captive capacity
along with better efficiency results in lower power & fuel (P&F) cost per tonne.
The Company has flexible power plants which can run on both pet–coke and other fuels
depending on the cost effectiveness. Though, pet coke usage is cost efficient, prices of
which have recently retracted from the high of ~Rs 9,450/tonne to ~Rs 8,550/tonne. It can
be imported or locally sourced from Indian Oil Corporation (IOC, Panipat) and Reliance
Industries Ltd.
Further, the Company commissioned 14.7 MW of wind power capacity at Koppal, Karnataka
in FY18. Another 6.3 MW wind power is expected to be set up by FY19E in Karnataka. This
project is meant to partially meet the power requirement of upcoming Kodla integrated
cement plant in Karnataka.
Investment Rationale
New capacities and geographies to aid upcoming growth in domestic market
Shree cement demonstrated a differentiated expansion strategy, with regular capacity
additions at higher frequency but of smaller magnitude. This enabled it to (1) expand
systematically as per market demand, (2) achieve faster project turnaround and quick
stabilization, and (3) drive growth with minimum pressure on balance sheet.
Over last few years, Shree has strengthened its market presence by entering into eastern
and southern markets, thus, diversifying away from vagaries of regional demands. Recently,
the Company has commissioned 3 MTPA cement grinding unit in Karnataka (south) and
has planned to add 5.5 MTPA in east by H1FY20, which will reduce its capacity
concentration in the north to less than 50%. Currently, the North accounts for ~58% of
Shree’s capacity.
Shree forayed into eastern market in FY14 by setting up 2.0 MTPA grinding unit in Bihar,
later increasing it to 5.6 MTPA. The Company also entered the lesser penetrated market
such as Chattisgarh with an integrated unit of 2.6 MTPA. Further, Shree has planned to

Shree Cement Ltd.
SKP Securities Ltd www.skpsecurities.com Page 22 of 33
setup 3 MTPA cement grinding unit in Odisha and 2.5 MTPA cement grinding unit in
Jharkhand at a capex of Rs 4.23 bn and Rs 4.8 bn respectively which is expected to come
on stream by H1FY20. Post expansion, Shree capacity in eastern region will increase from
8.6 MTPA to 14.1 MTPA, and total capacity will stand at 49.4 MTPA including overseas
capacity of 4 MTPA.
Exhibit : Cement capacity at various locations-
FY14 FY15 FY16 FY17 FY18 FY19E FY20E FY21E
Beawar, Rajasthan 3.0 3.0 3.0 3.6 3.6 3.6 3.6 3.6
Ras, Rajasthan 5.0 7.0 7.0 7.0 7.0 7.0 7.0 7.0
Khushkhera, Rajasthan 3.0 3.0 3.0 3.5 3.5 3.5 3.5 3.5
Suratgarh, Rajasthan 1.2 1.2 1.2 1.8 5.4 5.4 5.4 5.4
Laksar, Uttarakhand 1.8 1.8 1.8 1.8 1.8 1.8 1.8 1.8
Jobner, Rajasthan (Jaipur) 1.5 1.5 1.5 1.5 1.5 1.5 1.5 1.5
Panipat, Haryana — 1.5 1.5 1.5 1.5 1.5 1.5 1.5
North 15.5 19.0 19.0 20.7 24.3 24.3 24.3 24.3
Bulandsahar, Uttar Pradesh — — 2.0 2.0 2.0 2.0 2.0 2.0
Central 0.0 0 2.0 2.0 2.0 2.0 2.0 2.0
Raipur, Chhattisgarh — 2.6 2.6 3.0 3.0 3.0 3.0 3.0
Aurangabad, Bihar 2.0 2.0 2.0 3.6 5.6 5.6 5.6 5.6
Cuttack, Odisha — — — — — — 3.0 3.0
Jharkhand — — — — — — 2.5 2.5
East 2.0 4.6 4.6 6.6 8.6 8.6 14.1 14.1
Karnataka — — — — — 3.0 3.0 3.0
South 0.0 0.0 0.0 0.0 0.0 3.0 3 3
Pune — — — — — — — 2
West 0.0 0.0 0.0 0.0 0.0 0.0 0.0 2.0
UAE 4.0 4.0 4.0
Cement capacity (MTPA) 17.5 23.6 25.6 29.3 34.9 41.9 47.4 49.4
Source: Company, SKP Research
The eastern and southern region is expected to witness sustained demand recovery driven
by rejuvenated housing and infrastructure development, thereby, resulting in better volumes
and realisations, partially absorbing the rising cost pressures. Further, eastern market is
more attractive from a pricing standpoint as the road network in the state is not up to the
mark, which makes logistics heavily reliant on railways. Given the shortage of rakes at
railways, the movement of cement in the region is lopsided which supports prices.
Consequently, Shree is expected to grow volumes at ~1.4-1.5x industry growth. Apart from
capacity expansion, the Company has won an e-auction of limestone mines in Kutch,
Gujarat which will help augment its capacity and geographical reach in future.
Supply concerns receding; increasing entry barriers limit fragmentation and
consolidation of capacities to support prices, +VE for Shree cement
Over the last decade, in a zeal to gain market share, aggressive manufacturers added
robust capacity, leading to overcapacity and utilisations collapsing to 65% in 2018 from
peak of 83% in 2008. However, capex helped many manufacturers gain scale and size. Off-
late, country’s cement sector is passing through a phase of aggressive consolidation,
resulting in top 5 groups controlling ~52% of the industry capacity, aiding reduced
competation and better pricing power. Also, indirect entry barriers like land acquisition, high
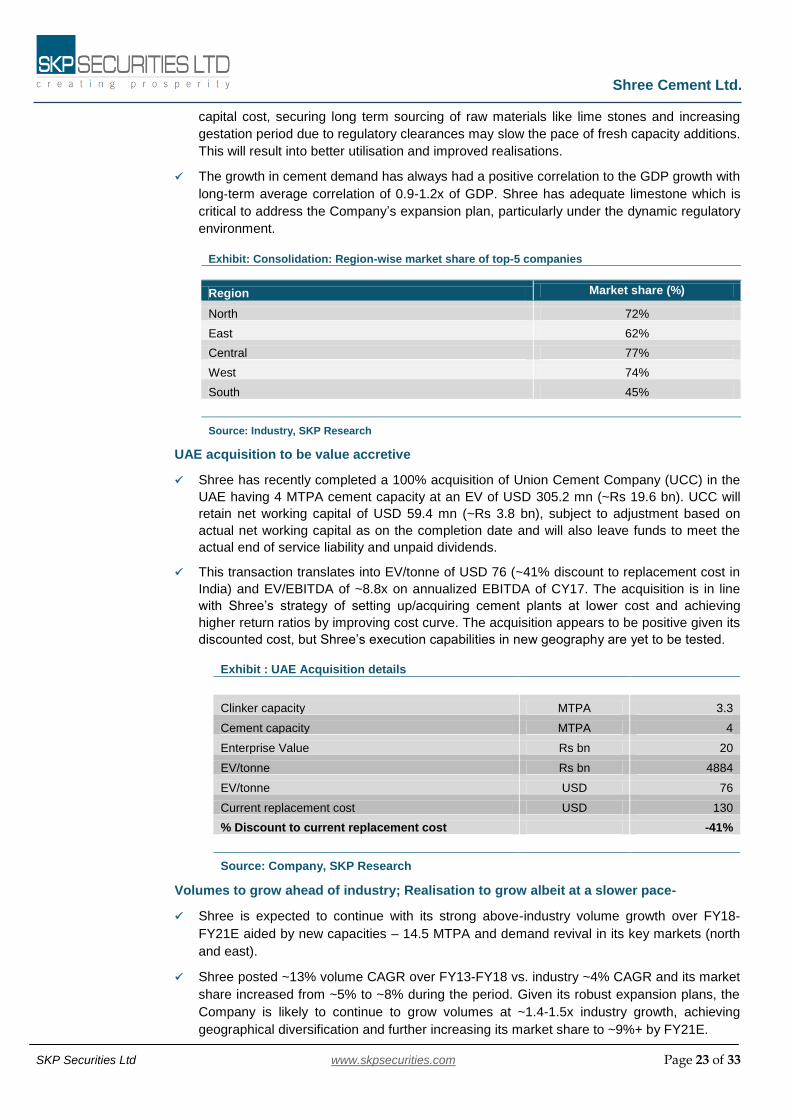
Shree Cement Ltd.
SKP Securities Ltd www.skpsecurities.com Page 23 of 33
capital cost, securing long term sourcing of raw materials like lime stones and increasing
gestation period due to regulatory clearances may slow the pace of fresh capacity additions.
This will result into better utilisation and improved realisations.
The growth in cement demand has always had a positive correlation to the GDP growth with
long‐term average correlation of 0.9-1.2x of GDP. Shree has adequate limestone which is
critical to address the Company’s expansion plan, particularly under the dynamic regulatory
environment.
Exhibit: Consolidation: Region-wise market share of top-5 companies
Region Market share (%)
North 72%
East 62%
Central 77%
West 74%
South 45%
Source: Industry, SKP Research
UAE acquisition to be value accretive
Shree has recently completed a 100% acquisition of Union Cement Company (UCC) in the
UAE having 4 MTPA cement capacity at an EV of USD 305.2 mn (~Rs 19.6 bn). UCC will
retain net working capital of USD 59.4 mn (~Rs 3.8 bn), subject to adjustment based on
actual net working capital as on the completion date and will also leave funds to meet the
actual end of service liability and unpaid dividends.
This transaction translates into EV/tonne of USD 76 (~41% discount to replacement cost in
India) and EV/EBITDA of ~8.8x on annualized EBITDA of CY17. The acquisition is in line
with Shree’s strategy of setting up/acquiring cement plants at lower cost and achieving
higher return ratios by improving cost curve. The acquisition appears to be positive given its
discounted cost, but Shree’s execution capabilities in new geography are yet to be tested.
Exhibit : UAE Acquisition details
Clinker capacity MTPA 3.3
Cement capacity MTPA 4
Enterprise Value Rs bn 20
EV/tonne Rs bn 4884
EV/tonne USD 76
Current replacement cost USD 130
% Discount to current replacement cost -41%
Source: Company, SKP Research
Volumes to grow ahead of industry; Realisation to grow albeit at a slower pace-
Shree is expected to continue with its strong above-industry volume growth over FY18-
FY21E aided by new capacities – 14.5 MTPA and demand revival in its key markets (north
and east).
Shree posted ~13% volume CAGR over FY13-FY18 vs. industry ~4% CAGR and its market
share increased from ~5% to ~8% during the period. Given its robust expansion plans, the
Company is likely to continue to grow volumes at ~1.4-1.5x industry growth, achieving
geographical diversification and further increasing its market share to ~9%+ by FY21E.

Shree Cement Ltd.
SKP Securities Ltd www.skpsecurities.com Page 24 of 33
Exhibit : Realisation & Volumes
Source: Company, SKP Research
13.5
17.5 23.6
25.6
29.3 34.9 41.9 47.4
49.4
12.5
14.3
16.2
14.2
20.6
22.5 2
6.6 3
2.0 35.7
91.3%
105.3%
85.9%
57.7%
72.8% 74.6%
65.2%70.4% 73.6%
0.0%
20.0%
40.0%
60.0%
80.0%
100.0%
120.0%
0
10
20
30
40
50
60
FY13 FY14 FY15 FY16 FY17 FY18 FY19E FY20E FY21E
Cement capacity (MTPA) Cement & clinker Sales (MTPA) Capacity Utilization (%)
37263630
3630
3530
3880
4063 4226
44374570
Realisation (Rs/MTPA)
Realisation rates for Shree are below top players as it is regarded as a Tier-II brand and
hence sells at Rs 15-20 per bag lower price point. Shree is a volume player, which is also
reflected in its higher utilisation rates over the years. Also its absence from South (where
capacity is still ramping up) also impacts realisations as it is the most disciplined market.
But it more than makes up for it due to its highly efficient cost structure.
However, Management highlighted that as part of a longer term strategy, the company will
be patient to develop trade channels through brand positioning and adequate support to the
marketing function. Currently, Shree is focused on increasing trade sales over non-trade as
it offers a superior business case— realizations in the trade segment are higher by close to
Rs 350/tonne (Rs17/bag, net-of-taxes) and trade sales have superior operating margins
even after accounting for dealer margins and other associated costs. Therefore, we expect
Shree to grow volumes & realizations at a CAGR of 15.9% & 4% over FY19E-FY21E.
Cost leadership to provide competitive advantage
Shree is the lowest cost cement producer among significant players. This is largely due to
vision of the promoters to achieve economies of scale and maintain focus on improving
efficiencies well ahead of the industry. Despite lower realizations v/s. peers, Shree
demonstrates operating edge and superior profitability due to (1) efficient cost structure,
especially in energy consumption and power usage and (2) savings on freights, with lower
lead distances. Key factors attributable to cost efficiencies are:
Power efficiency
Shree’s cost leadership in power usage is attributable to (a) 100% utilization of captive
power, (b) lower electricity consumption per unit of coal. It was the pioneer in usage of
pet coke as fuel in India in 2002 and all its plants today can use 100% pet-coke, which is
cost efficient. Even though prices have spiked up this year, it is still cost efficient on fuel
cost per kcal basis. Also all its plants are 100% multi-fuel and can switch between fuels
based on market prices.
Recently, the Company witnessed headwinds in power cost (mainly led by higher coal &
pet coke prices and temporary ban on pet coke) and rise in freight cost (due to higher
diesel prices & lower ex-factory dispatches). This led to an increase in cost/tonne.
However, the Company has tried to mitigate the cost headwinds by improvement in
energy consumption levels (down to 68.6 kwh/t of cement from 70.0 kwh/t of cement)
and increase in generation from its WHR power plants, which helped cushion the blow of
a significant increase in input cost.
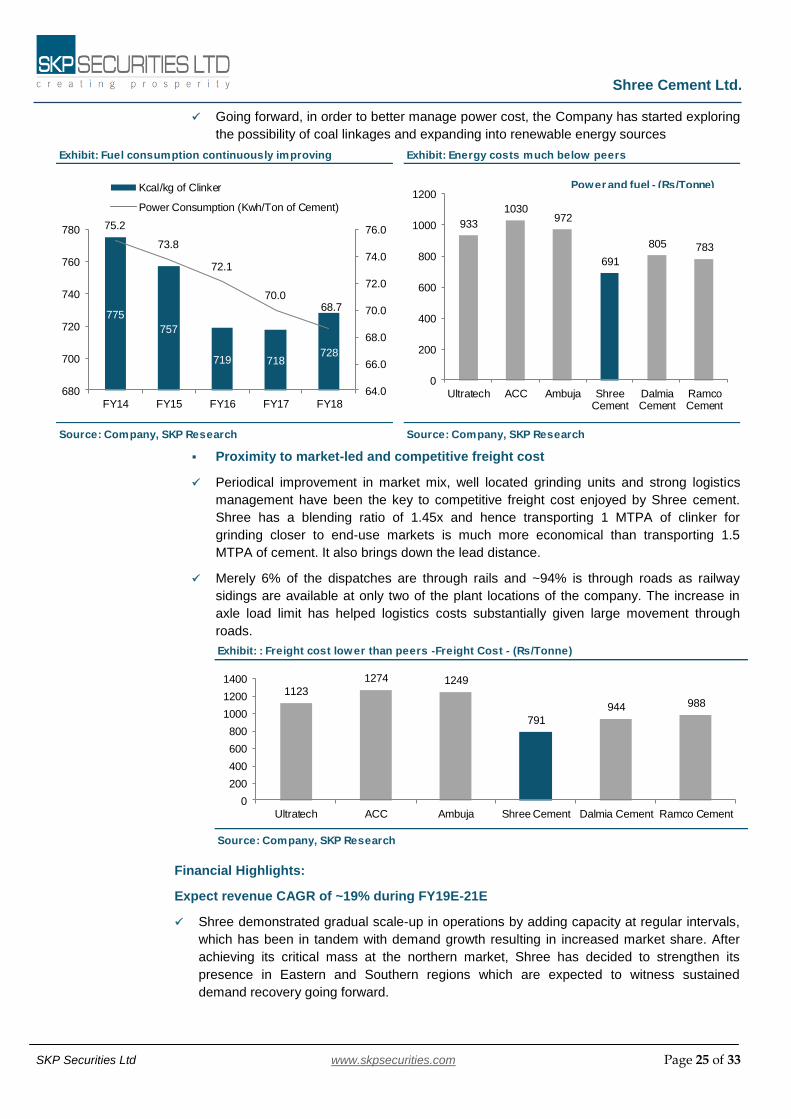
Shree Cement Ltd.
SKP Securities Ltd www.skpsecurities.com Page 25 of 33
Exhibit: Fuel consumption continuously improving Exhibit: Energy costs much below peers
Source: Company, SKP Research Source: Company, SKP Research
775
757
719 718728
75.2
73.8
72.1
70.068.7
64.0
66.0
68.0
70.0
72.0
74.0
76.0
680
700
720
740
760
780
FY14 FY15 FY16 FY17 FY18
Kcal/kg of Clinker
Power Consumption (Kwh/Ton of Cement)
933
1030972
691
805 783
0
200
400
600
800
1000
1200
Ultratech ACC Ambuja ShreeCement
DalmiaCement
RamcoCement
Power and fuel - (Rs/Tonne)
Source: Company, SKP Research
Exhibit: : Freight cost lower than peers -Freight Cost - (Rs/Tonne)
1123
1274 1249
791
944 988
0
200
400
600
800
1000
1200
1400
Ultratech ACC Ambuja Shree Cement Dalmia Cement Ramco Cement
Going forward, in order to better manage power cost, the Company has started exploring
the possibility of coal linkages and expanding into renewable energy sources
Proximity to market-led and competitive freight cost
Periodical improvement in market mix, well located grinding units and strong logistics
management have been the key to competitive freight cost enjoyed by Shree cement.
Shree has a blending ratio of 1.45x and hence transporting 1 MTPA of clinker for
grinding closer to end-use markets is much more economical than transporting 1.5
MTPA of cement. It also brings down the lead distance.
Merely 6% of the dispatches are through rails and ~94% is through roads as railway
sidings are available at only two of the plant locations of the company. The increase in
axle load limit has helped logistics costs substantially given large movement through
roads.
Financial Highlights:
Expect revenue CAGR of ~19% during FY19E-21E
Shree demonstrated gradual scale-up in operations by adding capacity at regular intervals,
which has been in tandem with demand growth resulting in increased market share. After
achieving its critical mass at the northern market, Shree has decided to strengthen its
presence in Eastern and Southern regions which are expected to witness sustained
demand recovery going forward.
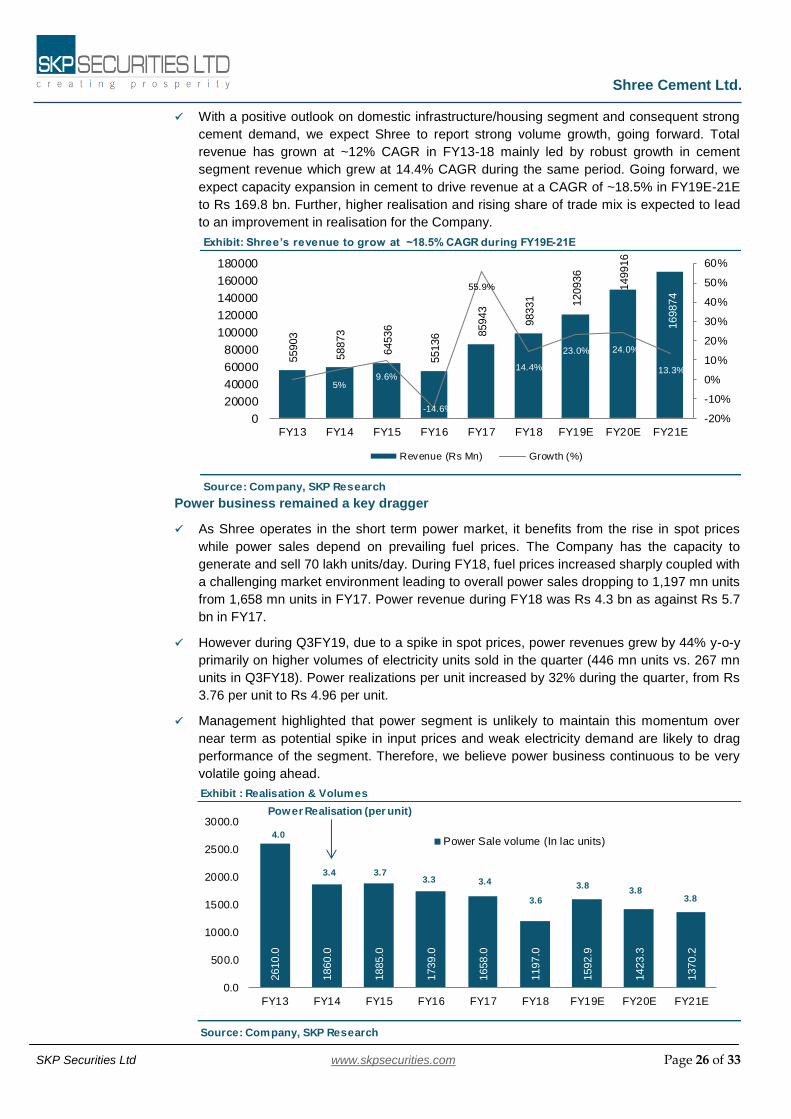
Shree Cement Ltd.
SKP Securities Ltd www.skpsecurities.com Page 26 of 33
Exhibit : Realisation & Volumes
Source: Company, SKP Research
2610.0
1860.0
1885.0
1739.0
1658.0
1197.0
1592.9
1423.3
1370.2
0.0
500.0
1000.0
1500.0
2000.0
2500.0
3000.0
FY13 FY14 FY15 FY16 FY17 FY18 FY19E FY20E FY21E
Power Sale volume (In lac units)4.0
3.4 3.73.3 3.4
3.6
3.83.8
3.8
Power Realisation (per unit)
Exhibit: Shree’s revenue to grow at ~18.5% CAGR during FY19E-21E
Source: Company, SKP Research
55903
58873
64536
55136 8
5943
98331 120936
149916
169874
5%9.6%
-14.6%
55.9%
14.4%
23.0% 24.0%
13.3%
-20%
-10%
0%
10%
20%
30%
40%
50%
60%
0
20000
40000
60000
80000
100000
120000
140000
160000
180000
FY13 FY14 FY15 FY16 FY17 FY18 FY19E FY20E FY21E
Revenue (Rs Mn) Growth (%)
With a positive outlook on domestic infrastructure/housing segment and consequent strong
cement demand, we expect Shree to report strong volume growth, going forward. Total
revenue has grown at ~12% CAGR in FY13-18 mainly led by robust growth in cement
segment revenue which grew at 14.4% CAGR during the same period. Going forward, we
expect capacity expansion in cement to drive revenue at a CAGR of ~18.5% in FY19E-21E
to Rs 169.8 bn. Further, higher realisation and rising share of trade mix is expected to lead
to an improvement in realisation for the Company.
Power business remained a key dragger
As Shree operates in the short term power market, it benefits from the rise in spot prices
while power sales depend on prevailing fuel prices. The Company has the capacity to
generate and sell 70 lakh units/day. During FY18, fuel prices increased sharply coupled with
a challenging market environment leading to overall power sales dropping to 1,197 mn units
from 1,658 mn units in FY17. Power revenue during FY18 was Rs 4.3 bn as against Rs 5.7
bn in FY17.
However during Q3FY19, due to a spike in spot prices, power revenues grew by 44% y-o-y
primarily on higher volumes of electricity units sold in the quarter (446 mn units vs. 267 mn
units in Q3FY18). Power realizations per unit increased by 32% during the quarter, from Rs
3.76 per unit to Rs 4.96 per unit.
Management highlighted that power segment is unlikely to maintain this momentum over
near term as potential spike in input prices and weak electricity demand are likely to drag
performance of the segment. Therefore, we believe power business continuous to be very
volatile going ahead.
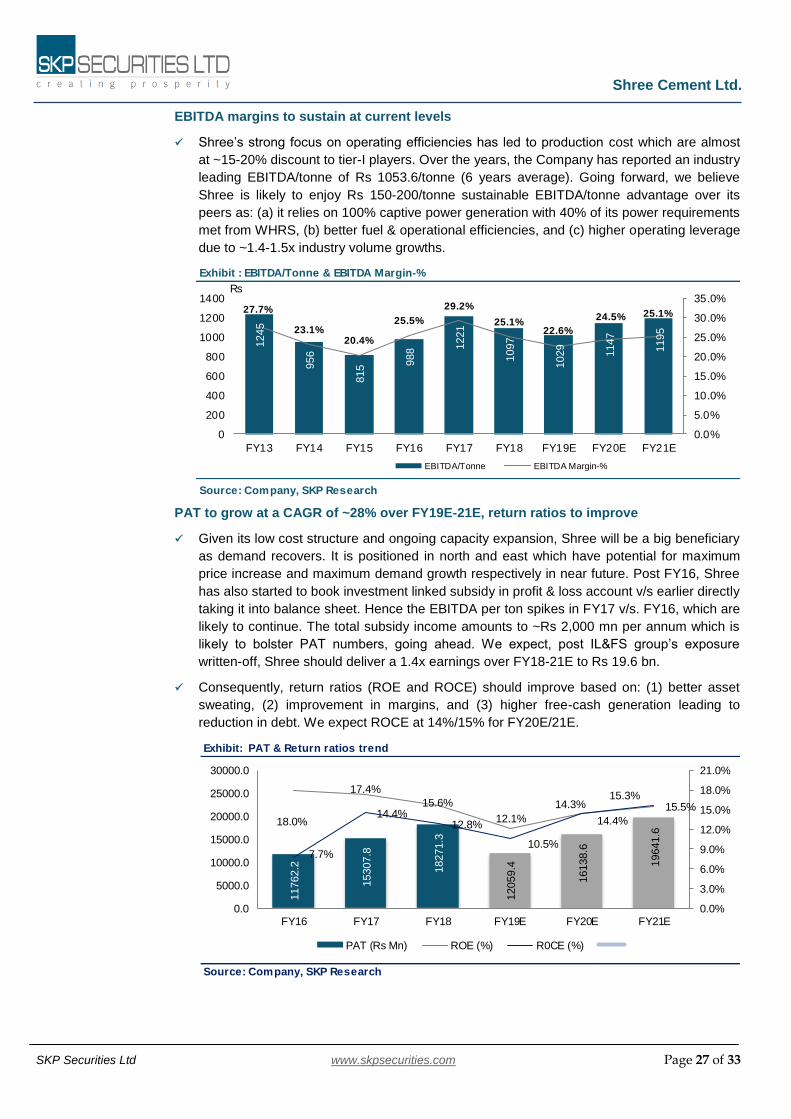
Shree Cement Ltd.
SKP Securities Ltd www.skpsecurities.com Page 27 of 33
Exhibit: PAT & Return ratios trend
Source: Company, SKP Research
11762.2
15307.8
18271.3
12059.4
16138.6
19641.6
18.0%
17.4%
15.6%
12.1%
14.3%15.3%
7.7%
14.4%12.8%
10.5%
14.4%
15.5%
0.0%
3.0%
6.0%
9.0%
12.0%
15.0%
18.0%
21.0%
0.0
5000.0
10000.0
15000.0
20000.0
25000.0
30000.0
FY16 FY17 FY18 FY19E FY20E FY21E
PAT (Rs Mn) ROE (%) R0CE (%)
Exhibit : EBITDA/Tonne & EBITDA Margin-%
Source: Company, SKP Research
1245
956
815 9
88 1
221
1097
1029
1147
1195
27.7%
23.1%20.4%
25.5%
29.2%
25.1%22.6%
24.5% 25.1%
0.0%
5.0%
10.0%
15.0%
20.0%
25.0%
30.0%
35.0%
0
200
400
600
800
1000
1200
1400
FY13 FY14 FY15 FY16 FY17 FY18 FY19E FY20E FY21E
EBITDA/Tonne EBITDA Margin-%
Rs
EBITDA margins to sustain at current levels
Shree’s strong focus on operating efficiencies has led to production cost which are almost
at ~15-20% discount to tier-I players. Over the years, the Company has reported an industry
leading EBITDA/tonne of Rs 1053.6/tonne (6 years average). Going forward, we believe
Shree is likely to enjoy Rs 150-200/tonne sustainable EBITDA/tonne advantage over its
peers as: (a) it relies on 100% captive power generation with 40% of its power requirements
met from WHRS, (b) better fuel & operational efficiencies, and (c) higher operating leverage
due to ~1.4-1.5x industry volume growths.
PAT to grow at a CAGR of ~28% over FY19E-21E, return ratios to improve
Given its low cost structure and ongoing capacity expansion, Shree will be a big beneficiary
as demand recovers. It is positioned in north and east which have potential for maximum
price increase and maximum demand growth respectively in near future. Post FY16, Shree
has also started to book investment linked subsidy in profit & loss account v/s earlier directly
taking it into balance sheet. Hence the EBITDA per ton spikes in FY17 v/s. FY16, which are
likely to continue. The total subsidy income amounts to ~Rs 2,000 mn per annum which is
likely to bolster PAT numbers, going ahead. We expect, post IL&FS group’s exposure
written-off, Shree should deliver a 1.4x earnings over FY18-21E to Rs 19.6 bn.
Consequently, return ratios (ROE and ROCE) should improve based on: (1) better asset
sweating, (2) improvement in margins, and (3) higher free-cash generation leading to
reduction in debt. We expect ROCE at 14%/15% for FY20E/21E.

Shree Cement Ltd.
SKP Securities Ltd www.skpsecurities.com Page 28 of 33
Exhibit: Exhibit: Peer Comparison
FY17 FY18 FY17 FY18 FY17 FY18 FY17 FY18
UltraTech 1142 103.2 1052 4889 5021 1017 992 20.8% 19.7% 11.0% 7.5%
ACC* 310 33.3 300 4780 5069 641 728 13.4% 14.4% 5.9% 6.9%
Ambuja* 448 29.7 4340 4546 798 844 18.4% 18.6% 10.1% 12.0%
Dalmia Bharat 217 26.1 181 4867 5060 1238 1188 25.4% 23.5% 0.9% 8.6%
Ramco Cement 180 17 126 4752 4730 1392 1154 29.3% 24.4% 16.4% 12.5%
Shree Cement 657 41.9 639.7 3880 4063 1221 1097 29.2% 25.1% 15.6% 14.1%
FY17 FY18 FY17 FY18 FY17 FY18 FY17 FY18 FY17 FY18
UltraTech 0.2 0.6 11.1% 8.4% 10.7% 7.4% 53.2 41.8 25.0 22.0
ACC* 0.0 0.0 7.5% 9.9% 7.2% 9.8% 36.1 43.8 24.1 16.5
Ambuja* 0.0 0.0 5.6% 7.3% 5.8% 9.1% 46.4 43.0 22.8 19.9
Dalmia Bharat 0.8 0.6 6.9% 8.9% 11.7% 11.4% 42.6 55.7 13.9 13.8
Ramco Cement 0.3 0.2 19.2% 14.4% 17.3% 14.8% 23.2 27.1 13.9 14.8
Shree Cement 0.2 0.4 17.4% 15.6% 14.4% 12.8% 46.9 41.9 24.8 24.2
Source: Company,SKP Research,*Calendar year CY16 & CY17
PAT Margin (%)Relisations/TonneCompanies
Mcap (Rs
Bn)
Cement
Capacity
(MTPA)
Power
Capacity
(MW)
EBITDA/Tonne EBITDA Margin (%)
P/E Ratio(x) EV/EBITDA Ratio(x)Companies
D/E Ratio (x) ROE (%) ROCE (%)
Exhibit: Total debt,Interest coverage ratio & D/E ratio
Particulars FY13 FY14 FY15 FY16 FY17 FY18 FY19E FY20E FY21E
Total Debt (Rs Mn) 9774 10783 6043 7265 12925 33940 33940 33729 33519
ICR (X) 5.8 6.3 3.3 7.6 10.0 11.6 5.7 8.5 10.2
D/E (X) 0.3 0.2 0.1 0.1 0.2 0.4 0.3 0.3 0.3
Source: Company, SKP Research
Balance sheet strength and positive cash flow to fund future capex
Smaller periodic expansions did not let Shree’s balance sheet strength dilute significantly in
the past. We believe this will continue going forward too. The Company has attained critical
mass as it can grow capacity by 10-12% annually based on its sustainable operating cash
flow (OCF).
Moreover, capex cost for Shree continues to be ~20% lower than the industry average
given: (a) the company’s organic model of growth without additional debt, (b) scope for
higher brownfield expansions, (c) securing equipment at competitive rates, and (iv)
replicating capacity designs by in-house team.
Shree’s capacity expansion of 5.5 MTPA capacities in the east translates into capex of USD
43/tonne. This is much lower than the industry standard of USD 50-60/tonne. We estimate
Shree to generate cash flow from operations of ~88 bn over FY19E-21E v/s capex need of
~ Rs 30 bn, thereby, driving growth without impacting balance sheet strength.
IL&FS investment write off
Shree had investments of ~Rs 1.8 bn in the preference shares of IL&FS Group, which it
completely wrote off during Q2FY19, post credit rating agencies downgrading IL&FS
Group's credit rating to junk status.
Peer Comparison:
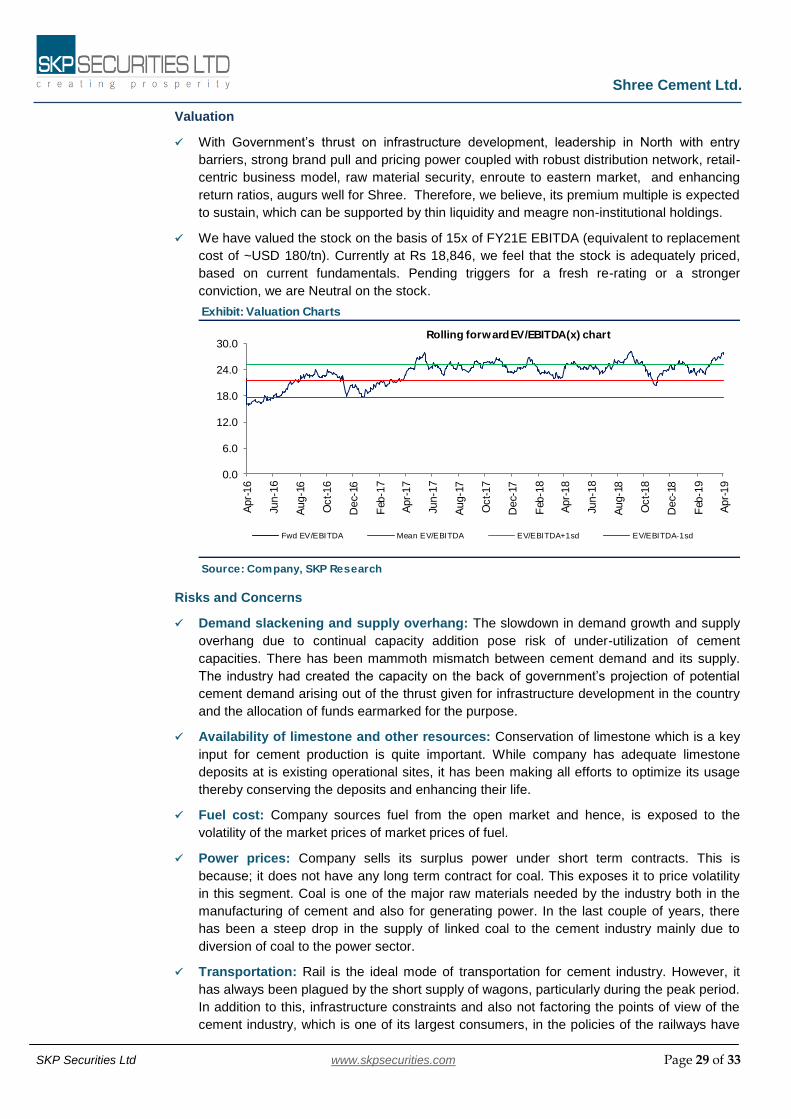
Shree Cement Ltd.
SKP Securities Ltd www.skpsecurities.com Page 29 of 33
Source: Company, SKP Research
Exhibit: Valuation Charts
0.0
6.0
12.0
18.0
24.0
30.0
Apr-
16
Jun-1
6
Aug-1
6
Oct-16
Dec-
16
Feb
-17
Apr-
17
Jun-1
7
Aug-1
7
Oct-17
Dec-
17
Feb
-18
Apr-
18
Jun-1
8
Aug-1
8
Oct-18
Dec-
18
Feb
-19
Apr-
19
Rolling forward EV/EBITDA(x) chart
Fwd EV/EBITDA Mean EV/EBITDA EV/EBITDA+1sd EV/EBITDA-1sd
Valuation
With Government’s thrust on infrastructure development, leadership in North with entry
barriers, strong brand pull and pricing power coupled with robust distribution network, retail-
centric business model, raw material security, enroute to eastern market, and enhancing
return ratios, augurs well for Shree. Therefore, we believe, its premium multiple is expected
to sustain, which can be supported by thin liquidity and meagre non-institutional holdings.
We have valued the stock on the basis of 15x of FY21E EBITDA (equivalent to replacement
cost of ~USD 180/tn). Currently at Rs 18,846, we feel that the stock is adequately priced,
based on current fundamentals. Pending triggers for a fresh re-rating or a stronger
conviction, we are Neutral on the stock.
Risks and Concerns
Demand slackening and supply overhang: The slowdown in demand growth and supply
overhang due to continual capacity addition pose risk of under-utilization of cement
capacities. There has been mammoth mismatch between cement demand and its supply.
The industry had created the capacity on the back of government’s projection of potential
cement demand arising out of the thrust given for infrastructure development in the country
and the allocation of funds earmarked for the purpose.
Availability of limestone and other resources: Conservation of limestone which is a key
input for cement production is quite important. While company has adequate limestone
deposits at is existing operational sites, it has been making all efforts to optimize its usage
thereby conserving the deposits and enhancing their life.
Fuel cost: Company sources fuel from the open market and hence, is exposed to the
volatility of the market prices of market prices of fuel.
Power prices: Company sells its surplus power under short term contracts. This is
because; it does not have any long term contract for coal. This exposes it to price volatility
in this segment. Coal is one of the major raw materials needed by the industry both in the
manufacturing of cement and also for generating power. In the last couple of years, there
has been a steep drop in the supply of linked coal to the cement industry mainly due to
diversion of coal to the power sector.
Transportation: Rail is the ideal mode of transportation for cement industry. However, it
has always been plagued by the short supply of wagons, particularly during the peak period.
In addition to this, infrastructure constraints and also not factoring the points of view of the
cement industry, which is one of its largest consumers, in the policies of the railways have
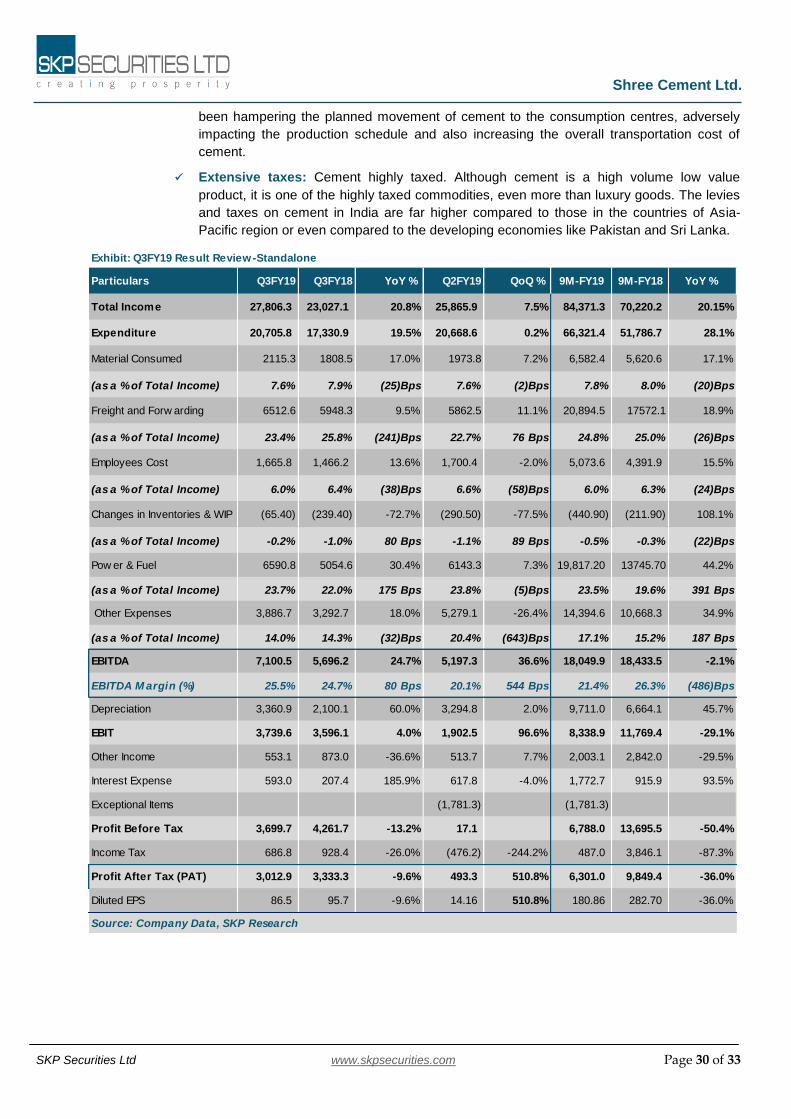
Shree Cement Ltd.
SKP Securities Ltd www.skpsecurities.com Page 30 of 33
Exhibit: Q3FY19 Result Review-Standalone
Particulars Q3FY19 Q3FY18 YoY % Q2FY19 QoQ % 9M-FY19 9M-FY18 YoY %
Total Income 27,806.3 23,027.1 20.8% 25,865.9 7.5% 84,371.3 70,220.2 20.15%
Expenditure 20,705.8 17,330.9 19.5% 20,668.6 0.2% 66,321.4 51,786.7 28.1%
Material Consumed 2115.3 1808.5 17.0% 1973.8 7.2% 6,582.4 5,620.6 17.1%
(as a % of Total Income) 7.6% 7.9% (25)Bps 7.6% (2)Bps 7.8% 8.0% (20)Bps
Freight and Forw arding 6512.6 5948.3 9.5% 5862.5 11.1% 20,894.5 17572.1 18.9%
(as a % of Total Income) 23.4% 25.8% (241)Bps 22.7% 76 Bps 24.8% 25.0% (26)Bps
Employees Cost 1,665.8 1,466.2 13.6% 1,700.4 -2.0% 5,073.6 4,391.9 15.5%
(as a % of Total Income) 6.0% 6.4% (38)Bps 6.6% (58)Bps 6.0% 6.3% (24)Bps
Changes in Inventories & WIP (65.40) (239.40) -72.7% (290.50) -77.5% (440.90) (211.90) 108.1%
(as a % of Total Income) -0.2% -1.0% 80 Bps -1.1% 89 Bps -0.5% -0.3% (22)Bps
Pow er & Fuel 6590.8 5054.6 30.4% 6143.3 7.3% 19,817.20 13745.70 44.2%
(as a % of Total Income) 23.7% 22.0% 175 Bps 23.8% (5)Bps 23.5% 19.6% 391 Bps
Other Expenses 3,886.7 3,292.7 18.0% 5,279.1 -26.4% 14,394.6 10,668.3 34.9%
(as a % of Total Income) 14.0% 14.3% (32)Bps 20.4% (643)Bps 17.1% 15.2% 187 Bps
EBITDA 7,100.5 5,696.2 24.7% 5,197.3 36.6% 18,049.9 18,433.5 -2.1%
EBITDA M argin (%) 25.5% 24.7% 80 Bps 20.1% 544 Bps 21.4% 26.3% (486)Bps
Depreciation 3,360.9 2,100.1 60.0% 3,294.8 2.0% 9,711.0 6,664.1 45.7%
EBIT 3,739.6 3,596.1 4.0% 1,902.5 96.6% 8,338.9 11,769.4 -29.1%
Other Income 553.1 873.0 -36.6% 513.7 7.7% 2,003.1 2,842.0 -29.5%
Interest Expense 593.0 207.4 185.9% 617.8 -4.0% 1,772.7 915.9 93.5%
Exceptional Items (1,781.3) (1,781.3)
Profit Before Tax 3,699.7 4,261.7 -13.2% 17.1 6,788.0 13,695.5 -50.4%
Income Tax 686.8 928.4 -26.0% (476.2) -244.2% 487.0 3,846.1 -87.3%
Profit After Tax (PAT) 3,012.9 3,333.3 -9.6% 493.3 510.8% 6,301.0 9,849.4 -36.0%
Diluted EPS 86.5 95.7 -9.6% 14.16 510.8% 180.86 282.70 -36.0%
Source: Company Data, SKP Research
been hampering the planned movement of cement to the consumption centres, adversely
impacting the production schedule and also increasing the overall transportation cost of
cement.
Extensive taxes: Cement highly taxed. Although cement is a high volume low value
product, it is one of the highly taxed commodities, even more than luxury goods. The levies
and taxes on cement in India are far higher compared to those in the countries of Asia-
Pacific region or even compared to the developing economies like Pakistan and Sri Lanka.

Shree Cement Ltd.
SKP Securities Ltd www.skpsecurities.com Page 31 of 33
Exhibit: Balance Sheet
Particulars FY18 FY19E FY20E FY21E Particulars FY18 FY19E FY20E FY21E
Total Income 98,331.0 120,935.7 149,915.6 169,874.2 Share Capital 348.4 348.4 348.4 348.4
Growth (%) 14.4% 23.0% 24.0% 13.3% Reserve & Surplus 88,618.2 99,005.2 112,217.2 127,678.1
Expenditure 73,603.5 93,604.2 113,186.3 127,235.8 Shareholders Funds 88,966.6 99,353.6 112,565.6 128,026.5
Material Cost 7,703.5 8,586.4 10,344.2 11,721.3 Total Debt 33,939.9 33,939.6 33,729.1 33,518.9
Employee Cost 5,880.5 7,014.3 8,545.2 9,513.0 Deferred Tax (Net) - - - -
Power and fuel Cost 19,796.5 27,331.5 32,831.5 37,202.5 Current Liabilities & Prov 28,510.2 31,629.4 36,959.5 34,272.6
Freight Cost 25,248.9 29,871.1 36,279.6 40,769.8
Admin & Other Exp. 14,974.1 20,800.9 25,185.8 28,029.2 Total Liabilities 151,416.7 164,922.6 183,254.3 195,818.0
EBITDA 24,727.5 27,331.5 36,729.3 42,638.4
Depreciation 8,994.0 13,329.8 15,726.8 17,609.6 Net Block inc. Capital WIP 50163.3 58812.8 60065.3 59435.7
EBIT 15,733.5 14,001.7 21,002.6 25,028.8 Current Assets 57,002.5 60,830.9 75,527.1 83,919.1
Other Income 3,890.5 2,567.6 2,995.5 3,624.6 Inventories 15,690.2 16,931.0 22,487.3 22,083.7
Interest Expense 1,352.7 2,464.7 2,480.0 2,464.6 Sundry Debtors 4,592.5 6,046.8 6,746.2 7,814.2
Exceptioanl Items* 0.0 -1,781.3 0.0 0.0 Cash & Bank Balance 1,209.7 2,248.2 8,480.7 13,734.3
Profit Before Tax (PBT) 18,271.3 14,104.6 21,518.1 26,188.9 Investments 23,110.4 24,265.9 25,479.2 28,027.1
Income Tax -4,429.8 2,045.2 5,379.5 6,547.2 Other Cur. Assets and L&A 12,399.7 11,338.9 12,333.6 12,259.8
Profit After Tax (PAT) 13,841.5 12,059.4 16,138.6 19,641.6 Non- current tax assets
Growth (%) 3.4% -12.9% 33.8% 21.7% Other financial assets 7,890.0 7,356.5 8,099.9 9,458.0
Diluted EPS 397.3 346.1 463.2 563.8 Other non-current assets 5,130.5 5,130.5 5,130.5 5,130.5
Growth (%) 3.4% -12.9% 33.8% 21.7% Non Current Investment 31,230.4 32,791.9 34,431.5 37,874.7
Shares in Mn 34.8 34.8 34.8 34.8 Total Assets 151,416.7 164,922.6 183,254.3 195,818.0
Exhibit: Ratio Analysis
Particulars FY18 FY19E FY20E FY21E Particulars FY18 FY19E FY20E FY21E
Profit Before Tax (PBT) 18,271.3 14,104.6 21,518.1 26,188.9 Earning Ratios (%)
Depreciation 8,994.0 13,329.8 15,726.8 17,609.6 EBITDA Margin (%) 25.1% 22.6% 24.5% 25.1%
Finance Costs 1,352.7 2,464.7 2,480.0 2,464.6 PAT Margins (%) 14.1% 10.0% 10.8% 11.6%
Chg. in Working Capital (1,273.5) 2,018.4 (2,663.7) (4,635.6) ROCE (%) 12.8% 10.5% 14.4% 15.5%
Direct Taxes Paid (5,074.3) (2,045.2) (5,379.5) (6,547.2) ROE (%) 15.6% 12.1% 14.3% 15.3%
Other Charges (3,890.5) (2,567.6) (2,995.5) (3,624.6) Per Share Data (INR)
Operating Cash Flows 18,379.7 27,334.8 28,864.2 31,363.2 Diluted EPS 397.3 346.1 463.2 563.8
Capital Expenditure (26,290.8) (22,000.5) (17,000.5) (17,001.5) Cash EPS (CEPS) 655.4 728.7 914.6 1069.2
Change in Investments (13,917.3) (2,717.0) (2,852.9) (5,991.1) BVPS 2553.6 2851.7 3230.9 3674.7
Others 4,109.5 2,588.8 3,016.8 3,646.0 Valuation Ratios (x)
Investing Cash Flows (36,098.6) (22,128.7) (16,836.6) (19,346.5) P/E 41.9 54.4 40.7 33.4
Inc / (Dec) in Debt 19,573.0 (2,585.6) (2,960.0) (2,674.8) Price/BVPS 6.5 6.6 5.8 5.1
Dividend Paid (inc tax) (1,844.8) (1,672.3) (2,926.6) (4,180.8) EV/Sales 6.0 5.5 4.4 3.8
Others 89.4 90.4 91.4 92.4 EV/EBITDA 23.9 24.3 17.9 15.2
Financing Cash Flows 17,817.6 (4,167.5) (5,795.1) (6,763.2) Mcap/Sales 5.9 5.4 4.4 3.9
Net Cashflow 98.7 1,038.5 6,232.5 5,253.5 Balance Sheet Ratios
Opening Cash Balance 1,111.0 1,209.7 2,248.2 8,480.7 Debt - Equity 0.4 0.3 0.3 0.3
Cashflow during the year 98.7 1,038.5 6,232.5 5,253.5 Current Ratio 1.9 1.8 2.0 2.3
Closing Cash Balance 1,209.7 2,248.2 8,480.7 13,734.3 Asset Turn. Ratios 0.7 0.8 0.9 0.9
Figures in INR Million
Source: SKP Research , *FY19- Exceptioanl Items- IL&FS Investment Write off
Figures in INR MillionFigures in INR MillionExhibit: Income Statement
Exhibit: Cash Flow Statement
Shree Cement Ltd.
SKP Securities Ltd www.skpsecurities.com Page 32 of 33
Notes:
The above analysis and data are based on last available prices and not official closing rates. SKP Research is also available on Bloomberg and
Thomson First Call.
DISCLAIMER:
This document has been prepared by SKP Securities Ltd, hereinafter referred to as SKP to provide information about the company(ies)/sector(s), if any, covered in the report and may be distributed by it and/or its affiliates. SKP Securities Ltd., offers broking and depository participant services and is regulated by Securities and Exchange Board of India (SEBI). It also distributes investment products/services like mutual funds, alternative investment funds, bonds, IPOs, etc., renders corporate advisory services and invests its own funds in securities and investment products. We declare that no material disciplinary action has been taken against SKP by any regulatory authority impacting Equity Research Analysis. As a value addition to its clients, it offers its research services and reports in various formats to its clients and prospects. As such, SKP is making these disclosures under SEBI (Research Analysts) Regulations, 2014.
Terms & Conditions and Other Disclosures:
This research report (“Report”) is for the personal information of the selected recipient(s), does not construe to be any investment, legal or taxation advice, is not for public distribution and should not be copied, reproduced or redistributed to any other person or in any form without SKP’s prior permission. The information provided in the Report is from publicly available data, which we believe, are reliable. While reasonable endeavours have been made to present reliable data in the Report so far as it relates to current and historical information, but SKP does not guarantee the accuracy or completeness of the data in the Report. Accordingly, SKP or its promoters, directors, subsidiaries, associates or employees shall not be in any way responsible for any loss or damage that may arise to any person from any inadvertent error in the information contained and views and opinions expressed in this publication. Past performance mentioned in the Report should not be taken as an indication or guarantee of future performance, and no representation or warranty, express or implied, is made regarding future performance. Information, opinions and estimates contained in this report reflect a judgment of its original date of publication by SKP and are subject to change without notice. The price, value of and income from any of the securities mentioned in this report can rise or fall. The Report includes analysis and views of individual research analysts (which, hereinafter, includes persons reporting to them) covering this Report. The Report is purely for information purposes. Opinions expressed in the Report are SKP’s or its research analysts’ current opinions as of the date of the Report and may be subject to change from time to time without notice. SKP or any person connected with it does not accept any liability arising from the use of this document. Investors should not solely rely on the information contained in this Report and must make investment decisions based on their own investment objectives, judgment, risk profile and financial position. The recipients of this Report may take professional advice before acting on this information. SKP, along with its affiliates, are engaged in various financial services and so might have financial, businesses or other interest in other entities, including the subject company or its affiliates mentioned in this report, for which it might have received any compensation in the past twelve months. SKP does not provide any merchant banking or market making service and does not manage public offers. However, SKP encourages independence in preparation of research reports and strives to minimize conflict in preparation of research reports. SKP and its analysts did not receive any compensation or other benefits from the subject company mentioned in the Report or from a third party in connection with preparation of the Report. Accordingly, SKP and its Research Analyst do not have any material conflict of interest at the time of publication of this Report. SKP’s research analysts may provide input into its other business activities. Investors should assume that SKP and/or its affiliates are seeking or will seek business assignments from the company(ies) that are the subject of this material and that the research analysts who are involved in preparing this material may educate investors on investments in such businesses. The research analysts responsible for the preparation of this document may interact with trading desk/sales personnel and other parties for the purpose of gathering, applying and interpreting information. Our research analysts are paid on the profitability of SKP, which may include earnings from business activities for which this Report is being used, but not for the preparation of this report. SKP generally prohibits its analysts, persons reporting to analysts and their relatives from maintaining a financial interest in the securities or derivatives of any company(ies) that the analyst covers. Additionally, SKP generally, prohibits its analysts and persons reporting to analysts from serving as an officer, director or advisory board member of any companies that the analyst cover. The following Disclosure of Interest Statement, clarifies it further: SKP and/or its Directors/or its affiliates or its Research Analyst(s) engaged in preparation of this Report or his/her relative (i) do not own 1% or more of the equity securities of the subject company mentioned in the report as of the last day of the month preceding the publication of the research report (ii) do not have any financial interests in the subject company mentioned in this report (iii) do not have any other material conflict of interest at the time of publication of the research report. The distribution of this document in other jurisdictions may be strictly restricted and/ or prohibited by law, and persons into whose possession this document comes should inform themselves about such restriction and/ or prohibition, and observe any such restrictions and/ or prohibition.
SKP Securities Limited is registered as a Research Analyst under SEBI (Research Analyst) Regulations, 2014 having registration no. INH300002902.
Our Research reports / recommendations may differ on account of differences in research methodology and difference in time horizons for which recommendations are made . Accordingly our sales personnel, professionals or affiliates may provide oral or written market commentary or trading strategies or reports or analysis to our clients that may reflect opinions that are contrary to the opinions expressed herein, and we, or entities associated with us, may make investment decisions that can be inconsistent with the recommendations expressed herein. In reviewing these materials, you should be aware that any or all of the foregoing, among other things, may give rise to real or potential conflicts of interest.
Shree Cement Ltd.
SKP Securities Ltd www.skpsecurities.com Page 33 of 33
Analyst Certification
The views expressed in this research report accurately reflect the personal views of the analyst about the subject securities or issues, which are subject to change without prior notice and does not represent to be an authority on the subject. No part of the compensation of the research analyst was, is, or will be directly or indirectly related to the specific recommendations and views expressed by research analyst in this report. The research analysts, strategists, or research associates principally responsible for preparation of SKP research receive compensation based upon various factors, including quality of research, investor client feedback, stock picking, competitive factors and firm revenues.
Disclosure of Interest Statement
Analyst ownership of the stock NIL
Served as an officer, director or employee NIL
NSE & BSE INZ000199335, Depository Participant: IN-DP-155-2015,ARN: 0006
SKP Securities Ltd
Contacts Research Dealing
Mumbai Kolkata Mumbai Kolkata
Phone 022 4922 6006 033 4007 7000 022 4922 6000 033 4007 7400
Fax 022 4922 6066 033 4007 7007 022 4922 6066 033 4007 7007
E-mail [email protected] [email protected]
Member: NSE BSE NSDL CDSL
Private Wealth | Broking | Distribution | Institutional Equities | Investment Banking
Related Documents