Permeability and porosity as constraints on the explosive eruption of magma: Laboratory experiments and field investigations Inauguraldissertation zur Erlangung des Doktorgrades Fakultät für Geowissenschaften der Ludwig-Maximilians-Universität München vorgelegt von Sebastian Müller München 26. Oktober 2006

Welcome message from author
This document is posted to help you gain knowledge. Please leave a comment to let me know what you think about it! Share it to your friends and learn new things together.
Transcript
Permeability and porosity as constraints on
the explosive eruption of magma:
Laboratory experiments and field
investigations
Inauguraldissertation
zur Erlangung des Doktorgrades
Fakultät für Geowissenschaften
der Ludwig-Maximilians-Universität München
vorgelegt von
Sebastian Müller
München
26. Oktober 2006

II

III
1. Berichterstatter: Prof. Donald Bruce Dingwell
2. Berichterstatter: Prof. Ludwig Masch
Tag der mündlichen Prüfung: 27. April 2007

IV

V
For we must suppose that the wind in the earth has effects similar to those of
the wind in our bodies whose force, when it is pent up inside us, can cause tremors and
throbbings (…)
Aristoteles, Meteorologica, Book II

VI

VII
Table of Content
Table of Content ..........................................................................................................VII
List of Figures .................................................................................................................X
List of Tables .............................................................................................................. XIII
Preamble.......................................................................................................................XV
Zusammenfassung ...........................................................................................................1
1 Introduction ...............................................................................................................7
1.1 Explosive volcanism – threat and challenge.............................................................7
1.2 The development of porosity – bubble nucleation and growth ................................9
1.3 Causes and consequences of magma permeability.................................................12
2 Sample provenance and preparation.....................................................................15
2.1 Investigated volcanoes............................................................................................15
2.1.1 St. Augustine, Alaska, USA ................................................................................16
2.1.2 Bezymianny, Kamchatka, Russia ........................................................................18
2.1.3 Colima, Mexico ...................................................................................................20
2.1.4 Krakatau, Indonesia .............................................................................................23
2.1.5 Kelut, Indonesia...................................................................................................24
2.1.6 Merapi, Indonesia ................................................................................................26
2.1.7 Soufrière Hills, Montserrat, UK ..........................................................................27
2.1.8 Campi Flegrei, Agnano-Monte Spina, Italy ........................................................29
2.1.9 Stromboli, Italy ....................................................................................................30
2.1.10 Monte Pilato, Lipari, Italy ...................................................................................31
2.1.11 Santorini, Greece .................................................................................................33
2.1.12 Mt. Unzen, Japan .................................................................................................34
2.1.13 Pinatubo, Philippines ...........................................................................................36
2.1.14 Sample overview .................................................................................................37
2.2 Sample preparation .................................................................................................39
2.3 Laboratory porosity determination .........................................................................40
3 Field porosity investigations ...................................................................................42
3.1 Introduction ............................................................................................................42
3.2 Field based porosity determination.........................................................................43
3.3 Field porosity measurements – results....................................................................45
VIII
3.3.1 St. Augustine .......................................................................................................45
3.3.2 Bezymianny .........................................................................................................47
3.3.3 Colima .................................................................................................................50
3.3.4 Krakatau...............................................................................................................51
3.3.5 Kelut ....................................................................................................................52
3.3.6 Merapi..................................................................................................................54
3.3.7 Unzen...................................................................................................................56
3.4 Interpretations .........................................................................................................57
3.4.1 Correlations between porosity distributions and eruptive behaviour ..................57
3.4.2 Correlations between porosity and the size of volcanic eruptions ......................60
4 Permeability measurements on volcanic rocks – influences of texture and
temperature ..............................................................................................................65
4.1 Factors controlling permeability.............................................................................65
4.1.1 Basic parameters..................................................................................................65
4.1.2 Textural parameters .............................................................................................65
4.2 Permeability measurements - method.....................................................................70
4.2.1 Experimental setup ..............................................................................................70
4.2.2 Data analysis........................................................................................................72
4.2.3 Error estimation ...................................................................................................77
4.3 Permeability measurements - results ......................................................................78
4.4 Permeability-porosity relationships - interpretations..............................................79
4.5 High-temperature permeability measurements – experimental difficulties, possible
solutions and preliminary results ............................................................................82
4.5.1 Experimental approaches.....................................................................................83
4.5.2 High-temperature measurements with a NaCl sealing ........................................86
5 Permeability control on volcanic fragmentation processes .................................91
5.1 Introduction ............................................................................................................91
5.2 Bubble overpressure and its reduction....................................................................91
5.3 Experimental procedure..........................................................................................93
5.4 The effect of permeability on the fragmentation threshold ....................................95
5.4.1 Fragmentation energy density............................................................................100
5.4.2 Implications .......................................................................................................102
6 Summary and conclusions ....................................................................................104
7 Bibliography...........................................................................................................107

IX
Acknowledgements ......................................................................................................117
Appendices ...................................................................................................................119
A. Permeability measurements and the use of the filtration codes – an operating manual
..............................................................................................................................119
B. Tables of experimental results ..................................................................................124
Curriculum vitae..........................................................................................................129

X
List of Figures
Figure 1.1: Schematic view of processes in a volcanic conduit ......................................10
Figure 1.2: Bubble growth history...................................................................................11
Figure 2.1: World map with investigated volcanoes. ......................................................15
Figure 2.2: TAS diagram .................................................................................................16
Figure 2.3: St. Augustine volcano ...................................................................................16
Figure 2.4: Thin section and sample picture of St. Augustine andesite. .........................17
Figure 2.5: Bezymianny volcano.....................................................................................18
Figure 2.6: Thin section and sample picture of Bezymianny andesite. ...........................19
Figure 2.7: Colima volcano .............................................................................................20
Figure 2.8: Schematic depiction of the stages of Colima eruption cycles.......................21
Figure 2.9: Thin section and sample picture of Colima andesite ....................................22
Figure 2.10: Krakatau islands ..........................................................................................23
Figure 2.11: Thin section and sample picture of Krakatau pumice. ................................24
Figure 2.12: Kelut volcano ..............................................................................................24
Figure 2.13: Thin section and sample picture of Kelut basaltic anesite.. ........................25
Figure 2.14: Merapi volcano. ..........................................................................................26
Figure 2.15: Thin section and sample picture of Merapi andesite...................................27
Figure 2.16: Soufrière Hills volcano ...............................................................................27
Figure 2.17: Thin section and sample picture of Soufrière Hills andesite.......................28
Figure 2.18: Campi Flegrei caldera. ................................................................................29
Figure 2.19: Thin section and sample picture of Campi Flegrei pumice.........................30
Figure 2.20: Stromboli volcano. ......................................................................................30
Figure 2.21: Thin section and sample picture of Stromboli scoria..................................31
Figure 2.22: Monte Pilato, Lipari.. ..................................................................................31
Figure 2.23: Thin section and sample picture of Lipari pumice......................................32
Figure 2.24: Santorini island ...........................................................................................33
Figure 2.25: Thin section and sample picture of Santorini pumice. ................................34
Figure 2.26: Unzen volcano.............................................................................................34
Figure 2.27: Thin section and sample picture of Unzen dacite .......................................35
Figure 2.28: Pinatubo volcano.........................................................................................36
Figure 2.29: Thin section and sample picture of Pinatubo grey pumice.. .......................37
XI
Figure 2.30: Pumice clast with a drilled sample cylinder................................................39
Figure 2.31: Helium pycnometer.....................................................................................40
Figure 3.1: The setup used for field density/porosity measurements ..............................44
Figure 3.2: Locations of density measurements on Augustine island .............................46
Figure 3.4 Porosity distributions of Augustine volcano ..................................................47
Figure 3.5: Locations of density measurements on Bezymianny volcano ......................48
Figure 3.6: Porosity distributions of Bezymianny volcano .............................................49
Figure 3.7: Locations of density measurements on Volcán de Colima. ..........................50
Figure 3.8: Porosity distributions of Colima ...................................................................51
Figure 3.9: Locations of density measurements on Krakatau..........................................51
Figure 3.10: Porosity distributions of Krakatau. .............................................................52
Figure 3.11: Locations of density measurements on Kelut volcano................................53
Figure 3.12: Porosity distributions of Kelut ....................................................................53
Figure 3.13: Locations of density measurements on Merapi volcano.............................54
Figure 3.14: Porosity distributions of Merapi .................................................................55
Figure 3.15: Locations of density measurements on Unzen volcano. .............................56
Figure 3.16: Porosity distributions of Unzen volcano. ....................................................57
Figure 3.17: Compilation of the total porosity distribution datasets ...............................58
Figure 3.18: Porosity-based classification of eruptive styles ..........................................60
Figure 3.19: Mean porosity vs. VEI ................................................................................62
Figure 3.20: Mean porosity vs. eruption magnitude........................................................64
Figure 4.1 Textural parameters that may influence the permeability..............................66
Figure 4.2: Permeability-porosity relations according to Kozeny-Carman equations ....67
Figure 4.3: Permeability-porosity relation according to percolation theory....................68
Figure 4.4: Permeability data of previous workers..........................................................69
Figure 4.5: The experimental setup for permeability measurements ..............................71
Figure 4.6: Detailed view of the permeability autoclave setup .......................................72
Figure 4.7: Pressure an temperature evolution curves of a permeability experiments....73
Figure 4.8: Experimentally measured and calculated pressure evolution .......................75
Figure 4.9: Results of permeability measurements. ........................................................78
Figure 4.10: Comparison of k obtained by transient and quasi-static approaches ..........78
Figure 4.11: Permeability results - interpretations ..........................................................80
Figure 4.12: Different types of pore textures responsible for permeability variations....82
Figure 4.13: Sample mounting for high-temperature permeability measurements .........85
XII
Figure 4.14: Pressure profiles for high temperature experiments....................................87
Figure 4.15: Permeability development during high-temperature experiments ..............88
Figure 4.16: Pressure profiles of a degassing experiment on a steel cylinder.................89
Figure 4.17: High temperature permeability measurement on a trachytic sample ..........90
Figure 5.1: Schematic depiction of permeability control on fragmentation processes....92
Figure 5.2: Set-up of the autoclave section used for fragmentation experiments.. .........94
Figure 5.3: High- and room-temperature fragmentation threshold values ......................95
Figure 5.4: k-Φ relations of permeability-fragmentation experiment samples. ..............96
Figure 5.5: Permeability vs fragmentation threshold. .....................................................98
Figure 5.6: Permeability vs fragmentation threshold at samples with 80% porosity ......99
Figure 5.7: Fragmentation threshold energy density vs permeability. ..........................101
Figure 5.8: Comparison of the fit accuracy of two threshold-models. ..........................103
XIII
List of Tables
Table 2.1: Overview of the samples used for permeability and/or fragmentation
experiments......................................................................................................................37
Table 3.1: Compilation of Tephra volume, measured mean density, calculated erupted
mass and the explosivity scales M and VEI. ...................................................................63
Table 5.1: Results of combined porosity, permeability, and fragmentation threshold
determinations for 22 pumice/ breadcrust bomb samples and 10 dome rock samples....97
Table B.1: Room-temperature permeability, porosity, threshold and energy density
results of 112 samples....................................................................................................124
Table B.2: Parameters and results of high-temperature permeability experiments.......127

XIV

XV
Preamble
Parts of the contents presented in this thesis have been published in scientific journals or
are in the process of reviewing:
Mueller, S., Melnik, O., Spieler, O., Scheu, B., Dingwell, D.B. (2005): Permeability and
degassing of dome lavas undergoing rapid decompression: An experimental
determination. Bull Vulcanol 67, 526-538
Scheu, B., Kueppers, U., Mueller, S., Spieler, O., Dingwell, D.B.: Experimental
volcanology on eruptive products of Unzen volcano. Submitted to
J Volcanol Geotherm Res.
Mueller, S., Scheu, B., Dingwell, D.B.: Permeability control on magma fragmentation.
Submitted to Geology, in review.
Parts of the permeability measurement setup development follow a previous study
performed in the context of the diploma thesis “Die Entwicklung einer Permeabilitäts-
Messmethode zur Analyse von Vulkaniten unter Hochdruck- und Hochtemperatur-
bedingungen”, by S. Mueller, LMU München, 2002.

XVI
Zusammenfassung
1
Zusammenfassung
Vulkanausbrüche stellen eine der am schwierigsten vorhersagbaren
Naturkatastrophen dar. Die Unwägbarkeiten beziehen sich dabei sowohl auf den
Zeitpunkt eines Ausbruchs als auch auf dessen Ausprägung und Heftigkeit. Die
Prozesse, die vor oder während eines Vulkanausbruchs ablaufen, werden durch eine
Vielzahl physikalischer und chemischer Parameter beeinflusst. Die Tatsache, dass die
meisten dieser Parameter in irgendeiner Form voneinander abhängen und sich somit
gegenseitig beeinflussen, führt zu einem komplexen Netzwerk an Einflussgrößen, das
nicht mehr rein theoretisch erfasst werden kann. Die Ergebnisse experimenteller
Arbeiten an natürlichen Materialien gewinnen deshalb, insbesondere als Datengrundlage
für numerische Eruptionsmodelle, zunehmend an Bedeutung. Solche Modelle stellen
gerade zu Zeiten, in denen sozio-ökonomische Faktoren zu einer zunehmenden
Bevölkerungsdichte und Agglomeration von Industrie in direkter Umgebung von
Vulkanen führen, ein effektives Instrument zur Vorhersage und Risikoabschätzung dar.
Die Porosität eines Magmas und dessen Gaspermeabilität sind Parameter, die
einen beachtlichen Einfluss auf den Charakter einer Eruption haben können. Detaillierte
Untersuchungen der Permeabilität vulkanischer Gesteine und ihrer Abhängigkeit von
Porosität und texturellen Gegebenheiten einerseits, und ihres Einflusses auf die
Magmenfragmentation andererseits, sind deshalb für das Verständnis eruptiver Prozesse
grundlegend. Gerade die Kombination von Feldbeobachtungen und Laborarbeit
ermöglicht sowohl die Aufstellung einer statistisch relevanten Datenmenge, als auch die
experimentelle Quantifizierung von Zusammenhängen verschiedener Gesteins-
parameter.
Das Hauptaugenmerk dieser Arbeit lag auf der experimentellen Bestimmung der
Gaspermeabilität vulkanischer Gesteine. Um dabei hoch-turbulente vulkanische
Entgasungsprozesse zu simulieren, wurden die Versuche mit einer instationären
Meßmethode nach dem Stoßrohr-Prinzip (shock tube) durchgeführt: Eine durch das
kontrollierte Öffnen von Berstscheiben hervorgerufene, quasi-instantane
Dekompression in einer Autoklavenkammer oberhalb des Probenzylinders verursacht
einen Druckgradient über die Probe. Dieser Gradient führt entweder zur Filtration des
Zusammenfassung
2
noch unter Druck stehenden Gases unterhalb des Probenzylinders durch den Porenraum
des Gesteins, bis auch in der unteren Autoklavenkammer Atmosphärendruck herrscht,
oder, wenn der initiale Gasdruck über einem probenspezifischen Schwellenwert liegt,
zur Fragmentation der Probe. Die aufgezeichnete Druckverlaufskurve der unteren
Autoklavenkammer dient als Grundlage für die Berechnung zweier
Permeabilitätskoeffizienten: Ein linearer Koeffizient k, der in etwa der Darcy-
Permeabilität eines laminar strömenden Fluids entspricht, und ein nicht-linearer
Koeffizient C als Korrekturfaktor für das nicht-laminare Fließverhalten des Gases.
Die Permeabilität eines porösen Gesteins hängt von einer Vielzahl textureller
Gegebenheiten ab. Das effektiv für die Gasfiltration verfügbare Porenvolumen, d.h. die
Gesteinsporosität Φ, spielt dabei eine wichtige Rolle. Da Filtration in vulkanischen
Gesteinen jedoch ausschließlich durch miteinander verbundene Poren und Brüche
stattfinden kann, kommt dem Grad der „Poren-Verbundenheit“ die ausschlaggebende
Bedeutung zu. Dieser Grad wird wiederum von Faktoren wie Klüftigkeit des Gesteins,
mittlere Porengröße, Porengrößenverteilung, Porenform, etc. beeinflusst. Aufgrund der
Komplexität dieser Einflüsse ist es nahezu unmöglich, die Permeabilität von natürlichen
Materialien theoretisch zu berechnen oder vorherzusagen. Empirisch-experimentelle
Arbeit ist in diesem Gebiet deswegen unabdingbar. Durch mehr als 360 Versuche an
112 Gesteinsproben verschiedener Herkunft, Zusammensetzung und Porentextur wurde
mit dieser Arbeit eine umfassende Datenbasis an Permeabilitäts- und Porositätswerten
für die Untersuchung verschiedenster Fragestellungen auf diesem Gebiet geschaffen.
Der Zusammenhang zwischen Porosität und Permeabilität vulkanischer Gesteine
ist in erster Linie durch eine enorme Streuung gekennzeichnet. Für denselben
Porositätswert können Permeabilitätswerte in einem Bereich von vier Größenordungen
auftreten. Dennoch konnten die in dieser Arbeit untersuchten Gesteine nach ihrer
zugrundeliegenden Porengeometrie in zwei Gruppen mit unterschiedlichen
Permeabilitäts-Porositäts-Trends klassifiziert werden. Der grundsätzliche Verlauf der
beiden Trends konnte durch zwei verschiedene theoretische Modelle begründet werden:
Bei niedrig-porösen Domgesteinen, bei denen Klüfte und stark deformierte und
elongierte Poren einen übergeordneten Einfluss auf Entgasungsvorgänge haben, konnte
der k-Φ-Trend mit Modellen zum Gasfluss durch kluftähnliche (zwei parallele
Begrenzungsebenen) und kapillare Geometrien (Röhren) angenähert werden (Kozeny-
Carman-Gleichungen; k ~ Φn; 3 ≤ n ≤ 3,8). Bei hoch-porösen Gesteinen explosiven
Ursprungs (Bimse, Schlacken, Brotkrustenbomben), bei denen der Gastransport

Zusammenfassung
3
bevorzugt durch ein Netzwerk miteinander verbundener, mehr oder wenig
kugelförmiger Blasen stattfindet, konnte die Filtrations-Theorie von vollständig
„überlappbaren“ Hohlkugeln (fully penetrable spheres – FPS; k ~ (Φ-30)2) als Näherung
verwendet werden.
Die Permeabilität von Vulkaniten kann durch das Entstehen von Abkühlungs-
(Mikro-)Rissen post-eruptiv verändert werden und entspricht damit nicht mehr der
ursprünglichen Magmenpermeabilität. Experimente bei hohen, magmatisch relevanten
Temperaturen können daher Aufschlüsse über die „reale“ Gesteinspermeabilität liefern.
Gasflussexperimente bei hohen Temperaturen stellen jedoch eine hohe technische
Herausforderung dar. Die Abdichtung der Probe gegen die Autoklavenwand bzw. den
Probenhalter entpuppte sich dabei als das am schwierigsten zu lösende Problem.
Letztendlich konnten jedoch durch die Verwendung von gepresstem NaCl als Dichtung
erste zufrieden stellende Ergebnisse erzielt werden. Der relativ niedrige Schmelzpunkt
von Kochsalz (801 °C) erlaubte jedoch -unter Berücksichtigung gewisser
Verunreinigungen (z.B. Wasser) und einer Sicherheitsmarge- nur Versuchstemperaturen
bis ~750 °C. Das feinkörnige Salz wird in den Zwischenraum von Autoklav und
Probenzylinder eingefüllt und regelmäßig mittels eines Stahlrohrs und einer Presse
komprimiert. Während des Versuchs kann das Salz jederzeit nach Bedarf
weiterkomprimiert werden, um eventuell auftretende Undichtigkeiten wieder
auszufüllen. Die leichte mechanische Deformierbarkeit der Salzkristalle sorgt hierbei für
eine stets kompakte, gasdichte Ummantelung der Probe. Die Messergebnisse von drei
Domgesteinen zeigen eine zum Teil deutlich reduzierte Filtrationsrate bei hohen
Temperaturen, ein Effekt, der größtenteils auf die höhere Gasviskosität zurückzuführen
sein dürfte. Eine diesbezügliche Korrektur ergab für die Proben einen höheren
Permeabilitätswert als bei einer bei Raumtemperatur durchgeführten Messung. Dies
könnte ein Hinweis auf eine durch thermische Expansion bedingte Weitung der für den
Gasfluss relevanten Porenverbindungen sein. Da jedoch die kompressive Kraft, die das
Salz (durch die manuelle Nachkomprimierung einerseits und die thermische Expansion
des Salzes andererseits) auf den Probenzylinder ausübt, bei diesen Versuchen eine
unbekannte Größe darstellt, müssen die erzielten Ergebnisse unter Vorbehalt betrachtet
werden. Die Kompression könnte, insbesondere bei Gesteinen mit ausgeprägten
Kluftsystemen, Risse in einem unbekannten Maße verengen und somit einen - der
thermischen Ausdehnung entgegenwirkenden - Einfluss auf die effektiv gemessene
Zusammenfassung
4
Permeabilität haben. Der Vergleich von Permeabilitätswerten vor und nach dem
Aufheizprozess und eine Langzeitmessung an einer peralkalinen (trachytischen) Probe
legen nahe, dass bei den hier angewendeten Versuchsbedingungen keine permanenten
Veränderungen der Porenstruktur (z.B. Kluftheilung) auftreten.
Für die Modellierung eruptiver Prozesse ist der Einfluss der Permeabilität auf die
Magmenfragmentation von besonderem Interesse. Insbesondere der
Fragmentationsschwellenwert (fragmentation threshold), d.h. die physikalischen
Rahmenbedingungen, bei denen ein poröses Magma Gasüberdruck nicht mehr allein
durch Filtration abbauen kann, sondern in Partikel verschiedener Größe zerbricht, stellt
diesbezüglich einen wichtigen Parameter dar. Dieser Schwellenwert wurde lange Zeit
allein als abhängig vom Erreichen einer bestimmten Porositätsstufe angesehen (z.B.
Sparks 1978, Thomas et al. 1994, Gardner et al. 1996); neuere experimentelle Arbeiten
proklamieren dagegen eine Kombination von Gasüberdruck und Porosität als
bestimmende Faktoren (Spieler et al. 2004b). Mit einer Serie kombinierter
Permeabilitäts- und Fragmentationsvesuche konnte in der vorliegenden Arbeit
zusätzlich ein beträchtlicher Einfluss der Permeabilität auf den
Fragmentationsschwellenwert, insbesondere bei hoch-permeablen Gesteinen,
experimentell nachgewiesen werden. Dieser Einfluss konnte in einer analytischen
Beziehung zwischen Gasüberdruck, Gesteinsporosität und Permeabilität quantifiziert
werden. Mit dieser Gleichung können nun numerischen Modellen von Conduit-
Prozessen, wie der Übergang von effusivem zu explosivem Verhalten, realistischere
Input-Parameter zur Verfügung gestellt werden. Diese können damit einen verbesserten
Beitrag zur Risiko-Evaluierung explosiver Vulkane leisten.
Ein weiterer Aspekt der vorliegenden Arbeit bestand in der Analyse von Dichte-
und Porositätsdaten von insgesamt acht zirkum-pazifischen Vulkanen, die teils im
Rahmen von Feldkampagnen selber gemessen, teils aus der Literatur entnommen
wurden (Hoblitt & Harmon 1993, Kueppers 2005). Bei den untersuchten Vulkanen
handelt es sich um St. Augustine (Alaska, USA), Bezymianny (Kamtschatka, Russland),
Colima (Mexiko), Merapi, Kelut, Krakatau (alle Indonesien), Unzen (Japan) und Mt. St.
Helens (Washington, USA). Um eine statistisch aussagekräftige Dichteverteilung zu
erhalten, wurde im Gelände die Dichte von durchschnittlich 60 - zufällig ausgewählten -
Gesteinsproben pro Messpunkt mittels Archimedischem Prinzip (Messung des Gewichts
Zusammenfassung
5
der Probe in Luft und ihres Auftriebs in Wasser) bestimmt (Kueppers et al. 2005). Pro
Vulkan wurden zwischen drei und 37 Messpunkte bearbeitet. Aus der Rohdichte eines
Gesteins kann bei bekannter Dichte der reinen Festphase des Materials (Matrixdichte
oder Reindichte) dessen Porosität bestimmt werden. Die Matrixdichten wurden an
Pulvern repräsentativer Proben im Labor mittels He-Pycnometrie bestimmt.
Die Resultate der einzelnen Messpunkte und der Gesamt-Porositätsdaten eines
Vulkans wurden in Histogrammen mit einer Häufigkeitsverteilung der unterschiedlichen
Porositätsklassen in 5 %-Schritten dargestellt. Die vergleichende Interpretation dieser
Porositätsverteilungen erlaubt (a) Aussagen über regionalspezifische Eruptions- und
Ablagerungsmechanismen, wenn die einzelnen Probenpunkte eines Vulkans
untereinander verglichen und analysiert werden, und (b) Aussagen über generelle,
überregionale Zusammenhänge bezüglich Eruptionscharakteristika und Explosivität,
wenn die Gesamtdatensätze mehrerer Vulkane betrachtet werden. In diesem
Zusammenhang interpretierbare Parameter sind die generelle Form (z.B. unimodal-
bimodal) und die Varianz (d.h. die „Breite“) einer Verteilungskurve, sowie die Werte
der Häufigkeits-Maxima und der Porositäts-Durchschnitte.
Anhand dieser Parameter konnten die acht untersuchten Vulkane in drei
übergeordnete Eruptions-Klassen eingeordnet werden: (1) Dom-bildende Vulkane,
deren Haupt-Aktivitätsform aus gravitativ induzierten Block- und Asche-Strömen
(block-and-ash-flow oder nuée ardente) und seltenen explosiven Events besteht
(Merapi, Unzen, Colima), (2) Kryptodom-bildende Vulkane, bei denen ein plötzliches
dekompressives Ereignis (z.B. Hangrutsch) einen explosiven Ausbruch (lateral oder
directed blast) hervorgerufen hat (Mt. St. Helens, Bezymianny), und (3) explosive,
subplinianische bis plinianische Eruptionen mit pyroklastischen Strömen (Kelut,
Krakatau, St. Augustine).
Des Weiteren wurden mögliche Zusammenhänge zwischen den mittleren
Porositätswerten einer Eruptionsablagerung und der Explosivität eines Ausbruchs
untersucht. Als Messgrößen für die Explosivität wurden dabei zwei verschiedene in der
Literatur beschriebene Indizes verwendet:
- Der Volcanic Explosivity Index (VEI) nach Newhall & Self (1982), eine
größtenteils auf dem Gesamtvolumen des bei einem Ausbruch (oder während
einer längeren Eruptionsphase) geförderten Materials basierende Kennzahl
zwischen 0 (= rein effusiv) und 8 (= katastrophal explosiv), und
Zusammenfassung
6
- die Eruption Magnitude (M) nach Pyle (1995, 2000), der die Masse des
geförderten Materials als Grundlage dient.
Während der Abgleich der Porositätsdaten mit dem VEI einen eher qualitativen,
positiven Zusammenhang mit allerdings ungenauer Korrelation bei niedrig-porösen und
-explosiven Förderprodukten aufweist, konnte durch Berechnung der Eruption
Magnitude (unter Verwendung der in dieser Studie ermittelten Porositätswerte) eine
insgesamt bessere Korrelation erreicht werden. Abweichungen von einem linear
ansteigenden Trend können dabei durch die jeweiligen Eruptionscharakteristiken (z.B.
Kryptodom, phreatomagmatische Aktivität) erklärt werden.
Introduction
7
1 Introduction
1.1 Explosive volcanism – threat and challenge
The relationship between mankind and volcanoes is of ambivalent nature. On the
one hand, people have always benefited from the fertility of the rich volcanic soils and
the amenities of hot springs, and therefore often settled in proximity of volcanoes. But
every now and then, the apparently peaceful landscapes tend to turn into vigorously
exploding volcanoes, responsible for lethal catastrophic events that may destroy human
lives, buildings, and infrastructure. Several of the most serious natural disasters in
history are correlated to explosive volcanic eruptions – either directly by pyroclastic
flows and ash fall, or indirectly through the effect of tsunamis (e.g. Krakatau 1883, with
more than 36,000 casualties) or the impact of volcanic aerosols on climate and
agriculture (e.g. Tambora 1815, with at least 117,000 casualties, Sigurdsson 2000). Just
as the powerful consequences of these phenomena have always fascinated and
frightened people, their causes have been subject to speculation and interpretation since
early times of human civilization.
At the beginning of the 21st century, approximately 10 % of human population live
within a 100 km radius of historically active volcanic centres, concurrently a
considerable amount of capital is concentrated in those areas. Explosive volcanic
eruptions generate natural hazards that can have devastating effects on human life, and
the environmental status quo. The damage to infrastructure can lead to massive
international capital flow with a social and economic hangover. For risk minimization
and the prevention of casualties caused by the various effects of such an event it is
therefore essential to understand mechanistically how a volcano works and why (and,
even more important, when) it “chooses” to explode.
As of today, the most applicable methods for volcanic hazard assessment are
provided by seismic or chemical monitoring of eruptive precursors. But considering the
enormous speed of progress in computational technologies, numerical modelling is
becoming an increasingly important tool to predict the course and consequences of an
eruption. If provided with a framework of profound and realistic physico-chemical
Introduction
8
parameters, such models can now deliver helpful insights even into extremely complex
physical processes.
An explosive volcanic eruption as one of such processes derives its complexity
from the interaction of a vast number of more or less interdependent physico-chemical
parameters. Chemical composition, pressure, and temperature govern magma
crystallinity, volatile exsolution, and viscosity. The latter in turn influence magma
ascent and bubble growth dynamics. Overpressure development in volatile phase
depends on the structure of a pore framework and its gas permeability. An efficient
discharge of the gaseous phase again has an impact on magma viscosity and all the
related processes and properties (e.g. Gilbert & Sparks 1998, Dingwell 1998b, Cashman
et al. 2000).
It can be regarded as a primary task of experimental volcanology to contribute a
basis of realistic data that may serve as input parameter for numerical models. This
especially accounts for those natural processes, which are eluded from direct
observation, or are too complex for a purely theoretical treatment. Magmatic
fragmentation is a good example for such a complex process (Mader et al. 2004).
The subject of this work is to investigate the interrelations of porosity and
permeability of natural volcanic rocks and examine the effects of both parameters on
fragmentation processes and explosivity. For this purpose, a new setup for the
investigation of permeability under conditions close to volcanic environments – high
decompression rates, strongly transient conditions and high temperatures – has been
developed. The influence of pore texture and volume on the permeability has been
experimentally investigated (Chapter 4). The determination and quantification of a
dependency between the degassing efficiency of a volcanic rock and its fragmentation
behaviour was a further vital component of this work (Chapter 5). Porosity data from
samples of various volcanic settings have been achieved in the laboratory and, in a
statistical relevant amount, directly from volcanic deposits in order to analyse their
significance for volcanic explosivity evaluations (Chapter 3).
Introduction
9
1.2 The development of porosity – bubble nucleation and growth
A magma is basically a mixture of three phases: a viscous silicate melt, crystals,
and a volatile phase. The composition of the latter varies with the magma’s origin and
degree of fractionation; the biggest portion is usually represented by H20 and CO2.
Under deep-crustal conditions, volatiles are dissolved in the melt. The total amount of
volatiles that can be kept in dissolution depends on the magma’s composition, its
temperature, and the confining pressure.
Bubble nucleation
The formation of a new gas phase requires a certain amount of volatile
supersaturation in the silicate melt, in order to provide the energy input necessary to
create new surfaces (Figure 1.1). Since a huge volume increase accompanies volatile
exsolution and formation of a vapour phase, pressure reduction is the most effective
mechanism to achieve this supersaturation. This depressurization might be caused e.g.
by magma ascent to shallower levels or sudden confining wall rock failure. This type of
bubble nucleation is also referred to as first boiling (Navon & Lyakhovsky 1998).
Another process to reach supersaturation is to increase the water content of the melt.
The crystallization of OH-poor or -free minerals, would, for instance, increase the
relative H2O-content of the residual melt. This process is termed second boiling and
may be of special importance for the pressurization of crystallizing magma chambers or
lava domes (Navon & Lyakhovsky 1998, Cashman et al. 2000, Francis & Oppenheimer
2003).
Once a melt is saturated, the thermodynamic equilibrium demands the formation of
a separate vapour phase. According to classical nucleation theory for a homogenous
material (e.g. Landau & Lifshitz 1980, Navon & Lhaykhovsky 1998), bubble formation
is governed by the counterbalance between energy gained by balancing the saturation
disequilibrium (volume energy) and energy lost by increasing the bubble-melt interface
against surface tension (surface energy). A critical nucleus size, above which the bubble
is stable and can grow, is defined at exactly the point, where volume energy and surface
energy are balanced. If a bubble with a radius smaller than the critical radius is formed,
capillary force closes the bubble. Classical nucleation theory predicts that - assuming

Introduction
10
realistic surface tension values of silicate melts - extremely high supersaturation
pressures of up to 150 MPa are required to cause nucleation in a homogenous medium
(Navon & Lyakhovsky 1998). However in a natural system with all kinds of impurities,
nucleation may also occur heterogeneously. Crystals may provide particularly
favourable sites for bubble nucleation, since the crystal-gas interface energy is lower
than that of the melt to gas. Taking these heterogeneities into account, bubble nucleation
may thus occur at much lower degrees of supersaturation (Navon & Lyakhovsky 1998,
Cashman et al. 2000). These two end-member models - purely homogenous versus
heterogeneous - define two possible exsolution levels within a magma column. This
relative position, with respect to the fragmentation level during an explosive eruption, is
an important control on the resulting bubble sizes, bubble-size distribution and bubble
number density of the pyroclasts, since it defines the time scale of bubble growth and
coalescence. This may have considerable effects on the general dynamics of an eruption
(Cashman et al. 2000).
Figure 1.1: Schematic view of processes in a volcanic
conduit. Bubble nucleation initiates when the magma
has reached a certain amount of volatile
supersaturation, which mainly depends on the
available concentration of heterogeneities acting as
nucleation sites. After nucleation, bubbles grow due to
volatile diffusion and decompression, and eventually
coalesce. If a system of interconnected pore space is
established, gas will escape following the pressure
gradient. Lastly, magma fragmentation transforms the
bubbly flow into a gas-particle dispersion flow.
Modified from Melnik et al. 2005.
Bubble growth
Once nucleated, bubble growth is - under constant ambient pressure - controlled by
an interplay between water diffusion from the melt phase towards the melt-vesicle
interface and bubble expansion against the viscous melt. In early stages of vesicle
Introduction
11
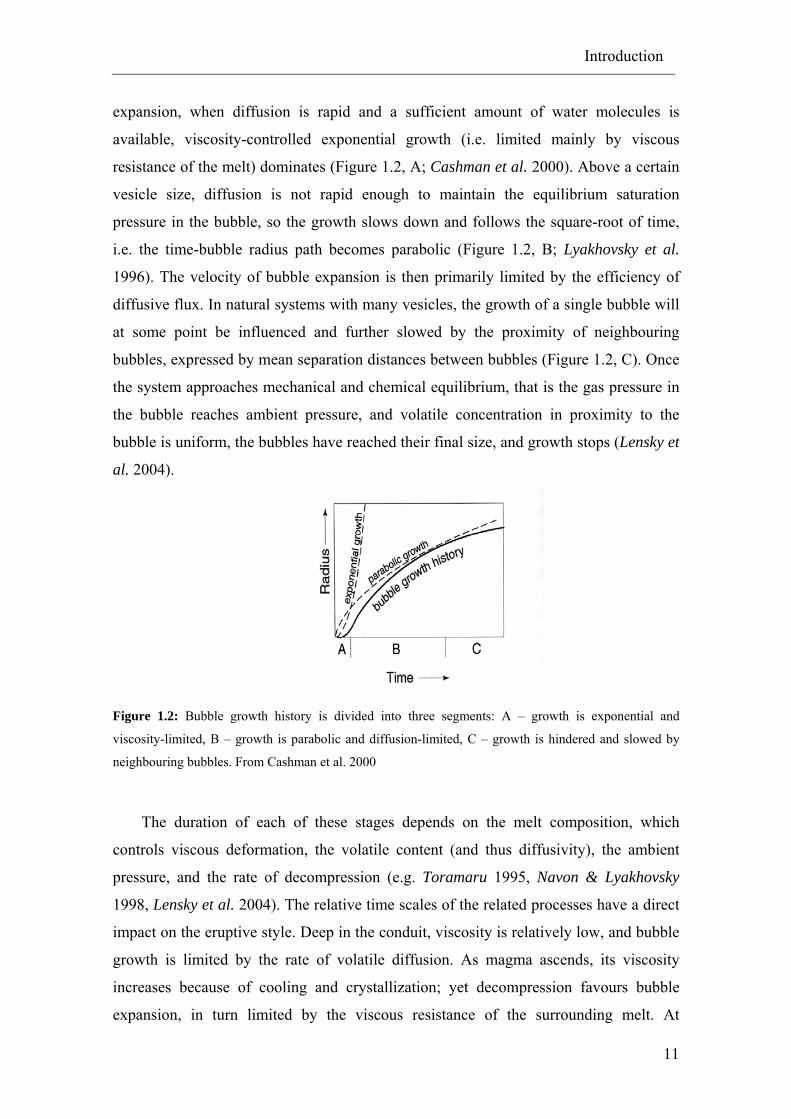
expansion, when diffusion is rapid and a sufficient amount of water molecules is
available, viscosity-controlled exponential growth (i.e. limited mainly by viscous
resistance of the melt) dominates (Figure 1.2, A; Cashman et al. 2000). Above a certain
vesicle size, diffusion is not rapid enough to maintain the equilibrium saturation
pressure in the bubble, so the growth slows down and follows the square-root of time,
i.e. the time-bubble radius path becomes parabolic (Figure 1.2, B; Lyakhovsky et al.
1996). The velocity of bubble expansion is then primarily limited by the efficiency of
diffusive flux. In natural systems with many vesicles, the growth of a single bubble will
at some point be influenced and further slowed by the proximity of neighbouring
bubbles, expressed by mean separation distances between bubbles (Figure 1.2, C). Once
the system approaches mechanical and chemical equilibrium, that is the gas pressure in
the bubble reaches ambient pressure, and volatile concentration in proximity to the
bubble is uniform, the bubbles have reached their final size, and growth stops (Lensky et
al. 2004).
Figure 1.2: Bubble growth history is divided into three segments: A – growth is exponential and
viscosity-limited, B – growth is parabolic and diffusion-limited, C – growth is hindered and slowed by
neighbouring bubbles. From Cashman et al. 2000
The duration of each of these stages depends on the melt composition, which
controls viscous deformation, the volatile content (and thus diffusivity), the ambient
pressure, and the rate of decompression (e.g. Toramaru 1995, Navon & Lyakhovsky
1998, Lensky et al. 2004). The relative time scales of the related processes have a direct
impact on the eruptive style. Deep in the conduit, viscosity is relatively low, and bubble
growth is limited by the rate of volatile diffusion. As magma ascends, its viscosity
increases because of cooling and crystallization; yet decompression favours bubble
expansion, in turn limited by the viscous resistance of the surrounding melt. At
Introduction
12
shallower depth, this enhanced viscous resistance may result in considerable amounts of
excess pressure in the bubbles, which may eventually lead to magma fragmentation by
internal overpressure (Figure 1.1; Cashman et al. 2000). These effects will be addressed
further in Chapter 5.
Porosity
The entirety of the bubbles nucleated, grown, and coalesced during ascent, together
with syn- and post-eruptive shear- cooling- or expansion fractures, define the total
porosity of a volcanic rock. It is commonly expressed as a fraction of the bulk volume
(vol% or fraction between 0 and 1). The total porosity (Φtot) of a material is composed
by the connected (or open, accessible, effective) pore space (Φop) plus isolated (or
closed) pores.
In contrast to sedimentary rocks with an intergranular porosity, where the void
space is primarily defined by the interstices between single grains or particles and is
commonly highly interconnected, the porosity of volcanic rocks derives from originally
isolated, ‘spherical’ vesicles. The accessibility of gas to flow between these vesicles is
provided mainly by bubble-bubble interconnections, formed during bubble coalescence.
If a sample has experienced considerable brittle deformation, the influence of (micro-
and macro-) cracks on the formation of a connected porosity may be substantial. The
resulting texture of a volcanic rock’s pore space depends on its history of coalescence,
shear deformation (elongation) and compaction during ascent or emplacement.
Important parameters in this context are the bubble size, the bubble size distribution, the
bubble number density (number of bubbles per volume unit), the bubble’s aspect ratios,
the degree of coalescence, and, indirectly, also the crystal content. Textural features of
porosity and their relation to permeability will be further addressed in Chapter 4.
1.3 Causes and consequences of magma permeability
According to theoretical solubility relationship (e.g. Shaw 1974), initial H2O
contents of many dacitic to rhyolitic magmas (4-6 wt%) should lead to porosities of
about 75 vol% at 450-750 m depth and >99 vol% at the volcanic vent (Klug & Cashman
1996). The fact that such high vesicularities are rarely found in natural pumices
indicates the presence of more or less effective degassing of the magma during ascent.

Introduction
13
Degassing is a crucial process for the eruptive behaviour of a volcanic system.
Beside its superficially visible manifestations, like volcanic gas emission and the
precipitation of magmatic-hydrothermal deposits, it may have substantial impacts on the
fragmentation behaviour (Klug & Cashman 1996, Dingwell 1998a, Papale 2001), the
transition in eruptive styles (explosive-effusive; Eichelberger et al. 1986, Dingwell
1996, Gonnermann & Manga 2003, Melnik et al. 2005), the pressurization of lava
domes and plugs (Sparks 1997, Navon et al. 1998), and post-fragmentation processes
(Kaminsky & Jaupart 1997).
Gas filtration through magma occurs if an interconnected framework of pores and
fractures has been developed during bubble growth and brittle deformation, and a
pressure gradient exists that drives the motion of the gas phase. The permeability of
such a system is limited by the aperture size of the bubble-bubble interconnections or
the width of a fracture (Blower 2001a). To create a network of bubbles connected via
apertures, the vesicles have to mechanically interact and coalesce at some point during
ascent. This is considered to happen mainly through the process of thinning and
subsequent failure of bubble walls. The time scale of melt film rupture thereby depends
on the balance between two counteracting forces: the pressure difference that causes
radial expansion of bubbles together with capillary and gravitational forces (both acting
to retract the melt films between touching vesicles), against viscous resistance of the
liquid (Klug & Cashman 1996, Navon & Lyakhovsky 1998). According to Klug &
Cashman (1996) the frequent occurrence of coalesced bubbles in pumices indicates that
the aforementioned time scale of wall thinning is less than the time scale of
fragmentation.
Assumptions about the mechanisms and directions of gas escape diverge: some
models assume that magma degassing through the conduit wall into the country rock is
significant (e.g. Jaupart 1998), while others claim effectively impermeable conduit
walls and a vertical direction of gas filtration through a permeable bubbly magma
(Jaupart & Allegre 1991, Woods & Koyaguchi 1994).
However, as the dynamics of volcanic eruptions are likely to be sensitive to
volatile content, exsolution mechanisms, and gas overpressures, small changes of the
permeability within a volcanic system may change the eruptive style considerably.
Accordingly, sudden transitions from effusive to explosive behaviour and back may, for
example, be attributed to the opening of new fracture systems within a volcanic edifice,
giving rise to a sudden increase in degassing efficiency. Similarly, a gradual increase of

Introduction
14
the permeability of a porous magma and the transition from closed- to open-system
degassing may at some point lead to the transgression of the critical degree of volatile
and overpressure extraction from the magma, and cause termination of explosive
activity. Examples and explanations of these kinds of eruptive style transitions are given
in Eichelberger et al. 1986, Woods & Koyaguchi 1994, Gonnermann & Manga 2003,
Melnik 2000 and Melnik et al. 2005.
A contribution to the ongoing debate, whether a high permeability can influence,
and eventually also prevent magma fragmentation, is given by the experimental
investigations described in Chapter 5 of this thesis.
Sample provenance and preparation
15
2 Sample provenance and preparation
2.1 Investigated volcanoes
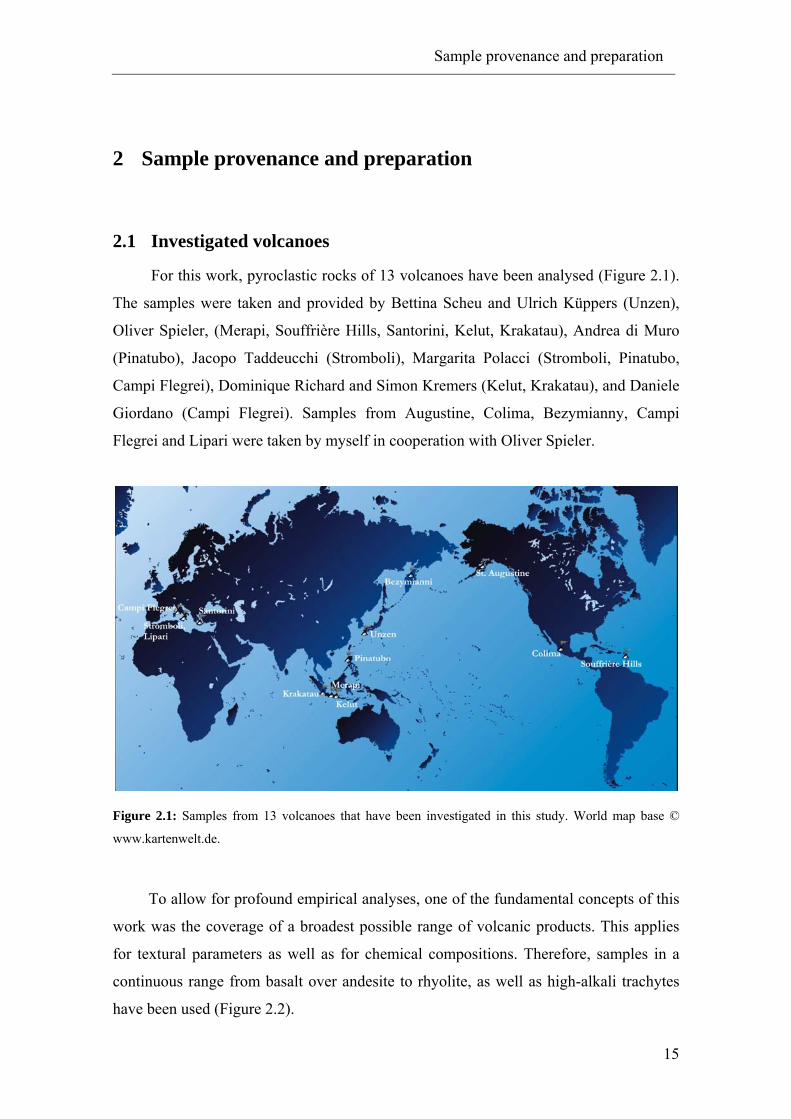
For this work, pyroclastic rocks of 13 volcanoes have been analysed (Figure 2.1).
The samples were taken and provided by Bettina Scheu and Ulrich Küppers (Unzen),
Oliver Spieler, (Merapi, Souffrière Hills, Santorini, Kelut, Krakatau), Andrea di Muro
(Pinatubo), Jacopo Taddeucchi (Stromboli), Margarita Polacci (Stromboli, Pinatubo,
Campi Flegrei), Dominique Richard and Simon Kremers (Kelut, Krakatau), and Daniele
Giordano (Campi Flegrei). Samples from Augustine, Colima, Bezymianny, Campi
Flegrei and Lipari were taken by myself in cooperation with Oliver Spieler.
Figure 2.1: Samples from 13 volcanoes that have been investigated in this study. World map base ©
www.kartenwelt.de.
To allow for profound empirical analyses, one of the fundamental concepts of this
work was the coverage of a broadest possible range of volcanic products. This applies
for textural parameters as well as for chemical compositions. Therefore, samples in a
continuous range from basalt over andesite to rhyolite, as well as high-alkali trachytes
have been used (Figure 2.2).
Sample provenance and preparation
16
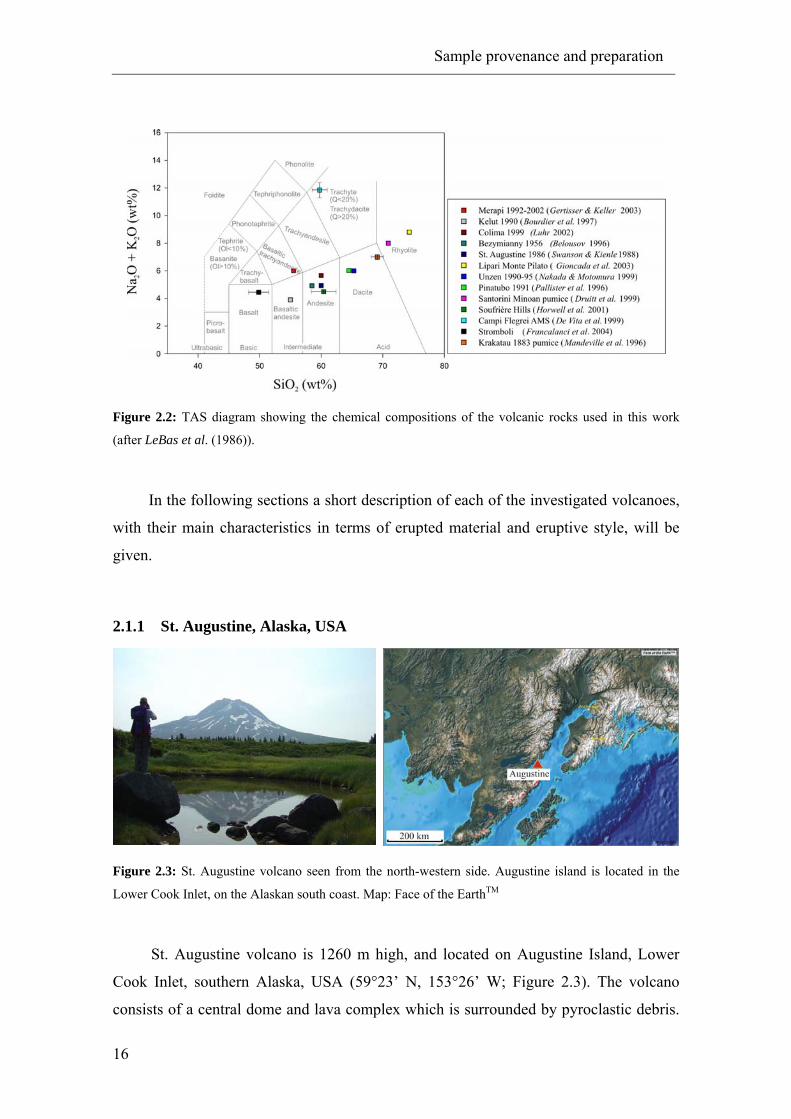
Figure 2.2: TAS diagram showing the chemical compositions of the volcanic rocks used in this work
(after LeBas et al. (1986)).
In the following sections a short description of each of the investigated volcanoes,
with their main characteristics in terms of erupted material and eruptive style, will be
given.
2.1.1 St. Augustine, Alaska, USA
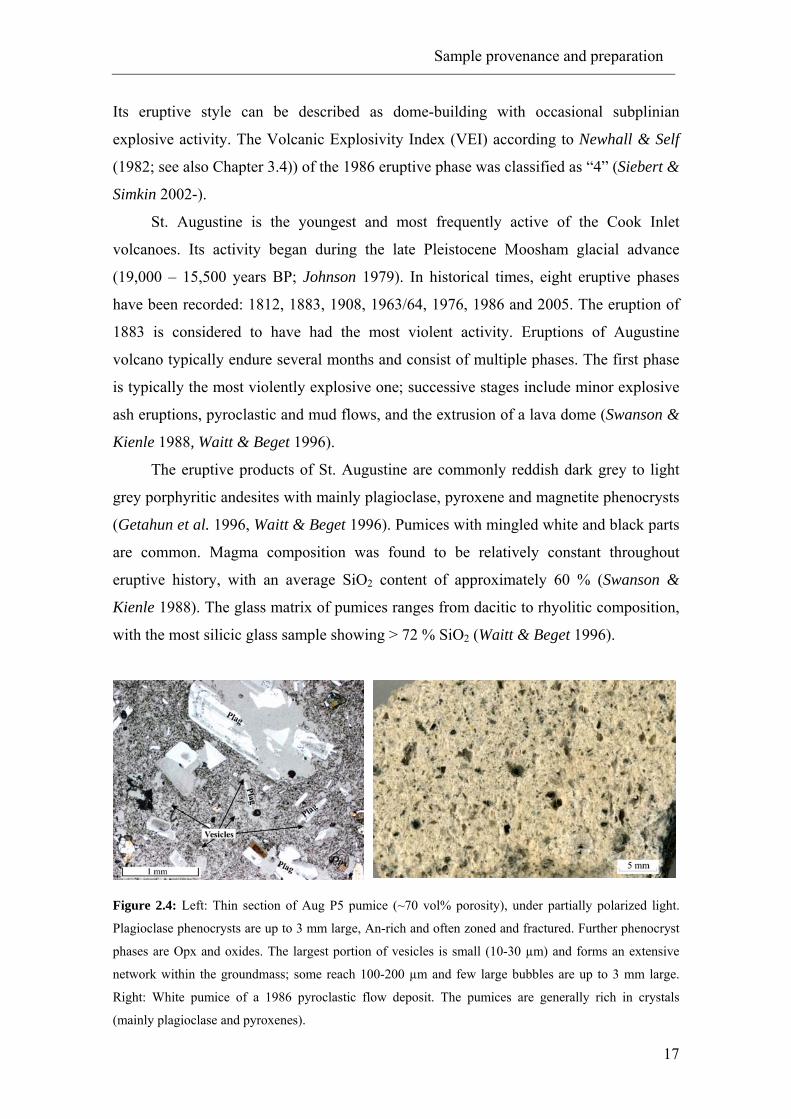
Figure 2.3: St. Augustine volcano seen from the north-western side. Augustine island is located in the
Lower Cook Inlet, on the Alaskan south coast. Map: Face of the EarthTM
St. Augustine volcano is 1260 m high, and located on Augustine Island, Lower
Cook Inlet, southern Alaska, USA (59°23’ N, 153°26’ W; Figure 2.3). The volcano
consists of a central dome and lava complex which is surrounded by pyroclastic debris.
Sample provenance and preparation
17
Its eruptive style can be described as dome-building with occasional subplinian
explosive activity. The Volcanic Explosivity Index (VEI) according to Newhall & Self
(1982; see also Chapter 3.4)) of the 1986 eruptive phase was classified as “4” (Siebert &
Simkin 2002-).
St. Augustine is the youngest and most frequently active of the Cook Inlet
volcanoes. Its activity began during the late Pleistocene Moosham glacial advance
(19,000 – 15,500 years BP; Johnson 1979). In historical times, eight eruptive phases
have been recorded: 1812, 1883, 1908, 1963/64, 1976, 1986 and 2005. The eruption of
1883 is considered to have had the most violent activity. Eruptions of Augustine
volcano typically endure several months and consist of multiple phases. The first phase
is typically the most violently explosive one; successive stages include minor explosive
ash eruptions, pyroclastic and mud flows, and the extrusion of a lava dome (Swanson &
Kienle 1988, Waitt & Beget 1996).
The eruptive products of St. Augustine are commonly reddish dark grey to light
grey porphyritic andesites with mainly plagioclase, pyroxene and magnetite phenocrysts
(Getahun et al. 1996, Waitt & Beget 1996). Pumices with mingled white and black parts
are common. Magma composition was found to be relatively constant throughout
eruptive history, with an average SiO2 content of approximately 60 % (Swanson &
Kienle 1988). The glass matrix of pumices ranges from dacitic to rhyolitic composition,
with the most silicic glass sample showing > 72 % SiO2 (Waitt & Beget 1996).
Figure 2.4: Left: Thin section of Aug P5 pumice (~70 vol% porosity), under partially polarized light.
Plagioclase phenocrysts are up to 3 mm large, An-rich and often zoned and fractured. Further phenocryst
phases are Opx and oxides. The largest portion of vesicles is small (10-30 µm) and forms an extensive
network within the groundmass; some reach 100-200 µm and few large bubbles are up to 3 mm large.
Right: White pumice of a 1986 pyroclastic flow deposit. The pumices are generally rich in crystals
(mainly plagioclase and pyroxenes).

Sample provenance and preparation
18
The samples investigated in this work derive from the 1986 eruption. The
porosity/density distribution of volcanic products of eight different locations has been
measured in a field campaign in summer 2004. The porosity of the investigated material
ranges from ~3 to ~80 vol%.
2.1.2 Bezymianny, Kamchatka, Russia
Figure 2.5: Bezymianny volcano on central Kamchatka peninsula seen from south-east. Visible is the
horseshoe-shaped crater of the 1956 directed blast event with a newly grown dome structure. Map: Face
of the EarthTM.
The volcano (2882 m asl) is situated in the central part of the Klyuchevskaya
volcanic complex, Kamchatka peninsula, Russia (56°04’ N, 160°43’ E; Figure 2.5). Its
activity is dome-building with highly explosive eruptions, interrupted by up to several
hundred years of quiescence. The explosivity of the last major explosive event in 1956
is rated as VEI 5 (Siebert & Simkin 2002-).
The eruptive history of Bezymianny volcano began 10,000–11,000 yBP with the
extrusion of basaltic-andesitic to andesitic lava to form a “pre-Bezymianny”
stratovolcanic structure. The present Bezymianny stratovolcano started growing 5000-
5500 yBP. Three periods of activity were recorded within the last 2500 years: 2400-
1700 yBP (B I), 1350-1000 yBP (B II) and 1955-present (B III; Bogoyavlenskaya et al.
1991).
The eruptive phase of 1955/56 culminated in a sector collapse triggering a
directed blast event similar to the 1980 Mt. St. Helens eruption, and destroyed the
formerly 3100 m high summit and the eastern slope, forming a horseshoe-shaped crater
with a new dome structure in its centre. For this work, samples of proximal block-and-
ash-flows from a 2000 eruption and deposits of the pyroclastic flows that followed the

Sample provenance and preparation
19
1956 sector collapse, as well as deposits of the blast event itself have been investigated.
Density measurements have been performed on five sites in September 2004.
The products of this eruption are dense, dark grey to bluish hornblende andesites,
vesicular light-grey hornblende andesites, and rock fragments of the old pre-
Bezymianny edifice. The bulk SiO2-content ranges between 52.5 % and 65.5 %
(Bogoyavlenskaya et al. 1991) and averages at around 58.5 % (Belousov 1996). Thin
sections show that the main phenocrysts phases are plagioclase and hornblende (Figure
2.6).
Figure 2.6: Left: Thin section of an andesite from 1956 Bezymianny blast-deposit. Vesicles are rather
small with sizes mainly between 25 and 100 µm. They show for the most part deformation/ collapse
structures (e.g. concavely shaped edges). The dominating phenocryst phase is plagioclase; hornblende and
ore minerals are minor components. Mafic minerals are often rimed by oxide minerals. Right: High-
crystalline blast-deposit sample (porosity ~25 vol%) with deformed vesicles, and predominantly
plagioclase and hornblende phenocrysts.
Sample provenance and preparation
20
2.1.3 Colima, Mexico
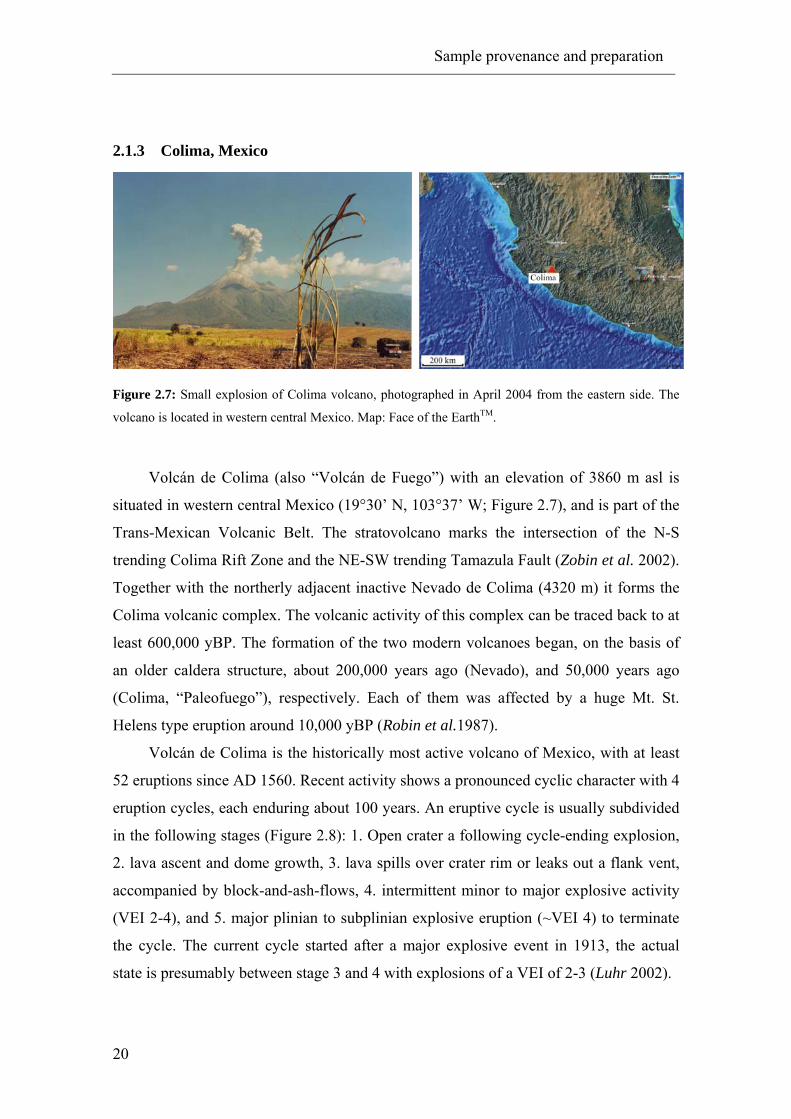
Figure 2.7: Small explosion of Colima volcano, photographed in April 2004 from the eastern side. The
volcano is located in western central Mexico. Map: Face of the EarthTM.
Volcán de Colima (also “Volcán de Fuego”) with an elevation of 3860 m asl is
situated in western central Mexico (19°30’ N, 103°37’ W; Figure 2.7), and is part of the
Trans-Mexican Volcanic Belt. The stratovolcano marks the intersection of the N-S
trending Colima Rift Zone and the NE-SW trending Tamazula Fault (Zobin et al. 2002).
Together with the northerly adjacent inactive Nevado de Colima (4320 m) it forms the
Colima volcanic complex. The volcanic activity of this complex can be traced back to at
least 600,000 yBP. The formation of the two modern volcanoes began, on the basis of
an older caldera structure, about 200,000 years ago (Nevado), and 50,000 years ago
(Colima, “Paleofuego”), respectively. Each of them was affected by a huge Mt. St.
Helens type eruption around 10,000 yBP (Robin et al.1987).
Volcán de Colima is the historically most active volcano of Mexico, with at least
52 eruptions since AD 1560. Recent activity shows a pronounced cyclic character with 4
eruption cycles, each enduring about 100 years. An eruptive cycle is usually subdivided
in the following stages (Figure 2.8): 1. Open crater a following cycle-ending explosion,
2. lava ascent and dome growth, 3. lava spills over crater rim or leaks out a flank vent,
accompanied by block-and-ash-flows, 4. intermittent minor to major explosive activity
(VEI 2-4), and 5. major plinian to subplinian explosive eruption (~VEI 4) to terminate
the cycle. The current cycle started after a major explosive event in 1913, the actual
state is presumably between stage 3 and 4 with explosions of a VEI of 2-3 (Luhr 2002).

Sample provenance and preparation
21
Figure 2.8: Schematic depiction of the five stages of eruption cycles of Colima volcano. Explanation see
text. From Luhr 2002.
Volcán de Colima usually erupts andesitic lavas with ~61 wt% SiO2, the cycle-
ending major explosions (e.g. 1818 and 1913), as well as 1976 and 1981/82 lava flows,
involve more mafic andesites with ~58 wt% SiO2. This change in composition is
attributed to a periodic recharge of deeper, mafic magma into a more differentiated
magma reservoir and may be interpreted as a precursor for a cycle-terminating
explosion in near future. The magma of the current eruption cycle contains 2-3.5 wt.%
H20, which is significantly lower than the water contents of the 1896-1913 cycle. This
indicates a lower explosivity of the current eruptive cycle (Luhr 2002).
The andesites of Colima show a porphyritic texture with plagioclase (13-25 vol%),
orthopyroxene (2-4 vol%), clinopyroxene (3-4 vol%), and minor hornblende (< 0.5%) as
phenocrysts. Ti-oxides and olivine can occur as xenocrysts; the groundmass amounts to
59-68 vol% (Luhr 2002).
Sample provenance and preparation
22
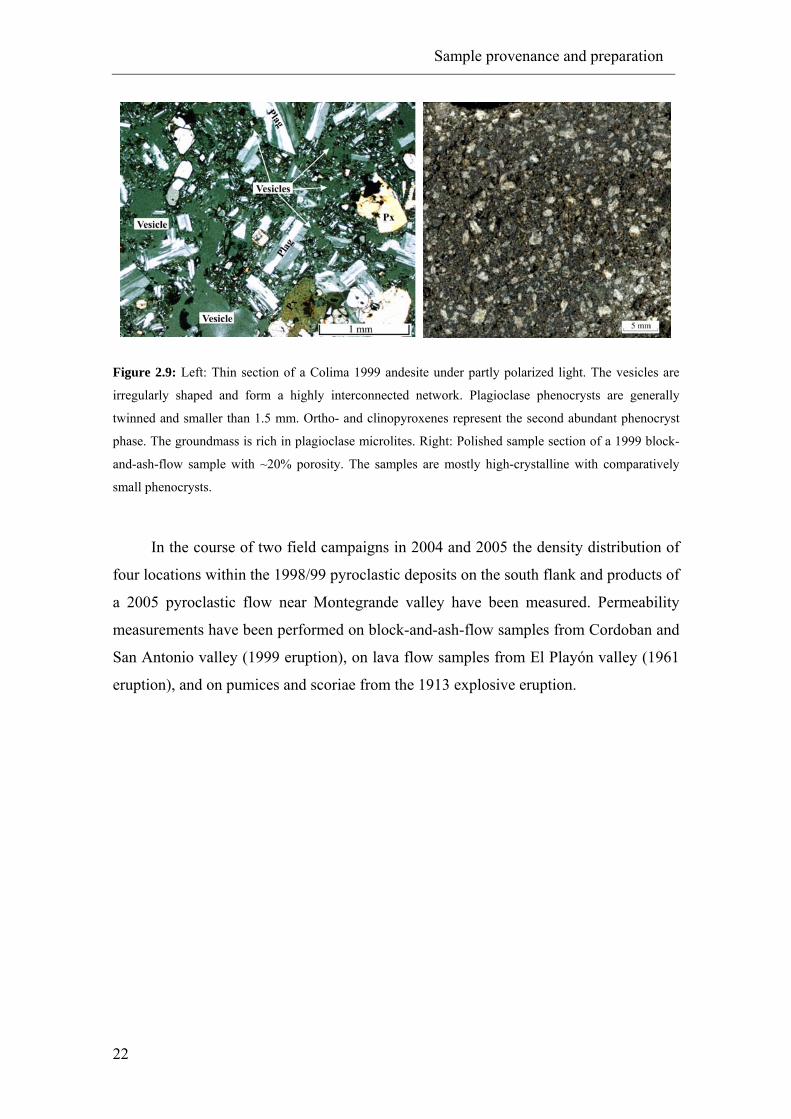
Figure 2.9: Left: Thin section of a Colima 1999 andesite under partly polarized light. The vesicles are
irregularly shaped and form a highly interconnected network. Plagioclase phenocrysts are generally
twinned and smaller than 1.5 mm. Ortho- and clinopyroxenes represent the second abundant phenocryst
phase. The groundmass is rich in plagioclase microlites. Right: Polished sample section of a 1999 block-
and-ash-flow sample with ~20% porosity. The samples are mostly high-crystalline with comparatively
small phenocrysts.
In the course of two field campaigns in 2004 and 2005 the density distribution of
four locations within the 1998/99 pyroclastic deposits on the south flank and products of
a 2005 pyroclastic flow near Montegrande valley have been measured. Permeability
measurements have been performed on block-and-ash-flow samples from Cordoban and
San Antonio valley (1999 eruption), on lava flow samples from El Playón valley (1961
eruption), and on pumices and scoriae from the 1913 explosive eruption.
Sample provenance and preparation
23
2.1.4 Krakatau, Indonesia
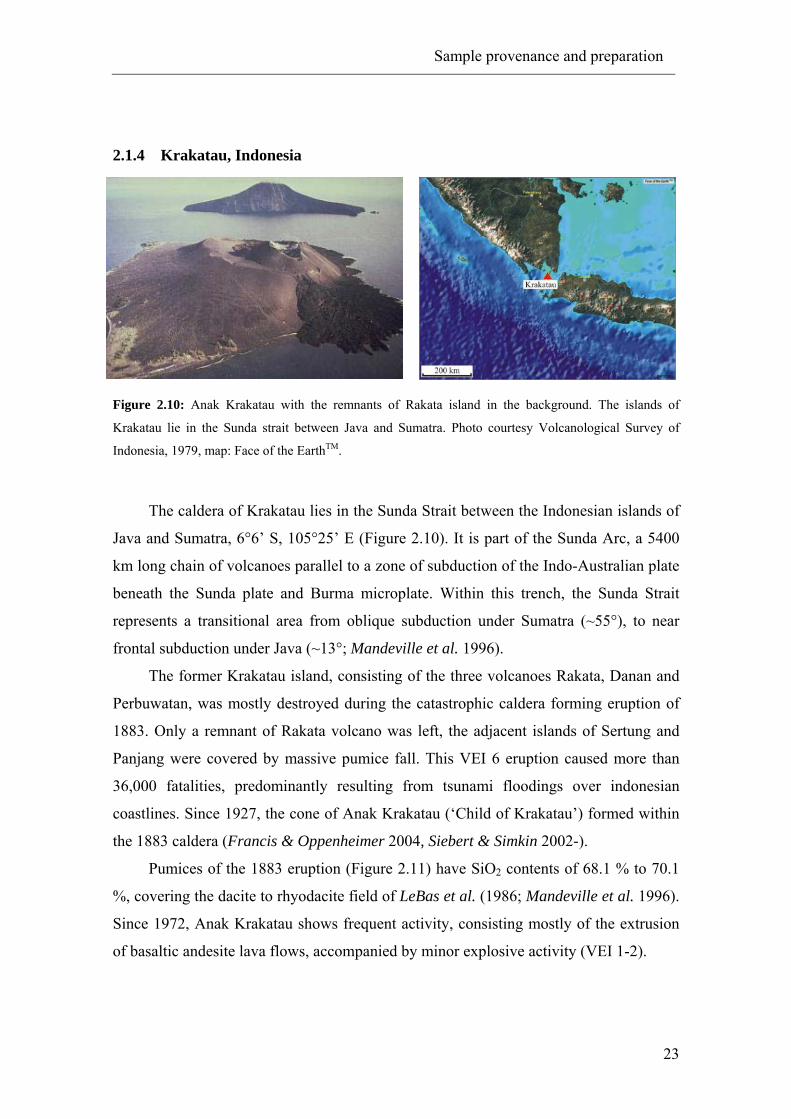
Figure 2.10: Anak Krakatau with the remnants of Rakata island in the background. The islands of
Krakatau lie in the Sunda strait between Java and Sumatra. Photo courtesy Volcanological Survey of
Indonesia, 1979, map: Face of the EarthTM.
The caldera of Krakatau lies in the Sunda Strait between the Indonesian islands of
Java and Sumatra, 6°6’ S, 105°25’ E (Figure 2.10). It is part of the Sunda Arc, a 5400
km long chain of volcanoes parallel to a zone of subduction of the Indo-Australian plate
beneath the Sunda plate and Burma microplate. Within this trench, the Sunda Strait
represents a transitional area from oblique subduction under Sumatra (~55°), to near
frontal subduction under Java (~13°; Mandeville et al. 1996).
The former Krakatau island, consisting of the three volcanoes Rakata, Danan and
Perbuwatan, was mostly destroyed during the catastrophic caldera forming eruption of
1883. Only a remnant of Rakata volcano was left, the adjacent islands of Sertung and
Panjang were covered by massive pumice fall. This VEI 6 eruption caused more than
36,000 fatalities, predominantly resulting from tsunami floodings over indonesian
coastlines. Since 1927, the cone of Anak Krakatau (‘Child of Krakatau’) formed within
the 1883 caldera (Francis & Oppenheimer 2004, Siebert & Simkin 2002-).
Pumices of the 1883 eruption (Figure 2.11) have SiO2 contents of 68.1 % to 70.1
%, covering the dacite to rhyodacite field of LeBas et al. (1986; Mandeville et al. 1996).
Since 1972, Anak Krakatau shows frequent activity, consisting mostly of the extrusion
of basaltic andesite lava flows, accompanied by minor explosive activity (VEI 1-2).

Sample provenance and preparation
24
Figure 2.11: Left: Thin section of a highly vesicular pumice of the 1883 explosive eruption. Bubble size
ranges from 20 µm to more than 7 mm, the size distribution is highly polydisperse. Especially large
vesicles are often coalesced. The phenocryst content is rather low, the most abundant mineral phase is
plagioclase (with a brownish appearance due to the partly polarized light). Right: Highly porous, white
pumice from Rakata island (porosity ~ 85 vol%).
Density measurements have been performed by S. Kremers, D. Richard and O.
Spieler on six locations (on Sertung, Rakata, Panjang, and Anak Krakatau), during a
field campaign in March 2005. For the permeability investigations, white pumices of the
1883 eruption and basaltic andesites from the Anak Krakatau crater rim have been used.
2.1.5 Kelut, Indonesia
Figure 2.12: Crater lake of Kelut volcano, eastern central Java. Photo by Dan Dzurisin, 1980 (U.S.
Geological Survey), map: Face of the EarthTM.
Kelut is a 1731 m high stratovolcano, situated in the eastern part of Java (7°56’ S,
112°18’ E; Figure 2.12). It consists of a cluster of summit lava and numerous craters,
giving the volcano a rather irregular profile. Since AD 1000 more than 30 eruptions
have been reported from Kelut, often accompanied by outpouring of the crater lake,
leading to catastrophic lahars with numerous fatalities. Most eruptions are short (few
Sample provenance and preparation
25
hours) but violent, and have usually a moderate magnitude in terms of erupted material
volume (Bourdier et al. 1997). The most recent eruption (Feb 1990), started with a
series of phreatic explosions, after 24 years of dormancy. A subsequent small plinian
phase sustained for four hours and predominantly produced light grey pumices and dark
scoriae. The VEI 4 eruption totalled ~0.13 km3 of erupted tephra (Bourdier et al. 1997,
Siebert & Simkin 2002-).
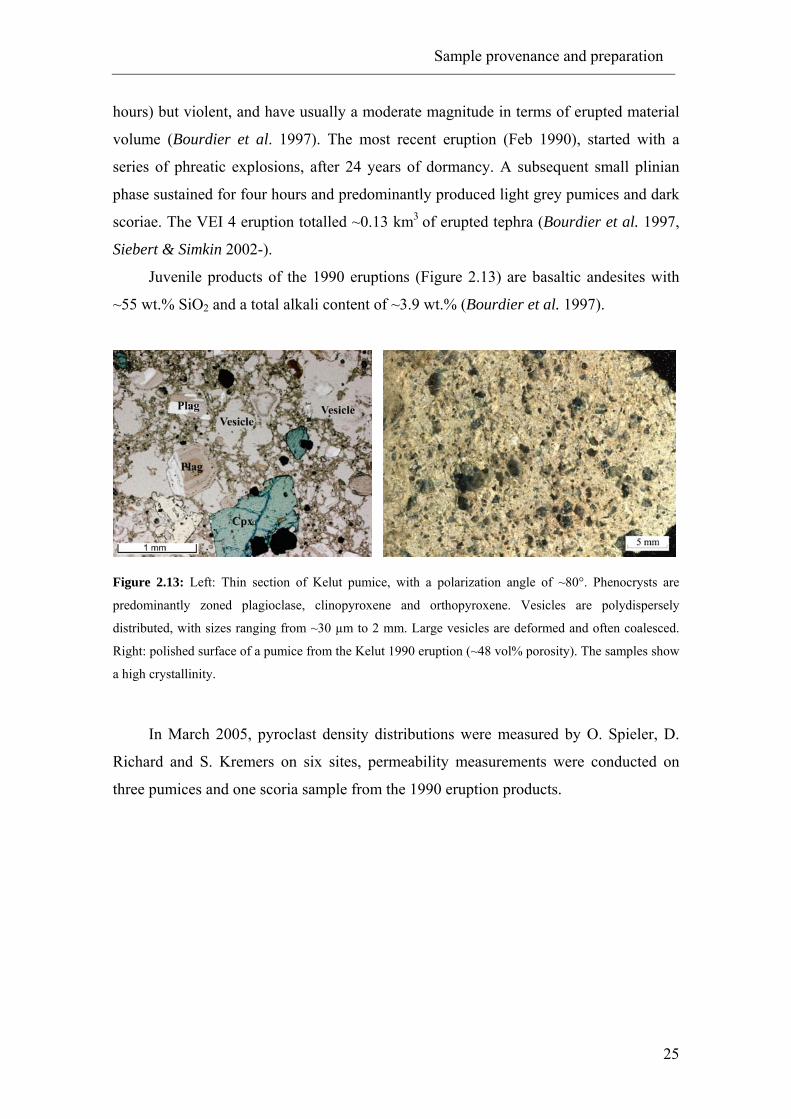
Juvenile products of the 1990 eruptions (Figure 2.13) are basaltic andesites with
~55 wt.% SiO2 and a total alkali content of ~3.9 wt.% (Bourdier et al. 1997).
Figure 2.13: Left: Thin section of Kelut pumice, with a polarization angle of ~80°. Phenocrysts are
predominantly zoned plagioclase, clinopyroxene and orthopyroxene. Vesicles are polydispersely
distributed, with sizes ranging from ~30 µm to 2 mm. Large vesicles are deformed and often coalesced.
Right: polished surface of a pumice from the Kelut 1990 eruption (~48 vol% porosity). The samples show
a high crystallinity.
In March 2005, pyroclast density distributions were measured by O. Spieler, D.
Richard and S. Kremers on six sites, permeability measurements were conducted on
three pumices and one scoria sample from the 1990 eruption products.
Sample provenance and preparation
26
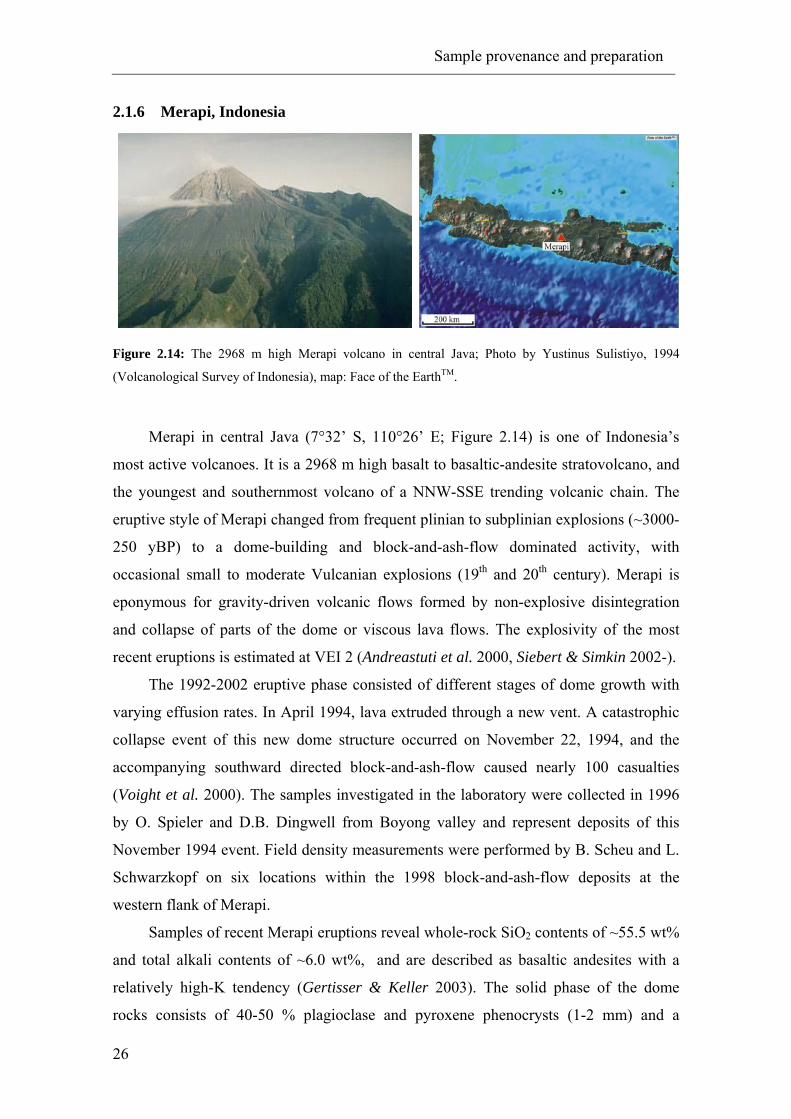
2.1.6 Merapi, Indonesia
Figure 2.14: The 2968 m high Merapi volcano in central Java; Photo by Yustinus Sulistiyo, 1994
(Volcanological Survey of Indonesia), map: Face of the EarthTM.
Merapi in central Java (7°32’ S, 110°26’ E; Figure 2.14) is one of Indonesia’s
most active volcanoes. It is a 2968 m high basalt to basaltic-andesite stratovolcano, and
the youngest and southernmost volcano of a NNW-SSE trending volcanic chain. The
eruptive style of Merapi changed from frequent plinian to subplinian explosions (~3000-
250 yBP) to a dome-building and block-and-ash-flow dominated activity, with
occasional small to moderate Vulcanian explosions (19th and 20th century). Merapi is
eponymous for gravity-driven volcanic flows formed by non-explosive disintegration
and collapse of parts of the dome or viscous lava flows. The explosivity of the most
recent eruptions is estimated at VEI 2 (Andreastuti et al. 2000, Siebert & Simkin 2002-).
The 1992-2002 eruptive phase consisted of different stages of dome growth with
varying effusion rates. In April 1994, lava extruded through a new vent. A catastrophic
collapse event of this new dome structure occurred on November 22, 1994, and the
accompanying southward directed block-and-ash-flow caused nearly 100 casualties
(Voight et al. 2000). The samples investigated in the laboratory were collected in 1996
by O. Spieler and D.B. Dingwell from Boyong valley and represent deposits of this
November 1994 event. Field density measurements were performed by B. Scheu and L.
Schwarzkopf on six locations within the 1998 block-and-ash-flow deposits at the
western flank of Merapi.
Samples of recent Merapi eruptions reveal whole-rock SiO2 contents of ~55.5 wt%
and total alkali contents of ~6.0 wt%, and are described as basaltic andesites with a
relatively high-K tendency (Gertisser & Keller 2003). The solid phase of the dome
rocks consists of 40-50 % plagioclase and pyroxene phenocrysts (1-2 mm) and a
Sample provenance and preparation
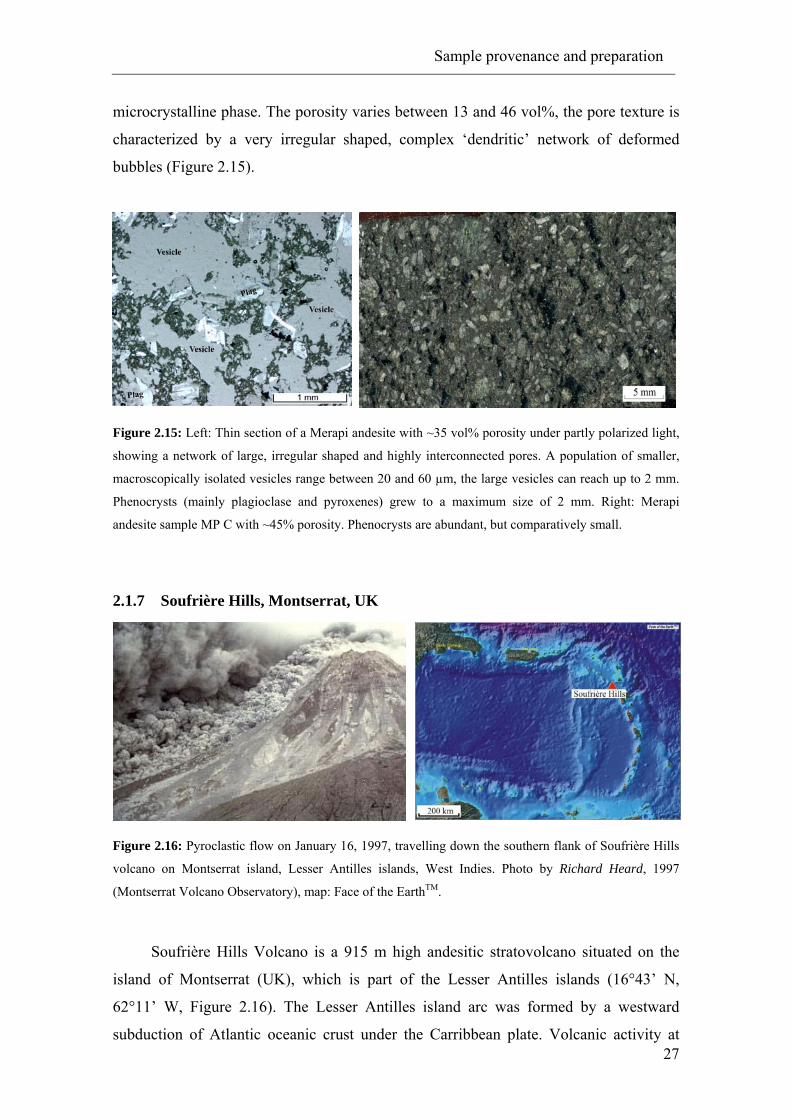
27
microcrystalline phase. The porosity varies between 13 and 46 vol%, the pore texture is
characterized by a very irregular shaped, complex ‘dendritic’ network of deformed
bubbles (Figure 2.15).
Figure 2.15: Left: Thin section of a Merapi andesite with ~35 vol% porosity under partly polarized light,
showing a network of large, irregular shaped and highly interconnected pores. A population of smaller,
macroscopically isolated vesicles range between 20 and 60 µm, the large vesicles can reach up to 2 mm.
Phenocrysts (mainly plagioclase and pyroxenes) grew to a maximum size of 2 mm. Right: Merapi
andesite sample MP C with ~45% porosity. Phenocrysts are abundant, but comparatively small.
2.1.7 Soufrière Hills, Montserrat, UK
Figure 2.16: Pyroclastic flow on January 16, 1997, travelling down the southern flank of Soufrière Hills
volcano on Montserrat island, Lesser Antilles islands, West Indies. Photo by Richard Heard, 1997
(Montserrat Volcano Observatory), map: Face of the EarthTM.
Soufrière Hills Volcano is a 915 m high andesitic stratovolcano situated on the
island of Montserrat (UK), which is part of the Lesser Antilles islands (16°43’ N,
62°11’ W, Figure 2.16). The Lesser Antilles island arc was formed by a westward
subduction of Atlantic oceanic crust under the Carribbean plate. Volcanic activity at
Sample provenance and preparation
28
Montserrat island started in early Pliocene. Five different eruptions centres have been
active since then, of which Soufrière Hills is the youngest (Roobol & Smith 1998,
Harford et al. 2003).
Two historical eruptions are recorded: an early 17th-century eruption, during which
Castle peak lava dome was formed, and the ongoing active phase that started 1995. The
recent eruption started with long-term small-to-moderate explosions with ash eruptions
starting in 1995, and was later accompanied by dome growth, block-and-ash-flows,
pyroclastic flows and surges, and a lateral blast caused by a debris avalanche on Dec 26,
1997. In July and August 1997, a series of pyroclastic flows reached Montserrat’s
capital Plymouth and almost entirely destroyed it. The 1995-2003 eruptive episode is
classified as VEI 3 (Robertson et al. 1998, Druitt et al. 2002, Siebert & Simkin 2002-).
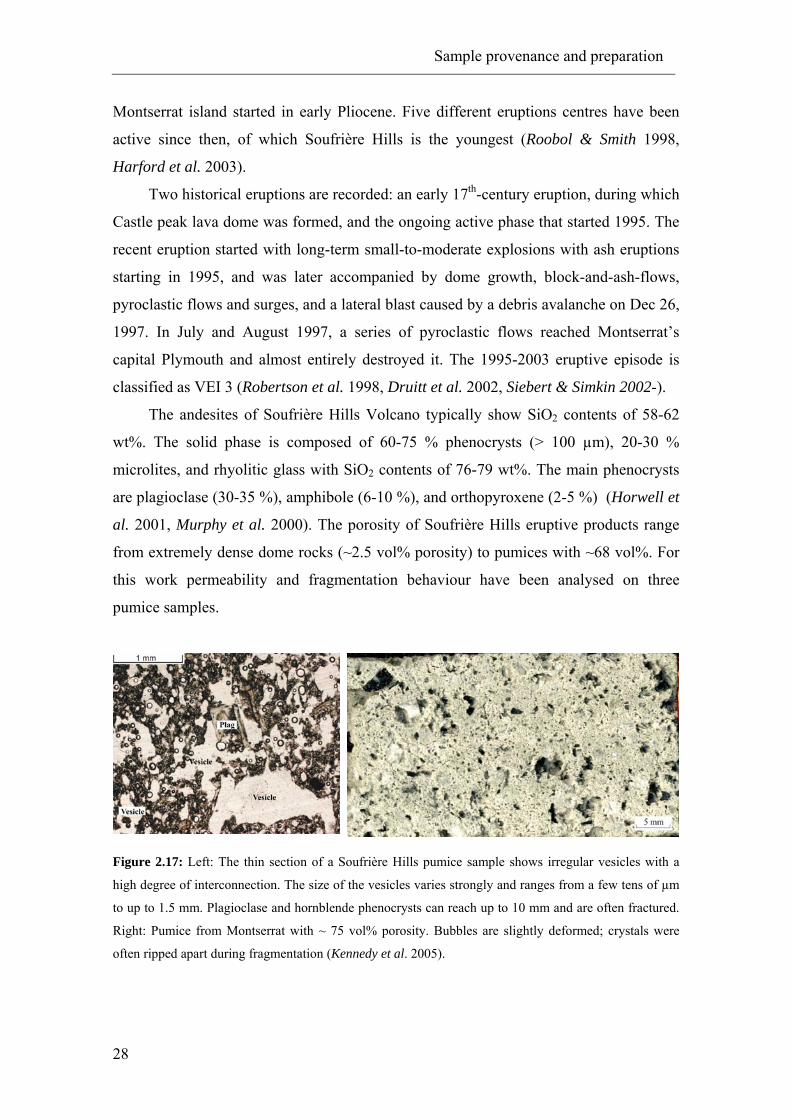
The andesites of Soufrière Hills Volcano typically show SiO2 contents of 58-62
wt%. The solid phase is composed of 60-75 % phenocrysts (> 100 µm), 20-30 %
microlites, and rhyolitic glass with SiO2 contents of 76-79 wt%. The main phenocrysts
are plagioclase (30-35 %), amphibole (6-10 %), and orthopyroxene (2-5 %) (Horwell et
al. 2001, Murphy et al. 2000). The porosity of Soufrière Hills eruptive products range
from extremely dense dome rocks (~2.5 vol% porosity) to pumices with ~68 vol%. For
this work permeability and fragmentation behaviour have been analysed on three
pumice samples.
Figure 2.17: Left: The thin section of a Soufrière Hills pumice sample shows irregular vesicles with a
high degree of interconnection. The size of the vesicles varies strongly and ranges from a few tens of µm
to up to 1.5 mm. Plagioclase and hornblende phenocrysts can reach up to 10 mm and are often fractured.
Right: Pumice from Montserrat with ~ 75 vol% porosity. Bubbles are slightly deformed; crystals were
often ripped apart during fragmentation (Kennedy et al. 2005).
Sample provenance and preparation
29
2.1.8 Campi Flegrei, Agnano-Monte Spina, Italy
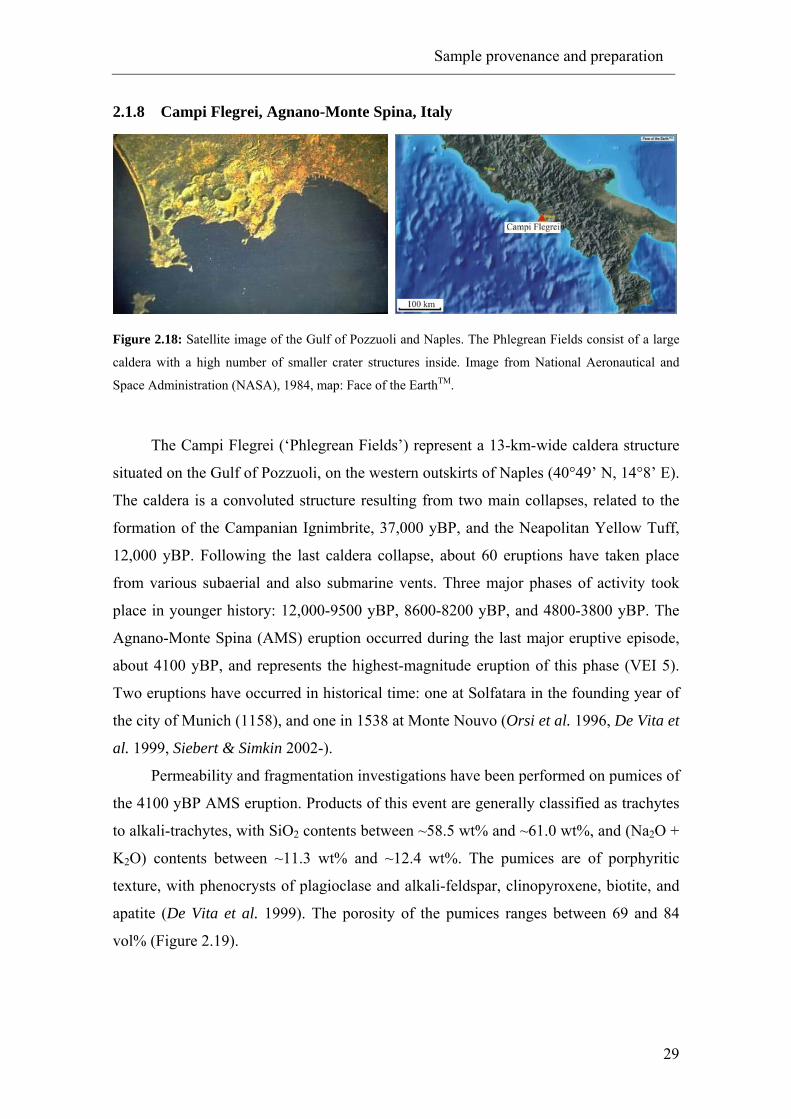
Figure 2.18: Satellite image of the Gulf of Pozzuoli and Naples. The Phlegrean Fields consist of a large
caldera with a high number of smaller crater structures inside. Image from National Aeronautical and
Space Administration (NASA), 1984, map: Face of the EarthTM.
The Campi Flegrei (‘Phlegrean Fields’) represent a 13-km-wide caldera structure
situated on the Gulf of Pozzuoli, on the western outskirts of Naples (40°49’ N, 14°8’ E).
The caldera is a convoluted structure resulting from two main collapses, related to the
formation of the Campanian Ignimbrite, 37,000 yBP, and the Neapolitan Yellow Tuff,
12,000 yBP. Following the last caldera collapse, about 60 eruptions have taken place
from various subaerial and also submarine vents. Three major phases of activity took
place in younger history: 12,000-9500 yBP, 8600-8200 yBP, and 4800-3800 yBP. The
Agnano-Monte Spina (AMS) eruption occurred during the last major eruptive episode,
about 4100 yBP, and represents the highest-magnitude eruption of this phase (VEI 5).
Two eruptions have occurred in historical time: one at Solfatara in the founding year of
the city of Munich (1158), and one in 1538 at Monte Nouvo (Orsi et al. 1996, De Vita et
al. 1999, Siebert & Simkin 2002-).
Permeability and fragmentation investigations have been performed on pumices of
the 4100 yBP AMS eruption. Products of this event are generally classified as trachytes
to alkali-trachytes, with SiO2 contents between ~58.5 wt% and ~61.0 wt%, and (Na2O +
K2O) contents between ~11.3 wt% and ~12.4 wt%. The pumices are of porphyritic
texture, with phenocrysts of plagioclase and alkali-feldspar, clinopyroxene, biotite, and
apatite (De Vita et al. 1999). The porosity of the pumices ranges between 69 and 84
vol% (Figure 2.19).

Sample provenance and preparation
30
Figure 2.19: Left: Thin section of an Agnano-Monte Spina pumice with ~80% porosity. The pumice is
highly inflated, large vesicles can reach cm-scale in these samples and are highly coalesced. A smaller
vesicle population ranges between 30 and 100 µm. Plagioclase and clinopyroxene represent the dominant
phenocryst phases. Right: Pumice sample with a highly inflated central part.
2.1.9 Stromboli, Italy
Figure 2.20: Stromboli, the NE-most of the Aeolian islands, seen from the west. Photo by Guiseppina
Kysar, 1999 (Smithsonian Institution), map: Face of the EarthTM.
Stromboli is a 924 m high stratovolcano which forms the NE-most of the Aeolian
islands in the Thyrrenian sea (38°47’ N, 15°12’ E; Figure 2.18). It is characterized by
persistent mild explosive activity (and is actually eponymous for this kind of eruptive
behaviour), with occasional major explosions and paroxysms, and lava flows. The VEI
for this kind of activity is specified to 2 (Siebert & Simkin 2002-).
The composition of Stromboli pumices and scoriae has remained relatively
constant since the beginning of the ‘Strombolian activity’ between the 3rd and 7th
century AD. Silica contents range in the order of 48.2 wt% and 51.5 wt%, K2O contents
are generally high with values between 1.5 wt% and 2.5 wt%. This classifies
Sample provenance and preparation
31
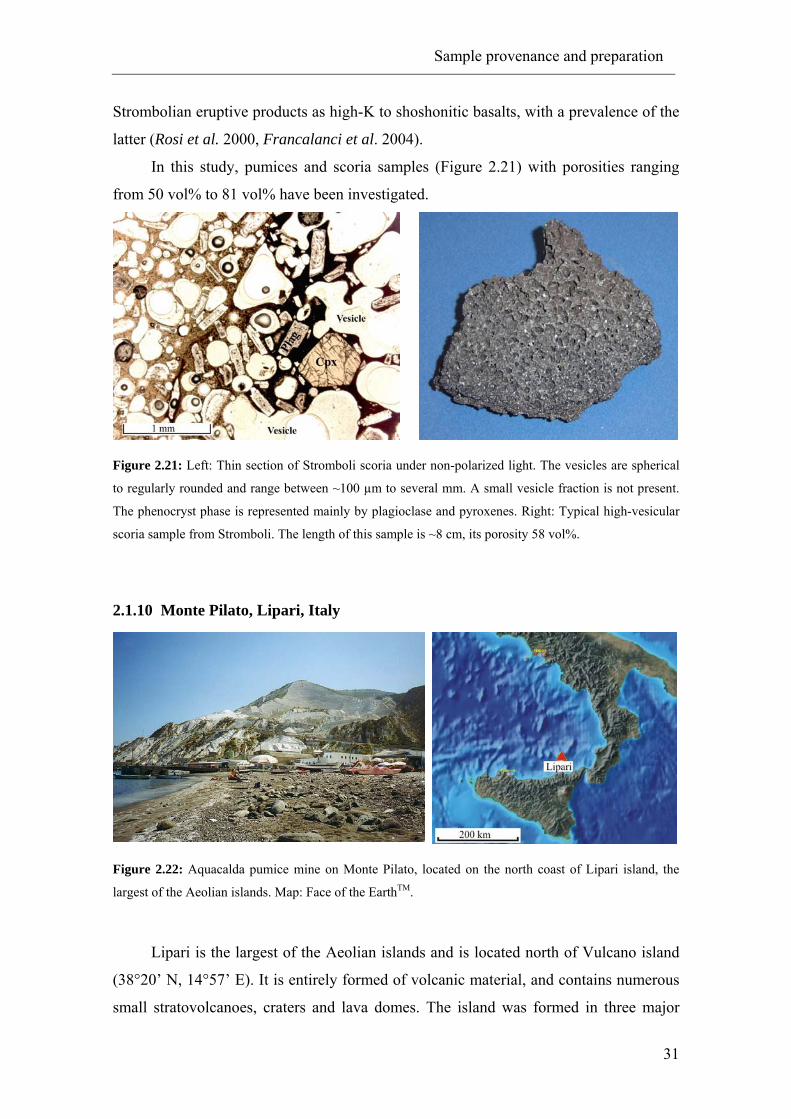
Strombolian eruptive products as high-K to shoshonitic basalts, with a prevalence of the
latter (Rosi et al. 2000, Francalanci et al. 2004).
In this study, pumices and scoria samples (Figure 2.21) with porosities ranging
from 50 vol% to 81 vol% have been investigated.
Figure 2.21: Left: Thin section of Stromboli scoria under non-polarized light. The vesicles are spherical
to regularly rounded and range between ~100 µm to several mm. A small vesicle fraction is not present.
The phenocryst phase is represented mainly by plagioclase and pyroxenes. Right: Typical high-vesicular
scoria sample from Stromboli. The length of this sample is ~8 cm, its porosity 58 vol%.
2.1.10 Monte Pilato, Lipari, Italy
Figure 2.22: Aquacalda pumice mine on Monte Pilato, located on the north coast of Lipari island, the
largest of the Aeolian islands. Map: Face of the EarthTM.
Lipari is the largest of the Aeolian islands and is located north of Vulcano island
(38°20’ N, 14°57’ E). It is entirely formed of volcanic material, and contains numerous
small stratovolcanoes, craters and lava domes. The island was formed in three major
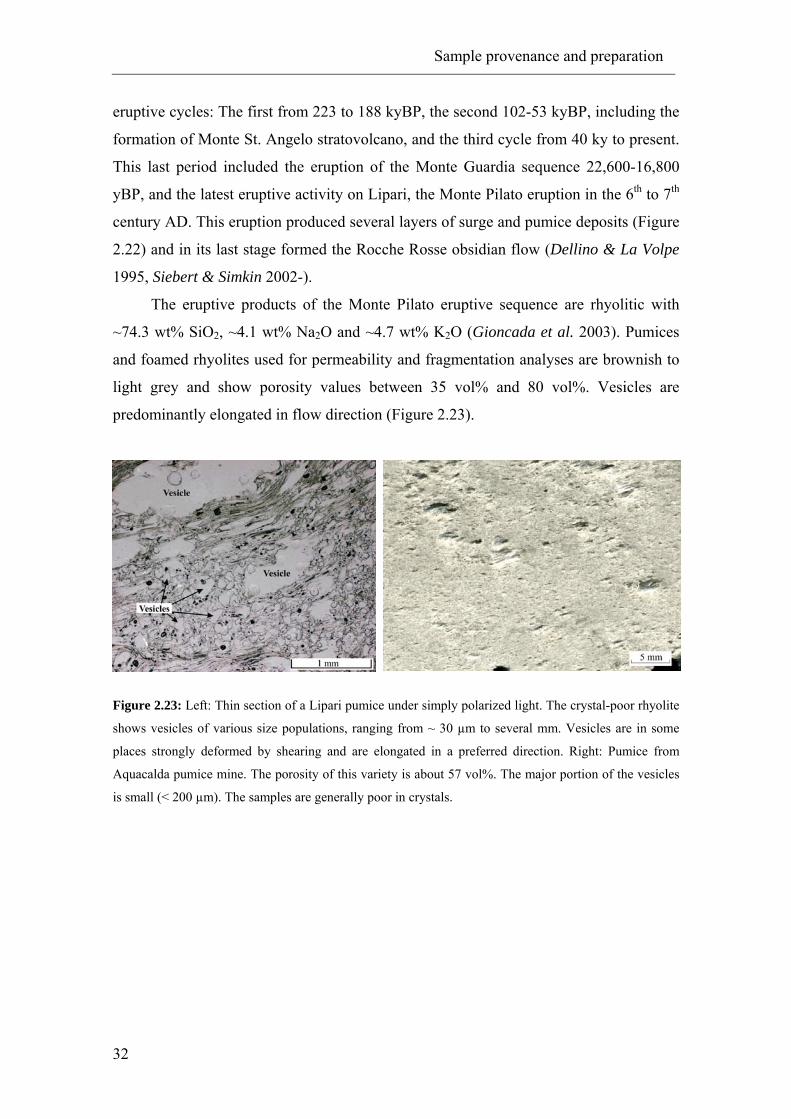
Sample provenance and preparation
32
eruptive cycles: The first from 223 to 188 kyBP, the second 102-53 kyBP, including the
formation of Monte St. Angelo stratovolcano, and the third cycle from 40 ky to present.
This last period included the eruption of the Monte Guardia sequence 22,600-16,800
yBP, and the latest eruptive activity on Lipari, the Monte Pilato eruption in the 6th to 7th
century AD. This eruption produced several layers of surge and pumice deposits (Figure
2.22) and in its last stage formed the Rocche Rosse obsidian flow (Dellino & La Volpe
1995, Siebert & Simkin 2002-).
The eruptive products of the Monte Pilato eruptive sequence are rhyolitic with
~74.3 wt% SiO2, ~4.1 wt% Na2O and ~4.7 wt% K2O (Gioncada et al. 2003). Pumices
and foamed rhyolites used for permeability and fragmentation analyses are brownish to
light grey and show porosity values between 35 vol% and 80 vol%. Vesicles are
predominantly elongated in flow direction (Figure 2.23).
Figure 2.23: Left: Thin section of a Lipari pumice under simply polarized light. The crystal-poor rhyolite
shows vesicles of various size populations, ranging from ~ 30 µm to several mm. Vesicles are in some
places strongly deformed by shearing and are elongated in a preferred direction. Right: Pumice from
Aquacalda pumice mine. The porosity of this variety is about 57 vol%. The major portion of the vesicles
is small (< 200 µm). The samples are generally poor in crystals.
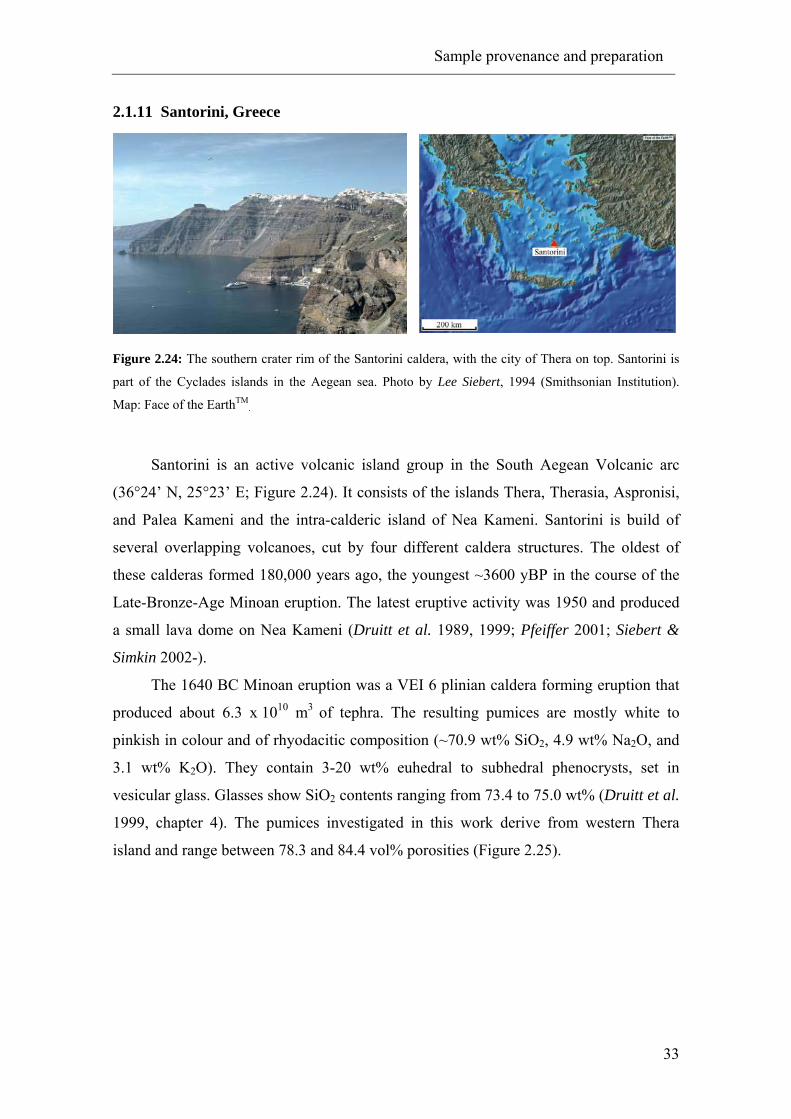
Sample provenance and preparation
33
2.1.11 Santorini, Greece
Figure 2.24: The southern crater rim of the Santorini caldera, with the city of Thera on top. Santorini is
part of the Cyclades islands in the Aegean sea. Photo by Lee Siebert, 1994 (Smithsonian Institution).
Map: Face of the EarthTM.
Santorini is an active volcanic island group in the South Aegean Volcanic arc
(36°24’ N, 25°23’ E; Figure 2.24). It consists of the islands Thera, Therasia, Aspronisi,
and Palea Kameni and the intra-calderic island of Nea Kameni. Santorini is build of
several overlapping volcanoes, cut by four different caldera structures. The oldest of
these calderas formed 180,000 years ago, the youngest ~3600 yBP in the course of the
Late-Bronze-Age Minoan eruption. The latest eruptive activity was 1950 and produced
a small lava dome on Nea Kameni (Druitt et al. 1989, 1999; Pfeiffer 2001; Siebert &
Simkin 2002-).
The 1640 BC Minoan eruption was a VEI 6 plinian caldera forming eruption that
produced about 6.3 x 10¹⁰ m3 of tephra. The resulting pumices are mostly white to
pinkish in colour and of rhyodacitic composition (~70.9 wt% SiO2, 4.9 wt% Na2O, and
3.1 wt% K2O). They contain 3-20 wt% euhedral to subhedral phenocrysts, set in
vesicular glass. Glasses show SiO2 contents ranging from 73.4 to 75.0 wt% (Druitt et al.
1999, chapter 4). The pumices investigated in this work derive from western Thera
island and range between 78.3 and 84.4 vol% porosities (Figure 2.25).

Sample provenance and preparation
34
Figure 2.25: Left: Santorini Minoan pumice thin section of suboptimal quality (the black dots are
grinding material). Large vesicles are often highly expanded to cm-scale and coalesced. The material is
generally poor in crystals (3-20 wt% phenocrysts; Druitt et al. 1999), with plagioclase and orthopyroxene
as the major phenocrysts. Right: Close view of a light-grey Santorini pumice (~85 vol% porosity) from
the Minoan eruption ~1640 BC.
2.1.12 Mt. Unzen, Japan
Figure 2.26: Aerial photograph of Unzen volcanic complex, taken from the east, with pyroclastic flow
deposits of the 1990-95 eruption. Mt. Unzen is located on Kyushu, the southernmost Japanese islands;
Photo from Unzen-Decade Volcano page, taken on Oct. 13, 1995 by Nagasaki Photo Service, Map: Face
of the EarthTM.
Unzen volcano is situated on Shimabara peninsula on Kyushu, the southernmost
of the four major Japanese islands (32°45’ N, 130°17’ E, elevation ~1500 m asl; Figure
2.26). It is located in a volcanotectonic back-arc depression, known as the Unzen
Graben, and its activity is related to a steep subduction of the Philippine Sea Plate below
the Eurasian Plate. Three complex stratovolcanoes, Kinugasa on the north, Fugen-dake
at the east-center, and Kusenbu on the south, form the andesitic-to-dacitic Unzen
volcanic complex. Onset of volcanic activity in the Unzen region was about 500 ky ago.
Active phases, comprising mainly lava dome growth, around Mt. Fugen (the central
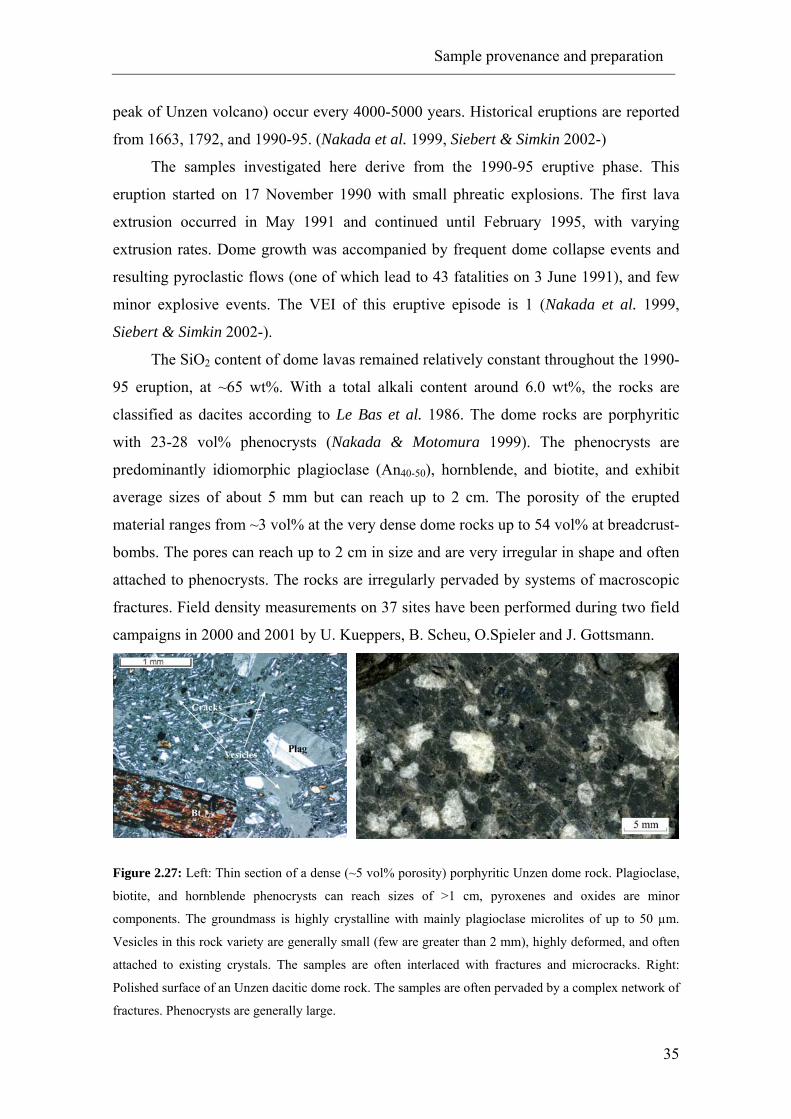
Sample provenance and preparation
35
peak of Unzen volcano) occur every 4000-5000 years. Historical eruptions are reported
from 1663, 1792, and 1990-95. (Nakada et al. 1999, Siebert & Simkin 2002-)
The samples investigated here derive from the 1990-95 eruptive phase. This
eruption started on 17 November 1990 with small phreatic explosions. The first lava
extrusion occurred in May 1991 and continued until February 1995, with varying
extrusion rates. Dome growth was accompanied by frequent dome collapse events and
resulting pyroclastic flows (one of which lead to 43 fatalities on 3 June 1991), and few
minor explosive events. The VEI of this eruptive episode is 1 (Nakada et al. 1999,
Siebert & Simkin 2002-).
The SiO2 content of dome lavas remained relatively constant throughout the 1990-
95 eruption, at ~65 wt%. With a total alkali content around 6.0 wt%, the rocks are
classified as dacites according to Le Bas et al. 1986. The dome rocks are porphyritic
with 23-28 vol% phenocrysts (Nakada & Motomura 1999). The phenocrysts are
predominantly idiomorphic plagioclase (An40-50), hornblende, and biotite, and exhibit
average sizes of about 5 mm but can reach up to 2 cm. The porosity of the erupted
material ranges from ~3 vol% at the very dense dome rocks up to 54 vol% at breadcrust-
bombs. The pores can reach up to 2 cm in size and are very irregular in shape and often
attached to phenocrysts. The rocks are irregularly pervaded by systems of macroscopic
fractures. Field density measurements on 37 sites have been performed during two field
campaigns in 2000 and 2001 by U. Kueppers, B. Scheu, O.Spieler and J. Gottsmann.
Figure 2.27: Left: Thin section of a dense (~5 vol% porosity) porphyritic Unzen dome rock. Plagioclase,
biotite, and hornblende phenocrysts can reach sizes of >1 cm, pyroxenes and oxides are minor
components. The groundmass is highly crystalline with mainly plagioclase microlites of up to 50 µm.
Vesicles in this rock variety are generally small (few are greater than 2 mm), highly deformed, and often
attached to existing crystals. The samples are often interlaced with fractures and microcracks. Right:
Polished surface of an Unzen dacitic dome rock. The samples are often pervaded by a complex network of
fractures. Phenocrysts are generally large.
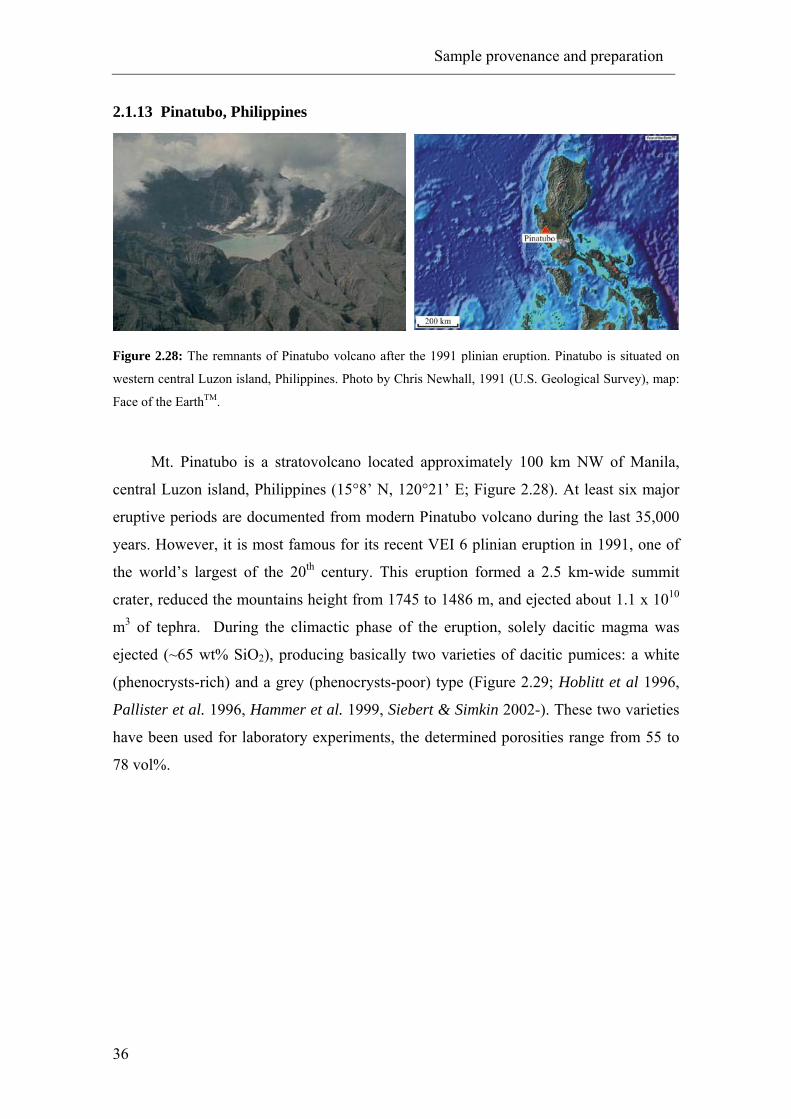
Sample provenance and preparation
36
2.1.13 Pinatubo, Philippines
Figure 2.28: The remnants of Pinatubo volcano after the 1991 plinian eruption. Pinatubo is situated on
western central Luzon island, Philippines. Photo by Chris Newhall, 1991 (U.S. Geological Survey), map:
Face of the EarthTM.
Mt. Pinatubo is a stratovolcano located approximately 100 km NW of Manila,
central Luzon island, Philippines (15°8’ N, 120°21’ E; Figure 2.28). At least six major
eruptive periods are documented from modern Pinatubo volcano during the last 35,000
years. However, it is most famous for its recent VEI 6 plinian eruption in 1991, one of
the world’s largest of the 20th century. This eruption formed a 2.5 km-wide summit
crater, reduced the mountains height from 1745 to 1486 m, and ejected about 1.1 x 10¹⁰
m3 of tephra. During the climactic phase of the eruption, solely dacitic magma was
ejected (~65 wt% SiO2), producing basically two varieties of dacitic pumices: a white
(phenocrysts-rich) and a grey (phenocrysts-poor) type (Figure 2.29; Hoblitt et al 1996,
Pallister et al. 1996, Hammer et al. 1999, Siebert & Simkin 2002-). These two varieties
have been used for laboratory experiments, the determined porosities range from 55 to
78 vol%.

Sample provenance and preparation
37
Figure 2.29: Left: Thin section of a grey (crystal poor) pumice of the 1991 eruption of Mt. Pinatubo.
Many vesicles have spherical shapes. The larger vesicle population has diameters of 300-600 µm, small
vesicles are ~50 µm. Phenocrysts (mainly plagioclase) are generally small. Right: Pinatubo grey pumice
with ~75 vol% porosity. Bubbles are often spherical and generally small, as well as the variability of
bubble sizes.
2.1.14 Sample overview
Table 2.1: Overview of the samples used for permeability and/or fragmentation experiments
Sample Origin Eruption Rock type Av. Porosity [%] LIP B Lipari Mte. Pilato, 6th/7th AD Rhyolite, Pumice 57.0 LIP C Lipari Mte. Pilato, 6th/7th AD Rhyolite, Pumice 69.3 LIP E Lipari Mte. Pilato, 6th/7th AD Rhyolite, Pumice 38.5 LIP F Lipari Mte. Pilato, 6th/7th AD Rhyolite, Pumice 79.8 MUZ 2000 A Mt. Unzen 1990-95 Dacite, Dome/ BAF 4.3 MUZ 2000 D Mt. Unzen 1990-95 Dacite, Dome/ BAF 16.2 MUZ 2000 E Mt. Unzen 1990-95 Dacite, Dome/ BAF 16.6 MUZ 2000 G Mt. Unzen 1990-95 Dacite, Dome/ BAF 34.5 MUZ 2001 A Mt. Unzen 1990-95 Dacite, Dome/ BAF 7.1 MUZ 2001 B Mt. Unzen 1990-95 Dacite, Dome/ BAF 5.7 MUZ 2001 C Mt. Unzen 1990-95 Dacite, Dome/ BAF 21.3 MUZ 2001 F Mt. Unzen 1990-95 Dacite, Dome/ BAF 35.6 MUZ BKB Mt. Unzen 1990-95 Dacite, Breadcrust Bomb 43.6 MUZ VUL 01 Mt. Unzen 1990-95 Dacite, Breadcrust Bomb 47.1 MP A Merapi 1990-2002 Andesite, BAF 14.0 MP B Merapi 1990-2003 Andesite, BAF 35.5 MP C Merapi 1990-2004 Andesite, BAF 45.5 CF S Campi Flegrei Agnano-Monte Spina Trachyte, Pumice 75.6 SNT Santorini Minoan Rhyodacite, Pumice 82.3 STR_Br Stromboli 2003 Basalt, scoria 61.5
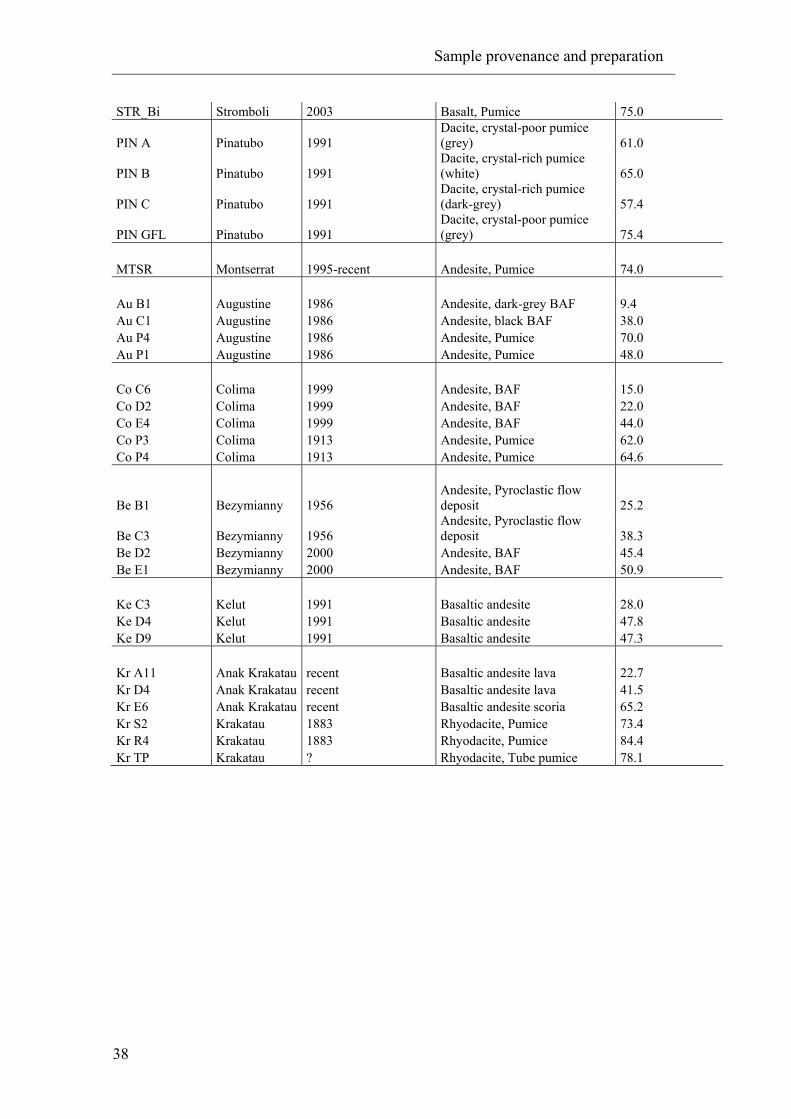
Sample provenance and preparation
38
STR_Bi Stromboli 2003 Basalt, Pumice 75.0
PIN A Pinatubo 1991 Dacite, crystal-poor pumice (grey) 61.0
PIN B Pinatubo 1991 Dacite, crystal-rich pumice (white) 65.0
PIN C Pinatubo 1991 Dacite, crystal-rich pumice (dark-grey) 57.4
PIN GFL Pinatubo 1991 Dacite, crystal-poor pumice (grey) 75.4
MTSR Montserrat 1995-recent Andesite, Pumice 74.0 Au B1 Augustine 1986 Andesite, dark-grey BAF 9.4 Au C1 Augustine 1986 Andesite, black BAF 38.0 Au P4 Augustine 1986 Andesite, Pumice 70.0 Au P1 Augustine 1986 Andesite, Pumice 48.0 Co C6 Colima 1999 Andesite, BAF 15.0 Co D2 Colima 1999 Andesite, BAF 22.0 Co E4 Colima 1999 Andesite, BAF 44.0 Co P3 Colima 1913 Andesite, Pumice 62.0 Co P4 Colima 1913 Andesite, Pumice 64.6
Be B1 Bezymianny 1956 Andesite, Pyroclastic flow deposit 25.2
Be C3 Bezymianny 1956 Andesite, Pyroclastic flow deposit 38.3
Be D2 Bezymianny 2000 Andesite, BAF 45.4 Be E1 Bezymianny 2000 Andesite, BAF 50.9 Ke C3 Kelut 1991 Basaltic andesite 28.0 Ke D4 Kelut 1991 Basaltic andesite 47.8 Ke D9 Kelut 1991 Basaltic andesite 47.3 Kr A11 Anak Krakatau recent Basaltic andesite lava 22.7 Kr D4 Anak Krakatau recent Basaltic andesite lava 41.5 Kr E6 Anak Krakatau recent Basaltic andesite scoria 65.2 Kr S2 Krakatau 1883 Rhyodacite, Pumice 73.4 Kr R4 Krakatau 1883 Rhyodacite, Pumice 84.4 Kr TP Krakatau ? Rhyodacite, Tube pumice 78.1
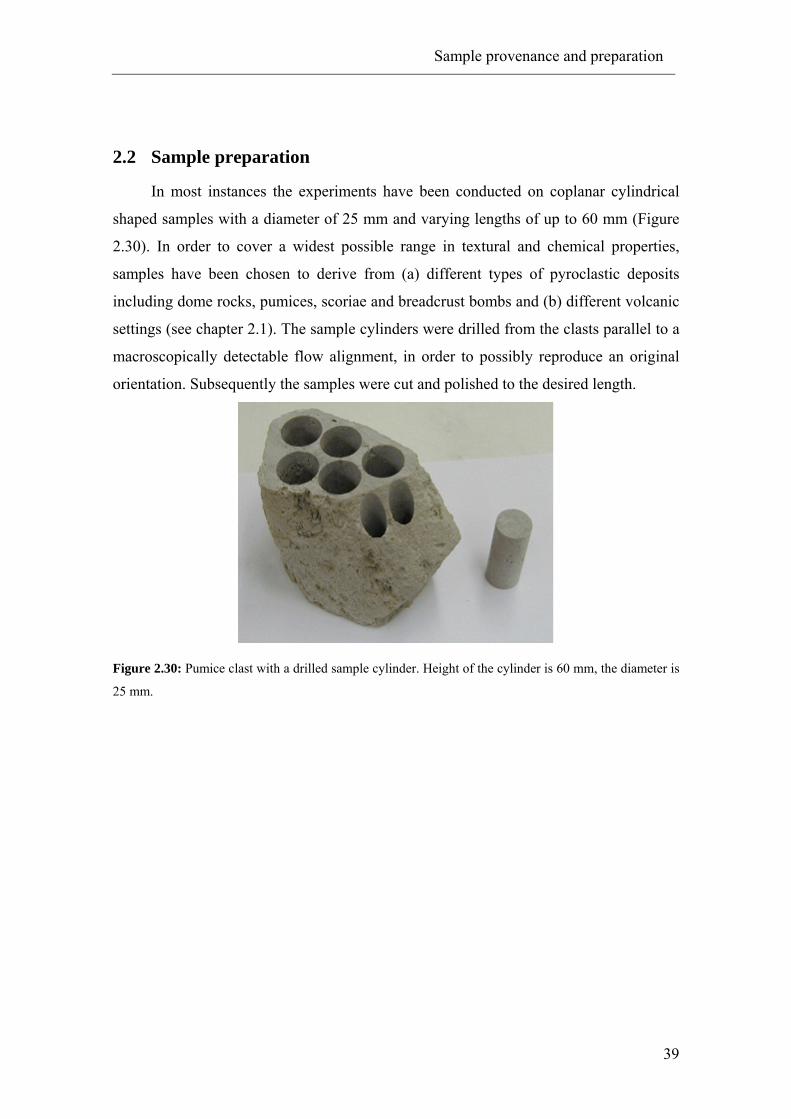
Sample provenance and preparation
39
2.2 Sample preparation
In most instances the experiments have been conducted on coplanar cylindrical
shaped samples with a diameter of 25 mm and varying lengths of up to 60 mm (Figure
2.30). In order to cover a widest possible range in textural and chemical properties,
samples have been chosen to derive from (a) different types of pyroclastic deposits
including dome rocks, pumices, scoriae and breadcrust bombs and (b) different volcanic
settings (see chapter 2.1). The sample cylinders were drilled from the clasts parallel to a
macroscopically detectable flow alignment, in order to possibly reproduce an original
orientation. Subsequently the samples were cut and polished to the desired length.
Figure 2.30: Pumice clast with a drilled sample cylinder. Height of the cylinder is 60 mm, the diameter is
25 mm.
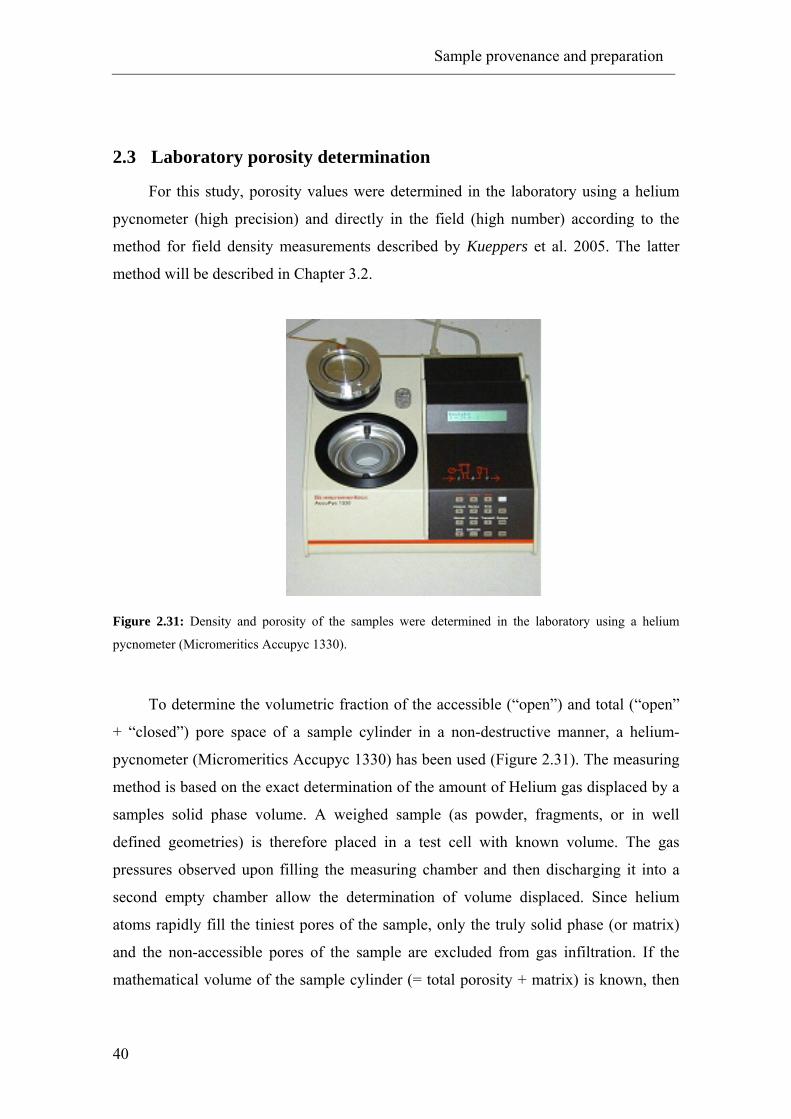
Sample provenance and preparation
40
2.3 Laboratory porosity determination
For this study, porosity values were determined in the laboratory using a helium
pycnometer (high precision) and directly in the field (high number) according to the
method for field density measurements described by Kueppers et al. 2005. The latter
method will be described in Chapter 3.2.
Figure 2.31: Density and porosity of the samples were determined in the laboratory using a helium
pycnometer (Micromeritics Accupyc 1330).
To determine the volumetric fraction of the accessible (“open”) and total (“open”
+ “closed”) pore space of a sample cylinder in a non-destructive manner, a helium-
pycnometer (Micromeritics Accupyc 1330) has been used (Figure 2.31). The measuring
method is based on the exact determination of the amount of Helium gas displaced by a
samples solid phase volume. A weighed sample (as powder, fragments, or in well
defined geometries) is therefore placed in a test cell with known volume. The gas
pressures observed upon filling the measuring chamber and then discharging it into a
second empty chamber allow the determination of volume displaced. Since helium
atoms rapidly fill the tiniest pores of the sample, only the truly solid phase (or matrix)
and the non-accessible pores of the sample are excluded from gas infiltration. If the
mathematical volume of the sample cylinder (= total porosity + matrix) is known, then
Sample provenance and preparation
41
the volumetric fraction of the rocks open porosity (Φop) can be achieved easily
according to
Φop = (Vmath – Vpyc)/Vmath, (2.1)
with Vmath being the measured mathematical volume and Vpyc the volume determined by
the pycnometer (i.e. matrix + isolated pores). The density ρm of the samples matrix
(including the closed porosity) can then be calculated via
ρm = ms/Vpyc, (2.2)
with ms being the mass of the sample, its bulk density ρb is
ρb = ms/Vmath. (2.3)
To determine a rocks total and closed porosity, a portion of the material is milled
to a fine powder in order to open all the closed pore sections. The density ρp of the
powder represents the samples matrix density excluding the closed pores, so the total
porosity is obtained with
Φtot = (ρp - ρb) / ρp. (2.4)
Field porosity investigations
42
3 Field porosity investigations
3.1 Introduction
Investigations of explosive volcanism and the modelling of related processes
require profound knowledge of the physico-chemical properties of the rock material
involved. Vesicularity and density highly influence the rheological properties as well as
the fragmentation behaviour of the magma. Since the overpressurized gas in the pore
space is considered to be one of the driving forces of an explosive eruption, the porosity
distribution of erupted pyroclasts may reflect the degree of a volcano’s explosivity, and
give valuable insights into pre-eruptive conditions of a volcanic conduit.
Direct observation of volcanic conduit rocks is restricted to the investigation of
eroded edifices (which, due to their age, are often highly chemically and physically
altered), or drilling projects (which represent a major technical challenge and are
exceedingly expensive). It can be assumed that within the volcanic edifice the physical
and textural properties of silica-rich magma are, due to high melt viscosity, subject to
only minor changes. Hence information on the temporal variability of the ascending
magma’s vesicularity can be easiest achieved via the measurement of a statistically
reliable amount of representative erupted samples (Kueppers et al. 2005).
In order to relate density/porosity distributions of eruptive products to specific
volcanic settings and eruption characteristics, the results of field campaigns on seven
volcanoes of the circum-Pacific area (“Ring of Fire“) have been evaluated and
compared. The density of more than 3200 pyroclastic-flow and block-and-ash-flow
samples of St. Augustine (Alaska), Bezymianny (Kamchatka), Unzen (Japan), Merapi,
Kelut, Krakatau (all Indonesia) and Colima (Mexico) were measured directly in the
field. Data from Unzen derive from 2000 and 2001 field campaigns by U. Kueppers, B.
Scheu, O. Spieler and J. Gottsmann (published in Kueppers et al. 2005 and Kueppers
2005), Merapi density data have been measured in 2002 by B. Scheu and L.
Schwarzkopf. Kelut and Krakatau have been investigated by O. Spieler, D. Richard and
S. Kremers in 2005. In addition, density data from Hoblitt & Harmon (1993) of the
1980 Mt. St. Helens eruption have been used for comparison.

Field porosity investigations
43
3.2 Field based porosity determination
The total porosity of samples is easily acquired by measuring its bulk density. If
then the mean density of the solid phase (the matrix density ρP as defined in Chapter
2.3) of the material is known, the sample’s porosity can be calculated according to
equation (2.4). To determine of the matrix densities a representative number of samples
from each volcano (or, if it obviously represents an exceptional depositional
environment, also from a single measurement site) have been grinded to powder. The
density of the powder was measured with the helium pycnometer (see Chapter 2.3). The
mean density value was then used to calculate each rock’s porosity.
Density measurements of porous media usually involve time-consuming
procedures like water saturation (e.g. Belikov et al. 1964, Schopper 1982) or surface
impregnation/ coating (e.g. Houghton & Wilson 1989, Polacci et al. 2003), or they are
done via pycnometric methods (e.g. Chapter 2.3). All these measurements are
commonly done in the laboratory, and require sampling and sample transportation.
However, in order to reliably evaluate the density distribution of volcanic deposits, an
adequate number of measuring locations, as well as a statistically reliable amount of
samples measured per location is required. A number of 60 measurements per spot was
found to meet this requirement. Since transportation of this amount of samples with a
total weight of several hundreds of kg per volcano would represent a disproportionate
effort, density measurements were conducted directly in the field.
The measuring setup developed for this purpose (Kueppers et al. 2005) is based
on the Archimedean principle, which states that the buoyant force of a body is equal to
the weight of the displaced fluid. A dry sample’s bulk mass therefore must be weighed
in air and subsequently under water (Figure 3.1). To prevent water infiltration into the
accessible pore space, the samples were placed in plastic bags, which, when evacuated
using a battery-powered vacuum pump, tightly cover the samples surface. To keep the
vacuum in the plastic bag, it was sealed with silicon glue.
If the density of the water, ρH20, is assumed to be 1 g/cm3, the bulk density of the
rock can be calculated according to
ρsample = (mair /(mair-mH2O))ρH20, (3.1)
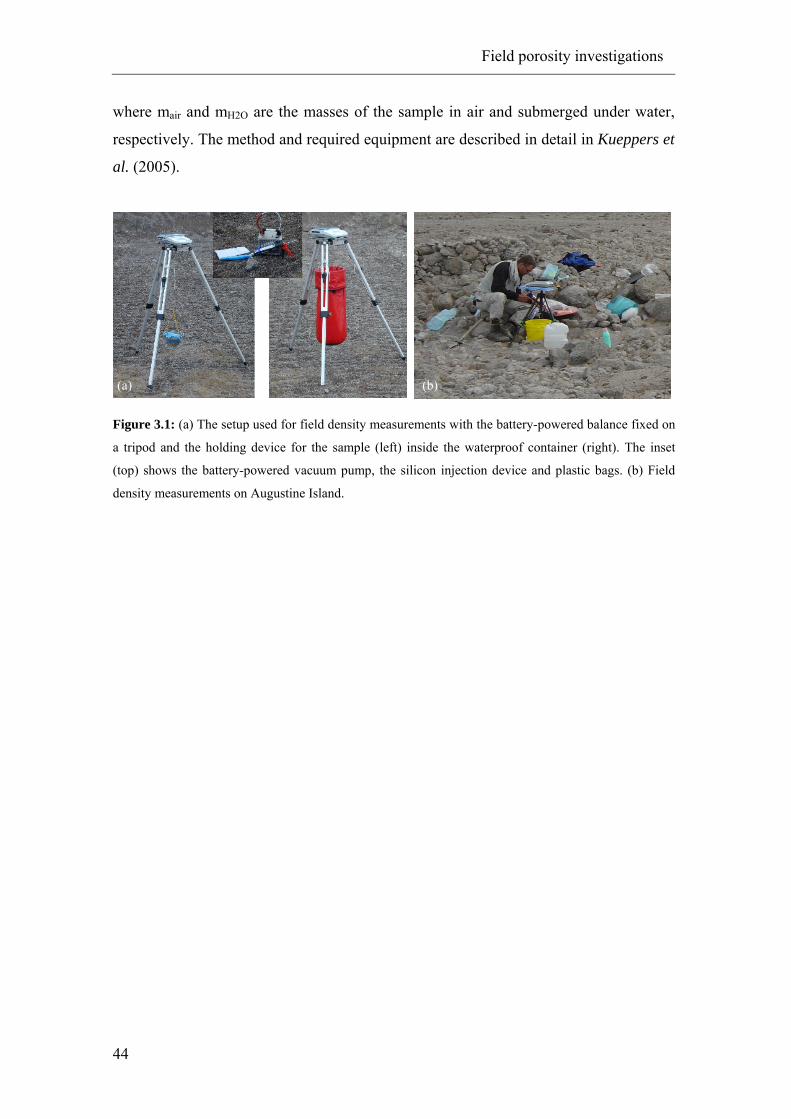
Field porosity investigations
44
where mair and mH2O are the masses of the sample in air and submerged under water,
respectively. The method and required equipment are described in detail in Kueppers et
al. (2005).
Figure 3.1: (a) The setup used for field density measurements with the battery-powered balance fixed on
a tripod and the holding device for the sample (left) inside the waterproof container (right). The inset
(top) shows the battery-powered vacuum pump, the silicon injection device and plastic bags. (b) Field
density measurements on Augustine Island.
(a) (b)

Field porosity investigations
45
3.3 Field porosity measurements – results
3.3.1 St. Augustine
Density measurements have been performed on 8 sites within the deposits of the
1986 eruptive phase: 4 sites within pumice flow/ pumiceous pyroclastic flow deposits
(PPF; unit 86pp, according to Waitt & Begét 1996), 3 sites within lithic pyroclastic flow
deposits (LPF; unit 86pl) and one lahar flow deposit (LahF, also unit 86pp) (Figure 3.2).
For the porosity determination, an average matrix density of 2.64 g/cm3 has been
measured for the porous pumice flow deposits (LOK 1, 2 and 9), and 2.78 g/cm3 for the
remaining locations.
Figure 3.2: Locations of density measurements on Augustine island. LOK 1 and 2 represent pumice flows
(levees) within the lithic-rich pyroclastic deposits, LOK 5 and 9 are deposits of pumiceos pyroclastic
flows. LOK 4, 7 and 8 are deposits of lithic pyroclastic flows/ block-and-ash-flows, and LOK 6 lahar and
“mixed-flow” deposits. Modified from the Geological Map of Augustine Island by Waitts & Begét 1996.
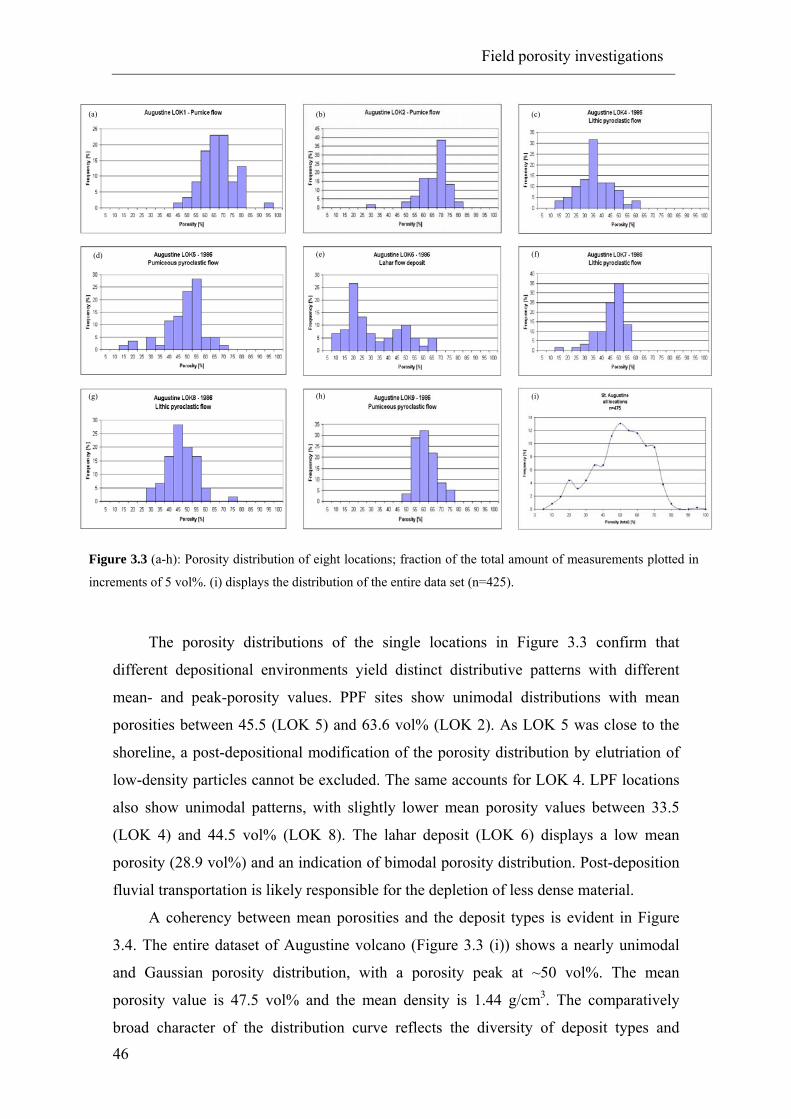
Field porosity investigations
46
Figure 3.3 (a-h): Porosity distribution of eight locations; fraction of the total amount of measurements plotted in
increments of 5 vol%. (i) displays the distribution of the entire data set (n=425).
The porosity distributions of the single locations in Figure 3.3 confirm that
different depositional environments yield distinct distributive patterns with different
mean- and peak-porosity values. PPF sites show unimodal distributions with mean
porosities between 45.5 (LOK 5) and 63.6 vol% (LOK 2). As LOK 5 was close to the
shoreline, a post-depositional modification of the porosity distribution by elutriation of
low-density particles cannot be excluded. The same accounts for LOK 4. LPF locations
also show unimodal patterns, with slightly lower mean porosity values between 33.5
(LOK 4) and 44.5 vol% (LOK 8). The lahar deposit (LOK 6) displays a low mean
porosity (28.9 vol%) and an indication of bimodal porosity distribution. Post-deposition
fluvial transportation is likely responsible for the depletion of less dense material.
A coherency between mean porosities and the deposit types is evident in Figure
3.4. The entire dataset of Augustine volcano (Figure 3.3 (i)) shows a nearly unimodal
and Gaussian porosity distribution, with a porosity peak at ~50 vol%. The mean
porosity value is 47.5 vol% and the mean density is 1.44 g/cm3. The comparatively
broad character of the distribution curve reflects the diversity of deposit types and
(a) (b) (c)
(d) (e) (f)
(g) (h) (i)
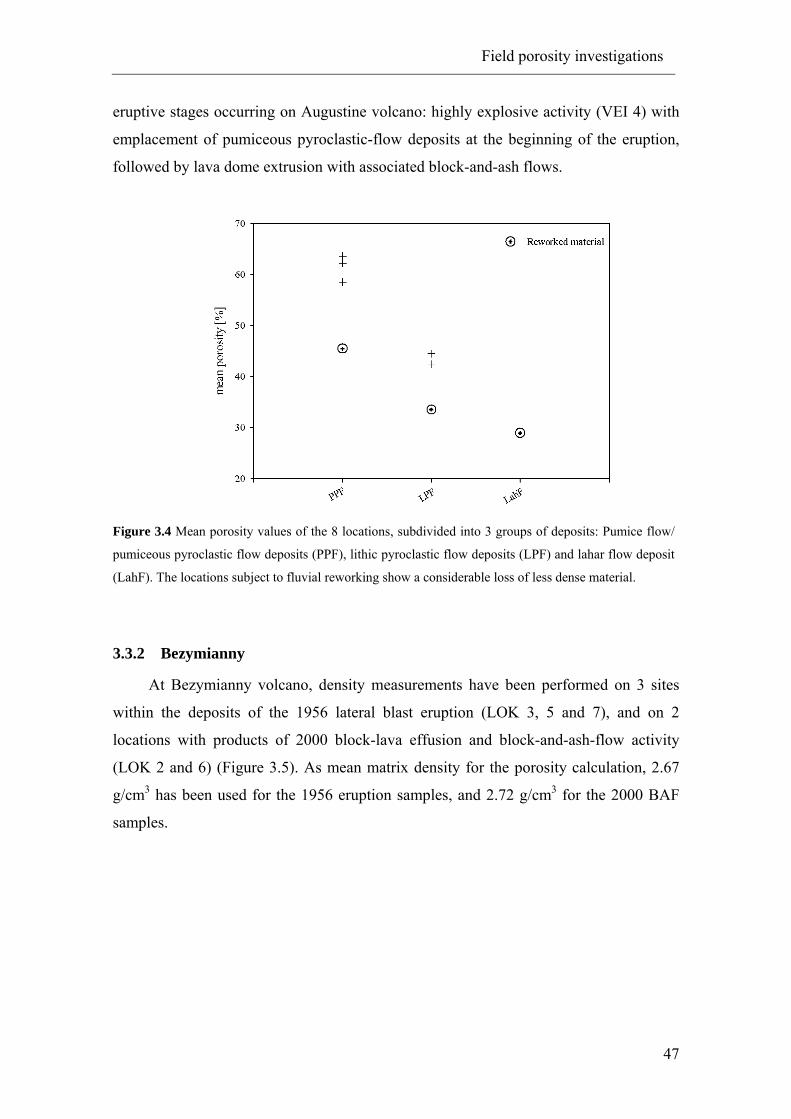
Field porosity investigations
47
eruptive stages occurring on Augustine volcano: highly explosive activity (VEI 4) with
emplacement of pumiceous pyroclastic-flow deposits at the beginning of the eruption,
followed by lava dome extrusion with associated block-and-ash flows.
Figure 3.4 Mean porosity values of the 8 locations, subdivided into 3 groups of deposits: Pumice flow/
pumiceous pyroclastic flow deposits (PPF), lithic pyroclastic flow deposits (LPF) and lahar flow deposit
(LahF). The locations subject to fluvial reworking show a considerable loss of less dense material.
3.3.2 Bezymianny
At Bezymianny volcano, density measurements have been performed on 3 sites
within the deposits of the 1956 lateral blast eruption (LOK 3, 5 and 7), and on 2
locations with products of 2000 block-lava effusion and block-and-ash-flow activity
(LOK 2 and 6) (Figure 3.5). As mean matrix density for the porosity calculation, 2.67
g/cm3 has been used for the 1956 eruption samples, and 2.72 g/cm3 for the 2000 BAF
samples.

Field porosity investigations
48
Figure 3.5: LANDSAT image of Bezymianny volcano with the locations of the 5 measurement sites.
Locations 3, 5, and 7 represent deposits of the 1956 sector-collapse induced lateral blast event, locations 6
and 2 are BAF deposits of 2000.
Figure 3.6 shows the porosity distributions of the 5 investigated locations. Porosity
values range from 10 to 60 vol%, the mean value for all locations is 35.70 vol%, with a
mean density of 1.73 g/cm3. All locations of 1956 eruption show a slight bimodal
distribution with a maximum at the more porous mode. This pattern is confirmed by the
compiled plots of the whole dataset (f) but is more prominent in the 1956-deposits (h).
The bimodality of these kind of eruptive products is in good agreement with results of
Hoblitt & Harmon 1993, who investigated the density distribution of products of the
1980 lateral blast of Mt. St. Helens. They ascribe the bimodal distribution to two distinct
vesicle nucleation events: the first population formed during magma ascent and
cryptodome formation, the second upon rapid decompression due to the sector collapse.
They also conclude that for the early bubble nucleation to occur, the volatile content in
the magma has to be greater than a threshold value of 0.2-0.4 wt%. At magma portions
with lower bulk water content, the confining pressure during the cryptodome formation

Field porosity investigations
49
stage hinders gas exsolution and bubble growth. As the eruptive scenario of the 1956
Bezymianny eruption is assumed to be comparable to the Mt. St. Helens 1980 lateral
blast, a similar explanation may account for the bimodal porosity distribution of
Bezymianny products. The mean values of only the 1956 deposits are 32.4 vol%
porosity and 1.80 g/cm3 density.
Figure 3.6: Porosity distribution of 5 locations of Bezymianny volcano, plotted in 5 vol%-steps as fraction of the
total amount of measurements. (f) displays the distribution of the entire data set (n=300), (g) the distribution of the
2000 eruption products, (h) the distribution of only the 1956-eruption samples. A bimodal pattern is evident for all
sites of the 1956 eruption.
(a) (b) (c)
(e) (f) (d)
(g) (h)

Field porosity investigations
50
3.3.3 Colima
Five locations have been measured at Volcán de Colima during two field
campaigns in 2004 and 2005. The samples from San Antonio and Cordoban valleys are
products of the 1998/99 pyroclastic and block-and-ash-flows; “Montegrande valley” and
“LPF” samples are from early the 2005 explosive activity (Figure 3.7). Results show an
overall low porosity in which the majority of rocks range between 1 and 30 vol%; a few
outliers show porosities up to 63 vol% (Figure 3.8). The mean porosity of the entire
dataset is 16.4 vol%, the mean bulk density 2.28 g/cm3, and the mean matrix density for
the porosity determination 2.73 g/cm3. The low mean porosity may be an indication of a
low volatile content of the magma, or effective degassing of the magma prior to
eruption. These results are in good accordance to the general low water content of recent
activity products measured by Luhr 2002.
Figure 3.7: Satellite view of Volcán de Colima with the five of the field density measurements.
Background image from GoogleEarthTM.
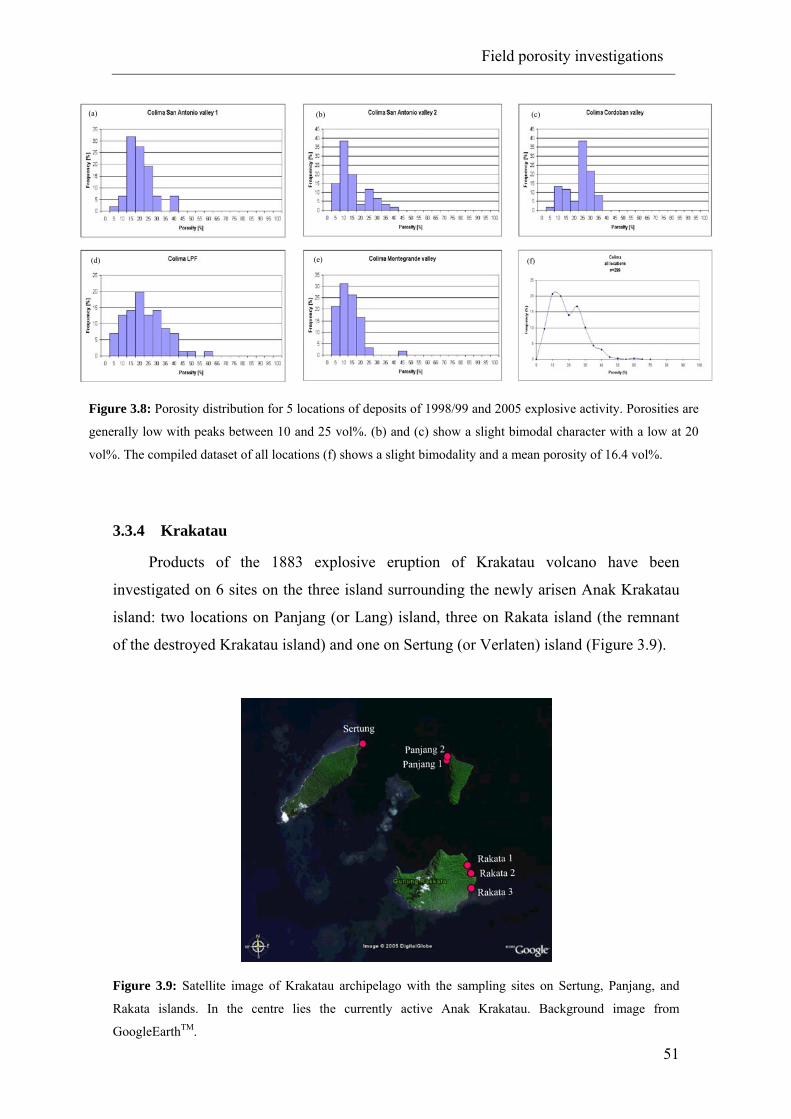
Field porosity investigations
51
Figure 3.8: Porosity distribution for 5 locations of deposits of 1998/99 and 2005 explosive activity. Porosities are
generally low with peaks between 10 and 25 vol%. (b) and (c) show a slight bimodal character with a low at 20
vol%. The compiled dataset of all locations (f) shows a slight bimodality and a mean porosity of 16.4 vol%.
3.3.4 Krakatau
Products of the 1883 explosive eruption of Krakatau volcano have been
investigated on 6 sites on the three island surrounding the newly arisen Anak Krakatau
island: two locations on Panjang (or Lang) island, three on Rakata island (the remnant
of the destroyed Krakatau island) and one on Sertung (or Verlaten) island (Figure 3.9).
Figure 3.9: Satellite image of Krakatau archipelago with the sampling sites on Sertung, Panjang, and
Rakata islands. In the centre lies the currently active Anak Krakatau. Background image from
GoogleEarthTM.
(a) (b) (c)
(d) (e) (f)
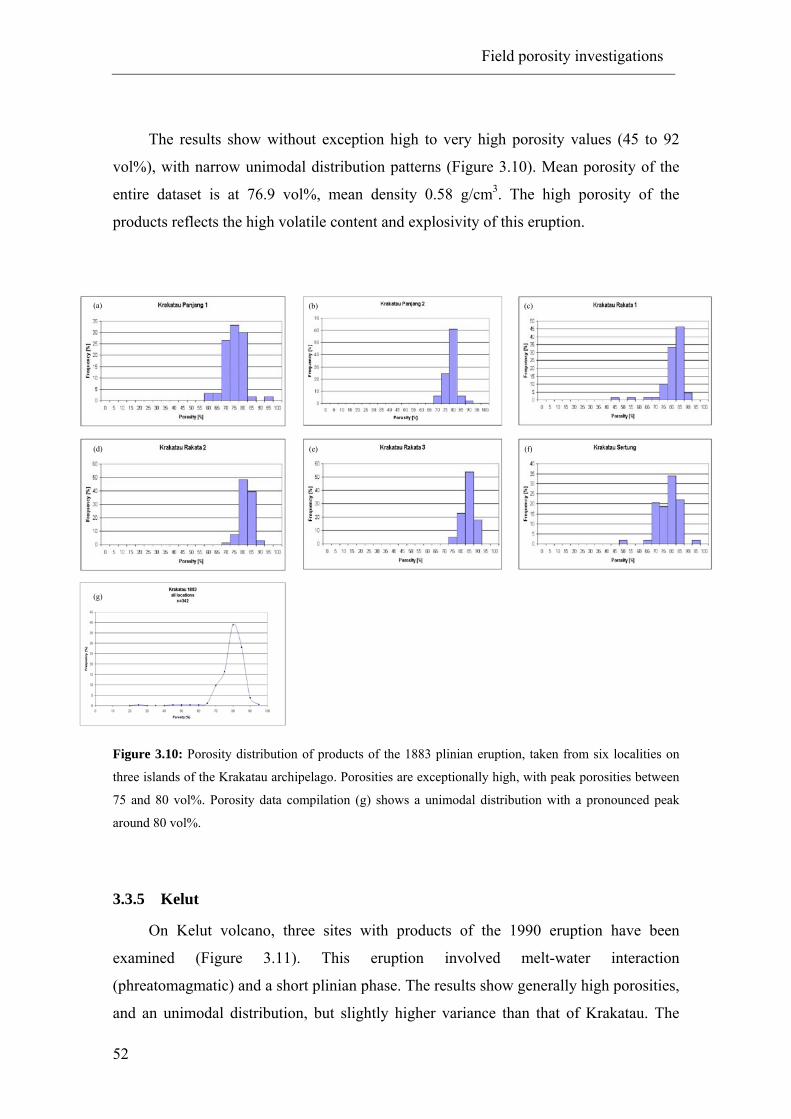
Field porosity investigations
52
The results show without exception high to very high porosity values (45 to 92
vol%), with narrow unimodal distribution patterns (Figure 3.10). Mean porosity of the
entire dataset is at 76.9 vol%, mean density 0.58 g/cm3. The high porosity of the
products reflects the high volatile content and explosivity of this eruption.
Figure 3.10: Porosity distribution of products of the 1883 plinian eruption, taken from six localities on
three islands of the Krakatau archipelago. Porosities are exceptionally high, with peak porosities between
75 and 80 vol%. Porosity data compilation (g) shows a unimodal distribution with a pronounced peak
around 80 vol%.
3.3.5 Kelut
On Kelut volcano, three sites with products of the 1990 eruption have been
examined (Figure 3.11). This eruption involved melt-water interaction
(phreatomagmatic) and a short plinian phase. The results show generally high porosities,
and an unimodal distribution, but slightly higher variance than that of Krakatau. The
(a) (b) (c)
(d) (e) (f)
(g)

Field porosity investigations
53
entire dataset displays an almost Gaussian distribution with a mean porosity at 66.16
vol% (Figure 3.12). The mean density of the samples is 0.93 g/cm3.
Figure 3.11: Satellite image of Kelut volcano showing the three sampling locations R1-3. The outcrops
represent pumice and dark scoriaceous pumice deposits from the 1990 explosive eruption. Background
image from GoogleEarthTM.
Figure 3.12: Results of porosity determinations on three sites on Kelut’s western flank. The plots show
consistent peak abundances at porosities around 70 vol%. Mean porosity of the whole data is 66.16 vol%.
(a) (b) (c)
(d)

Field porosity investigations
54
3.3.6 Merapi
Six locations have been investigated in Jurangjero valley on Merapi’s western
flank: D1-3 represent sites within the lower, middle and upper unit of a 1998 block-and-
ash-flow deposit, respectively. D4-6 were equally sampled on a more proximal position
of the same flow (Figure 3.13). For the calculation of porosity a mean matrix density of
2.82 g/cm3 has been assumed.
Figure 3.13: The two locations of the six measuring points taken on Merapi volcano. D1-3 are distal
deposits of a 1998 Jurangjero valley block-and-ash-flow, D4-6 were taken on a site closer to the dome.
On each location 60 samples from a lower, middle and upper section of the flow have been measured,
respectively. Modified from Schwarzkopf et al. 2005.
The results of the measurements show vaguely bimodal distributions for D1-D4.
This bimodality is also evident for the total data compilation, indicating at least two
bubble growth stages in the Merapi andesite (Figure 3.14). The mean porosity of the
entire dataset is 26.21 vol%, its mean density 2.08 g/cm3. The mean porosity variation
within a respective deposit location, from upper (U) to lower (L) level is displayed in
Figure 3.14 (h). It shows trends in the opposite direction for the distal (decreasing with
depth) and proximal sites (increasing with depth). The compiled mean porosity values

Field porosity investigations
55
(in vol%) (Figure 3.14 (i)) indicate no apparent change in sample density with distance
from the dome. The lack of a systematic correlation between porosity distribution and
(a) runout distance and (b) stratigraphic position is consistent with the chaotic, unsorted
character of Merapi-type block-and-ash-flows.
Distal Proximal
Upper 28.37 24.82
Middle 25.18 25.18
Lower 23.40 29.79
mean 25.65 26.60
Figure 3.14: Porosity distributions of three distal (D1-3) and 3 proximal (D4-6) measuring points from
Merapi’s western flank. The compiled distribution (g) shows a slight bimodal character with a peak at ~20
vol% porosity. (h) displays the mean porosity variation within a respective deposit location, from upper
(U) to lower (L) level. The compiled mean porosity values (in vol%) (i) indicate only narrow differences
between the distal and proximal sites.
(a) (b) (c)
(d) (e) (f)
(g) (h) (i)
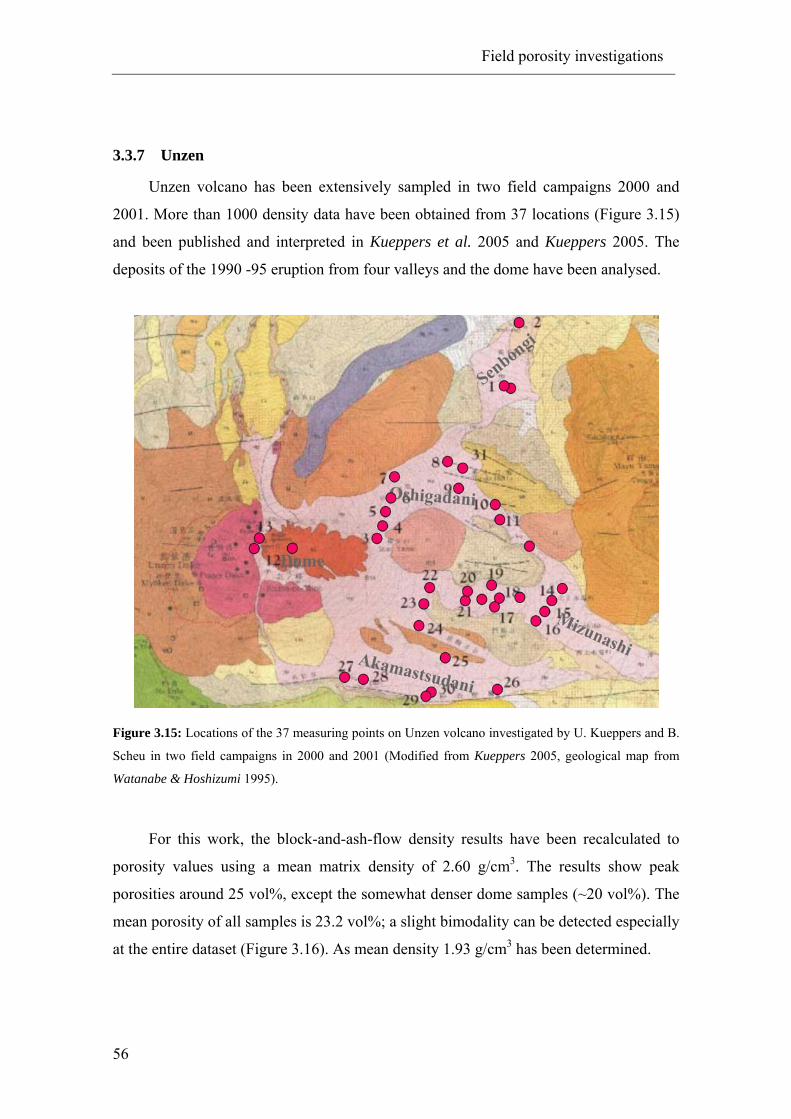
Field porosity investigations
56
3.3.7 Unzen
Unzen volcano has been extensively sampled in two field campaigns 2000 and
2001. More than 1000 density data have been obtained from 37 locations (Figure 3.15)
and been published and interpreted in Kueppers et al. 2005 and Kueppers 2005. The
deposits of the 1990 -95 eruption from four valleys and the dome have been analysed.
Figure 3.15: Locations of the 37 measuring points on Unzen volcano investigated by U. Kueppers and B.
Scheu in two field campaigns in 2000 and 2001 (Modified from Kueppers 2005, geological map from
Watanabe & Hoshizumi 1995).
For this work, the block-and-ash-flow density results have been recalculated to
porosity values using a mean matrix density of 2.60 g/cm3. The results show peak
porosities around 25 vol%, except the somewhat denser dome samples (~20 vol%). The
mean porosity of all samples is 23.2 vol%; a slight bimodality can be detected especially
at the entire dataset (Figure 3.16). As mean density 1.93 g/cm3 has been determined.
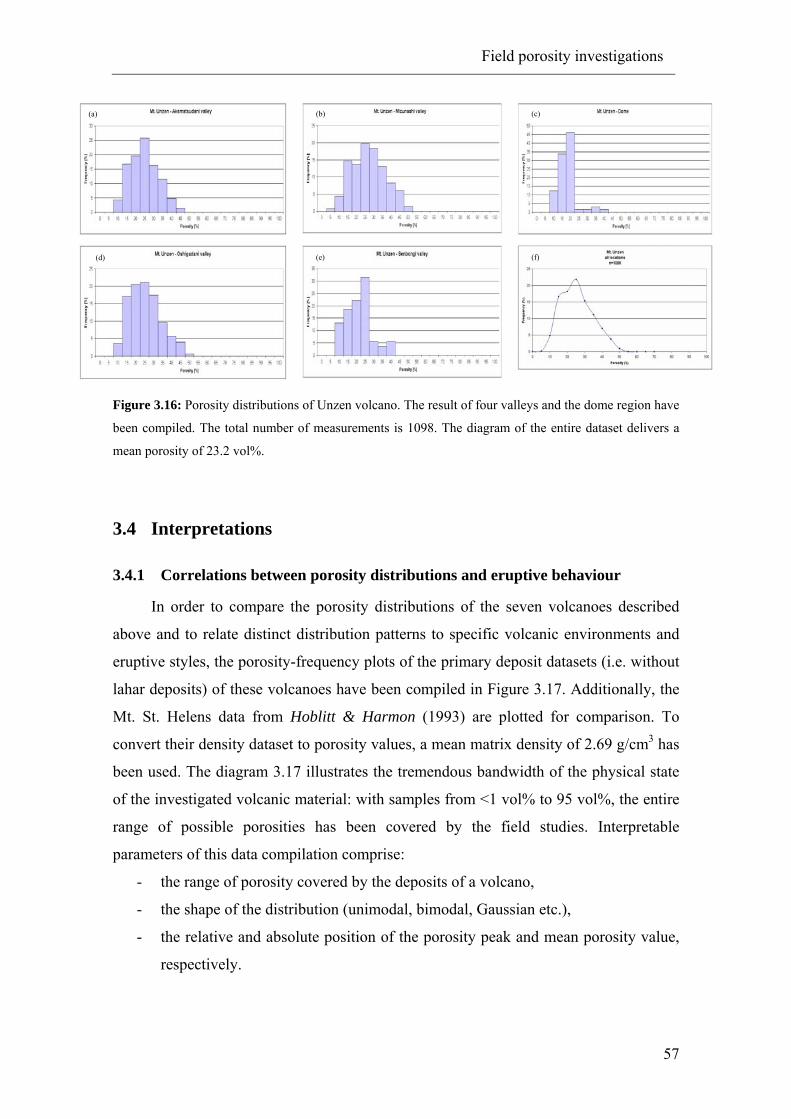
Field porosity investigations
57
Figure 3.16: Porosity distributions of Unzen volcano. The result of four valleys and the dome region have
been compiled. The total number of measurements is 1098. The diagram of the entire dataset delivers a
mean porosity of 23.2 vol%.
3.4 Interpretations
3.4.1 Correlations between porosity distributions and eruptive behaviour
In order to compare the porosity distributions of the seven volcanoes described
above and to relate distinct distribution patterns to specific volcanic environments and
eruptive styles, the porosity-frequency plots of the primary deposit datasets (i.e. without
lahar deposits) of these volcanoes have been compiled in Figure 3.17. Additionally, the
Mt. St. Helens data from Hoblitt & Harmon (1993) are plotted for comparison. To
convert their density dataset to porosity values, a mean matrix density of 2.69 g/cm3 has
been used. The diagram 3.17 illustrates the tremendous bandwidth of the physical state
of the investigated volcanic material: with samples from <1 vol% to 95 vol%, the entire
range of possible porosities has been covered by the field studies. Interpretable
parameters of this data compilation comprise:
- the range of porosity covered by the deposits of a volcano,
- the shape of the distribution (unimodal, bimodal, Gaussian etc.),
- the relative and absolute position of the porosity peak and mean porosity value,
respectively.
(a) (b) (c)
(d) (e) (f)
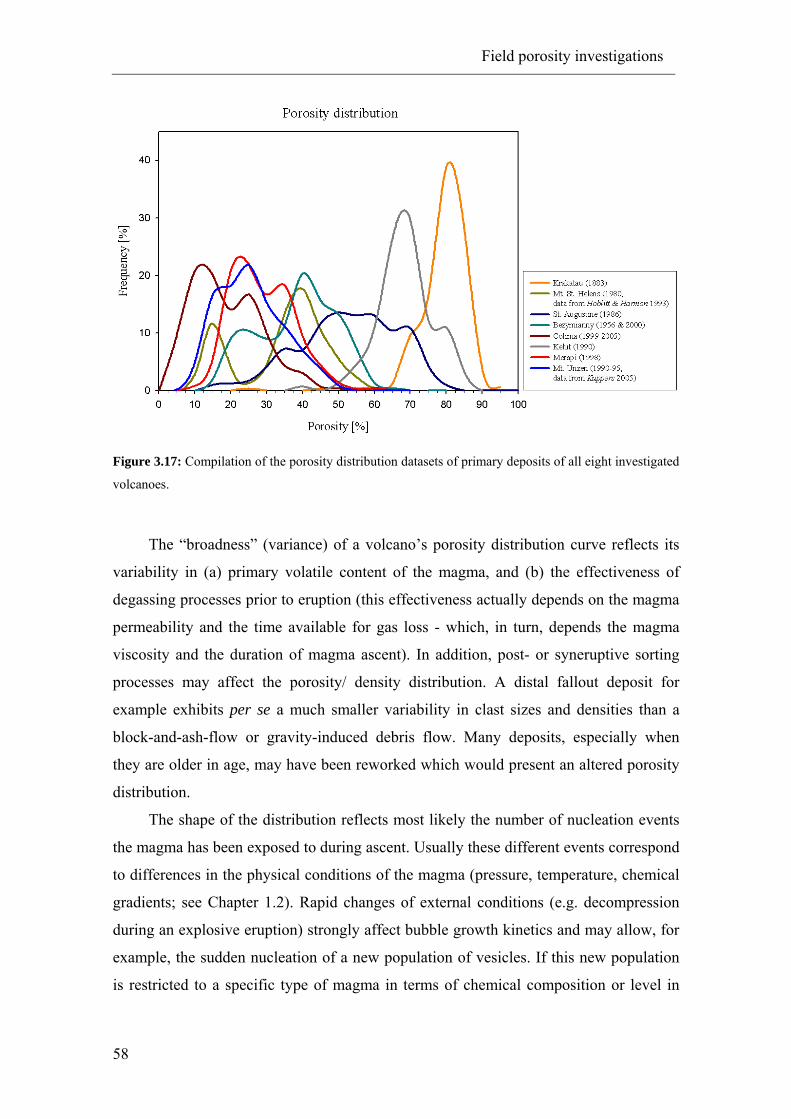
Field porosity investigations
58
Figure 3.17: Compilation of the porosity distribution datasets of primary deposits of all eight investigated
volcanoes.
The “broadness” (variance) of a volcano’s porosity distribution curve reflects its
variability in (a) primary volatile content of the magma, and (b) the effectiveness of
degassing processes prior to eruption (this effectiveness actually depends on the magma
permeability and the time available for gas loss - which, in turn, depends the magma
viscosity and the duration of magma ascent). In addition, post- or syneruptive sorting
processes may affect the porosity/ density distribution. A distal fallout deposit for
example exhibits per se a much smaller variability in clast sizes and densities than a
block-and-ash-flow or gravity-induced debris flow. Many deposits, especially when
they are older in age, may have been reworked which would present an altered porosity
distribution.
The shape of the distribution reflects most likely the number of nucleation events
the magma has been exposed to during ascent. Usually these different events correspond
to differences in the physical conditions of the magma (pressure, temperature, chemical
gradients; see Chapter 1.2). Rapid changes of external conditions (e.g. decompression
during an explosive eruption) strongly affect bubble growth kinetics and may allow, for
example, the sudden nucleation of a new population of vesicles. If this new population
is restricted to a specific type of magma in terms of chemical composition or level in
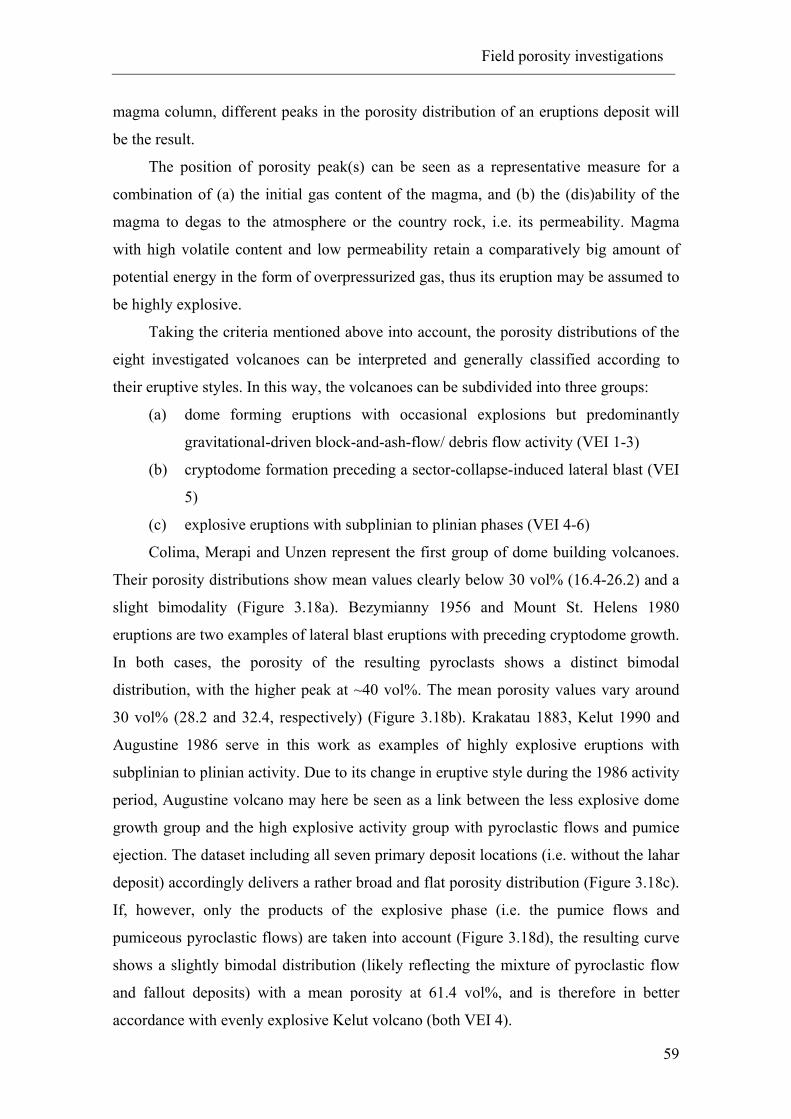
Field porosity investigations
59
magma column, different peaks in the porosity distribution of an eruptions deposit will
be the result.
The position of porosity peak(s) can be seen as a representative measure for a
combination of (a) the initial gas content of the magma, and (b) the (dis)ability of the
magma to degas to the atmosphere or the country rock, i.e. its permeability. Magma
with high volatile content and low permeability retain a comparatively big amount of
potential energy in the form of overpressurized gas, thus its eruption may be assumed to
be highly explosive.
Taking the criteria mentioned above into account, the porosity distributions of the
eight investigated volcanoes can be interpreted and generally classified according to
their eruptive styles. In this way, the volcanoes can be subdivided into three groups:
(a) dome forming eruptions with occasional explosions but predominantly
gravitational-driven block-and-ash-flow/ debris flow activity (VEI 1-3)
(b) cryptodome formation preceding a sector-collapse-induced lateral blast (VEI
5)
(c) explosive eruptions with subplinian to plinian phases (VEI 4-6)
Colima, Merapi and Unzen represent the first group of dome building volcanoes.
Their porosity distributions show mean values clearly below 30 vol% (16.4-26.2) and a
slight bimodality (Figure 3.18a). Bezymianny 1956 and Mount St. Helens 1980
eruptions are two examples of lateral blast eruptions with preceding cryptodome growth.
In both cases, the porosity of the resulting pyroclasts shows a distinct bimodal
distribution, with the higher peak at ~40 vol%. The mean porosity values vary around
30 vol% (28.2 and 32.4, respectively) (Figure 3.18b). Krakatau 1883, Kelut 1990 and
Augustine 1986 serve in this work as examples of highly explosive eruptions with
subplinian to plinian activity. Due to its change in eruptive style during the 1986 activity
period, Augustine volcano may here be seen as a link between the less explosive dome
growth group and the high explosive activity group with pyroclastic flows and pumice
ejection. The dataset including all seven primary deposit locations (i.e. without the lahar
deposit) accordingly delivers a rather broad and flat porosity distribution (Figure 3.18c).
If, however, only the products of the explosive phase (i.e. the pumice flows and
pumiceous pyroclastic flows) are taken into account (Figure 3.18d), the resulting curve
shows a slightly bimodal distribution (likely reflecting the mixture of pyroclastic flow
and fallout deposits) with a mean porosity at 61.4 vol%, and is therefore in better
accordance with evenly explosive Kelut volcano (both VEI 4).
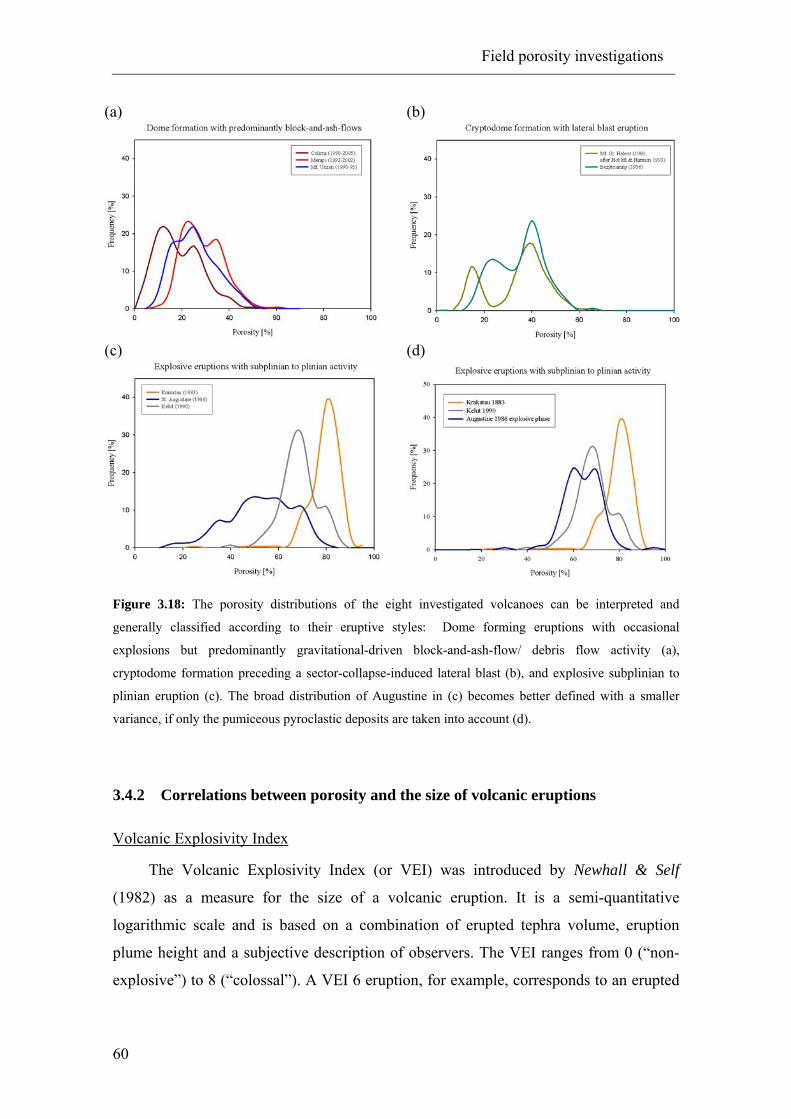
Field porosity investigations
60
(a) (b)
(c)
(d)
Figure 3.18: The porosity distributions of the eight investigated volcanoes can be interpreted and
generally classified according to their eruptive styles: Dome forming eruptions with occasional
explosions but predominantly gravitational-driven block-and-ash-flow/ debris flow activity (a),
cryptodome formation preceding a sector-collapse-induced lateral blast (b), and explosive subplinian to
plinian eruption (c). The broad distribution of Augustine in (c) becomes better defined with a smaller
variance, if only the pumiceous pyroclastic deposits are taken into account (d).
3.4.2 Correlations between porosity and the size of volcanic eruptions
Volcanic Explosivity Index
The Volcanic Explosivity Index (or VEI) was introduced by Newhall & Self
(1982) as a measure for the size of a volcanic eruption. It is a semi-quantitative
logarithmic scale and is based on a combination of erupted tephra volume, eruption
plume height and a subjective description of observers. The VEI ranges from 0 (“non-
explosive”) to 8 (“colossal”). A VEI 6 eruption, for example, corresponds to an erupted

Field porosity investigations
61
tephra volume of 10-100 km3 (Newhall & Self 1982, Simkin & Siebert 2002-, Mason et
al. 2004)
As mentioned above, the averaged pore volume of a volcanic deposit should allow
inferences on the explosive potential of an eruption. Although the VEI scale is a very
general classification of the explosive style of an eruption and mostly integrates over
longer periods of activity, it may in this context serve as a reference measure. In Figure
3.19 the mean porosity values of eight distinct eruptions or, in the case of Augustine,
eruptive phases are plotted versus their VEI classification after Simkin & Siebert
(2002-). The distribution indicates a rough general positive relation of the mean porosity
with the VEI value. Exceptions can be noted especially at the low-porosity deposits of
Colima, Unzen and Merapi. These show no coherency within this correlation. The
deviation of the two cryptodome-dominated eruptions of Bezymianny and Mount St.
Helens towards higher VEI scales is however not surprising, and reflects a different
style of depressurization: During the formation of a cryptodome, volatile exsolution and
thus porosity development is suppressed by the lithostatic pressure of the overlying
material. Nevertheless, the exsolved gas in the (limited) pore volume should be able to
bear a higher amount of overpressure than in an environment without the additional
lithostatic load. Upon rapid decompression, a highly compressed gas in a comparably
small total pore volume may therefore cause a large, cataclysmic explosive response to
the removal of the confining load. This scenario lead to the VEI 5 eruptions of Mt. St.
Helens and Bezymianny which generated material with no more than ~30 vol%
porosity.
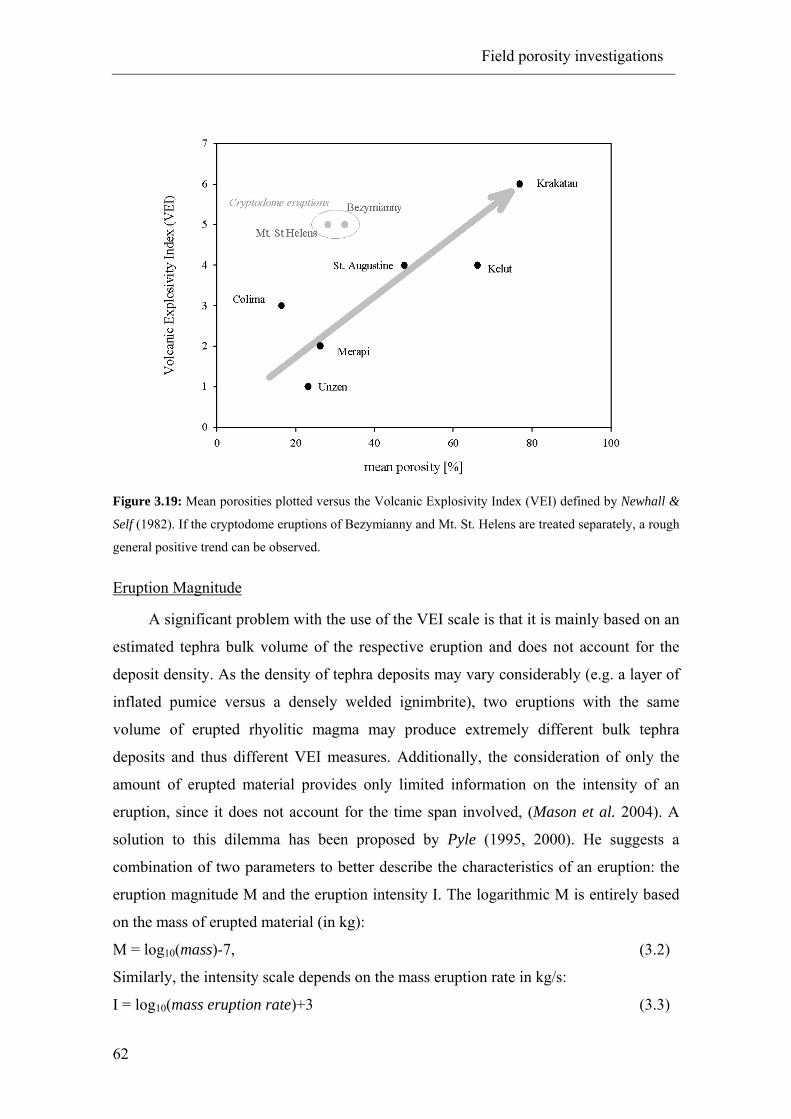
Field porosity investigations
62
Figure 3.19: Mean porosities plotted versus the Volcanic Explosivity Index (VEI) defined by Newhall &
Self (1982). If the cryptodome eruptions of Bezymianny and Mt. St. Helens are treated separately, a rough
general positive trend can be observed.
Eruption Magnitude
A significant problem with the use of the VEI scale is that it is mainly based on an
estimated tephra bulk volume of the respective eruption and does not account for the
deposit density. As the density of tephra deposits may vary considerably (e.g. a layer of
inflated pumice versus a densely welded ignimbrite), two eruptions with the same
volume of erupted rhyolitic magma may produce extremely different bulk tephra
deposits and thus different VEI measures. Additionally, the consideration of only the
amount of erupted material provides only limited information on the intensity of an
eruption, since it does not account for the time span involved, (Mason et al. 2004). A
solution to this dilemma has been proposed by Pyle (1995, 2000). He suggests a
combination of two parameters to better describe the characteristics of an eruption: the
eruption magnitude M and the eruption intensity I. The logarithmic M is entirely based
on the mass of erupted material (in kg):
M = log10(mass)-7, (3.2)
Similarly, the intensity scale depends on the mass eruption rate in kg/s:
I = log10(mass eruption rate)+3 (3.3)
Field porosity investigations
63
The mass eruption rate is commonly estimated according to direct observations, so data
are not available for every eruption. The scales of both parameters are chosen in a way
to be comparable to the VEI scale.
Using the mean bulk density values determined in the field campaigns, it is
possible to calculate M from the easier obtainable bulk tephra volumes of an eruption,
listed e.g. in digital databases like Siebert & Simkin 2002- (Table 3.1).
Table 3.1: Compilation of Tephra volume, measured mean density, calculated erupted mass and the explosivity scales M and VEI.
Eruption Tephra volume
(m3) b
Mean density
(kg/m3)
Erupted mass
(kg)
Magnitude M VEI b
Colima 1998-rec 2,40E+06 2280 5,47E+09 2,74 3
Krakatau 1883 2,00E+10 570 1,14E+13 6,06 6
Augustine 1986 1,00E+08 1440 1,44E+11 4,16 4
Unzen 1990-95 4,70E+06 2000 9,40E+09 2,97 1
Kelut 1990 1,30E+08 730 9,49E+10 3,98 4
Merapi 1992-2002 1,10E+07 2080 2,29E+10 3,36 2
Bezymianny 1956 2,80E+09 1800 5,04E+12 5,70 5
Mt. St. Helens 1980 1,20E+09 1930 a 2,32E+12 5,36 5 a - mean density value calculated from density data from Hoblitt & Harmon (1993); b – data from Siebert & Simkin 2002-
As M accounts for both the tephra volume and mean density, a closer correlation
between porosity and eruption magnitude can be expected and becomes verified in
Figure 3.20. Now also the low porous eruption deposits fit very well into the trend. This
correlation seems to react even more sensible to changes of the eruption mechanism, as
the deviation of Bezymianny, Mount St. Helens and also Kelut is bigger in Figure 1.20
compared to Figure 1.19. All these eruptions are characterized by not only pure
explosive (Vulcanian or Plinian) eruption mechanism. Because of the assumed high
energetic character of the lateral blast eruptions, the data points of Bezymianny and
Mount St. Helens still deviate from a possible linear relation. Also the Kelut 1990
eruption does not closely fit this approximate trend, most likely because it was
comparatively short (and had therefore a relatively low total tephra output), but -due to
its phreatomagmatic character- intense.
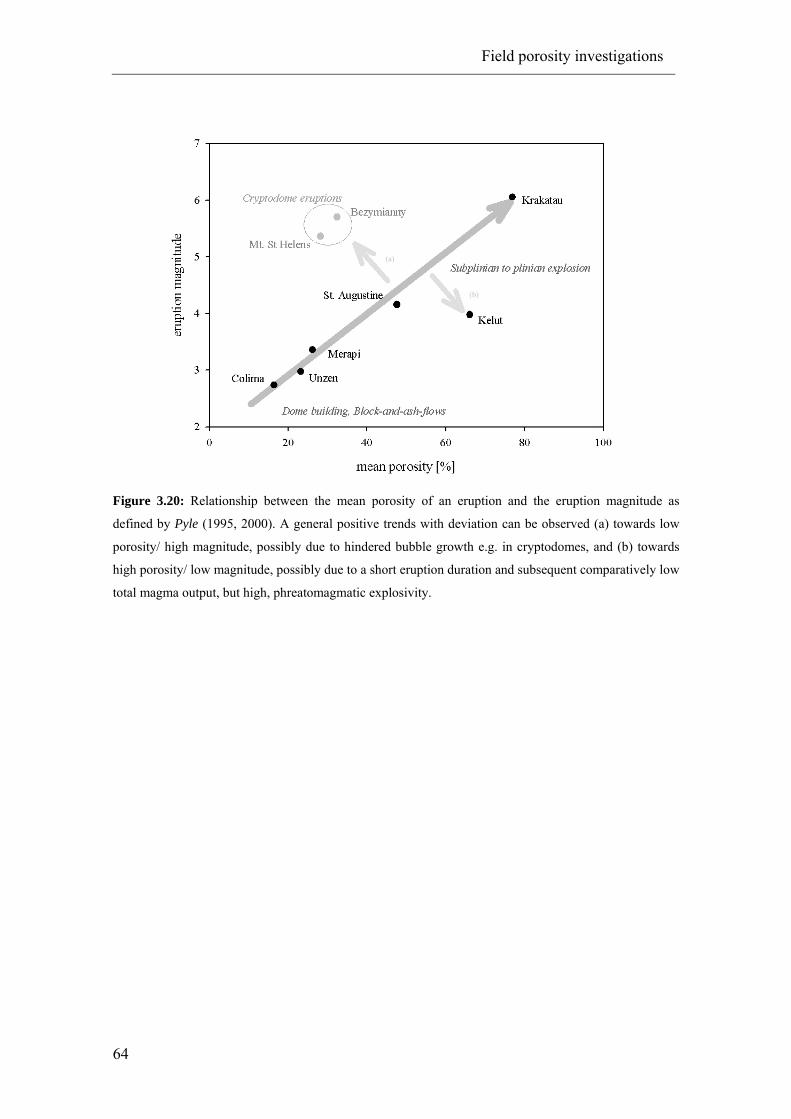
Field porosity investigations
64
Figure 3.20: Relationship between the mean porosity of an eruption and the eruption magnitude as
defined by Pyle (1995, 2000). A general positive trends with deviation can be observed (a) towards low
porosity/ high magnitude, possibly due to hindered bubble growth e.g. in cryptodomes, and (b) towards
high porosity/ low magnitude, possibly due to a short eruption duration and subsequent comparatively low
total magma output, but high, phreatomagmatic explosivity.
(a)
(b)
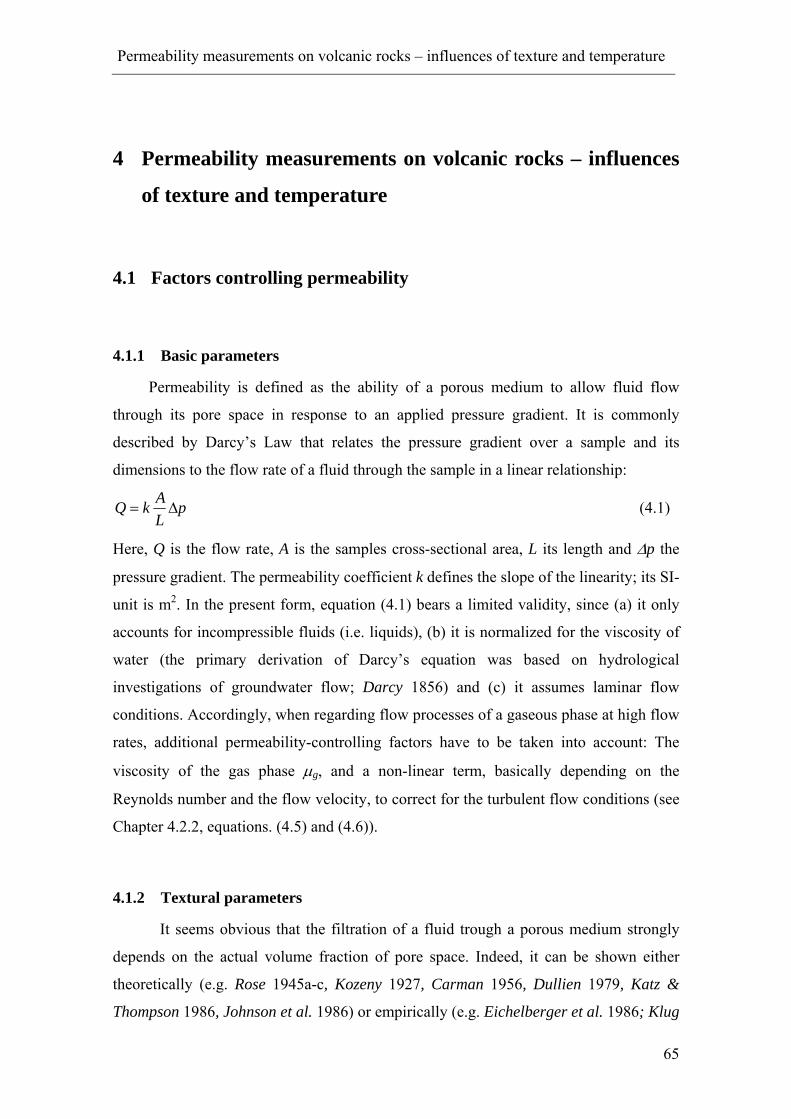
Permeability measurements on volcanic rocks – influences of texture and temperature
65
4 Permeability measurements on volcanic rocks – influences
of texture and temperature
4.1 Factors controlling permeability
4.1.1 Basic parameters
Permeability is defined as the ability of a porous medium to allow fluid flow
through its pore space in response to an applied pressure gradient. It is commonly
described by Darcy’s Law that relates the pressure gradient over a sample and its
dimensions to the flow rate of a fluid through the sample in a linear relationship:
pLAkQ ∆= (4.1)
Here, Q is the flow rate, A is the samples cross-sectional area, L its length and ∆p the
pressure gradient. The permeability coefficient k defines the slope of the linearity; its SI-
unit is m2. In the present form, equation (4.1) bears a limited validity, since (a) it only
accounts for incompressible fluids (i.e. liquids), (b) it is normalized for the viscosity of
water (the primary derivation of Darcy’s equation was based on hydrological
investigations of groundwater flow; Darcy 1856) and (c) it assumes laminar flow
conditions. Accordingly, when regarding flow processes of a gaseous phase at high flow
rates, additional permeability-controlling factors have to be taken into account: The
viscosity of the gas phase µg, and a non-linear term, basically depending on the
Reynolds number and the flow velocity, to correct for the turbulent flow conditions (see
Chapter 4.2.2, equations. (4.5) and (4.6)).
4.1.2 Textural parameters
It seems obvious that the filtration of a fluid trough a porous medium strongly
depends on the actual volume fraction of pore space. Indeed, it can be shown either
theoretically (e.g. Rose 1945a-c, Kozeny 1927, Carman 1956, Dullien 1979, Katz &
Thompson 1986, Johnson et al. 1986) or empirically (e.g. Eichelberger et al. 1986; Klug
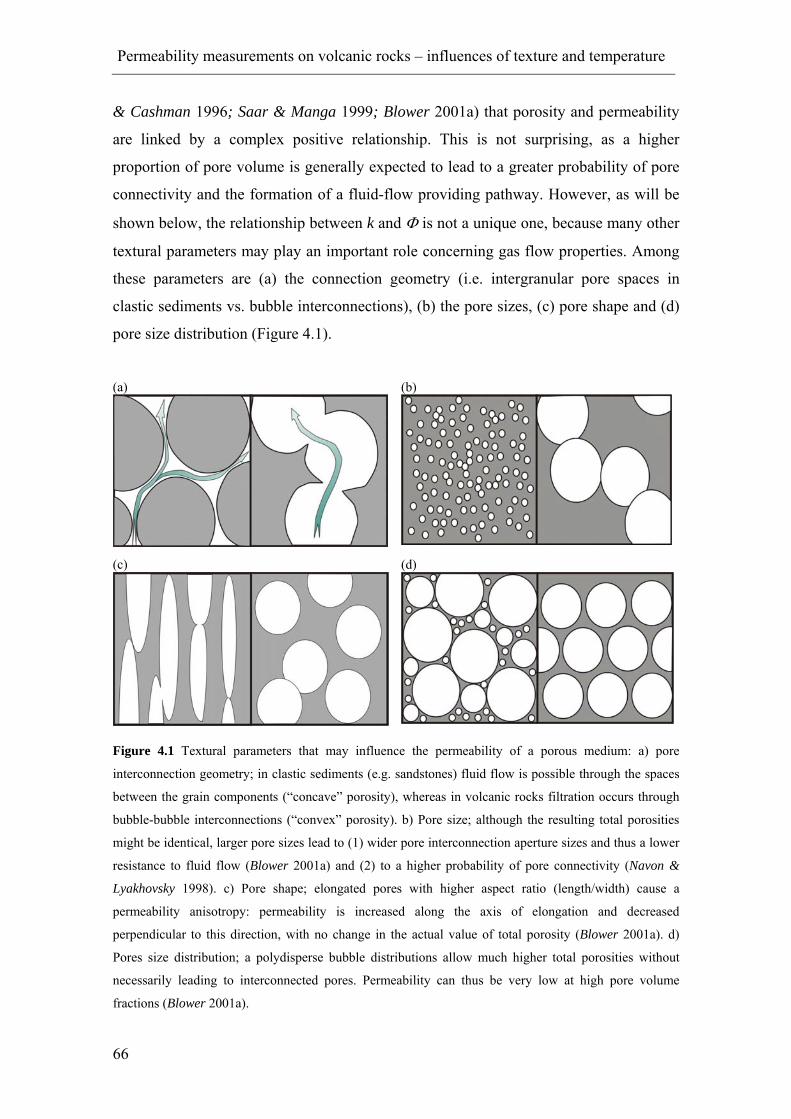
Permeability measurements on volcanic rocks – influences of texture and temperature
66
& Cashman 1996; Saar & Manga 1999; Blower 2001a) that porosity and permeability
are linked by a complex positive relationship. This is not surprising, as a higher
proportion of pore volume is generally expected to lead to a greater probability of pore
connectivity and the formation of a fluid-flow providing pathway. However, as will be
shown below, the relationship between k and Φ is not a unique one, because many other
textural parameters may play an important role concerning gas flow properties. Among
these parameters are (a) the connection geometry (i.e. intergranular pore spaces in
clastic sediments vs. bubble interconnections), (b) the pore sizes, (c) pore shape and (d)
pore size distribution (Figure 4.1).
(a) (b)
(c) (d)
Figure 4.1 Textural parameters that may influence the permeability of a porous medium: a) pore
interconnection geometry; in clastic sediments (e.g. sandstones) fluid flow is possible through the spaces
between the grain components (“concave” porosity), whereas in volcanic rocks filtration occurs through
bubble-bubble interconnections (“convex” porosity). b) Pore size; although the resulting total porosities
might be identical, larger pore sizes lead to (1) wider pore interconnection aperture sizes and thus a lower
resistance to fluid flow (Blower 2001a) and (2) to a higher probability of pore connectivity (Navon &
Lyakhovsky 1998). c) Pore shape; elongated pores with higher aspect ratio (length/width) cause a
permeability anisotropy: permeability is increased along the axis of elongation and decreased
perpendicular to this direction, with no change in the actual value of total porosity (Blower 2001a). d)
Pores size distribution; a polydisperse bubble distributions allow much higher total porosities without
necessarily leading to interconnected pores. Permeability can thus be very low at high pore volume
fractions (Blower 2001a).
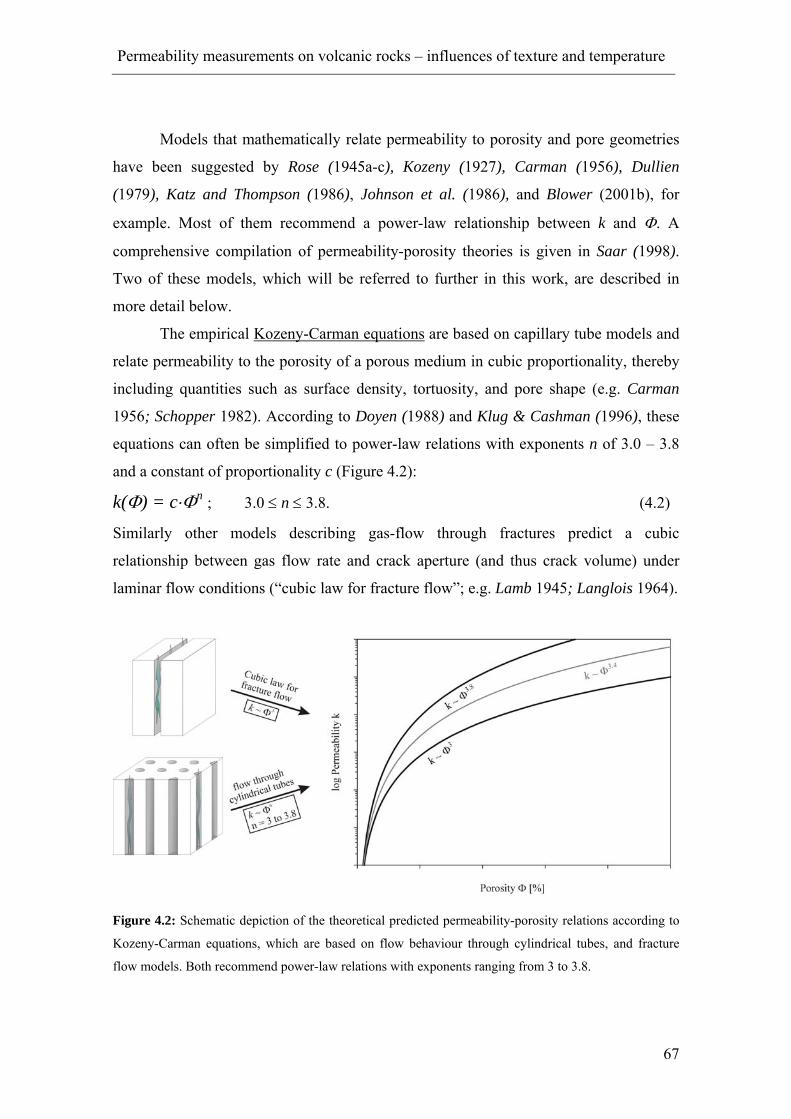
Permeability measurements on volcanic rocks – influences of texture and temperature
67
Models that mathematically relate permeability to porosity and pore geometries
have been suggested by Rose (1945a-c), Kozeny (1927), Carman (1956), Dullien
(1979), Katz and Thompson (1986), Johnson et al. (1986), and Blower (2001b), for
example. Most of them recommend a power-law relationship between k and Φ. A
comprehensive compilation of permeability-porosity theories is given in Saar (1998).
Two of these models, which will be referred to further in this work, are described in
more detail below.
The empirical Kozeny-Carman equations are based on capillary tube models and
relate permeability to the porosity of a porous medium in cubic proportionality, thereby
including quantities such as surface density, tortuosity, and pore shape (e.g. Carman
1956; Schopper 1982). According to Doyen (1988) and Klug & Cashman (1996), these
equations can often be simplified to power-law relations with exponents n of 3.0 – 3.8
and a constant of proportionality c (Figure 4.2):
k(Φ) = c⋅Φn ; 3.0 ≤ n ≤ 3.8. (4.2)
Similarly other models describing gas-flow through fractures predict a cubic
relationship between gas flow rate and crack aperture (and thus crack volume) under
laminar flow conditions (“cubic law for fracture flow”; e.g. Lamb 1945; Langlois 1964).
Figure 4.2: Schematic depiction of the theoretical predicted permeability-porosity relations according to
Kozeny-Carman equations, which are based on flow behaviour through cylindrical tubes, and fracture
flow models. Both recommend power-law relations with exponents ranging from 3 to 3.8.

Permeability measurements on volcanic rocks – influences of texture and temperature
68
Percolation theory deals with fluid flow through a random media by
mathematically describing the probability of connectivity in a disordered lattice and
generally predicts a permeability-porosity relationship in the form
k(Φ) = c⋅(Φ - Φcr)n ∀ Φ ≥ Φcr
k(Φ) = 0 ∀ Φ < Φcr (4.3)
where c is a magnitude-defining constant and n is the power-law exponent dependent on
the pathway geometry. Φcr is a critical porosity (“percolation threshold”) below which
no connected, continuous network of pores and thus no permeability can be expected.
For media with idealized, spherical bubbles (FPS – fully penetrable sphere model), n = 2
and Φcr ∼ 30 % (Figure 4.3; Saar & Manga 1999; Blower 2001a; Feng et al. 1987;
Sahimi 1994, 1995; Mukhopadhyay & Sahimi 1994).
Figure 4.3: Schematic depiction of the theoretical permeability-porosity trend according to the
percolation theory for a medium with fully penetrable, spherical bubbles. The model predicts a
percolation threshold at ~30 % porosity, below which no filtration can be expected, and an increase of k to
the square of the porosity above that threshold.
In recent experimental volcanological research, the permeability, as a physical
parameter of volcanic rocks, has increasingly become an object of interest, especially in
terms of its direct influence on volcanic degassing processes and thus eruption
mechanisms. Mentionable in this context are the works of Eichelberger et al. (1986),
Westrich & Eichelberger (1994), Klug & Cashman (1996), Saar & Manga (1999),
Melnik & Sparks (2002), Srouga et al. (2003), and Burgisser & Gardner (2005). A
selected compilation of permeability measurement results of previous workers is
displayed in Figure 4.4.
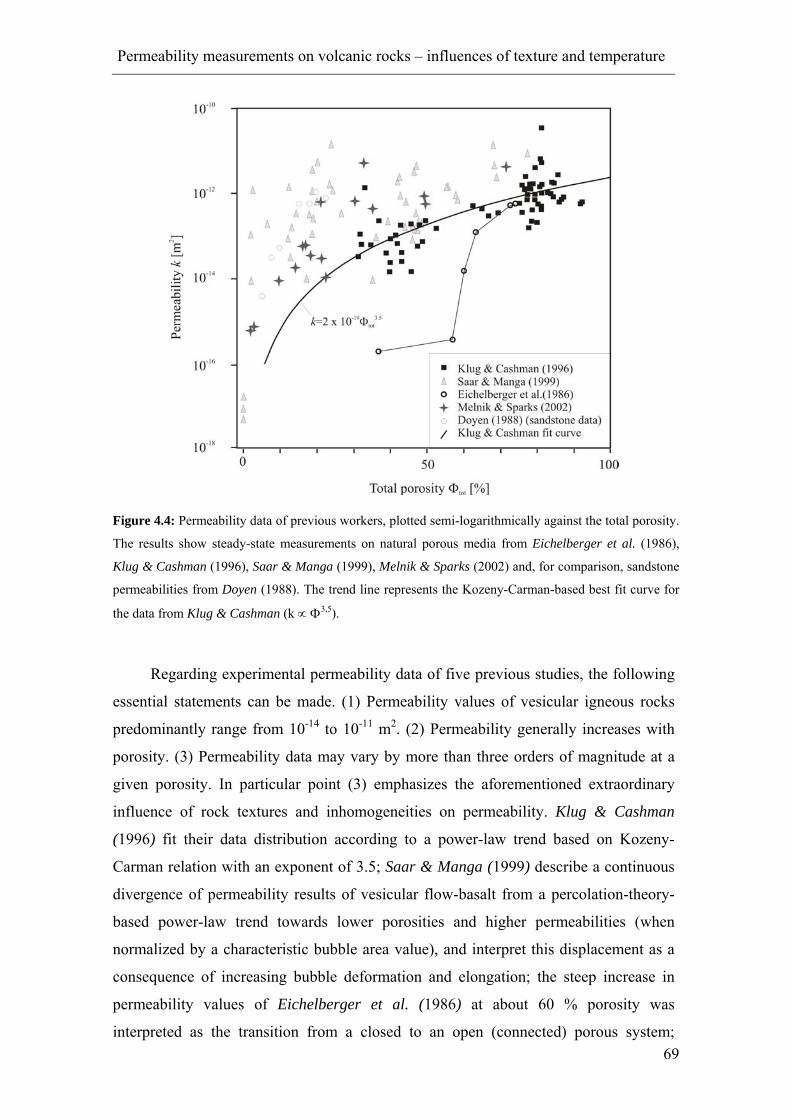
Permeability measurements on volcanic rocks – influences of texture and temperature
69
Figure 4.4: Permeability data of previous workers, plotted semi-logarithmically against the total porosity.
The results show steady-state measurements on natural porous media from Eichelberger et al. (1986),
Klug & Cashman (1996), Saar & Manga (1999), Melnik & Sparks (2002) and, for comparison, sandstone
permeabilities from Doyen (1988). The trend line represents the Kozeny-Carman-based best fit curve for
the data from Klug & Cashman (k ∝ Φ3,5).
Regarding experimental permeability data of five previous studies, the following
essential statements can be made. (1) Permeability values of vesicular igneous rocks
predominantly range from 10-14 to 10-11 m2. (2) Permeability generally increases with
porosity. (3) Permeability data may vary by more than three orders of magnitude at a
given porosity. In particular point (3) emphasizes the aforementioned extraordinary
influence of rock textures and inhomogeneities on permeability. Klug & Cashman
(1996) fit their data distribution according to a power-law trend based on Kozeny-
Carman relation with an exponent of 3.5; Saar & Manga (1999) describe a continuous
divergence of permeability results of vesicular flow-basalt from a percolation-theory-
based power-law trend towards lower porosities and higher permeabilities (when
normalized by a characteristic bubble area value), and interpret this displacement as a
consequence of increasing bubble deformation and elongation; the steep increase in
permeability values of Eichelberger et al. (1986) at about 60 % porosity was
interpreted as the transition from a closed to an open (connected) porous system;
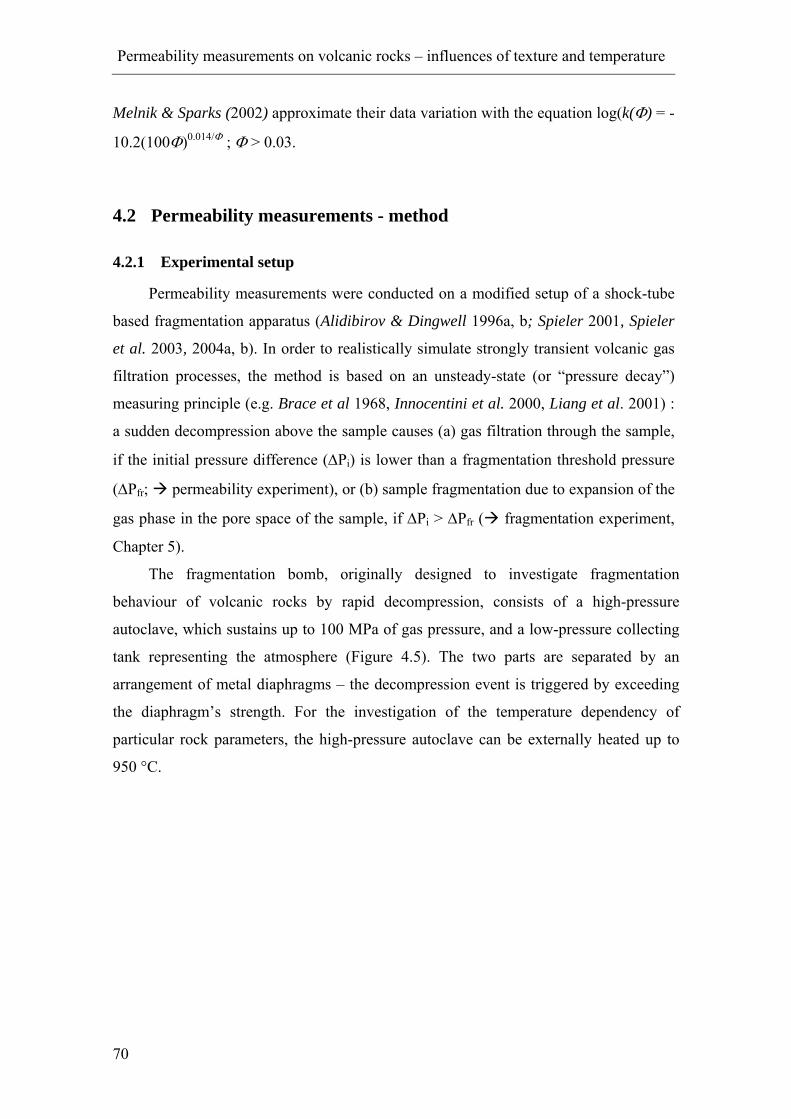
Permeability measurements on volcanic rocks – influences of texture and temperature
70
Melnik & Sparks (2002) approximate their data variation with the equation log(k(Φ) = -
10.2(100Φ)0.014/Φ ; Φ > 0.03.
4.2 Permeability measurements - method
4.2.1 Experimental setup
Permeability measurements were conducted on a modified setup of a shock-tube
based fragmentation apparatus (Alidibirov & Dingwell 1996a, b; Spieler 2001, Spieler
et al. 2003, 2004a, b). In order to realistically simulate strongly transient volcanic gas
filtration processes, the method is based on an unsteady-state (or “pressure decay”)
measuring principle (e.g. Brace et al 1968, Innocentini et al. 2000, Liang et al. 2001) :
a sudden decompression above the sample causes (a) gas filtration through the sample,
if the initial pressure difference (∆Pi) is lower than a fragmentation threshold pressure
(∆Pfr; permeability experiment), or (b) sample fragmentation due to expansion of the
gas phase in the pore space of the sample, if ∆Pi > ∆Pfr ( fragmentation experiment,
Chapter 5).
The fragmentation bomb, originally designed to investigate fragmentation
behaviour of volcanic rocks by rapid decompression, consists of a high-pressure
autoclave, which sustains up to 100 MPa of gas pressure, and a low-pressure collecting
tank representing the atmosphere (Figure 4.5). The two parts are separated by an
arrangement of metal diaphragms – the decompression event is triggered by exceeding
the diaphragm’s strength. For the investigation of the temperature dependency of
particular rock parameters, the high-pressure autoclave can be externally heated up to
950 °C.
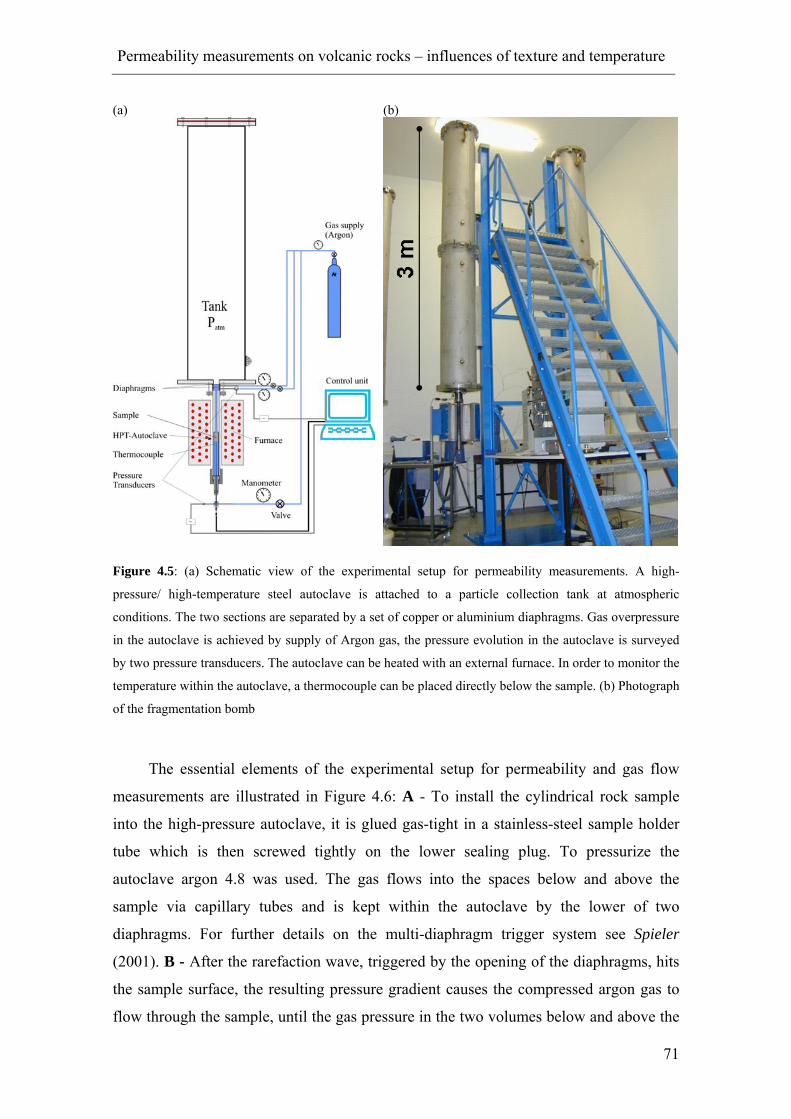
Permeability measurements on volcanic rocks – influences of texture and temperature
71
(a) (b)
Figure 4.5: (a) Schematic view of the experimental setup for permeability measurements. A high-
pressure/ high-temperature steel autoclave is attached to a particle collection tank at atmospheric
conditions. The two sections are separated by a set of copper or aluminium diaphragms. Gas overpressure
in the autoclave is achieved by supply of Argon gas, the pressure evolution in the autoclave is surveyed
by two pressure transducers. The autoclave can be heated with an external furnace. In order to monitor the
temperature within the autoclave, a thermocouple can be placed directly below the sample. (b) Photograph
of the fragmentation bomb
The essential elements of the experimental setup for permeability and gas flow
measurements are illustrated in Figure 4.6: A - To install the cylindrical rock sample
into the high-pressure autoclave, it is glued gas-tight in a stainless-steel sample holder
tube which is then screwed tightly on the lower sealing plug. To pressurize the
autoclave argon 4.8 was used. The gas flows into the spaces below and above the
sample via capillary tubes and is kept within the autoclave by the lower of two
diaphragms. For further details on the multi-diaphragm trigger system see Spieler
(2001). B - After the rarefaction wave, triggered by the opening of the diaphragms, hits
the sample surface, the resulting pressure gradient causes the compressed argon gas to
flow through the sample, until the gas pressure in the two volumes below and above the

Permeability measurements on volcanic rocks – influences of texture and temperature
72
sample is in equilibrium. The pressure trends in these spaces are recorded with two
pressure transducers (Kistler 4075A100). A detailed description of the experimental
procedure is given in Appendix A.
Figure 4.6: Detailed view of the autoclave setup (A) before and (B) after diaphragm rupture. ∆PFr is the
threshold pressure for fragmentation. For further explanations see text.
4.2.2 Data analysis
Following the rupture of the diaphragms, the upper pressure transducer records a
steep drop to atmospheric conditions, whereas the lower transducer shows an
exponential decay, caused by gas filtration through the sample (Figure 4.7a).
Temperature variations recorded by the thermocouple below the sample show a
Permeability measurements on volcanic rocks – influences of texture and temperature
73
decrease in temperature at the initial stage of decompression due to the gas expansion
and a slight increase later due to heat transfer from the walls of the autoclave. Overall
temperature variations within the autoclave are in the order of 10 - 15 °C leading to a
variation in gas density of less then 5% (Figure 4.7b).
(a)
(b)
Figure 4.7: (a) Pressure drop curves recorded by the pressure transducers above and below the sample
during a permeability experiments. (b) Temperature trend of the gas in the autoclave, recorded directly
below the sample cylinder (red curve). For comparison the according pressure evolution in the same
chamber is plotted. The temperature drop is caused by the decompression in the lower volume.
Transient filtration code
In order to analyse the experimental data a transient 1D filtration code was
developed in cooperation with Dr. Oleg Melnik (Moskow State University). The flow is
assumed to be isothermal due to the high heat capacity of the matrix skeleton, the
intense heat transfer between the gas and the skeleton, and the low variations of the
temperature in the gas volume below the sample. A non-linear friction term is taken into
account to describe the rapid filtration processes. Inertia terms are neglected and,
therefore, the code is not capable of considering rapid variations of parameters on the
timescale of ta = L / a (where L is the characteristic length scale, for example the length
of the sample, and a is the velocity of sound in the gas phase). For typical experimental
conditions the value of ta is on the order of 0.2 ms, which is much shorter than the
duration of the filtration experiments (typically several tens of seconds). Therefore, the
model cannot describe the propagation of a rarefaction wave through the sample
generated by the disruption of diaphragms, but instead concentrates on the flow
thereafter.
Permeability measurements on volcanic rocks – influences of texture and temperature
74
The basic system of equations for the code is the following:
0Ut x
ρ ρ∂ ∂Φ + =
∂ ∂ (4.4)
( )2
Reg Up U Cx k k
µ ρ∂= − +
∂ (4.5)
( ) 0Re ; Re ;Ren
g
U kC p RTλ ρ ρµ
= = = (4.6)
In this system Equation (4.4) is the mass conservation equation, Equation (4.5) is
the Darcy equation with a non-linear friction term to correct for the turbulent flow
conditions (Forchheimer correction) and Equation (4.6) defines parameters and the
equation of state for the gas. Here ρ is the density of the gas, U is the filtration velocity,
p is the pressure, µg is the viscosity of the gas phase, and Φ the void fraction. k is the
linear permeability coefficient and C(Re) is the non-linear correction coefficient due to
rapid gas flow, depending on the Reynolds number (Re), as a power law. λ is constant,
R is the gas constant for argon and T0 is the initial temperature of the gas. t is the
experiment time, and x the position within the sample cylinder.
The system is solved with the following boundary conditions: 2
0 : ; : ( )4a L
d Dx V U x L p p tdtρ π ρ= = − = = (4.7)
where Va is the volume of the autoclave below the sample and D is the diameter of the
sample. At the bottom of the sample the density of inflowing gas changes due to the
evacuation of the gas from the autoclave. Equation (4.7) specifies mass conservation for
the gas below the sample. At the top of the sample pressure evolution with time is given.
Because the code does not consider the process of diaphragm rupture, the formation of
the rarefaction wave and its interaction with the sample, the function pL(t) is given by:
( ) ( )00
expL a a
tp t p p pτ
⎛ ⎞= + − −⎜ ⎟
⎝ ⎠ (4.8)
where p0 and pa are the initial and final pressures and τ0 is a constant defining the rate of
pressure drop above the sample. The value of τ0 influences the stability of the

Permeability measurements on volcanic rocks – influences of texture and temperature
75
calculations and is kept as small as possible (~ 0.1 s). For relatively small values of τ0,
the particular choice has a minor impact on the results.
The code for fixed values of k, λ and n is solved numerically by means of the 2-
point Thomas method described in detail in Melnik and Sparks (2004). In order to find a
best fit to the experimental data (the evolution of pressure in the autoclave with time)
the following functional criteria is used:
( )( ) ( )( )( )2
0, ,min ln lnft
e ck np p d
λτ τ τ∆ = −∫ (4.9)
Here tf is the duration of the experimental record, and pe and pc are the measured
and the calculated pressures at the bottom of the sample, respectively. Pressure is scaled
logarithmically in order to allow both high and low pressure parts of the experimental
curve to be fitted. The value of n was fixed for most calculations at n = 0, corresponding
to the Forchheimer equation (e.g. Dullien 1979).
Figure 4.8: Comparison of experimentally measured evolution of autoclave pressure with calculations
using different friction models. Explanations see text.
Figure 4.8 shows a comparison of the experimentally measured pressure below the
sample with calculations for n = 0 and 0.5. Calculated best fit coefficients are for n = 0:
Permeability measurements on volcanic rocks – influences of texture and temperature
76
k = 5.29⋅10-13 m2, λ = 111, ∆ = 0.18⋅10-2, and for n = 0.5: k = 5⋅10-12 m2, λ = 136, ∆=
0.88⋅10-3. For comparison the fit with λ = 0 is plotted as a dashed line. In this case k =
1.6⋅10-13 m2. If only the last 10 s of the dataset are used for the determination of linear
permeability, the value of k (6.05⋅10-13 m2) is close to the value determined for n = 0.
For the same sample and different initial pressures the fit for the data with n = 0.5 is
always better, but the range of best-fit parameters for different runs is much wider than
for the case when n = 0. Therefore, in further analysis, the Forchheimer correction to
Darcy equation will be used. It is clear from Figure 4.8 that the linear Darcy law alone
(i.e. for λ=0) cannot fit the experimental data well. In the case of large pressure
gradients typical for pre-fragmentation conditions in ascending magma during explosive
eruptions the resistance to gas escape is strongly non-linear. Therefore transient effects
can be very important in this case.
Quasi-static approach
Because during most of the experiment the system behaves quasi-statically (i.e.,
the discharge rate above and the sample are equal) a simplified method to determine the
permeability coefficient can be used. If we neglect the time derivative in Equation (4.4)
then the discharge rate is a function of time only. Substituting this relationship into
Equation (4.5) gives:
( ) ( )( )
20 0( )
,( , ) ,
RT Q t RT Q tp x t
x k p x t k p x tµ λ∂
= − −∂
(4.10)
This equation is an ordinary differential equation for pressure where time acts as a
parameter. It can be integrated analytically giving:
( )( ) ( ) ( )( )2
00, 2,
kp t Q t RT Q t k xp x t
k
µ λ− += (4.11)
Discharge rate can be determined from the boundary condition at the top of the sample
p(L,t) = pa(t). Substitution of the discharge rate into Equation (4.11) gives pressure
profile along the sample which is independent from values of k and λ:
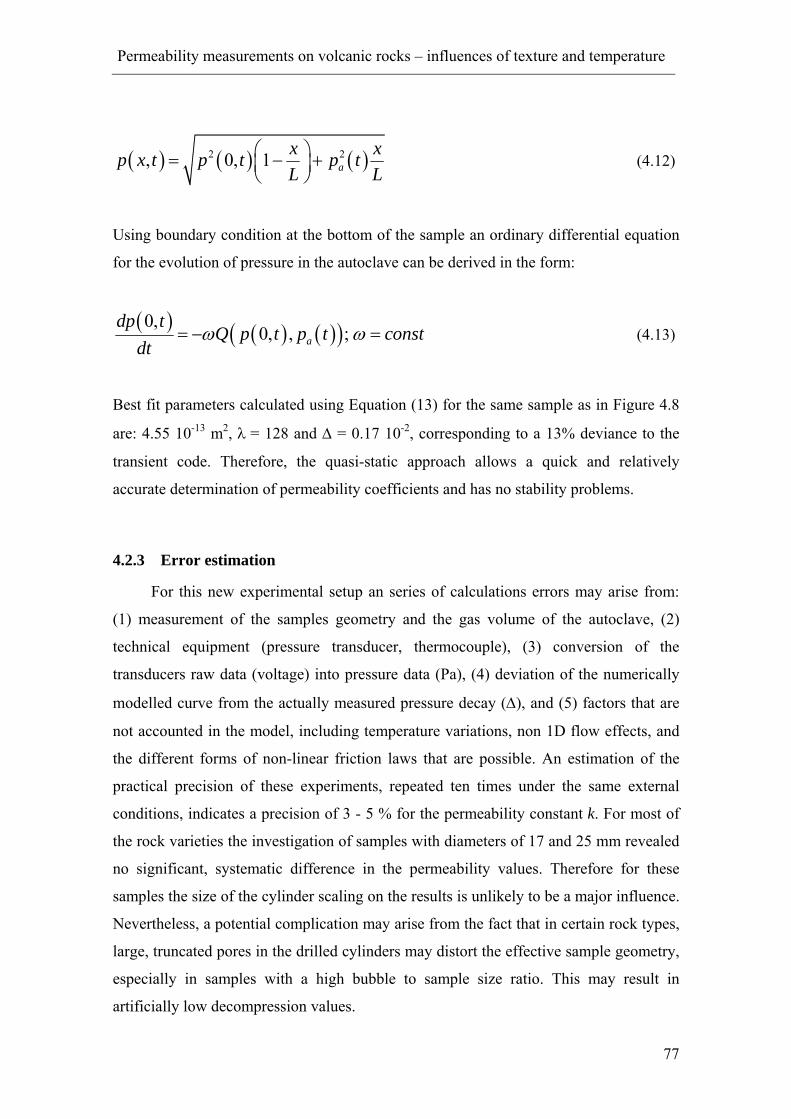
Permeability measurements on volcanic rocks – influences of texture and temperature
77
( ) ( ) ( )2 2, 0, 1 ax xp x t p t p tL L
⎛ ⎞= − +⎜ ⎟⎝ ⎠
(4.12)
Using boundary condition at the bottom of the sample an ordinary differential equation
for the evolution of pressure in the autoclave can be derived in the form:
( ) ( ) ( )( )0,0, , ;a
dp tQ p t p t const
dtω ω= − = (4.13)
Best fit parameters calculated using Equation (13) for the same sample as in Figure 4.8
are: 4.55 10-13 m2, λ = 128 and ∆ = 0.17 10-2, corresponding to a 13% deviance to the
transient code. Therefore, the quasi-static approach allows a quick and relatively
accurate determination of permeability coefficients and has no stability problems.
4.2.3 Error estimation
For this new experimental setup an series of calculations errors may arise from:
(1) measurement of the samples geometry and the gas volume of the autoclave, (2)
technical equipment (pressure transducer, thermocouple), (3) conversion of the
transducers raw data (voltage) into pressure data (Pa), (4) deviation of the numerically
modelled curve from the actually measured pressure decay (∆), and (5) factors that are
not accounted in the model, including temperature variations, non 1D flow effects, and
the different forms of non-linear friction laws that are possible. An estimation of the
practical precision of these experiments, repeated ten times under the same external
conditions, indicates a precision of 3 - 5 % for the permeability constant k. For most of
the rock varieties the investigation of samples with diameters of 17 and 25 mm revealed
no significant, systematic difference in the permeability values. Therefore for these
samples the size of the cylinder scaling on the results is unlikely to be a major influence.
Nevertheless, a potential complication may arise from the fact that in certain rock types,
large, truncated pores in the drilled cylinders may distort the effective sample geometry,
especially in samples with a high bubble to sample size ratio. This may result in
artificially low decompression values.
Permeability measurements on volcanic rocks – influences of texture and temperature
78
4.3 Permeability measurements - results
To enable a comparability with the results of other studies, the linear permeability
coefficient k will be used for further interpretations. The correlation between
permeability results calculated with the 1D transient code and the total porosity of the
corresponding samples is plotted semi-logarithmically in Figure 4.9. The obtained
permeability values range from 2⋅10-15 to 1.5⋅10-10 which is in good agreement with the
results of previous workers (Figure 4.4). The results show a general positive
relationship between porosity and permeability with a high data scatter.
Figure 4.9: The results of unsteady-state permeability measurements on material from 13 volcanoes,
shown as a total porosity vs. linear permeability plot. It reveals a general increasing trend with a high
scatter.
A comparison of the permeability constants obtained using the 1D-transient code
with those obtained using the quasi-static approach is shown in Figure 4.10. Values of k
predicted by both methods are similar, with maximum difference of only 0.3 log units
(Figure 4.10). This demonstrates that the steady-state approach provides an easy and fast
method to determine permeability even from strongly unsteady experiments. However,
the method is limited by the length of the dataset. If the experimental timescale is too
short, transient effects may become more important.

Permeability measurements on volcanic rocks – influences of texture and temperature
79
Figure 4.10: Comparison of linear permeability values obtained by transient and quasi-static approaches.
A correlation coeffictient of 0.958 underpins the applicability of the quasi-static approach.
4.4 Permeability-porosity relationships - interpretations
One of the most apparent features of the data distribution in Figure 4.9 is the
enormous scatter of permeability of more than 3 orders of magnitude for a given
porosity value. Therefore it is almost impossible to interpret these data according to a
simple cause-and-effect correlation. In an attempt to apply k-Φ-models with power-law
exponents of three or higher to our data, as for example the Kozeny-Carman based
curve of Klug & Cashman (1996), the permeability values are either strongly
overestimated at low porosities or underestimated for highly porous samples. Therefore
it will be proposed to interpret the data using a combination of two different power-law
models, each describing gas flow through a different pore structure type (Figure 4.11).
It is evident that gas flow through the samples can still occur below the
theoretically predicted percolation threshold for a network of spherical bubbles (~ 30 %
porosity; Figure 4.11, Figure 4.4). This flow might occur through microcracks, most
likely to have been generated during cooling processes, or elongated collapsed bubbles,
resulting from dynamic processes during magma flow and degassing (Saar & Manga
1999). If so, then adequate models to approximate this kind of degassing should be the
capillary-tube based Kozeny-Carman relations or the cubic law for fracture flow, both
recommending permeability-porosity relations with power-law exponents between 3.0
and 3.8 (e.g. Doyen 1988; Klug & Cashman 1996; see Chapter 4.1.2). Indeed we find
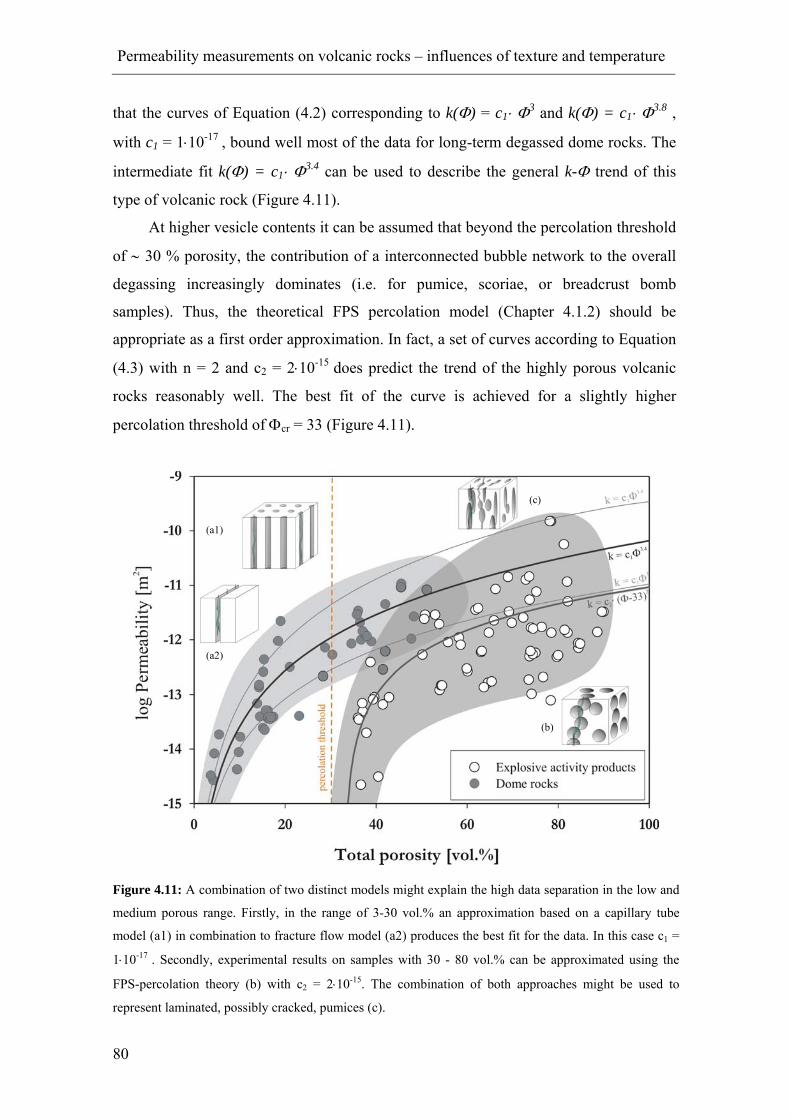
Permeability measurements on volcanic rocks – influences of texture and temperature
80
that the curves of Equation (4.2) corresponding to k(Φ) = c1⋅ Φ3 and k(Φ) = c1⋅ Φ3.8 ,
with c1 = 1⋅10-17 , bound well most of the data for long-term degassed dome rocks. The
intermediate fit k(Φ) = c1⋅ Φ3.4 can be used to describe the general k-Φ trend of this
type of volcanic rock (Figure 4.11).
At higher vesicle contents it can be assumed that beyond the percolation threshold
of ∼ 30 % porosity, the contribution of a interconnected bubble network to the overall
degassing increasingly dominates (i.e. for pumice, scoriae, or breadcrust bomb
samples). Thus, the theoretical FPS percolation model (Chapter 4.1.2) should be
appropriate as a first order approximation. In fact, a set of curves according to Equation
(4.3) with n = 2 and c2 = 2⋅10-15 does predict the trend of the highly porous volcanic
rocks reasonably well. The best fit of the curve is achieved for a slightly higher
percolation threshold of Φcr = 33 (Figure 4.11).
Figure 4.11: A combination of two distinct models might explain the high data separation in the low and
medium porous range. Firstly, in the range of 3-30 vol.% an approximation based on a capillary tube
model (a1) in combination to fracture flow model (a2) produces the best fit for the data. In this case c1 =
1⋅10-17 . Secondly, experimental results on samples with 30 - 80 vol.% can be approximated using the
FPS-percolation theory (b) with c2 = 2⋅10-15. The combination of both approaches might be used to
represent laminated, possibly cracked, pumices (c).
(a1)
(a2)
(b)
(c)
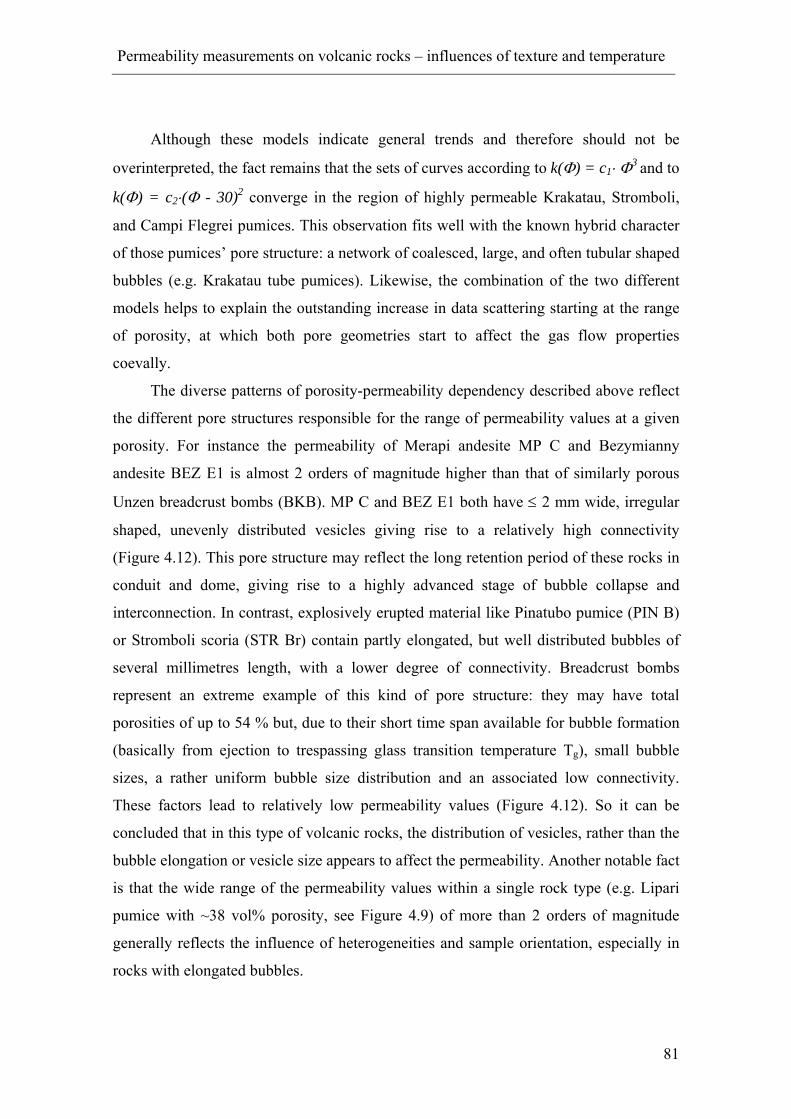
Permeability measurements on volcanic rocks – influences of texture and temperature
81
Although these models indicate general trends and therefore should not be
overinterpreted, the fact remains that the sets of curves according to k(Φ) = c1⋅ Φ3 and to
k(Φ) = c2⋅(Φ - 30)2 converge in the region of highly permeable Krakatau, Stromboli,
and Campi Flegrei pumices. This observation fits well with the known hybrid character
of those pumices’ pore structure: a network of coalesced, large, and often tubular shaped
bubbles (e.g. Krakatau tube pumices). Likewise, the combination of the two different
models helps to explain the outstanding increase in data scattering starting at the range
of porosity, at which both pore geometries start to affect the gas flow properties
coevally.
The diverse patterns of porosity-permeability dependency described above reflect
the different pore structures responsible for the range of permeability values at a given
porosity. For instance the permeability of Merapi andesite MP C and Bezymianny
andesite BEZ E1 is almost 2 orders of magnitude higher than that of similarly porous
Unzen breadcrust bombs (BKB). MP C and BEZ E1 both have ≤ 2 mm wide, irregular
shaped, unevenly distributed vesicles giving rise to a relatively high connectivity
(Figure 4.12). This pore structure may reflect the long retention period of these rocks in
conduit and dome, giving rise to a highly advanced stage of bubble collapse and
interconnection. In contrast, explosively erupted material like Pinatubo pumice (PIN B)
or Stromboli scoria (STR Br) contain partly elongated, but well distributed bubbles of
several millimetres length, with a lower degree of connectivity. Breadcrust bombs
represent an extreme example of this kind of pore structure: they may have total
porosities of up to 54 % but, due to their short time span available for bubble formation
(basically from ejection to trespassing glass transition temperature Tg), small bubble
sizes, a rather uniform bubble size distribution and an associated low connectivity.
These factors lead to relatively low permeability values (Figure 4.12). So it can be
concluded that in this type of volcanic rocks, the distribution of vesicles, rather than the
bubble elongation or vesicle size appears to affect the permeability. Another notable fact
is that the wide range of the permeability values within a single rock type (e.g. Lipari
pumice with ~38 vol% porosity, see Figure 4.9) of more than 2 orders of magnitude
generally reflects the influence of heterogeneities and sample orientation, especially in
rocks with elongated bubbles.
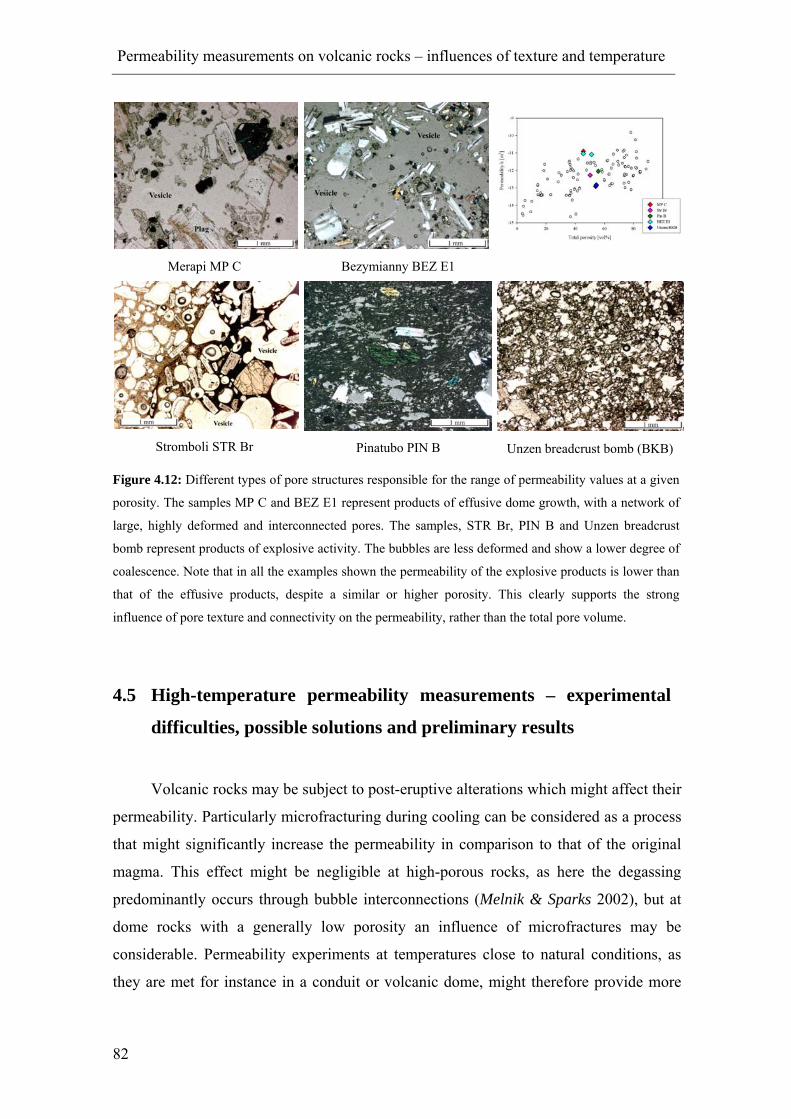
Permeability measurements on volcanic rocks – influences of texture and temperature
82
Merapi MP C
Bezymianny BEZ E1
Stromboli STR Br Pinatubo PIN B Unzen breadcrust bomb (BKB)
Figure 4.12: Different types of pore structures responsible for the range of permeability values at a given
porosity. The samples MP C and BEZ E1 represent products of effusive dome growth, with a network of
large, highly deformed and interconnected pores. The samples, STR Br, PIN B and Unzen breadcrust
bomb represent products of explosive activity. The bubbles are less deformed and show a lower degree of
coalescence. Note that in all the examples shown the permeability of the explosive products is lower than
that of the effusive products, despite a similar or higher porosity. This clearly supports the strong
influence of pore texture and connectivity on the permeability, rather than the total pore volume.
4.5 High-temperature permeability measurements – experimental
difficulties, possible solutions and preliminary results
Volcanic rocks may be subject to post-eruptive alterations which might affect their
permeability. Particularly microfracturing during cooling can be considered as a process
that might significantly increase the permeability in comparison to that of the original
magma. This effect might be negligible at high-porous rocks, as here the degassing
predominantly occurs through bubble interconnections (Melnik & Sparks 2002), but at
dome rocks with a generally low porosity an influence of microfractures may be
considerable. Permeability experiments at temperatures close to natural conditions, as
they are met for instance in a conduit or volcanic dome, might therefore provide more

Permeability measurements on volcanic rocks – influences of texture and temperature
83
realistic data for conduit dynamics models, if they are capable of re-enacting the
original, pre-eruptive state of a sample.
4.5.1 Experimental approaches
However, permeability measurements at high temperatures represent, from the
experimental point of view, a major technical challenge in terms of operational
demands, material deformation and the steadiness of the experimental conditions. The
biggest problem in this context is the gas tight fit of the sample-autoclave-interface. In
the following section an overview of some of the approaches pursued during this project,
and the problems faced, will be given. For the tests, the gas discharge rates of samples
cylinders assembled with the respective approach were compared to discharge rates
obtained by the standard room-temperature method using crystal bond as a adhesive.
1) The first approach was to glue the sample into a steel sample holder, in analogy to
the room-temperature setup (Chapter 4.2.1 & Appendix A). As adhesive, a high
temperature cement (Sauereisen No. 13) was used. At 850°C gas leakage was
observed. The cause of this leakage is most probably the different thermal
expansion of steel and rock. With an expansion coefficient α ~ 18-19⋅10-6 K-1
(Wegst 1989) the thermal expansion of steel is considerable larger than that of
silicic rocks (α ~ 5-10⋅10-6 K-1; e.g. Strohmeyer 2003) and the thermal expansion
of the HT cement (4.68⋅10-6 K-1; Sauereisen Zircon potting cement No. 13
datasheet) is not able to compensate this, resulting in gas leakage between sample
and sample holder.
2) Ceramic sample holder tubes with lower thermal expansivities (Alsint, α ~ 8⋅10-6
K-1 and fired pyrophyllite, α ~ 3⋅10-6 K-1; α-values from http://www.haldenwanger
.de/pdf/materials_e_06.pdf and www.ceramic-substrates.co.uk/material,
respectively) were used. Again, the sample cylinders were glued using the high-
temperature cement. Problems with this approach were: (a) The Pyrophyllit sample
holders were too fragile to withstand the uniaxial pressures required to tighten it
against two copper sealing rings above and below the sample holder. (b) The
surface of the stronger Alsint (an Al2O3 ceramic) sample holder didn’t conjoin
properly with the cement. Gas leakage therefore most likely occurred through the
Alsint-cement interface. (c) The low thermal expansion coefficients of the ceramic
Permeability measurements on volcanic rocks – influences of texture and temperature
84
tubes in comparison to that of the sample in few cases caused rupture of the
ceramic tube.
3) To allow for a dynamical adjustment of the sealing material between sample and
sample holder, a borosilicate glass tube was placed around the samples. For a glass
tube of a specified glass composition there exists a temperature window above the
softening point, in which the glass viscosity causes gravitational collapse of the
tube and hence closure of the space between the autoclave and the sample. For
borosilicate glass, 850 °C is within this temperature window. However, it was
found that the gravitational collapse didn’t create a bonding between the glass and
the rough sample surface strong enough to withstand to applied gas overpressures.
Gas leakage, most likely through the glass-sample interface, was the consequence.
4) The following three approaches were based on grouting a powdery substance into
the space between autoclave and sample: the sample cylinder is placed in the
autoclave, free-standing on the conical shaped inset on top of the sample (in
measurement position). Then gradually the powder is filled in the space between
sample and autoclave (Figure 4.13). About every 5 mm, the loose powder grains
are compressed in a hydraulic press with not more than 10 bar, using a steel tube
with 28 mm outer and ~25mm inner diameter as plunger. The procedure is
repeated, until the compressed powder coat covers the entire sample length. The
advantage of this method is that the sealing compound can be, if required, further
compressed during the high-T experiment by moving up a metal tube through the
retightening of the lower screw nut. The induced deformation of the powder
continuously seals the system. First attempts with this method were conducted
using compacted CaF2-powder. This material is often used as sealing material in
high-temperature experimental petrology, since it has a high melting point > 1360
°C. However, the problem in this case was that the Calcium Fluoride grains are too
rigid to be mechanically deformable at the applied compressive pressures, and
therefore did not form a compact, gas-tight filling. The overpressurized gas in the
grain interstices caused – upon rapid decompression – a complete blow-out of the
material.
5) Though softer pyrophyllite or talcum powder could be compressed to a compact
seal, dehydration reactions at high temperatures caused volume reduction of the
sealing coat and subsequent gas leakage.
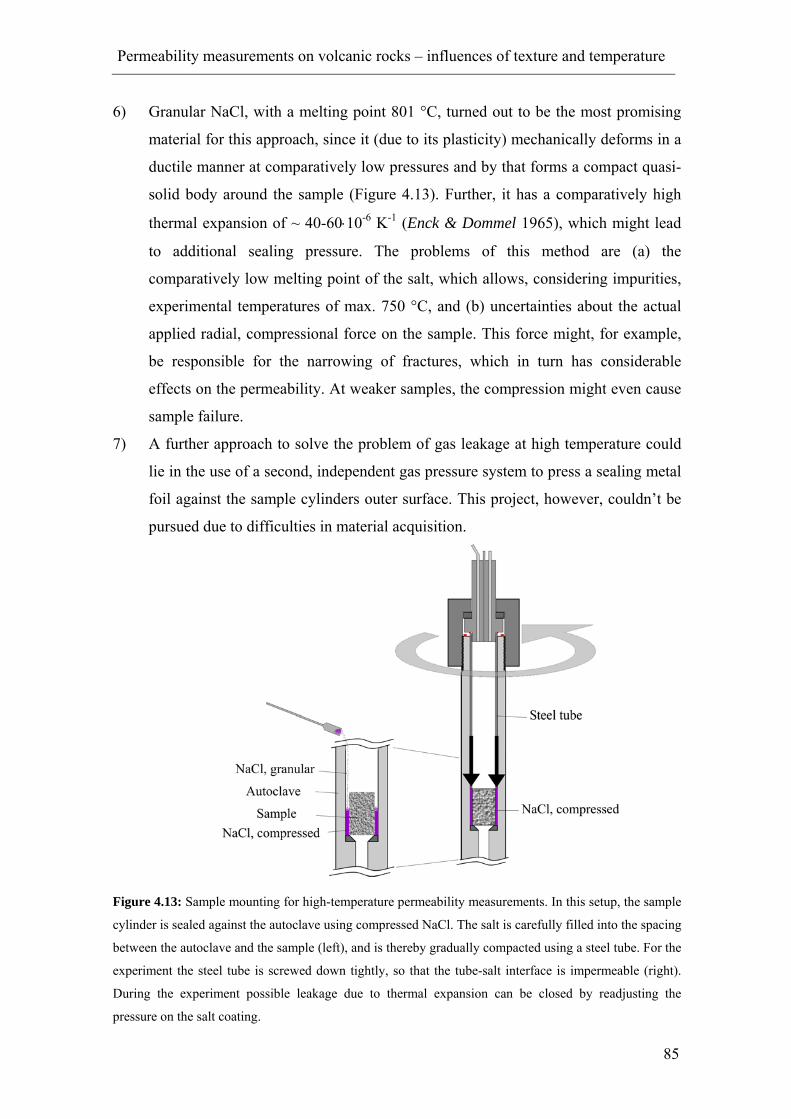
Permeability measurements on volcanic rocks – influences of texture and temperature
85
6) Granular NaCl, with a melting point 801 °C, turned out to be the most promising
material for this approach, since it (due to its plasticity) mechanically deforms in a
ductile manner at comparatively low pressures and by that forms a compact quasi-
solid body around the sample (Figure 4.13). Further, it has a comparatively high
thermal expansion of ~ 40-60⋅10-6 K-1 (Enck & Dommel 1965), which might lead
to additional sealing pressure. The problems of this method are (a) the
comparatively low melting point of the salt, which allows, considering impurities,
experimental temperatures of max. 750 °C, and (b) uncertainties about the actual
applied radial, compressional force on the sample. This force might, for example,
be responsible for the narrowing of fractures, which in turn has considerable
effects on the permeability. At weaker samples, the compression might even cause
sample failure.
7) A further approach to solve the problem of gas leakage at high temperature could
lie in the use of a second, independent gas pressure system to press a sealing metal
foil against the sample cylinders outer surface. This project, however, couldn’t be
pursued due to difficulties in material acquisition.
Figure 4.13: Sample mounting for high-temperature permeability measurements. In this setup, the sample
cylinder is sealed against the autoclave using compressed NaCl. The salt is carefully filled into the spacing
between the autoclave and the sample (left), and is thereby gradually compacted using a steel tube. For the
experiment the steel tube is screwed down tightly, so that the tube-salt interface is impermeable (right).
During the experiment possible leakage due to thermal expansion can be closed by readjusting the
pressure on the salt coating.
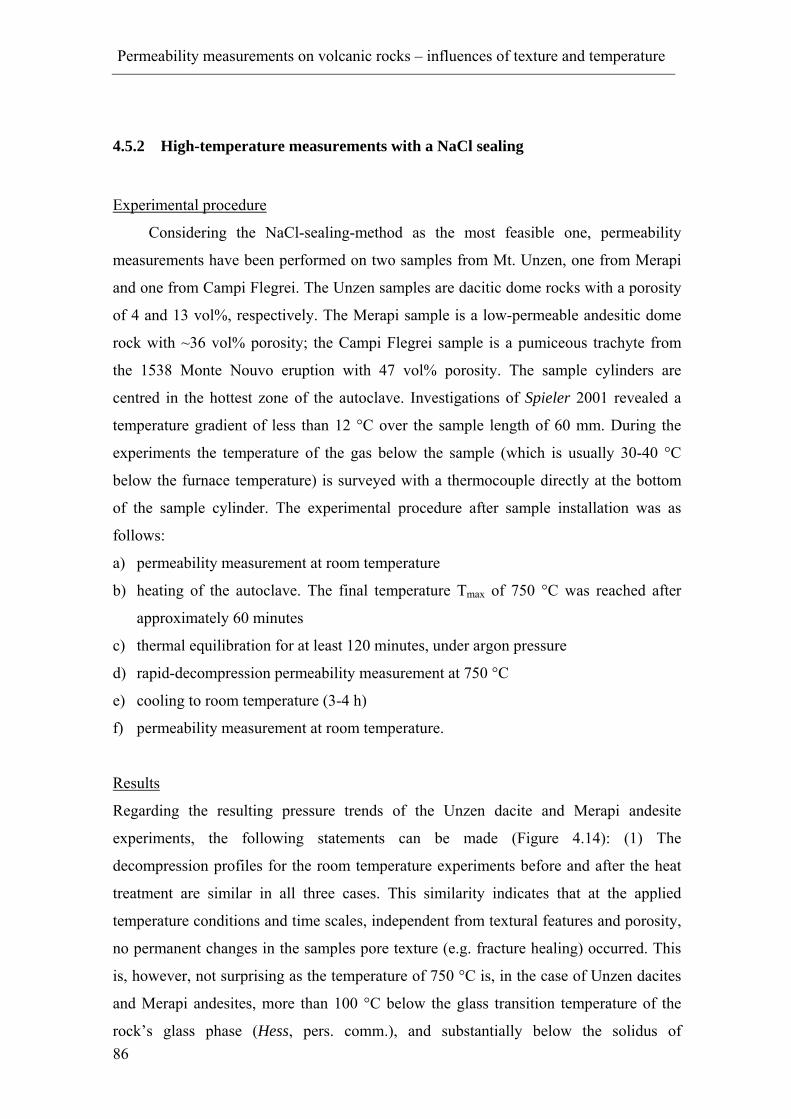
Permeability measurements on volcanic rocks – influences of texture and temperature
86
4.5.2 High-temperature measurements with a NaCl sealing
Experimental procedure
Considering the NaCl-sealing-method as the most feasible one, permeability
measurements have been performed on two samples from Mt. Unzen, one from Merapi
and one from Campi Flegrei. The Unzen samples are dacitic dome rocks with a porosity
of 4 and 13 vol%, respectively. The Merapi sample is a low-permeable andesitic dome
rock with ~36 vol% porosity; the Campi Flegrei sample is a pumiceous trachyte from
the 1538 Monte Nouvo eruption with 47 vol% porosity. The sample cylinders are
centred in the hottest zone of the autoclave. Investigations of Spieler 2001 revealed a
temperature gradient of less than 12 °C over the sample length of 60 mm. During the
experiments the temperature of the gas below the sample (which is usually 30-40 °C
below the furnace temperature) is surveyed with a thermocouple directly at the bottom
of the sample cylinder. The experimental procedure after sample installation was as
follows:
a) permeability measurement at room temperature
b) heating of the autoclave. The final temperature Tmax of 750 °C was reached after
approximately 60 minutes
c) thermal equilibration for at least 120 minutes, under argon pressure
d) rapid-decompression permeability measurement at 750 °C
e) cooling to room temperature (3-4 h)
f) permeability measurement at room temperature.
Results
Regarding the resulting pressure trends of the Unzen dacite and Merapi andesite
experiments, the following statements can be made (Figure 4.14): (1) The
decompression profiles for the room temperature experiments before and after the heat
treatment are similar in all three cases. This similarity indicates that at the applied
temperature conditions and time scales, independent from textural features and porosity,
no permanent changes in the samples pore texture (e.g. fracture healing) occurred. This
is, however, not surprising as the temperature of 750 °C is, in the case of Unzen dacites
and Merapi andesites, more than 100 °C below the glass transition temperature of the
rock’s glass phase (Hess, pers. comm.), and substantially below the solidus of
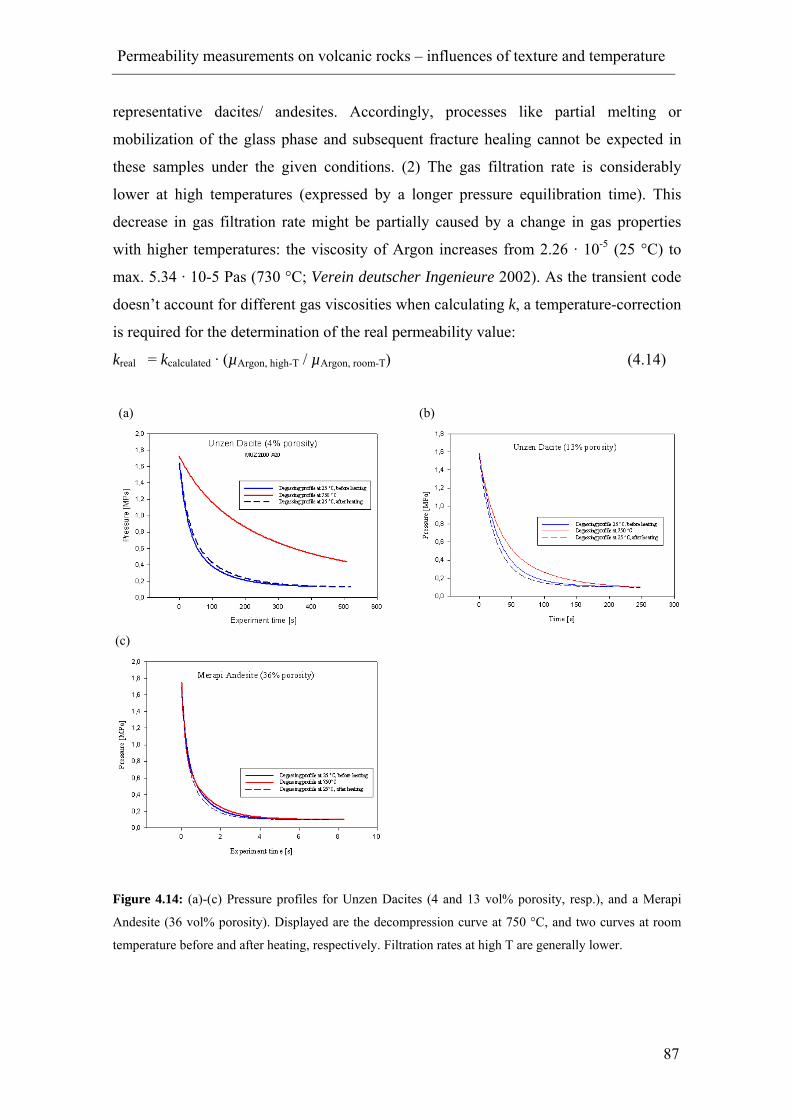
Permeability measurements on volcanic rocks – influences of texture and temperature
87
representative dacites/ andesites. Accordingly, processes like partial melting or
mobilization of the glass phase and subsequent fracture healing cannot be expected in
these samples under the given conditions. (2) The gas filtration rate is considerably
lower at high temperatures (expressed by a longer pressure equilibration time). This
decrease in gas filtration rate might be partially caused by a change in gas properties
with higher temperatures: the viscosity of Argon increases from 2.26 · 10-5 (25 °C) to
max. 5.34 · 10-5 Pas (730 °C; Verein deutscher Ingenieure 2002). As the transient code
doesn’t account for different gas viscosities when calculating k, a temperature-correction
is required for the determination of the real permeability value:
kreal = kcalculated · (µArgon, high-T / µArgon, room-T) (4.14)
(a)
(b)
(c)
Figure 4.14: (a)-(c) Pressure profiles for Unzen Dacites (4 and 13 vol% porosity, resp.), and a Merapi
Andesite (36 vol% porosity). Displayed are the decompression curve at 750 °C, and two curves at room
temperature before and after heating, respectively. Filtration rates at high T are generally lower.

Permeability measurements on volcanic rocks – influences of texture and temperature
88
Interpretations
The uncorrected and corrected permeability values in comparison to the room
temperature data are displayed in Figure 4.15. The results illustrate that the corrected,
real permeability of the samples at high temperatures is effectively higher than at room
temperature. This allows the interpretation that thermal expansion of the entire sample
leads to an extension of the pore interconnections responsible for gas flow. (a) (b)
(c)
Figure 4.15: Permeability development during high-temperature experiments. The room-temperature
experiments before and after the heating are similar within a 10 %-interval for all three cases. This
indicates that no permanent changes in the samples structure took place. At high temperatures the
permeability value, calculated without temperature correction, drops about 30 % (dark red dots). If,
however, the changed gas properties are taken into account, permeability gets effectively higher (red dots).
The red dotted line schematically indicates the temperature course of the experiment.
This effect can be illustrated regarding a comparative degassing experiment using
a steel cylinder with seven capillary drillings as sample representative (Figure 4.16).
Although the gas viscosity is higher at high temperatures and the flow rate should

Permeability measurements on volcanic rocks – influences of texture and temperature
89
theoretically decrease, the gas filtration rate is higher at 850 °C. This is most probably
caused by an extension of the capillaries diameter by thermal expansion.
Figure 4.16: Pressure profiles of a degassing experiment at room temperature and 850 °C, performed on a
steel cylinder with seven 0.2 mm drillings. Despite a higher gas viscosity, in this case the filtration rate of
the high temperature experiment is higher.
It can be therefore concluded: (a) gas filtration through the samples is slower at
high temperatures, though (b) the effective permeability of the samples is higher.
However, these conclusions must be seen under certain restrictions: it must be
taken into account that the radial compressive forces induced by the salt upon the sample
cylinder may counteract the extensional forces of the thermal expansion. This might
lower both the calculated and the corrected permeability value. As the gas filtration
properties of fracture-like geometries are more sensitive to volumetric changes than that
of bubble interconnections, this compressive permeability reduction assumingly is more
effective at dense samples with prominent fracture zones, rather than at high-porous
samples. Since the amount of radial pressure and the actual effect of the compression on
the sample can not fully be quantified and controlled in the present setup, uncertainties
concerning the interpretation of the obtained permeability data remain.
To address the question whether permanent changes in a sample’s textural
properties can principally occur at the given experimental circumstances, a Campi
Flegrei sample with trachytic, peralcaline composition was heated above the glass
transition temperature of the material (~605-690 °C depending on water content; Hess,
pers. comm.), and kept at 750 °C for five hours (Figure 4.17). Permeability
measurements were performed subsequently during the heating phase without rapid

Permeability measurements on volcanic rocks – influences of texture and temperature
90
decompression, by supplying a defined ‘pulse’ of argon gas into the volume below the
sample. Because the supplied gas was at room-temperature, no viscosity-correction for
the permeability calculation was performed. As a slight temperature-increase of the gas
during filtration can be assumed, the permeability values from the four high-temperature
experiments in Figure 4.17 likely represent minimum values. But, as the conditions were
equal for all four experiments, they allow a comparative examination: the results show
no apparent changes in permeability throughout the entire experiment (Figure 4.17). It
can therefore be concluded that deformation kinetics in these experiments are far too
slow to cause any substantial structural modifications in the materials pores or fractures,
even if the glass transition temperature is exceeded. Considering that in the present
experiments no axial stresses are applied to the rock cylinder and deformation would
have to occur purely gravitationally, these results correspond to the expected behaviour
of highly viscous melts.
(a)
(b)
Figure 4.17: Long-term high temperature permeability measurement on a trachytic sample from Monte
Nouvo, Campi Flegrei. (a) Pressure profiles from one room temperature and four experiments at 750 °C
furnace temperature, measured in 1h-intervalls. (b) Calculated permeability values (uncorrected). As no
considerable changes in permeability throughout the entire experiment can be noted, permanent changes
of the pore texture can be excluded under the given circumstances. The red dotted line schematically
indicates the temperature course of the experiment.

Permeability control on volcanic fragmentation processes
91
5 Permeability control on volcanic fragmentation processes
5.1 Introduction
Fragmentation of porous magma bearing gas overpressure is considered to be a
crucial process generating explosive volcanic eruptions. A decompressive event (e.g.
rapid magma ascent, landslide, dome collapse, plug failure) disrupts the stress
equilibrium between the gas phase and the surrounding melt. When the gas in the pores
is exposed to a pressure gradient, it may either fragment the surrounding magma, or
escape from the magma along an existing pathway of cracks and interconnected
bubbles. Thus magma permeability can be a decisive parameter in determining whether
an eruption experiences fragmentation; that is, whether it is explosive or effusive, or
exhibits a temporal transition between the two eruptive styles. An experimental
investigation of the interconnection between degassing efficiency and fragmentation
behaviour of volcanic rocks is therefore of great importance for a refined understanding
of eruption mechanisms.
5.2 Bubble overpressure and its reduction
Of the various phenomena that can drive magma fragmentation, internal bubble
overpressure is considered to be amongst the most important (Alidibirov & Dingwell
1996a, 2000; Cashman et al. 2000; Ichihara et al. 2002). The propelling force of this
phenomenon, exerted upon the pyroclastic products, should depend on magma porosity,
gas overpressure, and the ability to preserve the overpressure condition for a certain
time. The latter magma property is strongly dependent on its degassing efficiency or
permeability. Magma porosity and permeability are normally linked by a complex
positive relationship, as a higher proportion of pore space generally leads to a greater
probability of pore interconnectedness (see chapter 3; Eichelberger et al., 1986; Klug
and Cashman, 1996; Blower, 2001a).
As outlined in chapter 1, bubbles grow within rising magma due to overpressure
fed by volatile diffusion and decompression. As the magmastatic pressure in the magma
column decreases during ascent, i) volatile solubility decreases and, upon saturation and
bubble nucleation, volatiles diffuse from the liquid into the bubbles; and ii) bubbles
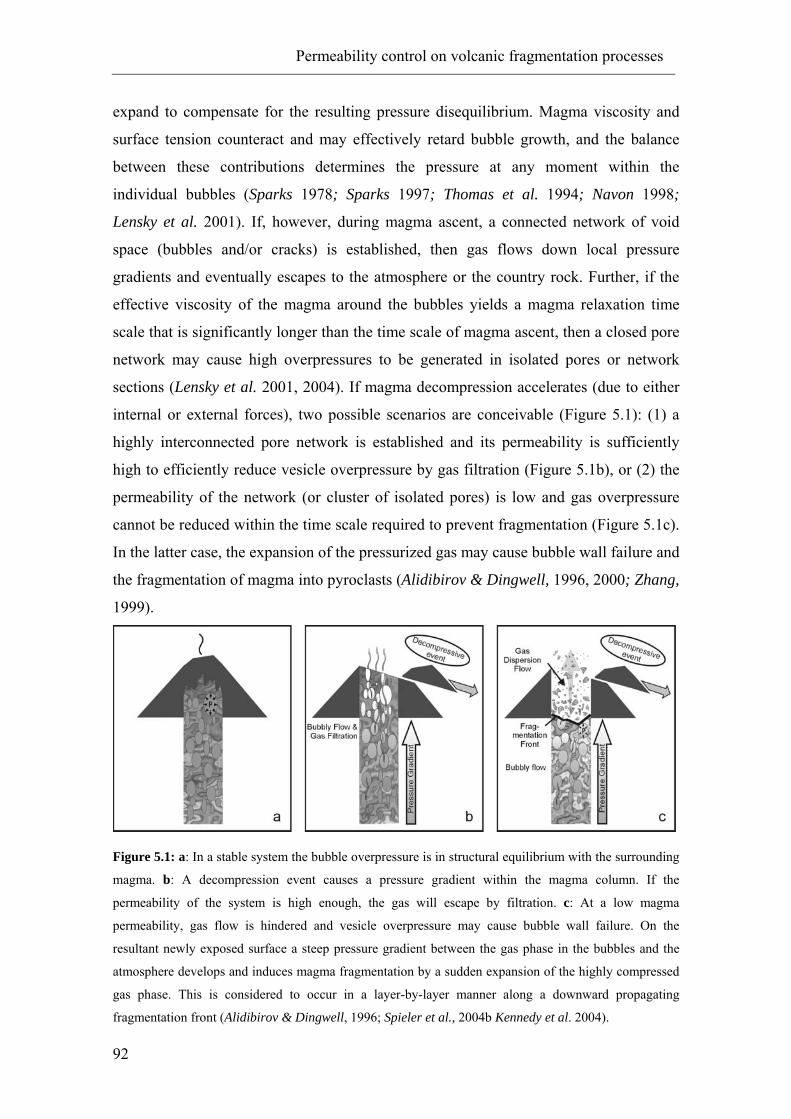
Permeability control on volcanic fragmentation processes
92
expand to compensate for the resulting pressure disequilibrium. Magma viscosity and
surface tension counteract and may effectively retard bubble growth, and the balance
between these contributions determines the pressure at any moment within the
individual bubbles (Sparks 1978; Sparks 1997; Thomas et al. 1994; Navon 1998;
Lensky et al. 2001). If, however, during magma ascent, a connected network of void
space (bubbles and/or cracks) is established, then gas flows down local pressure
gradients and eventually escapes to the atmosphere or the country rock. Further, if the
effective viscosity of the magma around the bubbles yields a magma relaxation time
scale that is significantly longer than the time scale of magma ascent, then a closed pore
network may cause high overpressures to be generated in isolated pores or network
sections (Lensky et al. 2001, 2004). If magma decompression accelerates (due to either
internal or external forces), two possible scenarios are conceivable (Figure 5.1): (1) a
highly interconnected pore network is established and its permeability is sufficiently
high to efficiently reduce vesicle overpressure by gas filtration (Figure 5.1b), or (2) the
permeability of the network (or cluster of isolated pores) is low and gas overpressure
cannot be reduced within the time scale required to prevent fragmentation (Figure 5.1c).
In the latter case, the expansion of the pressurized gas may cause bubble wall failure and
the fragmentation of magma into pyroclasts (Alidibirov & Dingwell, 1996, 2000; Zhang,
1999).
Figure 5.1: a: In a stable system the bubble overpressure is in structural equilibrium with the surrounding
magma. b: A decompression event causes a pressure gradient within the magma column. If the
permeability of the system is high enough, the gas will escape by filtration. c: At a low magma
permeability, gas flow is hindered and vesicle overpressure may cause bubble wall failure. On the
resultant newly exposed surface a steep pressure gradient between the gas phase in the bubbles and the
atmosphere develops and induces magma fragmentation by a sudden expansion of the highly compressed
gas phase. This is considered to occur in a layer-by-layer manner along a downward propagating
fragmentation front (Alidibirov & Dingwell, 1996; Spieler et al., 2004b Kennedy et al. 2004).
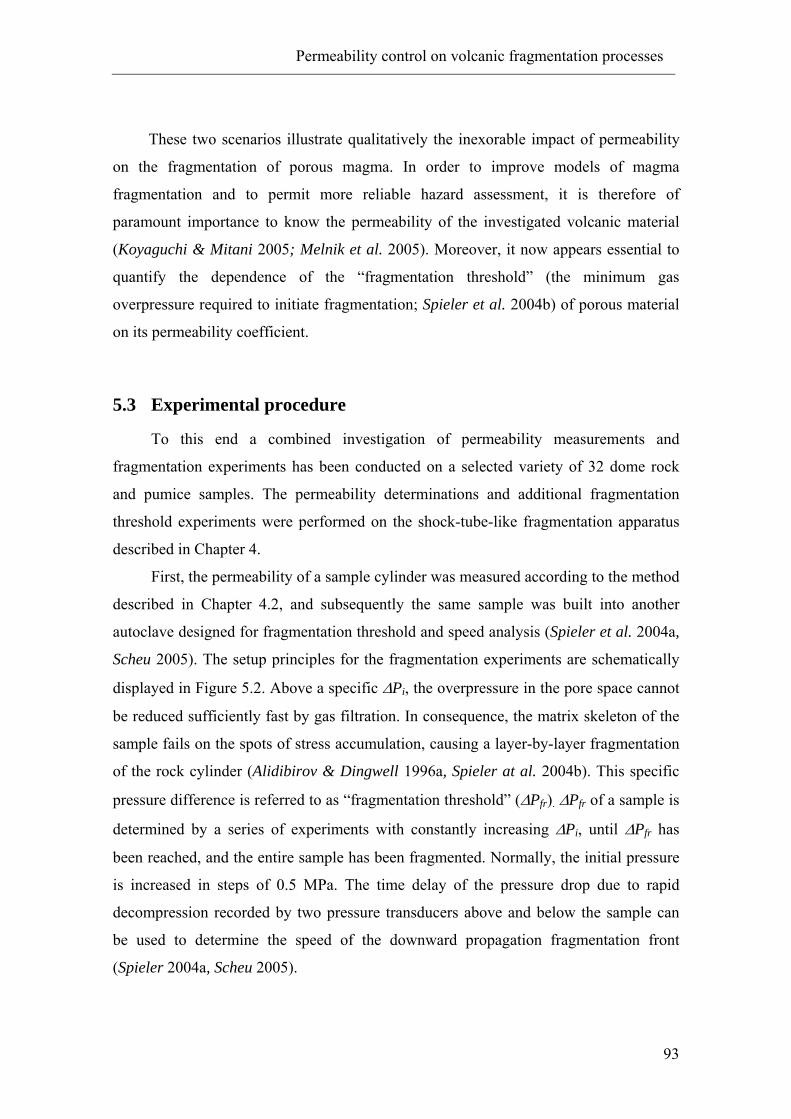
Permeability control on volcanic fragmentation processes
93
These two scenarios illustrate qualitatively the inexorable impact of permeability
on the fragmentation of porous magma. In order to improve models of magma
fragmentation and to permit more reliable hazard assessment, it is therefore of
paramount importance to know the permeability of the investigated volcanic material
(Koyaguchi & Mitani 2005; Melnik et al. 2005). Moreover, it now appears essential to
quantify the dependence of the “fragmentation threshold” (the minimum gas
overpressure required to initiate fragmentation; Spieler et al. 2004b) of porous material
on its permeability coefficient.
5.3 Experimental procedure
To this end a combined investigation of permeability measurements and
fragmentation experiments has been conducted on a selected variety of 32 dome rock
and pumice samples. The permeability determinations and additional fragmentation
threshold experiments were performed on the shock-tube-like fragmentation apparatus
described in Chapter 4.
First, the permeability of a sample cylinder was measured according to the method
described in Chapter 4.2, and subsequently the same sample was built into another
autoclave designed for fragmentation threshold and speed analysis (Spieler et al. 2004a,
Scheu 2005). The setup principles for the fragmentation experiments are schematically
displayed in Figure 5.2. Above a specific ∆Pi, the overpressure in the pore space cannot
be reduced sufficiently fast by gas filtration. In consequence, the matrix skeleton of the
sample fails on the spots of stress accumulation, causing a layer-by-layer fragmentation
of the rock cylinder (Alidibirov & Dingwell 1996a, Spieler at al. 2004b). This specific
pressure difference is referred to as “fragmentation threshold” (∆Pfr). ∆Pfr of a sample is
determined by a series of experiments with constantly increasing ∆Pi, until ∆Pfr has
been reached, and the entire sample has been fragmented. Normally, the initial pressure
is increased in steps of 0.5 MPa. The time delay of the pressure drop due to rapid
decompression recorded by two pressure transducers above and below the sample can
be used to determine the speed of the downward propagation fragmentation front
(Spieler 2004a, Scheu 2005).
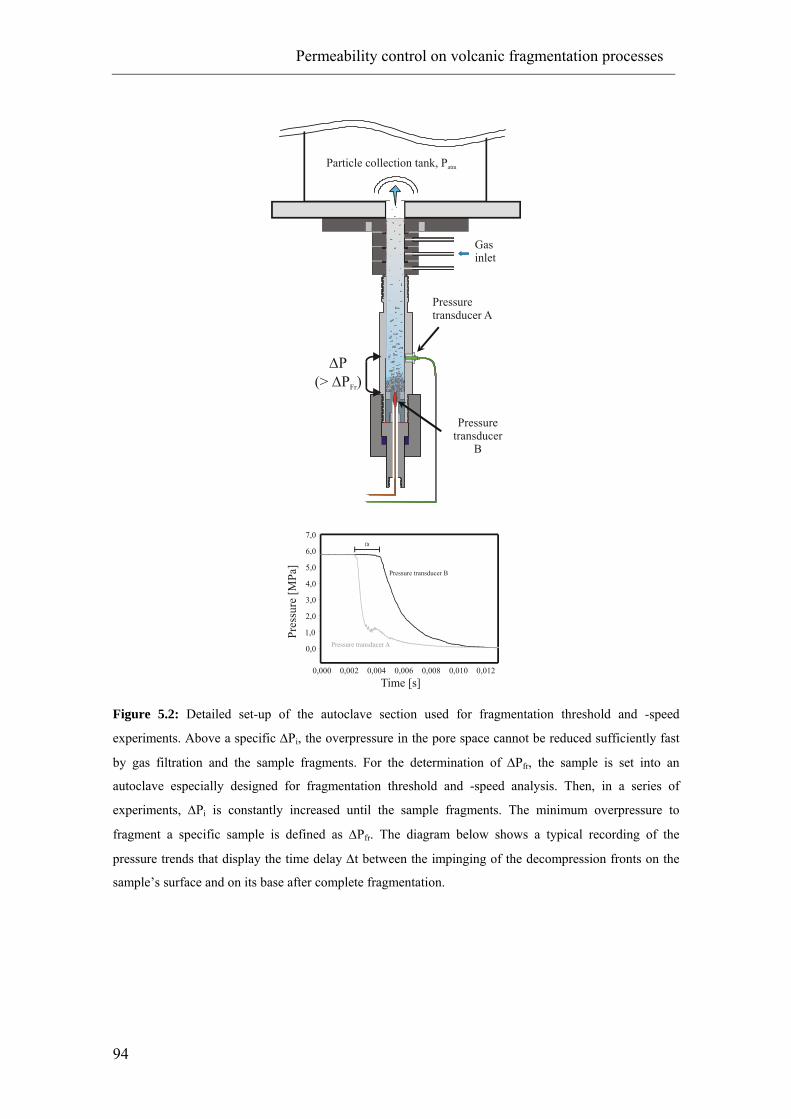
Permeability control on volcanic fragmentation processes
94
Pressure transducer A
Pressure transducer
B
Gas inlet
Particle collection tank, Patm
∆∆P
(> P )Fr
Time [s]0,000 0,002 0,004 0,006 0,008 0,010 0,012
0,0
1,0
2,0
3,0
4,0
5,0
6,0
7,0Dt
Pres
sure
[MPa
]
Pressure transducer A
Pressure transducer B
Figure 5.2: Detailed set-up of the autoclave section used for fragmentation threshold and -speed
experiments. Above a specific ∆Pi, the overpressure in the pore space cannot be reduced sufficiently fast
by gas filtration and the sample fragments. For the determination of ∆Pfr, the sample is set into an
autoclave especially designed for fragmentation threshold and -speed analysis. Then, in a series of
experiments, ∆Pi is constantly increased until the sample fragments. The minimum overpressure to
fragment a specific sample is defined as ∆Pfr. The diagram below shows a typical recording of the
pressure trends that display the time delay ∆t between the impinging of the decompression fronts on the
sample’s surface and on its base after complete fragmentation.
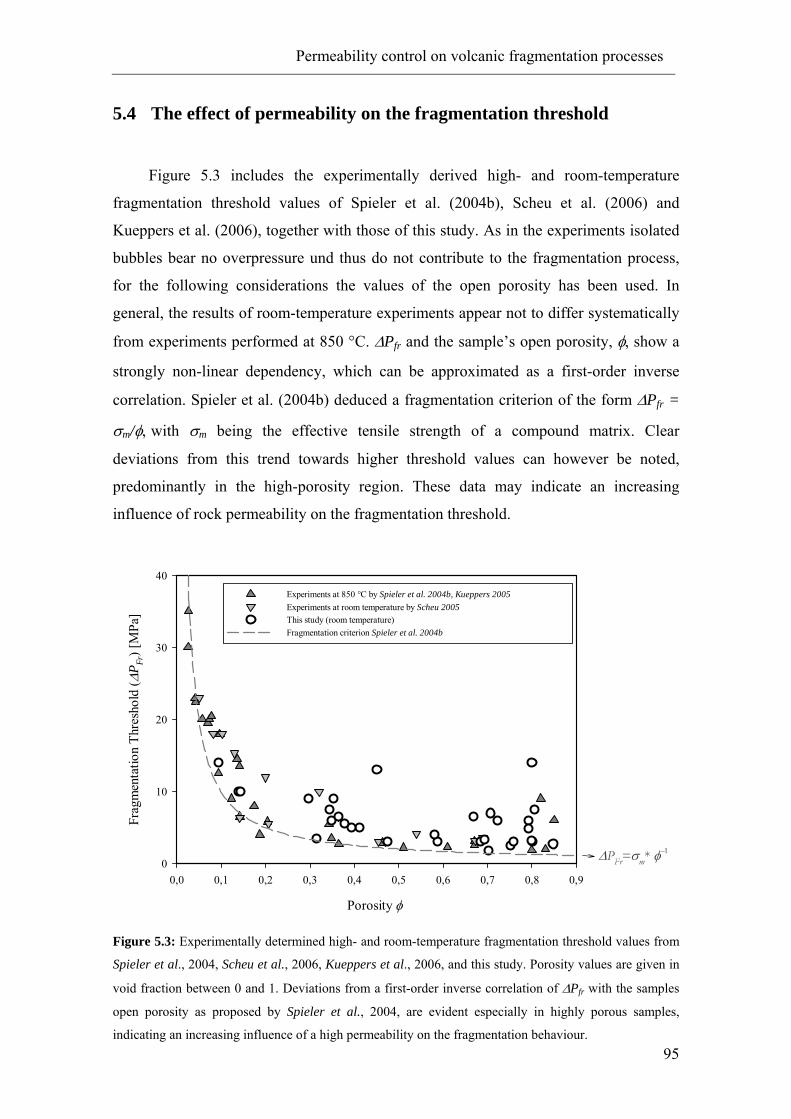
Permeability control on volcanic fragmentation processes
95
5.4 The effect of permeability on the fragmentation threshold
Figure 5.3 includes the experimentally derived high- and room-temperature
fragmentation threshold values of Spieler et al. (2004b), Scheu et al. (2006) and
Kueppers et al. (2006), together with those of this study. As in the experiments isolated
bubbles bear no overpressure und thus do not contribute to the fragmentation process,
for the following considerations the values of the open porosity has been used. In
general, the results of room-temperature experiments appear not to differ systematically
from experiments performed at 850 °C. ∆Pfr and the sample’s open porosity, φ, show a
strongly non-linear dependency, which can be approximated as a first-order inverse
correlation. Spieler et al. (2004b) deduced a fragmentation criterion of the form ∆Pfr =
σm/φ, with σm being the effective tensile strength of a compound matrix. Clear
deviations from this trend towards higher threshold values can however be noted,
predominantly in the high-porosity region. These data may indicate an increasing
influence of rock permeability on the fragmentation threshold.
Porosity φ
0,0 0,1 0,2 0,3 0,4 0,5 0,6 0,7 0,8 0,9
Frag
men
tatio
n Th
resh
old
( ∆P Fr
) [M
Pa]
0
10
20
30
40Experiments at 850 °C by Spieler et al. 2004b, Kueppers 2005Experiments at room temperature by Scheu 2005This study (room temperature)Fragmentation criterion Spieler et al. 2004b
∆PFr=σm* φ−1
Figure 5.3: Experimentally determined high- and room-temperature fragmentation threshold values from
Spieler et al., 2004, Scheu et al., 2006, Kueppers et al., 2006, and this study. Porosity values are given in
void fraction between 0 and 1. Deviations from a first-order inverse correlation of ∆Pfr with the samples
open porosity as proposed by Spieler et al., 2004, are evident especially in highly porous samples,
indicating an increasing influence of a high permeability on the fragmentation behaviour.

Permeability control on volcanic fragmentation processes
96
In Figure 5.4 the linear permeability values of the samples used for the combined
permeability-fragmentation study are highlighted. The comparison of Figure 5.3 and
Figure 5.4 reveals conspicuous accordance in the porosity intervals 0.35-0.45 and 0.70-
0.80. In both cases exceptionally high amplitudes of permeability values of almost four
orders of magnitude coincides with exceptional deviations of the fragmentation
threshold pressures from a first-order inverse trend. This analogy foreshadows the
influence of the rock permeability on the fragmentation threshold. The experimental
results of the porosity, permeability and fragmentation threshold determinations are
compiled in Table 5.1.
Porosity φ
0,0 0,1 0,2 0,3 0,4 0,5 0,6 0,7 0,8 0,9
Perm
eabi
lity
k [m
2 ]
1e-15
1e-14
1e-13
1e-12
1e-11
1e-10
1e-9Dome rocks Explosive activity products
Figure 5.4: Permeability-porosity relations of the samples used for permeability-fragmentation
experiments (highlighted with a black ring). Porosity values are given in void fraction between 0 and 1.

Permeability control on volcanic fragmentation processes
97
Table 5.1: Results of combined porosity, permeability, and fragmentation threshold determinations for 22 pumice/ breadcrust bomb samples and 10 dome rock samples
Sample Open porosity φ Permeability k [m2] Fragmentation
threshold ∆PFr [MPa]
Energy Density at
∆PFr
[10-6J/m’] (= ∆PFr*φ)
Explosive activity
products
Lipari B03 0.587 5.96e-13 3.0 1.7595
Lipari B04 0.581 1.66e-13 4.0 2.3252
Lipari C02 0.694 4.98e-13 3.3 2.2895
Lipari E01 0.393 8.90e-14 5.0 1.9660
Lipari E09 0.377 1.99e-14 5.5 2.0730
Lipari E20 0.364 2.20e-15 6.5 2.3633
Lipari F03 0.758 4.85e-13 3.0 2.2746
Unzen VUL02 0.475 1.47e-13 3.0 1.4247
Unzen BKB38 0.367 8.90e-14 4.1 1.5047
Campi Flegrei AMS 02 0.707 5.46e-12 7.0 4.9483
Campi Flegrei AMS 03 0.793 1.17e-11 6.0 4.7598
Campi Flegrei AMS 06 0.669 2.75e-12 6.5 4.3466
Campi Flegrei AMS 15 0.723 9.86e-12 6.0 4.3368
Campi Flegrei AMS 27 0.792 5.08e-12 4.8 3.8011
Montserrat 33 0.684 1.67e-12 3.0 2.0505
Krakatau RAK301 0.848 3.27e-12 2.7 2.2883
Krakatau tube pumice03 0.781 1.26e-10 14.0 11.2000
Santorini 01 0.752 1.35e-12 2.5 1.8793
Santorini 03 0.701 7.83e-14 1.8 1.2622
Santorini 05 0.798 7.13e-13 3.2 2.5549
Santorini 12 0.801 8.47e-13 3.0 2.4027
Stromboli biondo01 0.805 5.65e-11 7.5 6.0375
Dome rocks
Unzen 01 A17 0.050 4.35e-15 23.0 1.1592
Unzen 01 F18 0.343 9.99e-13 7.5 2.5748
Unzen 00 G18 0.412 4.50e-12 5.0 2.0590
Unzen 00 G52 0.349 3.41e-12 6.0 2.0958
Merapi A02 0.139 6.88e-14 10.0 1.3850
Merapi A03 0.143 1.35e-13 10.0 1.4250
Merapi B04 0.297 4.64e-13 9.0 2.6694
Merapi B12 0.353 2.91e-12 9.0 3.1770
Merapi C01 0.451 1.26e-11 13.0 5.8630
Augustine B102 0.094 4.24e-15 14.0 1.3174
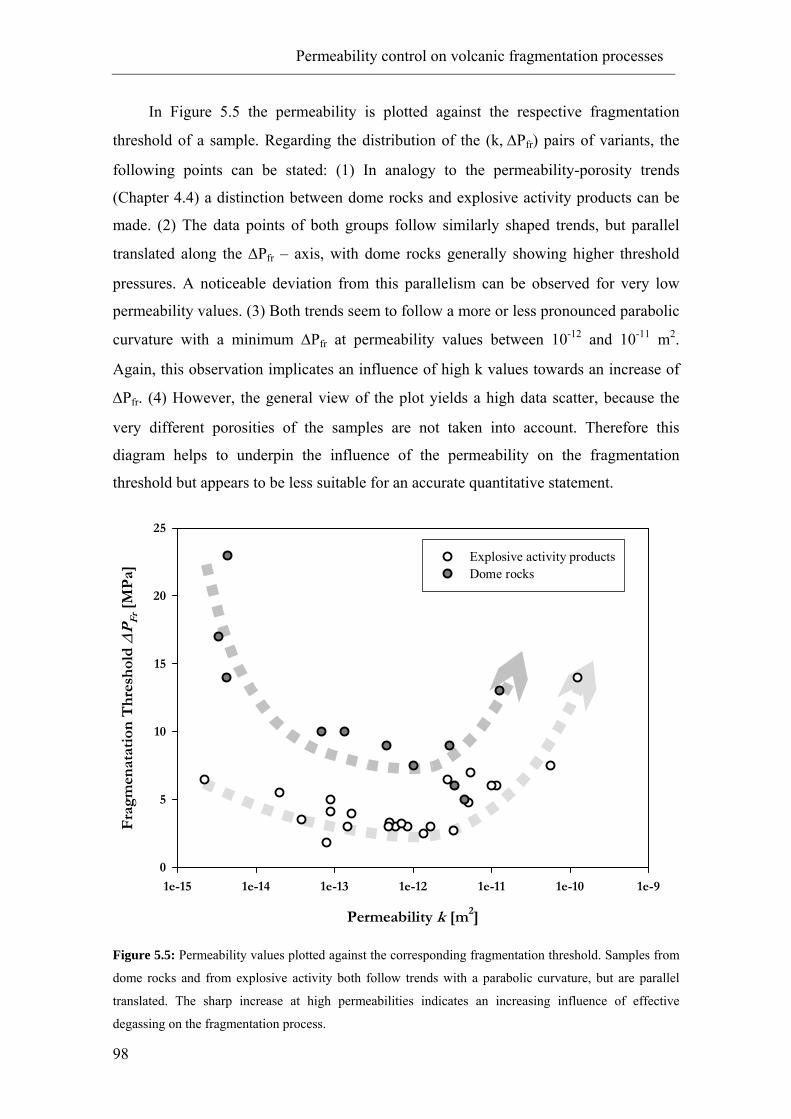
Permeability control on volcanic fragmentation processes
98
In Figure 5.5 the permeability is plotted against the respective fragmentation
threshold of a sample. Regarding the distribution of the (k, ∆Pfr) pairs of variants, the
following points can be stated: (1) In analogy to the permeability-porosity trends
(Chapter 4.4) a distinction between dome rocks and explosive activity products can be
made. (2) The data points of both groups follow similarly shaped trends, but parallel
translated along the ∆Pfr – axis, with dome rocks generally showing higher threshold
pressures. A noticeable deviation from this parallelism can be observed for very low
permeability values. (3) Both trends seem to follow a more or less pronounced parabolic
curvature with a minimum ∆Pfr at permeability values between 10-12 and 10-11 m2.
Again, this observation implicates an influence of high k values towards an increase of
∆Pfr. (4) However, the general view of the plot yields a high data scatter, because the
very different porosities of the samples are not taken into account. Therefore this
diagram helps to underpin the influence of the permeability on the fragmentation
threshold but appears to be less suitable for an accurate quantitative statement.
Permeability k [m2]
1e-15 1e-14 1e-13 1e-12 1e-11 1e-10 1e-9
Fra
gmen
atat
ion
Th
resh
old
∆P
Fr [
MP
a]
0
5
10
15
20
25
Explosive activity productsDome rocks
Figure 5.5: Permeability values plotted against the corresponding fragmentation threshold. Samples from
dome rocks and from explosive activity both follow trends with a parabolic curvature, but are parallel
translated. The sharp increase at high permeabilities indicates an increasing influence of effective
degassing on the fragmentation process.
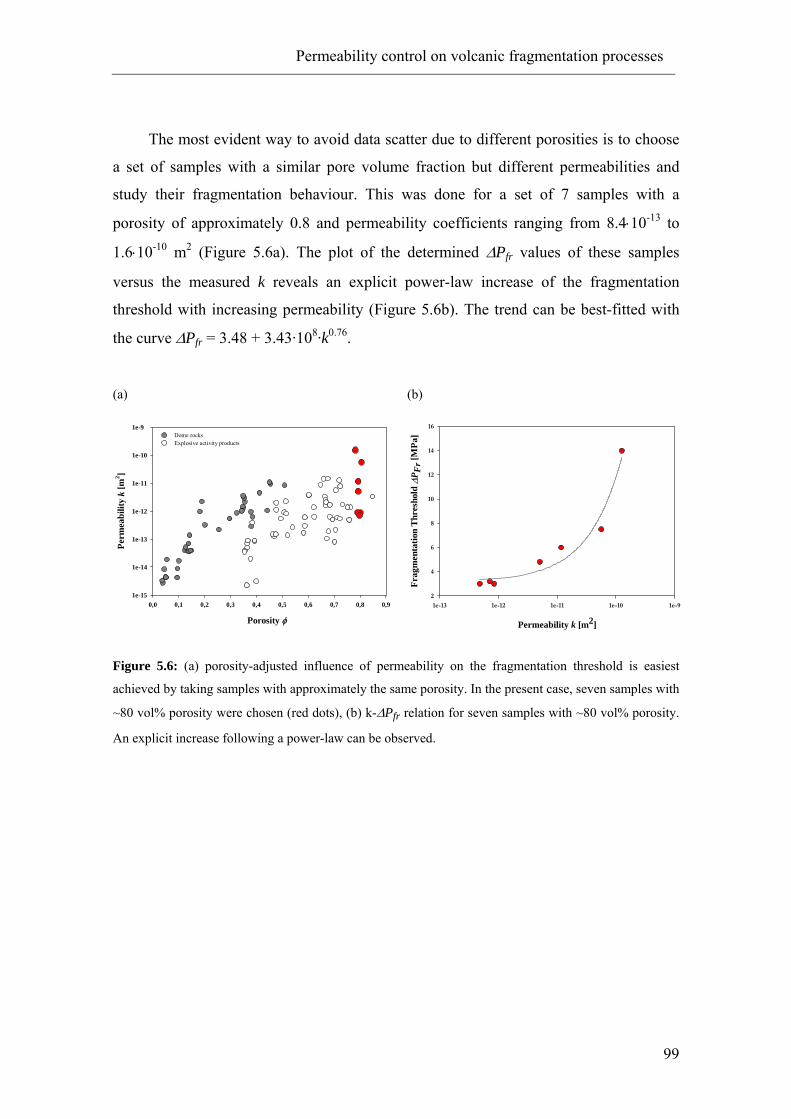
Permeability control on volcanic fragmentation processes
99
The most evident way to avoid data scatter due to different porosities is to choose
a set of samples with a similar pore volume fraction but different permeabilities and
study their fragmentation behaviour. This was done for a set of 7 samples with a
porosity of approximately 0.8 and permeability coefficients ranging from 8.4⋅10-13 to
1.6⋅10-10 m2 (Figure 5.6a). The plot of the determined ∆Pfr values of these samples
versus the measured k reveals an explicit power-law increase of the fragmentation
threshold with increasing permeability (Figure 5.6b). The trend can be best-fitted with
the curve ∆Pfr = 3.48 + 3.43·108·k0.76.
(a)
Porosity φ
0,0 0,1 0,2 0,3 0,4 0,5 0,6 0,7 0,8 0,9
Perm
eabi
lity
k [m
2 ]
1e-15
1e-14
1e-13
1e-12
1e-11
1e-10
1e-9Dome rocks Explosive activity products
(b)
Permeability k [m2]
1e-13 1e-12 1e-11 1e-10 1e-9
Frag
men
tatio
n T
hres
hold
∆P F
r [M
Pa]
2
4
6
8
10
12
14
16
Figure 5.6: (a) porosity-adjusted influence of permeability on the fragmentation threshold is easiest
achieved by taking samples with approximately the same porosity. In the present case, seven samples with
~80 vol% porosity were chosen (red dots), (b) k-∆Pfr relation for seven samples with ~80 vol% porosity.
An explicit increase following a power-law can be observed.
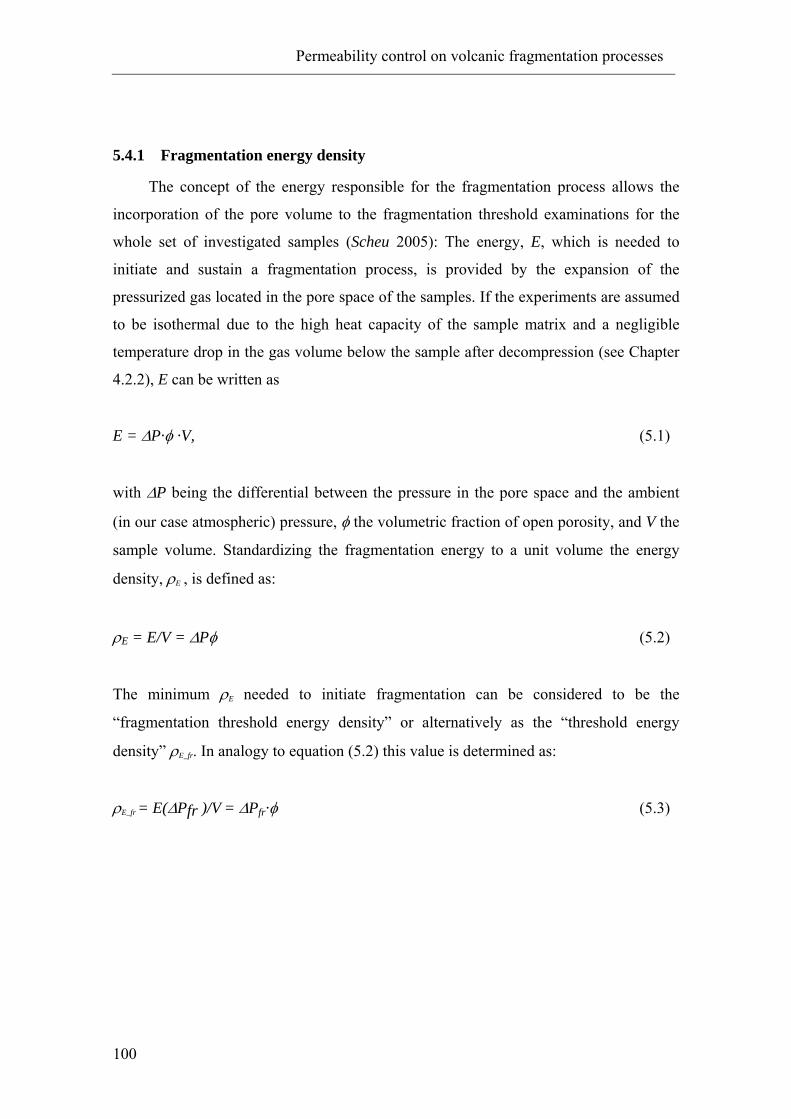
Permeability control on volcanic fragmentation processes
100
5.4.1 Fragmentation energy density
The concept of the energy responsible for the fragmentation process allows the
incorporation of the pore volume to the fragmentation threshold examinations for the
whole set of investigated samples (Scheu 2005): The energy, E, which is needed to
initiate and sustain a fragmentation process, is provided by the expansion of the
pressurized gas located in the pore space of the samples. If the experiments are assumed
to be isothermal due to the high heat capacity of the sample matrix and a negligible
temperature drop in the gas volume below the sample after decompression (see Chapter
4.2.2), E can be written as
E = ∆P·φ ·V, (5.1)
with ∆P being the differential between the pressure in the pore space and the ambient
(in our case atmospheric) pressure, φ the volumetric fraction of open porosity, and V the
sample volume. Standardizing the fragmentation energy to a unit volume the energy
density, ρE , is defined as:
ρE = E/V = ∆Pφ (5.2)
The minimum ρE needed to initiate fragmentation can be considered to be the
“fragmentation threshold energy density” or alternatively as the “threshold energy
density” ρE_fr. In analogy to equation (5.2) this value is determined as:
ρE_fr = E(∆Pfr )/V = ∆Pfr·φ (5.3)
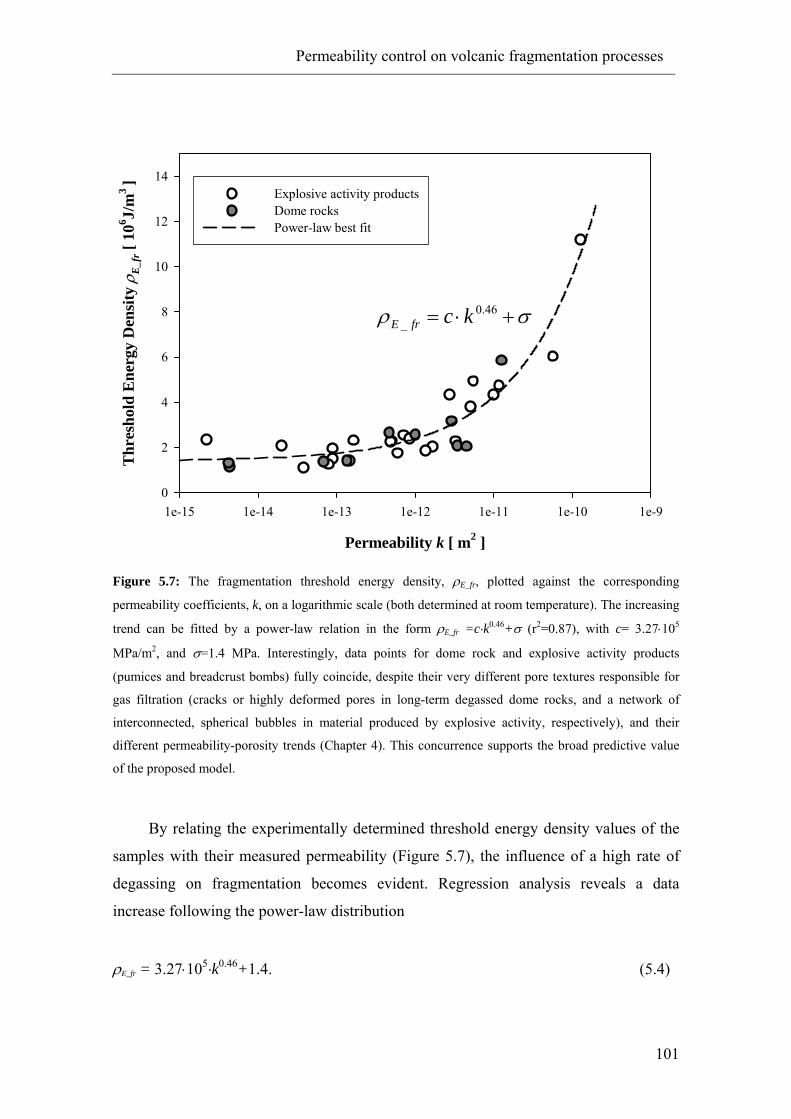
Permeability control on volcanic fragmentation processes
101
Permeability k [ m2 ]
1e-15 1e-14 1e-13 1e-12 1e-11 1e-10 1e-9
Thr
esho
ld E
nerg
y D
ensi
ty ρ
E_f
r [ 1
06 J/m
3 ]
0
2
4
6
8
10
12
14Explosive activity productsDome rocksPower-law best fit
σρ +⋅= 46.0_ kcfrE
Figure 5.7: The fragmentation threshold energy density, ρE_fr, plotted against the corresponding
permeability coefficients, k, on a logarithmic scale (both determined at room temperature). The increasing
trend can be fitted by a power-law relation in the form ρE_fr =c⋅k0.46+σ (r2=0.87), with c= 3.27⋅105
MPa/m2, and σ=1.4 MPa. Interestingly, data points for dome rock and explosive activity products
(pumices and breadcrust bombs) fully coincide, despite their very different pore textures responsible for
gas filtration (cracks or highly deformed pores in long-term degassed dome rocks, and a network of
interconnected, spherical bubbles in material produced by explosive activity, respectively), and their
different permeability-porosity trends (Chapter 4). This concurrence supports the broad predictive value
of the proposed model.
By relating the experimentally determined threshold energy density values of the
samples with their measured permeability (Figure 5.7), the influence of a high rate of
degassing on fragmentation becomes evident. Regression analysis reveals a data
increase following the power-law distribution
ρE_fr = 3.27⋅105⋅k0.46+1.4. (5.4)
Permeability control on volcanic fragmentation processes
102
By combining equations (5.3) and (5.4) a correlation of the fragmentation threshold with
the sample porosity and permeability is obtained:
∆Pfr = (c⋅k0.46+σ)⋅1/φ (5.5)
where c and σ are constants with the values 3.27⋅105 MPa/m2 and 1.4 MPa, respectively.
5.4.2 Implications
Previous definitions of the criterion required for magma fragmentation have
invoked either a range of porosity (Sparks 1978; Sparks et al. 1994; Thomas et al. 1994;
Gardner et al. 1996) or a combination of porosity and overpressure (Zhang 1999,
Spieler et al. 2004b). The equation (5.5) bears similarities to the empirically defined
criterion given by Spieler et al. (2004b). The comparison of the two equations strongly
suggests that the constant σ, used in this study, can be regarded as an averaged value of
the effective tensile strength of the samples matrix. The value of σ =1.4 MPa agrees
well with the values reported by Spieler et al. (2004b). In this way, equation (5.5)
represents an enhanced fragmentation criterion that relates the fragmentation threshold
pressure not only to the porosity, but also to the rock permeability.
The data distribution in Figure 5.7 indicates that at k-values around 10-12 m²
there is a notable change in the influence of permeability. For k < 10-12 m² the threshold
energy density is more or less constant. Consequently, the effect of permeability on the
fragmentation behaviour is minor and can be sufficiently explained by existing models.
For k > 10 -12 m² the threshold energy density increases sharply, suggesting that the
permeability is taking over control on the fragmentation process. Furthermore, it is
remarkable that the data in Figure 5.7 display a well defined trend with a relatively low
degree of scatter, despite the very different properties exhibited by the samples, such as
bulk chemistry, cristallinity, porosity, and tortuosity. As a result, it can be concluded
that the influence of these material properties on the fragmentation behaviour is minor
compared to that of the permeability.
The fit accuracy of the criterion proposed here with respect to the experimental
results is shown in Figure 5.8, and compared with results calculated with the
fragmentation criterion by Spieler et al. 2004b. The data distribution demonstrates that
the criterion incorporating the permeable gas flow is capable of predicting the
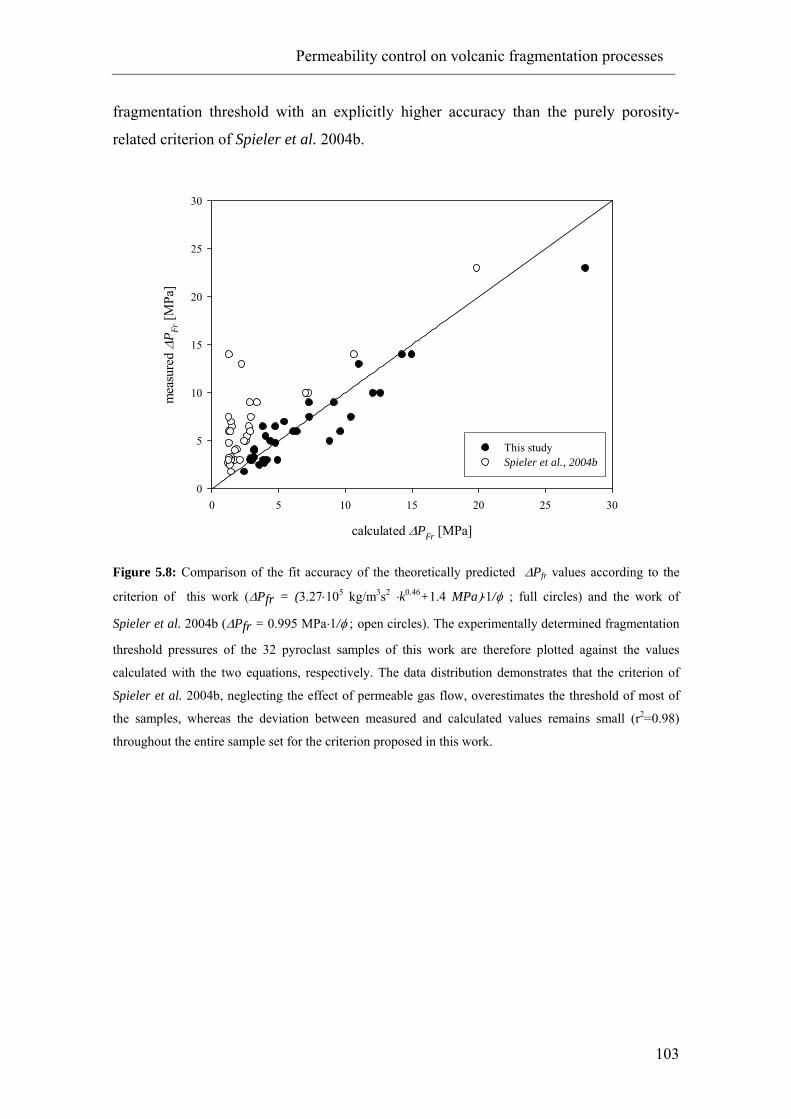
Permeability control on volcanic fragmentation processes
103
fragmentation threshold with an explicitly higher accuracy than the purely porosity-
related criterion of Spieler et al. 2004b.
calculated ∆PFr [MPa]
0 5 10 15 20 25 30
mea
sure
d ∆P
Fr [M
Pa]
0
5
10
15
20
25
30
This study Spieler et al., 2004b
Figure 5.8: Comparison of the fit accuracy of the theoretically predicted ∆Pfr values according to the
criterion of this work (∆Pfr = (3.27⋅105 kg/m3s2 ⋅k0.46+1.4 MPa)⋅1/φ ; full circles) and the work of
Spieler et al. 2004b (∆Pfr = 0.995 MPa⋅1/φ ; open circles). The experimentally determined fragmentation
threshold pressures of the 32 pyroclast samples of this work are therefore plotted against the values
calculated with the two equations, respectively. The data distribution demonstrates that the criterion of
Spieler et al. 2004b, neglecting the effect of permeable gas flow, overestimates the threshold of most of
the samples, whereas the deviation between measured and calculated values remains small (r2=0.98)
throughout the entire sample set for the criterion proposed in this work.
Summary and conclusions
104
6 Summary and conclusions
Porosity and permeability are both parameters which may have a considerable
impact on the characteristics of a volcanic eruption. Various processes, from magmatic
flow during ascent to the point of magmatic fragmentation during an explosive eruption
are influenced, and sometimes even controlled by the amount of volatiles trapped in a
magma’s pore space and by the efficiency of their escape. Detailed investigations of the
porosity of pyroclastic rocks and its relation to the gas permeability are therefore crucial
for the understanding of such processes and may provide an important database for
physical models. The combination of experimental work and field investigation
represents in this context an effective approach to obtain a statistically relevant amount
of data on the one hand, and, on the other hand, experimentally quantify the correlation
between different parameters.
For this study, density data of pyroclastic deposits from eight circum-pacific
volcanoes were recalculated to porosity values using the determined matrix density of
the corresponding rocks. The pyroclasts density was determined directly in the field
with a method based on the Archimedean principle; the matrix density was determined
in the laboratory using a He-Pycnometer. The comparison of the resulting porosity
distribution histograms allows (a) the investigation of local features related to
depositional mechanisms, if the distribution of single measurement points is evaluated,
and (b) statements about large scale coherencies regarding the eruptive style and the
explosivity of a volcano, if the compiled datasets of the volcanoes are compared.
The shape and the variance of the distribution curves, as well as the positions of
the porosity peak or mean porosity values are parameters that can be used for further
interpretation. The differences in the porosity distribution patterns allowed the
classification of the investigated volcanoes into three groups, corresponding to their
eruptive characteristics: (1) dome-building volcanoes with predominantly block-and-
ash-flow activity and occasional Vulcanian explosions (Merapi, Unzen, Colima), (2)
cryptodome-forming volcanoes with a subsequent lateral-blast eruption (Bezymianny,
Mount St. Helens), and (3) Subplinian to Plinian explosive eruptions (Krakatau, Kelut,
Augustine).
Summary and conclusions
105
Furthermore, possible coherencies between the mean porosity values of selected
eruptions and their explosivity, expressed in two different explosivity indexes, were
evaluated. The ‘Volcanic Explosivity Index’ (VEI), introduced by Newhall & Self
(1982), is mainly based on the volume of the erupted tephra, and shows a rough positive
correlation to the mean porosity of eruptive products. A qualitative enhancement of this
correlation, especially considering low-porosity, low-explosive deposits, was achieved
by using the measured porosity values to determine the index of the ‘Eruption
Magnitude’, introduced by Pyle 1995. Volcanoes with not only pure explosive
(Vulcanian and/or Plinian) activity were found to deviate systematically from this
correlation. Besides their relevance for the understanding and modeling of eruption
physics, the interpretation of porosity data may help to discriminate eruption
characteristics and explosivities also at historic and pre-historic eruption deposits.
The main focus of this work was the experimental investigation of the gas
permeability of volcanic rocks. In order to simulate degassing processes under strongly
transient conditions, the experiments were performed on a shock-tube like apparatus.
The permeability of a natural porous material depends on a complex mixture of physical
and textural parameters. Evidently, the volume fraction of the materials pore space, i.e.
its porosity, is one of the prominent factors controlling permeable gas flow. But, as a
high scatter of measured permeability values for a given porosity indicates, it seems that
parameters like vesicle sizes, vesicle size distribution, vesicle shape, the degree of
interconnectivity et cetera may likewise influence filtration properties. Therefore it is
almost impossible to predict the permeability development of natural material with
theoretical cause-and-effect relations, and experimental work in this field is essential.
By performing more than 360 gas filtration experiments on 112 different samples from
13 volcanoes, a comprehensive permeability and porosity database was created with this
study, giving rise to profound empirical as well as quantitative investigations.
The dependency of porosity and permeability of volcanic rocks was found to
follow two different, but overlapping trends, according to the geometries of the gas-
flow providing pore-space: at low porosities (i.e. long-term degassed dome rocks), gas
escape occurs predominantly through microcracks or elongated micropores and
therefore could be described by simplified forms of capillary (Kozeny-Carman
relations) and fracture flow models. At higher porosities, the influence of vesicles
becomes progressively stronger as they form an increasingly connected network.
Summary and conclusions
106
Therefore, a model based on the percolation theory of fully penetrable spheres was
used, as a first approximation, to describe the permeability-porosity trend.
To investigate possible influences of high temperatures on the degassing
properties of volcanic rocks, a measuring method that allowed permeability experiments
at temperatures up to 750 °C was developed and tested. A sealing coat of compacted
NaCl, which was, if required, further compressed during the high-T experiment, was
found to be the most promising approach to avoid gas leaking due to different thermal
expansivities of the materials involved. The results of three dome rock samples showed
distinct lower gas filtration rates at high temperatures. As this may, for the largest part,
be attributed to changed gas properties at high temperature, the obtained permeability
values must be corrected for the enhanced gas viscosity. The corrected permeability
values of the samples were higher than those obtained at room temperature, possibly
caused by thermal expansion of the pores. Since, however, compressional forces of the
salt coating upon the sample cylinder may lower the permeability particularly of highly
fractured rocks to a not quantifyable degree, these results must be interpreted
accordingly and seen under certain restrictions.
Comparison of the permeability values before and after the heating process
revealed that no permanent structural changes in the pore network occurred. This was
confirmed by a 5h-experiment on a trachytic sample, with permeability tests in an
interval of 60 minutes.
The influence of permeability on magmatic fragmentation is of special interest for
the modelling of eruptive processes. In particular the ‘fragmentation threshold’, i.e. the
physical conditions, at which magma is no longer able to reduce gas overpressure by
filtration and fragments, represents an important boundary condition for explosive
eruption models. Former studies defined this threshold to depend on either the porosity
of the magma, or a combination of porosity and overpressure. The experimental results
of this work, however, reveal that, in addition to porosity and applied overpressure, the
permeability strongly influences the fragmentation threshold. By quantifying this
influence in a simple, analytical equation, these results will provide a valuable tool for
physical models of eruption mechanics.
Bibliography
107
7 Bibliography
Alidibirov M & Dingwell DB (1996a) Magma fragmentation by rapid decompression. Nature 380: 146-148
Alidibirov M & Dingwell DB (1996b) An experimental facility for the investigation of
magma fragmentation by rapid decompression. Bul. Volcanol 58: 411-416 Alidibirov M, Dingwell DB (2000), Three fragmentation mechanisms for highly viscous
magma under rapid decompression, J Volcanol Geotherm Res 100: 413–421 Andreastuti SD, Alloway BV, Smith IEM (2000) A detailed tephrostratigraphic
framework at Merapi volcano, Central Java, Indonesia: implications for eruption predictions and hazard assessment. J Volcanol Geotherm Res 100: 51-67
Belikov BP, Zalesskii BV, Rozanov YA, Sanina EA, Timchenko IP (1964) Methods of
studying the physicomechanical properties of rocks. In: Zalesskii BV (ed.) Physical and mechanical properties of rocks. Izdatel’stvo Nauka, Moskau, 1-58
Belousov A (1996) Deposits of the 30 March 1956 directed blast at Bezymianny
volcano, Kamchatka, Russia. Bull Volcanol 57: 649-662 Blower JD (2001a) Factors controlling permeability-porosity relationships in magma.
Bull Volcanol 63: 497-504 Blower JD (2001b) A three-dimensional network model of permeability in vesicular
material. Comp Geosci 7: 115-119 Bogoyavlenskaya GY, Braitseva OA, Melekestsev IV, Maksimov AP, Ivanov BV
(1991) Bezymianny Volcano. In: Fedotov SA, Masurenkov YuP (eds) Active volcanoes of Kamchatka, v. 1. Nauka, Moscow, pp 166-197
Brace WF, Walsh JB, Frangos WT (1968) Permeability of Granite under High
Pressure. J Geophys Res 73: 2225-2236 Bourdier J-L, Pratomo I, Thouret J-C, Boudon G, Vincent PM (1997) Observations,
stratigraphy and eruptive processes of the 1990 eruption of Kelut volcano, Indonesia. J Volc Geotherm Res 79: 181-203
Burgisser A, Gardner JE (2005) Experimental constraints on degassing and
permeability in volcanic conduit flow. Bull Volcanol 67: 42-56
Bibliography
108
Carman PC (1956) Flow of Gases Through Porous Media. Academic Press, New York, pp 1-182
Cashman KV, Sturtervant B, Papale P, Navon O (2000) Magmatic fragmentation. In:
Sigurdsson H (ed) Encyclopedia of Volcanoes. Academic Press, London, pp 421-430
Darcy HPG (1856) Les Fontaines Publique de la Ville de Dijon. Victor Dalmont, Paris,
pp 1-647 Dellino P, La Volpe L (1995) Fragmentation versus transportation mechanisms in the
pyroclastic sequence of Monte Pilato - Rocche Rosse (Lipari, Italy). J Volcanol Geotherm Res 64: 211-231
De Vita S, et al (1999) The Agnano-Monte Spina eruption (4100 years BP) in the
restless Campi Flegrei caldera (Italy). J Volcanol Geotherm Res 123: 269-301 Dingwell DB (1996) Volcanic dilemma: flow or blow? Science 273: 1054-1055 Dingwell DB (1998a) Magma degassing and fragmentation. Recent experimental
advances. In: Freundt A, Rosi M (eds) From Magma to Tephra. Modelling physical processes of explosive volcanic eruptions. Elsevier, Amsterdam, pp 1-23
Dingwell DB (1998b) Recent experimental progress in the physical description of
silicic magma relevant to explosive volcanism. In: Gilbert JS, Sparks RSJ (eds) The physics of Explosive Volcanic Eruptions. Geological Society, London, Special Publications 145, 9-26.
Doyen PM (1988) Permeability, conductivity, and pore geometry of sandstone. J
Geophys Res 93: 7729-7740 Druitt TH, Mellors RA, Pyle DM, Sparks RSJ (1989) Explosive volcanism on
Santorini, Greece. Geol Mag 126: 95-126 Druitt TH, Edwards L, Mellors RM, Pyle DM, Sparks RSJ, Lanphere M, Davies M,
Barreirio B (1999) Santorini volcano. Geol Soc London Mem 19: 1-165 Druitt TH, et al. (2002) Episodes of cyclic vulcanian explosive activity with fountain
collapse at Soufrière Hills Volcano, Montserrat. In: Druitt TH, Kokelaar BP (eds) The Eruption of Soufrière Hills Volcano, Montserrat, from 1995 to 1999. Geol Soc Lond, Memoirs 21, pp 281-306
Dullien FAL (1979) Porous Media ─ Fluid Transport and Pore Structure. Academic
Press, San Diego, pp 1-396 Eichelberger JC, Carrigan CR, Westrich HR, Price RH (1986) Non-explosive silicic
volcanism. Nature 323: 598-602 Enck FD, Dommel JG (1965) Behaviour of the Thermal Expansion of NaCl at Elevated
Temperatures. J Appl Phys 36: 839-844

Bibliography
109
Feng S, Halperin HI, Sen PN (1987) Transport properties of continuum systems near
the percolation threshold. Phys Rev B 35: 197-214 Francalanci L, Tommasini S, Conticelli S (2004) The volcanic activity of Stromboli in
the 1906-1998 AD period: mineralogical, geochemical and isotope data relevant to the understanding of the plumbing system. J Volc Geotherm Res 131: 179-211
Francis P, Oppenheimer C (2004) Volcanoes, 2nd edition. Oxford University Press,
Oxford, pp 1-521 Gardner JE, Thomas RME, Jaupart C, Tait S (1996) Fragmentation of magma during
Plinian volcanic eruptions. Bull Volcanol 58: 144-162 Gertisser R, Keller J (2003) Temporal variations in magma composition at Merapi
Volcano (Central Java, Indonesia): magmatic cycles during the past 2000 years of explosive activity. J Volcanol Geotherm Res 123: 1-23
Getahun A, Reed MH, Symonds R (1996) Mount St. Augustine volcano fumarole wall
rock alteration: mineralogy, zoning, composition and numerical models of its formation process. J Volcanol Geotherm Res 71: 73-107
Gilbert JS, Sparks RSJ (1998) Future research directions on the physics of explosive
volcanic eruptions. In: Gilbert JS, Sparks RSJ (eds) The physics of Explosive Volcanic Eruptions. Geological Society, London, Special Publications 145, 9-26
Gioncada A, Mazzuoli R, Bisson M, Pareschi MT (2003) Petrology of volcanic
products younger than 42 ka on the Lipari-Volcano complex (Aeolian Islands, Italy): an example of volcanism controlled by tectonics. J Volcanol Geotherm Res 122: 191-220
Gonnermann HM, Manga M (2003) Explosive volcanism may not be an inevitable
consequence of magma fragmentation. Nature 426: 432-435 Hammer JE, Cashman KV, Hoblitt RP, Newman S (1999) Degassing and microlite
crystallization during pre-climactic events of the 1991 eruption of Mt. Pinatubo, Philippines. Bull Volcanol 60: 355-380
Harford CL, Sparks RSJ, Fallick AE (2003) Degassing at the Soufriere Hills Volcano,
Montserrat, recorded in matrix glass compositions J Petrology 44: 1503–1523 Hoblitt RP, Harmon RS (1993) Bimodal Density Distribution of Cryptodome Dacite
from the 1980 Eruption of Mount St. Helens, Washington. Bull Volcanol 55: 421-437
Hoblitt RP, Wolfe EW, Scott WE, Couchman MR, Pallister JS, Javier D (1996) The
preclimactic eruptions of Mount Pinatubo, June 1991. In: Newhall CG, Punongbayan RS (eds) Fire and Mud: Eruptions and Lahars of Mount
Bibliography
110
Pinatubo, Philippines. Quezon City, Philippines: Philippine Inst Volc Seism, and Seattle: Univ Wash Press, pp 457-511
Horwell CJ, Brana LP, Sparks RSJ, Murphy MD, Hards VL (2001) A geochemical
investigation of fragmentation and physical fractionation in pyroclastic flows from the Soufrière Hills Volcano, Montserrat. J Volcanol Geotherm Res 109: 247–262
Houghton BF & Wilson CJN (1989) A vesicularity index for pyroclastic deposits. Bull
Volcanol 51: 451-462 Ichihara M, Rittel D, Sturtevant B (2002) Fragmentation of a porous viscoelastic
material: implications to magma fragmentation. J Geophys Res 107, doi:10.1029/2001JB000591
Innocentini MDM, Pardo ARF, Pandolfelli VC (2000) Pressure–Decay Technique for
Evaluating the Permeability of Highly Dense Refractories. J Am Ceram Soc 83(1): 220 -222
Jaupart C, Allegre CJ (1991) Eruption rate, gas content and instabilities of eruption
regime in silicic volcanoes. Earth Planet Sci Lett 102: 413-429 Jaupart C (1998) Gas loss from magma through conduit walls during eruption. In:
Gilbert JS, Sparks RSJ (eds) The physics of Explosive Volcanic Eruptions. Geological Society, London, Special Publications 145, 73-90
Johnson DA (1979) Onset of volcanism at Augustine Volcano, Lower Cook Inlet. U.S.
Geol Surv Circ 804B: 78-80 Johnson DL, Koplik J, Schwartz LM (1986) New pore-size parameter characterizing:
transport in porous media. Phys Rev Lett 20, 2564-2567 Kaminsky E, Jaupart C (1997) Expansion and quenching of vesicular magma fragments
in Plinian eruptions. J Geophys Res 102: 12203-12817 Katz AJ, Thompson AH (1986) Quantitative prediction of permeability in porous rock.
Phys Rev B 34: 8179-8181 Kennedy B, Spieler O, Scheu B, Kueppers U, Taddeucci J, Dingwell DB (2005)
Conduit implosion during Vulcanian eruptions. Geology 33: 581-584 Klug C, Cashman KV (1996) Permeability development in vesiculating magmas ─
implications for fragmentation. Bull Volcanol 58: 87-100 Koyaguchi T, Mitani NK (2005) A theoretical model for fragmentation of viscous
bubbly magmas in shock tubes. J Geophysys Res 110: doi:10.1029/2004JB003513
Kozeny J (1927) Über kapillare Leitung des Wassers im Boden. Sitzungsber. Akad.
Wiss. Wien 136: 271-306

Bibliography
111
Kueppers U (2005) Nature and efficiency of pyroclast generation from porous magma: Insights from field investigations and laboratory experiments. PhD thesis, Ludwig-Maximilians-Univeristät München, pp. 1-104
Kueppers U, Scheu B, Spieler O, Dingwell DB (2005) Field-based density
measurements as tool to identify pre-eruption dome structure: set-up and first results from Unzen volcano, Japan. J Volcanol Geotherm Res 141: 65-75
Kueppers U, Scheu B, Spieler O, Dingwell DB (2006) Fragmentation efficiency of
explosive volcanic eruptions: A study of experimentally generated pyroclasts. J Volcanol Geotherm Res 153: 125-135
Lamb SH (1945) Hydrodynamics, 6th ed. Dover, New York, pp 1-738 Landau LD, Lifshitz EM (1980) Course of Theoretical Physics, Vol. 5, Statistical
Physics, 3rd edition. Pergamon, Oxford. Langlois WE (1964) Slow Viscous Flow. MacMillan, New York, pp 1-229 Le Bas MJ, LeMaitre RW, Streckeisen A, Zanettin B (1986) A chemical classification
of volcanic rocks based on the total alkali-silica diagram. J Petrol 27: 745-750 Lensky NG, Lyakhovsky V, Navon O (2001) Radial variations of melt viscosity around
growing bubbles and gas overpressure in vesiculating magmas. Earth Planet Sci Lett 186: 1-6
Lensky NG, Navon O, Lyakhovsky V (2004) Bubble growth during decompression of
magma: experimental and theoretical investigation. J Volcanol Geotherm Res 129: 7-22
Liang Y, Price JD, Wark DA, Watson EB (2001) Nonlinear pressure diffusion in a
porous medium: Approximate solutions with applications to permeability measurements using transient pulse-decay method. J Geophys Res. 106: 529-535
Luhr JF (2002) Petrology and geochemistry of the 1991 and 1998-1999 lava flows from
Volcán de Colima, Mexico: implications for the end of the current eruptive cycle. J Volcanol Geotherm Res 117: 169-194
Lyakhovsky V, Hurwitz S, Navon O (1996) Bubble growth in rhyolitic melts:
experimental and numerical investigation. Bull Volcanol 58: 19-32 Mader HM, Manga M, Koyaguchi T (2004) The role of laboratory experiments in
volcanology. J Volcanol Geotherm Res 129: 1-5 Mandeville CW, Carey S, Sigurdsson H (1996) Magma mixing, fractional
crystallization and volatile degassing during the 1883 eruption of Krakatau volcano, Indonesia. J Volcanol Geotherm Res 74: 243-274
Mason BG, Pyle DM, Oppenheimer C (2004) The size and frequency of the largest
explosive eruptions on Earth. Bull Volcanol 66: 735-748

Bibliography
112
Melnik O (2000) Dynamics of two-phase conduit flow of high-viscosity gas-saturated
magma: large variations of sustained explosive eruption intensity. Bull Volcanol 62: 153-170
Melnik O, Sparks RSJ (2002) Dynamics of magma ascent and lava extrusion at
Soufrière Hills Volcano, Montserrat. In: Druitt TH, Kokelaar BP (eds) The eruption of Soufrière Hills Volcano, Montserrat, from 1995 to 1999. Geol Soc Lond, Memoirs 21, pp 153-171
Melnik O, Sparks RSJ (2004) Controls on conduit magma flow dynamics during lava-
dome building eruptions. J Geophys Res 110, B022, doi:10.1029/2004JB003183: 1-21
Melnik O, Barmin AA, Sparks RSJ (2005) Dynamics of magma flow inside volcanic
conduits with bubble overpressure buildup and gas loss through permeable magma. J Vulcanol Geotherm Res 143: 53-68
Mukhopadhyay S, Sahimi M (1994) Scaling behaviour of permeability and
conductivity anisotropy near the percolation threshold. J Statist Phys 74 (5-6): 1301-1308
Murphy MD, Sparks RSJ, Barclay J, Carroll MR, Brewer TS (2000) Remobilization of
andesite magma by intrusion of mafic magma at the Soufrière Hills Volcano, Montserrat, West Indies. J Petrol 41: 21–42
Nakada S, Motomura Y (1999) Petrology of the 1990-1995 eruption at Unzen: effusion
pulsation and groundmass crystallization. J Volcanol Geotherm Res 89: 173-196
Nakada S, Shimizu H, Ohta K (1999) Overview of the 1990-1995 eruption at Unzen
volcano. J Volcanol Geotherm Res 89: 1-22 Navon O, Lyakhovsky V (1998) Vesiculation processes in vesiculating magmas. In:
Gilbert JS, Sparks RSJ (eds) The physics of Explosive Volcanic Eruptions. Geological Society, London, Special Publications 145: 27-50
Navon O, Chekhmir A, Lyakhovsky V (1998) Bubble growth in highly viscous melts:
theory, experiments, and autoexplosivity of dome lavas. Earth Planet Sci Let 160: 763-776
Newhall CG, Self S (1982) The volcanic explosivity index (VEI): an estimate of
explosive magnitude for historical volcanism. J Geophys Res 87: 1231-1238 Orsi G, de Vita S, Di Vito M (1996) The restless, resurgent Campi Flegrei nested
caldera Italy: constraints on its evolution and configuration. J Volcanol Geotherm Res 74: 179-214
Pallister JS, Hoblitt RP, Meeker GP, Knight RJ, Siems DF (1996) Magma mixing at
Mount Pinatubo: petrographic and chemical evidence from the 1991 deposits. In: Newhall CG, Punongbayan RS (eds) Fire and Mud: Eruptions and Lahars
Bibliography
113
of Mount Pinatubo, Philippines. Quezon City, Philippines: Philippine Inst Volc Seism, and Seattle: Univ Wash Press, pp 687-731
Papale P (2001) Dynamics of magma flow in volcanic conduits with variable
fragmentation efficiency and nonequilibrium pumice degassing. J Geophys Res 106 (B6): 11043-11065
Pfeiffer T (2001) Vent development during the Minoan eruption (1640 BC) of
Santorini, Greece, as suggested by ballistic blocks. J Volcanol Geotherm Res 106: 229-242
Polacci M, Pioli L, Rosi M (2003) The plinian phase of the campanian ignimbrite
eruption (Phlegrean Fields, Italy): evidence from density measurements and textural characterization of pumice. Bull Volcanol 65: 418-432
Pyle DM (1995) Mass and energy budgets of explosive volcanic eruptions. Geophys
Res Lett 5: 563-566 Pyle DM (2000) Sizes of Volcanic Eruptions. In: Sigurdsson H (ed) Encyclopedia of
Volcanoes. Academic Press, London, pp 263-269 Robertson R, et al. (1998) The explosive eruption of Soufrière Hills Volcano,
Montserrat, West Indies, 17 september, 1996. Geophys Res Let 25: 3429-3432
Robin C, Mossand P, Camus G, Camtagrel J-M, Gourgaud A, Vincent PM (1987)
Eruptive history of the Colima volcanic complex (Mexico). J Volcanol Geotherm Res 31: 99-113
Roobol MJ, Smith AL (1998) Pyroclastic stratigraphy of the Soufrière Hills Volcano,
Montserrat - implications for the present eruption. Geophys Res Lett 25: 3393–3396
Rose HE (1945a) An investigation into the laws of flow of fluids through beds of
granular materials. Proc Inst Mech Eng, War Emergency Issues 1-12: 141-147 Rose HE (1945b) The isothermal flow of gases through beds of granular materials.
Proc Inst Mech Eng, War Emergency Issues 1-12: 148-153 Rose HE (1945c) On the resistance coefficient-Reynolds number relationship for fluid
flow through a bed of granular material. Proc Inst Mech Eng, War Emergency Issues 1-12: 154-168
Rosi M, Bertagnini A, Landi P (2000) Onset of the persistent activity at Stromboli
volcano (Italy). Bull Volcanol 62: 294-300. Saar MO (1998) The Relationship Between Permeability, Porosity, and Microstructure
in Vesicular Basalts. MSc. Thesis, University of Oregon, pp 1-101 Saar MO, Manga M (1999) Permeability-porosity relationship in vesicular basalts.
Geophys Res Lett 26(1): 111-114
Bibliography
114
Sahimi M (1994) Applications of Percolation Theory. Taylor and Francis, London, pp
1-300 Sahimi M (1995) Flow and Transport in Porous Media and Fractured Rocks. VHC
Verlagsgesellschaft mbH, Weinheim, pp 1-496 Scheu B (2005) Understanding silicic volcanism: Constraints from elasticity and failure
of vesicular magma. PhD thesis, Ludwig-Maximilians-Univeristät München, pp. 1-139
Scheu B, Spieler O, Dingwell DB (2006) Dynamics of explosive volcanism at Unzen
volcano: an experimental contribution. Bull Volcanol, doi: 10.1007/s00445-006-0066-5
Schopper J (1982) Porosity and permeability. In: Hellwege KH (ed) Landolt-Börnstein:
Physikalische Eigenschaften der Gesteine, Vol. V/1a. Springer, Berlin, pp 184-303
Schwarzkopf LM, Schmincke H-U, Cronin SJ (2005): A conceptual model for block-
and-ash flow basal avalanche transport and deposition based on deposit architecture of 1998 and 1994 Merapi flows. J Volcanol Geotherm Res 139, 117-134
Shaw HR (1974) Diffusion of H2O in granitic liquids, 1. Experimental data. In:
Hoffman AW, Giletti BJ, Yoder HS, Yund RA (eds) Geochemical transport kinetics. Carnegie Inst Washington Publ 634: 139-170.
Siebert L, Simkin T (2002-) Volcanoes of the World: an Illustrated Catalog of
Holocene Volcanoes and their Eruptions. Smithsonian Institution. Global Volcanism Program Digital Information Series, GVP-3, (http://www.volcano.si.edu/world/).
Sigurdsson H (2000) Introduction In: Sigurdsson H (ed) Encyclopedia of Volcanoes.
Academic Press, London, pp 1-13 Sparks RSJ (1978) The dynamics of bubble formation and growth in magmas: a review
and analysis. J Vulcanol Geotherm Res 3: 1-37 Sparks RSJ (1997) Causes and consequences of pressurization in lava dome eruptions.
Earth Planet Sci Lett 150: 177-189 Sparks RSJ, Barclay J, Jaupart C, Mader HM, Phillips JC (1994) Physical aspects of
magma degassing. I. Experimental and theoretical constraints on vesiculation. In: Carrol MR, Holloway JR (eds) Volatiles in Magmas: Washington D.C., Mineralogical Society of America, Rev. Mineral. 30. pp. 414-445.
Spieler O. (2001): Die Fragmentierung hochviskoser Magmen. Experimenteller Aufbau
und Analysetechniken. PhD Thesis, Ludwig-Maximilians-Universität München, pp. 1-134
Bibliography
115
Spieler O, Alidibirov M & Dingwell DB (2003) Grain-size characteristics of experimental pyroclasts of 1980 Mount St Helens cryptodome dacite: effects of pressure drop and temperature. Bull Vulcanol 63, 90-104
Spieler O, Dingwell DB & Alidibirov M (2004a) Magma Fragmentation Speed: an
experimental determination. J Vulcanol Geotherm Res 129, 109-123 Spieler O, Kennedy B, Kueppers U, Dingwell DB, Scheu B & Taddeucci J (2004b) The
fragmentation threshold of pyroclastic rocks. Earth Planet Sci Let 226: 139-148
Srouga P, Rubinstein N, Hinterwimmer G (2004) Porosity and permeability in volcanic
rocks: a case study on the Serie Tobífera, South Patagonia, Argentina. J Vulcanol Geotherm Res 132: 31-43
Strohmeyer D (2003) Gefügeabhängigkeit technischer Gesteinseigenschaften. PhD
Thesis, Georg-August-Universität Göttingen. Swanson SE, Kienle J (1988) The 1986 eruption of Mount St. Augustine: field test of
hazard evaluation. J Geophys Res 93: 4500-4520 Thomas N, Jaupart C, Vergniolle S (1994) On the vesicularity of pumice. J Geophys
Res 99: 15633-15644 Toramaru A (1995) Numerical study of nucleation and growth of bubbles in viscous
magmas. J Geophys Res 100: 1913-1931 Verein deutscher Ingenieure (Hrsg) (2002) VDI Wärmeatlas. Berechnungsblätter für
den Wärmeübergang. 9th ed. Springer, Berlin. Voight B, Young KD, Hidayat D, Subandrio Purbawinata MA, Ratdomopurbo A,
Suharna LaHusen R, Marso J, Iguchi M, Ishihara K (2000) Deformation and seismic precursors to dome-collapse and fountain-collapse nuées ardentes at Merapi, Volcano, Indonesia, 1994–1998. J Volcanol Geotherm Res 100: 261–287
Waitt RB, Begét JE (1996) Provisional Geologic Map of Augustine Volcano, Alaska.
U.S. Geol Surv Open-File Report 96-516 Watanabe K, Hoshizumi H (1995) Geological Map of Unzen volcano. Geological map
of volcanoes 8, Geological survey of Japan Wegst CW (1989) Stahlschlüssel. 15. Auflage. Verlag Stahlschlüssel Wegst GmbH,
Marbach Westrich HR, Eichelberger JC (1994) Gas transport and bubble collapse in rhyolite
magma: an experimental approach. Bull Volcanol 56: 447-458 Woods AW, Koyaguchi T (1994) Transitions between explosive and effusive eruptions
of silicic magma. Nature 370: 641-644

Bibliography
116
Zhang Y (1999) A criterion for the fragmentation of bubbly magma based on brittle failure theory. Nature 402: 648-650
Zobin VM, Luhr JF, Taran YA, Bretón M, Cortés A, De La Cruz-Reyna S, Dominguez
T, Galindo I, Gavilanes JC, Muñiz JJ, Navarro C, Ramírez JJ, Reyes GA, Ursúla M, Velasco J, Alatorre E, Santiago H (2002) Overview of the 1997-2000 activity of Volcán de Colima, México. J Volcanol Geotherm Res 117: 1-19

Acknowledgements
117
Acknowledgements
At the outset, I want to thank Professor Donald B. Dingwell for supervising this work
and giving me the opportunity to present my results at countless meetings all around
the world.
Thanks to Oliver Spieler for all his support, especially with all kinds of technical
questions, and for all the unconventional solutions in the lab. The three field campaigns
(‘McGyver-tours’) in Mexico, Alaska, and Kamchatka were really amazing experiences
which I don’t want to miss.
Many thanks to Professor Ludwig Masch, for agreeing to act as a second reviewer.
I’m deeply indebted to Betty Scheu for all her help not only with physics and maths
problems (even at times when she doubted her skills…), for her half-around-the-globe-
assistance at paper and thesis writing, and at any other problem. I really enjoyed
working with you, may it be continued somewhere, someday…
Thanks to Ulli Küppers for his virtually unbelievable helpfulness in all kinds of
situations (no matter if it is to unscrew an intractable autoclave, repair a Twingo, sell a
VW-Bus roof rack, etc.). I wish you a lot of fun on the Azores; enjoy the nightlife, and
good luck with your Punk-Pub…
Many thanks to Yan Lavallée for good mood, good music, and the thorough reading of
the manuscript. I’ll miss the Bavarian coffees…
Thanks also to Benoît Cordonnier, who helped me a lot with image analysis questions,
e.g. by giving me a Photoshop-crash course.
Thanks to Dominique Richard for selflessly providing density data and compilations,
and for helping me to start my van early in the morning.
Acknowledgements
118
I’m grateful to Oleg Melnik, who solved a lot of mathematical and physical problems
for me and wrote a specially designed numerical code for the permeability calculation.
Thanks to the employees from the workshop and the secretary for help with technical
and administrative problems.
I would like to thank Jacopo Taddeucci (for proof readings, etcetera. See you next year
in Toscana…), Alex Nichols (for countless proof-readings), Margarita Polacci (for
hosting me in Pisa and introducing me to the mysteries of pumice thin sections),
Daniele Giordano (for the Monte Nuovo sample), Clive Oppenheimer (for hosting me
in Cambridge) and Andrea di Muro (for providing the Pinatubo samples).
Thanks to the ‘Toskana crew’, Susi Rummel, Stefan Gottschaller, Andi (aka Schäp)
and Saskia Geiß, Christian Dekant and Hanni Schwarz for the very relaxing Toscana
holidays and the many interesting culinary creations (e.g. Ananas-Streichwurst or
Blumentopfbrotente). A warm welcome to our new member Julian Geiß, born on 21.
October 2006.
Special thanks to Stefan Gottschaller for all the interdisciplinary discussions in his
office, the mind-clearing coffee breaks (I owe you at least 10 kg of coffee powder…)
and the many little hints for the use of weird programmes.
Many thanks to David, for always being there (e.g. just for a beer…).
Many thanks to my parents. Without your support this PhD wouldn’t have been
possible.
Very special thanks to my wife Hanni and my son Linus for your love, your constant
emotional support (bridging even the 700 km between München and Bremen), and your
patience with me, especially in the late stages of the PhD. Auf zu neuen Ufern…
The work was financially supported by the EU project MULTIMO and by the BMBF
project SUNDAARC – DEVACOM (Publikationsnummer GEOTECH – 273).

Appendices
119
Appendices
A. Permeability measurements and the use of the filtration codes – an
operating manual
The methods for permeability measurements and data evaluation described in this
work have been specially designed for particular investigations relevant to explosive
volcanic activity and are therefore hardly comparable to standard measuring techniques.
They comprise a complex procedure of sample preparation, installation, measurement,
data recording and finally data evaluation. In order to enable a not only theoretical
reproducibility of the method, a practical guideline for the steps relevant for
measurement and subsequent data editing will be given in the following:
Experimental procedure
(1) Sample preparation: A 25 mm core is drilled out of the respective sample boulder
and the edges cut to the desired length (standard length for most of the
investigations on the fragmentation apparatus is 60 mm. However, permeability
measurements at lengths down to 20 mm and up to 100 mm are operable). The
edges should be polished coplanar.
(2) Pycnometric density measurement/ BET surface analysis: After drying and
weighing the sample may pass through the non-destructive characterisation
procedures of interest. Porosity/ density measurements on the AccuPyc™ are a
standard precursor for further fragmentation/ permeability investigations.
(3) Sample installation: The sample cylinder is glued into a steel tube using an
adhesive (Crystalbond™) that softens and is processible at a temperatures of 71 °C,
and consolidates and becomes gas tight when cooling down to room temperature
(Figure A1). For high-temperature measurements the sample cylinder is placed in
the autoclave, free-standing on the conical shaped inset on top of the sample (in
measurement position). Then gradually the salt is filled in the space between sample
and autoclave. About every 5 mm, the loose salt grains are compressed in a
hydraulic or “Spindel” press, using a steel tube with 28 mm outer and ~25mm inner
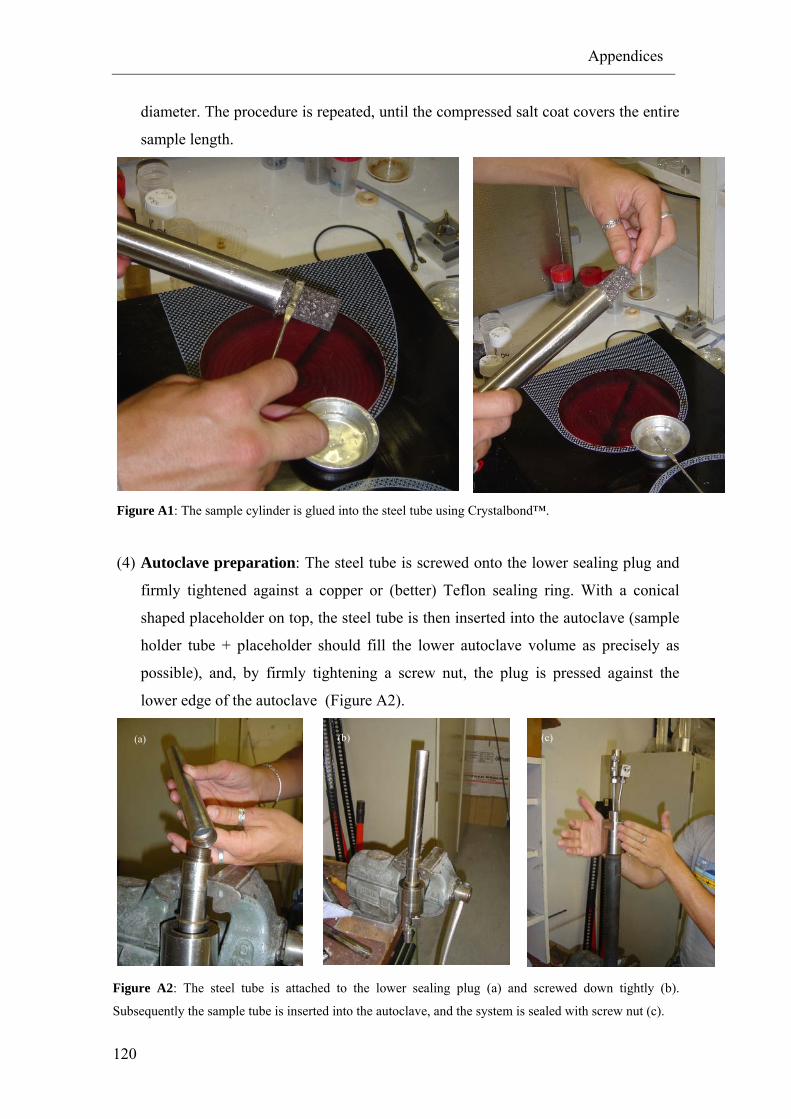
Appendices
120
diameter. The procedure is repeated, until the compressed salt coat covers the entire
sample length.
Figure A1: The sample cylinder is glued into the steel tube using Crystalbond™.
(4) Autoclave preparation: The steel tube is screwed onto the lower sealing plug and
firmly tightened against a copper or (better) Teflon sealing ring. With a conical
shaped placeholder on top, the steel tube is then inserted into the autoclave (sample
holder tube + placeholder should fill the lower autoclave volume as precisely as
possible), and, by firmly tightening a screw nut, the plug is pressed against the
lower edge of the autoclave (Figure A2).
Figure A2: The steel tube is attached to the lower sealing plug (a) and screwed down tightly (b).
Subsequently the sample tube is inserted into the autoclave, and the system is sealed with screw nut (c).
(a) (b) (c)

Appendices
121
(5) Autoclave installation: The autoclave is attached to the particle collection tank,
with diaphragms of the desired strength placed in the diaphragm holders, and
pressure transducers and gas supply are attached to the autoclave. Pressure
transducer amplifiers are connected to the recording device (computer or oscillator;
Figure A3).
Figure A3: Copper or aluminium diaphragms are placed in the diaphragm holders (a). The autoclave is
then attached to the tank and screwed down tightly against the diaphragms (b). Finally the gas supply
system and the pressure transducers are attached (c).
(a) (b)
(c)
Appendices
122
(6) Data recording: Commonly a Labview™ applet is used to record and save the
pressure signals of the two transducers. It is important for further data editing that
the amount of recorded data points is between 5000 and 15000. The sampling
interval and the record time should be adjusted accordingly.
(7) Filtration experiment: For the measurement the autoclave is pressurized to the
required overpressure. By a controlled exceeding of the uppermost diaphragms
strength the upper autoclave volume is rapidly decompressed. The pressure signals
are recorded until the pressures in the two volumes are completely equalized.
(8) The recorded .dyn or .pt files are saved and converted into plain text files.
Data editing procedure
(1) Code installation: Both codes, the steady and transient, consist of a main.exe, a
parameter.dat and a pressure.txt file, which should be saved in the same folder for
each of the codes. The additional files grfront.dat and rgb.txt, responsible for
graphical presentation of the results, have to be saved in a newly created folder
C:\pgplot.
(2) Pressure file separation: For an initial data processing, the plain text file of the
pressure recording should be imported to a suitable processing program, in the
present case SigmaPlot® 8.0 has been used. All columns except the two pressure
transducer signals should be deleted, as well as all forerun recording of the
experiment (pressurization phase, constant pressure line etc.). The upper
transducer column should be put in column 3 and should contain exactly one
maximum pressure value (pi) before the rapid pressure drop. Lower transducers
signal should be placed in column 2.
(3) Time axis and conversions: A time axis according to the chosen sampling
interval should be created in column 1. For SigmaPlot, a transform file containing
“col(1)=data(0;size(col(2))*x;x)”, where x is the sampling interval in seconds, will
create a progressional time series. As the codes require bar as a unit of pressure,
all MPa values should be converted. The three resulting columns “time [s] - plow
Appendices
123
[bar] – pup [bar]” should be re-exported to a plain text file. (Note: the codes
operate only with dot-separated decimals, so eventually commas have to be
converted in this txt-file.)
(4) Pressure.txt-file editing of the steady code: The entire pressure data set will then
be copy-pasted into the appropriate section of the pressure.txt file of the quasi-
steady code. Sample specifications must be entered above in the same file.
(5) Param.dat-file editing of the steady code: The parameters in this file define the
boundary conditions for the numerical calculation process of the code. “Min K”
and “Max K” are the boundaries for the linear permeability, “Min C” and “Max C”
for the non-linear term. For normal rocks k should lie between 1e-15 and 1e-10,
and C between 1d-1 and 1d4 (1d2 = 100, 1d3 = 1000,…). If one of the resulting
parameters calculated by the code lies on the previously defined boundary value,
the respective number should be adjusted. The setting “ik” defines the calculation
range for the permeability determination: 0 – the code determines both C and k
using the whole dataset, approximation is done with the non-linear Forchheimer
law, 1 - determines only the linear permeability k using the tale of the dataset
applying Darcy’s law. “tstart” and “dtend” define the time range for this
calculation.
(6) “main.exe” starts the code. After the calculations have been performed, a graphic
file shows the measured versus the calculated pressure drop curve. k and C results
and an mean deviation “delta” are displayed as well. A full compilation of the
resulting parameters is found in the file “results.dat”.
(7) For the use of the transient code, the 3 columns of the time/pressure recording
must be pasted into the pressure.txt-file of the transient code. Calculation
parameters, including the sample specifications, have to be entered in the
respective param.dat-file. Again the main.exe file starts the calculations. Note:
The correct value of C (transient) is obtained by multiplying the calculated C with
the square root of k.

Appendices
124
B. Tables of experimental results
Table B.1: Results of room-temperature permeability and laboratory porosity measurements of 112 samples, as well as fragmentation threhold and energy density values. For each of the samples, one to five permeability measurements at different initial pressure differences have been performed. The average values of these experiments are displayed in the table.
Sample k(quasi-static)[m2]
C(quasi-static)
k(transient)[m2]
C (transient)
Φopen [vol%]
Φtotal [vol%]
∆Pfr [MPa]
ρE_fr [10-6
J/m3] LIP B02 2,37E-13 661,21 2,67E-13 97,54 53,92 60,05
LIP B04 1,39E-13 326,06 1,66E-13 233,41 58,13 64,60 4 2,33
LIP B03 6,54E-13 90,50 5,96E-13 38,57 58,65 63,04 3 1,76
LIP C02 4,56E-13 528,48 4,98E-13 337,81 69,38 73,69 3,3 2,29
LIP E01 9,34E-14 572,50 8,90E-14 220,70 39,32 39,57 5 1,97
LIP E03 2,98E-13 249,28 3,90E-13 69,57 38,41 38,74
LIP E04 7,54E-14 433,24 8,16E-14 294,31 39,22 39,32
LIP E08 3,41E-14 1998,00 4,94E-14 1749,70 36,47 37,06
LIP E09 2,03E-14 2475,20 1,99E-14 2847,39 37,69 37,84 5,5 2,07
LIP E11 6,20E-14 236,14 6,94E-14 171,48 36,46 36,95
LIP E12 3,38E-14 395,12 3,73E-14 294,24 35,50 35,99
LIP E13 3,03E-14 397,24 3,48E-14 110,04 35,39 36,18
LIP E14 3,40E-14 117,37 3,80E-14 79,28 31,51 33,78
LIP E17 3,32E-15 84149,00 3,12E-15 90242,50 39,87 40,46
LIP E20 2,67E-15 56126,00 2,21E-15 50346,01 36,36 36,63 6,5 2,36
LIP F03 4,29E-13 6834,40 4,85E-13 5424,00 75,82 79,69 3 2,27
LIP F04 5,21E-13 1585,40 5,21E-13 1229,08 76,59 79,97 3,1 2,37
MUZ VUL01 1,06E-13 893,64 1,21E-13 651,02 46,88 53,95
MUZ VUL02 1,71E-13 210,07 1,47E-13 71,50 47,49 54,25 3 1,42
MUZ VUL03 1,03E-13 1330,77 1,47E-13 375,20 46,34 54,48
MUZ BKB35 8,99E-14 741,99 9,91E-14 588,52 36,88 42,93
MUZ BKB 38 6,67E-14 793,82 8,91E-14 804,06 36,70 42,83 4,1 1,50
MUZ 2000 A18 2,56E-15 16775,00 2,67E-15 9001,65 3,83 4,22
MUZ 2000 A19 7,34E-15 19836,00 8,93E-15 12137,27 4,41 4,41
MUZ 2001 A22 2,11E-14 1065,24 1,85E-14 1239,93 5,47 5,47
MUZ 2000 A22 1,51E-14 1764,90 1,68E-14 1064,28 10,12 10,12
MUZ 2000 A25 3,98E-15 5418,00 3,29E-15 802,42 3,67 3,67 17 0,62
MUZ 2001 A17 4,15E-15 6198,00 4,35E-15 8354,00 5,04 5,04 23 1,16
MUZ 2001 B18 3,63E-14 1508,25 3,96E-14 1115,25 12,37 14,47
MUZ 2001 C20 2,82E-13 154,15 3,18E-13 118,89 20,16 21,01
MUZ 2000 D02 4,20E-14 1853,90 5,09E-14 1920,70 12,67 16,21
MUZ 2000 D09 3,27E-14 2239,80 3,63E-14 1776,70 13,72 16,21
MUZ 2000 E17 3,10E-14 1546,05 3,52E-14 1209,44 14,12 16,64
MUZ 2000 E21 3,31E-14 1366,40 3,91E-14 1110,18 14,89 17,42
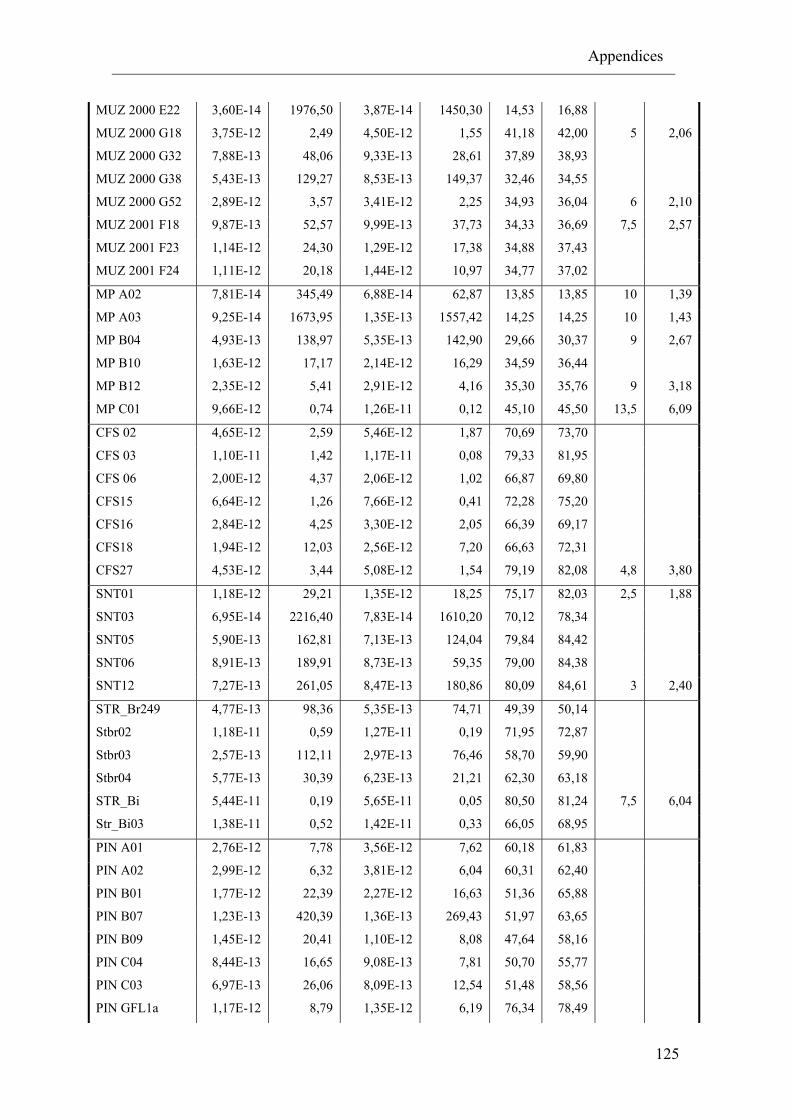
Appendices
125
MUZ 2000 E22 3,60E-14 1976,50 3,87E-14 1450,30 14,53 16,88
MUZ 2000 G18 3,75E-12 2,49 4,50E-12 1,55 41,18 42,00 5 2,06
MUZ 2000 G32 7,88E-13 48,06 9,33E-13 28,61 37,89 38,93
MUZ 2000 G38 5,43E-13 129,27 8,53E-13 149,37 32,46 34,55
MUZ 2000 G52 2,89E-12 3,57 3,41E-12 2,25 34,93 36,04 6 2,10
MUZ 2001 F18 9,87E-13 52,57 9,99E-13 37,73 34,33 36,69 7,5 2,57
MUZ 2001 F23 1,14E-12 24,30 1,29E-12 17,38 34,88 37,43
MUZ 2001 F24 1,11E-12 20,18 1,44E-12 10,97 34,77 37,02
MP A02 7,81E-14 345,49 6,88E-14 62,87 13,85 13,85 10 1,39
MP A03 9,25E-14 1673,95 1,35E-13 1557,42 14,25 14,25 10 1,43
MP B04 4,93E-13 138,97 5,35E-13 142,90 29,66 30,37 9 2,67
MP B10 1,63E-12 17,17 2,14E-12 16,29 34,59 36,44
MP B12 2,35E-12 5,41 2,91E-12 4,16 35,30 35,76 9 3,18
MP C01 9,66E-12 0,74 1,26E-11 0,12 45,10 45,50 13,5 6,09
CFS 02 4,65E-12 2,59 5,46E-12 1,87 70,69 73,70
CFS 03 1,10E-11 1,42 1,17E-11 0,08 79,33 81,95
CFS 06 2,00E-12 4,37 2,06E-12 1,02 66,87 69,80
CFS15 6,64E-12 1,26 7,66E-12 0,41 72,28 75,20
CFS16 2,84E-12 4,25 3,30E-12 2,05 66,39 69,17
CFS18 1,94E-12 12,03 2,56E-12 7,20 66,63 72,31
CFS27 4,53E-12 3,44 5,08E-12 1,54 79,19 82,08 4,8 3,80
SNT01 1,18E-12 29,21 1,35E-12 18,25 75,17 82,03 2,5 1,88
SNT03 6,95E-14 2216,40 7,83E-14 1610,20 70,12 78,34
SNT05 5,90E-13 162,81 7,13E-13 124,04 79,84 84,42
SNT06 8,91E-13 189,91 8,73E-13 59,35 79,00 84,38
SNT12 7,27E-13 261,05 8,47E-13 180,86 80,09 84,61 3 2,40
STR_Br249 4,77E-13 98,36 5,35E-13 74,71 49,39 50,14
Stbr02 1,18E-11 0,59 1,27E-11 0,19 71,95 72,87
Stbr03 2,57E-13 112,11 2,97E-13 76,46 58,70 59,90
Stbr04 5,77E-13 30,39 6,23E-13 21,21 62,30 63,18
STR_Bi 5,44E-11 0,19 5,65E-11 0,05 80,50 81,24 7,5 6,04
Str_Bi03 1,38E-11 0,52 1,42E-11 0,33 66,05 68,95
PIN A01 2,76E-12 7,78 3,56E-12 7,62 60,18 61,83
PIN A02 2,99E-12 6,32 3,81E-12 6,04 60,31 62,40
PIN B01 1,77E-12 22,39 2,27E-12 16,63 51,36 65,88
PIN B07 1,23E-13 420,39 1,36E-13 269,43 51,97 63,65
PIN B09 1,45E-12 20,41 1,10E-12 8,08 47,64 58,16
PIN C04 8,44E-13 16,65 9,08E-13 7,81 50,70 55,77
PIN C03 6,97E-13 26,06 8,09E-13 12,54 51,48 58,56
PIN GFL1a 1,17E-12 8,79 1,35E-12 6,19 76,34 78,49
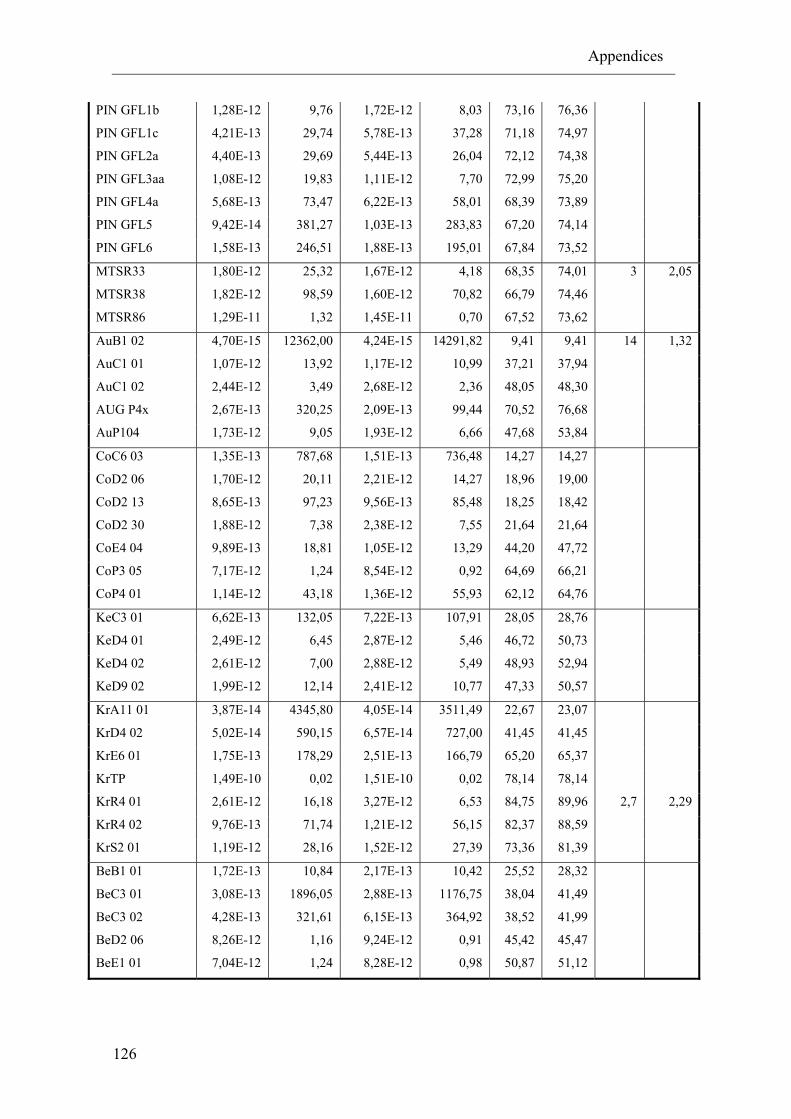
Appendices
126
PIN GFL1b 1,28E-12 9,76 1,72E-12 8,03 73,16 76,36
PIN GFL1c 4,21E-13 29,74 5,78E-13 37,28 71,18 74,97
PIN GFL2a 4,40E-13 29,69 5,44E-13 26,04 72,12 74,38
PIN GFL3aa 1,08E-12 19,83 1,11E-12 7,70 72,99 75,20
PIN GFL4a 5,68E-13 73,47 6,22E-13 58,01 68,39 73,89
PIN GFL5 9,42E-14 381,27 1,03E-13 283,83 67,20 74,14
PIN GFL6 1,58E-13 246,51 1,88E-13 195,01 67,84 73,52
MTSR33 1,80E-12 25,32 1,67E-12 4,18 68,35 74,01 3 2,05
MTSR38 1,82E-12 98,59 1,60E-12 70,82 66,79 74,46
MTSR86 1,29E-11 1,32 1,45E-11 0,70 67,52 73,62
AuB1 02 4,70E-15 12362,00 4,24E-15 14291,82 9,41 9,41 14 1,32
AuC1 01 1,07E-12 13,92 1,17E-12 10,99 37,21 37,94
AuC1 02 2,44E-12 3,49 2,68E-12 2,36 48,05 48,30
AUG P4x 2,67E-13 320,25 2,09E-13 99,44 70,52 76,68
AuP104 1,73E-12 9,05 1,93E-12 6,66 47,68 53,84
CoC6 03 1,35E-13 787,68 1,51E-13 736,48 14,27 14,27
CoD2 06 1,70E-12 20,11 2,21E-12 14,27 18,96 19,00
CoD2 13 8,65E-13 97,23 9,56E-13 85,48 18,25 18,42
CoD2 30 1,88E-12 7,38 2,38E-12 7,55 21,64 21,64
CoE4 04 9,89E-13 18,81 1,05E-12 13,29 44,20 47,72
CoP3 05 7,17E-12 1,24 8,54E-12 0,92 64,69 66,21
CoP4 01 1,14E-12 43,18 1,36E-12 55,93 62,12 64,76
KeC3 01 6,62E-13 132,05 7,22E-13 107,91 28,05 28,76
KeD4 01 2,49E-12 6,45 2,87E-12 5,46 46,72 50,73
KeD4 02 2,61E-12 7,00 2,88E-12 5,49 48,93 52,94
KeD9 02 1,99E-12 12,14 2,41E-12 10,77 47,33 50,57
KrA11 01 3,87E-14 4345,80 4,05E-14 3511,49 22,67 23,07
KrD4 02 5,02E-14 590,15 6,57E-14 727,00 41,45 41,45
KrE6 01 1,75E-13 178,29 2,51E-13 166,79 65,20 65,37
KrTP 1,49E-10 0,02 1,51E-10 0,02 78,14 78,14
KrR4 01 2,61E-12 16,18 3,27E-12 6,53 84,75 89,96 2,7 2,29
KrR4 02 9,76E-13 71,74 1,21E-12 56,15 82,37 88,59
KrS2 01 1,19E-12 28,16 1,52E-12 27,39 73,36 81,39
BeB1 01 1,72E-13 10,84 2,17E-13 10,42 25,52 28,32
BeC3 01 3,08E-13 1896,05 2,88E-13 1176,75 38,04 41,49
BeC3 02 4,28E-13 321,61 6,15E-13 364,92 38,52 41,99
BeD2 06 8,26E-12 1,16 9,24E-12 0,91 45,42 45,47
BeE1 01 7,04E-12 1,24 8,28E-12 0,98 50,87 51,12
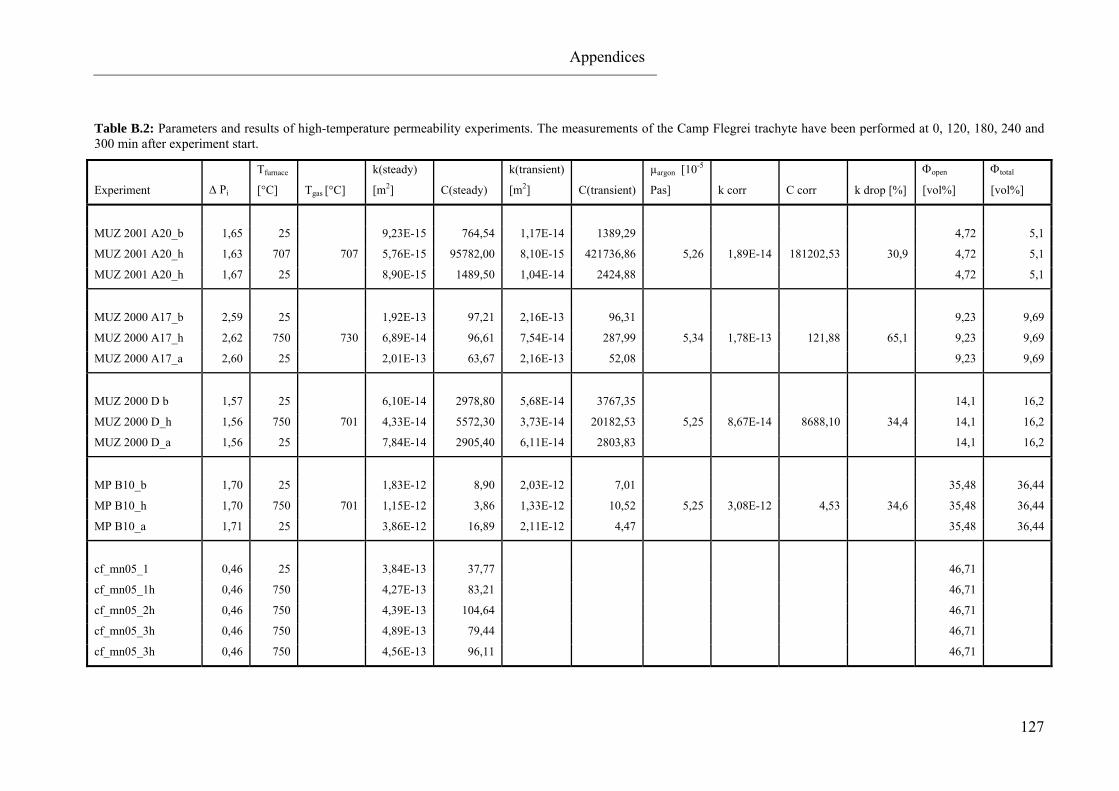
Appendices
127
Table B.2: Parameters and results of high-temperature permeability experiments. The measurements of the Camp Flegrei trachyte have been performed at 0, 120, 180, 240 and 300 min after experiment start.
Experiment ∆ Pi
Tfurnace
[°C] Tgas [°C]
k(steady)
[m2] C(steady)
k(transient)
[m2] C(transient)
µargon [10-5
Pas] k corr C corr k drop [%]
Φopen
[vol%]
Φtotal
[vol%]
MUZ 2001 A20_b 1,65 25 9,23E-15 764,54 1,17E-14 1389,29 4,72 5,1
MUZ 2001 A20_h 1,63 707 707 5,76E-15 95782,00 8,10E-15 421736,86 5,26 1,89E-14 181202,53 30,9 4,72 5,1
MUZ 2001 A20_h 1,67 25 8,90E-15 1489,50 1,04E-14 2424,88 4,72 5,1
MUZ 2000 A17_b 2,59 25 1,92E-13 97,21 2,16E-13 96,31 9,23 9,69
MUZ 2000 A17_h 2,62 750 730 6,89E-14 96,61 7,54E-14 287,99 5,34 1,78E-13 121,88 65,1 9,23 9,69
MUZ 2000 A17_a 2,60 25 2,01E-13 63,67 2,16E-13 52,08 9,23 9,69
MUZ 2000 D b 1,57 25 6,10E-14 2978,80 5,68E-14 3767,35 14,1 16,2
MUZ 2000 D_h 1,56 750 701 4,33E-14 5572,30 3,73E-14 20182,53 5,25 8,67E-14 8688,10 34,4 14,1 16,2
MUZ 2000 D_a 1,56 25 7,84E-14 2905,40 6,11E-14 2803,83 14,1 16,2
MP B10_b 1,70 25 1,83E-12 8,90 2,03E-12 7,01 35,48 36,44
MP B10_h 1,70 750 701 1,15E-12 3,86 1,33E-12 10,52 5,25 3,08E-12 4,53 34,6 35,48 36,44
MP B10_a 1,71 25 3,86E-12 16,89 2,11E-12 4,47 35,48 36,44
cf_mn05_1 0,46 25 3,84E-13 37,77 46,71
cf_mn05_1h 0,46 750 4,27E-13 83,21 46,71
cf_mn05_2h 0,46 750 4,39E-13 104,64 46,71
cf_mn05_3h 0,46 750 4,89E-13 79,44 46,71
cf_mn05_3h 0,46 750 4,56E-13 96,11 46,71

Appendices
128
Curriculum vitae
129
Curriculum vitae
Persönliche Daten
Sebastian Philipp Müller, geboren am 20. Mai 1975 in München
verheiratet, 1 Kind
Schulbildung
1981-1985 Besuch der Tagesheimschule an der Hochstraße, München
1985-1994 Besuch des Willi-Graf-Gymnasiums, München
Juli 1995 Erwerb der allgemeinen Hochschulreife
Studium
1995-1996 Studium der Geographie an der Technischen Universität
München
1996-2002 Studium der Geologie/Paläontologie an der Ludwig-
Maximilians-Universität München
September 2002 Erwerb des Diploms in Geologie/Paläontologie
Seit November 2002 Promotion an der Fakultät für Geowissenschaften, LMU
München
Berufstätigkeit
Seit November 2002 Wissenschaftlicher Mitarbeiter am Department für Geo- und
Umweltwissenschaften der LMU München
Related Documents