Doctoral paper Performance measurement in agri-food supply chains: a case study Lusine H. Aramyan, Alfons G.J.M. Oude Lansink, Jack G.A.J. van der Vorst and Olaf van Kooten Wageningen University, Wageningen, The Netherlands Abstract Purpose – Measurement of the performance of entire supply chains is an important issue because it allows for “tracking and tracing” of efficacy and efficiency failures and leads to more informed decision making with regard to chain design. However, the choice of appropriate supply chain performance indicators is rather complicated due to the presence of multiple inputs and multiple outputs in the system. Therefore, this paper aims to evaluate the usefulness of a novel conceptual model for supply chain performance measurement in an agri-food supply chain. Design/methodology/approach – A conceptual model for integrated supply chain performance measurement is evaluated in a Dutch-German tomato supply chain by means of a case study approach. Findings – The proposed conceptual framework is found to be useful for measuring performance of the tomato supply chain. From the case study it is concluded that four main categories of performance measures (i.e. efficiency, flexibility, responsiveness, and food quality) are identified as key performance components of the tomato supply chain performance measurement system. Originality/value – This research evaluates a novel concept for measuring the performance of agri-food supply chains. This concept is the first step in developing an integrated performance measurement system that contains financial as well as non-financial indicators combined with the specific characteristics of agri-food supply chains. Based on a case study in the tomato supply chain, this concept is found to have potential. Keywords Food industry, Supply chain management, Performance measurement (quality), Case study Paper type Case study Introduction In order to be able to assess the success of supply chains, an adequate performance measurement system (PMS) needs to be developed. In this study, a PMS is defined as a system that enables a firm to monitor the relevant performance indicators of products, services and production processes in the appropriate time frame (Rosenau et al., 1996). Performance indicators are the criteria with which the performance of products, services and production processes can be evaluated. Besides, performance indicators are operationalized process characteristics, which compare the efficiency and/or effectiveness of a system with a norm or target value (Van der Vorst, 2000). A PMS comprises systematic methods of setting business goals together with periodic feedback reports that indicate progress against those goals (Simons, 2000). PMS informs decision makers whether they are meeting their goals, whether customers are satisfied and whether and where improvements are necessary. In order to improve performance of the entire supply chain there is a need to look outside the boundaries of individual firms incorporating the whole chain. So, there is a need for a PMS that integrates different aspects of performance into a cohesive system, because such an integrated system enhances the information flow within the chain. According to Bititci et al. (1997), the integrated PMS is the information system that is at the heart of the performance management process and it is of critical importance to the effective and efficient functioning of the PMS. Integrated PMS provides more comprehensive measurement of entire supply chain performance than single-measure approaches do. The complexity that supply chain actors often face is the conflicting goals of individual actors in the chain. Each individual actor has its own goals, performance indicators and optimization criteria. These do not necessarily contribute positively to the performance of the chain as a whole because an individual’s own performance improvements can be detrimental to other chain actors. The position of actors in the chain (supplier, manufacturer, wholesaler, service supplier) affects their contribution (Van Hoek, 1998). The conflicting interests of different actors in the chain complicate the availability of information. The relevance of the information differs in each stage of the chain, even if the information is of high importance for the overall supply chain performance. Moreover, the strategic value of some of the information inhibits a free exchange between chain partners (Wijnands and Ondersteijn, 2006). However co-operation generally leads to a The current issue and full text archive of this journal is available at www.emeraldinsight.com/1359-8546.htm Supply Chain Management: An International Journal 12/4 (2007) 304–315 q Emerald Group Publishing Limited [ISSN 1359-8546] [DOI 10.1108/13598540710759826] The authors would like thank Jo Wijnands for his help with conducting interviews in Germany. 304

Welcome message from author
This document is posted to help you gain knowledge. Please leave a comment to let me know what you think about it! Share it to your friends and learn new things together.
Transcript

Doctoral paper
Performance measurement in agri-food supplychains: a case study
Lusine H. Aramyan, Alfons G.J.M. Oude Lansink, Jack G.A.J. van der Vorst and Olaf van Kooten
Wageningen University, Wageningen, The Netherlands
AbstractPurpose – Measurement of the performance of entire supply chains is an important issue because it allows for “tracking and tracing” of efficacy andefficiency failures and leads to more informed decision making with regard to chain design. However, the choice of appropriate supply chainperformance indicators is rather complicated due to the presence of multiple inputs and multiple outputs in the system. Therefore, this paper aims toevaluate the usefulness of a novel conceptual model for supply chain performance measurement in an agri-food supply chain.Design/methodology/approach – A conceptual model for integrated supply chain performance measurement is evaluated in a Dutch-Germantomato supply chain by means of a case study approach.Findings – The proposed conceptual framework is found to be useful for measuring performance of the tomato supply chain. From the case study it isconcluded that four main categories of performance measures (i.e. efficiency, flexibility, responsiveness, and food quality) are identified as keyperformance components of the tomato supply chain performance measurement system.Originality/value – This research evaluates a novel concept for measuring the performance of agri-food supply chains. This concept is the first step indeveloping an integrated performance measurement system that contains financial as well as non-financial indicators combined with the specificcharacteristics of agri-food supply chains. Based on a case study in the tomato supply chain, this concept is found to have potential.
Keywords Food industry, Supply chain management, Performance measurement (quality), Case study
Paper type Case study
Introduction
In order to be able to assess the success of supply chains, an
adequate performance measurement system (PMS) needs to be
developed. In this study, a PMS is defined as a system that
enables a firm to monitor the relevant performance indicators of
products, services and production processes in the appropriate
time frame (Rosenau et al., 1996). Performance indicators are
the criteria with which the performance of products, services
and production processes can be evaluated. Besides,
performance indicators are operationalized process
characteristics, which compare the efficiency and/or
effectiveness of a system with a norm or target value (Van der
Vorst, 2000). A PMS comprises systematic methods of setting
business goals together with periodic feedback reports that
indicate progress against those goals (Simons, 2000). PMS
informs decision makers whether they are meeting their goals,
whether customers are satisfied and whether and where
improvements are necessary.In order to improve performance of the entire supply chain
there is a need to look outside the boundaries of individual
firms incorporating the whole chain. So, there is a need for a
PMS that integrates different aspects of performance into a
cohesive system, because such an integrated system enhances
the information flow within the chain. According to Bititci
et al. (1997), the integrated PMS is the information system
that is at the heart of the performance management process
and it is of critical importance to the effective and efficient
functioning of the PMS. Integrated PMS provides more
comprehensive measurement of entire supply chain
performance than single-measure approaches do.The complexity that supply chain actors often face is the
conflicting goals of individual actors in the chain. Each
individual actor has its own goals, performance indicators and
optimization criteria. These do not necessarily contribute
positively to the performance of the chain as a whole because
an individual’s own performance improvements can be
detrimental to other chain actors. The position of actors in the
chain (supplier, manufacturer, wholesaler, service supplier)
affects their contribution (Van Hoek, 1998). The conflicting
interests of different actors in the chain complicate the
availability of information. The relevance of the information
differs in each stage of the chain, even if the information is of
high importance for the overall supply chain performance.
Moreover, the strategic value of some of the information inhibits
a free exchange between chain partners (Wijnands and
Ondersteijn, 2006). However co-operation generally leads to a
The current issue and full text archive of this journal is available at
www.emeraldinsight.com/1359-8546.htm
Supply Chain Management: An International Journal
12/4 (2007) 304–315
q Emerald Group Publishing Limited [ISSN 1359-8546]
[DOI 10.1108/13598540710759826]
The authors would like thank Jo Wijnands for his help with conductinginterviews in Germany.
304
win-win situation. Information sharing, clear communication,
recognition of mutual benefits, and a high level of cooperationlead to the increasing likelihood of supply chain relationship
success (Bowersox and Closs, 1996). Alignment of the goals andoptimization procedures of individual actors in the chain may beenhanced by providing insight into the effect of opposing goals
on performance. Therefore, a well-defined PMS should give aninsight into the contribution of individual chain actors to theperformance of the entire chain.Recent studies have shown that supply chains lack accurate
indicators of performance for comparison, benchmarking and
decision-making. Beamon (1999a, b) concluded that currentsupply chain PMSs are inadequate because they rely on theuse of costs as a primary indicator. Gunasekaran et al. (2001)concluded that there is no balanced approach with regards tofinancial as well as non-financial indicators and the number ofperformance indicators to be used. Lee and Billington (1992)
found that supply chains do not have ample performanceindicators and firms aim at accomplishing their own
performance standards. Authors in different disciplinesgenerally have different views on what a supply chain PMSshould look like. A main debate in the literature is about the
indicators to be included in the PMS.Christopher (1998) suggested that while there are many
indicators of performance that can be deployed in an
organization, there are a relatively small number of criticaldimensions that contribute more than proportionally to
success or failure in the market, which he named keyperformance indicators (KPI). According to Bunte et al.(1998) (in marketing), performance indicators should relate
to both effectiveness and efficiency of the supply chain and itsactors. Van der Vorst (2000) (in logistics) makes a distinctionbetween performance indicators on three main levels:1 the supply chain level (e.g. product availability, quality,
responsiveness, delivery reliability and total supply chain
costs);2 the organization level (e.g. inventory level, throughput
time, responsiveness, delivery reliability and totalorganizational costs); and
3 the process level (e.g. responsiveness, throughput time,
process yield and process costs).
Li and O’Brien (1999) (in manufacturing) proposed a model
to improve supply chain efficiency and effectiveness based onfour criteria:1 profit;2 lead-time performance;3 delivery promptness; and4 waste elimination.
The year saw the foundation of the Supply Chain Council,which developed the Supply Chain Operations Reference(SCORw) Model. This model provided guidance on the types
of indicators decision-makers can use to develop a balancedapproach towards measuring the performance of an overallsupply chain. The SCORw Model advocates a set of supply
chain performance indicators as a combination of:. reliability measures (e.g. fill rate, perfect order
fulfillment);. cost measures (e.g. cost of goods sold);. responsiveness measures (e.g. order fulfillment lead-time);
and. asset measures (e.g. inventories) (Supply Chain Council,
2004).
Lai et al. (2002) distinguished three dimensions of supply
chain performance in transport logistics:1 service effectiveness for shippers;2 operational efficiency; and3 service effectiveness for consignees.
Within these dimensions they identified four performance
indicators:1 responsiveness;2 reliability;3 costs; and4 assets.
Beamon (1999a, b) (in manufacturing) suggested a system of
three dimensions:1 resources (i.e. efficiency of operations);2 output (i.e. high level of customer service); and3 flexibility (i.e. ability to respond to a changing
environment).
This literature review shows that many efforts have been made
to develop a PMS for various supply chains. Despite their
importance, little attention has been paid in the literature to
integrated PMS. To our knowledge no integrated
measurement system exists in agri-food supply chains that
combines different aspects of performance (e.g. financial and
non-financial, qualitative and quantitative) into one
measurement system: therefore, we aim to fill this gap.Measuring the performance of agri-food supply chains is
rather difficult, because they have many characteristics that
set them apart from other types of supply chains. Examples
are:. shelf life constraints for raw materials and perishability of
products;. long production throughput time;. seasonality in production;. physical product features like sensory properties such as
taste, odor, appearance, color, size and image;. requires conditioned transportation and storage;. product safety issues; and. natural conditions affect the quantity and the quality of
farm products.
Furthermore, recent socio-economic developments have
resulted in a change in performance requirements for food
supply chains as a whole and for all stages in the supply chain.
Consumers put new demands on different attributes of food
such as quality, integrity, safety, diversity and services (Van
der Vorst, 2005). The policy changes concerning the
environmental issues have a great impact on agri-food
supply chains. The use of pesticides and other chemicals
has a negative impact on consumers’ buying behavior. As a
result, consumers have high demands on a broad range of
quality aspects like food safety, production characteristics,
sensory properties, shelf life, reliability, convenience (Van der
Spiegel, 2004). Thus, when developing a PMS for agri-food
supply chains, the indicators that reflect the quality aspects of
product and processes are important and together with other
financial and non-financial indicators should be included in a
PMS.Recently, Aramyan et al. (2006) developed a preliminary
conceptual framework of a PMS for agri-food supply chains
based on the literature, which captures the characteristics of
agri-food supply chain as well as other financial and non-
Performance measurement in agri-food supply chains
Lusine H. Aramyan et al.
Supply Chain Management: An International Journal
Volume 12 · Number 4 · 2007 · 304–315
305
financial indicators. The conceptual framework, described in
the next section, consists of four main categories:1 efficiency;2 flexibility;3 responsiveness; and4 food quality.
The goal of this study is to evaluate and further develop the
conceptual framework of Aramyan et al. (2006) using data
from a Dutch-German tomato supply chain. In this study we
investigate two research questions:1 Are the four categories (efficiency, flexibility,
responsiveness and food quality) of performance
measures suggested in the conceptual framework the key
performance components for an integrated PMS in the
tomato supply chains?2 Do the different indicators within these categories vary
in different links of the tomato supply chain, given
the different objectives of these different links in the
chain?
This paper is organized as follows. The next section provides
the details of the conceptual framework, followed by the
method used to carry out the research and the case study
description. Thereafter, the results of the case study are
analyzed. The paper ends with conclusions and discusses
areas for future research.
A conceptual framework
This section discuses a conceptual framework for measuring
the performance of agri-food supply chains. Based on a
literature review of existing performance indicators for supply
chains, a conceptual framework for measuring the
performance of agri-food supply chains has been developed
(Aramyan et al., 2006). Agri-food supply chain performance
indicators are grouped into four main categories:1 efficiency;2 flexibility;3 responsiveness; and4 food quality.
These four categories are the bottom line of the PMS. Each
of these main categories contains more detailed
performance indicators (Figure 1). The suggested
performance indicators can be used at the organizational
level as well as the supply chain level. This means that
supply chain members, besides their own set of performance
indicators, have a common set of performance indicators
within four main categories that help them to evaluate their
own performance and the performance of the chain. This
common set of indicators for the complete supply chain can
be identified as key performance indicators. Efficiencymeasures how well the resources are utilized (Lai et al.,2002). It includes several measures such as production
costs, profit, return on investment and inventory. Flexibilityindicates the degree to which the supply chain can respond
to a changing environment and extraordinary customer
service requests (Bowersox and Closs, 1996; Beamon,
1998). It may include customer satisfaction, volume
flexibility, delivery flexibility, reduction in the number of
backorders and lost sales. Responsiveness aims at providing
the requested products with a short lead-time (Persson and
Olhager, 2002). It may include fill rate, product lateness,
customer response time, lead-time, shipping errors, and
customer complaints.The specific characteristics of agri-food supply chains are
captured in the measurement framework in the category
“food quality”. The latter is based on the framework of food
quality developed by Luning et al. (2002). Food quality is
divided into product and process quality. Product quality
consists of:. product safety and health;. sensory properties and shelf-life; and. product reliability and convenience.
Within product safety and health, health (salubrity) refers to
food composition and diet. Product safety refers to the
requirement that products must be “free” of hazards with an
acceptable risk. Sensory perception of food is determined by
the overall sensation of taste, odor, color, appearance and
texture, which are determined by physical features and
chemical composition. The shelf-life of a product is defined as
the time between harvesting or processing and packaging of
the product, and the point in time at which it becomes
unacceptable for consumption. Product reliability refers to the
compliance of actual product composition with product
description, and convenience relates to the ease of use or
consumption of the product for the consumer (Luning et al.,2002).Process quality is divided into:
. production system characteristics;
. environmental aspects; and
. marketing.
Production system characteristics refer to the way a food
product is manufactured and includes such factors as
pesticides used, animal welfare and the use of genetic
engineering. Environmental implications of agri-food
products refer mainly to the use of packaging and food
waste management. Marketing efforts determine quality
attributes (e.g. promotions, service), affecting quality
expectation (Luning et al., 2002).Adding the category “food quality” to the three other
categories completes the conceptual framework for measuring
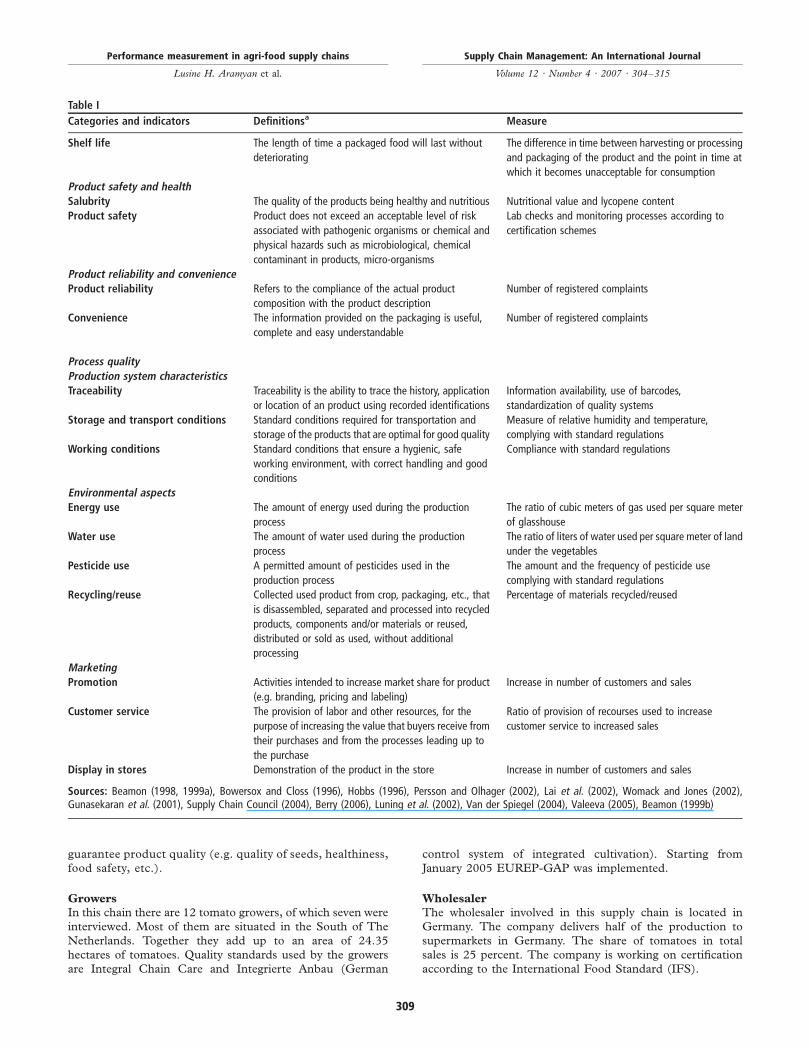
the performance of agri-food supply chain (Figure 1). Table I
includes the definitions of all suggested performance
indicators based on an extensive literature review, and the
possible ways to measure them.
Methodology
In order to evaluate the conceptual framework a case study
research has been designed. The case study has been carried
out in a Dutch-German tomato supply chain. The sources of
information are interviews with:. the chain manager of a breeding company;. seven owner-growers of tomato producing firms;. the wholesaler of a wholesale company;. the manager of a distribution center; and. two managers of supermarkets.
The type of interview used was a focus interview (Yin, 2003),
in which the interview consists of open-ended questions and a
set of questions in the form of a questionnaire. The
questionnaire[1] consisted of three parts. The first part
included general open-ended questions to become familiar
with the firm. In the second part interviewees were given
Performance measurement in agri-food supply chains
Lusine H. Aramyan et al.
Supply Chain Management: An International Journal
Volume 12 · Number 4 · 2007 · 304–315
306

definitions of possible performance indicators that could be
integrated into a PMS. Interviewees were asked to judge the
feasibility and the measurability of suggested indicators.
Interviewees were given the opportunity to suggest new
indicators and/or to reject the proposed indicators and to
provide suggestions for better (i.e. feasible) ways to measure
the suggested indicators. Next, the interviewees were asked to
rank the listed indicators of performance according to the
perceived importance for their firm, using an interval ranking
(Churchill, 1999). A five-point Likert scale was used, with 1
being “not important at all” for measuring performance and 5
being “very important”. The last part of the questionnaire
consisted of evaluating the usefulness of the whole conceptual
framework in general, where interviewees were asked to judge
the categories in the framework, and to propose new and/or
reject categories.The interviews were conducted in February-March 2005
in The Netherlands and in the Rhine-Ruhr area in
Germany, where Dutch tomatoes from this chain are sold.
Prior to the interviews, pre-test interviews were conducted
with three interviewees external to the chain in order to test
the questionnaire. In the tomato chain in total 12
interviewees were interviewed. Seven growers agreed to
participate in the interview. One breeder and one
wholesaler took part in the interview, because there is
only one of each in the chain. Finally, one manager of one
distribution center and two managers of two supermarkets
were interviewed.
Case study description and research design
The supply chain in this case is a tomato chain and consists of
two parts – a Dutch and a German part. The Dutch part
consists of one breeder and 12 growers. The German part
consists of one wholesaler and multiple distribution centers
and retailers in Germany.This particular supply chain has been chosen as a case
study because it is a complete chain starting from the breeder
to the end consumer. Also, this chain experiences problems
with information flow throughout the entire chain. Breeder
and growers do not receive feedback about their products
from the supermarkets. Information sources are not always
clear for all members of the chain. For instance, growers
implemented EUREP-GAP (the global certification of Good
Agricultural Practices, GAP, developed by the Euro-Retailer
Produce Working Group, EUREP) based on the supposed
requirements of German supermarkets, while German
supermarkets were not aware of those requirements. This
lack of information complicates the improvement of the
performance of the overall supply chain.The chain consists of relatively small-scale growers with an
average of about 2 ha tomato cultivation. Currently, the
number of large growers producing a high volume of
vegetables is small, while the number of small growers is
relatively large. In The Netherlands, the total number of firms
producing tomatoes is 543, of which 422 firms (77.5 percent)
have less than 3 ha of tomato cultivation (Land- en
tuinbouwcijfers, 2004).
Breeder
In this tomato chain there is one breeder, situated in The
Netherlands. The company specializes in the breeding of
many different vegetable seeds. The company has
developed an integral chain care system, which is a
certification system based on quality standards aiming to
Figure 1 Conceptual framework of agri-food supply chain performance categories and indicators
Performance measurement in agri-food supply chains
Lusine H. Aramyan et al.
Supply Chain Management: An International Journal
Volume 12 · Number 4 · 2007 · 304–315
307
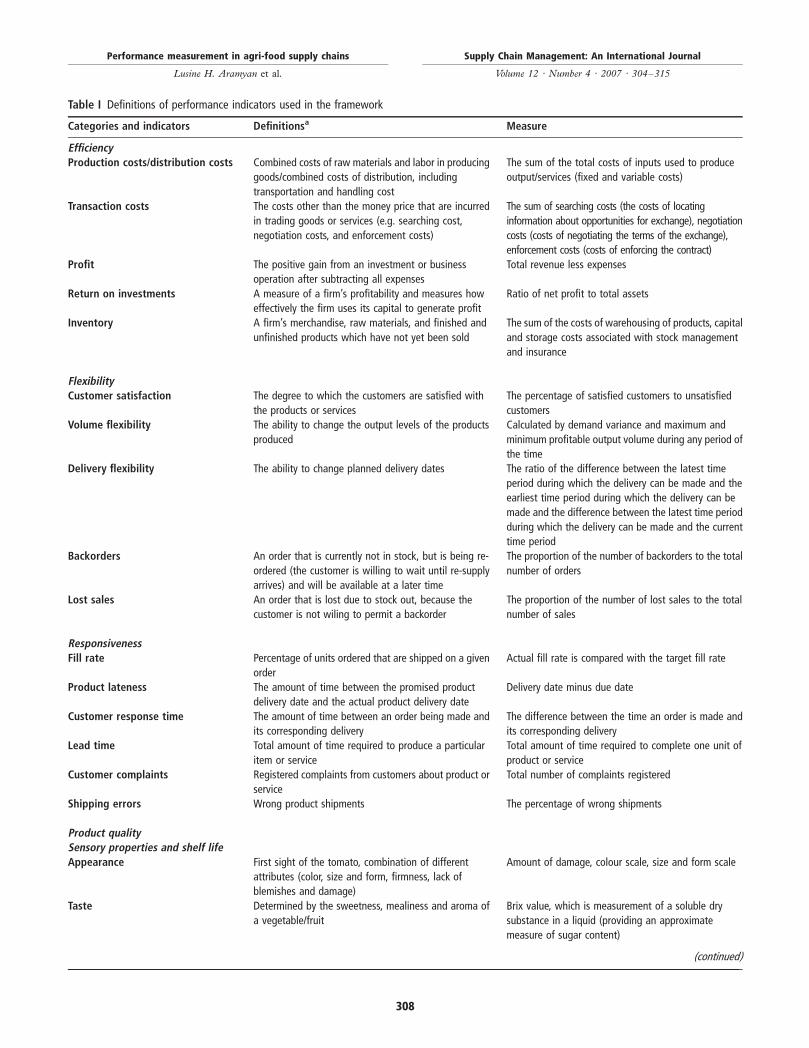
Table I Definitions of performance indicators used in the framework
Categories and indicators Definitionsa Measure
EfficiencyProduction costs/distribution costs Combined costs of raw materials and labor in producing
goods/combined costs of distribution, including
transportation and handling cost
The sum of the total costs of inputs used to produce
output/services (fixed and variable costs)
Transaction costs The costs other than the money price that are incurred
in trading goods or services (e.g. searching cost,
negotiation costs, and enforcement costs)
The sum of searching costs (the costs of locating
information about opportunities for exchange), negotiation
costs (costs of negotiating the terms of the exchange),
enforcement costs (costs of enforcing the contract)
Profit The positive gain from an investment or business
operation after subtracting all expenses
Total revenue less expenses
Return on investments A measure of a firm’s profitability and measures how
effectively the firm uses its capital to generate profit
Ratio of net profit to total assets
Inventory A firm’s merchandise, raw materials, and finished and
unfinished products which have not yet been sold
The sum of the costs of warehousing of products, capital
and storage costs associated with stock management
and insurance
FlexibilityCustomer satisfaction The degree to which the customers are satisfied with
the products or services
The percentage of satisfied customers to unsatisfied
customers
Volume flexibility The ability to change the output levels of the products
produced
Calculated by demand variance and maximum and
minimum profitable output volume during any period of
the time
Delivery flexibility The ability to change planned delivery dates The ratio of the difference between the latest time
period during which the delivery can be made and the
earliest time period during which the delivery can be
made and the difference between the latest time period
during which the delivery can be made and the current
time period
Backorders An order that is currently not in stock, but is being re-
ordered (the customer is willing to wait until re-supply
arrives) and will be available at a later time
The proportion of the number of backorders to the total
number of orders
Lost sales An order that is lost due to stock out, because the
customer is not wiling to permit a backorder
The proportion of the number of lost sales to the total
number of sales
ResponsivenessFill rate Percentage of units ordered that are shipped on a given
order
Actual fill rate is compared with the target fill rate
Product lateness The amount of time between the promised product
delivery date and the actual product delivery date
Delivery date minus due date
Customer response time The amount of time between an order being made and
its corresponding delivery
The difference between the time an order is made and
its corresponding delivery
Lead time Total amount of time required to produce a particular
item or service
Total amount of time required to complete one unit of
product or service
Customer complaints Registered complaints from customers about product or
service
Total number of complaints registered
Shipping errors Wrong product shipments The percentage of wrong shipments
Product qualitySensory properties and shelf lifeAppearance First sight of the tomato, combination of different
attributes (color, size and form, firmness, lack of
blemishes and damage)
Amount of damage, colour scale, size and form scale
Taste Determined by the sweetness, mealiness and aroma of
a vegetable/fruit
Brix value, which is measurement of a soluble dry
substance in a liquid (providing an approximate
measure of sugar content)
(continued)
Performance measurement in agri-food supply chains
Lusine H. Aramyan et al.
Supply Chain Management: An International Journal
Volume 12 · Number 4 · 2007 · 304–315
308
guarantee product quality (e.g. quality of seeds, healthiness,
food safety, etc.).
Growers
In this chain there are 12 tomato growers, of which seven were
interviewed. Most of them are situated in the South of The
Netherlands. Together they add up to an area of 24.35
hectares of tomatoes. Quality standards used by the growers
are Integral Chain Care and Integrierte Anbau (German
control system of integrated cultivation). Starting from
January 2005 EUREP-GAP was implemented.
Wholesaler
The wholesaler involved in this supply chain is located in
Germany. The company delivers half of the production to
supermarkets in Germany. The share of tomatoes in total
sales is 25 percent. The company is working on certification
according to the International Food Standard (IFS).
Table I
Categories and indicators Definitionsa Measure
Shelf life The length of time a packaged food will last without
deteriorating
The difference in time between harvesting or processing
and packaging of the product and the point in time at
which it becomes unacceptable for consumption
Product safety and healthSalubrity The quality of the products being healthy and nutritious Nutritional value and lycopene content
Product safety Product does not exceed an acceptable level of risk
associated with pathogenic organisms or chemical and
physical hazards such as microbiological, chemical
contaminant in products, micro-organisms
Lab checks and monitoring processes according to
certification schemes
Product reliability and convenienceProduct reliability Refers to the compliance of the actual product
composition with the product description
Number of registered complaints
Convenience The information provided on the packaging is useful,
complete and easy understandable
Number of registered complaints
Process qualityProduction system characteristicsTraceability Traceability is the ability to trace the history, application
or location of an product using recorded identifications
Information availability, use of barcodes,
standardization of quality systems
Storage and transport conditions Standard conditions required for transportation and
storage of the products that are optimal for good quality
Measure of relative humidity and temperature,
complying with standard regulations
Working conditions Standard conditions that ensure a hygienic, safe
working environment, with correct handling and good
conditions
Compliance with standard regulations
Environmental aspectsEnergy use The amount of energy used during the production
process
The ratio of cubic meters of gas used per square meter
of glasshouse
Water use The amount of water used during the production
process
The ratio of liters of water used per square meter of land
under the vegetables
Pesticide use A permitted amount of pesticides used in the
production process
The amount and the frequency of pesticide use
complying with standard regulations
Recycling/reuse Collected used product from crop, packaging, etc., that
is disassembled, separated and processed into recycled
products, components and/or materials or reused,
distributed or sold as used, without additional
processing
Percentage of materials recycled/reused
MarketingPromotion Activities intended to increase market share for product
(e.g. branding, pricing and labeling)
Increase in number of customers and sales
Customer service The provision of labor and other resources, for the
purpose of increasing the value that buyers receive from
their purchases and from the processes leading up to
the purchase
Ratio of provision of recourses used to increase
customer service to increased sales
Display in stores Demonstration of the product in the store Increase in number of customers and sales
Sources: Beamon (1998, 1999a), Bowersox and Closs (1996), Hobbs (1996), Persson and Olhager (2002), Lai et al. (2002), Womack and Jones (2002),Gunasekaran et al. (2001), Supply Chain Council (2004), Berry (2006), Luning et al. (2002), Van der Spiegel (2004), Valeeva (2005), Beamon (1999b)
Performance measurement in agri-food supply chains
Lusine H. Aramyan et al.
Supply Chain Management: An International Journal
Volume 12 · Number 4 · 2007 · 304–315
309

Retail distribution centers
There are three distribution centers, one of which agreed to
participate. The three distribution centers are part of an
organization with a turnover of e32.16bn in 2003. The
company is one the of the largest European food trading
companies. The share of fruits and vegetables in total sales is
12 percent, of which the share of tomatoes is 6-7 percent. The
quality standards used by the firm are Integrierte Anbau and
HACCP.
Retail outlets
The last link in the chain before the end-consumer is formed
by the retailers, which are part of the same group as the
distribution centers. It is a group of 15 cooperatives composed
of many largely independent retailers supplied by its own
regional food wholesalers.A schematic representation of the tomato supply chain is
given in Figure 2.
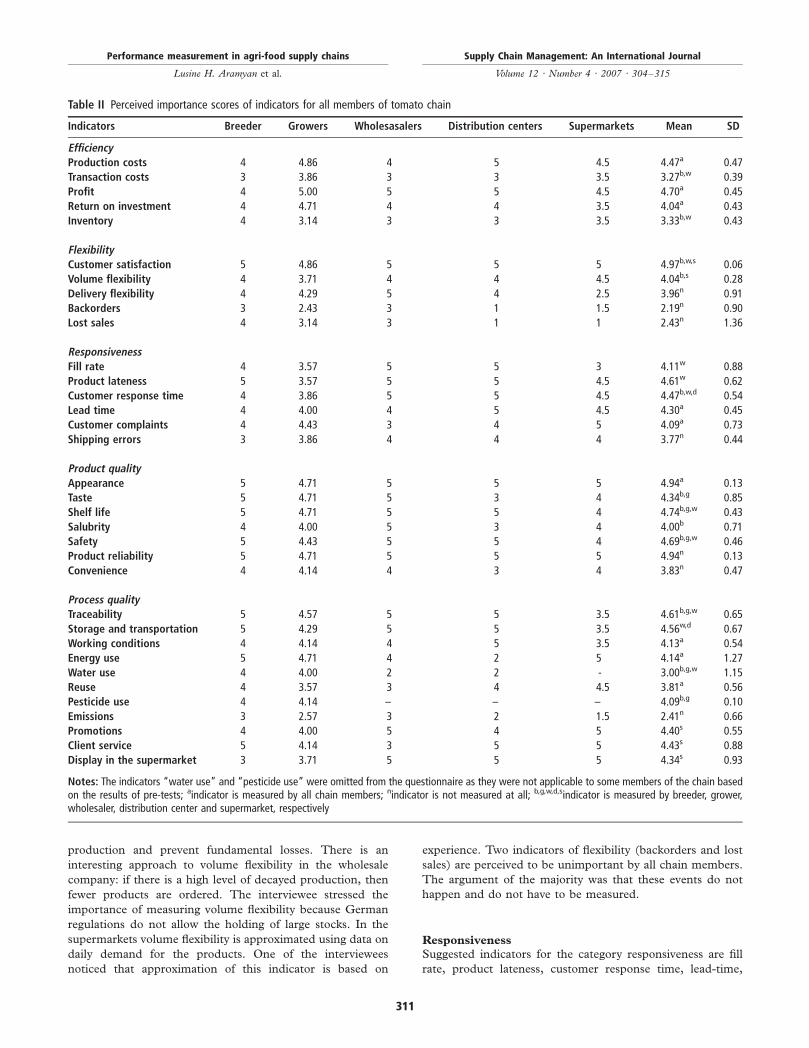
Findings of the case study
Table II presents perceived importance scores of the
performance indicators for all members of the tomato
supply chain. All interviewees agreed with the suggested
categories in the framework and indicated that they cover all
relevant aspects. Some of the interviewees suggested including
other indicators in the framework. Let us discuss the main
findings.
Efficiency
Within the category of efficiency, interviewees suggested
including the efficiency of the salesman (for wholesale,
distribution center and supermarkets), measured as the
number of pallets sold per year, and the efficiency per
hectare of the production (for breeder and growers).
Suggested indicators from the framework for efficiency were
production/distribution and transaction costs, profit, return
on investments, and inventory. All suggested indicators of
efficiency are currently measured only in the breeding and
wholesale companies. From the five suggested indicators of
efficiency only three (production costs, profit and return on
investments) are measured by the growers. Inventory costs
and transaction costs are not measured. Not all suggested
indicators of efficiency are measured in the distribution center
(e.g. transaction costs are not calculated). From the five
indicators of efficiency, three are measured by the
supermarkets.In the category efficiency, all chain members but one found
two indicators of medium importance – i.e. transaction costs
and inventory – the exception being the breeder, who found
inventory costs important (see Table II). A possible
explanation can be that this chain is structured such that
transaction costs (e.g. searching costs and transportation
costs) are kept to a minimum. Since growers are not allowed
to sell their products to wholesalers outside the chain, they do
not seek other channels such as auctions or direct marketing.
Growers benefit from the arrangement with the wholesaler
since they have no transportation costs and save time for
marketing their products. On the other hand the wholesaler is
assured of a constant supply of products. Unlike the other
chain members, the breeder emphasized the importance of
inventory costs. Inventory costs are important for the breeder
given the large amount of expensive seeds that are kept in
storage for a long time-period, which increases the costs of
warehousing. The wholesaler and the distribution center sell
their whole stock within one day and therefore inventory costs
are not of interest to them. There is a high level of agreement
between chain members on production cost and profit
indicators in the efficiency category, which shows that the
costs remain one of the major concerns for measuring supply
chain performance.
Flexibility
Suggested indicators for flexibility were customer satisfaction,
volume flexibility, delivery flexibility, the number of
backorders and lost sales. Customer satisfaction is the most
important indicator of performance for all chain members.
However, it is either not measured at all, or it is measured
indirectly. The breeding company registers complaints from
customers, which are used as an indicator of customer
satisfaction. Occasionally, the breeder surveys customers to
ask directly for satisfaction of growers (e.g. opinion about the
breeder, its image and reliability). In the supermarkets,
customer satisfaction is measured by the turnover and the
number of customers. Sometimes, supermarkets send out
questionnaires to their customers asking how satisfied they are
with the supermarkets. The results are used to improve
customer satisfaction. Although customer satisfaction was
ranked highest by the growers and the distribution center, it is
not measured in these firms at all, which is remarkable.Although delivery flexibility is important for all members in
the supply chain (except for supermarkets), companies do not
measure it. Most companies have a list of priority customers
who receive preferential treatment in case they ask for a rush
order. Volume flexibility is calculated in the breeding
company on the basis of expected sales. Volume flexibility is
not calculated by growers. Their major intention is to produce
as much as possible, even if the demand for the product is low
and they make losses. One explanation for this is that they are
restricted by the size of their glasshouses. However, the
interviewees agreed that it would be very useful for them to be
able to measure this indicator in order to predict over-
Figure 2 Schematic representation of the tomato supply chain
Performance measurement in agri-food supply chains
Lusine H. Aramyan et al.
Supply Chain Management: An International Journal
Volume 12 · Number 4 · 2007 · 304–315
310
production and prevent fundamental losses. There is an
interesting approach to volume flexibility in the wholesale
company: if there is a high level of decayed production, then
fewer products are ordered. The interviewee stressed the
importance of measuring volume flexibility because German
regulations do not allow the holding of large stocks. In the
supermarkets volume flexibility is approximated using data on
daily demand for the products. One of the interviewees
noticed that approximation of this indicator is based on
experience. Two indicators of flexibility (backorders and lost
sales) are perceived to be unimportant by all chain members.
The argument of the majority was that these events do not
happen and do not have to be measured.
Responsiveness
Suggested indicators for the category responsiveness are fill
rate, product lateness, customer response time, lead-time,
Table II Perceived importance scores of indicators for all members of tomato chain
Indicators Breeder Growers Wholesasalers Distribution centers Supermarkets Mean SD
EfficiencyProduction costs 4 4.86 4 5 4.5 4.47a 0.47
Transaction costs 3 3.86 3 3 3.5 3.27b,w 0.39
Profit 4 5.00 5 5 4.5 4.70a 0.45
Return on investment 4 4.71 4 4 3.5 4.04a 0.43
Inventory 4 3.14 3 3 3.5 3.33b,w 0.43
FlexibilityCustomer satisfaction 5 4.86 5 5 5 4.97b,w,s 0.06
Volume flexibility 4 3.71 4 4 4.5 4.04b,s 0.28
Delivery flexibility 4 4.29 5 4 2.5 3.96n 0.91
Backorders 3 2.43 3 1 1.5 2.19n 0.90
Lost sales 4 3.14 3 1 1 2.43n 1.36
ResponsivenessFill rate 4 3.57 5 5 3 4.11w 0.88
Product lateness 5 3.57 5 5 4.5 4.61w 0.62
Customer response time 4 3.86 5 5 4.5 4.47b,w,d 0.54
Lead time 4 4.00 4 5 4.5 4.30a 0.45
Customer complaints 4 4.43 3 4 5 4.09a 0.73
Shipping errors 3 3.86 4 4 4 3.77n 0.44
Product qualityAppearance 5 4.71 5 5 5 4.94a 0.13
Taste 5 4.71 5 3 4 4.34b,g 0.85
Shelf life 5 4.71 5 5 4 4.74b,g,w 0.43
Salubrity 4 4.00 5 3 4 4.00b 0.71
Safety 5 4.43 5 5 4 4.69b,g,w 0.46
Product reliability 5 4.71 5 5 5 4.94n 0.13
Convenience 4 4.14 4 3 4 3.83n 0.47
Process qualityTraceability 5 4.57 5 5 3.5 4.61b,g,w 0.65
Storage and transportation 5 4.29 5 5 3.5 4.56w,d 0.67
Working conditions 4 4.14 4 5 3.5 4.13a 0.54
Energy use 5 4.71 4 2 5 4.14a 1.27
Water use 4 4.00 2 2 - 3.00b,g,w 1.15
Reuse 4 3.57 3 4 4.5 3.81a 0.56
Pesticide use 4 4.14 – – – 4.09b,g 0.10
Emissions 3 2.57 3 2 1.5 2.41n 0.66
Promotions 4 4.00 5 4 5 4.40s 0.55
Client service 5 4.14 3 5 5 4.43s 0.88
Display in the supermarket 3 3.71 5 5 5 4.34s 0.93
Notes: The indicators “water use” and “pesticide use” were omitted from the questionnaire as they were not applicable to some members of the chain basedon the results of pre-tests; aindicator is measured by all chain members; nindicator is not measured at all; b,g,w,d,sindicator is measured by breeder, grower,wholesaler, distribution center and supermarket, respectively
Performance measurement in agri-food supply chains
Lusine H. Aramyan et al.
Supply Chain Management: An International Journal
Volume 12 · Number 4 · 2007 · 304–315
311

customer complaints and shipping errors. Three indicators
are used in the breeding company:1 lead-time (with the help of planning);2 customer response time (by sending out a questionnaire to
customers); and3 customer complaints (all complaints are registered).
Fill rate and shipping errors are not measured, because the
company does not do transportation. Growers use only two
indicators:1 lead-time (production time and required harvesting and
packaging time); and2 customer complaints (all complaints are registered).
In general, growers think that this part is more applicable to
the wholesaler, because the wholesaler collects products. In
the wholesale company and in the distribution center, only
product lateness is not measured, although it is perceived to
be very important. The interviewees argued that the product
has to be in time: mistakes are not allowed and usually do
not happen. From all suggested indicators of
responsiveness, customer complaints and lead-time are
measured by the supermarkets, while others are not. The
reason why the others are not measured was explained by an
interviewee: they usually do not occur. Shipping error is not
measured. Interviewees explain that shipping errors can
happen weekly; however, they are not measured or
documented because they are aware of wrong shipments.
Surprisingly, nothing is done to minimize shipping errors,
although they often occur.
Food quality
Suggested indicators for product quality were: appearance,
taste, shelf life, salubrity, product safety, product reliability,
convenience in information on packaging. These indicators
fall into three subcategories (see the section entitled
“Conceptual framework”).All indicators of product quality are measured by the
breeding company inside the firm. Also, additional product
quality measurements take place in the firms of growers and
in retail shops. In the wholesale company all indicators are
measured (except for salubrity) inside the company by quality
inspectors of the company and by the KCB (Dutch Quality
Control Bureau). In the distribution center and in the
supermarkets most of the indicators are measured on the basis
of subjective perceptions, without performing formal tests,
e.g. for the appearance of the tomato, color is checked by
looking to see how red the tomato is. Product safety and
salubrity are not measured in the distribution center and in
the supermarkets, though these indicators are important, and
should be checked according to standard regulations
(especially product safety). Interviewees from the
supermarkets believe that it is checked in the distribution
center. However, the interviewee from the distribution center
believed that measurement was done by the wholesaler.
Obviously the different actors in the supply chain do not have
adequate information about what the previous actor does to
the products, which can have grave consequences for product
safety.Shelf life is not measured in the supermarket, because
products are supposed to be fresh. When a product is too old,
it is sold for a lower price. Here a conflict arises between
growers and supermarkets, because some growers prefer to
incur costs of disposal than to have poor quality tomatoes sold
for a lower price.These results show that there is joint agreement between
supply chain members on the category of product quality,
where all indicators (except for salubrity, taste and
convenience) scored high on importance in all links of thesupply chain, indicating that the chain as a whole claims to
take product quality very seriously. The high level ofagreement in the “product quality” category may be
explained by the fact that the breeding company developed
the integral chain care system to guarantee product qualitydown the supply chain.Suggested indicators for process quality are traceability,
storage and transportation conditions, working conditions,energy use, water use, reuse, pesticide use, emissions,
promotions in supermarkets, client service and displays in
supermarkets. These indicators fall into three subcategories(see the section entitled “Conceptual framework”). The
findings from the interviews about process quality indicators
are not uniform. Suggested indicators obtained scores rangingfrom “not important at all” to “very important”. However,
indicators reflecting environmental aspects are generallyperceived to be of low importance.Water use received different scores in different links,
because of differences in use of this indicator. Interestingresults are obtained concerning traceability in the
supermarkets, which appeared to be of medium importance
but it is not measured. It is difficult to maintain traceability.When products reach the supermarket they often end up in
one large bin, and the growers can no longer be identified,
while until that stage the product is 100 percent traceable.The suggested indicators are all measured in each link of
the chain, except for the last three indicators of marketing(they are not measured in the first three links of the chain)
and the indicator “emissions”. The interviewees argued that
indicators of marketing are difficult to measure. Insupermarkets, the indicators of marketing are measured by
comparing total returns to marketing efforts. Emissions are
perceived to be not very important or even not important atall across the entire supply chain. Most of the links of the
chain do not have direct restrictions from the government for
emissions and therefore they do not measure emissions. Ingeneral, all indicators of process quality (except for indicators
of marketing) are already measured and controlled as basicrequirements of the quality certification systems that
companies use. Therefore, interviewees suggested that these
indicators should not be included as separate items in thePMS framework.
Summary of results
The results indicate that many performance measurementindicators are measured in some links of the chain while they
are not measured in others. This shows that different
performance indicators are used in different links of the ofthe supply chain, given their differing objectives. This
complicates the harmonization of performance measurement
in the entire supply chain, in order to get consistent measuresof performance for the entire chain. Based on the results of
the case study a condensed PMS with key performance
indicators for agri-food supply chain is suggested in Figure 3.The choice of the indicators in the framework is conditioned
by the following criteria:
Performance measurement in agri-food supply chains
Lusine H. Aramyan et al.
Supply Chain Management: An International Journal
Volume 12 · Number 4 · 2007 · 304–315
312

. high importance scores of indicators (score between 4 and5);
. measurability of these indicators (indicators can be easilymeasured by the firms); and
. applicability to entire chain (each supply chain member
finds useful to implement these indicators to some extent).
Each of the selected indicators will be discussed below.
Efficiency
Three indicators suggested in this category received a highimportance score (costs 4.47, profit 4.7, return on
investments 4.04), are easily measured, and are used by allchain members. Therefore, they have been included in theframework.
Flexibility
Customer satisfaction received a high importance score (4.97)and is perceived to be a useful indicator for measuringperformance of the entire supply chain. In this research,customer satisfaction was defined as the degree to which thecustomers are satisfied with the products or services.However, this indicator is difficult to measure and turnedout to be too broad and ambiguous to meaningfully comparedifferent chain members. Therefore, it has been replaced withanother indicator. This replacement was carried out based onthe model developed by Kano et al. (1984), which states thatin order to increase customer satisfaction the customer mustbe delighted. Given that the product of our study is thetomato, there is a little variance between competing products,because it is a natural product (i.e. good, fresh product isimplied by the customer, not expressed). In order to increase
customer satisfaction, the customer needs to be delighted;therefore there is a need for customer-tailored, attractiverequirements for the product. The major attractiverequirement that came out of the case study is having alarge variety of the product (e.g. cherry tomato, cocktailtomato), which is captured by the indicator mix flexibility.Mix flexibility is the ability to change the variety of theproducts produced, which enables the firm to enhancecustomer satisfaction by providing the kinds of product thatcustomers request, in a timely manner. This indicator can be
easily measured by the number of different products that can
be produced within a given time period, and therefore has
been included in the framework.Volume flexibility received a high importance score (4.04):
it is measurable indicator and although it is currently only
measured by the breeder and by supermarkets, other supply
chain members have indicated the usefulness of this indicator.
Therefore, it is also included in the framework.
Responsiveness
Two indicators suggested in this category received a high
importance score (lead time 4.3 and customer complaints
4.09) are easily measurable and used by all chain members,
therefore, can be included in the framework.
Food quality
Two indicators of product quality have been included in the
framework. These two indicators are considered to be of a
high importance (appearance 4.94 and product safety 4.69).
These indicators are measurable and applicable for all chain
members. Although some indicators of process quality
received high scores of importance (e.g. traceability, storage
and transportation conditions, pesticide use, working
conditions), they are not included as separate indicators into
the condensed framework, because, as the respondents
suggested, these indicators are already included as basic
requirements in the quality certifications systems used by
firms.
Discussion and conclusions
This research evaluated a conceptual framework for
measuring performance of agri-food supply chains. The
framework is the first step to develop an integrated
performance measurement system, which contains financial
as well as non-financial indicators combined with the specific
characteristics of agri-food supply chains. The framework was
evaluated in a Dutch-German tomato supply chain which is a
complete chain starting from the breeder till the retailer.In this study we hypothesized that efficiency, flexibility,
responsiveness and food quality are the key performance
Figure 3 Resulting conceptual framework of agri-food supply chain performance with key performance indicators
Performance measurement in agri-food supply chains
Lusine H. Aramyan et al.
Supply Chain Management: An International Journal
Volume 12 · Number 4 · 2007 · 304–315
313
components that form base for an agri-food supply chain
performance measurement system. All interviewees agreedabout the necessity of these four categories within one
integrated performance measurement framework andevaluated the framework as complete for measuring
performance of an agri-food supply chain. This provides ananswer to the first research question. Some of the suggested
indicators such as transaction costs, backorders or emissionsare perceived to be unimportant for measuring the
performance of the chain. However, these indicators can beused in measuring performance at the organizational level, ifchain members perceive them important. The results show
that many performance measurement indicators are measuredin some links of the chain while they are not measured in
others, given the different objectives in the chain. Thisprovides an answer to the second research question.The most relevant indicators for measuring the
performance of the entire supply chain appeared to be costs,
profit, customer satisfaction, lead-time and the majority of theproduct quality indicators. Some of the indicators, though
perceived to be important, are not measured by supply chainmembers (e.g. delivery flexibility, and marketing indicators).The major argument for not measuring these indicators lies in
the difficulty of quantifying these measures.Based on these results, a condensed PMS framework for
agri-food supply chains has been suggested, where supplychain members, besides their own set of performance
indicators, are suggested to have a common set ofperformance indicators within four main categories, which
will help them to compare the performance within chainmembers and end performance of the chain. A similar multi-
level PMS was suggested by Van der Vorst in, 2000 (see theintroduction to this paper).The framework can be adjusted to each member of the
chain, based on the importance of the given indicators for
each chain member. By using the four main categories(efficiency, flexibility, responsiveness and food quality) withthe common set of key performance indicators for the entire
supply chain integrated into one measurement system, chainmembers have the choice to include or exclude additional
indicators in the system based on their own perceptions aboutthe importance of these indicators. So, the measurement
system can be designed for each link of the supply chain,where the main four categories with common set of key
performance indicators must be the same for each link, whileeach chain member may have additional own performance
indicators within categories given different objectives of thefirms. The performance measurement framework suggested inthis study allows supply chain members to develop a clear
view on performance of the entire supply chain, as well as onthe different aspects of the performance of their own
organization, which allows them to make tradeoffs betweendifferent aspects of performance (e.g. increased costs, but
higher quality products). The system allows for making acomparison between the categories to evaluate the
performance of the firms and the chain (e.g. if efficiencyincreases what happens to flexibility? What impact has
improved food quality on responsiveness and efficiency?).This system also allows observing the impact of, for example,policy implications/regulations or innovations on the whole
performance of the supply chain.Given the fact that the framework was evaluated in one
particular case study (i.e. the tomato supply chain), caution is
needed when generalizing the results. This chain consists of
relatively small growers and large breeding and wholesale
companies. Moreover, this chain is rather long. In other
chains some adjustments may need to be carried out in the
suggested framework with respect to the selection of (key)
performance indicators.In order to apply this framework, more empirical research
needs to be carried out. One difficulty with determining the
performance of the entire supply chain is the combination of
different indicators into a performance function that measures
overall performance. Given the fact that multiple indicators in
the framework have different dimensions, one of suitable
method of analysis could be the multi-criteria decision making
(MCDM) approach. This approach allows for the making of
explicit trade-offs between multiple indicators by installing
weighing factors for each indicator in an aggregating function.
Another approach could be the use of conjoint analysis. One
suggestion for future research is to build a performance
measurement system based on the framework developed in
this research, taking into account tradeoffs between multiple
indicators by means of MCDM. Another suggestion for
future research could be using this framework and conjoint
analysis to test the impact of different management systems
(e.g. quality assurance systems) on the performance of whole
agri-food supply chains.
Note
1 The questionnaire can be obtained upon request from the
corresponding author.
References
Aramyan, L., Ondersteijn, C., van Kooten, O. and Oude
Lansink, A. (2006), “Performance indicators in agri-food
production chains”, in Ondersteijn, C.J., Wijnands, J.H.,
Huirne, R.B. and van Kooten, O. (Eds), Quantifying the
Agri-food Supply Chain, Springer, Dordrecht, pp. 47-64.Beamon, B.M. (1998), “Supply chain design and analysis:
models and methods”, International Journal of ProductionEconomics, Vol. 55 No. 3, pp. 281-94.
Beamon, B.M. (1999a), “Measuring supply chain
performance”, International Journal of Operations
& Production Management, Vol. 19 No. 3, pp. 275-92.Beamon, B.M. (1999b), “Designing the green supply chain”,
Logistics Information Management, Vol. 12 No. 4, pp. 332-42.Berry, L. (2006), On Great Service: A Framework for Action,The Free Press, New York, NY.
Bititci, U.S., Carrie, A.S. and McDevitt, L. (1997),
“Integrated performance measurement systems:
a development guide”, International Journal of Operations& Production Management, Vol. 17 No. 5, pp. 522-34.
Bowersox, D.J. and Closs, D.J. (1996), Logistical Management:
The Integrated Supply Chain Process, McGraw-Hill, New
York, NY.Bunte, F., Mulder, M., Van Tongeren, F. and De Vlieger, K.
(1998), “Meting van de ‘performance’ van agrarische
productiekolommen”, Research Report No. 163, Dutch
Agricultural Economics Institute, The Hague.Christopher, M.G. (1998), Logistics and Supply Chain
Management: Strategies for Reducing Costs and Improving
Services, Pitman, London.
Performance measurement in agri-food supply chains
Lusine H. Aramyan et al.
Supply Chain Management: An International Journal
Volume 12 · Number 4 · 2007 · 304–315
314
Churchill, G.A. (1999), Marketing Research: Methodological
Foundations, The Dryden Press, Orlando, FL.Gunasekaran, A., Patel, C. and Tirtiroglu, E. (2001),
“Performance measures and metrics in a supply chain
environment”, International Journal of Operations
& Production Management, Vol. 21 Nos 1/2, pp. 71-87.Hobbs, J.E. (1996), “A transaction cost approach to supply
chain managment”, Supply Chain Management, Vol. 1 No. 2,
pp. 15-27.Kano, N., Seraku, N., Takahashi, F. and Tsuji, S. (1984),
“Attractive quality and must-be quality”, The Journal of the
Japanese Society for Quality Control, Vol. 14, April, pp. 39-48.Lai, K.H., Ngai, E.W.T. and Cheng, T.C.E. (2002),
“Measures for evaluating supply chain performance in
transport logistics”, Transportation Research, Part E: Logistics
and Transportation Review, Vol. 38 No. 6, pp. 439-56.Land- en tuinbouwcijfers (2004), Centraal Bureau voor de
Staitistiek (CBS), LEI, Wageningen University and
Research Center, Wageningen.Lee, H.L. and Billington, C. (1992), “Managing supply chain
inventory: pitfalls and opportunities”, Sloan Management
Review, Vol. 33, pp. 65-73.Li, D. and O’Brien, C. (1999), “Integrated decision
modelling of supply chain efficiency”, International Journal
of Production Economics, Vol. 59 Nos 1-3, pp. 147-57.Luning, P.A., Marcelis, W.J. and Jongen, W.M.F. (2002), Food
Quality Management: A Techno Managerial Approach,
Wageningen Academic Publishers, Wageningen.Persson, F. and Olhager, J. (2002), “Performance simulation
of supply chain designs”, International Journal of Production
Economics, Vol. 77 No. 3, pp. 231-45.Rosenau, M.D., Griffin, A., Castellion, G.A. and
Anschuetz, N.F. (1996), The PDMA Handbook of New
Product Development, Wiley, New York, NY.
Simons, R. (2000), Performance Measurement and ControlSystems for Implementing Strategy, Prentice-Hall, EnglewoodCliffs, NJ.
Supply Chain Council (2004), available at: www.supply-chain.org
Valeeva, N.I. (2005), “Cost-effectiveness of improving foodsafety in the dairy production chain”, PhD thesis,Wageningen University, Wageningen.
Van der Spiegel, M. (2004), “Measuring effectiveness of foodquality management”, PhD thesis, Wageningen University,Wageningen.
Van der Vorst, J.G.A.J. (2000), “Effective food supply chains.Generating, modelling and evaluating supply chainscenarios”, PhD thesis, Wageningen University,Wageningen.
Van der Vorst, J.G.A.J. (2005), “Performance measurement inagri-food supply chain networks. An overview”,in Ondersteijn, C.J., Wijnands, J.H., Huirne, R.B. andvan Kooten, O. (Eds), Quantifying the Agri-food SupplyChain, Springer, Dordrecht, pp. 13-24.
Van Hoek, R.I. (1998), “Measuring the unmeasurable –measuring and improving performance in the supplychain”, Supply Chain Management: An InternationalJournal, Vol. 3 No. 4, pp. 187-92.
Wijnands, J.H. and Ondersteijn, C. (2006), Quantifying theAgri-food Supply Chain, Springer, Dordrecht.
Womack, J. and Jones, D. (2002), Seeing the Whole: Mappingthe Extended Value Stream, Lean Enterprise Institute,Cambridge, MA.
Yin, R.K. (2003), Case Study Research, Design and Methods,3rd ed., Sage Publications, London.
Corresponding author
Lusine H. Aramyan can be contacted at: [email protected]
To purchase reprints of this article please e-mail: [email protected]
Or visit our web site for further details: www.emeraldinsight.com/reprints
Performance measurement in agri-food supply chains
Lusine H. Aramyan et al.
Supply Chain Management: An International Journal
Volume 12 · Number 4 · 2007 · 304–315
315
Related Documents