Opportunities For Agri-Food Chains To Become Energy-Smart NOVEMBER 2015 R. SIMS, A. FLAMMINI, M. PURI, S. BRACCO

Welcome message from author
This document is posted to help you gain knowledge. Please leave a comment to let me know what you think about it! Share it to your friends and learn new things together.
Transcript
Opportunities For Agri-Food Chains To Become Energy-Smart
NOVEMBER 2015
R. SIMS, A. FLAMMINI, M. PURI, S. BRACCO
ISBN 978-92-5-108959-0
The designations employed and the presentation of material in this
information product do not imply the expression of any opinion whatsoever
on the part of the Food and Agriculture Organization of the United
Nations (FAO), or of the PAEGC Founding Partners concerning the legal or
development status of any country, territory, city or area or of its authorities,
or concerning the delimitation of its frontiers or boundaries. The mention
of specific companies or products of manufacturers, whether or not these
have been patented, does not imply that these have been endorsed or
recommended by FAO, or the PAEGC Founding Partners in preference to
others of a similar nature that are not mentioned. The views expressed in this
information product are those of the author(s) and do not necessarily reflect
the views or policies of FAO, or the PAEGC Founding Partners.
FAO and USAID encourage the use, reproduction and dissemination of
material in this information product. Except where otherwise indicated,
material may be copied, downloaded and printed for private study, research
and teaching purposes, or for use in non-commercial products or services,
provided that appropriate acknowledgement of FAO and USAID as the
source and copyright holder is given and that FAO’s endorsement of users’
views, products or services is not implied in any way.
All requests for translation and adaptation rights, and for resale and other
commercial use rights should be made via www.fao.org/contact-us/licence-
request or addressed to [email protected].
FAO information products are available on the FAO website (www.fao.org/
publications) and can be purchased through [email protected]”
© FAO and USAID, 2015

Opportunities For Agri-Food Chains To Become Energy-Smart
NOVEMBER 2015
R. SIMS, A. FLAMMINI, M. PURI, S. BRACCO

OPPORTUNITIES FOR AGRI-FOOD CHAINS TO BECOME ENERGY-SMARTiv
ABOUT PAEGCIn 2012, The United States Agency for International Development (USAID), the Government of Sweden (SIDA), the Government of Germany (BMZ), Duke Energy Corporation, and the United States Overseas Private Investment Corporation (OPIC) (collectively, the “Founding Partners”) combined resources to create the Powering Agriculture: An Energy Grand Challenge for Development (PAEGC) initiative. The objective of PAEGC is to support new and sustainable approaches to accelerate the development and deployment of clean energy solutions for increasing agriculture productivity and/or value for farmers and agribusinesses in developing countries and emerging regions that lack access to reliable, affordable clean energy.
PAEGC utilizes the financial and technical resources of its Founding Partners to support its innovator cohort’s implementation of clean energy technologies and business models that: (i) Enhance agricultural yields/productivity; (ii) Decrease post-harvest loss; (iii) Improve farmer and agribusiness income generating opportunities and revenues; and/or (iv) Increase energy efficiency and associated savings within the operations of farms and agribusinesses - while stimulating low carbon economic growth within the agriculture sector of developing countries and emerging regions.
For more information, visit PoweringAg.org
OPPORTUNITIES FOR AGRI-FOOD CHAINS TO BECOME ENERGY-SMART v
TABLE OF CONTENTS
Foreword ............................................................................................................................................................................................. viiPreface ............................................................................................................................................................................................ viiiAcknowledgements ................................................................................................................................................................................... ixAbbreviations ...............................................................................................................................................................................................xExecutive summary ....................................................................................................................................................................................1
1 Clean energy solutions and rural development............................................................................................................19 1.1 Aims and objectives .............................................................................................................................................................21 1.2 Scope of the study ...............................................................................................................................................................22 1.3 Case studies .............................................................................................................................................................................25
2 Energy and the food value chain ........................................................................................................................................... 27 2.1 Value chain approach ......................................................................................................................................................... 28 2.1.1 Agri-food energy input trends ........................................................................................................................ 29 2.1.2 Energy in food losses and waste ................................................................................................................... 33 2.1.3 Scale of enterprise .................................................................................................................................................. 35 2.1.4 Access to energy ..................................................................................................................................................... 36 2.1.5 Cleaner value-chains ............................................................................................................................................. 37 2.2 Energy demand and supply technologies............................................................................................................... 41 2.3 Behavior and demand side management ............................................................................................................... 43 2.4 Cross-cutting low-carbon and energy demand efficiency options ........................................................ 45 2.4.1 Conservation agriculture ....................................................................................................................................46 2.4.2 Water pumping and irrigation ......................................................................................................................... 47 2.4.3 Heating ...........................................................................................................................................................................51 2.4.4 Cooling and cold storage ...................................................................................................................................54 2.4.5 Tractors and machinery ...................................................................................................................................... 57 2.4.6 Fertilizers and agri-chemicals ........................................................................................................................... 59 2.4.7 Transport and distribution of goods ............................................................................................................61 2.4.8 Processing and packaging ................................................................................................................................... 62 2.4.9 Use of information technology .......................................................................................................................66 2.5 Renewable energy supply options for, and from, the agri-food chain .................................................68 2.5.1 Renewable energy technologies .................................................................................................................... 69 2.5.2 Bioenergy ..................................................................................................................................................................... 69 2.5.3 Wind power ............................................................................................................................................................... 73 2.5.4 Solar photovoltaics ................................................................................................................................................. 74 2.5.5 Small and mini-hydro power ............................................................................................................................ 75 2.5.6 Current use of renewable energy in the agri-food chain ............................................................... 76 2.5.7 Mitigation and climate change impacts ...................................................................................................... 78 2.5.8 Economic assessment ........................................................................................................................................... 79 2.5.9 Policies for encouraging renewables in the agri-food sector ....................................................... 81

OPPORTUNITIES FOR AGRI-FOOD CHAINS TO BECOME ENERGY-SMARTvi
3 Milk value chain ................................................................................................................................................................................ 85 3.1 Global and regional production .................................................................................................................................. 85 3.2 Energy and water demand ..............................................................................................................................................91 3.2.1 Feed Production ...................................................................................................................................................... 93 3.2.2 Direct energy consumption ...........................................................................................................................101 3.2.3 Transport .................................................................................................................................................................. 100 3.2.4 Milk Processing and packaging...................................................................................................................... 100 3.3 Production and processing technologies .............................................................................................................102 3.4 Summary of key energy interventions .................................................................................................................. 104
4 Rice value chain ...............................................................................................................................................................................111 4.1 Global and regional production .................................................................................................................................111 4.2 Energy and water demand ........................................................................................................................................... 115 4.2.1 On-farm rice production ................................................................................................................................. 117 4.2.2 Processing ..................................................................................................................................................................120 4.3 Production and processing technologies .............................................................................................................126 4.4 Summary of key energy interventions ...................................................................................................................130
5 Vegetables value chain ...............................................................................................................................................................133 5.1 Tomatoes .................................................................................................................................................................................136 5.1.1 Global and regional production ...................................................................................................................136 5.1.2 Energy and water demand ..............................................................................................................................139 5.2 Beans ..........................................................................................................................................................................................148 5.2.1 Global and regional production ...................................................................................................................148 5.2.2 Energy and water demand ..............................................................................................................................153 5.3 Carrots ......................................................................................................................................................................................160 5.3.1 Global and regional production ...................................................................................................................160 5.3.2 Energy and water demand ..............................................................................................................................162 5.4 Summary of key energy interventions ...................................................................................................................166
6 Selected tools to assess suitability and profitability of energy interventions along the agri-food chain..........................................................................................................................................................169 6.1 Details of selected tools suitable for use in the agri-food chain ............................................................172 6.1.1 Value chain analysis ..............................................................................................................................................172 6.1.2 Techno-economic assessment (renewables and water) ...............................................................174 6.1.3 Bioenergy assessment ....................................................................................................................................... 180 6.1.4 On-farm assessments .........................................................................................................................................182
7 Knowledge gaps .............................................................................................................................................................................187
8 Conclusions and recommendations ..................................................................................................................................189
References ..........................................................................................................................................................................................191
OPPORTUNITIES FOR AGRI-FOOD CHAINS TO BECOME ENERGY-SMART vii
FOREWORDThe G7 summit in July 2015 emphasized the need for a broad scope of interventions appreciating that hunger and malnutrition are currently most prevalent in rural areas. The G7 aim to follow an integrated, multi-sectoral approach to support rural areas in developing their potential. Yet, they also appreciate that rural worlds around the globe are in transition. To influence this transition to become socially inclusive and ecologically sustainable is a precondition to pro-poor rural economic development. Furthermore, access to affordable, reliable, sustainable and modern energy for all is spelled out as Sustainable Development Goal 7. Hence, sustainable energy solutions for agriculture and food value chains are a central structural element to any support strategy for such inclusive rural development.
This is where Powering Agriculture: An Energy Grand Challenge for Development sets out to make a difference. The Initiative brings together the United States Agency for International Development (USAID), the Swedish International Development Cooperation Agency (SIDA), the German Federal Ministry for Economic Cooperation and Development (BMZ), Duke Energy, and the Overseas Private Investment Corporation (OPIC). These partners join forces and focus on increased agricultural productivity and value in developing countries by promoting clean energy solutions in agriculture and agri-food value chains.
However, only little data and evidence are available on the energy needs along particular value chains that root in agricultural production. Therefore it is often not easy to design a supportive framework for value chain development with the aim to increase productivity and value generated in rural areas.
In order to fill this gap, the study on hand highlights the potential opportunities for reducing the demand for fossil fuels and reducing greenhouse gas emissions in the value chains milk/dairy, rice and vegetables – all of them of central importance for human nutrition. The Powering Agriculture partners are glad to present the results from the collaborative work with the Food and Agriculture Organization of the United Nations.
This report aims to assist actors along the value chains, policy makers and other stakeholders in the agri-food industry to reduce the dependence on fossil fuels, reduce related greenhouse gas emissions, and become more resilient to possible future climate change impacts. I hope it may serve as a solid knowledge base that leads to better targeted rural development interventions aiming at increased productivity and value added locally and regionally.
Dr. Stefan Schmitz Deputy Director GeneralCommissioner for the “One World - No Hunger” InitiativeGerman Federal Ministry for Economic Cooperation and Development BMZ
OPPORTUNITIES FOR AGRI-FOOD CHAINS TO BECOME ENERGY-SMARTviii
PREFACEThe Food and Agriculture Organization of the United Nations (FAO) recognizes that the world’s agri-food supply chains are currently under pressure. For several decades, the production, processing and distribution of food have been highly dependent on fossil fuel inputs. There has also been an ever growing surge for food as the world population grows, along with the increasing demand for higher protein diets. As a result, the agri-food production and processing sector has become a major producer of greenhouse gas (GHG) emissions. FAO believes agriculture is central to mounting a transformational and effective response to climate changes issues, including for reducing GHG. As such, there is a need to increase energy efficiency and clean energy solutions in agri-food systems.
“Energy and climate-smart food systems” as well as sustainable agricultural production systems can become viable solutions for development and bring significant structural change in rural areas relying on clean energy solutions. However, addressing these challenges calls for better evidence to target actions and promote solutions. This concerns in particular, the amount and types of energy required at particular stages of the agri-food chain. We need more information on the forms of energy and technologies currently in use, as well as on practical alternative options to replace fossil fuels for heating, cooling and electricity generation with renewable energy systems. Such systems could increase energy end-use efficiency and better manage demand to drive rural economic development along more climate-friendly pathways.
This study, undertaken by a team of FAO experts in collaboration with our partners, addresses these information needs through a detailed analysis of the energy demand and possible clean-energy solutions (i.e., more than 100 technologies and measures) along three selected value chains: milk, rice and vegetables.
Findings also show that the current dependence on fossil fuel inputs by the agri-food industry results in around seven to eight percent of GHG emissions. These emissions can be reduced by both improved energy efficiency along the agri-food

OPPORTUNITIES FOR AGRI-FOOD CHAINS TO BECOME ENERGY-SMART ix
chain and the deployment of renewable energy systems to displace fossil fuels. Various co-benefits identified - improved health, time saving, reduced drudgery, water savings, increased productivity, improved soil quality and nutrient values, biodiversity protection, food security, and better livelihoods and quality of life - should be taken into account in any related policy development. As well, potential trade-offs also need to be carefully considered, in particular the use of more packaging materials to increase the shelf life of food products and ensuring that clean energy solutions do not compromise food production and food security. Moreover, what may be a suitable solution for an industrialized corporate farming system may not apply to a small family or subsistence farming systems. The challenge is to meet growing energy demands with low-carbon energy systems and to use the energy efficiently throughout the production, transport, processing, storage and distribution of food that takes into account the diversity of food production conditions.
This publication can assist farmers, farmer associations, practitioners, training institutions, food processing companies, policy makers and other stakeholders in the agri-food industry to reduce their dependence on fossil fuels, reduce related GHG emissions and become more resilient to possible future climate change impacts. It also provides a solid ground to assist international dialogue among agriculture and energy experts, organizations as well as companies and business associations to define selection criteria for clean energy support in food production.
FAO would like to thank the trust that the Partners of the Powering Agriculture Program have placed in the organization to undertake this important study and is committed to further contribute to the development of more “energy-smart” agrifood systems worldwide.
Maria Helena Semedo Deputy Director-General Natural Resources Food and Agriculture Organization of the United Nations
OPPORTUNITIES FOR AGRI-FOOD CHAINS TO BECOME ENERGY-SMARTx
ACKNOWLEDGEMENTS
This report was prepared by Ralph Sims (Massey University, New Zealand), Alessandro Flammini, Manas Puri, and Stefania Bracco (FAO Climate, Energy and Tenure Division) under the overall supervision of Olivier Dubois (Leader of the FAO Energy Team) and the technical supervision of Alessandro Flammini.
We would like to thank Karl Moosmann (GIZ), Ryan Shelby (USAID), and Frida Rodhe (SIDA) who provided insights, advice, and comments for the finalization of the report.
The work was carried out in the context of the project “The landscape where agriculture and energy meet” (GCP/GLO/594/GER). This project was funded by the German Corporation for International Cooperation (GIZ) on behalf of the German Federal Ministry for Economic Cooperation and Development as a contribution to the initiative “Powering Agriculture: An Energy Grand Challenge for Development”.
The Authors would also like to thank the team from the Powering Agriculture Support Task Order, implemented by Tetra Tech ES, Inc., for their assistance in finalizing the report, specifically Dr. Carolina Barreto for her technical contribution and Ms. Anna Perkinson for her assistance in editing the report.
OPPORTUNITIES FOR AGRI-FOOD CHAINS TO BECOME ENERGY-SMART xi
ABBREVIATIONS
AEZ Agro-Ecological Zones BEE Bio Chains Economic EvaluationBEFS Bioenergy and Food SecurityCDMA Code Division Multiple AccessCHP Combined Heat and PowerCIP Cleaning-In-PlaceCSP Concentrating Solar PowerDIT Diagnostic Tools for InvestmentEU European UnionFAO Food and Agricultural Organization of the United NationsFAOSTAT FAO Statistics DatabaseFEAT Farm Energy Analysis Tool FIT Feed-In-Tariff GDP Gross Domestic ProductGEF Global Environmental FacilityGHG Greenhouse GasGIZ Gesellschaft für Internationale ZusammenarbeitGMS Greater Mekong Sub-Region GPS Global Positioning SystemsHOMER Hybrid Optimization of Multiple Energy ResourcesHVAC Heating, Ventilation and Air ConditioningICT Information and Communication Technology IEA International Energy AgencyINI Investment Need IndexIPCC Intergovernmental Panel on Climate Change
IPI Investment Potential IndexK Potassium LAC Latin America and CaribbeanLEAP Long Range Energy Alternatives Planning SystemLNG Liquefied Natural GasLPG Liquefied Petroleum GasN NitrogenNENA Near East and North Africa P PhosphorusPV Photovoltaic RAPSim Renewables Alternative Power System SimulationRHR Refrigeration Heat Recovery Unit SSA Sub-Saharan AfricaUHT Ultra-high temperatureUK United KingdomUN United NationsUNESCO United Nations Educational, Scientific and Cultural OrganizationUNSD United Nations Statistics DivisionUSA United States of AmericaUSAID United States Agency for International Development USD United States DollarUSDA United States Department of AgricultureVCA Value Chain Analysis VMP Versatile Multi-Crop PlanterVSD Variable Speed Drive WEAP Water Evaluation and Planning System

OPPORTUNITIES FOR AGRI-FOOD CHAINS TO BECOME ENERGY-SMARTxii

OPPORTUNITIES FOR AGRI-FOOD CHAINS TO BECOME ENERGY-SMART 1
EXECUTIVE SUMMARY“In December 2015, at the 21st Conference of the Parties
organized by the United Nations Framework Convention
on Climate Change, we need to transform political
commitment into actions and results. That includes ensuring
the necessary funding to cover the cost of transition to food
systems that mitigate and adapt, that are more sustainable
and resilient to climate change”
Graziano da Silva FAO, Director General, 23 April, 2015
The world’s agri-food supply chains are being challenged. For several decades, the production, processing and distribution of food have been highly dependent on fossil fuel inputs (the exception being subsistence farmers who use only manual labor and perhaps animal power to produce food for their families that is then usually cooked on inefficient biomass cook-stoves). There has also been an ever growing demand for food as the world population grows, along with the increasing demand for higher protein diets. As a result, the agri-food production and processing sector has become a major producer of greenhouse gases (GHGs) (Fig. ES.1).
FIGURE ES.1. Indicative shares of the approximately 10 GtCO2-eq of total greenhouse gases emitted by the global agri-food sector in 2010. Sources: IPCC, 2014. 5th Assessment Report- Mitigation: Chapter 11, Agriculture forestry and other land use; Chapter 10, Industry; Chapter 8, Transport. FAO, 2011a.
Cooking/retail
Transport
Foodprocessing
IrrigationMachinery
Ruminants
Paddy rice
Fertilizer
Manure
Carbondioxide
Nitrousoxide
Methane
POST-HARVEST BEHIND THE FARM GATE

OPPORTUNITIES FOR AGRI-FOOD CHAINS TO BECOME ENERGY-SMART2
In addition, the projected impacts of climate change show it is likely that in many regions, current food supply systems will be threatened, especially where more frequent floods and droughts are predicted. So diminishing fresh and clean water supplies in some countries will become a major threat to sustainable food production that is already becoming constrained in some areas. Therefore food supply systems, including the availability of water for irrigation, need to become more secure whilst becoming more resilient to climate change impacts.
The land area and fertile soil available for crop and animal production is constrained, and it is actually shrinking in some regions, as the degraded land area increases, soil fertility declines. Further land use change through deforestation for agricultural production is no longer acceptable. Therefore, to meet the ever-growing food demand, the food productivity per hectare needs to be increased at the same time as energy, water, fertilizer and other inputs are reduced. As well as plant breeding to develop improved crop varieties, this can be achieved by more efficient production and processing systems and technologies that use energy more wisely and reduce waste of resources during each step of the process.
This Food and Agriculture Organization of the United Nations (FAO) report concentrates on the high dependence of energy inputs, particularly fossil fuels, at all stages along the various agri-food value chains. Emphasis is given to agricultural food production systems and the subsequent processing of raw food products into consumer products for the fresh, local and export markets. Direct energy inputs include petroleum fuels for tractors, harvesters, trucks and irrigation plants; electricity for motor drives, lighting, refrigeration, water pumping; and natural gas for water heating, steam raising, and process heat. Indirect energy inputs include those used for the manufacture and delivery of fertilizers and agri-chemicals. Indirect energy embedded in farm buildings and processing factories, machinery, equipment and fencing was not included. Transport, food retailing, cooking and waste disposal were also largely excluded from the analysis.
Since there are many different food value chains, only three were selected here as examples to demonstrate the potential opportunities that there are for reducing the demand for fossil fuels and reducing GHG emissions. They were milk, rice, and vegetables, the latter restricted to tomatoes (including greenhouse production), beans, and carrots, with various markets for each including fresh, canned, paste and frozen products.
This study aims to assist farm businesses, farmer associations, practitioners, training institutions, food processing companies, policy makers and other stakeholders in the agri-food industry to reduce their dependence on fossil fuels, reduce related GHG emissions, and become more resilient to possible future climate change impacts.
OPPORTUNITIES FOR AGRI-FOOD CHAINS TO BECOME ENERGY-SMART 3
WHAT DO WE KNOW?
• Demand for food will continue to grow as populations increase and higher protein diets are sought by many of the emerging middle classes in many countries.
• Global food supply and consumption is responsible for around one-third of the total annual end-use energy.
• The agri-food industry sector is heavily dependent on fossil fuel inputs for production, transport, processing, and distribution.
• Around one-fifth of the total annual global greenhouse gas emissions are emitted by the food sector (without considering emissions due to land use change).
• The energy demand by sector will continue to grow steadily with increasing food demand.
• Worldwide, we fail to consume around one-third of the food we produce; this corresponds to more than one-third of the energy supplied along the food chain. Much of this food is dumped, so it neither ends up in landfills where the resulting methane gas can be captured and utilized, nor can it be processed into biogas or other forms of bioenergy.
• Energy saving opportunities are numerous at every step along each agri-food chain through improved energy efficiency and using energy more wisely to avoid wasting it. Many investments result in cost savings whilst also avoiding sufficient GHG emissions, this can result in negative costs in terms of USD/t CO2-eq avoided.
• There are many opportunities to displace fossil fuels with renewable energy systems and gain multiple co-benefits including cost savings, access to modern energy systems, treatment of organic wastes, improved human health, local employment opportunities, social cohesion of communities, improved livelihoods, sustainable development, as well as reduced GHG emissions.
The main challenge for the agri-food sector is to decouple fossil fuel energy inputs (both for production and processing as well as indirect inputs) from the increasing demands for food supply in the short term while ensuring food security.
WHAT DO WE NOT KNOW?
• The impacts of climate change on food production and water supply are likely to be significant but their true extent, and the regions that will be hardest hit, remain uncertain, even though now better understood1. Most likely more energy will be needed to increase active management in agriculture to become more resilient to more extreme weather events.
1. IPCC 5th Assessment Report 2014 –Impacts, Adaptation, Vulnerability. http://ipcc-wg2.gov/AR5/

OPPORTUNITIES FOR AGRI-FOOD CHAINS TO BECOME ENERGY-SMART4
• The future costs of oil, gas, and coal will continue to fluctuate but how much they might increase due to scarcity, or as a result of an international price on carbon, and by when, are unknown. Poor farmers who rely on direct or indirect energy inputs are often the first to be hit by energy price rises.
• The operating performance of renewable energy technologies for heating, cooling, electricity, and transport has largely improved in recent years, and installed capacity costs have declined as a result of greater experience through the learning curve. However, it is not known at what rate technological improvements will continue and enable renewables to become even more competitive with fossil fuel technologies.
HOW CAN WE REDUCE THE ENERGY DEMAND AND GHG EMISSIONS OF THE AGRI-FOOD CHAIN?
A range of energy intensive technologies are common to many food chains and each provides opportunities to reduce GHG emissions.
• Conservation agriculture is an approach to manage ecosystems for improved and sustained productivity by minimizing mechanical soil disturbance, providing permanent soil cover to maintain moisture content, and diversifying crop species grown in rotation. Reduced energy can result from less fuel used for tillage, less power for irrigation, and less indirect energy needed for weed control per unit of produce. However, any GHG and cost savings will be offset if lower crop productivity results.
• Water pumping for drinking water, irrigation, and food processing consumes a lot of energy, usually by the use of either electricity or diesel for internal combustion engines, to power the pumps. Solar and wind-powered pumps are growing in popularity and should be encouraged where good solar and wind renewable energy resources exist. Energy demands for irrigation can be reduced by:
• using gravity supply where possible;
• using efficient designs of electric motors;
• sizing pumping systems to the crop’s actual water requirements;
• choosing efficient water pump designs that are correctly matched to suit the task;
• performing pump maintenance regularly;
• using low-head distribution sprinkler systems or drip irrigation in row crops;

OPPORTUNITIES FOR AGRI-FOOD CHAINS TO BECOME ENERGY-SMART 5
• monitoring soil moisture to guide water application rates;
• choosing appropriate and drought resistant crop varieties;
• using weather forecasts when applying water on a rotational basis to different fields;
• varying irrigation rates across a field to match the soil and moisture conditions by using automatic regulation control systems based on Global Positioning Systems (GPS);
• conserving soil moisture after application through mulch, tree shelter belts, etc.; and
• maintaining all equipment, water sources, intake screens etc. in good working order (hence minimizing system inefficiencies).
• Heat to obtain hot water, pasteurized milk, warm greenhouses, dried fruits and vegetables, canned food, and for other food processes, is normally produced from the combustion of natural gas, coal, oil, biomass, or from electrical resistance heaters. To reduce energy demands, the heat can be used more efficiently and by reducing the heat losses within a system by, for example, heat exchangers taking heat out of milk to pre-heat water. In all cases, the heat can be provided from solar thermal, geothermal or modern bioenergy heat plants, or from efficient designs of heat pumps.
• Cooling and cold storage are used widely to maintain food quality both after harvesting and processing and to reduce losses along the supply chain. Refrigeration systems depend on reliable electricity supply systems although new technologies such as solar absorption chillers are reaching the market. Other sources of renewable electricity can be used on both small and large scales. For cold stores, reducing energy demand is possible through such measures as increasing the insulation, keeping access doors closed, and minimizing the heat load at the end of the processing phase of the cold chain.
• Tractors and machinery can produce similar power outputs using less fuel where engines are maintained, tire pressures are correct, unnecessary ballast for the task is removed, and the operator understands how to optimize tractor performance through correct gear and throttle selection as well as the use of the hydraulic systems. A well-trained operator can save up to 10% fuel and 20% of time sitting on the tractor as well as reduce damage to soil through compaction or wheel-slip.
• Fertilizers (including nitrogen, phosphorous, NPK and potash blends) have much embedded energy during manufacture which can be reduced by improved efficiencies at the manufacturing plant, but also by more accurate application methods. Recommendations to reduce energy inputs in fertilizer use include:
OPPORTUNITIES FOR AGRI-FOOD CHAINS TO BECOME ENERGY-SMART6
• growing nitrogen-fixing legume crops as green crops;
• selecting an NPK fertilizer of the desired nutrient value after undertaking soil or leaf analysis;
• applying at the calibrated rate as determined by the soil or leaf analysis test results;
• applying smaller amounts whenever the crop can respond to give greater productivity;
• applying liquid fertilizers, including through injection, directly into irrigation water;
• using organic manures where available, including the effluent arising from food processing plants and the sludge from biogas plants; and
• using precision agriculture techniques based on GPS controlled equipment and an assessment of soil type variations.
• Transport and distribution of food varies with distance and markets. Air-freighting fresh food across the world to meet demand for out-of-season products is highly energy dependent compared with supplying local markets with fresh food when available. Transport of food commodities such as milk powder or rice in bulk, and also fruit and vegetables such as apples, bananas, potatoes, carrots etc. at times under controlled atmosphere or refrigeration, can be relatively cheap with a low-carbon footprint per tonne. In rural areas of developing countries, improving the roads can help reduce the energy and time needed to take fresh products to markets and hence improve local livelihoods.
• Processing of food at either the small-to-medium enterprise or large business scale requires energy for heating, cooling, lighting, packaging, and storing. The energy needed for such ‘beyond the farm gate’ operations globally totals around three times the energy used ‘behind the farm gate’ (Fig. ES.1). In many processing plants, an energy audit by a trained specialist would identify cost-effective opportunities to reduce energy demand whilst increasing throughput and quality.
• Renewable energy can substitute fossil fuel inputs for power (heat and electricity) all along the value-added chain where good local resources exist. This can be achieved using grid electricity with a growing share of renewables, or by installing solar photovoltaic (PV), solar thermal, wind power, or bioenergy for heat and power on the farm or at the processing plants. Since organic wastes are often produced both on-farm and at the processing plant, investments in anaerobic digestion plants to produce biogas that can be used to provide heat, power or transport fuels has been widely deployed.

OPPORTUNITIES FOR AGRI-FOOD CHAINS TO BECOME ENERGY-SMART 7
The fishing industry is not detailed in this study but can also become more energy-smart along the entire food chain, particularly by reducing fuel consumption of large and small fishing vessels. This will help the industry cope with the volatility and rising trends of fuel and energy prices and to ensure fish remain available at accessible prices (FAO, 2012). For example, fouling (i.e. marine weed growth on the hull of a fishing vessel), can contribute to an increase in fuel consumption of up to 7% after only one month and 44% after six months, but can be reduced significantly through the use of anti-fouling paints. In addition, reducing 20% of the speed in a fishing vessel could reduce up to 51% of fuel consumption (FAO, 1999; FAO, 2011a).
As a result of failing to consume around one-third of the food we produce, the waste of inputs of energy, water, land use, and labor is well understood2, so this is only briefly mentioned in this study. Reducing GHG emissions by changing diets and moving away from red meat consumption, dairy products, and reducing obesity have been mooted. Such behavioral change would be difficult to achieve without drastic measures being imposed. Indeed, the trend is going in the other direction with the incidence of obesity exceeding starvation and the growing demand for higher protein diets in countries such as India and China.
Reducing GHG emissions from animal farming (mainly nitrous oxide from manure and urine, and methane from enteric fermentation of ruminants) can be achieved to a limited extent by breeding, selection of feed, improved conversion efficiency, and manure management. The potential has been well summarized in a recent FAO report (Gerbet et al. 2013) and so is not covered further here.
WHERE ARE THE VARIOUS CLEAN ENERGY SOLUTIONS BEST INTRODUCED ALONG THE AGRI-FOOD CHAINS?
There are various scales of enterprises operating within the global food sector ranging from large corporate industries, small and medium enterprises, family-owned and operated farms and businesses, down to subsistence farmers trying to feed their families so they can survive.
Different clean energy solutions exist for both:
• the more energy intensive operations that can look to improve their activities by higher efficiencies; and
• the millions of small family and subsistence farmers who could improve their livelihoods and achieve greater productivity per hectare, or per labor unit, by gaining energy access through modern low-carbon systems.
2. See for example FAO, 2011a, Energy-smart food for people and climate; Gustavsson et al., 2011
OPPORTUNITIES FOR AGRI-FOOD CHAINS TO BECOME ENERGY-SMART8
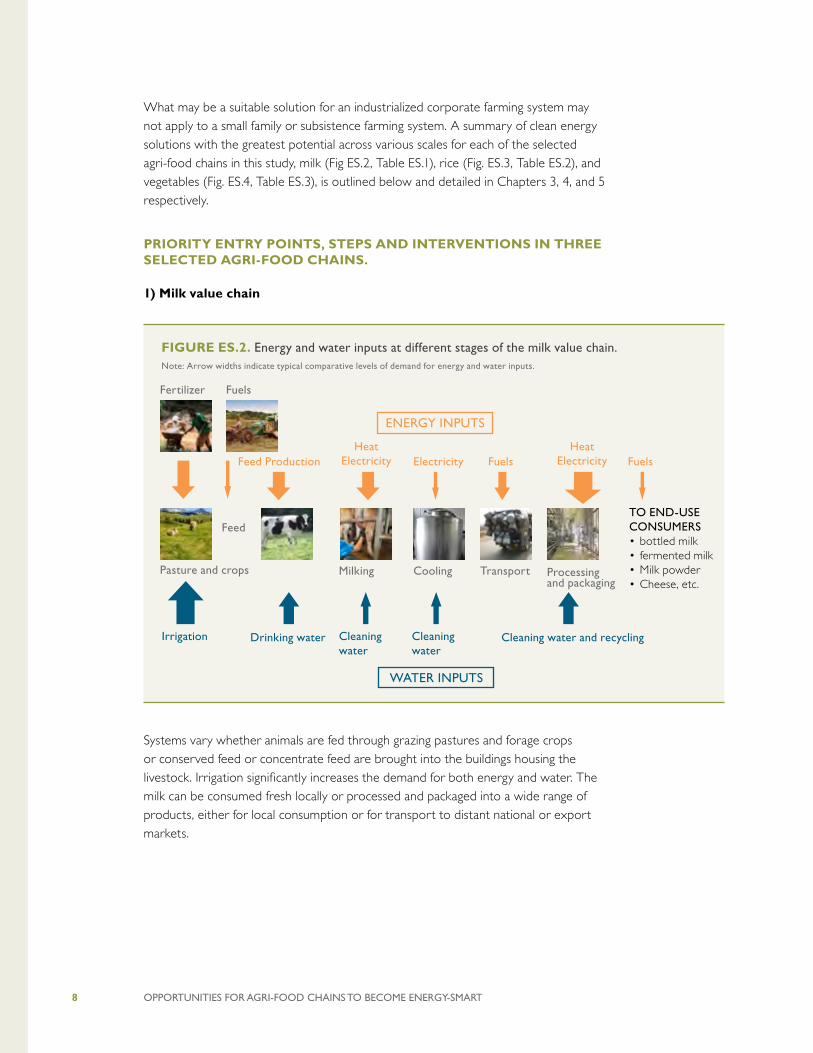
What may be a suitable solution for an industrialized corporate farming system may not apply to a small family or subsistence farming system. A summary of clean energy solutions with the greatest potential across various scales for each of the selected agri-food chains in this study, milk (Fig ES.2, Table ES.1), rice (Fig. ES.3, Table ES.2), and vegetables (Fig. ES.4, Table ES.3), is outlined below and detailed in Chapters 3, 4, and 5 respectively.
PRIORITY ENTRY POINTS, STEPS AND INTERVENTIONS IN THREE SELECTED AGRI-FOOD CHAINS.
1) Milk value chain
Systems vary whether animals are fed through grazing pastures and forage crops or conserved feed or concentrate feed are brought into the buildings housing the livestock. Irrigation significantly increases the demand for both energy and water. The milk can be consumed fresh locally or processed and packaged into a wide range of products, either for local consumption or for transport to distant national or export markets.
FIGURE ES.2. Energy and water inputs at different stages of the milk value chain. Note: Arrow widths indicate typical comparative levels of demand for energy and water inputs.
Fertilizer Fuels
Feed ProductionHeat
Electricity Electricity FuelsHeat
Electricity Fuels
Drinking water Cleaning water
Cleaning water
Processing and packaging
Cleaning water and recyclingIrrigation
Pasture and crops Milking
Feed
Cooling Transport
ENERGY INPUTS
WATER INPUTS
TO END-USE CONSUMERS• bottled milk• fermented milk• Milk powder• Cheese, etc.

OPPORTUNITIES FOR AGRI-FOOD CHAINS TO BECOME ENERGY-SMART 9
TABLE ES.1. Summary of low carbon mitigation options specific to milk production.
Energy demands
Energy efficiency options Renewable energy options Comments
PRODUCTION
Animal feed production from grazing and crops
Fertilizer use. Precision application. Organic fertilizers.
Use of crop residues for heat and power.
Feed may be produced off-farm and bought in thereby adding a transport cost.
Tractor and machinery performance.
Fuel efficient tractors (European standard). Operator education.
Biodiesel powered tractors and harvesters.
A number of fuel saving options are under the operator’s control.
Irrigation. Apply water only as needed.Proper pump/motor sizing according to water demands. GPS sprinkler controls.
Solar/wind water pumping. Biodiesel-fueled engines for driving pumps.
Drip irrigation may be suitable for row crops but not for pasture.
On-farm milking
Milk harvesting. Variable speed drive motors on vacuum and milk pumps.
Biogas from anaerobic digestion of manure for heat and electricity.
Biogas option depends on scale and cost of labor to maintain and operate the plant.
Milk cooling. Pre-cooling of milk and heat exchanger for hot water.
Standard practice to pre-cool milk before storing in refrigerated milk tank ready for collection. On small scale, milk kept cool in churns by spraying with cold water.
PROCESSING
Thermal treatment
Pasteurization, thermization, and homo-genization .
Real time monitoring of heat energy use. Recovering steam for heating. Recovering waste heat from milk chillers.
Concentrating solar power (CSP) or bioenergy for heat generation. Evaporative coolers using solar PV panels.
Wide range of standard energy efficiency options for motors, fans etc.
Drying and cooling.
Improved technology designs of dryers.
PV-powered refrigerators (solar chillers). Bioenergy heat such as from wood pellets.
Drying for milk powder production requires high temperatures and a reliable heat supply.
Water usage Water used in cleaning-in-place (CIP).
Water recycling and reuse. Using on-demand hot water systems rather than storage tanks.
Wastewater produced from dairy processing can be recycled to produce biogas for heat, electricity or transport fuels.
Raw biogas is corrosive so can be scrubbed of H2S for use in engines.
TRANSPORT
Diesel fuel use. Implementing sustainability measures (such as EURO standard vehicles). Route optimization. Reducing idle time. Selecting optimum truck size for the load. Driver education.
Liquid biofuel or biogas powered vehicles. Electric heavy duty vehicles beginning to reach the market.
Good truck operators use less fuel. Driver training courses exist.

OPPORTUNITIES FOR AGRI-FOOD CHAINS TO BECOME ENERGY-SMART10
2) Rice value chain
The practice of rice intensification focuses on increasing rice yield while at the same time reducing the use of water and other resources. It also encourages the use of organic manure or vermicomposting as a means of providing nutrients to the soil. Water use is minimized by keeping the soils moist rather than flooding which minimizes anaerobic conditions, reduces methane emissions, and increases soil organism diversity.
Renewable electricity and heat can be used in the field as well as in rice mills at both large and small scale for water pumping, drying, lighting etc.
Any intervention which causes a decrease in MJ of fossil energy consumed/kg of rice produced, or liters water consumed/kg of rice produced, without reducing productivity may be considered successful. Such interventions may not necessarily be oriented around the use of renewable energy.
FIGURE ES.3. Energy and water inputs at different stages of a typical rice value chain, though these vary whether mechanized (top photos) or use mainly manual inputs and whether the rice product is destined for local storage and consumption or for transport, sale or export.Note: Fertilizer is an indirect energy input but others, such as energy embedded in machinery manufacture and building construction, are lower and not shown. Arrow widths indicate typical comparative levels of demand for energy and water inputs and also depict the common use of rice husks as a fuel for generating bioenergy heat and power for use on-site of for export.
Water Pumping
Fuels, wind, solar or gravity
Fuels Fertilizer Fuels ElectricityTransportpaddy rice
Heat Electricity
Heat Electricity
Fuels
Drying - artificial Rice mill Rice husks
Transport
Cultivation/planting
Crop management
Harvest
Cleaning water (recycled?)
Irrigation
ENERGY INPUTS
WATER INPUTS
Threshing Parboilling paddy rice
Drying - natural
Processing and packaging
TO END-USE CONSUMERS
White rice
Biomass Heat

OPPORTUNITIES FOR AGRI-FOOD CHAINS TO BECOME ENERGY-SMART 11
TABLE ES.2. Summary of low carbon mitigation options specific to rice production.
Energy demands
Energy efficiency options
Renewable energy options
Comments
PRODUCTION
Fertilizer use Precision application. Organic fertilizers.
Matching fertilizer use to crop and soil requirements and increasing nitrogen use efficiency.
Tractor and machinery performance.
Fuel efficient tractors (European standard).Operator education.
Biodiesel powered tractors and harvesters.
There is a range of fuel saving options under the operator’s control.
Irrigation. Apply water only as needed.
Solar/wind water pumping. Biodiesel-fueled engines for driving water pumps.
Flood irrigation using gravity where possible. Water use and energy inputs can be reduced by measuring and matching the soil moisture and water rate.
Micro-hydro power generation.
Are often suitable streams near the rice fields.
PROCESSING
Mechanical Pasteurization, thermization, and
Real time monitoring of heat energy use. Recovering steam for heating. Recovering waste heat from milk chillers.
Concentrating solar power (CSP) or bioenergy for heat generation. Evaporative coolers using solar PV panels.
Wide range of standard energy efficiency options for motors, fans etc.
Drying and cooling.
Improved technology designs of dryers.
PV-powered refrigerators (solar chillers). Bioenergy heat such as from wood pellets.
Drying for milk powder production requires high temperatures and a reliable heat supply.
Thermal treatment
Drying. Improved technology designs of dryers. Real time monitoring of heat energy use. Recovered heat for pre-heating air.
Solar direct drying. Solar to pre-heat boiler feed water. Bioenergy heat from rice husks or wood pellets.
Drying requires low to medium temperatures and a reliable heat supply. Ash residues can have value for brick making etc.
Parboiling. Improved efficiency of husk fueled furnaces designed to reduce air, water and land pollution.
Solar heat to heat water or parboil rice on-farm or before the milling process.
Depending on location, for heating water, approximately 50 % energy consumption reduction is possible using solar thermal systems.
Heat and power generation
On-site at mill. Combustion or gasification of rice husks or rice straw.
Cogeneration of heat and power using rice husks is commercially viable in many rice mills. Surplus power can be sold and exported to grid if nearby connection is available.
TRANSPORT
Diesel fuel use. As for milk chain.

OPPORTUNITIES FOR AGRI-FOOD CHAINS TO BECOME ENERGY-SMART12
3) Vegetables value chain
Vegetable wastes and by-products from processing are available in large quantities throughout the world. For example processing, packing, distribution and consumption of fruit and vegetables in India, the Philippines, China and the United States of America generate about 55 Mt of waste that could be recycled through livestock as feed resources, further processed to extract or develop value-added products, or anaerobically digested to produce biogas.
FIGURE ES.4. Energy and water inputs at different stages of selected vegetable value chains, whether as mechanized production in large fields for processing (top photos), in heated or unheated greenhouse production (middle photos), or in smaller scale market gardens with mainly manual operations (bottom photos) for local. Note: Arrow widths indicate typical comparative levels of demand for energy and water inputs.
Water Pumping
Fuels, wind, solar or gravity
Irrigation
ENERGY INPUTS
WATER INPUTS
TO END-USE CONSUMERS
Crop Management Harvest Transport Process water
Cleaning water (recycled?)
Cultivation/planting
FuelsFuels Fuels
Electricity
Heat ElectricityFertilizer
Processing and packaging
Cooling
Biogas from wet washes
Used for heat and power genertation
PROCESSED
GREENHOUSE
MARKET GARDEN
Heat

OPPORTUNITIES FOR AGRI-FOOD CHAINS TO BECOME ENERGY-SMART 13
TABLE ES.3. Summary of low carbon mitigation options specific to vegetable production.
Main energy demands Energy efficiency options
Renewable energy options
Comments
PRODUCTION
Tractor performanceOperation of machinery.
Regular maintenance.Educate drivers.
Biodiesel fuels. Driver training can save 10% of fuel and time in the seat.
Integrated pest management.
Reduces use of agri-chemicals and number of applications.
Precision irrigation. Solar water pumps.
Greenhouses - unheated
Hydroponic production.
Advanced air circulation fan designs.
Carbon dioxide enrichment using bioenergy heaters.
Reduces artificial fertilizer use. Uses all the floor area for plants not pathways by using gantries.
Greenhouses - heated
Combined heat and power (CHP). Heat recovery. Heat pumps.
Solar heated greenhouses.Geothermal or bioenergy for heat.
Displacing coal or gas with renewable heat is becoming common practice.
PROCESSING
Hydrothermal treatment.
Wet residues for anaerobic digestion.
By-products reuse. Heat and water recovery.
Process wastes used for generating biogas for cogeneration, heating, transport.
By-products suitable for bioenergy use compete with use as animal feeds, compost etc.
Recycle water. Save water pumping. Used for other cleaning cycles, for irrigation or for cleaning the work-place.
Cooling/refrigeration.
Evaporative cooling.Liquid air refrigeration.Pre cooling methods.
Evaporative coolers use solar PV panels. Solar chillers /refrigerators.
Heat Water heating. Solar water heating.Bioenergy as pellet boilers.Geothermal heating.
Geothermal steam only available in a few areas but ground source heat pumps an option anywhere.
Drying Recirculation of air in dryer.Pulsed fluid-bed drying.
Solar cabinet dryer with forced circulation. Geothermal drying.
Same as above.
Freezing Hydro-cooling before freezing.
Packaging Use bio-based resources, for alternative packaging.Eco-design.
Avoid plastics by “green chemistry”
OPPORTUNITIES FOR AGRI-FOOD CHAINS TO BECOME ENERGY-SMART14
A number of key energy interventions can be identified which are common to the three vegetable value chains. These include:
• combined heat and power (CHP) and heat recovery for greenhouse production;
• water recycling and re-use, for instance, the use of processing wastewater to irrigate fields;
• optimizing refrigeration cooling and freezing systems;
• extraction of by-products from processing wastes for bioenergy, animal feed and other uses;
• organic wastes used as feedstock in anaerobic digesters to produce biogas to be used for cogeneration, heating (for processing companies, businesses or communities) or for transport; and
• solid wastes with high nutritional values resulting from processing vegetables utilized for animal feed or in producing quality compost to replenish soil nutrients and carbon stocks.
WHAT TOOLS ARE AVAILABLE TO HELP ASSESS THE PROFITABILITY OF CLEAN ENERGY INVESTMENTS?
The possible energy interventions along the agri-food chain are numerous and sometimes there is a need to prioritize them on the basis of certain criteria. Several tools are available (many are free downloads) to assist decision making on energy interventions in order to assess the most suitable and/or profitable options (see Chapter 6). Most of these decision support tools are general and can be applied to assess energy interventions across sectors, such as the economic effects of an energy efficiency improvement, or of changing a fossil fuel energy supply source with renewables.
A range of tools were evaluated for their suitability (Table ES.4) to assess possible interventions along the agri-food value chains, including both on-farm production and food processing. In order to assess the impacts along a specific value chain, FAO has developed a Value Chain Analysis (VCA)3 tool for decision-making that can be used for project-level decisions. Analyzing impacts of policy options through value chains provides policy makers and other stakeholders with anticipated evidence on likely changes directly induced by policies. Other tools are specific for farm operations and, although not fully refined, can be used for techno-economic analysis of both energy interventions and bioenergy production on-farm, thus assessing how farm operations would be affected by a change in direct or indirect energy inputs, including the associated costs.
3. VCA is the assessment of a portion of an economic system where upstream agents in production and distribution processes are linked to downstream partners by technical, economic, territorial, institutional and social relationships.
The effects of policies targeting specific production processes extend their primary impacts in the economic system according to the same path as the main inputs and outputs.

OPPORTUNITIES FOR AGRI-FOOD CHAINS TO BECOME ENERGY-SMART 15
A techno-economic tool usually informs about the cost, feasibility and mitigation potential of an intervention, but often fails to assess the direct and indirect effects and whether effects are intended or not. For example, an intervention could have an adverse impact on environmental and social sustainability or on other natural resources not expressly under consideration, such as soil quality in the case of biomass removal, groundwater quality in the case of geothermal energy generation, hydraulic fracturing for oil and gas extraction, downstream users in the case of mini-hydro power, as well as irrigation including solar or wind water pumping. Such tools for assessing both agri-food and energy supply can be used in an integrated and iterative way to correctly size and match the components of a system since, for example, renewable energy systems often tend to be oversized and therefore relatively uneconomic.
WHICH CO-BENEFITS CAN BE TAKEN INTO ACCOUNT ALONG WITH CLIMATE CHANGE MITIGATION?
There are many opportunities to displace fossil fuels with low-carbon renewable energy systems to gain multiple co-benefits alongside GHG mitigation. These include cost savings, time savings, access to modern energy systems, sustainable development, treatment of organic wastes, avoidance of depleting constrained resources such as water and soil nutrients, as well as improving human health, local employment opportunities, soil structure, social cohesion of communities, and livelihoods.
An evaluation of all such relevant co-benefits along with any dis-benefits (such as possible lower vegetable crop productivity resulting from minimum tillage), and trade-offs (i.e. using more packaging materials to increase the shelf life of food products and reduce food waste) needs assessment for each value-chain.
TABLE ES.4. Selected tools suitable for assessing low-carbon agri-food energy options
Type of Assessment Tool
Value Chain Analysis FAO Value Chain Analysis
Techno-economic assessment of energy interventions at various steps of the agri-food chain
RETScreen (Software Suite)
HOMER
RAPSim
Energy Efficiency Benefits Calculator
Diagnostic Tools for Investment (DIT)
Power Irrigation Tool
Bioenergy techno-economic assessment (biomass from agricultural sources)
BEFS Rapid Appraisal (Software Suite)
Bio chains Economic Evaluation (BEE)
On-farm assessmentFARMDESIGN
Farm Energy Analysis Tool (FEAT)

OPPORTUNITIES FOR AGRI-FOOD CHAINS TO BECOME ENERGY-SMART16
Whether in developed or developing countries, most farmers or businesses gain few benefits, if any, simply from reducing GHG emissions as part of their activities. Until a carbon price, possibly through an international emissions trading scheme, provides some form of incentive, or regulations are imposed, then the present drivers for the uptake of low-carbon technologies and systems are the co-benefits. Where valuable co-benefits exist and are recognized to have a perceived or real value, then government intervention may not be needed, other than perhaps to undertake educational programs and promotion to the general public.
As well as GHG mitigation potential, various other co-benefits resulting from renewable energy project deployment can be considered including realizing improvements in air pollution, health, energy access, energy security, water use, capacity building and employment opportunities. These should be drivers for supporting policies being implemented by local, regional, state, and national governments.
It is apparent that the co-benefits from climate change mitigation activities throughout the agri-food chain are key factors in developing supporting policies in close association with health, water, land use, food, and transport policies. However, there is a need for targeted action in support of such developments in order to obtain better evidence of the co-benefits (and any dis-benefits) resulting from supporting clean energy systems.
WHAT ARE THE GAPS IN THE KNOWLEDGE?
Additional knowledge is needed for a range of commodities concerning the amount and types of energy inputs at particular stages along the agri-food chain and the entry points of various energy technologies. The data for water use and volumes consumed during food processing operations is very uncertain given that the few global datasets available do not cover all countries.
For individual food chains in general, there are few comparisons available concerning the energy use for different methods of transport of the products from the field and to the markets. A techno-economic tool usually informs about the cost, feasibility and mitigation potential of an intervention, but they often fail to assess the direct and indirect effects of an intervention on environmental and social sustainability or on other natural resources.
OPPORTUNITIES FOR AGRI-FOOD CHAINS TO BECOME ENERGY-SMART 17
WHERE TO GO FROM HERE?
The current dependence on fossil fuel inputs by the agri-food industry and their GHG emissions can be reduced by improved energy efficiency along the length of the agri-food chain and the deployment of renewable energy systems to displace fossil fuels and to provide access to modern energy. Various co-benefits also arise and should be accounted for in any policy development. There are many opportunities for farmers and food processing companies to reduce energy end-use inputs and hence costs in their food production and processing operations. The energy intensity of many processing plants can be more than 50% higher than necessary due to outdated technologies, poor energy efficiency systems when benchmarked against the best available technologies, other business priorities, and a lack of understanding. This provides a significant opportunity for reducing energy demand and any associated GHG emissions if supplied by fossil fuels. Improved energy efficiency can also benefit the uptake of renewable energy systems since installed capacity can be reduced and hence costs minimized. The provision of energy auditors and training schemes is needed for farmers and businesses.
Sustainable agriculture production systems and “energy-smart” agri-food processing and delivery systems can be pragmatic and cost-effective solutions for sustainable development. They can also bring significant structural changes, improved livelihoods, and enhanced food security to rural communities in many countries. However, there is a need for targeted action in support of such developments in order to obtain better evidence of the co-benefits and dis-benefits resulting from supporting clean energy systems. Potential trade-offs also need to be carefully considered such as a saving on water volumes applied by the use of drip irrigation being offset by the need to use additional energy for water pumping (if gravity feed is no longer possible).
A range of existing tools have been identified that can enable data-based decision making to be better achieved as well as to assess the profitability of a proposed investment in a clean energy solution. Prioritizing such tools is not possible in general terms, so assistance with selection of the most suitable tool for any given purpose and location after careful deliberations would be useful.
For non-industrialized agri-food systems, access to modern energy and increased energy inputs can lead to greater food security and improved livelihoods for the rural poor. The challenge is to meet such growing energy demands with low-carbon energy systems and to use the energy efficiently such that fossil fuel inputs are decoupled from the increased production, transport, processing, storage and distribution of food.

CLE
AN
EN
ERG
Y S
OLU
TIO
NS
AN
D R
UR
AL
DEV
ELO
PMEN
T
OPPORTUNITIES FOR AGRI-FOOD CHAINS TO BECOME ENERGY-SMART 19
1. CLEAN ENERGY SOLUTIONS AND RURAL DEVELOPMENTTo increase the productivity of agri-food systems and meet the global food demand of a growing world population over the past century, energy inputs have played a crucial role, both on the farm and beyond the farm gate. Over the past century and before, an increasing dependence on fossil fuel inputs along the entire agri-food chain has enabled the growing food demand of the world to be largely satisfied.
Traditionally, the substitution of manual labor and animal power with internal combustion engines installed on two and four wheel tractors and fueled by petroleum fuels has enabled demand for on-farm, mechanical power services to be met. Natural gas and oil have been consumed to manufacture chemical fertilizers and pesticides. Transport of food products to markets and to processing plants is largely dependent on diesel and gasoline inputs to fuel trucks, boats and planes. Heat demands for food processing and packaging plants are usually met by natural gas, heating oil, and coal. Grid electricity systems (essential where available for refrigeration, lighting, motor drives etc. but not always available or reliable in rural areas of developing countries), typically have a high share of thermal power stations, fueled by gas and coal, in the electricity mix. Diesel engine-fired power plants are common on a smaller scale in remote rural regions and islands. This high dependency of the food system on fossil fuels is now becoming cause for concern.
Total greenhouse gas (GHG) emissions from the agri-food sector4 are around 22% of total GHG emissions per year, with variations in shares of the three main gases between the top 50 “high-GDP” countries and the other “low-GDP” countries mainly due to the lower shares of CO2-eq emissions coming from processing and distribution as well as the higher shares of methane emissions coming from paddy rice production and ruminant animals (Fig. 1.1).
4. Agri-food sector includes the agriculture sector (i.e. primary production, including livestock and fishery) and the whole food chain. The figures include emissions associated with the so-called indirect energy inputs (energy to manufacture fertilizers, pesticides and machinery) but excludes emissions from forestry and land-use.

CLE
AN
EN
ERG
Y S
OLU
TIO
NS
AN
D R
UR
AL
DEV
ELO
PMEN
T
OPPORTUNITIES FOR AGRI-FOOD CHAINS TO BECOME ENERGY-SMART20
In many countries, the application of low-carbon and renewable energy solutions to replace fossil fuels is rapidly increasing in the heating, cooling, and power sectors, and to some degree in the transport sector through the growing use of biofuels and electric vehicles (particularly when the electricity is either generated from renewables or the energy mix of the grid has a relatively low GHG emission factor). In remote rural areas where no electricity grid connection exists, stand-alone mini-grid solutions are increasingly being constructed, particularly where they offer the potential to boost local economic development as a result of more intensive agricultural and food processing activities.
Such “sustainable agriculture production systems” and “climate-smart food systems” can become pragmatic solutions for sustainable development and can also bring significant structural changes, improved livelihoods, and enhanced food security to rural communities in many countries. However, there is a need for targeted action in support of such developments in order to obtain better evidence of the co-benefits and dis-benefits resulting from supporting clean energy systems.
FIGURE 1.1. Global shares of anthropogenic greenhouse gas emissions along the agri-food supply chain and by gas, with breakdown for high- and low-GDP countries.Source: FAO, 2011a
Global High-GDP countries Low-GDP countries
~9.7 Gt CO2eq/year ~3.3 Gt CO2eq/year ~6.4 Gt CO2eq/year
0
20%
40%
60%
80%
100%
90%
70%
50%
30%
10%
Retail, preparation and cookingProcessing and distributionFisheries productionLivestock productionCropping production
Carbon dioxide CO2
Methane CH4
Nitrous oxide N2O
CLE
AN
EN
ERG
Y S
OLU
TIO
NS
AN
D R
UR
AL
DEV
ELO
PMEN
T
OPPORTUNITIES FOR AGRI-FOOD CHAINS TO BECOME ENERGY-SMART 21
1.1. AIMS AND OBJECTIVESThis study provides a solid framework that aims to help reduce the dependence of agri-food systems on fossil fuel inputs. It targets a readership of members of farming associations, training institutions, businesses, practitioners, policy makers and other stakeholders in the agri-food industry.
Specific objectives of the study are to:
• outline opportunities for reducing the present energy demand per unit of product throughout the agri-food chain by using energy efficient technologies and energy-smart systems;
• present priority entry points, steps and interventions along selected agri-food chains in order to introduce clean energy solutions where appropriate and encourage their rapid deployment;
• identify and explain existing tools that a) increase data availability to enable data-based decision making and b) assess the profitability of investments in clean energy solutions, and to identify any gaps in suitable tools;
• assess all co-benefits relating to clean energy uptake which, other than GHG mitigation, can include improved health, employment opportunities, and livelihoods, and avoid the depletion of other constrained resources such as water and soil nutrients; and
• identify the critical areas where current knowledge gaps and/or other constraints exist and/or where only limited knowledge is available, with recommendations for further evaluation in order for these thematic gaps to be addressed.
The outputs from the study will support: international dialogue among experts in agricultural production, food processing and energy; staff of environmental and international organizations; businesses and their industry associations; and policy makers when they are defining selection criteria for enhancing clean energy inputs to support a specific agri-food production system, and hence increase the deployment of low emission technologies and systems.
The main findings, as outlined throughout the report, will help private sector players, development practitioners, and policy makers deal with clean energy solutions in the context of developing countries in order to improve the evidence base for making investment and policy decisions.
CLE
AN
EN
ERG
Y S
OLU
TIO
NS
AN
D R
UR
AL
DEV
ELO
PMEN
T
OPPORTUNITIES FOR AGRI-FOOD CHAINS TO BECOME ENERGY-SMART22
1.2. SCOPE OF THE STUDYA key task was to classify already existing knowledge and practices in renewable energy and energy efficiency for application throughout the different stages of agri-food chains. The value chain approach is outlined in Chapter 2 where cross-cutting energy use technologies and systems are described that are of relevance to many food supply chains. The focus was not only on technology options but, where feasible, also on the broader level that includes adaptation for local conditions, investment and operational cost analysis, financing and cost-benefit issues, local skill requirements, capacity building for local maintenance, and analysis of the policy environment. Energy inputs as used by the retailers and consumers of food products, such as when storing, purchasing and preparing food, and the disposal of food wastes, were excluded.
The meta-level analysis was based mainly on existing literature and databases maintained by Food and Agriculture Organization of the United Nations (FAO) and other international institutions with a mandate for data collection in the energy, agriculture and food sectors. Data on agri-food, capacity building, social issues, food supply security, adaptation, and resilience of rural communities to climate change impacts were limited but sources included evaluations of projects funded by the Global Environment Facility (GEF)5 and also various Intergovernmental Panel on Climate Change (IPCC) reports that provide an extensive literature review and a good scientific overview6.
The global food system covers a vast arena of production and processing systems. Not all could be addressed in this study due to constraints of time and resources. Therefore the scope was limited to three specific value chains presented as representative examples and chosen for their diversity.
1. Milk products (Chapter 3). There is an unexplored local and regional market potential for fresh milk and processed milk products in developing countries. To date, production has been constrained due in part to poor hygiene in the collection and processing facilities. The solutions examined here to improve hygiene and therefore prevent postharvest losses are:
• simple processing methods that can be accomplished at both small and large scales, including pasteurizing (by heating the milk to 60oC for a minute); traditional biotechnological preservation processes (to produce sour milk and yogurt); butter making and slim milk production; and
• the provision of reliable cooling facilities (such as refrigerated milk vats, solar chillers, ice banks) to maintain cold temperatures along the supply chain from milking to processing (and for some milk products through to retailing).
5. http://www.thegef.org/gef/eo_doc%2526pub where an extensive search for “food”, “agriculture”, “food processing”, “food security” etc provides relevant information.6. http://www.ipcc.ch/
CLE
AN
EN
ERG
Y S
OLU
TIO
NS
AN
D R
UR
AL
DEV
ELO
PMEN
T
OPPORTUNITIES FOR AGRI-FOOD CHAINS TO BECOME ENERGY-SMART 23
2. Paddy rice (Chapter 4). This crop has central importance in Asian food systems and has ever-increasing production levels in African countries. Dryland rice has only a small share of total production (around 10% to 15%) so was largely excluded as also its production is more akin to growing a cereal crop. It has lower yields per hectare than paddy rice, and it is not as widely grown.
3. Fresh and processed vegetables (Chapter 5). These have good potential in both local and regional markets for gaining high returns on investments in both land and equipment. Vegetable production also provides integration opportunities where a second crop in a year can be grown under irrigation.
Fresh vegetable types are numerous with major regional differences in species grown and harvesting methods (e.g. manual, manual using picking platforms, fully automatic harvesters, and even mobile packing sheds). Processed vegetables tend to be grown at a larger scale and often involve intensive processing and transport activities.
For this study three vegetables were selected based on their widespread production, nutritional value, and suitability and practicability for further processing (e.g. canning, drying, cooling and deep freezing)7.
• Tomatoes (field grown or in heated or unheated greenhouses, manually or mechanically harvested, sold fresh, canned, bottled or dried, and used in a wide range of processed foods);
• Beans (green or dried/pulses, many species grown worldwide, manually or mechanically harvested, wide range of uses in cooking); and
• Carrots (root crop, manually or automatically harvested, sold fresh, canned or frozen).
For each of these value chains, an assessment was made of the total energy inputs on a global and per unit of production basis, as well as along the different stages of the value chain. The technologies currently used in the related production and processing system are described as new and innovative technologies identified that have the potential to improve value chain operations and/or make them more “climate smart”.
Water use is inexorably linked with food production as outlined in the water-energy-food nexus concept (UNESCO, 2012; FAO, 2014). The agri-food sector accounts for around 80% of total freshwater use. The FAO AQUASTAT database8 provides useful information for water demands in agriculture. However, water is also used widely in food processing operations but there is limited data available on volumes consumed. So wherever possible water was included in the discussions of the selected food chains, but knowledge gaps exist. Clean energy technology solutions include both energy efficiency and renewable electricity and also include heat and cold provision
7. Although also widely grown, leafy crops such as lettuce, spinach and cabbage were excluded from the selection along with cassava, potatoes, peas, corn etc.8. http://www.fao.org/nr/water/aquastat/main/index.stm
CLE
AN
EN
ERG
Y S
OLU
TIO
NS
AN
D R
UR
AL
DEV
ELO
PMEN
T
OPPORTUNITIES FOR AGRI-FOOD CHAINS TO BECOME ENERGY-SMART24
such as through heat exchangers, solar thermal, direct geothermal, and modern biomass combustion. Since biomass resources arise in large volumes in the agri-food sector from various agricultural and forest activities as well as from food processing operations, the use of these resources for bioenergy (to provide heat and power) or for transport fuels, are discussed within the context of sustainable production.
Transport of materials within the farm and beyond the farm gate to a collection/storage/processing facility were included but transport of products and logistics for wider trade marketing and distribution were not. The use of liquid and gaseous biofuels to power transport vehicles, tractors, harvesters, chainsaws, as well as stationary diesel plants used for electricity generation and irrigation water pumping remains controversial depending on the biomass source. Therefore, this study did not cover the growing of dedicated crops for biofuels, their sustainable production, or competition for water and land use9.
Vertical integration, where food processing companies manage their own production units for provision of raw materials, and where farm production units integrate processing into their operations, was addressed where applicable. This added complexity to the analysis but was important as the secondary processing activities can have higher energy inputs per unit of product than the primary production component behind the farm-gate.
An evaluation of all relevant co-benefits (such as avoiding damage to soil structure and saving water), dis-benefits (such as possible lower crop productivity from minimum tillage for vegetable production), and trade-offs (such as using more packaging materials to increase the shelf life of food products) were assessed for each value chain.
A review of a range of tools and models that can be applied to analyze the potential impacts of energy demand and related GHG emissions at all stages along the agri-food chain is presented in Chapter 6.
9. Readers wishing to learn more are recommended to read IPCC 5th Assessment Report – Mitigation, (2014), Chapter 11 Agriculture, Forests and Land Use, 11.13 “Appendix Bioenergy”, page 870 https://www.ipcc.ch/pdf/assessment-report/ar5/wg3/ipcc_wg3_ar5_chapter11.pdf and the STAP (2015) Advisory Document for the GEF “Optimizing the global environmental benefits of transport biofuels” http://www.stapgef.org/stap/wp-content/uploads/2015/04/Biofuels_March13_final.pdf
CLE
AN
EN
ERG
Y S
OLU
TIO
NS
AN
D R
UR
AL
DEV
ELO
PMEN
T
OPPORTUNITIES FOR AGRI-FOOD CHAINS TO BECOME ENERGY-SMART 25
1.3. CASE STUDIESDescribing and analyzing real-world case studies based around the three value chains and the cross-cutting technologies gave additional value to this project. Where possible, regional differences in the agri-food value chains were considered and case studies used to illustrate how these might best be managed. Africa, Asia, South East Asia, and South America were concentrated on, giving the ability to then compare very different economies.
A key message from the various case studies presented is that when endeavoring to save energy inputs and reduce GHG emissions from an intervention in an agri-food chain, that the productivity or health of the crop or animal is not adversely impacted. An energy intensity indicator of GJ/ha could be positive, but should the crop yield decline as a result of an intervention, then the more valuable indicator to monitor would be GJ/t of product. In addition, sustainability issues relating to water use, biodiversity, and land use change should also be considered.

ENER
GY
AN
D T
HE
FOO
D V
ALU
E C
HA
IN
OPPORTUNITIES FOR AGRI-FOOD CHAINS TO BECOME ENERGY-SMART 27
2. ENERGY AND THE FOOD VALUE CHAINAgricultural production depends on external energy inputs to assist the natural process of photosynthesis in converting sunlight to plant proteins. The plants are used directly as food for humans and also provide feed for animals for obtaining meat, eggs and milk products. Manual labor and animal power have traditionally been harnessed to provide such energy inputs and the inefficient combustion of biomass has been used to provide heat for cooking and hot water. Further energy inputs are needed for the storage, processing, transport, and distribution of food products.
These traditional forms of energy inputs have largely been displaced by fossil fuels as agriculture has become more industrialized over the decades, and farm and food processing enterprises have become more intensive (a process still continuing in many countries). Hence provision of the modern energy services that are essential throughout the agri-food chain and its associated industries has become largely dependent on fossil fuel inputs. Such services include heating, cooling, movement of goods, water pumping, lighting, animal comfort, mechanical power, etc.
Electricity is a key energy carrier used in many activities on farms, in food processing plants and during the manufacture of fertilizer, machinery, equipment, and building materials. Around two thirds of total electricity generation in the world is dependent on fossil fuels in the form of coal, natural gas or diesel fuel that are combusted to either produce steam to drive turbines, or to fuel internal combustion engines that are then used to drive electricity generators. The other third of total electricity generation is fairly equally divided between nuclear power plants and renewable electricity systems, mainly hydro-power plants (IEA, 2014).
Many small, remote rural communities remain without access to modern energy services due to poor road infrastructure and the electricity grid not yet having reached the area. Even where electricity distribution lines have been built, supply may be very unreliable with frequent outages and fluctuating power quality. In such locations, diesel-generation sets are often employed to produce electricity, or more recently renewable energy systems have been developed such as small-scale hydro, wind, and solar power systems. The electricity can be used by businesses in the production, storage, handling, and processing of food products.
Where rural locations are remote, any purchased liquid fuels are relatively expensive due to delivery costs. Hence there can be higher incentives to use energy wisely (by improving efficiencies) as well as by developing local renewable energy resources for
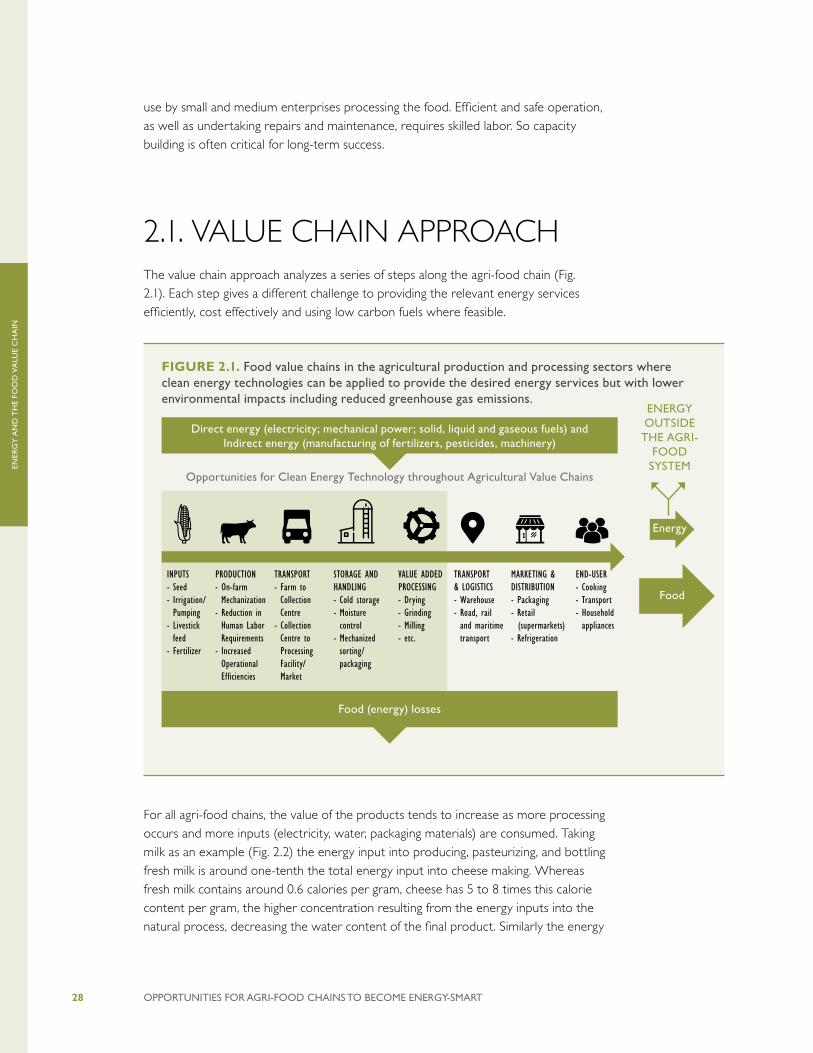
ENER
GY
AN
D T
HE
FOO
D V
ALU
E C
HA
IN
OPPORTUNITIES FOR AGRI-FOOD CHAINS TO BECOME ENERGY-SMART28
use by small and medium enterprises processing the food. Efficient and safe operation, as well as undertaking repairs and maintenance, requires skilled labor. So capacity building is often critical for long-term success.
2.1. VALUE CHAIN APPROACHThe value chain approach analyzes a series of steps along the agri-food chain (Fig. 2.1). Each step gives a different challenge to providing the relevant energy services efficiently, cost effectively and using low carbon fuels where feasible.
For all agri-food chains, the value of the products tends to increase as more processing occurs and more inputs (electricity, water, packaging materials) are consumed. Taking milk as an example (Fig. 2.2) the energy input into producing, pasteurizing, and bottling fresh milk is around one-tenth the total energy input into cheese making. Whereas fresh milk contains around 0.6 calories per gram, cheese has 5 to 8 times this calorie content per gram, the higher concentration resulting from the energy inputs into the natural process, decreasing the water content of the final product. Similarly the energy
FIGURE 2.1. Food value chains in the agricultural production and processing sectors where clean energy technologies can be applied to provide the desired energy services but with lower environmental impacts including reduced greenhouse gas emissions.
Direct energy (electricity; mechanical power; solid, liquid and gaseous fuels) and Indirect energy (manufacturing of fertilizers, pesticides, machinery)
TRANSPORT & LOGISTICS- Warehouse- Road, rail and maritime transport
MARKETING & DISTRIBUTION- Packaging- Retail (supermarkets)- Refrigeration
END-USER- Cooking- Transport- Household appliances
Food (energy) losses
Opportunities for Clean Energy Technology throughout Agricultural Value Chains
INPUTS- Seed- Irrigation/ Pumping
- Livestick feed
- Fertilizer
PRODUCTION- On-farm Mechanization
- Reduction in Human Labor Requirements
- Increased Operational Efficiencies
TRANSPORT- Farm to Collection Centre
- Collection Centre to Processing Facility/ Market
STORAGE AND HANDLING- Cold storage- Moisture control
- Mechanized sorting/ packaging
VALUE ADDED PROCESSING- Drying- Grinding- Milling- etc.
Food
Energy
ENERGY OUTSIDE
THE AGRI-FOOD
SYSTEM

ENER
GY
AN
D T
HE
FOO
D V
ALU
E C
HA
IN
OPPORTUNITIES FOR AGRI-FOOD CHAINS TO BECOME ENERGY-SMART 29
used for milling paddy rice (to remove bran and husks) increases the value as does the postharvest treatment of vegetables, including keeping fresh products cool so they maintain quality by the time they reach the consumer.
2.1.1. AGRI-FOOD ENERGY INPUT TRENDS
End-use energy demand by the global agri-food sector is around one-third of the world’s total final energy demand. In high GDP countries approximately 25% of the total is consumed behind the farm-gate (including fisheries), 45% in food processing and distribution, and 30% in retail, preparation and cooking. In low-GDP countries, a smaller share is spent on the farm and a greater share on cooking (FAO, 2011a). The energy demand for agriculture, fishing and forestry production has been steadily rising with the main energy inputs coming from electricity and diesel fuel and a small rise in “renewables and waste” (biomass) (Fig. 2.3).
The data for food processing and distribution is very uncertain given that the datasets do not cover all countries. White (2007) showed the total energy demand (direct and indirect) for food processing and packaging in the United Kingdom (UK) is around 70% more than that consumed behind the farm-gate and this range was supported in an earlier FAO analysis (FAO, 2011a). United Nations Statistics Division (UNSD) data shows that the total agri-food energy from food processing is similar to the total used by the primary production sector (Fig. 2.3). However, this is possibly an under-estimate due to missing country data, and the lack of inclusion of the energy inputs used for the numerous informal, small-scale, food processing activities that occur in developing countries and that are not included with the “food and tobacco industry” data.
FIGURE 2.2. Difference in energy consumption of different milk products. Milk is an example of where energy inputs along the food chain (MJ/kg) tend to increase the value of the product for which the consumer is willing to pay more in terms of USD/calorie delivered. Source: Lillywhite et al., 2013
0
10
20
30
40
50
60
CheeseButterYoghurtCreamLiquid Milk
MJ/K
g

ENER
GY
AN
D T
HE
FOO
D V
ALU
E C
HA
IN
OPPORTUNITIES FOR AGRI-FOOD CHAINS TO BECOME ENERGY-SMART30
The global trend has been for the total value of agricultural gross production to rise faster than total energy consumption by the sector. This has led to a slight reduction in energy intensity per international dollar value (J/I$) over the past decade indicating improvements in energy efficiency have been made (Fig. 2.4).
FIGURE 2.3. Energy demand by type for the global primary production sector from 2000-2012 (EJ/yr).Source FAOSTAT, 2015; UNSD Energy Statistics Database, 2015 Source: Lillywhite et al., 2013
0
2
4
6
8
10Heat
EJ/y
r
Electricity
Renewable and waste
Other fossil fuels
Natural gas (including LNG)
Motor gasoline
Liquified petroleum gas
Hard coal
Gas oil/ Diesel oil
Fuel oil2012201120102009200820072006200520042003200220012000
FIGURE 2.4. The rate of increase in the global agricultural gross production value from 2000 (Index = 100) to 2012 exceeded the rate of increase in energy consumption by the agricultural sector leading to reduced energy intensity in terms of energy input per constant 2004-2006 international dollar earned (J/I$).Source FAOSTAT, 2015
60
90
120
150 Agriculturalenergy intensity (J/I$)
Agriculturalgross production value (I$)
Agriculturalenergy consumption (J)
2012201120102009200820072006200520042003200220012000
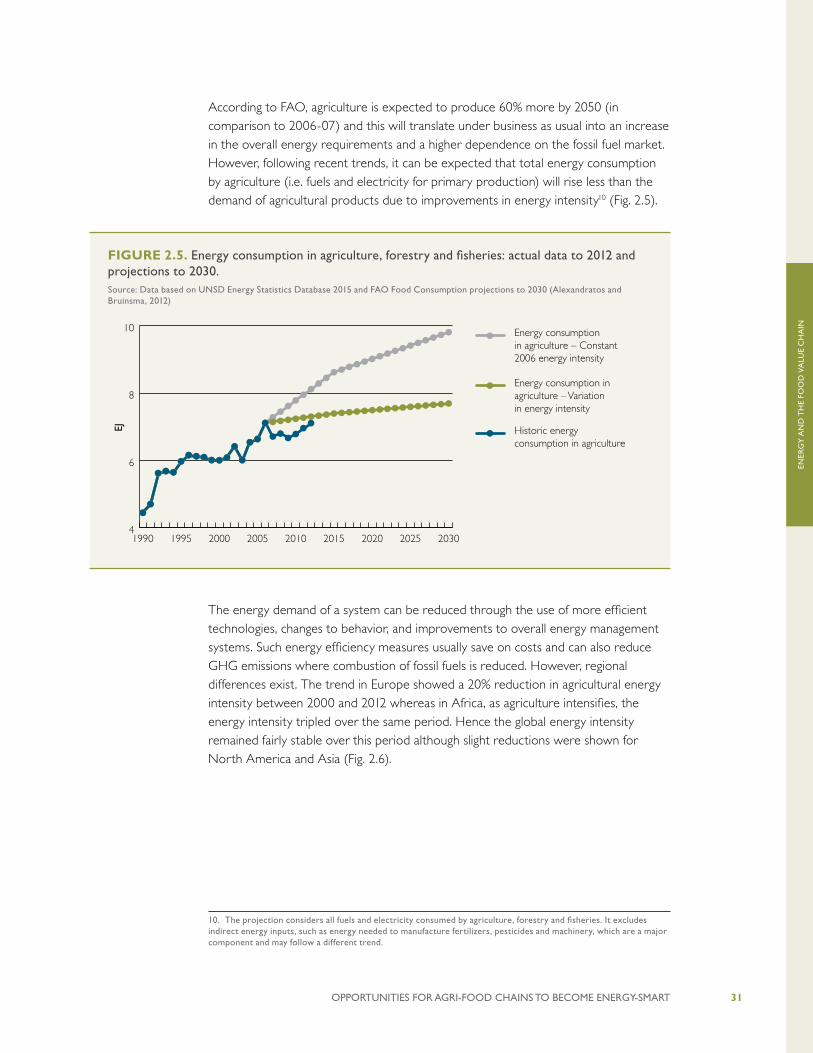
ENER
GY
AN
D T
HE
FOO
D V
ALU
E C
HA
IN
OPPORTUNITIES FOR AGRI-FOOD CHAINS TO BECOME ENERGY-SMART 31
According to FAO, agriculture is expected to produce 60% more by 2050 (in comparison to 2006-07) and this will translate under business as usual into an increase in the overall energy requirements and a higher dependence on the fossil fuel market. However, following recent trends, it can be expected that total energy consumption by agriculture (i.e. fuels and electricity for primary production) will rise less than the demand of agricultural products due to improvements in energy intensity10 (Fig. 2.5).
The energy demand of a system can be reduced through the use of more efficient technologies, changes to behavior, and improvements to overall energy management systems. Such energy efficiency measures usually save on costs and can also reduce GHG emissions where combustion of fossil fuels is reduced. However, regional differences exist. The trend in Europe showed a 20% reduction in agricultural energy intensity between 2000 and 2012 whereas in Africa, as agriculture intensifies, the energy intensity tripled over the same period. Hence the global energy intensity remained fairly stable over this period although slight reductions were shown for North America and Asia (Fig. 2.6).
10. The projection considers all fuels and electricity consumed by agriculture, forestry and fisheries. It excludes indirect energy inputs, such as energy needed to manufacture fertilizers, pesticides and machinery, which are a major component and may follow a different trend.
FIGURE 2.5. Energy consumption in agriculture, forestry and fisheries: actual data to 2012 and projections to 2030. Source: Data based on UNSD Energy Statistics Database 2015 and FAO Food Consumption projections to 2030 (Alexandratos and Bruinsma, 2012)
4
6
8
10 Energy consumption in agriculture – Constant 2006 energy intensity
Energy consumption in agriculture – Variation in energy intensity
Historic energy consumption in agriculture
203020252020201520102005200019951990
EJ
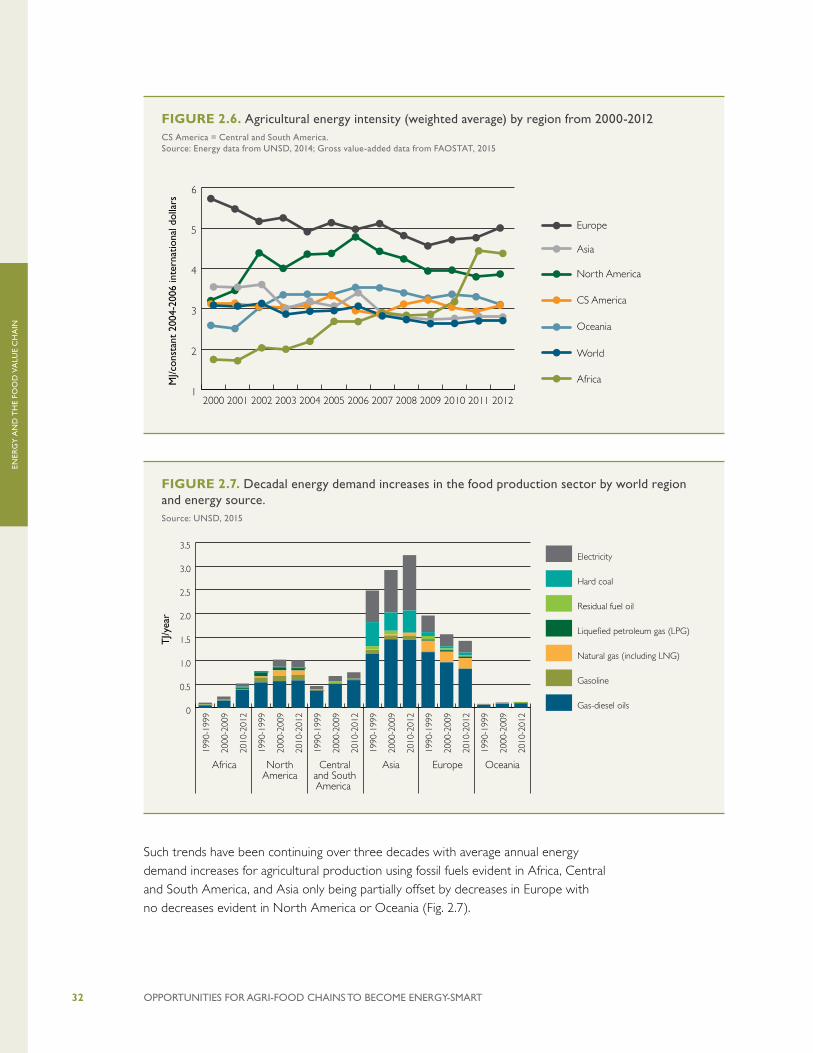
ENER
GY
AN
D T
HE
FOO
D V
ALU
E C
HA
IN
OPPORTUNITIES FOR AGRI-FOOD CHAINS TO BECOME ENERGY-SMART32
Such trends have been continuing over three decades with average annual energy demand increases for agricultural production using fossil fuels evident in Africa, Central and South America, and Asia only being partially offset by decreases in Europe with no decreases evident in North America or Oceania (Fig. 2.7).
FIGURE 2.6. Agricultural energy intensity (weighted average) by region from 2000-2012CS America = Central and South America.Source: Energy data from UNSD, 2014; Gross value-added data from FAOSTAT, 2015
1
2
3
4
5
6
Oceania
Europe
North America
CS America
Asia
Africa
World
2012201120102009200820072006200520042003200220012000
MJ/c
onst
ant
2004
-200
6 in
tern
atio
nal d
olla
rs
FIGURE 2.7. Decadal energy demand increases in the food production sector by world region and energy source.Source: UNSD, 2015
0
0.5
1.0
1.5
2.0
2.5
3.0
3.5Electricity
Hard coal
Residual fuel oil
Lique�ed petroleum gas (LPG)
Natural gas (including LNG)
Gasoline
Gas-diesel oils
2010
-201
2
2000
-200
9
1990
-199
9
2010
-201
2
2000
-200
9
1990
-199
9
2010
-201
2
2000
-200
9
1990
-199
9
2010
-201
2
2000
-200
9
1990
-199
9
2010
-201
2
2000
-200
9
1990
-199
9
2010
-201
2
2000
-200
9
1990
-199
9
OceaniaEuropeAsiaAfrica NorthAmerica
Centraland SouthAmerica
TJ/y
ear
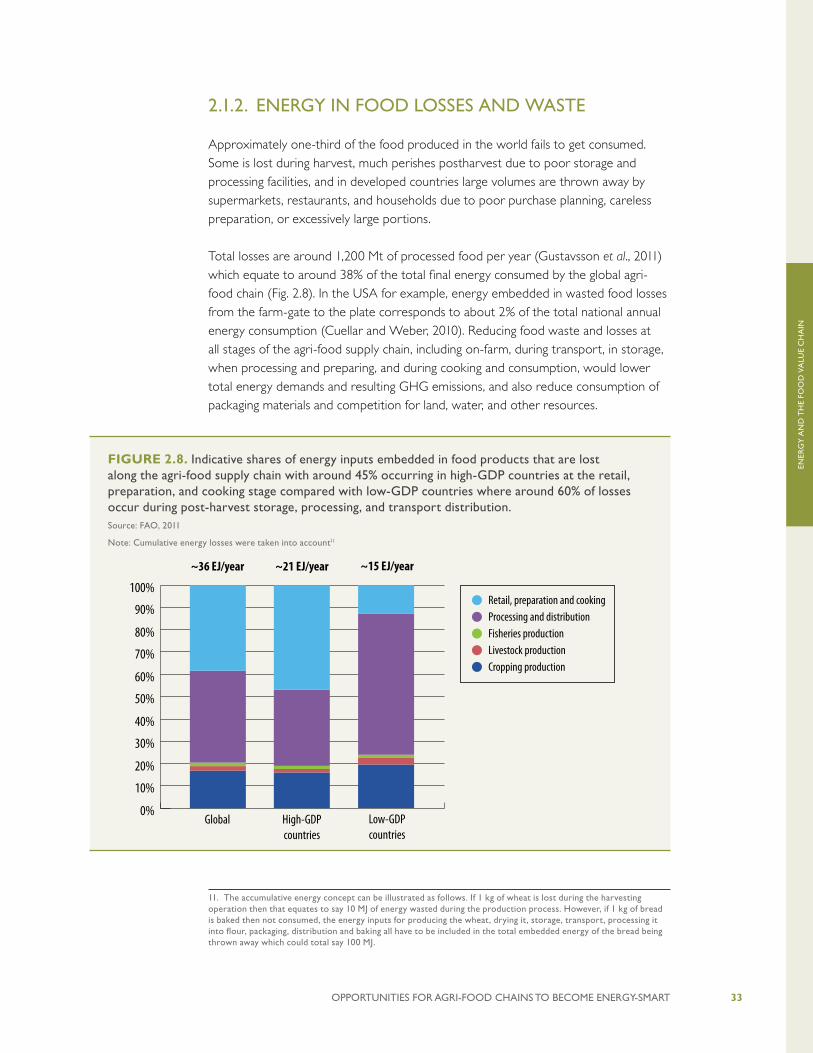
ENER
GY
AN
D T
HE
FOO
D V
ALU
E C
HA
IN
OPPORTUNITIES FOR AGRI-FOOD CHAINS TO BECOME ENERGY-SMART 33
2.1.2. ENERGY IN FOOD LOSSES AND WASTE
Approximately one-third of the food produced in the world fails to get consumed. Some is lost during harvest, much perishes postharvest due to poor storage and processing facilities, and in developed countries large volumes are thrown away by supermarkets, restaurants, and households due to poor purchase planning, careless preparation, or excessively large portions.
Total losses are around 1,200 Mt of processed food per year (Gustavsson et al., 2011) which equate to around 38% of the total final energy consumed by the global agri-food chain (Fig. 2.8). In the USA for example, energy embedded in wasted food losses from the farm-gate to the plate corresponds to about 2% of the total national annual energy consumption (Cuellar and Weber, 2010). Reducing food waste and losses at all stages of the agri-food supply chain, including on-farm, during transport, in storage, when processing and preparing, and during cooking and consumption, would lower total energy demands and resulting GHG emissions, and also reduce consumption of packaging materials and competition for land, water, and other resources. 11
11. The accumulative energy concept can be illustrated as follows. If 1 kg of wheat is lost during the harvesting operation then that equates to say 10 MJ of energy wasted during the production process. However, if 1 kg of bread is baked then not consumed, the energy inputs for producing the wheat, drying it, storage, transport, processing it into flour, packaging, distribution and baking all have to be included in the total embedded energy of the bread being thrown away which could total say 100 MJ.
FIGURE 2.8. Indicative shares of energy inputs embedded in food products that are lost along the agri-food supply chain with around 45% occurring in high-GDP countries at the retail, preparation, and cooking stage compared with low-GDP countries where around 60% of losses occur during post-harvest storage, processing, and transport distribution.Source: FAO, 2011
Note: Cumulative energy losses were taken into account11
0%
20%
40%
60%
80%
100%
90%
70%
50%
30%
10%
Global
Retail, preparation and cookingProcessing and distributionFisheries productionLivestock productionCropping production
High-GDPcountries
Low-GDPcountries
~36 EJ/year ~21 EJ/year ~15 EJ/year
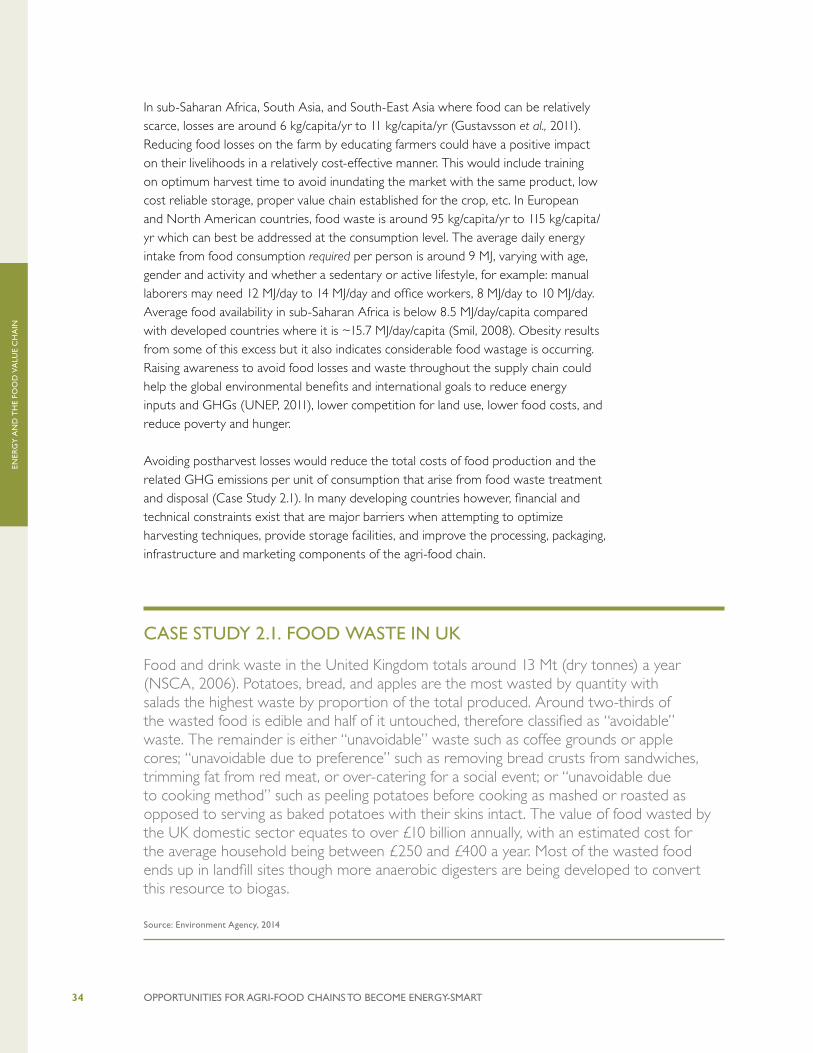
ENER
GY
AN
D T
HE
FOO
D V
ALU
E C
HA
IN
OPPORTUNITIES FOR AGRI-FOOD CHAINS TO BECOME ENERGY-SMART34
In sub-Saharan Africa, South Asia, and South-East Asia where food can be relatively scarce, losses are around 6 kg/capita/yr to 11 kg/capita/yr (Gustavsson et al., 2011). Reducing food losses on the farm by educating farmers could have a positive impact on their livelihoods in a relatively cost-effective manner. This would include training on optimum harvest time to avoid inundating the market with the same product, low cost reliable storage, proper value chain established for the crop, etc. In European and North American countries, food waste is around 95 kg/capita/yr to 115 kg/capita/yr which can best be addressed at the consumption level. The average daily energy intake from food consumption required per person is around 9 MJ, varying with age, gender and activity and whether a sedentary or active lifestyle, for example: manual laborers may need 12 MJ/day to 14 MJ/day and office workers, 8 MJ/day to 10 MJ/day. Average food availability in sub-Saharan Africa is below 8.5 MJ/day/capita compared with developed countries where it is ~15.7 MJ/day/capita (Smil, 2008). Obesity results from some of this excess but it also indicates considerable food wastage is occurring. Raising awareness to avoid food losses and waste throughout the supply chain could help the global environmental benefits and international goals to reduce energy inputs and GHGs (UNEP, 2011), lower competition for land use, lower food costs, and reduce poverty and hunger.
Avoiding postharvest losses would reduce the total costs of food production and the related GHG emissions per unit of consumption that arise from food waste treatment and disposal (Case Study 2.1). In many developing countries however, financial and technical constraints exist that are major barriers when attempting to optimize harvesting techniques, provide storage facilities, and improve the processing, packaging, infrastructure and marketing components of the agri-food chain.
CASE STUDY 2.1. FOOD WASTE IN UK
Food and drink waste in the United Kingdom totals around 13 Mt (dry tonnes) a year (NSCA, 2006). Potatoes, bread, and apples are the most wasted by quantity with salads the highest waste by proportion of the total produced. Around two-thirds of the wasted food is edible and half of it untouched, therefore classified as “avoidable” waste. The remainder is either “unavoidable” waste such as coffee grounds or apple cores; “unavoidable due to preference” such as removing bread crusts from sandwiches, trimming fat from red meat, or over-catering for a social event; or “unavoidable due to cooking method” such as peeling potatoes before cooking as mashed or roasted as opposed to serving as baked potatoes with their skins intact. The value of food wasted by the UK domestic sector equates to over £10 billion annually, with an estimated cost for the average household being between £250 and £400 a year. Most of the wasted food ends up in landfill sites though more anaerobic digesters are being developed to convert this resource to biogas.
Source: Environment Agency, 2014
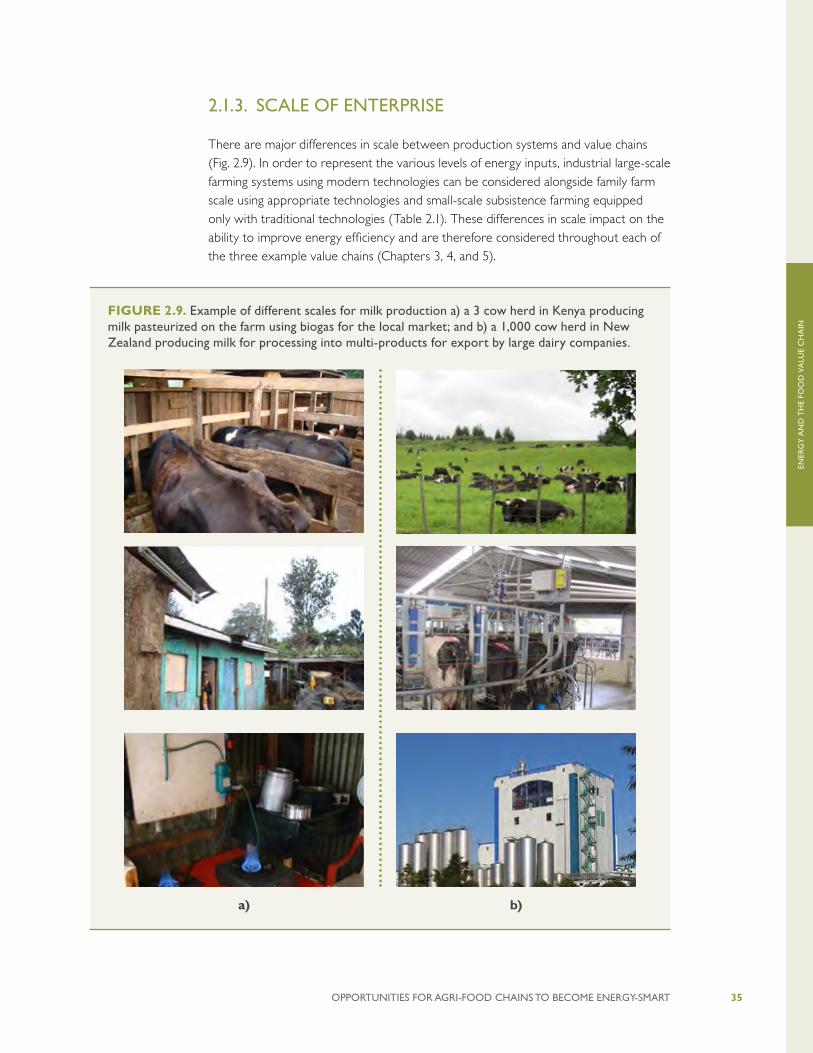
ENER
GY
AN
D T
HE
FOO
D V
ALU
E C
HA
IN
OPPORTUNITIES FOR AGRI-FOOD CHAINS TO BECOME ENERGY-SMART 35
FIGURE 2.9. Example of different scales for milk production a) a 3 cow herd in Kenya producing milk pasteurized on the farm using biogas for the local market; and b) a 1,000 cow herd in New Zealand producing milk for processing into multi-products for export by large dairy companies.
2.1.3. SCALE OF ENTERPRISE
There are major differences in scale between production systems and value chains (Fig. 2.9). In order to represent the various levels of energy inputs, industrial large-scale farming systems using modern technologies can be considered alongside family farm scale using appropriate technologies and small-scale subsistence farming equipped only with traditional technologies (Table 2.1). These differences in scale impact on the ability to improve energy efficiency and are therefore considered throughout each of the three example value chains (Chapters 3, 4, and 5).
a) b)
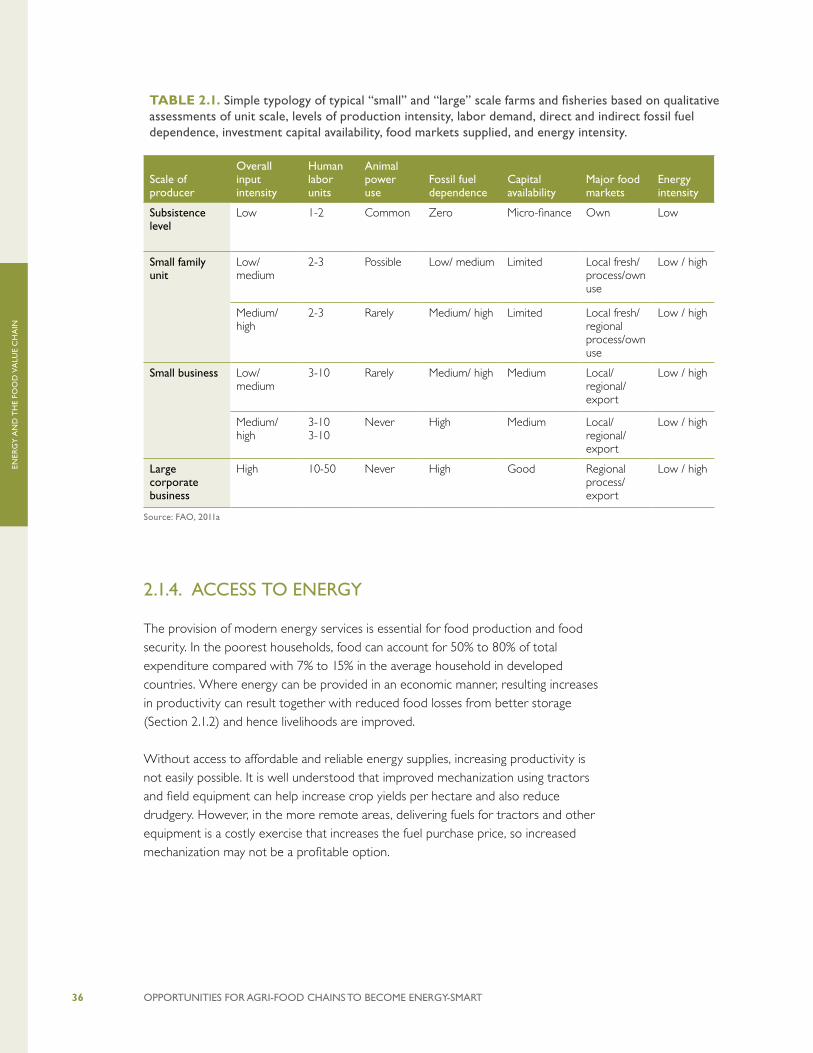
ENER
GY
AN
D T
HE
FOO
D V
ALU
E C
HA
IN
OPPORTUNITIES FOR AGRI-FOOD CHAINS TO BECOME ENERGY-SMART36
Scale of producer
Overall input intensity
Human labor units
Animal power use
Fossil fuel dependence
Capital availability
Major food markets
Energy intensity
Subsistence level
Low 1-2 Common Zero Micro-finance Own Low
Small family unit
Low/medium
2-3 Possible Low/ medium Limited Local fresh/ process/own use
Low / high
Medium/high
2-3 Rarely Medium/ high Limited Local fresh/ regional process/own use
Low / high
Small business Low/ medium
3-10 Rarely Medium/ high Medium Local/ regional/ export
Low / high
Medium/ high
3-103-10
Never High Medium Local/ regional/ export
Low / high
Large corporate business
High 10-50 Never High Good Regional process/ export
Low / high
Source: FAO, 2011a
2.1.4. ACCESS TO ENERGY
The provision of modern energy services is essential for food production and food security. In the poorest households, food can account for 50% to 80% of total expenditure compared with 7% to 15% in the average household in developed countries. Where energy can be provided in an economic manner, resulting increases in productivity can result together with reduced food losses from better storage (Section 2.1.2) and hence livelihoods are improved.
Without access to affordable and reliable energy supplies, increasing productivity is not easily possible. It is well understood that improved mechanization using tractors and field equipment can help increase crop yields per hectare and also reduce drudgery. However, in the more remote areas, delivering fuels for tractors and other equipment is a costly exercise that increases the fuel purchase price, so increased mechanization may not be a profitable option.
TABLE 2.1. Simple typology of typical “small” and “large” scale farms and fisheries based on qualitative assessments of unit scale, levels of production intensity, labor demand, direct and indirect fossil fuel dependence, investment capital availability, food markets supplied, and energy intensity.

ENER
GY
AN
D T
HE
FOO
D V
ALU
E C
HA
IN
OPPORTUNITIES FOR AGRI-FOOD CHAINS TO BECOME ENERGY-SMART 37
Reducing post-harvest losses by investing in dryers, cooling equipment, storage facilities etc. is well understood. But access to heat and electricity is needed to heat the drying air, power the fans, run the refrigeration plants etc. Electricity is not always available on islands or in remote regions where distribution lines do not reach. Diesel engines to drive generators are common in such locations, but once again the cost of the delivered fuel is relatively high. Renewable electricity can be a cheaper alternative in locations where the resources are good (Section 2.5) but the high up-front investment costs can be a major barrier.
Detailed analysis of the benefits from providing access to sustainable modern energy is outlined in detail in the IPCC 5th Assessment Report – Mitigation, 201412. Also the United Nations (UN) “Sustainable Energy for All” initiative is very relevant for food production. To date many reports and analyses have suggested that investments in innovations to support clean energy development and energy access have been nowhere near sufficient to meet the nature and scale of challenges associated with lack of sustainable energy in food production (see for example Bazilian et al., 2010).
2.1.5. CLEANER VALUE-CHAINS
Given that food production and processing is heavily dependent on fossil fuel inputs; that GHG emissions from the agri-food sector are over 20% of the world’s total (FAO, 2011a); and that other local air pollutants such as black carbon (a short-lived climate forcer) are emitted from such activities as fuelwood burning, charcoal production, open field burning of savannah and crop residues, and diesel fuel combustion (STAP, 2015), a move towards cleaner value chains is essential.
In many instances, this will also reduce the dependence of many rural communities in developing countries on traditional use of crop residues or animal dung for heat energy, reduce the time spent on such chores as collecting fuelwood (especially by women), and avoid further deforestation.
For more industrialized food production, major differences can exist in the farm management systems depending on local conditions. For example, some regions allow for milk cows or beef cattle to graze all year round, but in colder climates cattle may be housed and fed indoors, with feeding and manure removal performed manually. In organic systems, the collected manure would be used to offset inorganic fertilizers (Fig. 2.10).
12. Chapter 4, Sustainable Development and Equity; Chapter 6, Assessing Transformation Pathways (6.6.2.2); Chapter 7 Energy Supply (7.9.1); Chapter 14, Regional Development and Co-operation (14.3.2). http://mitigation2014.org/report/publication/

ENER
GY
AN
D T
HE
FOO
D V
ALU
E C
HA
IN
OPPORTUNITIES FOR AGRI-FOOD CHAINS TO BECOME ENERGY-SMART38
FIGURE 2.10. Energy inputs per kilogram of beef produced under different farm management regimes.Source: Cederberg et al., 2009
Similar regional variations result for other food production such as for a range of fruit (Fig. 2.11, with countries and fruits selected by what could be found in the literature). Although only a limited comparison can be made, the higher energy intensity of orchard production in the United States (USA) is evident, and the relatively high indirect energy in Turkey and Iran is possibly due to lower crop productivity.
0
20
40
60
80
100
Sweden (organic)Sweden (imported feed)Brazil
MJ/k
g
FIGURE 2.11. Average energy inputs for fruit production in Turkey (cherries, oranges, lemons, mandarins) and Iran (grapes, kiwifruit, pears); France (apples), Switzerland (apples), Sweden (apples, cherries, strawberries); and United States (apples, cherries, oranges, strawberries).Note: Direct energy is diesel and electricity used on-farm; indirect is from manufacture of fertilizers and agri-chemicals only
Source: Kizilaslan, 2009; Mohammadi, 2010; Ozkan et al., 2004; Tabatabaie et al., 2013
0.0
0.5
1.0
1.5
2.0
2.5
3.0
Direct energyIndirect energyTotal energy inputs
United StatesFrance, Sweden and SwitzerlandTurkey and Iran
MJ/K
g

ENER
GY
AN
D T
HE
FOO
D V
ALU
E C
HA
IN
OPPORTUNITIES FOR AGRI-FOOD CHAINS TO BECOME ENERGY-SMART 39
When attempting to improve the overall production efficiency of a food value chain by finding ways of reducing energy inputs and hence lowering resulting GHG emissions, there will be trade-offs necessary between energy inputs, labor inputs, and environmental impacts. It is well understood that an increase in fossil fuel energy inputs into a subsistence farming system can result in greater productivity per hectare, resulting in less demand for land and reduced manual labor inputs since the fossil fuel energy used substitutes for human energy.
Similarly, animals used for transport and cultivation can be replaced by tractors. Whereas this involves the combustion of an increased amount of fossil fuels, and hence more GHGs emitted, it offsets the number of draught animals needed and therefore their demand for animal feed (which competes for land with human food production). Particularly for cattle, this reduces their enteric methane emissions. As a result, the CO2-eq emissions from tractor fuel combustion are a small price to pay.
There are major differences between attempting to reduce, say, tractor fuel demand through energy efficiency measures in industrialized agriculture (section 2.4.5) and introducing tractors and machinery into traditional agriculture in order to improve productivity, reduce losses and reduce drudgery. Utilizing best practice, “leapfrog technologies” whenever possible ensures that the energy services needed (for cultivation, transport, refrigeration, etc.) are provided at low costs and with the least environmental impacts. The same argument holds for all aspects of food production and processing.
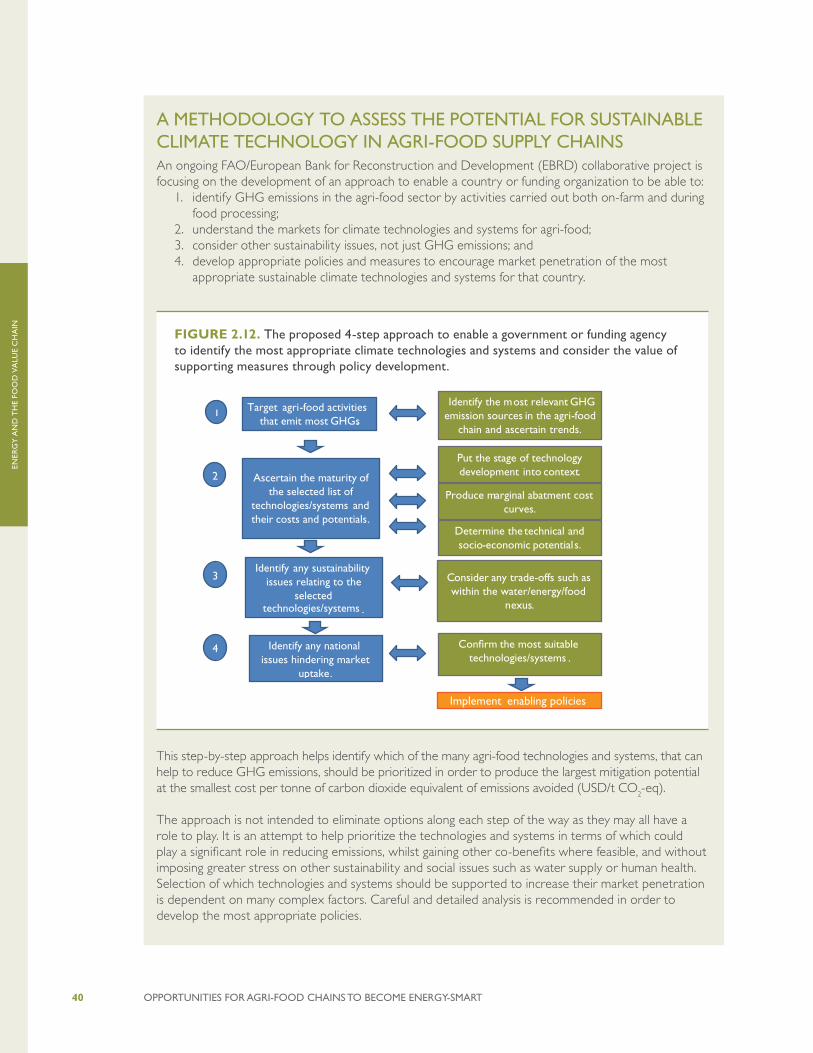
ENER
GY
AN
D T
HE
FOO
D V
ALU
E C
HA
IN
OPPORTUNITIES FOR AGRI-FOOD CHAINS TO BECOME ENERGY-SMART40
A METHODOLOGY TO ASSESS THE POTENTIAL FOR SUSTAINABLE CLIMATE TECHNOLOGY IN AGRI-FOOD SUPPLY CHAINSAn ongoing FAO/European Bank for Reconstruction and Development (EBRD) collaborative project is focusing on the development of an approach to enable a country or funding organization to be able to:
1. identify GHG emissions in the agri-food sector by activities carried out both on-farm and during food processing;
2. understand the markets for climate technologies and systems for agri-food; 3. consider other sustainability issues, not just GHG emissions; and 4. develop appropriate policies and measures to encourage market penetration of the most
appropriate sustainable climate technologies and systems for that country.
This step-by-step approach helps identify which of the many agri-food technologies and systems, that can help to reduce GHG emissions, should be prioritized in order to produce the largest mitigation potential at the smallest cost per tonne of carbon dioxide equivalent of emissions avoided (USD/t CO2-eq).
The approach is not intended to eliminate options along each step of the way as they may all have a role to play. It is an attempt to help prioritize the technologies and systems in terms of which could play a significant role in reducing emissions, whilst gaining other co-benefits where feasible, and without imposing greater stress on other sustainability and social issues such as water supply or human health. Selection of which technologies and systems should be supported to increase their market penetration is dependent on many complex factors. Careful and detailed analysis is recommended in order to develop the most appropriate policies.
FIGURE 2.12. The proposed 4-step approach to enable a government or funding agency to identify the most appropriate climate technologies and systems and consider the value of supporting measures through policy development.
Identify the most relevant GHG emission sources in the agri-food
chain and ascertain trends.
Ascertain the maturity of the selected list of
technologies/systems and their costs and potentials.
Put the stage of technology development into context.
Determine the technical and socio-economic potentials.
Identify any national issues hindering market
uptake.
Con�rm the most suitable technologies/systems .
Identify any sustainability issues relating to the
selected technologies/systems .
Consider any trade-offs such as within the water/energy/food
nexus.
1
2
3
4
Target agri-food activities that emit most GHGs.
Produce marginal abatment cost curves.
Implement enabling policies

ENER
GY
AN
D T
HE
FOO
D V
ALU
E C
HA
IN
OPPORTUNITIES FOR AGRI-FOOD CHAINS TO BECOME ENERGY-SMART 41
2.2. ENERGY DEMAND AND SUPPLY TECHNOLOGIES
The technologies and systems described in the cross-cutting Section 2.4, and in the selected food value chains in chapters 3, 4, and 5, can be classified as end-use technologies. When utilized by the primary production sector or the food processing sector, the end-user farmer or food processing business that employs low-carbon technologies and systems benefits from them being less reliant on fuel/electricity for the same service, thus saving on operating costs. This can offset additional investment costs over the conventional technologies, especially for new installations, and can result in a short payback period, but this depends on the local conditions.
For example, a short payback period of just one or two years is possible for displacing grid electricity with a solar water heating system in countries such as Jordan where the grid electricity price is relatively high (~20 USD cents/kWh) and solar irradiation also relatively high (~1,800 kWh/m2/yr). By way of contrast, in countries such as Belarus that have cheap electricity (~US 5 c/kWh) and low solar irradiation (~1,200 kWh/m2/yr) a longer payback period of seven to eight years can be expected. Therefore the economics involved with the cross-cutting low-carbon technologies and systems under consideration here can only be considered in broad terms and will need individual analysis by country to determine whether or not they are economically viable. Government intervention may be needed to encourage uptake of the energy efficient technologies before the existing technology has reached its end-of-life.
Whether in developed or developing countries, most farmers or businesses gain few benefits, if any, simply from reducing GHG emissions as part of their activities. Until a carbon price provides some form of incentive, or regulations are imposed, then the present reasons for the uptake of low-carbon technologies and systems are the co-benefits. Where valuable co-benefits exist and can be recognized as such and have a perceived or real value, government intervention may not be needed, other than perhaps to undertake educational programs and promotion. Co-benefits to reducing GHG emissions may include saving time, saving money, improving soil quality, increasing productivity, better animal health, better human health, greater resilience to combat extreme weather events, and food security.
Occasionally, a disruptive technology may result in voluntary application of the technology before the end-of-life of the existing technology (such as has happened with smart phones). This can result in “stranded assets” and to date, has been uncommon in the agri-food sector where new technologies usually take some time to increase their market penetration.
Energy supply technologies can also provide practical opportunities for farmers, growers, and food processors. This could involve:

ENER
GY
AN
D T
HE
FOO
D V
ALU
E C
HA
IN
OPPORTUNITIES FOR AGRI-FOOD CHAINS TO BECOME ENERGY-SMART42
• a small portion of the farmed land being used for installing wind turbines, solar panels, micro-hydro schemes etc. (Section 2.6);
• biomass produced on the farm as crop residues, animal manure etc., being used as a feedstock in a gasifier or anaerobic digestion plant, with the gases produced used to power an internal combustion engine to drive a generator;
• a food processing plant purchasing locally produced renewable electricity and biomass to meet its heat demand; and
• the biomass residues arising from the food production processing operation (such as sugar cane production or rice milling) used for heat and power generation on-site to run processing operations and sale of surplus energy.
Innovative “smart grids” are under close evaluation in many countries13. In many situations, the existing grid, its incumbent owners, and its system operators, are the constraints to the evolution of a smart grid, though several demonstration projects are in place. Typically a smart grid:
• will have a multitude of small generators using local renewable energy resources;
• will involve the management of peak loads through demand-side interactions;
• can link with electric vehicles as a storage option using their batteries; and
• can avoid the need to expand existing grid carrying capacity as loads continue to increase with growing demand.
As developments continue, the smart grid concept might become more suitable for providing electricity to rural communities currently with limited or no electricity access. Ideal locations are where there are good renewable energy sources of solar, wind, small hydro streams etc., and where extending the existing national grid, or using mini-grids based around diesel engine generation sets are impractical.
13. This is exemplified by the international companies represented at the “Smart Grid World Forum” held in London in November, 2014 http://smartgridworldconference.com/speaker-information/.
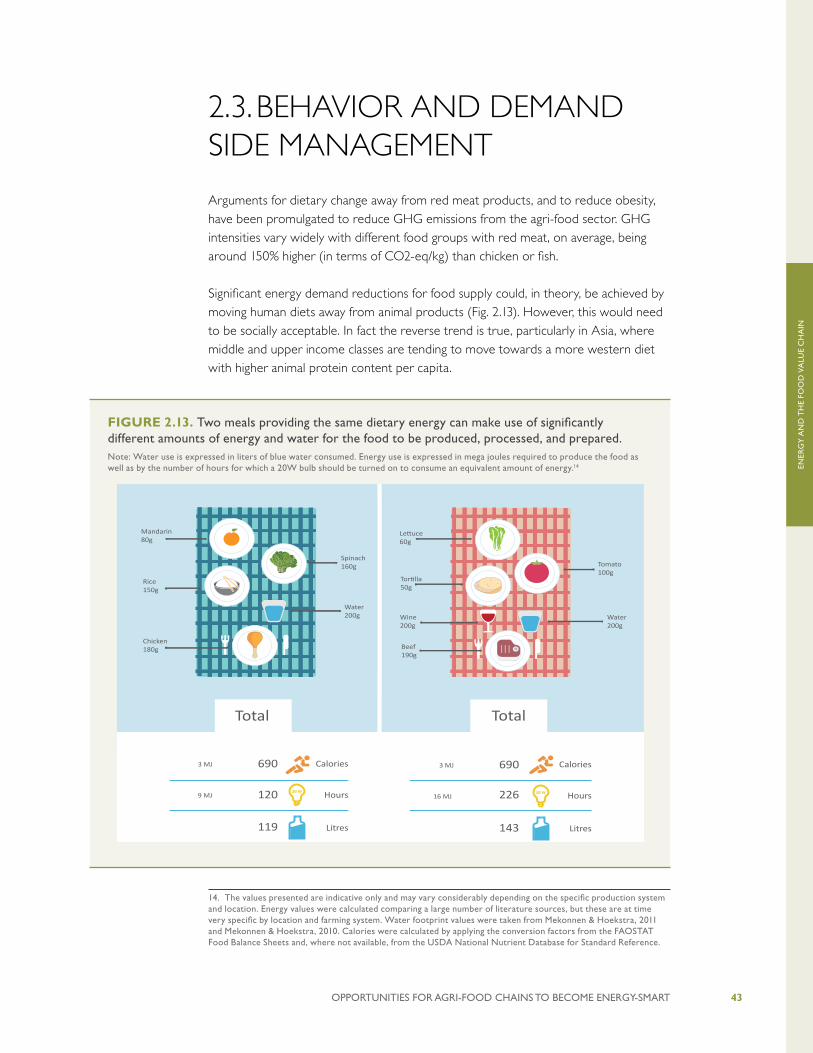
ENER
GY
AN
D T
HE
FOO
D V
ALU
E C
HA
IN
OPPORTUNITIES FOR AGRI-FOOD CHAINS TO BECOME ENERGY-SMART 43
FIGURE 2.13. Two meals providing the same dietary energy can make use of significantly different amounts of energy and water for the food to be produced, processed, and prepared. Note: Water use is expressed in liters of blue water consumed. Energy use is expressed in mega joules required to produce the food as well as by the number of hours for which a 20W bulb should be turned on to consume an equivalent amount of energy.14
2.3. BEHAVIOR AND DEMAND SIDE MANAGEMENT
Arguments for dietary change away from red meat products, and to reduce obesity, have been promulgated to reduce GHG emissions from the agri-food sector. GHG intensities vary widely with different food groups with red meat, on average, being around 150% higher (in terms of CO2-eq/kg) than chicken or fish.
Significant energy demand reductions for food supply could, in theory, be achieved by moving human diets away from animal products (Fig. 2.13). However, this would need to be socially acceptable. In fact the reverse trend is true, particularly in Asia, where middle and upper income classes are tending to move towards a more western diet with higher animal protein content per capita.14
14. The values presented are indicative only and may vary considerably depending on the specific production system and location. Energy values were calculated comparing a large number of literature sources, but these are at time very specific by location and farming system. Water footprint values were taken from Mekonnen & Hoekstra, 2011 and Mekonnen & Hoekstra, 2010. Calories were calculated by applying the conversion factors from the FAOSTAT Food Balance Sheets and, where not available, from the USDA National Nutrient Database for Standard Reference.
WHAT ARE YOU EATING TODAY?
Meals
Wheat 200g
68
24
6704.2 MJ
1.1 MJ
Beef 200g
110
184
4501.9 MJ
14 MJ
Tortilla 50g
4
11
1100.5 MJ
0.8 MJ
Orange juice 200g
40
13
900.4 MJ
1.0 MJ
French fries 100g
8
26
1701 MJ
1.9 MJ
Slice of bread 50g
15
13
1300.5 MJ
1.0 MJ
Cheese 50g
22
26
1900.8 MJ
1.9 MJ
20
9
700.3 MJ
0.7 MJ
119
120
6903 MJ
9 MJ
Apple 150g
Mandarin80g
143
226
6903 MJ
16 MJ
Growing food requires energy and water as input, while providing nutritional energy to humans. Energy is consumed in the form of fuel and electricity used on-farm, to manufacture fertilizers and machinery, and to process food. Water is required to grow crops, to feed animals and to process food products. This infographic presents typical values of water and energy consumption per serving during the production of selected food products (from a life-cycle perspective) as well as their caloric value. Water use is expressed in liters of blue water consumed. Energy use is expressed in megajoules required to produce the food as well as number of hours for which a 20W bulb should run to consume an equivalent amount of energy.
Water 200g
Total Total
Tomato 100g
Water 200g
Wine 200g
Tortilla 50g
Beef 190g
Lettuce 60g
Calories
Hours
Litres
Calories
Hours
Litres
Calories
Hours
Litres
Calories
Hours
Litres
Calories
Hours
Litres
Calories
Hours
Litres
Calories
Hours
Litres
Calories
Hours
Litres
Calories
Hours
Litres
Calories
Hours
Litres
The Water-Energy-Food Nexus
20 W20 W
20 W 20 W
20 W 20 W
20 W 20 W
20 W 20 W
The values presented are indicative only and may vary considerably depending on the specific production system and location. Energy values were calculated comparing a large number of lite-rature sources, but these are at time very specific by location and farming system. Water footprint values were taken from (Mekonnen & Hoekstra, 2011) and (Mekonnen & Hoekstra, 2010). Calori-es were calculated applying the conversion factors from the FAOSTAT Food Balance Sheets and, where not available, from the USDA National Nutrient Database for Standard Reference.
Chicken180g
Rice 150g
Spinach160g

ENER
GY
AN
D T
HE
FOO
D V
ALU
E C
HA
IN
OPPORTUNITIES FOR AGRI-FOOD CHAINS TO BECOME ENERGY-SMART44
Purchasing food that is based on energy efficient management systems and is locally produced, supplied only when in season, needs to be only lightly cooked, and with a low content of livestock products would result in reductions in overall energy demands for the product (Schneider and Smith, 2009). Changing to a low red meat and milk product diet can therefore be an effective means of lowering the carbon and energy footprint of a household (Weber and Matthews, 2008). A household in a high-GDP country changing its consumption to vegetable-based protein sources for just one day a week could produce similar GHG mitigation benefits, as could be obtained by buying all their weekly food from local providers, thus avoiding the energy used for transport.
However, the argument that all meat consumption is bad is rather simplistic (Godfray et al., 2010) since there are significant differences in the production efficiency and hence energy used in the production processes of the major classes of meat consumed. For example, 8 kg of cereals used for animal feed are needed to produce 1 kg of beef meat, whereas only 4 kg are needed for pork, and 1 kg for chicken. Moreover, through better rearing management and genetically improving animal breeds, the conversion efficiency of animal feed intakes can be increased.
A significant proportion of livestock is still grass-fed using pasture land which is often not suitable for arable cropping. In addition, pigs and poultry are often fed on human food wastes in subsistence farming systems. Therefore, these low intensive production systems have a lower carbon footprint.
In low-GDP countries meat and milk represent the most concentrated source of some vitamins and minerals, which is important for young children. Livestock are also widely used for animal power for cultivating transporting goods, and carrying people. They also provide a local supply of manure, can be a vital source of income, and are of huge cultural importance for many poorer communities. Obtaining food as a co-product of livestock thus can provide additional benefits to the traditional benefits associated with livestock usage.
Meat produced from intensive livestock farms situated close to cities can be an efficient way of providing the high amount of food energy needed by urban societies. Since the energy and protein contents of meat are higher than in a similar mass of cereals, smaller amounts need to be transported to the urban centers, therefore lower energy inputs are needed to provide a similar amount of protein.
On the other hand, reduction in energy use through dietary change can also be achieved by eating minimally processed or whole foods, which require less energy for processing and packaging. The agri-food system in high-GDP countries typically provides highly processed, high calorific value foods, with only a small fraction of calorie intake in most diets coming from unprocessed grains, fruits, and vegetables
ENER
GY
AN
D T
HE
FOO
D V
ALU
E C
HA
IN
OPPORTUNITIES FOR AGRI-FOOD CHAINS TO BECOME ENERGY-SMART 45
Implementing policies to achieve dietary change, for example, by lowering the consumption of animal products, would be difficult to introduce, other than by possibly linking them to health co-benefits. Establishing financial incentives or taxes to discourage people from eating high-fat diets, fast foods, and high sugar can be linked to health related objectives such as to reduce heart disease and obesity levels. Changing people’s behavior is not an easy task, and powerful marketing and promotion campaigns would be required to raise awareness and gain public acceptance. In considering this challenge, one should bear in mind that similar campaigns have been successfully undertaken to reduce smoking and drunk-driving in some countries. Overall, policies that encourage food labelling, stimulate dietary change, reduce obesity, and avoid food losses can help reduce the energy demand of the agri-food sector at relatively low cost. However, social acceptance of such policies could be a barrier to implementation.
2.4. CROSS-CUTTING LOW-CARBON AND ENERGY DEMAND EFFICIENCY OPTIONS
Many low carbon and/or energy end-use efficiency measures relevant to the agri-food sector are economically feasible and relate to a wide range of value chains. The three selected chains outlined in detail in Sections 3, 4, and 5 are simply examples. The cross-cutting topics discussed below are relevant to many food value chains, and to at least two of those selected here for detailed analysis (Table 2.2). They include:
• low-carbon systems such as conservation agriculture;
• more energy efficient technologies for water pumping, heating, cooling, processing, conveyance, and field mechanization;
• the manufacture and use of fertilizers and agri-chemicals; and
• efficient transport from farms to markets and to processing plants by road, rail, air, and water.
All of these cross-cutting options can be economically feasible depending on the specific situation and local conditions.
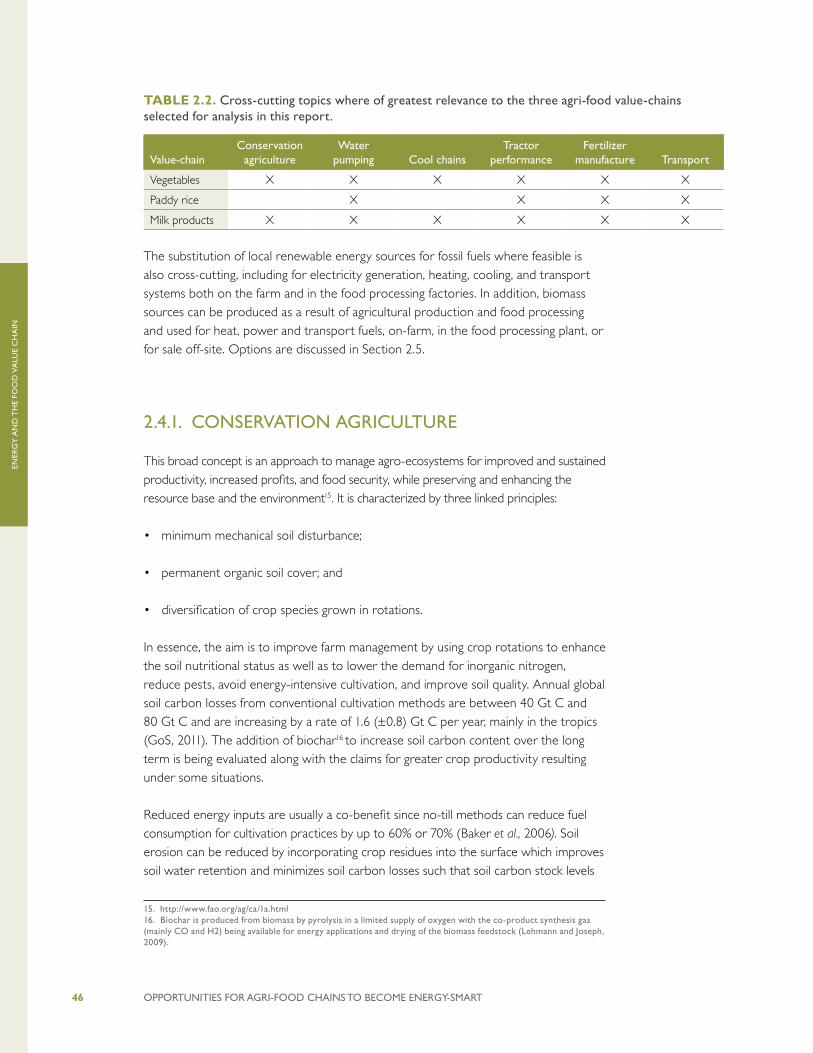
ENER
GY
AN
D T
HE
FOO
D V
ALU
E C
HA
IN
OPPORTUNITIES FOR AGRI-FOOD CHAINS TO BECOME ENERGY-SMART46
Value-chainConservation
agricultureWater
pumping Cool chainsTractor
performanceFertilizer
manufacture Transport
Vegetables X X X X X X
Paddy rice X X X X
Milk products X X X X X X
The substitution of local renewable energy sources for fossil fuels where feasible is also cross-cutting, including for electricity generation, heating, cooling, and transport systems both on the farm and in the food processing factories. In addition, biomass sources can be produced as a result of agricultural production and food processing and used for heat, power and transport fuels, on-farm, in the food processing plant, or for sale off-site. Options are discussed in Section 2.5.
2.4.1. CONSERVATION AGRICULTURE
This broad concept is an approach to manage agro-ecosystems for improved and sustained productivity, increased profits, and food security, while preserving and enhancing the resource base and the environment15. It is characterized by three linked principles:
• minimum mechanical soil disturbance;
• permanent organic soil cover; and
• diversification of crop species grown in rotations.
In essence, the aim is to improve farm management by using crop rotations to enhance the soil nutritional status as well as to lower the demand for inorganic nitrogen, reduce pests, avoid energy-intensive cultivation, and improve soil quality. Annual global soil carbon losses from conventional cultivation methods are between 40 Gt C and 80 Gt C and are increasing by a rate of 1.6 (±0.8) Gt C per year, mainly in the tropics (GoS, 2011). The addition of biochar16 to increase soil carbon content over the long term is being evaluated along with the claims for greater crop productivity resulting under some situations.
Reduced energy inputs are usually a co-benefit since no-till methods can reduce fuel consumption for cultivation practices by up to 60% or 70% (Baker et al., 2006). Soil erosion can be reduced by incorporating crop residues into the surface which improves soil water retention and minimizes soil carbon losses such that soil carbon stock levels
15. http://www.fao.org/ag/ca/1a.html16. Biochar is produced from biomass by pyrolysis in a limited supply of oxygen with the co-product synthesis gas (mainly CO and H2) being available for energy applications and drying of the biomass feedstock (Lehmann and Joseph, 2009).
TABLE 2.2. Cross-cutting topics where of greatest relevance to the three agri-food value-chains selected for analysis in this report.
ENER
GY
AN
D T
HE
FOO
D V
ALU
E C
HA
IN
OPPORTUNITIES FOR AGRI-FOOD CHAINS TO BECOME ENERGY-SMART 47
may increase. The overall impact of conservation agriculture on crop productivity varies (Case Study 2.2) but where lower yields result, this can offset any benefits.
Growing vegetables using conservation agriculture techniques is perhaps more challenging than for arable crops, as production techniques tend to be more intensive, but successful demonstrations exist including for tomatoes (Warnert, 2012) (Case Study 2.3).
CASE STUDY 2.2. CONSERVATION AGRICULTURE AND CROP YIELDSA global analysis of 5,463 paired crop yield observations compared cultivation costs and productivity. No-till significantly increased yields by 7.3% under rain-fed agriculture in dry climates based on field trials across 48 crops and 63 countries. However, overall no-till practices reduced crop yields by 5.7% but could be improved if better combined with the other conservation agriculture principles of soil cover and crop rotation. The analysis did not provide details on the financial aspects but noted that the changeover to a no-till system makes some of the old tillage equipment obsolete resulting in a possible loss of capital investment.
Source: Pittelkow et al., 2014
CASE STUDY 2.3. INTER-CROPPING IN ETHIOPIAMaize yields were steadily declining in Hawassa, southern Ethiopia, because repeated plowing and removal of crop residues to feed livestock eroded the soil and removed nutrients and organic matter. Therefore, conservation agriculture techniques using a maize/bean rotation were implemented under the SIMLESA program of the Ethiopian Institute of Agricultural Research (EIAR). One of the farmers who planted trial plots of maize intercropped with haricot beans (rather than with the climbing beans traditionally grown there) stated the crops were particularly “robust and green - an indication of far better yields than we usually harvest.”
Source: ACIAR, 2011
2.4.2. WATER PUMPING AND IRRIGATION
Mechanical pumping of water is used to provide water supplies for animals, food processing, washing and cleaning, and crop and pasture irrigation. The latter consumes around 225 PJ/yr of energy globally to power the pumps that irrigate approximately 10% of the ~300 Mha of total arable land (Smil, 2008). In addition approximately 50 PJ/yr of indirect energy is used for the manufacture and delivery of irrigation equipment. The improved efficiency of irrigation systems can save on water, energy, costs, and GHG emissions.

ENER
GY
AN
D T
HE
FOO
D V
ALU
E C
HA
IN
OPPORTUNITIES FOR AGRI-FOOD CHAINS TO BECOME ENERGY-SMART48
Irrigated land tends to give greater productivity than rain-fed crops and also enables the option for double and triple cropping practices (FAO, 2011b). However, even where good water supplies are available, a lack of available financial investment often constrains installations, as in Africa where only 4% of cropland is irrigated. In India, irrigation practices based mainly on deep-well pumping resulted in around 3.7% (58.7 Mt CO2-eq) of the country’s total GHG emissions in 2000 (Nelson et al., 2009), but crop yields were increased. Irrigation systems should be designed to use water as efficiently as possible, especially in regions where water supplies are constrained. Gravity-fed systems from water storage reservoirs are common for paddy rice and use little external energy, but where water is scarce, drip irrigation systems are more water efficient than using flood irrigation or overhead sprinklers.
There is sometimes a trade-off between water use efficiency and energy efficiency in the choice of an irrigation system. For example, micro-irrigation drip systems are more water efficient but require more external energy inputs than for manual or surface flood irrigation systems.
Small producers cannot afford expensive irrigation systems and often do not have the capacity for technology adoption, operation, and maintenance. To gain mutual benefits from scale and access to trained operators, they can merge into a producer cooperative or farmer association.
The most common irrigation methods are manual, surface, sprinkler, trickle or micro-irrigation, and sub-irrigation (USAID, 2009).
• Manual irrigation is normally feasible only for small farmers with areas less than 0.5 hectare to be irrigated. The amount of water consumed and labor involved depends on the method of distribution. For instance, using buckets or watering cans uses water efficiently by delivering it directly to the plant, has low requirements for infrastructure and technical equipment, but requires very high labor inputs.
• Surface irrigation, such as commonly used for paddy rice production, has a relatively high water requirement due to inefficient use from evaporation and infiltration to the sub-soil. There is also a risk of increased soil salinity in areas where fields are routinely flooded depending on the soil type. However, it is a low cost and simple technology that can avoid energy demand for water pumping when the fields are supplied by gravity through distribution channels that are manually damned, when needed, to effect flooding.
• Sprinkler irrigation from overhead gives a more efficient use of water, though evaporation losses occur, especially when applied at warm ambient temperatures in direct sunlight. It has a high energy input requirement, can be expensive, and requires technical capacity to operate and maintain. There are several systems of sprinkler irrigation (e.g. center pivot, rotating, traveling/water-reel, lateral move/side
ENER
GY
AN
D T
HE
FOO
D V
ALU
E C
HA
IN
OPPORTUNITIES FOR AGRI-FOOD CHAINS TO BECOME ENERGY-SMART 49
roll/wheel line), which have different capital costs and labor requirements. New hi-tech developments use Global Positioning System (GPS) to monitor crop growth and soil type so the irrigation rates can be continually varied at each nozzle to give “precision irrigation” at high water and energy efficiency levels.17
• Drip irrigation (also known as micro- or trickle-irrigation) is a highly water efficient method, minimizing evaporation and runoff. Once installed, it requires low labor other than for maintenance. Compared to some other automated systems such as overhead sprinklers, it needs lower water pressure and energy use, but it can be costly to install and difficult to regulate and maintain.
• Sub-irrigation/seepage method of irrigation with underground pipes and emitters is sometimes used to grow tomatoes and other field crops in areas with high water tables, or in greenhouses. Similar to drip irrigation with a network of pipes, the system delivers water to the plant root zone from below the soil surface and the water is absorbed upwards. It has a high capital cost and uses high technology inputs.
Water pumps may be powered manually, mechanically using a gasoline or diesel fuel internal combustion engine, by wind, and electrically, either taking power from the main grid, a local micro-grid, through a solar photovoltaic (PV) panel array, or wind turbine to generate power on-site. Since wind and solar are variable forms of renewable energy, pumping only occurs when the wind blows, the sun shines, or relatively expensive battery storage systems are added to the system (Section 2.5). Small-scale hybrid power systems, combining solar and wind energy sources without the need for a backup generator, are used worldwide (USAID, 2009). Water volume demand, local power source availability and reliability, local technical capacity, and system costs are key variables when choosing which pumping technology to adopt. FAO has developed an online tool to assess the economics related to renewable energy solutions for irrigation18.
Energy savings from existing irrigation systems can result from improving basic operating conditions, mending leaks due to lack of maintenance, and replacing worn or improperly sized pumps (Case Study 2.4). Crops often take up less than 50% of the irrigation water applied (FAO, 2011a), so there is potential to improve water use efficiency by reducing water run-off and evaporative and infiltration losses (Case Study 2.5). This can result in less electricity and/or diesel fuel inputs for pumping. Both water and energy inputs can be reduced by altering crop sowing dates to avoid anticipated periods of water deficit and mulching operations, as well as by adopting sensor-based, water demand-led irrigation systems. Precision irrigation systems that accurately and continually control water application rates depending on the varying soil type and moisture levels using GPS analysis can provide reliable and flexible water application, along with deficit irrigation and wastewater reuse (FAO, 2011a). The use of solar
17. http://www.precisionirrigation.co.nz/en/dealers/index/18. http://www.fao.org/energy/88788/en/.
ENER
GY
AN
D T
HE
FOO
D V
ALU
E C
HA
IN
OPPORTUNITIES FOR AGRI-FOOD CHAINS TO BECOME ENERGY-SMART50
PV and wind–powered irrigation systems are gaining in popularity but need to be managed carefully due to the variable nature of the resource, and in combination with water use efficiency.
Recommendations to reduce energy inputs in irrigation systems include:
• using gravity supply where possible;
• using efficient designs of electric motors;
• choosing efficient water pump designs to suit the task so they are correctly matched to their duty;
• performing pump maintenance regularly;
• using low-head distribution systems;
• monitoring soil moisture to guide water application rates;
• applying the minimum amount of water to achieve the target;
• using weather forecasts when applying water on a rotational basis to different fields;
• varying irrigation rates across a field to match the soil conditions – using automatic regulation systems and GPS where feasible to do so;
• conserving the water applied through mulch, tree shelter belts, etc.; and
• maintaining all equipment, water sources, intake screens etc, in good working order.
CASE STUDY 2.4. ENERGY EFFICIENCY IN IRRIGATION – NEW ZEALANDIrrigation is a large user of energy in New Zealand’s farming sector. Availability of data, and a low awareness of the opportunities and costs have traditionally been barriers to the uptake of energy efficiency in the irrigation sector. In 2013 a project was undertaken in a partnership between regional electricity lines companies and Irrigation New Zealand to assess energy efficiency opportunities in irrigation systems and develop benchmarks for use by the sector. Of the 14 systems investigated in this Study, 12 had energy efficiency improvements identified. These could be achieved for relatively low capital costs and delivered an average payback period of 3.8 years. In addition, four industry consultants developed improved proficiency in energy efficiency analysis.
Source: EECA, 2014

ENER
GY
AN
D T
HE
FOO
D V
ALU
E C
HA
IN
OPPORTUNITIES FOR AGRI-FOOD CHAINS TO BECOME ENERGY-SMART 51
2.4.3. HEATING
Heating water, pasteurizing and evaporating milk, heating greenhouses, drying tomatoes, rice and beans, and many other processes in the agri-food sector require heat energy inputs. This is normally produced from the combustion of coal, gas, oil products, biomass or electrical heaters using grid electricity. In order to reduce GHG emissions from fossil fuels, using the heat more efficiently and reducing heat losses within a system give practical solutions. In addition, substituting fossil fuel energy with the renewable energy sources of modern bioenergy, solar thermal, or geothermal gives low-carbon options. The combination of improved energy efficiency with renewable energy can help to keep the energy costs low. Specific heating examples are given in the three selected agri-food chains (Chapters 3, 4, and 5).
Cereals are normally dried artificially after harvest prior to storage and transport in order to maintain quality. Electricity, natural gas, or liquefied petroleum gas (LPG) can be used to provide heat at around 0.5 GJ/t - 0.75 GJ/t to dry wet grain down to an acceptable moisture content at around 14% (wet basis) for storage. Crop drying and curing can be one of the more energy-intensive operations on-farm. For example in Zimbabwe, tobacco (heat) curing accounted for over half the total on-farm energy demand (FAO, 1995). Solar heat can also be used for drying grain or fruit, either naturally in the open air or in solar-heated facilities.
CASE STUDY 2.5. SOLAR-POWERED DRIP IRRIGATION IN PERUA common irrigation practice is to flood the field with seasonal water or from gravity-fed systems or using diesel/gasoline-powered pumps. An alternative is a low-cost, highly efficient, drip irrigation system using a solar-powered pump. This University of Massachusetts project provides farmers in developing countries with an affordable, eco-friendly, and easy irrigation method that promotes the sustainable use of water and energy. The system uses an inexpensive, low-pressure, 12-volt diaphragm pump that is hooked up to a 250 W solar photovoltaic array.
A prototype of the system was installed in January 2008 in Turripampa, Peru. Researchers claim water delivery by drip lines at the plants’ root level is 40% more efficient per unit land area than traditional flood irrigation in furrows since less water is lost due to evaporation and seepage in the sandy soils. Liquid fertilizer could also be applied to the field through the drip lines, reducing labor and energy costs. In addition, depending on the crop cycle, drip irrigation could allow up to three harvests per year instead of one in the rainy season, generating enough income to quickly pay for the system.
Growing asparagus, a drought resistant cash crop, allowed the small farmer to pay back the USD 1,500 initial investment in two years.
Source: Barreto et al., 2009

ENER
GY
AN
D T
HE
FOO
D V
ALU
E C
HA
IN
OPPORTUNITIES FOR AGRI-FOOD CHAINS TO BECOME ENERGY-SMART52
Heat recovery can be one of the most cost-effective energy efficiency measures in a food processing plant. It involves the use of waste heat from one process for another useful purpose. But before investing in heat recovery systems, it is recommended to investigate whether the waste heat can be reduced in the first place through improved energy efficiency. Many processing operations generate significant amounts of waste heat while at the same time another part of the plant or process requires heat. At times the economics of heat recovery can be improved if heat can be stored for later use to smooth out mismatches between supply and demand. Opportunities to link potential heat supply and demand are often overlooked.
Direct heat exchangers involve heat exchanger plants that do not alter the characteristics of the waste heat stream and use straightforward heat exchange between different materials. Phase change behavior systems can also be used to upgrade heat, such as by using vapor compression heat pumps. A range of different types of heat exchange technologies exist including simple warm air recycle, plate and tubular recuperators, run-around coils, regenerators, heat wheels, and heat pipes (that use phase change as part of the heat exchange mechanism and crosses the boundary between direct heat exchange and heat pump mechanisms).
CASE STUDY 2.6. TAPI FOOD: SOLAR FOOD PROCESSING COMPANY IN INDIATapi food, located in Surat, India is a confectionary producing company which produces sweets, fruit jams, fruit jelly candies, sharbats, and squashes. In 2006, Tapi food installed 10 automatic tracking Scheffler parabolic mirrors of 10 m2 each which generate around 350 kg of stream per day at a pressure of around 6 kg/cm2 to heat a special type of steam jacketed kettle. The total investment cost of the installation was around USD 23,015 of which 25% was covered by Tapi food while the remaining 75% was subsidized by the state government of Gujrat and the government of India. Tapi food was able to pay back the amount in around 3 years.
The facility uses solar energy to produce steam which is then used in a steam jacketed kettle to heat and concentrate juice. The heat is also used to boil fruits, additives like sugar, and water to transform them into jams and jellies. The solar dishes enable Tapi food to produce around 1,000 kg of products per day while consuming around 500 liters of water per day to produce steam and saving around 1,000 tonnes of firewood each year which was previously used to produce heat.
In addition to using solar energy, the facility uses bio waste and other agricultural waste to power their boilers during the night and on days when solar irradiance is not substantial. With the success of the solar steam production units the company now aims to use renewable energy for all of its processing processes.
Source: Solar food processing network, 2015 and direct communication with Tapi Food.

ENER
GY
AN
D T
HE
FOO
D V
ALU
E C
HA
IN
OPPORTUNITIES FOR AGRI-FOOD CHAINS TO BECOME ENERGY-SMART 53
Most heat exchangers have negligible built in heat storage, but regenerators are an exception. They operate in a cyclic manner and capture waste heat, store it, and release it for use at a later time. They typically operate in pairs to enable a continuous draw-off of recovered heat — one regenerator would be charged while the other was being drawn down. Another approach is to take recovered heat from any form of heat exchanger and store it for an extended period in a separate piece of the heat exchanger plant such as a well-insulated hot water tank. Conducting a waste heat survey of a food processing site can identify opportunities for heat recovery, provide some idea of a suitable heat exchanger plant, and indicate the need for heat energy storage. Heat exchanger plant selection is dependent upon the heat source and recovered heat use, the transfer mediums (e.g. gas-to-liquid), and other factors such as temperature, fouling risk and costs.
It is also recommended undertaking an analysis of process integration in the plant using pinch technology that can be applied to any situation where there are heat sources and demands. It is a method for systematically looking at all the heat flows within a food processing site or on a dairy farm, in order to optimize process design, plant selection, and energy use. Pinch technology facilitates the recognition of opportunities for cooling from one unit (e.g. milk) to service the heating requirements of another (e.g. water). It can also be used to identify the minimum practical energy requirements for a process. The methodology assists with the choice of energy sources and cooling methods and also helps to identify potential process modifications that would reduce energy use.
The starting point for pinch technology is the recognition that technical processes can be broken into four components:
• hot utilities or sources of energy;
• cold utilities or product or wastes that require final cooling;
• a process stream between the hot and cold utilities that needs to be heated; and
• one that needs to be cooled.
The results of pinch technology, the wise choice of utilities such as cogeneration or heat pumps, and the widespread use of heat exchangers may not lead to the optimum use of energy since maintaining tight control over a process can be essential for both quality control and energy efficiency.

ENER
GY
AN
D T
HE
FOO
D V
ALU
E C
HA
IN
OPPORTUNITIES FOR AGRI-FOOD CHAINS TO BECOME ENERGY-SMART54
2.4.4. COOLING AND COLD STORAGE
To reduce food supply chain losses in developing countries, post-harvest storage and technologies need to be simple, prevent pest infestation, and, where possible, use local renewable sources of energy. Developing refrigeration systems across the whole food supply chain is common in high-GDP countries but for low-GDP countries it may prove more challenging due to the costs involved and the availability of reliable electricity. That is why simple evaporative cooling techniques will continue to have a role to play (Practical Action, 199919) (Case Study 2.7).
More advanced cooling in a cold-storage room where electricity is available can be achieved by means of fans for forced air pre-cooling, evaporative portable forced air cooling, ice-making machines, and hydro-coolers. Renewable energy powered technology options include using solar PV panels, small wind turbines, or small hydro systems to generate electricity for refrigeration and evaporative coolers, or solar energy for direct use in absorption chillers (Section 2.5).
Refrigeration dependence is essential where economic development depends on exporting food that requires preservation through reliable cold chains. Possible solutions focus on the use of passive evaporative-cooling technologies with transport only to local markets rather than active cooling over longer distances that depends on reliable electricity generation on refrigerated boats and trucks. Refrigeration during transport powered by on-board diesel generation sets can be of low efficiency, partly because the surface area to volume ratio of a container is relatively high and insulation
19. http://www.fao.org/climatechange/17850-0c63507f250b5a65147b7364492c4144d.pdf
CASE STUDY 2.7. ZERO ENERGY COOL CHAMBERS PROJECT IN INDIAThe concept of zero energy cool chambers to provide a simple evaporative cooling service for freshly harvested fruit and vegetables has been encouraged for Indian farmers and growers to undertake. It provides a low-cost, on-farm cooling technology that does not require electricity to operate, can be easily constructed using unskilled labor, and uses materials easily sourced locally. The simple structure is based on a double brick wall with the cavity between filled with sand. A roof is constructed using bamboo and other available materials. The walls are then soaked with water and after which evaporation occurs. So it is only feasible when supplies of water are available at around the time of harvest. Such a cool chamber can reduce the temperature of the fresh produce by 10oC -15oC below ambient temperature whilst maintaining a high humidity of about 95%. This retains the quality of the fresh horticultural products and increases their shelf life before transporting to market. Therefore, small farmers can store their harvest over a few days before going to market and avoid selling cheaply to middlemen.
Source: Roy, 2011
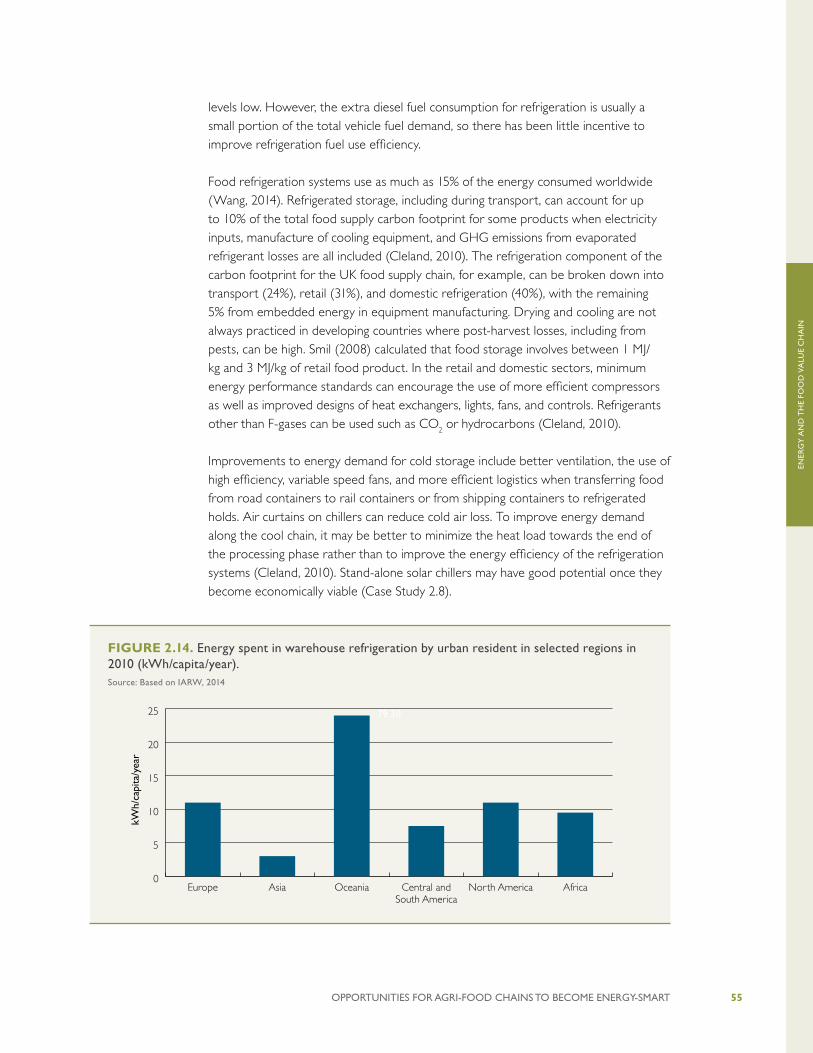
ENER
GY
AN
D T
HE
FOO
D V
ALU
E C
HA
IN
OPPORTUNITIES FOR AGRI-FOOD CHAINS TO BECOME ENERGY-SMART 55
levels low. However, the extra diesel fuel consumption for refrigeration is usually a small portion of the total vehicle fuel demand, so there has been little incentive to improve refrigeration fuel use efficiency.
Food refrigeration systems use as much as 15% of the energy consumed worldwide (Wang, 2014). Refrigerated storage, including during transport, can account for up to 10% of the total food supply carbon footprint for some products when electricity inputs, manufacture of cooling equipment, and GHG emissions from evaporated refrigerant losses are all included (Cleland, 2010). The refrigeration component of the carbon footprint for the UK food supply chain, for example, can be broken down into transport (24%), retail (31%), and domestic refrigeration (40%), with the remaining 5% from embedded energy in equipment manufacturing. Drying and cooling are not always practiced in developing countries where post-harvest losses, including from pests, can be high. Smil (2008) calculated that food storage involves between 1 MJ/kg and 3 MJ/kg of retail food product. In the retail and domestic sectors, minimum energy performance standards can encourage the use of more efficient compressors as well as improved designs of heat exchangers, lights, fans, and controls. Refrigerants other than F-gases can be used such as CO2 or hydrocarbons (Cleland, 2010).
Improvements to energy demand for cold storage include better ventilation, the use of high efficiency, variable speed fans, and more efficient logistics when transferring food from road containers to rail containers or from shipping containers to refrigerated holds. Air curtains on chillers can reduce cold air loss. To improve energy demand along the cool chain, it may be better to minimize the heat load towards the end of the processing phase rather than to improve the energy efficiency of the refrigeration systems (Cleland, 2010). Stand-alone solar chillers may have good potential once they become economically viable (Case Study 2.8).
FIGURE 2.14. Energy spent in warehouse refrigeration by urban resident in selected regions in 2010 (kWh/capita/year).Source: Based on IARW, 2014
0
5
10
15
20
25
AfricaNorth AmericaCentral andSouth America
OceaniaAsiaEurope
kWh/
capi
ta/y
ear
79.30

ENER
GY
AN
D T
HE
FOO
D V
ALU
E C
HA
IN
OPPORTUNITIES FOR AGRI-FOOD CHAINS TO BECOME ENERGY-SMART56
FIGURE 2.15. Compound annual growth rate in refrigerated warehouse capacity (percentage (%), annualized for 2008-2014).Source: IARW, 2014
0 10 20 30 40 50 60 70
TurkeyIndiaPeru
ChinaGreat Britain
ChileNamibiaMexico
BrazilPolandFrance
GermanyPortugalSweden
United StatesDenmark
BelgiumGreeceIreland
ItalyCanada
NetherlandsAustria 4.18
4.51 4.69 4.71 4.84 5.41 5.8 8.73 9.29 9.82 10.8 11.23 11.64 19.7 26.25 26.51 27.41 30.05 31.21 34.67 36.5 42.99 68.11
CASE STUDY 2.8. SOLAR COOLING FOR STORING LIVESTOCK VACCINE IN ANGOLAAnimal husbandry is an important source of livelihood in rural Angola and a major agriculture activity. As a consequence, animal service delivery has a direct impact on the socio-economic conditions of herders. The Strengthening of Livestock Services in Angola (SANGA) project, led by FAO and co-funded by the European Union (EU) and the Institute of Veterinary Services (ISV) of Angola provided technical assistance to the livestock keepers and animal health and veterinary technicians to manage livestock and maintain animal health. The livestock in Angola are vulnerable to diseases due lack of reliable veterinary services and access to vaccination, and vaccines are required to be stored in specific temperatures to survive. The lack of access to energy hampers the storage and distribution of these vaccines across rural Angola resulting in loss of preventable animal life. The project aimed at increasing the availability of medicines in the veterinary support system that would result from the involvement of herders.
In 2011, the project installed solar energy systems in refrigeration rooms in 15 municipal veterinary pharmacies. This included the installation of four PV systems to power veterinary centers, including cold storage rooms, as well as around 15 absorption refrigerators to store vaccines in different villages. Solar energy systems and solar coolers have made vaccines more available and have provided herders with the right tools to treat their animals, thus reducing livestock mortality (and consequently, the waste of natural resources).
Source: FAO, 2011
ENER
GY
AN
D T
HE
FOO
D V
ALU
E C
HA
IN
OPPORTUNITIES FOR AGRI-FOOD CHAINS TO BECOME ENERGY-SMART 57
2.4.5. TRACTORS AND MACHINERY
Increasing the level of agricultural mechanization will require: access by farmers to affordable and reliable fuel supplies; suitable financing arrangements; ownership agreements; hiring opportunities for tractors off-farm; availability of spare parts, maintenance and repair services; and, skill upgrading and education (Ashburner and Kienzle, 2011). In 2005, around one-third of the 27 million tractors then operating in the world were in developing countries. They consumed ~5 EJ of diesel fuel for field operations, land development, and transport (Smil, 2008). A further 1.5 EJ/yr of energy was used for the manufacture and maintenance of tractors and implements. The additional fuel demand for the numerous two-wheel tractor designs used mainly by small farmers is not known. Some developing countries such as Kenya are already well advanced in farm machinery use, so any fuel efficiency initiatives would produce similar results as for farming systems in developed countries.
The energy consumed to manufacture machinery should also be accounted in a life cycle assessment. Generally accepted values of energy intensity for machinery (embedded energy/mass) range from 50 MJ/kg to 80 MJ/kg including repairs over life time (Tullberg, 2014).
In Africa, approximately 80% of cultivation is carried out using hand-tools and animal-powered technologies. Paddy rice production in Asia is also labor intensive. In Bangladesh, manual labor has been partly replaced by the deployment of small, mobile, multi-purpose diesel engines that are used to power small tractors, irrigation pumps, etc. They have revolutionized food production there which illustrates that the availability of cheap fossil fuels, often through government subsidies, have been able to deliver benefits at the small farm scale in recent decades.
For example, farmers in Bangladesh could not afford fuel efficient tractor designs made in India but were able to gain access to cheaper Chinese multi-application engines that then boosted food production as a result (Box 1; Biggs and Justice, 2011). This example illustrates a possible trade-off between adequate access to energy and energy efficiency. One way to address this is to consider the process as stepwise in that when a farmer starts gaining reliable access to energy supplies, this enables an increase in production and income. This, in turn, at some stage in the future might allow the farmer to purchase a more energy efficient tractor.
Many methods of reducing tractor fuel consumption have been well researched and documented (Case study 2.9). These include: matching of tractor and machinery size; controlling tractor passes over the field within “tramlines”; minimizing the number of passes by combining operations like shallow tilling, seeding and fertilizing; selecting tractor and harvester engines with higher fuel efficiencies; retiring high fuel consuming machinery before end-of-life; improving engine maintenance; correcting tire pressures; and implementing training programs on tractor and machinery operations, repairs and maintenance. However, in many situations, energy efficiency is a lower priority than increasing food productivity, reducing losses, and providing sustainable energy access for all.
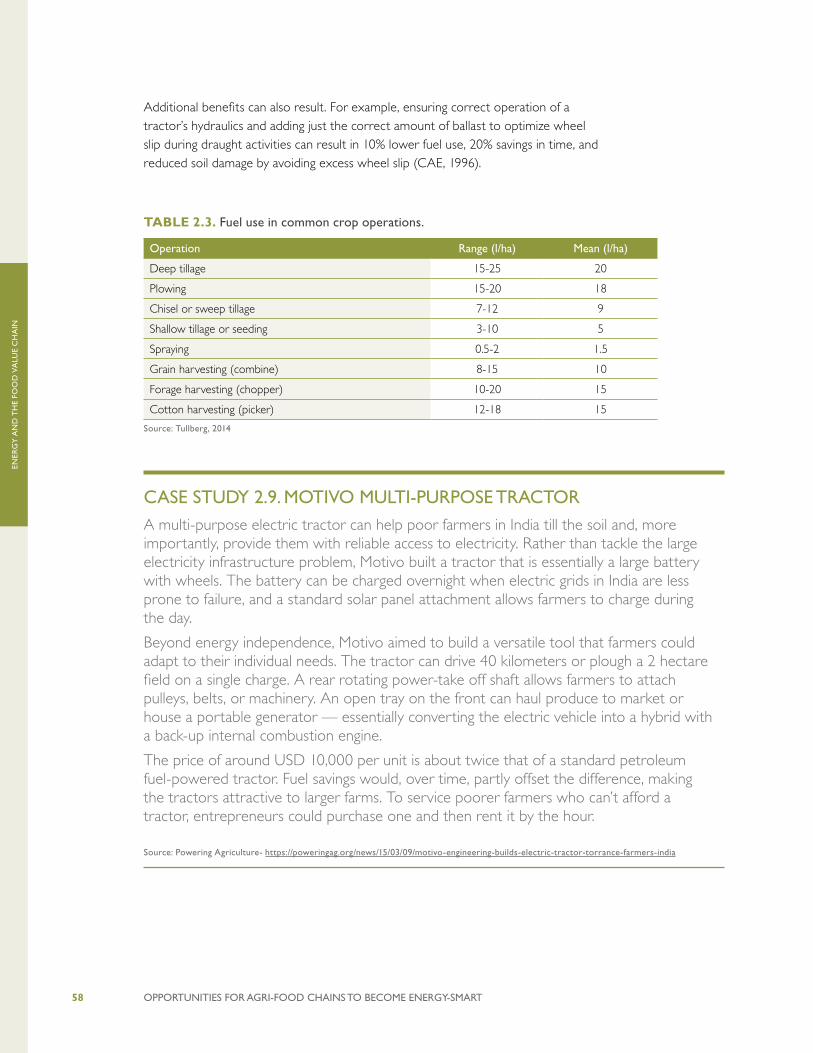
ENER
GY
AN
D T
HE
FOO
D V
ALU
E C
HA
IN
OPPORTUNITIES FOR AGRI-FOOD CHAINS TO BECOME ENERGY-SMART58
Additional benefits can also result. For example, ensuring correct operation of a tractor’s hydraulics and adding just the correct amount of ballast to optimize wheel slip during draught activities can result in 10% lower fuel use, 20% savings in time, and reduced soil damage by avoiding excess wheel slip (CAE, 1996).
TABLE 2.3. Fuel use in common crop operations.
Operation Range (l/ha) Mean (l/ha)
Deep tillage 15-25 20
Plowing 15-20 18
Chisel or sweep tillage 7-12 9
Shallow tillage or seeding 3-10 5
Spraying 0.5-2 1.5
Grain harvesting (combine) 8-15 10
Forage harvesting (chopper) 10-20 15
Cotton harvesting (picker) 12-18 15
Source: Tullberg, 2014
CASE STUDY 2.9. MOTIVO MULTI-PURPOSE TRACTORA multi-purpose electric tractor can help poor farmers in India till the soil and, more importantly, provide them with reliable access to electricity. Rather than tackle the large electricity infrastructure problem, Motivo built a tractor that is essentially a large battery with wheels. The battery can be charged overnight when electric grids in India are less prone to failure, and a standard solar panel attachment allows farmers to charge during the day.
Beyond energy independence, Motivo aimed to build a versatile tool that farmers could adapt to their individual needs. The tractor can drive 40 kilometers or plough a 2 hectare field on a single charge. A rear rotating power-take off shaft allows farmers to attach pulleys, belts, or machinery. An open tray on the front can haul produce to market or house a portable generator — essentially converting the electric vehicle into a hybrid with a back-up internal combustion engine.
The price of around USD 10,000 per unit is about twice that of a standard petroleum fuel-powered tractor. Fuel savings would, over time, partly offset the difference, making the tractors attractive to larger farms. To service poorer farmers who can’t afford a tractor, entrepreneurs could purchase one and then rent it by the hour.
Source: Powering Agriculture- https://poweringag.org/news/15/03/09/motivo-engineering-builds-electric-tractor-torrance-farmers-india

ENER
GY
AN
D T
HE
FOO
D V
ALU
E C
HA
IN
OPPORTUNITIES FOR AGRI-FOOD CHAINS TO BECOME ENERGY-SMART 59
2.4.6. FERTILIZERS AND AGRI-CHEMICALS
Fertilizer is directly relevant to vegetables and paddy rice production, and also to milk production where it is used widely on pastures and for growing crops for animal feed.
Inorganic fertilizer applications have contributed significantly to crop yield increases in recent decades for cereals, pastures, forage crops, vegetables, rice, and fruit. This demand will probably continue to expand, especially in developing countries.
Analyzing energy inputs into crop production requires the adoption of energy coefficients to transform energy inputs into energy consumed as usually measured in Joules. In the production phase, inorganic fertilizers, insecticides, fungicides, and herbicides have the highest impact in terms of MJ per unit of output. For instance, the energy equivalent of herbicides typically ranges between 100 MJ and 200 MJ per unit (Hartirli et al. 2006, Turhan et al. 2008, Pahlavan et al. 2011). Fertilizers, and in particular nitrogenous fertilizers, have an energy input equivalent value of about 70 MJ per unit, whereas the energy equivalents of phosphorus oxide (P2O5) and potassium oxide (K2O) fertilizers are about 10 MJ per unit. In 2000, the total energy embedded in inorganic fertilizer manufacture was around 7 EJ globally (Giampietro, 2002; GoS, 2011; Smil, 2008; Zentner et al. 2004).
Nitrogen fertilizer production alone accounts for about half of the fossil fuels used in primary production and significant amounts of nitrous oxide can be emitted during the production of nitrate (GoS, 2011). Applications of nitrogen (N), phosphorus (P) and potassium (K) macro-nutrients have contributed significantly to crop yield increases in recent decades and this demand will probably expand, mainly in developing countries. Average annual N, P, K applications range from zero in sub-Saharan Africa to 500 kg/ha, 50 kg/ha, and 100 kg/ha respectively in double-cropped Chinese rice fields (Smil, 2008). N-uptake by crops tends to be inefficient, for instance, being as low as around 26% or 28% of the total applied for cereals and 20% for vegetables in some regions of China (Miao et al., 2011).
Some mineral fertilizer manufacturers have demonstrated various options to save energy inputs per unit of fertilizer produced and delivered (Case Study 2.10). In addition, farmers can save indirect energy by reducing the quantity of fertilizers applied to crops and pastures as a result of more precise applications. This will also serve to lower GHG emissions per unit of output and possibly avoid excess nitrates being discharged into aquifers and surface waters. More accurate application can be achieved by improving the precision and timing of applications using engineering and computer-aided technologies such as information technology using biosensors for monitoring of soil fertility, soil moisture, and detection of trace gases. The development of “precision farming” techniques, including using GPS systems for accurate application of agri-chemicals and fertilizers on crops and pastures where needed, can have both direct and indirect energy saving benefits (McBratney et al., 2006). In developed countries, a combination of these techniques has achieved

ENER
GY
AN
D T
HE
FOO
D V
ALU
E C
HA
IN
OPPORTUNITIES FOR AGRI-FOOD CHAINS TO BECOME ENERGY-SMART60
significant reduction in fertilizer use since the mid-1980s (Schneider and Smith, 2009). In the USA for example, application levels by 2000 were around 30% lower than in 1979 (Heinberg and Bromford, 2008). A shift towards organic fertilizers, including the use of nitrogen-fixing plants in a rotation or in a pasture mix, can also reduce indirect energy inputs from nitrogenous fertilizers.
CASE STUDY 2.10. EFFICIENT FERTILIZER USE IN NEW ZEALANDFertilizer manufacture, especially nitrogenous fertilizers, is a high energy process. At the Taranaki plant in New Zealand, around 14,500 m3 of natural gas is required to produce 40 tonnes of urea (50% N) per hour. Only 5.8 L/t of diesel is consumed in transport of the urea to the farms but in total, 370 L of diesel equivalent are consumed by the time one tonne of urea is delivered to the farm, mainly from the natural gas. If applied at 50 kg/ha, then approximately 18.5 L/t is the embodied (indirect) energy input, compared with around 1.5 L/ha of diesel fuel needed to spread it on the land. Therefore, it is more important to apply fertilizer accurately to reduce wastage than it is to try and save tractor fuel. In addition, accurate application limits the buildup of nitrates in the groundwater and reduces emission of the GHG nitrous oxide.
Ground spreading of fertilizer consumes around 1.5 to 1.8 L/ha of fuel, whereas aerial topdressing from fixed-wing aircraft consumes two to five times this amount (although due to the time saved it is often no more expensive per hectare). The energy required for aerial topdressing can constitute around 30% of the total fertilizer energy input. From a direct energy input viewpoint, ground spreading of high analysis fertilizers should be encouraged where practical.
Source: CAE, 1996
Recommendations to reduce energy inputs in fertilizers include:
• growing nitrogen-fixing legume crops such as clovers in pasture or lupins as green crops;
• selecting a fertilizer of the desired nutrient value after soil or leaf analysis and applying it accurately at the calibrated rate determined by the test results;
• applying strategic applications of smaller amounts when the crop needs it to give greater productivity and fewer environmental impacts, though this is partly offset by the additional fuel used by the tractor spreader;
• considering the application of liquid fertilizers, including via fertigation systems when injected directly into the water during irrigation;

ENER
GY
AN
D T
HE
FOO
D V
ALU
E C
HA
IN
OPPORTUNITIES FOR AGRI-FOOD CHAINS TO BECOME ENERGY-SMART 61
• using organic manures where available, including the effluent arising from food processing plants and the sludge from biogas plants; and
• using precision agriculture techniques based on soil types and GPS controlled equipment.
2.4.7. TRANSPORT AND DISTRIBUTION OF GOODS
Under specific circumstances, transport, can account for up to 50% to 70% of the total carbon footprint of some food products; for example, when transporting fresh fruit or vegetables by road to markets several hundred kilometers away or by air to overseas markets to meet out of season demands. Long distance transport by air transport has relatively high energy inputs at 100 MJ/t-km to 200 MJ/t-km, road freight transport is around 70 MJ/t-km to 80 MJ/t-km (80g CO2-eq/t-km to 180g CO2-eq/t-km) and much lower at 10 MJ/t-km to 30 MJ/t-km for shipping (10 g CO2-eq/t-km to 70 g CO2-eq/t-km) or rail (20 g CO2-eq/t-km to 120 g CO2-eq/t-km) (IMO, 2008; Sims et al., 201420). Trips by homeowners to purchase food can account for an additional 1 MJ to 4 MJ of vehicle energy inputs per kg of food purchased. Only around 1% of food products are shipped by air, with around two-thirds of local products and one-third of exported products by road, and the remainder fairly equally divided between rail, shipping, and local waterways (FAO, 2011a).
Typically, the energy input for transport is a relatively small share of total energy inputs into an agri-food chain. Therefore producing specific crops and animal products in locations where productivity is naturally higher due to soil and climatic conditions can sometimes outweigh any possible transport savings if grown locally but yielding less (Case Study 2.11). For this reason, “buying local” in the USA would reduce agri-food GHG emissions by only around 4% to 5% at the most (Weber and Matthews, 2008).
Therefore, the trend towards buying food locally may have relatively little energy saving impacts on transport, but can save energy on processing and packaging of supermarket goods when it is sold fresh or minimally processed (Bomford, 2011). Locating production and handling of food physically closer to areas of high population density can help to reduce transport energy inputs (Heller and Keoleian, 2000).
In 2000, over 800 Mt of food shipments were made globally (Smil, 2008), equating to over 130 kg per person. Taking an extreme case, in the USA, the average household consumes around 5 kg/day of food with an average transport distance per tonne totaling
20. Reducing the energy demand for both long and short distance freight travel is possible for existing road, rail, water and air transport using well understood improvements in technologies and changes in operating behaviour. A detailed overview is provided in the Transport chapter of the IPCC 5th Assessment Report (Sims et al, 2014).
ENER
GY
AN
D T
HE
FOO
D V
ALU
E C
HA
IN
OPPORTUNITIES FOR AGRI-FOOD CHAINS TO BECOME ENERGY-SMART62
8,240 km21 (Weber and Matthews, 2008). In developing countries transport of food is often constrained due to poor roads that restrict long distance travel to markets.
When fresh fruit or vegetables are exported, international shipping is an important component of the total energy (Case Study 2.10). Globalization in the past two decades appears to have increased the average travel movement of food products by 25%. However, total global GHG emissions from transport of food remain far smaller than total emissions from primary production (Weber and Matthews, 2008).
2.4.8. PROCESSING AND PACKAGING
The food processing industry requires energy for heating, cooling, and electricity with the total demand being around three times the direct energy consumed behind the farm gate (White, 2007). In addition, energy is embedded in the packaging which can be relatively energy-intensive due to the use of plastics and aluminum. Packaging accounted for around 5% of total weight of supermarket food purchases in the UK with ~60% to 70% of that being recyclable (LGA, 2009). The total amount of energy needed for processing and packaging has been calculated to lie between 50 MJ/kg to 100 MJ/kg of retail food product (Smil, 2008).
Food processing plants can be relatively energy-intensive such as the wet-milling of corn, which consumes around 15% of total energy used by the USA food industry. Producing heat from combustion of coal, gas, woody biomass, or charcoal for drying, steam-raising, and cooking is the main energy demand for the processing of meat, milk powder, bread, and brewery products. In large-scale plants, cogeneration of heat and power using biomass available on-site can be a profitable co-activity.
21. The total freight transport distance to meet food demand from farm to retail (including transport of seeds, fertilizers and feed for livestock), was approximately 1,200 billion t/km, or around 15,000 t-km/household/yr. 1997 data updated to 2004, including imported food that is likely to have increased the average distance to markets since 1997.
CASE STUDY 2.11. ORCHARD PRODUCTION IN NEW ZEALANDApples can be grown in New Zealand with relatively low energy inputs due to the regular rainfall, good soils and temperate climate. Detailed surveys of orchardists and industry representatives showed that of the total energy consumption of 7.67 MJ per kilogram of apples produced in New Zealand and then delivered to Europe: 1.45 MJ/kg was for orchard operations; 0.51 MJ/g for post-harvest processing and refrigeration; 1.46 MJ/kg for packaging; and 4.24 MJ/kg for shipping, being around 45% of the total (Frater, 2011). However, total energy inputs are comparatively low and apples are also available out of season in the northern hemisphere to meet customer demand.
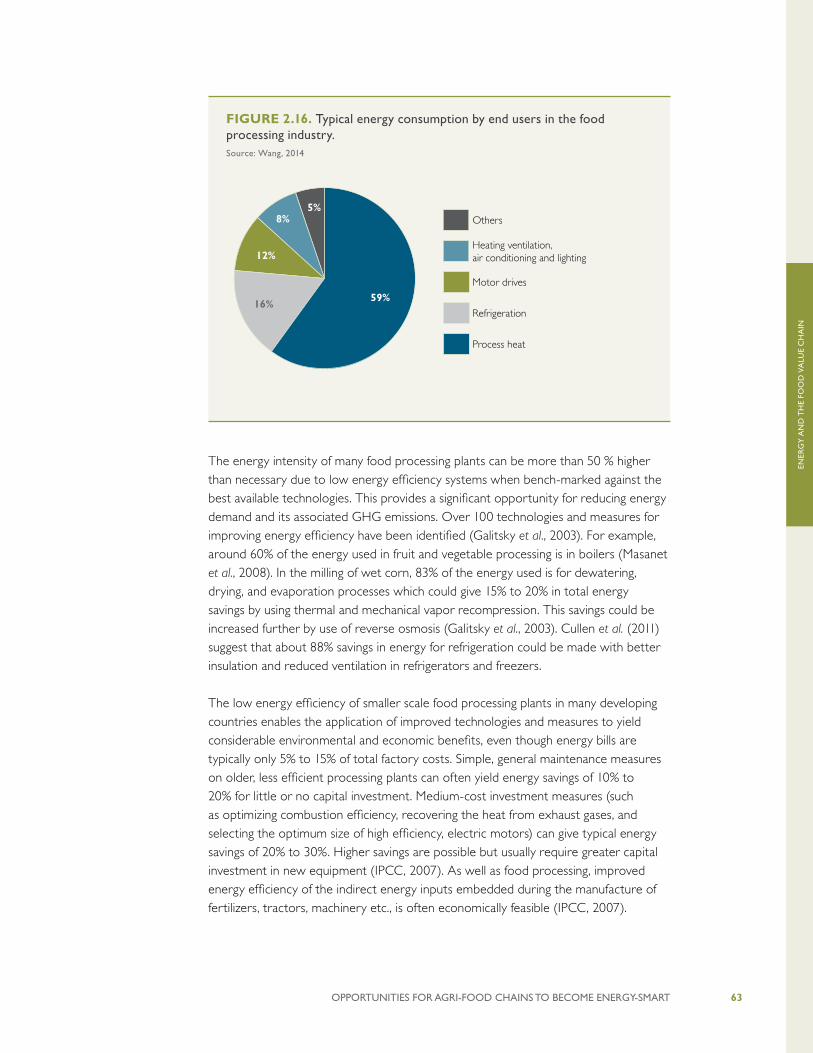
ENER
GY
AN
D T
HE
FOO
D V
ALU
E C
HA
IN
OPPORTUNITIES FOR AGRI-FOOD CHAINS TO BECOME ENERGY-SMART 63
The energy intensity of many food processing plants can be more than 50 % higher than necessary due to low energy efficiency systems when bench-marked against the best available technologies. This provides a significant opportunity for reducing energy demand and its associated GHG emissions. Over 100 technologies and measures for improving energy efficiency have been identified (Galitsky et al., 2003). For example, around 60% of the energy used in fruit and vegetable processing is in boilers (Masanet et al., 2008). In the milling of wet corn, 83% of the energy used is for dewatering, drying, and evaporation processes which could give 15% to 20% in total energy savings by using thermal and mechanical vapor recompression. This savings could be increased further by use of reverse osmosis (Galitsky et al., 2003). Cullen et al. (2011) suggest that about 88% savings in energy for refrigeration could be made with better insulation and reduced ventilation in refrigerators and freezers.
The low energy efficiency of smaller scale food processing plants in many developing countries enables the application of improved technologies and measures to yield considerable environmental and economic benefits, even though energy bills are typically only 5% to 15% of total factory costs. Simple, general maintenance measures on older, less efficient processing plants can often yield energy savings of 10% to 20% for little or no capital investment. Medium-cost investment measures (such as optimizing combustion efficiency, recovering the heat from exhaust gases, and selecting the optimum size of high efficiency, electric motors) can give typical energy savings of 20% to 30%. Higher savings are possible but usually require greater capital investment in new equipment (IPCC, 2007). As well as food processing, improved energy efficiency of the indirect energy inputs embedded during the manufacture of fertilizers, tractors, machinery etc., is often economically feasible (IPCC, 2007).
FIGURE 2.16. Typical energy consumption by end users in the food processing industry.Source: Wang, 2014
Others
Heating ventilation,air conditioning and lighting
Motor drives
Refrigeration
Process heat
59%
5%8%
12%
16%
ENER
GY
AN
D T
HE
FOO
D V
ALU
E C
HA
IN
OPPORTUNITIES FOR AGRI-FOOD CHAINS TO BECOME ENERGY-SMART64
Taking the dairy processing industry as an example, the key energy efficiency technologies are: the use of pinch technology as an analytical tool; multiple effects evaporation and mechanical vapor recompression as a means of recovering and reusing heat; and various membrane separation technologies as substitutes for evaporation or centrifuge use. Also useful are cogeneration, direct firing of driers using natural gas, and using pressurized hot water systems for heating rather than steam generation.
For meat processing, energy management initiatives include using smaller plants to lower energy demand, since bigger plants have a large baseload and tend to use less variable energy per unit of production than smaller plants due to economies of scale. The use of multi-shift operations in small plants spreads their energy baseloads across enough production to counter the loss of economies of scale. This illustrates that industry structural trends can be as important as equipment retrofits in improving energy efficiency. The key energy efficiency technologies for the meat industry are better heat recovery from refrigeration plants through the use of supercritical refrigerants such as CO2, the use of variable speed electric motors to drive equipment such as fans, management practices for better scheduling of refrigeration compressors, methods to reduce cold air loss through cold store doors, improved hot water management, and cogeneration.
For the processing of many frozen or canned foods, low temperature heat pump drying, freeze concentration, the use of air knives or vacuums for surface drying, ozone and ultraviolet treatments to extend product life or to sterilize water supplies, ohmic heating of food, and air radio frequency heating combined with conventional hot air drying are useful low energy technologies.
More specifically, fans can account for 20% to 30% or more of the load in a chiller and since air velocity determines the rate of heat removal, it needs to be adjusted as freezing progresses. The use of variable speed drives (VSDs) to modulate fan output is more effective than having many fans and progressively switching these off to achieve the desired airflow. Increasing hot water storage can also lead to efficiency gains by accommodating demand fluctuations that enables the hot water to be supplied from boilers running continuously near peak capacity and therefore at maximum efficiency. When drying, both multiple effect evaporators and mechanical vapor recompression technologies enable the latent heat of evaporation to be recovered and reused.
For vegetables such as beans to be frozen, excess water can create problems of product clumping. So dewatering prior to freezing using air knives or a vacuum is possible, with the latter often preferable. Since less water now needs to be frozen, energy has been saved while product quality is improved.
Management focus in food processing tends to be on product quality rather than energy use. This can be turned into an advantage if management can be encouraged to critically review the technical processes and control systems they use and involve their staff in this exercise (Case Study 2.12).
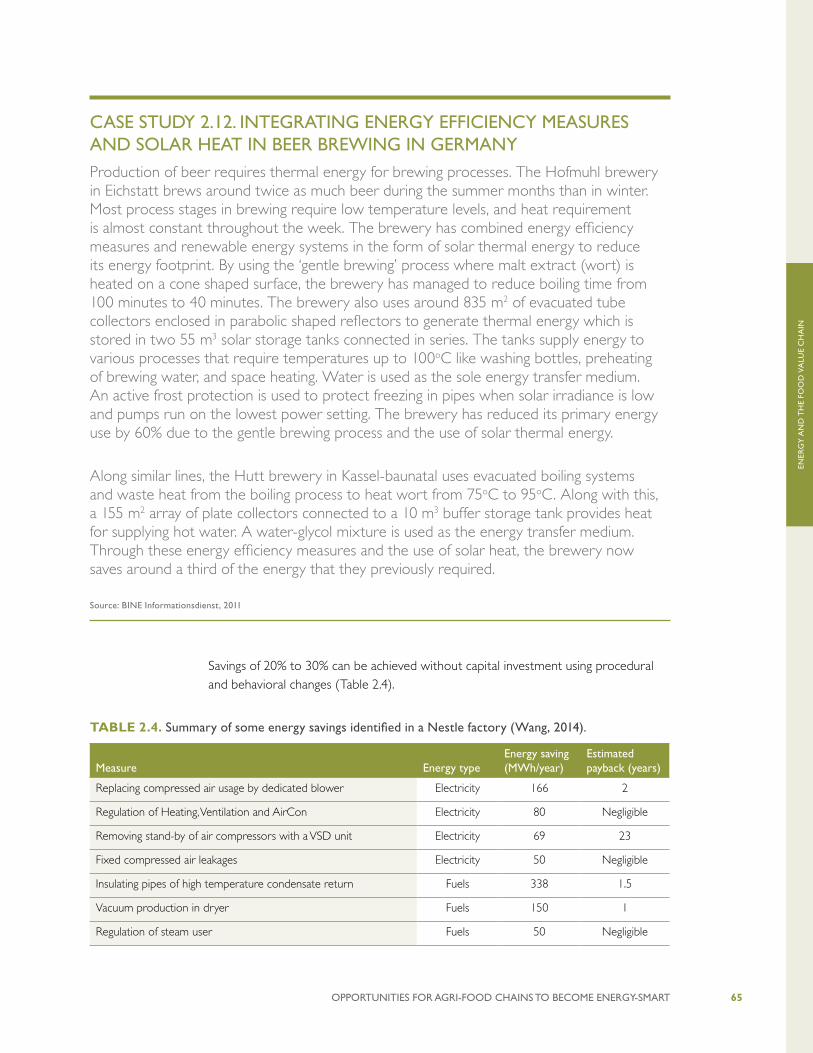
ENER
GY
AN
D T
HE
FOO
D V
ALU
E C
HA
IN
OPPORTUNITIES FOR AGRI-FOOD CHAINS TO BECOME ENERGY-SMART 65
Savings of 20% to 30% can be achieved without capital investment using procedural and behavioral changes (Table 2.4).
CASE STUDY 2.12. INTEGRATING ENERGY EFFICIENCY MEASURES AND SOLAR HEAT IN BEER BREWING IN GERMANY Production of beer requires thermal energy for brewing processes. The Hofmuhl brewery in Eichstatt brews around twice as much beer during the summer months than in winter. Most process stages in brewing require low temperature levels, and heat requirement is almost constant throughout the week. The brewery has combined energy efficiency measures and renewable energy systems in the form of solar thermal energy to reduce its energy footprint. By using the ‘gentle brewing’ process where malt extract (wort) is heated on a cone shaped surface, the brewery has managed to reduce boiling time from 100 minutes to 40 minutes. The brewery also uses around 835 m2 of evacuated tube collectors enclosed in parabolic shaped reflectors to generate thermal energy which is stored in two 55 m3 solar storage tanks connected in series. The tanks supply energy to various processes that require temperatures up to 100oC like washing bottles, preheating of brewing water, and space heating. Water is used as the sole energy transfer medium. An active frost protection is used to protect freezing in pipes when solar irradiance is low and pumps run on the lowest power setting. The brewery has reduced its primary energy use by 60% due to the gentle brewing process and the use of solar thermal energy.
Along similar lines, the Hutt brewery in Kassel-baunatal uses evacuated boiling systems and waste heat from the boiling process to heat wort from 75oC to 95oC. Along with this, a 155 m2 array of plate collectors connected to a 10 m3 buffer storage tank provides heat for supplying hot water. A water-glycol mixture is used as the energy transfer medium. Through these energy efficiency measures and the use of solar heat, the brewery now saves around a third of the energy that they previously required.
Source: BINE Informationsdienst, 2011
TABLE 2.4. Summary of some energy savings identified in a Nestle factory (Wang, 2014).
Measure Energy type Energy saving (MWh/year)
Estimated payback (years)
Replacing compressed air usage by dedicated blower Electricity 166 2
Regulation of Heating, Ventilation and AirCon Electricity 80 Negligible
Removing stand-by of air compressors with a VSD unit Electricity 69 23
Fixed compressed air leakages Electricity 50 Negligible
Insulating pipes of high temperature condensate return Fuels 338 1.5
Vacuum production in dryer Fuels 150 1
Regulation of steam user Fuels 50 Negligible
ENER
GY
AN
D T
HE
FOO
D V
ALU
E C
HA
IN
OPPORTUNITIES FOR AGRI-FOOD CHAINS TO BECOME ENERGY-SMART66
2.4.9. USE OF INFORMATION TECHNOLOGY
Application of information and communication technology (ICT) in agriculture could bring innovation in agriculture technology and ensure more efficient production systems. Portable and hand held devices such as internet connected mobile phones could be used as an effective tool to disseminate crucial information such as local weather conditions, prevalent prices, information of subsides, as well as information on sustainable practices relating to the use of fertilizers and other resources such as energy and water. Many developing countries in Asia and Africa have leapfrogged to advance wireless technologies with high penetration of mobile phone and low penetration of wired land lines. In addition to providing key information, wireless ICT can also be used to provide access to financial services to rural populations where banks do not exist. Some examples of ICT-enabled financial services for the rural sector include mobile financial services, branchless banking, ATMs, and smartcards. Specific apps on mobile phones or the ability to make calls and send and receive messages can be used to follow market prices for farmers’ products and to be kept informed of the latest trends and developments (Case Study 2.13). Extension workers promoting best practices can make regular and continuing contact with thousands of farmers rather than dozens of farmers. Data can be transferred relating to food certification bodies and food safety, as is being demanded by food product purchasers in China, Europe, and elsewhere. Information and advice could also be sought on maintaining renewable energy systems.
CASE STUDY 2.13. USE OF A MOBILE APP IN PUDUCHERRY, INDIAPuducherry, a district in the coastal state of Tamil Nadu in southern India, is one of the oldest fishing towns in India. With the changing environmental conditions, and after the 2004 Indian ocean tsunami, fishermen have started employing new technologies that offer them better information. “Fisher Friend” is an app that can be installed on a low cost CDMA phone and keeps fishermen informed of important safety, weather, and livelihood information. The app has a graphic interface and an icon based menu which makes it easy to use. The app-based service can be used at an affordable subscription which costs a maximum of USD 0.60/month.
Source: Qualcomm’s Wireless Reach Initiative (http://www.oecd.org/aidfortrade/48367406.pdf)
Mobile phones can also be used to give diagnostic advice to farmers. If a disease appears on their bean crop, a photo can be taken and sent to an organization anywhere in the world that provides diagnostic services and provide advice on treatment. Use of ICT is also very useful in increasing transparency in the market by ensuring the farmers get fair prices for their produce while also guaranteeing the sale of their produce. The Indian company RML set up a network of internet connected kiosks (Case Study 2.14).

ENER
GY
AN
D T
HE
FOO
D V
ALU
E C
HA
IN
OPPORTUNITIES FOR AGRI-FOOD CHAINS TO BECOME ENERGY-SMART 67
Farmers in many countries are beginning to benefit from information technologies and improved communication facilities. This is true for not only large corporate and small business farming enterprises, but also for small family farms, and potentially for subsistence farmers as they begin to work in co-operatives and market surplus through farmers’ associations in the future to improve their livelihoods. This would have not been possible without access to a modern source of energy such as electricity. Moreover, such technologies are not energy intensive, and the energy needed can be easily supplied by renewable energy sources such as solar PV.
CASE STUDY 2.14. REUTERS MARKET LIGHT (RML) SMS SERVICE IN INDIAICT-enabled services targeting farmers are increasing quickly. RML is a commercial ICT service which caters to the entire agricultural value chain. By 2014, RML covered more than 450 crop varieties, 1,300 markets, and is used by over 1.4 million farmers in 50,000 villages across 17 states in India.
The services have helped farmers reduce prices by around 12% and given them access to markets. Approximately 90% of farmers believe they have benefited from the RML service, and over 80% of farmers are willing to pay for it (Gandhi, 2015). The typical cost of the service is around USD 1.50 per month. The farmers receive four to five messages per day on prices, commodities, and advisory services from a database with information on crops and markets. Preliminary evidence suggests that collectively, the service may have generated additional USD 2–3 billion in income for farmers as a result of improved decision-making, while over 50% of them have reduced their spending on agricultural inputs.
Source: ICT in Agriculture, 2011
CASE STUDY 2.15. BENEFITS FROM ICT SYSTEMS FOR RICE GROWERS IN THE PHILIPPINESA new computer-based decision tool, “Nutrient Manager for Rice”, developed jointly by the International Rice Research Institute and the Atlas Fertilizer Corporation, provides rice farmers with guidelines and advice for nutrient management so they can apply fertilizer more efficiently and therefore maximize yields. The tool is available as a mobile platform accessible by tablets, laptops or cell phones that more than 90% of Filipino farmers now own. Traditionally fertilizer advice to relatively few farmers has been achieved through farmer meetings and technical seminars. Now many more can benefit from “using the right nutrient source, at the right rate, at the right time, in the right place” to increase yields and gain additional income. Applying fertilizer more efficiently saves on energy inputs and related GHG emissions.
Source: Ilustre R, 2015. Partnerships for improved nutrient management, Fertilizers & Agriculture, Newsletter, International Fertilizer Industry Association, February. pp3-5 www.fertilizer.org

ENER
GY
AN
D T
HE
FOO
D V
ALU
E C
HA
IN
OPPORTUNITIES FOR AGRI-FOOD CHAINS TO BECOME ENERGY-SMART68
Rural dwellers and farmers in most countries now have access to mobile phones. Even if they have no electricity access, the phones are being recharged using solar chargers and mobile phone antennas are being powered by off-grid PV systems.
For example, in Africa a few years ago, the phone landlines were unreliable and did not reach many rural communities, so there was no internet access and it was impossible to talk on the telephone. Today this has been totally transformed and there are now more mobile phone users in Africa than in Europe or North America22.
Instead of abandoning the entire technology when only a wire has become loose or the battery needs replacing, seeking advice becomes possible even in remote regions where it is difficult for service agents to reach without high travel costs.
In addition, GPS facilities are evolving to enable the greater uptake of precision farming systems. GPS enables more efficient application of fertilizers and agrichemicals by automatically varying application rates according to soil type and plant growth, and can control individual sprinklers of irrigation systems to reduce wasting water and avoid nutrient loss and pollution of nitrates to groundwater23.
2.5. RENEWABLE ENERGY SUPPLY OPTIONS FOR, AND FROM, THE AGRI-FOOD CHAIN
Using local renewable energy resources along the entire agri-food chain can help to improve energy access, allay energy security concerns, diversify farm and food processing revenues, avoid disposal of waste products, reduce dependence on fossil fuels and greenhouse gas emissions, and help achieve sustainable development goals. Land used to produce food also receives solar, wind, and possibly hydropower resources with potential for electricity generation. In addition, from all agri-food chains, biomass resources are produced as crop residues, animal wastes, food process wastes that can be converted into bioenergy and used for heat and power generation, as well as transport fuels.
The transition away from fossil fuels to renewable energy systems has begun in all sectors including agri-food, but it will take time to take full effect and the use of fossil fuels will continue for many years. Biomass, wind, solar, hydro, geothermal, and ocean energy resources are widely available and can be converted into the full range of energy carriers (electricity, heat, cold, liquid biofuels, and gaseous biofuels including biogas).
22. http://en.wikipedia.org/wiki/List_of_countries_by_number_of_mobile_phones_in_use23. See for example http://www.precisionirrigation.co.nz/

ENER
GY
AN
D T
HE
FOO
D V
ALU
E C
HA
IN
OPPORTUNITIES FOR AGRI-FOOD CHAINS TO BECOME ENERGY-SMART 69
At present, renewable energy meets over 13% of the global primary energy demand although almost half of this comes from traditional biomass used for cooking and heating. Renewable energy worldwide added 103 GW to global capacity in 2014 with total investment rising by 17% to reach a total of USD 270 billion, just 3% behind the all-time record set in 2011 of USD 279 billion. Wind, solar, biomass, waste-to-energy, geothermal, small hydro, and marine power contributed an estimated 9.1% of world electricity generation in 2014 which represents a GHG emissions savings of around 1.3Gt CO2-eq, about twice the emissions of the global aviation sector (UNEP, 2015). Many scenarios show there is good potential for the share of modern renewable energy to rise to over 70% by 2050 (IPCC, 2011a).
This Section focuses on the opportunities for renewable energy deployment on farms, in rural areas, and for food processors, whilst recognizing the need for flexibility and trade-offs between the continued use of fossil fuels, and energy efficiency measures.
Where good solar, wind, hydro, geothermal, or biomass resources exist, these can be used to generate heat or electricity for use by on-farm enterprises as well as to substitute for fossil fuel direct energy inputs in food processing plants. If excess heat or electricity is produced to meet demand on-site, it can be exported off the property to gain additional revenue for the owner of the enterprise. Such activities can result in rural development benefits for landowners, small agri-food industries, and local communities.
2.5.1. RENEWABLE ENERGY TECHNOLOGIES
In locations where good renewable energy resources exist, farmers and agri-food processing businesses have the opportunity to install their own technologies to generate wind power, solar power, micro-hydro-power or, possibly in the future, electricity from ocean energy resources. Landowners can also partner with wind farm, geothermal or other renewable energy developers and gain a share of any electricity sales that result. At the decentralized scale, solar thermal, biomass, and geothermal resources can be utilized to supply both heating and cooling. Detailed assessments of each technology, together with issues concerning integration into existing and future energy supply systems, sustainable development, costs and potentials, and supporting policies are discussed in detail in the IPCC report, “Renewable Energy and Climate Change Mitigation” (IPCC, 2011b). They are only briefly covered here.
2.5.2. BIOENERGY
Biomass is the most widely used form of renewable energy worldwide and can be defined as “energy contained in living or recently living biological organisms” (Fossil fuels are thus excluded). It originates from various sources (Table 2.5) and its application can provide heat (for both traditional and modern applications) (Fig. 2.17), electricity, and transport fuels.
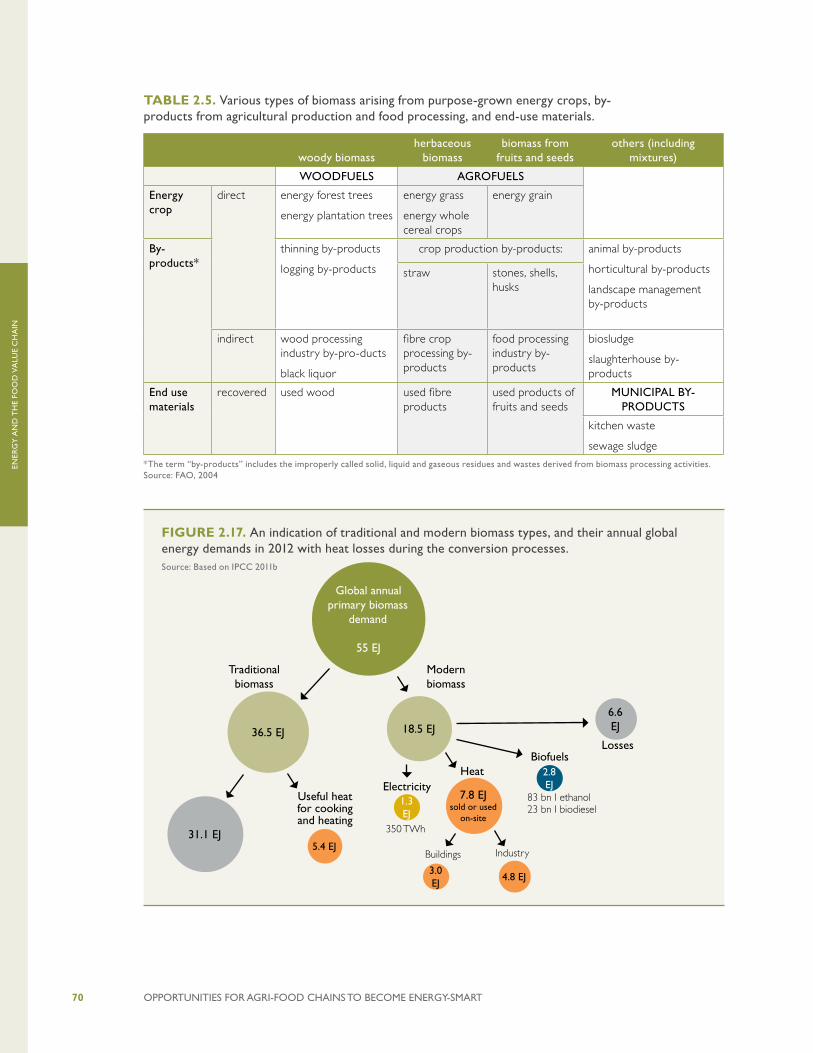
ENER
GY
AN
D T
HE
FOO
D V
ALU
E C
HA
IN
OPPORTUNITIES FOR AGRI-FOOD CHAINS TO BECOME ENERGY-SMART70
TABLE 2.5. Various types of biomass arising from purpose-grown energy crops, by-products from agricultural production and food processing, and end-use materials.
FIGURE 2.17. An indication of traditional and modern biomass types, and their annual global energy demands in 2012 with heat losses during the conversion processes.Source: Based on IPCC 2011b
woody biomassherbaceous
biomassbiomass from
fruits and seedsothers (including
mixtures)
WOODFUELS AGROFUELS
Energy crop
direct energy forest trees
energy plantation trees
energy grass
energy whole cereal crops
energy grain
By-products*
thinning by-products
logging by-products
crop production by-products: animal by-products
horticultural by-products
landscape management by-products
straw stones, shells, husks
indirect wood processing industry by-pro-ducts
black liquor
fibre crop processing by-products
food processing industry by-products
biosludge
slaughterhouse by-products
End use materials
recovered used wood used fibre products
used products of fruits and seeds
MUNICIPAL BY-PRODUCTS
kitchen waste
sewage sludge
*The term “by-products” includes the improperly called solid, liquid and gaseous residues and wastes derived from biomass processing activities.Source: FAO, 2004
Global annual primary biomass
demand
55 EJ
36.5 EJ 18.5 EJ
31.1 EJ
6.6 EJ
5.4 EJ
7.8 EJsold or used
on-site
3.0 EJ
4.8 EJ
2.8 EJ
1.3 EJ
Traditional biomass
Modernbiomass
Useful heat for cooking and heating
ElectricityHeat
LossesBiofuels
83 bn I ethanol23 bn I biodiesel
Buildings Industry
350 TWh

ENER
GY
AN
D T
HE
FOO
D V
ALU
E C
HA
IN
OPPORTUNITIES FOR AGRI-FOOD CHAINS TO BECOME ENERGY-SMART 71
There are a wide variety of solid biomass resources, including vegetative grass crops, forest residues, crop residues, nut shells (Case Study 2.16), rice husks, animal wastes, and urban wastes. Firewood, the oldest energy source known to mankind, can be a renewable energy source because the energy it contains comes from the sun - as is the case for all biomass sources. However, any tree, crop, or plant residue harvested then combusted to provide energy services has to be replaced by a new plant for biomass to be truly sustainable, renewable, and low carbon. In addition the soil nutrients need to be replaced, possibly through application of the ash or sludge from a biogas plant.
Modern combustion, gasification, and pyrolysis thermo-chemical conversion technologies are largely mature, although improvements in performance and conversion efficiencies are continually being sought. This is also the case for bio-chemical conversion processes such as anaerobic digestion and ligno-cellulosic enzymatic hydrolysis.
CASE STUDY 2.16. NUT SHELLS FOR PACKAGING MATERIALS AND BIOFUELS Shells from cashew nuts are rich in cellulose and fiber which can be used to produce packaging as well as can be used as biofuels. Italian chocolate manufacturing company Ferrero uses about 25% of the world hazelnut production to manufacture 180 million kg of its Nutella spread per year, generating large quantities of hazelnut shell as residual by-product. Partnering with Stora Enso, a renewable packaging company and PTS, a German research institute, they are using hazelnut shells and cocoa skin as raw material for fiber in pulp to make packaging material for chocolates.
Cashew shells are cellulose-rich, non-edible residues which when transformed into bioplastic can be used in a wide range of products such as computers and car interiors. Although still at the laboratory stage, the Japanese technology company NEC, is using residues to produce heat and water resistant bioplastic for electronic devices. Most bioplastic is traditionally made from starch which is derived from crops such as corn that competes for land with food production. The high cellulose content also makes them ideal as solid biomass for combustion to produce bioenergy (both heat and electricity).
In Africa and India, peanut and almond shells are used as solid fuels in coal boilers and domestic stoves. They can also be processed into briquettes to be used in biomass boilers. An Australian nut producer, Suncoast Gold Macadamias, produces around 4,000 tonnes of macadamia shell per year. Through an investment of USD 3 million in a waste-to-energy plant, the company now generates around 9,500 MWh of renewable electricity by burning macadamia residues. The processing plant uses around 1,400 MWh of generation per year and sells any surplus back to the grid.
Source: Moulds, 2015
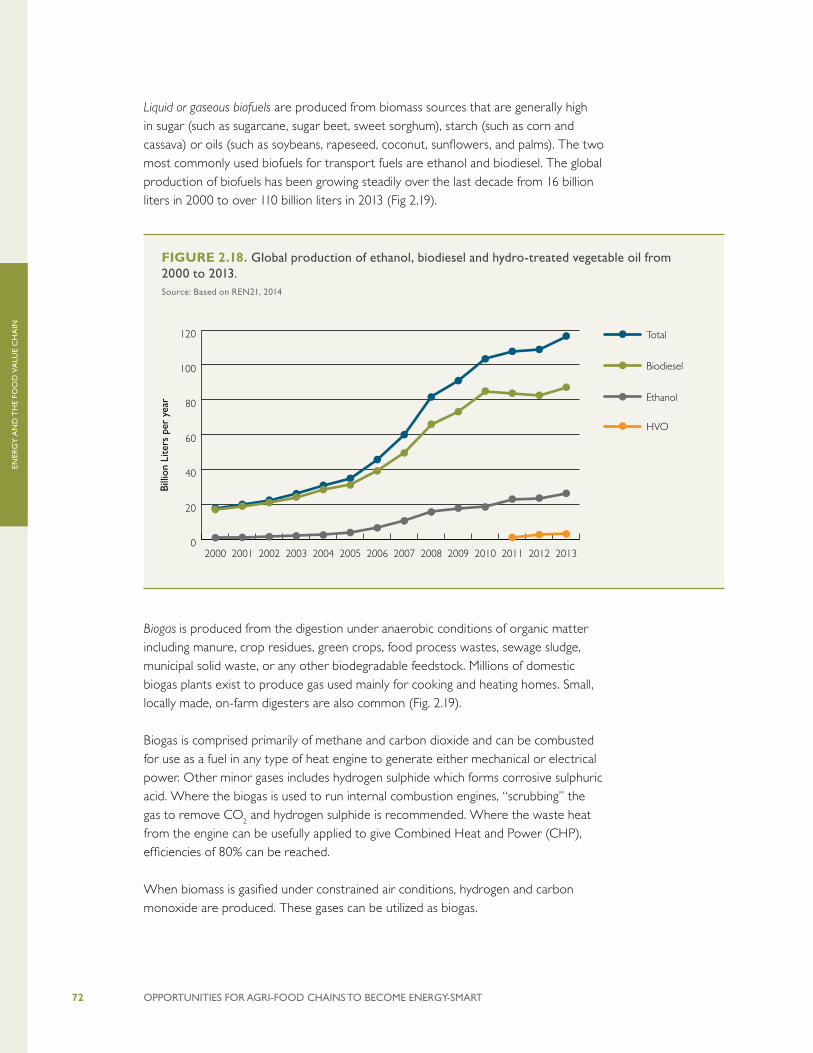
ENER
GY
AN
D T
HE
FOO
D V
ALU
E C
HA
IN
OPPORTUNITIES FOR AGRI-FOOD CHAINS TO BECOME ENERGY-SMART72
Liquid or gaseous biofuels are produced from biomass sources that are generally high in sugar (such as sugarcane, sugar beet, sweet sorghum), starch (such as corn and cassava) or oils (such as soybeans, rapeseed, coconut, sunflowers, and palms). The two most commonly used biofuels for transport fuels are ethanol and biodiesel. The global production of biofuels has been growing steadily over the last decade from 16 billion liters in 2000 to over 110 billion liters in 2013 (Fig 2.19).
Biogas is produced from the digestion under anaerobic conditions of organic matter including manure, crop residues, green crops, food process wastes, sewage sludge, municipal solid waste, or any other biodegradable feedstock. Millions of domestic biogas plants exist to produce gas used mainly for cooking and heating homes. Small, locally made, on-farm digesters are also common (Fig. 2.19).
Biogas is comprised primarily of methane and carbon dioxide and can be combusted for use as a fuel in any type of heat engine to generate either mechanical or electrical power. Other minor gases includes hydrogen sulphide which forms corrosive sulphuric acid. Where the biogas is used to run internal combustion engines, “scrubbing” the gas to remove CO2 and hydrogen sulphide is recommended. Where the waste heat from the engine can be usefully applied to give Combined Heat and Power (CHP), efficiencies of 80% can be reached.
When biomass is gasified under constrained air conditions, hydrogen and carbon monoxide are produced. These gases can be utilized as biogas.
FIGURE 2.18. Global production of ethanol, biodiesel and hydro-treated vegetable oil from 2000 to 2013. Source: Based on REN21, 2014
0
20
40
60
80
100
120 Total
HVO
Biodiesel
Ethanol
20132012201120102009200820072006200520042003200220012000
Billi
on L
iters
per
yea
r

ENER
GY
AN
D T
HE
FOO
D V
ALU
E C
HA
IN
OPPORTUNITIES FOR AGRI-FOOD CHAINS TO BECOME ENERGY-SMART 73
Biogas can also be used for a range of energy applications such as industrial burners (consuming around 1,000 L/hr - 3,000 L/hr); gas refrigerators (30 L/hr -75 L/hr for 100 liters capacity depending on ambient temperature); co-fueled biogas / diesel engines (500 L/hr per kW). To generate 1 kWh of electricity from biogas about 1 m3 of gas is required (or less if co-fueled with diesel or gasoline), so a small-scale biogas system should produce at least 10 m3 biogas per day to be viable for a power generation plant used on a small farm.
2.5.3. WIND POWER
For decades wind has been used to drive windmills to grind grain and to pump water, this remains common today in many rural areas. More recently, electricity generating wind turbines ranging in size from 0.3 kW to 6 MW have become reliable and cost effective. Many rural properties have considerable wind resources, which are still untapped.
The amount of electricity generated at a site is related to the wind resources, and the power generated from a turbine is determined by the cube of the wind speed. So if a wind turbine is located on a site with an excellent mean annual wind speed of 10 m/second (capacity factor around 45%-50%), it will generate around three times as much electricity in a year as if it was located on a good to average site with 7 m/s mean speed (capacity factor around 20%-25%). As a general rule, wind turbines can be competitive where the average wind speed is 5 m/s or greater. Usually sites
FIGURE 2.19. Small on-farm anaerobic digester in Kenya using manure from a 4 cow dairy herd with butanol gas storage bag.
ENER
GY
AN
D T
HE
FOO
D V
ALU
E C
HA
IN
OPPORTUNITIES FOR AGRI-FOOD CHAINS TO BECOME ENERGY-SMART74
are pre-selected on the basis of a wind atlas, and then validated with on-site wind measurements before development of a wind farm. For grid integration, the variability of the wind can be overcome by having flexible grids when at low to moderate penetration levels (Sims et al., 2011)
Technological developments over recent years have resulted in more efficient and more reliable wind turbines. As is the case for several other forms of renewable energy technologies, the benefits of wind turbines include:
• produce no greenhouse gases, though like every manufactured product, they have a carbon footprint;
• can make a significant contribution to a regional electricity supply and to power supply diversification, as well as provide electricity to remote locations off-grid;
• a short lead time between planning and construction as compared to coal, gas, and nuclear powered projects, though gaining a consent to build a large wind farm with many turbines can take time depending on the perceptions of possible impacts by the local communities;
• flexibility with regard to an increasing energy demand since more turbines can easily be added to an existing wind farm; and
• make use of local resources in terms of labor, capital and materials for towers, roads, and foundations, even if all or parts of the actual wind turbines are imported.
In general, the specific energy costs per kWh generated decrease with increasing size of turbine so smaller turbines are relatively expensive per kW of installed capacity. Micro-wind turbines may be as small as 50 W and generate only about 300 kWh/yr. The electricity is usually stored in batteries so it can be used for small refrigeration units, electric fence charging, lighting, and other low power uses. Small turbines in locations at low wind speeds (4 m/s-5 m/s) could generate up to 1,500 kWh/yr and save around 0.75 t CO2-eq if displacing diesel generation. Small turbines of 20 kW and 9m rotor diameter can produce about 20 MWh per year for use on farms, and small agri-food businesses.
2.5.4. SOLAR PHOTOVOLTAICS
Solar radiation can be converted to electricity using photovoltaic panels consisting of solar cells, commonly made of layers of silicone that produce direct current electricity. Where necessary, this can be transformed into alternating current using inverters for use by commercial electric appliances that usually operate on grid electricity.
ENER
GY
AN
D T
HE
FOO
D V
ALU
E C
HA
IN
OPPORTUNITIES FOR AGRI-FOOD CHAINS TO BECOME ENERGY-SMART 75
PV systems are modular and range from residential systems of 0.25 kWp -10 kWp24 output, up to utility scale industrial PV plants of over 1000 MWp capacity25. A PV system of 1 kWp nominal capacity will take up a roof or ground area of around 6m2 and generate around 1 kWh of electricity in one hour or longer depending on the cloud cover. Conversion efficiencies of solar irradiation to electricity vary from 12%-14% for commercial poly-crystalline PV panels, 14%-16% for monocrystalline, and 8%-10% for thin films. Typically the higher the efficiency, the greater the cost/kWp.
Tracking systems continually orientate the panels towards the sun to absorb the most radiation and increase generation by up to 30% compared with fixed panels. Typically, tracking is favored where investment capital is available, the feed-in-tariff (FIT) is high, and/or solar radiation yields are plentiful to provide a short return on the additional investment (Mehrtash et al., 2102).
2.5.5. SMALL AND MINI-HYDRO POWER
Where suitable, streams and rivers are close to electricity demand, they can be used to generate electricity by diverting some of the water through turbine propellers that power generators. They range from 1 kW26 to thousands of MW27. The technology is mature and many examples exist for use on-farm or in the agri-food processing chain. The choice of site is determined by proximity to the load or to the local electricity distribution network. Since generation is 24 hours a day, dumping of surplus electricity at times of low demand is necessary, unless the water flowing through the plant can be controlled in some way.
Design of a small- mini- or micro-hydro system should take into account the water supply fluctuations during dry periods, impacts on the ecosystem from extracting water, and risk of damage during periods of flooding.
A recent study reviewed about 20 mini-grids with micro-hydro technologies. After returning 20 years later to the sites, those with the original aim of using local electricity generation for agricultural development had a clear positive impact and had survived, whereas the others were abandoned as soon as a national grid connection became available (Practical Action, 2015).
24. kWp refers to peak kW output when the sun is directly overhead and shining brightly. Electricity can be generated even on cloudy days but the power output can be much lower than peak.25. A plant under construction in Pakistan is aiming for over 1000MWp capacity http://www.qasolar.com/26. See for example: http://www.ecoinnovation.co.nz/default.aspx27. Full details of the technologies and developments can be found on the IEA Hydro web site, http://www.ieahydro.org/
ENER
GY
AN
D T
HE
FOO
D V
ALU
E C
HA
IN
OPPORTUNITIES FOR AGRI-FOOD CHAINS TO BECOME ENERGY-SMART76
2.5.6. CURRENT USE OF RENEWABLE ENERGY IN THE AGRI-FOOD CHAIN
Renewable energy is already widely used throughout the agri-food sector, either directly to provide energy supplies on-site or indirectly as a result of being integrated into the existing conventional energy supply system (Sims et al., 2011). Renewable energy sources tend to be widely dispersed throughout rural areas. So their availability has the potential to provide a reliable and affordable energy supply that can become an essential component for sustainable development.
Reducing the dependence of the agri-food system on fossil fuels using renewable energy is feasible for on-farm activities such as milking, cooling, vegetable grading, aquaculture production, food processing, packaging, transporting raw food and animal feedstocks, distributing finished food products, and cooking. In rural areas in developing countries and emerging economies, renewable energy being generated for such productive uses presents the opportunity to also provide much needed basic energy services.
The land area required for renewable energy projects is usually relatively small, with the exception of biomass energy crops (Case Study 2.17). Wind farms typically use ~5% of total land area; large solar PV arrays can use several hectares but smaller systems are more commonly located on building rooftops; and small hydro run-of-river projects usually need only a small area of land for the turbine house. Bardi (2004) calculated that the land needed to displace global fossil fuel use with solar and wind energy technologies would use around 1.5% of the ~50 million km2 land area currently used for agriculture and this would have “minimal impact on food and textile agricultural production”. This compares with around one-third of the land needed to feed the draught animals where they are used for cultivation etc.
CASE STUDY 2.17. ENERGY CROPS FOR TRANSPORT BIOFUELSEnergy crops are being purpose-grown in some countries to provide biomass for conversion to liquid transport biofuels (such as corn, sugarcane, and oilseed rape) but also for cogeneration of heat and power. Competition for land and water resources between food and biofuels is an ongoing concern, and new varieties are being developed specifically for commercial use to improve yields and reduce energy and water consumption. However, market analysis of 15 case studies in 12 countries in Latin America, Africa and Asia (FAO, 2009) confirmed that bioenergy from small-scale, on-farm projects can be used to produce heat, power, and biofuels for local use, contribute to rural livelihoods, reduce imported fossil fuel dependence, and offer new opportunities for rural communities without impacting on local food supply security. Examples include electricity generation from jatropha oil-fueled engines; charcoal briquette production; afforestation; ethanol production for cook-stove fuel; wood-fired dryers; biogas from sisal fiber production residues.

ENER
GY
AN
D T
HE
FOO
D V
ALU
E C
HA
IN
OPPORTUNITIES FOR AGRI-FOOD CHAINS TO BECOME ENERGY-SMART 77
Food processing plants often utilize biomass by-products for heat and power generation. The heat and electricity generated is usually used on-site. In some instances excess electricity is produced which can be sold and exported to the electricity grid as an additional revenue earner for the company. For example, sugar mills commonly use their bagasse residues (the ligno-cellulosic material left after the sugar has been extracted from the cane) for CHP co-generation on-site (Case Study 2.18).
Wet processing wastes, such as tomato rejects, skins, and juice process pulp wastes are commonly used as feedstocks in anaerobic digestion plants for biogas production. The biogas can be used to generate heat and/or power for use on-site or, after cleaning it to biomethane before injecting it into the gas grid or compressing it as a vehicle fuel (NSCA, 2006). Constraints to exporting electricity or biomethane injection include whether the existing grid passes near the farm or processing plant to avoid high connection costs for grid extension. The seasonal nature of some food processing plant operations has an impact on energy provision and so will require specific contractual arrangements to be made where the gas, heat or electricity is sold.
Large-scale, centralized renewable energy systems such as large hydro dams (which currently generate around 20% of global electricity (IEA, 2014), concentrating solar power (CSP) installations, and large geothermal plants are usually not integrated into agri-food systems so they are not evaluated here. However, businesses involved in the manufacture of fertilizers, agricultural machinery etc. have the opportunity to purchase “green energy” sourced from low carbon sources in order to reduce their dependence on fossil fuels. They can also improve the energy efficiency of their manufacturing process and hence reduce the embedded energy in their products.
Given the importance of adequate energy in the post-harvest stages to avoid food deterioration and loss, particularly in developing countries, attention has been given to the possibility to use renewable energy beyond the farm gate in those countries.28 Solar energy has been successfully used for both drying food and cold storage, and so has biomass for heat (for example, using fuelwood to dry spices in Sri Lanka). This innovation
28. See for example, GIZ, 2011
CASE STUDY 2.18. SUSTAINABLE BIOMASS FOR POWER IN AFRICAWith careful management, biomass can be produced sustainably, not compete with food for land use or water, and avoid increasing both direct and indirect GHG emissions. A project “Cogen for Africa,” funded by the Global Environment Facility, aimed to assist African countries implement efficient bioenergy CHP systems. The potential is high with Mauritius already obtaining close to 40% of its total electricity supply from CHP systems.
Source: Karekezi and Kithyoma, 2006

ENER
GY
AN
D T
HE
FOO
D V
ALU
E C
HA
IN
OPPORTUNITIES FOR AGRI-FOOD CHAINS TO BECOME ENERGY-SMART78
has diversified income streams and increased revenue to a range of local actors operating within the spice production market chain. Small scale growers are now also able to sell mature spices where they can be dried and preserved on-site (FAO, 2009).
2.5.7. MITIGATION AND CLIMATE CHANGE IMPACTS
The mitigation potential from displacing fossil fuels with renewable energy to provide heating, cooling, electricity, and transport fuels is huge. There is usually a small carbon footprint from manufacturing, delivering and installing a technology such as a wind turbine, bioenergy plant, or PV panel, but the carbon payback period is usually in the order of months rather than years.
For biomass, this is more complex and requires land use change aspects to be incorporated into an evaluation. Details of the sustainable production of biomass, and the various views, can be found in an overview report (STAP, 2015).
As well as GHG mitigation potential, various other co-benefits resulting from renewable energy project deployment can be considered. These should be drivers for supporting policies being implemented by local, regional, state, and national governments. These co-benefits include realizing improvements in air pollution, health, energy access, energy security, water use, capacity building, and employment opportunities. They are well documented throughout the IPCC 5th Assessment Report-Mitigation (IPCC, 2015b).
It is well documented that climate change will most likely have an impact on future food production, so the agri-food sector will need to adapt. Investments aimed at improving agricultural adaptation will inevitably favor some crops and regions over others. South Asia and Southern Africa are the regions that, without sufficient adaptation measures being put in place, will likely suffer greater adverse impacts on several of the staple crops that their populations depend upon for food security (Lobell et al., 2008).
In addition, climate change will likely have impacts on the technical potential of renewable energy resources and their geographic distribution (IPCC, 2011b). For example: increased cloud cover could reduce solar radiation levels but probably not significantly overall; the technical potential of a small hydropower plant could increase in some locations due to changes in precipitation but more frequent floods may be a greater risk, with substantial variations across regions and countries; increased changes in the regional distribution of wind energy resources are expected; energy crop productivity could be affected by changes in precipitation, soil conditions, and atmospheric CO2 concentration levels, probably with a small overall global impact but with considerable regional differences that will be difficult to assess.
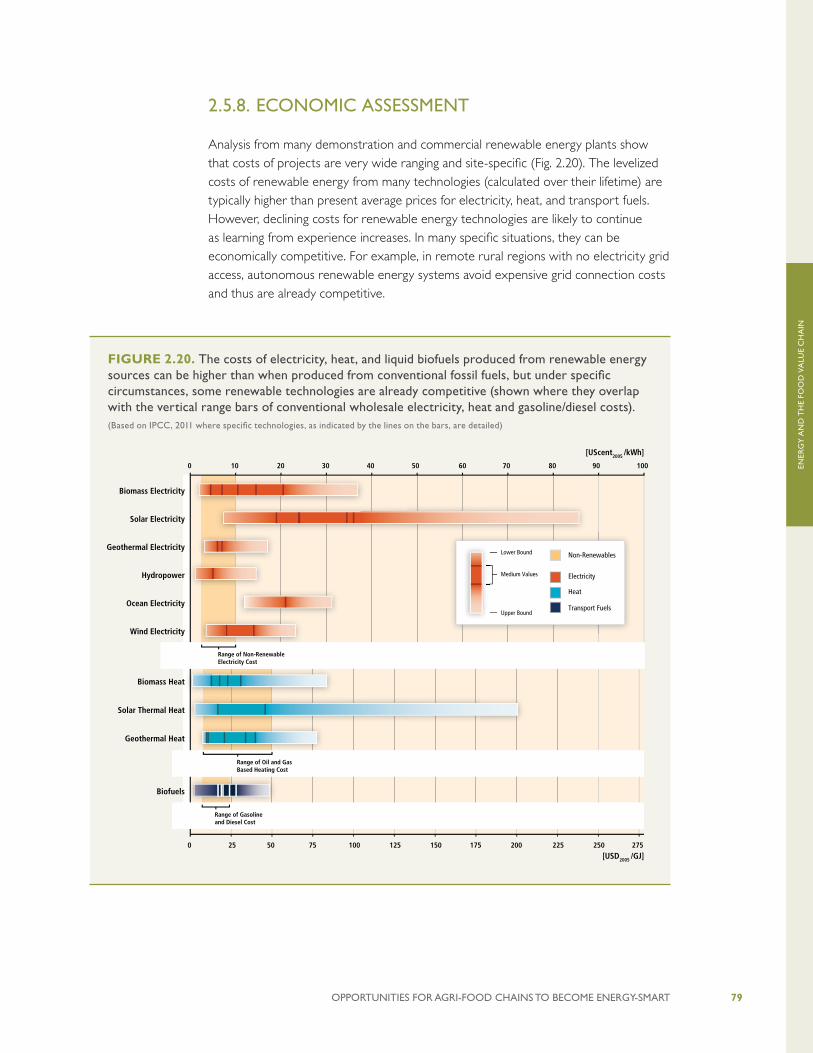
ENER
GY
AN
D T
HE
FOO
D V
ALU
E C
HA
IN
OPPORTUNITIES FOR AGRI-FOOD CHAINS TO BECOME ENERGY-SMART 79
2.5.8. ECONOMIC ASSESSMENT
Analysis from many demonstration and commercial renewable energy plants show that costs of projects are very wide ranging and site-specific (Fig. 2.20). The levelized costs of renewable energy from many technologies (calculated over their lifetime) are typically higher than present average prices for electricity, heat, and transport fuels. However, declining costs for renewable energy technologies are likely to continue as learning from experience increases. In many specific situations, they can be economically competitive. For example, in remote rural regions with no electricity grid access, autonomous renewable energy systems avoid expensive grid connection costs and thus are already competitive.
FIGURE 2.20. The costs of electricity, heat, and liquid biofuels produced from renewable energy sources can be higher than when produced from conventional fossil fuels, but under specific circumstances, some renewable technologies are already competitive (shown where they overlap with the vertical range bars of conventional wholesale electricity, heat and gasoline/diesel costs).(Based on IPCC, 2011 where specific technologies, as indicated by the lines on the bars, are detailed)
14
Summary for Policymakers Summaries
Figure SPM.5 | Range in recent levelized cost of energy for selected commercially available RE technologies in comparison to recent non-renewable energy costs. Technology sub-categories and discount rates were aggregated for this fi gure. For related fi gures with less or no such aggregation, see [1.3.2, 10.5, Annex III].
Range of Oil and Gas Based Heating Cost
Range of Non-Renewable Electricity Cost
Range of Gasoline and Diesel Cost
[UScent2005 /kWh]
0 10 20 30 40 50 60 70 80 90 100
[USD2005 /GJ]
Biofuels
Geothermal Heat
Solar Thermal Heat
Biomass Heat
Wind Electricity
Ocean Electricity
Hydropower
Geothermal Electricity
Solar Electricity
Biomass Electricity
27525022520017515012510075500 25
Non-Renewables
Heat
Transport Fuels
Electricity
Lower Bound
Upper Bound
Medium Values
Biofuels:1. Corn ethanol2. Soy biodiesel3. Wheat ethanol4. Sugarcane ethanol
5. Palm oil biodiesel
Biomass Heat:1. Municipal solid waste based CHP2. Anaerobic digestion based CHP3. Steam turbine CHP4. Domestic pellet heating system
Solar Thermal Heat:1. Domestic hot water systems in China2. Water and space heating
Geothermal Heat:1. Greenhouses2. Uncovered aquaculture ponds3. District heating4. Geothermal heat pumps5. Geothermal building heating
Biomass:1. Cofiring2. Small scale combined heat and power, CHP (Gasification internal combustion engine)3. Direct dedicated stoker & CHP4. Small scale CHP (steam turbine)5. Small scale CHP (organic Rankine cycle)
Solar Electricity:1. Concentrating solar power2. Utility-scale PV (1-axis and fixed tilt) 3. Commercial rooftop PV4. Residential rooftop PV
Geothermal Electricity:1. Condensing flash plant2. Binary cycle plant
Hydropower:1. All types
Ocean Electricity:1. Tidal barrage
Wind Electricity:1. Onshore2. Offshore
Transport FuelsHeatElectricity
Notes: Medium values are shown for the following subcategories, sorted in the order as they appear in the respective ranges (from left to right):
The lower range of the levelized cost of energy for each RE technology is based on a combination of the most favourable input-values, whereas the upper range is based on a combination of the least favourable input values. Reference ranges in the figure background for non-renewable electricity options are indicative of the levelized cost of centralized non-renewable electricity generation. Reference ranges for heat are indicative of recent costs for oil and gas based heat supply options. Reference ranges for transport fuels are based on recent crude oil spot prices of USD 40 to 130/barrel and corresponding diesel and gasoline costs, excluding taxes.
ENER
GY
AN
D T
HE
FOO
D V
ALU
E C
HA
IN
OPPORTUNITIES FOR AGRI-FOOD CHAINS TO BECOME ENERGY-SMART80
For biomass, the costs of delivering supplies to an agri-food conversion plant (in terms of USD/GJ delivered) can be significant but vary widely depending on scale, average transport distance, and type of biomass (IPCC, 2011b). In food processing plants where biomass is already collected on-site as part of the main food production process (such as kernels and bunches from palm oil production), costs when used for energy purposes can be relatively low (~0 USD/GJ to 2 USD/GJ) or even negative where waste disposal costs are avoided, such as for rice husks. For use on-farm, collection and storage of animal wastes and crop residues (such as baling and carting of cereal straw) add to the delivered biomass costs (~2 USD/GJ to 4 USD/GJ). Purpose grown energy crops have relatively high delivered costs since production, harvesting, transport, and storage costs all need to be included (~ 5 USD/GJ to 10 USD/GJ or higher).
For biogas power plants, the feed-in tariffs paid for electricity that cannot be used on-farm or by the food processing plant can be crucial for economic operation, unless there is a cost avoided from not having to dispose of the organic waste feedstock, or as a result there are more reliable electricity supply systems than the national grid can provide in many rural areas. Feasibility studies have shown that biogas plants can be operated more economically if there is also a profitable use for the heat, but in most cases the local heat demand is insufficient.
In Europe, wind energy costs were estimated at around 60 USD/MWh in 2012 and were around 10% higher than coal- or gas-fired plants. Installed costs for small wind turbines intended for battery charging with a turbine diameter of between 0.5m and 5m and a power output of 0.5 kW to 2 kW vary from 4 USD/W to 10 USD/W.
Total investment costs for a PV system, include planning consents, solar panels, an inverter and/or a controller, mounting, cables, connectors, and installation labor costs. The return on the investment depends on whether it is grid connected or autonomous and is influenced by the market penetration of PV in the given area.
The share of global wind generating capacity accounted for by Africa, Asia, and Latin America reached over 20% as of 2012 mainly due to growth in India and China. This confirms that wind energy can be economically feasible in developing countries and emerging economies where the potential remains unexploited. .However, many are now increasing their use of renewable energy (REN21, 2014) and are formulating specific expansion targets for a ‘green energy mix’. It is only in recent years that appreciable development of the market potential for wind power has taken place in these economies, further contributing to lower generation costs and greater access to modern energy.
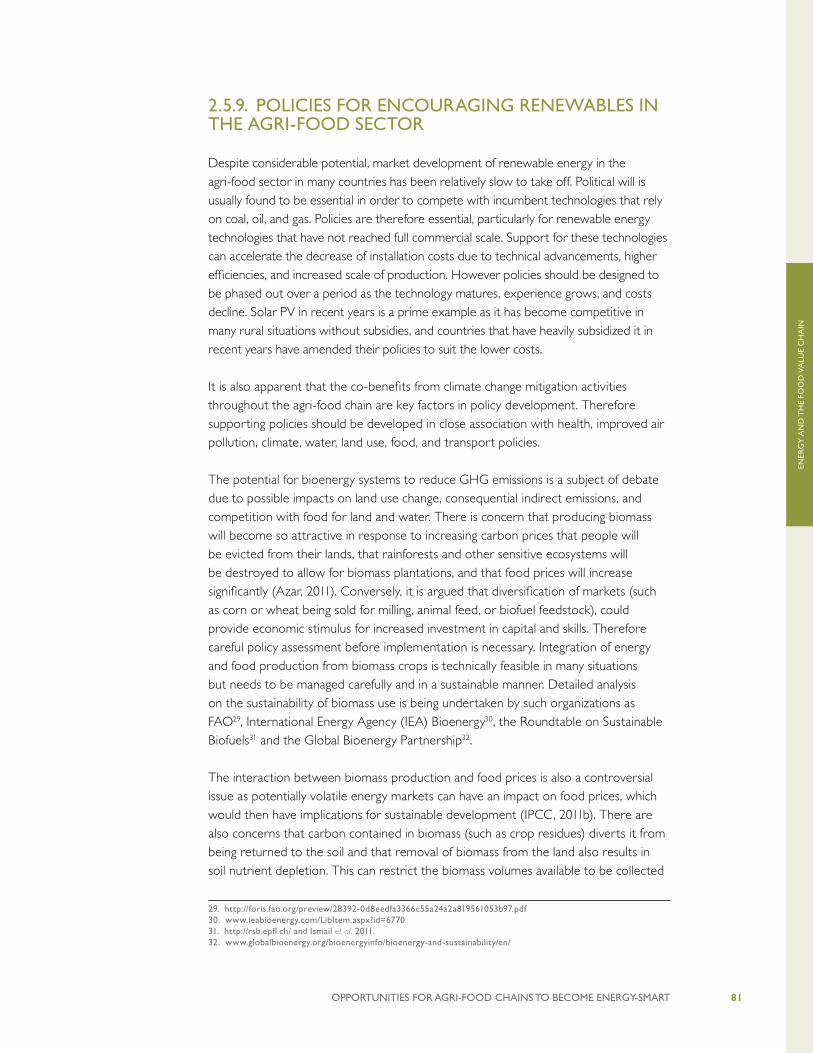
ENER
GY
AN
D T
HE
FOO
D V
ALU
E C
HA
IN
OPPORTUNITIES FOR AGRI-FOOD CHAINS TO BECOME ENERGY-SMART 81
2.5.9. POLICIES FOR ENCOURAGING RENEWABLES IN THE AGRI-FOOD SECTOR
Despite considerable potential, market development of renewable energy in the agri-food sector in many countries has been relatively slow to take off. Political will is usually found to be essential in order to compete with incumbent technologies that rely on coal, oil, and gas. Policies are therefore essential, particularly for renewable energy technologies that have not reached full commercial scale. Support for these technologies can accelerate the decrease of installation costs due to technical advancements, higher efficiencies, and increased scale of production. However policies should be designed to be phased out over a period as the technology matures, experience grows, and costs decline. Solar PV in recent years is a prime example as it has become competitive in many rural situations without subsidies, and countries that have heavily subsidized it in recent years have amended their policies to suit the lower costs.
It is also apparent that the co-benefits from climate change mitigation activities throughout the agri-food chain are key factors in policy development. Therefore supporting policies should be developed in close association with health, improved air pollution, climate, water, land use, food, and transport policies.
The potential for bioenergy systems to reduce GHG emissions is a subject of debate due to possible impacts on land use change, consequential indirect emissions, and competition with food for land and water. There is concern that producing biomass will become so attractive in response to increasing carbon prices that people will be evicted from their lands, that rainforests and other sensitive ecosystems will be destroyed to allow for biomass plantations, and that food prices will increase significantly (Azar, 2011). Conversely, it is argued that diversification of markets (such as corn or wheat being sold for milling, animal feed, or biofuel feedstock), could provide economic stimulus for increased investment in capital and skills. Therefore careful policy assessment before implementation is necessary. Integration of energy and food production from biomass crops is technically feasible in many situations but needs to be managed carefully and in a sustainable manner. Detailed analysis on the sustainability of biomass use is being undertaken by such organizations as FAO29, International Energy Agency (IEA) Bioenergy30, the Roundtable on Sustainable Biofuels31 and the Global Bioenergy Partnership32.
The interaction between biomass production and food prices is also a controversial issue as potentially volatile energy markets can have an impact on food prices, which would then have implications for sustainable development (IPCC, 2011b). There are also concerns that carbon contained in biomass (such as crop residues) diverts it from being returned to the soil and that removal of biomass from the land also results in soil nutrient depletion. This can restrict the biomass volumes available to be collected
29. http://foris.fao.org/preview/28392-0d8eedfa3366c55a24a2a819561053b97.pdf30. www.ieabioenergy.com/LibItem.aspx?id=677031. http://rsb.epfl.ch/ and Ismail et al, 2011.32. www.globalbioenergy.org/bioenergyinfo/bioenergy-and-sustainability/en/

ENER
GY
AN
D T
HE
FOO
D V
ALU
E C
HA
IN
OPPORTUNITIES FOR AGRI-FOOD CHAINS TO BECOME ENERGY-SMART82
from a given site, particularly where conservation agriculture and organic farming systems avoid the use of inorganic fertilizers.
Agro-forestry biomass linked with food production can have benefits (such as the mitigation of saline soils in Australia). Energy crop management can also help ensure soil fertility is maintained and in some cases enhanced for future food production.
Even with high electricity prices in many countries, and despite the recent decrease in the PV retail price, the return on PV investment usually exceeds 10 years without subsidies. The spread of PV technology has been influenced by policy tools which were meant to pay back the externalities of conventional energy substituted to those who generated electricity from renewable sources. In the success stories of PV application the mechanism of funding/implementation was conducted through a high feed-in-tariff, or specific support scheme offering investment co-financing or tax benefits to PV producers33. Electricity prices over 0.12 USD/kWh, or an FIT to reach a similar unit price create an enabling environment for private investors to install PV systems. Without that support, systems could still be installed for reasons of energy supply security.
In countries where PV or wind represent less than 1% to 2% of the total electricity mix, policy tools are used to enhance the systems and make them economically viable. This can be either an FIT, where generating electricity from renewable sources is supported with a contractual fixed electricity purchase price, higher than the grid electricity price. For example, Germany, Czech Republic, Slovakia etc. offer a FIT higher than 0.36 USD/kWh to boost PV installations, or investment costs are reduced with grant schemes.
There is a shortage of qualified personnel to establish the foundations for the exploitation of renewable energy and to develop projects. Therefore policies that support education and training are valuable. The absence of reliable data on renewable energy potential in a country, combined with unattractive energy policy framework conditions, could deter international investors, who would instead focus their attention on the expanding markets in developed countries.
A wide range of policies are available to support market penetration of renewable energy and most are well proven (REN21, 2014) (Table 2.6).
33. http://www.pvpolicy.org
ENER
GY
AN
D T
HE
FOO
D V
ALU
E C
HA
IN
OPPORTUNITIES FOR AGRI-FOOD CHAINS TO BECOME ENERGY-SMART 83
Full details of policies for renewable energy and the current status of each country can be found in REN21 (2014).34
34. Clarification; A standard consists of technical definitions and guidelines that function as instructions for designers/manufacturers and operators/users of equipment. Are considered voluntary because they are guidelines and not enforceable by law. A code is a standard that has been adopted by one or more governmental bodies and is enforceable by law.
TABLE 2.6. Possible policy choices and measures to encourage the deployment of renewable energy within a country or region.
Setting Targets Regulations
Fiscal Measures and Other Incentives Guidance
Leading by Example
Overall Target
Sector Specific Target
Codes O
f Practice34
Mandates
Tax Impositions
Health and Safety
Capital G
rants and Rebates
Operating G
rants
Investment in the Private Sector
Soft Loans and Guarantees
Tax Credits and/or C
arbon Pricing
Tax Reduction/Exem
ption
Standards –National/International
Education/Promotion
Specialist Training
Technology Transfer
Dem
onstration by Governm
ents
Procurement by G
overnments
Support for Early Adopters
CASE STUDY 2.19. POWERING AG INNOVATION SMART GRID ON MAIN STREET: ELECTRICITY AND VALUE-ADDED PROCESSING FOR AGRICULTURAL GOODSEarthSpark has developed a solar-diesel hybrid micro-grid system that will increase access to affordable, reliable electricity for value-added agricultural processing. By providing technical guidance and facilitating access to financing for local partners, EarthSpark is assisting agribusinesses in upgrading to efficient electric mills so the processing of rice, sorghum, coffee, and corn can be modernized. The project first focuses on breadfruit crops that typically rot due to lack of processing. Converting the fruit to flour or chips extends the shelf life by months and significantly increases its value and marketability.
Source: https://poweringag.org/innovators/smart-grid-main-street-electricity-value-added-processing-agricultural-goods
ENER
GY
AN
D T
HE
FOO
D V
ALU
E C
HA
IN
OPPORTUNITIES FOR AGRI-FOOD CHAINS TO BECOME ENERGY-SMART84
CASE STUDY 2.20. POWERING AG INNOVATION MICRO-SOLAR UTILITIES FOR SMALL-SCALE IRRIGATIONEarth Institute’s solution will enable a small group of farmers to use a central solar energy unit to power multiple alternate current pumps for irrigation. The proposed solution takes advantage of the benefits of solar without the high costs associated with direct current powered pumps and battery storage. This power will be accessed by farmers with prepaid electricity cards issued by a micro-utility, and sold through local vendors who will benefit from a small commission. Recognizing that a major obstacle to technology adoption is financing, a tariff-based financing model will allow customers to cover their appliance loans in small payments added into their micro-utility bills.
Source: https://poweringag.org/innovators/micro-solar-utilities-small-scale-irrigation
CASE STUDY 2.21. POWERING AG INNOVATION BIOMASS-POWERED THERMAL PROCESSING OF BAMBOOAfrican Bamboo is developing an environmentally friendly bamboo thermal modification process called ThermoBoo. Through this chemical-free process, decay factors such as rot and insects are virtually eliminated, and the thermally-modified bamboo fiber can be further processed into sturdy panels that can be marketed to a range of domestic and international buyers. The ThermoBoo process involves the combustion of biomass dust—a technological approach that is completely new to Ethiopia. Through the project’s successful implementation of a pilot processing facility, African Bamboo envisions developing a replicable model that can lead to prospective business opportunities throughout the region.
Source: https://poweringag.org/innovators/biomass-powered-thermal-processing-bamboo
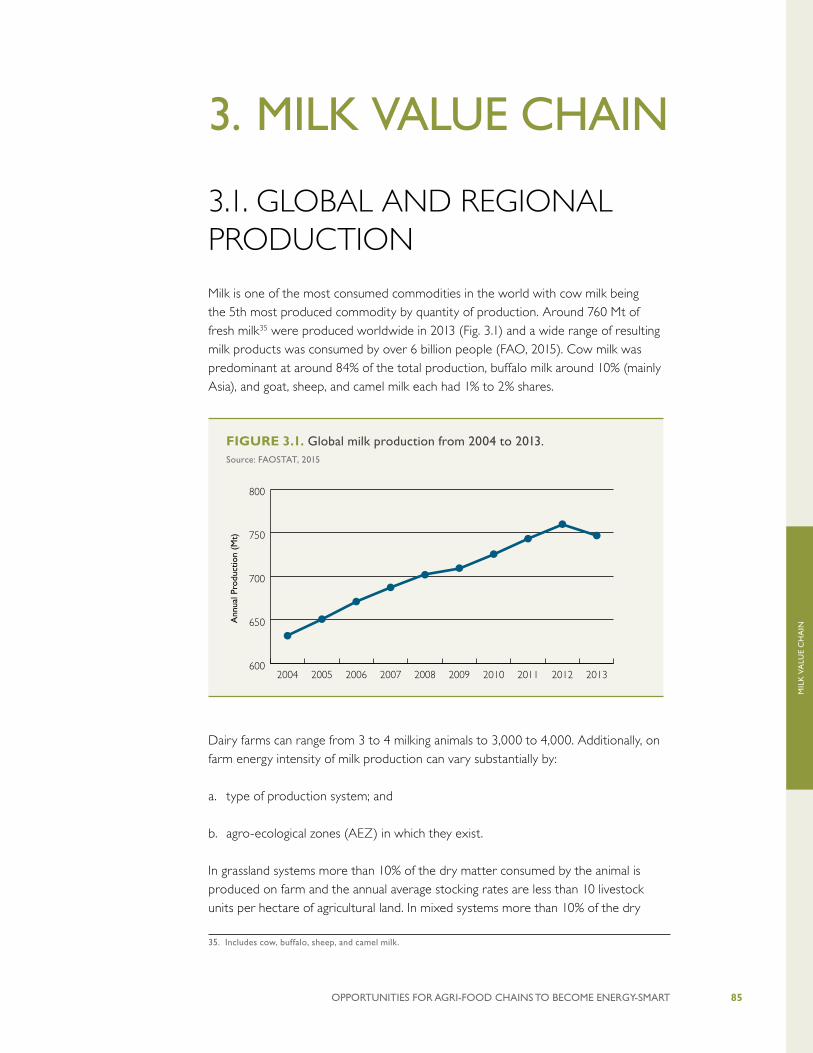
OPPORTUNITIES FOR AGRI-FOOD CHAINS TO BECOME ENERGY-SMART 85
MIL
K V
ALU
E C
HA
IN
3. MILK VALUE CHAIN
3.1. GLOBAL AND REGIONAL PRODUCTION
Milk is one of the most consumed commodities in the world with cow milk being the 5th most produced commodity by quantity of production. Around 760 Mt of fresh milk35 were produced worldwide in 2013 (Fig. 3.1) and a wide range of resulting milk products was consumed by over 6 billion people (FAO, 2015). Cow milk was predominant at around 84% of the total production, buffalo milk around 10% (mainly Asia), and goat, sheep, and camel milk each had 1% to 2% shares.
Dairy farms can range from 3 to 4 milking animals to 3,000 to 4,000. Additionally, on farm energy intensity of milk production can vary substantially by:
a. type of production system; and
b. agro-ecological zones (AEZ) in which they exist.
In grassland systems more than 10% of the dry matter consumed by the animal is produced on farm and the annual average stocking rates are less than 10 livestock units per hectare of agricultural land. In mixed systems more than 10% of the dry
35. Includes cow, buffalo, sheep, and camel milk.
FIGURE 3.1. Global milk production from 2004 to 2013.Source: FAOSTAT, 2015
600
650
700
750
800
2013201220112010200920082007200620052004
Ann
ual P
rodu
ctio
n (M
t)
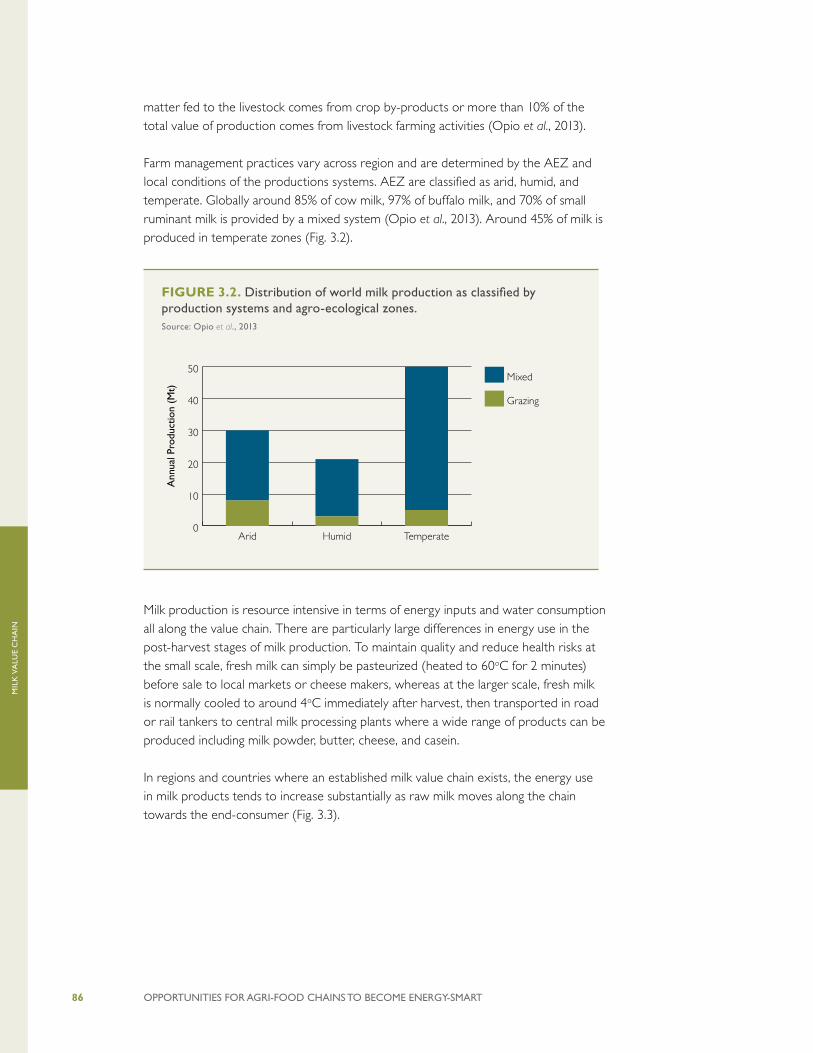
OPPORTUNITIES FOR AGRI-FOOD CHAINS TO BECOME ENERGY-SMART86
MIL
K V
ALU
E C
HA
IN
matter fed to the livestock comes from crop by-products or more than 10% of the total value of production comes from livestock farming activities (Opio et al., 2013).
Farm management practices vary across region and are determined by the AEZ and local conditions of the productions systems. AEZ are classified as arid, humid, and temperate. Globally around 85% of cow milk, 97% of buffalo milk, and 70% of small ruminant milk is provided by a mixed system (Opio et al., 2013). Around 45% of milk is produced in temperate zones (Fig. 3.2).
Milk production is resource intensive in terms of energy inputs and water consumption all along the value chain. There are particularly large differences in energy use in the post-harvest stages of milk production. To maintain quality and reduce health risks at the small scale, fresh milk can simply be pasteurized (heated to 60oC for 2 minutes) before sale to local markets or cheese makers, whereas at the larger scale, fresh milk is normally cooled to around 4oC immediately after harvest, then transported in road or rail tankers to central milk processing plants where a wide range of products can be produced including milk powder, butter, cheese, and casein.
In regions and countries where an established milk value chain exists, the energy use in milk products tends to increase substantially as raw milk moves along the chain towards the end-consumer (Fig. 3.3).
FIGURE 3.2. Distribution of world milk production as classified by production systems and agro-ecological zones.Source: Opio et al., 2013
0
10
20
30
40
50Mixed
Grazing
TemperateHumidArid
Ann
ual P
rodu
ctio
n (M
t)
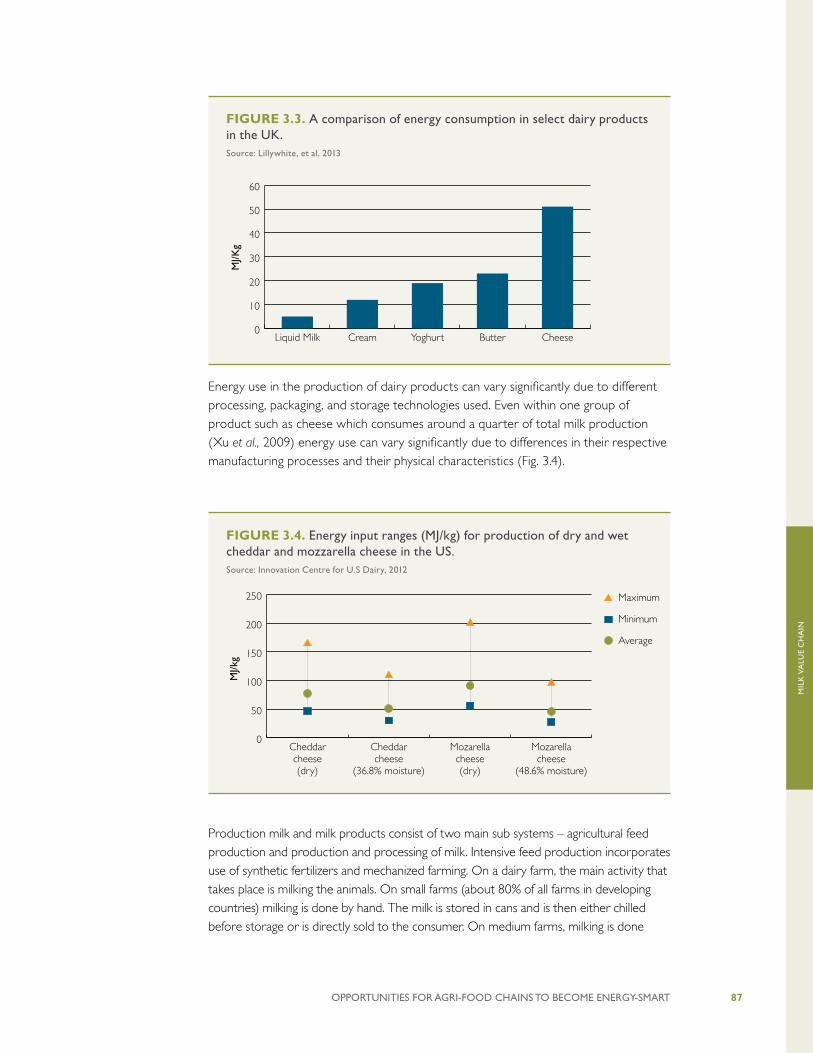
OPPORTUNITIES FOR AGRI-FOOD CHAINS TO BECOME ENERGY-SMART 87
MIL
K V
ALU
E C
HA
IN
Energy use in the production of dairy products can vary significantly due to different processing, packaging, and storage technologies used. Even within one group of product such as cheese which consumes around a quarter of total milk production (Xu et al., 2009) energy use can vary significantly due to differences in their respective manufacturing processes and their physical characteristics (Fig. 3.4).
Production milk and milk products consist of two main sub systems – agricultural feed production and production and processing of milk. Intensive feed production incorporates use of synthetic fertilizers and mechanized farming. On a dairy farm, the main activity that takes place is milking the animals. On small farms (about 80% of all farms in developing countries) milking is done by hand. The milk is stored in cans and is then either chilled before storage or is directly sold to the consumer. On medium farms, milking is done
FIGURE 3.3. A comparison of energy consumption in select dairy products in the UK.Source: Lillywhite, et al, 2013
0
10
20
30
40
50
60
CheeseButterYoghurtCreamLiquid Milk
MJ/K
g
FIGURE 3.4. Energy input ranges (MJ/kg) for production of dry and wet cheddar and mozzarella cheese in the US.Source: Innovation Centre for U.S Dairy, 2012
0
50
100
150
200
250 Maximum
Minimum
Average
Mozarellacheese
(48.6% moisture)
Mozarellacheese(dry)
Cheddarcheese
(36.8% moisture)
Cheddarcheese(dry)
MJ/k
g

OPPORTUNITIES FOR AGRI-FOOD CHAINS TO BECOME ENERGY-SMART88
MIL
K V
ALU
E C
HA
IN
FIGURE 3.5. Milk products value chain.
by machines consisting of a vacuum pump and a vacuum vessel which serves as a milk collecting pail, teat cups connected by hoses to the vacuum vessel, and a pulsator which alternately applies vacuum and atmospheric pressure to the teat cups. Milk is then transferred from the tin pail cans and then transported to the milk factory. On large dairy farms the milk directly enters a pipeline which transfers it to a refrigerated storage tank. It is later transferred to refrigerated trucks for further processing.
Due to these variations a global estimate of energy use in dairy production would misrepresent reality. Nevertheless, based on a general milk-product value chain, (Fig. 3.5) it is useful to explore hotspots where fossil fuel inputs per unit of milk production could possibly be decreased either through increasing resource use efficiencies, using renewable energy, or both. Activities within the processing and packaging stages of the value chain can significantly change depending on the final product (such as packaged milk, cheese, milk powder etc.). This can influence energy demand.
Asia is currently the largest producer of milk followed by Europe and America (Fig. 3.6) with India the highest milk producing country (Fig. 3.7). Differences in AEZ influence regional milk production. Around 50% of cow milk is produced in temperate zones where managing and breeding the cattle is easier, while 69% of sheep and goat, and 84% of buffalo milk is produced in arid zones (Opio et al., 2013).
Sheep and goats adapt well to harsh conditions and are better converters of low quality feed to milk than cows, which require high quality feed. Buffalo milk production is mainly concentrated in south Asia where India and Pakistan produced around 96% of total global production in 2013 (FAO, 2015).
TRANSPORTAION
Embedded Energy in Inputs
• Feed
• Fertilizers
• Seeds
• Machinery
• Building material
On Farm Energy Use
• Milking
• Storage
• Fule for mechanization
Energy Use in Processing and Packaging
• Processing of raw milk to cheese, powder, cream, whey, etc.
• Bottling and packaging
Retail and Final Consumption
• Refrigeration
• Storing and Cooking

OPPORTUNITIES FOR AGRI-FOOD CHAINS TO BECOME ENERGY-SMART 89
MIL
K V
ALU
E C
HA
IN
Fossil fuel is extensively used in the production of animal feed, particularly diesel for tractors and harvesting machinery and natural gas for the production of fertilizers. In most industrialized regions, animal feed is produced in intensive cropping systems with high rates of fertilizer application and high energy use. A high proportion of feed consists of concentrates, forage crops, imported hay, and silage. Although there is a dearth of data on energy use in feed production, CO2-eq emissions from diesel and natural gas combustion used to produce and transport feed and to blend concentrated feed vary with production, processing, and transport distance (Fig. 3.5). At the feed production stage, the energy use is larger in industrialized countries where feed production and processing is intensive and more mechanized compared with developing countries where milk production tends to be centered on open grazing systems.
FIGURE 3.7. Top 10 milk producing countries based on average annual milk production between 2004 and 2013.Source: FAOSTAT, 2015
FIGURE 3.6. Milk production from 2004 to 2013 by region.Source: FAOSTAT, 2015
0
500
100
150
200
250
300Asia
Europe
Americas
Africa
Oceania
2013201220112010200920082007200620052004
Mt
0
20
40
60
80
100
120
UnitedKingdom
NewZealand
FranceBrazilGermanyPakistanRussianFederation
ChinaUnitedStates
of America
India
Mt
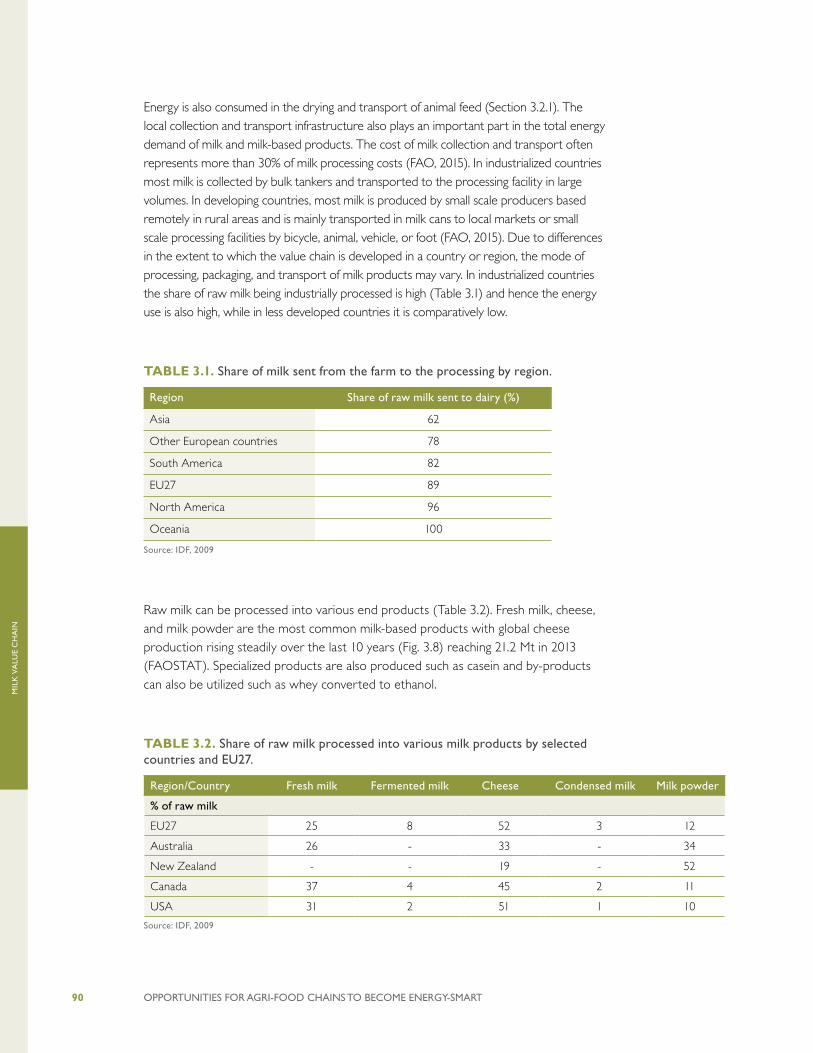
OPPORTUNITIES FOR AGRI-FOOD CHAINS TO BECOME ENERGY-SMART90
MIL
K V
ALU
E C
HA
IN
Energy is also consumed in the drying and transport of animal feed (Section 3.2.1). The local collection and transport infrastructure also plays an important part in the total energy demand of milk and milk-based products. The cost of milk collection and transport often represents more than 30% of milk processing costs (FAO, 2015). In industrialized countries most milk is collected by bulk tankers and transported to the processing facility in large volumes. In developing countries, most milk is produced by small scale producers based remotely in rural areas and is mainly transported in milk cans to local markets or small scale processing facilities by bicycle, animal, vehicle, or foot (FAO, 2015). Due to differences in the extent to which the value chain is developed in a country or region, the mode of processing, packaging, and transport of milk products may vary. In industrialized countries the share of raw milk being industrially processed is high (Table 3.1) and hence the energy use is also high, while in less developed countries it is comparatively low.
TABLE 3.1. Share of milk sent from the farm to the processing by region.
Region Share of raw milk sent to dairy (%)
Asia 62
Other European countries 78
South America 82
EU27 89
North America 96
Oceania 100
Source: IDF, 2009
Raw milk can be processed into various end products (Table 3.2). Fresh milk, cheese, and milk powder are the most common milk-based products with global cheese production rising steadily over the last 10 years (Fig. 3.8) reaching 21.2 Mt in 2013 (FAOSTAT). Specialized products are also produced such as casein and by-products can also be utilized such as whey converted to ethanol.
TABLE 3.2. Share of raw milk processed into various milk products by selected countries and EU27.
Region/Country Fresh milk Fermented milk Cheese Condensed milk Milk powder
% of raw milk
EU27 25 8 52 3 12
Australia 26 - 33 - 34
New Zealand - - 19 - 52
Canada 37 4 45 2 11
USA 31 2 51 1 10
Source: IDF, 2009
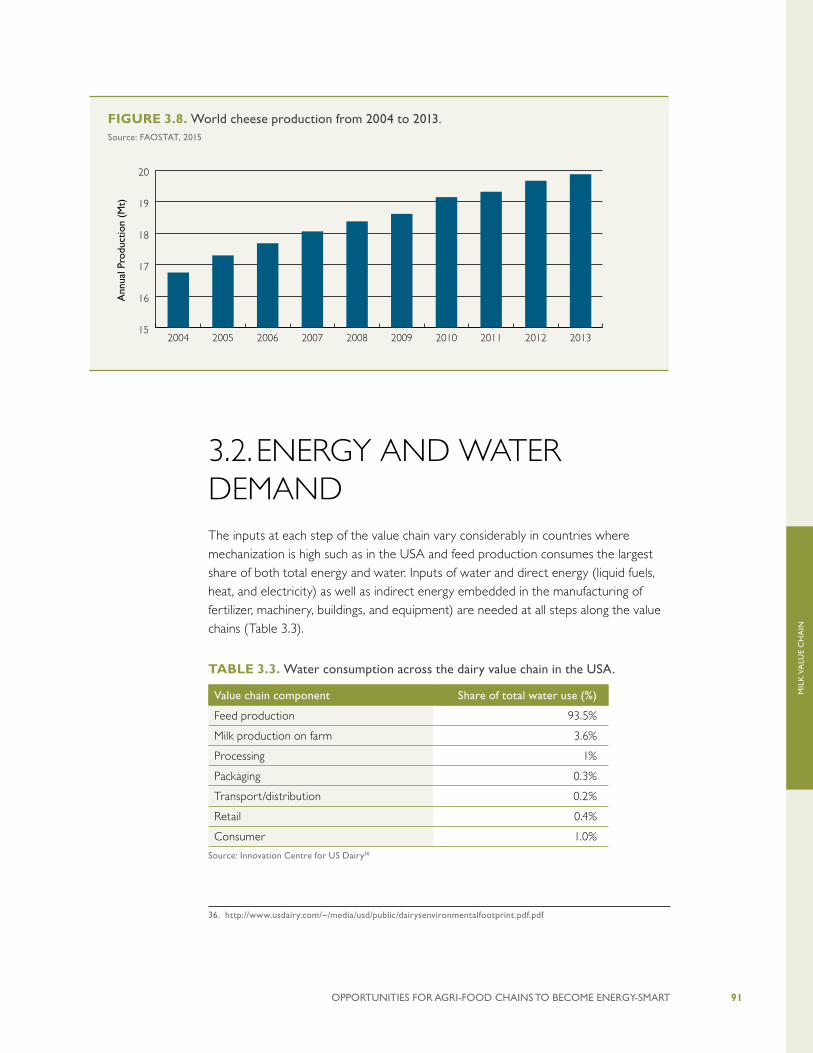
OPPORTUNITIES FOR AGRI-FOOD CHAINS TO BECOME ENERGY-SMART 91
MIL
K V
ALU
E C
HA
IN
FIGURE 3.8. World cheese production from 2004 to 2013.Source: FAOSTAT, 2015
TABLE 3.3. Water consumption across the dairy value chain in the USA.
Value chain component Share of total water use (%)
Feed production 93.5%
Milk production on farm 3.6%
Processing 1%
Packaging 0.3%
Transport/distribution 0.2%
Retail 0.4%
Consumer 1.0%
Source: Innovation Centre for US Dairy36
36. http://www.usdairy.com/~/media/usd/public/dairysenvironmentalfootprint.pdf.pdf
3.2. ENERGY AND WATER DEMANDThe inputs at each step of the value chain vary considerably in countries where mechanization is high such as in the USA and feed production consumes the largest share of both total energy and water. Inputs of water and direct energy (liquid fuels, heat, and electricity) as well as indirect energy embedded in the manufacturing of fertilizer, machinery, buildings, and equipment) are needed at all steps along the value chains (Table 3.3).
15
16
17
18
19
20
2013201220112010200920082007200620052004
Ann
ual P
rodu
ctio
n (M
t)
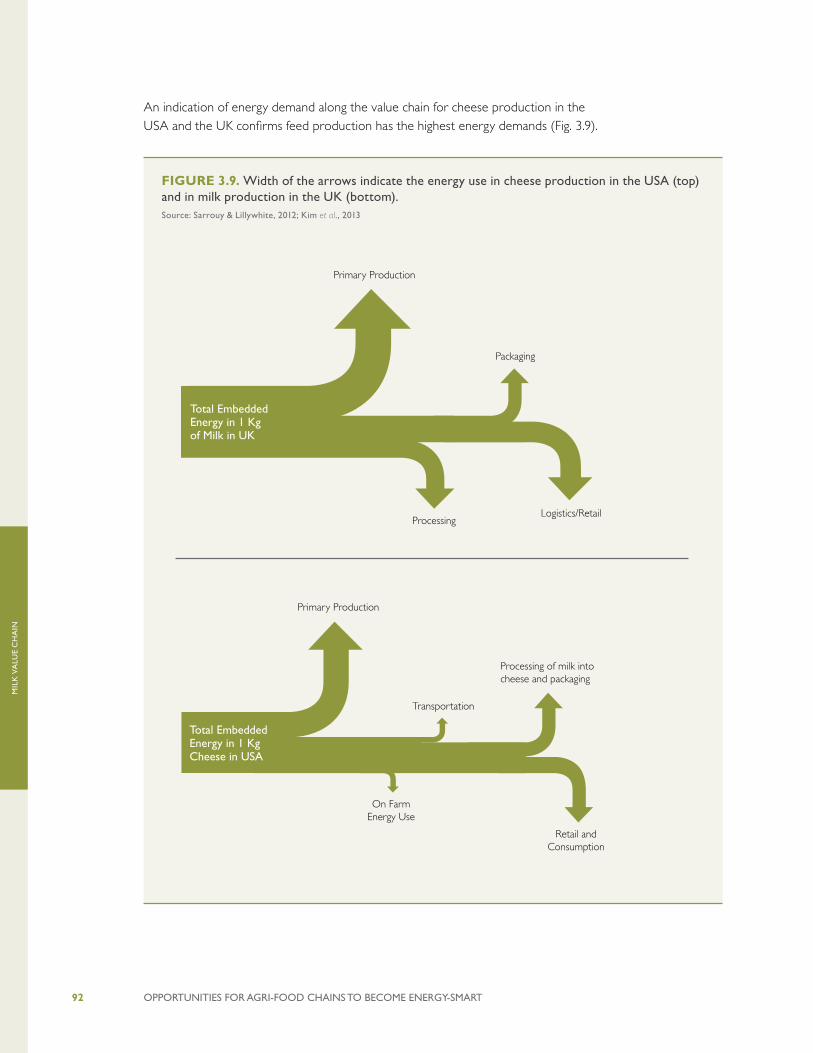
OPPORTUNITIES FOR AGRI-FOOD CHAINS TO BECOME ENERGY-SMART92
MIL
K V
ALU
E C
HA
IN
FIGURE 3.9. Width of the arrows indicate the energy use in cheese production in the USA (top) and in milk production in the UK (bottom).Source: Sarrouy & Lillywhite, 2012; Kim et al., 2013
An indication of energy demand along the value chain for cheese production in the USA and the UK confirms feed production has the highest energy demands (Fig. 3.9).
Primary Production
Packaging
Logistics/RetailProcessing
Total Embedded Energy in 1 Kg of Milk in UK
Primary Production
Transportation
Processing of milk into cheese and packaging
Retail andConsumption
On FarmEnergy Use
Total Embedded Energy in 1 Kg Cheese in USA
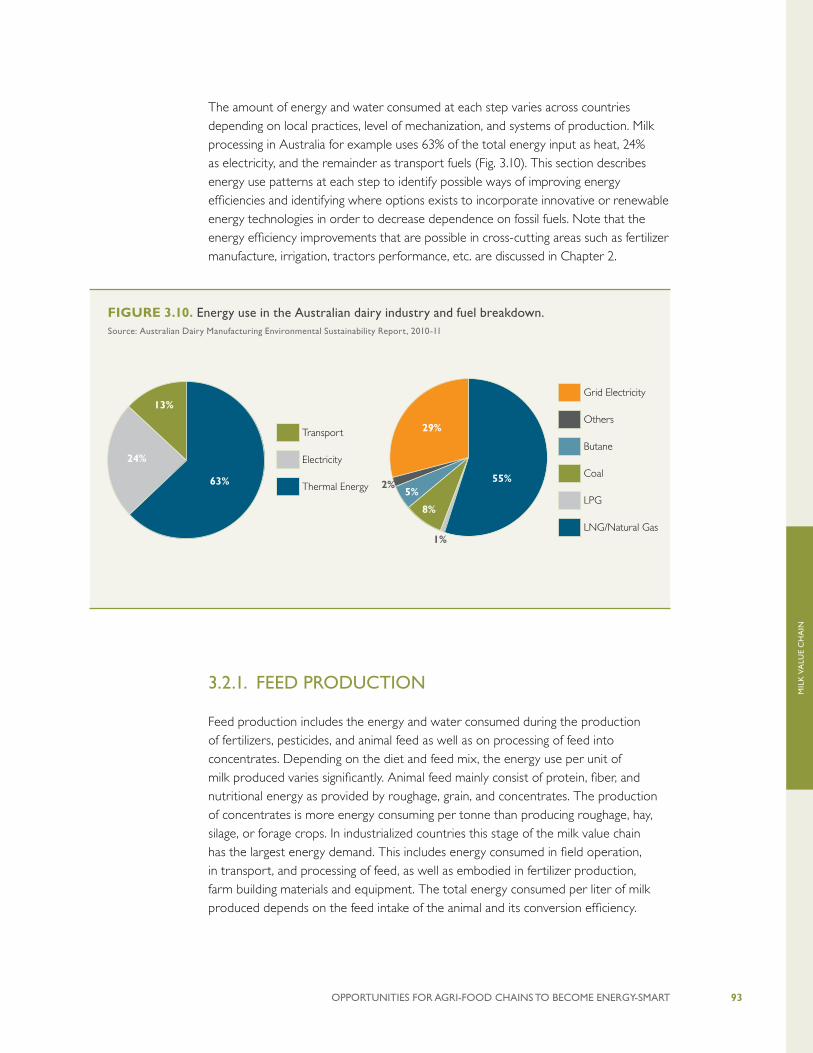
OPPORTUNITIES FOR AGRI-FOOD CHAINS TO BECOME ENERGY-SMART 93
MIL
K V
ALU
E C
HA
IN
FIGURE 3.10. Energy use in the Australian dairy industry and fuel breakdown. Source: Australian Dairy Manufacturing Environmental Sustainability Report, 2010-11
The amount of energy and water consumed at each step varies across countries depending on local practices, level of mechanization, and systems of production. Milk processing in Australia for example uses 63% of the total energy input as heat, 24% as electricity, and the remainder as transport fuels (Fig. 3.10). This section describes energy use patterns at each step to identify possible ways of improving energy efficiencies and identifying where options exists to incorporate innovative or renewable energy technologies in order to decrease dependence on fossil fuels. Note that the energy efficiency improvements that are possible in cross-cutting areas such as fertilizer manufacture, irrigation, tractors performance, etc. are discussed in Chapter 2.
3.2.1. FEED PRODUCTION
Feed production includes the energy and water consumed during the production of fertilizers, pesticides, and animal feed as well as on processing of feed into concentrates. Depending on the diet and feed mix, the energy use per unit of milk produced varies significantly. Animal feed mainly consist of protein, fiber, and nutritional energy as provided by roughage, grain, and concentrates. The production of concentrates is more energy consuming per tonne than producing roughage, hay, silage, or forage crops. In industrialized countries this stage of the milk value chain has the largest energy demand. This includes energy consumed in field operation, in transport, and processing of feed, as well as embodied in fertilizer production, farm building materials and equipment. The total energy consumed per liter of milk produced depends on the feed intake of the animal and its conversion efficiency.
Transport
Electricity
Thermal Energy
13%
63%
24%
Grid Electricity
Others
Butane
Coal
LPG
LNG/Natural Gas
29%
55%
8%
5%
1%
2%

OPPORTUNITIES FOR AGRI-FOOD CHAINS TO BECOME ENERGY-SMART94
MIL
K V
ALU
E C
HA
IN
Concentrates and grains are energy intensive to produce and are more prevalent in industrialized regions, whereas grazing and the use of crop residues is more prevalent in less intensive farming systems which reduces the energy demand per animal. For example the average feed ration of dairy cattle in industrialized regions contains between 16% and 38% concentrate and by-products while in developing regions, roughage is the main ingredient of cattle feed which can be as high as 97% in sub-Saharan Africa (Table 3.4). Energy is also consumed in the drying and transport of animal feed. In less developed regions, reliance on natural pastures for feed tends to be higher (Opio et al., 2013) with minimal fertilizer application making it less energy and water intensive (Fig. 3.11).37
In relatively poor regions of the world, roughage is more readily available and requires minimal processing, making it cheap to procure and less energy intensive. However, while using roughage is less energy intensive it is also less nutritious for the cattle resulting in lower milk yields for similar volume of feed intake.
37. LAC-Latin America and Caribbean; NENA- Near East and North Africa; SSA-Sub Saharan Africa
FIGURE 3.11. Fossil fuel related CO2 intensity of animal feed as produced in selected regions.Source: Opio et al., 2013
kg C
O2 -
eq/k
g dr
y m
atte
r in
take
Concentrate blendingTransport and processing
0. 00
0. 05
0. 10
0. 15
0. 20
0. 25
0. 30
0. 35
N. A
mer
ica
LAC
W. E
urop
e
E. Eu
rope
Russ
ian F
ed.
NEN
A
SSA
Sout
h A
sia
E &
SE A
sia
Oce
ania
Source: GLEAM.
Mechanization: feed productionFertilizer application

OPPORTUNITIES FOR AGRI-FOOD CHAINS TO BECOME ENERGY-SMART 95
MIL
K V
ALU
E C
HA
IN
TABLE 3.4. Regional averages of dairy cattle feed mix as % shares of the total dry matter intake per animal per year broken down into “Roughage” and “By-products and concentrates”.
North America
RussiaWestern Europe
NENA*East and
South East Asia
OceaniaSouth Asia
Sub Saharan Africa
%
Roughage
Fresh grass 14.4 23.8 33.2 41.1 22.4 68.3 10.7 56.8
Hay 17.0 23.8 16.6 17.8 19.2 5.6 14.2 18.1
Legumes and silage
30.6 34.3 22.6 0.3 2.7 10.4 - -
Crop residues - 1.8 2.5 31.7 38.4 - 60.1 17.0
Sugarcane tops - - - 1.6 0.6 - 3.5 1.9
Leaves - - - 3.6 2.3 - 6.1 3
By products and concentrates
Bran 4.4 2.9 2.0 0.6 0.5 2.5 0.2 0.1
Oilseed meals 6.4 4.6 8.5 2.3 6.7 1.3 5.2 3.1
Wet distillers grain 4.3
Grains 22.8 7.2 13.2 0.2 7.2 11.8 - 0.1
Molasses - - 0.1 0.5 - - - 0.1
Pulp - 1.8 1.3 - - - - -
Total 100 100 100 100 100 100 100 100
FIGURE 3.12. Feed composition shares (%) between roughage and by-product and concentrates for dairy cattle by region. Source: Opio et al., 2013
0
20
40
60
80
100
By products and concentratesRoughage
Sub SaharanAfrica
SouthAsia
OceaniaEast andSouth East Asia
Near Eastand North
Africa
WesternEurope
RussiaNorthAmerica
%
Source: Opio et al., 2013
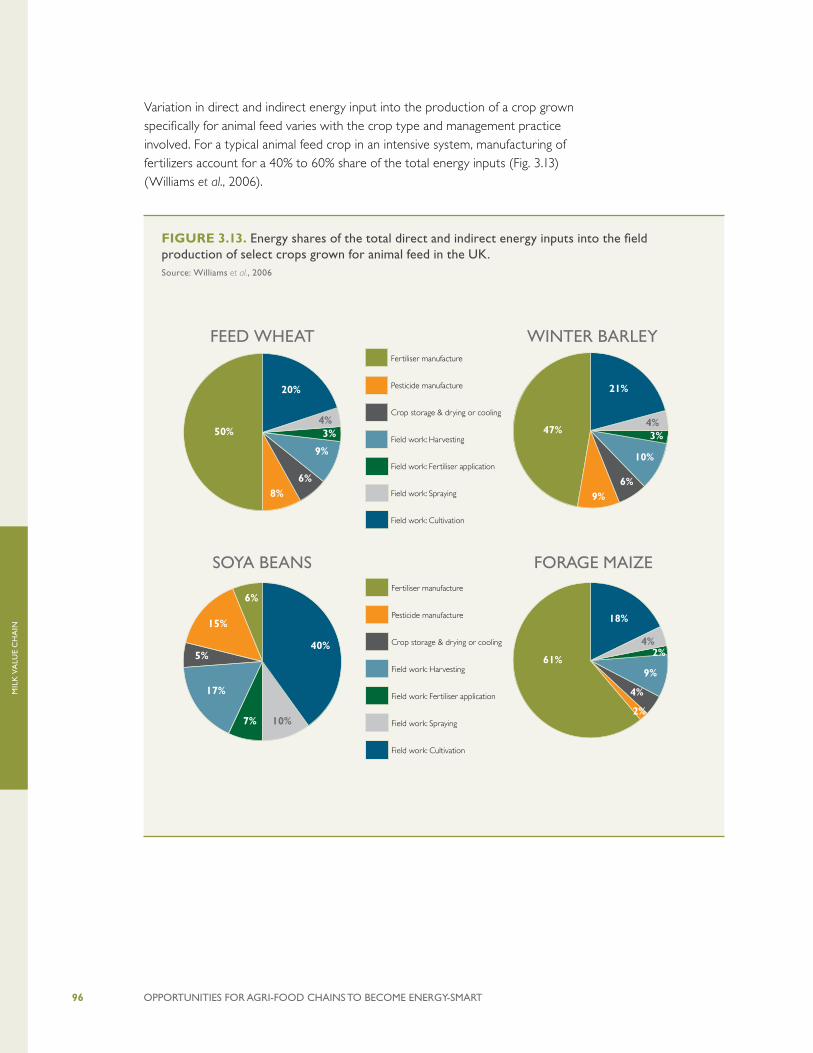
OPPORTUNITIES FOR AGRI-FOOD CHAINS TO BECOME ENERGY-SMART96
MIL
K V
ALU
E C
HA
IN
FIGURE 3.13. Energy shares of the total direct and indirect energy inputs into the field production of select crops grown for animal feed in the UK. Source: Williams et al., 2006
Variation in direct and indirect energy input into the production of a crop grown specifically for animal feed varies with the crop type and management practice involved. For a typical animal feed crop in an intensive system, manufacturing of fertilizers account for a 40% to 60% share of the total energy inputs (Fig. 3.13) (Williams et al., 2006).
Fertiliser manufacture
Pesticide manufacture
Crop storage & drying or cooling
Field work: Harvesting
Field work: Fertiliser application
Field work: Spraying
Field work: Cultivation
20%
50%
8%6%
9%
4%3%
Fertiliser manufacture
Pesticide manufacture
Crop storage & drying or cooling
Field work: Harvesting
Field work: Fertiliser application
Field work: Spraying
Field work: Cultivation
21%
47%
9%6%
10%
4%3%
Fertiliser manufacture
Pesticide manufacture
Crop storage & drying or cooling
Field work: Harvesting
Field work: Fertiliser application
Field work: Spraying
Field work: Cultivation
40%
6%
15%
5%
17%
10%7%
Fertiliser manufacture
Pesticide manufacture
Crop storage & drying or cooling
Field work: Harvesting
Field work: Fertiliser application
Field work: Spraying
Field work: Cultivation
18%
61%
2%
4%
9%
4%2%
FEED WHEAT WINTER BARLEY
FORAGE MAIZESOYA BEANS

OPPORTUNITIES FOR AGRI-FOOD CHAINS TO BECOME ENERGY-SMART 97
MIL
K V
ALU
E C
HA
IN
3.2.2. DIRECT ENERGY CONSUMPTION
Typically 10% to 20% of the total energy in the dairy value chain is consumed on dairy farms (Table 3.5) (Gronroos et al., 2006).
TABLE 3.5. Primary energy use in average Finnish conventional and organic milk (GJ per 1000 L of milk) and percentage shares.
Conventional Milk Organic Milk Conventional Milk Organic Milk
Pre-farm total 3.48 0.93 49% 20%
Electricity38 0.11 0.06
Fuels; purchased fodder 0.22 0.15
Fuels; fertilisers 3.15 0.72
On-farm total 1.29 1.53 18% 32%
Electricity 0.85 0.84
Fuels 0.45 0.68
Post-farm total 1.99 1.99 28% 42%
Dairy processing - electricity 0.59 0.59
Dairy processing - fuels 0.4 0.4
Packaging - fuels and electricity 1 1
Transport fuels 0.28 0.31 4% 7%
Grand total 7.05 4.75 100% 100%
Source: Gronroos et al., 2006
For example, in cheese production in the US, 10% of total energy is consumed on-farm, 22% in processing and packaging, 6% in transport, 22% in retail and final consumption, and the remianing 40% as indirect embedded energy mainly in fertilizers and feed. In UK cheese production, slightly different shares are apparent with higher on-farm diesel energy shares possibly due to the use of more concentrated animal feeds (Table 3.6) (Kim et al., 2013).38
38 Includes pesticide production, oil-seed rape processing, feed mill, agricultural lime production, drying of grains (purchased fodder); in bread production: pesticide, package, yeast, salt and agricultural lime production
TABLE 3.6. Energy use (and % shares) across milk and cheese value chain in the UK (MJ/kg).
Pre farm and on-farm production
Processing Packaging Logistical/retail
Milk 3.3 (45%) 1.4 (19%) 0.5 (7%) 2.1 (29%)
Cheese 27.4 (57%) 13.9 (28%) 1.7 (3%) 5.9 (12%)
Source: Lillywhite et al., 2013
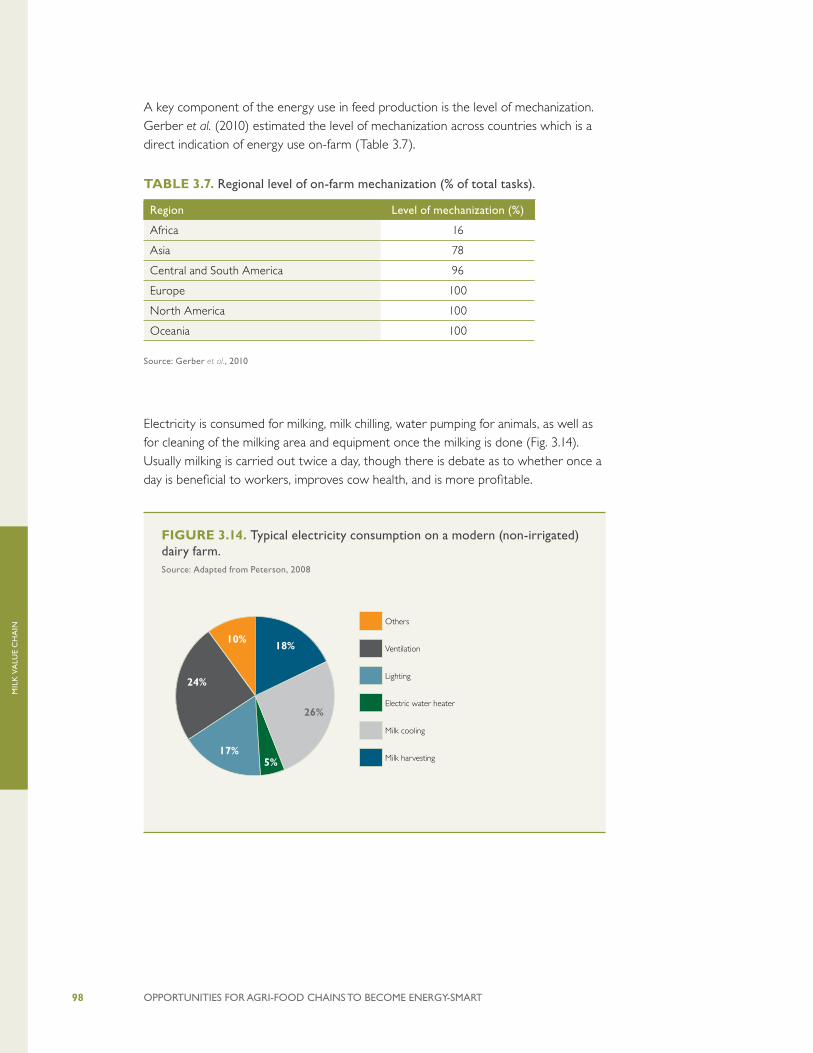
OPPORTUNITIES FOR AGRI-FOOD CHAINS TO BECOME ENERGY-SMART98
MIL
K V
ALU
E C
HA
IN
A key component of the energy use in feed production is the level of mechanization. Gerber et al. (2010) estimated the level of mechanization across countries which is a direct indication of energy use on-farm (Table 3.7).
TABLE 3.7. Regional level of on-farm mechanization (% of total tasks).
Region Level of mechanization (%)
Africa 16
Asia 78
Central and South America 96
Europe 100
North America 100
Oceania 100
Source: Gerber et al., 2010
Electricity is consumed for milking, milk chilling, water pumping for animals, as well as for cleaning of the milking area and equipment once the milking is done (Fig. 3.14). Usually milking is carried out twice a day, though there is debate as to whether once a day is beneficial to workers, improves cow health, and is more profitable.
FIGURE 3.14. Typical electricity consumption on a modern (non-irrigated) dairy farm.Source: Adapted from Peterson, 2008
Others
Ventilation
Lighting
Electric water heater
Milk cooling
Milk harvesting
18%10%
24%
17%
26%
5%
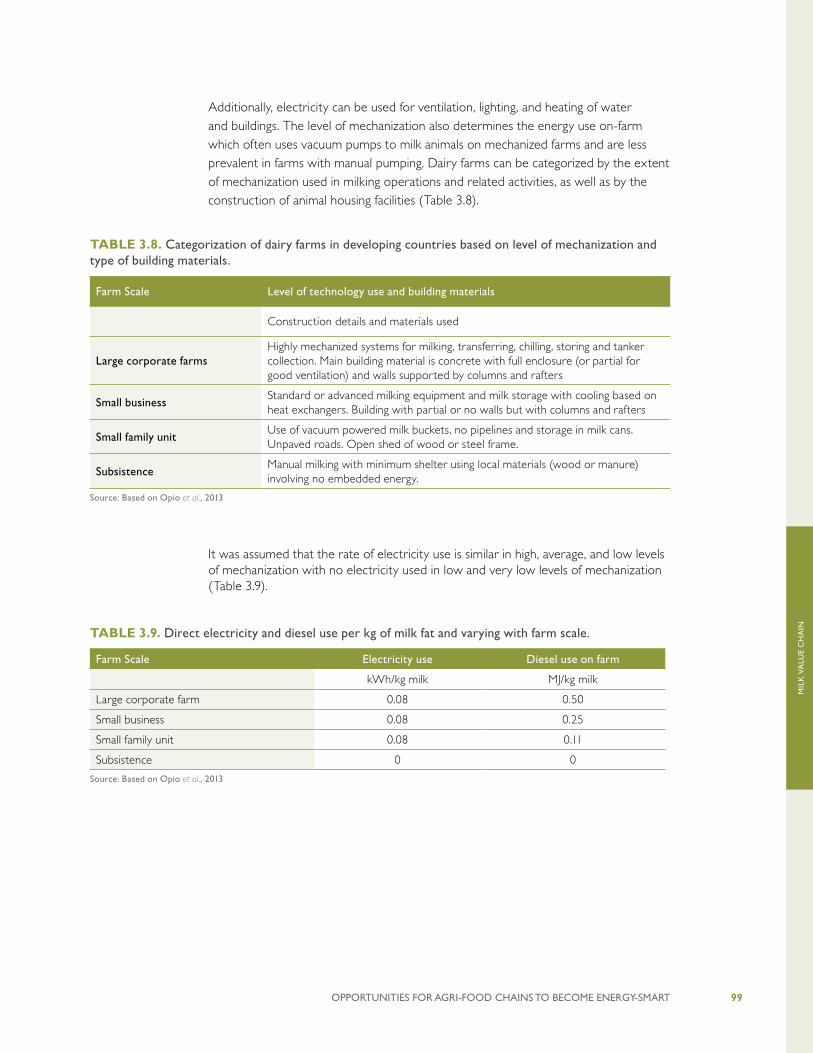
OPPORTUNITIES FOR AGRI-FOOD CHAINS TO BECOME ENERGY-SMART 99
MIL
K V
ALU
E C
HA
IN
Additionally, electricity can be used for ventilation, lighting, and heating of water and buildings. The level of mechanization also determines the energy use on-farm which often uses vacuum pumps to milk animals on mechanized farms and are less prevalent in farms with manual pumping. Dairy farms can be categorized by the extent of mechanization used in milking operations and related activities, as well as by the construction of animal housing facilities (Table 3.8).
TABLE 3.8. Categorization of dairy farms in developing countries based on level of mechanization and type of building materials.
Farm Scale Level of technology use and building materials
Construction details and materials used
Large corporate farmsHighly mechanized systems for milking, transferring, chilling, storing and tanker collection. Main building material is concrete with full enclosure (or partial for good ventilation) and walls supported by columns and rafters
Small businessStandard or advanced milking equipment and milk storage with cooling based on heat exchangers. Building with partial or no walls but with columns and rafters
Small family unitUse of vacuum powered milk buckets, no pipelines and storage in milk cans. Unpaved roads. Open shed of wood or steel frame.
SubsistenceManual milking with minimum shelter using local materials (wood or manure) involving no embedded energy.
Source: Based on Opio et al., 2013
It was assumed that the rate of electricity use is similar in high, average, and low levels of mechanization with no electricity used in low and very low levels of mechanization (Table 3.9).
TABLE 3.9. Direct electricity and diesel use per kg of milk fat and varying with farm scale.
Farm Scale Electricity use Diesel use on farm
kWh/kg milk MJ/kg milk
Large corporate farm 0.08 0.50
Small business 0.08 0.25
Small family unit 0.08 0.11
Subsistence 0 0
Source: Based on Opio et al., 2013

OPPORTUNITIES FOR AGRI-FOOD CHAINS TO BECOME ENERGY-SMART100
MIL
K V
ALU
E C
HA
IN
3.2.3. TRANSPORT
The energy consumed in transporting the raw milk from the farm to the processing plant is derived from petroleum fuels. The factors influencing the energy use are the distance over which the product is transported as well as the capacity and efficiency of the vehicle. Dairy products are highly perishable and hence refrigeration is also required while transporting where feasible, which increases the energy use. Gerber et al. (2010) reported the average energy consumed in transporting milk from farm to processing plant in Organisation for Economic Co-operation and Development (OECD) countries was 0.22 MJ/kg and the average energy use in transport of milk, cheese, and butter from dairy to retail points was 0.45 MJ/kg, 3.7 MJ/kg, and 1.67 MJ/kg respectively. Roads and other transport infrastructure also affect the energy use in transport. For instance, Cederberg et al., (2009) reported a 25% increase in diesel consumption in beef transport in Brazil due to bad road conditions.
3.2.4. MILK PROCESSING AND PACKAGING
The milk product value chain is similar for all milk products until the milk reaches the processing plant where milk is transformed into various products requiring heat and electricity. Raw milk solids contain fat, casein protein, whey protein, lactose, organic acids, and other components. Different milk products contain different concentrations of solids, so the processing of raw milk into milk products requires concentrating and separating of the solids (Lundie et al., 2007). It is estimated that the global cheese making industry processes approximately a quarter of total raw milk into various types of cheese.
Cheese production is the most energy intensive product of all since it requires extensive processing with energy input at each stage (Fig. 3.15). Once the raw milk is received, it is stored at temperatures ranging from 4oC to 7oC. Thereafter the fat and proteins in the milk are standardized which involves separation of solids by heating the milk to get the desired level of fat content. This is followed by pasteurization which again involves heating the milk to around 60oC before quickly cooling it. Pasteurization makes sure milk is safe to drink (by killing any bacteria) and helps to prolong its shelf life. The pasteurized milk is then treated with a starter at controlled temperature and pH levels resulting in the formulation of curd. The excess whey is drained off and the curd is pressed, shaped and aged which alters the taste of the cheese. At each step of the processing cleaning-in-place takes place which uses a substantial amount of water. Most energy is used as heat derived from electricity or natural gas.
A similar process to cheese making is followed by other milk products with variations in the energy inputs mainly for heating (Fig. 2.16). In liquid milk production, the largest energy consuming process is standardization (or homogenization) and pasteurization, cooling in butter production, evaporation and drying in milk powder production, while in cheese production, energy use is more or less evenly distributed.

OPPORTUNITIES FOR AGRI-FOOD CHAINS TO BECOME ENERGY-SMART 101
MIL
K V
ALU
E C
HA
IN
FIGURE 3.15. % share of total energy use in a milk processing operation in Netherlands. HVAC: Heating, ventilation and air conditioning; CIP: Cleaning-in-placeSource: Xu & Flapper, 2009
0
5
10
15
20
25
30
35
40
Othersbuilding/HVAC
WaterProvision
Cooling/refrigeration
CIPFilling/Packaging
Standard-ization/Pasteur-ization
StorageThermization
PackagingMilkTreatment
Milk reception Supporting Processes
%
FIGURE 3.16. Typical share of total energy demand for liquid milk, cheese, butter, and milk powder production in Netherlands. Source: Gerber et al., 2010; Ramirez, et al., 2006
0
10
20
30
40
50
60
70Pa
ckin
g
Dry
ing
Ther
mal
con
cent
ratio
n/ev
apor
atio
n
Ther
miz
atio
n/pa
steu
rizat
ion/
cent
rifug
atio
n
Cle
anin
g in
pla
ce
Pres
suriz
ed a
ir
Coo
ling
Cle
anin
g in
pla
ce
Pres
suriz
ed a
ir
Coo
ling
Che
ese
trea
tmen
t/st
orag
e
Che
ese
proc
essin
g
Rece
ptio
n, t
herm
izat
ion
Build
ing
(ligh
teni
ng,
spac
e he
atin
g)
Wat
er p
rovi
sion
Cle
anin
g in
pla
ce
Pres
suriz
ed a
ir
Coo
ling
Pack
ing
Cen
trifu
gatio
n/ho
mog
eniz
atio
n/pa
steu
rizat
ion
Stor
age
Rece
ptio
n, t
herm
izat
ion
Fluid milk Cheese Butter Milk powder
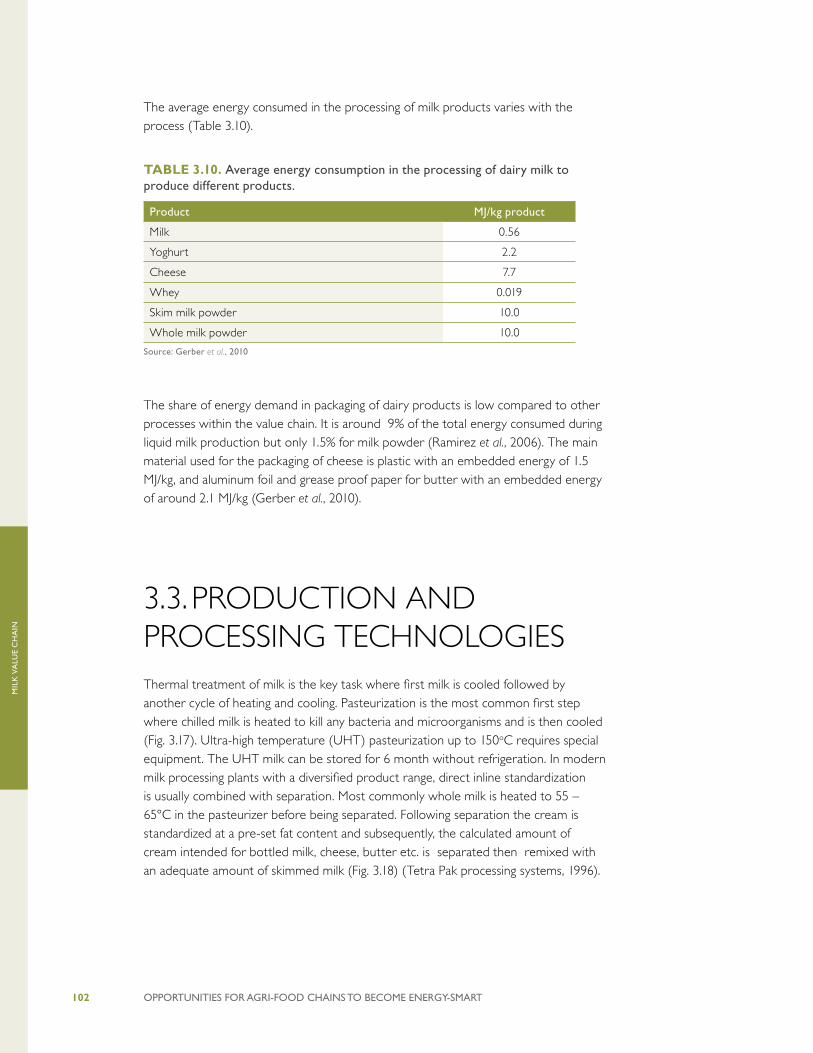
OPPORTUNITIES FOR AGRI-FOOD CHAINS TO BECOME ENERGY-SMART102
MIL
K V
ALU
E C
HA
IN
The average energy consumed in the processing of milk products varies with the process (Table 3.10).
TABLE 3.10. Average energy consumption in the processing of dairy milk to produce different products.
Product MJ/kg product
Milk 0.56
Yoghurt 2.2
Cheese 7.7
Whey 0.019
Skim milk powder 10.0
Whole milk powder 10.0
Source: Gerber et al., 2010
The share of energy demand in packaging of dairy products is low compared to other processes within the value chain. It is around 9% of the total energy consumed during liquid milk production but only 1.5% for milk powder (Ramirez et al., 2006). The main material used for the packaging of cheese is plastic with an embedded energy of 1.5 MJ/kg, and aluminum foil and grease proof paper for butter with an embedded energy of around 2.1 MJ/kg (Gerber et al., 2010).
3.3. PRODUCTION AND PROCESSING TECHNOLOGIESThermal treatment of milk is the key task where first milk is cooled followed by another cycle of heating and cooling. Pasteurization is the most common first step where chilled milk is heated to kill any bacteria and microorganisms and is then cooled (Fig. 3.17). Ultra-high temperature (UHT) pasteurization up to 150oC requires special equipment. The UHT milk can be stored for 6 month without refrigeration. In modern milk processing plants with a diversified product range, direct inline standardization is usually combined with separation. Most commonly whole milk is heated to 55 – 65°C in the pasteurizer before being separated. Following separation the cream is standardized at a pre-set fat content and subsequently, the calculated amount of cream intended for bottled milk, cheese, butter etc. is separated then remixed with an adequate amount of skimmed milk (Fig. 3.18) (Tetra Pak processing systems, 1996).

OPPORTUNITIES FOR AGRI-FOOD CHAINS TO BECOME ENERGY-SMART 103
MIL
K V
ALU
E C
HA
IN
FIGURE 3.17. Major processes of raw whole milk from the farm to produce a range of milk products. Source: Ramirez et al., 2006
FIGURE 3.18. Direct in line standardization of cream and milk. Source: Tetra Pak processing systems, 1996
milk with 4% fat. The requirement is to produce an optimal amount of 3%standardised milk and surplus cream containing 40% fat.
Separation of 100 kg of whole milk yields 90.35 kg of skimmilk with0.05% fat and 9.65 kg of cream with 40% fat.
The amount of 40% cream that must be added to the skimmilk is 7.2 kg.This gives altogether 97.55 kg of 3% market milk, leaving 9.65 – 7.2 = 2.45kg surplus 40% cream. The principle is illustrated in figure 6.2.32.
Direct in-line standardisationIn modern milk processing plants with a diversified product range, direct in-line standardisation is usually combined with separation. Previously thestandardisation was done manually, but, along with increased volumes toprocess the need for fast, constant and correct standardisation methods,independent of seasonable fluctuations of the raw milk fat content, hasincreased. Control valves, flow and density meters and a computerisedcontrol loop are used to adjust the fat content of milk and cream to desiredvalues. This equipment is usually assembled in units, figure 6.2.33.
The pressure in the skimmilk outlet must be kept constant in order toenable accurate standardisation. This pressure must be maintained regard-less of variations in flow or pressure drop caused by the equipment afterseparation, and this is done with a constant-pressure valve located close tothe skimmilk outlet.
For precision in the process it is necessary to measure variable parame-ters such as:• fluctuations in the fat content of the incoming milk,• fluctuations in throughput,• fluctuations in preheating temperature.
Most of the variables are interdependent; any deviation in one stage of
Tetra Alfast
4
1
3
2
5
Fig. 6.2.33 Direct in-line standardisa-tion systems are pre-assembled asprocess units.1 Density transmitter2 Flow transmitter3 Control valve4 Control panel5 Shut-off valve
SkimmilkStandardised milkCream
Whole milk
Skimmilk
Surplusstandardised cream
Standardisedmilk
Control ofcream fatcontent
Flowmeasurementof remix cream
Tetra Alfast
Flowmeasurement
Flowmeasurement
OPPORTUNITIES FOR AGRI-FOOD CHAINS TO BECOME ENERGY-SMART104
MIL
K V
ALU
E C
HA
IN
In the production of milk powder, evaporation is a key step although the products to be evaporated are normally heat sensitive and can be destroyed by adding heat. To reduce this heat impact, evaporation takes place under vacuum pressure, sometimes at temperatures as low as 40°C. The evaporator is usually designed for the shortest possible residence time so that most products can be concentrated with good results. Milk products intended for milk powder are normally concentrated from an initial solids content of 9% to 13% to a final concentration of 40% to 50% total solids before the product is pumped to the dryer.
3.4. SUMMARY OF KEY ENERGY INTERVENTIONS
From the above discussion, some hotspots with the milk value chain where interventions are needed to reduce energy and water use can be identified. The largest demand for energy is at the animal feed production stage where up to 40%39 of energy can be consumed mainly through fertilizer manufacture and application. Reducing chemical fertilizer use in organic milk production can contribute significantly to lowering the total energy use.
Chemical fertilizer can be replaced by using organic matter (crop residues, manure etc.) to provide nutrients. Gronroos et al. (2006) compared the energy use between organic and conventional milk production systems (Fig. 2.19) and reported that total energy inputs of 7.05 MJ/kg of conventional milk were reduced to 4.75 MJ/kg of organic milk, mainly due to the reduced use of chemical fertilizers. In conventional milk production system around 45% of the energy was spent on fertilizer production and application which was three times that of organic milk production system.
Milk processing consumes from 20% to 30% of the total energy use in the dairy value chain. Milk pasteurizing and chilling are key processes since they prevent production and nutrition losses. Improving energy use efficiency in machinery and controlling waste are practical solutions as well as employing renewable sources of energy to offset any direct fossil energy use. The key challenges are to find ways to produce thermal energy which are clean (for example solar energy), have minimal environmental and GHG impacts, increase efficiency in production, and transfer of thermal energy to minimize energy and product losses.
39. This is the estimation for intensive systems in industrialized countries. In developing countries it may be much lower due to dependence on open grazing and lack of concentrates in the feed mix.

OPPORTUNITIES FOR AGRI-FOOD CHAINS TO BECOME ENERGY-SMART 105
MIL
K V
ALU
E C
HA
IN
A number of options exist to increase the efficiency of the existing milking systems and generally of the dairy farms (Case Studies 3.1 and 3.2). These include the use of VSD, pre-coolers, heat recovery systems, and energy efficient lighting systems. On a farm, milk is harvested using vacuum pumps, is cooled, and then transferred to bulk tank for storage. Vacuum pumps run on electricity and traditionally always run at a fixed maximum speed. VSD is an electronic speed controller which varies the voltage supplied to the motor to optimize the vacuum demand thereby optimizing the electricity input to the motor. VSD with adequately sized vacuum pumps can result in up to 80% energy savings as compared to traditional oversized vacuum pumps.
FIGURE 3.19. Comparison of energy use in production of conventional and organic milk (GJ/1000 L milk).Source: Gronroos et al., 2006
0.0
0.5
1.0
1.5
2.0
2.5
3.0
3.5
Electricity
POST-FARM
GJ/1
000
L m
ilk
Fuels,Purchased fodder
Fuels,Fertilizer
Electricity Liquid fuels Electricity
ON-FARMPRE-FARM
Fuels
Conventional Milk Organic Milk
CASE STUDY 3.1. ENERGY USE IN MILK POWDER IN AUSTRALIAIn 2010, Tatura Milk Industries started using real time energy data to improve operational efficiency in their powder dryers. Around 20 monitoring meters were installed on one dryer to capture data on air and liquid flows, humidity, steam, and associated electricity consumption over an 18 month period. A program for step-by-step improvement in the dryer operation was developed. The analysis also revealed that highly experienced dryer operators already had different (and entrenched) ways of managing the dryer performance. A set of operating procedures produced and accepted by all of the individual operators as moving towards both consistent and optimum energy efficient performance. As a result, improvements were estimated to be more than 5%.
Source: Dairy Australia, 2011

OPPORTUNITIES FOR AGRI-FOOD CHAINS TO BECOME ENERGY-SMART106
MIL
K V
ALU
E C
HA
IN
Milk cooling consumes a large share of energy use on farm. To maintain the milk quality, raw milk is cooled to around 4oC. Pre-cooling is an energy conservation technology used to cool raw milk while it is being pumped to storage tanks. It uses an intermediate cooling fluid, usually cold water, which flows congruent or counter to the direction of milk flow. The heat from the milk is transferred to the cooling fluid by decreasing the temperature of milk by around 40oC and an energy saving of around 60% (Sanford, 2003). While refrigeration consumes electrical energy to cool milk, it also releases energy from the condenser in the form of heat. A refrigeration heat recovery unit (RHR) can be used to capture heat from the condenser to preheat water. A RHR can recover 20% to 60% of heat energy that is captured when cooling milk for storage (Sanford, 2003).
CASE STUDY 3.2. ENERGY USE IN REFRIGERATIONIndustrial refrigeration plants are an essential part of the dairy supply chain but are substantial users of energy. The amount of electricity consumed can often constitute the majority of electricity use at an individual dairy operation. Bega Cheese operates a number of refrigeration plants at its processing and packaging facilities in Bega, New South Wales. These facilities are mainly used to process milk, whey, and cheese products, as well as for storage and maturation of bulk and retail cheese products. Six energy saving opportunities were selected to save around 5.2 TJ of energy per year based on the business drivers of cost reduction, greenhouse gas abatement, improved plant reliability, and increased capacity. In addition a lighting project was developed to replace high bay lights with more energy efficient LEDs saving an additional 215 MWh of energy with the added advantage of reducing heat load together with further improving refrigeration GHG emissions by 230 t CO2-eq.
Source: Dairy Australia, 2011
Optimizing lighting systems to match demands, replacing traditional lamps with energy efficient fluorescent or LED lighting, and switching them off when not in use can lead to substantial energy savings. Where animals are housed in hot countries, ventilation is essential to maintain animal health and productivity. Ventilation allows constant inflow of fresh air and outflow of hot, moist air from the barn. Choosing high efficiency ventilation systems can reduce on farm electricity use. This includes selecting fan efficiency ratings that normally have a certified rating seal (for example from the Air Movement and Control Association International.40)
In addition to increasing energy efficiencies through the use of energy conservation technologies, renewable sources of energy can be used to produce heat and electricity to process and store milk. Utilizing solar energy for the production of heat is a promising technology which has been implemented in many cases (Case Study 3.3).
40. http://www.amca.org/
OPPORTUNITIES FOR AGRI-FOOD CHAINS TO BECOME ENERGY-SMART 107
MIL
K V
ALU
E C
HA
IN
Where available, geothermal energy can be utilized to produce heat and electricity which could be for heating and cooling milk (Kiruja, 2011), cheese making, or beer brewing (Case Study 3.4). Small solar photovoltaics and CSP systems can be used for heating and cooling milk (Case Study 3.5). Solar power is particularly suited for cooling and storing milk in warm developing countries where lack of access to electricity results in milk deterioration. Reusing waste energy from refrigeration in combination with solar energy can also be used to increase energy efficiency use on a dairy farm (Case Study 3.6).
CASE STUDY 3.3. SOLAR POWERED MILK CHILLING CENTER IN SRI LANKAThe international milk processing company, Fonterra, runs a solar powered milk chilling center in Sri Lanka which is designed to conserve around 22 MWh per year compared with a standard plant design. The center has 32 solar panels installed with a total capacity of 3.24 kW. Milk is collected from a network of 4,000 Sri Lankan dairy farmers for processing into fresh dairy products.
Source: Nkwocha, 2013
CASE STUDY 3.4. GEOTHERMAL ENERGY IN ITALYIn Tuscany, between the provinces of Pisa, Siena, and Grosseto, there is the biggest natural geothermal area in Europe. Here, 34 geothermal plants use geothermal energy to produce about 5.5 TWh of electricity per year. These cover about one-fourth of the regional electricity demand and the average consumption of about 2 million Italian households (Enel Green Power 2015). The first geothermal plant was opened in 1913 in Lardarello, a few years after the first transformation of geothermal energy in electricity by the Prince Ginori-Conti.
In Tuscany, about 700 people are directly working in the geothermal industry, and about a thousand work in satellite activities. Big geothermal plants are quite automatized and are not likely to increase further local direct employment. For this reason, in 1998 several Tuscan municipalities created the association Cosgiv (Consorzio per lo Sviluppo delle aree Geotermiche) to promote the direct use of the geothermal energy for electricity and heat in small local enterprises, in order to increase local employment and generate socio-economic development in an environmentally sustainable way. For instance, geothermal energy has substituted fossil fuel inputs in the processing phases of a cheese factory and to produce bread in a bakery. In a local brewery, geothermal energy is currently used for boiling the beers, but a project aims to use it also for the cooling process, making all the beer processing stages adopt 100% renewable energy.
Sources: Enel Green Power 2015, available at: http://www.enelgreenpower.com/it-IT/doc/plants/geotermia_IT.pdf ; Consorzio per lo Sviluppo delle aree Geotermiche 2015, available at: http://www.distrettoenergierinnovabili.it/der/s/cosvig/consorzio-sviluppo-geotermico and http://www.expo.rai.it/formaggio-birra-produzione-geotermica/

OPPORTUNITIES FOR AGRI-FOOD CHAINS TO BECOME ENERGY-SMART108
MIL
K V
ALU
E C
HA
IN
CASE STUDY 3.5. SOLAR PASTEURIZATION OF MILK IN INDIA A solar concentrating dish on a clear sunny day can deliver sufficient heat energy for the pasteurization of ~30,000 liters of milk and the heating of water for the cleaning-in-place of the milk storage tanks. This translates into saving of about 20,000 liters of boiler fuel oil per annum. The system pressure and temperature is 18 bar and 180°C. Due to a mismatch in the working hours of the plant and availability of the sun, an insulated pressurized water storage tank was used for the storing of thermal energy. Pressurized water was selected as the medium of heat transfer as it has high specific heat, no fire hazards, no possibility of accelerated oxidization overnight (as in the case of tarring of thermic oil), compatibility with food products, and low operational cost.Source: CliqueSolar, 2015
CASE STUDY 3.6. HOT WATER FROM WASTE HEAT AND SOLAR ENERGY IN NEW ZEALAND In New Zealand around 14 MWh of solar energy a year falls on the roof of a typical dairy shed. In addition, heat in the order of 24,000 kWh per year is lost to the atmosphere from a typical milk chiller. A combination of solar energy and waste heat from the milk chiller was used to heat water for the washing of milking equipment and vats. The high efficiency solar panels produced a water temperature up to 85°C. The waste heat was recovered from the milk chiller by a plate heat exchanger installed at the chiller unit. Cold water was pumped through the heat exchanger. The efficiency is optimized through smart controllers and differential temperature controls that protect from frost and to optimize the system efficiency.Source: Energy Efficiency and Conservation Authority (New Zealand), 2009.
Water use on a dairy farm is substantial, especially for cleaning-in-place of the milking equipment to maintain hygiene. Behavioral changes, the monitoring of water, and avoiding leakages can lead to substantial changes in total water use during milk production. Milking frequency (once a day versus twice a day) also influences the total water use in a dairy plant (Case Study 3.7).

OPPORTUNITIES FOR AGRI-FOOD CHAINS TO BECOME ENERGY-SMART 109
MIL
K V
ALU
E C
HA
IN
Utilizing animal waste (manure) to produce biogas is another viable technology which is used to produce heat and electricity that can be used to heat and cool milk on farm (Case Study 3.8). Innovative small capacity milk coolers have been developed for regions where large scale milk collection and storing infrastructure is absent or inefficient (Case Study 3.9).
CASE STUDY 3.7. WATER USE EFFICIENCY IN AUSTRALIALion’s Chelsea plant in Melbourne was able to identify a series of water reduction opportunities with opportunities implemented almost immediately leading to a savings of 29 ML of fresh water annually. Initiatives implemented included moving to a six day production schedule, which eliminated one CIP wash a week (saving 6.76 ML each year), installing improved sprays on carton fillers (saving 10 ML per year), and reducing the amount of water used to flush milk pasteurizers during cleaning whilst still maintaining required levels of hygiene.Source: DairyAustralia, 2011
CASE STUDY 3.8. BIOGAS FOR MILK CHILLING IN PAKISTANThree biogas plants were installed on farms that each had around 100 cows. The electricity generated from using the gas to fuel internal combustion engines produced 64 kWh of electricity per day which was used to run milk chillers with capacities of 500 L (12kWh) and 1,000 L (20,8 kWh) for 8 hours. The additional electricity generated was used to run other farm equipment such as fodder cutters, fans, or for lighting purposes.Source: Wisions of Sustainability, 2013

OPPORTUNITIES FOR AGRI-FOOD CHAINS TO BECOME ENERGY-SMART110
MIL
K V
ALU
E C
HA
IN
CASE STUDY 3.9. SMALL SCALE MILK COOLER IN UGANDA AND INDIAA small scale milk cooler in Uganda uses evaporative cooling in combination with zeolite stone (a porous volcanic stone which absorbs water) to cool and store milk The systems expose water adjacent to the container containing milk to a low vacuum, through a valve. The water evaporates which produces cooling and is absorbed by the zeolite. Once the absorption capacity of zeolite is reached, heat produced from biogas is used to dry zeolite and restart the process.
The evaporative cooling principle applied to chill the milk is similar to coming out of a swimming pool on a windy day: as the water evaporates the person feels cold. Recently the University of Georgia received USD 1 million to continue working on this milk cooling solution designed to help dairy farmers, particularly those in sub-Saharan Africa who lack access to refrigeration.
In India, a thermal energy battery pack recharged by solar energy, has been developed by the US company Promethean to give rapid milk cooling regardless of electricity outages.
In Kenya, recognizing the need for affordable cold-chain technologies, SunDanzer is developing a small-scale portable cooling system tailored for use in the Kenyan dairy market. The system comprises a photovoltaic refrigerator that uses solar energy to cool a chest refrigerator. This technology may use a battery for energy storage or phase-change materials—substances which are capable of storing and releasing large amounts of energy—or a combination of both. SunDanzer will evaluate freezing phase-change material into “milk packs.” The portable milk packs retain their cold temperature overnight, and in the morning, farmers use them to keep collected milk cold in sterilized aluminum milk containers as they transport it to dairy processing facilities.
Sources: Taylor, 2009. UGA Today http://news.uga.edu/releases/article/uga-engineer-receives-1-million-to-develop-milk-cooler/Promethean Power Systems https://poweringag.org/2013-winners/prometheanSunDanzer: https://poweringag.org/innovators/solar-powered-refrigeration-dairy-farms

OPPORTUNITIES FOR AGRI-FOOD CHAINS TO BECOME ENERGY-SMART 111
RIC
E V
ALU
E C
HA
IN
FIGURE 4.1. Global paddy rice production from 2004 to 2013.Source: FAOSTAT, 2015
4. RICE VALUE CHAIN
4.1. GLOBAL AND REGIONAL PRODUCTION
Rice production accounts for about 28% of total world cereal production and provides about 60% of dietary calories to more than 3 billion people. It is the second most cultivated cereal after wheat with East Asia and Southeast Asia accounting for around 60% of the world’s rice production. Milled rice is around two-thirds the weight of paddy rice at harvest, before the husks and bran are removed at the mill. World production of milled rice was around 475 Mt/yr41 in 2014 which has increased by around 50% since 1990 (Fig. 4.1) (FAOSTAT, 2015) to meet growing demand. By the year 2025, it is estimated that it will be necessary to produce 60% more rice than the amount currently produced.
The rice value chain is characterized by small holders with an average size of 1 hectare in Southeast Asia. It incorporates an intricate network of government and private actors. Government responsibilities are making sure that a suitable policy framework is in place in terms of seed laws, export policies, use of inputs, tax incentives, etc. Private actors are involved along the supply chain from provision of inputs, through rice production, to processing and trade.
41. https://www.worldriceproduction.com/
600
650
700
750
800
2013201220112010200920082007200620052004
Ann
ual P
rodu
ctio
n (M
t)

OPPORTUNITIES FOR AGRI-FOOD CHAINS TO BECOME ENERGY-SMART112
RIC
E V
ALU
E C
HA
IN
Traditionally, rice production was a low input process where farmers grew rainfed rice in the wet season and animal grazing was encouraged in the dry season, which helped with nutrient return to the soil. Due to population growth and food scarcity in Asia during the 1960s, new systems of production were developed. These practices, which collectively came to be known as “the green revolution”, introduced higher yielding varieties along with external fertilizer and agro-chemical inputs to increase productivity. Most rice systems in Asia are currently intensive with high resource use, especially water (Fig. 4.2). Rice is grown in various parts of the world in different ecosystems which characterize the resource use in the production process. The ecosystems can be broadly divided into upland, lowland, and flood prone systems (Fig. 4.3). The majority of rice is grown under irrigated conditions in which the fields are flooded from planting to harvest time and around 75% (Table 4.1) of rice production takes place on irrigated wetland (Chapagain, 2009).
FIGURE 4.2. Rice ecosystems and their related water use vary with geographical location.
UplandLevel to steeply sloping fields; rarely flooded, aerobic soil; rice direct seeded on plowed dry soil or dibbled in wet, non-puddled soil
Rainfed lowlandLevel to slightly sloping bunded fields; non-continuous flooding of variable depth and duration; submergence not exceeding 50 cm for more than 10 consecutive days; rice transplanted in puddle or plowed dry soil; alternating aerobic to anaerobic soil of variable frequency and duration
IrrigatedLeveled, bunded fields with water control; rice transplanted or direct seeded in puddle soil; shallow flooded with anaerobic soil during crop growth
Flood-proneLevel to slightly sloping or depressed fields; more than 10 consecutive days of medium to very deep flooding (50 to more than 300 cm) during crop growth; rice transplanted in puddle soil; soil salinity or toxicity in tidal areas
UPLANDShifting cultivation
Permanent agriculture
RAINFED LOWLANDDrought-prone
Favorable IRRIGATED
FLOOD PRONE
RAINFED LOWLANDDrought/
submergence-prone
deficit water surplus
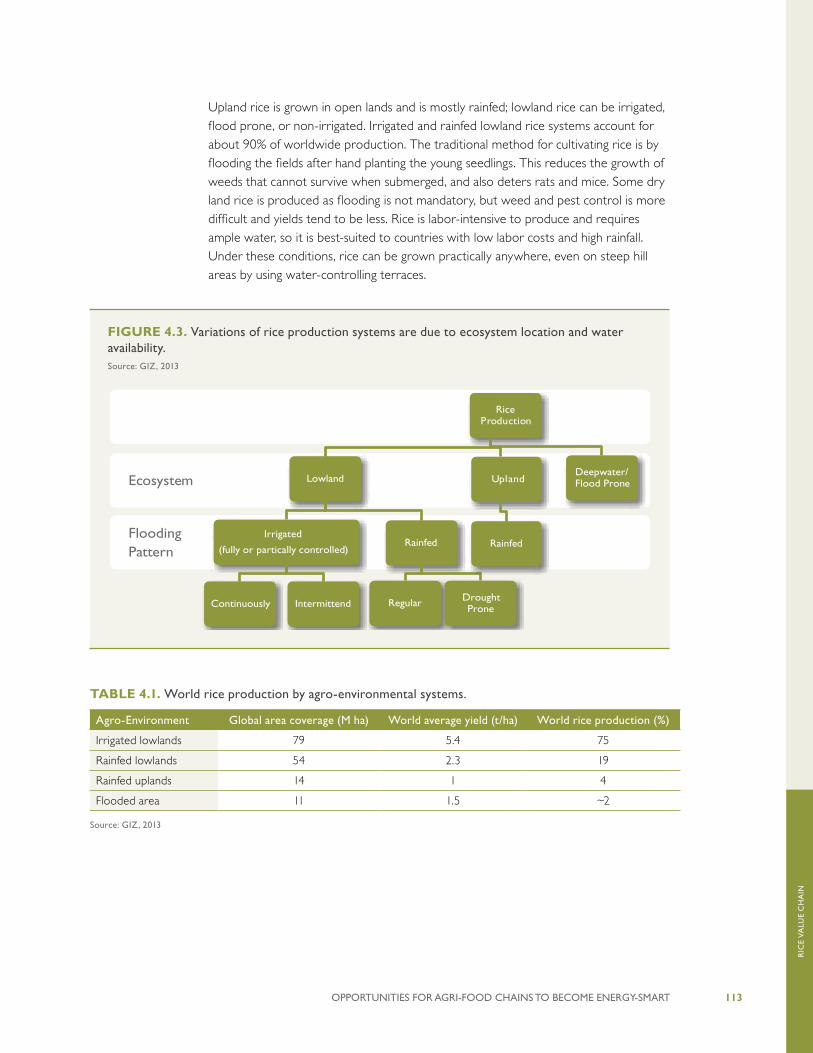
OPPORTUNITIES FOR AGRI-FOOD CHAINS TO BECOME ENERGY-SMART 113
RIC
E V
ALU
E C
HA
IN
Upland rice is grown in open lands and is mostly rainfed; lowland rice can be irrigated, flood prone, or non-irrigated. Irrigated and rainfed lowland rice systems account for about 90% of worldwide production. The traditional method for cultivating rice is by flooding the fields after hand planting the young seedlings. This reduces the growth of weeds that cannot survive when submerged, and also deters rats and mice. Some dry land rice is produced as flooding is not mandatory, but weed and pest control is more difficult and yields tend to be less. Rice is labor-intensive to produce and requires ample water, so it is best-suited to countries with low labor costs and high rainfall. Under these conditions, rice can be grown practically anywhere, even on steep hill areas by using water-controlling terraces.
FIGURE 4.3. Variations of rice production systems are due to ecosystem location and water availability.Source: GIZ, 2013
Flooding Pattern
Ecosystem
Rice noitcudorP
Lowland
Irrigated
(fully or partically controlled)
Continuously Intermittend
Rainfed
Regular Drought Prone
Deepwater/ Flood Prone dnalpU
Rainfed
TABLE 4.1. World rice production by agro-environmental systems.
Agro-Environment Global area coverage (M ha) World average yield (t/ha) World rice production (%)
Irrigated lowlands 79 5.4 75
Rainfed lowlands 54 2.3 19
Rainfed uplands 14 1 4
Flooded area 11 1.5 ~2
Source: GIZ, 2013

OPPORTUNITIES FOR AGRI-FOOD CHAINS TO BECOME ENERGY-SMART114
RIC
E V
ALU
E C
HA
IN
Approximately 95% of the world’s rice is produced in less developed countries, mainly in Asia (Fig. 4.4). China and India are the largest producers with around 200 Mt and 160 Mt of paddy rice per year respectively in 2013 (Fig. 4.5). Their exports are relatively low due to the high demand from local markets.
The greater Mekong sub-region (GMS) is an important rice producing region with around 44.1% of total production (FAOSTAT). In the GMS, agriculture contributes to over 40% of the GDP and provides employment to as much as 75% of the population. Thailand and Vietnam are two of the largest exporters of rice in the GMS. At present in Vietnam, approximately 75% of the population are farmers with around 80% of those being rice farmers. Deep-water rice and floating rice are grown on the floodplains and deltas of rivers such as the Irrawaddy in Myanmar, the Mekong in Vietnam and Cambodia, and the Chao Phraya in Thailand. However, in Thailand as well as Laos and Cambodia, rice is grown mostly as a mono-crop in rainfed lowlands (Table 4.2). Similarly, in Cambodia, around 80% of the population lives in rural areas and engages in agriculture, although off-farm employment makes an increasingly important contribution to household incomes. Agriculture provides about 35% of Cambodia’s GDP. Rice is the predominant crop, accounting for about 87% of crop land, while the rice value chain accounts for about 15% of GDP. About 79% of rice is produced in the wet season and this high proportion reflects the under-development of irrigation systems. Cambodia produces a significant rice surplus, estimated as 3 Mt to 4 Mt of paddy, but most of the surplus production is exported to Vietnam for processing. The Royal Government of Cambodia gives a high priority to its Policy on Paddy Production and Rice Export which has the target of achieving 1 Mt of milled rice exports by 2016.
FIGURE 4.4. Paddy rice production from 2004 to 2013 by region.Source: FAOSTAT, 2015
0
100
200
300
400
500
600
700
800 Asia
Europe
Americas
Africa
Oceania
2013201220112010200920082007200620052004
Ann
ual P
rodu
ctio
n (M
t)

OPPORTUNITIES FOR AGRI-FOOD CHAINS TO BECOME ENERGY-SMART 115
RIC
E V
ALU
E C
HA
IN
TABLE 4.2. Area of lowland rice production in Southeast Asian countries under irrigated and rain fed systems (1,000 ha).
Country Irrigated Rainfed
Cambodia 154 1124
Indonesia 6154 4015
Lao PDR 40 319
Malaysia 445 152
Myanmar 1124 4166
Philippines 2334 1304
Thailand 2075 6792
Viet Nam 3687 1955
Total 16013 19827
Source: Susan et. al, 2002.
4.2. ENERGY AND WATER DEMAND
Rice production is resource intensive in terms of energy and water all along the value chain but it varies with the ecosystem and farm size (Fig. 4.6). There are particularly large differences in energy demand on-farm depending on the extent to which external inputs are used as well as the level of mechanization.
FIGURE 4.5. Top 10 rice producing nations in 2013. Source: FAOSTAT, 2015
0
50
100
150
200
250
Japan
Braz
il
Phillip
pines
Myanm
ar
Thaila
nd
Viet N
am
Bang
lades
h
Indon
esia
India
China
Ann
ual P
rodu
ctio
n (M
t)
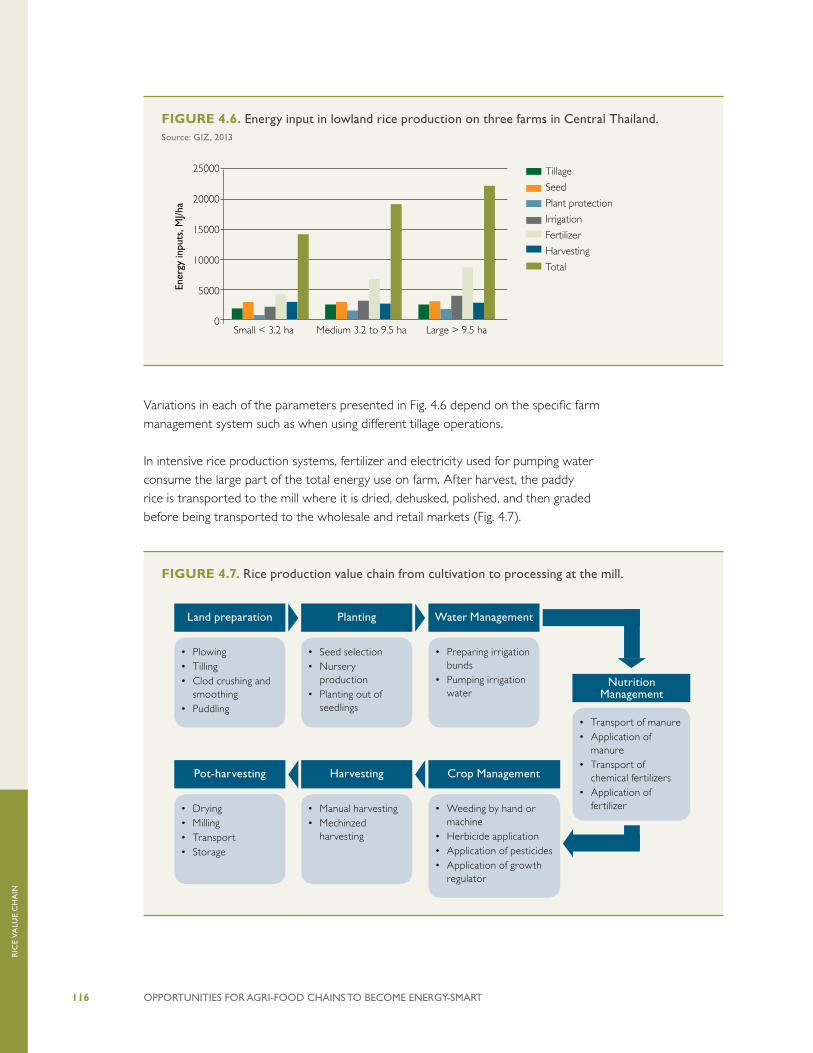
OPPORTUNITIES FOR AGRI-FOOD CHAINS TO BECOME ENERGY-SMART116
RIC
E V
ALU
E C
HA
IN
FIGURE 4.6. Energy input in lowland rice production on three farms in Central Thailand.Source: GIZ, 2013
Variations in each of the parameters presented in Fig. 4.6 depend on the specific farm management system such as when using different tillage operations.
In intensive rice production systems, fertilizer and electricity used for pumping water consume the large part of the total energy use on farm. After harvest, the paddy rice is transported to the mill where it is dried, dehusked, polished, and then graded before being transported to the wholesale and retail markets (Fig. 4.7).
Conventional tillage and puddling
Puddling & manual forming of beds
58 cm dry bed formed by VMP in a single pass
Dry strip tillage by the VMP in a single pass
Direct energy
Fuel 2200 (8.2) 2240 (8.5) 1510 (7.5) 540 (2.8)
Human 160 (0.6) 170 (0.6) 250 (1.2) 250 (1.3)
Subtotal 2350 (8.8) 2410 (9.2) 1760 (8.7) 780 (4.1)
Indirect energy
Seed 440 (1.6) 440 (1.7) 440 (2.2) 580 (3.0)
Machinery 4390 (16.4) 3890 (14.8) 1010 (5.0) 600 (3.1)
Fertilizing 9930 (37.1) 9930 (37.8) 9930 (49.0) 9930 (52.0)
Plant protection 3930 (14.7) 3930 (14.9) 3930 (19.4) 3930 (20.6)
Irrigation 5710 (21.3) 5710 (21.7) 3210 (15.8) 3280 (17.2)
Subtotal 24400 (91.2) 23880 (90.8) 18510 (91.3) 18310 (95.9)
Total 26750 a (100) 26300 a (100) 20270 b (100) 19100 c (100)
Note: Figures in the parenthesis indicate the percentage. VMP: versatile multi-crop planter. In a row, means followed by a common letter(s) are not signi�cantly different at 5 % level by LSD test. LSD0.05 = 0.73, CV (%) = 1.57.
Tillage
Seed
Plant protection
Irrigation
Fertilizer
Harvesting
Total
25000
20000
15000
10000
5000
0
Ener
gy in
puts
, MJ/h
a
Small < 3.2 ha Medium 3.2 to 9.5 ha Large > 9.5 ha
FIGURE 4.7. Rice production value chain from cultivation to processing at the mill.
• Plowing• Tilling• Clod crushing and
smoothing• Puddling
Land preparation
• Seed selection• Nursery
production• Planting out of
seedlings
Planting
• Preparing irrigation bunds
• Pumping irrigation water
Water Management
• Drying• Milling• Transport• Storage
Pot-harvesting
• Manual harvesting• Mechinzed
harvesting
Harvesting
• Weeding by hand or machine
• Herbicide application• Application of pesticides• Application of growth
regulator
Crop Management
• Transport of manure• Application of
manure• Transport of
chemical fertilizers• Application of
fertilizer
Nutrition Management

OPPORTUNITIES FOR AGRI-FOOD CHAINS TO BECOME ENERGY-SMART 117
RIC
E V
ALU
E C
HA
IN
4.2.1. ON-FARM RICE PRODUCTION
At the farm level, direct energy inputs, as diesel or gasoline, are used in various crop production processes such as land preparation, irrigation, threshing, harvesting, and transport of agricultural inputs and farm produce. Indirect energy is embodied in fertilizers, pesticides, buildings, and farm machinery. On-farm energy use in rice production varies greatly depending on the production systems. For instance, in rainfed systems, rain water is the primary source of water and hence rainfed rice production is less energy intensive compared to irrigated rice systems. Additionally, energy use can also vary across countries depending on the availability and use of fossil fuels and electricity. A description of the main on-farm activities follows.
Land preparation: Cultivation of wet or dry soil is required to ensure that the rice field is ready for planting out the seedlings. Cultivation typically involves:
• plowing to mix in any residue and overturn the soil;
• harrowing to break the soil clods into smaller pieces and incorporate manure; and
• leveling the field surface ready for the flood irrigation.
Seeding and planting: Many countries have yet to mechanize their rice farming practices so typically rice seeds are germinated in a nursery and the seedlings then planted in the rice field either by hand or by mechanical transplanters. Seeds can also be sown directly by seed drills that place the seeds into grooves cut into the ground surface. The mechanized transplanting operation is then not required. Typical direct and indirect energy demand can change depending on the type of tillage system used (Table 4.3).
Nutrient management: Chemical fertilizers are widely used by rice farmers and often spread manually over the field as in the Mekong region. Animal manure is applied less often.
Weed management: Weed control is done either manually, mechanically, or chemically to maintain the health and vigor of the growing crop plants. Flooding also reduces weed growth. Manual weeding is labor intensive but environmentally sound compared with chemicals or the use of GHG emitting tractors and machinery to control the weeds by surface cultivation. However both mechanical and chemical weeding can be cost effective, so they are generally used where labor availability is low or hourly costs high.

OPPORTUNITIES FOR AGRI-FOOD CHAINS TO BECOME ENERGY-SMART118
RIC
E V
ALU
E C
HA
IN
TABLE 4.3. Direct and indirect energy consumption under different tillage operations for rice production (MJ/ha).
Harvesting: This operation consists of cutting the ripe rice heads, threshing, and cleaning. These activities can be done manually in individual steps or in combination using a mechanized harvester. Manual harvesting is the most common method in Asia. The crop is cut using simple hand tools like the sickle (for cutting 15 cm−25 cm above ground level) or simple hand-held knives (for cutting just below the panicle). Mechanical cutting uses reapers, either hand-driven or mounted on the front of a tractor. A reaper with a cutting width of 1.5 m can operate at a rate of 2 ha to 4 ha per day. The rice stalks are tied in bundles. Alternatively, a combine harvester cuts and threshes the rice which is stored on board in sacks or in tanks ready to be transferred to the transport vehicle.
Due to the large differences in production practices, levels of mechanization, and amounts of external inputs used, it is difficult to estimate the average on-farm energy consumption (Figs. 4.8, 4.9, and 4.10). Nevertheless, electricity and fertilizer have the largest shares of total energy consumed in intensive mechanized systems. While energy inputs into less intensive systems are considerably less, the yields can also be radically lower when compared to intensive systems. Hence energy inputs in terms of GJ/t of rice harvested can be higher.
High input intensive systems generally provide higher yields. In recent years however, there have been declining yields in some double or triple cropping systems, even where best practice has been followed. There is also evidence of diminishing returns from N fertilizer applications.
Conventional tillage and puddling
Puddling & manual forming of beds
58 cm dry bed formed by VMP in a single pass
Dry strip tillage by the VMP in a single pass
Direct energy
Fuel 2200 (8.2) 2240 (8.5) 1510 (7.5) 540 (2.8)
Human 160 (0.6) 170 (0.6) 250 (1.2) 250 (1.3)
Subtotal 2350 (8.8) 2410 (9.2) 1760 (8.7) 780 (4.1)
Indirect energy
Seed 440 (1.6) 440 (1.7) 440 (2.2) 580 (3.0)
Machinery 4390 (16.4) 3890 (14.8) 1010 (5.0) 600 (3.1)
Fertilizing 9930 (37.1) 9930 (37.8) 9930 (49.0) 9930 (52.0)
Plant protection 3930 (14.7) 3930 (14.9) 3930 (19.4) 3930 (20.6)
Irrigation 5710 (21.3) 5710 (21.7) 3210 (15.8) 3280 (17.2)
Subtotal 24400 (91.2) 23880 (90.8) 18510 (91.3) 18310 (95.9)
Total 26750 a (100) 26300 a (100) 20270 b (100) 19100 c (100)
Note: Figures in the parenthesis indicate the percentage. VMP: versatile multi-crop planter. In a row, means followed by a common letter(s) are not signi�cantly different at 5 % level by LSD test. LSD0.05 = 0.73, CV (%) = 1.57.
Tillage
Seed
Plant protection
Irrigation
Fertilizer
Harvesting
Total
25000
20000
15000
10000
5000
0
Ener
gy in
puts
, MJ/h
a
Small < 3.2 ha Medium 3.2 to 9.5 ha Large > 9.5 ha
Source: GIZ, 2013
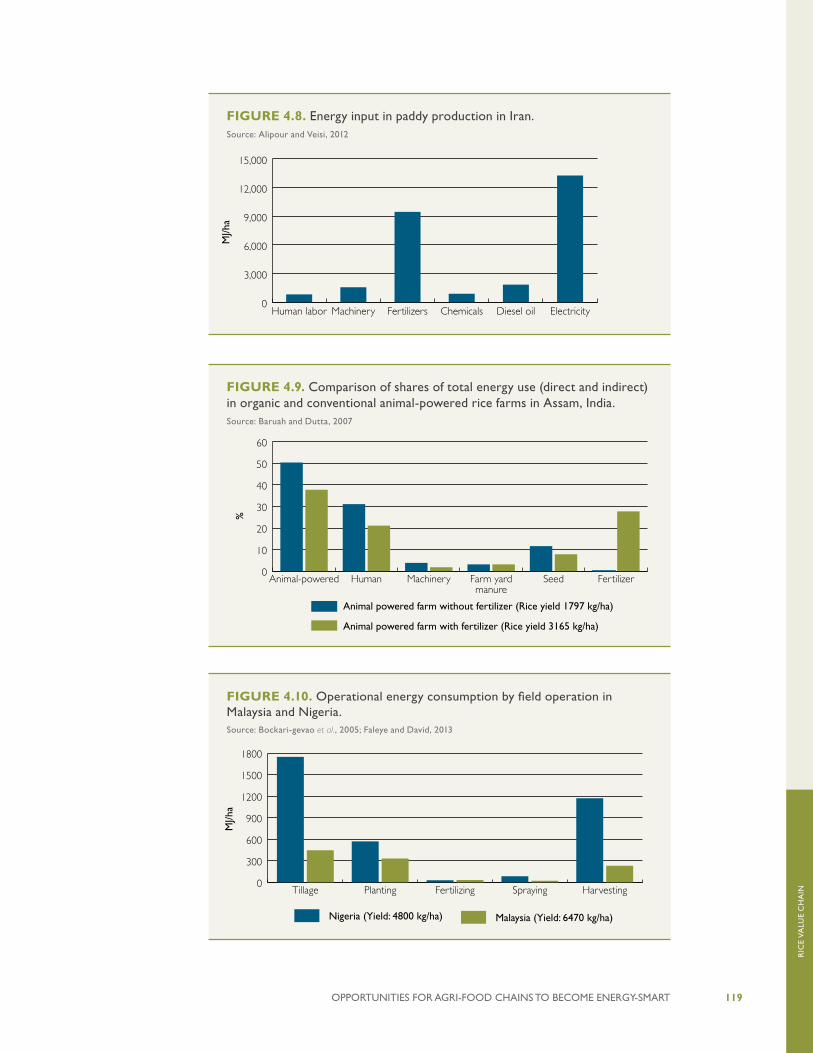
OPPORTUNITIES FOR AGRI-FOOD CHAINS TO BECOME ENERGY-SMART 119
RIC
E V
ALU
E C
HA
IN
FIGURE 4.8. Energy input in paddy production in Iran.Source: Alipour and Veisi, 2012
0
3,000
6,000
9,000
12,000
15,000
ElectricityDiesel oilChemicalsFertilizersMachineryHuman labor
MJ/h
a
FIGURE 4.9. Comparison of shares of total energy use (direct and indirect) in organic and conventional animal-powered rice farms in Assam, India.Source: Baruah and Dutta, 2007
0
10
20
30
40
50
60
Animal powered farm with fertilizer (Rice yield 3165 kg/ha)
Animal powered farm without fertilizer (Rice yield 1797 kg/ha)
FertilizerSeedFarm yardmanure
MachineryHumanAnimal-powered
%
FIGURE 4.10. Operational energy consumption by field operation in Malaysia and Nigeria.Source: Bockari-gevao et al., 2005; Faleye and David, 2013
0
300
600
900
1200
1500
1800
Nigeria (Yield: 4800 kg/ha) Malaysia (Yield: 6470 kg/ha)
HarvestingSprayingFertilizingPlantingTillage
MJ/h
a
OPPORTUNITIES FOR AGRI-FOOD CHAINS TO BECOME ENERGY-SMART120
RIC
E V
ALU
E C
HA
IN
Intensive rice production in Asia consumes around 20% of all N fertilizer produced worldwide (IPNI, 2005). Globally, the average annual nitrogen fertilizer application rate is about 118± 40 kg N/ha. In most Asian countries the fertilization rates vary from 60 kg N/ha to 90 kg N/ha in wet season to 100 kg N/ha to 150 kg N/ha in the dry season. However, a substantial part of the applied nitrogen is lost through leaching, denitrification and ammonia (NH3) leading to water pollution, decreasing soil productivity, and GHG emissions. In China for instance, the nitrogen use efficiency is only 30% to 35% and up to 50% of the nitrogen applied is lost through diffusion of nitrous oxide emissions or infiltration of nitrates (Zhao, Wu, Dong, and Li, 2010). Inefficient fertilizer use not only costs money but also can cause water, soil, and environmental pollution. It also results in waste of energy embodied in the fertilizer.
Rice cultivation in irrigated fields is water intensive which effects the physical and nutritional characteristics of the plant (Keiser et al., 2002). It has been estimated that the global water footprint of rice production is around 1308 Mm3/year of which 707 Mm3/year is evaporated, 332 Mm3/year is green water, 374 Mm3/year is blue water, 64 Mm3/year is polluted, and 538 Mm3/year is lost (Chapagain, 2009). In irrigated lowland rice systems, depending on the type of the soil, water use can vary from 400 mm in heavy clay with shallow water table, to 2,000 mm in sandy soils with deep water tables. This amounts to roughly 1,200 mm of water per crop amounting to roughly 5,000 liters of water per kilogram of rice on average for a crop yielding around 2 t/ha.
4.2.2. PROCESSING
Once the paddy is harvested, it is dried to reduce the moisture of the grain. Paddy is generally harvested at a moisture content of 20% and 25% (wet basis) which makes it susceptible to microorganism growth and high respiration rates. Therefore, it is usually dried to 12% to 14% moisture content to enable long storage with minimal losses (Jittanit et al., 2010). Total energy input into a conventional dryer is in the range of 4 MJ/kg to 6 MJ/kg of removed water depending on the thermal efficiency of the drying systems.
Sun drying is the traditional method where the grain is spread out on the open ground on sheets. Mechanical drying uses heated air that can be controlled (temperature and flow) to give better quality of rice compared to sun drying and with lower risks of losses. Small to medium-sized grain dryers of various designs are commonly used throughout Asia (Fig. 4.11).
In-store drying provides an ideal second stage of drying because the slow and gentle process maintains the grain quality and there are relatively low energy input requirements of heat and electricity to operate the fans. This leads to low energy costs which is why in recent years in-store drying has become popular in Asian countries such as Thailand.

OPPORTUNITIES FOR AGRI-FOOD CHAINS TO BECOME ENERGY-SMART 121
RIC
E V
ALU
E C
HA
IN
The harvested rice can be parboiled before the milling activities to boost its nutritional characteristics and change the texture. The process involves increasing the moisture content of the grain by 25% to 30% followed by steaming to gelatinize the starch content. Thermal energy (steam) is used to soak and heat the paddy to increase its moisture content. Parboiled rice is then milled which involves various processes such as pre cleaning, removal of husk and bran layers, shelling, polishing and grading and packaging. Regardless of parboiling, a rice milling system at the village scale can be a simple one or two step process, or multi stage.
• In the one-step process, husk and bran removal are done in one pass and milled or white rice is produced directly out of the paddy.
• In the two-step process, removing the husk and bran are done separately, and brown rice is produced as an intermediate product.
• In multistage milling, the rice undergoes several processing steps depending on whether the paddy is milled in the village for local consumption or for selling to the market.
Large scale commercial milling systems are multi-stage. The objective is to reduce mechanical stresses and heat build-up in the grains, thereby minimizing grain breakage and producing uniformly polished grain. Compared to the village-level, the commercial system is more sophisticated and is configured to maximize the process of producing well-milled, whole grains.
Rice milling facilities come in various configurations and the components vary in design and performance42. A modern commercial mill catering to the higher-end market has three basic stages:
42. http://www.knowledgebank.irri.org/step-by-step-production/postharvest/milling/commercial-rice-milling-systems
FIGURE 4.11. Types of dryers and energy use.Source: Gummert, 2011
Solar drying
Energy consumption
In-store dryingFixed-bed
batch dryerRecirculating batch dryer
Continuous flow dryer

OPPORTUNITIES FOR AGRI-FOOD CHAINS TO BECOME ENERGY-SMART122
RIC
E V
ALU
E C
HA
IN
• husking;
• whitening; and
• grading (Table 4.4).
Many adjustments are automated (such as the rubber roller clearance, inclination of the separator bed, and feeding rates). This gives maximum efficiency and ease of operation. The whitener-polishers are provided with sensors to assess the current load on the motor drives which gives an indication of the operating pressure on the grain to continually optimize it.
TABLE 4.4. Stages of modern rice milling process.
Stage Function
ParboilingSoakingSteamingDrying
The starches in the rice become gelatinized and retrograded after cooling. The process boosts the nutritional characteristic of rice and changes the texture.
HuskingPre-cleaning Removes all impurities and unfilled grains from the paddy
Husking Removes the husk from the paddy
Husk aspiration Separates the husk from the brown rice/unhusked paddy
Paddy separation Separates the unhusked paddy from the brown rice
De-stoning Separates small stones from the brown rice
Whitening Whitening Removes all or part of the bran layer and germ from the brown rice
Polishing Improves the appearance of milled rice by removing remaining bran particles and by polishing the exterior of the milled kernel.
GradingSifting Separates small impurities or chips from the milled rice
Length grading Separates small and large brokens from the head rice
Blending Mixes head rice with predetermined amounts of brokens, as required by the customer.
Weighing and bagging Prepares milled rice ready for transport to the customer
Source: http://www.knowledgebank.irri.org/
Typically in a rice mill, energy is used for parboiling (where carried out), drying, and milling activities (Figs. 4.12 and 4.13). In a typical small to medium size operation, milling activities consume the largest share of total electricity.
The thermal energy intensity for parboiling and other milling activities depends on the type of technology used and the energy efficiency of the technology. In many countries the rice husk obtained as a by-product of the milling process is combusted to produce steam for parboiling paddy and for subsequent drying. In developing countries such as Bangladesh, open furnaces are used for heat generation and the thermal energy
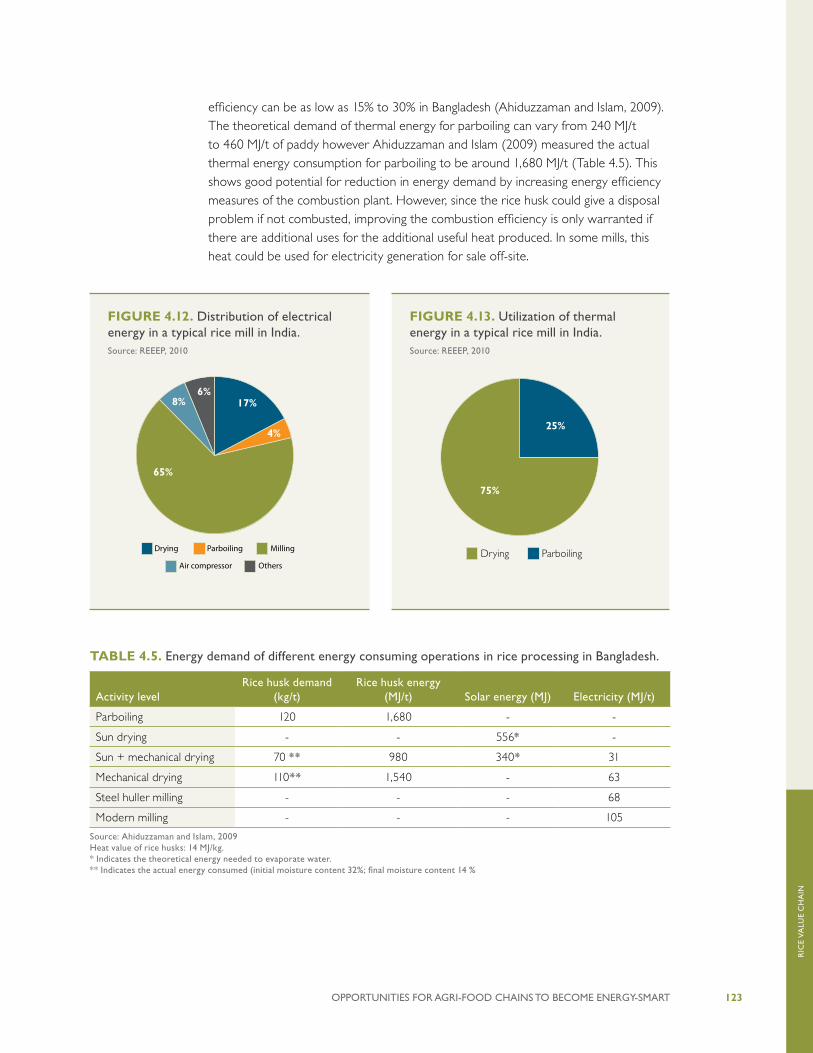
OPPORTUNITIES FOR AGRI-FOOD CHAINS TO BECOME ENERGY-SMART 123
RIC
E V
ALU
E C
HA
IN
FIGURE 4.13. Utilization of thermal energy in a typical rice mill in India.Source: REEEP, 2010
efficiency can be as low as 15% to 30% in Bangladesh (Ahiduzzaman and Islam, 2009). The theoretical demand of thermal energy for parboiling can vary from 240 MJ/t to 460 MJ/t of paddy however Ahiduzzaman and Islam (2009) measured the actual thermal energy consumption for parboiling to be around 1,680 MJ/t (Table 4.5). This shows good potential for reduction in energy demand by increasing energy efficiency measures of the combustion plant. However, since the rice husk could give a disposal problem if not combusted, improving the combustion efficiency is only warranted if there are additional uses for the additional useful heat produced. In some mills, this heat could be used for electricity generation for sale off-site.
Drying Parboiling
25%
75%
FIGURE 4.12. Distribution of electrical energy in a typical rice mill in India.Source: REEEP, 2010
TABLE 4.5. Energy demand of different energy consuming operations in rice processing in Bangladesh.
Activity levelRice husk demand
(kg/t)Rice husk energy
(MJ/t) Solar energy (MJ) Electricity (MJ/t)
Parboiling 120 1,680 - -
Sun drying - - 556* -
Sun + mechanical drying 70 ** 980 340* 31
Mechanical drying 110** 1,540 - 63
Steel huller milling - - - 68
Modern milling - - - 105
Source: Ahiduzzaman and Islam, 2009 Heat value of rice husks: 14 MJ/kg. * Indicates the theoretical energy needed to evaporate water. ** Indicates the actual energy consumed (initial moisture content 32%; final moisture content 14 %
OthersAir compressor
MillingParboilingDrying
65%
8%6%
17%
4%

OPPORTUNITIES FOR AGRI-FOOD CHAINS TO BECOME ENERGY-SMART124
RIC
E V
ALU
E C
HA
IN
Rice production systems are large emitters of GHG. Factors affecting GHG emissions include land preparation, seed preparation, rice varieties, fertilizer application, water management, and harvesting such as rice, wheat, and maize.
GHG emissions arise from fossil fuel use in the production and processing of rice but also from the use of nitrogenous fertilizers. From a study in Ghana, where diesel fuel usage was 46.1 kg/ha, approximately 477 kg CO2-eq of GHGs were emitted per hectare of rice production (Table 4.6). In addition, the flooding of rice fields creates anaerobic conditions that result in methanogenesis followed by methane release. It is estimated that approximately one-third of all agricultural CH4 emissions come from rice production (28 Mt to 44 Mt of CH4 per year) (FAO, 2013). The amount of methane emitted per hectare depends on the physical, chemical, and biological properties of the soil, quantity of organic residues, temperature, plant physiology, and water regime.
Due to average temperature increases, climate change is projected to negatively impact the production of major crops. For example, rice yields in Cambodia could fall by 5% by 2020 without adaptation measures being introduced such as new varieties.
TABLE 4.6. GHG emission from diesel used in rice production and transport from the field in Ghana.
Source: Salam, 2015
The rice value chain varies with processing scale (on-farm or processing plant) and different end-use markets (Fig. 4.14). GHG emissions occur at the production and processing stages but also during the packaging operation. Energy efficiency improvements can often be achieved at each step of the chain that are often cost effective. Methane emissions from rice production can be reduced by using water management practices such as cultivating aerobic rice and irrigating periodically during the growing season to reduce water use when rice is not grown, and shorten
Activity/source CO2 emission CH4 emission N 2O emission Total
kg ha-1 kg CO2-eq ha-1 %
29.6 29.6 0.06 1.26 0.0001 0.031 30.89 7
1.1 345 345 72
20.5 20.5 0.045 0.95 0.0001 0.031 21.48 5
27.7 27.7 0.061 1.28 0.0001 0.031 29.01 6
Land preparation
Fertiliser application
Planting
Harvesting
Transportation 48.5 48.5 0.106 2.23 0.0003 0.09 50.82 10
Total 126.3 126.3 0.272 5.72 1.1006 345.183 477.2 100
kg ha-1 kg CO2-eq ha-1 kg ha-1 kg CO2-eq ha-1 kg CO2-eq ha-1
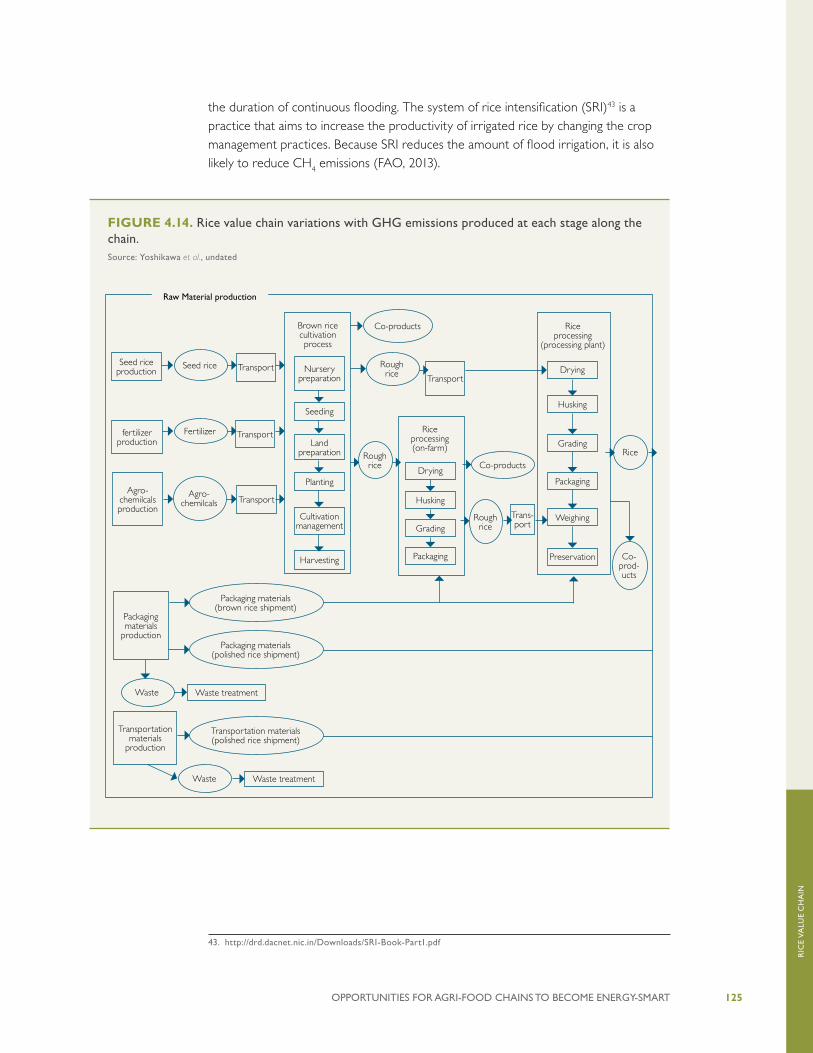
OPPORTUNITIES FOR AGRI-FOOD CHAINS TO BECOME ENERGY-SMART 125
RIC
E V
ALU
E C
HA
IN
FIGURE 4.14. Rice value chain variations with GHG emissions produced at each stage along the chain.Source: Yoshikawa et al., undated
the duration of continuous flooding. The system of rice intensification (SRI)43 is a practice that aims to increase the productivity of irrigated rice by changing the crop management practices. Because SRI reduces the amount of flood irrigation, it is also likely to reduce CH4 emissions (FAO, 2013).
43. http://drd.dacnet.nic.in/Downloads/SRI-Book-Part1.pdf
Seed rice production
fertilizerproduction
Agro-chemilcalsproduction
Packaging materials
production
Transportationmaterials
production
Seed rice
Fertilizer
Agro-chemilcals
Transport
Transport
Transport
Packaging materials(brown rice shipment)
Packaging materials(polished rice shipment)
Transportation materials(polished rice shipment)
Waste Waste treatment
Waste Waste treatment
Nurserypreparation
Seeding
Land preparation
Planting
Cultivationmanagement
Harvesting
Rough rice Transport
Co-products
Rough rice
Rough rice
Co-products
Trans-port
Drying
Husking
Grading
Packaging
Weighing
Preservation
Drying
Husking
Grading
Packaging
Riceprocessing (on-farm)
Brown ricecultivation process
Riceprocessing
(processing plant)
Rice
Co-prod-ucts
Raw Material production
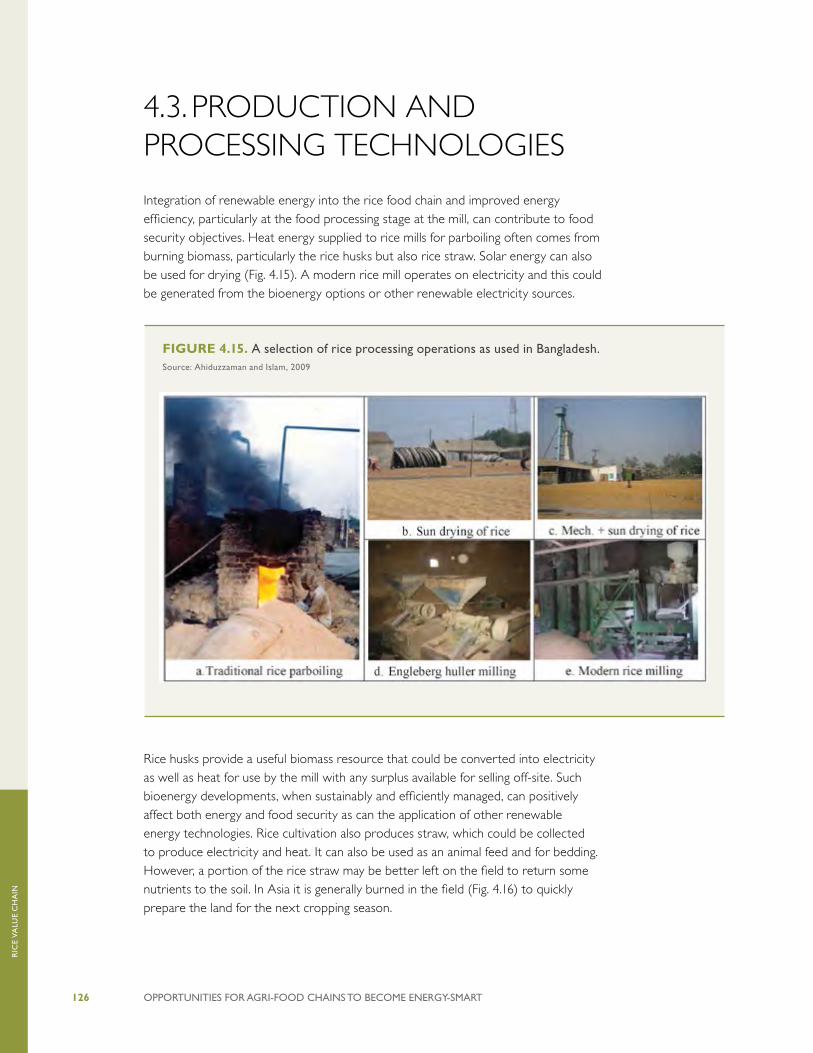
OPPORTUNITIES FOR AGRI-FOOD CHAINS TO BECOME ENERGY-SMART126
RIC
E V
ALU
E C
HA
IN
4.3. PRODUCTION AND PROCESSING TECHNOLOGIES
Integration of renewable energy into the rice food chain and improved energy efficiency, particularly at the food processing stage at the mill, can contribute to food security objectives. Heat energy supplied to rice mills for parboiling often comes from burning biomass, particularly the rice husks but also rice straw. Solar energy can also be used for drying (Fig. 4.15). A modern rice mill operates on electricity and this could be generated from the bioenergy options or other renewable electricity sources.
Rice husks provide a useful biomass resource that could be converted into electricity as well as heat for use by the mill with any surplus available for selling off-site. Such bioenergy developments, when sustainably and efficiently managed, can positively affect both energy and food security as can the application of other renewable energy technologies. Rice cultivation also produces straw, which could be collected to produce electricity and heat. It can also be used as an animal feed and for bedding. However, a portion of the rice straw may be better left on the field to return some nutrients to the soil. In Asia it is generally burned in the field (Fig. 4.16) to quickly prepare the land for the next cropping season.
FIGURE 4.15. A selection of rice processing operations as used in Bangladesh.Source: Ahiduzzaman and Islam, 2009

OPPORTUNITIES FOR AGRI-FOOD CHAINS TO BECOME ENERGY-SMART 127
RIC
E V
ALU
E C
HA
IN
Procuring rice straw is cumbersome since it is often expensive to collect from farms in remote areas. Where available, rice straw can be burned directly to produce heat such as in improved cook-stoves or it can be used as feedstock for steam turbine gasification or pyrolysis plants to generate electricity (Case Study 4.1). Rice husks are produced at the mills and can also be utilized for bioenergy which avoids disposal costs. Cogeneration of heat and electricity is possible for any given plant. Typically 1 kWh electricity generation requires 2 kg to 3 kg of straw or rice husk. On a global basis, the total biomass resources available from rice husks or straw (Table 4.7) could be used to produce around 5 PJ to 10 PJ of useful heat or 3 TWh to 4 TWh of electricity. The amount presently used varies by region (Fig. 4.16).
CASE STUDY 4.1. IMPROVED RICE HUSK FURNACE FOR RICE PARBOILING IN BANGLADESHRice husks are extensively used in rice mills in Bangladesh albeit in highly polluting open furnaces. These traditional furnaces generally operate at an efficiency of 20% and can also negatively affect human health. In 2001, scientists from The Energy and Resources Institute (TERI), India designed and operated an improved rice husk furnace to produce steam for the process heating of paddy in rice mills. The improved furnace operated at 44% efficiency saving rice husks which were then used to produce briquettes to be used in other furnaces replacing fossil fuels. CO2-eq emissions came down to 3,300 ppm in the exhaust gas which were within the permissible limit of 5,000 ppm. The steam output rate also increased from 1 t/hr to 2 t/hr at 2 kg/cm2 pressure.Source: TERI, 2001
FIGURE 4.16. Amount of rice paddy biomass burned by region in 2012.Source: FAOSTAT, 2015
0
10
20
30
40
50
60
70
80
OceaniaEuropeAsiaSouth AmericaNorth America
Mt
0.602.61
0.380.06
79.30
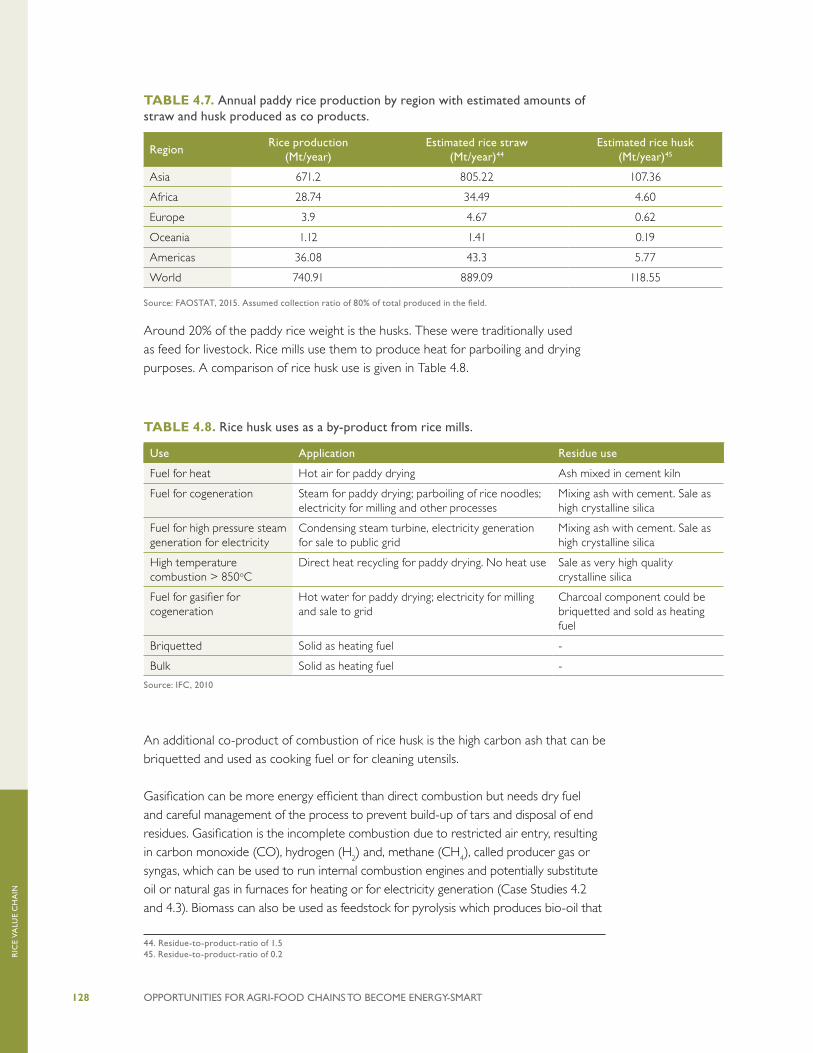
OPPORTUNITIES FOR AGRI-FOOD CHAINS TO BECOME ENERGY-SMART128
RIC
E V
ALU
E C
HA
IN
TABLE 4.7. Annual paddy rice production by region with estimated amounts of straw and husk produced as co products.
RegionRice production
(Mt/year)Estimated rice straw
(Mt/year)44
Estimated rice husk (Mt/year)45
Asia 671.2 805.22 107.36
Africa 28.74 34.49 4.60
Europe 3.9 4.67 0.62
Oceania 1.12 1.41 0.19
Americas 36.08 43.3 5.77
World 740.91 889.09 118.55
Source: FAOSTAT, 2015. Assumed collection ratio of 80% of total produced in the field.44 45
Around 20% of the paddy rice weight is the husks. These were traditionally used as feed for livestock. Rice mills use them to produce heat for parboiling and drying purposes. A comparison of rice husk use is given in Table 4.8.
TABLE 4.8. Rice husk uses as a by-product from rice mills.
Use Application Residue use
Fuel for heat Hot air for paddy drying Ash mixed in cement kiln
Fuel for cogeneration Steam for paddy drying; parboiling of rice noodles; electricity for milling and other processes
Mixing ash with cement. Sale as high crystalline silica
Fuel for high pressure steam generation for electricity
Condensing steam turbine, electricity generation for sale to public grid
Mixing ash with cement. Sale as high crystalline silica
High temperature combustion > 850oC
Direct heat recycling for paddy drying. No heat use Sale as very high quality crystalline silica
Fuel for gasifier for cogeneration
Hot water for paddy drying; electricity for milling and sale to grid
Charcoal component could be briquetted and sold as heating fuel
Briquetted Solid as heating fuel -
Bulk Solid as heating fuel -
Source: IFC, 2010
An additional co-product of combustion of rice husk is the high carbon ash that can be briquetted and used as cooking fuel or for cleaning utensils.
Gasification can be more energy efficient than direct combustion but needs dry fuel and careful management of the process to prevent build-up of tars and disposal of end residues. Gasification is the incomplete combustion due to restricted air entry, resulting in carbon monoxide (CO), hydrogen (H2) and, methane (CH4), called producer gas or syngas, which can be used to run internal combustion engines and potentially substitute oil or natural gas in furnaces for heating or for electricity generation (Case Studies 4.2 and 4.3). Biomass can also be used as feedstock for pyrolysis which produces bio-oil that
44. Residue-to-product-ratio of 1.545. Residue-to-product-ratio of 0.2

OPPORTUNITIES FOR AGRI-FOOD CHAINS TO BECOME ENERGY-SMART 129
RIC
E V
ALU
E C
HA
IN
can be further refined into various hydrocarbon products and bio-char which can be incorporated into the soil to enhance the carbon content thus sequestering carbon from the atmosphere (Lehmann, 2009). Bio-oil can be used for combustion in boilers or in diesel engines after some modifications (Nagaraja et al., 2013) .
Although still an emerging technology, ethanol can also be produced from cellulosic biomass such as rice husks. Abbas and Ansumali, (2010) estimated the global potential production of bioethanol from rice husk to be in the order of 20.9 to 24.3 GL per annum, potentially satisfying around one-fifth of the global ethanol biofuel demand for a 10% gasohol fuel blend.
So in summary, rice husks can be used as:
• feedstock for ethanol to replace gasoline;
• feedstock for gasification for heat and electricity production;
• feedstock for steam raising to generate heat and possible electricity; and
• various non energy applications.
Solar thermal and PV electricity could be used in the drying and processing of paddy.
CASE STUDY 4.2. RICE HUSK GASIFICATION IN RICE MILL IN CAMBODIAIn 2012, Ms. Yam Chan installed a 600 kW gasifier in her mill with a milling capacity of 6 t/hr. The investment cost of the whole system was USD 60,000. The mill operates 10 hours/day, 22 days/month over the whole year. The gasifier has replaced about 60% of diesel consumption, giving a short term payback period. Rice husks are used to fuel driers as well as the gasifier. However, the mill has a very low pollution control and black water flows in a large pond next to the installation ash, and tars are found on the ground and a high level of dust and noise is noticed.Source: IRENA, 2014
CASE STUDY 4.3. GASIFICATION PLANT IN GUYANAIn March 2015, Guyana’s first gasification plant became operational at Ramlakhan Rice Mill, Ex-Mouth, on the Essequibo Coast. The mill is presently meeting 70% of its energy from the gasification plant and 30% from diesel. Around 600 kg of rice husk are required to fuel the 250 kW power generating set that replaces 70% of the diesel required to run the diesel genset. CO2-eq emissions have been reduced accordingly.Source: Ganesh, 2015
OPPORTUNITIES FOR AGRI-FOOD CHAINS TO BECOME ENERGY-SMART130
RIC
E V
ALU
E C
HA
IN
Solar water heaters are used to preheat boiler feed water and hence reduces the consumption of heating fuel. The use of preheated water improves the efficiency and time required for steam generation. Solar drying systems can also be utilized for parboiling rice before the milling process. Depending on location, approximately 2% to 53% of fuel consumption reduction is possible using solar water heating systems. Where suitable rivers and streams are available micro-hydro power generation may be possible. For example, the Mekong region has a number of irrigation canals and streams which are currently used as sources for small and micro hydro power generation schemes even though they have a relatively low head. The electricity generated can be used for as applications similar to solar power with the advantage that it is generated for 24 hours a day and all year round unless the stream flow changes with the seasons. Compared to solar PV and biomass to electricity, micro-hydro may be less capital intensive. Small scale farmers can easily generate electricity not only for on-farm use but also for their household activities.
4.4. SUMMARY OF KEY ENERGY INTERVENTIONS
Key energy interventions specific to the rice chain that can be technically and economically viable are:
• use of rice husk gasification to produce heat and electricity for rice mills;
• improvement of efficiency of husk powered furnaces designed to reduce air, water and land pollution;
• use of husk residue left after gasification for other purposes depending on the carbon/ash content; and
• development of solar thermal and renewable electricity systems for use in both on-farm pumping, drying and in milling activities.
The priority entry points along the value chain where interventions should be targeted are:
• fertilizer and water use on farm;
• for parboiling rice, efficiency in production and use of thermal energy in boilers and drying; and

OPPORTUNITIES FOR AGRI-FOOD CHAINS TO BECOME ENERGY-SMART 131
RIC
E V
ALU
E C
HA
IN
• efficient use of electricity in milling process by installing energy efficient motors, increasing efficiency in production and use of compressed air, minimizing low load operations and using variable speed drive with motors where appropriate.
A two pronged strategy for energy saving in a rice value chain is required which leads to overall resource efficiency. The first is to increase water and energy efficiency both on the farm and in the milling station, and second by using renewable energy. Water use and other external inputs can be reduced by measuring and matching the actual water and fertilizer use to crop requirement and increasing nitrogen use efficiency.
SRI practices focus on increasing rice yield while at the same time reducing the use of water and other resources. It also encourages the use of organic manure or vermicomposting as a means to providing nutrients to the soil. Water use is minimized by keeping the soils moist rather than flooding to minimize anaerobic conditions and increase soil organism diversity. This could also reduce methane emissions.
Solar electricity and heat can be used in the field as well as in rice mills at both large and small scale (Case Studies 4.4 and 4.5) for:
• water pumping to support irrigation and reduce dependence on grid electricity or fossil fuels;
• drying of paddy by direct solar heat or driving fans and heating air; and
• powering electric motors, lighting, etc.
Direct and indirect energy use in rice production has impacts on rice yield. Fertilizer and other external inputs improve soil fertility resulting in increased rice yield. Similarly,
CASE STUDY 4.4. SOLAR RICE HULLING VERSUS TRADITIONAL RICE HULLING IN A VILLAGE ENVIRONMENTAt the small scale rice hulling costs USD 0.50 to produce a 25 kg (0.02 USD/kg) bag of rice which lasts 12-25 days for an average family. Once transport costs are added, this can be 1 USD/bag or 0.04 USD/kg. A small village having a solar powered mill could reduce travel time to the large rice mill in a nearby town as well as transport costs. A 375W micro-rice mill can process 40 kg of rice per hour or 400-500 kg/week (8-10 bags), and so can serve 40-80 households if run for 2 hours/day. A PV powered solar rice mill with a battery and inverter costs around USD 1,150-1,800. More rice can be milled by increasing the number of solar panels Revenue can reach up to 10 USD/week, or USD 500-2,000 per year giving a 2-4 year payback period, or 3-6 years if the operator’s income is drawn from the gross revenue.Source: IRENA, 2014
OPPORTUNITIES FOR AGRI-FOOD CHAINS TO BECOME ENERGY-SMART132
RIC
E V
ALU
E C
HA
IN
water used in flooding prevents weed growth preventing any crop loss. At the same time, excess application of water and external chemical inputs in the long term can have negative environmental and ecosystem impacts including loss in soil fertility, water pollution, climate change, and the availability of finite resources like drinking and cooking water. A key success factor on which interventions can be assessed is by assessing the energy and water used per unit of rice produced in combination with the rice yield. Any intervention which causes a decrease in MJ of fossil energy consumed/kg of rice produced, or liters water consumed/kg of rice produced, without reducing productivity may be considered a successful intervention. Such interventions may not necessarily be oriented around the use of renewable energy, but also on improving energy use efficiency. For instance based on the local soil type, assessing the optimal amount of fertilizer application rates could prevent excessive fertilizer use thereby reducing indirect energy consumption. Similarly, reducing water use in flooding coupled with other sustainable weed prevention methods could reduce water use without affecting rice yield.
CASE STUDY 4.5. SOLAR RICE HULLING MILL IN PAPUA NEW GUINEAA 1 kW solar rice hulling mill was installed in Mahalang, Papua New Guinea (PNG). It uses a belt drive from an electric motor to run the mill. The electric motor runs from a battery and inverter system. Diesel powered rice mills of 200 kg/hour capacity are sold at approximately USD 3,000 in the local market with very high profit margins. The fuel operating cost is at least 1-3 USD/day to run, or 500-1,000 USD/year, and often more when mills are run more than 1 hour per day. Therefore, a 5-year total cost of ownership can easily total USD 5,000-8,000. In contrast, a 40-80 kg/hour slower solar rice mill may possibly be installed for as little as USD 3,000, giving an upfront similar price, but zero operational (fuel) costs. While this mill may be slower, it is appropriately sized for a village of 40-80 households, which is the typical size of a PNG village. Most diesel mills in PNG are oversized for their application, and some were installed for political rather than technical reasons.Source: IRENA, 2014
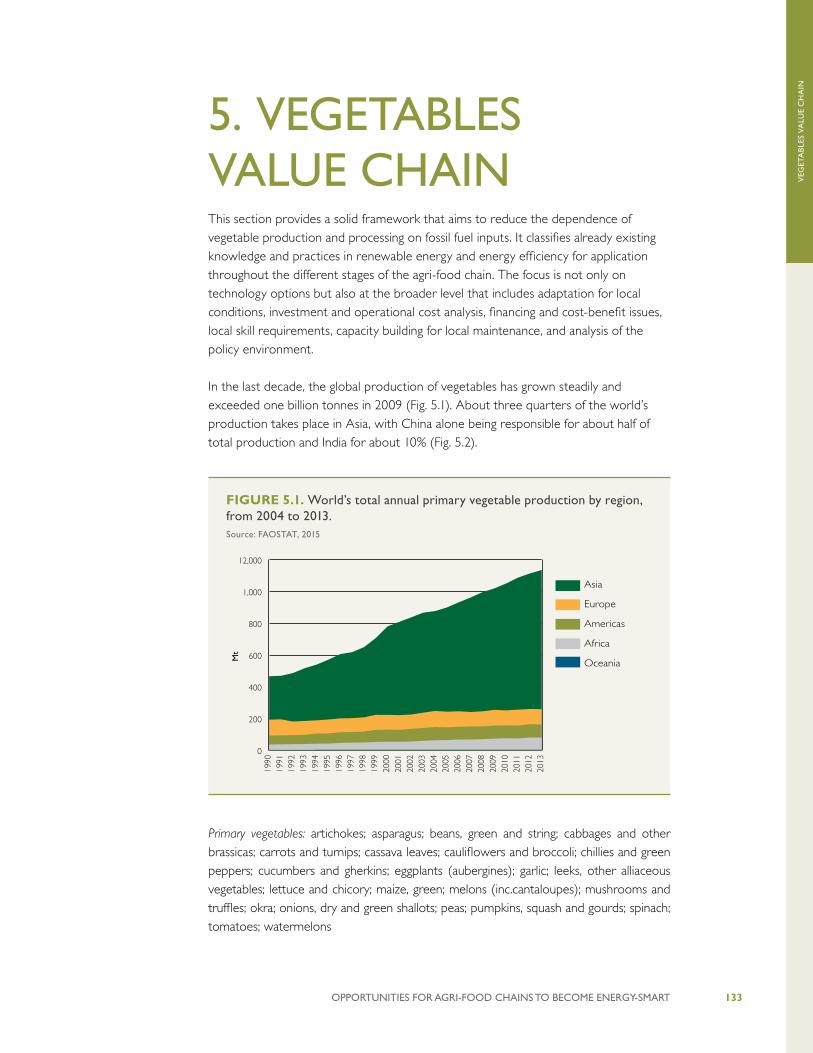
OPPORTUNITIES FOR AGRI-FOOD CHAINS TO BECOME ENERGY-SMART 133
VEG
ETA
BLE
S V
ALU
E C
HA
IN
5. VEGETABLES VALUE CHAINThis section provides a solid framework that aims to reduce the dependence of vegetable production and processing on fossil fuel inputs. It classifies already existing knowledge and practices in renewable energy and energy efficiency for application throughout the different stages of the agri-food chain. The focus is not only on technology options but also at the broader level that includes adaptation for local conditions, investment and operational cost analysis, financing and cost-benefit issues, local skill requirements, capacity building for local maintenance, and analysis of the policy environment.
In the last decade, the global production of vegetables has grown steadily and exceeded one billion tonnes in 2009 (Fig. 5.1). About three quarters of the world’s production takes place in Asia, with China alone being responsible for about half of total production and India for about 10% (Fig. 5.2).
Primary vegetables: artichokes; asparagus; beans, green and string; cabbages and other brassicas; carrots and turnips; cassava leaves; cauliflowers and broccoli; chillies and green peppers; cucumbers and gherkins; eggplants (aubergines); garlic; leeks, other alliaceous vegetables; lettuce and chicory; maize, green; melons (inc.cantaloupes); mushrooms and truffles; okra; onions, dry and green shallots; peas; pumpkins, squash and gourds; spinach; tomatoes; watermelons
FIGURE 5.1. World’s total annual primary vegetable production by region, from 2004 to 2013.Source: FAOSTAT, 2015
0
200
400
600
800
1,000
12,000
Asia
Europe
Americas
Africa
Oceania
2013
2012
2011
2010
2009
2008
2007
2006
2005
2004
2003
2002
2001
2000
1999
1998
1997
1996
1995
1994
1993
1992
1991
1990
Mt

OPPORTUNITIES FOR AGRI-FOOD CHAINS TO BECOME ENERGY-SMART134
VEG
ETA
BLE
S V
ALU
E C
HA
IN
For each kind of vegetable, their production and value chains vary widely according to the specific regional characteristics and the harvesting method (e.g. manual, picking platforms, fully automatic harvesters, mobile packing sheds). Worldwide, the most produced vegetable commodities are tomatoes, watermelon, onions, cabbage and other brassicas, cucumbers, and gherkins (Fig. 5.3).
In particular, a focus of this study is the value chain of three vegetable types, selected for their widespread production, nutritional value, and suitability for further processing (e.g. canning, drying, cooling, and deep freezing):
FIGURE 5.2. Share of total primary vegetable production by leading country, 2004 to 2013.Source: FAOSTAT, 2015
0%
10%
20%
30%
40%
50%
60%
OthersBrazilRep. of Korea
NigeriaJapanMexicoSpainItalyRussian Fed.
EgyptIran (IR)TurkeyUSAIndiaChina
FIGURE 5.3. World’s primary vegetable production by main item, from 2004 to 2013.Note: Other vegetables whose average production is less than 20 Mt per year are excluded.
Source: FAOSTAT, 2015
0
50
100
150
200
2013201220112010200920082007200620052004
Mt
String beans
Beans, green
Garlic
Pumpkins, squash and gourds
Lettuce and chicory
Chillies and peppers, green
Melons, other (inc.cantaloupes)
Carrots and turnips
Eggplants (aubergines)
Cucumbers and gherkins
Cabbages and other brassicas
Onions, dry
Watermelons
Tomatoes

OPPORTUNITIES FOR AGRI-FOOD CHAINS TO BECOME ENERGY-SMART 135
VEG
ETA
BLE
S V
ALU
E C
HA
IN
TABLE 5.1. Typical energy demand throughout vegetable value chain.
Diesel / Gasoline Electricity Natural Gas
PRODUCTION
Fertilizers ✔
Irrigation ✔ (pumps) ✔ (pumps)
Cultivation on Farm ✔ (machinery) ✔ (greenhouse) ✔ (heating greenhouses)
Harvesting ✔ (machinery)
STORAGE Storage/Refrigeration ✔
TRANSPORT Transport ✔ ✔
PROCESSING
Sanitizing/Cleaning ✔ ✔
Grading and Sorting ✔
Peeling/cutting ✔ ✔ (steam)
Blanching ✔ (boiler fuel) ✔ (heat) ✔ (heat)
Cooling ✔
Drying ✔ ✔ ✔
Freezing ✔
PACKAGING
Can filling ✔
Can exhausting ✔ (heat) ✔ ✔ (heat)
Can sealing ✔
Heat sterilization ✔ ✔ ✔
Packaging ✔
• tomatoes: field or greenhouse (heated or unheated) grown; manual or mechanical harvesting; sold fresh, canned, bottled or dried; used in a wide range of processed foods;
• beans46: green and dry beans and other pulses; manual or mechanical harvesting; wide range of uses including fresh, frozen or dried; and
• carrots: root crop; manual or automatic harvesting; fresh, canned, frozen.
The main energy demands throughout the value chain of fresh and processed vegetables occur in the production and processing stages (Table 5.1). The demand for energy and water inputs varies according to: the vegetable type; the method of production (e.g. greenhouse, open field, organic system); the type of harvesting, transport, processing and packaging (e.g. manual, mechanized, automated); the scale of production (small farmer to corporate agri-business); and the differences in local conditions (water availability and provision, climate, seasonal events, infrastructure, access to market and land). In particular, differences in energy requirements are found between fresh vegetables vis-à-vis processed products, particularly where these are transported over medium to long distances (Section 2.4.7) whereas fresh vegetables are usually sold at local markets.
46. There are many types of beans, but, according to FAOSTAT, only green beans (including string beans) are primary vegetables. Dried beans are numerous and classified as “pulses”, defined by FAO as “crops harvested solely for consumption as dried products”.
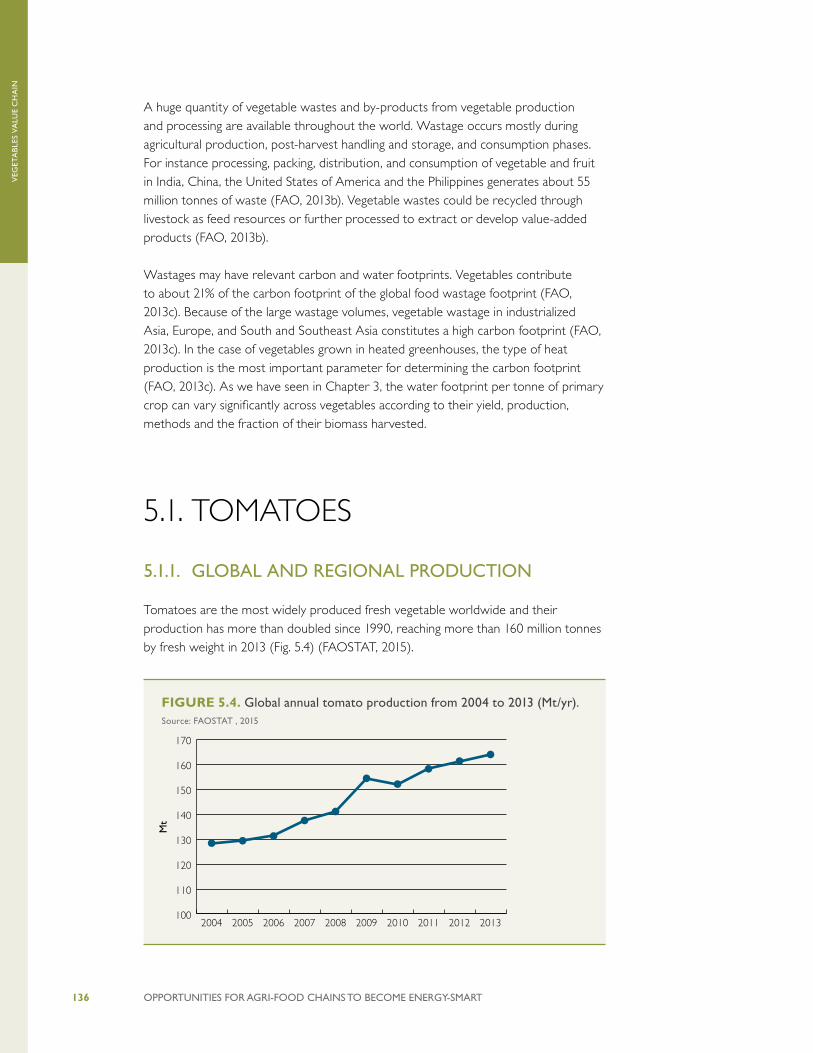
OPPORTUNITIES FOR AGRI-FOOD CHAINS TO BECOME ENERGY-SMART136
VEG
ETA
BLE
S V
ALU
E C
HA
IN
A huge quantity of vegetable wastes and by-products from vegetable production and processing are available throughout the world. Wastage occurs mostly during agricultural production, post-harvest handling and storage, and consumption phases. For instance processing, packing, distribution, and consumption of vegetable and fruit in India, China, the United States of America and the Philippines generates about 55 million tonnes of waste (FAO, 2013b). Vegetable wastes could be recycled through livestock as feed resources or further processed to extract or develop value-added products (FAO, 2013b).
Wastages may have relevant carbon and water footprints. Vegetables contribute to about 21% of the carbon footprint of the global food wastage footprint (FAO, 2013c). Because of the large wastage volumes, vegetable wastage in industrialized Asia, Europe, and South and Southeast Asia constitutes a high carbon footprint (FAO, 2013c). In the case of vegetables grown in heated greenhouses, the type of heat production is the most important parameter for determining the carbon footprint (FAO, 2013c). As we have seen in Chapter 3, the water footprint per tonne of primary crop can vary significantly across vegetables according to their yield, production, methods and the fraction of their biomass harvested.
5.1. TOMATOES
5.1.1. GLOBAL AND REGIONAL PRODUCTION
Tomatoes are the most widely produced fresh vegetable worldwide and their production has more than doubled since 1990, reaching more than 160 million tonnes by fresh weight in 2013 (Fig. 5.4) (FAOSTAT, 2015).
FIGURE 5.4. Global annual tomato production from 2004 to 2013 (Mt/yr).Source: FAOSTAT , 2015
100
110
120
130
140
150
160
170 World
2013201220112010200920082007200620052004
Mt

OPPORTUNITIES FOR AGRI-FOOD CHAINS TO BECOME ENERGY-SMART 137
VEG
ETA
BLE
S V
ALU
E C
HA
IN
Tomatoes are also a widely processed vegetable since they can be dried, canned, bottled, juiced, etc. and many food products include them as a component such as sauces, ketchup, pastes, salsas, and pizzas. For instance, in the USA fruit and vegetable canneries sector, tomato-based items represent the most important product from an economic perspective and accounted for over USD 5.5 billion in product shipments in 2002 (U.S. Census Bureau, 2004).
FAO data on production and trade show that 3.5 Mt of tomato paste was produced in 2011, 2 Mt of peeled tomatoes, and 0.4 Mt of tomato juice (Fig. 5.5).
There are many tomato varieties roughly divided by shape and size (e.g. “slicing” or “globe”, plum or paste, beefsteak, oxheart, pear, cherry, grape, and campari). These varieties are widely produced across many regions and climates and can be grown using several different techniques. All the operations from planting to processing can be accomplished manually or mechanically at different scales. Moreover, the production of tomatoes off-season often takes place in heated greenhouses, which have a high energy requirement. Production also differs according to the organic or conventional production techniques adopted.
Asia is globally the main tomato producing region with over 100 Mt/yr (Fig. 5.6) which is more than a quarter of global production. The first ten largest producer countries together generate about half of the world’s tomato supply (Fig. 5.7) (FAOSTAT, 2015). In many of these countries, the production of tomatoes takes place at a small scale grown on small family farms (Hatirli et al., 2006).
FIGURE 5.5. Global production of major tomato-based products, from 2001 to 2011.Source: FAOSTAT, 2015
Mt
0
0.5
1
1.5
2
2.5
3
3.5
4Peeled
Paste
Juice
20112010200920082007200620052004200320022001

OPPORTUNITIES FOR AGRI-FOOD CHAINS TO BECOME ENERGY-SMART138
VEG
ETA
BLE
S V
ALU
E C
HA
IN
The main producers of tomato paste and peeled tomatoes are China plus countries from the Mediterranean area and Latin and Central America, whereas Canada, Europe, and Japan are the world’s leaders in the production of tomato juice (FAOSTAT, 2015).
FIGURE 5.6. Fresh tomato annual production by region from 2004 to 2013.Source: FAOSTAT, 2015
0
20
40
60
80
100 Oceania
Europe
Asia
Americas
Africa
2013201220112010200920082007200620052004
Mt
FIGURE 5.7. Fresh tomato production by country from 2004 to 2013.Source: FAOSTAT, 2015
0
100
200
300
400
500
600
700
Others RussianFed.
MexicoBrazilSpainIranItalyEgyptTurkeyIndiaUSAChina
Mt
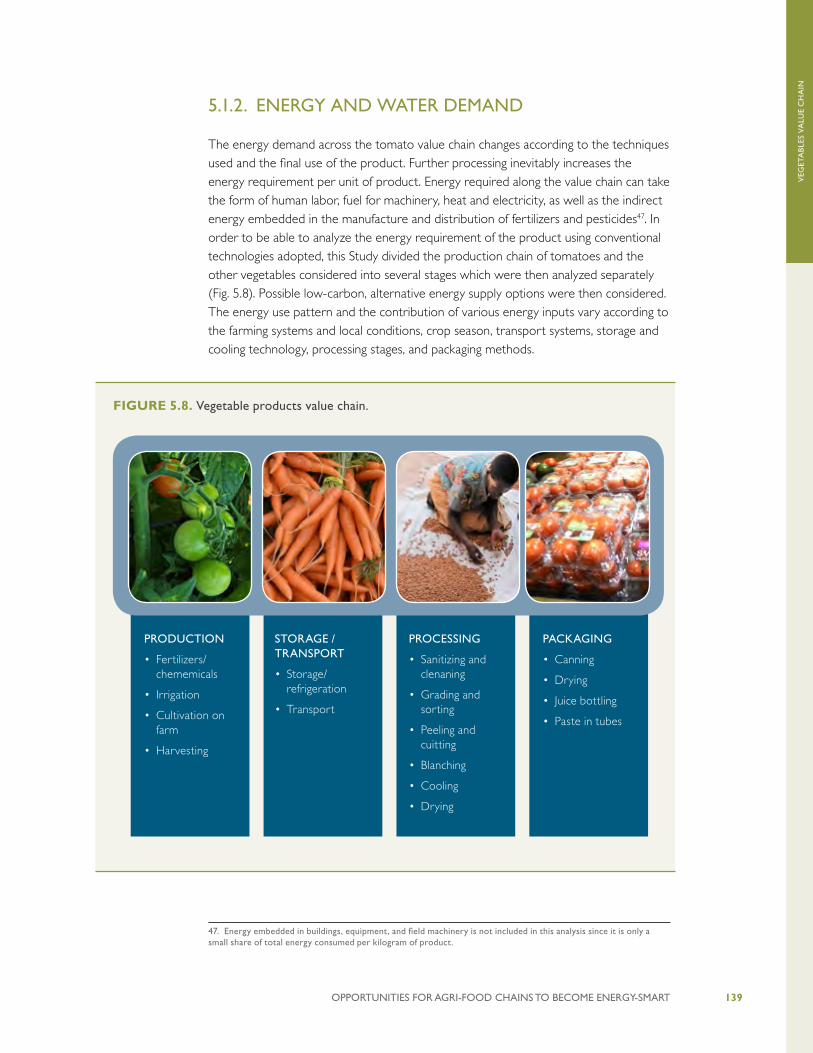
OPPORTUNITIES FOR AGRI-FOOD CHAINS TO BECOME ENERGY-SMART 139
VEG
ETA
BLE
S V
ALU
E C
HA
IN
5.1.2. ENERGY AND WATER DEMAND
The energy demand across the tomato value chain changes according to the techniques used and the final use of the product. Further processing inevitably increases the energy requirement per unit of product. Energy required along the value chain can take the form of human labor, fuel for machinery, heat and electricity, as well as the indirect energy embedded in the manufacture and distribution of fertilizers and pesticides47. In order to be able to analyze the energy requirement of the product using conventional technologies adopted, this Study divided the production chain of tomatoes and the other vegetables considered into several stages which were then analyzed separately (Fig. 5.8). Possible low-carbon, alternative energy supply options were then considered. The energy use pattern and the contribution of various energy inputs vary according to the farming systems and local conditions, crop season, transport systems, storage and cooling technology, processing stages, and packaging methods.
47. Energy embedded in buildings, equipment, and field machinery is not included in this analysis since it is only a small share of total energy consumed per kilogram of product.
FIGURE 5.8. Vegetable products value chain.
PRODUCTION
• Fertilizers/chememicals
• Irrigation
• Cultivation on farm
• Harvesting
STORAGE / TRANSPORT
• Storage/refrigeration
• Transport
PROCESSING
• Sanitizing and clenaning
• Grading and sorting
• Peeling and cuitting
• Blanching
• Cooling
• Drying
PACKAGING
• Canning
• Drying
• Juice bottling
• Paste in tubes
OPPORTUNITIES FOR AGRI-FOOD CHAINS TO BECOME ENERGY-SMART140
VEG
ETA
BLE
S V
ALU
E C
HA
IN
Production
Tomatoes can be grown in the field and harvested manually with repeated harvests as they continue to ripen or on a large scale they can be machine harvested to reduce labor inputs. To extend the growing season, tomatoes may be grown in greenhouses. Typically, houses with glass or plastic cladding are heated using natural gas, coal, diesel fueled boilers, or electricity (Foster et al., 2006). To produce 1 kg of tomatoes the required energy input can vary from 20 MJ/kg to 45 MJ/kg (Sims, 2014). An Australian Study showed that 40% to 90% of the energy input per kg of greenhouse tomato goes to artificial heating, depending on the technology (Case Study 5.1; Page et al., unpublished). Artificial lighting (Case Study 5.2) and
CASE STUDY 5.1. HEATING TOMATO GREENHOUSES WITH BIOMASSTwo greenhouse tomato growers in Gippsland, Australia have decided to move away from coal and invest in a biomass heating plant to meet their thermal energy demand. The 2 MW biomass plant combusts wood chips, bark, and sawdust sourced from nearby sawmills and timber processing industries to produce thermal energy to heat around 200,000 liters of water stored in an insulated tank. This is used as a buffer to heat the high-tech glasshouses that grow the tomato crops using a hydroponic system. By substituting biomass for brown coal briquettes, the growers have more than halved the energy cost and significantly reduced their greenhouse gas emissions by an estimated 150,000 kt CO2-eq over a 25 year lifetime. The estimated annual heating costs using biomass to heat a typical two hectare glasshouse are around 55% less than the USD 280,000 if using coal briquettes, 65% less than if using natural gas and 85% cheaper than LPG. The Austrian-made bioenergy system can handle biomass with a moisture content up to 60% without loss of efficiency.Source: Practical Hydroponics & Greenhouses. September 2014. 3 http://www.polytechnik.com/DE/assets/phg-sep2014---gippsland-growers-go-green.pdf
CASE STUDY 5.2. LIGHTING TECHNOLOGY IN GREENHOUSESLighting in greenhouses is a high energy input in advanced systems. An innovative lighting technology is produced by a company called Biolumic Ltd to control food and crop quality and productivity. The system delivers precise UV recipes and devices to apply treatments to a range of different crops. The technology can be used to grow crops indoors or to prime plants grown outdoors to grow better later in life.
According to the company, UV treatments can protect plants from stress and improve resistance to disease, while increasing yields and improving quality. UV radiation would improve plant hardiness and increase healthy compaction of plant growth habits, which can increase planting density.
Moreover, it is stated that specific UV recipes and treatments would induce systemic plant resistance to key pathogens, and insect feeding deterrence in seedlings.
Source: Biolumic Ltd. (http://www.biolumic.com/Products.html)
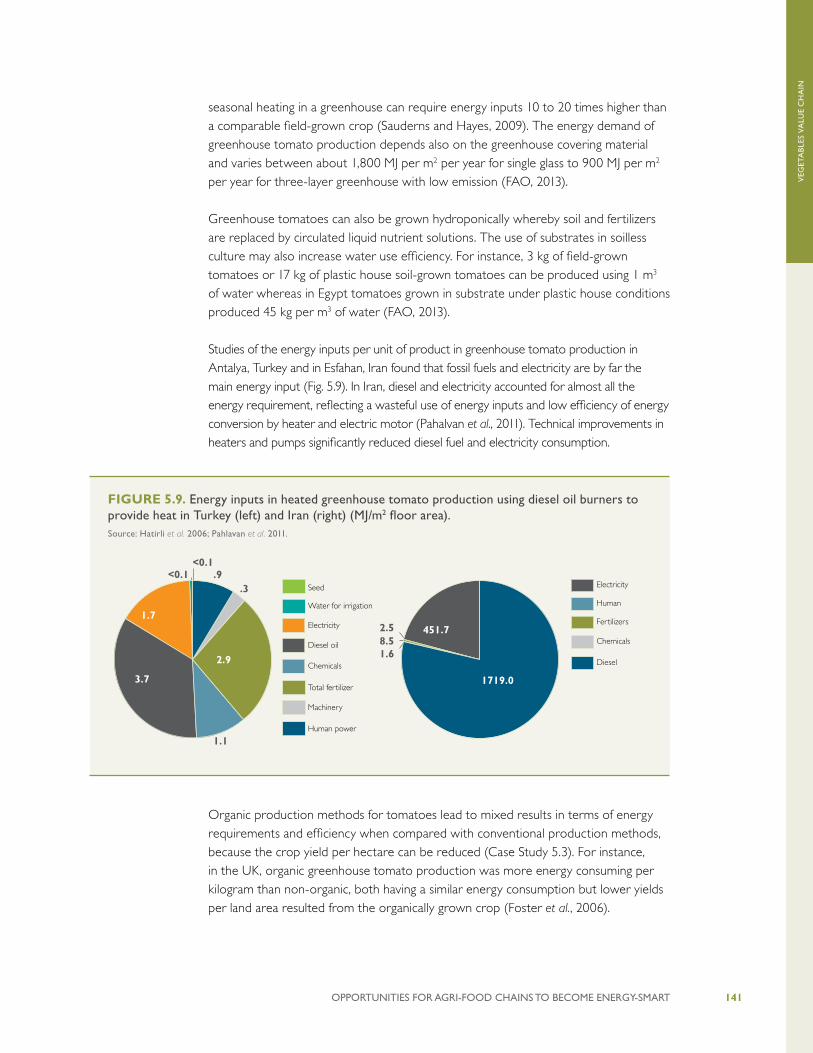
OPPORTUNITIES FOR AGRI-FOOD CHAINS TO BECOME ENERGY-SMART 141
VEG
ETA
BLE
S V
ALU
E C
HA
IN
seasonal heating in a greenhouse can require energy inputs 10 to 20 times higher than a comparable field-grown crop (Sauderns and Hayes, 2009). The energy demand of greenhouse tomato production depends also on the greenhouse covering material and varies between about 1,800 MJ per m2 per year for single glass to 900 MJ per m2 per year for three-layer greenhouse with low emission (FAO, 2013).
Greenhouse tomatoes can also be grown hydroponically whereby soil and fertilizers are replaced by circulated liquid nutrient solutions. The use of substrates in soilless culture may also increase water use efficiency. For instance, 3 kg of field-grown tomatoes or 17 kg of plastic house soil-grown tomatoes can be produced using 1 m3 of water whereas in Egypt tomatoes grown in substrate under plastic house conditions produced 45 kg per m3 of water (FAO, 2013).
Studies of the energy inputs per unit of product in greenhouse tomato production in Antalya, Turkey and in Esfahan, Iran found that fossil fuels and electricity are by far the main energy input (Fig. 5.9). In Iran, diesel and electricity accounted for almost all the energy requirement, reflecting a wasteful use of energy inputs and low efficiency of energy conversion by heater and electric motor (Pahalvan et al., 2011). Technical improvements in heaters and pumps significantly reduced diesel fuel and electricity consumption.
Organic production methods for tomatoes lead to mixed results in terms of energy requirements and efficiency when compared with conventional production methods, because the crop yield per hectare can be reduced (Case Study 5.3). For instance, in the UK, organic greenhouse tomato production was more energy consuming per kilogram than non-organic, both having a similar energy consumption but lower yields per land area resulted from the organically grown crop (Foster et al., 2006).
FIGURE 5.9. Energy inputs in heated greenhouse tomato production using diesel oil burners to provide heat in Turkey (left) and Iran (right) (MJ/m2 floor area).Source: Hatirli et al. 2006; Pahlavan et al. 2011.
Seed
Water for irrigation
Electricity
Diesel oil
Chemicals
Total fertilizer
Machinery
Human power
1.7
2.9
3.7
1.1
.9<0.1<0.1
.3 Electricity
Human
Fertilizers
Chemicals
Diesel
451.7
1719.0
2.58.51.6
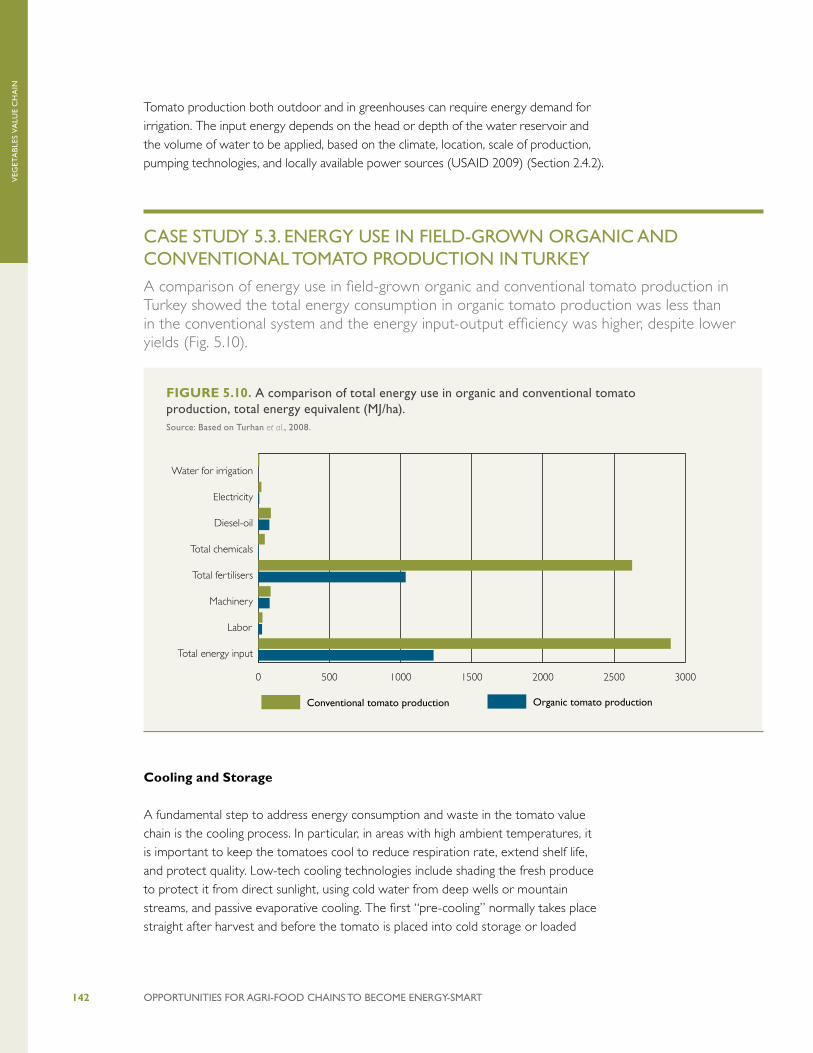
OPPORTUNITIES FOR AGRI-FOOD CHAINS TO BECOME ENERGY-SMART142
VEG
ETA
BLE
S V
ALU
E C
HA
IN
Tomato production both outdoor and in greenhouses can require energy demand for irrigation. The input energy depends on the head or depth of the water reservoir and the volume of water to be applied, based on the climate, location, scale of production, pumping technologies, and locally available power sources (USAID 2009) (Section 2.4.2).
CASE STUDY 5.3. ENERGY USE IN FIELD-GROWN ORGANIC AND CONVENTIONAL TOMATO PRODUCTION IN TURKEYA comparison of energy use in field-grown organic and conventional tomato production in Turkey showed the total energy consumption in organic tomato production was less than in the conventional system and the energy input-output efficiency was higher, despite lower yields (Fig. 5.10).
Cooling and Storage
A fundamental step to address energy consumption and waste in the tomato value chain is the cooling process. In particular, in areas with high ambient temperatures, it is important to keep the tomatoes cool to reduce respiration rate, extend shelf life, and protect quality. Low-tech cooling technologies include shading the fresh produce to protect it from direct sunlight, using cold water from deep wells or mountain streams, and passive evaporative cooling. The first “pre-cooling” normally takes place straight after harvest and before the tomato is placed into cold storage or loaded
FIGURE 5.10. A comparison of total energy use in organic and conventional tomato production, total energy equivalent (MJ/ha).Source: Based on Turhan et al., 2008.
0 500 1000 1500 2000 2500 3000
Organic tomato productionConventional tomato production
Total energy input
Labor
Machinery
Total fertilisers
Total chemicals
Diesel-oil
Electricity
Water for irrigation
OPPORTUNITIES FOR AGRI-FOOD CHAINS TO BECOME ENERGY-SMART 143
VEG
ETA
BLE
S V
ALU
E C
HA
IN
for transport (USAID, 2009). Pre-cooling from around 35°C to 15°C can extend the post-harvest lifetime of a tomato from 3 days to 14 days (USAID, 2009). Keeping the produce cool can therefore reduce waste in a significant way and for relatively low energy consumption (Section 2.2.4). For instance, a packinghouse can be cooled just by wetting the walls or by using porous materials at one end, which provides passive cooling via water evaporation when moisture laden air is pulled from inside the building by a small ventilation fan (USAID, 2009). More innovative technologies are also under development (Case Study 5.4).
Transport
Transport occurs several times within the tomato value chain: from the field to the packinghouse; from the packinghouse to the cold storage or processing site; and to the market (USDA, 2009). The total energy demand changes according to the transport method and distance. For instance, a Study of non-refrigerated food transport in Europe showed that freight transport of fresh products by small vans or by air can be ten times more energy consuming per unit of product than if transported by water, rail or large truck (van Essen et al., 2003) (Section 2.4.7).
CASE STUDY 5.4. COLD CHAIN DEVELOPMENT IN EMERGING ECONOMIES Refrigeration technologies using liquid air have been adopted in Tanzania to store and transport fresh tomatoes and other vegetables and fruits. A recent survey of stakeholders in value chains for high value commodities such as tomatoes and other vegetables and fruits in Tanzania found that more than 56% of respondents identified the lack of storage options, especially cold storage, as their most common constraint (Chemonics, 2013). Therefore, there is good potential for value addition and/or waste reduction by using liquid air based cooling/freezing technologies when moving crops to markets. For example, tomatoes and mangos are handled in great quantities, often without any refrigeration. Investments in the cold chain, especially when handling such higher value crops, can be profitable. For instance, tomatoes, as well as red capsicum peppers, can be priced at up to 10 times the value of green tomatoes and peppers, but if they are not kept refrigerated they have a much shorter shelf life since they are harvested at a ripe stage. Pre-cooling tomatoes and other crops in a liquid air powered refrigerated container prior to or during transportation to marketplace delivers fresher, higher quality products, reduces losses and so ensures higher returns, even when the market price remains the same. Liquid air can provide pre-cooling to 18°C in transit, and transporting 6 tonnes of tomatoes for ten hours with liquid air would be 25% cheaper than the diesel option.Source: Kitinoja, 2014
OPPORTUNITIES FOR AGRI-FOOD CHAINS TO BECOME ENERGY-SMART144
VEG
ETA
BLE
S V
ALU
E C
HA
IN
For tomatoes field-produced in Queensland, Australia, 65% of the total energy consumed per kg was for transport, with fertilizers, pesticides, tractor diesel, packaging, and electricity making up the rest (Page et al., unpublished). Similarly, transporting tomatoes to New Hampshire, USA, from Canada by road accounted for 40% to 60% of the total energy input in the tomato lifecycle (Pydynkowski et al., 2008). Production, packaging, storage and disposal accounted for the remaining energy inputs.
In developing countries with poor roads and infrastructure, long-distance travel can be restricted therefore the energy used in transport is often much lower. On the other hand, for fresh tomatoes and other vegetables more difficult access to market may imply higher waste due to the deterioration of the product on route.
Processing
The energy consumed in tomato processing depends on the final use of the commodity. If the tomato is sold fresh to the market, the only processes it will go through are washing and, possibly, grading and sorting. The industrial processes applied to tomatoes and other fruits and vegetables can be categorized as preservation to prepare food for end-use consumption (heating, drying, refrigeration/freezing), and non-preservation processes, such as peeling, chopping, cutting, packaging and waste management (Lung et al., 2006). In the US food processing industry, process heat and steam production each accounted for about one third of the total energy input (Section 2.4.8).
Tomatoes can be peeled, canned, frozen, or processed to paste, juice, sauce, or as a base for other products, such as ketchup. In all cases the initial treatment is cleaning and sanitizing, which can be done at different scales using different techniques, but normally involving hot water (Section 2.2.3). Hot treatments vary according to the commodity, but typically are at temperatures around 40°C to 52°C for 2 to 5 minutes, followed by ice baths which quickly reduce temperature. The energy requirement for raising the water temperature depends on the amount of water used, on the ambient temperature and on the required hot water temperature. For instance, 9.2 kWh to 14.7 kWh of electricity are required to raise 400 L of water from ambient temperatures of 20°C to 25°C via resistance heaters. Cooling after hot water treatment may require another 27 kWh to 67 kWh for every tonne of product (USAID, 2009). Solar water heating can substantially reduce the electricity or propane requirements, saving 80% to 90% of the fuel that would otherwise be required (USAID, 2009).
Grading and sorting of tomatoes can be done manually in small to medium scale production facilities or mechanically at larger scale using conveyor systems in a packhouse and automatic grading by size and color. Simple conveyor-type sizing machines such as diverging bar roller sizers or belt sizers, typically require 0.75 kW to 1.5 kW of electric motor power (USAID, 2009).
OPPORTUNITIES FOR AGRI-FOOD CHAINS TO BECOME ENERGY-SMART 145
VEG
ETA
BLE
S V
ALU
E C
HA
IN
Where tomatoes are further processed more energy input is required. If tomatoes are to be canned, diced, or transformed into tomato juice, paste, or sauce, after grading and sorting they are typically washed, sorted by color (either manually or automatically to remove green tomatoes), and peeled by using steam. Red tomatoes which are not sufficiently peeled are then sorted manually and sent to pulping, together with green tomatoes previously discarded. Green and unpeeled tomatoes are crushed by the pulper together with pulping waste from the dicer. Then, the tomato slurry proceeds to the evaporator for concentration into paste, juice, and puree. The evaporated product is continuously sterilized until it is packed. Peeled red tomatoes are diced and filled into cans using rotary brush fillers. The canned diced tomatoes are then exhausted, sealed, sterilized, and cooled. These processes have high requirements of steam (for blanching, cooking, brine heating, can exhausting, sealing, heat sterilization), hot water (for product and can washing), and electricity (for inspection and grading, washing, cutting and slicing, peeling, pulping, cooling, can filling and sealing) (US EPA, 2008). For instance, tomato ketchup requires about 380 MJ of electricity and 1,700 MJ of heat per tonne of product (Wang, 2014). Tomato juice requires around 125 MJ of electricity and 4,800 MJ of fuels for heat per tonne (Wang, 2014). For frozen vegetables electricity is the most relevant energy component (Section 5.2.2).
Tomatoes and other fresh vegetables can be dried before packaging to extend their product shelf life and reduce post-harvest losses. More details on drying processes are given in Section 5.2.2 on beans, but Case Study 5.5 shows the potential use of geothermal energy to dry tomatoes.
Tomato processing, as for many vegetables, produces by-products and residues, such as product rejects, cores, culls, evaporated volatiles, peels, pulp, and seeds (UNIDO, 2014). Some solid wastes resulting from peeling, coring, and pulping, have high nutritional values and organic content which can be utilized for animal feed stock or in producing quality compost to replenish soil carbon stocks and nutrients (UNIDO 2014). Alternatively, the organic wastes can be used as feedstock in anaerobic digesters to produce biogas and sludge with a nutritional value (Section 2.5.2).
Packaging
Packaging has many uses, including the preservation of produce as well as a being a vehicle for marketing (Queensland State Government, 2010). It can be categorized as:
• primary packaging: that is used around the product at the point of sale e.g. bottles;
• secondary packaging: that groups the product until it is sold e.g. boxes; and
• tertiary packaging: that enables the product to be handled and transported without damage.

OPPORTUNITIES FOR AGRI-FOOD CHAINS TO BECOME ENERGY-SMART146
VEG
ETA
BLE
S V
ALU
E C
HA
IN
Packing can be done manually for small amounts of product or with the help of machines. Electricity use for packing is about 0.7 kWh/t (based on lemon and orange packing costs) (USAID, 2009). For packaging of less delicate commodities such as potatoes or carrots machine packing using automated weighing and bagging can be used.
Produce may be packed in several kinds of package such as wooden crates, bamboo baskets, plastic crates, plastic bags, or nylon sacks, and there are opportunities to increase the energy efficiency of such packaging. Some products require less energy and can be reused or fabricated from agricultural residues like long grasses, bagasse, paddy, cotton stalk, jute stick, wheat straw, and recycled paper and cardboard (APO, 2006).
Water demand
The concept of “water footprint” (Hoekstra and Chapagain, 2008) provides a framework to analyze the link between human consumption and the appropriation of freshwater. The water footprint of a product is expressed as water volume consumed
CASE STUDY 5.5. DRYING TOMATOES USING GEOTHERMAL HEATDrying of tomatoes and other produce is an important process to reduce waste and to ensure that nutritious food is available all year round and during droughts.
Low- to medium-enthalpy geothermal resources with temperatures less than 150°C can be used where available to provide heat because they have good potential for agricultural drying applications. The heat can be obtained from hot water or steam from geothermal wells or by recovering waste heat from a geothermal plant. When a good geothermal resource is available, using geothermal energy rather than oil, gas or electricity in food processing may reduce the costs significantly. Geothermal energy can be used to dry a wide range of food products, such as tomatoes, rice, and other cereals, onions, cotton, chillies, and garlic. The thermal energy required for tomato drying in Greece is 1,450 kWh per tonne (wet weight) (Andritsos et al., 2003), whereas for rice drying in Macedonia is 136 kWh per tonne (wet weight) (Popovski et al., 1992). The actual energy requirement for drying ultimately depends on the water content of the products.
In 2001, a small-scale tomato drying plant started operating in Nea Kessani, Xanthi, Greece. During the first year of operation, it produced 4 tonnes of high-quality dried-tomato products. Geothermal hot water at 59°C was used to dry tomatoes in a 14 m long rectangular tunnel dryer (1 m wide by 2 m high). First, tomatoes were sorted and washed, and then they were cut in half and placed onto stainless steel trays (100 cm2 by 50 cm2 meshes). Batches made of 25 trays of about 7 kg of fresh tomatoes each were dried for 45 minutes. The dried tomatoes were then immersed in olive oil and made ready for transport to the marketplace.
Source: FAO 2015
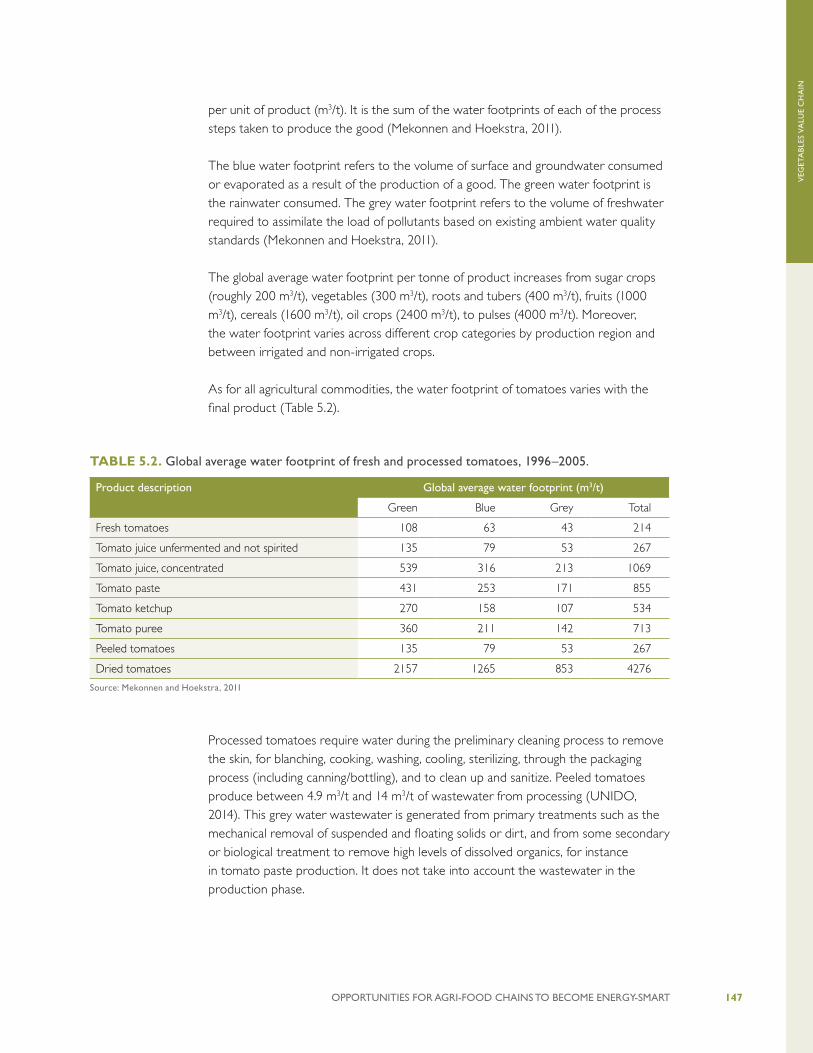
OPPORTUNITIES FOR AGRI-FOOD CHAINS TO BECOME ENERGY-SMART 147
VEG
ETA
BLE
S V
ALU
E C
HA
IN
TABLE 5.2. Global average water footprint of fresh and processed tomatoes, 1996–2005.
Product description Global average water footprint (m3/t)
Green Blue Grey Total
Fresh tomatoes 108 63 43 214
Tomato juice unfermented and not spirited 135 79 53 267
Tomato juice, concentrated 539 316 213 1069
Tomato paste 431 253 171 855
Tomato ketchup 270 158 107 534
Tomato puree 360 211 142 713
Peeled tomatoes 135 79 53 267
Dried tomatoes 2157 1265 853 4276
Source: Mekonnen and Hoekstra, 2011
per unit of product (m3/t). It is the sum of the water footprints of each of the process steps taken to produce the good (Mekonnen and Hoekstra, 2011).
The blue water footprint refers to the volume of surface and groundwater consumed or evaporated as a result of the production of a good. The green water footprint is the rainwater consumed. The grey water footprint refers to the volume of freshwater required to assimilate the load of pollutants based on existing ambient water quality standards (Mekonnen and Hoekstra, 2011).
The global average water footprint per tonne of product increases from sugar crops (roughly 200 m3/t), vegetables (300 m3/t), roots and tubers (400 m3/t), fruits (1000 m3/t), cereals (1600 m3/t), oil crops (2400 m3/t), to pulses (4000 m3/t). Moreover, the water footprint varies across different crop categories by production region and between irrigated and non-irrigated crops.
As for all agricultural commodities, the water footprint of tomatoes varies with the final product (Table 5.2).
Processed tomatoes require water during the preliminary cleaning process to remove the skin, for blanching, cooking, washing, cooling, sterilizing, through the packaging process (including canning/bottling), and to clean up and sanitize. Peeled tomatoes produce between 4.9 m3/t and 14 m3/t of wastewater from processing (UNIDO, 2014). This grey water wastewater is generated from primary treatments such as the mechanical removal of suspended and floating solids or dirt, and from some secondary or biological treatment to remove high levels of dissolved organics, for instance in tomato paste production. It does not take into account the wastewater in the production phase.
OPPORTUNITIES FOR AGRI-FOOD CHAINS TO BECOME ENERGY-SMART148
VEG
ETA
BLE
S V
ALU
E C
HA
IN
5.2. BEANS
5.2.1. GLOBAL AND REGIONAL PRODUCTION
Beans are an important vegetable crop which can be harvested and consumed fresh or dry. As stated earlier, there are several types of beans. Green beans (Phaseolus and Vigna species) are harvested in the pods at high moisture content and eaten whole. Dried beans are numerous and harvested solely for consumption as dried products, thereby excluding crops harvested green, crops used mainly for oil extraction (e.g. soybean and groundnuts), and leguminous crops (e.g. clover and alfalfa) used exclusively for seed. The dry bean category includes: all species of Phaseolus: kidney, haricot bean (Ph. vulgaris); lima, butter bean (Ph. lunatus); adzuki bean (Ph. angularis); mungo bean, golden, green gram (Ph. aureus); black gram, urd (Ph. mungo); scarlet runner bean (Ph. coccineus); rice bean (Ph. calcaratus); moth bean (Ph. aconitifolius); and tepary bean (Ph. Acutifolius). Some countries also include beans commonly classified as Vigna (angularis, mungo, radiata, conitifolia). Dry beans are also referred to as pulses, or edible legumes. The FAO definition of “pulses” includes dry beans and ten other primary pulses: dry broad beans; dry peas; chick-peas; dry cow peas; pigeon peas; lentils; bambara beans; vetches; lupins; and other pulses not elsewhere specified.
This report analyzes mainly the following green and dry beans, leaving aside all the other peas and pulses:
• green beans: Phaseolus and Vigna spp. for shelling;
• string beans: Phaseolus vulgaris; Vigna spp. eaten whole; and
• dry beans: including only species of Phaseolus48: kidney, haricot bean (Ph. vulgaris); lima, butter bean (Ph. lunatus); adzuki bean (Ph. angularis); mungo bean, golden, green gram (Ph. aureus); black gram, urd (Ph. mungo); scarlet runner bean (Ph. coccineus); rice bean (Ph. calcaratus); moth bean (Ph. aconitifolius); tepary bean (Ph. acutifolius).
Dry beans and pulses are fundamental for achieving food and nutritional security in developing countries. Food legumes complement cereal crops as a source of protein and minerals in dietary terms, while agronomically they are used as a rotation crop with cereals, since they help to fix atmospheric nitrogen in the soil, thereby reducing the need for inorganic nitrogenous fertilizers. They also contribute to breaking pest host cycles and to increasing biodiversity (UNIDO, 2014). Beans require high quantities of phosphorus and potassium, which can be obtained from inorganic fertilizers, but small amounts of nitrogen.
48. Several countries also include certain types of beans commonly classified as Vigna (angularis, mungo, radiata, aconitifolia). In the past, these species were also classified as Phaseolus.
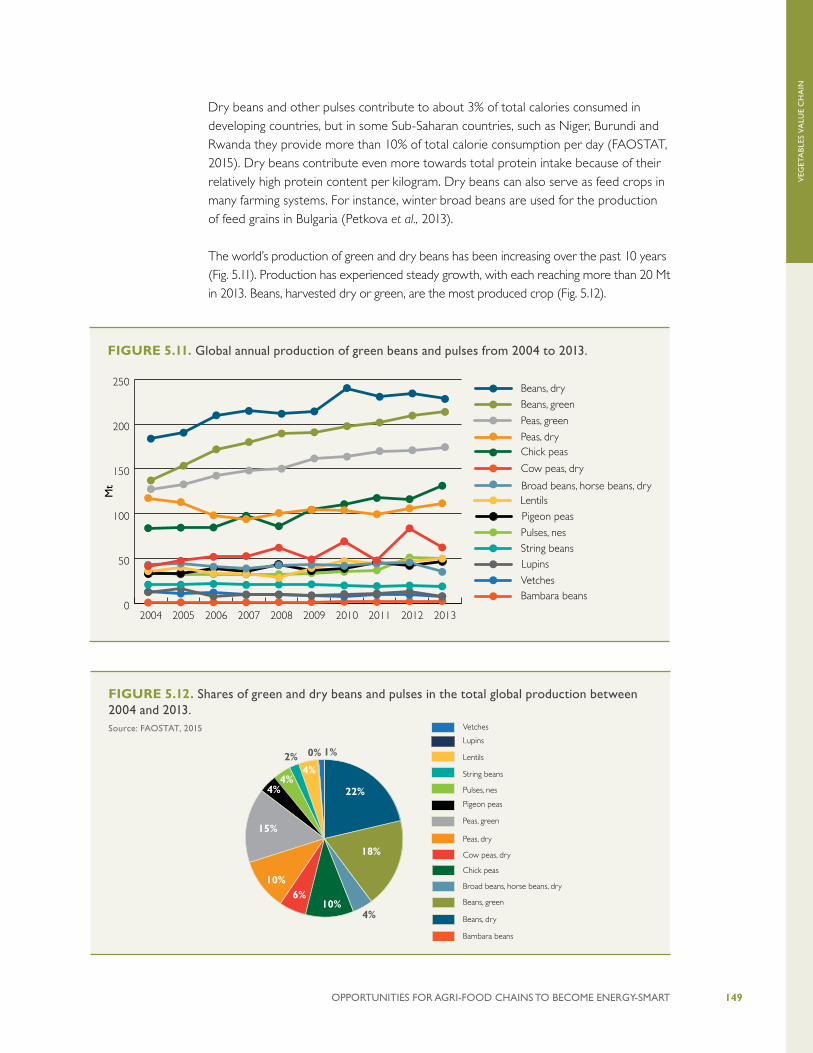
OPPORTUNITIES FOR AGRI-FOOD CHAINS TO BECOME ENERGY-SMART 149
VEG
ETA
BLE
S V
ALU
E C
HA
IN
Dry beans and other pulses contribute to about 3% of total calories consumed in developing countries, but in some Sub-Saharan countries, such as Niger, Burundi and Rwanda they provide more than 10% of total calorie consumption per day (FAOSTAT, 2015). Dry beans contribute even more towards total protein intake because of their relatively high protein content per kilogram. Dry beans can also serve as feed crops in many farming systems. For instance, winter broad beans are used for the production of feed grains in Bulgaria (Petkova et al., 2013).
The world’s production of green and dry beans has been increasing over the past 10 years (Fig. 5.11). Production has experienced steady growth, with each reaching more than 20 Mt in 2013. Beans, harvested dry or green, are the most produced crop (Fig. 5.12).
FIGURE 5.11. Global annual production of green beans and pulses from 2004 to 2013.
0
50
100
150
200
250
2013201220112010200920082007200620052004
Mt
Bambara beansVetches
LupinsString beansPulses, nes
Pigeon peas
LentilsBroad beans, horse beans, dry
Cow peas, dry
Chick peasPeas, dry
Peas, green
Beans, green
Beans, dry
FIGURE 5.12. Shares of green and dry beans and pulses in the total global production between 2004 and 2013.Source: FAOSTAT, 2015 Vetches
Lupins
Lentils
String beans
Pulses, nes
Pigeon peas
Peas, green
Peas, dry
Cow peas, dry
Chick peas
Broad beans, horse beans, dry
Beans, green
Beans, dry
Bambara beans
18%
10%6%
10%
15%
4%4%
4%2%
4%
0% 1%
22%
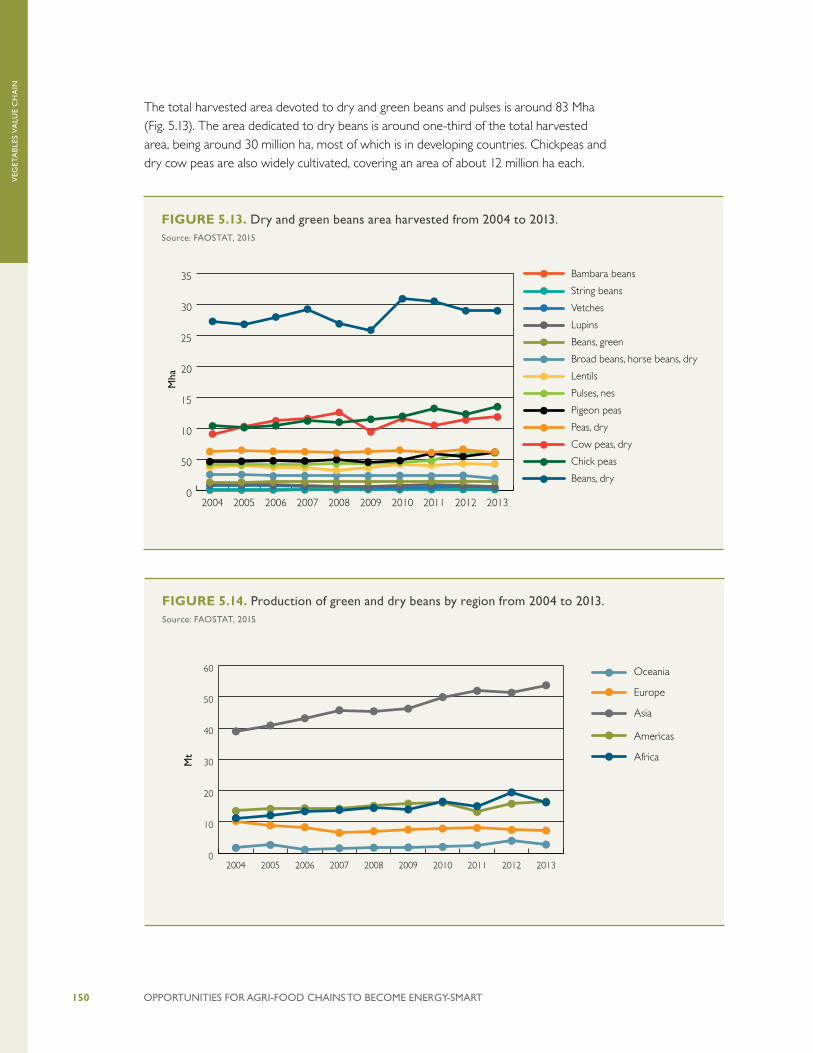
OPPORTUNITIES FOR AGRI-FOOD CHAINS TO BECOME ENERGY-SMART150
VEG
ETA
BLE
S V
ALU
E C
HA
IN
FIGURE 5.14. Production of green and dry beans by region from 2004 to 2013.Source: FAOSTAT, 2015
The total harvested area devoted to dry and green beans and pulses is around 83 Mha (Fig. 5.13). The area dedicated to dry beans is around one-third of the total harvested area, being around 30 million ha, most of which is in developing countries. Chickpeas and dry cow peas are also widely cultivated, covering an area of about 12 million ha each.
FIGURE 5.13. Dry and green beans area harvested from 2004 to 2013. Source: FAOSTAT, 2015
0
50
10
15
20
25
30
35
2013201220112010200920082007200620052004
Mha
Bambara beans
String beans
Vetches
Lupins
Beans, green
Broad beans, horse beans, dry
Lentils
Pulses, nes
Pigeon peas
Peas, dry
Cow peas, dry
Chick peas
Beans, dry
0
10
20
30
40
50
60 Oceania
Europe
Asia
Americas
Africa
2013201220112010200920082007200620052004
Mt
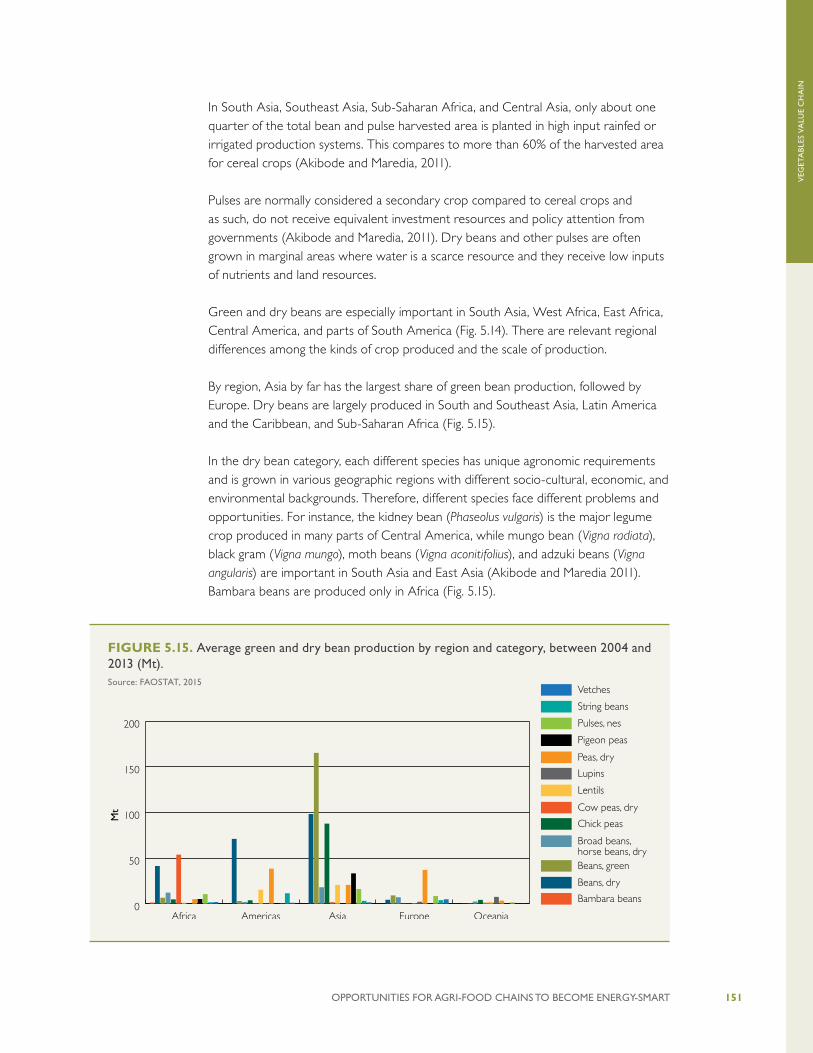
OPPORTUNITIES FOR AGRI-FOOD CHAINS TO BECOME ENERGY-SMART 151
VEG
ETA
BLE
S V
ALU
E C
HA
IN
In South Asia, Southeast Asia, Sub-Saharan Africa, and Central Asia, only about one quarter of the total bean and pulse harvested area is planted in high input rainfed or irrigated production systems. This compares to more than 60% of the harvested area for cereal crops (Akibode and Maredia, 2011).
Pulses are normally considered a secondary crop compared to cereal crops and as such, do not receive equivalent investment resources and policy attention from governments (Akibode and Maredia, 2011). Dry beans and other pulses are often grown in marginal areas where water is a scarce resource and they receive low inputs of nutrients and land resources.
Green and dry beans are especially important in South Asia, West Africa, East Africa, Central America, and parts of South America (Fig. 5.14). There are relevant regional differences among the kinds of crop produced and the scale of production.
By region, Asia by far has the largest share of green bean production, followed by Europe. Dry beans are largely produced in South and Southeast Asia, Latin America and the Caribbean, and Sub-Saharan Africa (Fig. 5.15).
In the dry bean category, each different species has unique agronomic requirements and is grown in various geographic regions with different socio-cultural, economic, and environmental backgrounds. Therefore, different species face different problems and opportunities. For instance, the kidney bean (Phaseolus vulgaris) is the major legume crop produced in many parts of Central America, while mungo bean (Vigna radiata), black gram (Vigna mungo), moth beans (Vigna aconitifolius), and adzuki beans (Vigna angularis) are important in South Asia and East Asia (Akibode and Maredia 2011). Bambara beans are produced only in Africa (Fig. 5.15).
FIGURE 5.15. Average green and dry bean production by region and category, between 2004 and 2013 (Mt).Source: FAOSTAT, 2015
Mt
0
50
100
150
200
Vetches
String beans
Pulses, nes
Pigeon peas
Peas, dry
Lupins
Lentils
Cow peas, dry
Chick peas
Broad beans, horse beans, dryBeans, green
Beans, dry
Bambara beans
OceaniaEuropeAsiaAmericasAfrica

OPPORTUNITIES FOR AGRI-FOOD CHAINS TO BECOME ENERGY-SMART152
VEG
ETA
BLE
S V
ALU
E C
HA
IN
The top country growers of dry beans and green beans in terms of area harvested in 2010 were India and China (Fig. 5.16). In 2010, the total harvested area for dry beans (31 Mha) was almost twenty times bigger than the total green beans area (1.5 Mha). India is the top dry bean grower in terms of land, and also grows the second biggest green bean area after China (Fig. 5.16). The second largest dry bean producer is Brazil, which represents 11% of the world’s total area harvested, followed by Myanmar (9%) and Mexico (5%). The eleven top producing countries cover about 80% of the total area under dry beans. The production of green beans is even more concentrated in Asia, with China alone accounting for almost 40% of the total global harvested area, followed by India (14%), Thailand (11%) and Indonesia (10%) (Fig. 5.16).
Different types of beans are more important in different countries. For instance, in India, Myanmar and Pakistan, black gram (urad) (Vigna mungo), mungo beans (Vigna radiata), and moth beans (Vigna aconitifolius) are the most relevant, while in China mungo beans and kidney beans are more important. In the majority of the Sub-Saharan African and Latin American and Caribbean countries the kidney bean (Ph. vulgaris) is most popular (Akibode and Maredia, 2011).
FIGURE 5.16. Dry and green bean producer countries ranked in terms of harvested area (dry beans in Mha, green beans in 1,000 ha), 2010.Source: FAOSTAT, 2015
0
2
4
6
8
10
12
Oth
ers
Keny
a
Ang
ola
Moz
ambi
que
USA
Chi
na
Uga
nda
Tanz
ania
Mex
ico
Mya
nmar
Braz
il
Indi
a
Mha
0
100
200
300
400
500
600
Oth
er
Serb
ia
Italy
Egyp
t
Ecua
dor
Turk
ey
Indo
nesia
Thai
land
Indi
a
Chi
na
1000
ha
Green BeansDry Beans

OPPORTUNITIES FOR AGRI-FOOD CHAINS TO BECOME ENERGY-SMART 153
VEG
ETA
BLE
S V
ALU
E C
HA
IN
5.2.2. ENERGY AND WATER DEMAND
Green beans, including string beans, are vegetables which can be consumed fresh, frozen, or dried naturally or artificially. Dry beans are processed in a similar manner to many other pulses and can then be stored for months.
Production
The cultivation of beans requires energy in the form of fuel for tractors and herbicides to prepare the field, to sow, weed control and plant protection, and fertilizer. Several kinds of bean also require support for the reed (Abeliotis et al., 2013), but these
CASE STUDY 5.6. BEAN PRODUCTION IN THE PRESPA NATIONAL PARK, GREECE Three different bean varieties (gigantes, elefantes, plake) grown by different cultivation techniques (conventional, integrated and organic) were compared to assess the energy inputs (Table 5.3). Organic systems had only potassium fertilizer added, but used more electricity and diesel and also around 10% more water per tonne of bean produced due to the lower yield per hectare.
Bean varieties with high inputs and high yields were environmentally preferable per tonne of produce, but low input, low yield varieties were preferable for land use. The integrated system reduced acidification and eutrophication impacts, whereas organic agricultural practices protected the global abiotic resources.
TABLE 5.3. Energy, nutrient and water inputs per tonne of beans produced.
Source: Abeliotis et al., 2013
Inputs Units Gigantesconventional
Gigantesintegrated
Gigantesorganic
Plakeconventional
Plakeintegrated
Plakeorganic
Elefantesintegrated
N fertilizer kg 18.22 3.65 – 33.30 2.13 – 1.31
P2O5 kg – 39.01 – – 51.03 – 5.11
K2O kg 66.36 36.88 24.91 97.18 34 74.40 3
Water ton 1423 1474 1594 1733 1626.5 1811 1371
Manure cattle ton – 1.51 1.88 – – 2.62 0.037
Manure sheep ton 4.06 – 4.13 4.98 0.58 7.1 0.138
Sea weeds ton – – 1.38 – – 4.69 –
Fungicides g 66.5 75.6 – 278.8 72.3 – –
Herbicides g 406.3 31.5 – 263.2 30.7 – 14.8
Insecticides g 146.4 84.6 – 296.6 107.9 – –
Sulphur g – – 127.8 – – 266.9 –
Electricity kWh 76 78 85 92 86 96 73
Diesel kg 24.9 25.8 28 30.3 28.4 32 24
Land occupation m2 a -1 3571.4 3703.7 3194.9 8695.7 4081.6 6578.9 3448.3

OPPORTUNITIES FOR AGRI-FOOD CHAINS TO BECOME ENERGY-SMART154
VEG
ETA
BLE
S V
ALU
E C
HA
IN
are not included here. Manure or fertilizer is normally applied every 2 to 3 years, depending on the soil (Abeliotis et al., 2013). Irrigation may be needed and can be facilitated by the creation of channels to avoid direct contact of the water with the plants or overhead sprinklers.
Soil preparation and harvesting can be done manually or mechanically, with very different energy requirements (Case Study 5.6). Modern, self-propelled harvesting machines can be used to harvest large bean plantations, but in developing countries this process on small plots is done manually or with the support of tractors and simple harvesting machines (Case Study 5.7).
CASE STUDY 5.7. CLUSTER BEAN CROP PRODUCTION IN INDIAThe total energy inputs used in farm operations for growing of cluster beans in India was around 3.3 GJ/ha, based on a survey of 58 farmers. This included manual and animal energy. Seedbed preparation was responsible for 36.6% of the total, followed by sowing (16.3%), irrigation (14.4%) and threshing (13.3%) (Fig. 5.17). Owing to drought conditions, most farmers used irrigation. Diesel contributed 48.0% of the total energy input, with fertilizers 11.4%. Electricity (5.6%) was mainly used for water pumping.
For the human energy input, men contributed mainly to seedbed preparation, sowing, bund making, irrigation, and fertilizer applications, whereas women were dominant in weeding, harvesting, threshing, and transport operations. Farmyard manure, combined with fertilizers contributed 19.9% of the total energy consumed in raising cluster beans.
Machinery
Chemicals
Fertilizers
Farmyard manure
Seeds
Electricity
Diesel
Animal
Human
11%
48%6%
8%
9%
13%
0%
4%1%
Post-harvest activity
Transport
Threshing
Harvesting
Spraying
Fertilizer application
Weeding
Irrigation
Bund making
Sowing
Seedbed preparation
13%
14%
6%
8% 37%
0%
0%
3%
2%
1%
16%
FIGURE 5.17. Energy inputs into cluster bean production in India.Source: Singh et al., 2003

OPPORTUNITIES FOR AGRI-FOOD CHAINS TO BECOME ENERGY-SMART 155
VEG
ETA
BLE
S V
ALU
E C
HA
IN
The energy and water requirements can change widely depending also upon the farm size (Case Study 5.8). The market price of fresh green beans is similar to that of dry beans by weight, but green beans are 90% water so they must be kept cool to prevent weight loss.
As for tomatoes, beans can also be cultivated in soilless culture systems, but being sensitive to salinity, recommended effective concentration values for nutrient solutions supplied to hydroponically grown beans must be relatively low (FAO 2013). Green beans can be grown in greenhouses to extend their growing calendars beyond the conventional open-air cultivation season (Section 5.1.2).
CASE STUDY 5.8. RED BEAN PRODUCTION IN KURDISTAN PROVINCE OF IRANFor red bean production, irrigation was the highest energy input per hectare regardless of the farm size, though smaller farms had a greater demand for water pumping per hectare (Fig. 5.18). Nitrogen fertilizers were also energy intensive at around 12 GJ/ha to15 GJ/ha, regardless of farm size.
FIGURE 5.18. Energy requirement for red bean production (MJ/ha).Note: Type 1 farm (T1) has a land size around 0.1 ha, T2 is 0.2 ha, T3 is 0.5 ha.
Source: Salami et al., 2009
Nature and Science, 2009;7(9) Salami, et al, The impact
T1 T1 T1
T1
T1
T1
T2 T2 T2
T2
T2
T2
T3 T3 T3
T3
T3
T3
0
10000
20000
30000
40000
50000
60000
70000
80000
90000
100000
Ener
gy e
quiv
alen
t
T1 1575.4 354.7 2129.1 13341.8 883.2 87256
T2 885.4 333.8 2107.1 13366.8 910.2 29967.7
T3 724.5 244.7 1720.3 15620 1186.4 24229.5
Labor Machinery Diesel fuel Nitrogen (N) Seeds Irrigation
Figure 2. The distribution of energy input (MJ 1ha− ) ratios in the red bean production.
Table 6. Total energy input in the form of direct, indirect, renewable and non-renewable for red bean production (MJ )1ha −
T1 land type T2 land type T3 land type Form of energy
Quantity(MJ )1ha −
Percentage a Quantity(MJ )1ha −
Percentage a Quantity(MJ )1ha −
Percentage a
Directenergy b
3704.5 3.51 2292.5 6.3 2444.8 5.6
Indirect energy c
101835.7 96.49 44578.5 93.7 41280.6 94.4
Renewable energy d
2458.6 2.33 1795.6 3.77 1910.9 4.4
Non-renewable energy e
103081.6 97.67 45775.4 96.23 41814.5 95.6
Total energy input
105540.2 100 47571 100 43725.4 100
a Indicates percentage of energy input. b
Includes human labor and diesel. c
Includes seeds, fertilizers, manure, chemicals, and machinery. d
Includes human labor, seeds, and manure.
http://www.sciencepub.net/nature [email protected]

OPPORTUNITIES FOR AGRI-FOOD CHAINS TO BECOME ENERGY-SMART156
VEG
ETA
BLE
S V
ALU
E C
HA
IN
Processing
Beans can be harvested green or dry and eaten fresh, frozen or dried. Beans harvested dry require little if any additional energy for artificial drying, but can be processed, canned, or frozen49.
Drying: The best way for drying fresh produce which contains up to 60% moisture content (wet basis) to a safe storage moisture content of 7% to 8% is the application of low heat and ventilation. Time and energy required for drying vary with the type of fresh produce and on the drying technologies (direct or indirect solar drying or heat-assisted drying). The main energy requirement in heated air dryers is for heating air. Heat sources may be electric, propane, wood, or any other locally available fuel. Electricity for air movement is only a small fraction of the air heating costs. A typical drying process can require about 2.3 GJ (57.8 L diesel) of heat and 6 kWh of electricity per Mt of produce (USAID 2009). Energy use can be reduced by incorporating measures such as air recirculation into the operation.
Costs vary depending on the initial and final moisture contents of the product. If energy conservation measures such as air recirculation are incorporated, fuel demand can drop significantly (USAID 2014). Moreover, alternative renewable sources of energy can be used to dry the beans (Case Study 5.9).
CASE STUDY 5.9. DRYING BEANS IN INDONESIAGeothermal energy can be used to dry crops such as beans, coffee berries, tea, rough rice, and fishery products (Abdullah and Gunadnya 2010). In the Kamojang geothermal field of West Java, a geothermal dryer has been used to dry beans and grain. Geothermal steam at about 160°C is used to heat air for the drying process. The air is blown and heated in a geothermal tube-bank heat exchanger before being blown into a drying chamber with four separated trays. The heat transfer rate in the geothermal exchanger is 1 kW, whereas the air flow velocity ranges from 4 m/s to 9 m/s and the drying temperature from 45°C to 60°C. The drying time depends on the moisture content of the raw material.Source: FAO, 2015
Freezing: In order to delay microbial activity and extend the shelf life of vegetables, they can be frozen. Storing green and dry beans such as lima beans (Phaseolus lunatus) and other foods at -20°C or lower temperatures reduces their rate of deterioration and increase the storage life up to 15 to 24 months. Three main processes are used to reduce the temperature: individual quick freezing; freezing in containers; and immersion freezing (US EPA, 2008). All these processes have high energy
49. The canning process of green and dry beans is already covered in the tomatoes Section 5.1.

OPPORTUNITIES FOR AGRI-FOOD CHAINS TO BECOME ENERGY-SMART 157
VEG
ETA
BLE
S V
ALU
E C
HA
IN
requirements. For instance, individual quick freezing relies on energy for the circulation of chilled air: the vegetables are frozen before packaging using fluidized-bed or air-blast freezers. Freezing in containers can be done using plate freezers in which containers are inserted between two refrigerated plates, or air-blast freezers. Immersion in a freezing solution consists of passing beans and other vegetables through a bath of refrigerant (typically propylene glycol, brine, glycerol, or calcium chloride) on a submerged mesh conveyor (US EPA, 2008).
In order to reduce the energy demand, a hydrocooling process can be performed prior to freezing. The temperature of beans and other vegetables is reduced using chilled water, either in shower or immersion-type units. Chilled water is normally produced using a heat exchanger. Hydrocooling is much more energy efficient than using evaporators in freezers to cool vegetables to just above freezing (US EPA, 2008).
Another process, freeze drying, dehydrates vegetables and fruits using a combination of freezing and low pressure. Products are first frozen and then placed in a chamber under high vacuum, where the water in the products is transformed directly from ice into the vapor phase and is condensed on refrigerated coils (Luh and York, 1988). Freeze drying may produce dried vegetables with better color, odor, and flavor retention than traditional drying methods, but the cost of freeze drying can be up to four times greater (Fellows, 2000).

OPPORTUNITIES FOR AGRI-FOOD CHAINS TO BECOME ENERGY-SMART158
VEG
ETA
BLE
S V
ALU
E C
HA
IN
Transport
Transport of beans is similar to tomatoes (Section 5.1) and other vegetables (Case Study 5.10).
CASE STUDY 5.10. GREEN BEANS FROM KENYA IMPORTED BY UKImports of fresh vegetables from Africa constitute 40% of UK air freighted food products. Fruit accounts for a further 20%. Around 70% of Kenyan green bean exports are transported to the UK, of which over 90% are transported by air. There was a four-fold increase in UK imports of green beans between 1990 and 2004, from 8,300 to 33,000 tonnes , whereas domestic UK green bean production fell by almost a third between 1995 and 2005 from 30,300 to 20,700 tonnes.
Around 87% of UK green bean imports come from five African countries, with two-thirds coming from Kenya. The energy consumption of green bean production up to the farm gate is 0.8 MJ/kg to 1.4 MJ/kg in Europe and 0.7 MJ/kg to 1.7 MJ/kg in Kenya. When the energy consumed in air freight of green beans from Kenya to the UK is included, the difference between the two supply chains becomes considerable (Table 5.3). Total energy demand is 12 times greater when beans are sourced in Kenya rather than in the UK, because air freight is about 58 MJ/kg of beans.
Transporting green beans from Kenya to the UK by sea (2 MJ/kg beans) rather than by plane would result in a significant energy saving. Low input systems were less energy demanding than high input. Medium scale enterprises used around 20% to 50% less energy per kg of beans than small scale enterprises.
TABLE 5.4. Energy used during green bean cultivation in Kenya.
SMALL SCALE MEDIUM SCALE
Low Input High Input Low Input High Input
YIELD, kg/ha 2900 2900 7400 7400
Land preparation by tractor MJ/kg 0 0 0.1 15% 0.1 8%
Irrigation MJ/kg 0.31 (35%) 0.62 (26%) 0.2 (29%) 0.31 (24%)
Inorganic fertilizer MJ/kg 0.43 (50%) 0.86 (36%) 0.34 (49%) 0.51 (40%)
Pesticide MJ/kg 0.13 (14%) 0.24 (38%) 0.05 (7%) 0.36 (28%)
TOTAL to farm gate MJ/kg 0.87 1.72 0.69 1.28
Energy use for production, packaging and distribution of Kenyan green beans to the UK
Transport to packinghouse/airport
MJ/kg 0.07 (0.1%) 0.07 (0.1%) 0.07 (0.1%) 0.07 (0.1%)
Packaging MJ/kg 3.92 (6.3%) 3.92 (6.2%) 3.92 (6.3%) 3.92 (6.2%)
Air transport to UK MJ/kg 57.83 (92.3%) 57.83 (91%) 57.83 (92.5%) 57.83 (91.6%)
TOTAL MJ/kg 62.69 63.54 62.51 63.1
Source: Jones, 2006

OPPORTUNITIES FOR AGRI-FOOD CHAINS TO BECOME ENERGY-SMART 159
VEG
ETA
BLE
S V
ALU
E C
HA
IN
Water demand
The water requirements for growing beans depend on the type of bean, the soil type, and the ambient temperature. For instance, in Greece during the summer period, beans require about 5 mm of water per day, therefore the whole water footprint on the life of the crop is about 300 mm to 450 mm (Abeliotis et al., 2013).
Green beans require more water per day than many other vegetables for their production, but higher amounts are demanded to grow dry beans and other pulses because they have a longer growing period (Table 5.4).
Processing green beans is also a water consuming process. For instance, cleaning and processing string beans generates 4.9 m3/t to 42.4 m3/t of wastewater discharge (UNIDO, 2014).
TABLE 5.5. Global average water footprint of various types of green and dry beans, 1996–2005.
Product Description Global average water footprint (m3/ t)
Green Blue Grey Total
Beans, Green 320 54 188 561
String Beans 301 104 143 547
Beans, Dry 3945 125 983 5053
Broad Beans, Horse Beans, Dry 1317 205 496 2018
Peas, Dry 1453 33 493 1979
Chick Peas 2972 225 981 4177
Cow Peas, Dry 6841 10 55 6906
Pigeon Peas 4739 72 683 5494
Lentils 4324 489 1060 5874
Source: Mekonnen and Hoekstra, 2011.
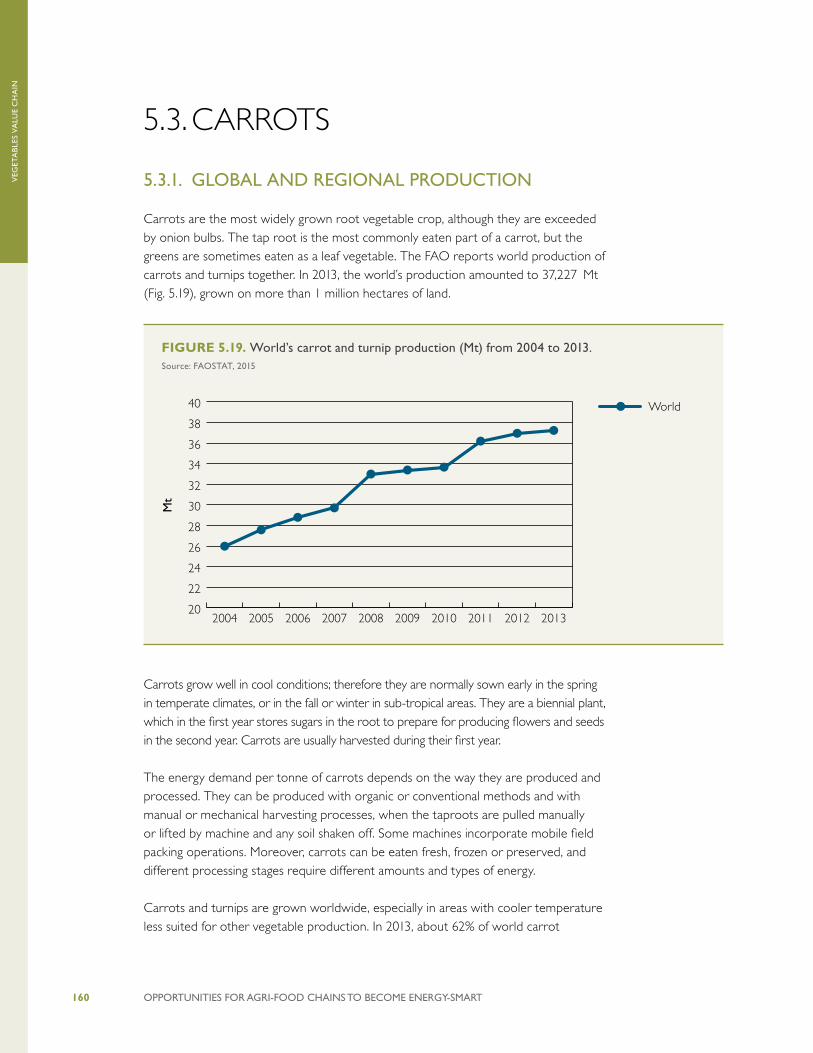
OPPORTUNITIES FOR AGRI-FOOD CHAINS TO BECOME ENERGY-SMART160
VEG
ETA
BLE
S V
ALU
E C
HA
IN
FIGURE 5.19. World’s carrot and turnip production (Mt) from 2004 to 2013.Source: FAOSTAT, 2015
5.3. CARROTS
5.3.1. GLOBAL AND REGIONAL PRODUCTION
Carrots are the most widely grown root vegetable crop, although they are exceeded by onion bulbs. The tap root is the most commonly eaten part of a carrot, but the greens are sometimes eaten as a leaf vegetable. The FAO reports world production of carrots and turnips together. In 2013, the world’s production amounted to 37,227 Mt (Fig. 5.19), grown on more than 1 million hectares of land.
Carrots grow well in cool conditions; therefore they are normally sown early in the spring in temperate climates, or in the fall or winter in sub-tropical areas. They are a biennial plant, which in the first year stores sugars in the root to prepare for producing flowers and seeds in the second year. Carrots are usually harvested during their first year.
The energy demand per tonne of carrots depends on the way they are produced and processed. They can be produced with organic or conventional methods and with manual or mechanical harvesting processes, when the taproots are pulled manually or lifted by machine and any soil shaken off. Some machines incorporate mobile field packing operations. Moreover, carrots can be eaten fresh, frozen or preserved, and different processing stages require different amounts and types of energy.
Carrots and turnips are grown worldwide, especially in areas with cooler temperature less suited for other vegetable production. In 2013, about 62% of world carrot
20
22
24
26
28
30
32
34
36
38
40 World
2013201220112010200920082007200620052004
Mt
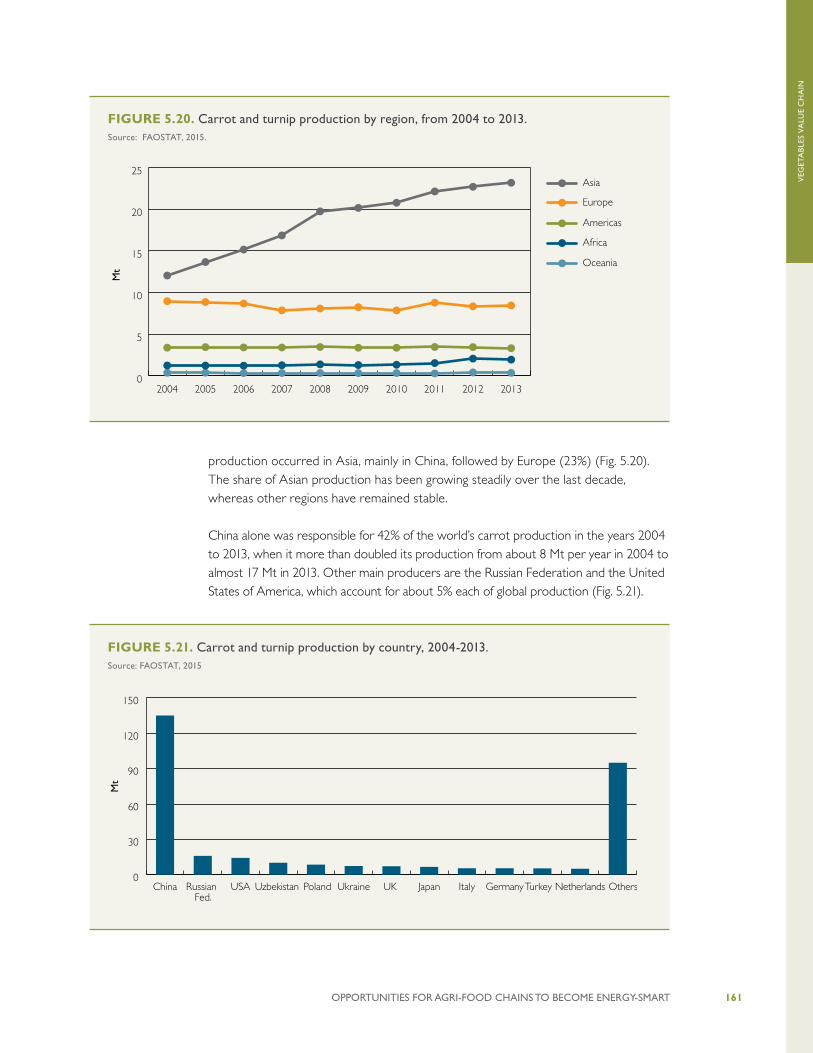
OPPORTUNITIES FOR AGRI-FOOD CHAINS TO BECOME ENERGY-SMART 161
VEG
ETA
BLE
S V
ALU
E C
HA
IN
FIGURE 5.21. Carrot and turnip production by country, 2004-2013. Source: FAOSTAT, 2015
production occurred in Asia, mainly in China, followed by Europe (23%) (Fig. 5.20). The share of Asian production has been growing steadily over the last decade, whereas other regions have remained stable.
China alone was responsible for 42% of the world’s carrot production in the years 2004 to 2013, when it more than doubled its production from about 8 Mt per year in 2004 to almost 17 Mt in 2013. Other main producers are the Russian Federation and the United States of America, which account for about 5% each of global production (Fig. 5.21).
FIGURE 5.20. Carrot and turnip production by region, from 2004 to 2013.Source: FAOSTAT, 2015.
0
5
10
15
20
25
Oceania
Europe
Asia
Americas
Africa
2013201220112010200920082007200620052004
Mt
0
30
60
90
120
150
OthersNetherlandsTurkeyGermanyItalyJapanUK UkrainePolandUzbekistanUSARussian Fed.
China
Mt

OPPORTUNITIES FOR AGRI-FOOD CHAINS TO BECOME ENERGY-SMART162
VEG
ETA
BLE
S V
ALU
E C
HA
IN
FIGURE 5.22. Carbon footprints per 600g serving for carrots when sold in different forms. Source: Foster et al., 2006, p.49.
5.3.2. ENERGY AND WATER DEMAND
There are few studies focusing on the energy consumed in the production and processing of carrots. Those reported focus on industrialized countries, largely Western Europe, and include the energy required in the consumption stages. For instance, Carlsson-Kanyama (1997, 1998) calculated an energy demand for carrot production and consumption of 21 MJ per kg of produce. Foster et al. (2006) identified the freezing process as having the greatest energy requirement among different food preserving techniques, with refrigerated preservation of fresh food and canning both having about 30% to 50% lower energy demand than freezing.
A UK Study on the environmental impacts of production and processing of carrots grown in open fields, the production of packing and materials, transport, storage, preparation, and waste management (including filling of cans), showed the different effects of carrots sold in different packages (Foster et al., 2006) (Fig. 5.22). In terms of GHG emissions, frozen and canned carrots had the largest global warming potentials, with storage in distribution, retail and in the home as the main contributing stages (Foster et al., 2006). Transport from shops to home was a major contributor in the case of fresh carrots. Peeled carrots, being less heavy than bunched carrots, have the lowest total global warming potential (Fig. 5.22). Transport and packaging were the main contributors for carrots sold in pouch and laminated cartons, whereas packaging alone was the main cause of emissions for canned carrots. In this case, the impact can be mitigated by recycling the packaging.
Global Warming Potential, whole system,carrots in various formats (kg CO2 equiv per 600g serving)
0.00
0.20
0.40
0.60
0.80
1.00
1.20
1.40
Freshbunched
Freshbunched
Frozenbag
Frozencarton
food can(l'fill)
pouch laminatecarton
kg C
O2-
eq
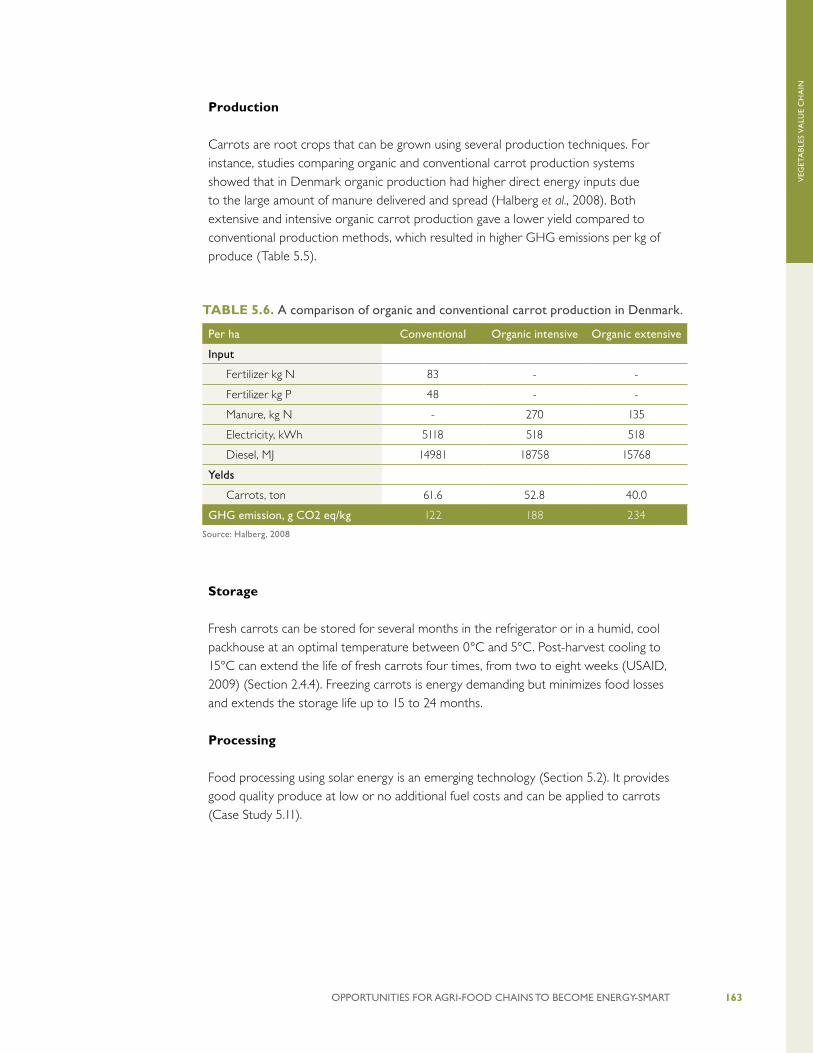
OPPORTUNITIES FOR AGRI-FOOD CHAINS TO BECOME ENERGY-SMART 163
VEG
ETA
BLE
S V
ALU
E C
HA
IN
Production
Carrots are root crops that can be grown using several production techniques. For instance, studies comparing organic and conventional carrot production systems showed that in Denmark organic production had higher direct energy inputs due to the large amount of manure delivered and spread (Halberg et al., 2008). Both extensive and intensive organic carrot production gave a lower yield compared to conventional production methods, which resulted in higher GHG emissions per kg of produce (Table 5.5).
Storage
Fresh carrots can be stored for several months in the refrigerator or in a humid, cool packhouse at an optimal temperature between 0°C and 5°C. Post-harvest cooling to 15°C can extend the life of fresh carrots four times, from two to eight weeks (USAID, 2009) (Section 2.4.4). Freezing carrots is energy demanding but minimizes food losses and extends the storage life up to 15 to 24 months.
Processing
Food processing using solar energy is an emerging technology (Section 5.2). It provides good quality produce at low or no additional fuel costs and can be applied to carrots (Case Study 5.11).
TABLE 5.6. A comparison of organic and conventional carrot production in Denmark.
Per ha Conventional Organic intensive Organic extensive
Input
Fertilizer kg N 83 - -
Fertilizer kg P 48 - -
Manure, kg N - 270 135
Electricity, kWh 5118 518 518
Diesel, MJ 14981 18758 15768
Yelds
Carrots, ton 61.6 52.8 40.0
GHG emission, g CO2 eq/kg 122 188 234
Source: Halberg, 2008

OPPORTUNITIES FOR AGRI-FOOD CHAINS TO BECOME ENERGY-SMART164
VEG
ETA
BLE
S V
ALU
E C
HA
IN
CASE STUDY 5.11. SOLAR DRYING OF CARROTS Different designs of solar dryers, collectors and concentrators are currently being used for various steps in food processing and value adding. For instance, a solar cabinet dryer with forced circulation developed by the Society for Energy, Environment and Development (SEED) can be used for dehydration of carrots and other vegetables.
Drying under simulated shade conditions using a UV-reducing blue filter helps retain nutrients better. The simple design and ease of handling of the SEED solar dryer makes it an ideal food processor in rural settings, close to where the harvest is produced. Drying can reduce the cost of transporting and storing fresh carrots and other vegetables. It also creates employment opportunities among the rural population, particularly women.
Fresh carrots high in solids but low in woody fiber are ideal for dehydration. The vegetables are cubed and washed thoroughly at 93°C in plain water or in 2% NaCl water for 3–4 minutes. The cubed carrots are loaded at 5 kg/m2 then dried in solar cabinet dryers. To achieve a final moisture content of around 4% to 5% (wet basis) around 10 to 12 hours are required.
Source: Eswara & Ramakrishnarao, 2013
Continual improvements in performance efficiency and reducing energy inputs result from investment in research and development and development at all stages of the food processing sector. For example a novel drying technology for carrots and other vegetables was first demonstrated over a decade ago (Case Study 5.12).
CASE STUDY 5.12. PULSED FLUID-BED DRYING FOR CARROTS Fluid-bed dryers are used widely in the dehydration of fruits and vegetables. The pulsed fluid-bed dryer is a modification of the conventional fluid-bed in which pulses of compressed air cause high-frequency vibrations within the bed of product particles, such as carrot cubes. These drying methods generate energy savings in heating and circulating hot air because they use 30% to 50% less air for fluidization than conventional methods. Moreover, pulsed fluid-bed dryers allow easier fluidization of irregular particle shapes and reduced channeling of particles (CADDET, 2000). They are approximately half the size of conventional conveyor-type dryers. Pulsed fluid-bed dryers have been successfully adopted in the food industry for the drying of carrot cubes, reducing the total drying time by two to three times compared to conventional methods, while providing cubes highly uniform in color and moisture content.Source: US EPA, 2008

OPPORTUNITIES FOR AGRI-FOOD CHAINS TO BECOME ENERGY-SMART 165
VEG
ETA
BLE
S V
ALU
E C
HA
IN
Packaging
Carrots can be eaten fresh, frozen or preserved. The various processing stages for carrots and the related environmental impact of each method are summarized in Table 5.6.
TABLE 5.7. Processing stages of carrots and other vegetables that contribute to the total environmental impact of a product-packaging life-cycle.
Note: The main environmental impacts are shown in brackets: FAETP, freshwater aquatic ecotoxicity; TETP, terrestrial ecotoxicity; GWP, global warming; HTP, human toxicity; ODP, ozone depletion; POCP, photochemical ozone creation.
Source: Lightart et al., 2006
Water demand
Compared with other vegetables, carrots and turnips tend to have a smaller water footprint during production (Table 5.8) than tomatoes (Table 5.2) and beans (Table 5.5).
TABLE 5.8. Global average water footprint of carrots, 1996–2005.
Product descriptionGlobal average water footprint (m3/t)
Green Blue Grey Total
Carrots and turnips 106 28 61 195
Source: Mekonnen and Hoekstra, 2011
System Most contributing life cycle stages
Fresh Bunched Cultivation (FAETP, TETP)Transportation (GWP, HTP, ODP, POCP)
Peeled Cultivation (FAETP, TETP)Transportation (GWP, HTP, ODP, POCP)
Frozen Bag Distribution and Retail (GWP, ODP, HTP, FAETP)Consumption (GWP, ODP, HTP)Transportation (HTP, ODP, POCP)
Carton Distribution and Retail (GWP, ODP, HTP, FAETP)Transportation (HTP, ODP, POCP)
Preserved Steel Food Can Cultivation (FAETP, TETP)Packaging (GWP, ODP, HTP, POCP)Transportation (GWP, ODP, HTP, POCP)
Food pouch Cultivation (FAETP, TETP)Transportation (GWP, ODP, HTP, POCP)
Tetra Recart Packaging (GWP, ODP, POCP)Transportation (GWP, ODP, HTP, POCP)
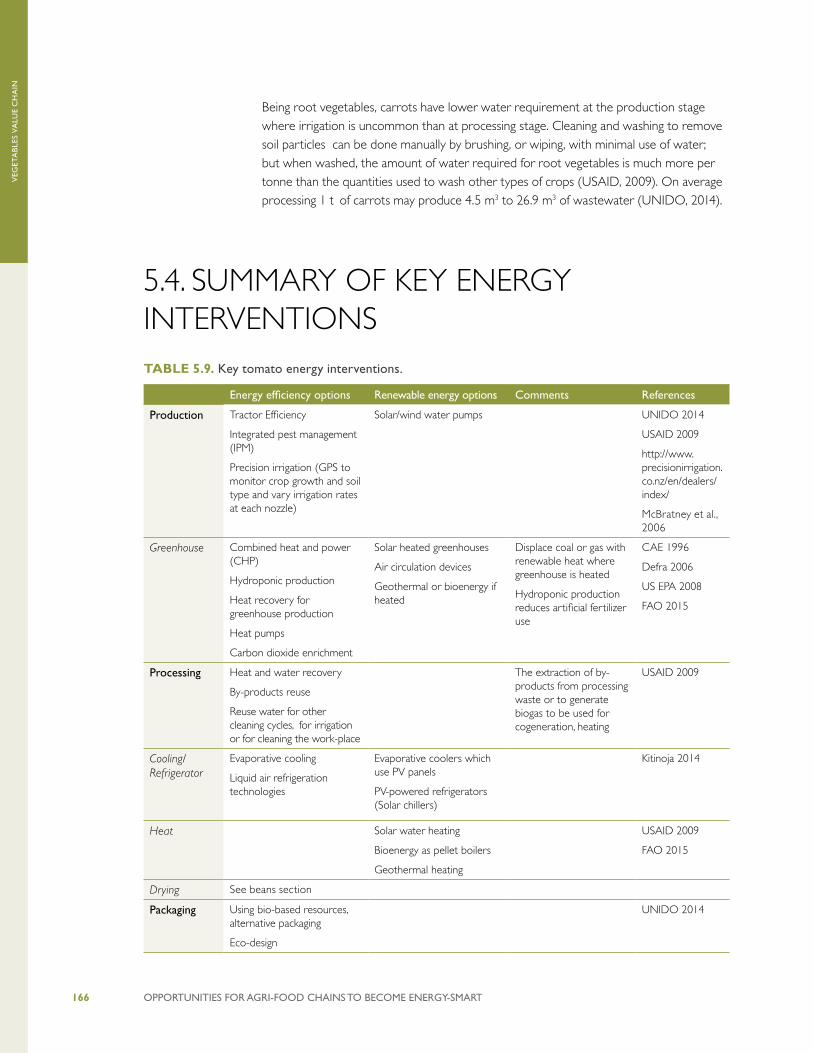
OPPORTUNITIES FOR AGRI-FOOD CHAINS TO BECOME ENERGY-SMART166
VEG
ETA
BLE
S V
ALU
E C
HA
IN
Being root vegetables, carrots have lower water requirement at the production stage where irrigation is uncommon than at processing stage. Cleaning and washing to remove soil particles can be done manually by brushing, or wiping, with minimal use of water; but when washed, the amount of water required for root vegetables is much more per tonne than the quantities used to wash other types of crops (USAID, 2009). On average processing 1 t of carrots may produce 4.5 m3 to 26.9 m3 of wastewater (UNIDO, 2014).
5.4. SUMMARY OF KEY ENERGY INTERVENTIONSTABLE 5.9. Key tomato energy interventions.
Energy efficiency options Renewable energy options Comments References
Production Tractor Efficiency
Integrated pest management (IPM)
Precision irrigation (GPS to monitor crop growth and soil type and vary irrigation rates at each nozzle)
Solar/wind water pumps UNIDO 2014
USAID 2009
http://www.precisionirrigation.co.nz/en/dealers/index/
McBratney et al., 2006
Greenhouse Combined heat and power (CHP)
Hydroponic production
Heat recovery for greenhouse production
Heat pumps
Carbon dioxide enrichment
Solar heated greenhouses
Air circulation devices
Geothermal or bioenergy if heated
Displace coal or gas with renewable heat where greenhouse is heated
Hydroponic production reduces artificial fertilizer use
CAE 1996
Defra 2006
US EPA 2008
FAO 2015
Processing Heat and water recovery
By-products reuse
Reuse water for other cleaning cycles, for irrigation or for cleaning the work-place
The extraction of by-products from processing waste or to generate biogas to be used for cogeneration, heating
USAID 2009
Cooling/Refrigerator
Evaporative cooling
Liquid air refrigeration technologies
Evaporative coolers which use PV panels
PV-powered refrigerators (Solar chillers)
Kitinoja 2014
Heat Solar water heating
Bioenergy as pellet boilers
Geothermal heating
USAID 2009
FAO 2015
Drying See beans section
Packaging Using bio-based resources, alternative packaging
Eco-design
UNIDO 2014

OPPORTUNITIES FOR AGRI-FOOD CHAINS TO BECOME ENERGY-SMART 167
VEG
ETA
BLE
S V
ALU
E C
HA
IN
TABLE 5.10. Key bean energy interventions.
Energy efficiency options Renewable energy options Comments References
Production See tomatoes section Solar/wind water pumps
Processing See tomatoes section
Cooling/Refrigerator See tomatoes section
Drying Recirculation of air in dryer Solar drying
Geothermal drying
FAO 2015
Freezing Hydrocooling before freezing US EPA 2008
TABLE 5.11. Key carrot energy interventions.
Energy efficiency options
Renewable energy options
Comments References
Production See tomatoes section
Processing Hydrothermal treatment
Wet residues for anaerobic digestion
FAO 2011
Cooling/Refrigerator See tomatoes section
Drying Pulsed fluid-bed drying
See also beans section
Solar cabinet dryer with forced circulation
Eswara & Ramakrishnarao 2013
US EPA 2008
Packaging See tomatoes section
A number of key energy interventions can be identified which are common to the three vegetable value chains. These include:
• CHP and heat recovery for greenhouse production;
• water recycling and re-use, for instance, the use of processing wastewater to irrigate fields;
• optimization of refrigeration systems and use of renewable electricity;
• extraction of by-products from processing wastes and utilizing them for animal feed stock or in producing quality compost which replenish soil carbon stocks (UNIDO, 2014); and
• alternatively, the organic wastes can be used as feedstock in anaerobic digesters to produce biogas (Section 2.5.2) used for cogeneration, heating (for processing companies or communities) or for transport.

OPPORTUNITIES FOR AGRI-FOOD CHAINS TO BECOME ENERGY-SMART168
VEG
ETA
BLE
S V
ALU
E C
HA
IN
A huge quantity of vegetable wastes and by-products from vegetable processing are available throughout the world. For example processing, packing, distribution, and consumption of fruit and vegetables in India, the Philippines, China, and the USA generate about 55 Mt of waste (FAO, 2013). These wastes could be recycled through livestock as feed resources or further processed to extract or develop value-added products such as biogas, biofuels, heat, and electricity.
CASE STUDY 5.13. POWERING AG INNOVATION A HYDROPONIC GREEN FARMING INITIATIVEECO Consult has developed an integrated model of hydroponic and photovoltaic farming to compete with conventional greenhouse technology and drip irrigation systems. To make the technology attractive to large-scale commercial farms, ECO Consult will retrofit a multi-span greenhouse with advanced hydroponic technologies and photovoltaic panels to generate enough power to operate the lighting, pumping, and air moderation systems.Source: https://poweringag.org/innovators/hydroponic-green-farming-initiative
CASE STUDY 5.14. POWERING AG INNOVATION SUNCHILL: SOLAR COOLING FOR HORTICULTURAL PRESERVATIONSunChill™ is a novel, off-grid refrigeration solution enabling increased agricultural productivity by: (i) Removing field heat from crops immediately following harvest, and (ii) providing continued product cooling at local markets and/or central processing facilities. This clean energy solution transforms 50°C solar thermal energy into 10°C refrigeration using solid refrigerants and local, non-precision components. These characteristics enable production of a low cost, low-maintenance technology that reduces spoilage and benefits smallholder farmer livelihoods.Source: https://poweringag.org/innovators/sunchill-solar-cooling-horticultural-preservation

OPPORTUNITIES FOR AGRI-FOOD CHAINS TO BECOME ENERGY-SMART 169
TO
OLSThe possible energy interventions along the agri-food chain are numerous and at
times there is a need to prioritize them on the basis of certain criteria. Several tools are available (some are available at no cost) to assist decision making on energy interventions and assess the most suitable and/or profitable options. Most of these decision support tools are general and can be applied to provide an economic assessment of energy interventions across sectors. These include the economic effects of an energy efficiency improvement or of changing a fossil fuel energy supply source with a low carbon source. These tools can be used to assess possible interventions along different food value chains, including on-farm production and food processing.
In order to assess the impacts along a specific value chain, FAO has developed a Value Chain Analysis (VCA)50 tool for decision making. This can be used for project-level decisions as well as for policy development. Analyzing a value chain implies:
a) taking stock of the situation of the value chain looking at its different economic, social, and environmental dimensions;
b) identifying areas of potential improvement of the value chain that can be introduced by new interventions or measures; and
c) assessing the likely economic, social, and environmental impacts of the available options.
In VCA an economic agent is defined as the subject carrying out a set of integrated operations of economic relevance, aimed at producing a given output. Each agent is a customer of an upstream agent as well as supplier of a downstream one belonging to
50. VCA is the assessment of a portion of an economic system where upstream agents in production and distribution processes are linked to downstream partners by technical, economic, territorial, institutional and social relationships.
The effects of policies targeting specific production processes extend their primary impacts in the economic system according to the same path as the main inputs and outputs. Analyzing impacts of policy options through value chains provides decision makers and other stakeholders with anticipated evidence on likely changes directly induced by policies (FAO, 2013. Value Chain Analysis for Policy Making – EASYPol Series 129).
6. SELECTED TOOLS TO ASSESS SUITABILITY AND PROFITABILITY OF ENERGY INTERVENTIONS ALONG THE AGRI-FOOD CHAIN
OPPORTUNITIES FOR AGRI-FOOD CHAINS TO BECOME ENERGY-SMART170
TO
OLS
the chain. The agent can be a physical person (such as a farmer, a trader, or a consumer), or a legal entity (for example a firm, an authority, a development organization).
Within a single value chain, “sub-chains” can be identified on the basis of the processing techniques or specific uses of the primary output. For example, within most rice value chains, two different sub-chains can be identified on the basis of the processing technique: on-farm husked rice or industrial processed rice.
A VCA helps to frame an energy intervention in a broader context, forcing the user to consider the impacts along the value chain of a single commodity or food product. Similar results can be achieved by applying the Value Links Methodology, published by Gesellschaft für Internationale Zusammenarbeit (GTZ) in 200751.
For analyzing the cost and potential of renewable energy systems that could be deployed on-farm or in the food processing plants (Section 2.5; FAO, 2011a), several tools are available that can facilitate a decision about possible interventions along a given value chain at the project level. Such tools suitable for energy techno-economic analysis and optimizing micro-grids or hybrid energy systems include RETScreen, HOMER and RAPSim. All these tools facilitate the decision making process at the project level, with a pure techno-economic analysis. They therefore omit other major considerations such as environmental sustainability, social sustainability, risk, and flexibility of the specific energy solution. These factors should be given a high priority, along with economic analysis, when making a final decision on investment in a renewable energy project. Other tools exist to this end but they are not treated specifically in this report.
The techno-economic tools mostly examine energy technologies for different applications, such as the local generation of power or heat for micro-grids, grid feed-in of electricity, or on-site consumption of heat and power. Technical and economic perspectives can be evaluated for specific locations. Factors including the profile and level of energy yield, system flexibility, and the creation of local jobs are called into play in technical comparisons. In addition, economic assessments focus attention on purchase investments, operating costs, levelized costs of electricity generation etc.
Other tools are available that can inform integrated energy planning on a wider scale, for example at the city or rural district level. One example is the integrated LEAP-WEAP tool52,
51. Value Links, has been published by GTZ in 2007 and is widely used by an independent network of practitioners working on value chain development. See http://www.valuelinks.org/ for more information on an update currently in progress.52. LEAP and WEAP are two complementary tools, developed by the Stockholm Environment Institute, used for energy planning at different scales and not for techno-economic analysis of specific energy interventions. LEAP (Long range Energy Alternatives Planning System) is a software system for integrated energy planning and climate change mitigation assessment and for creating Low Emission Development Strategies (LEDs).It can be used at a wide range of scales, from cities and states to national, regional and even global applications. The WEAP (Water Evaluation and Planning System) is a software tool that takes an integrated approach to water resources planning. It incorporates supply, demand, water quality and ecological considerations into a practical tool for integrated water resources planning. WEAP calculates water demand, supply, runoff, infiltration, crop requirements, flows, and storage, and pollution generation, treatment, discharge and in stream water quality under varying hydrologic and policy scenarios and provides information on available water resources. WEAP scenarios explore the model with a wide range of option such as water conservation, wastewater reuse and feedbacks between water and energy sectors. For example NAMAs can be individually modeled in LEAP as scenarios and combined to explore which overall strategy is preferable with respect to overall costs, emissions reduction potential, energy security and how the strategy contributes to national development objectives.
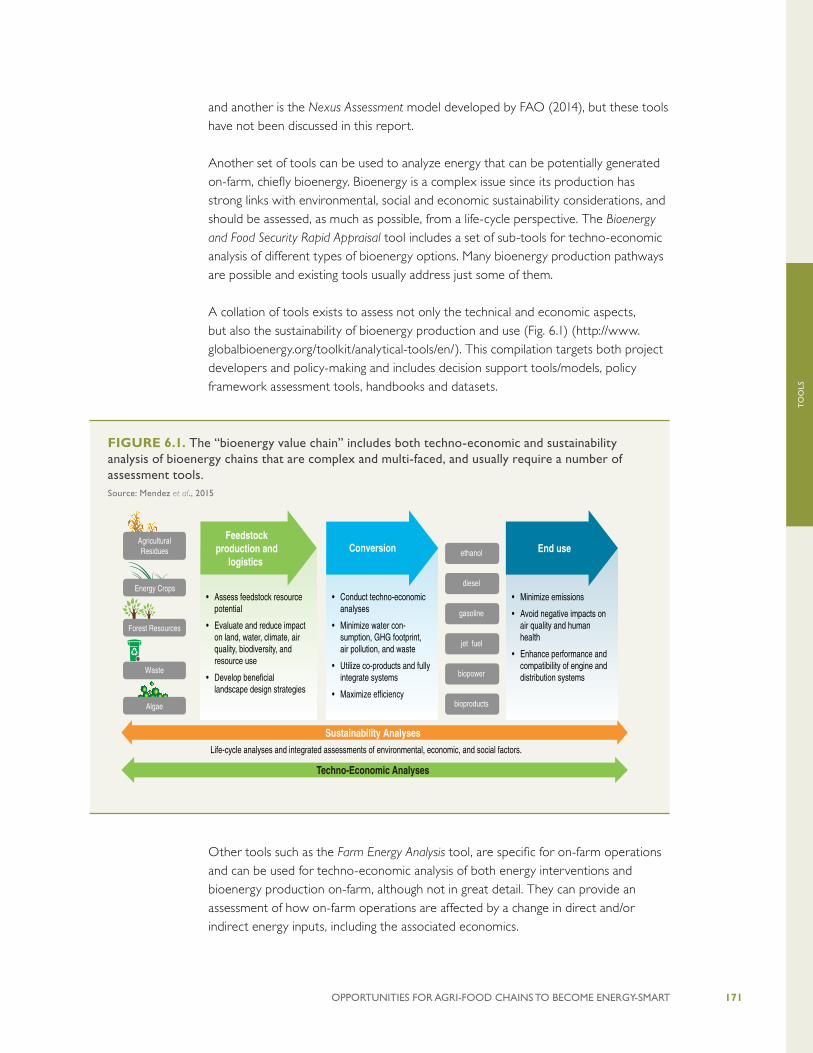
OPPORTUNITIES FOR AGRI-FOOD CHAINS TO BECOME ENERGY-SMART 171
TO
OLS
FIGURE 6.1. The “bioenergy value chain” includes both techno-economic and sustainability analysis of bioenergy chains that are complex and multi-faced, and usually require a number of assessment tools.Source: Mendez et al., 2015
and another is the Nexus Assessment model developed by FAO (2014), but these tools have not been discussed in this report.
Another set of tools can be used to analyze energy that can be potentially generated on-farm, chiefly bioenergy. Bioenergy is a complex issue since its production has strong links with environmental, social and economic sustainability considerations, and should be assessed, as much as possible, from a life-cycle perspective. The Bioenergy and Food Security Rapid Appraisal tool includes a set of sub-tools for techno-economic analysis of different types of bioenergy options. Many bioenergy production pathways are possible and existing tools usually address just some of them.
A collation of tools exists to assess not only the technical and economic aspects, but also the sustainability of bioenergy production and use (Fig. 6.1) (http://www.globalbioenergy.org/toolkit/analytical-tools/en/). This compilation targets both project developers and policy-making and includes decision support tools/models, policy framework assessment tools, handbooks and datasets.
Other tools such as the Farm Energy Analysis tool, are specific for on-farm operations and can be used for techno-economic analysis of both energy interventions and bioenergy production on-farm, although not in great detail. They can provide an assessment of how on-farm operations are affected by a change in direct and/or indirect energy inputs, including the associated economics.
70
chapter 3 Energy Security
Bioenergy & Sustainability
Given what we currently know about the potential risks of energy systems that are overly concentrated on a few sources or infrastructure systems and their impacts on the environment and criticality to development, energy systems are under increased pressure to transform and to better reflect society’s interests, but it cannot happen overnight.
The geopolitical, economic, and environmental dynamics of what otherwise appears to be an increasingly challenging future can be reshaped and, in the process, ensure continued economic growth and sustainable development. Such a transition, including bioenergy as well as other renewable and low-environmental impact energy sources (where resources permit), requires that we deploy a new suite of sustainable energy technologies while ensuring that the energy system remains structurally sound and economically viable.
The initial driver for expansion of bioenergy has been energy security. Brazil originally created the ProAlcool Program to minimize balance of trade deficits associated with petroleum imports and to provide alternative demand for sugar and molasses (Chapter 14, this volume). Similarly, the United States implemented federal policies that supported development of corn ethanol to reduce dependency on petroleum imports and to expand demand for corn, thereby reducing surpluses and increasing producer prices (Chapter 20, this volume). Several European countries have implemented biomass technologies to provide heat and power at a significant scale. The driver in this case has been more to reduce fossil fuel consumption. Subsequently, as awareness of the evidence that combustion of fossil fuels is causing climate change has expanded, bioenergy has come to be seen as a mechanism for decreasing the carbon intensity of energy use. Approximately 50 countries now have biofuels mandates predominantly in response to the above concerns. (Chapter 20, this volume).
As noted below, because the use of bioenergy in most market economies currently imposes increased costs relative to fossil fuels at the point of consumption, though not necessarily for the society as a whole, societal support for bioenergy depends
Figure 3.3. Supply chain for biofuels development.
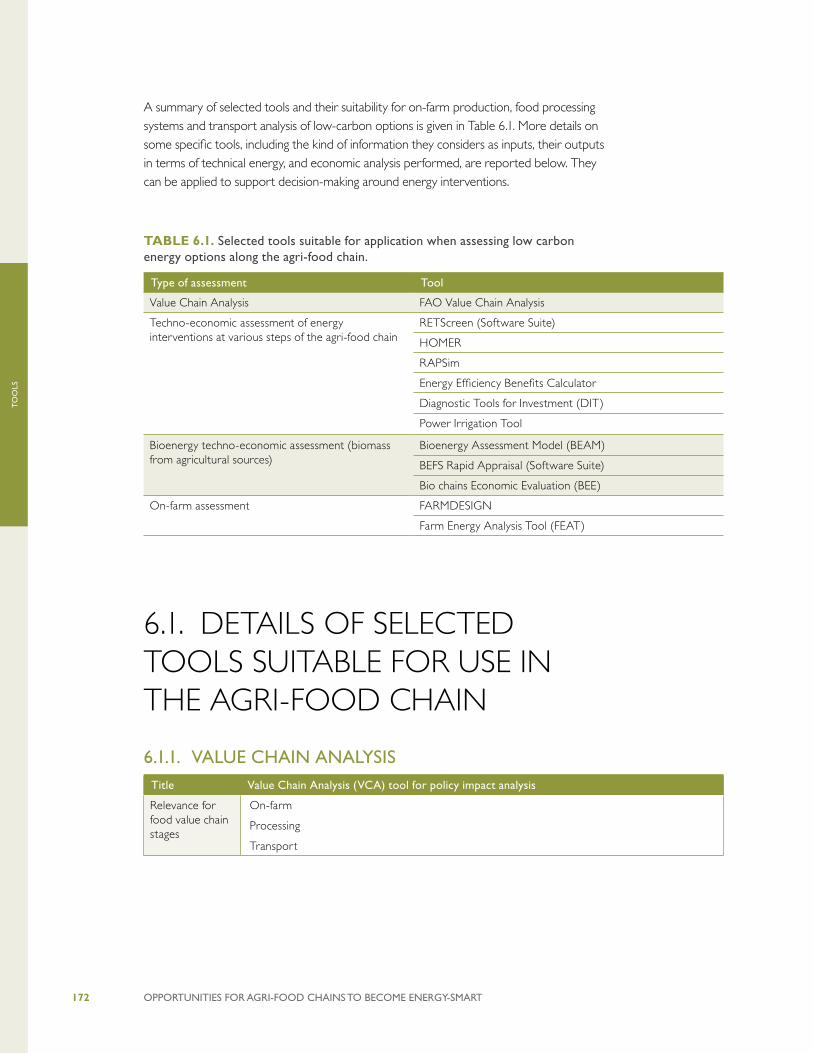
OPPORTUNITIES FOR AGRI-FOOD CHAINS TO BECOME ENERGY-SMART172
TO
OLS
A summary of selected tools and their suitability for on-farm production, food processing systems and transport analysis of low-carbon options is given in Table 6.1. More details on some specific tools, including the kind of information they considers as inputs, their outputs in terms of technical energy, and economic analysis performed, are reported below. They can be applied to support decision-making around energy interventions.
TABLE 6.1. Selected tools suitable for application when assessing low carbon energy options along the agri-food chain.
Type of assessment Tool
Value Chain Analysis FAO Value Chain Analysis
Techno-economic assessment of energy interventions at various steps of the agri-food chain
RETScreen (Software Suite)
HOMER
RAPSim
Energy Efficiency Benefits Calculator
Diagnostic Tools for Investment (DIT)
Power Irrigation Tool
Bioenergy techno-economic assessment (biomass from agricultural sources)
Bioenergy Assessment Model (BEAM)
BEFS Rapid Appraisal (Software Suite)
Bio chains Economic Evaluation (BEE)
On-farm assessment FARMDESIGN
Farm Energy Analysis Tool (FEAT)
6.1. DETAILS OF SELECTED TOOLS SUITABLE FOR USE IN THE AGRI-FOOD CHAIN
6.1.1. VALUE CHAIN ANALYSISTitle Value Chain Analysis (VCA) tool for policy impact analysis
Relevance for food value chain stages
On-farm
Processing
Transport

OPPORTUNITIES FOR AGRI-FOOD CHAINS TO BECOME ENERGY-SMART 173
TO
OLS
Title Value Chain Analysis (VCA) tool for policy impact analysis
Short description The FAO VCA-tool provides value chain policy impact assessment and performance monitoring.
It was developed to analyze and compare the effects of different policy options for agriculture and sustainable rural development.
It allows the creation of an accounting framework for value chain analysis and to compare different scenarios. A baseline scenario is built into which policy measures or changes in the value chain can be inserted. Their potential impacts are used to modify the original benchmark scenario.
It has been used in Viet Nam, Mali, Oman, Turkey, Burkina Faso, Syria, Nigeria, and Kenya.
Resources considered
The basic items of a value chain included in the tool are:
• Commodities: the basic data of a production system, e.g., seeds, taxes, wheat, energy, fertilizer, labor. These assessable elements are involved in the production, processing and trading of the main outputs of the chain that become commodities themselves.
• Activities: a combination of some commodities allows the value chain activities to be modeled. In the case of an agricultural chain, the main activities are commodity production, processing, and trading.
• Plans: combinations of basic commodities and activities to create plans. A plan corresponds to the top level of the hierarchy: it represents an agent, or a group of agents, a geographical area, or an exploitation method.
Technical assessment
The VCA software allows different scenarios to be built and to analyze the socio-economic impact of various policies such as the adoption of new low-carbon energy efficient technologies or support for renewable energy.
The information about how inputs and outputs would change before and after the intervention is exogenous and can come from other sources. It can be used in combination with other tools for techno-economic analysis.
For instance, in Burkina Faso, the model was used to compare butane and firewood by calculating the implicit price per unit of energy, the quality-energy adjusted price, and the energy-quality-externality-adjusted price.
Economic assessment
The FAO VCA-tool provides quantitative information and economic and financial prices for machines and equipment, buildings and infrastructure, land, labor, energy inputs, and water.
The tool allows for:
• commodity chain analysis:
• impact analysis using shadow prices,
• financial analysis,
• impact analysis using market prices,
• functional analysis and flow chart
• scenarios comparison
• cost-benefit analysis
• competitiveness and profitability indicators
Source FAO EasyPol http://www.fao.org/easypol/output/
Last update 2014
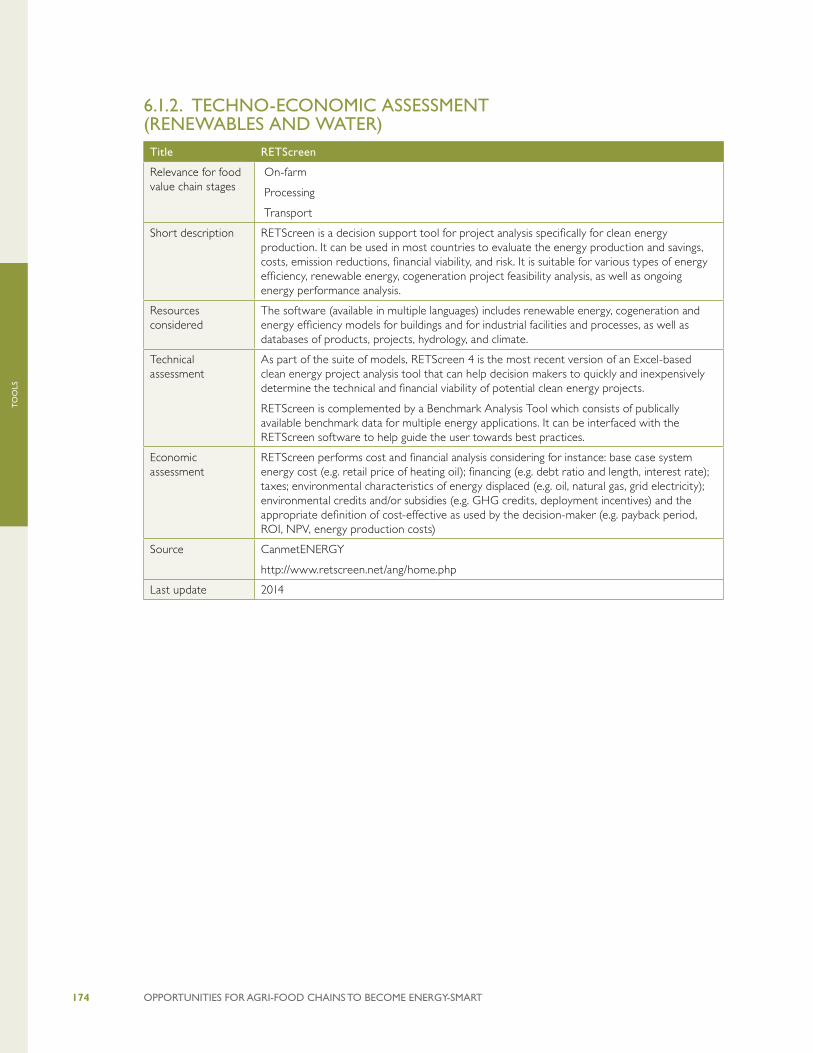
OPPORTUNITIES FOR AGRI-FOOD CHAINS TO BECOME ENERGY-SMART174
TO
OLS
6.1.2. TECHNO-ECONOMIC ASSESSMENT (RENEWABLES AND WATER)Title RETScreen
Relevance for food value chain stages
On-farm
Processing
Transport
Short description RETScreen is a decision support tool for project analysis specifically for clean energy production. It can be used in most countries to evaluate the energy production and savings, costs, emission reductions, financial viability, and risk. It is suitable for various types of energy efficiency, renewable energy, cogeneration project feasibility analysis, as well as ongoing energy performance analysis.
Resources considered
The software (available in multiple languages) includes renewable energy, cogeneration and energy efficiency models for buildings and for industrial facilities and processes, as well as databases of products, projects, hydrology, and climate.
Technical assessment
As part of the suite of models, RETScreen 4 is the most recent version of an Excel-based clean energy project analysis tool that can help decision makers to quickly and inexpensively determine the technical and financial viability of potential clean energy projects.
RETScreen is complemented by a Benchmark Analysis Tool which consists of publically available benchmark data for multiple energy applications. It can be interfaced with the RETScreen software to help guide the user towards best practices.
Economic assessment
RETScreen performs cost and financial analysis considering for instance: base case system energy cost (e.g. retail price of heating oil); financing (e.g. debt ratio and length, interest rate); taxes; environmental characteristics of energy displaced (e.g. oil, natural gas, grid electricity); environmental credits and/or subsidies (e.g. GHG credits, deployment incentives) and the appropriate definition of cost-effective as used by the decision-maker (e.g. payback period, ROI, NPV, energy production costs)
Source CanmetENERGY
http://www.retscreen.net/ang/home.php
Last update 2014

OPPORTUNITIES FOR AGRI-FOOD CHAINS TO BECOME ENERGY-SMART 175
TO
OLS
Title Hybrid Optimization of Multiple Energy Resources (HOMER)
Relevance for food value chain stages
On-farm
Processing
Transport
Short description
HOMER software is a global standard for micro-grid optimization. It navigates the complexities of building cost effective and reliable micro-grids that combine traditionally generated and renewable power, storage, and load management.
It covers a range of scales from village power systems to telecommunications and military applications.
Resources considered
HOMER simulates the operation of a hybrid micro-grid for an entire year, in time-steps from one minute to one hour.
It considers biomass, solar, wind, hydropower, combined heat and power, advanced load, advanced grid, and hydrogen systems. It examines all possible combinations of system types in a single run, and then sorts the systems according to the variable optimization choice.
Technical assessment
HOMER combines the multiple renewable energy and power system sources to create robust micro-grid systems that meet the electrical load demand of the proposed application while saving fossil fuels.
Economic assessment
HOMER provides economic information on how to cost-effectively combine renewable systems within a power grid.
Source HOMER Energy LLC - http://www.homerenergy.com/
Last update 2015

OPPORTUNITIES FOR AGRI-FOOD CHAINS TO BECOME ENERGY-SMART176
TO
OLS
Title Renewables Alternative Power System Simulation (RAPSim)
Relevance for food value chain stages
On-farm
Processing
Transport
Short description
RAPSim is a free and open source micro-grid simulation framework. It enables a better understanding of power flow behavior in smart micro-grids using renewable energy sources.
Resources considered
The predetermined objects in the tool are:
1. Power line resistor accumulates all the losses along a power line for use by the model;
2. Super conductors are low loss connectors between the different objects (physical super conductors are not modelled);
3. House stands for a power consumer specified by its electricity demand;
4. Solar power plant generates electricity depending on location and irradiation levels;
5. Wind power plant generates electricity depending on the local mean annual wind speeds;
6. Geothermal power plant is provides electricity supply independent of climate data;
7. Power grid represents a connection to the main power grid.
Technical assessment
The model calculates the power generated by each source in the micro-grid and then conducts a power flow analysis. This is helpful to determine the optimal placement of distributed generation units within a micro-grid.
It is able to simulate grid-connected or stand-alone micro-grids using solar, wind or other renewable energy sources.
Economic assessment
-
Source Alpen-Adria-Universität Klagenfurt within the Lakeside Labs project Smart Micro-grid. http://sourceforge.net/projects/rapsim/?source=navbar
Last update 2014
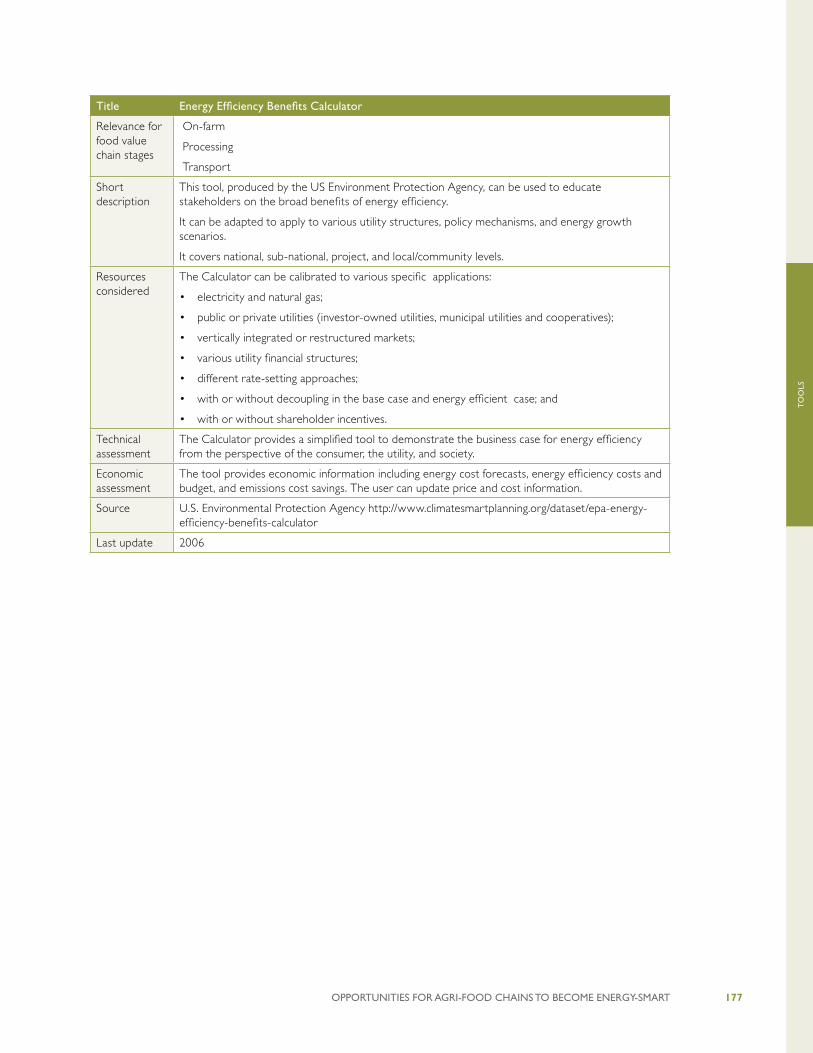
OPPORTUNITIES FOR AGRI-FOOD CHAINS TO BECOME ENERGY-SMART 177
TO
OLS
Title Energy Efficiency Benefits Calculator
Relevance for food value chain stages
On-farm
Processing
Transport
Short description
This tool, produced by the US Environment Protection Agency, can be used to educate stakeholders on the broad benefits of energy efficiency.
It can be adapted to apply to various utility structures, policy mechanisms, and energy growth scenarios.
It covers national, sub-national, project, and local/community levels.
Resources considered
The Calculator can be calibrated to various specific applications:
• electricity and natural gas;
• public or private utilities (investor-owned utilities, municipal utilities and cooperatives);
• vertically integrated or restructured markets;
• various utility financial structures;
• different rate-setting approaches;
• with or without decoupling in the base case and energy efficient case; and
• with or without shareholder incentives.
Technical assessment
The Calculator provides a simplified tool to demonstrate the business case for energy efficiency from the perspective of the consumer, the utility, and society.
Economic assessment
The tool provides economic information including energy cost forecasts, energy efficiency costs and budget, and emissions cost savings. The user can update price and cost information.
Source U.S. Environmental Protection Agency http://www.climatesmartplanning.org/dataset/epa-energy-efficiency-benefits-calculator
Last update 2006

OPPORTUNITIES FOR AGRI-FOOD CHAINS TO BECOME ENERGY-SMART178
TO
OLS
Title Diagnostic Tools for Investment (DTI)
Relevance for food value chain stages
On-farm
Processing
Transport
Short description The FAO Partnership for Agricultural Water for Africa (AgWA) has developed three Diagnostic Tools for Investment in Water for Agriculture and Energy. Together they offer an integrated platform to systematically assess trends in use of water resources, policy and institutional frameworks, the investment needs, and the potential to boost the sustainable use of water at country level.
The three tools are: the context tool; the institutional and policy tool; and the financial tool.
Resources considered
The context tool considers the current status of:
• agriculture (economic and social importance and productivity);
• irrigation;
• food security, poverty and food self-sufficiency (based on current level of food insecurity and poverty, self-sufficiency and food trade);
• water resources and hydropower (water availability, water use, storage capacity, hydropower production and use); and
• environment and climate change impacts.
The institutional and policy tool considers strategic priorities and political commitment of governments and donors and efficiency of the public spending in the irrigation and hydropower sectors.
As inputs, the financial tool considers: crop data, project data and hydropower data.
Technical assessment
The three tools work in synergy to provide a clear representation of all dimensions relevant to the use and management of water resources for agricultural development and hydropower generation.
The tool identifies the need and potential to invest in water for agriculture and energy. The indicators are used to produce two indexes: the Investment Need Index (INI) and the Investment Potential Index (IPI) that are visually represented using radar graphs. The INI illustrates the need to invest in water resources for increased food and energy production, while the IPI shows the potential of investing in those resources for the same purposes.
Economic assessment
The financial tool provides reliable and project-based estimates of on–going and planned investment in the development of water resources for food and energy production in the short, medium and long terms within a country.
The approach adopted is ‘project-based’, where the information on irrigation and hydropower projects is collected and processed (inputs) in order to derive the investment estimates (outputs).
The tool supports the investment decision-making process by analyzing the sources of project financing, the distribution of investments by type of project over time, and the derivation of financial and economic indicators.
Source FAO Partnership for Agricultural Water for Africa (AgWA),
http://www.fao.org/nr/water/agwa/investment-tools/dti/pt/
Last update 2015

OPPORTUNITIES FOR AGRI-FOOD CHAINS TO BECOME ENERGY-SMART 179
TO
OLS
Title Power Irrigation Tool
Relevance for food value chain stages
On-farm
Processing
Transport
Short description of the tool
This FAO tool evaluates economic, environmental, and social aspects of different energy sources for irrigation in order to help operators to assess the economic viability of different power supply options and water pumping technologies.
Resources considered
The tool provides technical and economic default inputs some of which can be amended by the user. Other inputs provided by the user include: water requirement; irrigation area; head of water source; hours of irrigation per day; water distribution system efficiency; air density (for wind-powered pumping systems); type of irrigation system (surface, drip, sprinkler); field water application efficiency; irrigation period; water lift (pumps to field); and some economic variables such as loan interest rate and variations in energy costs per year.
Default values are provided for: equipment efficiency and cost; performance of solar photovoltaic and wind electricity generators; fuel/electricity price and energy content; fuel/electricity operation cost; renewable energy technology; and cost of equipment.
Technical assessment
The tool shows renewable energy solutions for irrigation which might be alternatives to conventional systems. These include grid-powered electric pump; gasoline electricity generator with electric pump; diesel electricity generator with electric pump; natural gas electricity generator with electric pump; gasoline-powered pump and diesel-powered pump.
Economic assessment
The tool assesses the economics associated with different energy sources for irrigation including the cost, price, and payback time.
Source FAO http://www.fao.org/energy/88788/en/
Last update 2015

OPPORTUNITIES FOR AGRI-FOOD CHAINS TO BECOME ENERGY-SMART180
TO
OLS
6.1.3. BIOENERGY ASSESSMENTTitle Bioenergy and Food Security (BEFS) Rapid Appraisal
Relevance for food value chain stages
On-farm
Processing
Transport
Short description
The BEFS rapid appraisal tool provides countries with a set of easily applicable methodologies and user-friendly tools which allow the user to get an initial indication of their sustainable biomass potential and of the associated opportunities, risks and trade-offs from bioenergy systems.
Resources considered
The BEFS covers the whole biomass supply chain from feedstock production to the processing plant gate. In the case of electricity, distribution of the power is addressed as well. It considers all bioenergy options including solid, liquid and gaseous biofuels and covers the following energy end uses: heating, cooking, electricity and/or heat, and transport. Feedstock options that are investigated comprise agricultural residues, fuelwood and wood residues, and energy crops.
Technical assessment
The tool can assist policy makers and technical officers to:
• outline a country’s energy, agriculture and food security context;
• outline the sustainable bioenergy options of interest;
• obtain initial estimates of which sustainable bioenergy supply chains are viable in the country, based on economic profitability, financial viability, investment requirements, labor implications and smallholder inclusions; and
• identify options of interest that require more in-depth analysis through the BEFS Detailed Analysis section.
Economic assessment
Economic and finance data about the discount rate used to determine the present value of a future investment, the loan interest rate, capital interest rate, and inflation rate by biomass type are inputs used in the analysis.
Source FAO - http://www.fao.org/energy/befs/86304@192081/en/
Last update 2015

OPPORTUNITIES FOR AGRI-FOOD CHAINS TO BECOME ENERGY-SMART 181
TO
OLS
Title Bio Chains Economic Evaluation (BEE)
Relevance for food value chain stages
On-farm
Processing
Transport
Short description
BEE is a packaged model which performs full economic evaluation of bioenergy chains based on the cultivation and production of biomass from different energy crops.
Some parts of the model are based on completed previous modeling work and some others, such as the economic analysis, have been especially prepared for Bio Chains. The economic analysis is common to all modules of the package and offers the necessary information and decision making material as required in commerce and industry today.
It is primarily intended to cover the economic analysis of bioenergy chains, but its agricultural module is general enough to be capable of evaluating crops and plantations other than energy crops.
Resources considered
BEE examines the whole chain from farm to useful bioenergy or biomass fuel delivered at the conversion plant gate. It can analyze more than one crop and more than one conversion technology at the same time.
Technical assessment
BEE consists of three project modules:
• AgrEcon, for the economic analysis of agricultural production;
• TransEcon, for the economic analysis of transport and storage costs; and
• ConvEcon, for the economic analysis of biomass to bioenergy conversion.
Economic assessment
Each module performs an economic analysis based on supplied data or pieces of information maintained by the model itself. The analysis consists of all the steps necessary for decision making including capital budgeting, cost analysis, and investment appraisal. For this purpose it maintains monthly balance sheets, cash flows, and income statements for each of the project modules. It also estimates and analyzes the full cost of biomass production and calculates the most important financial indices and criteria of investment appraisal.
Source http://www.aua.gr/tmhmata/oikonom/soldatos/Bee/BeeHelp/meth_bee.htm
Last update 2004
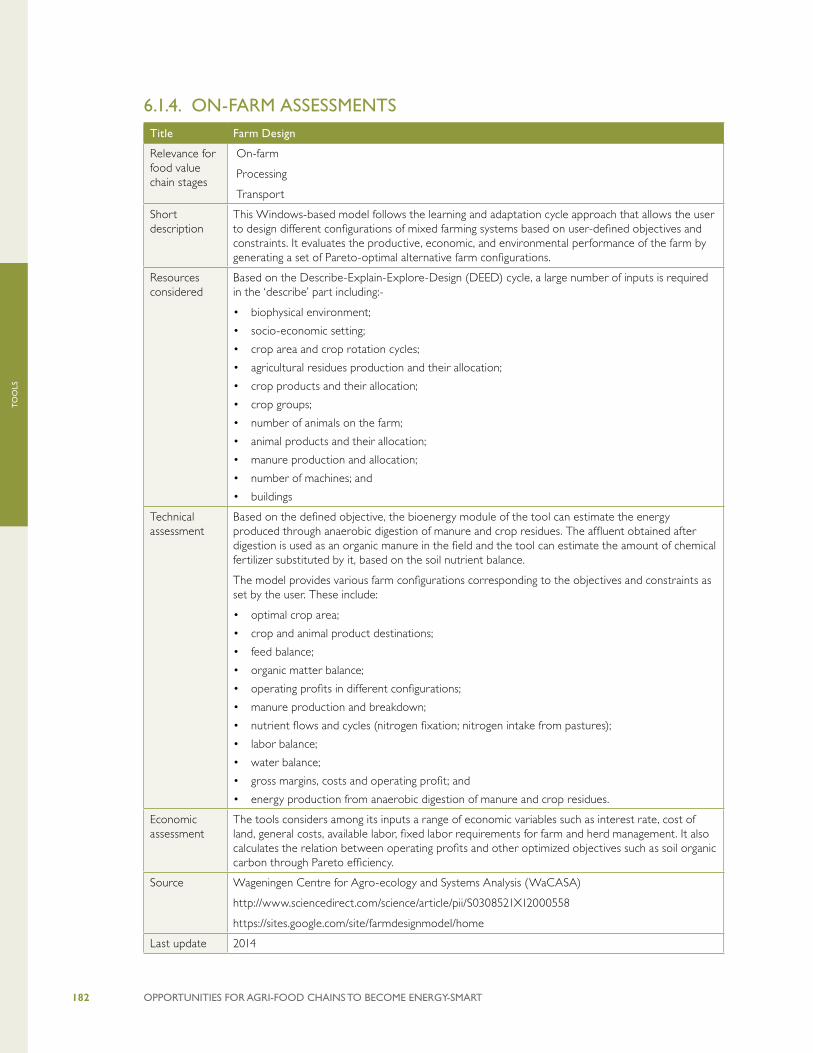
OPPORTUNITIES FOR AGRI-FOOD CHAINS TO BECOME ENERGY-SMART182
TO
OLS
6.1.4. ON-FARM ASSESSMENTSTitle Farm Design
Relevance for food value chain stages
On-farm
Processing
Transport
Short description
This Windows-based model follows the learning and adaptation cycle approach that allows the user to design different configurations of mixed farming systems based on user-defined objectives and constraints. It evaluates the productive, economic, and environmental performance of the farm by generating a set of Pareto-optimal alternative farm configurations.
Resources considered
Based on the Describe-Explain-Explore-Design (DEED) cycle, a large number of inputs is required in the ‘describe’ part including:-
• biophysical environment;
• socio-economic setting;
• crop area and crop rotation cycles;
• agricultural residues production and their allocation;
• crop products and their allocation;
• crop groups;
• number of animals on the farm;
• animal products and their allocation;
• manure production and allocation;
• number of machines; and
• buildings
Technical assessment
Based on the defined objective, the bioenergy module of the tool can estimate the energy produced through anaerobic digestion of manure and crop residues. The affluent obtained after digestion is used as an organic manure in the field and the tool can estimate the amount of chemical fertilizer substituted by it, based on the soil nutrient balance.
The model provides various farm configurations corresponding to the objectives and constraints as set by the user. These include:
• optimal crop area;
• crop and animal product destinations;
• feed balance;
• organic matter balance;
• operating profits in different configurations;
• manure production and breakdown;
• nutrient flows and cycles (nitrogen fixation; nitrogen intake from pastures);
• labor balance;
• water balance;
• gross margins, costs and operating profit; and
• energy production from anaerobic digestion of manure and crop residues.
Economic assessment
The tools considers among its inputs a range of economic variables such as interest rate, cost of land, general costs, available labor, fixed labor requirements for farm and herd management. It also calculates the relation between operating profits and other optimized objectives such as soil organic carbon through Pareto efficiency.
Source Wageningen Centre for Agro-ecology and Systems Analysis (WaCASA)
http://www.sciencedirect.com/science/article/pii/S0308521X12000558
https://sites.google.com/site/farmdesignmodel/home
Last update 2014
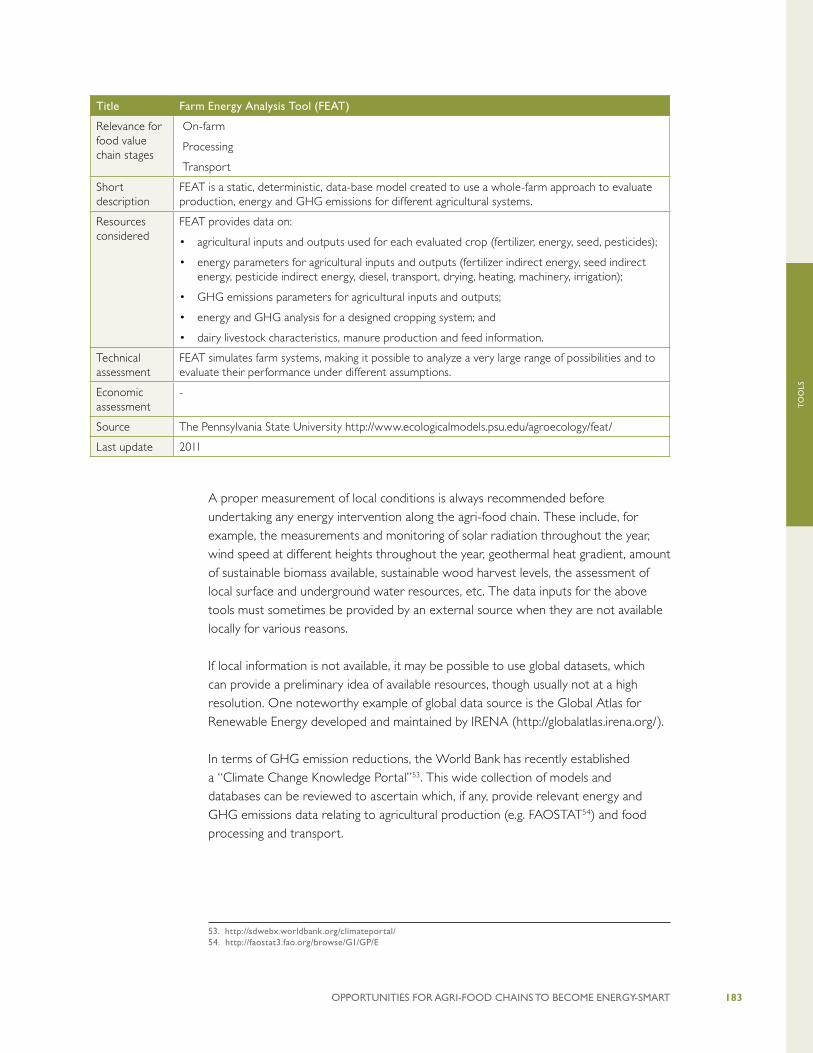
OPPORTUNITIES FOR AGRI-FOOD CHAINS TO BECOME ENERGY-SMART 183
TO
OLS
A proper measurement of local conditions is always recommended before undertaking any energy intervention along the agri-food chain. These include, for example, the measurements and monitoring of solar radiation throughout the year, wind speed at different heights throughout the year, geothermal heat gradient, amount of sustainable biomass available, sustainable wood harvest levels, the assessment of local surface and underground water resources, etc. The data inputs for the above tools must sometimes be provided by an external source when they are not available locally for various reasons.
If local information is not available, it may be possible to use global datasets, which can provide a preliminary idea of available resources, though usually not at a high resolution. One noteworthy example of global data source is the Global Atlas for Renewable Energy developed and maintained by IRENA (http://globalatlas.irena.org/).
In terms of GHG emission reductions, the World Bank has recently established a “Climate Change Knowledge Portal”53. This wide collection of models and databases can be reviewed to ascertain which, if any, provide relevant energy and GHG emissions data relating to agricultural production (e.g. FAOSTAT54) and food processing and transport.
53. http://sdwebx.worldbank.org/climateportal/ 54. http://faostat3.fao.org/browse/G1/GP/E
Title Farm Energy Analysis Tool (FEAT)
Relevance for food value chain stages
On-farm
Processing
Transport
Short description
FEAT is a static, deterministic, data-base model created to use a whole-farm approach to evaluate production, energy and GHG emissions for different agricultural systems.
Resources considered
FEAT provides data on:
• agricultural inputs and outputs used for each evaluated crop (fertilizer, energy, seed, pesticides);
• energy parameters for agricultural inputs and outputs (fertilizer indirect energy, seed indirect energy, pesticide indirect energy, diesel, transport, drying, heating, machinery, irrigation);
• GHG emissions parameters for agricultural inputs and outputs;
• energy and GHG analysis for a designed cropping system; and
• dairy livestock characteristics, manure production and feed information.
Technical assessment
FEAT simulates farm systems, making it possible to analyze a very large range of possibilities and to evaluate their performance under different assumptions.
Economic assessment
-
Source The Pennsylvania State University http://www.ecologicalmodels.psu.edu/agroecology/feat/
Last update 2011
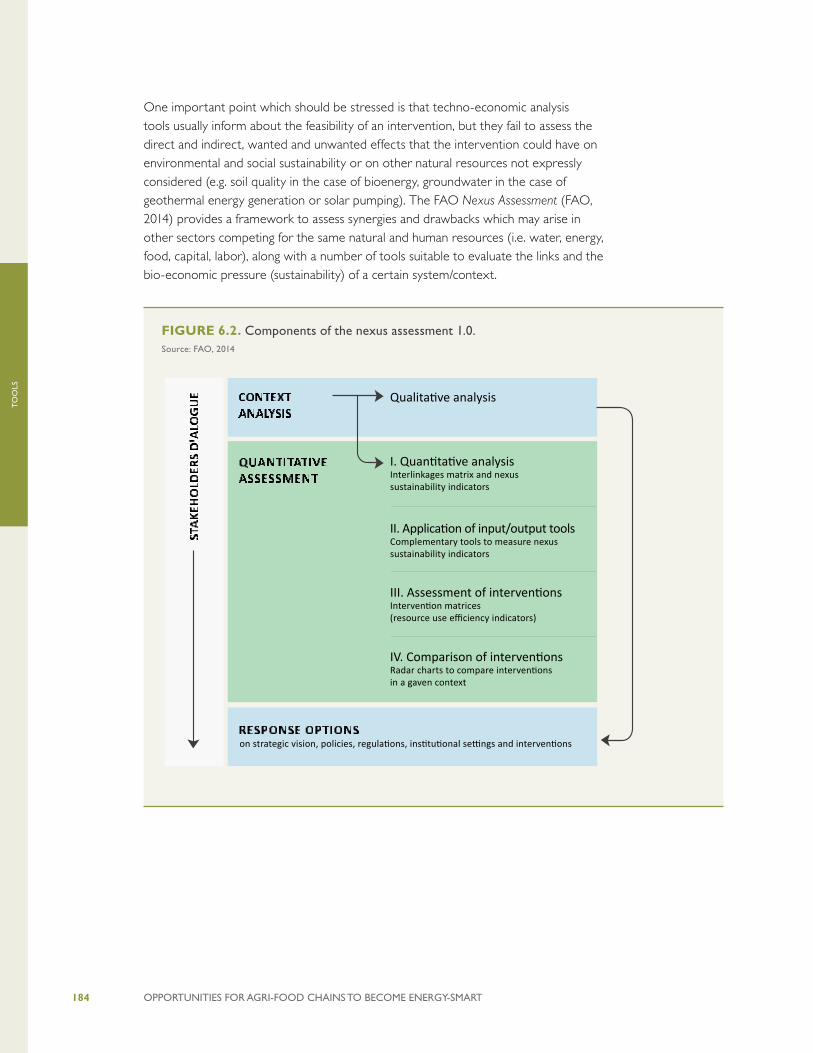
OPPORTUNITIES FOR AGRI-FOOD CHAINS TO BECOME ENERGY-SMART184
TO
OLS
One important point which should be stressed is that techno-economic analysis tools usually inform about the feasibility of an intervention, but they fail to assess the direct and indirect, wanted and unwanted effects that the intervention could have on environmental and social sustainability or on other natural resources not expressly considered (e.g. soil quality in the case of bioenergy, groundwater in the case of geothermal energy generation or solar pumping). The FAO Nexus Assessment (FAO, 2014) provides a framework to assess synergies and drawbacks which may arise in other sectors competing for the same natural and human resources (i.e. water, energy, food, capital, labor), along with a number of tools suitable to evaluate the links and the bio-economic pressure (sustainability) of a certain system/context.
FIGURE 6.2. Components of the nexus assessment 1.0. Source: FAO, 2014
8
]E
NE
RG
Y[
The proposed WEF nexus assessment approach helps “walking the talk” regarding nexus
promotion. It is innovative in many ways:
it provides a stepwise process to address policy-making and intervention
in a nexus manner;
the indicators it proposes have been selected on the basis of available international
datasets in case one wishes to carry out a nexus rapid appraisal, as the second best
option to generating context specific information;
it combines quantitative and qualitative assessment methods;
last but not least, it considers it is essential to link intervention assessment to context
status as a key condition to assess the sustainability and appropriateness of
interventions. The approach shows how to do this in practice.
Given its innovative character, the proposed nexus assessment approach should be considered
work in progress, to be improved as lessons from its implementation will be drawn.
F i g u r e E . 1
The components of the nexus assessment 1.0

OPPORTUNITIES FOR AGRI-FOOD CHAINS TO BECOME ENERGY-SMART 185
TO
OLS
FIGURE 6.3. Quantitative nexus assessments of specific interventions can be compared following a common framework. The resource efficiency performance of specific interventions (grey polygon) are assessed against the bio-economic pressure of the context (background) to highlight trade-offs. W=water, E=energy, F=food, L=labor, C=cost.
Source: FAO, 2014
63
NEXUS ASSESSMENTCHAPTER 4
4.8 Comparison of interventions
The assessment of single interventions and of nexus
context status can be combined in a single diagramme
to highlight where interventions are having a high
impact on nexus components that are already
at stake (Fig. 10).
The nexus assessment does not suggest which interventions are better than others in
absolute terms but just highlights the trade-offs and on which aspects the intervention is
adding pressure to nexus sustainability components already not sustainable or at risk of
becoming not sustainable. Of course the interventions which have a high impact on nexus
aspects which are already under pressure should be avoided.
Again, it should be reminded that both indicators used to measure sustainability aspects
and intervention performance should usually be chosen by a participatory process which
involves the affected stakeholders. As a result, two nexus context assessments of the same
system could appear slightly different because of the weights that different stakeholders
gave to different sustainability aspects, and the sustainability indicators chosen.
For example the three diagrammes of Fig. 10 refer to the same country/context, but the
indication of context sustainability may change on the basis of the specific ‘nexus issue’
analysed. For example, in this case, the context analysis of an intervention dealing with
F i g u r e 1 0
The three examples of visual representations above highlight which interventions are having a
high impact on nexus aspects already under stress. They refer to the same country/context.
A. SOLAR IRRIGATION IN REGION a
C. MINI-HYDRO IN REGION a
B. HYBRID DIESEL-SOLAR IRRIGATION IN REGION a
L
W
E
F
C
4
5
3
2
1
0
L
W
E
F
C
4
5
3
2
1
0
L
W
E
F
C
4
5
3
2
1
0


OPPORTUNITIES FOR AGRI-FOOD CHAINS TO BECOME ENERGY-SMART 187
KN
OW
LED
GE
GA
PS
7. KNOWLEDGE GAPSAdditional knowledge is needed for a range of commodities concerning the amount and types of energy inputs at particular stages along the agri-food chain and the entry points of various low-carbon technologies. Some questions that are difficult to answer without further research and analysis are as follows:
• What are the forms of energy and types of end-use technologies currently in use that could be improved upon to reduce energy intensities (MJ/kg of food product)?
• What practical alternative and economically feasible options can be optimized for a specific location to replace fossil fuels with renewable energy systems for heating, cooling, and electricity generation?
• How can energy end-use efficiency be increased and the energy demand side managed better to drive rural economic development along more climate-friendly pathways?
Wherever possible, water was included in the discussions of the selected food chains but knowledge gaps exist, particularly at the food processing stage of the chains. The data for water use and volumes consumed during food processing operations is very uncertain given that the few global datasets available do not cover all countries. Chapter 18 of the World Water Development Report 4 “Managing water along the livestock value chain”55 gives some data. It may be that individual countries have collected such data. The FAO database AQUASTAT focuses on country data for irrigation and not on water use beyond the farm gate.
For individual food chains in general, there are few comparisons available concerning the energy use for different methods of transport of the products from the field and to markets (USAID 2009). For specific food chains such as green beans, dry beans and carrots, few energy-related studies exist compared with milk products.
The availability of quality analysis tools to help evaluate energy-smart food production and processing in terms of techno-economic energy demand options and renewable energy and water use have improved in recent years. A techno-economic tool usually informs about the cost, feasibility, and mitigation potential of an intervention, but they often fail to assess the direct and indirect effects, and whether the effects are wanted or unwanted. An intervention could adversely impact environmental and social sustainability or other natural resources not expressly considered such as soil quality
55. See http://www.unesco.org/new/en/natural-sciences/environment/water/wwap/wwdr/wwdr4-2012/ and the chapter is on page 440-464 of this report: http://unesdoc.unesco.org/images/0021/002156/215644e.pdf.

OPPORTUNITIES FOR AGRI-FOOD CHAINS TO BECOME ENERGY-SMART188
KN
OW
LED
GE
GA
PS
in the case of biomass removal, groundwater quality in the case of geothermal energy generation, or downstream users in the case of solar or wind water pumping.
The FAO Nexus Assessment (FAO, 2014) provides a framework to assess synergies and drawbacks which may arise in other sectors competing for the same natural and human resources such as water, energy, food, capital, and labor. Tools suitable for closer evaluation and monitoring of the bio-economic pressure and long-term sustainability of a specific system in a given context would be useful.
OPPORTUNITIES FOR AGRI-FOOD CHAINS TO BECOME ENERGY-SMART 189 CO
NC
LUSI
ON
S A
ND
REC
OM
MEN
DA
TIO
NS
8. CONCLUSIONS AND RECOMMENDATIONS
A detailed analysis of the energy demand along the three selected value chains, milk, rice, and vegetables, was undertaken. An assessment of the potential for clean energy solutions was made for each specific value chain. Where feasible, the identification of priority stages, entry points, steps, and interventions for introducing the identified clean energy solutions into each value chain was made. As a result of introducing clean energy solutions, potential success factors were noted where feasible and indicators identified to measure this success. A brief assessment was conducted of the areas where knowledge gaps exist and where additional research could be undertaken to fill them. Avoiding food losses along the entire length of the agri-food chains would help to reduce the overall demands for energy, water, and land use but this option was not considered in detail, although wise energy planning along the value chain has high potential to reduce losses.
Based on the analysis of the three selected food chains, energy efficiency opportunities exist to reduce energy demand at all stages along the agri-food chain for both large and small-scale systems in all countries. Where the energy supply comes from fossil fuels, reductions in greenhouse gas emissions would also result. However, energy efficiency improvements on-farm can be deemed successful only if crop and animal productivity does not decline as a result.
There are many opportunities for reducing energy end-use inputs in food processing operations since the energy intensity of many processing plants can be more than 50% higher than necessary due to outdated technologies, lack of understanding, and poor energy efficiency systems when bench-marked against the best available technologies. This provides a significant opportunity for reducing energy demand and its associated GHG emissions. Over 100 technologies and measures for improving energy efficiency have been identified. Some have been outlined in the cross-cutting Section 2 and others are presented in the milk product, rice, and vegetable agri-food chains as outlined in Sections 3, 4 and 5. For example, combined heat and power can reduce energy demand by 20% to 30% and reductions between 5% and 35% of total CO2-eq emissions can be made by investing in improved heat exchanger networks or heat pumps.
Sustainable agriculture production systems that use energy wisely, together with “climate-smart” and “energy-smart” agri-food processing and delivery systems, can

OPPORTUNITIES FOR AGRI-FOOD CHAINS TO BECOME ENERGY-SMART190CO
NC
LUSI
ON
S A
ND
REC
OM
MEN
DA
TIO
NS
be cost-effective and become pragmatic solutions for sustainable development. They can also bring significant structural changes, improved livelihoods, and enhanced food security to rural communities in many countries. However, there is a need for targeted action in support of such developments in order to obtain better evidence of the co-benefits and dis-benefits resulting from supporting clean energy systems.
Co-benefits can include improved health, time savings, reduced drudgery, water savings, increased productivity, improved soil quality and nutrient values, biodiversity protection, food security, and better livelihoods and quality of life. Dis-benefits might include the possibility of lower crop productivity such as from minimum tillage for vegetable production. Potential trade-offs also need to be carefully considered such as using more packaging materials to increase the shelf life of food products.
A range of existing tools were identified that can enable data-based decision making to be better achieved as well as to assess the profitability of a proposed investment in a clean energy solution. Prioritizing such tools is not possible in general terms, so selection of the most suitable tool for any given purpose and location is necessary after careful deliberations.
In summary, the current dependence on fossil fuel inputs by the agri-food industry results in around 7% to 8% of global greenhouse gas emissions, (with approximately double this amount of emissions coming from agricultural methane and nitrous oxide emissions). These CO2-eq emissions can be reduced by improved energy efficiency along the length of the agri-food chain and the deployment of renewable energy systems to displace fossil fuels. Various co-benefits also arise and should be accounted for in any policy development. However, for non-industrialized agri-food systems, increased energy inputs can lead to greater food security and improved livelihoods for the rural poor. The challenge is to meet such growing energy demands with low-carbon energy systems and to use the energy efficiently throughout the production, transport, processing, storage and distribution of food.

OPPORTUNITIES FOR AGRI-FOOD CHAINS TO BECOME ENERGY-SMART 191
REFERENCES
Abbas A and Ansumali S, 2010. Global Potential of
Rice Husk as a Renewable Feedstock for Ethanol Biofuel
Production. Bio Energy Research, 3(4), 328–334.
ACIAR, 2011. Conservation trials impress in southern
Ethiopia. Australian Centre for International
Agricultural Research. Available online at http://aciar.
gov.au/content/conservation-agriculture-trials-impress-
southern-ethiopia-0
Aguirre E, 2009. Solar drip irrigation to benefit farmers
in developing countries. UMass Lowell news article, 5
June. Available online at http://www.uml.edu/News/
stories/2008-09/solar_irrigation_system.aspx
Ahiduzzaman M and Sadrul Islam A K, 2009. Energy
utilization and environmental aspects of rice processing
industries in Bangladesh. Energies,2(1), 134-149.
Alexandratos N. and Bruinsma J. 2012. World agriculture
towards 2030/2050: the 2012 revision. ESA working
paper No. 12-03. Rome: FAO. Available online at
http://www.fao.org/docrep/016/ap106e/ap106e.pdf
Alipour A, Veisi H, Darijani F, Mirbagheri B, and
Behbahani A G, 2012. Study and determination
of energy consumption to produce conventional rice
of the Guilan province. Research in Agricultural
Engineering, 58(3), 99-106.
Ashburner J E and Kienzle J, 2011. Investment in
agricultural mechanization in Africa. Conclusions and
recommendations of a Round Table Meeting of
Experts, Arusha, Tanzania. June 2009. Agricultural
and Food Engineering Technical Report 8, Food and
Agriculture Organization of the United Nations, Rome.
ISBN 978-92-5-1068208-5.
Baker C J, Saxton C E, Ritchie W R, Chamen W
C T, and Reicosky D C, 2006. No tillage seeding in
conservation agriculture. CABI publishers, 352 pages.
Available online at http://bookshop.cabi.org/?site=191&
page=2633&pid=1970
Bardi U, 2004. Solar power agriculture: a new paradigm
for energy production, Proc. “2004 New and Renewable
Energy Technology Developments for Sustainable
Development” conference, Evora, Portugal June.
Available online at http://www.spiritviewranch.com/pdf/
Christoph/archive/Solar%20Power%20Agriculture.pdf
Barreto C, and Duffy J, 2009. Low-cost solar drip
irrigation for small farmers in developing countries.
0158. Buffalo: ASES.
Baruah D C, and Dutta P K, 2007. An investigation into
the energy use in relation to yield of rice (Oryza sativa) in
Assam, India. Agriculture, Ecosystems & Environment,
120(2-4), 185–191.
Bazilian M, Nussbaumer P, Haites E, Levi M, Howells
M, and Yumkella K K, 2010. Understanding the scale of
investment for universal energy access. Geopolitics of
Energy 32, 21 –42.
BINE Informationsdienst, 2011. Brewing beer with solar
heat. Available online at http://www.bine.info/fileadmin/
content/Publikationen/Englische_Infos/projekt_1310_
engl_internetx.pdf
Bockari-gevao S M, Ishak W, Yahya A, and Wan C C,
2005. Analysis of energy consumption in lowland rice-based
cropping system of Malaysia. Songklanakarin Journal of
Science and Technology, 27(Jul.-Aug.), 819–826.
Bomford M, 2011. Beyond food miles, Post Carbon
Institute. Available online at http://www.resilience.org/
stories/2011-03-09/beyond-food-miles
http://www.bine.info/fileadmin/content/Publikationen/Englische_Infos/projekt_1310_engl_internetx.pdf
http://www.bine.info/fileadmin/content/Publikationen/Englische_Infos/projekt_1310_engl_internetx.pdf

OPPORTUNITIES FOR AGRI-FOOD CHAINS TO BECOME ENERGY-SMART192
CAE, 1996. Energy efficiency- a guide to current and
emerging technologies, Vol. 2 Industry and Primary
Production, Centre for Advanced Engineering,
University of Canterbury, Christchurch, New Zealand.
Cederberg C, Meyer D, & Flysjö A, 2009. Life cycle
inventory of greenhouse gas emissions and use of land
and energy in Brazilian beef production. Available online
at http://www.konkurrensverket.se/globalassets/
upphandling/hallbarhet/life-cycle-inventory-of-
greenhouse-gas-emissions-and-use-of-land-and-
energy-in-brazilian-beef-production-sik-2009792.pdf
Chapagain A, 2009. Water footprint of rice. In re-thinking
paradigms: Water and food security. 4th Marcelino Botín
Foundation Water Workshop, Santander (Spain) (pp.
22–24). Available online at http://www.rac.es/ficheros/
doc/00740.pdf
Chemonics International 2013. The fresh fruit and
vegetable markets of East Africa. Available online at
http://www.competeafrica.org/Files/FFV_Markets_
of_East_Africa_final_approved_and_compressed_
July_17_2013.pdf
Cleland D, 2010. Towards a sustainable cold chain. 1st
International Cold Chain Conference, International
Institute of Refrigeration, Cambridge, UK. March.
Available online at http://d3n8a8pro7vhmx.
cloudfront.net/eatradehub/pages/83/attachments/
original/1378732967/FFV_Markets_of_East_Africa_
final_approved_and_compressed_July_17_2013.
pdf?1378732967
CliqueSolar, 2015. Mahanand Dairy’s successful
installation of ARUN solar boiler and concentrated solar
thermal system for its thermal energy needs. Available
online at http://www.cliquesolar.com/DairyIndustry.
aspx
Cuellar, A D and Weber, M E 2010. Wasted food,
wasted energy: The embedded energy in food waste in
the United States. Environ. Sci. Technol. 2010, 44, pp:
6464-6469. http://pubs.acs.org/doi/pdfplus/10.1021/
es100310d
DairyAustralia, 2011. Australian dairy manufacturing
environmental sustainability report. Available
on line at http://www.dairyinnovation.com.
au/_literature_160844/DMSC_Sustainability_
Report_2010-11
EECA, 2014. Irrigation energy efficiency evaluation pilot
– summary report. Energy Efficiency and Conservation
Authority, New Zealand. Available online at http://
www.eeca.govt.nz/resource/irrigation-energy-
efficiency-evaluation-pilot-summary-report
Energy Efficiency and Conservation Authority
(New Zealand), 2009. Dairy farmers milk free energy.
Available online at http://www.solarthermalworld.org/
sites/gstec/files/New%20Zealand%20Dairy%20Farms.
Envirocheme, 2015. Wastewater treatment in the dairy
processing industry - recovering energy using anaerobic
technology. Available online at http://envirochemie.com/
cms/upload/downloads-en/fachbeitraege/Whitepaper_
Wastewater_treatment_in_the_dairy_processing_
industry_.pdf
Environment Agency, 2014. Guidance on: Waste
exemption: T25 anaerobic digestion at premises not used
for agriculture and burning resulting biogas. Available
online at https://www.gov.uk/waste-exemption-
t25-anaerobic-digestion-at-premises-not-used-for-
agriculture-and-burning-resulting-biogas and see
also https://www.gov.uk/search?q=biogas&filter_
organisations%5B%5D=environment-agency
Faleye T, David J, Dada-Joel O T, Chukwu U
C, and Ademiluyi, Y S, 2013. Determination of
energy consumption in lowland rice production in
Nigeria. International Research Journal of Agricultural
Science and Soil Science, 3(10), 336-342.
FAO, 2015. Gateway. Available online at http://www.
fao.org/agriculture/dairy-gateway/milk-and-milk-
products/en/

OPPORTUNITIES FOR AGRI-FOOD CHAINS TO BECOME ENERGY-SMART 193
FAO, 2014. Walking the Nexus Talk- assessing the
Water-Energy-Food nexus. Food and Agriculture
Organization of the UN. Available online at http://
www.fao.org/energy/81320/en/
FAO, 2013. Climate-Smart Agriculture Sourcebook.
Available online at http://www.fao.org/docrep/018/
i3325e/i3325e00.htm
FAO, 2013b. Utilization of fruit and vegetable wastes as
livestock feed and as substrates for generation of other
value-added products. RAP Publication 2013/04
FAO, 2013c. Food wastage footprint. Impacts on natural
resource. Summary Report.
FAO, 2012. Energy-Smart Food at FAO: An Overview.
Food and Agriculture Organization of the United
Nations, Rome.
FAO, 2011a. Energy-smart food for people and climate.
Issue paper. Food and Agriculture Organization of the
United Nations, Rome. Available online at http://www.
fao.org/docrep/014/i2454e/i2454e00.pdf
FAO, 2011b. Save and grow – a policy maker’s guide
to the sustainable intensification of smallholder crop
production. Plant Production and Protection Division,
Food and Agricultural Organization of the United
Nations, Rome.
FAO, 2011c. Veterinary help for livestock herders brings
relief to Angola. Available online at http://www.fao.org/
in-action/veterinary-help-for-livestock-herders-brings-
relief-to-angola/en/
FAO, 2009. Small scale bioenergy initiatives – brief
description and preliminary lessons on livelihood impacts
from case studies in Asia, Latin America and Africa.
Policy Innovation Systems for Clean Energy Security
(PISCES), Practical Action, and FAO, Environment and
Natural Resources Management working paper 31,
149 pages. Food and Agricultural Organization of the
United Nations, Rome. Available online at http://www.
fao.org/docrep/011/aj991e/aj991e00.htm
FAO, 2004. Unified bioenergy terminology. Food
and Agricultural Organization of the United Nations,
Rome ftp://ftp.fao.org/docrep/fao/007/j4504e/
j4504e00.pdf
FAO, 1999. Fuel and financial savings for operators
of small fishing vessels. Food and Agricultural
Organization of the United Nations, Rome.
Frater T G, 2011. Energy in New Zealand apple
production. PhD thesis, Massey University library,
Palmerston North, New Zealand.
Fritzson A, and Berntsson T, 2006. Energy efficiency
in the slaughter and meat processing industry—
opportunities for improvements in future energy markets.
Journal of Food Engineering 77, 792–802. doi:
10.1016/j.jfoodeng.2005.08.005, ISSN: 02608774.
Galitsky C, Worrell E and Ruth M, 2003. Energy
efficiency improvement and cost saving opportunities for
the corn wet milling industry: an ENERGY STAR guide
for energy and plant manager. Report LBNL-52307,
Lawrence Berkeley National Laboratory , Berkeley,
California, USA.
Ganesh R, 2015. President commissions pioneer
gasification plant in Essequibo –deems initiative a
welcome development. Available online at http://
guyanachronicle.com/president-commissions-pioneer-
gasification-plant-in-essequibo-deems-initiative-a-
welcome-development/
Gerber P, Vellinga T, Opio C, Henderson B, and
Steinfeld H, 2010. Greenhouse Gas Emissions from the
Dairy Sector A Life Cycle Assessment. Available online at
http://www.fao.org/docrep/012/k7930e/k7930e00.pdf
Gandhi, 2015. We reach out to over 1.4 million Indian
farmers. Available online at http://indiagri.in/interview-
detail.aspx?id=18
OPPORTUNITIES FOR AGRI-FOOD CHAINS TO BECOME ENERGY-SMART194
Giampietro M, 2002. Energy use in agriculture.
Encyclopedia of Life Sciences, MacMillan Publishers,
Nature Publishing Group. Available online at www.els.
net
GIZ, 2013. Rice cropping system and resource efficiency.
Available online at http://www.giz.de/fachexpertise/
downloads/giz2013-en-Study-rice-cropping-sys-low-res.
GIZ, 2011. Modern energy services for modern
agriculture – a review of smallholder farming in
developing countries. Available online at http://www.
gtz.de/de/dokumente/giz2011-en-energy-services-for-
modern-agriculture.pdf
GoS, 2011. Foresight project on global food and farming
futures. Synthesis Report C12: Meeting the challenges
of a low-emissions world, UK Government Office for
Science, London. Available online at http://www.bis.gov.
uk/assets/bispartners/foresight/docs/food-and-farming/
synthesis/11-632-c12-meeting-challenges-of-low-
emissions-world.pdf
Gronroos J, Seppala J, Voutilainen P, Seuri P, &
Koikkalainen K, 2006. Energy use in conventional
and organic milk and rye bread production in Finland.
Agriculture, Ecosystems & Environment, 117(2-3),
109–118. Available online at http://doi.org/10.1016/j.
agee.2006.03.022
Gummert M, 2011. Paddy drying systems. Available
online at http://www.knowledgebank.irri.org/training/
fact-sheets/postharvest-management/drying-fact-sheet-
category/paddy-drying-systems-fact-sheet
Heinberg R and Bomford M, 2009. The food and farming
transition – towards a post-carbon food system. Post
Carbon Institute, Sebastopol, California. Available
online at http://www.postcarbon.org/publications/food-
and-farming-transition/
Heller M C and Keoleian G A, 2000. Life cycle-based
sustainability indicators for assessment of the US food
system. Center for Sustainable Systems, University of
Michigan, Report CSS00-04. Available online at http://
css.snre.umich.edu/css_doc/CSS00-04.pdf
IARW, 2014. 2014 IARW Global Cold Storage Capacity
Report
ICT in Agriculture, 2011. Module 1: Introduction: ICT in
Agricultural Development. Available online at http://www.
ictinagriculture.org/sourcebook/module-1-introduction-
ict-agricultural-development
IEA, 2014. World Energy Outlook, 2014. International
Energy Agency, OECD/IEA, Paris.
IFC, 2010. Scoping Study Clean Technology Opportunities
and Barriers in Indonesian Palm Oil Mill and Rice Mill
Industries. Available online at http://www.ifc.org/wps/
wcm/connect/8894fe804726241c945cbf2b131bed2a/
Scoping%2BStudy%2Bclean%-2Btechnology%2Bopport
unities%2Bin%2BIndonesia.pdf?MOD=AJPERES
IMO, 2008. Updated Study on greenhouse gas emissions
from ships 2008-2009. International Maritime
Organization. Available online at http://www.unctad.
org/sections/wcmu/docs/cimem1p08_en.pdf
IPCC, 2011a. Summary for Policy Makers, IPCC Special
Report on Renewable Energy Sources and Climate Change
Mitigation, Cambridge University Press. Available online
at http://srren.ipcc-wg3.de/report/IPCC_SRREN_SPM.
IPCC, 2011b. Renewable Energy Sources and Climate
Change Mitigation, IPCC Special Report, Cambridge
University Press. Available online at http://srren.ipcc-
wg3.de/report
IPCC, 2007. 4th Assessment Report - Mitigation, Chapter
7, Industry, Working Group III, Intergovernmental Panel
on Climate Change. Available online at www.ipcc-wg3.
de/publications/assessment-reports/ar4/.fi les-ar4/
Chapter07.pdf

OPPORTUNITIES FOR AGRI-FOOD CHAINS TO BECOME ENERGY-SMART 195
IPNI, 2005. Rice ecosystems. Available
online at http://www.ipni.net/ppiweb/filelib.
nsf/0/6191D544DF714DEF48257074002E78E6/$file/
Rice%20HB%20p2-5.pdf
IRENA, 2014. Capacity Building for Solar Agro-processing
in the Pacific. Available online at http://www.irena.org/
documentdownloads/events/2015/VIA/IRENA_Solar_
Agroprocessing_VIA_2014.pdf
Jittanit W, Saeteaw N,and Charoenchaisri A, 2010.
Industrial paddy drying and energy saving options. Journal
of Stored Products Research, 46(4), 209-213.
Keiser J, Utzinger J, and Singer B H, 2002. The potential of
intermittent irrigation for increasing rice yields, lowering water
consumption, reducing methane emissions, and controlling
malaria in African rice fields. Journal of the American
Mosquito Control Association, 18(4), 329-340.
Kim D, Thoma G, Nutter D, Milani F, Ulrich R, &
Norris G, 2013. Life cycle assessment of cheese and
whey production in the USA. The International Journal
of Life Cycle Assessment, 18(5), 1019–1035. Available
online at http://doi.org/10.1007/s11367-013-0553-9
Kim D, Thoma G, Ulrich R, Nutter D, & Milani F,
2014. Life Cycle Assessment of Cheese Manufacturing in
the United States. Proceedings of the 9th International
Conference on Life Cycle Assessment in Agri-Food Sector
(LCA Food 2014). Available online at http://lcafood2014.
org/papers/98.pdf
Kiruja J, 2011. Use of Geothermal Energy in Dairy
Processing. United Nations University Geothermal
Training Report 16, 303-326. Available online at http://
www.os.is/gogn/unu-gtp-report/UNU-GTP-2011-16.pdf
Kizilaslan H, 2009. Input–output energy analysis of
cherries production in Tokat Province of Turkey. Applied
Energy 86(7), 1354-1358.
Lehmann J and Joseph S, 2009. Biochar for
environmental management: science and technology.
Earthscan Publications, London.
LGA, 2009. War on waste – food packaging Study,
Wave 3. Local Government Association, BMRB report
45106324. Available online at http://www.lga.gov.uk/
lga/aio/1613930
Lobell D B, Burke M B, Tebaldi C, Mastrandrea M
D, Falcon W P and Naylor R L, 2008. Prioritizing
climate change adaptation needs for food security in
2030, Science, 319(5863), 607-610 DOI: 10.1126/
science.1152339
Lundie S, Dennien G, Morain M, & Jones M, 2007.
Generation of an Industry-specific Physico-chemical
Allocation Matrix. Application in the Dairy Industry
and Implications for Systems Analysis (9 pp). The
International Journal of life cycle assessment 12(2),109-
117
McBratney A, Whelan B, Ancev T and Bouma J,
2006. Future directions of precision agriculture. Precision
Agriculture, 6(1), 7-23. DOI 10.1007/s11119-005-0681-
8. Available online at http://www.springerlink.com/
content/r4k236p6582x2143/
Mehrtash M, Quesada G, Dutil Y, Rousse D, 2012.
Performance evaluation of sun tracking photovoltaic
systems in Canada. Available online at http://www.t3e.
info/pdf/Publications/2012-ISME-%20Performance%20
Evaluation%20of%20Sun%20Tracking%20
Photovoltaic%20Systems%20in%20Canada.pdf
Mekonnen M M and Hoekstra A Y, 2011. The green,
blue and grey water footprint of crops and derived crop
products. Hydrology and Earth System Sciences, 15(5),
1577-1600
Mekonnen M M and Hoekstra A Y, 2010. The green,
blue and grey water footprint of farm animals and animal
products. Available online at http://waterfootprint.
org/media/downloads/Report-48-WaterFootprint-
AnimalProducts-Vol1.pdf
Mendes Souza G, Victoria R L, Joly C, Verdade L
M, 2015. Bioenergy & Sustainability: bridging the gaps.
SCOPE

OPPORTUNITIES FOR AGRI-FOOD CHAINS TO BECOME ENERGY-SMART196
Mohammadi A, et al. 2010. Energy inputs–yield
relationship and cost analysis of kiwifruit production in
Iran. Renewable energy 35(5), 1071-1075.
Moulds J, 2015. Chocolate company Ferrero to
make packaging using Nutella leftovers. Available
online at http://www.theguardian.com/sustainable-
business/2015/apr/21/ferrero-packaging-nutella-
nutshell-biomass-biofuel?CMP=share_btn_tw
Nagaraja M, Kumar R D, Ashwanandhini G, Nisha V,
Monika L, Lakshmi A B, and Sivaranjani E, 2013. Bio-
energy from coconut shells. Advances in Agriculture,
Sciences and Engineering Research, 3(2), 677-680.
Nelson G C, Robertson R, Msang S, Zhu T, Liao
X and Jawajar P, 2009. Greenhouse gas mitigation
– issues for Indian agriculture, Discussion paper
00900, International Food Policy Research Institute,
Washington DC, 39 pp. http://www.ifpri.org/sites/
default/files/publications/ifpridp00900.pdf
Nkwocha K, 2013. Milk chilled by solar power. Available
online at http://www.pv-tech.org/sunnyside/milk_
chilled_by_solar_power
NSCA, 2006. Biogas as a road transport fuel. National
Society for Clean Air and Environmental Protection,
Brighton, UK. ISBN 0 903 47461 1
Opio C, Gerber P, Mottet A, Falcucci A, Tempio G,
MacLeod M, Vellinga T, Henderson, B and Steinfeld
H, 2013. Greenhouse gas emissions from ruminant
supply chains - A global life cycle assessment. Food and
Agriculture Organization of the United Nations (FAO),
Rome.
Ozkan B, Akcaoz H, and Karadeniz F, 2004. Energy
requirement and economic analysis of citrus production
in Turkey. Energy Conversion and Management 45(11),
1821-1830.
Pittelkow C M, Liang X, Linquist B A, van Groeningen
A J, Lee J, Lundy M E, van Gestel N, Six J, Venterea
R T and van Kessel C, 2014. Productivity limits and
potential of the principles of conservation agriculture.
Letter. MacMillan Publishers Ltd, /Nature
Practical Action, 2015. The Energy–Water–Food
Nexus at Decentralized Scales - Synergies, trade-offs,
and how to manage them
Ramirez C, Patel M, and Blok K, 2006. From fluid
milk to milk powder: Energy use and energy efficiency
in the European dairy industry. Energy, 31(12), 1984–
2004. Available online at http://doi.org/10.1016/j.
energy.2005.10.014
REEEP, 2010. Energy efficiency best practices handbook
for SMEs: Energy efficiency in rice mill sector. Available
online at http://toolkits.reeep.org/file_upload/12450_
tmpphpfOD1zf.pdf
REN 21, 2014. Renewables 2014 Global status
report. Available online at http://www.ren21.net/
REN21Activities/GlobalStatusReport.aspx
Roy S K, 2011. On-farm storage technology can save
energy and raise farm income.
Salam A, 2015. Presentation “Energy Food Nexus:
Case of Rice production in Mekong Region” given
at the workshop “Water Energy Food Nexus:
International Cooperation and Technology Transfer”.
Paris, 18 March 2015
Sanford S, 2003. Heating water on dairy farms.
University of Wisconsin–Cooperative Extension
Publication. Madisan, Wisconsin. Available online at
http://learningstore.uwex.edu/Assets/pdfs/A3784-02.
Sarrouy C, & Lillywhite R, 2012. Product energy use
within the agri-food supply chain. In VIII International
conference on life cycle assessment in agri-food sector.
OPPORTUNITIES FOR AGRI-FOOD CHAINS TO BECOME ENERGY-SMART 197
Sims R, Schaeffer R, Creutzig F, Cruz-Núñez X,
D’Agosto M, Dimitriu D, Figueroa Meza M J, Fulton
L, Kobayashi S, Lah O, McKinnon A, Newman P,
Ouyang M, Schauer J J, Sperling D, and Tiwari G,
2014: Transport. In: Climate Change 2014: Mitigation of
Climate Change. Contribution of Working Group III to
the Fifth Assessment Report of the Intergovernmental
Panel on Climate Change, Cambridge University Press,
Cambridge, United Kingdom and New York, NY, USA.
Sims R, Mercado P, Krewitt W, Bhuyan G, Flynn D,
Holttinen H, Jannuzzi G, Khennas S, Liu Y, O’Malley
M, Nilsson L J, Ogden J, Ogimoto K, Outhred H,
Ulleberg O, van Hulle F, 2011. Integration of Renewable
Energy into Present and Future Energy Systems. Chapter
8 in IPCC Special Report on Renewable Energy
Sources and Climate Change Mitigation Cambridge
University Press. Available online at http://srren.ipcc-
wg3.de/report/IPCC_SRREN_Ch08.pdf
Smil V, 2008. Energy in nature and society- general
energetic of complex systems, MIT Press, Cambridge,
Massachusetts. 512 pages.
Solar food processing network, 2015. Tapi food – Solar
food processing company. Available online at http://
www.solarfood.org/projects/121-tapi-food-solar-food-
processing-company
STAP, 2015. Black carbon mitigation and the role of
the Global Environment Facility. A STAP advisory
document, Scientific and Technical Advisory Panel
of the GEF http://www.stapgef.org/stap/wp-content/
uploads/2015/10/Black-Carbon-Web-Single.pdf
STAP, 2015. Optimizing the global environmental benefits
of transport biofuels. A STAP advisory document.
Scientific and Technical Advisory Panel of the Global
Environment Facility (in press)
Tabatabaie S, Hossein M et al., 2013. Energy use
pattern and sensitivity analysis of energy inputs and input
costs for pear production in Iran. Renewable Energy 51,
7-12.
Taylor D, 2009. Milk cooler powered by renewable
energy could help Ugandan dairy farmers.
TERI, 2001. Rice-husk-fired boiler for parboiling rice mills,
Available online at http://www.teriin.org/technology/
rice-husk-fired
Tetra Pak processing systems, 1996. Dairy processing
handbook. Lund. Available online at http://www.
tetrapak.com/usprocessing/media/dairy-processing-
handbook
Tullberg J. N., 2014. Energy in crop production systems.
Sustainable Energy Solutions in Agriculture
UNESCO, 2012. Chapter 18 of the World Water
Development Report 4 “Managing water along
the livestock value chain” Available online at http://
unesdoc.unesco.org/images/0021/002156/215644e.pdf
and
http://www.unesco.org/new/en/natural-sciences/
environment/water/wwap/wwdr/wwdr4-2012/
UNEP, 2015. 9th Global Trends in Renewable Energy
Investment 2015. Frankfurt School-UNEP Collaborating
Centre for Climate & Sustainable Energy Finance and
Bloomberg New Energy Finance. Available online at
http://fs-unep-centre.org/publications/global-trends-
renewable-energy-investment-2015
UNEP, 2011. Towards a green economy: pathways
to sustainable development and poverty eradication
– a synthesis for policy makers. United Nations
Environment Programme Available online at www.
unep.org/greeneconomy
US EPA, 2007. Energy trends in selected manufacturing
sectors: Opportunities and challenges for environmentally
preferable energy outcomes.
Wang L, 2014. Energy efficiency technologies for
sustainable agriculture and food processing. Sustainable
Energy Solutions in Agriculture

OPPORTUNITIES FOR AGRI-FOOD CHAINS TO BECOME ENERGY-SMART198
Warnert J E, 2012. Processing tomatoes and conservation
agriculture. Conservation Agriculture, August 20.
Available online at http://ucanr.edu/blogs/blogcore/
postdetail.cfm?postnum=8176
Weber C L and Matthews H S, 2008. Food-miles
and the relative climate impacts of food choices in the
United States. Environmental Science and Technology,
10.1021/es702969f. Available online at http://pubs.acs.
org/doi/pdf/10.1021/es702969f
White R, 2007. Carbon governance from a systems
perspective: an investigation of food production and
consumption. Proceedings of the European Council for
an Energy-Efficient Economy (ECEEE) 2007 Summer
Study. France. Available online at http://www.eceee.
org/library/conference_proceedings/eceee_Summer_
Studies/2007/Panel_1/1.243/paper
Williams A, Audsley E, and Sandars D, 2006.
Determining the environmental burdens and resource
use in the production of agricultural and horticultural
commodities: Defra project report IS0205. Available
online at http://randd.defra.gov.uk/Default.
aspx?Menu= Menu&Module=More&Location
=None&Completed=0&ProjectID=11442
Wisions of Sustainability, 2013. Power milk chilling units
with Biogas. Available online at http://www.wisions.net/
projects/powering-milk-chilling-units-with-biogas
Xu T and Flapper J, 2009. Energy use and implications
for efficiency strategies in global fluid-milk processing
industry. Energy Policy, 37(12), 5334–5341. Available
online at http://doi.org/10.1016/j.enpol.2009.07.056
Xu T, Flapper J, and Kramer K J, 2009. Characterization
of energy use and performance of global cheese
processing. Energy, 34(11), 1993–2000. http://doi.
org/10.1016/j.energy.2009.08.014
Zentner R P, Lafond G P, Derksen D A, Nagy C N,
Wall D D and May W E, 2004. Effects of tillage method
and crop rotation on non-renewable energy use efficiency
for a thin Black Chernozem in the Canadian Praires.
Zhao L, Wu L, Dong C, and Li Y, 2010. Rice yield,
nitrogen utilization and ammonia volatilization as
influenced by modified rice cultivation at varying nitrogen
rates. Agricultural Sciences, 1(01), 10.


POWERING AGRICULTURE: An Energy Grand Challenge for Development U.S. Agency for International Development1300 Pennsylvania Avenue, NWWashington, DC 20523www.poweringag.org
I5125E/1/11.15
ISBN 978-92-5-108959-0
9 7 8 9 2 5 1 0 8 9 5 9 0
Related Documents