Performance Indicators Presentation October 2012

Welcome message from author
This document is posted to help you gain knowledge. Please leave a comment to let me know what you think about it! Share it to your friends and learn new things together.
Transcript

Performance Indicators Presentation October 2012
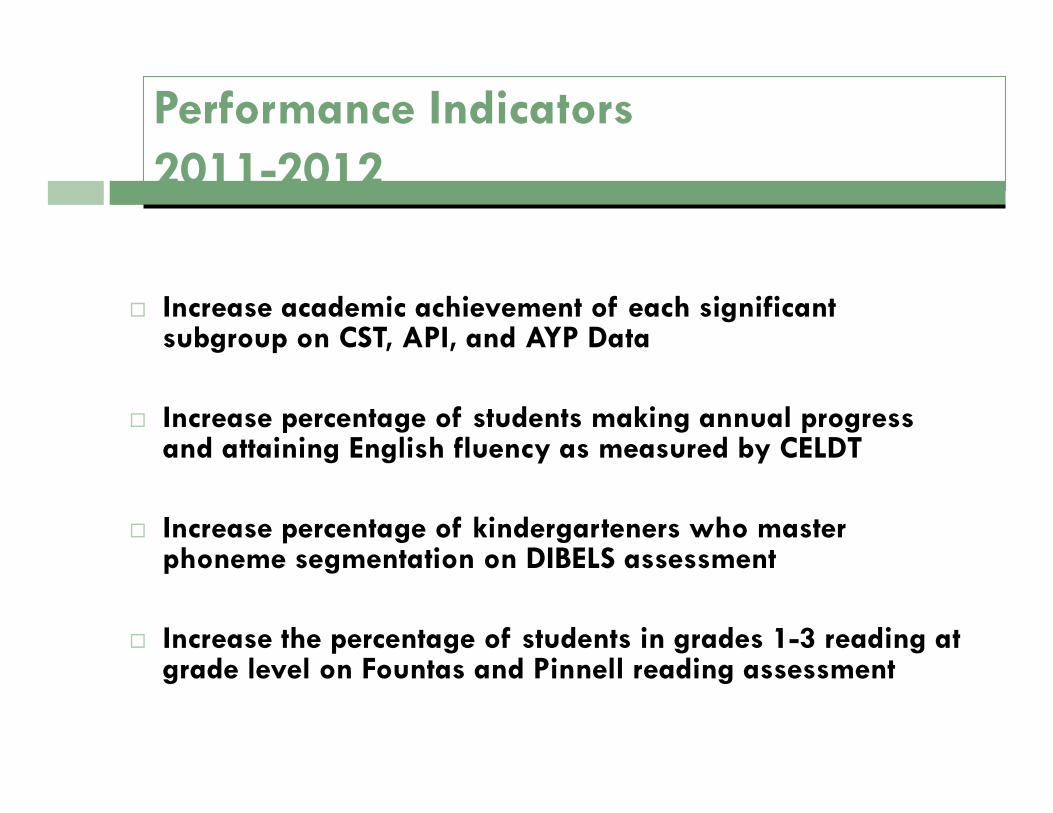
Increase academic achievement of each significant subgroup on CST, API, and AYP Data
Increase percentage of students making annual progress and attaining English fluency as measured by CELDT
Increase percentage of kindergarteners who master phoneme segmentation on DIBELS assessment
Increase the percentage of students in grades 1-3 reading at grade level on Fountas and Pinnell reading assessment
Performance Indicators 2011-2012
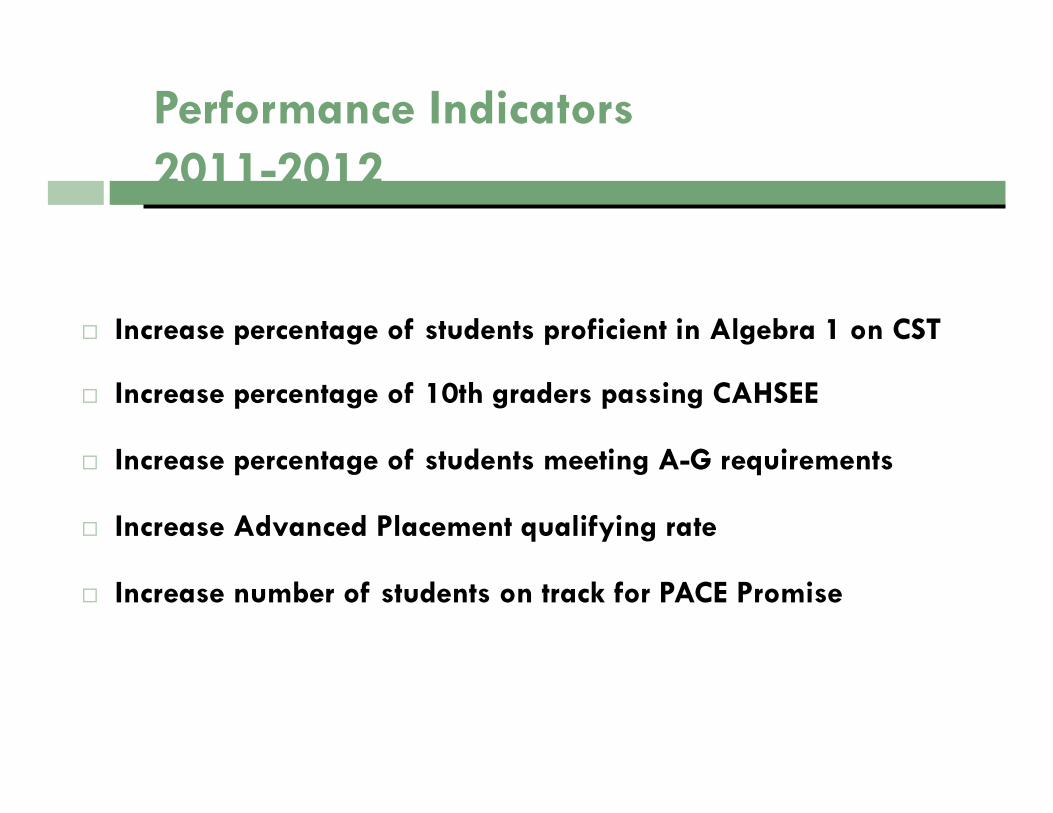
Increase percentage of students proficient in Algebra 1 on CST
Increase percentage of 10th graders passing CAHSEE
Increase percentage of students meeting A-G requirements
Increase Advanced Placement qualifying rate
Increase number of students on track for PACE Promise
Performance Indicators 2011-2012
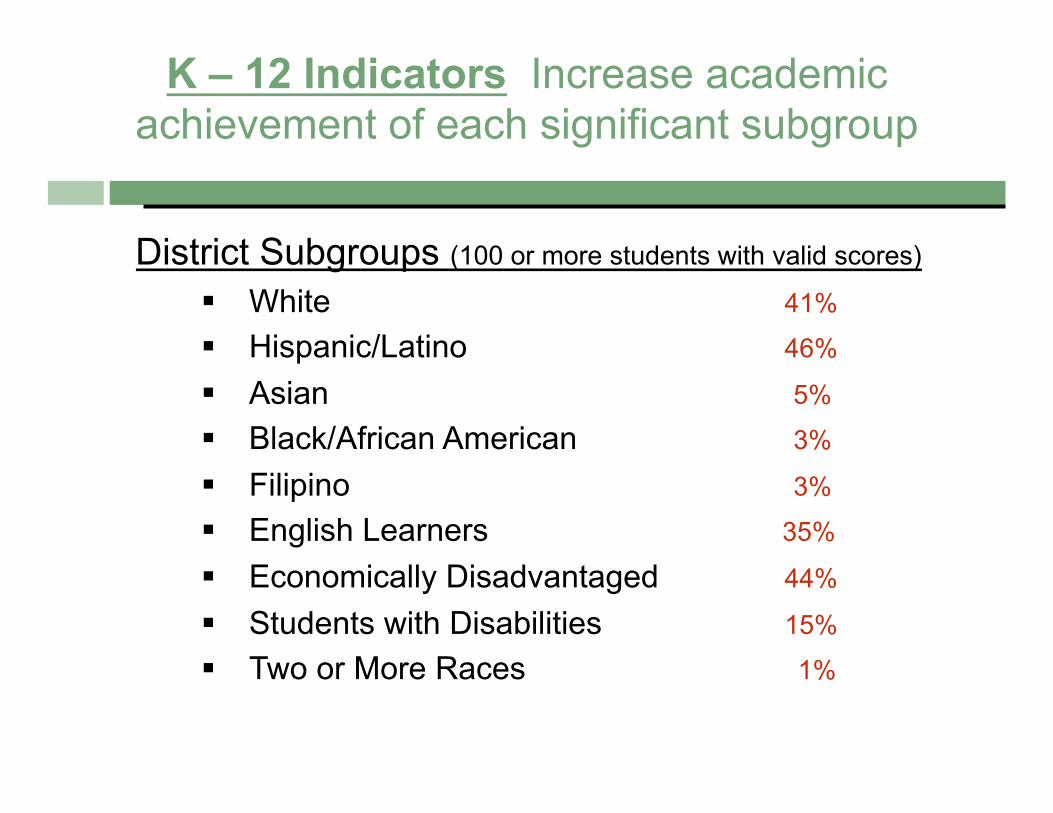
K – 12 Indicators Increase academic achievement of each significant subgroup
District Subgroups (100 or more students with valid scores)
White 41%
Hispanic/Latino 46%
Asian 5%
Black/African American 3%
Filipino 3%
English Learners 35%
Economically Disadvantaged 44%
Students with Disabilities 15%
Two or More Races 1%
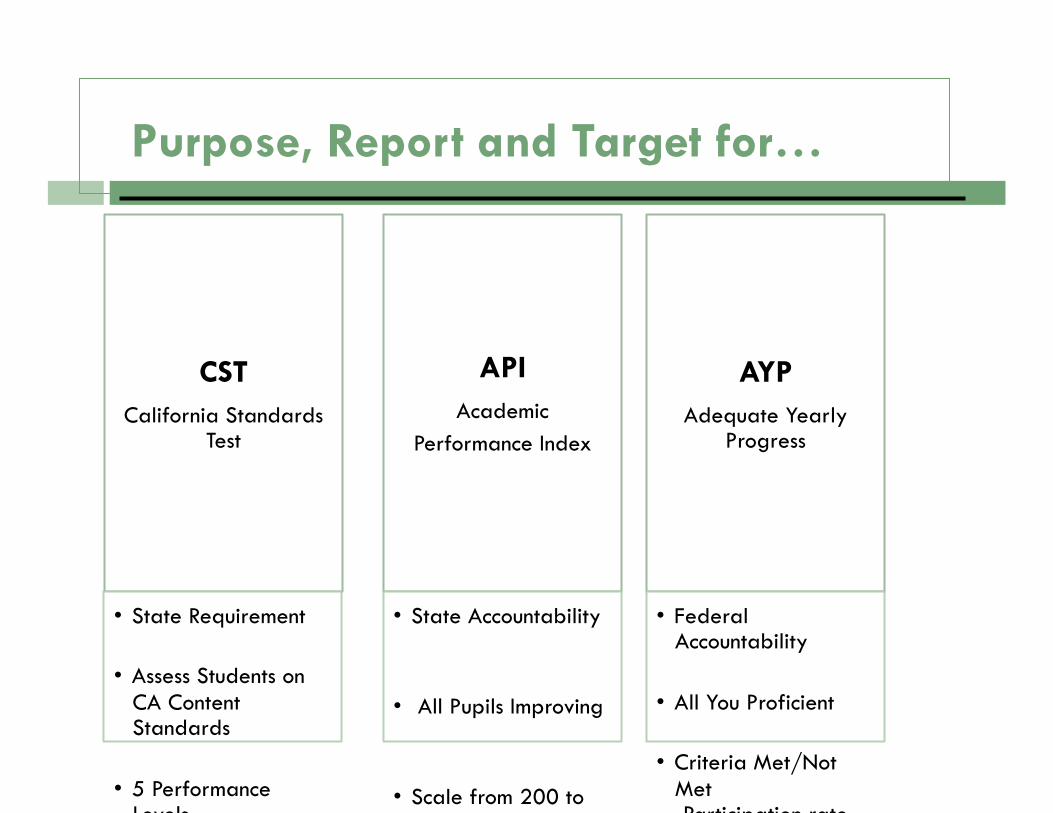
Purpose, Report and Target for…
CST California Standards
Test
• State Requirement
• Assess Students on CA Content Standards
• 5 Performance Levels
API Academic
Performance Index
• State Accountability
• All Pupils Improving
• Scale from 200 to 1000
AYP Adequate Yearly
Progress
• Federal Accountability
• All You Proficient
• Criteria Met/Not Met -Participation rate

2012 CST Performance Comparison with County and State
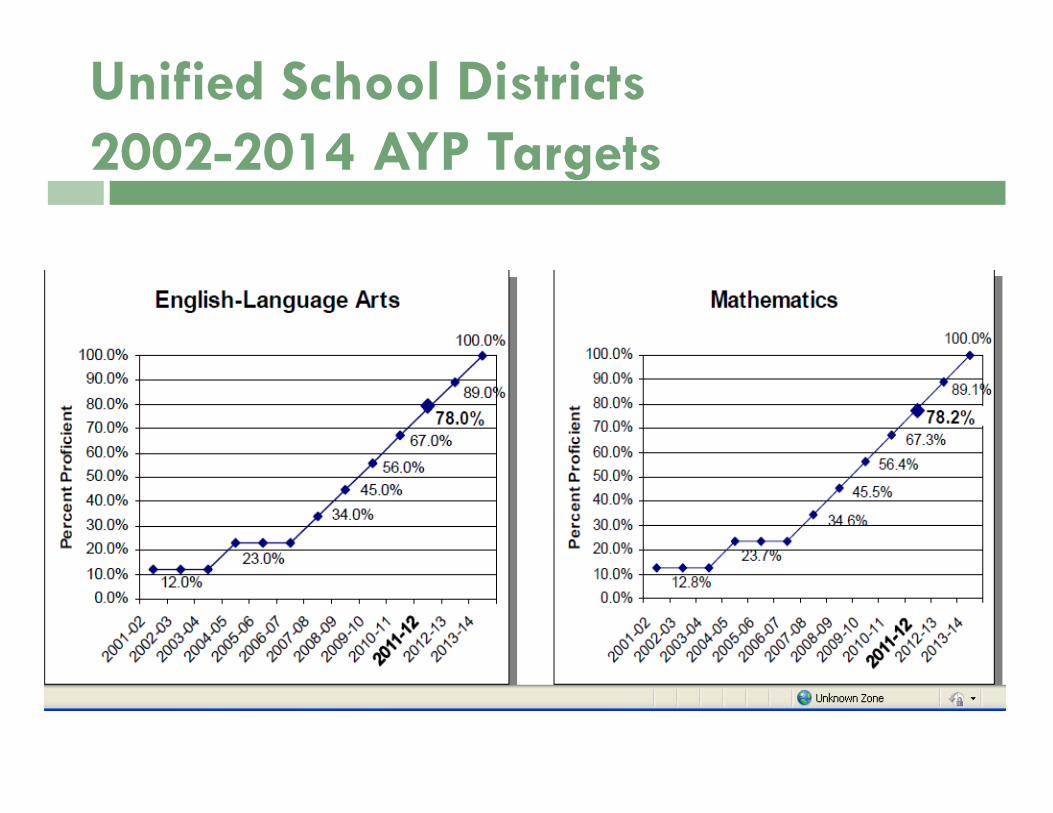
Unified School Districts 2002-2014 AYP Targets
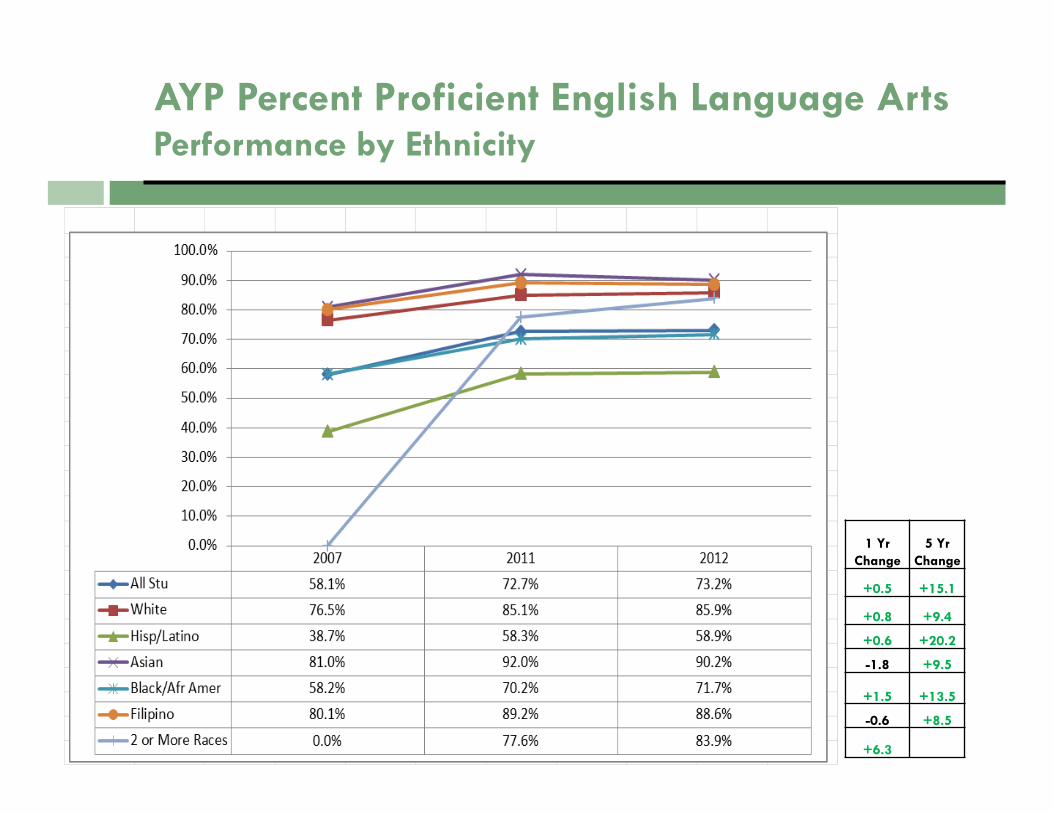
AYP Percent Proficient English Language Arts Performance by Ethnicity
2007 2011 2012
All Stu 54.0% 73.0% 73.2%
White 72.0% 85.0% 85.9%
Hisp/Latino 35.0% 58.0% 58.9%
Asian 79.0% 92.0% 90.2%
Black/Afr Amer 53.0% 70.0% 71.7%
Filipino 76.0% 89.0% 88.6%
2 or More Races 0.0% 77.6% 83.9%
0.0%
10.0%
20.0%
30.0%
40.0%
50.0%
60.0%
70.0%
80.0%
90.0%
100.0%
1 Yr Change
5 Yr Change
+0.5 +15.1
+0.8 +9.4
+0.6 +20.2
-1.8 +9.5
+1.5 +13.5
-0.6 +8.5
+6.3
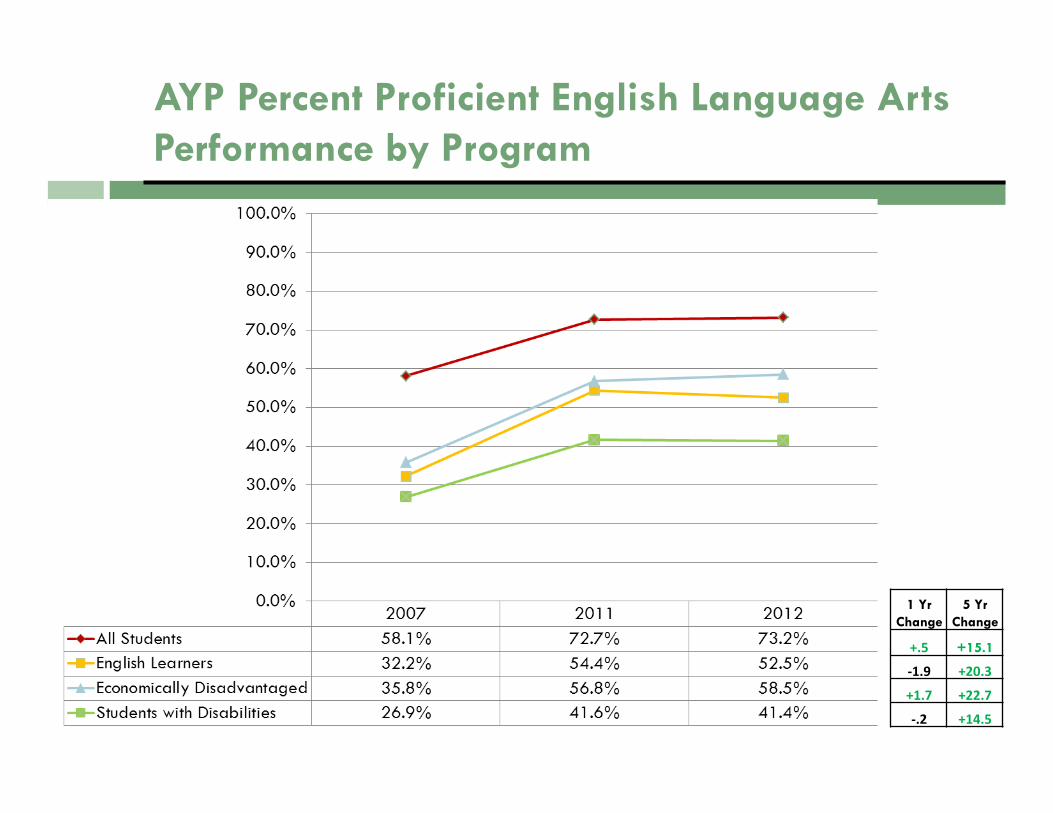
AYP Percent Proficient English Language Arts Performance by Program
1 Yr Change
5 Yr Change
+.5 +15.1
‐1.9 +20.3
+1.7 +22.7
‐.2 +14.5
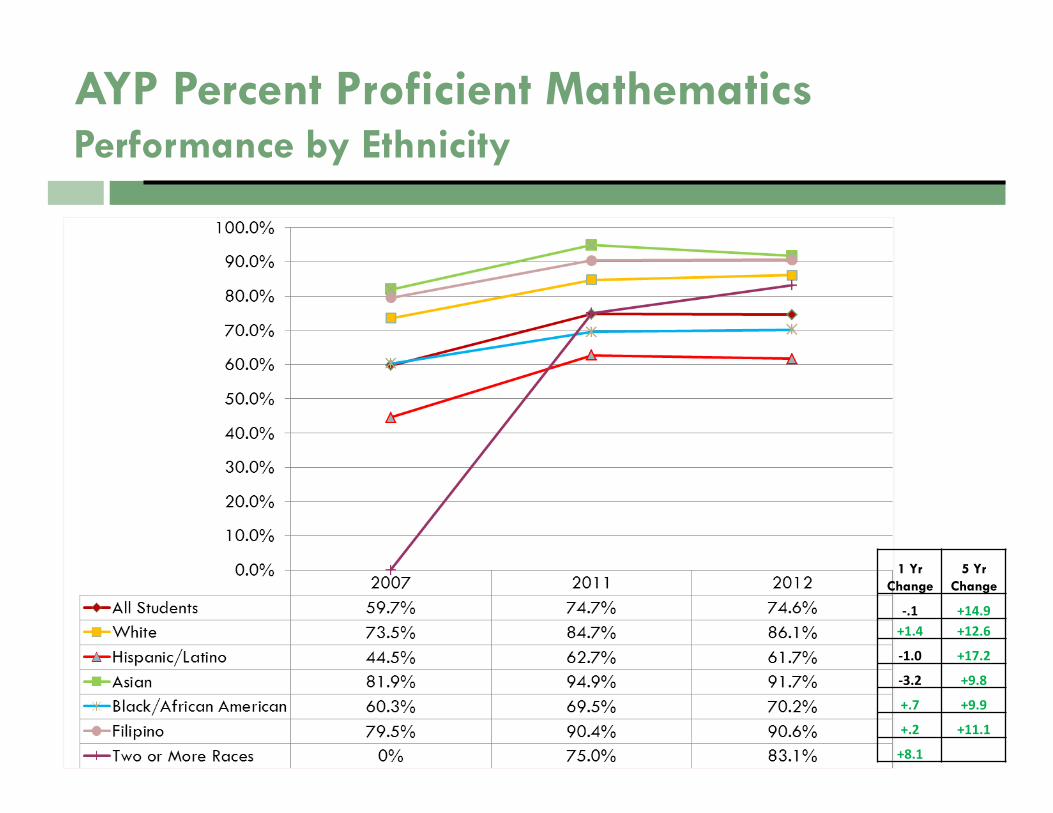
AYP Percent Proficient Mathematics Performance by Ethnicity
1 Yr Change
5 Yr Change
‐.1 +14.9+1.4 +12.6
‐1.0 +17.2
‐3.2 +9.8
+.7 +9.9
+.2 +11.1
+8.1

AYP Percent Proficient Mathematics Performance by Program
1 Yr Change
5 Yr Change
‐.1 +14.9
‐3.0 +16.7
‐.1 +19.3
‐1.2 +15.5
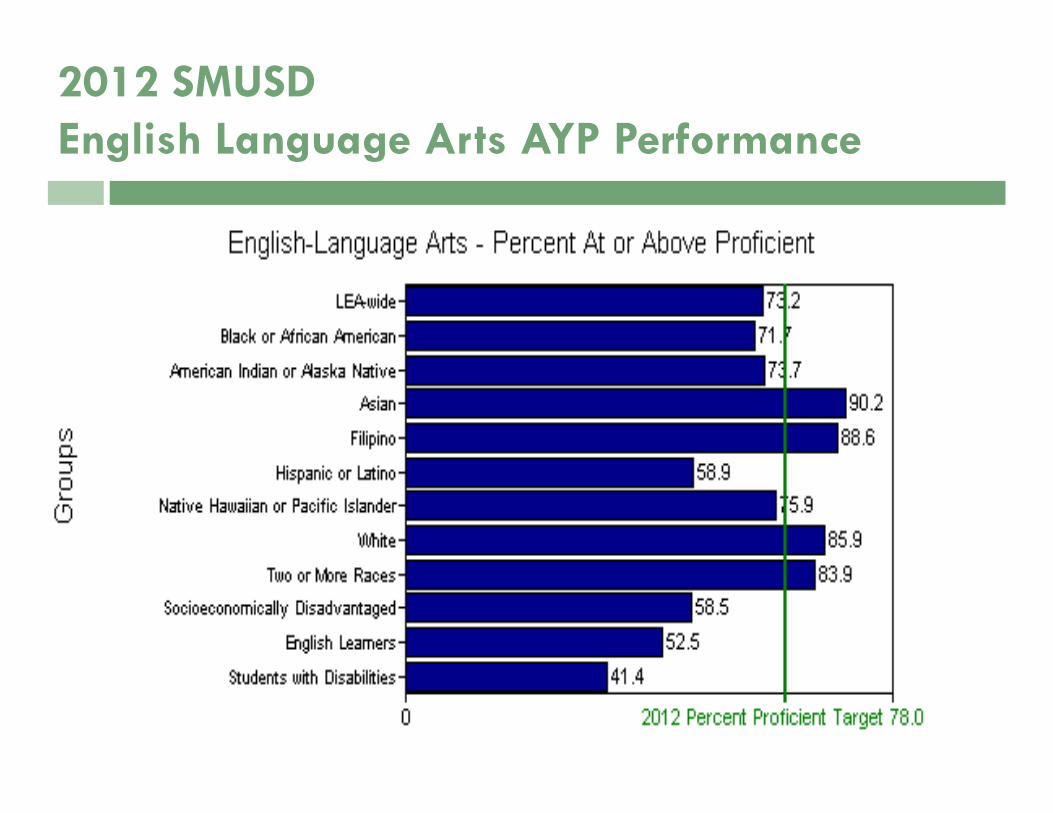
2012 SMUSD English Language Arts AYP Performance

2012 SMUSD Mathematics AYP Performance
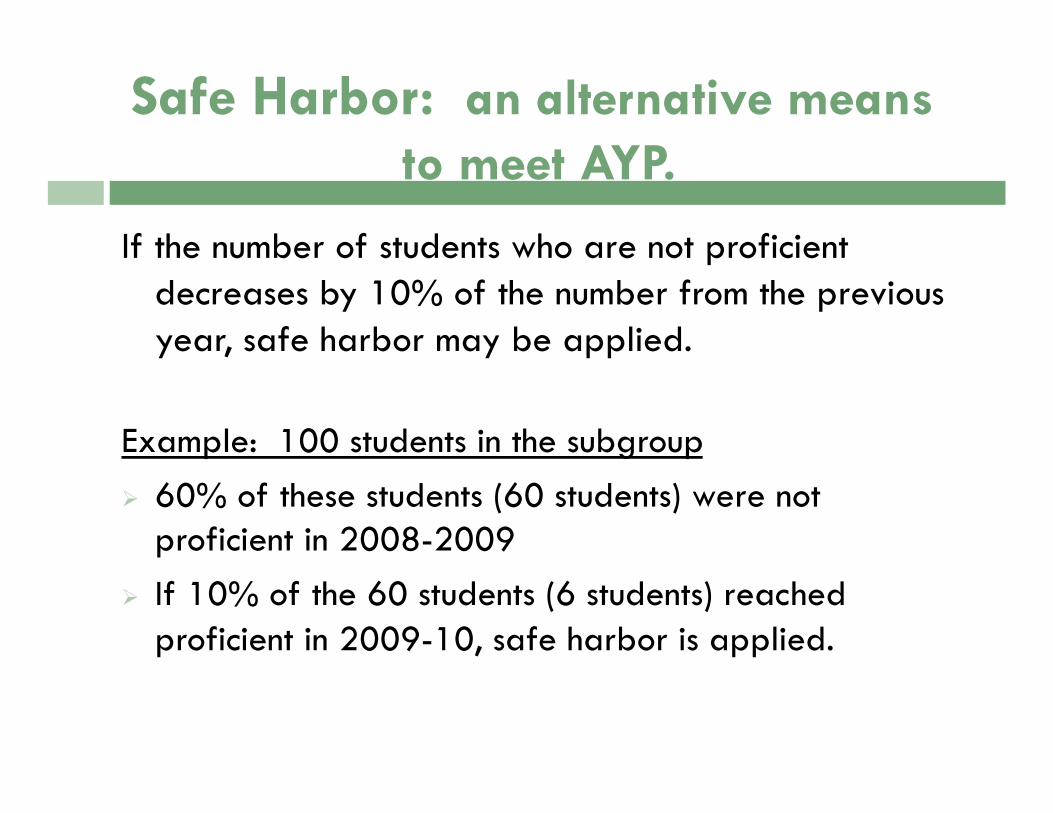
Safe Harbor: an alternative means to meet AYP.
If the number of students who are not proficient decreases by 10% of the number from the previous year, safe harbor may be applied.
Example: 100 students in the subgroup 60% of these students (60 students) were not
proficient in 2008-2009 If 10% of the 60 students (6 students) reached
proficient in 2009-10, safe harbor is applied.

30 of 42 Targets Met STAR Part. Rate
STAR Proficient and Advanced
API Graduation Rate
Goal 95% ELA/Math
ELA 78.0%
Math 78.2%
740 or Growth of >
1 Point
90%
All 100/100 73.2% 74.6% 868 (+2) 94.22%
White 100/99 85.9% 86.1% 96.4%
Hispanic 100/100 58.9% 61.7% 92.02%
African Am. 99/99 71.7% (SH) 70.2%
Filipino 100/100 88.6% 90.6%
Asian 100/100 90.2% 91.7%
Econ. Dis. 100/100 58.5% 61.8% 92.49%
EL 100/100 52.5% 57.8% 88.68%
Students w/Disabilities 99/99 41.4% 44.6% 82.72%
Two or More Races 100/100 83.9% 83.1%
Adequate Yearly Progress Targets 2011-12
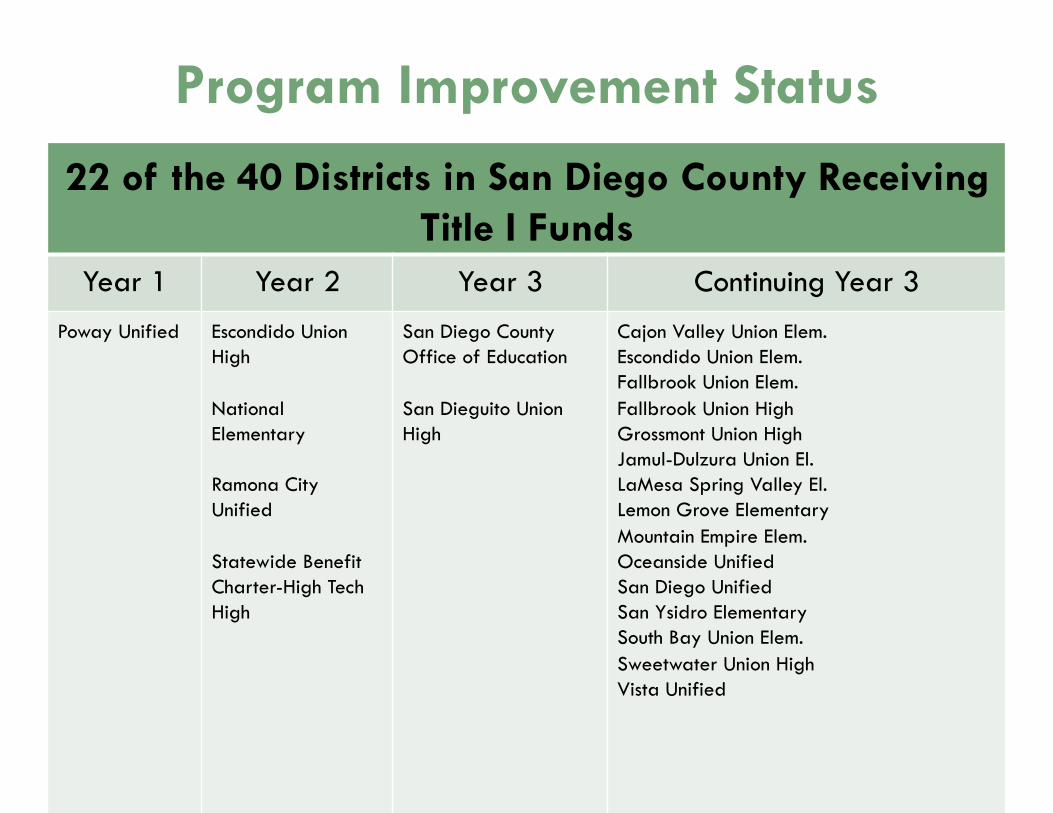
Program Improvement Status
22 of the 40 Districts in San Diego County Receiving Title I Funds
Year 1 Year 2 Year 3 Continuing Year 3 Poway Unified Escondido Union
High
National Elementary
Ramona City Unified
Statewide Benefit Charter-High Tech High
San Diego County Office of Education
San Dieguito Union High
Cajon Valley Union Elem. Escondido Union Elem. Fallbrook Union Elem. Fallbrook Union High Grossmont Union High Jamul-Dulzura Union El. LaMesa Spring Valley El. Lemon Grove Elementary Mountain Empire Elem. Oceanside Unified San Diego Unified San Ysidro Elementary South Bay Union Elem. Sweetwater Union High Vista Unified
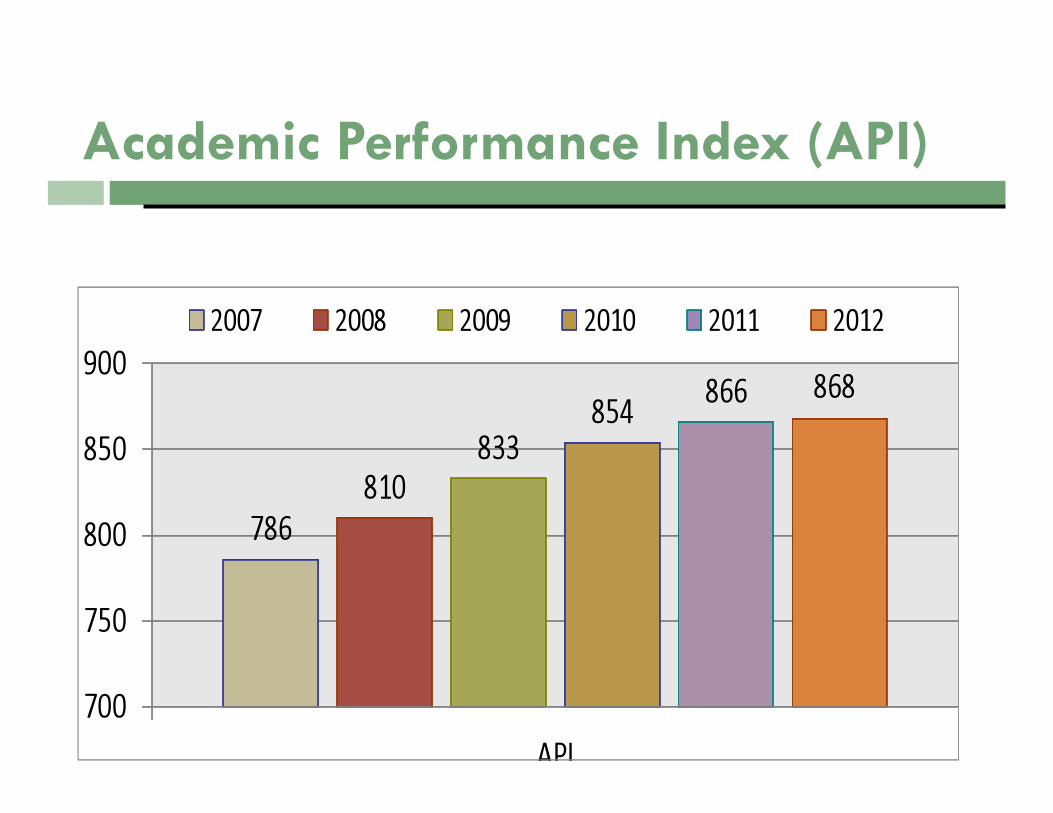
Academic Performance Index (API)
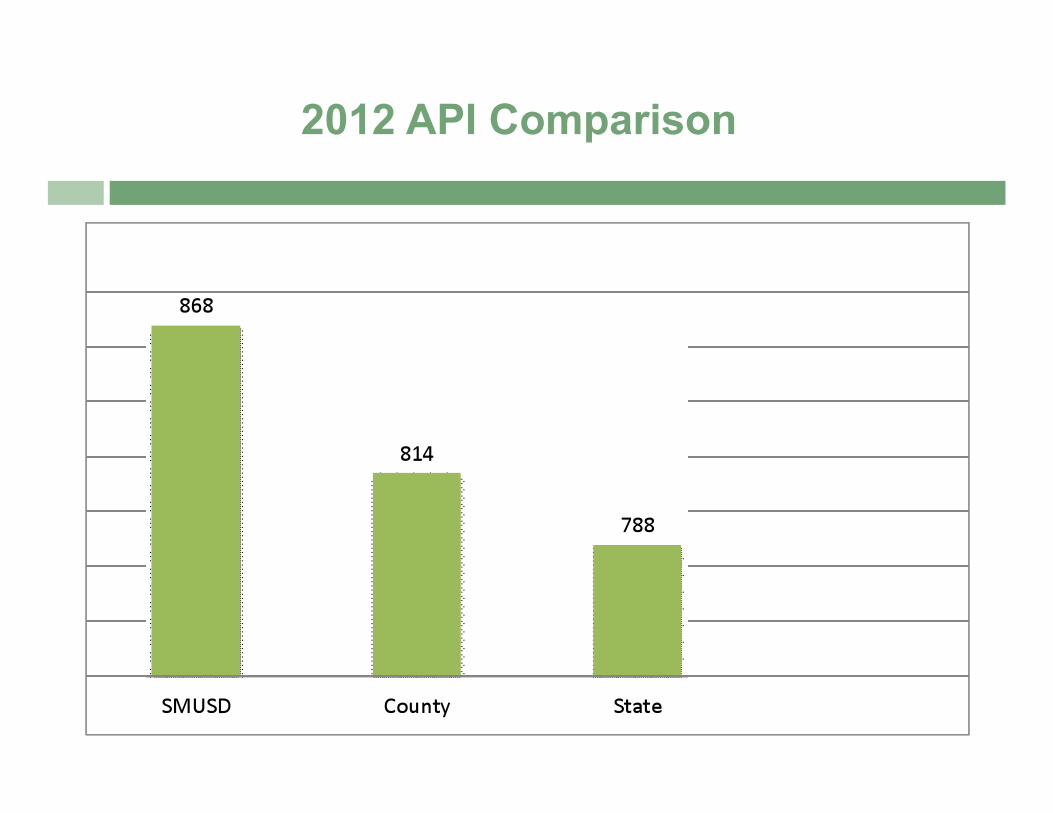
2012 API Comparison
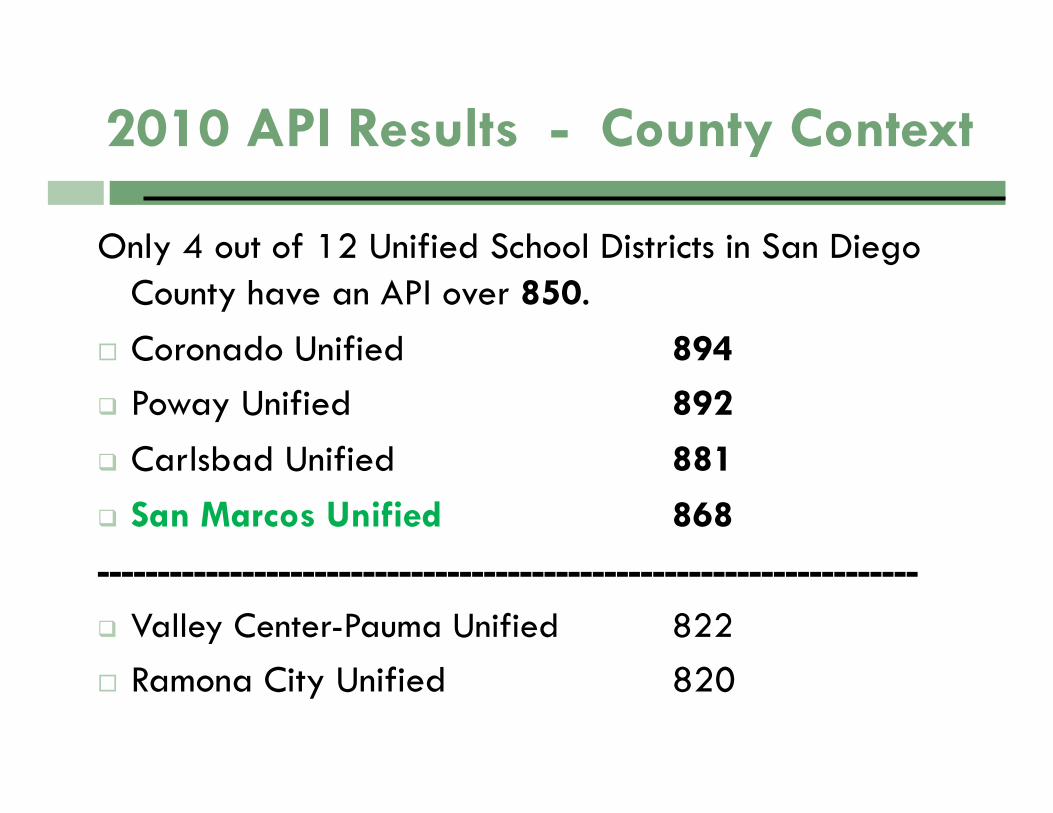
2010 API Results - County Context
Only 4 out of 12 Unified School Districts in San Diego County have an API over 850.
Coronado Unified 894 Poway Unified 892 Carlsbad Unified 881
San Marcos Unified 868
-------------------------------------------------------------------- Valley Center-Pauma Unified 822 Ramona City Unified 820

Surrounding North County District APIs
San Dieguito Union High 892 Carlsbad 881 SAN MARCOS UNIFIED 868 Valley CenterUnified 822 Ramona City Unified 820 Vista 798 Oceanside 788 Escondido Union Elem 759 Escondido Union High 746
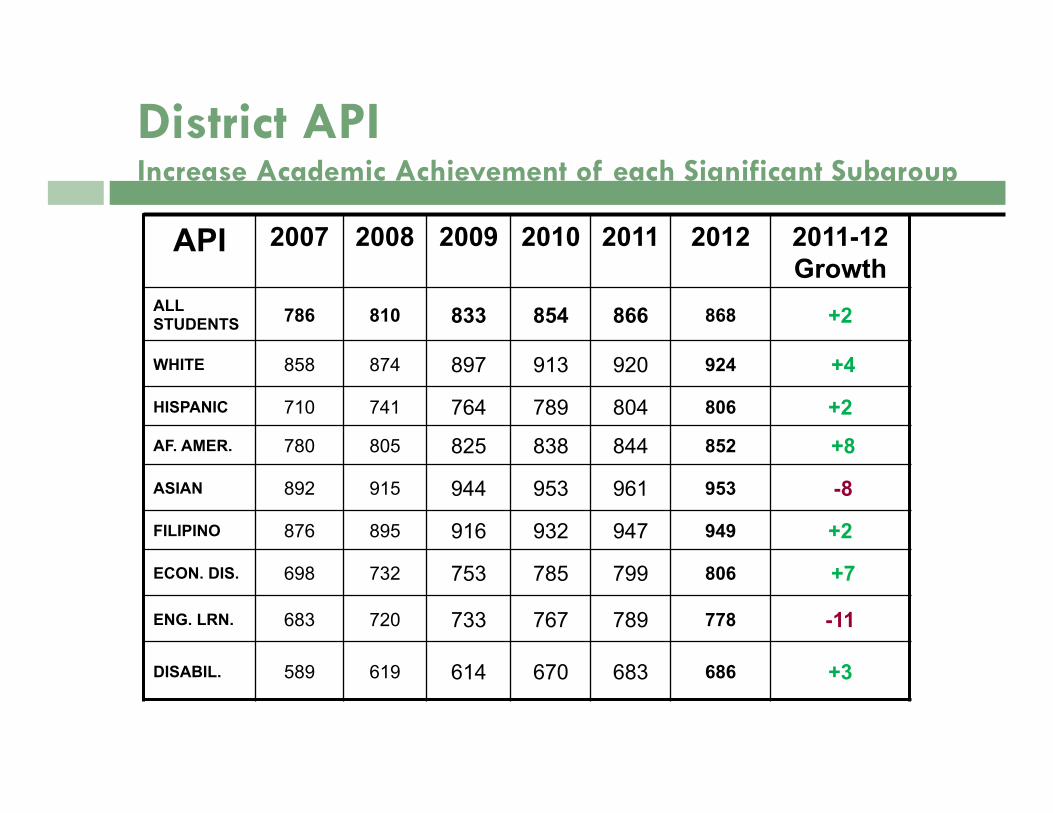
API 2007 2008 2009 2010 2011 2012 2011-12 Growth
ALL STUDENTS 786 810 833 854 866 868 +2
WHITE 858 874 897 913 920 924 +4
HISPANIC 710 741 764 789 804 806 +2 AF. AMER. 780 805 825 838 844 852 +8
ASIAN 892 915 944 953 961 953 -8
FILIPINO 876 895 916 932 947 949 +2
ECON. DIS. 698 732 753 785 799 806 +7
ENG. LRN. 683 720 733 767 789 778 -11
DISABIL. 589 619 614 670 683 686 +3
District API Increase Academic Achievement of each Significant Subgroup

API Coronado Poway Carlsbad San Marcos
All Students 894 892 881 868
WHITE 73% 899 54% 896 58% 909 41% 924
HISPANIC 17% 862 13% 812 26% 793 46% 806
AF. AMER. 2% 911 3% 803 2% 801 3% 852
ASIAN 3% 933 19% 953 7% 959 5% 953
FILIPINO 2% 896 7% 885 1% 929 3% 949
ECON. DIS. 5% 874 14% 795 21% 779 44% 806
ENG. LRN. 5% 834 20% 838 14% 748 35% 778
DISABIL. 11% 735 10% 703 10% 678 15% 686
Subgroup API Comparison: % of STAR Population and API
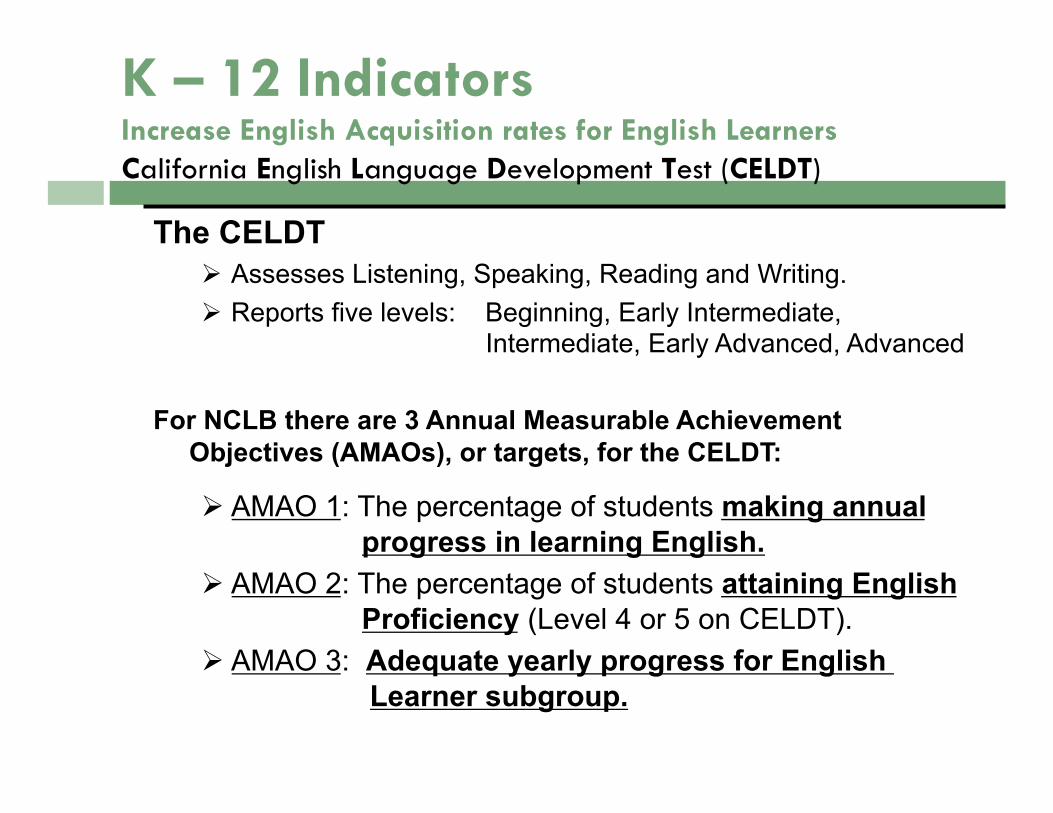
The CELDT Assesses Listening, Speaking, Reading and Writing. Reports five levels: Beginning, Early Intermediate,
Intermediate, Early Advanced, Advanced
For NCLB there are 3 Annual Measurable Achievement Objectives (AMAOs), or targets, for the CELDT:
AMAO 1: The percentage of students making annual progress in learning English.
AMAO 2: The percentage of students attaining English Proficiency (Level 4 or 5 on CELDT).
AMAO 3: Adequate yearly progress for English Learner subgroup.
K – 12 Indicators Increase English Acquisition rates for English Learners California English Language Development Test (CELDT)

CELDT AMAO 1- % of Students Making Annual Progress in Learning English
AMAO 2 - % of Students Attaining English Proficiency
56.0%
20.1%
45.1%
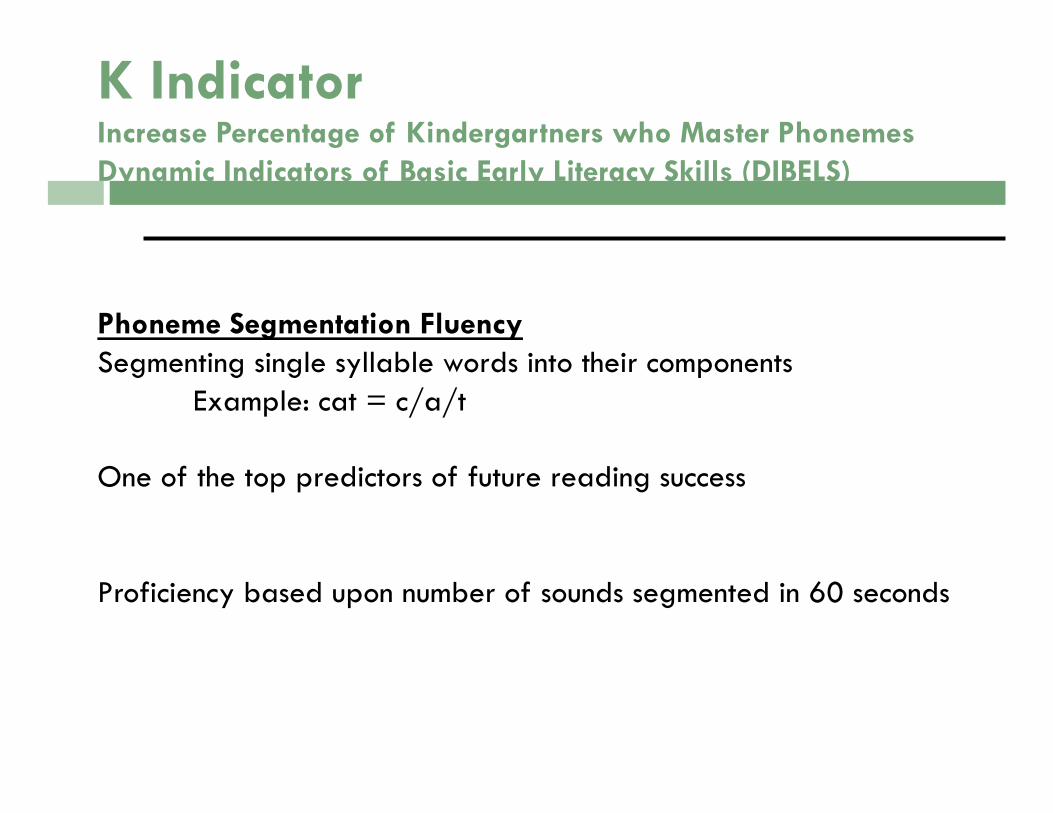
Phoneme Segmentation Fluency Segmenting single syllable words into their components
Example: cat = c/a/t
One of the top predictors of future reading success
Proficiency based upon number of sounds segmented in 60 seconds
K Indicator Increase Percentage of Kindergartners who Master Phonemes Dynamic Indicators of Basic Early Literacy Skills (DIBELS)
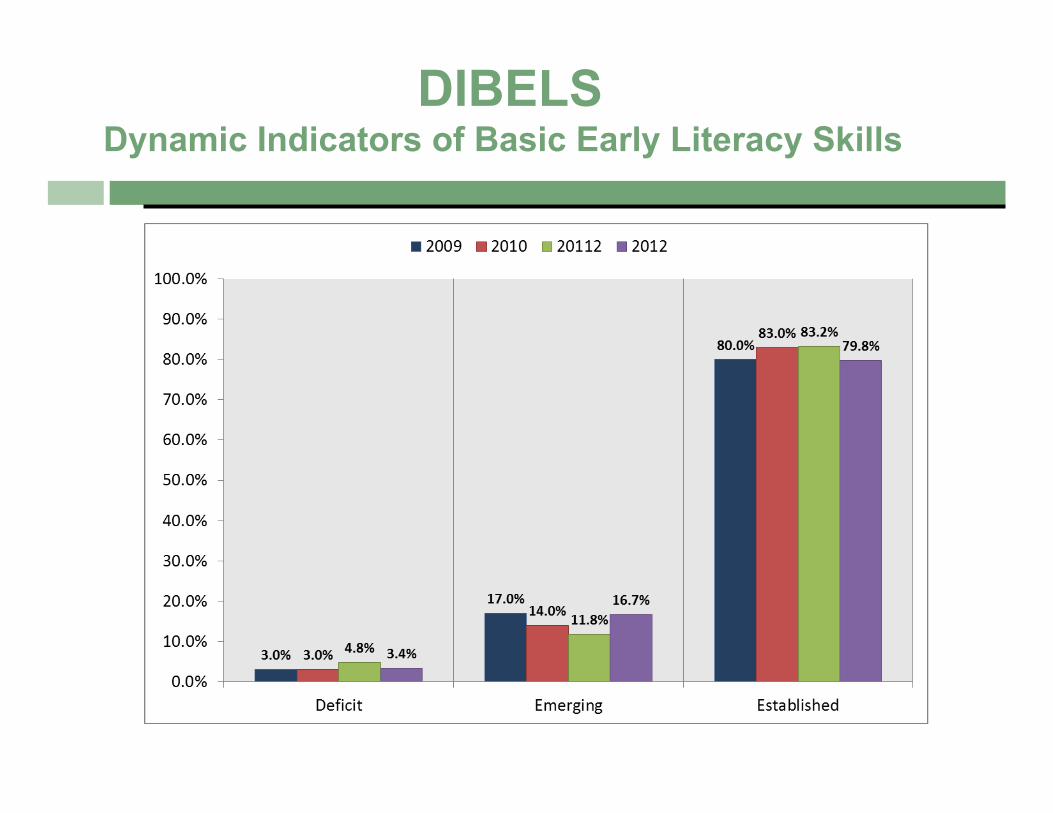
DIBELS Dynamic Indicators of Basic Early Literacy Skills
Fountas and Pinnell
Increase the percentage of students in grades 1–3 reading at grade level
Fountas & Pinnell is a reading assessment that measures decoding, fluency, vocabulary, and comprehension skills
The information from this assessment enables teachers to:
• Determine students’ independent and instructional reading level
• Group students for reading instruction
• Select texts that will be productive for a student’s instruction
• Identify students who need intervention and extra help
• Document student progress across a school year and across grade
levels

Fountas & Pinnell Percent of Students Reading at Grade Level
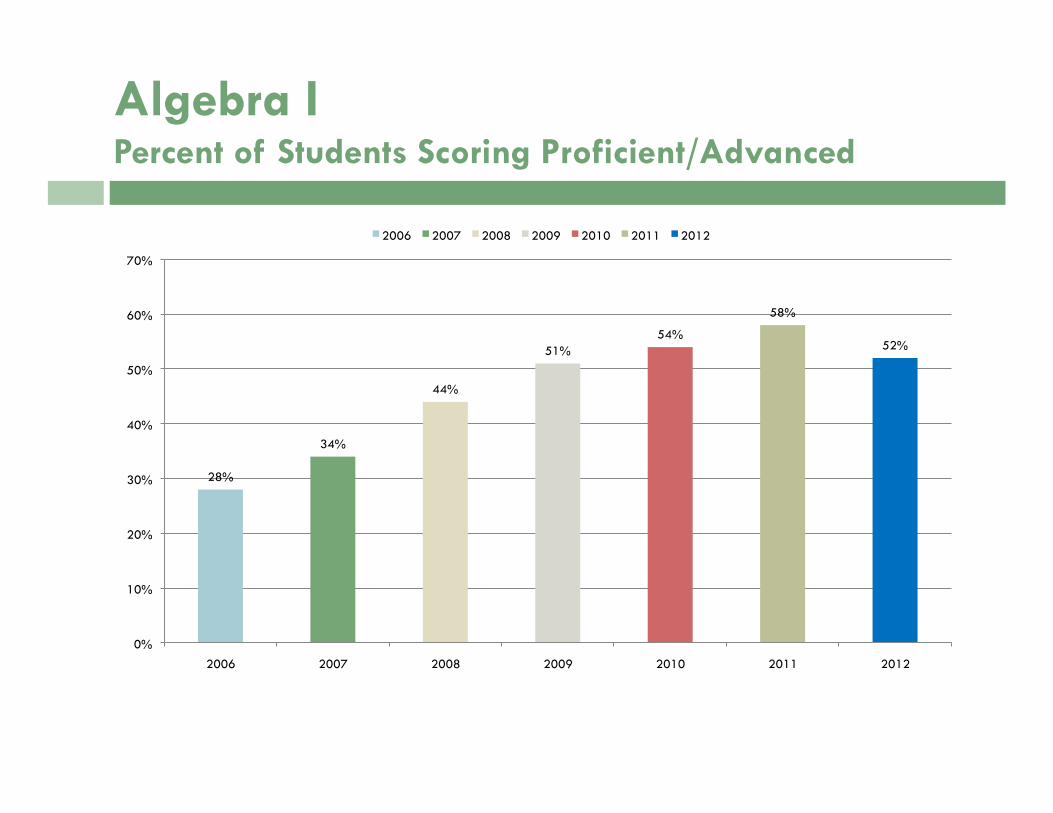
Algebra I Percent of Students Scoring Proficient/Advanced
28%
34%
44%
51% 54%
58%
52%
0%
10%
20%
30%
40%
50%
60%
70%
2006 2007 2008 2009 2010 2011 2012
2006 2007 2008 2009 2010 2011 2012

In 1999, state law authorized the California High School Exit Exam (CAHSEE).
Students in California public schools must pass CAHSEE in order to earn a High School diploma.
Only 10th grade pass rate is calculated in AYP. Pass rate for 10th-12th is included in API calculation.
9 – 12 Indicators Increase Percentage of 10th Graders Passing the CAHSEE

Percent of 10th Graders Passing California High School Exit Exam (CAHSEE)
A – G Students meeting UC / CSU entrance requirements.
These requirements are greater than those needed for graduation.
9 – 12 Indicators Increase Percentage of Students Meeting A – G Requirements
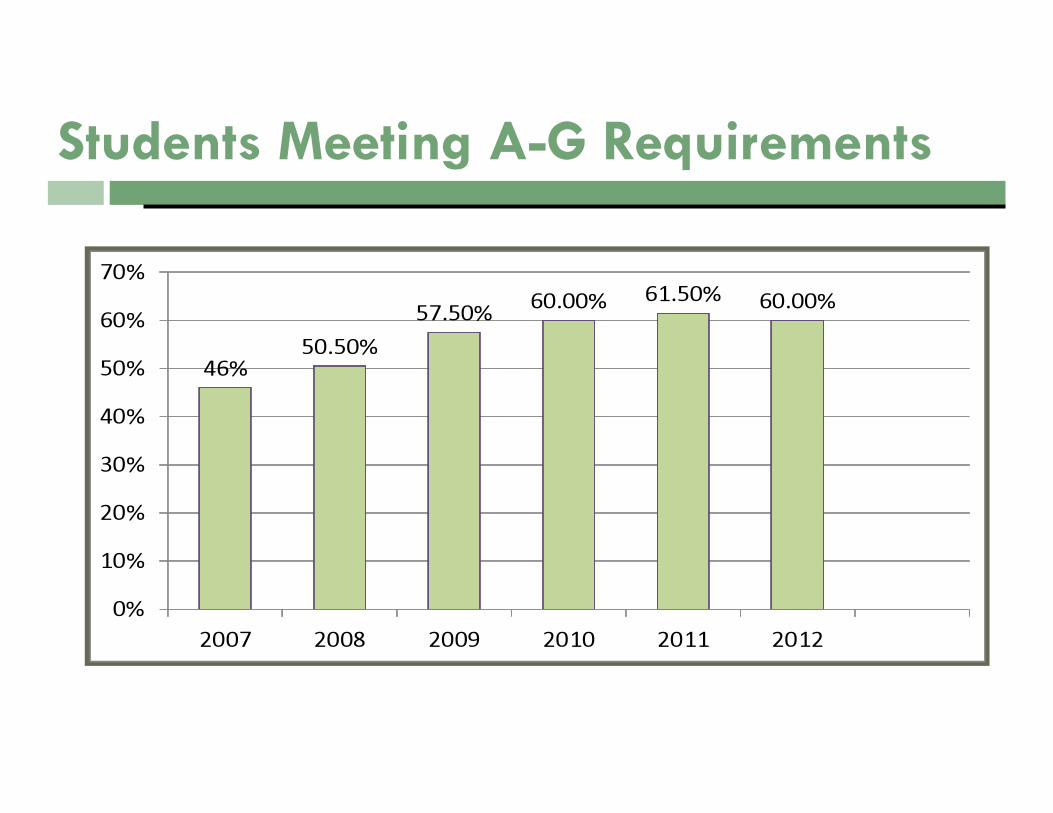
Students Meeting A-G Requirements
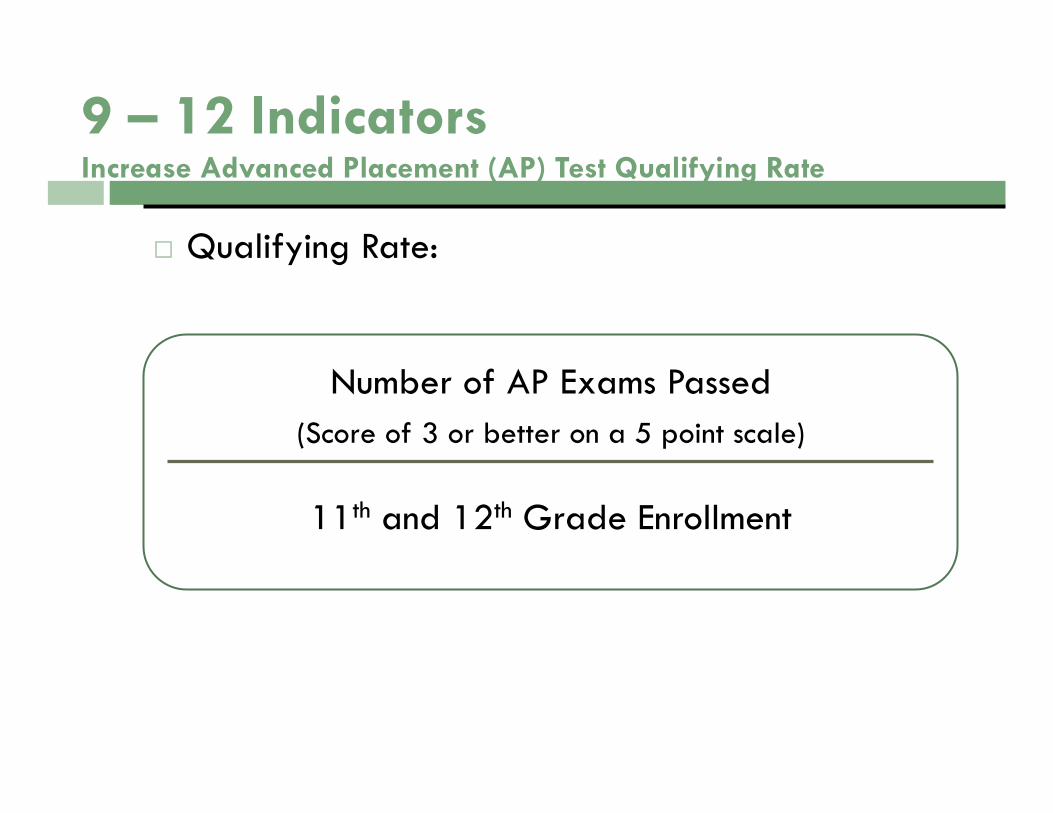
Qualifying Rate:
9 – 12 Indicators Increase Advanced Placement (AP) Test Qualifying Rate
Number of AP Exams Passed (Score of 3 or better on a 5 point scale)
11th and 12th Grade Enrollment

Advanced Placement (AP) Test Qualifying Rate
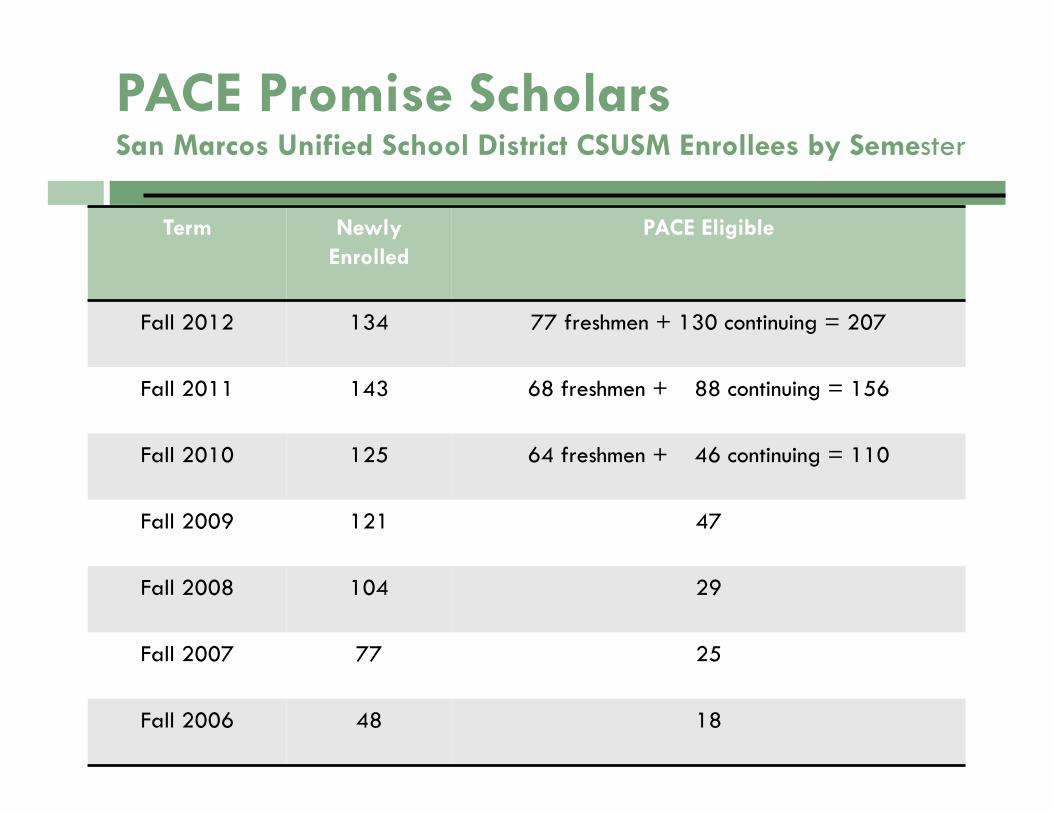
PACE Promise Scholars San Marcos Unified School District CSUSM Enrollees by Semester
Term Newly Enrolled
PACE Eligible
Fall 2012 134 77 freshmen + 130 continuing = 207
Fall 2011 143 68 freshmen + 88 continuing = 156
Fall 2010 125 64 freshmen + 46 continuing = 110
Fall 2009 121 47
Fall 2008 104 29
Fall 2007 77 25
Fall 2006 48 18

SMUSD System-Wide Priorities
DeepImplementationof…
Standards-Based Instruction Common Core
The Essential Elements of Instruction and Strategies to Accelerate the Academic
Achievement of ELs
A Culture of Collaboration and Inquiry

Focus on Essential Standards/Common Pacing Guides Test Score Analysis and Goal Setting Ongoing Monitoring-Common Interim Assessments Disaggregated Data: “Know Students by Name and Need” Targeted, Focused and Timely Intervention Programs District-wide Articulation: Teacher Leaders (EEI,
Technology), Secondary Curriculum Council, Elementary Team Leaders, Web-based Conferences
Structured Teacher Planning/Collaboration Time Instructional Leaders as Administrators/Feedback Focused
on Standards and EEI Continued Professional Development including One-to-One
Pilot
Continuous Improvement Strategies

Students benefit from the collaborative efforts of the San Marcos Team!
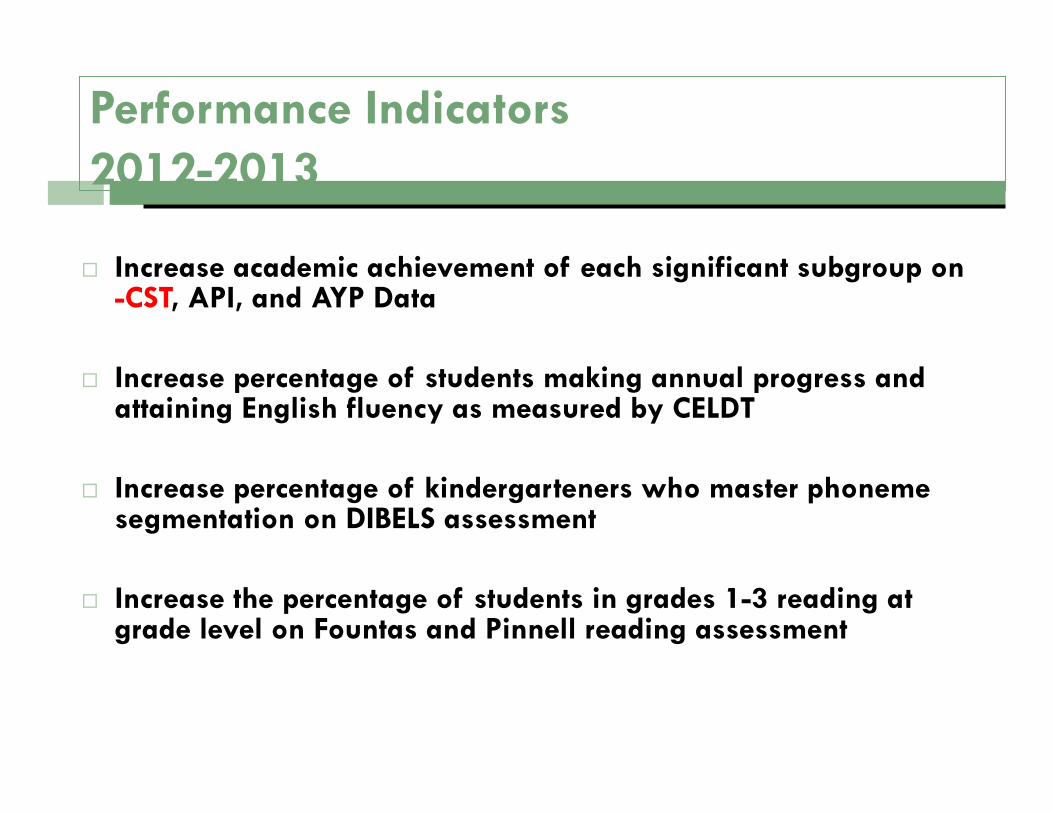
Increase academic achievement of each significant subgroup on -CST, API, and AYP Data
Increase percentage of students making annual progress and attaining English fluency as measured by CELDT
Increase percentage of kindergarteners who master phoneme segmentation on DIBELS assessment
Increase the percentage of students in grades 1-3 reading at grade level on Fountas and Pinnell reading assessment
Performance Indicators 2012-2013
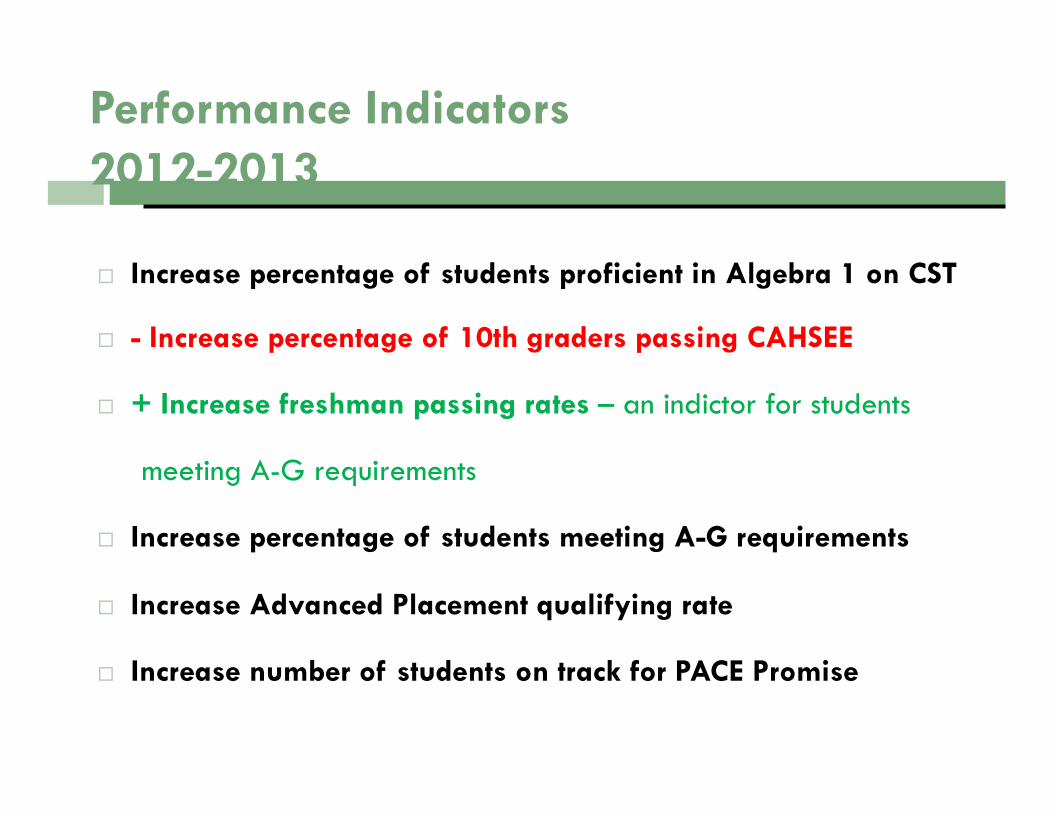
Increase percentage of students proficient in Algebra 1 on CST
- Increase percentage of 10th graders passing CAHSEE
+ Increase freshman passing rates – an indictor for students
meeting A-G requirements
Increase percentage of students meeting A-G requirements
Increase Advanced Placement qualifying rate
Increase number of students on track for PACE Promise
Performance Indicators 2012-2013
Related Documents