Upstream Research International Journal ISSN 2321 –0567 A Peer Reviewed Indexed Journal Vol. 2 Issue 1 (April 2014) Upstream Research International Journal ISSN 2321 –0567 A Peer Reviewed Indexed Journal Vol. 2 Issue 1 (April 2014) Performance Evaluation of Private Sectors Banks ICICI vs HDFC Anju Bala Assistant Professor, Department of Commerce, Government College for Women, Karnal Abstract Banking system is an important constituent of the overall economic system. It plays an important role in mobilizing the nation’s saving and in channelizing them into high investment priorities and better utilization of available resources. Hence, banking can better be described as kingpin of the chariot of economic progress. During the past two decades an all-round growth seen in banking sector and there exists a strong competition among public and private sector banks. The apex body of the banks that is Reserve Bank of India has taken several remedial measures and introduction effective reforms in the financial and banking sector. In return rapid economic growth and development with the stability through the process of globalization, liberalization and privatization in the financial system was introduced. In order to investigate the performance of selected private sector banks a study was undertaken and same of the salient finding are reported. The data spread over the period of 5 years were subjected to analysis the growth pattern in income, debt equity, capital adequacy, operating profit, net profit, gross profit, interest received, interest paid, and advances. The results highlight that banks need to redesign their business strategies to incorporate specific plans to promote financial inclusion of low income group treating it both a business opportunity as well as corporate social responsibility. The aim of this paper is to study the working of the public banks and private banks. This paper also examine the financial performance of private sector banks(ICICI and HDFC banks).

Welcome message from author
This document is posted to help you gain knowledge. Please leave a comment to let me know what you think about it! Share it to your friends and learn new things together.
Transcript

Upstream Research International Journal ISSN 2321 –0567
A Peer Reviewed Indexed Journal Vol. 2 Issue 1 (April 2014)
Upstream Research International Journal ISSN 2321 –0567
A Peer Reviewed Indexed Journal Vol. 2 Issue 1 (April 2014)
Performance Evaluation of Private Sectors Banks ICICI vs HDFC
Anju Bala Assistant Professor, Department of Commerce, Government College for Women, Karnal
Abstract Banking system is an important constituent of the overall economic system. It plays an important role in mobilizing the nation’s saving and in channelizing them into high investment priorities and better utilization of available resources. Hence, banking can better be described as kingpin of the chariot of economic progress. During the past two decades an all-round growth seen in banking sector and there exists a strong competition among public and private sector banks. The apex body of the banks that is Reserve Bank of India has taken several remedial measures and introduction effective reforms in the financial and banking sector. In return rapid economic growth and development with the stability through the process of globalization, liberalization and privatization in the financial system was introduced. In order to investigate the performance of selected private sector banks a study was undertaken and same of the salient finding are reported. The data spread over the period of 5 years were subjected to analysis the growth pattern in income, debt equity, capital adequacy, operating profit, net profit, gross profit, interest received, interest paid, and advances. The results highlight that banks need to redesign their business strategies to incorporate specific plans to promote financial inclusion of low income group treating it both a business opportunity as well as corporate social responsibility. The aim of this paper is to study the working of the public banks and private banks. This paper also examine the financial performance of private sector banks(ICICI and HDFC banks).
Upstream Research International Journal ISSN 2321 –0567
A Peer Reviewed Indexed Journal Vol. 2 Issue 1 (April 2014)
Upstream Research International Journal ISSN 2321 –0567
A Peer Reviewed Indexed Journal Vol. 2 Issue 1 (April 2014)
PRIVATE SECTOR BANKS
3.3 INDUSTRIAL CREDIT AND INVESTMENT CORPORATION OF INDIA (ICICI)
Profile
ICICI Bank was originally promoted in 1994 by ICICI Limited, an Indian financial institution, and was its wholly-owned subsidiary. ICICI's shareholding in ICICI Bank was reduced to 46% through a public offering of shares in India in fiscal year 1998, an equity offering in the form of ADRs listed on the NYSE in fiscal year 2000, ICICI Bank's acquisition of Bank of Madura Limited in an all-stock amalgamation in fiscal 2001, and secondary market sales by ICICI to institutional investors in fiscal year 2001 and fiscal year 2002. ICICI was formed in 1955 at the initiative of the World Bank, the Government of India and representatives of Indian industry. The principal objective was to create a development financial institution for providing medium-term and long-term project financing to Indian businesses.
Functions of ICICI
In order to achieve various objectives, the corporation performs the following functions
i. To provide loans repayable over a period of 15 years.
ii. To provide funds in the form of equity participation.
iii. To sponsor and underwrite new issues of shares and securities.
iv. To guarantee loans from the private investment sources.
v. To make funds available for reinvestment by removing investments as rapidly as possible.
vi. To provide managerial, technical and administrative services to industry.
vii. To undertake promotional activities for fostering growth in underdeveloped areas of the country.
viii. To serve as a merchant banker.
ix. To provide lease financing.

Upstream Research International Journal ISSN 2321 –0567
A Peer Reviewed Indexed Journal Vol. 2 Issue 1 (April 2014)
Upstream Research International Journal ISSN 2321 –0567
A Peer Reviewed Indexed Journal Vol. 2 Issue 1 (April 2014)
x. To provide loans in foreign currency towards the cost of important capital equipment.
Recently, ICICI Ltd. (alongwith two of its subsidiaries, ICICI Personal Finance Services Ltd. and
ICICI Capital Services Ltd.) has been merged with ICICI Bank Ltd; effective from May 3, 2002. The
erstwhile DFI has thus ceased to exist.
Financial Resources of ICICI
The Corporation was set up with an authorised capital of Rs. 50 crores of which Rs. 5 crores was in
ordinary shares. Out of this Rs. 5 crores, Rs. 2 crores was taken up by Indian banks, insurance companies,
Directors of ICICI etc. and Rs. 1.5 crores was issued to general public. The subscriber in U.K. and Common
Wealth Development Finance Company Ltd. subscribed Rs. 1.5. crores and 50 lakhs was paid by American
subscribers.
On March 31, 1999 ICICI’s paid up capital stood at Rs. 1863 crores and had reserves and surplus of
Rs. 2059,4 crores. It had borrowings from Government of India at Rs. 4653 crores and money raised from
bonds and debentures upto March, 1999 stood at Rs. 30619 crores. The borrowings from other sources were
Rs. 16067 crores upto March, 1999. ICICI was the first Indian financial company to raise Global Depository
Receipts (GDRs) in 1996 and American Depository Shares (ADS) in 1999. In 2001, ICICI raised a foreign
currency loan of US$ 75 million at LIBOR plus 70 basis points. In March 2007 the Capital of ICICI stands
Rs. 12398345000.
3.4 Housing Development Finance Corporation Limited
Profile
The Housing Development Finance Corporation Limited (HDFC) was amongst the first to receive an
'in principle' approval from the Reserve Bank of India (RBI) to set up a bank in the private sector, as part of
the RBI's liberalization of the Indian Banking Industry in 1994. The bank was incorporated in August 1994 in
the name of 'HDFC Bank Limited', with its registered office in Mumbai, India. HDFC Bank commenced
operations as a Scheduled Commercial Bank in January 1995.
Upstream Research International Journal ISSN 2321 –0567
A Peer Reviewed Indexed Journal Vol. 2 Issue 1 (April 2014)
Upstream Research International Journal ISSN 2321 –0567
A Peer Reviewed Indexed Journal Vol. 2 Issue 1 (April 2014)
Promoter
HDFC is India's premier housing finance company and enjoys an impeccable track record in India as
well as in international markets. Since its inception in 1977, the Corporation has maintained a consistent and
healthy growth in its operations to remain the market leader in mortgages. Its outstanding loan portfolio
covers well over a million dwelling units. HDFC has developed significant expertise in retail mortgage loans
to different market segments and also has a large corporate client base for its housing related credit facilities.
With its experience in the financial markets, a strong market reputation, large shareholder base and unique
consumer franchise, HDFC was ideally positioned to promote a bank in the Indian environment.
Business Focus
Capital Structure:
The authorized capital of HDFC Bank is Rs.450 crore (Rs.4.5 billion). The paid-up capital is
Rs.311.9 crore (Rs.3.1 billion). The HDFC Group holds 22.1% of the bank's equity and about 19.4% of the
equity is held by the ADS Depository (in respect of the bank's American Depository Shares (ADS) Issue).
Roughly 31.3% of the equity is held by Foreign Institutional Investors (FIIs) and the bank has about 190,000
shareholders. The shares are listed on the The Stock Exchange, Mumbai and the National Stock Exchange.
The bank's American Depository Shares are listed on the New York Stock Exchange (NYSE) under the
symbol "HDB".
Businesses of the Bank
HDFC Bank offers a wide range of commercial and transactional banking services and treasury products to
wholesale and retail customers. The bank has three key business segments:
(a) Wholesale banking services:
(b) Retail banking services
(c) Treasury
Upstream Research International Journal ISSN 2321 –0567
A Peer Reviewed Indexed Journal Vol. 2 Issue 1 (April 2014)
Upstream Research International Journal ISSN 2321 –0567
A Peer Reviewed Indexed Journal Vol. 2 Issue 1 (April 2014)
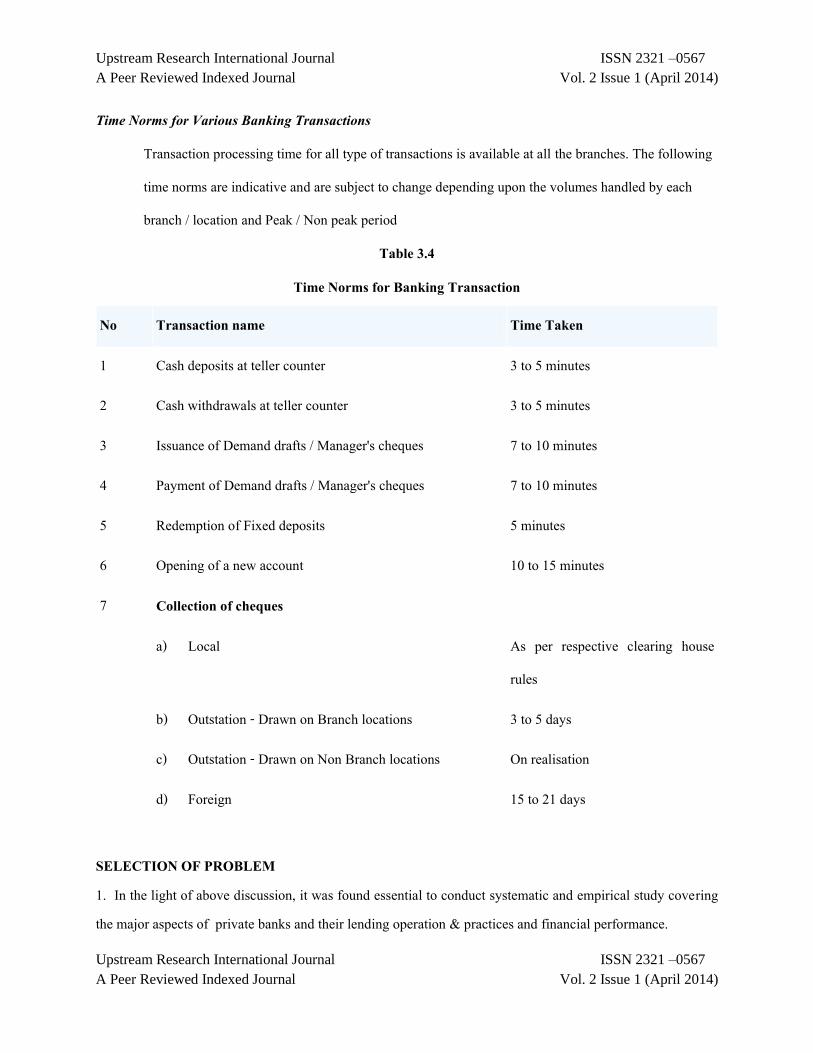
Time Norms for Various Banking Transactions
Transaction processing time for all type of transactions is available at all the branches. The following
time norms are indicative and are subject to change depending upon the volumes handled by each
branch / location and Peak / Non peak period
Table 3.4
Time Norms for Banking Transaction
No Transaction name Time Taken
1 Cash deposits at teller counter 3 to 5 minutes
2 Cash withdrawals at teller counter 3 to 5 minutes
3 Issuance of Demand drafts / Manager's cheques 7 to 10 minutes
4 Payment of Demand drafts / Manager's cheques 7 to 10 minutes
5 Redemption of Fixed deposits 5 minutes
6 Opening of a new account 10 to 15 minutes
7 Collection of cheques
a) Local As per respective clearing house
rules
b) Outstation - Drawn on Branch locations 3 to 5 days
c) Outstation - Drawn on Non Branch locations On realisation
d) Foreign 15 to 21 days
SELECTION OF PROBLEM 1. In the light of above discussion, it was found essential to conduct systematic and empirical study covering the major aspects of private banks and their lending operation & practices and financial performance.

Upstream Research International Journal ISSN 2321 –0567
A Peer Reviewed Indexed Journal Vol. 2 Issue 1 (April 2014)
Upstream Research International Journal ISSN 2321 –0567
A Peer Reviewed Indexed Journal Vol. 2 Issue 1 (April 2014)
2. Private Banks has been the leading and pioneering institution in the area of banking. It has also made a dent in the banking sector of the country with a view to grasping the idea of its investment and performance in India. 3. Finance has been preferred so far, as the major source of growth and development of banking industry in country. OBJECTIVES OF THE STUDY The present study aims at: To understand the conceptual framework of the Indian Banking Industry and Banking growth. To study the working of the private banks. To study the growth and development pattern. To evaluate the financial performance of private sector banks. To suggest recent and timely measure for important of lending operations and financial performance. To analyses the Landing operations, policies & practices. RESEARCH – METHODOLOGY
Research is common parlance refers to a search for knowledge. It can be defined as a scientific & systematic search for pertinent information on a specific topic. The advanced learner’s dictionary of current English lays down the meaning of research as ‚a careful investigation or inquiry especially through search for non facts in any branch for knowledge. The present investigation is a study of ‚A PERFORMANCE EVALUATION OF ICICI Vs HDFC BANKS”, in terms of its lending operations, financial performance and its contributions to the country. These considerations had led the investigator to use secondary data. The present study is based exclusively on secondary data, which have been collected from various issues of the annual reports of ICICI and HDFC Banks. Government and private records published from 2001-2006 have also been used to collect data. An attempt has been also made to get responses through on the spot interviews of the officers concerned in the area of lending policies and practices and other facts relating to present investigation. But, then researcher did not able to receive responses from the organization as the information was kept confidential for only organization point of view. The data has been analysed and interpreted by applying ratio analyses. Apart from
Upstream Research International Journal ISSN 2321 –0567
A Peer Reviewed Indexed Journal Vol. 2 Issue 1 (April 2014)
Upstream Research International Journal ISSN 2321 –0567
A Peer Reviewed Indexed Journal Vol. 2 Issue 1 (April 2014)
these, to give better understanding and in-depth interpretation, the researcher has also made use of table, chart, graph, pie gram and bar diagram.
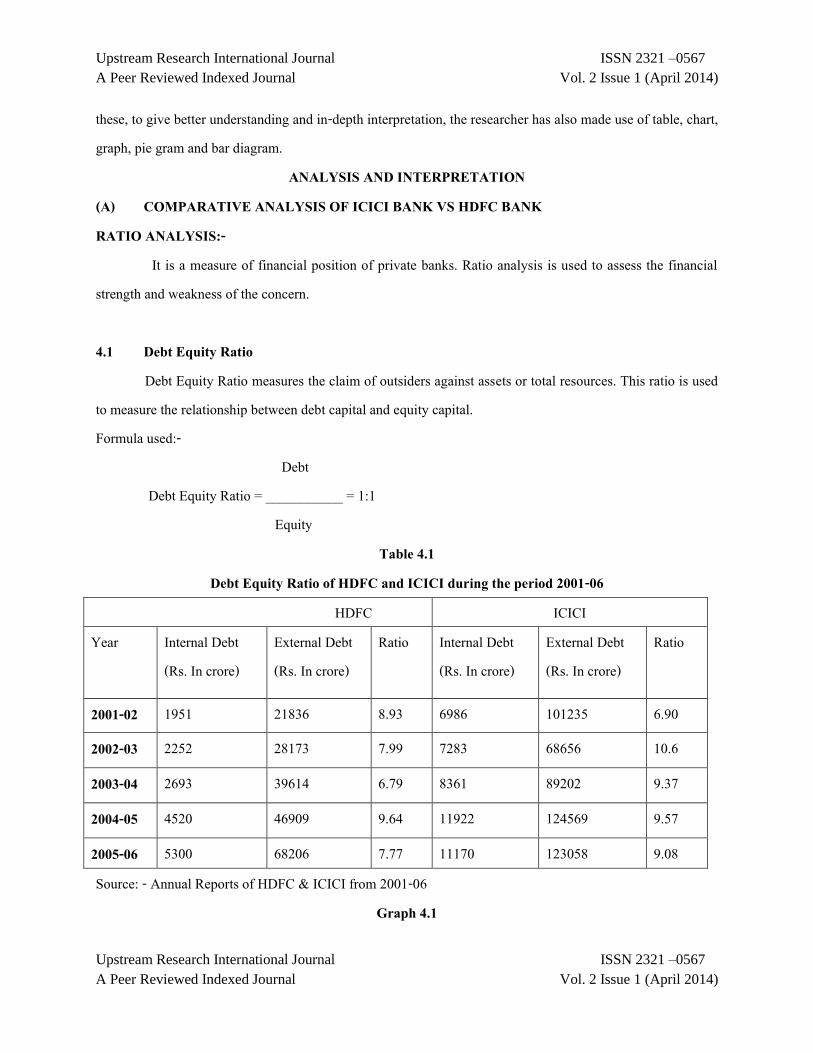
ANALYSIS AND INTERPRETATION (A) COMPARATIVE ANALYSIS OF ICICI BANK VS HDFC BANK RATIO ANALYSIS:- It is a measure of financial position of private banks. Ratio analysis is used to assess the financial strength and weakness of the concern. 4.1 Debt Equity Ratio Debt Equity Ratio measures the claim of outsiders against assets or total resources. This ratio is used to measure the relationship between debt capital and equity capital. Formula used:- Debt Debt Equity Ratio = ___________ = 1:1 Equity
Table 4.1 Debt Equity Ratio of HDFC and ICICI during the period 2001-06
HDFC ICICI Year Internal Debt
(Rs. In crore) External Debt (Rs. In crore)
Ratio Internal Debt (Rs. In crore)
External Debt (Rs. In crore)
Ratio
2001-02 1951 21836 8.93 6986 101235 6.90
2002-03 2252 28173 7.99 7283 68656 10.6
2003-04 2693 39614 6.79 8361 89202 9.37
2004-05 4520 46909 9.64 11922 124569 9.57
2005-06 5300 68206 7.77 11170 123058 9.08 Source: - Annual Reports of HDFC & ICICI from 2001-06
Graph 4.1

Upstream Research International Journal ISSN 2321 –0567
A Peer Reviewed Indexed Journal Vol. 2 Issue 1 (April 2014)
Upstream Research International Journal ISSN 2321 –0567
A Peer Reviewed Indexed Journal Vol. 2 Issue 1 (April 2014)
Graphic Presentation of Debt Equity Ratio
Table 4.1 shows that calculated ratio between debt and equity has been shown downward, upward, downward trends during the study period. During the year 2002-03 calculated ratio of ICICI has increased from 6.90 to 10.6. It may be due to increase debt. During the year 2005-06 calculated ratio of HDFC has declined to 7.77 and calculated ratio of ICICI has declined to 9.08. It may be due to increase in share capital and reduction in borrowings. The above diagram shows that ICICI has more effective optimal capital structure than HDFC. It may be suggested that HDFC should formulate effective and extensive financial plan to utilize maximum external source of finance to enhance the existing shareholder wealth. Table 4.2
Ratio of Interest Paid to Total Income of HDFC and ICICI during the period 2001-06 HDFC ICICI
Year Interest Paid (Rs. In crore)
Total Income (Rs. In crore)
Ratio Interest Paid (Rs. In crore)
Total Income (Rs. In crore)
Ratio
2001-02 1074 2036 52.75 3083 3942 78.21 2002-03 1192 2496 47.76 5084 6050 84.03 2003-04 1211 3029 39.98 7757 9281 83.58 2004-05 1316 3744 35.15 9870 12826 76.95 2005-06 1930 5599 34.47 14076 18767 75.00 Sources:-Annual reports of HDFC and ICICI from 2001-06
8.93 7.99 6.799.64
7.77
6.910.6
9.379.57
9.08
0
5
10
15
20
25
2001-02 2002-03 2003-04 2004-05 2005-06
HDFC Ratio ICICI Ratio
Upstream Research International Journal ISSN 2321 –0567
A Peer Reviewed Indexed Journal Vol. 2 Issue 1 (April 2014)
Upstream Research International Journal ISSN 2321 –0567
A Peer Reviewed Indexed Journal Vol. 2 Issue 1 (April 2014)
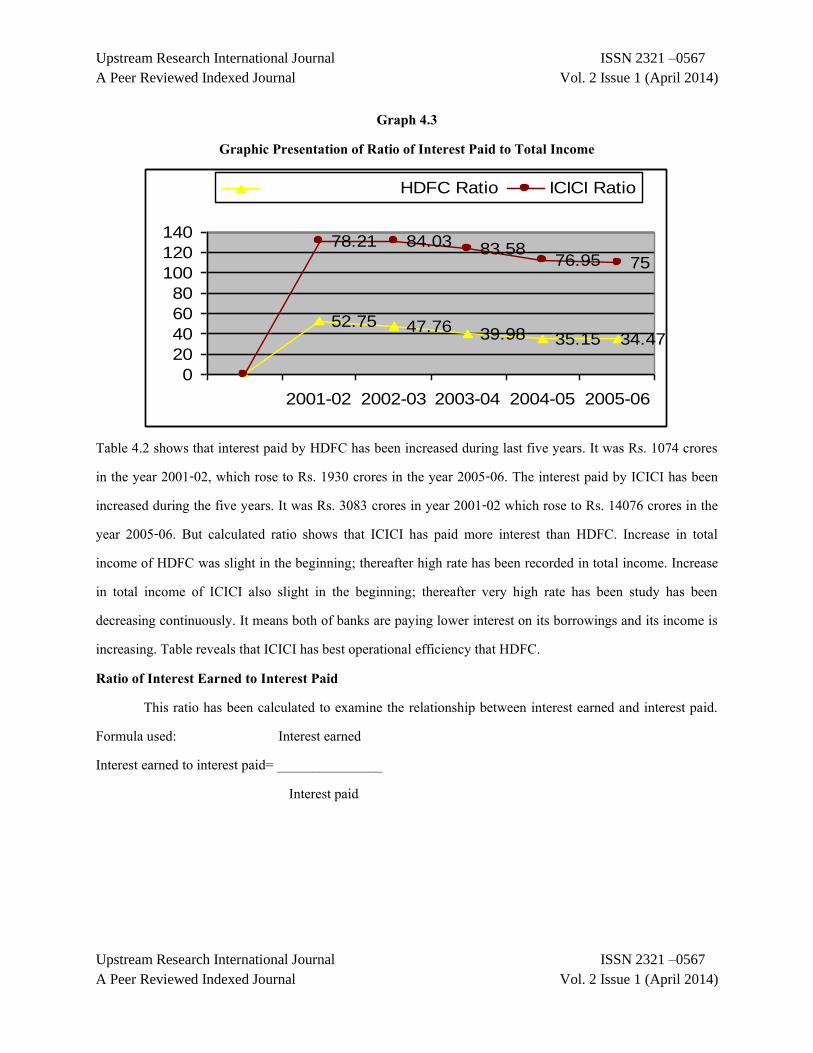
Graph 4.3 Graphic Presentation of Ratio of Interest Paid to Total Income
Table 4.2 shows that interest paid by HDFC has been increased during last five years. It was Rs. 1074 crores in the year 2001-02, which rose to Rs. 1930 crores in the year 2005-06. The interest paid by ICICI has been increased during the five years. It was Rs. 3083 crores in year 2001-02 which rose to Rs. 14076 crores in the year 2005-06. But calculated ratio shows that ICICI has paid more interest than HDFC. Increase in total income of HDFC was slight in the beginning; thereafter high rate has been recorded in total income. Increase in total income of ICICI also slight in the beginning; thereafter very high rate has been study has been decreasing continuously. It means both of banks are paying lower interest on its borrowings and its income is increasing. Table reveals that ICICI has best operational efficiency that HDFC. Ratio of Interest Earned to Interest Paid
This ratio has been calculated to examine the relationship between interest earned and interest paid. Formula used: Interest earned Interest earned to interest paid= _______________ Interest paid
52.75 47.76 39.98 35.15 34.47
78.21 84.03 83.5876.95 75
0
20
40
60
80
100
120
140
2001-02 2002-03 2003-04 2004-05 2005-06
HDFC Ratio ICICI Ratio

Upstream Research International Journal ISSN 2321 –0567
A Peer Reviewed Indexed Journal Vol. 2 Issue 1 (April 2014)
Upstream Research International Journal ISSN 2321 –0567
A Peer Reviewed Indexed Journal Vol. 2 Issue 1 (April 2014)
Table 4.3
Ratio of Interest Earned to Interest Paid of HDFC and ICICI during the period 2001-06 HDFC ICICI
Year Interest earned (Rs. In crore)
Interest Paid (Rs. In crore)
Ratio Interest earned (Rs. In crore)
Interest Paid (Rs. In crore)
Ratio
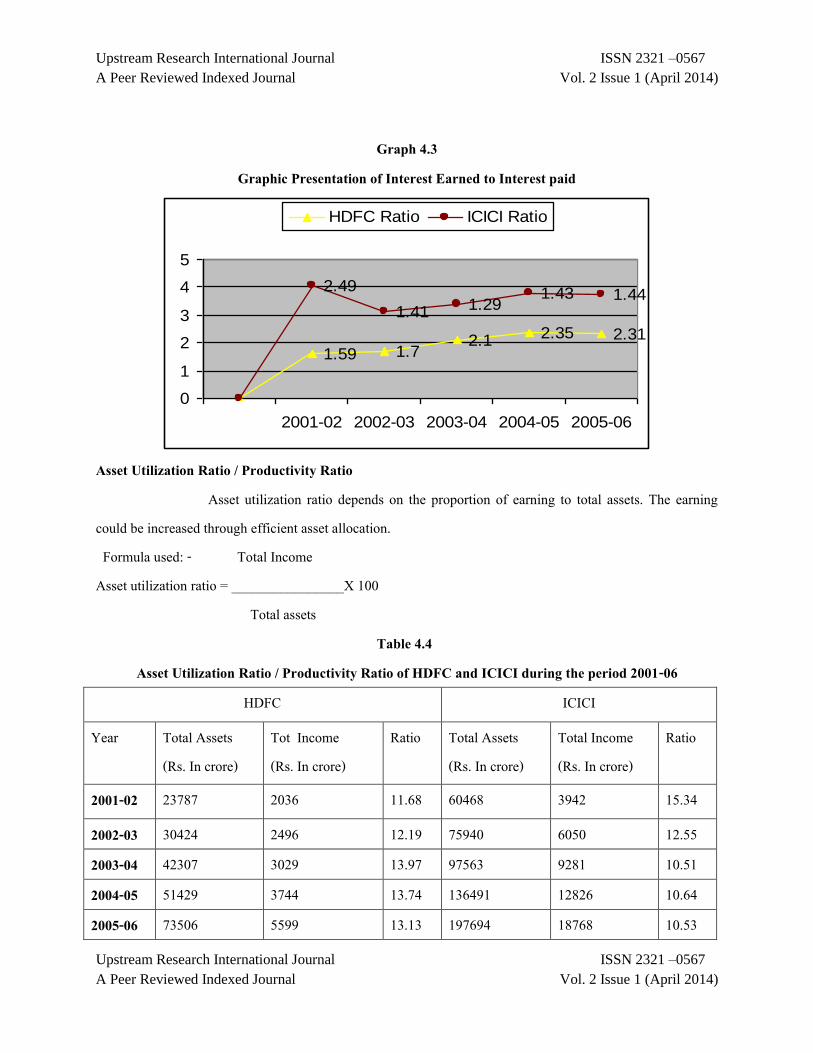
2001-02 1703 1074 1.59 3287 1317 2.49 2002-03 2023 1192 1.70 5039 3563 1.41 2003-04 2549 1211 2.10 7566 5852 1.29 2004-05 3093 1316 2.35 9407 6571 1.43 2005-06 4475 1930 2.31 13784 9597 1.44 Sources:-Annual reports of HDFC and ICICI from 2001-06 Table 4.3 depicts that interest earned has been gradually increasing year after year of both Banks and second component; interest paid is also increasing over the year. It was found that ratio of HDFC has been increasing from 2001-02 to 2005-06. In HDFC, it was 1.59 in the year 2001-02 shapely increased to 2.36 in the year 2005-06. In ICICI, it was decreasing under the period of study. It was 2.49 in the year 2001-02 shapely decreased to 1.44 in the year 2005-06. It was found that HDFC has been able to effectively utilize its loaned capital and it is getting the benefit of its ‘trading on equity.’
Upstream Research International Journal ISSN 2321 –0567
A Peer Reviewed Indexed Journal Vol. 2 Issue 1 (April 2014)
Upstream Research International Journal ISSN 2321 –0567
A Peer Reviewed Indexed Journal Vol. 2 Issue 1 (April 2014)
Graph 4.3
Graphic Presentation of Interest Earned to Interest paid
Asset Utilization Ratio / Productivity Ratio Asset utilization ratio depends on the proportion of earning to total assets. The earning could be increased through efficient asset allocation. Formula used: - Total Income Asset utilization ratio = ________________X 100 Total assets Table 4.4
Asset Utilization Ratio / Productivity Ratio of HDFC and ICICI during the period 2001-06 HDFC ICICI
Year Total Assets (Rs. In crore)
Tot Income (Rs. In crore)
Ratio Total Assets (Rs. In crore)
Total Income (Rs. In crore)
Ratio
2001-02 23787 2036 11.68 60468 3942 15.34
2002-03 30424 2496 12.19 75940 6050 12.55 2003-04 42307 3029 13.97 97563 9281 10.51 2004-05 51429 3744 13.74 136491 12826 10.64 2005-06 73506 5599 13.13 197694 18768 10.53
1.59 1.72.1 2.35 2.31
2.49
1.41 1.291.43 1.44
0
1
2
3
4
5
2001-02 2002-03 2003-04 2004-05 2005-06
HDFC Ratio ICICI Ratio
Upstream Research International Journal ISSN 2321 –0567
A Peer Reviewed Indexed Journal Vol. 2 Issue 1 (April 2014)
Upstream Research International Journal ISSN 2321 –0567
A Peer Reviewed Indexed Journal Vol. 2 Issue 1 (April 2014)
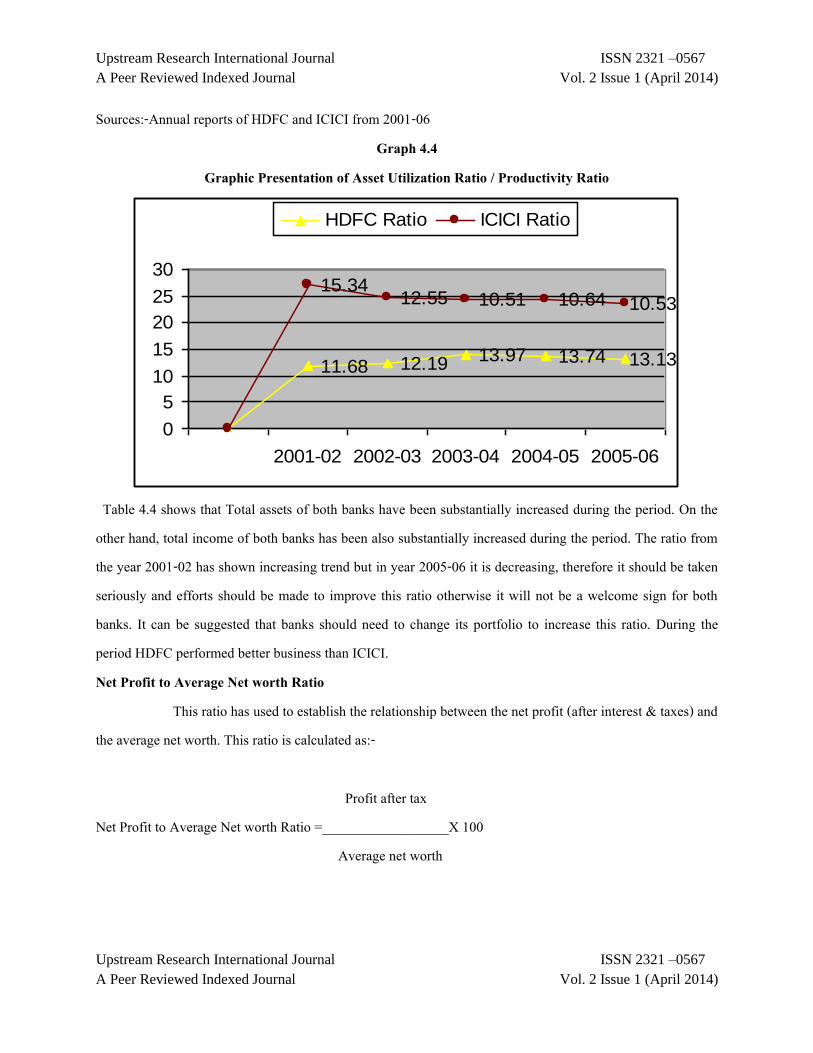
Sources:-Annual reports of HDFC and ICICI from 2001-06 Graph 4.4
Graphic Presentation of Asset Utilization Ratio / Productivity Ratio
Table 4.4 shows that Total assets of both banks have been substantially increased during the period. On the other hand, total income of both banks has been also substantially increased during the period. The ratio from the year 2001-02 has shown increasing trend but in year 2005-06 it is decreasing, therefore it should be taken seriously and efforts should be made to improve this ratio otherwise it will not be a welcome sign for both banks. It can be suggested that banks should need to change its portfolio to increase this ratio. During the period HDFC performed better business than ICICI. Net Profit to Average Net worth Ratio This ratio has used to establish the relationship between the net profit (after interest & taxes) and the average net worth. This ratio is calculated as:- Profit after tax Net Profit to Average Net worth Ratio =__________________X 100 Average net worth
11.68 12.19 13.97 13.74 13.13
15.3412.55 10.51 10.64 10.53
0
5
10
15
20
25
30
2001-02 2002-03 2003-04 2004-05 2005-06
HDFC Ratio ICICI Ratio
Upstream Research International Journal ISSN 2321 –0567
A Peer Reviewed Indexed Journal Vol. 2 Issue 1 (April 2014)
Upstream Research International Journal ISSN 2321 –0567
A Peer Reviewed Indexed Journal Vol. 2 Issue 1 (April 2014)
Table 4.5
Net Profit to Average Net worth Ratio of HDFC and ICICI during the period 2001-06 HDFC ICICI
Year Profit after tax (Rs. In crore)
Net Worth (Rs. In crore)
Ratio Profit after tax (Rs. In crore)
Net Worth (Rs. In crore)
Ratio
2001-02 297 1951 15.22 860 6986 12.31 2002-03 388 2252 17.23 620 7283 8.51 2003-04 510 2693 18.94 775 8361 9.27 2004-05 666 4520 14.73 2005 11922 16.82 2005-06 871 5300 16.43 2540 11170 22.74 Sources:-Annual reports of HDFC and ICICI from 2001-06
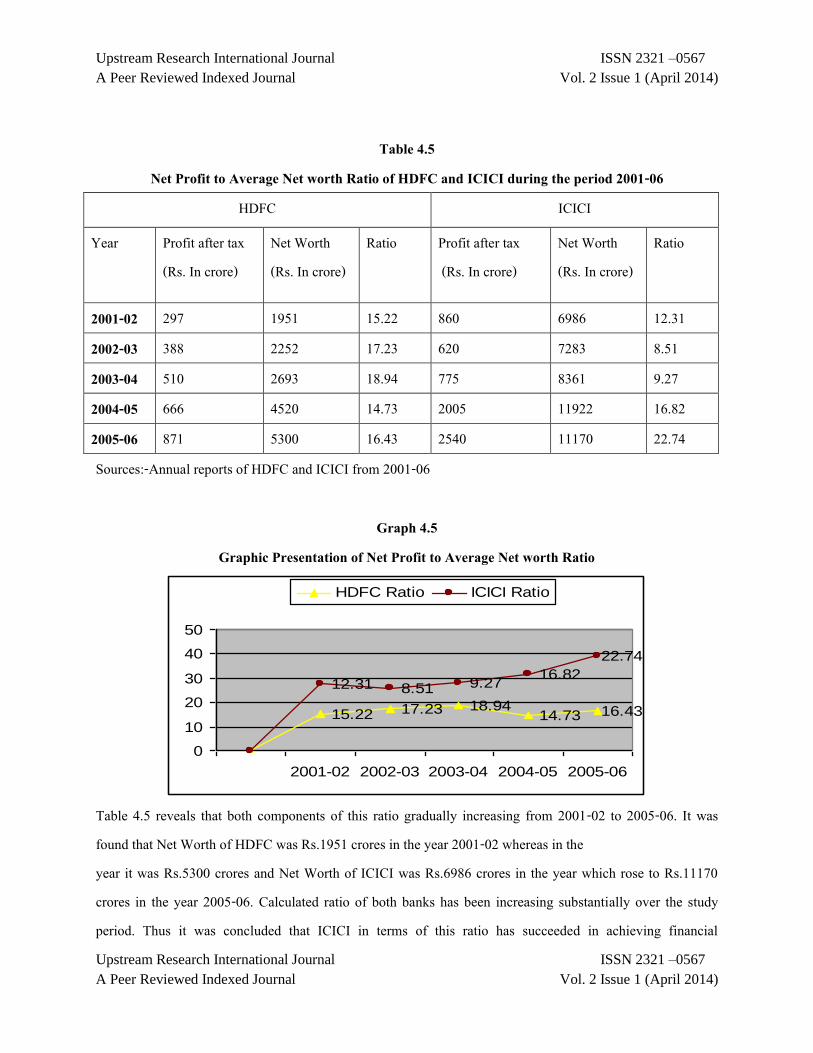
Graph 4.5
Graphic Presentation of Net Profit to Average Net worth Ratio
Table 4.5 reveals that both components of this ratio gradually increasing from 2001-02 to 2005-06. It was found that Net Worth of HDFC was Rs.1951 crores in the year 2001-02 whereas in the year it was Rs.5300 crores and Net Worth of ICICI was Rs.6986 crores in the year which rose to Rs.11170 crores in the year 2005-06. Calculated ratio of both banks has been increasing substantially over the study period. Thus it was concluded that ICICI in terms of this ratio has succeeded in achieving financial
15.22 17.23 18.9414.73 16.43
12.31 8.51 9.2716.82
22.74
0
10
20
30
40
50
2001-02 2002-03 2003-04 2004-05 2005-06
HDFC Ratio ICICI Ratio
Upstream Research International Journal ISSN 2321 –0567
A Peer Reviewed Indexed Journal Vol. 2 Issue 1 (April 2014)
Upstream Research International Journal ISSN 2321 –0567
A Peer Reviewed Indexed Journal Vol. 2 Issue 1 (April 2014)
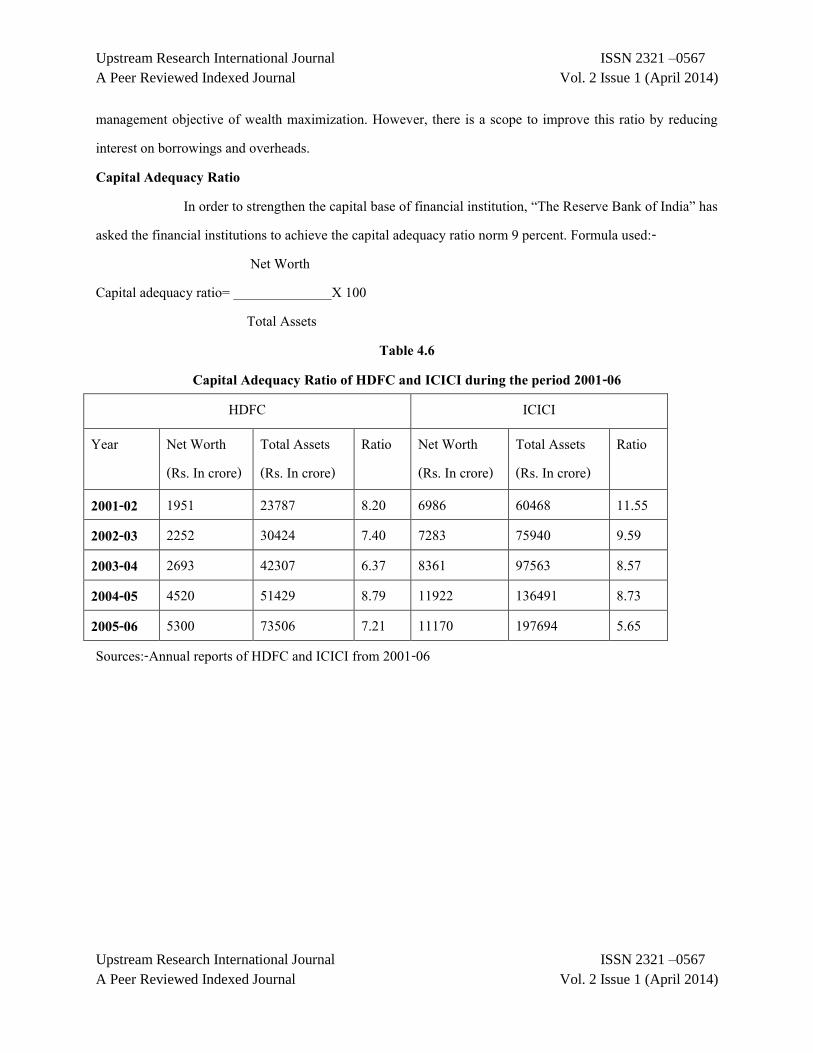
management objective of wealth maximization. However, there is a scope to improve this ratio by reducing interest on borrowings and overheads. Capital Adequacy Ratio In order to strengthen the capital base of financial institution, ‚The Reserve Bank of India‛ has asked the financial institutions to achieve the capital adequacy ratio norm 9 percent. Formula used:- Net Worth Capital adequacy ratio= ______________X 100 Total Assets
Table 4.6 Capital Adequacy Ratio of HDFC and ICICI during the period 2001-06
HDFC ICICI
Year Net Worth (Rs. In crore)
Total Assets (Rs. In crore)
Ratio Net Worth (Rs. In crore)
Total Assets (Rs. In crore)
Ratio
2001-02 1951 23787 8.20 6986 60468 11.55 2002-03 2252 30424 7.40 7283 75940 9.59 2003-04 2693 42307 6.37 8361 97563 8.57 2004-05 4520 51429 8.79 11922 136491 8.73 2005-06 5300 73506 7.21 11170 197694 5.65 Sources:-Annual reports of HDFC and ICICI from 2001-06
Upstream Research International Journal ISSN 2321 –0567
A Peer Reviewed Indexed Journal Vol. 2 Issue 1 (April 2014)
Upstream Research International Journal ISSN 2321 –0567
A Peer Reviewed Indexed Journal Vol. 2 Issue 1 (April 2014)
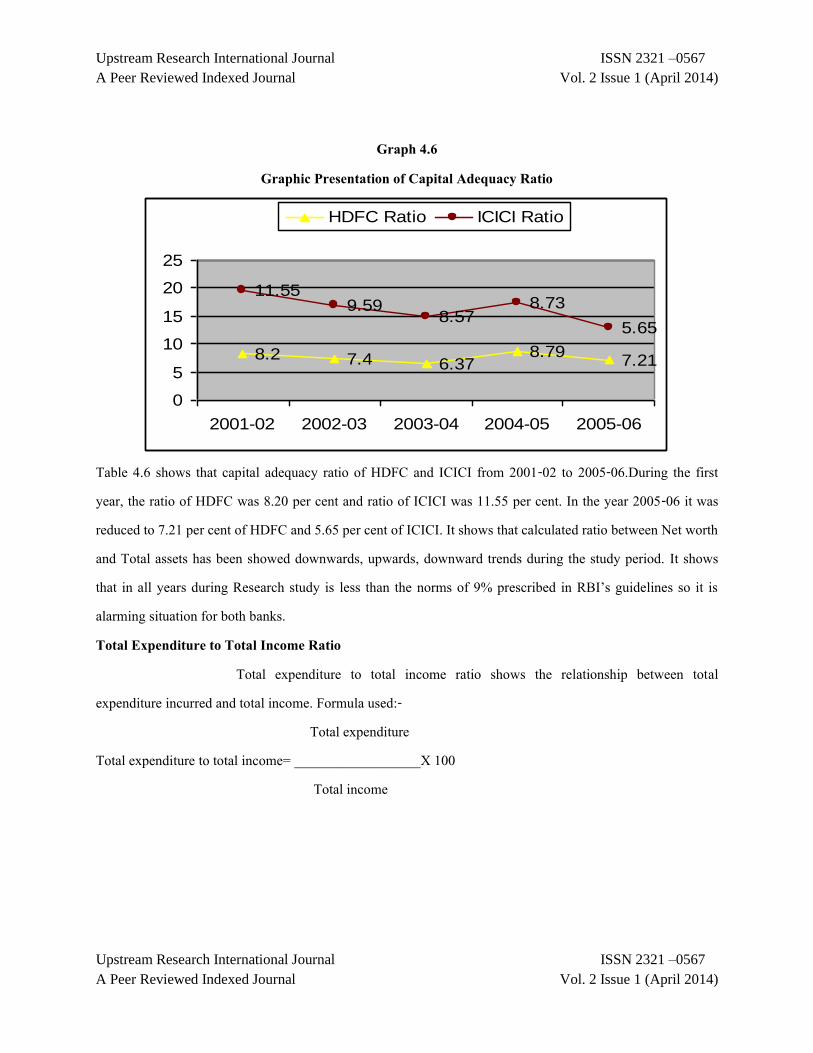
Graph 4.6
Graphic Presentation of Capital Adequacy Ratio
Table 4.6 shows that capital adequacy ratio of HDFC and ICICI from 2001-02 to 2005-06.During the first year, the ratio of HDFC was 8.20 per cent and ratio of ICICI was 11.55 per cent. In the year 2005-06 it was reduced to 7.21 per cent of HDFC and 5.65 per cent of ICICI. It shows that calculated ratio between Net worth and Total assets has been showed downwards, upwards, downward trends during the study period. It shows that in all years during Research study is less than the norms of 9% prescribed in RBI’s guidelines so it is alarming situation for both banks. Total Expenditure to Total Income Ratio Total expenditure to total income ratio shows the relationship between total expenditure incurred and total income. Formula used:- Total expenditure Total expenditure to total income= __________________X 100 Total income
8.2 7.4 6.378.79
7.21
11.559.59
8.578.73
5.65
0
5
10
15
20
25
2001-02 2002-03 2003-04 2004-05 2005-06
HDFC Ratio ICICI Ratio
Upstream Research International Journal ISSN 2321 –0567
A Peer Reviewed Indexed Journal Vol. 2 Issue 1 (April 2014)
Upstream Research International Journal ISSN 2321 –0567
A Peer Reviewed Indexed Journal Vol. 2 Issue 1 (April 2014)
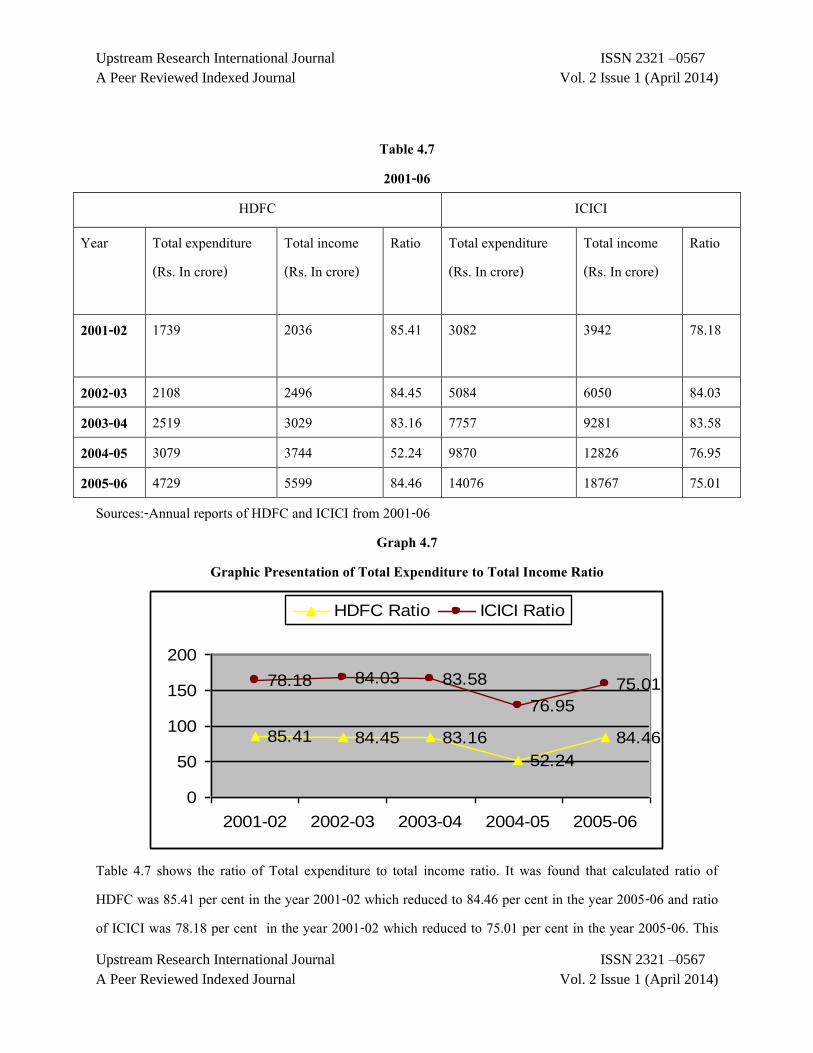
Table 4.7 2001-06
HDFC ICICI
Year Total expenditure (Rs. In crore)
Total income (Rs. In crore)
Ratio Total expenditure (Rs. In crore)
Total income (Rs. In crore)
Ratio
2001-02 1739 2036 85.41 3082 3942 78.18
2002-03 2108 2496 84.45 5084 6050 84.03 2003-04 2519 3029 83.16 7757 9281 83.58 2004-05 3079 3744 52.24 9870 12826 76.95 2005-06 4729 5599 84.46 14076 18767 75.01
Sources:-Annual reports of HDFC and ICICI from 2001-06 Graph 4.7
Graphic Presentation of Total Expenditure to Total Income Ratio
Table 4.7 shows the ratio of Total expenditure to total income ratio. It was found that calculated ratio of HDFC was 85.41 per cent in the year 2001-02 which reduced to 84.46 per cent in the year 2005-06 and ratio of ICICI was 78.18 per cent in the year 2001-02 which reduced to 75.01 per cent in the year 2005-06. This
85.41 84.45 83.16
52.24
84.46
78.18 84.03 83.58
76.95
75.01
0
50
100
150
200
2001-02 2002-03 2003-04 2004-05 2005-06
HDFC Ratio ICICI Ratio
Upstream Research International Journal ISSN 2321 –0567
A Peer Reviewed Indexed Journal Vol. 2 Issue 1 (April 2014)
Upstream Research International Journal ISSN 2321 –0567
A Peer Reviewed Indexed Journal Vol. 2 Issue 1 (April 2014)
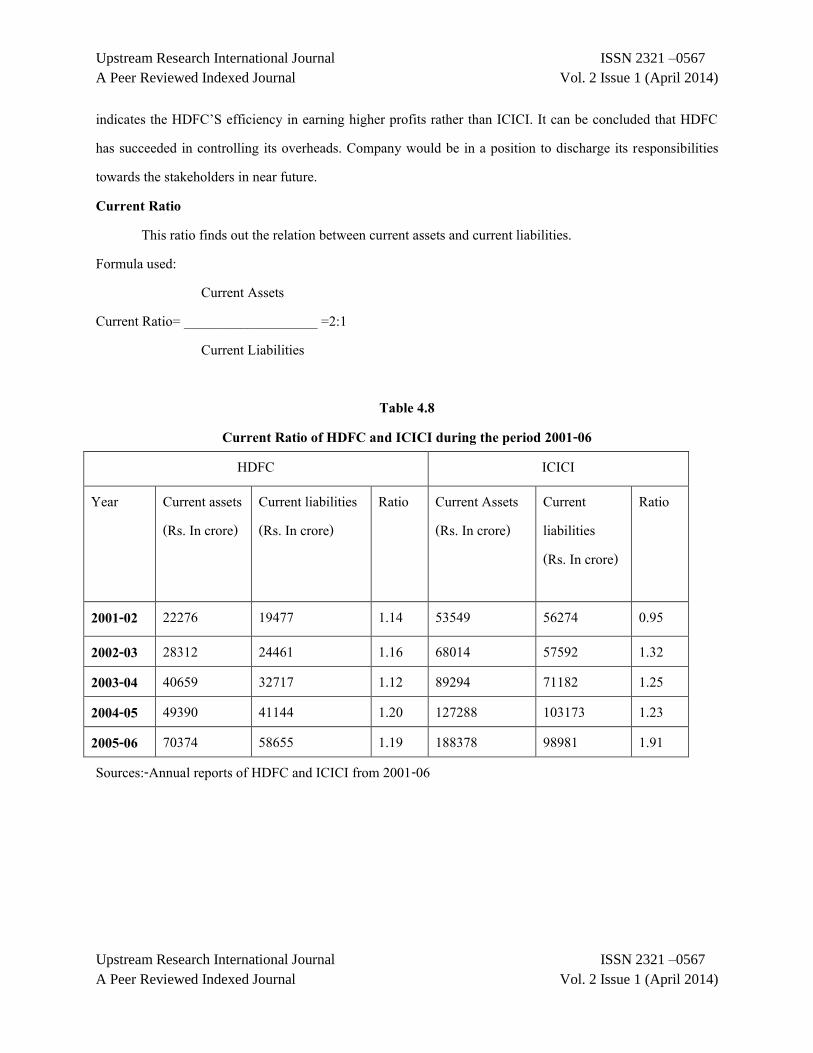
indicates the HDFC’S efficiency in earning higher profits rather than ICICI. It can be concluded that HDFC has succeeded in controlling its overheads. Company would be in a position to discharge its responsibilities towards the stakeholders in near future. Current Ratio This ratio finds out the relation between current assets and current liabilities. Formula used: Current Assets Current Ratio= ___________________ =2:1 Current Liabilities
Table 4.8 Current Ratio of HDFC and ICICI during the period 2001-06
HDFC ICICI
Year Current assets (Rs. In crore)
Current liabilities (Rs. In crore)
Ratio Current Assets (Rs. In crore)
Current liabilities (Rs. In crore)
Ratio
2001-02 22276 19477 1.14 53549 56274 0.95
2002-03 28312 24461 1.16 68014 57592 1.32 2003-04 40659 32717 1.12 89294 71182 1.25 2004-05 49390 41144 1.20 127288 103173 1.23 2005-06 70374 58655 1.19 188378 98981 1.91 Sources:-Annual reports of HDFC and ICICI from 2001-06
Upstream Research International Journal ISSN 2321 –0567
A Peer Reviewed Indexed Journal Vol. 2 Issue 1 (April 2014)
Upstream Research International Journal ISSN 2321 –0567
A Peer Reviewed Indexed Journal Vol. 2 Issue 1 (April 2014)
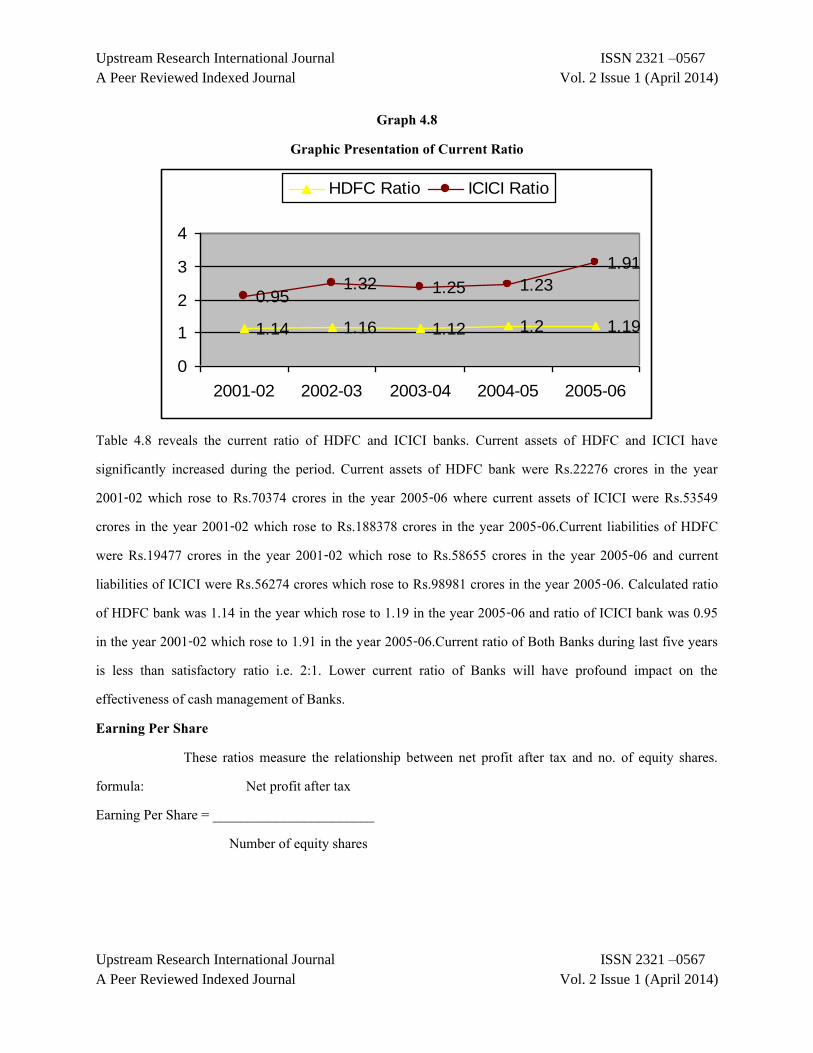
Graph 4.8 Graphic Presentation of Current Ratio
Table 4.8 reveals the current ratio of HDFC and ICICI banks. Current assets of HDFC and ICICI have significantly increased during the period. Current assets of HDFC bank were Rs.22276 crores in the year 2001-02 which rose to Rs.70374 crores in the year 2005-06 where current assets of ICICI were Rs.53549 crores in the year 2001-02 which rose to Rs.188378 crores in the year 2005-06.Current liabilities of HDFC were Rs.19477 crores in the year 2001-02 which rose to Rs.58655 crores in the year 2005-06 and current liabilities of ICICI were Rs.56274 crores which rose to Rs.98981 crores in the year 2005-06. Calculated ratio of HDFC bank was 1.14 in the year which rose to 1.19 in the year 2005-06 and ratio of ICICI bank was 0.95 in the year 2001-02 which rose to 1.91 in the year 2005-06.Current ratio of Both Banks during last five years is less than satisfactory ratio i.e. 2:1. Lower current ratio of Banks will have profound impact on the effectiveness of cash management of Banks. Earning Per Share These ratios measure the relationship between net profit after tax and no. of equity shares. formula: Net profit after tax Earning Per Share = _______________________ Number of equity shares
1.14 1.16 1.12 1.2 1.19
0.951.32 1.25 1.23
1.91
0
1
2
3
4
2001-02 2002-03 2003-04 2004-05 2005-06
HDFC Ratio ICICI Ratio

Upstream Research International Journal ISSN 2321 –0567
A Peer Reviewed Indexed Journal Vol. 2 Issue 1 (April 2014)
Upstream Research International Journal ISSN 2321 –0567
A Peer Reviewed Indexed Journal Vol. 2 Issue 1 (April 2014)
Table 4.9 Earning Per Shareof HDFC and ICICI during the period 2001-06
HDFC ICICI Year Profit after tax
(Rs. In crore) No. of equity share
Ratio Profit after tax (Rs. In crore)
No. of equity share
Ratio
2001-02 297 279032838 10.64 860 437659033 19.65
2002-03 388 279032838 13.91 620 276292335 22.44 2003-04 510 279718938 18.24 775 29322739 26.43 2004-05 666 282844438 23.55 2005 727767695 27.55 2005-06 871 313142408 27.81 2540 781779008 32.49
Sources:-Annual reports of HDFC and ICICI from 2001-06 Graph 4.9
Graphic Presentation of Earning Per Share
Table 4.9 reveals that earning per share of HDFC has been increasing from 10.64 per share in the year 2001-02 to Rs. 27.81 per share in the year 2005-06. Earning per share of ICICI has been increasing from 19.65 per share in the year 2001-02 to Rs. 32.49 per share in the year 2005-06. It is concluded that the earning per share of ICICI bank has good quality than HDFC. Further it may be observed that HDFC and ICICI is regularly announcing dividend for the shareholder.
10.64 13.91 18.2423.55 27.8119.65
22.4426.43
27.5532.49
0
20
40
60
80
2001-02 2002-03 2003-04 2004-05 2005-06
HDFC Ratio ICICI Ratio
Upstream Research International Journal ISSN 2321 –0567
A Peer Reviewed Indexed Journal Vol. 2 Issue 1 (April 2014)
Upstream Research International Journal ISSN 2321 –0567
A Peer Reviewed Indexed Journal Vol. 2 Issue 1 (April 2014)
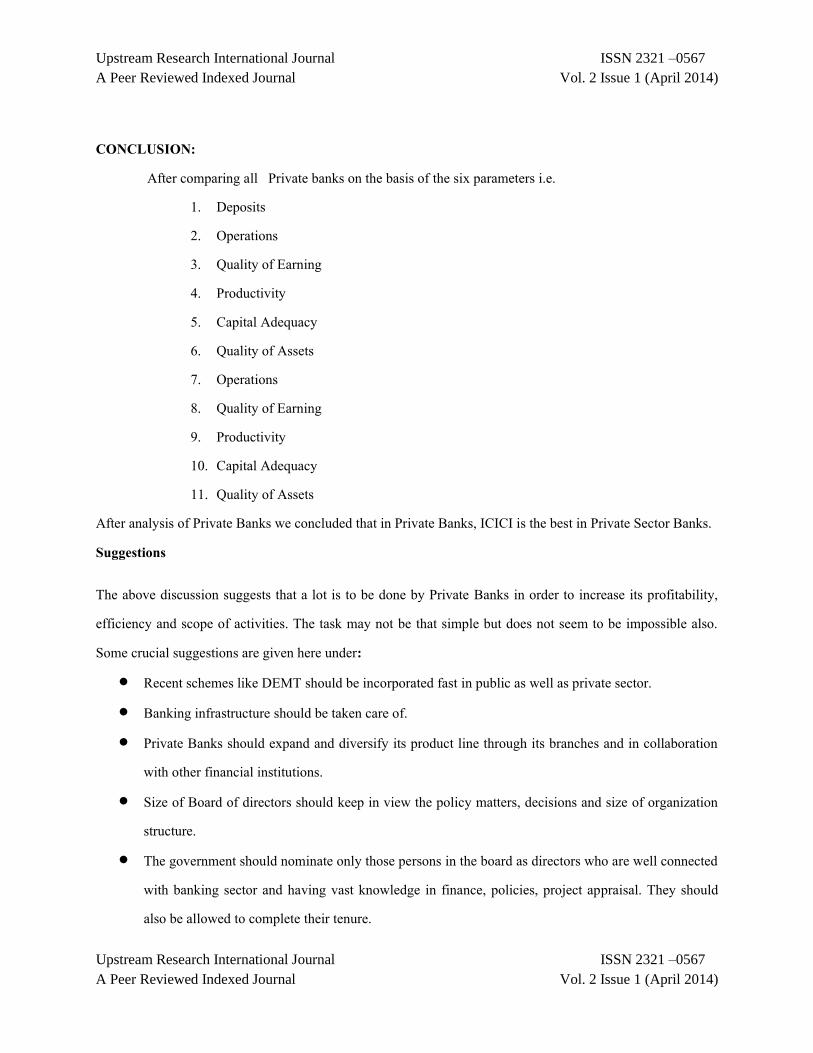
CONCLUSION: After comparing all Private banks on the basis of the six parameters i.e.
1. Deposits 2. Operations 3. Quality of Earning 4. Productivity 5. Capital Adequacy 6. Quality of Assets 7. Operations 8. Quality of Earning 9. Productivity 10. Capital Adequacy 11. Quality of Assets
After analysis of Private Banks we concluded that in Private Banks, ICICI is the best in Private Sector Banks. Suggestions
The above discussion suggests that a lot is to be done by Private Banks in order to increase its profitability, efficiency and scope of activities. The task may not be that simple but does not seem to be impossible also. Some crucial suggestions are given here under:
Recent schemes like DEMT should be incorporated fast in public as well as private sector. Banking infrastructure should be taken care of. Private Banks should expand and diversify its product line through its branches and in collaboration
with other financial institutions. Size of Board of directors should keep in view the policy matters, decisions and size of organization
structure. The government should nominate only those persons in the board as directors who are well connected
with banking sector and having vast knowledge in finance, policies, project appraisal. They should also be allowed to complete their tenure.
Upstream Research International Journal ISSN 2321 –0567
A Peer Reviewed Indexed Journal Vol. 2 Issue 1 (April 2014)
Upstream Research International Journal ISSN 2321 –0567
A Peer Reviewed Indexed Journal Vol. 2 Issue 1 (April 2014)
The managerial persons should be from finance background and they should provide ample opportunities to improve their skills and knowledge through training programmers and interaction with financial institutions.
Unprofitable banks should be closed down. Reduce the gap between deposits and advances. Formulate effective and extensive profit planning which may resources and enhance earnings. Formalities in getting loan should be reduced. Corruption should be removed and loans should reach in correct hands. Enhance its capital base to meet the diverse requirement of banking sector. Lending policies should be liberalized and these should be followed in letters and spirits. Organize more and more entrepreneurship programme so that prospective investors may be
encouraged to invest in banking sector. Undertake the underwriting business and merchant banking business with a view to help new and
nascent ventures. Finally, in the light of its experience in various fields should review all its planning, policies,
programmes and schedules and make necessary so that its contribution in the country may be more effective then it has hitherto been.
LIMITATIONS OF THE STUDY Every possible effort has been made by the researcher to complete the Present research work in all its aspects. But, because of a number of uncontrollable factors the research has its limitations as follows: i. Although the research study covers the period from 2001-02 to 2005-06, data have been collected
from various available sources even then, in some of the cases complete information was not available.
ii. The secondary data has been made basis for the analysis of the present study; therefore, the limitations of the secondary data remain the limitations of this study.
iii. The present research study has been restricted. Therefore, the observations made on the basis of present study cannot be generalized to all financial institutions.
Upstream Research International Journal ISSN 2321 –0567
A Peer Reviewed Indexed Journal Vol. 2 Issue 1 (April 2014)
Upstream Research International Journal ISSN 2321 –0567
A Peer Reviewed Indexed Journal Vol. 2 Issue 1 (April 2014)
CONCLUSION: After comparing all Private banks on the basis of the six parameters i.e.
1. Deposits 2. Operations 3. Quality of Earning 4. Productivity 5. Capital Adequacy 6. Quality of Assets
After analysis of Private Banks we concluded that in Private Banks, ICICI is the best in Private Sector Banks.
References Books Kothari, C.R. Research Methodology, 3rd Edition . Albers, Henry Herman, ‚Principal of Organization and Management ‚, Second edition, Jone Wiley & Sons Inc., New York, 1965. Zikmund, William G., Business Research Method, 5th Edition. Basch, Antonin, Financing Economic Development, The Macmillan Company, New York, 1964 Daghi, V. ‚Institution of India ‚ Vora and Company, Bombay, 1976. Jain, P.K., Financial Institution in India, Delhi, 1983 Pandey, I.M., Financial Management, Vikas Publishing House, Delhi. Singhal, N.C., ‚Impact of Development Banks on Industrialisation in India‛, Published by the Principal, B.J., Vanijya Mahvidyalaya, Vallabh vidyanagar, 1981. Misra. P.N., ‚Development Banks and The New Entrepreneurship in India‛, National Publishing House, 1987. Lakshmana Rao, Progress of Development Banking in India, Chauh Publication Allahbad, 1986. Jain, P.K., assessing The Performance of a Development Bank, Long Range Planning Oxford Shire, U.K., 1989. Machiraju, H.R., Indian Financial System, Vikas Publishing House, Delhi 1999. Financial Institutions and Markets, Shashi K. Gupta, Nisha Aggarwal.

Upstream Research International Journal ISSN 2321 –0567
A Peer Reviewed Indexed Journal Vol. 2 Issue 1 (April 2014)
Upstream Research International Journal ISSN 2321 –0567
A Peer Reviewed Indexed Journal Vol. 2 Issue 1 (April 2014)
Khan and Jain, Management Accounting and Financial Management problems and Solutions, Tata McGraw-Hill Publication, New Delhi. Chandra, Parsana, Financial Management, Theory and Practice, New Delhi, Tata McGraw-Hill Publishing Co., 1997. Bhatt, V.V., Structure of Financial Institutions, Vora & Company, Bombay 1972. Gupta V.K., Mittal J.P., Management of Financial Institution in India, Radha Publication, New Delhi, 1991. Barnard Chester I., Organisation and Management, Harvard University Press, Cambridge, 1948. Guthman, G.H, Analysis of Financial Statement, New York: Prentice Hall, 1953. Basu, S.K.,‛Theory and Practice of Development Banking-A study in the Asian context‛, Asia Publishing House, Bombay, 1965. Allen Louis A., Management and Organization, McGraw-Hill Book Company, New York, 1958. Articles Alman, E. I., ‘ Financial Ratios, Discriminate Analysis and Prediction of Corporate Bankruptey’ , Journer of Finance . Business Today, ‚Financing the Future‛, Vol-VI No.22, ‘Nov. 22-Dec 6, 1997, New Delhi. Journals, Newspapers Roshni Jayakar ‚Comparison of Banks‛ BT-KPMG Group. ‚SBI identifies foreign buy targets‛ Economic Times. Business Standard Chartered Accountant Management Accountant Finance India Annual Reports Annual reports of HDFC, 2001 to 2006 Annual reports of ICICI, 2001 to 2006 Annual reports of SBI, 2001 to 2006 Annual reports of PNB, 2001 to 2006
Upstream Research International Journal ISSN 2321 –0567
A Peer Reviewed Indexed Journal Vol. 2 Issue 1 (April 2014)
Upstream Research International Journal ISSN 2321 –0567
A Peer Reviewed Indexed Journal Vol. 2 Issue 1 (April 2014)
Websites www.hdfcbank.com www.icicibank.com www.sbibank.com www.pnbbank.com www.sebi.gov.in
Related Documents


