Nat.Volatiles&Essent.Oils,2021;8(4):5753-5764 5753 A Study on Operating Performance Evaluation of ICICI, HDFC and Nippon India Mutual Funds 1 Muralidhar Dunna, 2 Dr. K. K. Garg 1 M.Com, MBA, M.Phil, PGDFMT (PhD), Research Scholar, School of Commerce &Management, Lingaya’s Vidyapeeth, Faridabad, Haryana 2 Professor, School of Commerce &Management, Lingaya’s Vidyapeeth, Faridabad, Haryana Abstract Globalization, liberalization, technological advancement, high competition and economic uncertainties have made it imperative for the financial sector to satisfy their existing customers and retain them and be proactive in their management strategies to maintain their upper place in the highly competitive market. Indian Financial System was rejuvenated with the introduction of multiple financial institutions, financial services and financial instruments in the post LPG era. This process has opened doors to the private business entities also to start new financial institutions and offer various financial services and instruments. One such institution was mutual funds. Mutual fund companies come into this category. India’s mutual fund market has witnessed phenomenal growth over the last decade. The consistency in the performance of mutual funds has been a major factor that has attracted many investors. Mutual Fund is one of the most effective instruments for the small & medium investors for investment and offers opportunity to them to participate in capital market with low level of risk. The performance of mutual fund schemes is dependent on the right strategy adopted by the fund managers in designing the portfolio. Among various investment modes, Mutual Fund is the most suitable investment mode for the common man, as it offers an opportunity to invest in a diversified and professionally managed portfolio at a relatively low cost. A proper evaluation measure will remove confusion and help the investors to decide about the level of investment in various mutual funds schemes, about their performance over a period of time. Hence this research mainly focuses on Operating performance of HDFC, ICICI Prudential and Nippon India Mutual Funds with growth option and direct plan for five years periods. These mutual fund companies are top performer companies. For this study balanced, debt, liquid, ELSS, Equity Diversified and Indexed fund schemes have been taken. KEYWORDS: Mutual funds, Performance, Equity Diversified, ELSS, Investment, Globalization Introduction A mutual fund is an investment firm which combines funds from various individuals, shareholders or shareholders, with the single aim of investing and diversifying their investments into different secretarial types so that future returns are generated and distributed among themselves in accordance with their units. During the period of globalisation, there will be rapid price fluctuations in assets such as shareholdings, bonds, land and buildings, derivatives, etc. Secondly, many people find it difficult to monitor the ownership of property in their assets, investments, duties and various transactions related to financial matters. The best solution for all these is mutual fund. Mutual funds help investors in a complicated and modern financial scenario in both small and medium sizes. Investors purchase units from the mutual fund company by paying amount. The company allotted to units to the investors. Those investors called unit holders. Once returns generated by these investments from their proposed systems are distributed by units. Mutual funds play significant role in terms of resource mobilisation and efficient

Welcome message from author
This document is posted to help you gain knowledge. Please leave a comment to let me know what you think about it! Share it to your friends and learn new things together.
Transcript
Nat.Volatiles&Essent.Oils,2021;8(4):5753-5764
5753
A Study on Operating Performance Evaluation of ICICI, HDFC
and Nippon India Mutual Funds
1Muralidhar Dunna, 2Dr. K. K. Garg
1M.Com, MBA, M.Phil, PGDFMT (PhD), Research Scholar, School of Commerce &Management, Lingaya’s Vidyapeeth,
Faridabad, Haryana 2Professor, School of Commerce &Management, Lingaya’s Vidyapeeth, Faridabad, Haryana
Abstract
Globalization, liberalization, technological advancement, high competition and economic uncertainties have made it imperative
for the financial sector to satisfy their existing customers and retain them and be proactive in their management strategies to
maintain their upper place in the highly competitive market. Indian Financial System was rejuvenated with the introduction of
multiple financial institutions, financial services and financial instruments in the post LPG era. This process has opened doors to
the private business entities also to start new financial institutions and offer various financial services and instruments. One such
institution was mutual funds. Mutual fund companies come into this category. India’s mutual fund market has witnessed
phenomenal growth over the last decade. The consistency in the performance of mutual funds has been a major factor that has
attracted many investors. Mutual Fund is one of the most effective instruments for the small & medium investors for investment
and offers opportunity to them to participate in capital market with low level of risk. The performance of mutual fund schemes
is dependent on the right strategy adopted by the fund managers in designing the portfolio. Among various investment modes,
Mutual Fund is the most suitable investment mode for the common man, as it offers an opportunity to invest in a diversified and
professionally managed portfolio at a relatively low cost. A proper evaluation measure will remove confusion and help the
investors to decide about the level of investment in various mutual funds schemes, about their performance over a period of
time. Hence this research mainly focuses on Operating performance of HDFC, ICICI Prudential and Nippon India Mutual Funds
with growth option and direct plan for five years periods. These mutual fund companies are top performer companies. For this
study balanced, debt, liquid, ELSS, Equity Diversified and Indexed fund schemes have been taken.
KEYWORDS: Mutual funds, Performance, Equity Diversified, ELSS, Investment, Globalization
Introduction
A mutual fund is an investment firm which combines funds from various individuals, shareholders
or shareholders, with the single aim of investing and diversifying their investments into different
secretarial types so that future returns are generated and distributed among themselves in accordance
with their units. During the period of globalisation, there will be rapid price fluctuations in assets such as
shareholdings, bonds, land and buildings, derivatives, etc. Secondly, many people find it difficult to
monitor the ownership of property in their assets, investments, duties and various transactions related to
financial matters. The best solution for all these is mutual fund. Mutual funds help investors in a
complicated and modern financial scenario in both small and medium sizes. Investors purchase units from
the mutual fund company by paying amount. The company allotted to units to the investors. Those
investors called unit holders. Once returns generated by these investments from their proposed systems
are distributed by units. Mutual funds play significant role in terms of resource mobilisation and efficient
Nat.Volatiles&Essent.Oils,2021;8(4):5753-5764
5754
allocation among unit holders. Besides these, the funds also play a important role within the overall
expansion of capital and financial markets. Mutual funds also support efficient participation in monetary
and capital market growth and economic growth as a whole.
Objectives of the Study
• To examine Balanced, debt, liquid, ELSS, Equity Diversified and Indexed fund schemes of Selected Mutual
Funds.
• To learn how the selected mutual fund schemes are Operationally performing between 2015 and 2020
• To study the effectiveness of selected companies by using the Assets under Management, Sales and
Redemptions of the selected Mutual funds
Research Methodology
The study time was five years, i.e. from 2015-16 until 2019-20. The sample consists on the average
return of past five years of efficient fund companies in India. The broad BSE national index of 100 shares
was used as a proxy to determine whether or not the schemes and funds could beat the market. The data
is collected using the secondary sample. Secondary information was collected from fact sheets,
newspapers, journals, books and periodicals, in order to provide an overview of Indian mutual fund
industries' current trends. The information was collected from the AMC's, AMFI, mutualfundsindia.com
websites, moneycontrol.com, valueresearchonline.com etc. Secondary information has also been
collected through annual reports of various institutions. In addition, the research work also examines
published and unpublished documents.
Operating Performance Evaluation of Mutual Fund Schemes
By analysing the sales and repurchase/redemption of the various systems and asset management
the operational performance of the mutual fund can also be evaluated. From time to time, the mutual
fund companies launch different schemes. Investors purchase shares in mutual funds from themselves (or
through a fund broker) but are incapable of acquiring shares in a secondary stock market other investors
like the Bombay Stock Exchange or the National Stock Exchange. Premium investor payment for mutual
funds is the Net Asset Value (NAV) per share plus any fee imposed upon the purchase by the fund (such
as sales loads). Units of mutual funds are 'redemptible.' In other words, if any investor needs to sell his
units, he will re-sell them to their own NAV for funds or brokers acting for the fund with the exception of
any fees imposed by the fund. Mutual funds usually sell their shares continuously, even if some funds, for
example, stop selling when they are too large. The "asset management company" registered in SEBI, a
separate body, usually manages the investment in the mutual funds. Mutual funds are available in many
different varieties. For example, the Equity Fund, the Bond Fund, Money market fund, ELSS fund, Index
fund, among others. A different investment objective, different investment strategies and a different
portfolio can each be achieved.
Nat.Volatiles&Essent.Oils,2021;8(4):5753-5764
5755
Analysis of the Data
Data of selected mutual fund companies have been taken from the year 2015-16 to 2019-20 for
the Operational Performance Analysis. The researchers have done the following analysis of operating
performance.
• Evaluation of total sales for all the schemes
• Evaluation of total redemptions of all the selected schemes.
• Evaluation of Total Asset under management of scheme wise
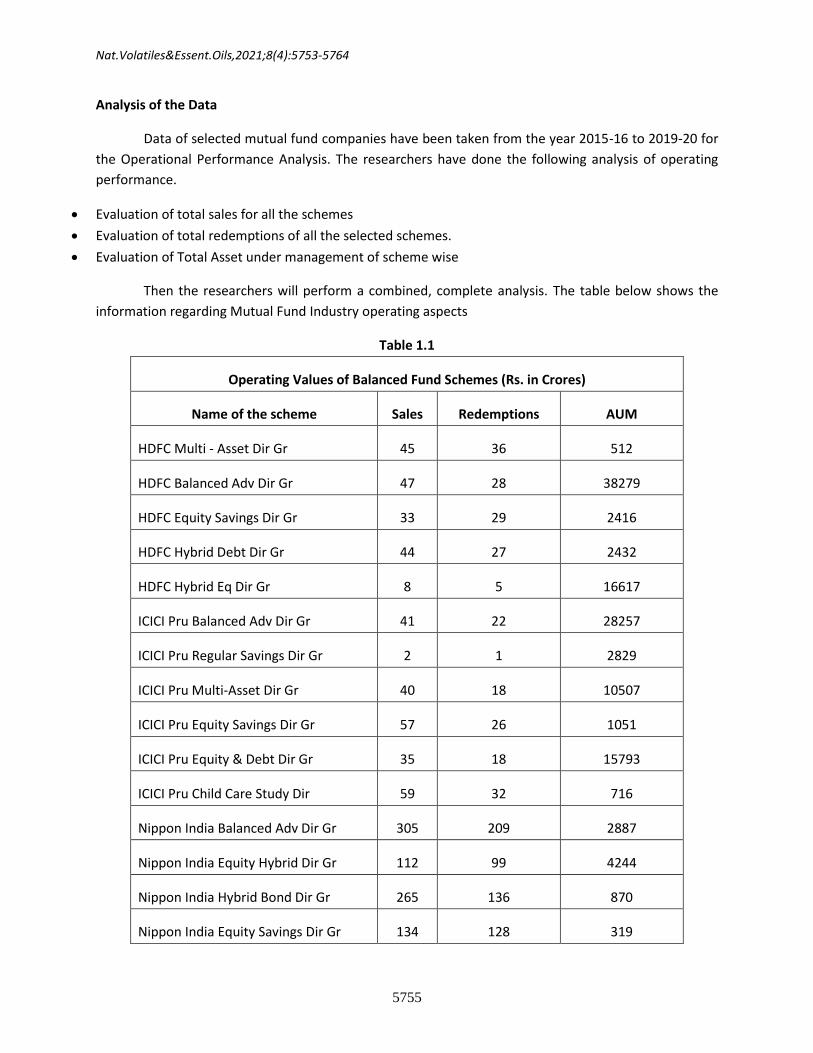
Then the researchers will perform a combined, complete analysis. The table below shows the
information regarding Mutual Fund Industry operating aspects
Table 1.1
Operating Values of Balanced Fund Schemes (Rs. in Crores)
Name of the scheme Sales Redemptions AUM
HDFC Multi - Asset Dir Gr 45 36 512
HDFC Balanced Adv Dir Gr 47 28 38279
HDFC Equity Savings Dir Gr 33 29 2416
HDFC Hybrid Debt Dir Gr 44 27 2432
HDFC Hybrid Eq Dir Gr 8 5 16617
ICICI Pru Balanced Adv Dir Gr 41 22 28257
ICICI Pru Regular Savings Dir Gr 2 1 2829
ICICI Pru Multi-Asset Dir Gr 40 18 10507
ICICI Pru Equity Savings Dir Gr 57 26 1051
ICICI Pru Equity & Debt Dir Gr 35 18 15793
ICICI Pru Child Care Study Dir 59 32 716
Nippon India Balanced Adv Dir Gr 305 209 2887
Nippon India Equity Hybrid Dir Gr 112 99 4244
Nippon India Hybrid Bond Dir Gr 265 136 870
Nippon India Equity Savings Dir Gr 134 128 319
Nat.Volatiles&Essent.Oils,2021;8(4):5753-5764
5756
Source: www.amfiindia.com
Operating Performance Evaluation - Balanced Fund Schemes
The researchers compiled the data and presented them in the table on the basis of monthly
statistical reports. The function values of the systems for the study are shown in Table 4.2.7. The results
show that of 15 balanced schemes, all schemes are providing good amount of sales, redemptions and
asset under management. The highest AUM generated by the HDFC Balanced Adv Dir Gr of HDFC AMC ltd
and the least AUM presented by the Nippon India Equity Savings Dir Gr. Higher AUM considers positive
indicator of quality and management experience of concerned AMC. It also presents higher sales
generated by Nippon India Balanced Adv Dir Gr and lower sales generated by ICICI Pru Regular Savings Dir
Gr and also the same schemes are providing lower redemptions as well. Normally higher sales and lower
redemptions always indicate positive impact on returns of the schemes.
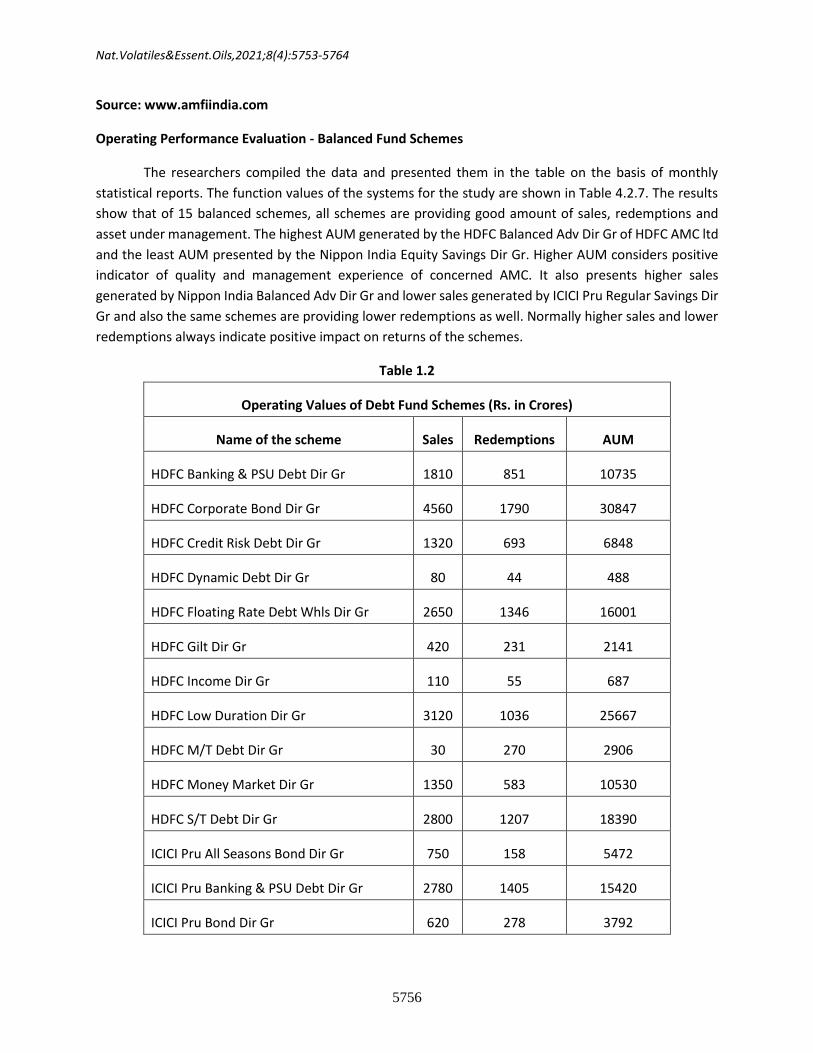
Table 1.2
Operating Values of Debt Fund Schemes (Rs. in Crores)
Name of the scheme Sales Redemptions AUM
HDFC Banking & PSU Debt Dir Gr 1810 851 10735
HDFC Corporate Bond Dir Gr 4560 1790 30847
HDFC Credit Risk Debt Dir Gr 1320 693 6848
HDFC Dynamic Debt Dir Gr 80 44 488
HDFC Floating Rate Debt Whls Dir Gr 2650 1346 16001
HDFC Gilt Dir Gr 420 231 2141
HDFC Income Dir Gr 110 55 687
HDFC Low Duration Dir Gr 3120 1036 25667
HDFC M/T Debt Dir Gr 30 270 2906
HDFC Money Market Dir Gr 1350 583 10530
HDFC S/T Debt Dir Gr 2800 1207 18390
ICICI Pru All Seasons Bond Dir Gr 750 158 5472
ICICI Pru Banking & PSU Debt Dir Gr 2780 1405 15420
ICICI Pru Bond Dir Gr 620 278 3792
Nat.Volatiles&Essent.Oils,2021;8(4):5753-5764
5757
ICICI PruConst Mat Gilt Dir Gr 80 42 362
ICICI Pru Corporate Bond Dir Gr 3520 1675 21156
ICICI Pru Credit Risk Dir Gr 1099 451 7007
ICICI Pru Floating Interest Dir Gr 2586 1418 13323
ICICI Pru Gilt Dir Gr 682 311 3474
ICICI Pru Long Term Bond Dir Gr 159 70 853
ICICI Pru Medium Term Bond Dir Gr 1045 472 6365
ICICI Pru Money Market Dir Gr 1428 681 10355
ICICI Pru Savings Dir Gr 4281 2099 26706
ICICI Pru Short Term Dir Gr 4523 2270 24170
ICICI Pru Ultra Short Term Dir Gr 1425 700 8495
Nippon India Bnk& PSU Dbt Dir Gr 1263 580 7712
Nippon India Corporate Bond Dir Gr 364 201 1978
Nippon India Credit Risk Dir Gr 104 51 1185
Nippon India Dynamic Bond Dir Gr 426 192 2748
Nippon India FRF Dir Gr 2600 1250 16057
Nippon India Gilt Sec Dir Gr 400 204 1762
Nippon India Income Dir Gr 78 39 417
Nippon India Low Duration Dir Gr 1242 576 8699
Nippon India Money Market Dir Gr 847 372 6571
Nippon India Short Term Dir Gr 1352 593 8987
Nippon India Strategic Debt Dir Gr 7 4 281
Nippon India U/ST Duration Dir Gr 89 46 724
Source: www.amfiindia.com
Nat.Volatiles&Essent.Oils,2021;8(4):5753-5764
5758
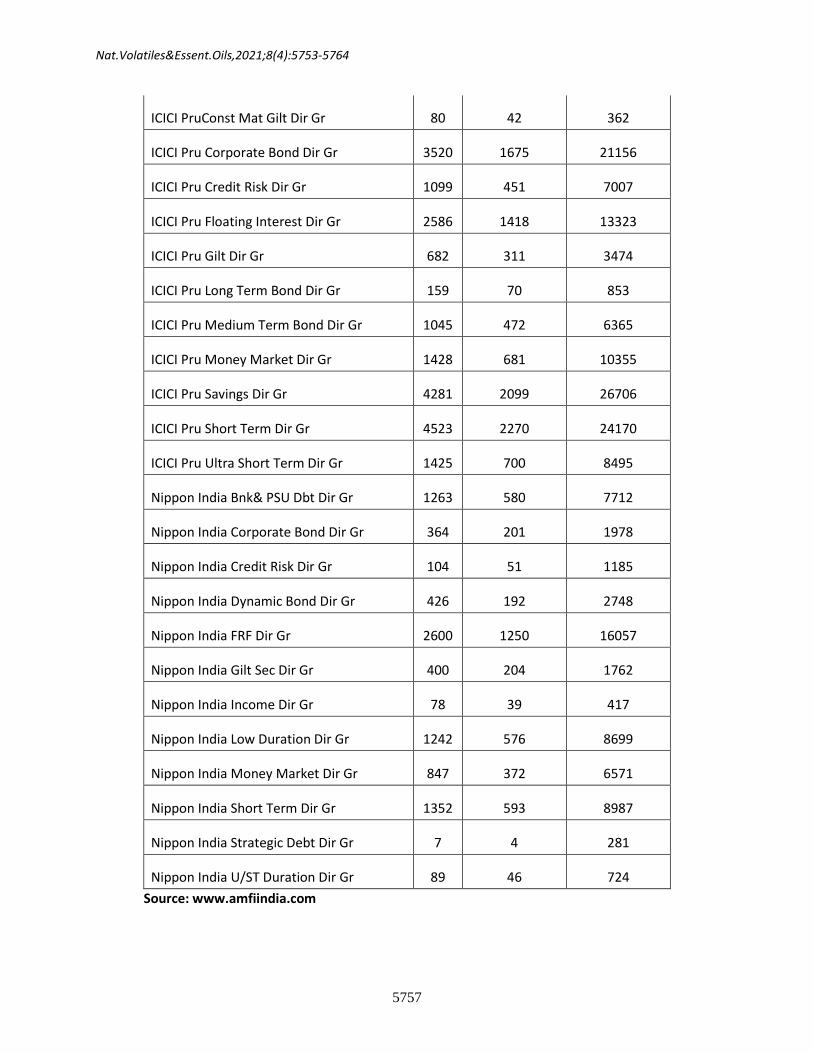
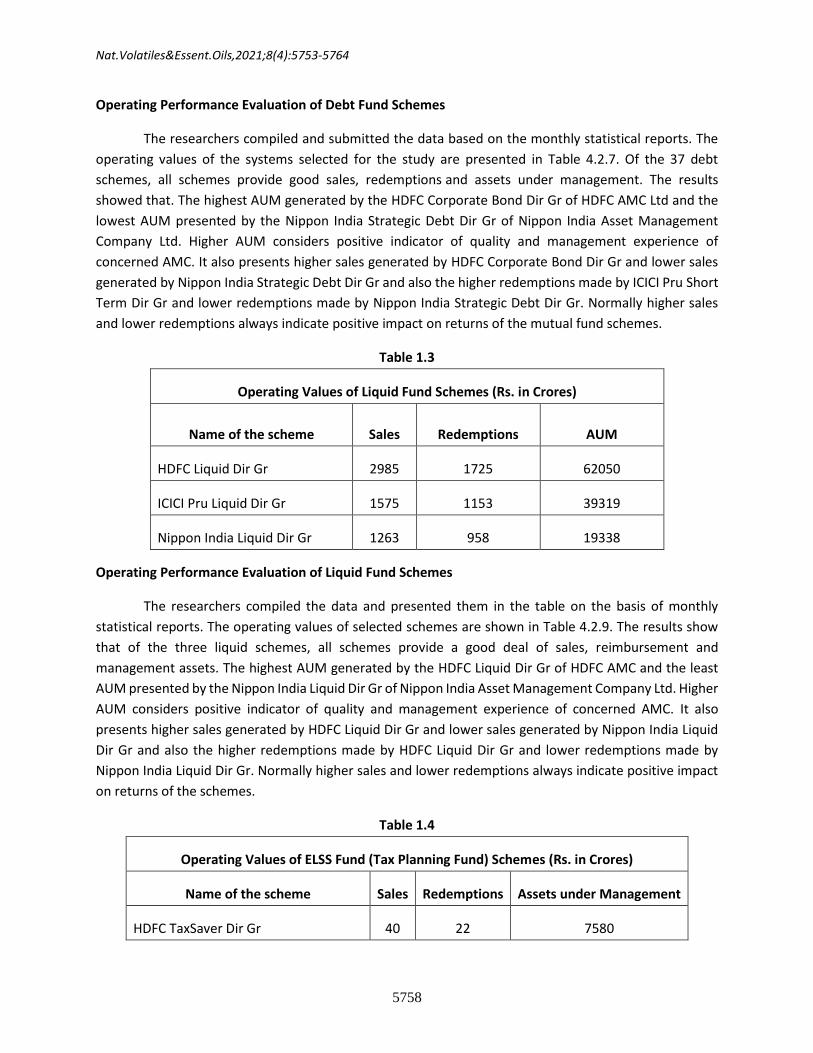
Operating Performance Evaluation of Debt Fund Schemes
The researchers compiled and submitted the data based on the monthly statistical reports. The
operating values of the systems selected for the study are presented in Table 4.2.7. Of the 37 debt
schemes, all schemes provide good sales, redemptions and assets under management. The results
showed that. The highest AUM generated by the HDFC Corporate Bond Dir Gr of HDFC AMC Ltd and the
lowest AUM presented by the Nippon India Strategic Debt Dir Gr of Nippon India Asset Management
Company Ltd. Higher AUM considers positive indicator of quality and management experience of
concerned AMC. It also presents higher sales generated by HDFC Corporate Bond Dir Gr and lower sales
generated by Nippon India Strategic Debt Dir Gr and also the higher redemptions made by ICICI Pru Short
Term Dir Gr and lower redemptions made by Nippon India Strategic Debt Dir Gr. Normally higher sales
and lower redemptions always indicate positive impact on returns of the mutual fund schemes.
Table 1.3
Operating Values of Liquid Fund Schemes (Rs. in Crores)
Name of the scheme Sales Redemptions AUM
HDFC Liquid Dir Gr 2985 1725 62050
ICICI Pru Liquid Dir Gr 1575 1153 39319
Nippon India Liquid Dir Gr 1263 958 19338
Operating Performance Evaluation of Liquid Fund Schemes
The researchers compiled the data and presented them in the table on the basis of monthly
statistical reports. The operating values of selected schemes are shown in Table 4.2.9. The results show
that of the three liquid schemes, all schemes provide a good deal of sales, reimbursement and
management assets. The highest AUM generated by the HDFC Liquid Dir Gr of HDFC AMC and the least
AUM presented by the Nippon India Liquid Dir Gr of Nippon India Asset Management Company Ltd. Higher
AUM considers positive indicator of quality and management experience of concerned AMC. It also
presents higher sales generated by HDFC Liquid Dir Gr and lower sales generated by Nippon India Liquid
Dir Gr and also the higher redemptions made by HDFC Liquid Dir Gr and lower redemptions made by
Nippon India Liquid Dir Gr. Normally higher sales and lower redemptions always indicate positive impact
on returns of the schemes.
Table 1.4
Operating Values of ELSS Fund (Tax Planning Fund) Schemes (Rs. in Crores)
Name of the scheme Sales Redemptions Assets under Management
HDFC TaxSaver Dir Gr 40 22 7580
Nat.Volatiles&Essent.Oils,2021;8(4):5753-5764
5759
HDFC L/T Advantage Dir Gr 41 19 7584
ICICI Pru Long Term Eq (Tax Sav) Dir Gr 42 18 7597
Nippon India Tax Saver Dir Gr 98 43 10245
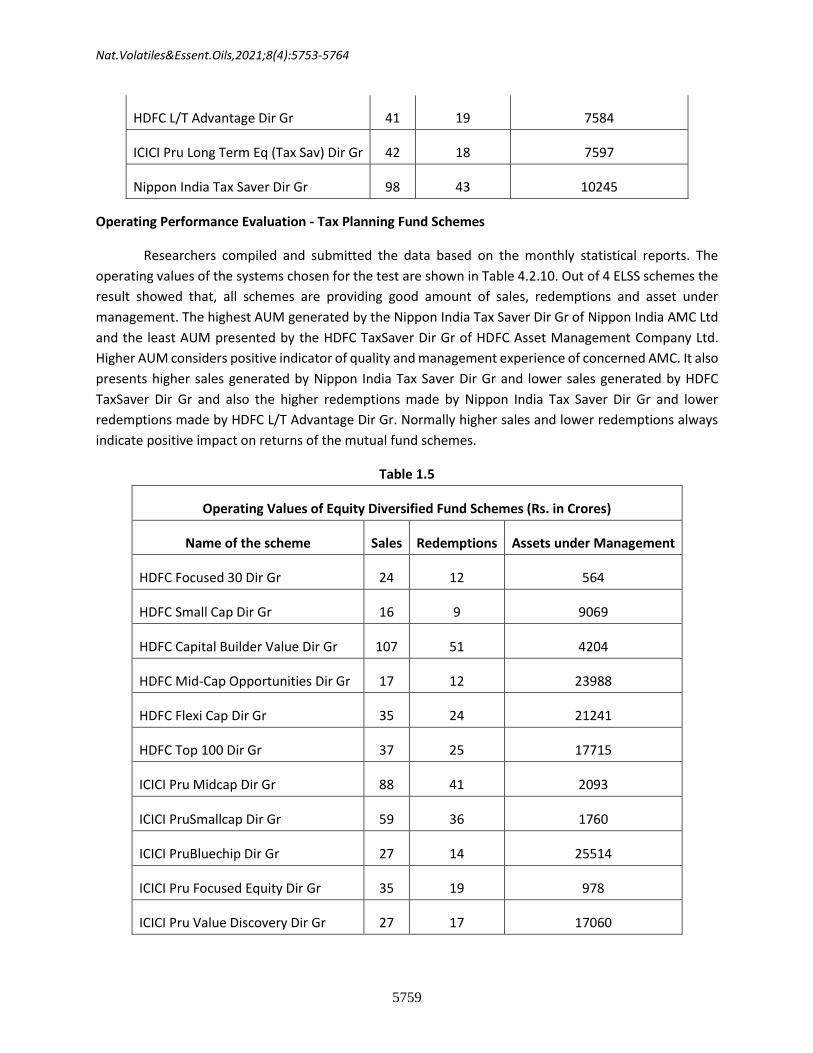
Operating Performance Evaluation - Tax Planning Fund Schemes
Researchers compiled and submitted the data based on the monthly statistical reports. The
operating values of the systems chosen for the test are shown in Table 4.2.10. Out of 4 ELSS schemes the
result showed that, all schemes are providing good amount of sales, redemptions and asset under
management. The highest AUM generated by the Nippon India Tax Saver Dir Gr of Nippon India AMC Ltd
and the least AUM presented by the HDFC TaxSaver Dir Gr of HDFC Asset Management Company Ltd.
Higher AUM considers positive indicator of quality and management experience of concerned AMC. It also
presents higher sales generated by Nippon India Tax Saver Dir Gr and lower sales generated by HDFC
TaxSaver Dir Gr and also the higher redemptions made by Nippon India Tax Saver Dir Gr and lower
redemptions made by HDFC L/T Advantage Dir Gr. Normally higher sales and lower redemptions always
indicate positive impact on returns of the mutual fund schemes.
Table 1.5
Operating Values of Equity Diversified Fund Schemes (Rs. in Crores)
Name of the scheme Sales Redemptions Assets under Management
HDFC Focused 30 Dir Gr 24 12 564
HDFC Small Cap Dir Gr 16 9 9069
HDFC Capital Builder Value Dir Gr 107 51 4204
HDFC Mid-Cap Opportunities Dir Gr 17 12 23988
HDFC Flexi Cap Dir Gr 35 24 21241
HDFC Top 100 Dir Gr 37 25 17715
ICICI Pru Midcap Dir Gr 88 41 2093
ICICI PruSmallcap Dir Gr 59 36 1760
ICICI PruBluechip Dir Gr 27 14 25514
ICICI Pru Focused Equity Dir Gr 35 19 978
ICICI Pru Value Discovery Dir Gr 27 17 17060
Nat.Volatiles&Essent.Oils,2021;8(4):5753-5764
5760
ICICI Pru Banking & Fin Svcs Dir Gr 57 28 3211
ICICI PruMulticap Dir Gr 105 59 5586
ICICI Pru Infrastructure Dir Gr 90 42 1122
ICICI Pru Dividend Yield Equity Dir Gr 83 41 198
Nippon India Value Dir Gr 37 16 3218
Nippon India Focused Equity Dir Gr 72 32 4389
Nippon India Quant Dir Gr 205 94 24
Nippon India Growth Dir Gr 141 76 8154
Nippon India Large Cap Dir Gr 96 37 9773
Nippon India Banking Dir Gr 59 29 2499
Nippon India Small Cap Dir Gr 46 21 10637
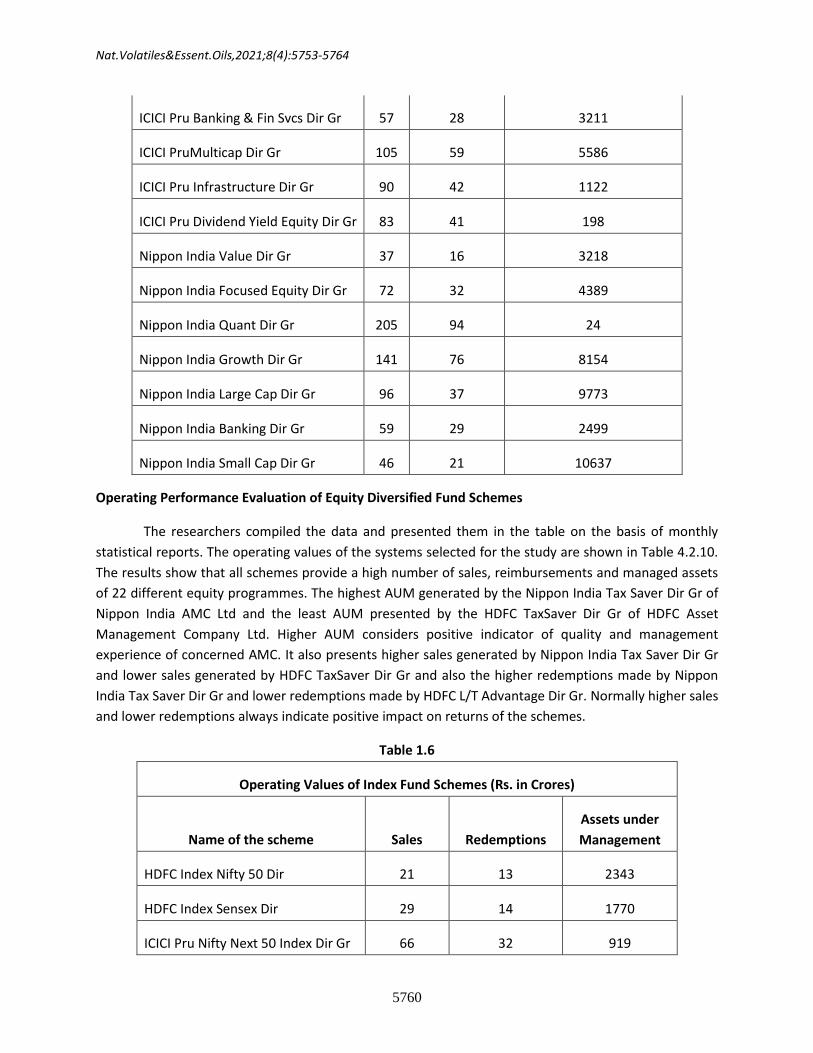
Operating Performance Evaluation of Equity Diversified Fund Schemes
The researchers compiled the data and presented them in the table on the basis of monthly
statistical reports. The operating values of the systems selected for the study are shown in Table 4.2.10.
The results show that all schemes provide a high number of sales, reimbursements and managed assets
of 22 different equity programmes. The highest AUM generated by the Nippon India Tax Saver Dir Gr of
Nippon India AMC Ltd and the least AUM presented by the HDFC TaxSaver Dir Gr of HDFC Asset
Management Company Ltd. Higher AUM considers positive indicator of quality and management
experience of concerned AMC. It also presents higher sales generated by Nippon India Tax Saver Dir Gr
and lower sales generated by HDFC TaxSaver Dir Gr and also the higher redemptions made by Nippon
India Tax Saver Dir Gr and lower redemptions made by HDFC L/T Advantage Dir Gr. Normally higher sales
and lower redemptions always indicate positive impact on returns of the schemes.
Table 1.6
Operating Values of Index Fund Schemes (Rs. in Crores)
Name of the scheme Sales Redemptions
Assets under
Management
HDFC Index Nifty 50 Dir 21 13 2343
HDFC Index Sensex Dir 29 14 1770
ICICI Pru Nifty Next 50 Index Dir Gr 66 32 919
Nat.Volatiles&Essent.Oils,2021;8(4):5753-5764
5761
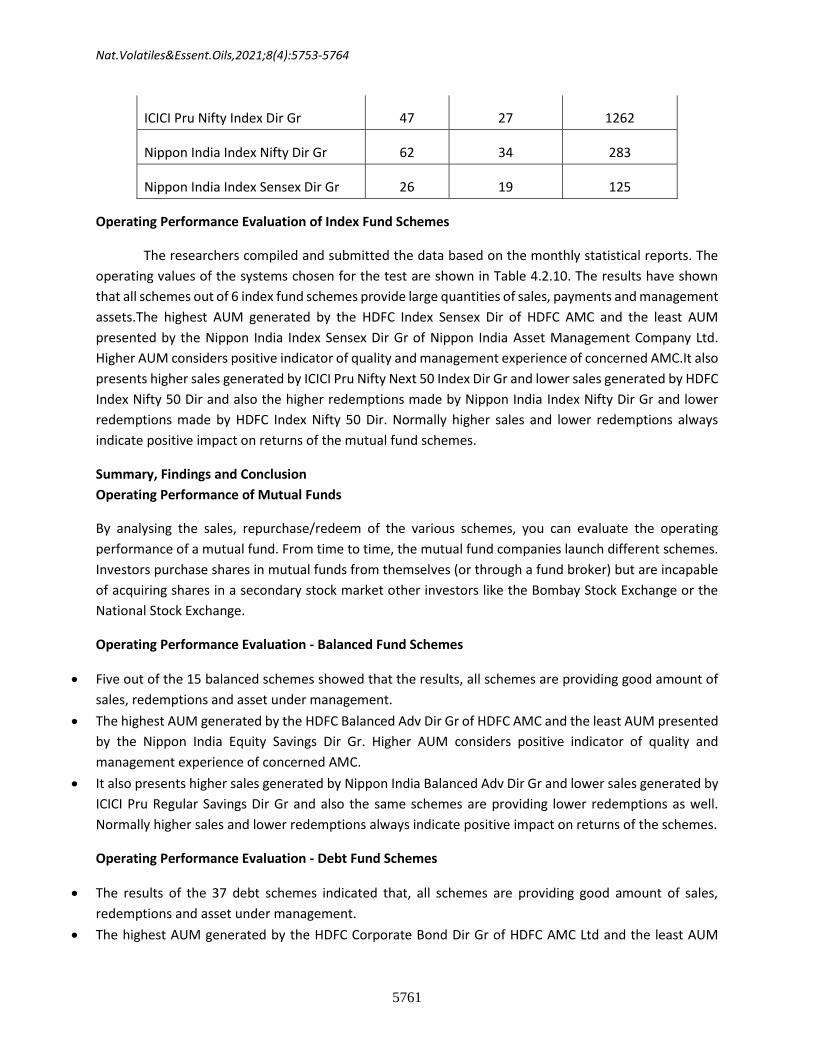
ICICI Pru Nifty Index Dir Gr 47 27 1262
Nippon India Index Nifty Dir Gr 62 34 283
Nippon India Index Sensex Dir Gr 26 19 125
Operating Performance Evaluation of Index Fund Schemes
The researchers compiled and submitted the data based on the monthly statistical reports. The
operating values of the systems chosen for the test are shown in Table 4.2.10. The results have shown
that all schemes out of 6 index fund schemes provide large quantities of sales, payments and management
assets.The highest AUM generated by the HDFC Index Sensex Dir of HDFC AMC and the least AUM
presented by the Nippon India Index Sensex Dir Gr of Nippon India Asset Management Company Ltd.
Higher AUM considers positive indicator of quality and management experience of concerned AMC.It also
presents higher sales generated by ICICI Pru Nifty Next 50 Index Dir Gr and lower sales generated by HDFC
Index Nifty 50 Dir and also the higher redemptions made by Nippon India Index Nifty Dir Gr and lower
redemptions made by HDFC Index Nifty 50 Dir. Normally higher sales and lower redemptions always
indicate positive impact on returns of the mutual fund schemes.
Summary, Findings and Conclusion
Operating Performance of Mutual Funds
By analysing the sales, repurchase/redeem of the various schemes, you can evaluate the operating
performance of a mutual fund. From time to time, the mutual fund companies launch different schemes.
Investors purchase shares in mutual funds from themselves (or through a fund broker) but are incapable
of acquiring shares in a secondary stock market other investors like the Bombay Stock Exchange or the
National Stock Exchange.
Operating Performance Evaluation - Balanced Fund Schemes
• Five out of the 15 balanced schemes showed that the results, all schemes are providing good amount of
sales, redemptions and asset under management.
• The highest AUM generated by the HDFC Balanced Adv Dir Gr of HDFC AMC and the least AUM presented
by the Nippon India Equity Savings Dir Gr. Higher AUM considers positive indicator of quality and
management experience of concerned AMC.
• It also presents higher sales generated by Nippon India Balanced Adv Dir Gr and lower sales generated by
ICICI Pru Regular Savings Dir Gr and also the same schemes are providing lower redemptions as well.
Normally higher sales and lower redemptions always indicate positive impact on returns of the schemes.
Operating Performance Evaluation - Debt Fund Schemes
• The results of the 37 debt schemes indicated that, all schemes are providing good amount of sales,
redemptions and asset under management.
• The highest AUM generated by the HDFC Corporate Bond Dir Gr of HDFC AMC Ltd and the least AUM
Nat.Volatiles&Essent.Oils,2021;8(4):5753-5764
5762
presented by the Nippon India Strategic Debt Dir Gr of Nippon India Asset Management Company Ltd.
Higher AUM considers positive indicator of quality and management experience of concerned AMC.
• It also presents higher sales generated by HDFC Corporate Bond Dir Gr and lower sales generated by
Nippon India Strategic Debt Dir Gr and also the higher redemptions made by ICICI Pru Short Term Dir Gr
and lower redemptions made by Nippon India Strategic Debt Dir Gr. Normally higher sales and lower
redemptions always indicate positive impact on returns of the schemes.
Operating Performance Evaluation of Liquid Fund Schemes
• The highest AUM generated by the HDFC Liquid Dir Gr of HDFC AMC Ltd and the least AUM presented by
the Nippon India Liquid Dir Gr of Nippon India Asset Management Company Ltd. Higher AUM considers
positive indicator of quality and management experience of concerned AMC.
• It also presents higher sales generated by HDFC Liquid Dir Gr and lower sales generated by Nippon India
Liquid Dir Gr and also the higher redemptions made by HDFC Liquid Dir Gr and lower redemptions made
by Nippon India Liquid Dir Gr. Normally higher sales and lower redemptions always indicate positive
impact on returns of the schemes.
Operating Performance Evaluation Tax Planning Fund Schemes
• The highest AUM generated by the Nippon India Tax Saver Dir Gr of Nippon India AMC Ltd and the least
AUM generated by the HDFC TaxSaver Dir Gr of HDFC Asset Management Company Ltd. Higher AUM
considers positive indicator of quality and management experience of concerned AMC.
• It also presents higher sales generated by Nippon India Tax Saver Dir Gr and lower sales generated by
HDFC TaxSaver Dir Gr and also the higher redemptions made by Nippon India Tax Saver Dir Gr and lower
redemptions made by HDFC L/T Advantage Dir Gr. Normally higher sales and lower redemptions always
indicate positive impact on returns of the different schemes of the mutual fund.
Operating Performance Evaluation of Equity Diversified Fund Schemes
• The highest AUM generated by the Nippon India Tax Saver Dir Gr of Nippon India AMC Ltd and the least
AUM generated by the HDFC TaxSaver Dir Gr of HDFC Asset Management Company Ltd. Higher AUM
considers positive indicator of quality and management experience of concerned AMC.
• It also presents higher sales generated by Nippon India Tax Saver Dir Gr and lower sales generated by
HDFC TaxSaver Dir Gr and also the higher redemptions made by Nippon India Tax Saver Dir Gr and lower
redemptions made by HDFC L/T Advantage Dir Gr. Normally higher sales and lower redemptions always
indicate positive impact on returns of the schemes.
Operating Performance Evaluation - Index Fund Schemes
• The highest AUM generated by the Nippon India Tax Saver Dir Gr of Nippon India AMC Ltd and the lowest
AUM provided by the HDFC TaxSaver Dir Gr of HDFC AMC Ltd. Higher AUM considers positive indicator of
quality and management experience of concerned AMC.
• It also presents higher sales generated by Nippon India Tax Saver Dir Gr and lower sales generated by
HDFC TaxSaver Dir Gr and also the higher redemptions made by Nippon India Tax Saver Dir Gr and lower
Nat.Volatiles&Essent.Oils,2021;8(4):5753-5764
5763
redemptions made by HDFC L/T Advantage Dir Gr. Normally higher sales and lower redemptions always
indicate positive impact on returns of the mutual fund schemes.
References
Agrawal D., “Measuring Performance of Indian Mutual Funds” Finance India, Available at
SSRN:http://ssrn.com/abstract=1311761 (2011)
Debasish, SathyaSwaroop “Investigating Performance of Equity-based Mutual Fund Schemes in Indian
Scenario” KCA Journal of Business Management, (2009), 2(2), 1-15.
Garg, Sanjay “A Study on Performance Evaluation of Selected Indian Mutual Funds” International Journal
of Innovation Creativity and Management (IJICM), (2011), 1(1), 1-10.
Gupta Amitabh, “Mutual Funds in India: A Study of Investment Management”, Finance India, Vol. XV (2),
(2001), pp. 631-637.
Irwin, Brown, FE, et al., “A Study of Mutual Funds: Investment Policy and Investment Company
Performance” reprinted in Hsiu-kwangwer and Alan Jzakon (Ed.) Elements of Investments, New
York: Holt, Renchart and Winston, (1965), pp.371-385.
Jensen Michael C, “The Performance Of Mutual Funds In The Period 1945-1964”, Journal of Finance, Vol.
23, (1967), pp.389- 416.
Muthappan P K &Damodharan E. “Risk –Adjusted Performance Evaluation of Indian Mutual funds
schemes” Finance India, vol. xx(3), (2006), Pp 965-983.
Prabakaran, G and Jayabal, G “Performance Evaluation of Mutual Fund Schemes in India: An Empirical
Study” Finance India, 24 (4), (2010), PP1347-1363.
Prof. Banerjee Ashok et. al “Performance of Indian Equity Mutual Funds vis-à-vis their style benchmarks:
An empirical exploration”, available at
https://papers.ssrn.com/sol3/papers.cfm?abstract_id=962827, (2007), PP.1-18
Rasheed Haroon, Qadeer Abdul “Performance Evaluation of Survivorship-Biased Open-Ended Mutual
Funds in Pakistan”, International Research Journal of Finance and Economics ISSN 1450-2887
Issue 82 (2012) pp.6-14.
Sharpe, William F “Mutual Fund Performance”, The Journal of Business, Vol. 39(1), (1966), pp.119-138.
Sondhi H J and Jain P.K, “ Financial Management of private public equity mutual funds in India : An
Analysis of profitability” The ICFAI Journal of Applied Finance, 2005 pp.14-27
Treynor, J. “How to Rate Management of Investment Funds”, Harvard Business Review, Volume 43(1),
(1965), pp. 63-75.
Treynor and Mazuy, “Can Mutual Funds Outguess The Markets” Harvard Business Review, Vol. 44(4),
(1966), pp.131-136.
Tandon, Shailesh, and Akanssha Nigam. "Empirical Investigation on Mutual Funds and Their Influence
Due to Interational Economic Event." International Journal of Business Management & Research
(IJBMR) ISSN (P) (2016): 2249-6920.
Krishnamoorthi, M., and T. K. Murugesan. "Analysis of risk and return of selected mutual funds schemes
in India." International journal of mechanical and production engineering research and (2018).
Maruti, Sheshrao, and Waghamare Shivaji. "Sector Mutual Funds-A Study on Performance Measurement
and Evaluation with Special Reference to Technology Funds." International Journal of Economics
Commerce and Research (IJECR) (2013).
Nat.Volatiles&Essent.Oils,2021;8(4):5753-5764
5764
Kothari, PRITAM P., and SHIVGANGA C. Mindargi. "A study of investors’ attitude towards mutual fund
with special reference to investors in Solapur City." Management Research (IJAFMR) 3.2 (2013):
1-12.
Sharma, Dhanraj. "Measurement of Risk and Return Performance of Mutual Funds in India: an
Investment Analysis Approach. “International Journal of Business and General Management
(IJBGM) 5.2, Feb- Mar 2016, 1-20
Web References
• www.allresearchjournal.com
• www.amfiindia.com
• www.dmims.edu.in
• www.icai.org
• www.indiainfoline.com
• www.ircjournals.org
• www.mobikwik.com
• www.moneycontrol.com
• www.mutualfundsindia.com
• www.rbi.com
• www.reirc.com
• www.scribid.com
• www.sebi.com
• www.uti.com
• www.valueresearchonline.com
Related Documents