J .J :.] ) Performance Evaluation & Forecasting for The Future Performance Of Transcom Electronics Limited =:J

Welcome message from author
This document is posted to help you gain knowledge. Please leave a comment to let me know what you think about it! Share it to your friends and learn new things together.
Transcript
J .J :.] )
Performance Evaluation & Forecasting for The Future Performance
Of Transcom Electronics Limited
=:J
...
r
r
Internship Report
On
Performance Evaluation & Forecasting for The Future Performance Of
Transcom Electronics Limited
Submitted to: Ms. Farzana Choudhury
Assistant Director
Carrier Placement program
Institute of Business Administration
BRAC University
Submitted by: Sazedullslam
ID# 01204028
MOB Department
BBA Program
Date of submission
31 st Auagust, 2006
BRAe University
r
r
r
Letter of Transmittal
August 31",2005
Ms. Farzana Choudhury
Assistant Director
Carrier Placement program
Institute of Business Administration
BRAC University
Subject: Submission of Internship Report
I am very happy to submit my Internship Report assigned to me at the completion of my
BBA curriculum.
While working on the report, I have tried to follow each and every guideline that you
had advised. It has been a very enlightening experience to work on this project and I
have thoroughly enjoyed my internship period at Transcom Electronics Limited. The
authority of Transcom Electronics Limited has also extended their cooperation as and
when required.
I hope you will accept my report and kindly oblige.
S~
Sazedul Islam
ID # 01204028
Bachelor in Business Administration (BBA)
Contact: 0189-464611, 7115733
..,
Acknowledgement
This internship report would not be completed without the help and cooperatiorf
of the following people. First of all I would like to thank honorable faculty
member and my internship advisor Ms. Farzana Choudhury , Assistant Director,
Carrier Placement program for giving me the permission to work on this topic.
My special appreciation and sincere gratitude goes to her for the clear guidelines
given, which was very help for me to understand and prepare the structure of
the paper.
Next, I would like to thank Transcom Electronics Limited authority for their cooperation
in doing this project. I would specially like to thank my internship co-coordinator for the
organization Mohammad Nazmul Kabir, Manager of Accounts & Finance Department
for his necessary support and cooperation. I gratefully acknowledge the valuable time
that Mr. Nazmul Kabir has spared for me.
Finally, I would like to thank all my colleagues of TEL Finance & Accounts department
who gave me necessary help, support and information to complete this report
successfully .
BRAC l;NI\'UI$rTY
¥
r
TABLE OF CONTENTS
Executive Summery of the Report [ PART- A. THE ORGANIZATION
1.0. Introducing the Company 1.1 The Company 1.2 Transcom Today 1.3 Transcom Electronics Limited
1 . 3 . 1 Transtec 1 . 3.2 Changhong
1.4 Bangladesh Electrical Industries Ltd, 1.5 Bangladesh Lamps Limited 1.6 Transcom Distribution Co. Ltd 1.7 Transcom Beverages Limited
1 . 7 . 1 Beverage distribution Limited 1.8 Incandescent Gis Group 1.9 High Intensity Discharges & Halogen Lamps
1 . 9 . 1 HID Lamps (Blended , Ballasted & Blended Mercury MI . ) 1 . 9 . 2 High Pressure sodium Lamps (Son & So n - T) 1.9 . 3 Metal Halide Lamps (HPI - T & HPI - BU) 1 . 9 . 4 Low Voltage Halogen Reflector Lamps
1.10 Compact Fluorescent Lamps & Energy Savers 1 . 10 . 1 Ecotone Crystal 1 . 10.2 Ecotone Decor 1 . 10 . 3 Ecotone Ambiance
1.11 Fluorescent Tube Lights, Starter, Ballasts & Luminous 1 . 11 . 1 Tublar Fluorescent Lamps (Tube lights) 1 . 11 . 2 Starter 1 . 11. 3 Ballast (Conventional & Electronic) 1 . 11 . 4 Luminaries
1.12 Transfin Trading Ltd~ 1.13 Trinco Limited 1.14 Tea Holdings Ltd . 1.15 Mediastar Ltd . 1.16 Mediaworld Ltd. 1.17 Eskayef (SK+F) Bangladesh Limited 1.18 Pizza Hut
2.0 Organization Structure of Transcom 2.1 Operation Network Organogram
3.0 Vision for the future
BRAe l'NIVERSllY
~
Page No.
1
1 1 1 2 2 2 2 2 3 3 3 3 3 4 4 4 4 4 4 4 4 4 5 5 5 5 5 5 5 6 6 6
7
7
9
BRAe UNIVERSITY
¥
I PART-B. ABOUT THE lOB Page No
4.0 Job description 10 4.1. Description / nature of the job/s 10 4.2. Specific responsibi lities of the job 10 4 .3 . Different aspects of job perfo rmance 11
I PART-C. PROJECT ... 5.0 Executive Summery of the Project 12
6.0 Introduction to the Project 13 '"' 6.1 Background of the Study 13
6.2 Scope of th e Study 13
7.0 Description of the project 14
7.1 Problem s ta tement 14
7.2 Broad Objec tive 14
7.3 Spec ific Task 14
7.4 Method ology 15 7.5 Limitation 15
8.0 Financial Analysis 16
8.1 Separati ng Ca uses and Symptoms of Problems 17
8.2 Kinds of Ra ti os 18
8.3 Liquidity ratio 19 8 . 3 . 1 Current Rati o 19 8 . 3 . 2 Quic k Ratio or Acid Test 21 8 . 3 . 3 Receivab l es Ratios 23 8 . 3 . 4 I n ventor y Turnover 27 8 . 3 . 5 Summary of liquidi ty ratio 30
8.4 Pro fit ability Ratios 31 8 . 4 . 1 Profit Margi n 33 8 . 4. 2 Gross Profit Margin 36 8 . 4 . 3 Fi x ed assets turnover 38 8 . 4 . 4 Total Asset Tu r n o ver 39 8 . 4 . 5 Retu r n on Investment 41
8 . 4 . 6 Return on Equity 44
8.4 . 7 Return on Assets 46
8 . 4 . 8 Summar y of Profitability Ratio 48
8.5 Tes ts of so lvency and equity pos ition 49
8 . 5 . 1 Debt management ratio : 49
8 . 5 . 2 Times i n terest Earned 51
8 . 5 . 3 Summary Tests of solvency and equity position 53
r.
....
Page No
9.0 Forecast Their Future Performance 54
9.1 Forecasted current ratio 54 9.2 Forecasted Quick Ratio 55 9.3 Forecasted Average Collection period 56 9.4 Forecasted Inventory turnover 57
r. 9.5 Forecasted Profit Margin 58 9.6 Forecasted Total assets Turnover 59 9.7 Forecasted Return on Investment 60 9.8 Forecasted Return on Equity 61 9.9 Forecasted Debt Management Ratio 62
10.0 Conclusion & Recommendations 63
Appendix
URAC l'WIVERSrtY
~
LIST OF FIGURES
Page No. Fig-I Current Ratio 20 Fig-2 Quick Ratio or Acid Test 22 Fig-3 Receivables Turnover 25 Fig-4 Average Collection Period 26 Fig-5 Inventory Turnover 29 Fig-6 Profit Margin 35 Fig-7 Gross Profit Margin 37 Fig-8 Fixed assets turnover 38 Fig-9 Total Asset Turnover 40 Fig-IO Return on Investment 43 Fig-ll Return on Equity 45 Fig-12 Return on Assets 47 Fig-13 Debt management ratio: 50 Fig-14 Times interest Earned 52 Fig-15 Forecasted current ratio 54 Fig-16 Forecasted Quick Ratio 55 Fig-17 Forecasted Average Collection period 56 Fig-18 Forecasted Inventory turnover 57 Fig-19 Forecasted Profit Margin 58 Fig-20 Forecasted Total assets Turnover 59 Fig-21 Forecasted Return on Investment 60 Fig-22 Forecasted Return on Equity 61 Fig-23 Forecasted Debt Management Ratio 62
LIST OF CHART
Page No
Chart-l Organogram of Transcom Electronics Limited 7
Chart-2 Structure of Finance and Accounting department 8
Chart-3 Summary of liquidity ratio 30
Chart-4 Factors affecting profit and interrelation of profitability ratio 32
Chart-5 Dupont chart 42
Chart-6 Summary of Profitability Ratio 48
Chart-7 Summary Tests of solvency and equity position 53
.-
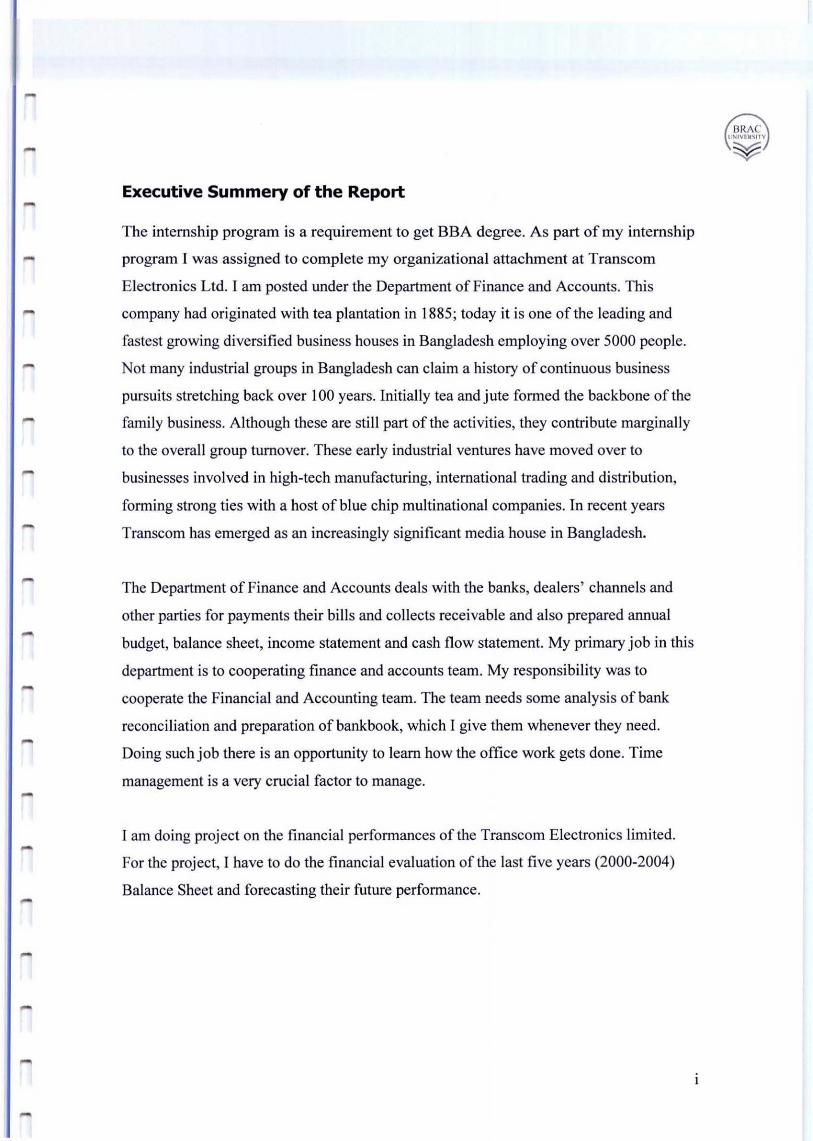
Executive Summery of the Report
The internship program is a requirement to get BBA degree. As part of my internship
program [ was assigned to complete my organizational attachment at Transcom
Electronics Ltd. [ am posted under the Department of Finance and Accounts. This
company had originated with tea plantation in 1885; today it is one of the leading and
fastest growing diversified business houses in Bangladesh employing over 5000 people.
Not many industrial groups in Bangladesh can claim a history of continuous business
pursuits stretching back over 100 years. Initially tea and jute formed the backbone of the
family business. Although these are still part ofthe activities, they contribute marginally
to the overall group turnover. These early industrial ventures have moved over to
businesses involved in high-tech manufacturing, international trading and distribution,
forming strong ties with a host of blue chip multinational companies. In recent years
Transcom has emerged as an increasingly significant media house in Bangladesh.
The Department of Finance and Accounts deals with the banks, dealers' channels and
other parties for payments their bills and collects receivable and also prepared annual
budget, balance sheet, income statement and cash flow statement. My primary job in this
department is to cooperating finance and accounts team. My responsibility was to
cooperate the Financial and Accounting team. The team needs some analysis of bank
reconciliation and preparation of bankbook, which [ give them whenever they need.
Doing such job there is an opportunity to learn how the office work gets done. Time
management is a very crucial factor to manage.
[ am doing project on the financial performances of the Transcom Electronics limited.
For the project, I have to do the financial evaluation of the last five years (2000-2004)
Balance Sheet and forecasting their future performance.
BRAe I IMVrll~l1V
~
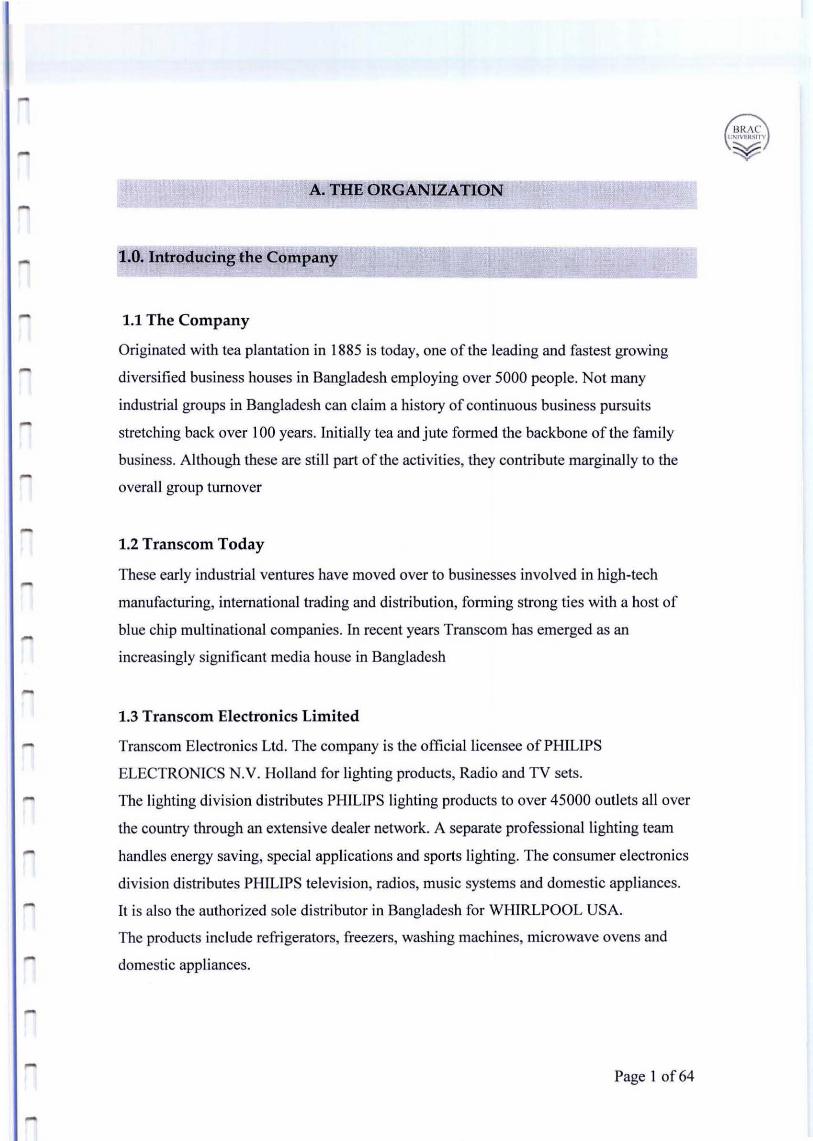
A. THE ORGANIZATION
1.0. Introducing the Company
1.1 The Company
Originated with tea plantation in 1885 is today, one of the leading and fastest growing
diversified business houses in Bangladesh employing over 5000 people. Not many
industrial groups in Bangladesh can claim a history of continuous business pursuits
stretching back over 100 years. Initially tea and jute formed the backbone of the family
business. Although these are still part of the activities, they contribute marginally to the
overall group turnover
1.2 Transcom Today
These early industrial ventures have moved over to businesses involved in high-tech
manufacturing, international trading and distribution, forming strong ties with a host of
blue chip multinational companies. In recent years Transcom has emerged as an
increasingly significant media house in Bangladesh
1.3 Transcom Electronics Limited
Transcom Electronics Ltd. The company is the official licensee of PHILIPS
ELECTRONICS N.V. Holland for lighting products, Radio and TV sets.
The lighting division distributes PHILIPS lighting products to over 45000 outlets all over
the country through an extensive dealer network. A separate professional lighting team
handles energy saving, special applications and sports lighting. The consumer electronics
division distributes PHlLIPS television, radios, music systems and domestic appliances.
It is also the authorized sole distributor in Bangladesh for WHIRLPOOL USA.
The products include refrigerators, freezers, washing machines, microwave ovens and
domestic appliances.
Page I of64
BRAe U""VEltSl n'
~
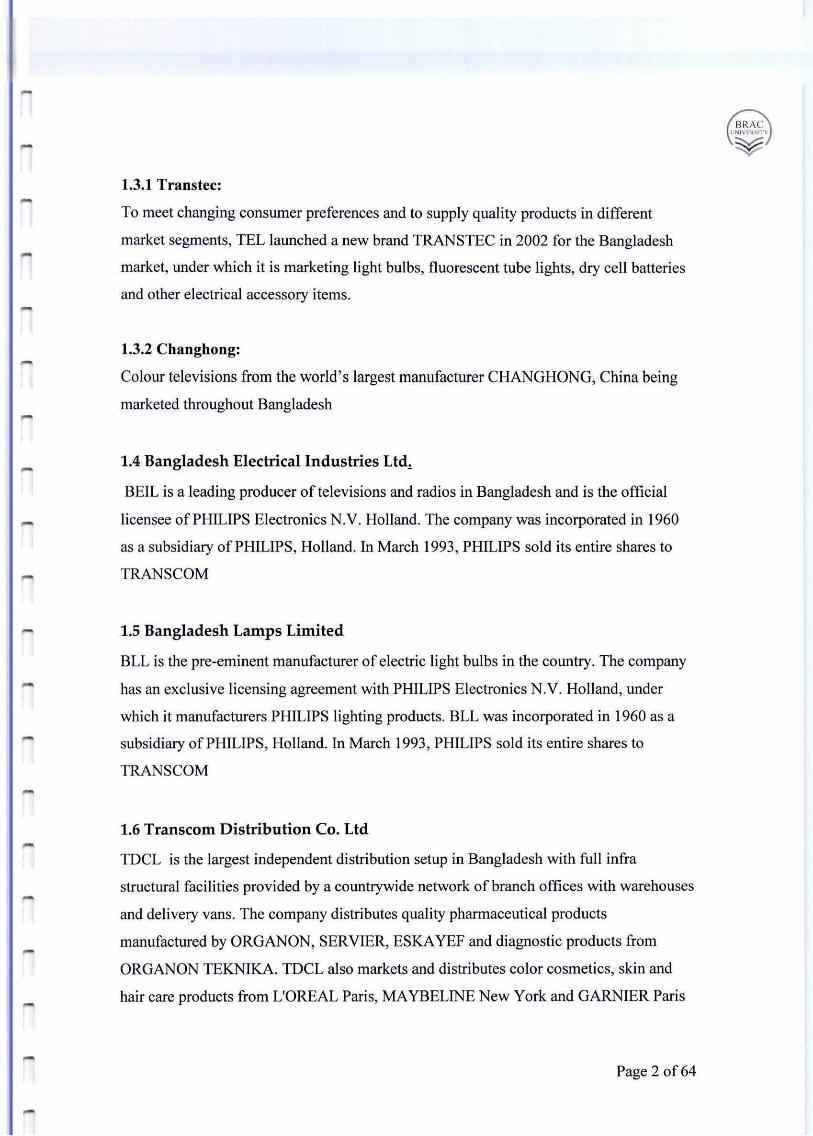
1.3.1 Transtec:
To meet changing consumer preferences and to supply quality products in different
market segments, TEL launched a new brand TRANSTEC in 2002 for the Bangladesh
market, under which it is marketing light bulbs, fluorescent tube lights, dry cell batteries
and other electrical accessory items.
1.3.2 Changhong:
Colour televisions from the world's largest manufacturer CHANGHONG, China being
marketed throughout Bangladesh
1.4 Bangladesh Electrical Industries Ltd,
BElL is a leading producer of televisions and radios in Bangladesh and is the official
licensee of PHILIPS Electronics N.V. Holland. The company was incorporated in 1960
as a subsidiary of PHILIPS, Holland. In March 1993, PHILIPS sold its entire shares to
TRANSCOM
1.5 Bangladesh Lamps Limited
BLL is the pre-eminent manufacturer of electric light bulbs in the country. The company
has an exclusive licensing agreement with PHILIPS Electronics N.V. Holland, under
which it manufacturers PHILIPS lighting products. BLL was incorporated in 1960 as a
subsidiary of PHILIPS, Holland. In March 1993, PHILIPS sold its entire shares to
TRANSCOM
1.6 Transcom Distribution Co. Ltd
TDCL is the largest independent distribution setup in Bangladesh with full infra
structural facilities provided by a countrywide network of branch offices with warehouses
and delivery vans. The company distributes quality pharmaceutical products
manufactured by ORGANON, SERVIER, ESKA YEF and diagnostic products from
ORGANON TEKNIKA. TDCL also markets and distributes color cosmetics, skin and
hair care products from L'OREAL Paris, MA YBELINE New York and GARNIER Paris
Page 2 of64
BRAe I! NIVf.~ ~ITI
¥
r
Fritolay, the world's number one potato chips, is now being exclusively marketed and
distributed all over Bangladesh by TDCL
1.7 Transcom Beverages Limited
On the basis of an exclusive Franchise for Bangladesh from Pepsico USA, TBL acquired
three modem bottling plants at Dhaka, Chittagong and Bogra from BBIL, Dhaka; EBIL,
Chittagong and NBIL, Bogra; in March 2000. TBL manufactures the famous Pepsi range
of beverages-Pepsi , 7up, Mirinda Orange, Mirinda Lemon, Slice and Soda. As a
corporate citizen Pepsico believes it has a responsibility to contribute to the quality of life
in our communities. TBL has put into action this philosophy through support of social
agencies, projects and programs and the scope of this support is extensive and it has not
been difficult to blend with this philosophy since the TRANSCOM group also followed
such a corporate ideology
1. 7.1 Beverage distribution Limited
BDL is the distribution arm through which all Pepsi products are distributed all over
Bangladesh
1.8 Incandescent GIs Group
Instantaneous light, low installation cost and warm color tone for a wide variety of
interior & exterior applications
1.9 High Intensity Discharges & Halogen Lamps
1.9.1 HID Lamps (Blended, Ballasted & Blended Mercury MI.):
A range of high intensity discharge lamps delivering very high lumen with increased
efficacy to encounter the needs of lighting up high ceilings in industrial indoors and
outdoor lighting applications
Page 3 of64
BRAe ( NIVF.R~(l"I·
¥
1.9.2 High Pressure sodium Lamps(Son & Son-T):
Lamps for precise optical control , ideal for Highways, Stadiums, Airports, Warehouses,
etc.
1.9.3 Metal Halide Lamps (HPI-T & HPI-BU) :
They offer unique combination of natural white color appearance and high luminous
efficacy as well as a very long life.
1.9.4 Low Voltage Halogen Reflector Lamps
Halogen dichotic reflector lamps used for accent lighting and general lighting with life
time of2400 hrs operating at 12 volt. UV suppressed and watt range of20w, 35w and
50w. Avai lable at different beam angles from 12 to 36
1.10 Compact Fluorescent Lamps & Energy Savers
1.10.1 Ecotone Crystal:
These light weight (compact fluorescent) lamps are available in II w, 15w, 18w & 20w
as a replacement fro 60, 75 & 100w.
1.10.2 Ecotone Decor:
The ignite instantly and consume 80% less energy than regular GLS lamps.
1.10.3 Ecotone Ambiance:
Lamp life is around 10,000 hrs; which is 10 times longer than normal GLS (5 yrs at 3-5
hours a day). They also give off much less heat.
1.11 Fluorescent Tube Lights, Starter, Ballasts & Luminous
1.11.1 Tublar Fluorescent Lamps (Tube lights)
High luminous efficacy, good colour rendition and long service life.
Page 4 of64
BRAe I :NIVf.II"IT\'
¥
1.11.2 Starter:
Philips excellent quality Glow-switch starter type SIO provides reliable starting. Voltage
range 220-240 Wattage range 2-65 Wattage.
1.11.3 Ballast (Conventional & Electronic) :
Philips ballast for energy saving and enhancing life ofTI fluorescent lamps
1.11.4 Luminaries:
Fitting accessories for Tl fluorescent lamps
1.12 Transfin Trading Ltd,
Transfin is the sole distributor of SANYO Japan, marketing refrigerators, freezers,
microwave ovens, washing machines, air-conditioners, Televisions etc.
1.13 Trinco Limited
Trinco is the sole distributor of DAEWOO ELECTRONICS Korea. It markets
DAEWOO televisions, washing machines, microwave ovens, audio and video
equipments
1.14 Tea Holdings Ltd.
THL is an exporter of Tea, Jute goods and Petroleum products. It is also involved in
warehousing, import and sales of agricultural commodities. It has been awarded the
Presidents Export Trophy for outstanding export performance. The company markets and
di stributes phone and IT network components from KRONE Germany. The company
represents VITOL Switzerland and Singapore for petroleum products Manufacturing
1.15 Mediastar Ltd.
PROTHOM ALO, the largest circulated daily newspaper has established itself as an
independent and respected voice in the field of media in Bangladesh
Page 5 of64
r.
r
1.16 Mediaworld Ltd.
THE DAILY STAR is the leading and most quoted English newspaper in Bangladesh.
The company also publishes the Bengali SHAPTAHIK 2000 a quality political and
current affairs weekly and ANONDODHARA, the premier film and entertainment
fortnightly.
1.17 Eskaye£ (SK+F) Bangladesh Limited
The company, which was incorporated in 1980 as a subsidiary of SMITH KLINE &
FRENCH USA, was acquired by Transcom in 1990. Eskay Eskayef ef manufacturing
high quality pharmaceuticals product and particularly strong in antibiotics.
1.18 Pizza Hut
They are the main distributor of Pizza hut.
Page 6 of64
BRAe I fNIVP'ICMf\'
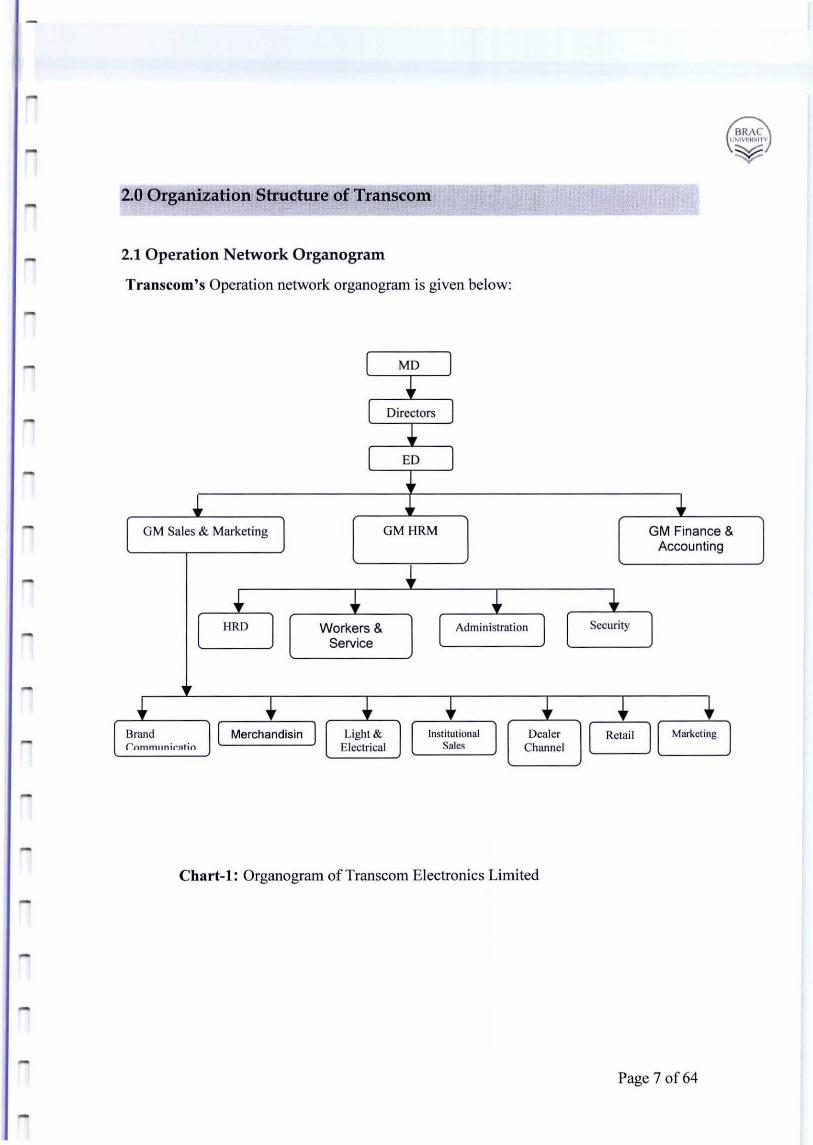
¥ 2.0 Organization Structure of Transcom
2.1 Operation Network Organogram
Transcom's Operation network organogram is given below:
I MD I t
I Directors I +
I ED j
+ , + [ OM Sales & Marketing
J OMHRM GM Finance &
Accounting
+ + + + + .... l HRD
J Workers & l Administrat ion J [
Security ] Service
+ + + .. + 1 .. [ Brand ]' Merchandisin I Light & Institutional I Dealer 6l Marketing I
rnm m llni f':Al in Electri cal Salc~ Channel
Chart-I : Organogram of Trans com Electronics Limited
Page 7 of64
MD J
+ l Directors J
+ l ED J
+ GM Finance &
Accounting
+ + [ Hire Purchase ) Accounts & Finance MIS
.. .. + I Asst. sales manager J Accounts Manager ) Manager
J .. + I National sales manager
+ Senior programmer
I Officer ) + Officer
J
r
+ + + + + + Assistant Assistant Ass istant Assistance Ass istant Assistant manager Manager manager Manager manager manager Import General In ventory, Sales Treasury (MIS) Tax & trade
Accounts & Benefits insurance .-
J + t t t Officer I I Officer I I Officer I I Officer I I Officer I
......
+ t t I
Officer
I Officer ) I Officer I Bank v .. Showroom
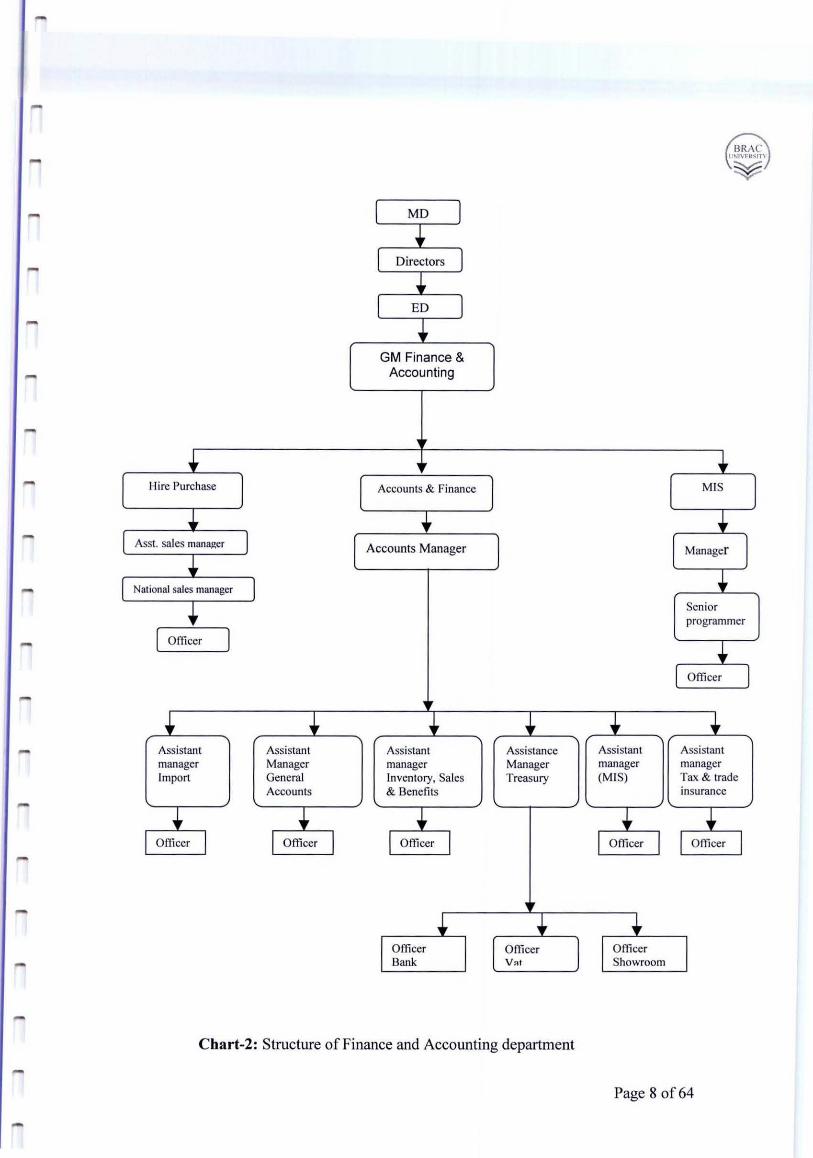
Chart-2 : Structure of Finance and Accounting department
Page 8 of64
3.0 Vision for the future
The Vision of the company is "To be the leader in the Electronics industry in the
region and provide a complete solution and the brand image to the precious
customers." There is an emphasis on creating a strong brand image in the customers'
mind. Such customers will require strong support for brand loyalty to develop.
Page 90f64
BRAe IINIV~)I"lT
¥
B. ABOUT THE JOB
4.0 Job description
As a part of successful completion of BBA program, every student has to do the
internship either after completion of all courses or before the completion. The objective
of internship is to learn the real world work place and practice the type/style/nature of
actual job performance. The intern student are placed in any business organization and
posted to the position in which they are interested. I Sazedul Islam am placed in
Transcom Electronics Limited as an intern to gather the knowledge of the real work place
to prepare myself to face the real challenges of the job market.
4.1. Description / nature of the job/s
Nature of job: Intern
Company: Transcom Electronics Limited.
Department: Finance and Accounting Department
Duration of the contract: June2006 - August, 2006
4.2. Specific responsibilities of the job
[ an1 doing project on the financial perfoffilances of the Transcom Electronics limited.
For the project, [ have to do the financial evaluation of the last five years (2000-2004)
Balance Sheet and forecasting their future perfoffilance. My responsibility was to
cooperate the Financial and Accounting team. The team needs some analysis of bank
reconciliation and preparation of bankbook, which [ give them whenever they need.
Doing such job there is an opportunity to learn how the office work gets done. Time
management is a very crucial factor to manage. Every work has to be finish on time.
Page 10 of64
BIV\C \.'1IVp~~nT
~
4.3. Different aspects of job performance
There are different factors which are the basis of the job performance evaluation. As an
internee my supervisor had his own factors of evaluation. The key factors are
• Understanding the Journals, Legers, Cash flows, bank reconciliation and different
types of payments.
• Preparation of bankbooks.
• Punctuality
• Team work
• Willingness to learn and cooperate
• Amiability
Page \l of64
BRAe U,f!VEI(~ln'
¥
C.PRO}ECT
5.0 Executive Summery of the Project
This report has done as a requirement for the Internship program. The basic purpose of
this report was to find out the financial performance of Transcom Electronics Limited,
which is the one of the leading companies in the electronics in Bangladesh. To fulfill this
purpose I tried to accomplish some Objectives like Identify whether the invested capital
gives desired return, Operating efficiency, Company's position within the industry,
Companies financial performance in the recent years and Forecasting for the next few
years, till 2009. I used both primary and secondary sources of information to collect data.
For collecting primary data I took interviews and for secondary data, Transcom
Electronics Limited, annual reports and other publications were reviewed.
After the analysis, I found that up to 2004 their performance was not satisfactory and they
did not meet the standard. The major causes of this deprived performance were to
increase in liabilities especially current liabi lity and high administrative cost. Their
current liability was 10 times higher than their long-term liability and in 2004 it has been
increased by 21 % than previous year. Their total debt ratio was 86% in 2004 and has
possibilities to increase in the future. This debt carried a huge amount of financial cost,
which hampered their profit margin. The Firm has generated loss from 2000-2004 and
their total assets has been decreased by 15% from 2003 to 2004. From all these stated
information, I can say that if the management would not able to maintain their debt and
expenses, the firm will face immense difficulty to run their business in the future .
In this report I have discussed about their financial performances, discussion on external
factors that affect the performance of financial institutions, discussion on internal factors
that can be controlled by financial institution managers and give some recommendation
for future improvements.
Page 12 of64
BRAe lrNlVl'lt ~1TV
~
-
6.0 Introduction to the Project
The topic of my internship project is "Financial performance and forecasting for the
future of Transcom Electronics Limited."
6.1 Background of the Study
The internship program is a requirement to get BBA degree. As part of my internship
program I was assigned to complete my organizational attachment at Transcom
Electronics Ltd. I have started the internship there from JuneOl, 2006 and after 12
weeks of practical exposure, under the supervision of Mohammad Nazmul Kabir of
Transcom Electronics Ltd and faculty supervisor MS.Farzana Choudhry my
attachment will be complete. I am posted under the Department of Finance and
Accounts.
The Department of Finance and Accounts deals with the banks, dealers' channels and
other parties for payments their bills and collects receivable and also prepared annual
budget, balance sheet, income statement and cash flow statement. My primary job in this
department is to cooperating finance and accounts team
6.2 Scope ofthe Study
The term paper will be intended to provide the financial performance of the
Transcom Electronics Limited and identify some drawbacks and make
recommendation on it.
Page 13 of 64
-7.0 Description of the project
7.1 Problem statement
To evaluate the Financial perfonnance and forecasting for the future of Trans com
Electronics Limited.
7.2 Broad Objective
The broad objective basically is the narrower view of the problem statement. It is more
specifically mentioned the pathway towards the problem statement. We can divide the
statement into several points so that the task can be complete separately but jointly and
with specific analysis and result for the perfection of the project paper.
• To find how the Transcom Electronics Limited performing financially.
• Forecast based on their ratios.
7.3 Specific Task
For the accomplishment of the broader objective, some sequential task is needed to be
done. To find out the how the company is performing till today, [ need to find some ratios
and figures which will give the picture of whether they are meeting their target or not.
For the sales forecasting, I choose trend analysis to evaluate their performance in the
future.
The specific tasks are detenn ined as follows
• To know whether the invested capital gives desired return.
• To know the operating efficiency.
• To know the company's position amongst the industry.
• To know the performance in the recent year.
Page 140f64
BRAe 1,"'I\I~N~ln
¥
7.4 Methodology
Data Source:
Both secondary and primary data will be required to conduct this research.
• Primary source: Primary data will be collected from interviewing the executives
to find out how the company is financially performing and their personal view
about the future performance of the company or whether they will be able to cover
up the lacking they are facing now.
• Secondary source: As secondary data source, Website of Transcom Electronics
Limited, Balance sheet of 2002 - 2004 and other related Documents would be used
have a comprehensive picture of the financial outlook of the company.
7.5 Limitation
• Data confidentiality: Accesses to all the information of my desire are not
readily available and sometimes they are too sensitive to be gathered, because
their information is not published to public.
• Unstructured data: It was very difficult to analyze the unstructured
information.
Page 15 of64
BRAe ! NtvEII\! 1"\
¥
-
....
8.0 Financial Analysis
Financial analysis is the process of determining the significant operating and financial
characteristics of a firm from accounting data and financial statements. The goal of such
analysis is to determine the efficiency and performance of the firm 's management, as
reflected in the financial records and reports. The analyst is attempting to measure the
firm 's liquidity, profitability, and other indications that business in conducted in a
rational and orderly way. If a firm does not achieve financial norms for its industry or
relationships among data that seem reasonable, the analysts note the deviations. The
burden of explaining the apparent problems may then be placed upon management.
In this chapter, I will develop ratio analysis as the primary tools for examining the firm' s
financial position and performance. I will recognize two viewpoints in receiving and
evaluating financial data:
I . External Analysis: This is performed by outsiders to the firm, such as creditors,
stockholders, or investment analysts. It makes use of existing financial statements
and involves limited access to confidential information on a firm.
2. Internal analysis: This is performed by the corporate finance and accounting
departments and is more detailed than external analysis. These departments have
available more detailed and current information than is available to outsiders.
They arc able to prepare pro forma, or future, statements and are able to produce a
more accurate and timely analysis of the firm's strengths and weaknesses
The two type of benchmark for making financial comparisons as follows:
I. Time series analysis: In this type of analysis, information for a single company is
compared over time. For example; a company may have a current ratio of 1.2.
Without additional information, this ratio does not tell us very much. Time series
analysis might tell us that the ratio has declined each year for the past years, from
a high of2. This Time series information cause us to do future study concerning
the factors that caused a steady deterioration if this ratio in the recent past.
Page 16 of64
BRAe \ .NIVEII'ln
~
2. Comparison with similar companies: Financial results often are affected by
industry and economy wide factors. By comparing with other one in the same line
business, the analyst can get better insight concerning specific company
performance.
For my report, [ choose time series analysis for analyzing the company's financial
performance because the industrial data is not available in the market.
8.1 Separating Causes and Symptoms of Problems
Financial analysis is used primarily to gain insights into operating and financial problems
confronting the firm. With respect to these problems, I must be careful to di stinguish
between the cause of the problem and a symptom of it. A cause is an event that produces
a result or effect; in our case the result is a problem. A symptom is a visible indicator that
a problem exists. The firm may observe symptoms, such as a low level of profits, but it
must deal with causes of problems, such as high costs. If it does not deal with the
problem cause, the firm will probably riot be able to correct the problem.
As we will see in this chapter, financial ratios are used to locate symptoms of problems.
Once the symptoms have been located, the financial analyst must determine the cause of
any problem. Then he must find a solution for it.
Financial Ratios
A ratio may be defined as a fixed relationship in degree or number between two numbers.
In finance, ratios are used to point out relationships that are not obvious from the raw
data. Some uses of ratios are the following:
I. To Compare Different Companies in the same industry: Ratios can highlight
the factors associated with successful and unsuccessful ftrms. They can reveal
strong firms and weak firms, overvalued and undervalued firms.
Page 17 of64
....
2. To Compare Different industries: Every industry has its own unique set of
operating and financial characteristics. These can be identified with the aid of
ratios.
3. To Compare Performance in Different Time Periods: Over a period of years, a
firm or an industry develops certain norms that may indicate future success or
failure . [frelationships change in a firm's data over different time periods, the
ratios may provide clues on trends and future problems.
From all the financial accounts on the balance sheet, income statement, and Cash flow
funds statement, it is possible to formulate countless ratios. To be successful in financial
analysis, the analyst must select only those ratios that provide significant information
about a firm's situation.
8.2 Kinds of Ratios
Financial ratios may be classified a number of ways. One classification scheme uses three
major categories:
I. Liquidity Ratios: These examine the adequacy of funds, the solvency of the firm,
and the firm's ability to pay its obligations when due.
2. Profitability Ratios: These measure the efficiency of the firm ' s activities and its
ability to generate profits.
3. Tests of solvency and equity position: It measure the ability of the firm's to meets
its long-term obligation.
4. Ownership Ratios: These are generally linked directly or indirectly to profits and
liquidity. They assist the stockholder in evaluating the firm's activities and policies
that affect the market price of the common stock.
In my report, I will discuss only the first three kinds of ratio. Ownership ratio will not
been discussed, because the firm's is a private limited company and has no common
share in the market.
Page 18 of64
...
8.3 Liquidity ratio
A firm 's ability to pay its debts can be measured partly through the use ofliquidity ratios.
Short-term liquidity involves the relationship between current assets and current
liabilities. If a firm has sufficient net working capital (the excess of current as sets over
current liabilities), it is deemed to have sufficient liquidity. Two ratios are commonly
used to measure liquidity directly: the current ratio and the quick ratio, or acid test.
Analyzing Liquiditys
The cash, receivable, and inventory ratio should be used together to gain an overall grasp
of the liquidity of the firm. I shall analyze each area and draw conclusion regarding the
liquidity of Trans com electronics Limited, using the balance sheet and income state
provided.
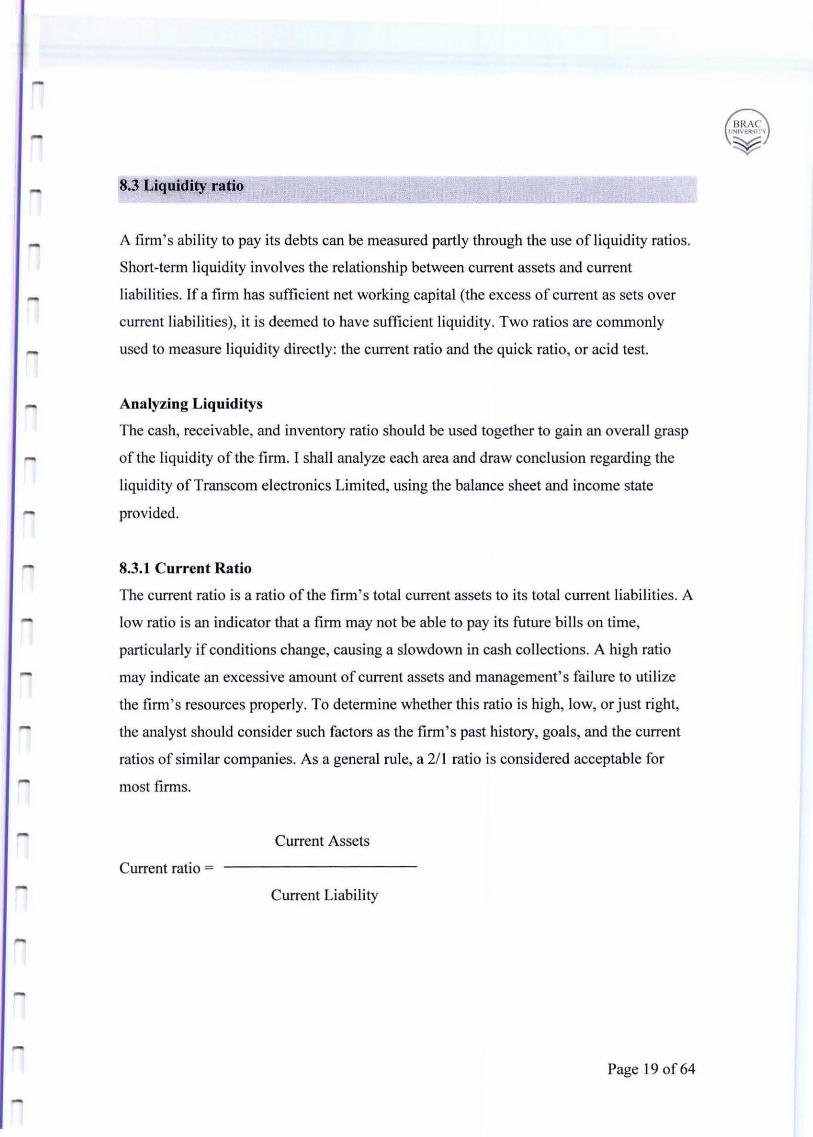
8.3.1 Current Ratio
The current ratio is a ratio of the firm ' s total current assets to its total current liabilities. A
low ratio is an indicator that a firm may not be able to pay its future bills on time,
particularly if conditions change, causing a slowdown in cash collections. A high ratio
may indicate an excessive amount of current assets and management's failure to utilize
the firm ' s resources properly. To determine whether this ratio is high, low, or just right,
the analyst should consider such factors as the firm's past history, goals, and the current
ratios of similar companies. As a general rule, a 2/ \ ratio is considered acceptable for
most firms.
Current Assets
Current ratio =
Current Liability
Page 19 of64
-
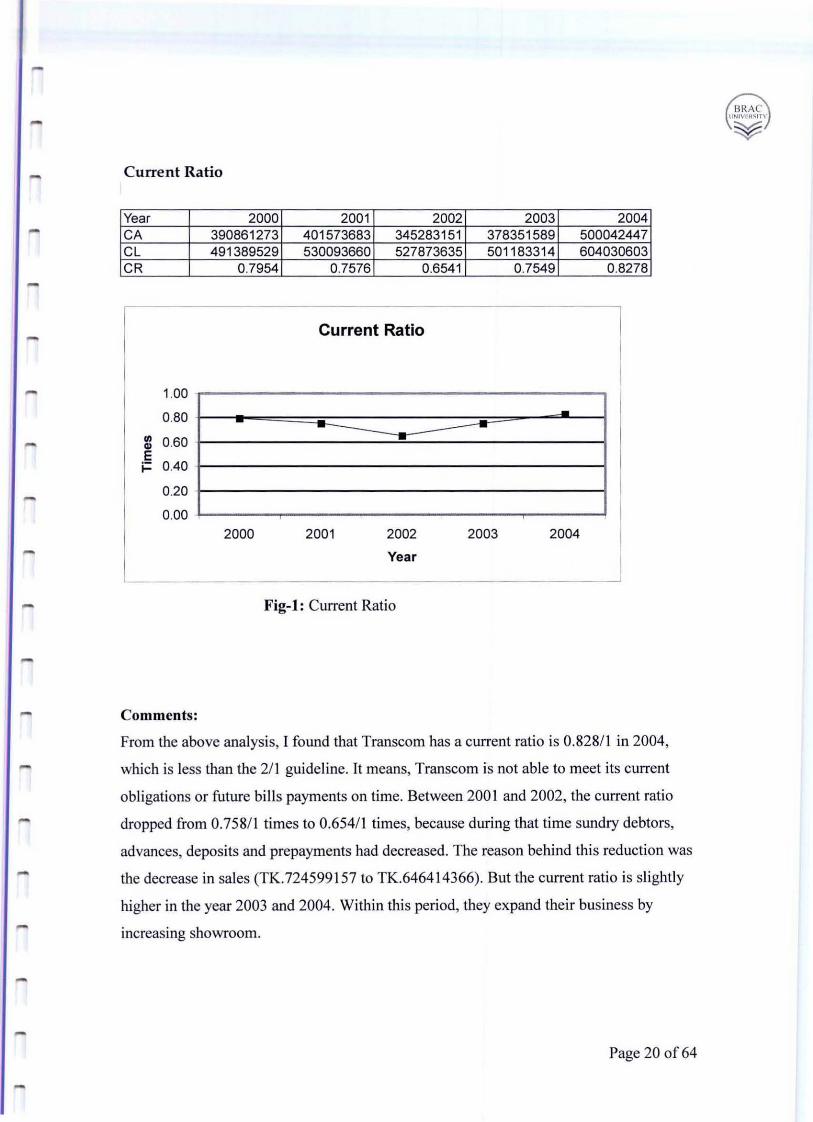
Current Ratio
Year 2000 2001 2002 2003 2004 CA 390861273 401573683 345283151 378351589 500042447 CL 491389529 530093660 527873635 501183314 604030603 CR 0.7954 0.7576 0.6541 0.7549 0.8278
Current Ratio
1.00
0.80 --.. 0.60 .. E i= 040
0.20
0.00 2000 2001 2002 2003 2004
Year
Fig-I: Current Ratio
Comments:
From the above analysis, I found that Transcom has a current ratio is 0.828/1 in 2004,
which is less than the 2/1 guideline. It means, Transcom is not able to meet its current
obligations or future bills payments on time. Between 200 I and 2002, the current ratio
dropped from 0.758/1 times to 0.65411 times, because during that time sundry debtors,
advances, deposits and prepayments had decreased. The reason behind thi s reduction was
the decrease in sales (TK.724599 I 57 to TK.6464 I 4366). But the current ratio is slightly
higher in the year 2003 and 2004. Within this period, they expand their business by
increasing showroom.
Page 20 of64
BRAe 1[tOIVHl~11Y
¥
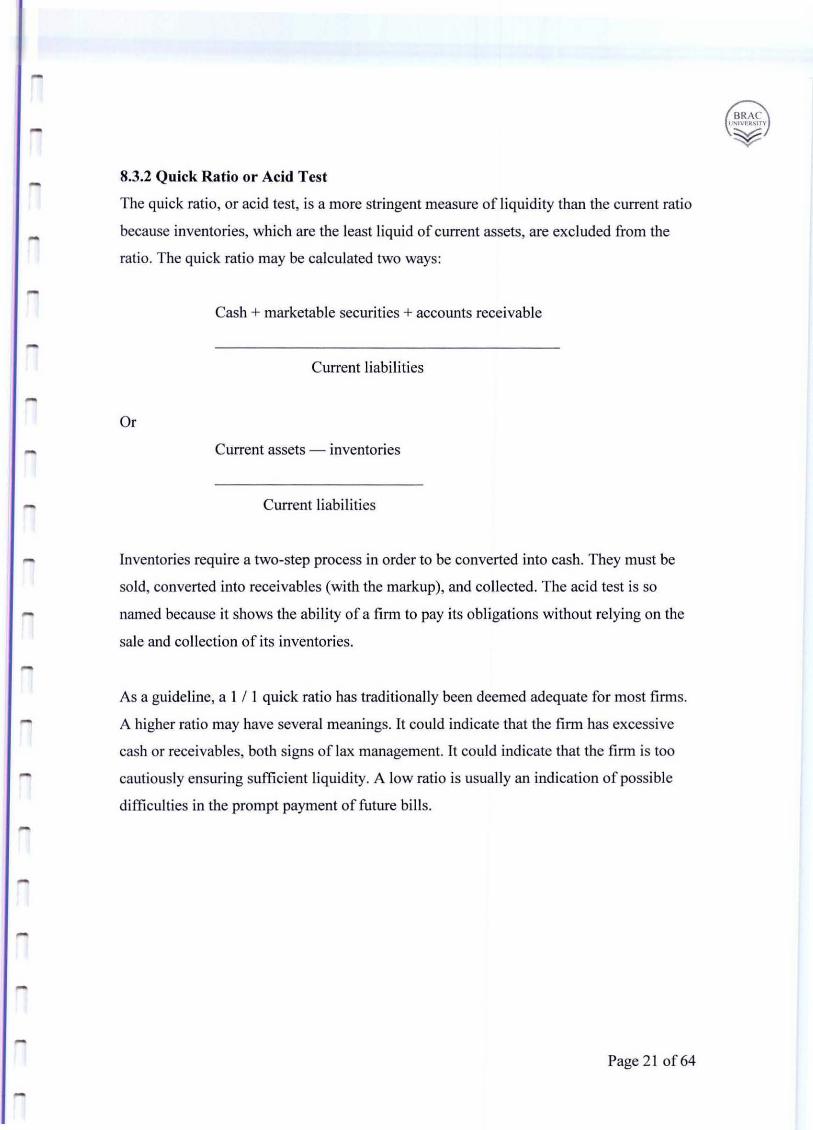
8.3.2 Quick Ratio or Acid Test
The quick ratio, or acid test, is a more stringent measure of liquidity than the current ratio
because inventories, which are the least liquid of current assets, are excluded from the
ratio. The quick ratio may be calculated two ways:
Cash + marketable securities + accounts receivable
Current liabilities
Or
Current assets - inventories
Current liabilities
Inventories require a two-step process in order to be converted into cash. They must be
sold, converted into receivables (with the markup), and collected. The acid test is so
named because it shows the ability of a firm to pay its obligations without relying on the
sale and collection of its inventories.
As a guideline, a I / I quick ratio has traditionally been deemed adequate for most firms.
A higher ratio may have several meanings. It could indicate that the firm has excessive
cash or receivables, both signs of lax management. It could indicate that the firm is too
cautiously ensuring sufficient liquidity. A low ratio is usually an indication of possible
difficulties in the prompt payment of future bills.
Page 2 1 of64
-
BRAe 1,I'IIVt~'tn
~
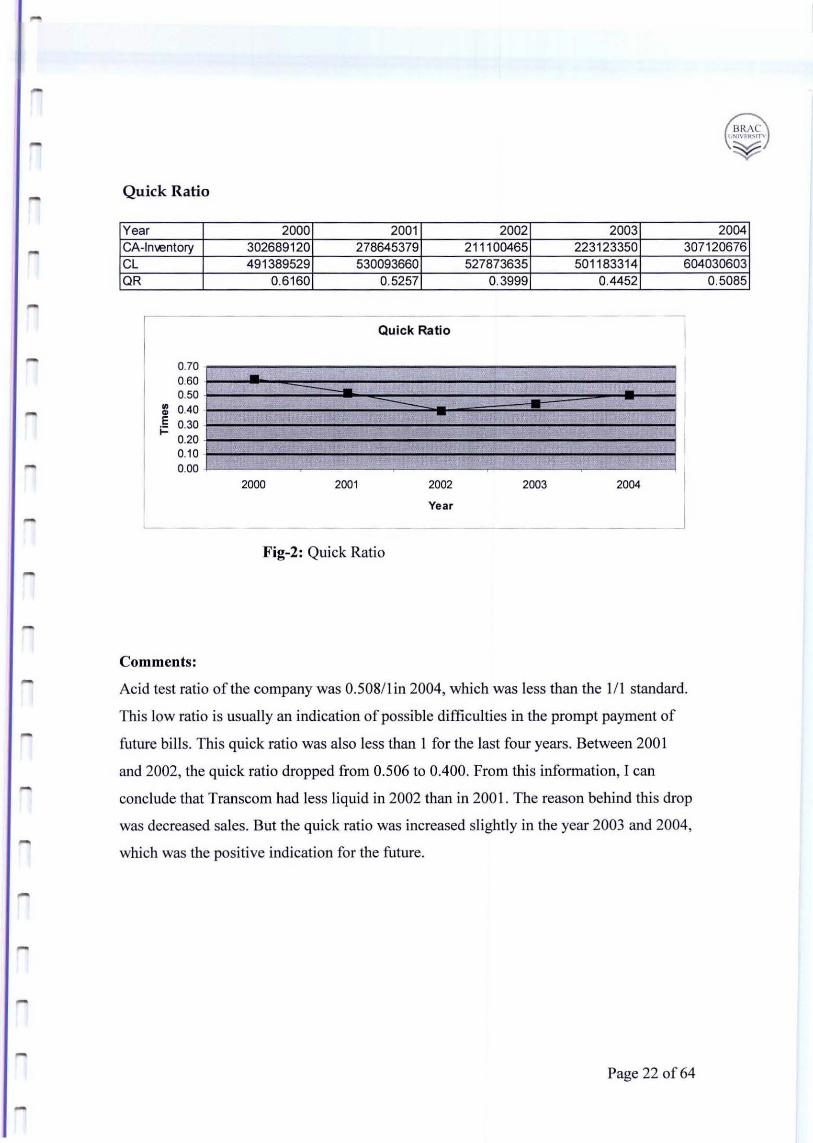
Quick Ratio
Year 2000 2001 2002 2003 2004 CA-Im.entory 302689120 278645379 211100465 223123350 307120676 CL 491389529 530093660 527873635 501183314 604030603 OR 0.6160 0.5257 0.3999 0.4452
Quick Ratio
0.70 0.60 · --0.50 .. 0.40 · -~
E 0.30 · ;= 0.20 0.10 0.00
2000 2001 2002 2003 2004
Year
Fig-2: Quick Ratio
Comments:
Acid test ratio of the company was 0.50811 in 2004, which was less than the III standard.
This low ratio is usually an indication of possible difficulties in the prompt payment of
future bills. This quick ratio was also less than I for the last four years. Between 200 I
and 2002, the quick ratio dropped from 0.506 to 0.400. From this information, I can
conclude that Transcom had less liquid in 2002 than in 2001. The reason behind this drop
was decreased sales. But the quick ratio was increased slightly in the year 2003 and 2004,
which was the positive indication for the future.
Page 22 of64
0.5085
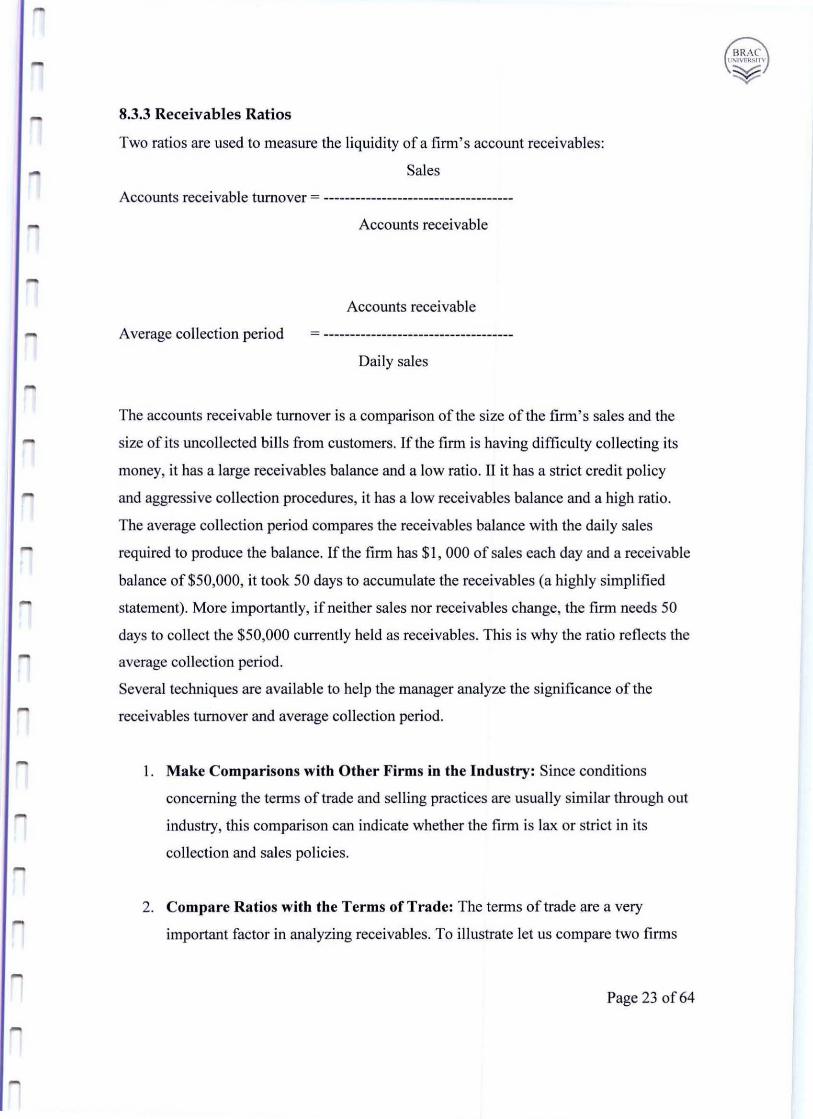
8.3.3 Receivables Ratios
Two ratios are used to measure the liquidity ofa firm ' s account receivables:
Sales
Accounts receivable turnover = -----------------------------------
Accounts receivable
Accounts receivable
Average collection period
Daily sales
The accounts receivable turnover is a comparison of the size ofthe finn's sales and the
size of its uncollected bills from customers. If the finn is having difficulty collecting its
money, it has a large receivables balance and a low ratio. II it has a strict credit policy
and aggressive collection procedures, it has a low receivables balance and a high ratio.
The average collection period compares the receivables balance with the daily sales
required to produce the balance. If the finn has $1, 000 of sales each day and a receivable
balance of$50,000, it took 50 days to accumulate the receivables (a highly simplified
statement). More importantly, if neither sales nor receivables change, the finn needs 50
days to collect the $50,000 currently held as receivables. This is why the ratio reflects the
average collection period.
Several techniques are available to help the manager analyze the significance ofthe
receivables turnover and average collection period.
1. Make Comparisons with Other Firms in the Industry: Since conditions
concerning the tenns of trade and selling practices are usually similar through out
industry, this comparison can indicate whether the finn is lax or strict in its
collection and sales policies.
2. Compare Ratios with the Terms of Trade: The terms of trade are a very
important factor in analyzing receivables. To illustrate let us compare two firms
Page 23 of64
BRAe ! N' VEII~ln'
¥
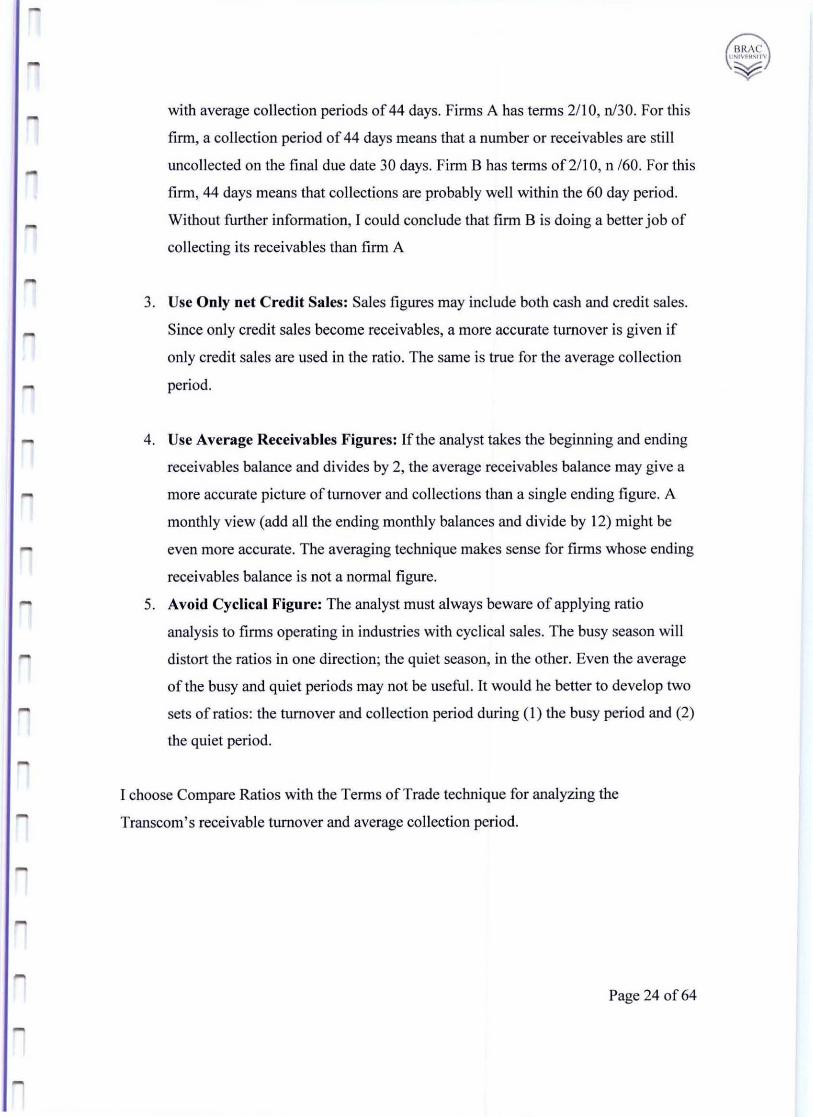
with average collection periods of 44 days. Firms A has terms 2/10, nl30. For this
firm, a collection period of 44 days means that a number or receivables are sti II
uncollected on the final due date 30 days. Firm B has terms of 211 0, n 160. For this
firm, 44 days means that collections are probably well within the 60 day period.
Without further information, I could conclude that firm B is doing a better job of
collecting its receivables than firm A
3. Use Only net Credit Sales: Sales figures may include both cash and credit sales.
Since only credit sales become receivables, a more accurate turnover is given if
only credit sales are used in the ratio. The same is true for the average collection
period.
4. Use Average Receivables Figures: If the analyst takes the beginning and ending
receivables balance and divides by 2, the average receivables balance may give a
more accurate picture of turnover and collections than a single ending figure. A
monthly view (add all the ending monthly balances and divide by 12) might be
even more accurate. The averaging technique makes sense for firms whose ending
receivables balance is not a normal figure.
5. Avoid Cyclical Figure: The analyst must always beware of applying ratio
analysis to firms operating in industries with cyclical sales. The busy season will
distort the ratios in one direction; the quiet season, in the other. Even the average
of the busy and quiet periods may not be useful. It would he better to develop two
sets of ratios: the turnover and collection period during (1) the busy period and (2)
the quiet period.
I choose Compare Ratios with the Terms of Trade technique for analyzing the
Transcom's receivable turnover and average collection period.
Page 24 of64
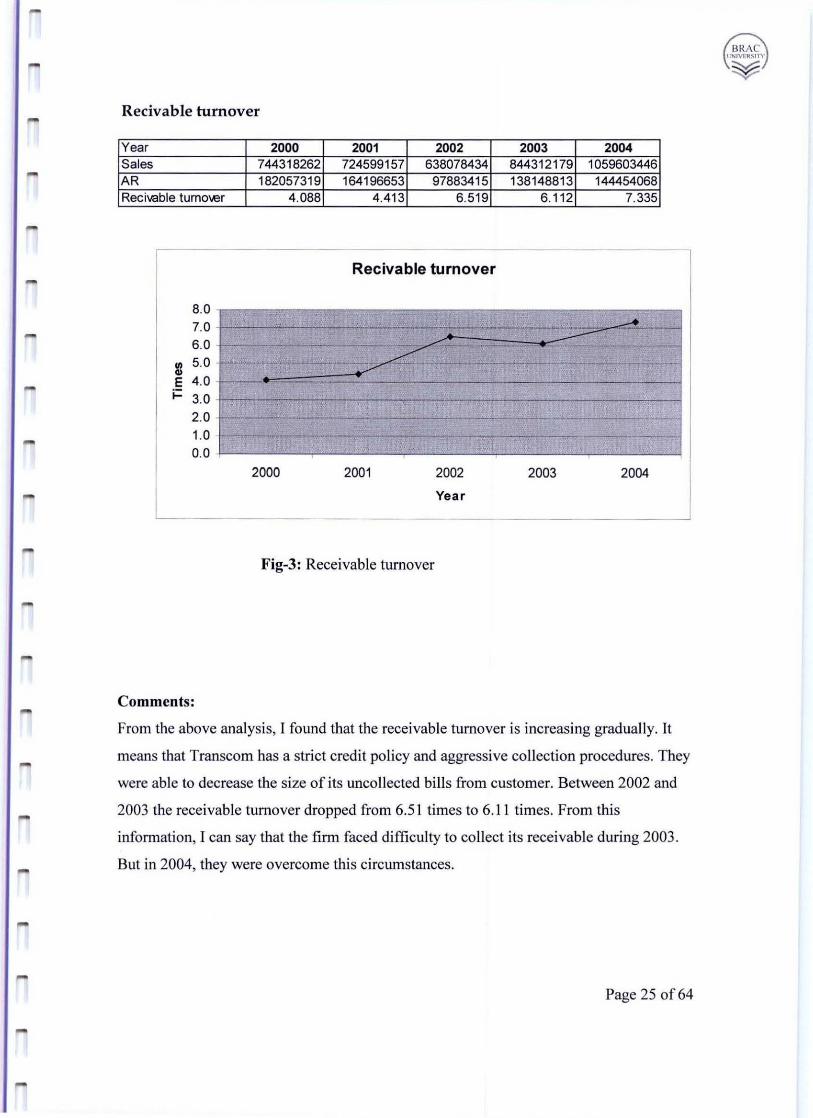
Recivable turnover
Year 2000 2001 2002 2003 2004 Sales 744318262 724599157 638078434 844312179 1059603446 AR 182057319 164196653 97883415 138148813 144454068 Recivable tumol.er 4.088 4.413 6.519 6.112 7.335
Recivable turnover
8.0 7.0 - • ..... .. ---6.0 i'---'- - - - - - -- -- - ~ .. 5.0 - ~ - - -- ~ ~ - - -..
E 4.0 j:: 3.0 -
2.0 - --.. . --. -- - -~- . 1.0 - -- -- -- --- -- - --0.0 -
2000 2001 2002 2003 2004
Year
Fig-3: Receivable turnover
Comments:
From the above analysis, I found that the receivable turnover is increasing gradually. It
means that Transcom has a strict credit policy and aggressive collection procedures. They
were able to decrease the size of its uncollected bills from customer. Between 2002 and
2003 the receivable turnover dropped from 6.5 1 times to 6.11 times. From this
information, I can say that the firm faced difficulty to collect its receivable during 2003 .
But in 2004, they were overcome this circumstances.
Page 25 of64
BRAe UNIVF.M.Slr."
¥
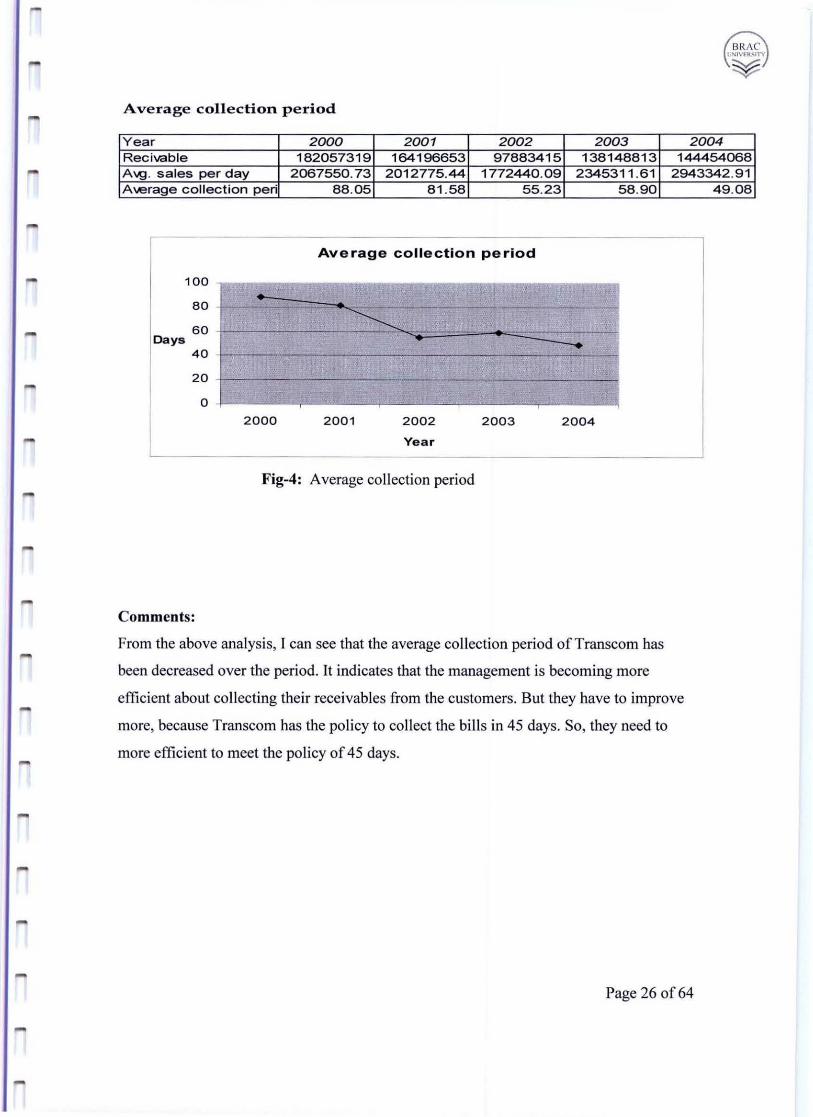
Average collection period
Year 2000 2001 2002 2003 2004 Recivable 182057319 164196653 97883415 138148813 144454068 A\9. sales per day 2067550.73 2012775.44 1772440.09 2345311 .61 2943342.91 Average collection peri
100
80
60 Days
40
20
o
-
-
... ;......-..
2000
-
88.05 81.58 55.23
Average collection period
.~ -- -- -- --~ ....
200 1 2002 2003 2004
Year
Fig-4: Average collection period
Comments:
58.90
-0
From the above analysis, I can see that the average co llection period of Trans com has
been decreased over the period. It indicates that the management is becoming more
efficient about collecting their receivables from the customers. But they have to improve
more, because Transcom has the policy to collect the bills in 45 days. So, they need to
more efficient to meet the policy of 45 days.
Page 26 of64
49.08
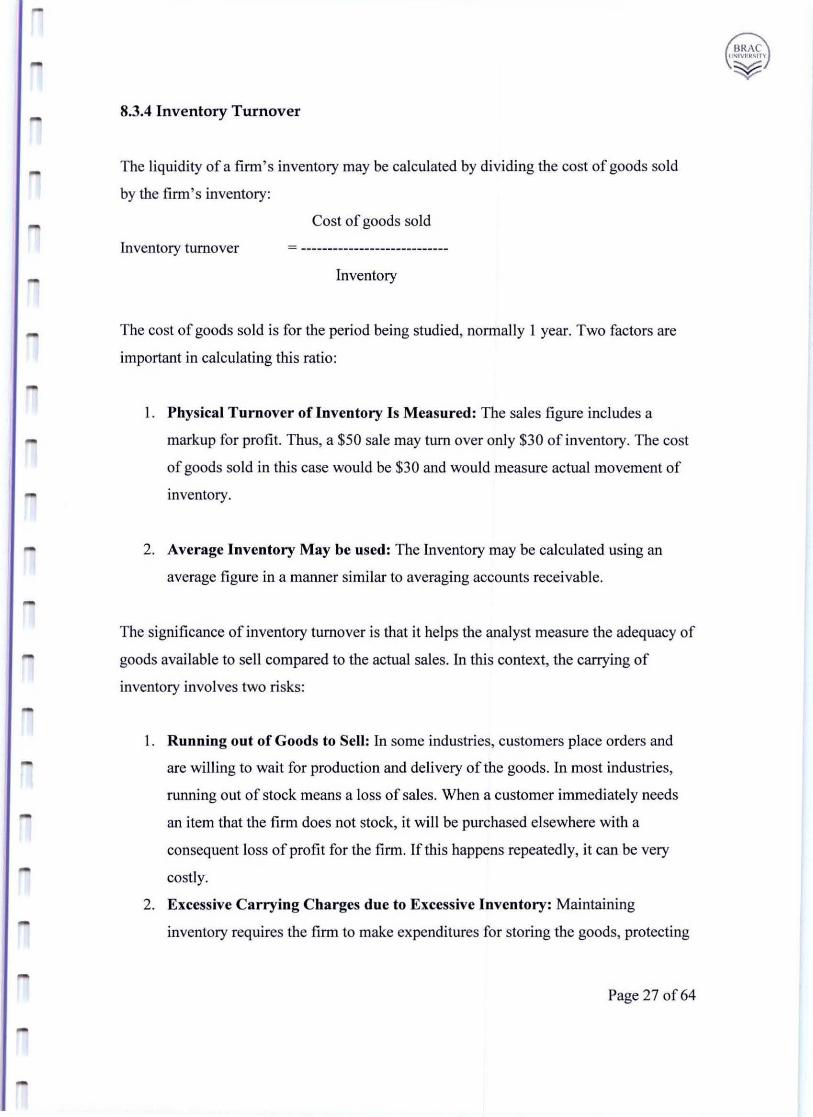
r 8.3.4 Inventory Turnover
The liquidity of a firm's inventory may be calculated by dividing the cost of goods sold
by the firm ' s inventory:
Cost of goods sold
Inventory turnover
Inventory
The cost of goods sold is for the period being studied, normally I year. Two factors are
important in calculating this ratio:
I. Physical Turnover of Inventory Is Measured: The sales figure includes a
markup for profit. Thus, a $50 sale may tum over only $30 of inventory. The cost
of goods sold in this case would be $30 and would measure actual movement of
inventory.
2. Average Inventory May be used: The Inventory may be calculated using an
average figure in a manner similar to averaging accounts receivable.
The significance of inventory turnover is that it helps the analyst measure the adequacy of
goods available to sell compared to the actual sales. In this context, the carrying of
inventory involves two risks:
1. Running out of Goods to Sell: In some industries, customers place orders and
are willing to wait for production and delivery of the goods. In most industries,
running out of stock means a loss of sales. When a customer immediately needs
an item that the firm does not stock, it will be purchased elsewhere with a
consequent loss of profit for the firm. If this happens repeatedly, it can be very
costly.
2. Excessive Carrying Charges due to Excessive Inventory: Maintaining
inventory requires the firm to make expenditures for storing the goods, protecting
Page 27 of64
them from theft or breakage, and handling them. If the firm maintains unneeded
inventory, it is paying for unnecessary warehouse space, insuring goods that it
need not hold, and incurring other costs that can be a financial burden on the firm.
Because the manager must compromise between running out of goods to sell and
investing in excessive inventory, either a high or low ratio may be an indication of poor
management, as follows :
1. High Turnover May Indicate Future Shortages: A high inventory turnover
results when the firm maintains extremely low stocks of goods or raw materials.
The low level of finished goods may indicate that the firm will suffer a loss of
sales due to an inability to deliver goods promptly. The low level ofraw materials
could cause shutdowns of the firm ' s production line, resulting in higher costs.
2. Low Turnover May Indicate Overstocking of inventory: A low inventory
turnover results from excessive inventory being carried by the firm. The firm may
be incurring high costs from overstocking finished goods or raw materials. At the
same time, the firm may be carrying obsolete goods in its inventory.
Different firms turn over their inventories at markedly different rates. A firm that has
many items at varying stages of production might he expected to have a relatively low
turnover. If the inventory contains only a few fast- moving items, a high turnover would
he expected. The analyst should remember that high and low turnovers are relative terms.
The current turnover must he compared to previous periods or to some industry norms
before it is designated as high, low, or normal. The nature of the business should also be
considered in analyzing the appropriateness of the size and turnover of the inventory.
Page 28 of64
BRA e IINI V~RMr"
~
,...
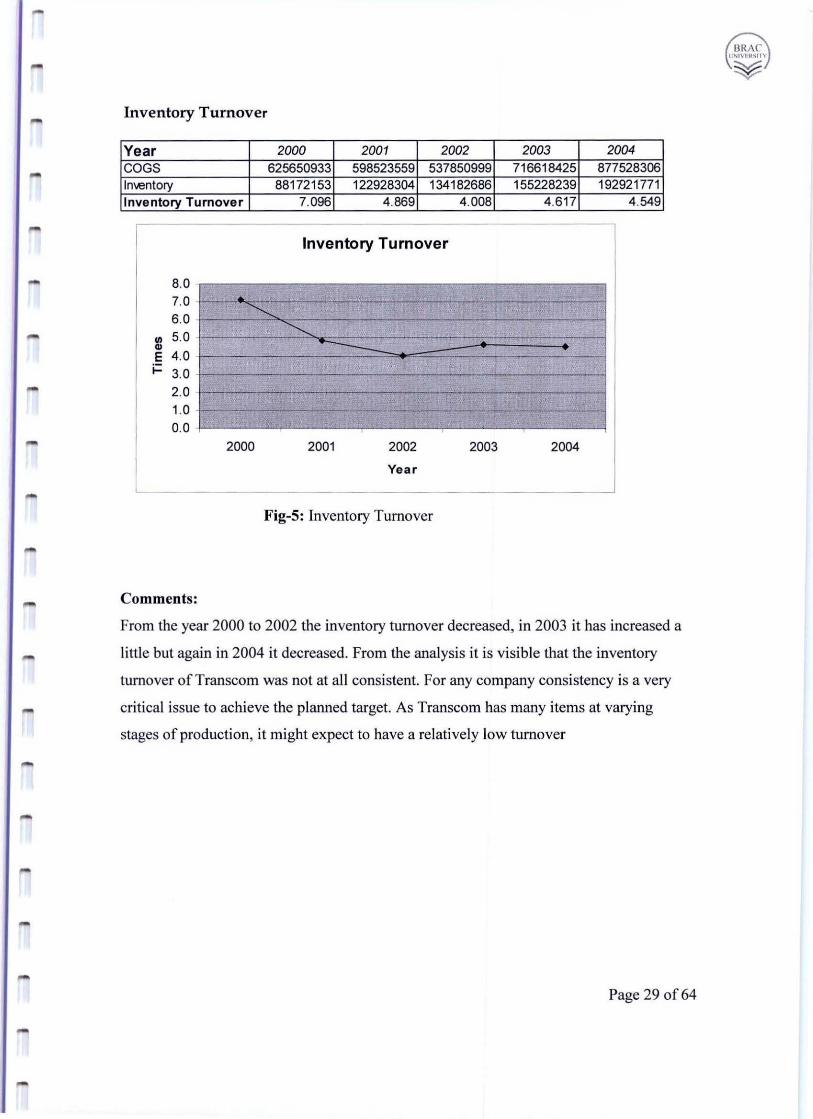
Inventory Turnover
Year 2000 2001 2002 2003 2004 COGS 625650933 598523559 537850999 716618425 877528306 Inl.entory 88172153 122928304 134182686 155228239 192921771 Inventory Turnover 7.096 4.869 4.008 4.617 4.549
Inventory Turnover
8.0 7.0 - .. 6.0 ............
5.0 ............ III ., -E 4.0 i= 3.0
2.0 1.0 f- -- - - _0_- ----. --- ~~
0.0 2000 2001 2002 2003 2004
Year
Fig-5: Inventory Turnover
Comments:
From the year 2000 to 2002 the inventory turnover decreased, in 2003 it has increased a
little but again in 2004 it decreased. From the analysis it is visible that the inventory
turnover of Transcom was not at all consistent. For any company consistency is a very
critical issue to achieve the planned target. As Transcom has many items at varying
stages of production, it might expect to have a relatively low turnover
Page 29 of64
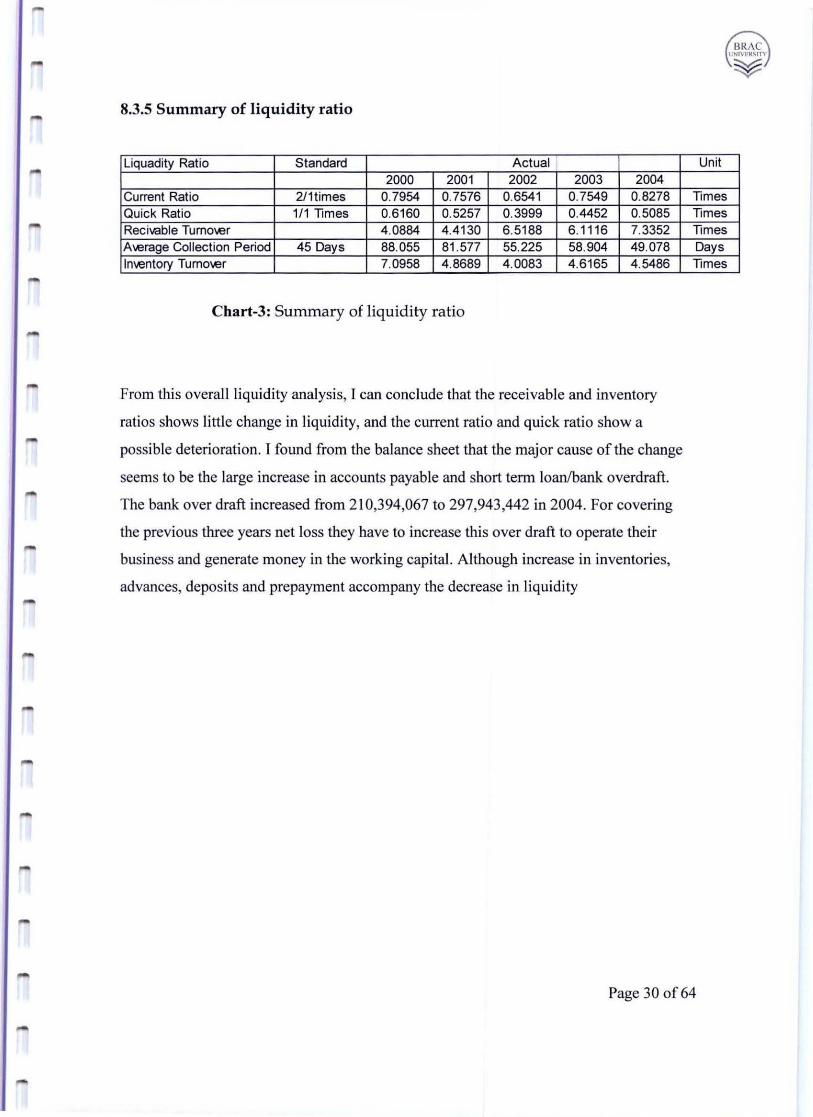
8.3.5 Summary of liquidity ratio
Liquadity Ratio Standard Actual 2000 2001 2002 2003 2004
Current Ratio 2/1times 0.7954 0.7576 0.6541 0.7549 0.8278 Quick Ratio 111 Times 0.6160 0.5257 0.3999 0.4452 0.5085 Recivable TumOl,er 4.0884 4.4130 6.5188 6.1116 7.3352 Al.erage Collection Period 45 Days 88.055 81.577 55.225 58.904 49.078 Inl.entory Tumol.er 7.0958 4.8689 4.0083 4.6165 4.5486
Chart-3: Summary of liquidity ratio
From this overall liquidity analysis, I can conclude that the receivable and inventory
ratios shows little change in liquidity, and the current ratio and quick ratio show a
possible deterioration. I found from the balance sheet that the major cause of the change
seems to be the large increase in accounts payable and short term loanlbank overdraft.
The bank over draft increased from 210,394,067 to 297,943,442 in 2004. For covering
the previous three years net loss they have to increase this over draft to operate their
business and generate money in the working capital. Although increase in inventories,
advances, deposits and prepayment accompany the decrease in liquidity
Unit
Times Times Times Days Times
Page 30 of64
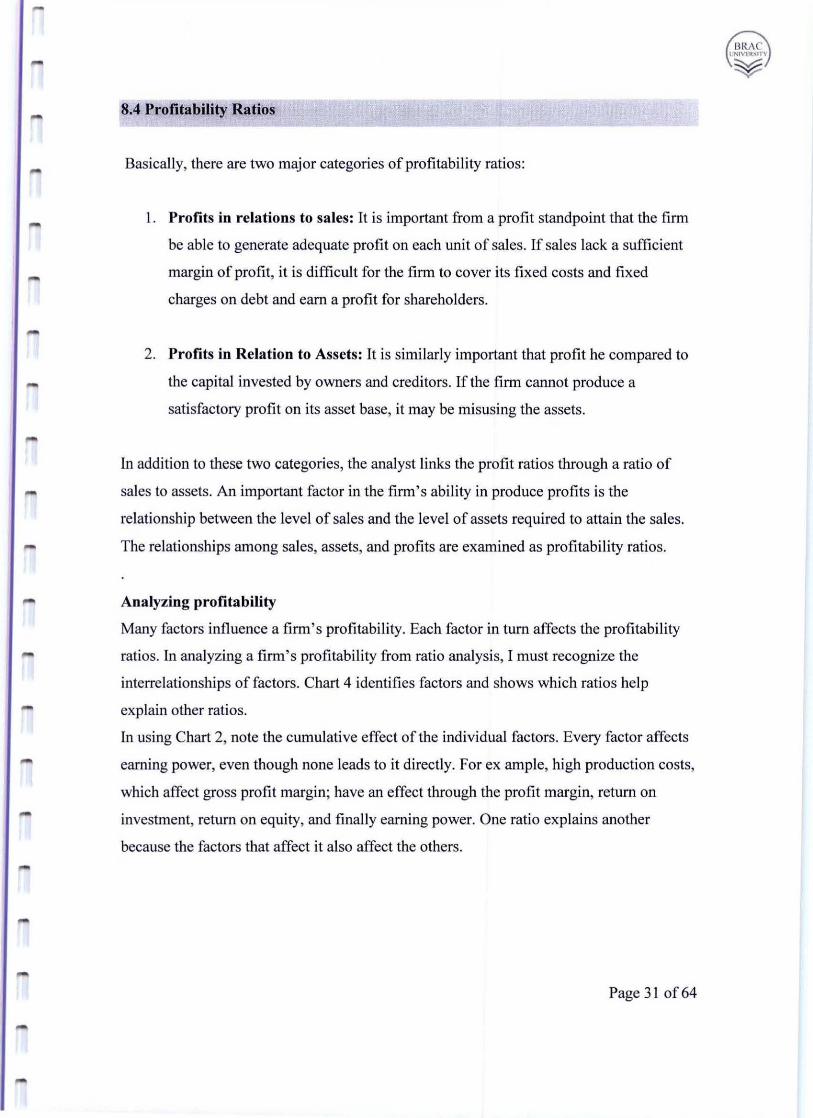
8.4 Profitability Ratios
Basically, there are two major categories of profitability ratios:
I. Profits in relations to sales: It is important from a profit standpoint that the firm
be able to generate adequate profit on each unit of sales. If sales lack a sufficient
margin of profit, it is difficult for the firm to cover its fixed costs and fixed
charges on debt and earn a profit for shareholders.
2. Profits in Relation to Assets: It is similarly important that profit he compared to
the capital invested by owners and creditors. If the firm cannot produce a
satisfactory profit on its asset base, it may be misusing the assets.
In addition to these two categories, the analyst links the profit ratios through a ratio of
sales to assets . An important factor in the firm's ability in produce profits is the
relationship between the level of sales and the level of assets required to attain the sales.
The relationships among sales, assets, and profits are examined as profitability ratios.
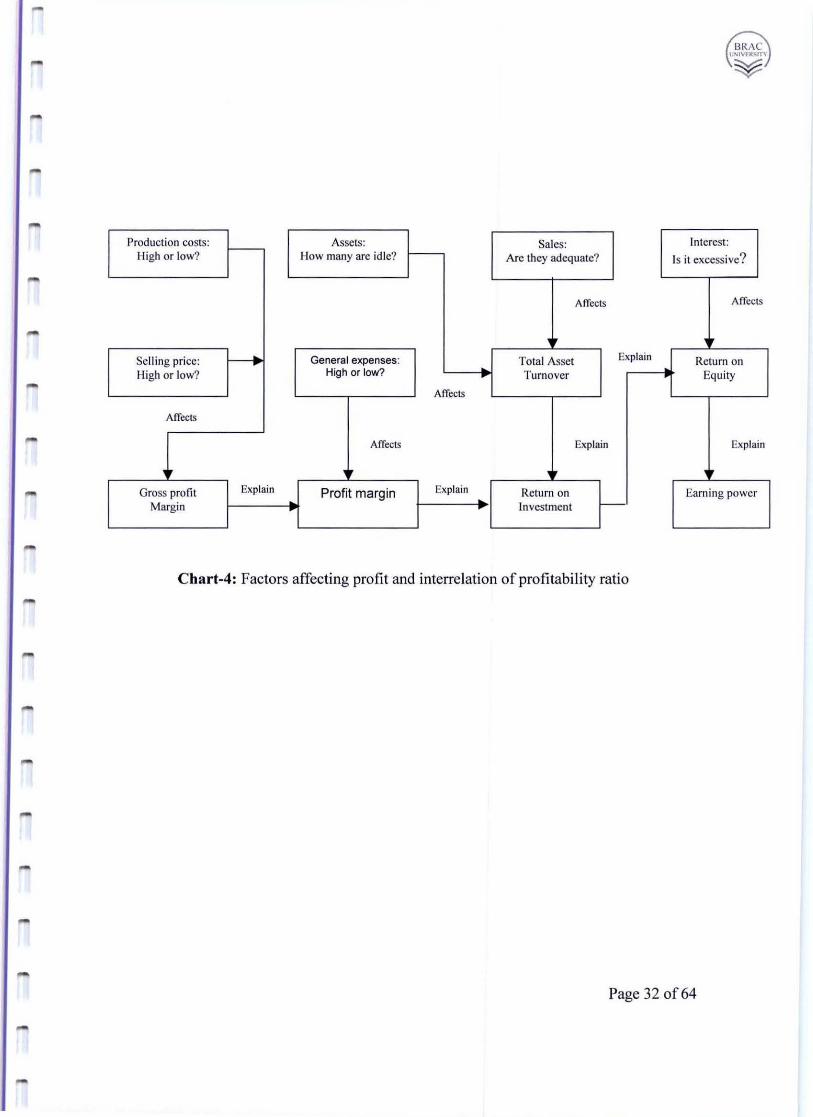
Analyzing profitability
Many factors influence a firm's profitability. Each factor in turn affects the profitability
ratios. In analyzing a firm's profitability from ratio analysis, I must recognize the
interrelationships of factors. Chart 4 identifies factors and shows which ratios help
explain other ratios.
In using Chart 2, note the cumulative effect of the individual factors. Every factor affects
earning power, even though none leads to it directly. For ex ample, high production costs,
which affect gross profit margin; have an effect through the profit margin, return on
investment, return on equity, and finally earning power. One ratio explains another
because the factors that affect it also affect the others.
Page 31 of64
BRAe !1N IVf. R~IT"
¥
....
BRAe 1 ; 1'oIVHt~lT'\
¥
Production costs: - Assets: Sales: Interest: High or low? How many arc idle? r--- Are they adequate? Is it excess ive?
Affects Affects
r Selling price: General expenses: Total Asset Explain Return on High or low? High or low? Turnover Equity
Affects
Affects
Affects Explain Explain
r Gross profit Explain Profit margin Explain Return on Earn ing power
Margin Investment r--
Char t-4: Factors affecting profit and interrelation of profitability ratio
Page 32 of64
8.4.1 Profit Margin
The firm's profit margin is calculated by dividing operating income by sales:
Operating income
Profi t margin = ---------------------------------
Sales
Both figures are normally taken from the income statement. The significance of thi s ratio
is that it helps measure the relationship between sales and operating profits. If the profit
margin is inadequate, the firm cannot achieve satisfactory return for its investors.
The profit margin is an indicator of the ability of the firm to withstand adverse
conditions, which may arise from several sources, such as the following:
I . Falling Prices: If the general price level in the marketplace experiences a decline,
does the firm have a sufficient margin to drop its price arid still show a profit on
individual sales?
2. Rising Costs: If the firm is caught in a period of rising costs when it cannot rai se
its prices, will the firm continue to be profitable?
3. Declining Sales: Can the firm withstand unexpected drops in sales and still show
a profit?
Similarly, the profit margin may be used as an indicator of possible success under
favorable conditions, such as the following:
Page 33 of64

r
1. Rising Prices: Ifthe firm is able to raise its prices, how quick will profits rise?
2. Lowered Costs: If supplies and materials decline in price, what profits can be
expected?
3. Increasing Sales: If the firm is able to gain large increases in sales without price
or cost effects, what would he the profit forecast?
Page 34 of64
BRAe ! JN IVfR~ITV
¥
BRAe !fNIVI'RSln'
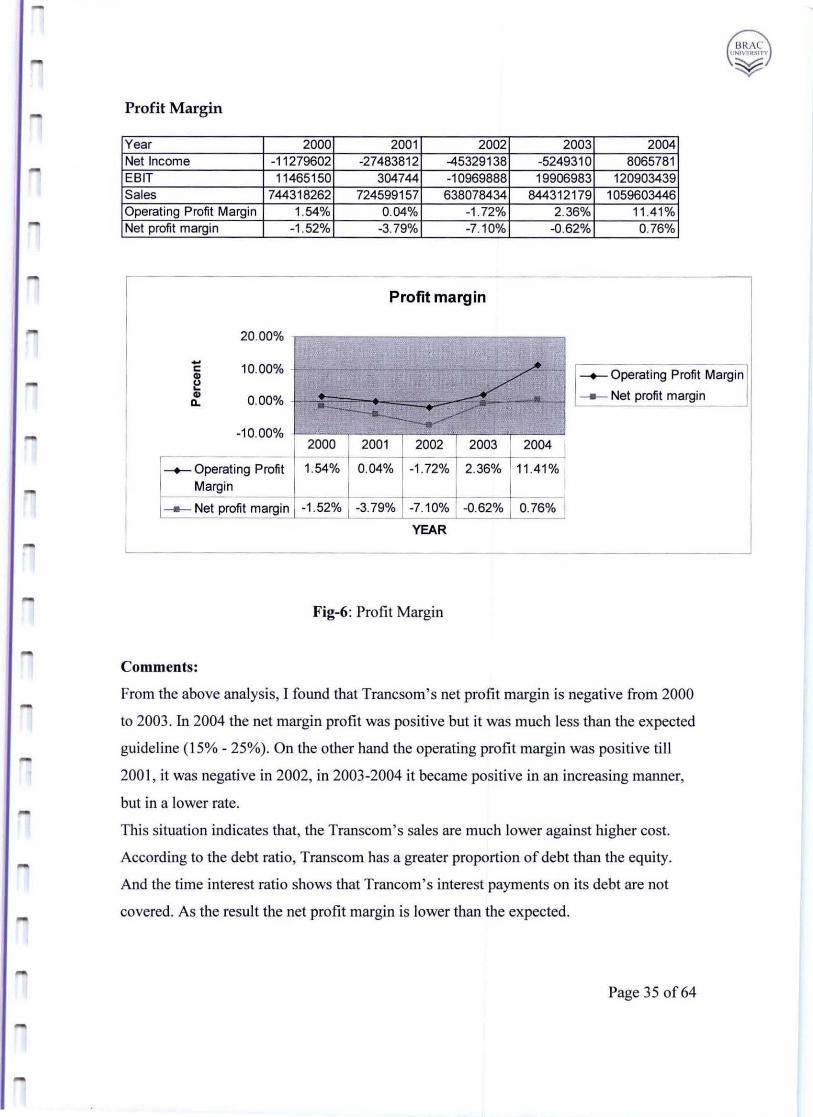
¥ Profit Margin
Year 2000 2001 2002 2003 2004 Net Income -11 279602 -27483812 -45329138 -5249310 8065781 EBIT 11465150 304744 -10969888 19906983 120903439 Sales 744318262 724599157 638078434 844312179 1059603446 Operating Profit Margin 1.54% 0.04% -1.72% 2.36% 11.41 % Net profit margin -1.52% -3.79% -7.10% -0.62% 0.76%
Profit margin
20.00%
- ~~ c 10.00% - - - - - -+-- Operating Profit Margin ., " ~ A. __ Net profi t margin .,
0.00% . Q. .... ~ -10.00% ~
2000 2001 2002 2003 2004
-+-- Operating Profit 1.54% 0.04% -1 .72% 2.36% 11.41 % Margin
__ Net profit margin -1.52% -3.79% -7.10% -0.62% 0.76%
YEAR
Fig-6: Profit Margin
Comments;
From the above analysis, I found that Trancsom's net profit margin is negative from 2000
to 2003. In 2004 the net margin profit was positive but it was much less than the expected
guideline (15% - 25%). On the other hand the operating profit margin was positive ti ll
200 I , it was negative in 2002, in 2003-2004 it became positive in an increasing manner,
but in a lower rate.
This situation indicates that, the Transcom's sales are much lower against higher cost.
According to the debt ratio, Transcom has a greater proportion of debt than the equity.
And the time interest ratio shows that Trancom's interest payments on its debt are not
covered. As the result the net profit margin is lower than the expected.
Page 35 of 64
8.4.2 Gross Profit Margin
A second ratio that links sales and profits is the gross profit margin, which is calculated
by dividing the gross margin by sales. This ratio shows the profits relative to sales after
the direct production costs are deducted. It may he used as an indicator of the efficiency
of the production operation and the relation between production costs and selling price:
Sales - cost of goods sold
Gross profit margin=
Sales
The difference between profit margin and gross profit margin lies in the general and
administrative expenses. These are included in the profit margin thus the profit margin
presents a total operations picture. They are excluded from the more narrow profit
measure of gross profit margin.
Page 36 of64
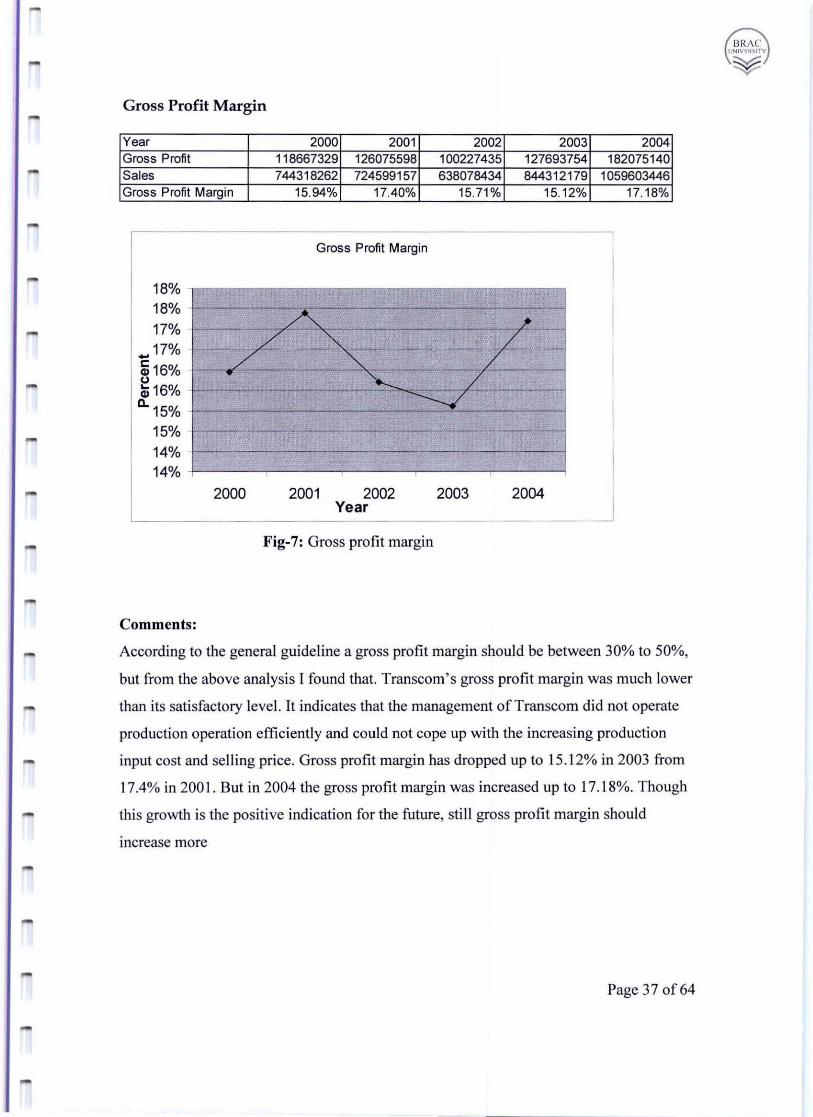
Gross Profit Margin
Year Gross Profit Sales Gross Profi t Margin
18% 18% 17%
... 17% 5i 16% c.> ;16% c.. 15%
15% 14% 14%
-
-
-
-
-
-
Comments:
/
2000
2000 2001 2002 118667329 126075598 100227435 744318262 724599157 638078434
15.94% 17.40% 15.71%
Gross Profit Margin
A / ."" ~ /
~ / ----.;'
, ,
2001 2002 2003 Year
Fig-7: Gross profit margin
2003 2004 127693754 182075140 844312179 1059603446
15.12% 17.18%
f'
L
2004
According to the general guideline a gross profit margin should be between 30% to 50%,
but from the above analysis I found that. Transcom's gross profit margin was much lower
than its satisfactory level. It indicates that the management of Transcom did not operate
production operation efficiently and could not cope up with the increasing production
input cost and sell ing price. Gross profit margin has dropped up to 15.12% in 2003 from
17.4% in 2001. But in 2004 the gross profit margin was increased up to 17.1 8%. Though
this growth is the positive indication for the future, still gross profit margin should
Increase more
Page 37 of64
8.4.3 Fixed assets turnover
A key measure of management effectiveness is its ability to effective utilization of the
available resources. The fixed assets turnover measure management ability to generate
sales given an investment in fixed assets. The ratio is computed as follows:
Net sales
Fixed assets turnover =
Fixed assets
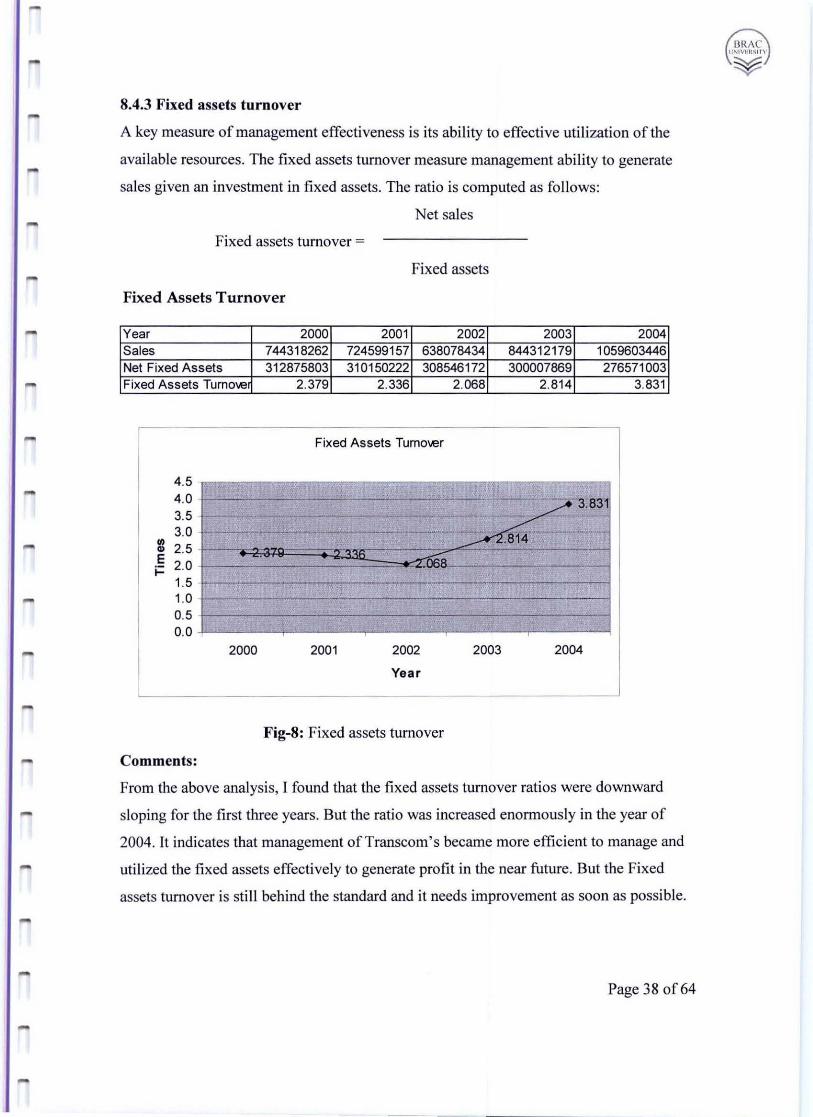
Fixed Assets Turnover
Year 2000 2001 2002 2003 2004 Sales 744318262 724599157 638078434 844312179 1059603446 Net Fixed Assets 312875803 310150222 308546172 300007869 276571003 Fixed Assets Turnol.e 2.379 2.336 2.068 2.814 3.831
Fixed Assets Turnol.er
4.5 4.0 3.5 r - -- -- -- - ~M~ 3.0 r-- -- --' -- .814-- .~
I/) ., 2.5 - ....:::::: E 2.0 -i= 1.5 -1.0 r 0.5 0.0
2000 2001 2002 2003 2004
Year
Fig-8: Fixed assets turnover
Comments:
From the above analysis, I found that the fixed assets turnover ratios were downward
sloping for the first three years. But the ratio was increased enormously in the year of
2004. It indicates that management of Transcom's became more efficient to manage and
utilized the fixed assets effectively to generate profit in the near future. But the Fixed
assets turnover is still behind the standard and it needs improvement as soon as possible.
Page 38 of64
... 8.4.4 Total Asset Turnover
The asset turnover is calculated by dividing sales by the firm's assets:
Sales Sales
Asset turnover= or -----------------------
Total assets Operating assets
It highlights the amount of assets that the firm used to produce its total sales. The ability
to produce a large volume of sales on a small asset base is an important part of the firm's
profit picture. Idle or improperly used assets increase the firm's need for costly financing
and the expenses for maintenance and upkeep. By achieving a high asset turnover, a firm
reduces costs and increases the eventual profit to its owners.
[n the calculation of asset turnover, assets may be defined three ways:
1. Total Assets: The most common usage of assets involves the total assets re
ported on the balance sheet. This is basically the book value of current fixed
assets. It is the most common asset measure since it is the most readily available,
appearing in the [mn's annual report.
2. Operating Assets: A more accurate measure of the assets used to generate a
given volume of sales is the actual operating assets. The analyst might eliminate
excess current assets, capital tied up in expansion activities, or other assets not
used in the firm's operations in order to produce the reported EBIT. The difficulty
in using operating assets is identif'ying them. If the firm is constructing a $25-
million factory, this may be noted in the annual report. Since it is not operating
yet, it can be eliminated from the total as sets. But there may be other unused
assets, and this may not be known.
3. Total Assets Plus Estimated Value of Leased Assets: When a firm leases plant
or equipment, it is earning a return on an asset that is not shown or the balance
Page 39 of64
--- --- --------
sheet. When comparing different fums, the approximate value of each firm's
assets should be reflected.
As a general rule, external analysis uses total assets, with or without an estimate of the
value of leased assets. lnternal analysis should use operating assets and should consider
the val ue ofleased assets.
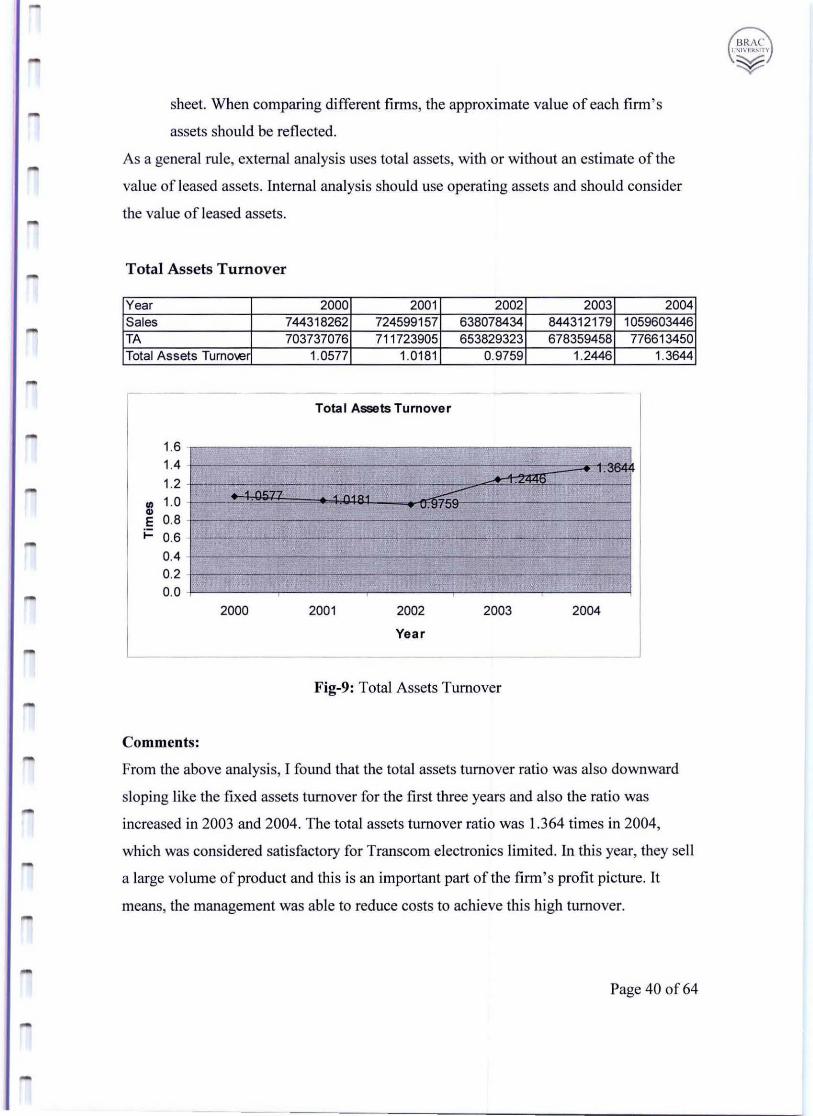
Total Assets Turnover
Year 2000 2001 2002 2003 2004 Sales 744318262 724599157 638078434 844312179 1059603446 TA 703737076 711 723905 653829323 678359458 776613450 Total Assets TumOl.e 1.0577 1.0181 0.9759 1.2446 1.3644
Total Assets Turnover
1.6 1.4 . """ 1.2
• n~'7'7 ~ 4 n . 0 4 I/) 1.0 - U .Q'UQ ., E 0.8 j:: 0.6 -
0.4 0.2 -0.0
2000 2001 2002 2003 2004
Year
Fig-9: Total Assets Turnover
Comments:
From the above analysis, I found that the total assets turnover ratio was also downward
sloping like the fixed assets turnover for the first three years and also the ratio was
increased in 2003 and 2004. The total assets turnover ratio was 1.364 times in 2004,
which was considered satisfactory for Transcom electronics limited. In this year, they sell
a large volume of product and this is an important part of the firm ' s profit picture. It
means, the management was able to reduce costs to achieve this high turnover.
Page 40 of64
8.4.5 Return on Investment
Individually, the profit margin and the asset turnover have certain weak nesses. The profit
margin ignores the money invested by the firm to earn the profit. On the other hand, the
asset turnover does not consider the profits made on the use of the assets. To overcome
these individual weaknesses, the two ratios may be combined to form a return on
investment (ROJ)
Return on investment may be calculated in two ways:
I. EBIT Divided by Assets: The firm's return on investment is a ratio of its
operating income to the assets used to produce the income.
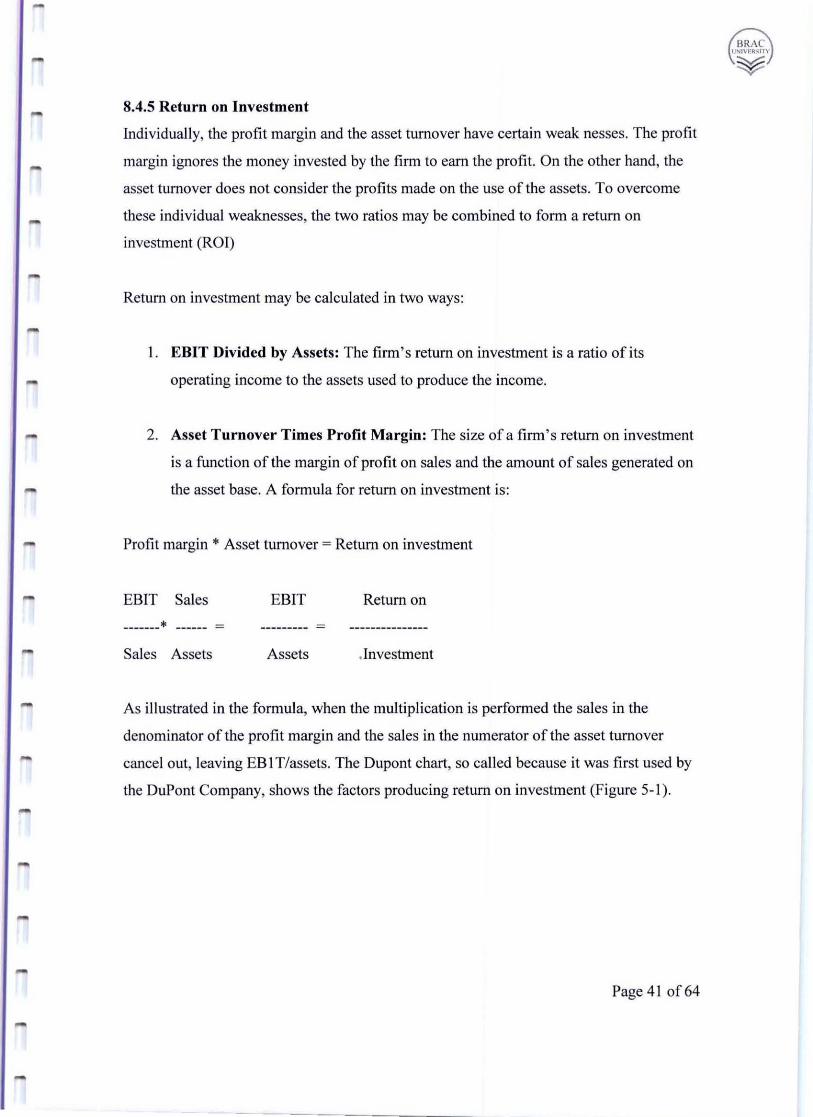
2. Asset Turnover Times Profit Margin: The size ofa firm ' s return on investment
is a function of the margin of profit on sales and the amount of sales generated on
the asset base. A formula for return on investment is:
Profit margin • Asset turnover = Return on investment
EBIT Sales EBIT Return on
• Sales Assets Assets .Investment
As illustrated in the formula, when the multiplication is performed the sales in the
denominator of the profit margin and the sales in the numerator of the asset turnover
cancel out, leaving EBI T/assets. The Dupont chart, so called because it was first used by
the DuPont Company, shows the factors producing return on investment (Figure 5-1).
Page 41 of64
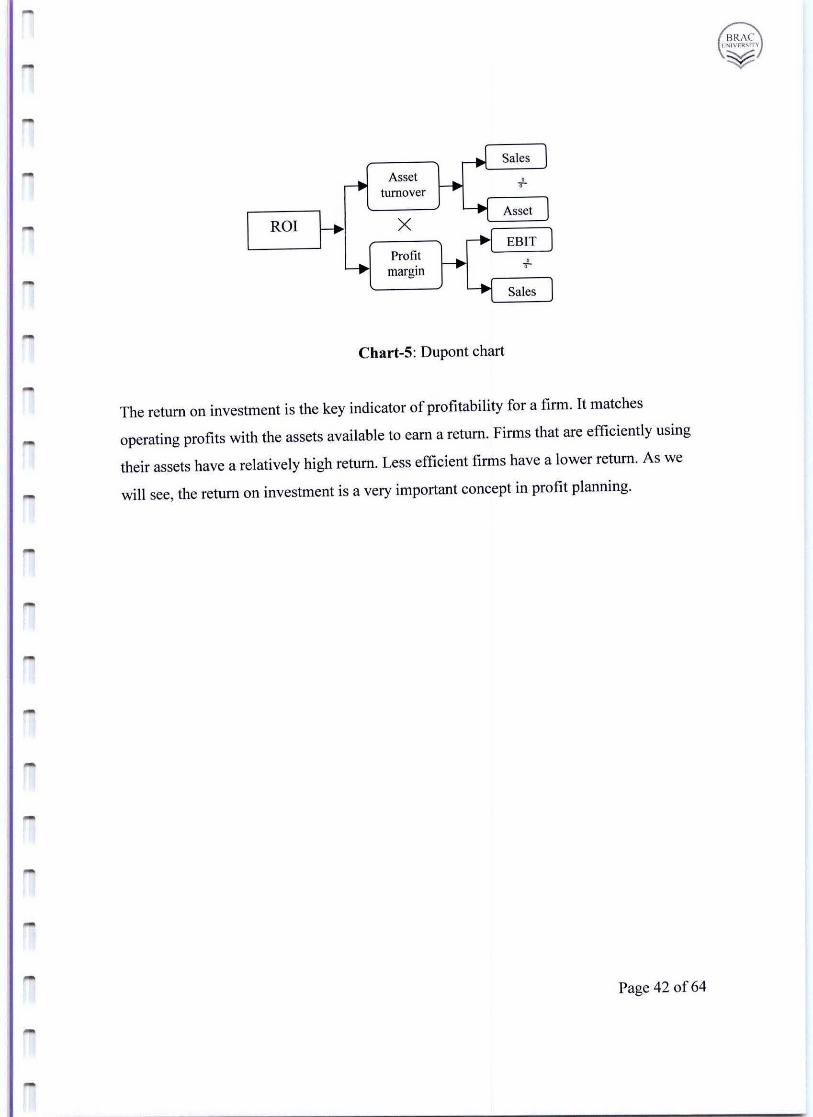
ROI
Asset turnover
x Profit
margin
Chart-S: Dupont chart
The return on investment is the key indicator of profitability for a firm. It matches
operating profits with the assets available to earn a return. Firms that are efficiently using
their assets have a relatively high return. Less efficient firms have a lower return. As we
will see, the return on investment is a very important concept in profit planning.
Page 42 of64
BRAe lJi'l IVEI(\ITY
¥
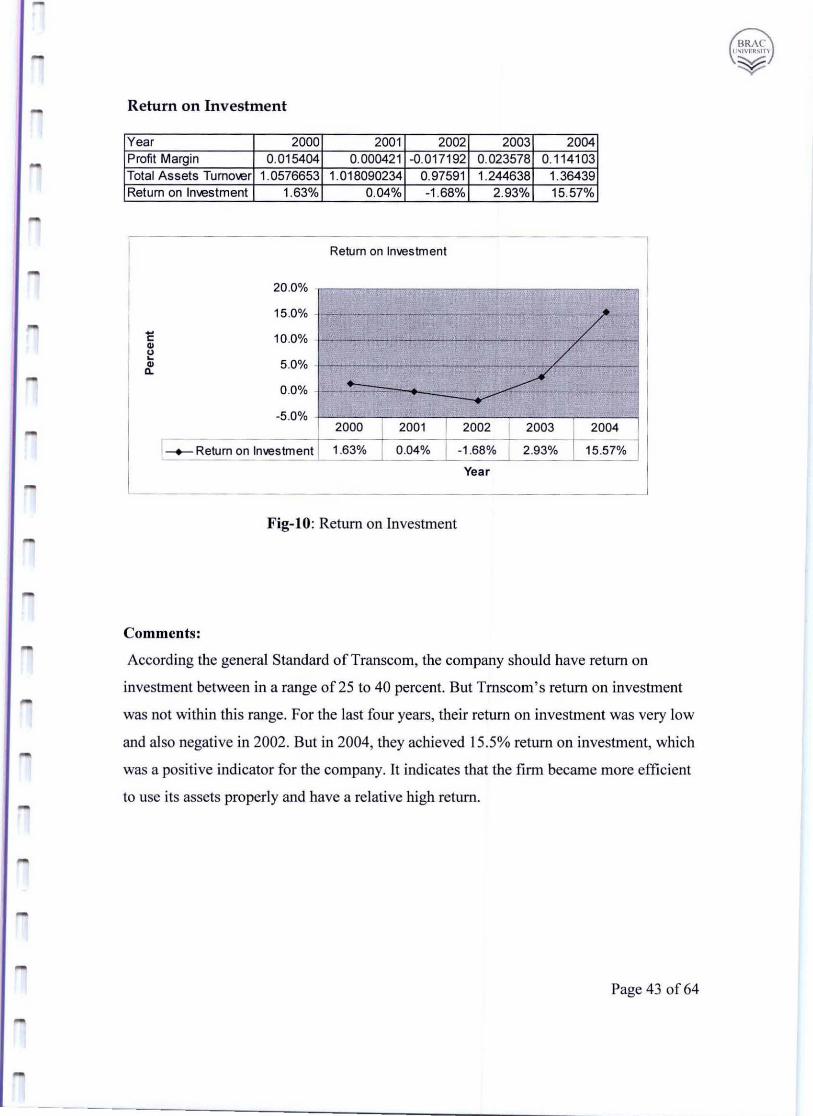
Return on Investment
Year 2000 2001 2002 2003 2004 Profit Margin 0.015404 0.000421 -0.017192 0.023578 0.114103 Total Assets Turno\er 1.0576653 1.018090234 0.97591 1.244638 1.36439 Return on In\estment 1.63% 0.04% -1 .68% 2.93% 15.57%
Return on Investment
20.0%
15.0% . - -~ - --- -/ -- 10.0% . c: CI> / u ~
5.0% . CI> Q.
~.~ 0.0% . c..... ... --"'" -5 .0% .
2000 2001 2002 2003 2004
I-+- Return on Investment 1.63% 0.04% -1 .68% 2.93% 15.57%
Year
Fig-lO: Return on Investment
Comments:
According the general Standard of Trans com, the company should have return on
investment between in a range of25 to 40 percent. But Trnscom's return on investment
was not within this range. For the last four years, their return on investment was very low
and also negative in 2002. But in 2004, they achieved 15.5% return on investment, which
was a positive indicator for the company. It indicates that the firm became more efficient
to use its assets properly and have a relative high return.
Page 43 of64
BRAC' ! , NIVf.II~n·'·
¥
8.4.6 Return on Equity
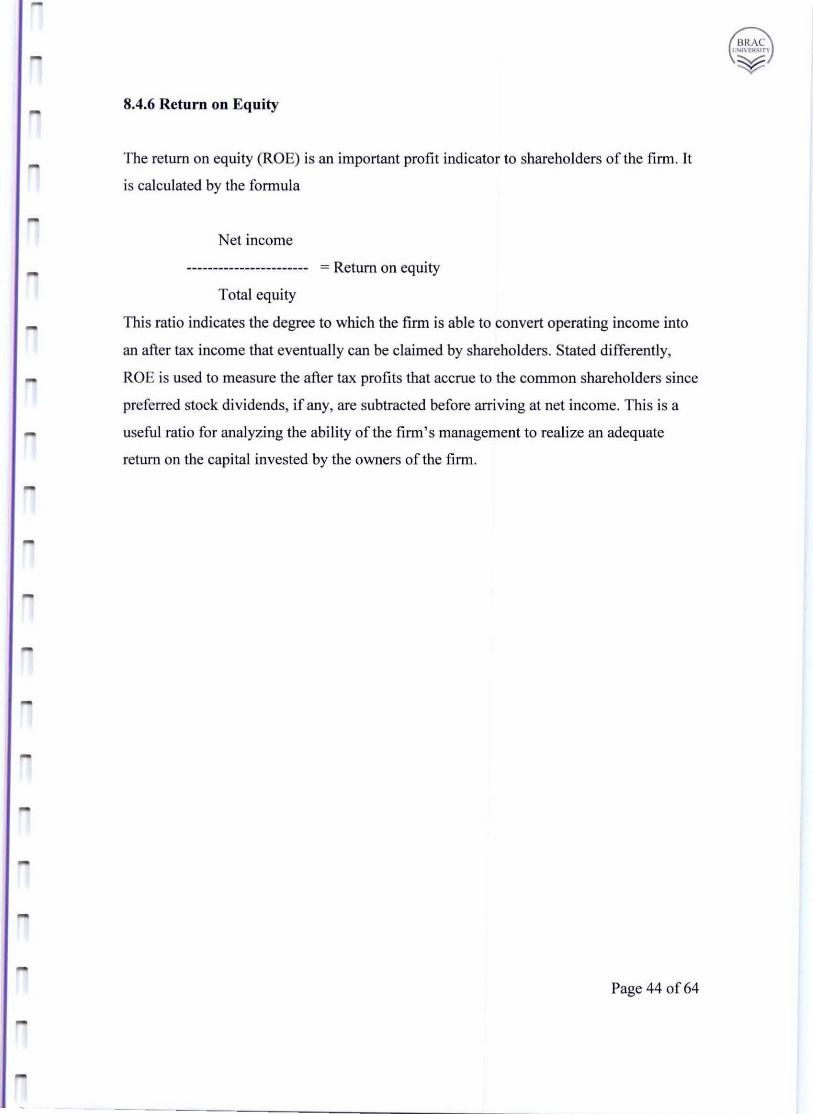
The return on equity (ROE) is an important profit indicator to shareholders of the firm. It
is calculated by the formula
Net income
----------------------- = Return on equity
Total equity
This ratio indicates the degree to which the firm is able to convert operating income into
an after tax income that eventually can be claimed by shareholders. Stated differently,
ROE is used to measure the after tax profits that accrue to the common shareholders since
preferred stock dividends, if any, are subtracted before arriving at net income. This is a
useful ratio for analyzing the ability of the firm's management to realize an adequate
return on the capital invested by the owners of the firm.
Page 44 of64
BRAe l1"'IVElt.~ln
¥
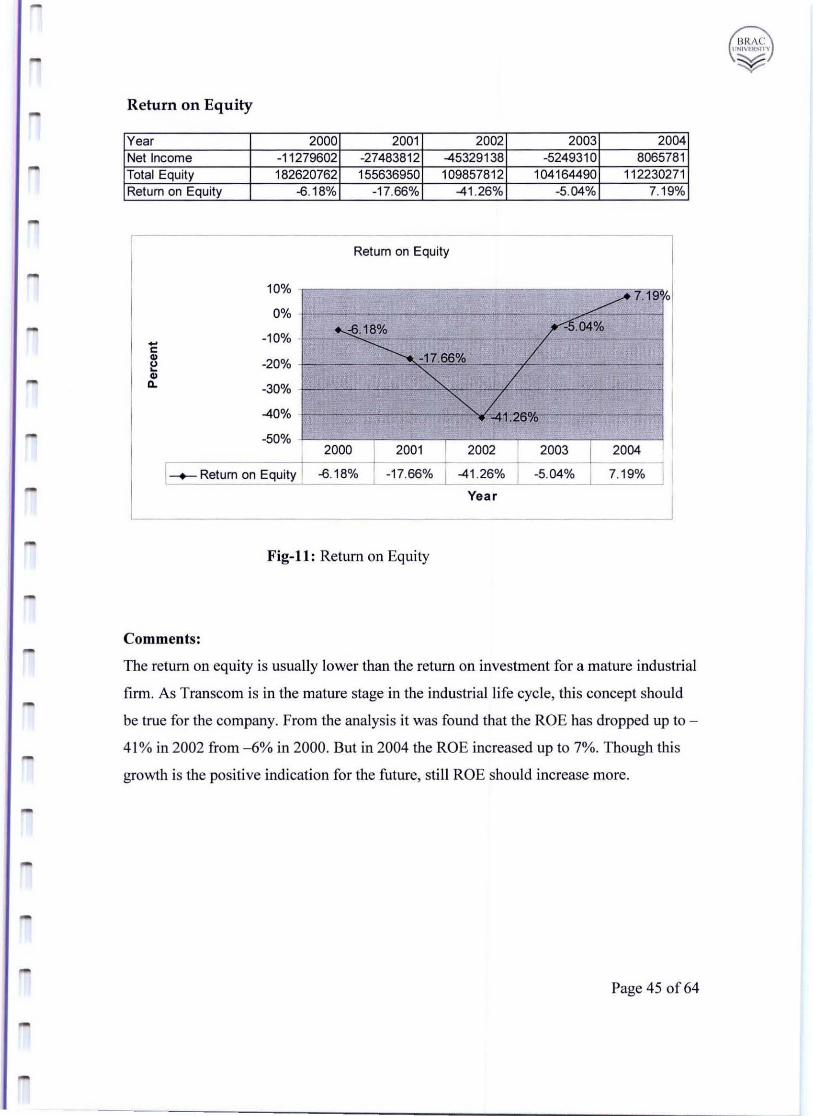
Return on Equity
Year 2000 2001 2002 2003 2004 Net Incorne -11279602 -27483812 -45329138 -5249310 8065781 Total Equity 182620762 155636950 109857812 104164490 112230271 Return on Equity -B.18% -17.66% -41 .26% -5.04% 7.19%
Return on Equity
10% /7.190
0
0% -
-10% -,s.18% -~~%_~ - -~-1;;%
-c:: CI)
-20% ~
"" / CI)
11. -30% -
""/ -40% - • t:26%
-50% 2000 2001 2002 2003 2004
I-+- Return on Equity -B. 18% -17.66% -41 .26% -5.04% 7.19%
Yea r
Fig-l1 : Return on Equity
Comments:
The return on equity is usually lower than the return on investment for a mature industrial
firm. As Transcom is in the mature stage in the industrial life cycle, this concept should
be true for the company. From the analysis it was found that the ROE has dropped up to -
41 % in 2002 from -6% in 2000. But in 2004 the ROE increased up to 7%. Though this
growth is the positive indication for the future, sti ll ROE should increase more.
Page 45 of64
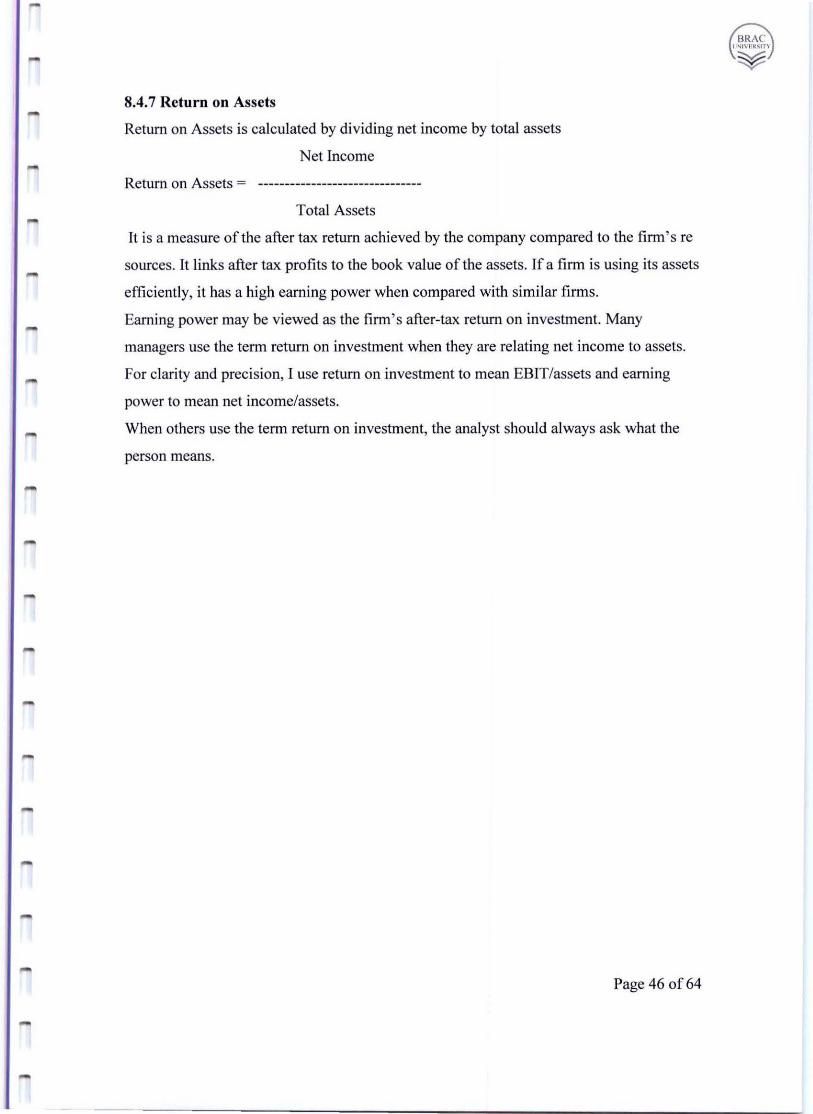
8.4.7 Return on Assets
Return on Assets is calculated by dividing net income by total assets
Net Income
Return on Assets =
Total Assets
It is a measure of the after tax return achieved by the company compared to the ftrm's re
sources. It links after tax profits to the book value of the assets. If a firm is using its assets
efficiently, it has a high earning power when compared with similar firms .
Earning power may be viewed as the firm 's after-tax return on investment. Many
managers use the term return on investment when they are relating net income to assets.
For clarity and precision, I use return on investment to mean EBIT/assets and earning
power to mean net income/assets.
When others use the term return on investment, the analyst should always ask what the
person means.
Page 46 of64
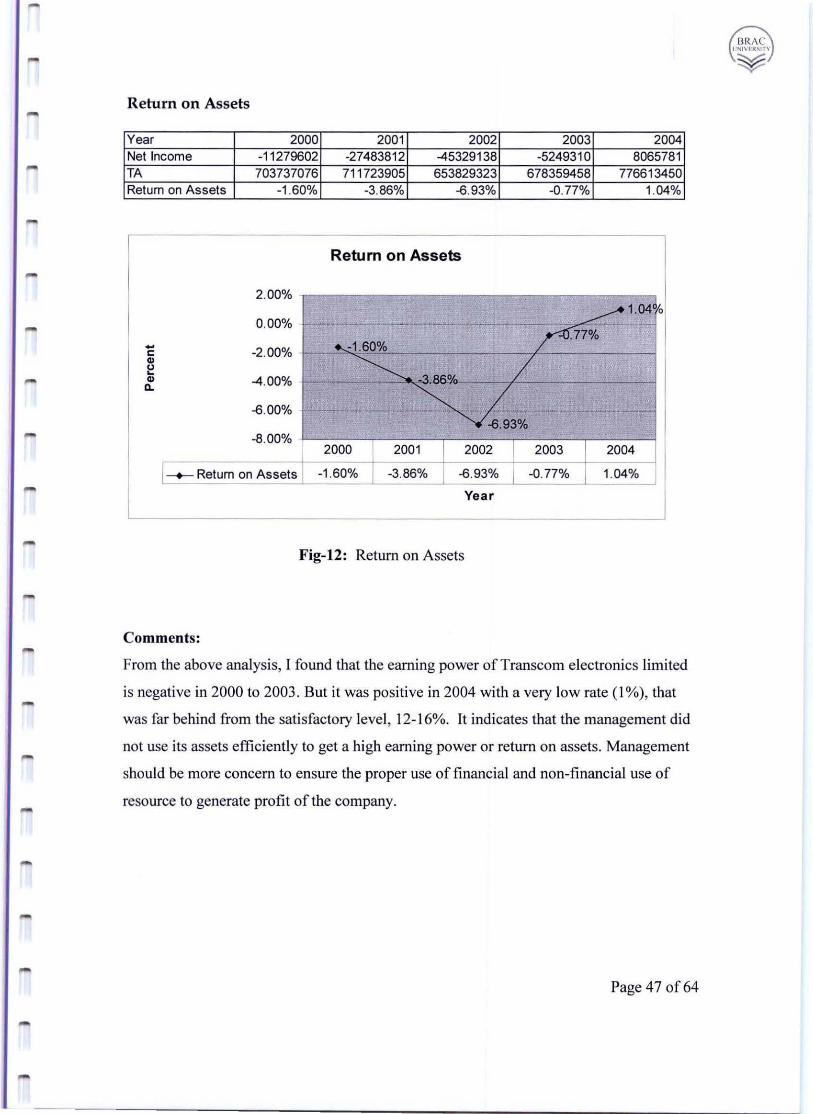
Return on Assets
Year 2000 2001 2002 2003 2004 Net Income -11279602 -27483812 -45329138 -5249310 8065781 TA 703737076 71 1723905 653829323 678359458 776613450 Return on Assets -1 .60% -3.86% -6.93% -0.77% 1.04%
Return on Assets
2.00% -
~1.040 0.00% - - - - - - -- """".77% ----- -2.00% - .. -1 .60% c:
~ / CD 0 ~
_'" ""' IlL CD -4.00% -Il.
-6.00% - -- -- - .-- - - .,.... -6.93%
-8.00% 2000 2001 2002 2003 2004
1 ___ Return on Assets -1 .60% -3.86% -6.93% -0.77% 1.04%
Yea r
Fig-12: Return on Assets
Comments:
From the above analysis, [ found that the earning power of Transcom electronics limited
is negative in 2000 to 2003. But it was positive in 2004 with a very low rate (1%), that
was far behind from the satisfactory level, 12-1 6%. It indicates that the management did
not use its assets efficiently to get a high earning power or return on assets. Management
should be more concern to ensure the proper use of financial and non-financial use of
resource to generate profit of the company.
Page 47 of 64
-
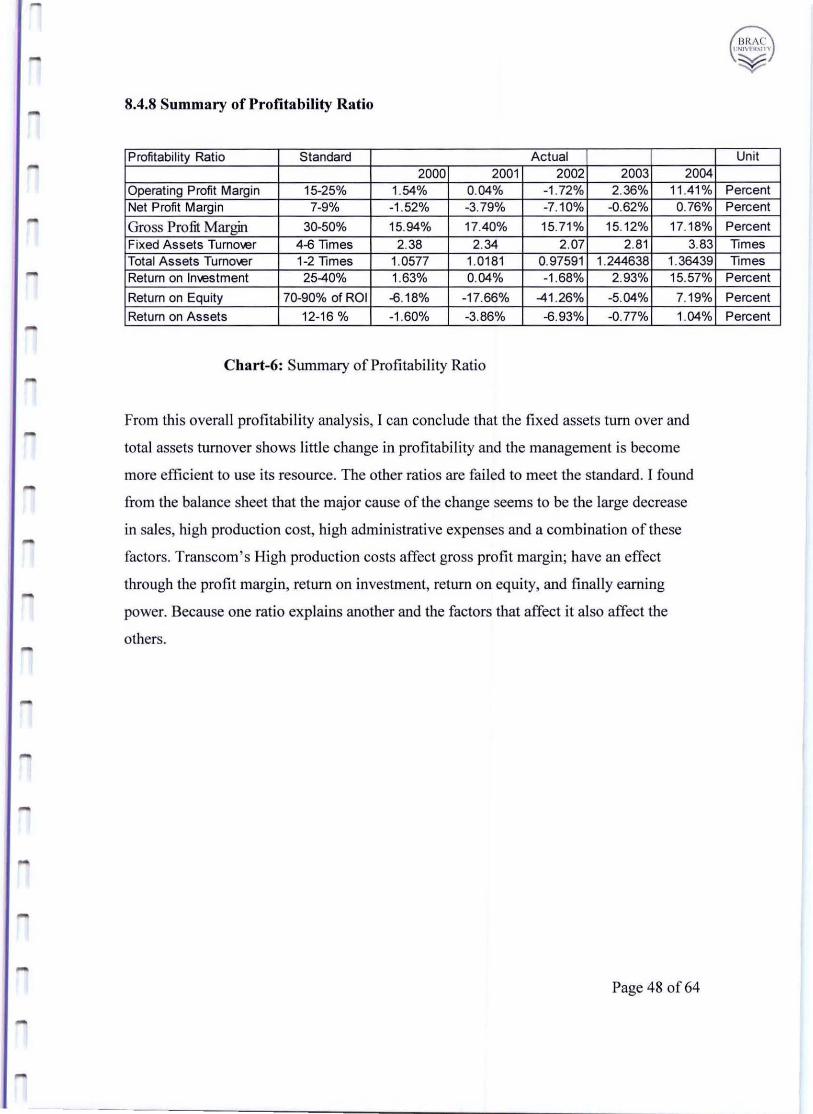
8.4.8 Summary of Profitability Ratio
Profitability Ratio Standard Actual 2000 2001 2002 2003 2004
Operating Profit Margin 15-25% 1.54% 0.04% -1 .72% 2.36% 11.41% Net Profit Margin 7-9% -1 .52% -3.79% -7.10% -0.62% 0.76%
Gross Profit Margin 30-50% 15.94% 17.40% 15.71 % 15.12% 17.18%
Fixed Assets Tumol.er 4-<3 Times 2.38 2.34 2.07 2.81 3.83 Total Assets Tumol.er 1-2 Times 1.0577 1.0181 0.97591 1.244638 1.36439 Return on Inl.estment 25-40% 1.63% 0.04% -1.68% 2.93% 15.57%
Return on Equity 70-90% of ROI -<3.18% -17.66% -41 .26% -5.04% 7.19%
Return on Assets 12-16 % -1 .60% -3.86% -<3.93% -0.77% 1.04%
Chart-6: Summary of Profitability Ratio
From this overall profitability analysis, I can conclude that the fixed assets tum over and
total assets turnover shows little change in profitability and the management is become
more efficient to use its resource. The other ratios are fai led to meet the standard. I found
from the balance sheet that the major cause of the change seems to be the large decrease
in sales, high production cost, high administrative expenses and a combination of these
factors. Transcom's High production costs affect gross profit margin; have an effect
through the profit margin, return on investment, return on equity, and finally earning
power. Because one ratio explains another and the factors that affect it also affect the
others.
Page 48 of64
BRAe I :NIVI II~ln'
¥
Unit
Percent Percent
Percent Times Times
Percent
Percent
Percent
---- -----------------------------------------------~
8.5 Tests of solvency anil equity position
Solvency refers to the ability of a company to meet its ling-term obligations on a
continuing basis. Test of solvency measure a company' s ability to meet these obligations.
Analyzing the way that a company has financed its assets and activities can identify
certain relationship
There are two type of solvency ratio and those are (1) Time interest earned (2) Debt to
equity ratio
8.5.1 Debt management ratio:
The extent to which a firm uses debt financing has three important implications:
I . By rising funds through debt, stockholders ownership is not diluted.
2. Creditors look to the equity, or owner supplied firm, to provide a margin of safety; if
the stockholders have provide only a part of total fmancing, the risks of the enterprise
are born mainly by creditors.
3. If the firm more on investments financed with borrowed funds that it pays in interest,
the return on the owner' s capital magnified, or " leverage".
This debt ratio is calculated by total debt by total assets
Total Debt
Debt ratio =
Total Assets
Page 49 of64
BRAe I IN IVF~S!T"
¥
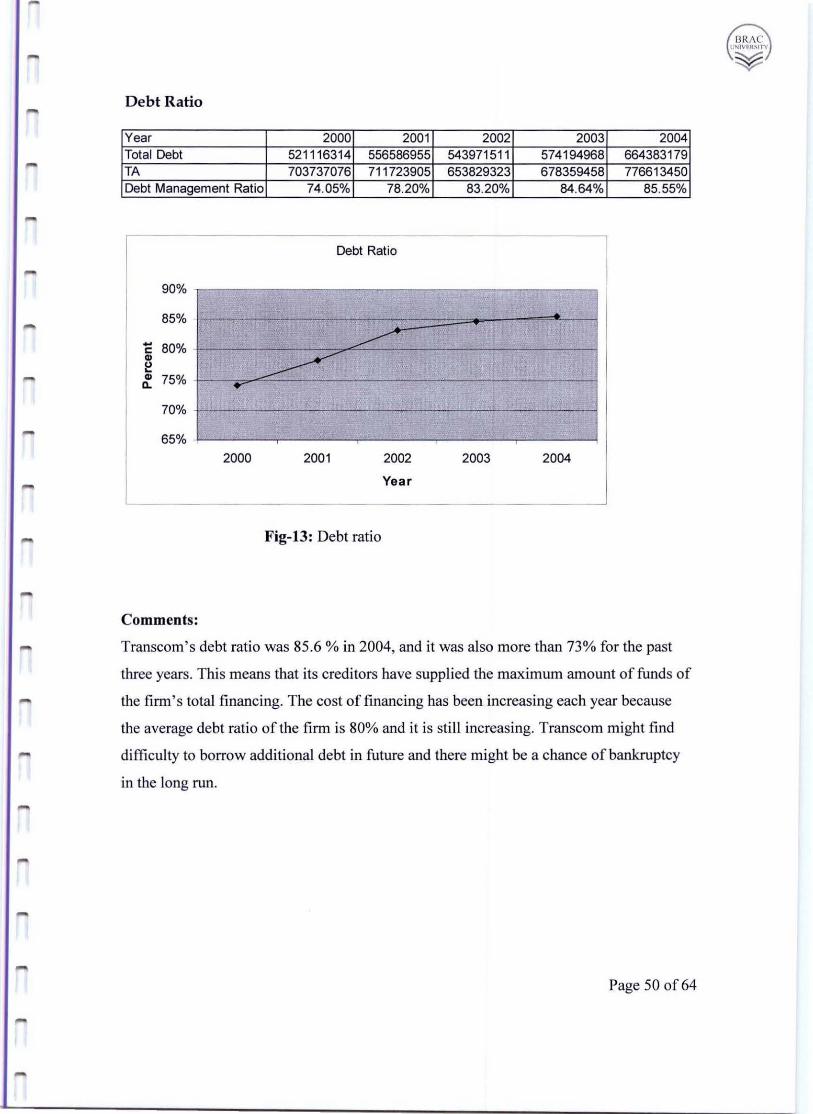
Debt Ratio
Year 2000 2001 2002 2003 2004 Total Debt 521116314 556586955 543971511 574194968 664383179 TA 703737076 711723905 653829323 678359458 776613450 Debt Management Ratio 74.05% 78.20% 83.20% 84.64% 85.55%
Debt Ratio
90%
85% ~
- 80% ------c
~ ., " ~ ., 75% n. ....
70%
65% 2000 2001 2002 2003 2004
Year
-
Fig-13: Debt ratio
Comments:
Transcom's debt ratio was 85.6 % in 2004, and it was also more than 73% for the past
three years. This means that its creditors have supplied the maximum amount of funds of
the firm ' s total financ ing. The cost of financing has been increasing each year because
the average debt ratio of the firm is 80% and it is still increasing. Transcom might find
difficulty to borrow additional debt in future and there might be a chance of bankruptcy
in the long run.
Page 50 of64
8.5.2 Times interest Earned
A useful measure of profit that does not link return to resources is the times interest
earned ratio. It is calculated by dividing the firm's operating income by the interest that it
must pay on its debt:
Operating income
Times interest earned = ----------------------------------
Interest
[t relates operating profits to the fixed charges created by the firm's borrowing.
The times interest earned ratio provides an indication of the margin of safety between
financial obligations and the net income. A firm may have an operating profit but may
face difficulty in making excessive interest payments. If it is confronted by a drop in
operating profits, it may be unable to meet its debt obligations. In either case, its net
income will decline or vanish. A satisfactory guideline for this ratio is that EB[T should
be 5 to 7 times interest charges. Thus, a firm could experience an- 80 to 86 percent drop
in EBIT and still cover interest payments
Page 51 of64
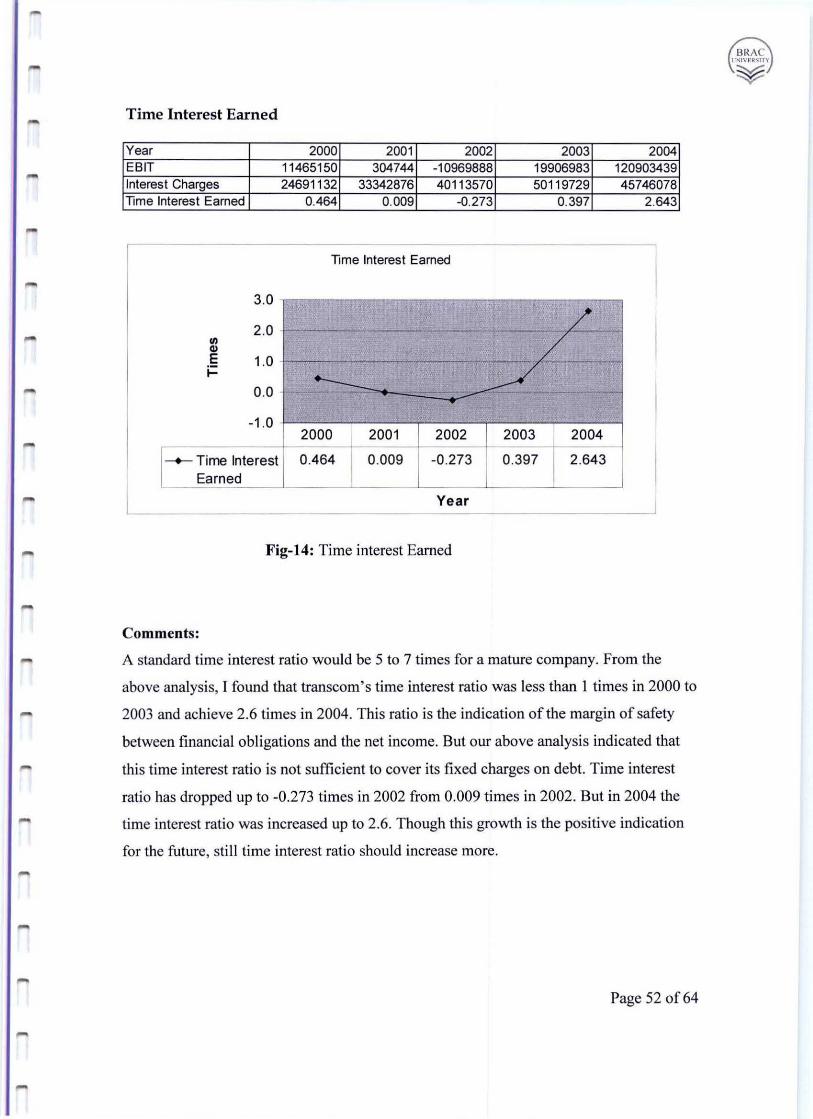
Time Interest Earned
Year 2000 2001 2002 2003 2004 EBIT 11465150 304744 -10969888 19906983 120903439 Interest Charges 24691132 33342876 40113570 50119729 45746078 Time Interest Earned 0.464 0.009 -0.273 0.397 2.643
Time Interest Earned
3.0
/ 2.0 -(/) / 41 E 1.0 -i= L _
0.0 ~ --....--1.0
2000 2001 2002 2003 2004
-+- Time Interest 0.464 0.009 -0.273 0.397 2 .643 Ea rned
Year
Fig-14: Time interest Earned
Comments:
A standard time interest ratio would be 5 to 7 times for a mature company. From the
above analysis, I found that transcom's time interest ratio was less than 1 times in 2000 to
2003 and achieve 2.6 times in 2004. This ratio is the indication of the margin of safety
between financial obligations and the net income. But our above analysis indicated that
this time interest ratio is not sufficient to cover its fixed charges on debt. Time interest
ratio has dropped up to -0.273 times in 2002 from 0.009 times in 2002. But in 2004 the
time interest ratio was increased up to 2.6. Though this growth is the positive indication
for the future, still time interest ratio should increase more.
Page 52 of64
BRAe 1IN I V"II~ln
¥
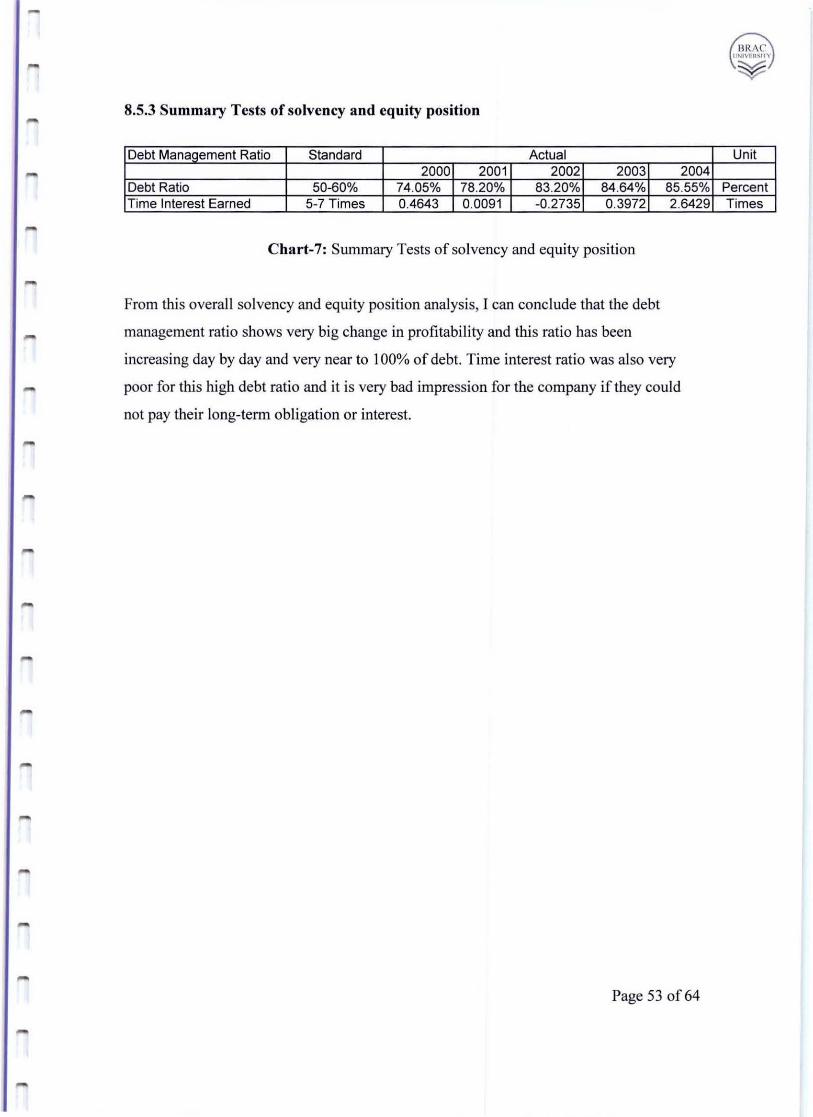
8.5.3 Summary Tests of solvency and equity position
Debt Management Ratio Standard Actual 2000 2001 2002 2003 2004
Debt Ratio 50-60% 74.05% 78.20% 83.20% 84.64% 85.55% Time I nterest Earned 5-7 Times 0.4643 0.0091 -0.2735 0.3972 2.6429
Chart-7: Summary Tests of solvency and equity position
From this overall so lvency and equity position analysis, [ can conclude that the debt
management ratio shows very big change in profitability and this ratio has been
increasing day by day and very near to 100% of debt. Time interest ratio was also very
poor for this high debt ratio and it is very bad impression for the company if they could
not pay their long-term obligation or interest.
Page 53 of64
Unit
Percent Times
...,
9.0 Forecasted Future Performance
I have used Trend Analysis to forecast the future financial performance of Trans com
Electronics Limited up to the year of2009.
9.1 Current ratio
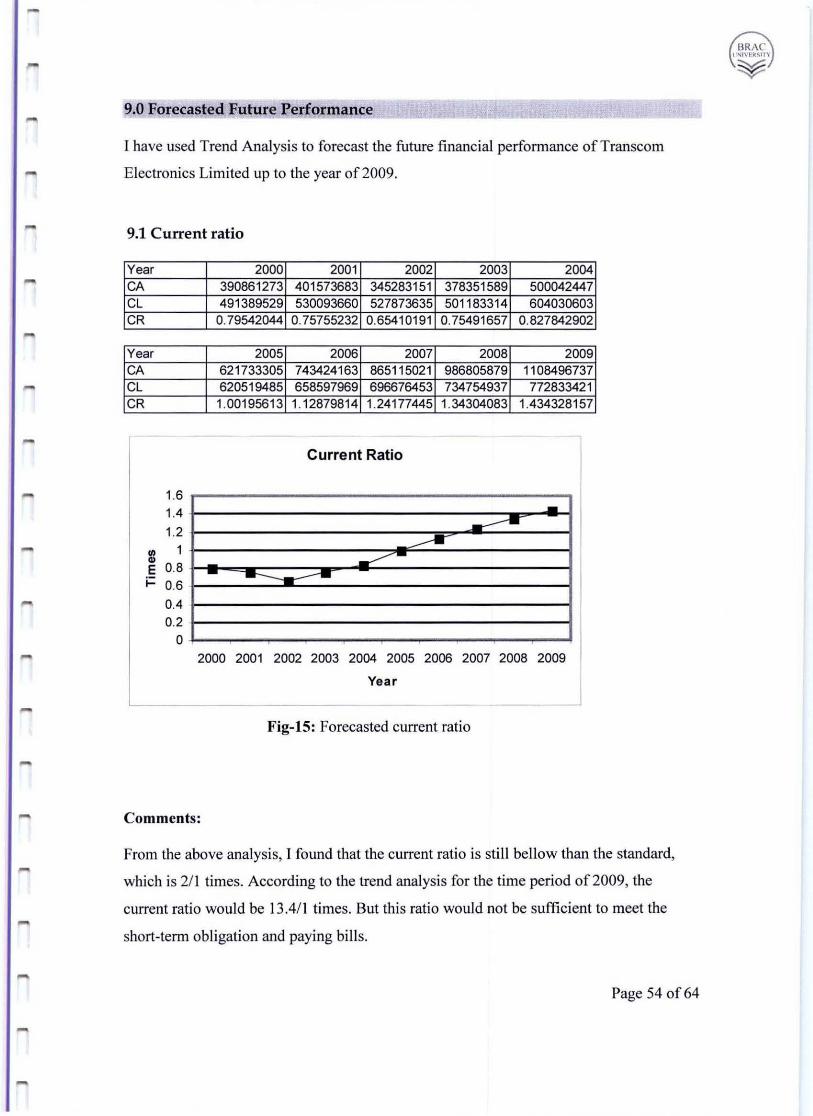
Year 2000 2001 2002 2003 2004 CA 390861273 401573683 345283151 378351589 500042447 CL 491389529 530093660 527873635 501183314 604030603 CR 0.79542044 0.75755232 0.65410191 0.75491657 0.827842902
Year 2005 2006 2007 2008 2009 CA 621733305 743424163 865115021 986805879 1108496737 CL 620519485 658597969 696676453 734754937 772833421 CR 1.00195613 1.12879814 1.24177445 1.34304083 1.434328157
Current Ratio
1.6 --...--:!: ...-------------
1.4 1.2
III 1 ., E 0.8 i= 0.6
0.4 0.2
0 2000 2001 2002 2003 2004 2005 2006 2007 2008 2009
Year
-
Fig-IS: Forecasted current ratio
Comments:
From the above analysis, I found that the current ratio is sti ll bellow than the standard,
which is 2/ 1 times. According to the trend analysis for the time period of2009, the
current ratio would be l3.41l times. But this ratio would not be sufficient to meet the
short-term obligation and paying bi lls.
Page 54 of64
....
....
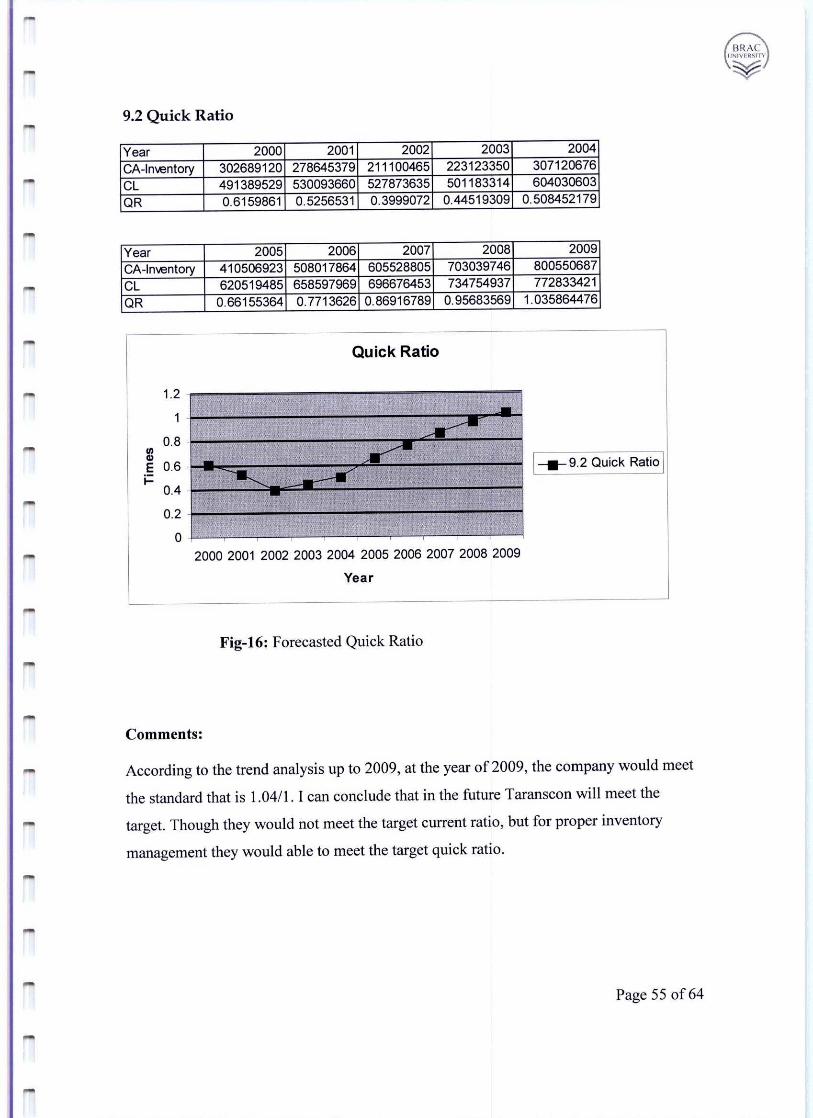
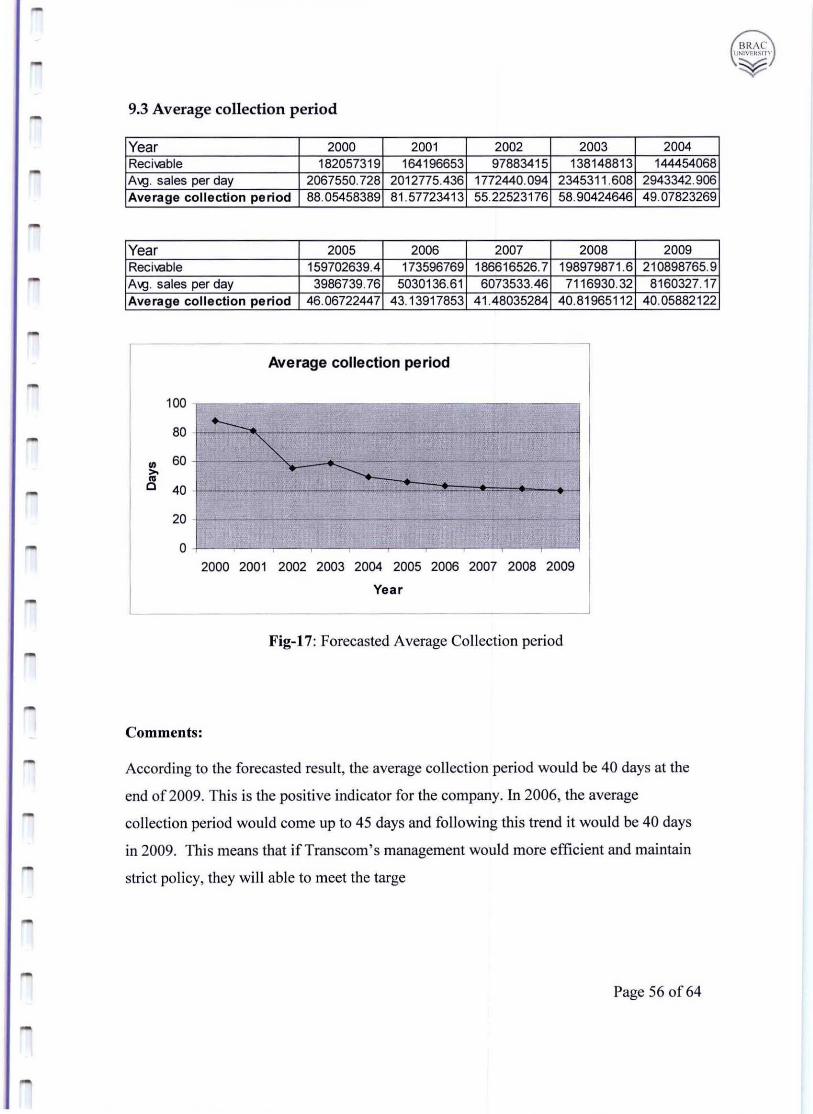
9.3 Average collection period
Year 2000 2001 2002 2003 2004 Recil.Gble 182057319 164196653 97883415 138148813 144454068 A;g . sales per day 2067550.728 2012775.436 1772440.094 2345311 .608 2943342.906 Average coll ection period 88.05458389 81 .57723413 55.22523176 58.90424646 49 .07823269
Year 2005 2006 2007 2008 2009 Recil.Gble 159702639.4 173596769 186616526.7 198979871.6 210898765.9 A;g. sales per day 3986739.76 5030136.61 6073533.46 7116930.32 8160327.17 Average collection pe riod 46.06722447 43.13917853 41.48035284 40 .81965112 40.05882122
Average collection period
100
80 - ----~ III 60 I- .-c- -- -- - - --~
>- .. '" c 40
20 -- ~--- -- -- ---- ----'
0 2000 2001 2002 2003 2004 2005 2006 2007 2008 2009
Year
Fig-I7 : Forecasted Average Collection period
Comments:
According to the forecasted result, the average collection period would be 40 days at the
end of 2009. This is the positive indicator for the company. In 2006, the average
collection period would come up to 45 days and fo llowing this trend it would be 40 days
in 2009. This means that if Transcom's management would more efficient and maintain
strict policy, they will able to meet the targe
Page 56 of64
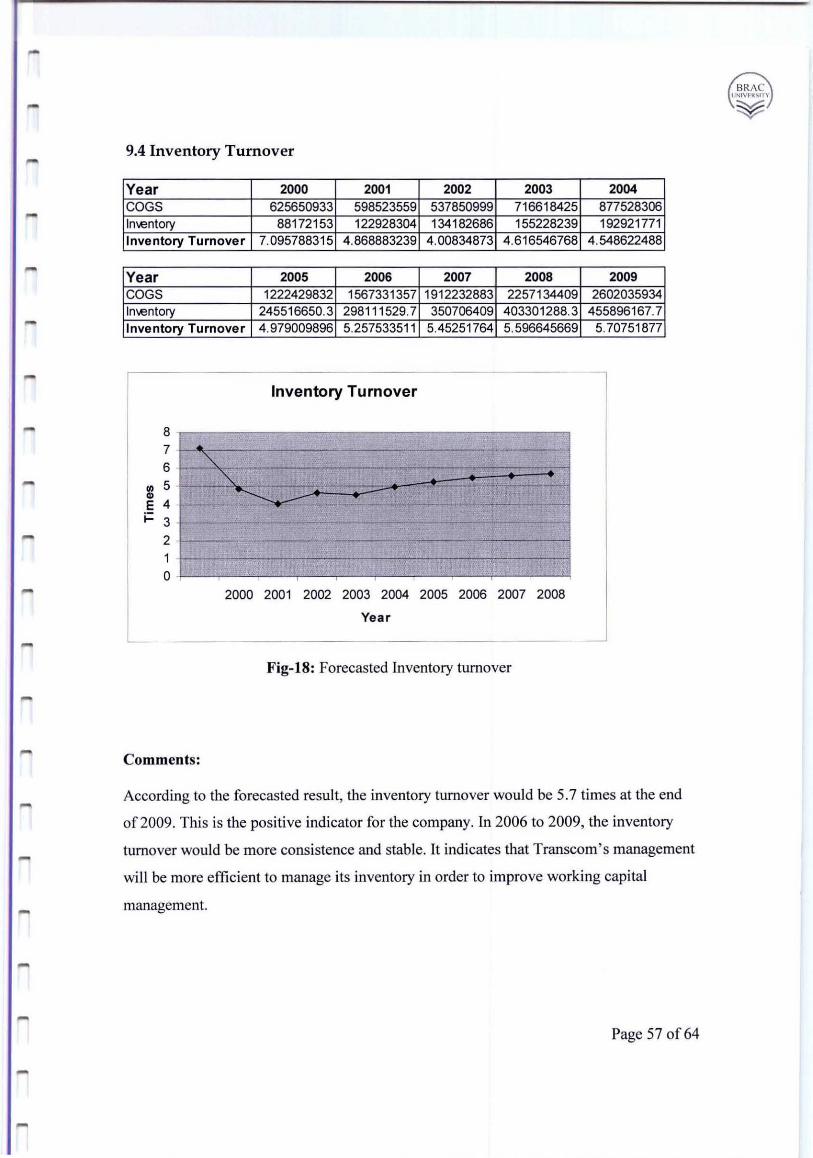
-
-
9.4 Inventory Turnover
Year 2000 2001 2002 2003 2004 COGS 625650933 598523559 537850999 716618425 877528306 Im.entory 88172153 122928304 134182686 155228239 192921771 Inventory Tu rnover 7.095788315 4.868883239 4.00834873 4 .616546768 4 .548622488
Year 2005 2006 2007 2008 2009 COGS 1222429832 1567331357 1912232883 2257134409 2602035934 Im.entory 245516650.3 298111529.7 350706409 403301288.3 455896167.7 Inve ntory Turnover 4.979009896 5.257533511 5.45251764 5.596645669 5.70751877
Inventory Turnover
8 7 6
II> 5
" E 4
.. "'-
"'-...............
.~ ..., -. -i= 3 f--- -- -- --- ~ -
2 .
1 0
2000 2001 2002 2003 2004 2005 2006 2007 2008
Year
Fig-i8: Forecasted Inventory turnover
Comments:
According to the forecasted result, the inventory turnover would be 5.7 times at the end
of2009. This is the positive indicator for the company. In 2006 to 2009, the inventory
turnover would be more consistence and stable. It indicates that Transcom' s management
will be more efficient to manage its inventory in order to improve working capital
management.
Page 57 of64
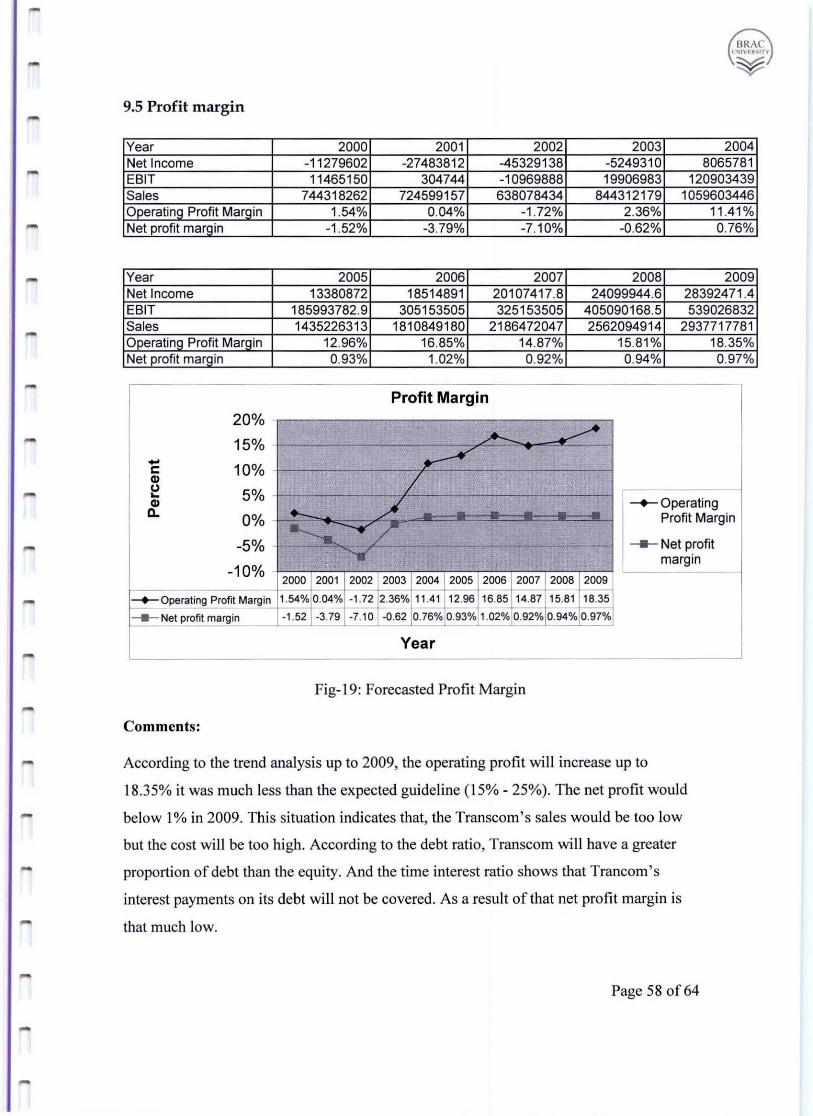
-
-
-
-
9.5 Profit margin
Year 2000 2001 2002 2003 2004 Net Income -11279602 -27483812 -45329138 -5249310 8065781 EBIT 11465150 304744 -10969888 19906983 120903439 Sales 744318262 724599157 638078434 844312179 1059603446 Operating Profit Margin 1.54% 0.04% -1 .72% 2.36% 11.41% Net profit margin -1.52% -3.79% -7 .10% -0.62% 0.76%
Year 2005 2006 2007 2008 2009 Net Income 13380872 18514891 20107417.8 24099944.6 28392471.4 EBIT 185993782.9 305153505 325153505 405090168.5 539026832 Sales 1435226313 1810849180 2186472047 2562094914 2937717781 Operating Profit Margin 12.96% 16.85% 14.87% 15.81 % 18.35% Net profit marQin 0.93% 1.02% 0.92% 0.94% 0.97%
Profit Margin 20%
15% - ~ :::.;.;+ ..¥' ...
.... ..-t: 10% / CI)
to) "- 5% -CI)
~ __ Operating
a. 0% - - Profit Margin
~ -.'/ -5% - - ---- --- - __ Net profit
-10% -margin
2000 2001 2002 2003 2004 2005 2006 2007 2008 2009
~ Operating Profit Margin 1.54% 0.04% -1.72 2.36% 11.41 12.96 16.85 14.87 15.81 18.35
___ Net profit margin -1.52 -3.79 -7.10 -0.62 0.76% 0.93% 1.02% 0.92% 0.94% 0.97%
Year
Fig- 19: Forecasted Profit Margin
Comments:
According to the trend analysis up to 2009, the operating profit will increase up to
18.35% it was much less than the expected guideline (15% - 25%). The net profit would
below 1 % in 2009. This situation indicates that, the Transcom's sales would be too low
but the cost will be too high. According to the debt ratio, Transcom wi ll have a greater
proportion of debt than the equity. And the time interest ratio shows that Trancom's
interest payments on its debt wi ll not be covered. As a result ofthat net profit margin is
that much low.
Page 58 of64
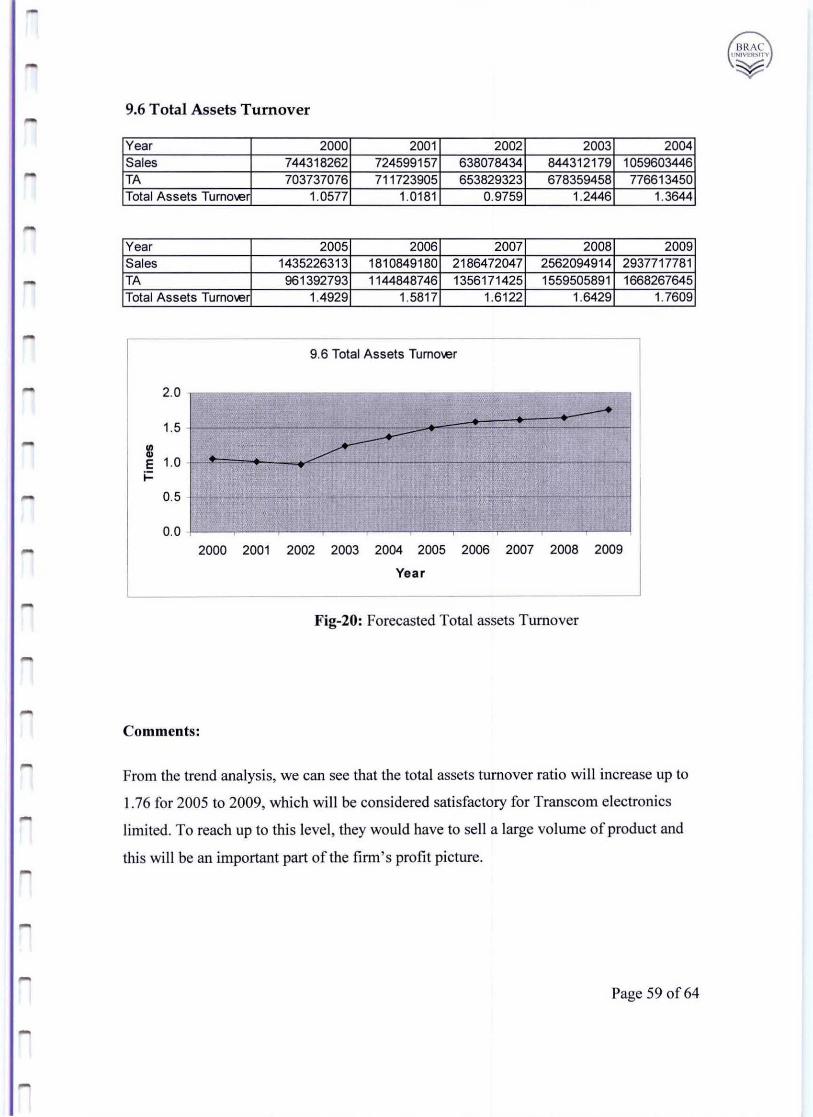
--
....
-
9.6 Total Assets Turnover
Year 2000 2001 2002 2003 2004 Sales 744318262 724599157 638078434 844312179 1059603446 TA 703737076 711723905 653829323 678359458 776613450 Total Assets Turnove 1.0577 1.0181 0.9759 1.2446 1.3644
Year 2005 2006 2007 2008 2009 Sales 1435226313 1810849180 2186472047 2562094914 2937717781 TA 961392793 1144848746 1356171425 1559505891 1668267645 Total Assets Turnove 1.4929 1.5817 1.6122 1.6429 1.7609
9.6 Total Assets Turnover
2.0 .... 1.5 - --8l 1.0 - A ~
E ~
i=
0.5 ----- .....
0.0 2000 2001 2002 2003 2004 2005 2006 2007 2008 2009
Year
Fig-20: Forecasted Total assets Turnover
Comments:
From the trend analysis, we can see that the total assets turnover ratio will increase up to
1.76 for 2005 to 2009, which will be considered satisfactory for Transcom electronics
limited. To reach up to this level, they would have to sell a large volume of product and
this will be an important part of the firm 's profit picture.
Page 59 of64
BRAe 1 1"I Vr.Il ~lT"
¥
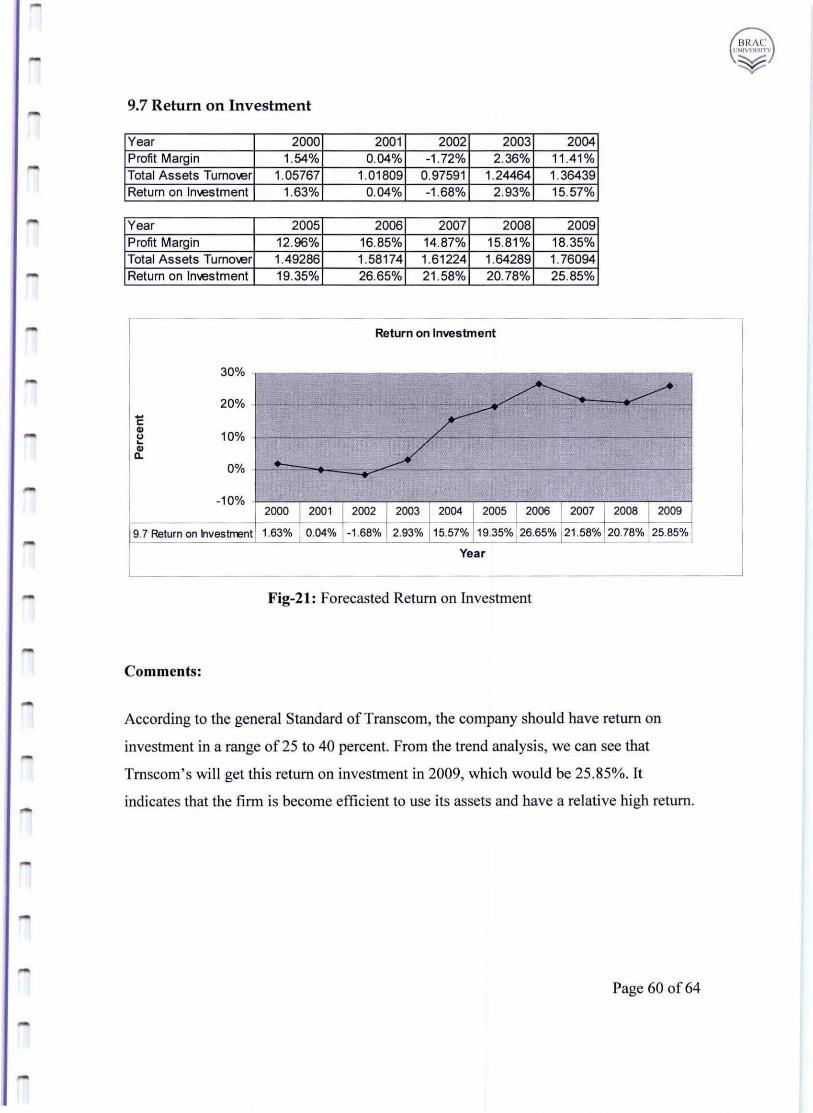
..,
.....
.....
.....
..,
9.7 Return on Investment
Year 2000 2001 2002 2003 2004 Profit Margin 1.54% 0.04% -1.72% 2.36% 11.41 % Total Assets Turnol.er 1.05767 1.01809 0.97591 1.24464 1.36439 Return on Inl.estrnent 1.63% 0.04% -1.68% 2.93% 15.57%
Year 2005 2006 2007 2008 2009 Profit Margin 12.96% 16.85% 14.87% 15.81% 18.35% Total Assets Turnol.er 1.49286 1.58174 1.61224 1.64289 1.76094 Return on Inl.estrnent 19.35% 26.65% 21.58% 20.78% 25.85%
Return on Investment
30% -
.~ 20% - -- - ~. ----' -" " 10% -0 ~
/ " Q. ... 0% . .... -10% -
2000 2001 2002 2003 2004 2005 2006 2007 2008 2009
9.7 Return on Investment 1.63% 0.04% -1.68% 2.93% 15.57% 19.35% 26.65% 21.58% 20.78% 25.85%
Year
Fig-21: Forecasted Return on lnvestment
Comments:
According to the general Standard of Transcom, the company should have return on
investment in a range of 25 to 40 percent. From the trend analysis, we can see that
Trnscom' s will get this return on investment in 2009, which would be 25 .85%. It
indicates that the firm is become efficient to use its assets and have a relative high return .
Page 60 of64
BRAe !,~tVf K~ln'
¥
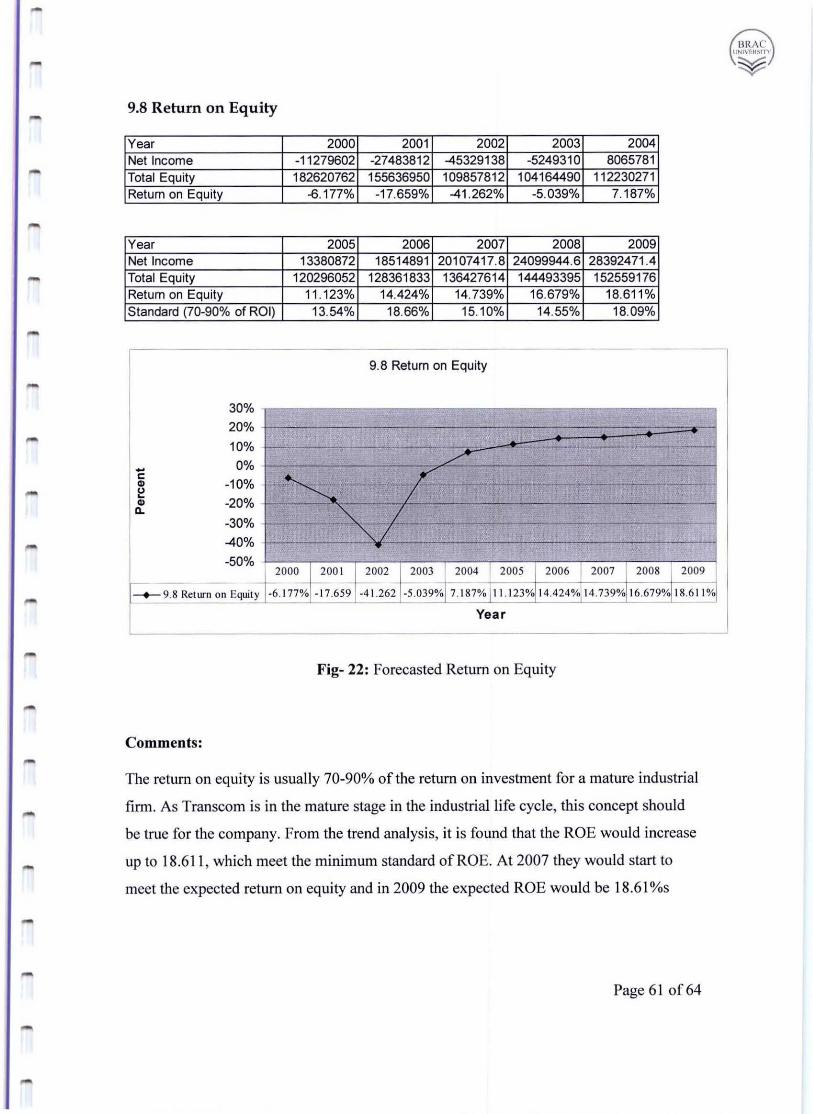
""'
9.8 Return on Equity
Year 2000 2001 2002 2003 2004 Net Income -11279602 -27483812 -45329138 -5249310 8065781 Total Equity 182620762 155636950 109857812 104164490 112230271 Return on Equity -6.177% -17.659% -41 .262% -5.039% 7.187%
Year 2005 2006 2007 2008 2009 Net Income 13380872 18514891 20107417.8 24099944.6 28392471.4 Total Equity 120296052 128361833 136427614 144493395 152559176 Return on Equity 11.123% 14.424% 14.739% 16.679% 18.611% Standard (70-90% of ROI) 13.54% 18.66% 15.10% 14.55% 18.09%
9.8 Return on Equity
30%
20%
10% -/" - 0%
~~ ~r c
" -10% - -~ -- - - - ~-
f::!
" -20% -D.
~/--30% - -- .. --40% -
-50% 2000 200 1 2002 2003 2004 2005 2006 2007 2008 2009
~ 9.8 Return on Equity -6.177% -17.659 -41.262 -5 .039% 7.187% 11.1 23% 14 .424% 14 .739% 16.679% 18.6 11 %
Year
Fig- 22: Forecasted Return on Equity
Comments:
The return on equity is usually 70-90% of the return on investment for a mature industrial
firm . As Transcom is in the mature stage in the industrial life cycle, this concept should
be true for the company. From the trend analysis, it is found that the ROE would increase
up to 18 .611, which meet the minimum standard of ROE. At 2007 they would start to
meet the expected return on equity and in 2009 the expected ROE would be 18.61 %s
Page 6 1 of64
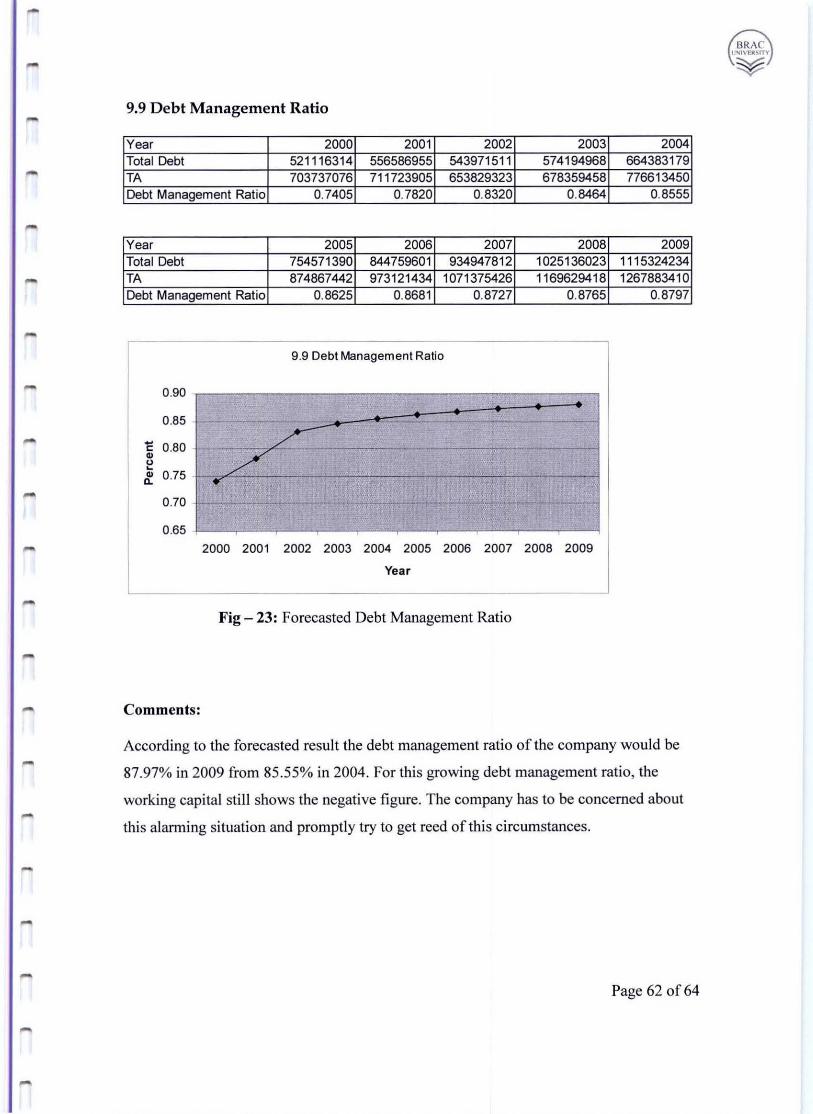
...
9.9 Debt Management Ratio
Year 2000 2001 2002 2003 2004 Total Debt 521116314 556586955 543971511 574194968 664383179 TA 703737076 71 1723905 653829323 678359458 776613450 Debt Management Ratio 0.7405 0.7820 0.8320 0.8464 0.8555
Year 2005 2006 2007 2008 2009 Total Debt 754571390 844759601 934947812 1025136023 1115324234 TA 874867442 973121434 1071375426 1169629418 1267883410 Debt Management Ratio 0.8625 0.8681 0.8727 0.8765 0.8797
9.9 Debt Management Ratio
0.90
0.85 -'---0.80 - 7 -~ I:
" U ~
" 0.75 -Q. ...
0.70 - T -0.65
2000 2001 2002 2003 2004 2005 2006 2007 2008 2009
Year
Fig - 23: Forecasted Debt Management Ratio
Comments:
According to the forecasted result the debt management ratio of the company would be
87.97% in 2009 from 85.55% in 2004. For this growing debt management ratio, the
working capital still shows the negative figure. The company has to be concerned about
this alarming situation and promptly try to get reed of this circumstances.
Page 62 of64
BRAe INIVl!II~ITY
¥
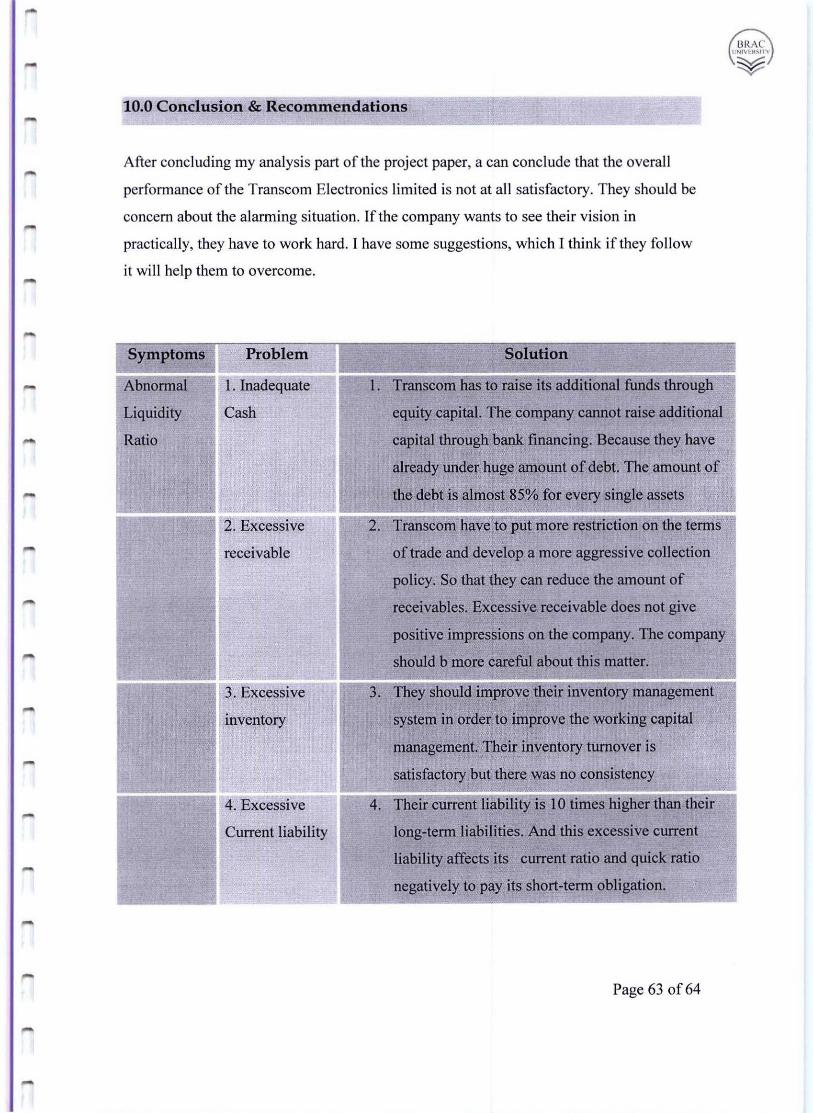
10.0 Conclusion & Recommendations
After concluding my analysis part of the project paper, a can conclude that the overall
perfonnance of the Transcom Electronics limited is not at all satisfactory. They should be
concern about the alanning situation. If the company wants to see their vision in
practically, they have to work hard. I have some suggestions, which I think if they follow
it will help them to overcome.
Symptoms Problem Solution
Al)normiil l. Inadequate 1. Transcom IiiiS to raise its additional funds through
Liquidity Cash equity capital. The company cannot raise additional
Ratio capital through bank financing. Because they have
already under huge amount of debt. The amount of
the debt is almost 85% for every single assets
2. Excessive 2. Transcom fiave to put more restriction on tfie terms
of trade and develop a more aggressive collection
policy. So that they can reduce the amount of
receivables. Excessive receivable does not give
positive impressions on the company. The company
should b more careful about this matter.
3. Excessive 3. ey sfiould improve ilieir inventory management
system in order to improve the working capital
management. Their inventory turnover is
satisfactory but there was no consistency
4. Their current liability is 10 times higher than their
Current liability long-term liabilities. And this excessive current
liability affects its current ratio and quick ratio
negatively to pay its short-term obligation.
Page 63 of64
BRAe l1NIVEII,ln'
¥
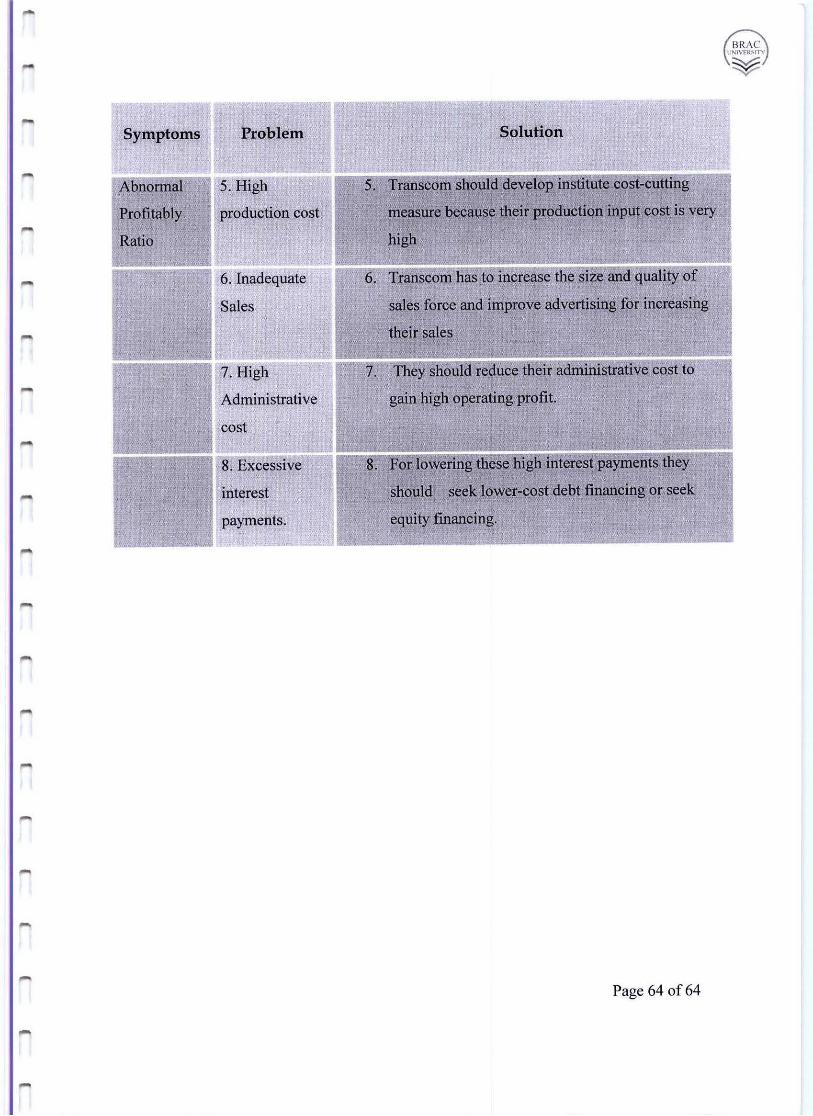
.-Symptoms Problem Solution
Abnonnal 5. High ==:;! .-
5. Transcom sliould-develop institute cost-cutting
Profitably production c ost measure because their production input cost is very
Ratio high .
6. Inadeq uat e 6. Transcom lias to increase the size and quality of
sales force and improve advertising for increasing
I their sales "1·
7. They sfioiild reduce their administratIVe cost to
ive gain high operating profit.
I
Excessive ....J -= 8. For lowering these high interest payments they
should seek lower-cost debt financing or seek
equity financing.
,...
Page 64 of64
Appendix
Reference
1. Scott Besley & Eugene F. Brigham, "Essentials of Managerial Finance" 12'h Edition, Printed by Harcourt College Publishers, 2000.
2. Anthony Saunders, "Financial Institutions Management: A Modern perspective" 2nd Edition, Published by Irwin! McGraw-Hill, 1997.
3. Lawrence J. Gitman, "Principal of Managerial Finance" 9th Edition, Published by Pearson Education, Inc., 2000.
4. www.transcombd.com
5. Five years (2000-2004) Annual report of Transcom.
BRAe UNIVERSITY
¥
Related Documents