Copyright © 2017 by the American Psychosomatic Society. Unauthorized reproduction of this article is prohibited. Perceived Discrimination and Longitudinal Change in Kidney Function Among Urban Adults May A. Beydoun, PhD, MPH 1 ; Angedith Poggi-Burke, MPH 1 ; Alan B. Zonderman, PhD 1 ; Ola S. Rostant, PhD 1 ; Michele K. Evans, MD 1 ; Deidra C. Crews, MD, ScM 2,3 1 Laboratory of Epidemiology and Population Sciences, National Institute on Aging, National Institutes of Health, Baltimore, MD; 2 Division of Nephrology, Department of Medicine, Johns Hopkins University School of Medicine, Baltimore, MD; 3 Welch Center for Prevention, Epidemiology and Clinical Research, Johns Hopkins Medical Institutions, Baltimore, MD. Corresponding author: Deidra C. Crews, MD, ScM Johns Hopkins University School of Medicine 301 Mason F. Lord Drive, Suite 2500 Baltimore MD 21224 E-mail: [email protected] Short running head: Discrimination and Kidney Function Decline Disclosure statement: The authors declare no conflict of interest. ACCEPTED Psychosomatic Medicine Publish Ahead of Print DOI: 10.1097/PSY.0000000000000478

Welcome message from author
This document is posted to help you gain knowledge. Please leave a comment to let me know what you think about it! Share it to your friends and learn new things together.
Transcript

Copyright © 2017 by the American Psychosomatic Society. Unauthorized reproduction of this article is prohibited.
Perceived Discrimination and Longitudinal Change in Kidney Function
Among Urban Adults
May A. Beydoun, PhD, MPH1; Angedith Poggi-Burke, MPH1; Alan B. Zonderman, PhD1;
Ola S. Rostant, PhD1; Michele K. Evans, MD1; Deidra C. Crews, MD, ScM2,3
1Laboratory of Epidemiology and Population Sciences, National Institute on Aging, National
Institutes of Health, Baltimore, MD;
2Division of Nephrology, Department of Medicine, Johns Hopkins University School of
Medicine, Baltimore, MD;
3Welch Center for Prevention, Epidemiology and Clinical Research, Johns Hopkins Medical
Institutions, Baltimore, MD.
Corresponding author:
Deidra C. Crews, MD, ScM
Johns Hopkins University School of Medicine
301 Mason F. Lord Drive, Suite 2500
Baltimore MD 21224
E-mail: [email protected]
Short running head: Discrimination and Kidney Function Decline
Disclosure statement: The authors declare no conflict of interest.
ACCEPTED
Psychosomatic Medicine Publish Ahead of PrintDOI: 10.1097/PSY.0000000000000478

Copyright © 2017 by the American Psychosomatic Society. Unauthorized reproduction of this article is prohibited.
ABSTRACT
Objective: Perceived discrimination has been associated with psychosocial distress and adverse
health outcomes. We examined associations of perceived discrimination measures with changes
in kidney function in a prospective cohort study, the Healthy Aging in Neighborhoods of
Diversity Across the LifeSpan. Methods: Our study included 1,620 participants with preserved
baseline kidney function (estimated glomerular filtration rate (eGFR) ≥60 ml/min/1.73m2) (662
Whites and 958 African-Americans (AA), aged 30-64 years). Self-reported perceived racial
discrimination (PRD) and perceived gender discrimination (PGD) and a general measure of
experience of discrimination (EOD) [“Medium vs. low”, “High vs. low”] were examined in
relation to baseline, follow-up and annual rate of change in eGFR using multiple mixed-effects
regression (γbase, γrate) and OLS models (γfollow). Results: Perceived gender discrimination “High
vs. Low PGD” was associated with a lower baseline eGFR in all models (γbase=-3.51(1.34),
p=0.009 for total sample). Among White women, High EOD was associated with lower baseline
eGFR, an effect that was strengthened in the full model (γbase=-5.86(2.52), p=0.020). Overall,
“High vs. Low” PGD was associated with lower follow-up eGFR (γfollow=-3.03(1.45), p=0.036).
Among AA women, both PRD and PGD were linked to lower follow-up kidney function, an
effect that was attenuated with covariate adjustment, indicating mediation through health-related,
psychosocial and lifestyle factors. In contrast, EOD was not linked to follow-up eGFR in any of
the sex by race groups. Conclusions: Perceived racial and gender discrimination are associated
with poor kidney function assessed by glomerular filtration rate and the strength of associations
differ by sex and race groups. Perceived discrimination deserves further investigation in
psychsocial risk factors for kidney disease.
Key words: Perceived discrimination, race, gender, urban adults, kidney function.
ACCEPTED

Copyright © 2017 by the American Psychosomatic Society. Unauthorized reproduction of this article is prohibited.
ABBREVIATIONS
AA=African-American
ACR=Albumin:creatinine ratio
CKD=Chronic Kidney Disease
BMI= Body Mass Index
CES-D= Center for Epidemiologic Studies-Depression
EDS=Elevated Depressive Symptoms
eGFR= Estimated Glomerular Filtration Rate
EOD= Experience of Discrimination
HANDLS=Health Aging in Neighborhoods of Diversity Across the LifeSpan
OLS=Ordinary Least Square
PRD=Perceived Racial Discrimination
PGD=Perceived Gender Discrimination
ACCEPTED

Copyright © 2017 by the American Psychosomatic Society. Unauthorized reproduction of this article is prohibited.
INTRODUCTION
Chronic kidney disease (CKD) is a public health problem affecting 13% of US adults. (1)
Clinical factors, such as hypertension and diabetes, and genetic factors (2) do not fully explain
CKD burden. Therefore, attention has been recently paid to other social, economic, and
psychosocial factors which may underlie kidney function decline.(3, 4) Among psychosocial
factors, perceived discrimination (general experience of discrimination (EOD), race/ethnicity-
related (PRD) or gender-related discrimination (PGD)) has been linked to adverse health
outcomes, possibly through stress-related pathways, including hypertension, cardiovascular
disease, poor general health status, and mental illness.(5) Stress is a condition whereby
environmental factors tax or exceed the adaptive capacity of individuals to a point where
psychological and physiological responses may place them at risk for disease.(6) Studies of
stressors and their relation to pathophysiology have revealed alterations in blood pressure, heart
rate and vascular reactivity in response to acute stress.(7-10)
These links suggest that adverse health outcomes are influenced by perceived racial
discrimination (11-29) and in other instances by perceived gender discrimination (PGD). (13, 15,
16, 20-23, 30) Nevertheless, in one earlier study, reporting no or low discrimination had an
unexpected positive relationship with worse health outcomes, such as hypertension, specifically
among African-American women. (13) Thus, the direction of the association between perceived
discrimination is still debated, particularly within different socio-demographic strata, such as sex
and race.
ACCEPTED

Copyright © 2017 by the American Psychosomatic Society. Unauthorized reproduction of this article is prohibited.
To our knowledge, there have been no empirical studies of the relation of perceived
discrimination and kidney function. Therefore, we examined the associations of PRD, PGD and
EOD with longitudinal kidney function change in a bi-racial socioeconomically diverse sample
from Baltimore City, Maryland, and tested differential associations by sex and race.
METHODS
Study Design
Initiated in 2004, The Healthy Aging in Neighborhoods of Diversity across the Life Span
(HANDLS) study is an ongoing prospective cohort study focused on the cardiovascular and
cognitive health of a socioeconomically diverse sample of African Americans and Whites
(baseline age: 30-64y), residing in Baltimore, Maryland. Race was self-reported in answer to the
question: Please look at this card and tell me which category best describes you. Are you:
1. White; 2. Black/African American; 3. American Indian or Alaska Native;
4. Asian; 5. Native Hawaiian or other Pacific Islander; 6. Some other race? Only
those with self-described race of white or African American were eligible for the HANDLS
study. Briefly, thirteen neighborhoods were selected using an area probability sampling
methodology as detailed elsewhere.(31) Phase 1 consisted of screening, recruitment, and
household interviews, while phase 2 collected more extensive data in a mobile Medical Research
Vehicle (MRV). The present study uses baseline visit 1 (2004-2009) and the first follow-up visit
2 (2009-2013), with mean follow-up time of ~5y.
All participants provided written informed consent, after accessing a protocol booklet in
layman's terms and a video detailing all procedures and future re-contacts. HANDLS study was
ACCEPTED

Copyright © 2017 by the American Psychosomatic Society. Unauthorized reproduction of this article is prohibited.
ethically approved by National Institute on Environmental Health Sciences, National Institutes of
Health, Institutional Review Board.
Participants
Of 3720 total baseline HANDLS participants initially selected with complete Phase 1 of
visit 1 data (i.e. home visit), 2,743 had complete data on estimated glomerular filtration rate
(eGFR) at either visit measured on the MRV (Phase 2, visit 1), while 1,993 had complete eGFR
data at both baseline and follow-up (N=750 at baseline only). We further excluded participants
with missing data on PRD/PGD/EOD (n=63) or with baseline eGFR<60 ml/min/1.73m2 (N=84).
Of the remaining participants (N=1,846) with preserved kidney function, those with missing data
on any of the covariates entered into the model were excluded (i.e. complete case analysis; N=68
missing on hypertension or diabetes, an additional N=125 missing on smoking/drug use, an
additional N=35 missing on elevated depressive symptoms status at baseline and an additional
N=2 missing on education) yielding a final sample size of N=1,616. Compared to the HANDLS
cohort that was not selected, our selected sample included a higher proportion who did not live in
poverty and more females (P<0.05); though no age or race differences were detected. This
sample selectivity was accounted for in the analysis through a 2-stage Heckman selection model
as discussed in the Statistical Analysis section.
Perceived Racial Discrimination
Baseline PRD was measured using an adapted 9-item Discrimination Scale of the
Experience of Discrimination (EOD) questionnaire, (13) and two global PRD items(32)
(Supplemental Digital Content 1, http://links.lww.com/PSYMED/A393), eliciting perceived
ACCEPTED

Copyright © 2017 by the American Psychosomatic Society. Unauthorized reproduction of this article is prohibited.
discrimination because of race, ethnicity/culture on a 4-point Likert scale („not at all‟ to „a lot‟).
The five PRD binary (yes/no) situations from the EOD were racial discrimination at school,
getting a job, at work, getting housing, and getting medical care. The sum of the five situational
items (range: 5-10), and that of the two global items (range:2-8), were entered as two measured
variables in a factor analysis with one common factor being extracted and predicted using the
regression method. The predicted factor (z-score) was then grouped into the following
categories: “Low PRD” (factor score<0), “Medium PRD” (factor score: 0-1) and “High PRD”
(factor score >1).
Perceived Gender Discrimination
Similarly, PGD included one global item measured on a 4-point Likert scale („not at all‟
to „a lot‟) and 5 binary “yes/no” items, namely: “Have you ever experienced discrimination, or
has anyone stopped you from doing something, hassled you, or made you feel inferior because of
your gender?” in five distinctive situations: at school, getting a job, at work, at home, or when
getting medical care?, with a total score range of 5-10.(13, 33) Using a similar approach, a factor
analysis was conducted to combine the global measure with the situational measures that were
also summed. The common factor was predicted and categorized as: “low PGD” (<0), “Medium
PGD” (0-1) and “High PGD” (>1). The correlation between the sum of global PGD items and
the sum of situational PGD items was 0.49, while that of global vs. situational PRD items was
0.54. The factor score for PGD were highly correlated with each sum of items (r=0.87 (factor
score vs. global), r=0.86 (factor score vs. situational). Those correlations were both 0.88 for
PRD. Cronbach‟s α, assuming we are summing up items for each scale, were 0.79 and 0.67, for
PRD and PGD, respectively. In addition to using the final factor score in the main analysis,
ACCEPTED

Copyright © 2017 by the American Psychosomatic Society. Unauthorized reproduction of this article is prohibited.
summation of the items of PRD and PGD was also used as a continuous outcome in a small
portion of the analysis.
Experience of discrimination (EOD)
Perceived discrimination was also measured using the EOD.(34, 35) The 9-item EOD
measures the everyday experiences of unfair treatment and is by far the most commonly used
scale in previous studies. This measure asks respondents „how often in your day-to-day life have
the following things happened to you?‟ (e.g. “You are treated with less courtesy”; “You are
treated with less respect”; “You get worse service at restaurants and stores”; “People act as if you
are not smart”; “People act as if they are afraid of you”; “People act as if they think you are
dishonest”) on a Likert response scale (1 (never), 2 (less than once a year), 3 (a few times a
year), 4 (a few times a month), 5 (at least once a week) and 6 (almost every day). Items were
reverse coded so higher scores reflect more everyday discrimination (Cronbach‟s α = .84 and
item-total correlations ranging from 0.54-0.77).
A similar factor analytic approach was carried out whereby each of the 9 items were
entered as measured variables and one factor was extracted. This common factor was then
predicted and categorized in a similar fashion as for PRD and PGD (“Low EOD” (factor
score<0), “Medium EOD” (factor score: 0-1) and “High EOD” (factor score>1). In addition to
using the final factor score in the main analysis, summation of the items of EOD was also used
as a continuous outcome in a small portion of the analysis.
ACCEPTED

Copyright © 2017 by the American Psychosomatic Society. Unauthorized reproduction of this article is prohibited.
Kidney Function
Our primary outcomes were baseline, annual rate of change and follow-up estimated
glomerular filtration rate (eGFR). Using participant fasting venous blood specimens, baseline
serum creatinine was measured at the National Institute on Aging, Clinical Research Branch
Core Laboratory, using a modified kinetic Jaffe method (CREA method, Dade Dimension X-
Pand Clinical Chemistry System, Siemens Healthcare Diagnostics Inc., Newark, DE) for a small
group of participants (n=88); while the majority of participants (n=1,528) had baseline serum
creatinine analyzed at Quest Diagnostics, Inc. by isotope dilution mass spectrometry (IDMS)
(Olympus America Inc., Melville, NY) and standardized to the reference laboratory, Cleveland
Clinic. While inter-assay coefficients of variation (CV) for this sample could not be calculated
due to the use of only one or the other measurement of creatinine at baseline, only intra-assay
CVs (mean/SD) could be estimated and those were 0.192 and 0.187 for the CREA and the IDMS
methods, respectively. All follow-up serum creatinine concentrations were measured using
IDMS at Quest Diagnostics, Inc.
For participants having spot urine data, micro-albumin concentration was measured at
Quest Diagnostics, Inc. using an immunoturbimetric assay (Kamiya Biomedical Co., Seattle,
WA). Estimated GFR was calculated using the CKD Epidemiology Collaboration equation(36),
truncating values at 150 mL/min/1.73 m2 (37). Urine albumin-to-creatinine ratio (ACR) was
estimated and included in a sensitivity analysis, due to its appreciable missingness from the
selected sample (>10%).
ACCEPTED

Copyright © 2017 by the American Psychosomatic Society. Unauthorized reproduction of this article is prohibited.
Covariates
Age, sex, race (White or AA), completed years of education, poverty status (household
income less than 125% of 2004 Department of Health and Human Services guideline) (38),
marital status, current cigarette smoking, illicit drug use and self-rated health were self-reported
at baseline. Baseline diabetes mellitus status combined fasting serum glucose concentration ≥126
mg/dL, self-reported diabetes, and/or prescription diabetic medication. Using two sitting blood
pressure measurements, with brachial artery auscultation and an inflatable cuff,(39) hypertension
was defined as the average of two systolic or diastolic blood pressures ≥ 140 mm Hg or ≥ 90 mm
Hg, respectively, or self-reported hypertension, or anti-hypertensive medication prescription.
Body mass index (BMI) was calculated as weight over height-squared (kg/m2). Elevated
depressive symptoms (EDS) were defined as ≥16 score on the 20-item Center for Epidemiologic
Studies-Depression (CES-D) scale.(40, 41)
Statistical Analysis
Bivariate associations of PRD and PGD with each of the baseline covariates were tested
using one-way ANOVA from a bivariate ordinary-least-square (OLS) regression model for
continuous variables and χ2 tests of independence for categorical variables. Similarly, we
compared means of baseline, follow-up and annual rates of change in eGFR across PRD and
PGD, stratifying by sex×race.
We used mixed-effects linear regression models to examine associations of baseline PRD
and PGD (high vs. low) with eGFR (baseline and annual rate of change), controlling for key
confounders. To account for non-random participant selection by age, sex, race and poverty
ACCEPTED

Copyright © 2017 by the American Psychosomatic Society. Unauthorized reproduction of this article is prohibited.
status, in each mixed-effect regression model, we conducted a 2-stage Heckman selection
process, as described elsewhere.(42, 43) In the basic model, we estimated the alternative
associations of PRD and PGD with baseline and annual rate of change in eGFR, adjusting slopes
and intercepts for age, sex and race (Model 1). Moving forward, we adjusted for factors that
were considered modifiable socio-economic, lifestyle and health-related. While some can be
considered potential confounders, others such as health-related factors are often the result of
lifestyle and socio-economic factors as well as psychosocial factors, and thus may be mediating
the effect of perceived discrimination on kidney function outcomes. Therefore, a stepwise
adjustment was used in order to examine the potential omnibus effect of adding several groups of
variables into the models in a cumulative manner. In Model 2, we further adjusted Model 1 for
poverty status, education and marital status (i.e. in addition to age, sex, and race); in Model 3, we
adjusted Model 2 for current smoking and illicit drug use, self-rated health, BMI and EDS; with
Model 4 controlling Model 3 further for diabetes and hypertensive status. We added interaction
terms and stratified by sex and race, because AAs report greater PRD(44) and reactions to
psychological stressors differ by gender(45). Predictive margins of eGFR from stratified mixed-
effects regression models were selectively plotted across time to illustrate key findings. Finally,
we conducted OLS regression models, evaluating PRD and PGD‟s independent associations with
follow-up eGFR. Thus, two types of longitudinal analyses were conducted. While the first
method investigates whether discrimination has a potential effect on the rate of change in kidney
function, the second method investigates the effect of baseline discrimination on the level of
kidney function 5 years later. A type I error of 0.05 was considered in all analyses which were
conducted using Stata version 13 (StataCorp, College Station, TX). A sensitivity analysis is
presented and discussed in Supplemental Digital Content 2
ACCEPTED

Copyright © 2017 by the American Psychosomatic Society. Unauthorized reproduction of this article is prohibited.
(http://links.lww.com/PSYMED/A394) whereby ACR was included in Model 5, after
excluding all participants with missing data on ACR. In a second sensitivity analysis (data not
reported), the method/laboratory used for creatinine measurement was added as an additional
covariate in all models and results of the full models were compared. In a third sensitivity
analysis (data not reported), the 1,846 individuals with complete data on eGFR at both visits
were selected, by including a category for missing (e.g. missing=“9”). Depressive symptoms
were categorized as (0:<16, 1:≥16, 9:missing).
RESULTS
Baseline Study Characteristics by EOD groups
Overall, participants‟ mean age was 48 years; 59% were AA; 41% were male. High PRD
was reported by 13.7%, High PGD by 11.3% and High EOD by 15.2%. Both PRD and PGD
factor scores (See factor analysis in methods section) had a positive and linear association with
EOD tertiles. A larger proportion of AA men was found among participants with High EOD as
opposed to low EOD (35.1% vs. 21.6%). High EOD was also associated with a higher proportion
below poverty, poor/fair self-rated health, current smoking, current illicit drug use and elevated
depressive symptoms. Overall, there was only a marginally significant higher mean baseline
eGFR in the “High EOD” as opposed to the “low EOD” group. No linear trend was detected
between EOD and the prevalence rates of hypertension and diabetes, the distribution in
educational level and marital status or in mean BMI (Table 1)
ACCEPTED

Copyright © 2017 by the American Psychosomatic Society. Unauthorized reproduction of this article is prohibited.
Baseline, follow-up and annual rate of change in eGFR by PRD, PGD and EOD groups
Overall, the mean annual rate of change in eGFR was estimated at -0.10 units/year, with a
standard deviation of 3.35 (range: -18.7;+17.1). “High PRD” was associated with a faster rate of
decline in eGFR among AA women as compared with “Low PRD”. (Figure 2A) In contrast,
PGD and EOD were not associated with the rate of change in eGFR in any of the sex by race
groups (Figure 2C-2D).
When examining baseline and follow-up eGFR (overall means±SD: 101.64±19.11 and
101.32±20.16, respectively), among AA women, High PRD (vs. Low PRD) and High PGD (vs.
Low PGD) were both associated with lower follow-up eGFR (Figure 1A-1B). In contrast, “High
EOD” was linked to higher eGFR among both AA women (baseline) and White men (baseline
and follow-up), when compared with “Low EOD” (Figure 1C).
Unadjusted association between PRD/PGD/EOD summation scores and key outcomes
Table S1 shows the unadjusted correlations between outcome measures and key
exposures, overall and stratifying simultaneously by sex and race. Although most correlation
coefficients were weak (<0.3), statistical significance was observed for AA women, whereby the
PRD summation score was inversely related to baseline, follow-up and annual rate of change in
eGFR. PGD among AA women was also inversely related to two of three outcomes, namely
baseline and follow-up eGFR. This is in stark contrast with the EOD summation score which
showed a positive association with baseline and follow-up eGFR, overall and among White men.
Finally, the EOD summation score was also positively associated with baseline eGFR among AA
women.
ACCEPTED

Copyright © 2017 by the American Psychosomatic Society. Unauthorized reproduction of this article is prohibited.
Net associations between PRD/PGD and EOD with baseline and annual rate of change in
eGFR
In mixed effects regression models examining the net effect of PRD and PGD on eGFR
(baseline and annual rate of change), In the total sample, “High vs. Low PGD” was associated
with a lower baseline eGFR in all models (full model: PGD effect: -3.51(1.34), p=0.009), an
effect restricted to Whites. (Table 2)
Other key findings emerged in the sex and race-stratified mixed-effects regression
models with EOD (Table 3). Specifically, among White women, High EOD was associated with
lower baseline eGFR, an effect that was strengthened in the full model (full model: EOD effect -
5.86(2.52), p=0.020). Among White men, high EOD was linked to a marginally significant faster
decline in eGFR in Model 1, which was fully attenuated by socio-economic factors in Model 2.
PRD/PGD and EOD and their adjusted associations with follow-up eGFR
Our sequential OLS models with alternative predictors PRD and PGD (Supplemental
Digital Content 2, Table S2, http://links.lww.com/PSYMED/A394) indicated that, overall,
“High vs. Low” PGD was associated with lower follow-up eGFR (full model: PGD effect: -
3.03(1.45), p=0.036). “Medium vs. Low PRD” was specifically positively associated with eGFR,
indicating better kidney function, among White men in Model 3 (PRD effect: +4.33(2.07),
p=0.037), an effect attenuated with adjustment for hypertension and diabetes status (PRD effect:
+4.09(2.08), p=0.050). Among AA women, both PRD and PGD were linked to lower kidney
function at follow-up, an effect that was attenuated systematically between Models 2 and 4,
indicating an effect of health-related (e.g. self-rated health, BMI, hypertension and diabetes),
ACCEPTED

Copyright © 2017 by the American Psychosomatic Society. Unauthorized reproduction of this article is prohibited.
psychosocial (depressive symptoms) and lifestyle factors (smoking and drug use). In contrast,
EOD was not linked to follow-up eGFR in any of the sex by race groups (Table S3). A few
marked changes were observed in the sensitivity analysis in the sample with complete ACR,
mostly due to a reduced overall sample size (n=1,158) (Supplemental Digital Content 2,
Tables S4-S7, http://links.lww.com/PSYMED/A394). In a second sensitivity analysis (data not
reported), the method/laboratory used for creatinine measurement was restricted to Quest
Diagnostics, the most commonly used laboratory at both waves, and the only one used in the
follow-up wave (n=1,528 of 1,616). The results were not altered, as was the case for a third
sensitivity analysis of N=1,846 individuals with complete baseline and follow-up visit eGFR
(data not reported).
DISCUSSION
Within a biracial urban sample of adults in Baltimore City, Maryland, High PRD was
reported by 13.7%, High PGD by 11.3% and High EOD by 15.2%. Associations between
perceived discrimination and kidney function varied by race and sex groups. Among Whites,
High PGD was associated with a lower baseline eGFR. Among White women, High EOD was
associated with lower baseline eGFR. Overall, High PGD was associated with lower follow-up
eGFR. Notably, among AA women, both PRD and PGD were linked to lower kidney function at
follow-up, an effect which appeared mediated by health-related, psychosocial and lifestyle
factors. In contrast, EOD was not linked to follow-up eGFR in any of the sex by race groups.
Our findings of variation of assocations between perceived discrimination and kidney
function change across gender and race groups are consistent with nuanced findings of several
ACCEPTED

Copyright © 2017 by the American Psychosomatic Society. Unauthorized reproduction of this article is prohibited.
other studies, underscoring the complex effects of discrimination on health outcomes. (18, 21,
23-25) For example, in a large sample of Asian-American adults, perceived discrimination was
associated with adverse health outcomes among both men and women, with the strongest
association being with women‟s mental health. The threshold for an association of discrimination
with adverse health outcomes was also lower among women as compared to men.(17) Based on
the CARDIA study, the experience of 1 or 2 episodes of discrimination were only associated
with higher levels of inflammation (as measured by C-reactive protein) among AA women.
There were no such associations observed among men or White women.(19)
The findings of our study could have implications for the well-established race and
gender differences in kidney disease outcomes. For example, Whites have equal or greater
overall prevalence of reduced kidney function when compared to African Americans,(46)
however African Americans experience faster declines in kidney function,(47) and bear a greater
burden of advanced and end-stage renal disease (ESRD).(48) While few studies have examined
the intersectionality of race and gender in kidney disease, White women have been documented
to have greater overall prevalence of reduced kidney function,(49) as compared to women of
other race/ethnic groups, however, African American men(50) have the highest incident rate for
ESRD. Our study argues for closer examination of psychosocial stressors for their impact on
these differences.
Biologically speaking, chronic psychosocial stress may induce changes in
neuroendocrine, autonomic and immune systems(51), and perceived discrimination has been
linked with increased levels of oxidative stress,(52) a pathway through which allostatic load
ACCEPTED

Copyright © 2017 by the American Psychosomatic Society. Unauthorized reproduction of this article is prohibited.
(53)) may be transduced into chronic diseases (54). In fact, stress-induced allostatic load was
hypothesized to cause an epigenetically induced pro-inflammatory state, leading to an increased
risk for cardiovascular disease.(55) Moreover, both racial and gender differences in coping with
psychosocial stress, including discrimination, are important to consider, as they were detected in
various non-CKD samples, and coping strategies have been noted to vary among men and
women with CKD, with women showing a broader range of strategies that can buffer the effects
of stress. (56)
Perceived discrimination can lead to hopelessness and low self-efficacy,(57) affecting the
ability to self-manage one‟s health, perhaps differentially by gender and race.(58) For instance,
among hypertensive AAs, PRD was linked to lower medication adherence.(59) Another study
suggested lifetime discrimination was associated with medical care delays and nonadherence,
(60) a possible contributor to racial disparities in health, in general, and CKD progression in
particular. Similarly, education-related discrimination was linked to poorer glycemic control
among type 2 diabetes patients(61), while gender discrimination among women was linked to
non-adherence to mammography services.(30) Among CKD patients, lifetime discrimination
was associated with lower odds of desiring a kidney transplant, suggesting that patients with
significant prior exposure to discrimination do not want to risk new treatment situations, such as
transplantation, because they have a lower expectation of successful outcomes.(62) Using
longitudinal data obtained from the Study of Women‟s Health Across the Nation SWAN (n =
2063; mean age at baseline = 46.0),Upchurch et al. found that race and SES's total effect on
womnen's allostatic load was at least partially mediated by psychosocial factors such as
perceived discrimination, perceived stress and hostility.(29) Another recent study exploring the
ACCEPTED

Copyright © 2017 by the American Psychosomatic Society. Unauthorized reproduction of this article is prohibited.
association between perceived racism and ambulatory blood pressure among Hispanics, reported
that lower perceived racism was associated with ambulatory blood pressure non-dipping, a
cardiovascular risk factor, only among Black Hispanics. This reveals a coping mechanism among
this group that differs from White Hispanics.(63) In a third recent study examining heart rate
variability (HRV) across three racial groups (Black, brown and White) found a gradient
(Black>brown>Whites) in HRV that clearly mediated by perceived discrimination.(28)
Examining sleep quality outcomes, another recent study reported that perceived discrimination
mediated racial differences in most sleep quality measures, with nonWhite consistently showing
poor sleep outcomes compared to Whites.(27) Finally, a study of mutliple ethnic groups reported
that perceived ethnic discimination was positively associated with the metabolic syndrome
(MetS) that ethnic differences in MetS were partially explained by this discrimination measure.
(26)
Our study had limitations, including residual confounding, specifically by time-
dependent blood pressure, urinary albumin excretion and apolipoprotein L1 risk variants among
AAs. Third, perceived discrimination may have a different effect on kidney function decline
from personally mediated or internalized forms of racism or sexism, which we did not examine.
Fourth, kidney function decline was estimated only from two measures, while baseline ACR data
was incomplete. Fifth, significant declines in eGFR was a relatively rare event, with 45 (2.8%)
participants declining to an (e.g. eGFR<60 ml/min/1.73m2 at follow-up and 150 (9.3%) declining
to an eGFR between 60 and 90 ml/min/1.73m2,) which precluded examining the association of
perceived discrimination with the development of significantly reduced kidney function.. Related
to this limitation, our sample had limited kidney function decline in relation to the two main
ACCEPTED

Copyright © 2017 by the American Psychosomatic Society. Unauthorized reproduction of this article is prohibited.
exposures, yielding our finding of potentially limited clinical significance. Moreover, no valid
data was available on whether participants had received a diagnosis of or treatment for CKD.
Finally, given the sampling methodology and the large percentage of missing data between initial
screening, baseline and follow-up examinations, our study findings are generalizable only to
urban US adults. Thus, future studies should include geographically diverse samples, ideally
with multiple eGFR and ACR assessments and longer follow-up.
The limitations of our study are balanced by its longitudinal design and the elucidation of
a novel risk factor for kidney function decline. If validated in other studies, our findings
emphasize the role of psychosocial stressors as potentially modifiable risk factors for adverse
kidney outcomes. Further intervention studies addressing psychosocial stressors and CKD are
likely warranted and future studies should also examine potential biomarkers that may mediate
the relationship between perceived discrimination and kidney function decline.
In conclusion, in this sample of urban adults, perceived gender discrimination was
associated with modestly lower kidney function among White women and AA men. Consistent
findings were observed among AA women with respect to perceived racial discrimination and
lower kidney function. Perceived discrimination, a psychosocial stressor, deserves further
investigation for its potential contribution to kidney outcomes.
ACCEPTED

Copyright © 2017 by the American Psychosomatic Society. Unauthorized reproduction of this article is prohibited.
Acknowledgements
This work was supported by the Intramural Research Program of the National Institute on Aging,
National Institutes of Health (NIH). D.C.C. was supported by grant K23DK097184 from the
National Institute of Diabetes and Digestive and Kidney Diseases, NIH.
Author contributions:
MAB: Study concept, literature search and review, plan of analysis, data management, statistical
analysis, write-up and revision of the manuscript.
APB: Plan of analysis, data management, literature search and review, write-up and revision of
the manuscript.
ABZ: Data acquisition, plan of analysis, write-up of parts of the manuscript, revision of the
manuscript.
OSR: Plan of analysis, write-up of parts of the manuscript, revision of the manuscript.
MKE: Data acquisition, revision of the manuscript.
DCC: Plan of analysis, literature search and review, write-up of parts of the manuscript, revision
of the manuscript.
ACCEPTED

Copyright © 2017 by the American Psychosomatic Society. Unauthorized reproduction of this article is prohibited.
REFERENCES
1. Coresh J, Selvin E, Stevens LA, Manzi J, Kusek JW, Eggers P, Van Lente F, Levey AS.
Prevalence of chronic kidney disease in the United States. Jama. 2007;298:2038-47.
2. Parsa A, Kao WH, Xie D, Astor BC, Li M, Hsu CY, Feldman HI, Parekh RS, Kusek JW,
Greene TH, Fink JC, Anderson AH, Choi MJ, Wright JT, Jr., Lash JP, Freedman BI, Ojo A,
Winkler CA, Raj DS, Kopp JB, He J, Jensvold NG, Tao K, Lipkowitz MS, Appel LJ,
Investigators AS, Investigators CS. APOL1 risk variants, race, and progression of chronic kidney
disease. The New England journal of medicine. 2013;369:2183-96.
3. Crews DC, Pfaff T, Powe NR. Socioeconomic factors and racial disparities in kidney
disease outcomes. Seminars in nephrology. 2013;33:468-75.
4. Bruce MA, Griffith DM, Thorpe RJ, Jr. Stress and the kidney. Advances in chronic
kidney disease. 2015;22:46-53.
5. Williams DR, Neighbors HW, Jackson JS. Racial/ethnic discrimination and health:
findings from community studies. American journal of public health. 2003;93:200-8.
6. Cohen S. KRC, Gordon L. U. Personality characteristics as moderators of the relationship
between stress and disorder. Measuring Stress. New York, NY: Oxford University Press; 1995.
7. Kovach JA, Nearing BD, Verrier RL. Angerlike behavioral state potentiates myocardial
ischemia-induced T-wave alternans in canines. Journal of the American College of Cardiology.
2001;37:1719-25.
8. Lind L, Johansson K, Hall J. The effects of mental stress and the cold pressure test on
flow-mediated vasodilation. Blood pressure. 2002;11:22-7.
9. Rosmond R. Role of stress in the pathogenesis of the metabolic syndrome.
Psychoneuroendocrinology. 2005;30:1-10.
ACCEPTED

Copyright © 2017 by the American Psychosomatic Society. Unauthorized reproduction of this article is prohibited.
10. Williams JE, Nieto FJ, Sanford CP, Couper DJ, Tyroler HA. The association between
trait anger and incident stroke risk: the Atherosclerosis Risk in Communities (ARIC) Study.
Stroke; a journal of cerebral circulation. 2002;33:13-9.
11. Bratter JL, Gorman BK. Is discrimination an equal opportunity risk?: racial experiences,
socioeconomic status, and health status among black and white adults. J Health Soc Behavior.
12. Williams DR, Neighbors HW, Jackson JS. Racial/ethnic discrimination and health:
findings from community studies. American journal of public health. 2003;93:200-8.
13. Krieger N. Racial and gender discrimination: risk factors for high blood pressure? Social
science & medicine. 1990;30:1273-81.
14. Ro AE, Choi KH. Social status correlates of reporting gender discrimination and racial
discrimination among racially diverse women. Women & health. 2009;49:1-15.
15. Shelton RC, Puleo E, Bennett GG, McNeill LH, Sorensen G, Emmons KM. The
association between racial and gender discrimination and body mass index among residents
living in lower-income housing. Ethnicity & disease. 2009;19:251-7.
16. Borrell C, Muntaner C, Gil-Gonzalez D, Artazcoz L, Rodriguez-Sanz M, Rohlfs I, Perez
K, Garcia-Calvente M, Villegas R, Alvarez-Dardet C. Perceived discrimination and health by
gender, social class, and country of birth in a Southern European country. Preventive medicine.
2010;50:86-92.
17. Hahm HC, Ozonoff A, Gaumond J, Sue S. Perceived discrimination and health outcomes
a gender comparison among Asian-Americans nationwide. Women's health issues : official
publication of the Jacobs Institute of Women's Health. 2010;20:350-8. ACCEPTED

Copyright © 2017 by the American Psychosomatic Society. Unauthorized reproduction of this article is prohibited.
18. Brodish AB, Cogburn CD, Fuller-Rowell TE, Peck S, Malanchuk O, Eccles JS. Perceived
Racial Discrimination as a Predictor of Health Behaviors: the Moderating Role of Gender. Race
and social problems. 2011;3:160-9.
19. Cunningham TJ, Seeman TE, Kawachi I, Gortmaker SL, Jacobs DR, Kiefe CI, Berkman
LF. Racial/ethnic and gender differences in the association between self-reported experiences of
racial/ethnic discrimination and inflammation in the CARDIA cohort of 4 US communities.
Social science & medicine. 2012;75:922-31.
20. Perry BL, Harp KL, Oser CB. Racial and Gender Discrimination in the Stress Process:
Implications for African American Women's Health and Well-Being. Sociological perspectives :
SP : official publication of the Pacific Sociological Association. 2013;56:25-48.
21. Kim IH, Noh S. Ethnic and gender differences in the association between discrimination
and depressive symptoms among five immigrant groups. Journal of immigrant and minority
health / Center for Minority Public Health. 2014;16:1167-75.
22. McDonald JA, Terry MB, Tehranifar P. Racial and gender discrimination, early life
factors, and chronic physical health conditions in midlife. Women's health issues : official
publication of the Jacobs Institute of Women's Health. 2014;24:e53-9.
23. Otiniano Verissimo AD, Gee GC, Ford CL, Iguchi MY. Racial discrimination, gender
discrimination, and substance abuse among Latina/os nationwide. Cultural diversity & ethnic
minority psychology. 2014;20:43-51.
24. Otiniano Verissimo AD, Grella CE, Amaro H, Gee GC. Discrimination and substance use
disorders among Latinos: the role of gender, nativity, and ethnicity. American journal of public
health. 2014;104:1421-8.
ACCEPTED

Copyright © 2017 by the American Psychosomatic Society. Unauthorized reproduction of this article is prohibited.
25. Brondolo E, Monge A, Agosta J, Tobin JN, Cassells A, Stanton C, Schwartz J. Perceived
ethnic discrimination and cigarette smoking: examining the moderating effects of race/ethnicity
and gender in a sample of Black and Latino urban adults. Journal of behavioral medicine.
2015;38:689-700.
26. Ikram UZ, Snijder MB, Agyemang C, Schene AH, Peters RJ, Stronks K, Kunst AE.
Perceived Ethnic Discrimination and the Metabolic Syndrome in Ethnic Minority Groups: The
Healthy Life in an Urban Setting Study. Psychosom Med. 2017;79:101-11.
27. Owens SL, Hunte HE, Sterkel A, Johnson DA, Johnson-Lawrence V. Association
Between Discrimination and Objective and Subjective Sleep Measures in the Midlife in the
United States Study Adult Sample. Psychosom Med. 2017.
28. Kemp AH, Koenig J, Thayer JF, Bittencourt MS, Pereira AC, Santos IS, Dantas EM, Mill
JG, Chor D, Ribeiro AL, Bensenor IM, Lotufo PA. Race and Resting-State Heart Rate
Variability in Brazilian Civil Servants and the Mediating Effects of Discrimination: An ELSA-
Brasil Cohort Study. Psychosom Med. 2016;78:950-8.
29. Upchurch DM, Stein J, Greendale GA, Chyu L, Tseng CH, Huang MH, Lewis TT,
Kravitz HM, Seeman T. A Longitudinal Investigation of Race, Socioeconomic Status, and
Psychosocial Mediators of Allostatic Load in Midlife Women: Findings From the Study of
Women's Health Across the Nation. Psychosom Med. 2015;77:402-12.
30. Dailey AB, Kasl SV, Jones BA. Does gender discrimination impact regular
mammography screening? Findings from the race differences in screening mammography study.
Journal of women's health. 2008;17:195-206.
31. Evans MK, Lepkowski JM, Powe NR, LaVeist T, Kuczmarski MF, Zonderman AB.
Healthy aging in neighborhoods of diversity across the life span (HANDLS): overcoming
ACCEPTED

Copyright © 2017 by the American Psychosomatic Society. Unauthorized reproduction of this article is prohibited.
barriers to implementing a longitudinal, epidemiologic, urban study of health, race, and
socioeconomic status. Ethn Dis. 2010;20:267-75.
32. Krieger N, Smith K, Naishadham D, Hartman C, Barbeau EM. Experiences of
discrimination: validity and reliability of a self-report measure for population health research on
racism and health. Social science & medicine. 2005;61:1576-96.
33. Williams DR. Measuring Discrimination Resource:
http://scholar.harvard.edu/files/davidrwilliams/files/measuring_discrimination_resource_feb_201
2_0_0.pdf. 2012.
34. Essed P. Understanding everyday racism Newbury Park, CA Sage; 1991.
35. Williams DR, Yan Y, Jackson JS, Anderson NB. Racial Differences in Physical and
Mental Health: Socio-economic Status, Stress and Discrimination. Journal of health psychology.
1997;2:335-51.
36. Levey AS, Stevens LA, Schmid CH, Zhang YL, Castro AF, 3rd, Feldman HI, Kusek JW,
Eggers P, Van Lente F, Greene T, Coresh J, Ckd EPI. A new equation to estimate glomerular
filtration rate. Annals of internal medicine. 2009;150:604-12.
37. Peralta CA, Vittinghoff E, Bansal N, Jacobs D, Jr., Muntner P, Kestenbaum B, Lewis C,
Siscovick D, Kramer H, Shlipak M, Bibbins-Domingo K. Trajectories of kidney function decline
in young black and white adults with preserved GFR: results from the Coronary Artery Risk
Development in Young Adults (CARDIA) study. Am J Kidney Dis. [Comparative Study
Research Support, N.I.H., Extramural Research Support, Non-U.S. Gov't]. 2013;62:261-6.
38. Evans MK, Lepkowski JM, Powe NR, LaVeist T, Kuczmarski MF, Zonderman AB.
Healthy aging in neighborhoods of diversity across the life span (HANDLS): overcoming
ACCEPTED

Copyright © 2017 by the American Psychosomatic Society. Unauthorized reproduction of this article is prohibited.
barriers to implementing a longitudinal, epidemiologic, urban study of health, race, and
socioeconomic status. Ethnicity & disease. 2010;20:267-75.
39. Chobanian AV, Bakris GL, Black HR, Cushman WC, Green LA, Izzo JL, Jr., Jones DW,
Materson BJ, Oparil S, Wright JT, Jr., Roccella EJ, National Heart Lung and Blood Institute,
Joint National Committee on Prevention Detection Evaluation and Treatment of High Blood
Pressure, National High Blood Pressure Education Program Coordinating Committee. The
Seventh Report of the Joint National Committee on Prevention, Detection, Evaluation, and
Treatment of High Blood Pressure: the JNC 7 report. JAMA : the journal of the American
Medical Association. 2003;289:2560-72.
40. Radloff L. The CES-D scale: a self-report depression scale for research in the general
population. Applied Psychological Measurement. 1977;1.
41. Beydoun MA, Fanelli Kuczmarski MT, Beydoun HA, Hibbeln JR, Evans MK,
Zonderman AB. omega-3 fatty acid intakes are inversely related to elevated depressive
symptoms among United States women. The Journal of nutrition. 2013;143:1743-52.
42. Beydoun MA, Beydoun HA, Kitner-Triolo MH, Kaufman JS, Evans MK, Zonderman
AB. Thyroid hormones are associated with cognitive function: moderation by sex, race, and
depressive symptoms. The Journal of clinical endocrinology and metabolism. 2013;98:3470-81.
43. Heckman JJ. Sample selection bias as a specification error. Econometrica. 1979;47:153-
61.
44. Landrine H, Klonoff E.A. African American Acculturation: Deconstructing Race and
Reviving Culture. . Thousand Oaks, CA: Sage; 1996. ACCEPTED

Copyright © 2017 by the American Psychosomatic Society. Unauthorized reproduction of this article is prohibited.
45. Guidi J, Offidani E, Rafanelli C, Roncuzzi R, Sonino N, Fava GA. The Assessment of
Allostatic Overload in Patients with Congestive Heart Failure by Clinimetric Criteria. Stress and
health : journal of the International Society for the Investigation of Stress. 2014.
46. McClellan WM, Newsome BB, McClure LA, Howard G, Volkova N, Audhya P,
Warnock DG. Poverty and racial disparities in kidney disease: the REGARDS study. American
journal of nephrology. 2010;32:38-46.
47. Peralta CA, Katz R, DeBoer I, Ix J, Sarnak M, Kramer H, Siscovick D, Shea S, Szklo M,
Shlipak M. Racial and ethnic differences in kidney function decline among persons without
chronic kidney disease. Journal of the American Society of Nephrology : JASN. 2011;22:1327-
34.
48. United States Renal Data System: USRDS. Annual Data Report: Atlas of Chronic Kidney
Disease and End-Stage Renal Disease in the United States. . Bethesda: 2013.
49. Kramer H, Palmas W, Kestenbaum B, Cushman M, Allison M, Astor B, Shlipak M.
Chronic kidney disease prevalence estimates among racial/ethnic groups: the Multi-Ethnic Study
of Atherosclerosis. Clinical journal of the American Society of Nephrology : CJASN.
2008;3:1391-7.
50. Grams ME, Chow EK, Segev DL, Coresh J. Lifetime incidence of CKD stages 3-5 in the
United States. Am J Kidney Dis. 2013;62:245-52.
51. Tsigos C, Chrousos GP. Hypothalamic-pituitary-adrenal axis, neuroendocrine factors and
stress. Journal of psychosomatic research. [Review]. 2002;53:865-71.
52. Szanton SL, Rifkind JM, Mohanty JG, Miller ER, 3rd, Thorpe RJ, Nagababu E, Epel ES,
Zonderman AB, Evans MK. Racial discrimination is associated with a measure of red blood cell
ACCEPTED

Copyright © 2017 by the American Psychosomatic Society. Unauthorized reproduction of this article is prohibited.
oxidative stress: a potential pathway for racial health disparities. International journal of
behavioral medicine. 2012;19:489-95.
53. McEwen BS. Stress, adaptation, and disease. Allostasis and allostatic load. Annals of the
New York Academy of Sciences. 1998;840:33-44.
54. Kooman JP, Kotanko P, Schols AM, Shiels PG, Stenvinkel P. Chronic kidney disease and
premature ageing. Nature reviews Nephrology. 2014;10:732-42.
55. Saban KL, Mathews HL, DeVon HA, Janusek LW. Epigenetics and social context:
implications for disparity in cardiovascular disease. Aging and disease. [Review]. 2014;5:346-
55.
56. Gemmell LA, Terhorst L, Jhamb M, Unruh M, Myaskovsky L, Kester L, Steel J. Gender
and Racial Differences in Stress, Coping, and Health-Related Quality of Life in Chronic Kidney
Disease. Journal of pain and symptom management. 2016.
57. Sanders-Phillips K, Settles-Reaves B, Walker D, Brownlow J. Social inequality and
racial discrimination: risk factors for health disparities in children of color. Pediatrics. 2009;124
Suppl 3:S176-86.
58. Ahmed AT, Mohammed SA, Williams DR. Racial discrimination & health: pathways &
evidence. The Indian journal of medical research. 2007;126:318-27.
59. Cuffee YL, Hargraves JL, Rosal M, Briesacher BA, Schoenthaler A, Person S, Hullett S,
Allison J. Reported racial discrimination, trust in physicians, and medication adherence among
inner-city African Americans with hypertension. American journal of public health.
2013;103:e55-62. ACCEPTED

Copyright © 2017 by the American Psychosomatic Society. Unauthorized reproduction of this article is prohibited.
60. Casagrande SS, Gary TL, LaVeist TA, Gaskin DJ, Cooper LA. Perceived discrimination
and adherence to medical care in a racially integrated community. Journal of general internal
medicine. 2007;22:389-95.
61. Reynolds DB, Walker RJ, Campbell JA, Egede LE. Differential effect of race, education,
gender, and language discrimination on glycemic control in adults with type 2 diabetes. Diabetes
technology & therapeutics. 2015;17:243-7.
62. Klassen AC, Hall Ag Fau - Saksvig B, Saksvig B Fau - Curbow B, Curbow B Fau -
Klassen DK, Klassen DK. Relationship between patients' perceptions of disadvantage and
discrimination and listing for kidney transplantation. American journal of public health.
2002;92:811-7.
63. Rodriguez CJ, Gwathmey TM, Jin Z, Schwartz J, Beech BM, Sacco RL, Di Tullio MR,
Homma S. Perceived Discrimination and Nocturnal Blood Pressure Dipping Among Hispanics:
The Influence of Social Support and Race. Psychosom Med. 2016;78:841-50.
ACCEPTED

Copyright © 2017 by the American Psychosomatic Society. Unauthorized reproduction of this article is prohibited.
FIGURE LEGENDS
Figure 1A. Baseline and follow-up mean eGFR by PRD category
Figure 1B. Baseline and follow-up mean eGFR by PGD category
Figure 1C. Baseline and follow-up mean eGFR by EOD category
Figure 2A. Annual rate of change in eGFR by PRD category
Figure 2B. Annual rate of change in eGFR by PGD category
Figure 2C. Annual rate of change in eGFR by EOD category
ACCEPTED

Copyright © 2017 by the American Psychosomatic Society. Unauthorized reproduction of this article is prohibited.
ACCEPTED

Copyright © 2017 by the American Psychosomatic Society. Unauthorized reproduction of this article is prohibited.
ACCEPTED

Copyright © 2017 by the American Psychosomatic Society. Unauthorized reproduction of this article is prohibited.
ACCEPTED

Copyright © 2017 by the American Psychosomatic Society. Unauthorized reproduction of this article is prohibited.
ACCEPTED

Copyright © 2017 by the American Psychosomatic Society. Unauthorized reproduction of this article is prohibited.
ACCEPTED

Copyright © 2017 by the American Psychosomatic Society. Unauthorized reproduction of this article is prohibited.
ACCEPTED

Copyright © 2017 by the American Psychosomatic Society. Unauthorized reproduction of this article is prohibited.
Table 1. Study participant baseline characteristics, overall and by EOD group, HANDLS study
Overall (n=1,616)
Low EOD (n=934)
Medium EOD (n =437)
High EOD (n =245)
P-trend
% 100 57.8 27.0 15.2 Sex×Race White women 23.6 24.6 23.8 19.2 <0.001 AA women 35.0 36.5 34.3 30.0 White men 17.2 17.2 18.1 15.5 AA men 24.1 21.6 23.8 35.1 Baseline Age, Mean (SE)
48.3(0.2) 49.3(0.3) 47.1(0.4) 46.5(0.5) 0.001
Married, % 33.4 33.7 32.7 33.4 0.94 Educational level, % <HS 6.5 6.4 6.4 6.9 0.84 HS 58.0 57.8 60.0 60.8 >HS 35.4 35.8 36.6 32.2 Poverty status, % 0.035 <125% PIR 38.0 36.3 37.8 45.3 ≥125% PIR 61.9 63.7 62.2 54.7 Self-rated health, % 0.001 Poor/fair 24.0 21.7 24.5 31.8 Good 40.7 40.0 45.1 35.5 Very good/Excellent 35.4 38.4 30.4 32.7 Current smoking status, %
45.2 42.7 44.2 56.3 0.001
ACCEPTED

Copyright © 2017 by the American Psychosomatic Society. Unauthorized reproduction of this article is prohibited.
Current illicit drug use, %
17.3 14.3 18.8 25.7 <0.001
BMI, Mean (SE) 30.1 (0.2) 29.9 (0.2) 30.7 (0.4) 29.6(0.5) 0.88 Elevated depressive symptoms, CES-D total score ≥16, %
40.1 32.2 49.0 54.3 <0.001
Hypertension, % yes 44.7 45.6 44.2 42.4 0.65 Diabetes, % yes 9.7 9.6 10.8 8.2 0.54 Baseline eGFR, Mean (SE)
101.6(0.5) 101.0(0.6) 102.0(0.9) 103.3(1.3) 0.09
PRD factor score, Mean (SE)
-0.003(0.018) -0.21(0.02) +0.18(0.04) +0.47(0.06) <0.001
Low 59.4 71.2 47.4 35.9 <0.001 Medium 26.8 22.8 33.9 29.4 High 13.7 6.0 18.8 34.7 PGD factor score, Mean (SE)
-0.004(0.017) -0.22(0.02) +0.21(0.04) +0.46(0.05) <0.001
Low 58.8 80.7 35.1 10.3 <0.001 Medium 30.0 17.4 55.9 33.2 High 11.3 1.9 9.0 56.3 EOD factor score, Mean (SE)
+0.007(0.023) -0.62(0.013) +0.42(0.01) +1.68(0.03) <0.001
ACCEPTED

Copyright © 2017 by the American Psychosomatic Society. Unauthorized reproduction of this article is prohibited.
Note: Selected study participants had preserved kidney function. Values are percent or Mean (SE). P-value for trend was based on a one-way ANOVA when row variable is continuous and χ2 when row variable is categorical. Abbreviations: BMI = body mass index; eGFR CKD-EPI = estimate glomerular filtration rate Chronic Kidney Disease Epidemiology Collaboration; EOD= 9-item EveryDay Discrimination Scale; PIR=poverty income ratio.
ACCEPTED

Copyright © 2017 by the American Psychosomatic Society. Unauthorized reproduction of this article is prohibited.
Table 2. Baseline and annual rate of change in eGFR by perceived racial/gender discrimination (PRD, PGD), overall and by sex×race: Mixed-effects linear regression models.
Models N
Model 1
Model 2
Model 3
Model 4
β(SE) P β(SE) P β(SE) P β(SE) P
Overall 1616 Model A: PRD PRD10 -1.72(1.00) 0.085 -1.63(1.00) 0.10 -1.59(1.00) 0.11 -1.60(1.00) 0.11 PRD10×Time +0.05(0.19) 0.80 +0.02(0.19) 0.91 +0.02(0.20) 0.91 +0.03(0.19) 0.88 PRD20 -1.37(1.31) 0.30 -1.11(1.31) 0.40 -1.35(1.32) 0.31 -1.31(1.32) 0.32 PRD20×Time -0.15(0.25) 0.55 -0.23(0.25) 0.37 -0.18(0.25) 0.49 -0.20(0.25) 0.42 Model B: PGD PGD10 -0.36(0.92) 0.70 -0.32(0.92) 0.72 -0.40(0.92) 0.66 -0.41(0.92) 0.66 PGD10×Time -0.12(0.18) 0.49 -0.14(0.18) 0.43 -0.12(0.18) 0.50 -0.14(0.18) 0.43 PGD20 -3.41(1.33) 0.010 -3.28(1.37) 0.014 -3.53(1.34) 0.009 -3.51(1.34) 0.009 PGD20×Time +0.13(0.26) 0.61 +0.09(0.26) 0.73 +0.14(0.26) 0.60 +0.11(0.26) 0.68
White women 381 Model A: PRD PRD10 -2.81(2.20) 0.20 -3.25(2.19) 0.14 -3.35(2.18) 0.13 -3.55(2.19) 0.11 PRD10×Time +0.53(0.46) 0.25 +0.62(0.46) 0.17 +0.70(0.45) 0.12 +0.66(0.45) 0.14 PRD20 +0.83(4.86) 0.86 -0.37 (4.85) 0.94 +0.23 (4.87) 0.96 +0.33(4.86) 0.95 PRD20×Time +0.25(1.00) 0.81 +0.54(0.99) 0.58 +0.34(0.98) 0.73 +0.32(0.98) 0.74 Model B: PGD PGD10 +0.27(1.73) 0.88 -0.18(1.75) 0.92 -0.18(1.75) 0.92 -0.06(1.76) 0.97 PGD10×Time -0.02(0.37) 0.96 +0.01(0.37) 0.98 -0.01(0.37) 0.98 -0.10(0.37) 0.79 PGD20 -4.50(2.55) 0.078 -4.73(2.55) 0.064 -4.73(2.55) 0.065 -4.88(2.57) 0.058 PGD20×Time +0.99(0.54) 0.067 +1.02(0.54) 0.058 +1.02(0.54) 0.058 +0.93(0.53) 0.077
White men 278 Model A: PRD AC
CEPTED

Copyright © 2017 by the American Psychosomatic Society. Unauthorized reproduction of this article is prohibited.
PRD10 +3.57(2.03) 0.079 +3.82(1.97) 0.052 +3.37(1.97) 0.088 +3.28(1.98) 0.098 PRD10×Time +0.15(0.40) 0.72 +0.09(0.40) 0.81 +0.30(0.40) 0.47 +0.27(0.40) 0.50 PRD20 -1.84(4.53) 0.68 -2.25(4.41) 0.61 -3.46(4.37) 0.43 -3.66(4.39) 0.40 PRD20×Time -0.25(0.89) 0.78 -0.22(0.88) 0.80 +0.35(0.89) 0.70 +0.31(0.88) 0.73 Model B: PGD PGD10 -2.77(1.92) 0.15 -2.48(1.87) 0.19 -3.45(1.84) 0.062 -3.36(1.85) 0.069 PGD10×Time +0.55(0.38) 0.15 +0.54(0.38) 0.16 +0.63(0.37) 0.093 +0.63(0.38) 0.094 PGD20 -1.67(5.36) 0.76 -2.80(5.20) 0.59 -4.45(5.22) 0.39 -4.50(5.22) 0.39 PGD20×Time -0.54(0.92) 0.56 -0.46(0.92) 0.62 +0.05(0.94) 0.96 +0.05(0.93) 0.96
AA women 565 Model A: PRD PRD10 -2.44(1.77) 0.16 -2.70(1.79) 0.13 -2.44(1.81) 0.18 -2.34(1.81) 0.20 PRD10×Time -0.33(0.32) 0.31 -0.33(0.33) 0.32 -0.33(0.33) 0.31 -0.33(0.33) 0.32 PRD20 -0.51(2.23) 0.82 -1.00(2.27) 0.66 -0.88(2.31) 0.70 -0.72(2.32) 0.76 PRD20×Time -0.73(0.41) 0.078 -0.62(0.42) 0.14 -0.57(0.43) 0.18 -0.57(0.43) 0.18 Model B: PGD PGD10 -0.70(1.76) 0.69 -1.08(1.77) 0.54 -0.93(1.78) 0.60 -0.92(1.78) 0.61 PGD10×Time -0.65(0.33) 0.044 -0.60(0.33) 0.066 -0.57(0.33) 0.081 -0.59(0.32) 0.074 PGD20 -1.25(2.45) 0.61 -1.81(2.48) 0.47 -1.67(2.52) 0.51 -1.59(2.52) 0.53 PGD20×Time -0.72(0.45) 0.11 -0.61(0.45) 0.18 -0.57(0.46) 0.21 -0.57(0.46) 0.21
AA men 392 Model A: PRD PRD10 -1.14(2.00) 0.57 -1.16(2.01) 0.57 -1.06(1.98) 0.59 -1.46(1.98) 0.46 PRD10×Time +0.52(0.39) 0.18 +0.40(0.39) 0.30 +0.40(0.38) 0.29 +0.48(0.38) 0.21 PRD20 -1.20(2.17) 0.58 -0.78(2.19) 0.72 -1.31(2.16) 0.54 -1.22(2.15) 0.57 PRD20×Time +0.43(0.42) 0.30 +0.27(0.42) 0.72 +0.23(0.41) 0.57 +0.22(0.41) 0.59 Model B: PGD PGD10 +1.82(1.84) 0.32 +2.09(1.85) 0.26 +1.86(1.81) 0.31 +1.79(1.81) 0.32 PGD10×Time +0.34(0.35) 0.34 +0.24(0.36) 0.50 +0.24(0.35) 0.50 +0.25(0.35) 0.47 PGD20 -3.03(2.43) 0.21 -2.90(2.43) 0.23 -3.90(2.39) 0.10 -3.84(2.38) 0.11 PGD20×Time +0.67(0.47) 0.15 +0.59(0.46) 0.20 +0.63(0.46) 0.17 +0.59(0.45) 0.11 AC
CEPTED

Copyright © 2017 by the American Psychosomatic Society. Unauthorized reproduction of this article is prohibited.
Note: Selected participants with preserved kidney function. PRD and PGD are coded as 2=High, 1=Medium, 0=Low, were entered separately in models A or B. For instance PGD10 refers to Medium PGD contrasted with Low PGD. Model 1: adjusted for inverse mills ratio, age, sex and race; Model 2: further adjusted for poverty status, marital status and educational level; Model 3: further adjusted for current smoking status and illicit drug use, BMI, self-rated health and elevated depressive symptoms; Model 4: further adjusted for diabetes and hypertension.
ACCEPTED

Copyright © 2017 by the American Psychosomatic Society. Unauthorized reproduction of this article is prohibited.
Table 3. Baseline and annual rate of change in eGFR by everyday discrimination (EOD), overall and by sex×race: Mixed-effects linear regression models
Models N
Model 1
Model 2
Model 3
Model 4
β(SE) P β(SE) P β(SE) P β(SE) P
Overall 1616 EOD10 -0.57(0.95) 0.54 -0.55(0.95) 0.56 -0.55(0.96) 0.57 -0.57(0.96) 0.56 EOD 10×Time +0.20(0.19) 0.30 +0.19(0.19) 0.75 +0.18(1.20) 0.99 +0.19(0.19) 0.31 EOD 20 +0.35(1.18) 0.77b +0.38(1.18) 0.75b +0.02(1.20) 0.99b +0.03(1.20) 0.98b EOD 20×Time -0.12(0.23) 0.61 -0.12(0.23) 0.61 -0.04(0.23) 0.86 -0.05(0.23) 0.84
White women 381 EOD10 +0.19(1.78) 0.92 +0.12(1.78) 0.95 -0.07(1.83) 0.97 -0.05(1.83) 0.98 EOD10×Time -0.08(0.38) 0.84 -0.06(0.38) 0.87 +0.12(0.39) 0.76 +0.10(0.39) 0.80 EOD20 -4.28(2.43) 0.078 -4.81(2.43) 0.048 -5.55(2.51) 0.027 -5.86(2.52) 0.020 EOD20×Time +0.12(0.52) 0.82 +0.25(0.52) 0.64 +0.72(0.53) 0.18 +0.65(0.53) 0.22
White men 278 EOD10 +0.91(1.64) 0.56 +0.99(1.61) 0.54 +0.01(1.64) 1.00 -0.03(1.64) 0.99 EOD10×Time -0.28(0.33) 0.40 -0.31(0.33) 0.34 -0.24(0.34) 1.00 -0.25(0.33) 0.46 EOD20 +4.98(2.19) 0.023 +3.49(2.16) 0.11 +2.83(2.19) 0.20 +2.77(2.21) 0.21 EOD20×Time -0.75(0.44) 0.088 -0.60(0.44) 0.17 -0.52(0.45) 0.25 -0.55(0.45) 0.22
AA women 565 EOD10 -1.66(1.83) 0.37 -1.13(1.84) 0.54 -1.04(1.86) 0.58 -1.08(1.86) 0.56 EOD10×Time +0.40(0.34) 0.23 +0.35(0.34) 0.30 +0.40(0.34) 0.37 +0.40(0.34) 0.24 EOD20 +3.49(2.39) 0.14 +3.67(2.39) 0.13 +3.67(2.43) 0.13 +3.67(2.43) 0.13 EOD20×Time -0.58(0.45) 0.19 -0.53(0.45) 0.24 -0.41(0.46) 0.37 -0.41(0.46) 0.37
AA men 392 EOD10 -0.03(2.02) 0.99 +0.00(2.02) 1.00 +0.22(2.02) 0.91 +0.11(2.01) 0.96 EOD10×Time +0.33(0.39) 0.40 +0.29(0.39) 0.31 +0.09(0.39) 0.82 +0.12(0.38) 0.76 EOD20 -0.79(2.16) 0.72 -0.50(2.16) 0.82 -0.65(2.12) 0.76 -0.48(2.12) 0.82 AC
CEPTED

Copyright © 2017 by the American Psychosomatic Society. Unauthorized reproduction of this article is prohibited.
Note: Selected participants with preserved kidney function. EOD is coded as 2=High, 1=Medium, 0=Low. For instance EOD10 refers to Medium EOD contrasted with Low EOD. Model 1: adjusted for inverse mills ratio, age, sex and race; Model 2: further adjusted for poverty status, marital status and educational level; Model 3: further adjusted for current smoking status and illicit drug use, BMI, self-rated health and elevated depressive symptoms; Model 4: further adjusted for diabetes and hypertension. a In a separate model with sex×race (0=White women vs. each of the other categories), sex×race×Time, sex×race×EODk0, sex×race× EODk0×Time, (in addition to the other covariates in each model), p<0.05 for the null hypothesis that the term sex×race× EODk0×Time =0. b In a separate model with sex×race (0=White women vs. each of the other categories), sex×race×Time, sex×race×EODk0, sex×race× EODk0×Time, (in addition to the other covariates in each model), p<0.05 for the null hypothesis that the term sex×race×EODk0=0.
EOD20×Time +0.42(0.41) 0.31 +0.42(0.41) 0.31 +0.32(0.41) 0.43 +0.27(0.40) 0.50
ACCEPTED

Copyright © 2017 by the American Psychosomatic Society. Unauthorized reproduction of this article is prohibited.
Supplemental Digital Content 1
Wave File Variable name Variable label Factor levels
1 Household Discrim01a HH-Discrim: Discrimination due to gender Not at all|A little|Some|A lot
1 Household Discrim01b HH-Discrim: Discrimination due to race Not at all|A little|Some|A lot
1 Household Discrim01c HH-Discrim: Discrimination due to ethnicity Not at all|A little|Some|A lot
1 Household Discrim01d HH-Discrim: Discrimination due to income Not at all|A little|Some|A lot
1 Household Discrim01e HH-Discrim: Discrimination because of age Not at all|A little|Some|A lot
1 Household Discrim01f HH-Discrim: Discrimination because of religion Not at all|A little|Some|A lot
1 Household Discrim01g HH-Discrim: Discrimination due to appearance Not at all|A little|Some|A lot
1 Household Discrim01h HH-Discrim: Discrimination due to sexual orientation Not at all|A little|Some|A lot
1 Household Discrim01i HH-Discrim: Discrimination because of health status Not at all|A little|Some|A lot
1 Household Discrim01j HH-Discrim: Discrimination because of disability Not at all|A little|Some|A lot
1 Household Discrim02a HH-Discrim: Discrimination interfered with life Not at all|A little|Some|A lot
1 Household Discrim02b HH-Discrim: Life harder due to Discrimination? Not at all|A little|Some|A lot
1 Household Discrim03a HH-Discrim: Experienced gender discrim. at school? No|Yes
1 Household Discrim03b HH-Discrim: Experienced gender discrim. when getting
No|Yes
1 Household Discrim03c HH-Discrim: Experienced gender discrim. at work No|Yes
1 Household Discrim03d HH-Discrim: Experienced gender discrim. at home No|Yes
1 Household Discrim03e HH-Discrim: When getting medical care exp. gender di
No|Yes
1 Household Discrim04a HH-Discrim: Racial discrimination at school? No|Yes
1 Household Discrim04b HH-Discrim: Racial No|Yes
ACCEPTED

Copyright © 2017 by the American Psychosomatic Society. Unauthorized reproduction of this article is prohibited.
discrim. when getting job
1 Household Discrim04c HH-Discrim: Racial discrim at work? No|Yes
1 Household Discrim04d HH-Discrim: Racial discrim when getting housing? No|Yes
1 Household Discrim04e HH-Discrim: Racial discrim when getting medical care No|Yes
1 Household Discrim04f HH-Discrim: Racial discrim from police/court? No|Yes
1 Household Discrim05a HH-Discrim: How often treated with less courtesy?
Almost every day|At least once a week|Few times a month|Few times a year|Less than 1/year|Never
1 Household Discrim05b HH-Discrim: How often treated with less respect?
Almost every day|At least once a week|Few times a month|Few times a year|Less than 1/year|Never
1 Household Discrim05c HH-Discrim: How often got worse service at stores?
Almost every day|At least once a week|Few times a month|Few times a year|Less than 1/year|Never
1 Household Discrim05d HH-Discrim: How often people act like you are not sm
Almost every day|At least once a week|Few times a month|Few times a year|Less than 1/year|Never
1 Household Discrim05e HH-Discrim: How often people act as afraid of you?
Almost every day|At least once a week|Few times a month|Few times a year|Less than 1/year|Never
1 Household Discrim05f HH-Discrim: How often people act as you are dishones
Almost every day|At least once a week|Few times a month|Few times a year|Less than 1/year|Never
1 Household Discrim05g HH-Discrim: How often people act as they are better
Almost every day|At least once a week|Few times a month|Few times a year|Less than 1/year|Never
1 Household Discrim05h HH-Discrim: How often people insult you
Almost every day|At least once a week|Few times a month|Few times a year|Less than 1/year|Never
1 Household Discrim05i HH-Discrim: How often people threaten/harass you
Almost every day|At least once a week|Few times a month|Few times a year|Less than 1/year|Never
1 Household Discrim06a HH-Discrim: Try to do something when treated unfairly
No|Yes
1 Household Discrim06b HH-Discrim: Do you keep it to yourself? No|Yes
1 Household Discrim06c HH-Discrim: Accept unfair treatment as fact of life? No|Yes
1 Household Discrim06d HH-Discrim: Talk to others when treated unfairly? No|Yes
ACCEPTED

Copyright © 2017 by the American Psychosomatic Society. Unauthorized reproduction of this article is prohibited.
*Items used to compute PGD factor score: Highlighted in yellow; items used to compute PRD factor score: Highlighted in gray; items used to compute EOD factor score: Highlighted in blue.
Wave File Variable name Variable label Factor levels
1 Household Discrim01a HH-Discrim: Discrimination due to gender Not at all|A little|Some|A lot
1 Household Discrim01b HH-Discrim: Discrimination due to race Not at all|A little|Some|A lot
1 Household Discrim01c HH-Discrim: Discrimination due to ethnicity Not at all|A little|Some|A lot
1 Household Discrim01d HH-Discrim: Discrimination due to income Not at all|A little|Some|A lot
1 Household Discrim01e HH-Discrim: Discrimination because of age Not at all|A little|Some|A lot
1 Household Discrim01f HH-Discrim: Discrimination because of religion Not at all|A little|Some|A lot
1 Household Discrim01g HH-Discrim: Discrimination due to appearance Not at all|A little|Some|A lot
1 Household Discrim01h HH-Discrim: Discrimination due to sexual orientation Not at all|A little|Some|A lot
1 Household Discrim01i HH-Discrim: Discrimination because of health status Not at all|A little|Some|A lot
1 Household Discrim01j HH-Discrim: Discrimination because of disability Not at all|A little|Some|A lot
1 Household Discrim02a HH-Discrim: Discrimination interfered with life Not at all|A little|Some|A lot
1 Household Discrim02b HH-Discrim: Life harder due to Discrimination? Not at all|A little|Some|A lot
1 Household Discrim03a HH-Discrim: Experienced gender discrim. at school? No|Yes
1 Household Discrim03b HH-Discrim: Experienced gender discrim. when getting
No|Yes
1 Household Discrim03c HH-Discrim: Experienced gender discrim. at work No|Yes
1 Household Discrim03d HH-Discrim: Experienced gender discrim. at home No|Yes
1 Household Discrim03e HH-Discrim: When getting medical care exp. gender No|Yes
ACCEPTED

Copyright © 2017 by the American Psychosomatic Society. Unauthorized reproduction of this article is prohibited.
di
1 Household Discrim04a HH-Discrim: Racial discrimination at school? No|Yes
1 Household Discrim04b HH-Discrim: Racial discrim. when getting job No|Yes
1 Household Discrim04c HH-Discrim: Racial discrim at work? No|Yes
1 Household Discrim04d HH-Discrim: Racial discrim when getting housing? No|Yes
1 Household Discrim04e HH-Discrim: Racial discrim when getting medical care No|Yes
1 Household Discrim04f HH-Discrim: Racial discrim from police/court? No|Yes
1 Household Discrim05a HH-Discrim: How often treated with less courtesy?
Almost every day|At least once a week|Few times a month|Few times a year|Less than 1/year|Never
1 Household Discrim05b HH-Discrim: How often treated with less respect?
Almost every day|At least once a week|Few times a month|Few times a year|Less than 1/year|Never
1 Household Discrim05c HH-Discrim: How often got worse service at stores?
Almost every day|At least once a week|Few times a month|Few times a year|Less than 1/year|Never
1 Household Discrim05d HH-Discrim: How often people act like you are not sm
Almost every day|At least once a week|Few times a month|Few times a year|Less than 1/year|Never
1 Household Discrim05e HH-Discrim: How often people act as afraid of you?
Almost every day|At least once a week|Few times a month|Few times a year|Less than 1/year|Never
1 Household Discrim05f HH-Discrim: How often people act as you are dishones
Almost every day|At least once a week|Few times a month|Few times a year|Less than 1/year|Never
1 Household Discrim05g HH-Discrim: How often people act as they are better
Almost every day|At least once a week|Few times a month|Few times a year|Less than 1/year|Never
1 Household Discrim05h HH-Discrim: How often people insult you
Almost every day|At least once a week|Few times a month|Few times a year|Less than 1/year|Never
1 Household Discrim05i HH-Discrim: How often people threaten/harass you
Almost every day|At least once a week|Few times a month|Few times a year|Less than 1/year|Never
1 Household Discrim06a HH-Discrim: Try to do something when treated unfairly
No|Yes
1 Household Discrim06b HH-Discrim: Do you keep it to yourself? No|Yes
ACCEPTED

Copyright © 2017 by the American Psychosomatic Society. Unauthorized reproduction of this article is prohibited.
1 Household Discrim06c HH-Discrim: Accept unfair treatment as fact of life? No|Yes
1 Household Discrim06d HH-Discrim: Talk to others when treated unfairly? No|Yes
*Items used to compute PGD factor score: Highlighted in yellow; items used to compute PRD factor score: Highlighted in gray; items used to compute EOD factor score: Highlighted in blue.
ACCEPTED

Copyright © 2017 by the American Psychosomatic Society. Unauthorized reproduction of this article is prohibited.
Supplemental Digital Content 2
MIXED-EFFECTS REGRESSION MODELS
The main multiple mixed-effects regression models can be summarized as follows:
Multi-level models vs. Composite models
Eq.
1.1-1.4
Where Yij is the outcome (eGFR) for each individual “i” and visit “j”; is the level-1 intercept for
individual i; is the level-1 slope for individual i; is the level-2 intercept of the random intercept
; is the level-2 intercept of the slope ; is a vector of fixed covariates for each individual i
that are used to predict level-1 intercepts and slopes and included baseline age (Agebase) among other
covariates. Xija, represents the main predictor variables (PGD and PRD); and are level-2
disturbances; is the within-person level-1 disturbance. Of primary interest are the main effects of each
exposure Xa (γ0a) and their interaction with TIME (γ1a), as described in a previous methodological
paper.(55)
ijijiiij TimeY HSS �� 10
i
l
kikkijaai ZX 0
100000 ]JJJS ��� ¦
i
n
mimmijaai ZX 1
111101 ]JJJS ¦
���
)( 10
11
110
10000
ijijii
ij
n
mimm
ijijaaij
l
kikkaijaij
Time
TimeZ
TimeXTime
ZXY
H]]
J
JJ
JJJ
���
�
��
��
¦
¦
i0S
i1S 00J
i0S 10J i1S ikZ
i0] i1]
ijH
ACCEPTED

Copyright © 2017 by the American Psychosomatic Society. Unauthorized reproduction of this article is prohibited.
Table S1. Crude association of baseline, follow-up and annual rate of change in eGFR with continuous summation scores on EOD, PRD and PGD, stratifying by sex and race; HANDLS 2004-2013
Baseline eGFR Follow-up eGFR Annual rate of change in eGFR
r P-value r P-value r P-value
EOD summation score
Overall +0.062* 0.013 +0.066* 0.008 +0.011 0.65
White women -0.012 0.80 -0.010 0.85 +0.004 0.94
White men +0.223* <0.001 +0.205* <0.001 +0.005 0.94
AA women +0.089* 0.034 +0.072 0.088 -0.012 0.78
AA men +0.049 0.34 +0.091 0.071 +0.053 0.29
PRD summation score
Overall +0.013 0.60 +0.010 0.69 -0.004 0.87
White women +0.001 0.99 +0.067 0.20 +0.086 0.092
White men +0.048 0.44 +0.087 0.15 +0.076 0.21
AA women -0.083* 0.048 -0.151* <0.001 -0.090* 0.032
AA men -0.084 0.097 -0.029 0.56 +0.060 0.24
PGD summation score
Overall -0.028 0.25 -0.015 0.55 +0.015 0.54
White women -0.075 0.15 +0.013 0.80 +0.11* 0.031
ACCEPTED

Copyright © 2017 by the American Psychosomatic Society. Unauthorized reproduction of this article is prohibited.
White men -0.038 0.53 -0.004 0.94 +0.046 0.45
AA women -0.089* 0.034 -0.148* <0.001 -0.078 0.064
AA men -0.069 0.17 +0.005 0.93 +0.085 0.095
Abbreviations: AA=African-American; eGFR=Estimated Glomerular Filtration Rate; EOD=EveryDay experience of Discrimination scale; PGD=Perceived gender discrimination scale PRD=Perceived racial discrimination scale; r=Pearson‟s correlation coefficient.
*P<0.05 for null hypothesis that r=0.
ACCEPTED

Copyright © 2017 by the American Psychosomatic Society. Unauthorized reproduction of this article is prohibited.
Table S2. Follow-up eGFR by perceived racial/gender discrimination (PRD, PGD), overall and by sex×race: Ordinary Least Square regression models.
Models N Model 1
Model 2 Model 3
Model 4
β(SE) P β(SE) P β(SE) P β(SE) P
Overall 1,616 Model A: PRD PRD (Medium vs. low) -1.48(1.07) 0.17 -1.52(1.07) 0.16 -1.49(1.08) 0.17 -1.46(1.08) 0.18 PRD (High vs. low) -2.07(1.39) 0.14 -2.13(1.41) 0.13 -2.17(1.42) 0.13 -2.23(1.42) 0.11 Model B: PGD PGD (Medium vs. low) -0.88(0.98) 0.37 -0.91(0.99) 0.36 -0.90(0.99) 0.36 -1.00(0.99) 0.31 PGD (High vs. low) -2.81(1.42) 0.045 -2.86(1.43) 0.046 -2.93(1.45) 0.043 -3.03(1.45) 0.036
White women 381 Model A: PRD PRD (Medium vs. low) -0.36(2.38) 0.88 -0.51(2.40) 0.83 -0.24(2.40) 0.92 -0.58(2.40) 0.81 PRD (High vs. low) +1.84(5.26) 0.73 +1.90(5.31) 0.72 +1.63(5.35) 0.76 +1.59(5.33) 0.77 Model B: PGD PGD (Medium vs. low) +0.28(1.89) 0.87 +0.07(1.92) 0.97 +0.17(1.93) 0.93 -0.28(1.94) 0.88 PGD (High vs. low) -0.23(2.78) 0.93 -0.49(2.80) 0.86 -0.30(2.83) 0.92 -0.71(2.83) 0.80
White men 278 Model A: PRD PRD (Medium vs. low) +4.02(2.05) 0.051 +4.13(2.04) 0.045 +4.33(2.07) 0.037 +4.09(2.08) 0.050 PRD (High vs. low) -1.87(4.56) 0.68 -1.95(4.59) 0.67 -1.00(4.60) 0.83 -1.44(4.62) 0.76 Model B: PGD PGD (Medium vs. low) -0.29(1.95) 0.88 -0.01(1.95) 0.99 -0.73(1.94) 0.71 -0.62(1.95) 0.75 PGD (High vs. low) -5.01(5.40) 0.35 -5.61(5.38) 0.30 -5.19(5.47) 0.34 -5.31(5.48) 0.33
AA women 565 Model A: PRD AC
CEPTED

Copyright © 2017 by the American Psychosomatic Society. Unauthorized reproduction of this article is prohibited.
Note: Selected participants with preserved kidney function. PRD and PGD are coded as 2=High, 1=Medium, 0=Low were entered separately in models A or B. For instance PGD10 refers to Medium PGD contrasted with Low PGD. Model 1: adjusted for inverse mills ratio, age, sex and race; Model 2: further adjusted for poverty status, marital status and educational level; Model 3: further adjusted for current smoking status and illicit drug use, BMI, self-rated health and elevated depressive symptoms; Model 4: further adjusted for diabetes and hypertension.
a In a separate model with sex×race (0=White women vs. each of the other categories), sex×race, sex×race×PRDk0 (or sex×race×PGDk0), in addition to the other covariates in each model, p<0.05 for the null hypothesis that the term sex×race×PRDk0=0 , where k=1 for Medium and k=2 for High contrasted with 0=Low.
PRD (Medium vs. low) -4.02(1.82) 0.027 -4.27(1.81) 0.021 -4.03(1.87) 0.032 -3.91(1.87) 0.037 PRD (High vs. low) -3.92(2.28) 0.086 -3.98(2.34) 0.090 -3.65(2.39) 0.13 -3.46(2.40) 0.15 Model B: PGD PGD (Medium vs. low) -3.66(1.80) 0.042 -3.82(1.82) 0.036 -3.58(1.84) 0.051 -3.61(1.84) 0.050 PGD (High vs. low) -4.66(2.51) 0.063 -4.79(2.55) 0.061 -4.45(2.60) 0.087 -4.38(2.60) 0.093
AA men 392 Model A: PRD PRD (Medium vs. low) +0.83(2.29) 0.72 +0.83(2.29) 0.72 +0.86(2.29) 0.71 +0.85(2.30) 0.71 PRD (High vs. low) +0.62(2.49) 0.80 +0.62(2.49) 0.80 -0.22(2.49) 0.93 -0.19(2.49) 0.94 Model B: PGD PGD (Medium vs. low) +3.50(2.09) 0.095 +3.35(2.11) 0.11 +3.15(2.10) 0.14 +3.20(2.10) 0.13 PGD (High vs. low) +0.22(2.77) 0.94 -0.01(2.76) 0.99 -0.93(2.77) 0.74 -1.02(2.76) 0.71
ACCEPTED

Copyright © 2017 by the American Psychosomatic Society. Unauthorized reproduction of this article is prohibited.
Table S3. Follow-up eGFR by perceived everyday discrimination (EOD), overall and by sex×race: Ordinary Least Square regression models.
Note: Selected participants with preserved kidney function. EOD is coded as 2=High, 1=Medium, 0=Low. For instance, EOD10 refers to Medium EOD contrasted with Low PGD. Model 1: adjusted for inverse mills ratio, age, sex and race; Model 2: further adjusted for poverty status, marital status and educational level; Model 3: further adjusted for current smoking status and illicit drug use, BMI, self-rated health and elevated depressive symptoms; Model 4: further adjusted for diabetes and hypertension. a In a separate model with sex×race (0=White women vs. each of the other categories), sex×race, sex×race×EODk0, (in addition to the other covariates in each model), p<0.05 for the null hypothesis that the term sex×race× EODk0=0, where k=1 for Medium and k=2 for High contrasted with 0=Low.
55 N
Model 1
Model 2
Model 3
Model 4
β(SE) P β(SE) P β(SE) P β(SE) P
Overall 1,616 EOD (Medium vs. low) +0.34(1.02) 0.74 +0.33(1.02) 0.75 +0.33(1.03) 0.75 +0.34(1.03) 0.74 EOD (High vs. low) -0.16(1.27) 0.90 -0.13(1.27) 0.92 -0.15(1.29) 0.91 -0.16(1.29) 0.90
White women 381 EOD (Medium vs. low) -0.07(1.93) 0.97 -0.17(1.95) 0.93 +0.40(2.03) 0.85 +0.38(2.02) 0.85 EOD (High vs. low) -3.62(2.64) 0.17 -3.86(2.66) 0.15 -2.63(2.77) 0.34 -3.23(2.76) 0.25
White men 278 EOD (Medium vs. low) +0.01(1.67) 1.00 -0.14(1.68) 0.93 -0.83(1.73) 0.63 -0.97(1.73) 0.58 EOD (High vs. low) +1.94(2.23) 0.39 +1.05(2.25) 0.64 +0.65(2.30) 0.78 +0.37(2.33) 0.87
AA women 565 EOD (Medium vs. low) +0.27(1.89) 0.89 +0.51(1.91) 0.79 +0.83(1.93) 0.67 +0.76(1.93) 0.69 EOD (High vs. low) +0.79(2.46) 0.75 +1.20(2.48) 0.63 +1.78(2.53) 0.48 +1.77(2.53) 0.48
AA men 392 EOD (Medium vs. low) +1.58(2.29) 0.49 +1.42(2.29) 0.54 +0.68(2.33) 0.77 +0.76(2.33) 0.75 EOD (High vs. low) +1.28(2.45) 0.60 +1.58(2.45) 0.52 +0.94(2.45) 0.70 +0.88(2.45) 0.72
ACCEPTED

Copyright © 2017 by the American Psychosomatic Society. Unauthorized reproduction of this article is prohibited.
SENSITIVITY ANALYSIS
A sensitivity analysis was conducted whereby albumin-to-creatinine ratio was added to the models as an additional covariate and results were compared to the main models (Model 5). In addition, the sensitivity analysis restricted the analytic sample to the participants with complete data on ACR (N=1,158) even in models where ACR was not included as covariate (i.e. Models 1-4). The results of the mixed-effects regression models are presented in Tables S4 and S6 and those of the OLS regression model with follow-up eGFR as the outcome variable are presented in Tables S5 and S7.
Based on Table S4 findings, overall, the new analysis revealed that “Medium vs. High” PRD was inversely related to baseline eGFR (Models 1-5), a finding that was not detected in the initial models. In contrast, among AA women, the inverse relationship between “High vs. Low” PGD and rate of change in eGFR was no longer detected in Model 1. “High vs. Low” PGD was found to be inversely related to baseline eGFR among AA men in Model 3, unlike in the main analyses which found no effect.
Another key difference between the main analyses and those of the sensitivity analyses (Table S5), is that in the latter there was no significant association between PRD (“Medium vs. Low”) and follow eGFR among White men in all models, though the direction of the relationship was the same. This indicates a lower statistical power to detect such an association, given the small sample size among White men (N=213). Similarly, the previously detected inverse relationship between PGD and follow-up eGFR among AA men became non-significant in the smaller sample. There was no indication for a mediating effect by ACR.
While no changes were found in the relationships observed between EOD and follow-up eGFR (Table S7), the results of the mixed-effect regression models with EOD as the main predictor showed a few differences with the initial findings, given the reduced sample size. Notably, the inverse relationship between “High vs. Low” EOD and baseline eGFR found among White women was non-significant or marginally significant in models Models 2-5, with no indication for a mediating effect by ACR. Moreover, the positive association between “High vs. Low” EOD and baseline eGFR found among White men in the initial analyses became null in the sensitivity analyses.
ACCEPTED

Copyright © 2017 by the American Psychosomatic Society. Unauthorized reproduction of this article is prohibited.
Table S4. Sensitivity analyses for mixed-effects regression models with PRD (Models A) or PGD (Models B): overall, and stratified by sex×race
Model 1 Model 2 Model 3 Model 4 Model 5a
Overall (N=1,158)
Sig Æ Null
Medium vs. Low
PRD -- -- -- -- --
PRD×time -- -- -- -- --
PGD -- -- -- -- --
PGD×time
-- -- -- -- --
High vs. Low
PRD -- -- -- -- --
PRD×time -- -- -- -- --
PGD -- -- -- -- --
PGD×time
-- -- -- -- --
Null Æ Sig.
Medium vs. Low
PRD -2.71(1.15)p=0.019 -2.58(1.15)
p=0.025 -2.58(1.15) p=0.025 -2.68(1.15)
p=0.020 -2.66(1.15)p=0.021
PRD×time -- -- -- -- --
PGD -- -- -- -- --
PGD×time
-- -- -- -- --
ACCEPTED

Copyright © 2017 by the American Psychosomatic Society. Unauthorized reproduction of this article is prohibited.
High vs. Low
PRD -- -- -- -- --
PRD×time -- -- -- -- --
PGD -- -- -- -- --
PGD×time
-- -- -- -- --
White women (N=289)
Sig Æ Null
Medium vs. Low
PRD -- -- -- -- --
PRD×time -- -- -- -- --
PGD -- -- -- -- --
PGD×time
-- -- -- -- --
High vs. Low
PRD -- -- -- -- --
PRD×time -- -- -- -- --
PGD -- -- -- -- --
PGD×time
-- -- -- -- --
Null Æ Sig.
Medium vs. Low
PRD -- -- -- -- --
ACCEPTED

Copyright © 2017 by the American Psychosomatic Society. Unauthorized reproduction of this article is prohibited.
PRD×time -- -- -- -- --
PGD -- -- -- -- --
PGD×time
-- -- -- -- --
High vs. Low
PRD -- -- -- -- --
PRD×time -- -- -- -- --
PGD -- -- -- -- --
PGD×time
-- -- -- -- --
White men (N=213)
Sig Æ Null
Medium vs. Low
PRD -- -- -- -- --
PRD×time -- -- -- -- --
PGD -- -- -- -- --
PGD×time
-- -- -- -- --
High vs. Low
PRD -- -- -- -- --
PRD×time -- -- -- -- --
PGD -- -- -- -- --
ACCEPTED

Copyright © 2017 by the American Psychosomatic Society. Unauthorized reproduction of this article is prohibited.
PGD×time
-- -- -- -- --
Null Æ Sig.
Medium vs. Low
PRD -- -- -- -- --
PRD×time -- -- -- -- --
PGD -- -- -- -- --
PGD×time
-- -- -- -- --
High vs. Low
PRD -- -- -- -- --
PGD -- -- -- -- --
PRD×time -- -- -- -- --
PGD×time
-- -- -- -- --
AA women (N=383)
Sig Æ Null
Medium vs. Low
PRD -- -- -- -- --
PRD×time -- -- -- -- --
PGD -- -- -- -- --
PGD×time
-- -- -- -- --
High vs. Low
PRD -- -- -- -- --
ACCEPTED

Copyright © 2017 by the American Psychosomatic Society. Unauthorized reproduction of this article is prohibited.
PRD×time -- -- -- -- --
PGD -- -- -- -- --
PGD×time
-0.45(0.36)p=0.21 -- -- -- --
Null Æ Sig.
Medium vs. Low
PRD -- -- -- -- --
PRD×time -- -- -- -- --
PGD -- -- -- -- --
PGD×time
-- -- -- -- --
High vs. Low
PRD -- -- -- -- --
PRD×time -- -- -- -- --
PGD -- -- -- -- --
PGD×time
-- -- -- -- --
AA men (N=273)
Sig Æ Null
Medium vs. Low
PRD -- -- -- -- --
PRD×time -- -- -- -- --
PGD -- -- -- -- --
PGD×time
-- -- -- -- --
High vs.
ACCEPTED

Copyright © 2017 by the American Psychosomatic Society. Unauthorized reproduction of this article is prohibited.
Low
PRD -- -- -- -- --
PRD×time -- -- -- -- --
PGD -- -- -- -- --
PGD×time
-- -- -- -- --
Null Æ Sig.
Medium vs. Low
PRD -- -- -- -- --
PRD×time -- -- -- -- --
PGD -- -- -- -- --
PGD×time
-- -- -- -- --
High vs. Low
PRD -- -- -- -- --
PRD×time -- -- -- -- --
PGD -- -- -5.92(3.01)p=0.048 -- --
PGD×time
-- -- -- -- --
-- no change in significance was noted between the main analysis and the sensitivity analysis.
a Model 5 included ACR as an additional variable to Model 4. All models had a total sample size of N=1,158 and thus included only participants with complete data on ACR. AC
CEPTED

Copyright © 2017 by the American Psychosomatic Society. Unauthorized reproduction of this article is prohibited.
Table S5. Sensitivity analysis for OLS regression models with PRD (Models A) or PGD (Models B): overall, and stratified by sex×race
Model 1 Model 2 Model 3 Model 4 Model 5
Overall (N=1,158)
Medium vs. Low
Sig Æ Null
PRD -- -- -- -- --
PGD -- -- -- -- --
Null Æ Sig.
PRD -- -- -- -- --
PGD -- -- -- -- --
High vs. Low
Sig Æ Null
PRD -- -- -- -- --
PGD -- -- -- -- --
Null Æ Sig.
PRD -- -- -- -- --
PGD -- -- -- -- --
White women (N=289)
Medium vs. Low
Sig Æ Null
PRD -- -- -- -- --
PGD -- -- -- -- --
Null Æ Sig.
PRD -- -- -- -- --
ACCEPTED

Copyright © 2017 by the American Psychosomatic Society. Unauthorized reproduction of this article is prohibited.
PGD -- -- -- -- --
High vs. Low
Sig Æ Null
PRD -- -- -- -- --
PGD -- -- -- -- --
Null Æ Sig.
PRD -- -- -- -- --
PGD -- -- -- -- --
White men (N=213)
Medium vs. Low
Sig Æ Null
PRD +3.82(2.41)p
=0.11 +3.98(2.40)p
=0.10 +3.60(2.46)p
=0.14 +3.05(2.49)p=
0.22 +2.82(2.47)p=0.26
PGD -- -- -- -- --
Null Æ Sig.
PRD -- -- -- -- --
PGD -- -- -- -- --
High vs. Low
Sig Æ Null
PRD -- -- -- -- --
PGD -- -- -- -- --
Null Æ Sig.
PRD -- -- -- -- --
PGD -- -- -- -- --
ACCEPTED

Copyright © 2017 by the American Psychosomatic Society. Unauthorized reproduction of this article is prohibited.
AA women (N=383)
Medium vs. Low
Sig Æ Null
PRD -- -- -- -- --
PGD -- -- -- -- --
Null Æ Sig.
PRD -- -- -- -- --
PGD -- -- -- -- --
High vs. Low
Sig Æ Null
PRD -- -- -- -- --
PGD -- -- -- -- --
Null Æ Sig.
PRD -- -- -- -- --
PGD -- -- -- -- --
AA men (N=273)
Medium vs. Low
Sig Æ Null
PRD -- -- -- -- --
PGD -- -- 4.10(2.10)p=0.52 3.94(2.11)p=0.062 -3.83(2.10)p=0.069
Null Æ Sig.
PRD -- -- -- -- --
PGD -- -- -- -- --
ACCEPTED

Copyright © 2017 by the American Psychosomatic Society. Unauthorized reproduction of this article is prohibited.
High vs. Low
Sig Æ Null
PRD -- -- -- -- --
PGD -- -- -- -- --
Null Æ Sig.
PRD -- -- -- -- --
PGD -- -- -- -- --
-- no change in significance was noted between the main analysis and the sensitivity analysis.
a Model 5 included ACR as an additional variable to Model 4. All models had a total sample size of N=1,158 and thus included only participants with complete data on ACR.
ACCEPTED

Copyright © 2017 by the American Psychosomatic Society. Unauthorized reproduction of this article is prohibited.
Table S6. Sensitivity analyses for mixed-effects regression models with EOD: overall, and stratified by sex×race
Model 1 Model 2 Model 3 Model 4 Model 5a
Overall (N=1,158)
Sig Æ Null
Medium vs. Low
EOD -- -- -- -- --
EOD×time
-- -- -- -- --
High vs. Low
EOD -- -- -- -- --
EOD×time
-- -- -- -- --
Null Æ Sig.
Medium vs. Low
EOD -- -- -- -- --
EOD×time
-- -- -- -- --
High vs. Low
EOD -- -- -- -- --
EOD×time
-- -- -- -- --
ACCEPTED
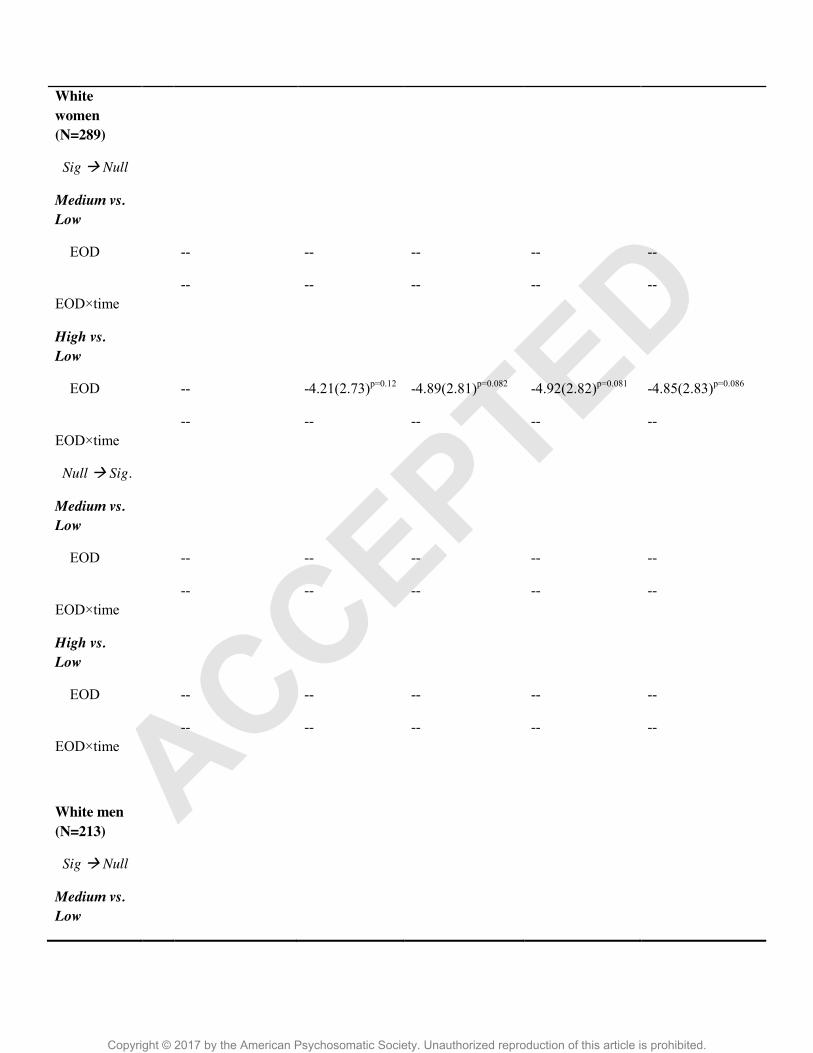
Copyright © 2017 by the American Psychosomatic Society. Unauthorized reproduction of this article is prohibited.
White women (N=289)
Sig Æ Null
Medium vs. Low
EOD -- -- -- -- --
EOD×time
-- -- -- -- --
High vs. Low
EOD -- -4.21(2.73)p=0.12 -4.89(2.81)p=0.082 -4.92(2.82)p=0.081 -4.85(2.83)p=0.086
EOD×time
-- -- -- -- --
Null Æ Sig.
Medium vs. Low
EOD -- -- -- -- --
EOD×time
-- -- -- -- --
High vs. Low
EOD -- -- -- -- --
EOD×time
-- -- -- -- --
White men (N=213)
Sig Æ Null
Medium vs. Low
ACCEPTED

Copyright © 2017 by the American Psychosomatic Society. Unauthorized reproduction of this article is prohibited.
EOD -- -- -- -- --
EOD×time
-- -- -- -- --
High vs. Low
EOD +2.42(2.36)p=0.31 -- -- -- --
EOD×time
-- -- -- -- --
Null Æ Sig.
Medium vs. Low
EOD -- -- -- -- --
EOD×time
-- -- -- -- --
High vs. Low
EOD -- -- -- -- --
EOD×time
-- -- -- -- --
AA women (N=383)
Sig Æ Null
Medium vs. Low
EOD -- -- -- -- --
EOD×time
-- -- -- -- --
High vs. Low
EOD -- -- -- -- --
-- -- -- -- --
ACCEPTED

Copyright © 2017 by the American Psychosomatic Society. Unauthorized reproduction of this article is prohibited.
EOD×time
Null Æ Sig.
Medium vs. Low
EOD -- -- -- -- --
EOD×time
-- -- -- -- --
High vs. Low
EOD -- -- -- -- --
EOD×time
-- -- -- -- --
AA men (N=273)
Sig Æ Null
Medium vs. Low
EOD -- -- -- -- --
EOD×time
-- -- -- -- --
High vs. Low
EOD -- -- -- -- --
EOD×time
-- -- -- -- --
Null Æ Sig.
Medium vs. Low
EOD -- -- -- -- --
EOD×time
-- -- -- -- --
ACCEPTED

Copyright © 2017 by the American Psychosomatic Society. Unauthorized reproduction of this article is prohibited.
High vs. Low
EOD -- -- -- -- --
EOD×time
-- -- -- -- --
-- no change in significance was noted between the main analysis and the sensitivity analysis.
a Model 5 included ACR as an additional variable to Model 4. All models had a total sample size of N=1,158 and thus included only participants with complete data on ACR.
ACCEPTED

Copyright © 2017 by the American Psychosomatic Society. Unauthorized reproduction of this article is prohibited.
Table S7. Sensitivity analysis for OLS regression models with EOD: overall, and stratified by sex×race
.
Model 1 Model 2 Model 3 Model 4 Model 5a
Overall (N=1,158)
Sig Æ Null
Medium vs. Low
EOD -- -- -- -- --
High vs. Low
EOD -- -- -- -- --
Null Æ Sig.
Medium vs. Low
EOD -- -- -- -- --
High vs. Low
EOD -- -- -- -- --
White women (N=289)
Sig Æ Null
Medium vs. Low
EOD -- -- -- -- --
High vs. Low
EOD -- -- -- -- --
Null Æ Sig.
ACCEPTED

Copyright © 2017 by the American Psychosomatic Society. Unauthorized reproduction of this article is prohibited.
Medium vs. Low
EOD -- -- -- -- --
High vs. Low
EOD -- -- -- -- --
White men (N=213)
Sig Æ Null
Medium vs. Low
EOD -- -- -- -- --
High vs. Low
EOD -- -- -- -- --
Null Æ Sig.
Medium vs. Low
EOD -- -- -- -- --
High vs. Low
EOD -- -- -- -- --
AA women (N=383)
Sig Æ Null
Medium vs. Low
EOD -- -- -- -- --
High vs. Low
EOD -- -- -- -- --
Null Æ Sig.
ACCEPTED

Copyright © 2017 by the American Psychosomatic Society. Unauthorized reproduction of this article is prohibited.
Medium vs. Low
EOD -- -- -- -- --
High vs. Low
EOD -- -- -- -- --
AA men (N=273)
Sig Æ Null
Medium vs. Low
EOD -- -- -- -- --
High vs. Low
EOD -- -- -- -- --
Null Æ Sig.
Medium vs. Low
EOD -- -- -- -- --
High vs. Low
EOD -- -- -- -- --
-- no change in significance was noted between the main analysis and the sensitivity analysis.
a Model 5 included ACR as an additional variable to Model 4. All models had a total sample size of N=1,158 and thus included only participants with complete data on ACR.
ACCEPTED
Related Documents