MEASURING RETURN AND VOLATILITY SPILLOVERS IN GLOBAL FINANCIAL MARKETS Pongsakorn Suwanpong FACULTY OF ECONOMICS, CHULALONGKORN UNIVERSITY – BANGKOK, THAILAND __________________________________________________________________ Abstract This paper purposely measures return and volatility spillovers in global financial markets, foreign exchange and equity markets, by employing the variance decomposition of a vector autoregression (VAR) and calculating into spillover indices, proposed by Diebold and Yilmaz (2009). The objectives of the paper is to investigate not only the sources of return and volatility spillovers in foreign exchange market, which may arise from regional or major trading partners’ currencies, but also to clarify the sources of return and volatility spillovers in equity market. In general, the empirical finding suggests that approximately 80% of forecast error variance comes from spillovers, both returns and volatilities. In particular, in analysis of currency market, the author found that the return spillover to Thai baht (THB), apart from itself, comes primarily from US dollar, Indonesian rupiah (IDR), and Singapore dollar (SGD). In addition, the volatility spillover to Thai baht (THB) arises from Indonesian rupiah (IDR) and Philippine peso (PHP). However, in an analysis of spillovers in equity market, the author found that the return spillover to Stock Exchange of Thailand (SET), apart from itself, results primarily from New York Stock Exchange (NYSE), while there are no volatility spillovers from other national equity markets to Stock Exchange of Thailand (SET).These empirical findings are essential for international portfolio managers devising portfolio strategies. Moreover, the policy implication is particular important to central bank for intervention the foreign exchange market in the case of excess volatility. I. Introduction The global foreign exchange activities have expedited in recent two decades on account of rapid globalization, especially in financial markets. Consistent with globalization, the speedy economic liberalization of the international trade and financial markets, conjointly the adoptions of floating exchange rate regime by industrialized countries in the early 1970s have made cross-border capital flows swift and effortless (Krugman and Obstfeld, 2009). This evolution has heralded an era of increased exchange rate risk and volatility in global currency market. These developments also indicate multiply occurrences of foreign exchange rate volatility spillovers and transmissions across currency markets. For comprehensive perspective, stock markets should be sensitive to the increasing volatility of exchange rates. Currency markets are also more responsive to global portfolio investments and innovations in stock markets resulting from the economic deregulation and integration in the global financial market since the 1980s (Yang and Doong, 2004).

Welcome message from author
This document is posted to help you gain knowledge. Please leave a comment to let me know what you think about it! Share it to your friends and learn new things together.
Transcript
MEASURING RETURN AND VOLATILITY SPILLOVERS
IN GLOBAL FINANCIAL MARKETS
Pongsakorn Suwanpong
FACULTY OF ECONOMICS, CHULALONGKORN UNIVERSITY – BANGKOK, THAILAND
__________________________________________________________________
Abstract
This paper purposely measures return and volatility spillovers in global financial markets,
foreign exchange and equity markets, by employing the variance decomposition of a vector
autoregression (VAR) and calculating into spillover indices, proposed by Diebold and Yilmaz (2009).
The objectives of the paper is to investigate not only the sources of return and volatility spillovers in
foreign exchange market, which may arise from regional or major trading partners’ currencies, but also
to clarify the sources of return and volatility spillovers in equity market. In general, the empirical finding
suggests that approximately 80% of forecast error variance comes from spillovers, both returns and
volatilities. In particular, in analysis of currency market, the author found that the return spillover to
Thai baht (THB), apart from itself, comes primarily from US dollar, Indonesian rupiah (IDR), and
Singapore dollar (SGD). In addition, the volatility spillover to Thai baht (THB) arises from Indonesian
rupiah (IDR) and Philippine peso (PHP). However, in an analysis of spillovers in equity market, the
author found that the return spillover to Stock Exchange of Thailand (SET), apart from itself, results
primarily from New York Stock Exchange (NYSE), while there are no volatility spillovers from other
national equity markets to Stock Exchange of Thailand (SET).These empirical findings are essential for
international portfolio managers devising portfolio strategies. Moreover, the policy implication is
particular important to central bank for intervention the foreign exchange market in the case of excess
volatility.
I. Introduction
The global foreign exchange activities have expedited in recent two decades on account of rapid
globalization, especially in financial markets. Consistent with globalization, the speedy economic
liberalization of the international trade and financial markets, conjointly the adoptions of floating
exchange rate regime by industrialized countries in the early 1970s have made cross-border capital flows
swift and effortless (Krugman and Obstfeld, 2009). This evolution has heralded an era of increased
exchange rate risk and volatility in global currency market. These developments also indicate multiply
occurrences of foreign exchange rate volatility spillovers and transmissions across currency markets. For
comprehensive perspective, stock markets should be sensitive to the increasing volatility of exchange
rates. Currency markets are also more responsive to global portfolio investments and innovations in
stock markets resulting from the economic deregulation and integration in the global financial market
since the 1980s (Yang and Doong, 2004).
In relevant literature, theoretical links between stock prices and exchange rates have taken two
forms. Firstly, “flow-oriented” models of exchange rate determination (Dornbusch and Fisher, 1980)
assume that the exchange rate is determined largely by a country’s current account or trade balance
performance. These models posit that changes in exchange rates affect international competitiveness and
trade balance, thereby influencing real economic variables such as real income and output. Stock prices,
usually defined as a present value of future cash flows of firms, should adjust to the economic
perspectives. Thus, flow oriented models represent a positive relationship between stock prices and
exchanges rates with direction of causation running from exchange rates to stock prices. . Causation can
be explained as follows. Domestic currency depreciation makes the local firms more competitive, thus
their exports become cheaper in international comparison. Higher exports lead to higher incomes and
increase in firms’ stock prices.
On the other hand, “stock oriented” models of exchange rate determination (Branson, 1983; Frankel,
1983) put much stress on the role of financial account in determining exchange rate dynamics. These
models view exchange rates as equating the supply and demand for assets such as stocks and bonds.
Since the values of financial assets are determined by the present values of their future cash flows,
expectations of relative currency values play a considerable role in their price movements, especially for
internationally held financial assets. Therefore, stock price innovations may affect exchange rate
dynamics.
Previous studies, which have examined the relationship between stock and foreign exchange markets
mainly for US (e.g. Aggarwal (1981), Soenen and Hennigar (1988), Roll (1992) and Chow et al.
(1997)), found different results concerning the links between the two markets. For example, Aggarwal
(1981) finds that revaluation of the US dollar is positively related to stock market returns. In contrast,
when Soenen and Hennigar (1988) considered a different period, 1980-1986, found a significantly
negative relationship. Roll (1992), who used daily data over the period 1988-1991 found also a positive
relationship between the two markets. On the other hand, Chow et al (1997) using monthly data for the
period 1977-1989 found no relationship for monthly excess stock returns and real exchange rate returns.
When repeating the exercise, however, with longer than six months horizons they found a positive
relationship between a strong dollar and stock returns. Despite the examination of the linkages and
interactions between exchange rates and stock prices, only a limited body of the paper has attempted to
analyze the possibility that there are return and volatility spillovers in currency and equity markets, and
volatility spillover effect can exist between the stock and currency markets. An examination of the
volatility spillover process also enhances the understanding of information transmission between stock
prices and exchange rates.
This paper purposely measures return and volatility spillovers in global financial markets, foreign
exchange and equity markets, by employing the variance decomposition of a vector autoregression
(VAR) and calculating into spillover indices, proposed by Diebold and Yilmaz (2009). The objectives of
the paper is to investigate not only the sources of return and volatility spillovers in foreign exchange
market, which may arise from regional or major trading partners’ currencies, but also to clarify the
sources of return and volatility spillovers in equity market. These empirical findings are essential for
international portfolio managers devising portfolio strategies. Moreover, the policy implication is
particular important to central bank for intervention the foreign exchange market in the case of excess
volatility.
The remainder of the paper is organized as follows. The next section exhibits the data and
methodological issues, the spillover index. Section III is the empirical findings in the global financial
markets and the empirical analysis. Section IV investigates the dynamic spillovers and interdependence
between the currency and equity markets. Finally, section V summarizes.
II. Data and Methodology
i. Data
The data set consists of daily equity market indices for 9 countries and exchange rates for 9
countries. The stock indices for 9 countries are NYSE Composite Index, FTSE MIB Index, Nikkei 225
Index, Jakarta Composite Index, FTSE Bursa Malaysia KLCI Index, Philippine SE Index, Straits Times
Index, SET index, and S&P/TSX Composite Index. The exchange rates (per US Dollar) for 9 countries
are trade-weighted U.S. dollar index, Great Britain pound (GBP), Japanese yen (JPY), Indonesian rupiah
(IDR), Malaysian ringgit (MYR), Philippine peso (PHP), Singapore dollar (SGD), Thai baht (THB), and
Canadian dollar (CAD) (see Appendix 1).
The datasets in equity market are daily nominal local-currency composite stock market indices
for ten recent years, Jan 2000 – Jan 2010, obtained from Bloomberg, and the datasets in currency market
are daily direct-quoted foreign exchange rate for ten recent years, Jan 2000 – Jan 2010, acquired from
Reuters. The daily data is aggregated into weekly observations to eliminate end-of-week effects and
time differences in trading sessions across markets. The paper employs the new methodology of
spillover estimation of Diebold and Yilmaz (2009) based on a standard VAR and the Cholesky
decomposition of an error variance-covariance matrix. The main instruments are return and volatility
spillovers. Spillovers are defined as short-run interdependencies, effects which fluctuations in one
market exert on other markets (Diebold and Yilmaz, 2009).
ii. Methodology
A statistical analysis of returns and volatility is employed to study stock market
interdependencies. Returns are calculated in accordance with the classical method as the change in log
price (Yang and Doong, 2004).
In order to remove time differences in trading across markets and end-of-week effects daily observations
are aggregated into weekly. Closing prices on each Wednesday represent weekly closing observations. If
Wednesday observation is absent, a corresponding adjacent value is used with priority to Thursday one.
Volatility is assessed following the Garman and Klass (1980) approach incorporating of stock market
information available for investors – low, high, opening, and closing prices. Obviously, this estimator is
more efficient than the classical estimation since it demands the process of continuous price observation
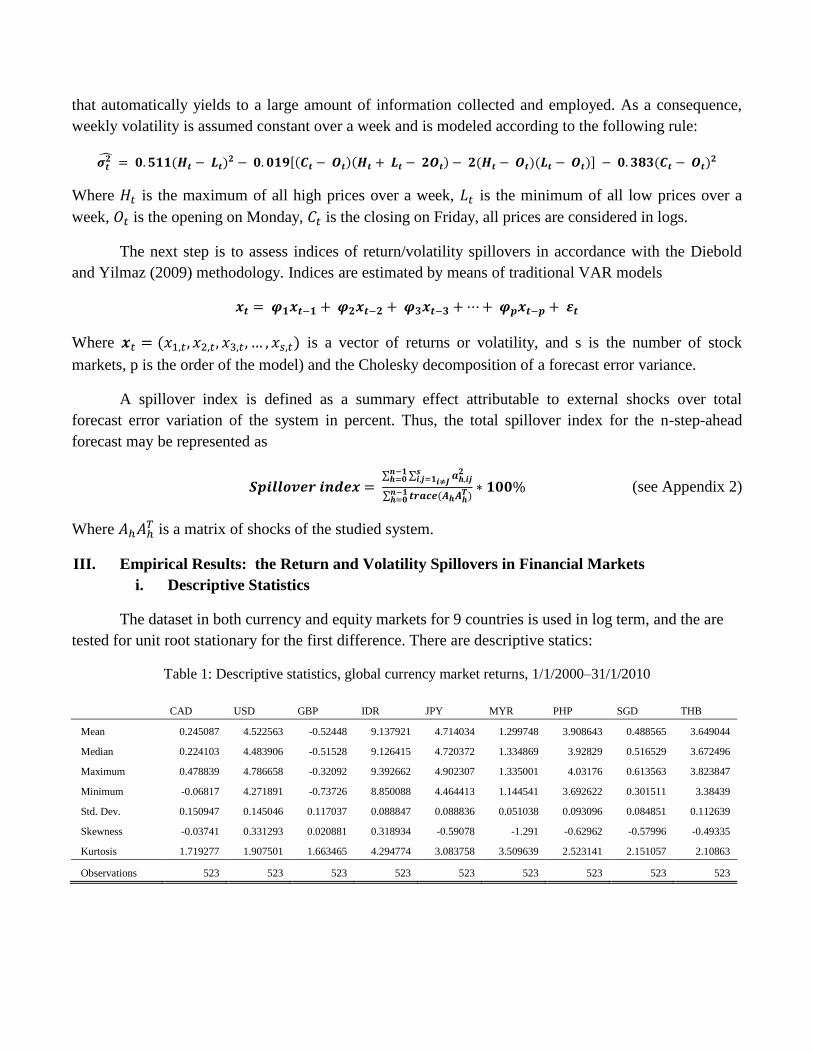
that automatically yields to a large amount of information collected and employed. As a consequence,
weekly volatility is assumed constant over a week and is modeled according to the following rule:
Where is the maximum of all high prices over a week, is the minimum of all low prices over a
week, is the opening on Monday, is the closing on Friday, all prices are considered in logs.
The next step is to assess indices of return/volatility spillovers in accordance with the Diebold
and Yilmaz (2009) methodology. Indices are estimated by means of traditional VAR models
Where is a vector of returns or volatility, and s is the number of stock
markets, p is the order of the model) and the Cholesky decomposition of a forecast error variance.
A spillover index is defined as a summary effect attributable to external shocks over total
forecast error variation of the system in percent. Thus, the total spillover index for the n-step-ahead
forecast may be represented as
(see Appendix 2)
Where is a matrix of shocks of the studied system.
III. Empirical Results: the Return and Volatility Spillovers in Financial Markets
i. Descriptive Statistics
The dataset in both currency and equity markets for 9 countries is used in log term, and the are
tested for unit root stationary for the first difference. There are descriptive statics:
Table 1: Descriptive statistics, global currency market returns, 1/1/2000–31/1/2010
CAD USD GBP IDR JPY MYR PHP SGD THB
Mean 0.245087 4.522563 -0.52448 9.137921 4.714034 1.299748 3.908643 0.488565 3.649044
Median 0.224103 4.483906 -0.51528 9.126415 4.720372 1.334869 3.92829 0.516529 3.672496
Maximum 0.478839 4.786658 -0.32092 9.392662 4.902307 1.335001 4.03176 0.613563 3.823847
Minimum -0.06817 4.271891 -0.73726 8.850088 4.464413 1.144541 3.692622 0.301511 3.38439
Std. Dev. 0.150947 0.145046 0.117037 0.088847 0.088836 0.051038 0.093096 0.084851 0.112639
Skewness -0.03741 0.331293 0.020881 0.318934 -0.59078 -1.291 -0.62962 -0.57996 -0.49335
Kurtosis 1.719277 1.907501 1.663465 4.294774 3.083758 3.509639 2.523141 2.151057 2.10863
Observations 523 523 523 523 523 523 523 523 523
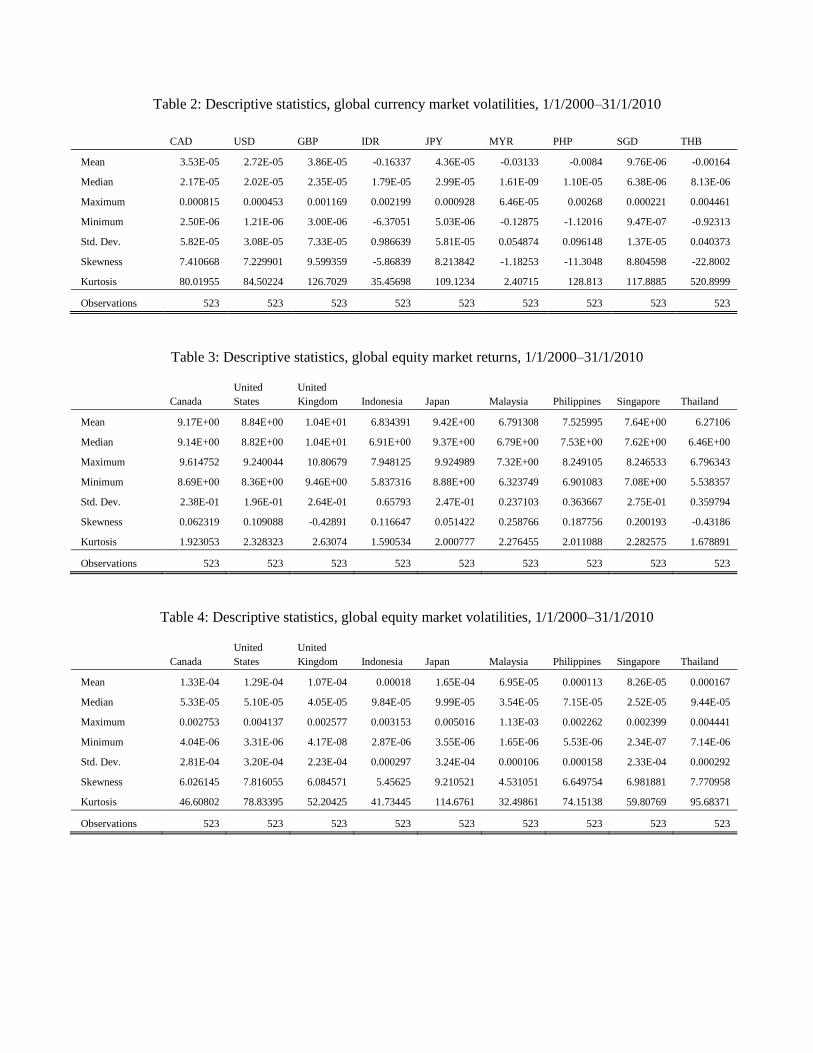
Table 2: Descriptive statistics, global currency market volatilities, 1/1/2000–31/1/2010
CAD USD GBP IDR JPY MYR PHP SGD THB
Mean 3.53E-05 2.72E-05 3.86E-05 -0.16337 4.36E-05 -0.03133 -0.0084 9.76E-06 -0.00164
Median 2.17E-05 2.02E-05 2.35E-05 1.79E-05 2.99E-05 1.61E-09 1.10E-05 6.38E-06 8.13E-06
Maximum 0.000815 0.000453 0.001169 0.002199 0.000928 6.46E-05 0.00268 0.000221 0.004461
Minimum 2.50E-06 1.21E-06 3.00E-06 -6.37051 5.03E-06 -0.12875 -1.12016 9.47E-07 -0.92313
Std. Dev. 5.82E-05 3.08E-05 7.33E-05 0.986639 5.81E-05 0.054874 0.096148 1.37E-05 0.040373
Skewness 7.410668 7.229901 9.599359 -5.86839 8.213842 -1.18253 -11.3048 8.804598 -22.8002
Kurtosis 80.01955 84.50224 126.7029 35.45698 109.1234 2.40715 128.813 117.8885 520.8999
Observations 523 523 523 523 523 523 523 523 523
Table 3: Descriptive statistics, global equity market returns, 1/1/2000–31/1/2010
Canada
United
States
United
Kingdom Indonesia Japan Malaysia Philippines Singapore Thailand
Mean 9.17E+00 8.84E+00 1.04E+01 6.834391 9.42E+00 6.791308 7.525995 7.64E+00 6.27106
Median 9.14E+00 8.82E+00 1.04E+01 6.91E+00 9.37E+00 6.79E+00 7.53E+00 7.62E+00 6.46E+00
Maximum 9.614752 9.240044 10.80679 7.948125 9.924989 7.32E+00 8.249105 8.246533 6.796343
Minimum 8.69E+00 8.36E+00 9.46E+00 5.837316 8.88E+00 6.323749 6.901083 7.08E+00 5.538357
Std. Dev. 2.38E-01 1.96E-01 2.64E-01 0.65793 2.47E-01 0.237103 0.363667 2.75E-01 0.359794
Skewness 0.062319 0.109088 -0.42891 0.116647 0.051422 0.258766 0.187756 0.200193 -0.43186
Kurtosis 1.923053 2.328323 2.63074 1.590534 2.000777 2.276455 2.011088 2.282575 1.678891
Observations 523 523 523 523 523 523 523 523 523
Table 4: Descriptive statistics, global equity market volatilities, 1/1/2000–31/1/2010
Canada
United
States
United
Kingdom Indonesia Japan Malaysia Philippines Singapore Thailand
Mean 1.33E-04 1.29E-04 1.07E-04 0.00018 1.65E-04 6.95E-05 0.000113 8.26E-05 0.000167
Median 5.33E-05 5.10E-05 4.05E-05 9.84E-05 9.99E-05 3.54E-05 7.15E-05 2.52E-05 9.44E-05
Maximum 0.002753 0.004137 0.002577 0.003153 0.005016 1.13E-03 0.002262 0.002399 0.004441
Minimum 4.04E-06 3.31E-06 4.17E-08 2.87E-06 3.55E-06 1.65E-06 5.53E-06 2.34E-07 7.14E-06
Std. Dev. 2.81E-04 3.20E-04 2.23E-04 0.000297 3.24E-04 0.000106 0.000158 2.33E-04 0.000292
Skewness 6.026145 7.816055 6.084571 5.45625 9.210521 4.531051 6.649754 6.981881 7.770958
Kurtosis 46.60802 78.83395 52.20425 41.73445 114.6761 32.49861 74.15138 59.80769 95.68371
Observations 523 523 523 523 523 523 523 523 523
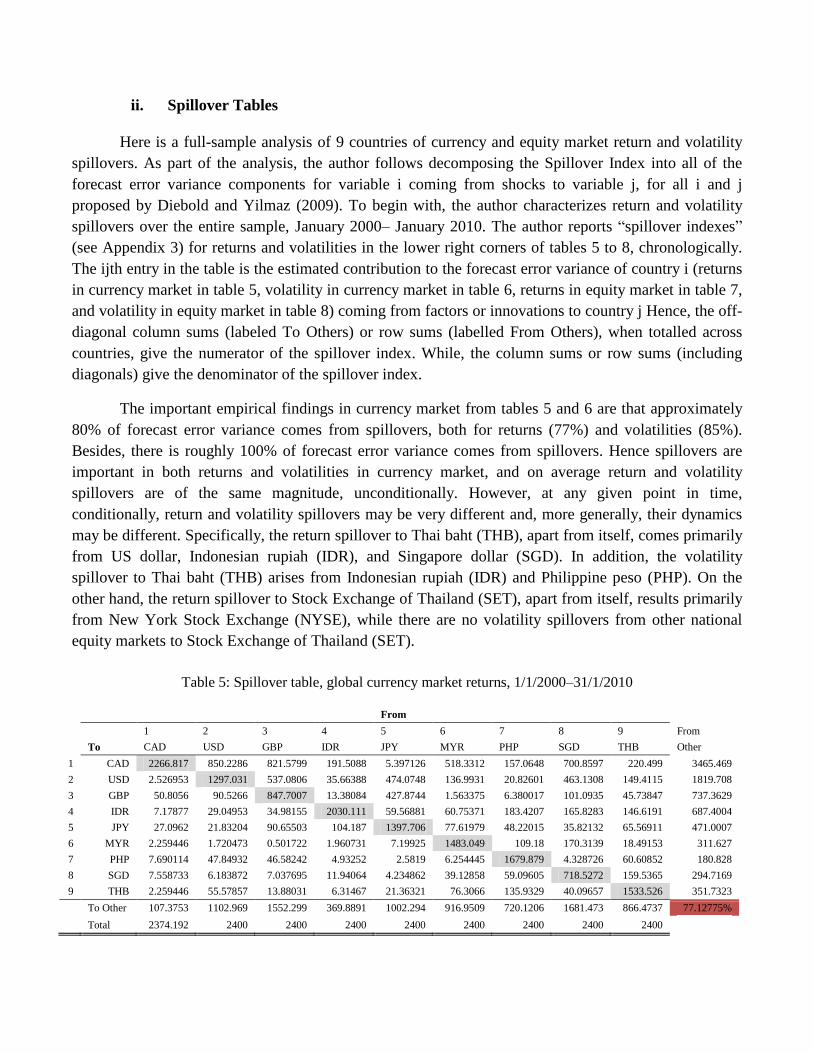
ii. Spillover Tables
Here is a full-sample analysis of 9 countries of currency and equity market return and volatility
spillovers. As part of the analysis, the author follows decomposing the Spillover Index into all of the
forecast error variance components for variable i coming from shocks to variable j, for all i and j
proposed by Diebold and Yilmaz (2009). To begin with, the author characterizes return and volatility
spillovers over the entire sample, January 2000– January 2010. The author reports “spillover indexes”
(see Appendix 3) for returns and volatilities in the lower right corners of tables 5 to 8, chronologically.
The ijth entry in the table is the estimated contribution to the forecast error variance of country i (returns
in currency market in table 5, volatility in currency market in table 6, returns in equity market in table 7,
and volatility in equity market in table 8) coming from factors or innovations to country j Hence, the off-
diagonal column sums (labeled To Others) or row sums (labelled From Others), when totalled across
countries, give the numerator of the spillover index. While, the column sums or row sums (including
diagonals) give the denominator of the spillover index.
The important empirical findings in currency market from tables 5 and 6 are that approximately
80% of forecast error variance comes from spillovers, both for returns (77%) and volatilities (85%).
Besides, there is roughly 100% of forecast error variance comes from spillovers. Hence spillovers are
important in both returns and volatilities in currency market, and on average return and volatility
spillovers are of the same magnitude, unconditionally. However, at any given point in time,
conditionally, return and volatility spillovers may be very different and, more generally, their dynamics
may be different. Specifically, the return spillover to Thai baht (THB), apart from itself, comes primarily
from US dollar, Indonesian rupiah (IDR), and Singapore dollar (SGD). In addition, the volatility
spillover to Thai baht (THB) arises from Indonesian rupiah (IDR) and Philippine peso (PHP). On the
other hand, the return spillover to Stock Exchange of Thailand (SET), apart from itself, results primarily
from New York Stock Exchange (NYSE), while there are no volatility spillovers from other national
equity markets to Stock Exchange of Thailand (SET).
Table 5: Spillover table, global currency market returns, 1/1/2000–31/1/2010
From
1 2 3 4 5 6 7 8 9 From
To CAD USD GBP IDR JPY MYR PHP SGD THB Other
1 CAD 2266.817 850.2286 821.5799 191.5088 5.397126 518.3312 157.0648 700.8597 220.499 3465.469
2 USD 2.526953 1297.031 537.0806 35.66388 474.0748 136.9931 20.82601 463.1308 149.4115 1819.708
3 GBP 50.8056 90.5266 847.7007 13.38084 427.8744 1.563375 6.380017 101.0935 45.73847 737.3629
4 IDR 7.17877 29.04953 34.98155 2030.111 59.56881 60.75371 183.4207 165.8283 146.6191 687.4004
5 JPY 27.0962 21.83204 90.65503 104.187 1397.706 77.61979 48.22015 35.82132 65.56911 471.0007
6 MYR 2.259446 1.720473 0.501722 1.960731 7.19925 1483.049 109.18 170.3139 18.49153 311.627
7 PHP 7.690114 47.84932 46.58242 4.93252 2.5819 6.254445 1679.879 4.328726 60.60852 180.828
8 SGD 7.558733 6.183872 7.037695 11.94064 4.234862 39.12858 59.09605 718.5272 159.5365 294.7169
9 THB 2.259446 55.57857 13.88031 6.31467 21.36321 76.3066 135.9329 40.09657 1533.526 351.7323
To Other 107.3753 1102.969 1552.299 369.8891 1002.294 916.9509 720.1206 1681.473 866.4737 77.12775%
Total 2374.192 2400 2400 2400 2400 2400 2400 2400 2400
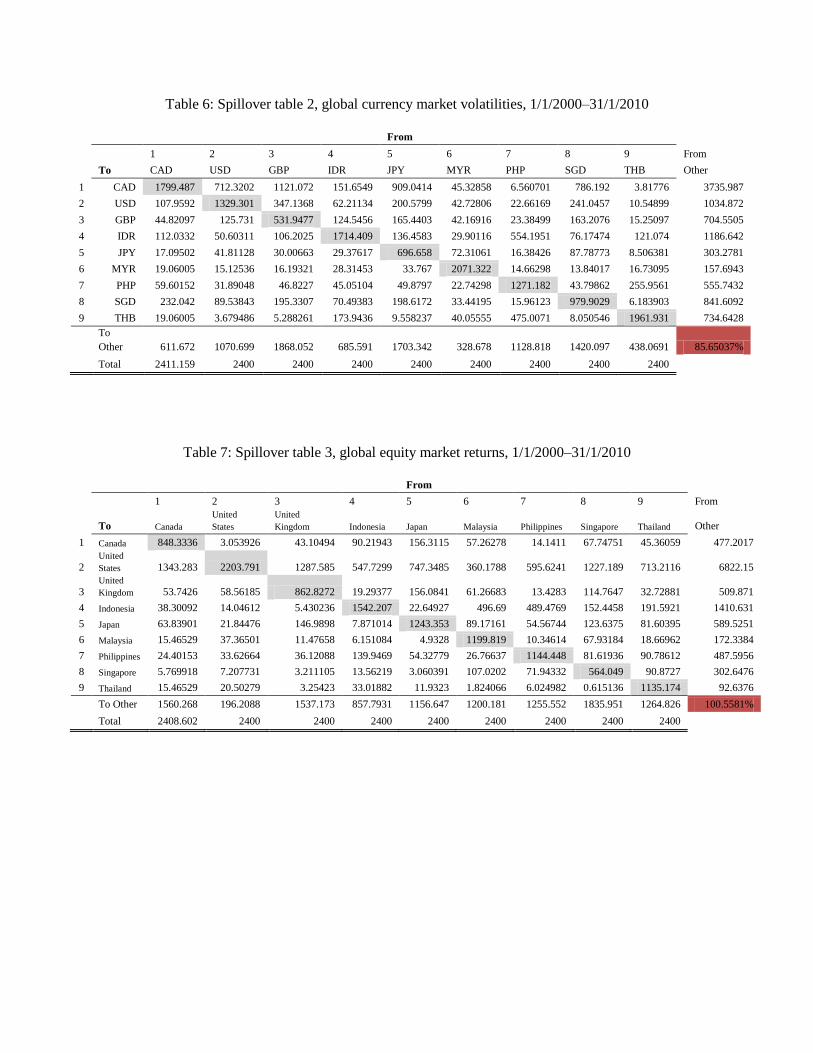
Table 6: Spillover table 2, global currency market volatilities, 1/1/2000–31/1/2010
From
1 2 3 4 5 6 7 8 9 From
To CAD USD GBP IDR JPY MYR PHP SGD THB Other
1 CAD 1799.487 712.3202 1121.072 151.6549 909.0414 45.32858 6.560701 786.192 3.81776 3735.987
2 USD 107.9592 1329.301 347.1368 62.21134 200.5799 42.72806 22.66169 241.0457 10.54899 1034.872
3 GBP 44.82097 125.731 531.9477 124.5456 165.4403 42.16916 23.38499 163.2076 15.25097 704.5505
4 IDR 112.0332 50.60311 106.2025 1714.409 136.4583 29.90116 554.1951 76.17474 121.074 1186.642
5 JPY 17.09502 41.81128 30.00663 29.37617 696.658 72.31061 16.38426 87.78773 8.506381 303.2781
6 MYR 19.06005 15.12536 16.19321 28.31453 33.767 2071.322 14.66298 13.84017 16.73095 157.6943
7 PHP 59.60152 31.89048 46.8227 45.05104 49.8797 22.74298 1271.182 43.79862 255.9561 555.7432
8 SGD 232.042 89.53843 195.3307 70.49383 198.6172 33.44195 15.96123 979.9029 6.183903 841.6092
9 THB 19.06005 3.679486 5.288261 173.9436 9.558237 40.05555 475.0071 8.050546 1961.931 734.6428
To
Other 611.672 1070.699 1868.052 685.591 1703.342 328.678 1128.818 1420.097 438.0691 85.65037%
Total 2411.159 2400 2400 2400 2400 2400 2400 2400 2400
Table 7: Spillover table 3, global equity market returns, 1/1/2000–31/1/2010
From
1 2 3 4 5 6 7 8 9 From
To Canada
United
States
United
Kingdom Indonesia Japan Malaysia Philippines Singapore Thailand Other
1 Canada 848.3336 3.053926 43.10494 90.21943 156.3115 57.26278 14.1411 67.74751 45.36059 477.2017
2 United
States 1343.283 2203.791 1287.585 547.7299 747.3485 360.1788 595.6241 1227.189 713.2116 6822.15
3 United
Kingdom 53.7426 58.56185 862.8272 19.29377 156.0841 61.26683 13.4283 114.7647 32.72881 509.871
4 Indonesia 38.30092 14.04612 5.430236 1542.207 22.64927 496.69 489.4769 152.4458 191.5921 1410.631
5 Japan 63.83901 21.84476 146.9898 7.871014 1243.353 89.17161 54.56744 123.6375 81.60395 589.5251
6 Malaysia 15.46529 37.36501 11.47658 6.151084 4.9328 1199.819 10.34614 67.93184 18.66962 172.3384
7 Philippines 24.40153 33.62664 36.12088 139.9469 54.32779 26.76637 1144.448 81.61936 90.78612 487.5956
8 Singapore 5.769918 7.207731 3.211105 13.56219 3.060391 107.0202 71.94332 564.049 90.8727 302.6476
9 Thailand 15.46529 20.50279 3.25423 33.01882 11.9323 1.824066 6.024982 0.615136 1135.174 92.6376
To Other 1560.268 196.2088 1537.173 857.7931 1156.647 1200.181 1255.552 1835.951 1264.826 100.5581%
Total 2408.602 2400 2400 2400 2400 2400 2400 2400 2400
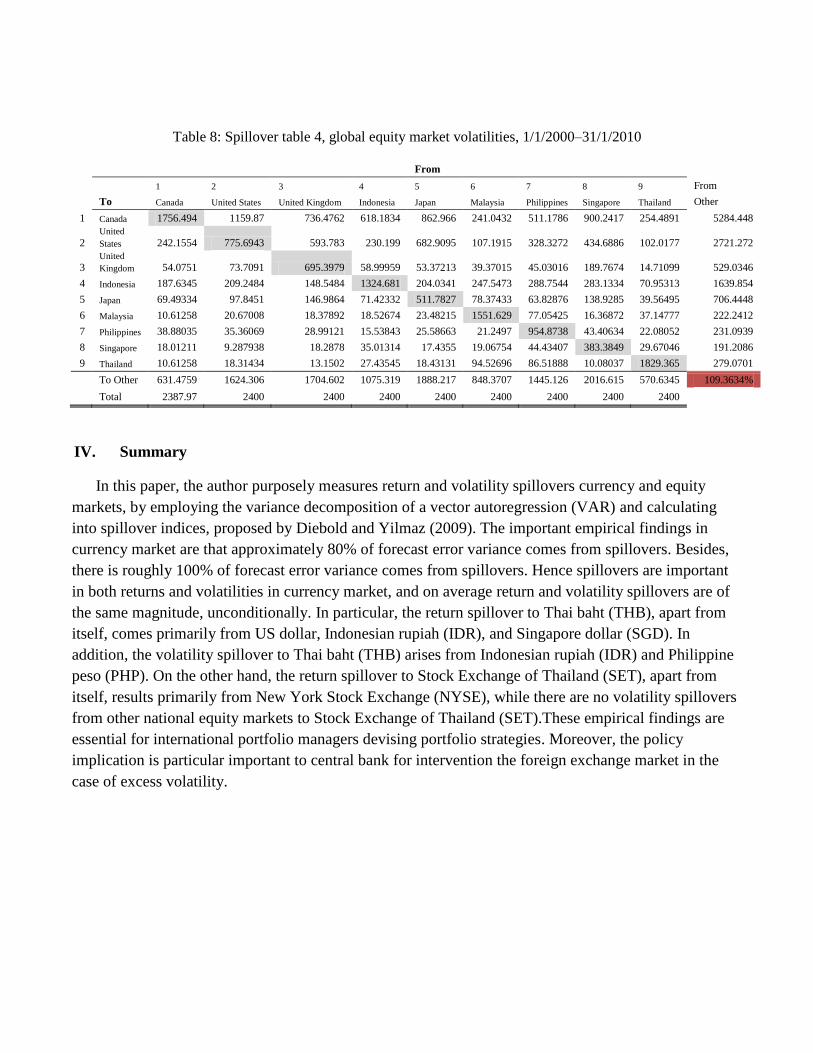
Table 8: Spillover table 4, global equity market volatilities, 1/1/2000–31/1/2010
From
1 2 3 4 5 6 7 8 9 From
To Canada United States United Kingdom Indonesia Japan Malaysia Philippines Singapore Thailand Other
1 Canada 1756.494 1159.87 736.4762 618.1834 862.966 241.0432 511.1786 900.2417 254.4891 5284.448
2 United
States 242.1554 775.6943 593.783 230.199 682.9095 107.1915 328.3272 434.6886 102.0177 2721.272
3 United
Kingdom 54.0751 73.7091 695.3979 58.99959 53.37213 39.37015 45.03016 189.7674 14.71099 529.0346
4 Indonesia 187.6345 209.2484 148.5484 1324.681 204.0341 247.5473 288.7544 283.1334 70.95313 1639.854
5 Japan 69.49334 97.8451 146.9864 71.42332 511.7827 78.37433 63.82876 138.9285 39.56495 706.4448
6 Malaysia 10.61258 20.67008 18.37892 18.52674 23.48215 1551.629 77.05425 16.36872 37.14777 222.2412
7 Philippines 38.88035 35.36069 28.99121 15.53843 25.58663 21.2497 954.8738 43.40634 22.08052 231.0939
8 Singapore 18.01211 9.287938 18.2878 35.01314 17.4355 19.06754 44.43407 383.3849 29.67046 191.2086
9 Thailand 10.61258 18.31434 13.1502 27.43545 18.43131 94.52696 86.51888 10.08037 1829.365 279.0701
To Other 631.4759 1624.306 1704.602 1075.319 1888.217 848.3707 1445.126 2016.615 570.6345 109.3634%
Total 2387.97 2400 2400 2400 2400 2400 2400 2400 2400
IV. Summary
In this paper, the author purposely measures return and volatility spillovers currency and equity
markets, by employing the variance decomposition of a vector autoregression (VAR) and calculating
into spillover indices, proposed by Diebold and Yilmaz (2009). The important empirical findings in
currency market are that approximately 80% of forecast error variance comes from spillovers. Besides,
there is roughly 100% of forecast error variance comes from spillovers. Hence spillovers are important
in both returns and volatilities in currency market, and on average return and volatility spillovers are of
the same magnitude, unconditionally. In particular, the return spillover to Thai baht (THB), apart from
itself, comes primarily from US dollar, Indonesian rupiah (IDR), and Singapore dollar (SGD). In
addition, the volatility spillover to Thai baht (THB) arises from Indonesian rupiah (IDR) and Philippine
peso (PHP). On the other hand, the return spillover to Stock Exchange of Thailand (SET), apart from
itself, results primarily from New York Stock Exchange (NYSE), while there are no volatility spillovers
from other national equity markets to Stock Exchange of Thailand (SET).These empirical findings are
essential for international portfolio managers devising portfolio strategies. Moreover, the policy
implication is particular important to central bank for intervention the foreign exchange market in the
case of excess volatility.
References
Aggarwal, R. (1981), Exchange Rates and Stock Prices: A Study of the US Capital Markets under
Floating Exchange Rates, Akron Business and Economic Review, (Fall), pp.7-12.
Branson, W.H. 1983, Macroeconomic Determinants of Real Exchange Rate Risk, in R.J. Herring (ed.)
Managing Foreign Exchange Rate Risk, Cambridge University Press, Cambridge, MA.
Chow, E.H., W.Y. Lee and M.S. Solt, 1997, The Exchange Rate Risk Exposure of Asset Returns, Journal
of Business, 70, 105-123.
Diebold F. X., Yilmaz K., (2009), Measuring Financial Asset Return and Volatility Spillovers, With
Application to Global Equity Market, The Economic Journal, 2009, pp.158-171.
Doong, S. C. and Yang, S. Y., (2004), Price and Volatility Spillovers between Stock Markets and
Exchange Rates: Empirical Evidence from the G-7 Countries, International Journal of Business and
Economics, Vol. 3, No. 2, pp.139-153
Dornbusch, R. and S. Fischer, (1980), Exchange Rates and the Current Account, American Economic
Review, 70(5), pp.960-971.
Jeffrey A. Frankel., (1987), Monetary and Portfolio Balance Models of Exchange Rate Determination,
Economics Working Papers 8752, University of California at Berkeley
Garman, Mark B. and Michael J. Klass (1980), On the Estimation of Security Price Volatilities from
Historical Data, Journal of Business, 53, 67-78.
Krugman, P.R., and M. Obstfeld, 2009, International Economics: Theory and Policy, 8th Edition,
Pearson International Edition.
Roll, R., 1992, Industrial Structure and the Comparative Behaviour of International Stock Market
Indices, Journal of Finance, 47, 3-41.
Soenen, L.A. and E.S. Hennigar, 1988, An Analysis of Exchange Rates and Stock Prices - The US
Experience between 1980 and 1986, Akron Business and Economic Review, (Winter), pp.7-16.
Appendix
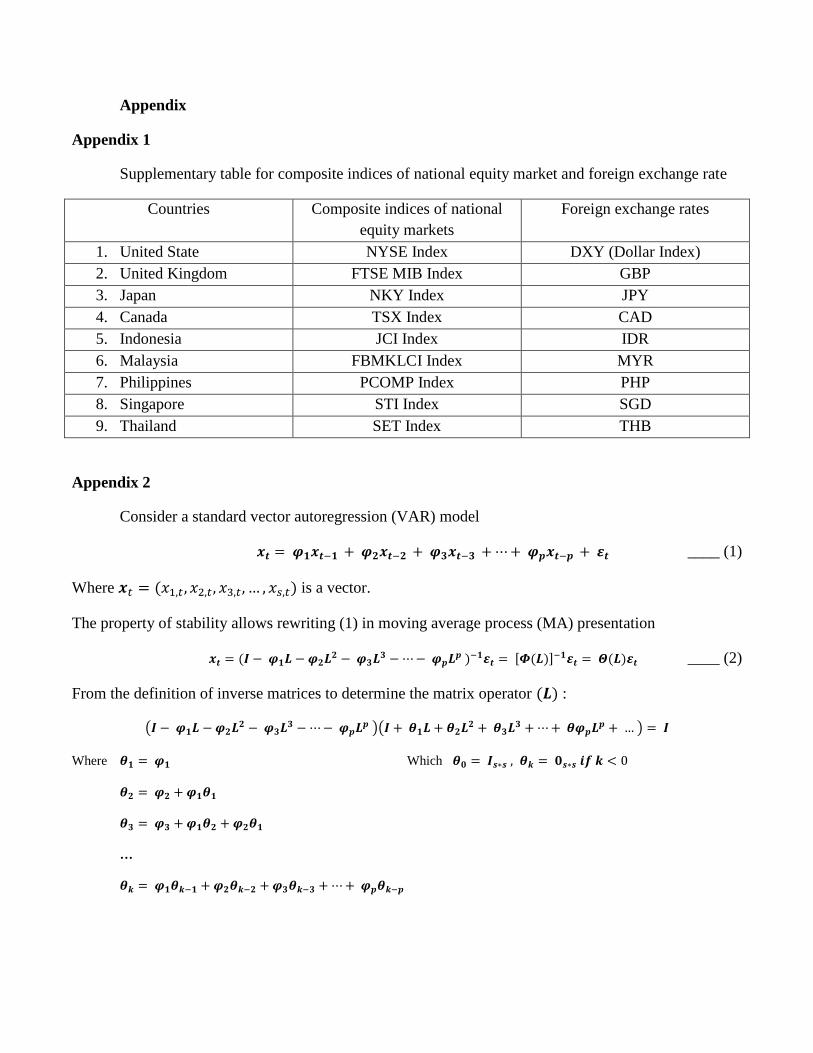
Appendix 1
Supplementary table for composite indices of national equity market and foreign exchange rate
Countries Composite indices of national
equity markets
Foreign exchange rates
1. United State NYSE Index DXY (Dollar Index)
2. United Kingdom FTSE MIB Index GBP
3. Japan NKY Index JPY
4. Canada TSX Index CAD
5. Indonesia JCI Index IDR
6. Malaysia FBMKLCI Index MYR
7. Philippines PCOMP Index PHP
8. Singapore STI Index SGD
9. Thailand SET Index THB
Appendix 2
Consider a standard vector autoregression (VAR) model
____ (1)
Where is a vector.
The property of stability allows rewriting (1) in moving average process (MA) presentation
____ (2)
From the definition of inverse matrices to determine the matrix operator :
Where Which
…
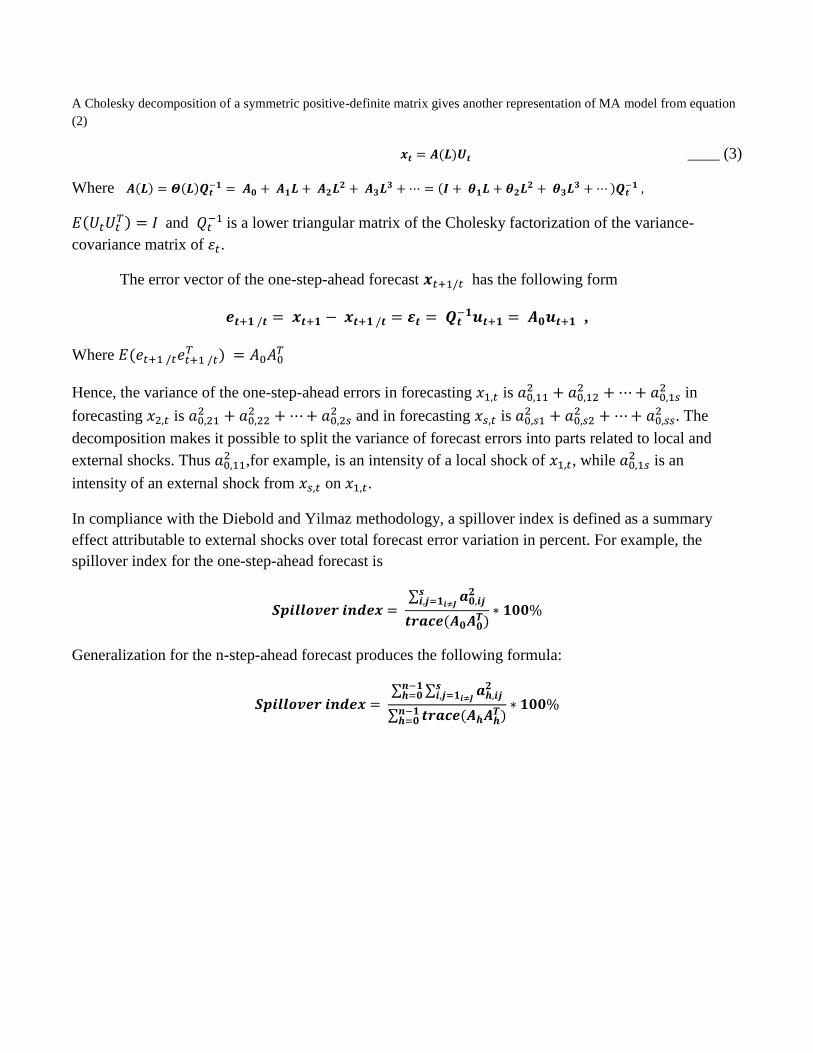
A Cholesky decomposition of a symmetric positive-definite matrix gives another representation of MA model from equation
(2)
____ (3)
Where
and
is a lower triangular matrix of the Cholesky factorization of the variance-
covariance matrix of .
The error vector of the one-step-ahead forecast has the following form
,
Where
Hence, the variance of the one-step-ahead errors in forecasting is
in
forecasting is
and in forecasting is
. The
decomposition makes it possible to split the variance of forecast errors into parts related to local and
external shocks. Thus ,for example, is an intensity of a local shock of , while
is an
intensity of an external shock from on .
In compliance with the Diebold and Yilmaz methodology, a spillover index is defined as a summary
effect attributable to external shocks over total forecast error variation in percent. For example, the
spillover index for the one-step-ahead forecast is
Generalization for the n-step-ahead forecast produces the following formula:
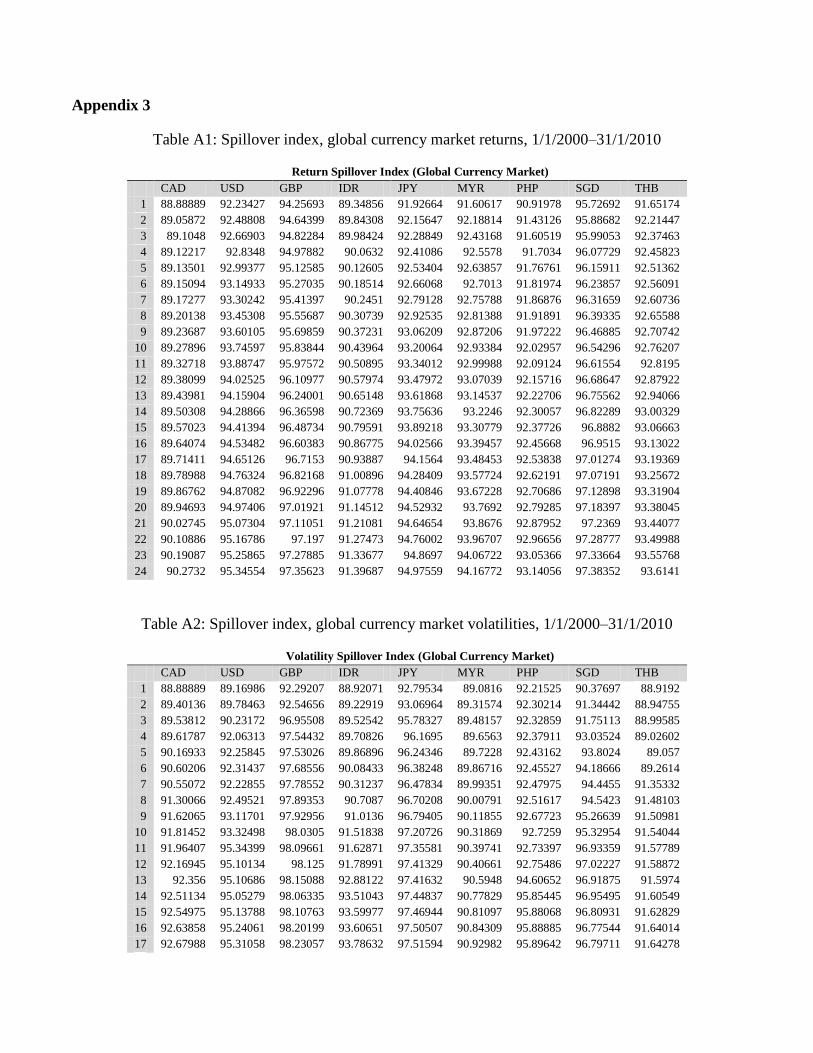
Appendix 3
Table A1: Spillover index, global currency market returns, 1/1/2000–31/1/2010
Return Spillover Index (Global Currency Market)
CAD USD GBP IDR JPY MYR PHP SGD THB
1 88.88889 92.23427 94.25693 89.34856 91.92664 91.60617 90.91978 95.72692 91.65174
2 89.05872 92.48808 94.64399 89.84308 92.15647 92.18814 91.43126 95.88682 92.21447
3 89.1048 92.66903 94.82284 89.98424 92.28849 92.43168 91.60519 95.99053 92.37463
4 89.12217 92.8348 94.97882 90.0632 92.41086 92.5578 91.7034 96.07729 92.45823
5 89.13501 92.99377 95.12585 90.12605 92.53404 92.63857 91.76761 96.15911 92.51362
6 89.15094 93.14933 95.27035 90.18514 92.66068 92.7013 91.81974 96.23857 92.56091
7 89.17277 93.30242 95.41397 90.2451 92.79128 92.75788 91.86876 96.31659 92.60736
8 89.20138 93.45308 95.55687 90.30739 92.92535 92.81388 91.91891 96.39335 92.65588
9 89.23687 93.60105 95.69859 90.37231 93.06209 92.87206 91.97222 96.46885 92.70742
10 89.27896 93.74597 95.83844 90.43964 93.20064 92.93384 92.02957 96.54296 92.76207
11 89.32718 93.88747 95.97572 90.50895 93.34012 92.99988 92.09124 96.61554 92.8195
12 89.38099 94.02525 96.10977 90.57974 93.47972 93.07039 92.15716 96.68647 92.87922
13 89.43981 94.15904 96.24001 90.65148 93.61868 93.14537 92.22706 96.75562 92.94066
14 89.50308 94.28866 96.36598 90.72369 93.75636 93.2246 92.30057 96.82289 93.00329
15 89.57023 94.41394 96.48734 90.79591 93.89218 93.30779 92.37726 96.8882 93.06663
16 89.64074 94.53482 96.60383 90.86775 94.02566 93.39457 92.45668 96.9515 93.13022
17 89.71411 94.65126 96.7153 90.93887 94.1564 93.48453 92.53838 97.01274 93.19369
18 89.78988 94.76324 96.82168 91.00896 94.28409 93.57724 92.62191 97.07191 93.25672
19 89.86762 94.87082 96.92296 91.07778 94.40846 93.67228 92.70686 97.12898 93.31904
20 89.94693 94.97406 97.01921 91.14512 94.52932 93.7692 92.79285 97.18397 93.38045
21 90.02745 95.07304 97.11051 91.21081 94.64654 93.8676 92.87952 97.2369 93.44077
22 90.10886 95.16786 97.197 91.27473 94.76002 93.96707 92.96656 97.28777 93.49988
23 90.19087 95.25865 97.27885 91.33677 94.8697 94.06722 93.05366 97.33664 93.55768
24 90.2732 95.34554 97.35623 91.39687 94.97559 94.16772 93.14056 97.38352 93.6141
Table A2: Spillover index, global currency market volatilities, 1/1/2000–31/1/2010
Volatility Spillover Index (Global Currency Market)
CAD USD GBP IDR JPY MYR PHP SGD THB
1 88.88889 89.16986 92.29207 88.92071 92.79534 89.0816 92.21525 90.37697 88.9192
2 89.40136 89.78463 92.54656 89.22919 93.06964 89.31574 92.30214 91.34442 88.94755
3 89.53812 90.23172 96.95508 89.52542 95.78327 89.48157 92.32859 91.75113 88.99585
4 89.61787 92.06313 97.54432 89.70826 96.1695 89.6563 92.37911 93.03524 89.02602
5 90.16933 92.25845 97.53026 89.86896 96.24346 89.7228 92.43162 93.8024 89.057
6 90.60206 92.31437 97.68556 90.08433 96.38248 89.86716 92.45527 94.18666 89.2614
7 90.55072 92.22855 97.78552 90.31237 96.47834 89.99351 92.47975 94.4455 91.35332
8 91.30066 92.49521 97.89353 90.7087 96.70208 90.00791 92.51617 94.5423 91.48103
9 91.62065 93.11701 97.92956 91.0136 96.79405 90.11855 92.67723 95.26639 91.50981
10 91.81452 93.32498 98.0305 91.51838 97.20726 90.31869 92.7259 95.32954 91.54044
11 91.96407 95.34399 98.09661 91.62871 97.35581 90.39741 92.73397 96.93359 91.57789
12 92.16945 95.10134 98.125 91.78991 97.41329 90.40661 92.75486 97.02227 91.58872
13 92.356 95.10686 98.15088 92.88122 97.41632 90.5948 94.60652 96.91875 91.5974
14 92.51134 95.05279 98.06335 93.51043 97.44837 90.77829 95.85445 96.95495 91.60549
15 92.54975 95.13788 98.10763 93.59977 97.46944 90.81097 95.88068 96.80931 91.62829
16 92.63858 95.24061 98.20199 93.60651 97.50507 90.84309 95.88885 96.77544 91.64014
17 92.67988 95.31058 98.23057 93.78632 97.51594 90.92982 95.89642 96.79711 91.64278
18 92.70707 95.51222 98.21057 93.8532 97.52691 90.98273 95.90232 96.97117 91.64006
19 92.74174 95.50827 98.22343 93.88787 97.5259 91.01998 95.84058 96.97263 91.56066
20 92.79276 95.52509 98.22606 93.85725 97.53509 91.05084 95.76394 96.96484 91.47
21 92.80518 95.54764 98.23895 93.92893 97.55475 91.08256 95.77654 96.97577 91.47785
22 92.86194 95.57342 98.25596 93.97957 97.55244 91.08324 95.77864 96.96841 91.48515
23 92.88941 95.63147 98.28186 94.14227 97.56816 91.13917 95.78244 96.98133 91.49131
24 92.8856 95.71987 98.28888 94.16824 97.58065 91.16978 95.78632 96.99579 91.5103
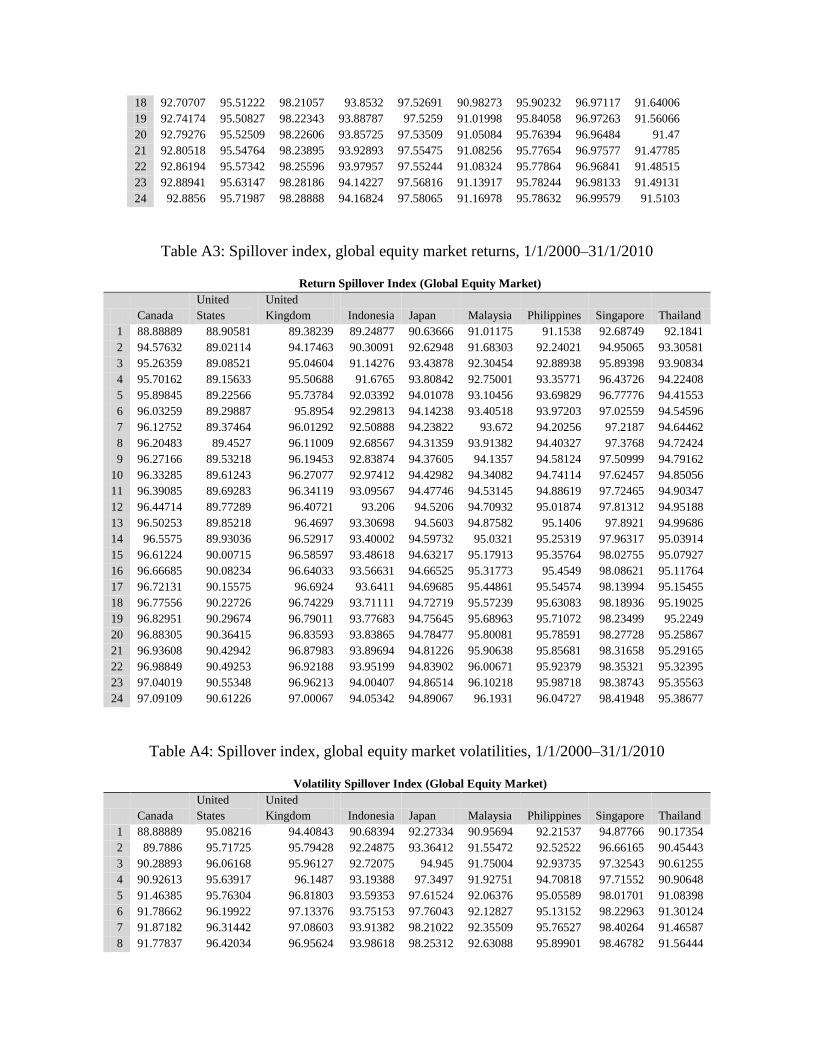
Table A3: Spillover index, global equity market returns, 1/1/2000–31/1/2010
Return Spillover Index (Global Equity Market)
Canada
United
States
United
Kingdom Indonesia Japan Malaysia Philippines Singapore Thailand
1 88.88889 88.90581 89.38239 89.24877 90.63666 91.01175 91.1538 92.68749 92.1841
2 94.57632 89.02114 94.17463 90.30091 92.62948 91.68303 92.24021 94.95065 93.30581
3 95.26359 89.08521 95.04604 91.14276 93.43878 92.30454 92.88938 95.89398 93.90834
4 95.70162 89.15633 95.50688 91.6765 93.80842 92.75001 93.35771 96.43726 94.22408
5 95.89845 89.22566 95.73784 92.03392 94.01078 93.10456 93.69829 96.77776 94.41553
6 96.03259 89.29887 95.8954 92.29813 94.14238 93.40518 93.97203 97.02559 94.54596
7 96.12752 89.37464 96.01292 92.50888 94.23822 93.672 94.20256 97.2187 94.64462
8 96.20483 89.4527 96.11009 92.68567 94.31359 93.91382 94.40327 97.3768 94.72424
9 96.27166 89.53218 96.19453 92.83874 94.37605 94.1357 94.58124 97.50999 94.79162
10 96.33285 89.61243 96.27077 92.97412 94.42982 94.34082 94.74114 97.62457 94.85056
11 96.39085 89.69283 96.34119 93.09567 94.47746 94.53145 94.88619 97.72465 94.90347
12 96.44714 89.77289 96.40721 93.206 94.5206 94.70932 95.01874 97.81312 94.95188
13 96.50253 89.85218 96.4697 93.30698 94.5603 94.87582 95.1406 97.8921 94.99686
14 96.5575 89.93036 96.52917 93.40002 94.59732 95.0321 95.25319 97.96317 95.03914
15 96.61224 90.00715 96.58597 93.48618 94.63217 95.17913 95.35764 98.02755 95.07927
16 96.66685 90.08234 96.64033 93.56631 94.66525 95.31773 95.4549 98.08621 95.11764
17 96.72131 90.15575 96.6924 93.6411 94.69685 95.44861 95.54574 98.13994 95.15455
18 96.77556 90.22726 96.74229 93.71111 94.72719 95.57239 95.63083 98.18936 95.19025
19 96.82951 90.29674 96.79011 93.77683 94.75645 95.68963 95.71072 98.23499 95.2249
20 96.88305 90.36415 96.83593 93.83865 94.78477 95.80081 95.78591 98.27728 95.25867
21 96.93608 90.42942 96.87983 93.89694 94.81226 95.90638 95.85681 98.31658 95.29165
22 96.98849 90.49253 96.92188 93.95199 94.83902 96.00671 95.92379 98.35321 95.32395
23 97.04019 90.55348 96.96213 94.00407 94.86514 96.10218 95.98718 98.38743 95.35563
24 97.09109 90.61226 97.00067 94.05342 94.89067 96.1931 96.04727 98.41948 95.38677
Table A4: Spillover index, global equity market volatilities, 1/1/2000–31/1/2010
Volatility Spillover Index (Global Equity Market)
Canada
United
States
United
Kingdom Indonesia Japan Malaysia Philippines Singapore Thailand
1 88.88889 95.08216 94.40843 90.68394 92.27334 90.95694 92.21537 94.87766 90.17354
2 89.7886 95.71725 95.79428 92.24875 93.36412 91.55472 92.52522 96.66165 90.45443
3 90.28893 96.06168 95.96127 92.72075 94.945 91.75004 92.93735 97.32543 90.61255
4 90.92613 95.63917 96.1487 93.19388 97.3497 91.92751 94.70818 97.71552 90.90648
5 91.46385 95.76304 96.81803 93.59353 97.61524 92.06376 95.05589 98.01701 91.08398
6 91.78662 96.19922 97.13376 93.75153 97.76043 92.12827 95.13152 98.22963 91.30124
7 91.87182 96.31442 97.08603 93.91382 98.21022 92.35509 95.76527 98.40264 91.46587
8 91.77837 96.42034 96.95624 93.98618 98.25312 92.63088 95.89901 98.46782 91.56444
9 91.9064 96.45724 96.97408 94.03241 98.2984 92.77421 95.95542 98.5166 91.62726
10 92.06691 96.5334 97.01005 94.15164 98.36472 92.82028 95.97093 98.55838 91.71594
11 92.12419 96.57257 96.99799 94.22417 98.37238 93.17602 96.19563 98.56777 91.76328
12 92.27859 96.59903 97.01178 94.25606 98.37605 93.25082 96.20554 98.57415 91.7894
13 92.30269 96.6162 97.01837 94.26283 98.3671 93.27079 96.21908 98.57336 91.80088
14 92.32313 96.6401 96.99702 94.28131 98.36655 93.28674 96.23542 98.58174 91.81747
15 92.36619 96.65674 97.00063 94.29178 98.36997 93.3091 96.24952 98.59149 91.82487
16 92.43933 96.68289 97.0186 94.32335 98.35706 93.32006 96.25828 98.60885 91.83862
17 92.45789 96.69553 97.00094 94.33705 98.34401 93.33692 96.2731 98.62258 91.85297
18 92.4735 96.70424 97.0245 94.34284 98.3401 93.35613 96.28638 98.62666 91.85605
19 92.49528 96.71869 97.05804 94.34641 98.3185 93.3676 96.2921 98.63672 91.86528
20 92.51593 96.73441 97.0657 94.3613 98.31015 93.37768 96.29797 98.64129 91.87509
21 92.53789 96.74365 97.06413 94.36804 98.30262 93.38773 96.30146 98.64476 91.87863
22 92.56904 96.75075 97.06597 94.3718 98.29624 93.39338 96.30373 98.64888 91.88429
23 92.58479 96.75166 97.06232 94.38019 98.29237 93.39991 96.30959 98.65363 91.89097
24 92.59903 96.75739 97.05668 94.38967 98.2879 93.40216 96.31094 98.65747 91.89363
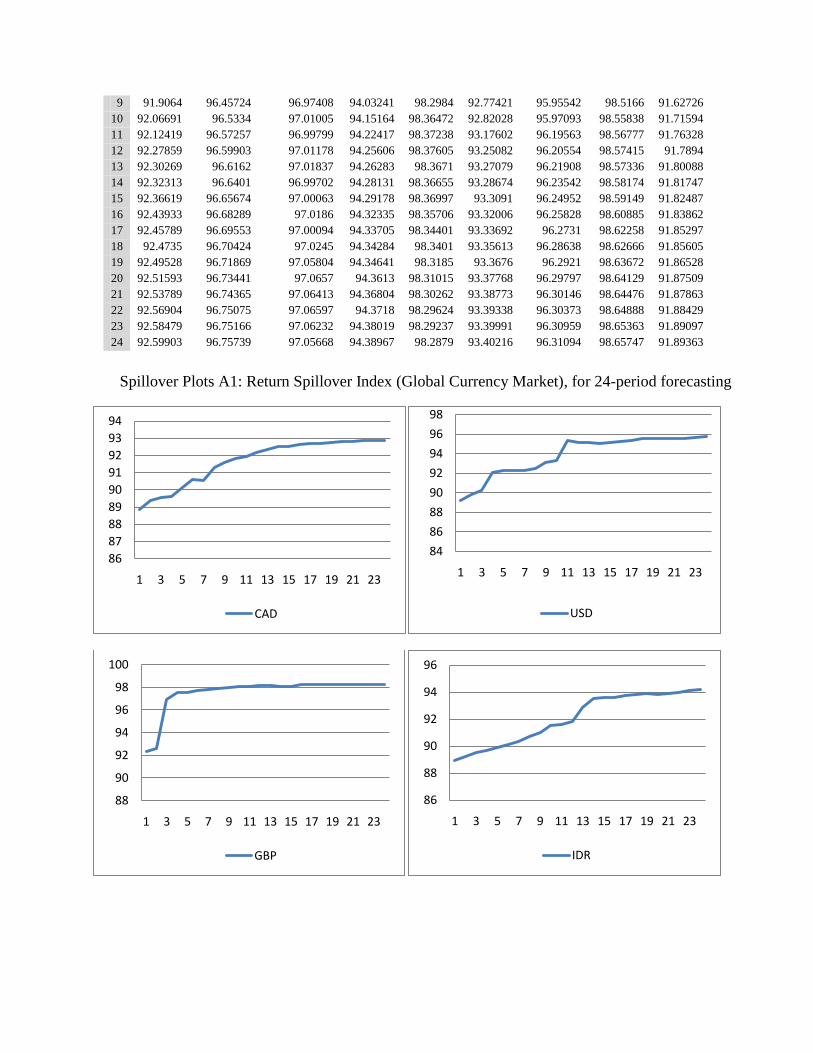
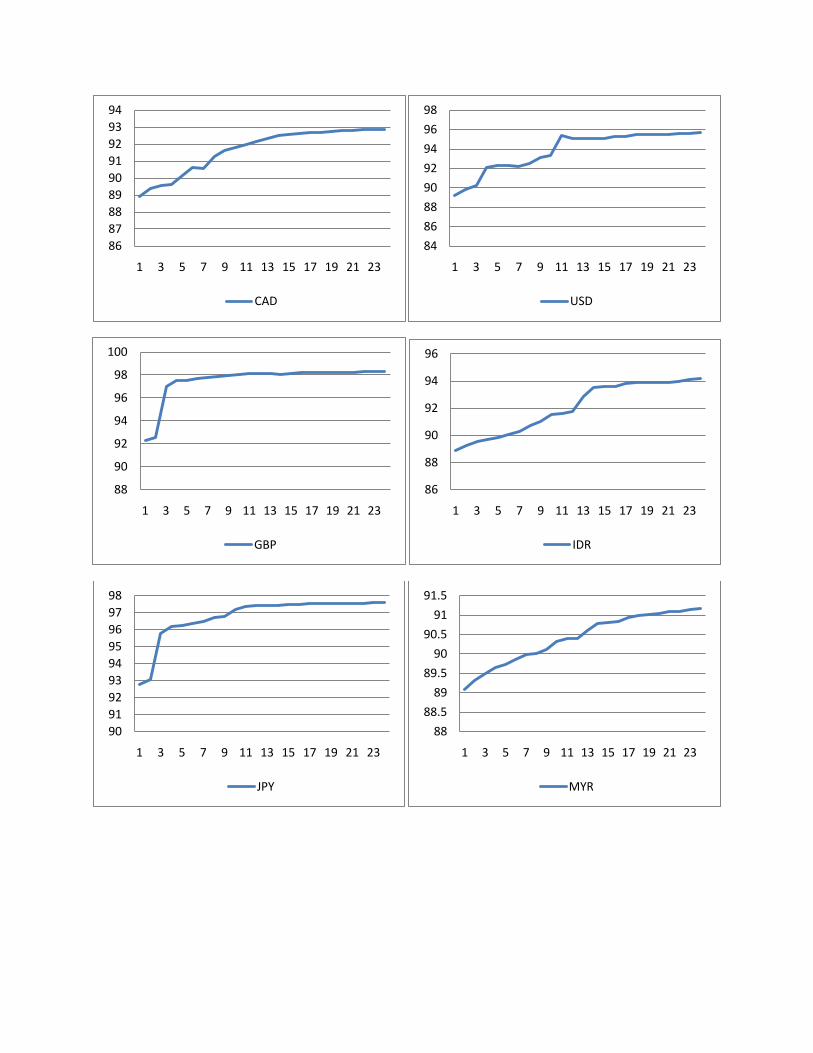
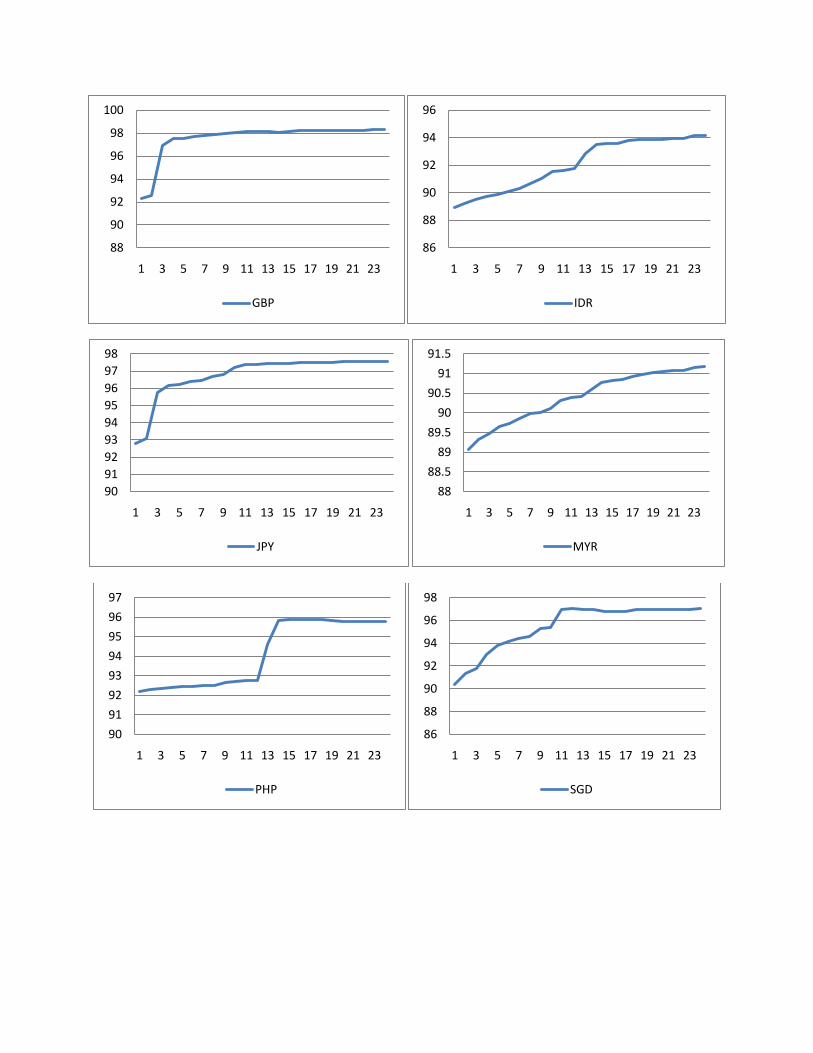
Spillover Plots A1: Return Spillover Index (Global Currency Market), for 24-period forecasting
86
87
88
89
90
91
92
93
94
1 3 5 7 9 11 13 15 17 19 21 23
CAD
84
86
88
90
92
94
96
98
1 3 5 7 9 11 13 15 17 19 21 23
USD
88
90
92
94
96
98
100
1 3 5 7 9 11 13 15 17 19 21 23
GBP
86
88
90
92
94
96
1 3 5 7 9 11 13 15 17 19 21 23
IDR

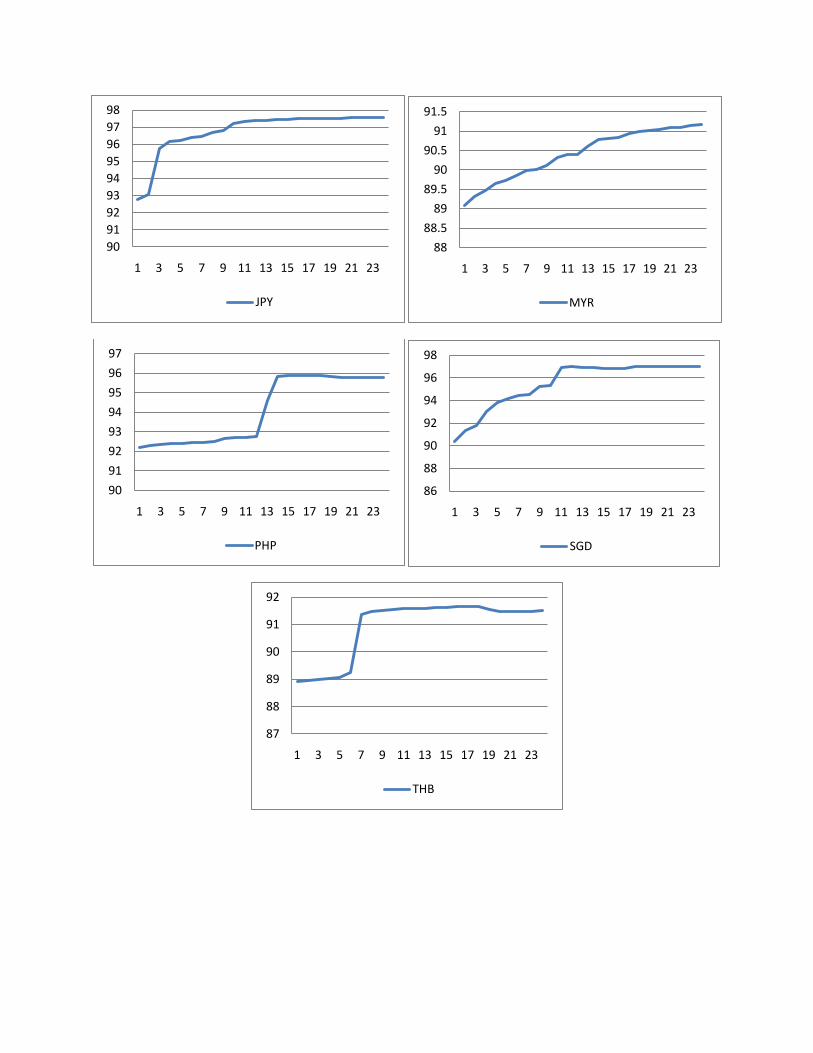
Spillover Plots A2: Volatility Spillover Index (Global Currency Market), for 24-period
forecasting
90
91
92
93
94
95
96
97
98
1 3 5 7 9 11 13 15 17 19 21 23
JPY
88
88.5
89
89.5
90
90.5
91
91.5
1 3 5 7 9 11 13 15 17 19 21 23
MYR
90
91
92
93
94
95
96
97
1 3 5 7 9 11 13 15 17 19 21 23
PHP
86
88
90
92
94
96
98
1 3 5 7 9 11 13 15 17 19 21 23
SGD
87
88
89
90
91
92
1 3 5 7 9 11 13 15 17 19 21 23
THB
86
87
88
89
90
91
92
93
94
1 3 5 7 9 11 13 15 17 19 21 23
CAD
84
86
88
90
92
94
96
98
1 3 5 7 9 11 13 15 17 19 21 23
USD
88
90
92
94
96
98
100
1 3 5 7 9 11 13 15 17 19 21 23
GBP
86
88
90
92
94
96
1 3 5 7 9 11 13 15 17 19 21 23
IDR
90
91
92
93
94
95
96
97
98
1 3 5 7 9 11 13 15 17 19 21 23
JPY
88
88.5
89
89.5
90
90.5
91
91.5
1 3 5 7 9 11 13 15 17 19 21 23
MYR

Spillover Plots A3: Return Spillover Index (Global Equity Market), for 24-period forecasting
90
91
92
93
94
95
96
97
1 3 5 7 9 11 13 15 17 19 21 23
PHP
86
88
90
92
94
96
98
1 3 5 7 9 11 13 15 17 19 21 23
SGD
87
88
89
90
91
92
1 3 5 7 9 11 13 15 17 19 21 23
THB
86
87
88
89
90
91
92
93
94
1 3 5 7 9 11 13 15 17 19 21 23
CAD
84
86
88
90
92
94
96
98
1 3 5 7 9 11 13 15 17 19 21 23
USD
88
90
92
94
96
98
100
1 3 5 7 9 11 13 15 17 19 21 23
GBP
86
88
90
92
94
96
1 3 5 7 9 11 13 15 17 19 21 23
IDR
90
91
92
93
94
95
96
97
98
1 3 5 7 9 11 13 15 17 19 21 23
JPY
88
88.5
89
89.5
90
90.5
91
91.5
1 3 5 7 9 11 13 15 17 19 21 23
MYR
90
91
92
93
94
95
96
97
1 3 5 7 9 11 13 15 17 19 21 23
PHP
86
88
90
92
94
96
98
1 3 5 7 9 11 13 15 17 19 21 23
SGD

Spillover Plots A4: Volatility Spillover Index (Global Equity Market), for 24-period forecasting
87
88
89
90
91
92
1 3 5 7 9 11 13 15 17 19 21 23
THB
86
87
88
89
90
91
92
93
94
1 3 5 7 9 11 13 15 17 19 21 23
CAD
84
86
88
90
92
94
96
98
1 3 5 7 9 11 13 15 17 19 21 23
USD
88
90
92
94
96
98
100
1 3 5 7 9 11 13 15 17 19 21 23
GBP
86
88
90
92
94
96
1 3 5 7 9 11 13 15 17 19 21 23
IDR
90
91
92
93
94
95
96
97
98
1 3 5 7 9 11 13 15 17 19 21 23
JPY
88
88.5
89
89.5
90
90.5
91
91.5
1 3 5 7 9 11 13 15 17 19 21 23
MYR
90
91
92
93
94
95
96
97
1 3 5 7 9 11 13 15 17 19 21 23
PHP
86
88
90
92
94
96
98
1 3 5 7 9 11 13 15 17 19 21 23
SGD
87
88
89
90
91
92
1 3 5 7 9 11 13 15 17 19 21 23
THB
Related Documents