~ WATER RESOURCES RESEARCH, VOL. 32, NO. 4, PAGES959-974, APRIL 1996 Peak flow responses to clear-cutting and roads in small and large basins, western Cascades, Oregon J. A. Jones Department of Geosciences, Oregon State University, Corvallis ( E. Grant 2,dfic Northwest Research Station, U.S.Forest Service, Corvallis,Oregon Abstract. This study quantified long-term changes in streamflows associated with clear- cutting and road construction and examined alternative hydrologic mechanisms to explain stream hydrograph changes in the Cascades Range, western Oregon. Weexamined differences in paired peak discharges for 150 to 375 storm events for five basin pairs, using 34-year records from two pairs of 60-to-101-ha experimental basins in the H. J~ Andrews Experimental Forest, and 50-to-55-year records from three pairs of adjacent basins ranging .,m 60 to 600 km 2. Forest harvesting has increased peak discharges by as much as 50% ¯ small basins and 100% in large basins over the past 50 years. These increases are t~ttributable to changes both in flow routing due to roads and in water balance due to treatment effects and vegetation succession. Introduction and Background with greater cumulative area of forest harvested in basins rang- ing from 60 to over 600 km 2. However, other studies in Wash- Forest harvesting has been conducted since the turn of the ington State have not found peak discharges to be related to century in the Cascade Range of Oregon. Logging beganin the forest harvest [Duncan, 1986; B. A. Connellyet al., unpub- 1930s, and a pattern of roads and distributed patch cuts of 20 lished manuscript, 1993]. 40 ha now covers up to 25% of public national forest lands, Several theoretically possible water balance mechanisms ~hich occupyover half of the western Cascades. A number of might operate to produce observed changes in peak discharge small paired basin experiments were established on public in response to specific treatments and climate-vegetation as- lands in the early 1950s in western Oregon to examinethe influence of forest harvestingon streamflow, especially water sociations. Evapotranspiration is a major determinant of yield [Hibbert, 1967; Rothacher, 1965]. Comparable paired ba- streamflow in forested basins, so suppressionof evapotranspi- smexperiments have been conducted in many different parts of ration by forest harvest can be expected to increase wateryield the United States and abroad [e.g., Blackieet al., 1979; Calla- and peak discharges. However, the magnitude of this response ham, 1990; Wright et al., 1990; Ziemer, 1981],in basins ranging may vary by season. For example, seasonal fluctuations in soil from 0.1 to 1.0 km 2. moisture storage in the Mediterranean climate of Oregon may Early studies from small paired experimentalbasins showed producedifferent responses for peak dischargesin fall versus ,trot dear-cutting and road building increased only some peak winter or spring. Also, streamflow responseto forest harvest storm discharges [Rothacher, 1970, 1973; Wright et al., 1990; maybe confoundedby changes in water balance components Zie~ner, 1981].In the Pacific Northwest, increases were greater other than evapotranspiration. For example, fog and cloud for small, early wet season storms, but "there has been no water interception and snowpack accumulation and melt are appreciable increase in peak flows for the largest flood- important water balance components in western Oregon, so producing storms" [Rothacher, 1970, p. 656, 1973]. Thus Roth- changes in these components could mitigate or counteract acher [1971, p. 46] concluded that "logging... does not signif- evapotranspiration-relatedincreases in peakdischarges [Harr, icantly increase major floods" in forested basins of the western 1982, 1986; Harrand Cofin, 1992; blarr and McCorison, 1979]. Cascades.However, subsequent studies [Harr, 1986; Wrightet Forest roads, constructed to access harvest sites, further ’~., !990]havequcstioned the validity of the regressionmethod complicate the hydrologic mechanisms operating in harvested ~sedby Rothacher [1971]and others [e.g., Hartet al., 1982]. basins in western Oregon. In these basins, soil infiltration ca- Evidence of peakflow responseto forest har~est over several pacity is high and hillslope flow is dominantly subsurface, so decadesin basins larger than 5 km-"is mixed. Some studies roads have the potential to both increase surface runoff and around the United States have shown significant relationships intercept subsurface flow [Wemple, 1994]. Roads have been between higher peak discharges and logged or deforested con- shown to increase, decrease, or not affect peak discharges in ditions in basins ranging up to 20,000 km 2 [Anderson and various studies in the Pacific Northwest [Wright et al., 1990; Hobba, 1959; Potter, 1991; Trimble andWeirich, 1987]. Christner Ziemer, 1981; Harr et al., 1975, 1979; King andTennyson, 1984]. a~d Harr [1982] and Lyonsand Beschta [1983] inferred that in The objective of this study is to quantify long-term changes the western Cascades of Oregon, peak discharges increased in stormhydrograph behaviorassociated with clear-cutting and road construction and to examine alternative hydrologicmech- ,~pyright 1996 by the American Geophysical Union. anismsto explain stream hydrograph changesin western Ore- Paper number 95WR03493. gon. We are especially interested in understanding the follow- 0043-I397/96/95WR-03493505.00 ing: (1) the magnitude and duration of peak discharge 959

Welcome message from author
This document is posted to help you gain knowledge. Please leave a comment to let me know what you think about it! Share it to your friends and learn new things together.
Transcript

~ WATER RESOURCES RESEARCH, VOL. 32, NO. 4, PAGES 959-974, APRIL 1996
Peak flow responses to clear-cutting and roads in small
and large basins, western Cascades, Oregon
J. A. JonesDepartment of Geosciences, Oregon State University, Corvallis
( E. Grant
2,dfic Northwest Research Station, U.S. Forest Service, Corvallis, Oregon
Abstract. This study quantified long-term changes in streamflows associated with clear-cutting and road construction and examined alternative hydrologic mechanisms to explainstream hydrograph changes in the Cascades Range, western Oregon. We examineddifferences in paired peak discharges for 150 to 375 storm events for five basin pairs, using34-year records from two pairs of 60-to-101-ha experimental basins in the H. J~ AndrewsExperimental Forest, and 50-to-55-year records from three pairs of adjacent basins ranging.,m 60 to 600 km2. Forest harvesting has increased peak discharges by as much as 50%¯ small basins and 100% in large basins over the past 50 years. These increases are
t~ttributable to changes both in flow routing due to roads and in water balance due totreatment effects and vegetation succession.
Introduction and Background with greater cumulative area of forest harvested in basins rang-ing from 60 to over 600 km2. However, other studies in Wash-Forest harvesting has been conducted since the turn of theington State have not found peak discharges to be related tocentury in the Cascade Range of Oregon. Logging began in theforest harvest [Duncan, 1986; B. A. Connelly et al., unpub-1930s, and a pattern of roads and distributed patch cuts of 20lished manuscript, 1993].40 ha now covers up to 25% of public national forest lands,
Several theoretically possible water balance mechanisms~hich occupy over half of the western Cascades. A number ofmight operate to produce observed changes in peak dischargesmall paired basin experiments were established on publicin response to specific treatments and climate-vegetation as-lands in the early 1950s in western Oregon to examine the
influence of forest harvesting on streamflow, especially water sociations. Evapotranspiration is a major determinant ofyield [Hibbert, 1967; Rothacher, 1965]. Comparable paired ba- streamflow in forested basins, so suppression of evapotranspi-sm experiments have been conducted in many different parts of ration by forest harvest can be expected to increase water yieldthe United States and abroad [e.g., Blackie et al., 1979; Calla- and peak discharges. However, the magnitude of this responseham, 1990; Wright et al., 1990; Ziemer, 1981], in basins ranging may vary by season. For example, seasonal fluctuations in soilfrom 0.1 to 1.0 km2. moisture storage in the Mediterranean climate of Oregon may
Early studies from small paired experimental basins showed produce different responses for peak discharges in fall versus,trot dear-cutting and road building increased only some peak winter or spring. Also, streamflow response to forest harveststorm discharges [Rothacher, 1970, 1973; Wright et al., 1990; may be confounded by changes in water balance componentsZie~ner, 1981]. In the Pacific Northwest, increases were greater other than evapotranspiration. For example, fog and cloudfor small, early wet season storms, but "there has been no water interception and snowpack accumulation and melt areappreciable increase in peak flows for the largest flood- important water balance components in western Oregon, soproducing storms" [Rothacher, 1970, p. 656, 1973]. Thus Roth- changes in these components could mitigate or counteractacher [1971, p. 46] concluded that "logging... does not signif- evapotranspiration-related increases in peak discharges [Harr,icantly increase major floods" in forested basins of the western 1982, 1986; Harr and Cofin, 1992; blarr and McCorison, 1979].Cascades. However, subsequent studies [Harr, 1986; Wright et Forest roads, constructed to access harvest sites, further’~., !990] have qucstioned the validity of the regression method complicate the hydrologic mechanisms operating in harvested~sed by Rothacher [1971] and others [e.g., Hart et al., 1982]. basins in western Oregon. In these basins, soil infiltration ca-
Evidence of peak flow response to forest har~est over several pacity is high and hillslope flow is dominantly subsurface, sodecades in basins larger than 5 km-" is mixed. Some studies roads have the potential to both increase surface runoff andaround the United States have shown significant relationships intercept subsurface flow [Wemple, 1994]. Roads have beenbetween higher peak discharges and logged or deforested con- shown to increase, decrease, or not affect peak discharges inditions in basins ranging up to 20,000 km2 [Anderson and various studies in the Pacific Northwest [Wright et al., 1990;Hobba, 1959; Potter, 1991; Trimble and Weirich, 1987]. Christner Ziemer, 1981; Harr et al., 1975, 1979; King and Tennyson, 1984].a~d Harr [1982] and Lyons and Beschta [1983] inferred that in The objective of this study is to quantify long-term changesthe western Cascades of Oregon, peak discharges increased in storm hydrograph behavior associated with clear-cutting and
road construction and to examine alternative hydrologic mech-,~pyright 1996 by the American Geophysical Union.
anisms to explain stream hydrograph changes in western Ore-Paper number 95WR03493. gon. We are especially interested in understanding the follow-0043-I397/96/95WR-03493505.00 ing: (1) the magnitude and duration of peak discharge
959
960 JONES AND GRANT: PEAK FLOW RESPONSES TO CLEAR-CUTTING, ROADS
Oregon
Basin
North Santiam .Watershed 1Watershed 2
....... Waiershed 3Blue River t
~r Blue RiveLookout CreekSal~on CreekLookout Creek
Lookou N. Fork Middle 1~, .~,,,Willamette Ri~
Br~itenbush RiveN. Fork M. North Santiam R
;:’ Ellipses indica’
: of the relation¯ , discharges. Mo
’ SMmon 50)0 55 years,;",~../’ :i!:, ,:..?ii:i i:~ .................: (USGS) strip
[] ~,~, i:~o~ 0 s 25-year USGSo ~ [] xmo - moo~ ~ ’ ~ 6~ storms, we
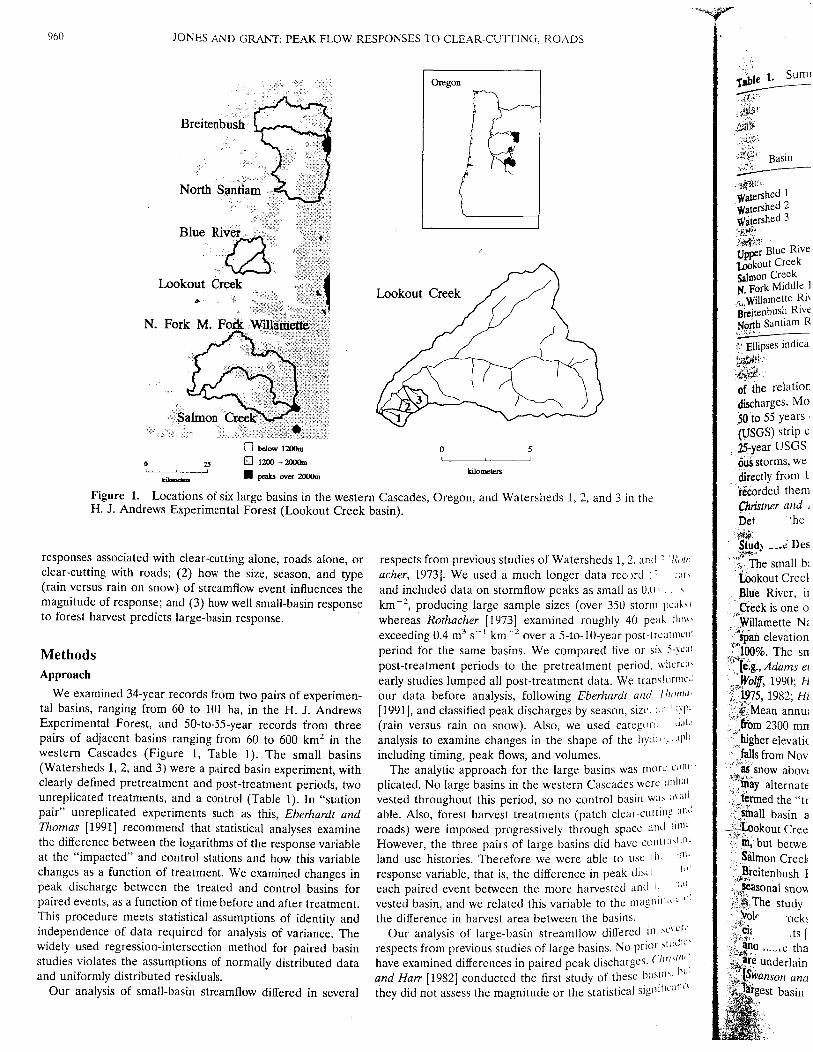
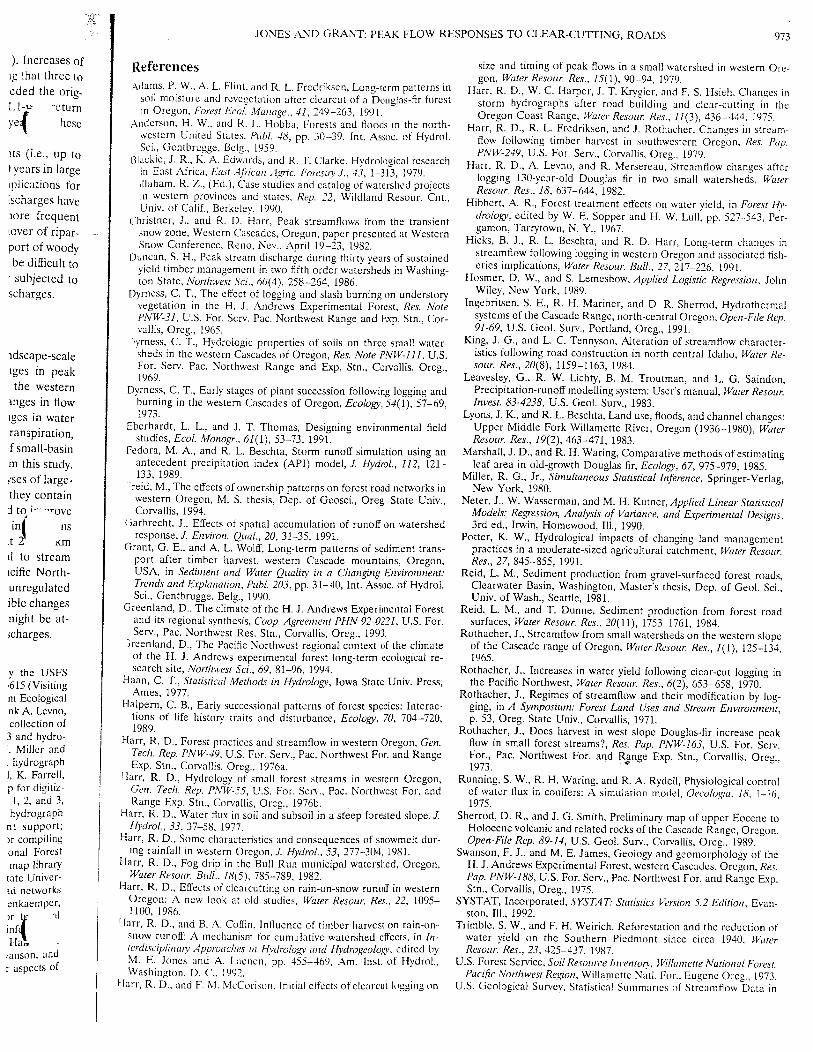
~,__,_ ectly from~r~corded themFigure 1. Locations of six large basins in the western Cascades, Oregon, and Watersheds 1, 2, and 3 in the
H. J. Andrews Experimental Forest (Lookout Creek basin). .Christner andDet ’he
Stud~ --.,~ Desresponses associated with clear-catting alone, roads alone, or respects from previous studies of Watersheds 1, 2, and : I!~,,ti: " ~!~e small b:clear-cutting with roads; (2) how the s~ze, season, and type acher, 1973]. We used a much longer data record I.- :;~r, ~kout Cree~(rain versus rain on snow) of streamflow event influences the and included data on stormflow peaks as small as 0.1~.~ :.magnitude of response; and (3) how well small-basin response km-~, producing large sample sizes (over 350 storm pc:tk~r ;Ci’eek is one oto forest harvest predicts large-basin response, whereas Rothacher [1973] examined roughly 40 peak
exceeding 0.4 m3 s-~ km-2 over a 5-to-10-year post-trcatmclc. /~’~an elevationMethods period for the same basins. We compared five or six 5-vca~ i!".100% The sn
post-treatment periods to the pretreatment period, where,- ~ii [i’.g.,Adams e~Approach early studies lumped all post-treatment data. We translormc~’, ~,Wolff, 1990
We examined 34-year records from two pairs of experimen- our data before analysis, following Eberhardt and 77,,m,,tal basins, ranging from 60 to 101 ha, in the H. J. Andrews [1991], and classified peak discharges by season, size. :~ ~ I3p, i~iMean annu;Experimental Forest, and 50-to-55-year records from three (rain versus rain on snow). Also, we used categori, d,,t.~ ,..~..iiff0m 2300 mnpairs of adjacent basins ranging from 60 to 600 km2 in the analysis to examine changes in the shape of the hwn .... tl~1~ :’:~"h[gher elevatkwestern Cascades (Figure 1, Table 1). The small basins including timing, peak flows, and volumes. : falls from Nov(Watersheds 1, 2, and 3) were a paired basin experiment, with The analytic approach for the large basins was more com ::i!:/~ Snow abowclearly defined pretreatment and post-treatment periods, two plicated. No large basins in the western Cascades were tmh~t~ .: ’may alternateunreplicated treatments, and a control (Table 1). In "station vested throughout this period, so no control basin was :~;,Ipair" unreplicated experiments such as this, Eberhardt and able. Also, forest harvest treatments (patch clear-cuttin~Thomas [1991] recommend that statistical analyses examine roads) were imposed progressively through space and titn~
I ;-~Lookout Creethe difference between the logarithms of the response variable However, the three pairs of large basins did have contr:~,ttn:- - !~’~, but betweat the "impacted" and control stations and how this variable land use histories. Therefore we were able to use ti~, ~n, ] ~-$/ilrnon Cree!~changes as a function of treatment. We examined changes in response variable, that is, the difference in peak discl I,,: ~reitenbush tpeak discharge between the treated and control basins for each paired event between the more harvested and i, ~." ~asonal sno~paired events, as a function of time before and after treatment, vested basin, and we related this variable to the maznit~-tc ": i~:The studyThis procedure meets statistical assumptions of identity and the difference in harvest area between the basins. ~31,"independence of data required for analysis of variance. The Our analysis of large-basin streamflow differed in sc~cr.~widely used regression-intersection method for paired basin respects from previous studies of large basins. No prior st atw" ~; ano ,e thastudies violates the assumptions of normally distributed data have examined differences in paired peak discharges. (’/~rt~t,,’ x~,are underlainand uniformly distributed residuals, and Harr [1982] conducted the first study of these basia~, bt~: ’~ii~r[Sffanson ana
Our analysis of small-basin streamflow differed in several they did not assess the magnitude or the statistical sigaitic:~nc~ i~’[~i’gest basin

JONES AND GR.aS’4T: PE.aJ~ FLOWRESPONSES TO CLEAR-CUTTING, ROADS 961
Table 1. Summa~ of Characteristics of Small and Large Basins in This Study in the Western Cascades of Oregon
Hydrologic RecordType and Duration Of Treatments Used
Elevation, m Cutting Roads NumberArea, Duration, of Paired
Basin km~- Minimum Maximum % Years km km-z Years years Events
Small BasinsWater~hed 1 1.0 460 990 100 I962-1966 0 n/a 1955-1988 352Natershed 2 0.6 530 1070 0 n/a 0 n/a 1955-1988 352, 377Watershed 3 1.0 490 1070 25 1963 2.7 1959 1955-1988 377
Large BasinsUpper Blue River 119 400 1600 25 1957-I991 1.9 1957-1990 1949-1991 148Lookout Creek 62 400 1600 22 1949-1991 1.9 1949-1990 1949-1991 148Salmon Creek 313 350 2400 20 1930-1991 ...... 1935-1990 171N. Fork Middle Fork 637 350 2400 16 1910-1991 ...... 1935-1990 171
Willamette RiverBreitenbush River 280 400 2800 14 1910-1991 ...... 1932-1987 191North Santiam River 559 400 3200 12 1940-1991 ...... 1932-1987 191
Ellipses indicate data not used in this study;n/a, not applicable.
of the relationship between area cut and changes in peak million-year-old, relatively permeable lava flows of the Highdischarges. Moreover, our analysis used streamflow records of Cascades [Ingebritsen et al., 1991]. Soils are weakly developed50 to 55 years compiled from original U.S. Geological Survey with thick organic litter horizons, deeply weathered parent(USGS) strip charts, whereas Christner and Hart [1982] used a materials, and high stone content. Although the <2-mm soil25-year USGS record of published peaks that omitted numer- fractions are mostly clay loams, moisture storage and transferous storms, we discovered. We determined cumulative harvests is characterized by high porosity, infiltration rates, and perco-directly from U.S. Forest Service (USFS) cutting records and lation rates [U.S. Forest Service, 1973; Dyrness, 1969]. Before
he recorded them in a geographic information system, whereas treatment, the vegetation of these basins consisted of mainlyChristner and Harr [1982] used USFS estimates of area cut. 100- to 500-year-old Douglas fir (Pseudotsuga menziesii), west-Details of the methods are presented below, ern hemlock (Tsuga heterophylla), and western red cedar
(Thuja plicata) in closed canopy stands, with increasingStudy Site Description amounts of Pacific silver fir (Abies amabilis) above 800 m.nd .... ~- The small basins, Watersheds 1, 2, and 3, are tributaries of
(34 years) Lookout Creek in the H. J. Andrews Experimental Forest near Forest Harvest History and Data Collection1.03 m3 s-~ Blue River, in the western Cascades of Oregon. Lookout Roads were constructed prior to clear-cutting in small basinsrm peaks), Creek is one of the six large basins, all of which are within the except in Watershed 1, which has no roads. Small basin treat-~eak flows Willamette National Forest (Figure 1, Table 1). The basins ments occurred in the late 1950s and early 1960s. In 1959, 2.7-treatment span elevations from 400 to 3200 m and have slopes of 60 to km of roads (6% of basin area assuming a road right-of-waysix 5-year 100%. The small basins are described in many publications width of 25 m) were constructed in Watershed 3. Watershed
t, whereas [e.g., Adams et al., 1991; Dymess, 1965, 1969, 1973; Grant and was 100% clear-cut from 1962 to 1966 and broadcast burned inansformed Wolff, 1990;Halpem, 1989; Hart, 1976a, b, 1986;Harretal., 1966. In 1963, 25% of Watershed 3 was clear-cut, and the three;l Thomas 1975, 1982; Hicks et al., 1991; Rothacher, 1965, 1970, 1973]. patch cuts were broadcast burned (Table 1). Both basins were:, and type Mean annual precipitation in the western Cascades ranges replanted after burning and now support 25-plus-year-old,rical data from 2300 mm at lower elevations to more than 2500 mm at stands of Douglas fir."drograph, higher elevations [Greenland, 19941. Over 80% of precipitation The precise history of forest harvest and road construction
fails from November to April, typically as rain below 400 m and in the six large basins was not known when this study began.tore corn- as snow above 1200 m. Elevations between 400 and 1200 m Roads were constructed concurrently with clear-cutting in’.re unbar- may alternately receive snow or rain and thus have been large basins. Therefore, geographic information system (GIS)was avail- termed the "transient snow zone" [Harr, 1981, 1986]. All of the data layers showing the date and location of clear-cuts werettting and small basin area and more than 75% of the Blue River/ compiled from USFS records, historical maps, and aerial pho-and time. Lookout Creek basins is in the transient snow zone below 1200 tographs. Each cut was outlined on 1:24,000 orthophotos, and)ntrasting m, but between 30 and 55% of the upper elevations of the these polygons were digitized and stored as a GIS layer. Eachthe same Salmon Creek/North Fork Willamette Middle Fork River and polygon was given attributes indicating the year and type ofharge for Breitenbush River/North Santiam River basin pairs is in the timber harvest (e.g. clear-cut), based on USFS Timber Re-less bar- seasonal snow zone (Figure 1). source Inventory and Mature and Over-Mature Stand datanitude of The study area is underlain by Tertiary and Quaternary bases obtained from the Blue River, Oak Ridge, and Detroit
volcanic rocks, primarily andesites and basalts, with some gla- Ranger Districts and the Supervisor’s Office of the Willamette~ se¥°’°I cial deposits [Sherrod and Smith, 1989]. All of the small basins National Forest. Numerous cuts had conflicting or unavailable,r sl[ and more than 75% of the Blue River/Lookout Creek basins data. Information for these polygons was supplemented byChr~ are underlain by highly weathered, deeply dissected volcanics consulting aerial photographs or the District silviculturalist.sins, but [Swanson and James, 1975]. One third to one half of the two Data on road networks were compiled for Lookout Creekfificance largest basin pairs are above 1200 m and underlain by <2- and Blue River basins only. The current road networks were
962 JONES AND GRANT: PEAK FLOW RESPONSES TO CLEAR-CUrITING. ROADS
video digitized; 1:100,000 black-and-white aerial photographs Each matched peak flow data set contained the date, time, test of siobtained in 1991 and the digitized lines were stored as a GIS peak discharge, begin date/time, peak date/time, and total vol- 1992]. Tlayer. Each road segment was assigned a decade of construc- ume as continuous variables along with categorical variable. ’,nt fo:tion based on historical maps and aerial photography and a including the month, season, and recurrence interval for eac! dyear of construction corresponding to the year prior to the date paired event (Table 1). ~ts rof the nearest adjacent clear-cut, strong X
Basin boundaries and proportions of area by elevation were Peak Discharge Event Classification porated,calculated from digital elevation data using Arc/Info GIS soft- Peak discharge events were classified according to time pc- compareware. The area cut and the length of road constructed by year riod, season, size, and event type. Time periods were defined as adjustedand by elevation in each basin were calculated from clear-cut six or seven roughly 5-year periods before, during, and after desiredand road layers overlaid on the elevation data. This GIS anal- treatment in small basins, and by decade (e.g., 1930s) in large compari’,ysis indicates that clear-cutting began as early as the 1900s basins. Three seasons were defined: fall (August through No- Incorpor,(railroad logging in the N. Fork Willamette) and as late as 1950 vember), winter (December through February), and spring Chang(Blue River). By 1990 cumulative clear-cuts represented be- (March through July). Size categories were defined based o~- small batween 12% (N. Santiam River) and 25% (Blue River) of basin the four quartiles (for small basins) and thirds (for large period, sarea (Table 1). , sins) of the cumulative distribution of events. Recurrence in- variance
tervals for each size class were defined using a nonparametric multipleStreamflow Monitoring and Data Collection event-ranking procedure (i.e., the tenth largest event recorded 1990;
Continuous hydrographs were obtained from the gaging sta- in a 10-year record is given a recurrence interval of 1 year) treatmmtion for each basin. In the small basins the recording stations [Haan, 1977]. The small-basin peak discharge record included probabilwere installed in 1953 and, apart from a modification of the on average 10 storms per year, so 90% of the small-basin est signilWatershed 1 flume early in the pretreatment period (1957), events had a <l-year return period. The smallest event cate- ofneither the calibration method nor the rating curves was gory had <0.125-year return periods, while the largest event rated, lC~changed over the period of record. Continuous records in the category had return periods from 0.4 to 100 years. In contrast, variancelarge basins began as early as 1928, and rating curves were the large-basin peak discharge record included on average chargesperiodically updated by the USGS. three to five storms per year, so 70 to 75% of the events had a were log
Storm hydrographs were extracted from the small-basin <l-year return period. The smallest event category had <0.5- differen~records based on the following criteria. Storms began when year return periods, while the largest event category had return treatedgage height rose more than 3.7 cm (0.12 ft) and cnded when periods from 1 to i00 years. More large events occurred in all of intereeither gage height fell to 20% of the peak value or 24 hours basins in the 1950s and 1970s, decades that had generally Chan~elapsed with steadily declining flow. Secondary storm peaks higher precipitation in this region [Greenland, i993]. Despite ~’ ba.’were defined as a gage height rise of 2.7 cm (0.09 ft) within different periods of record and distances of as much as 75 km ~, an~to 24 hours of a primary peak. Five descriptive statistics were between the northern and southernmost basin pairs, nearly peak disobtained for each primary hydrograph: cumulative volume, 70% of the matched storms occurred in all six large basins, ence ininstantaneous peak discharge, and time at beginning, peak, and Storm event types (rain versus rain on snow) were classified square I,end of each storm, for matched events in the small basins and in the Blue River/’ paired e
Storm hydrographs for the large basins were collected man, Lookout Creek large-basin pair. Small-basin events were clas- definedually from stage height records (from the original A-35 strip sifted by (1) classifying precipitation for each event into rain ! percent,charts or digital records)and the corresponding rating curves snow with a break point at 0°C, and (2) determining the ; normalbfor each water year housed in the USGS archives. The dis- amount of snowpack present at the time of the storm based on difleren(charge, date, and time of the peak were recorded for all storms a distributed-parameter hydrologic model (MMS [Leavesley et ence induring the period of record whose peak exceeded the original al., 1983]). Large-basin events were classified based on mini- : significa:
!~’ the basi~peak discharge threshold (1.1-year return interval calculated mum and maximum daily temperatures, the average daily hy-by U.S. Geological Survey [1993]) in either of the paired basins, drograph, and an antecedent precipitation index (API) over " in cumuOriginal records were examined in preference to USGS pub- 2-week period preceding each storm, following Hart [198I. discharglished records because criteria used to construct the latter have 1986]. API was calculated from daily precipitation data at ’ gressionchanged over the period of record. For example, in some Lookout Creek, following Fedora and Beschta [1989]. Hydro- i residuabbasins only the single highest peak discharge was recorded in graphs at the other two large-basin pairs which had datesthe early years. For five of the six gages the base flow used by corresponding to peaks at Blue River/Lookout Creek were ~i basin pathe USGS to report peak discharges had been revised upward classified as rain on snow according to their classification at : rain, rai~at some time during the record. Because of these various Blue River/Lookout Creek. This ad hoc classification should be than on,factors, our resulting data set contained events with recurrence viewed as approximate because of differences in geography and " conserv~intervals as low as 0.1 year, implying that in some basins the elevations among the large basins. :~: guarant~original 1.1-year event had been reduced to as frequent as a al., 199(0.1-year event. Statistical Analysis :: direct te
Matched storm hydrograph data sets were created for the Changes over time in the shape of the hydrograph were effects ofollowing five basin pairs: Watershed 1 versus 2, Watershed 3 examined using categorical data analysis. Four properties were ! and areversus 2, Blue River versus Lookout Creek, Salmon Creek examined: peak discharge, volume, begin time, and time ofversus North Fork Willamette Middle Fork River, and Bre- peak. For each hydrograph property, the mean difference was :~ _,ultitenbush River versus North Santiam River (Table 1). Storm calculated for the period of record, and counts of hydrographshydrographs were considered matched if primary peaks oc- falling above/below this number were obtained for each time Spatial
curred within 12 hours of each other. Seventy-five percent of period. For each period, observed (post-treatment) counts | :;i~{{ Foresmatched peaks in the small basin pairs were within 4 hours, were compared to expected (pretreatment) counts using a -~ | ~{! of small

JONES AND GRANT: PEAK FLOW RESPONSES TO CLEAR-CUTTING, ROADS 963
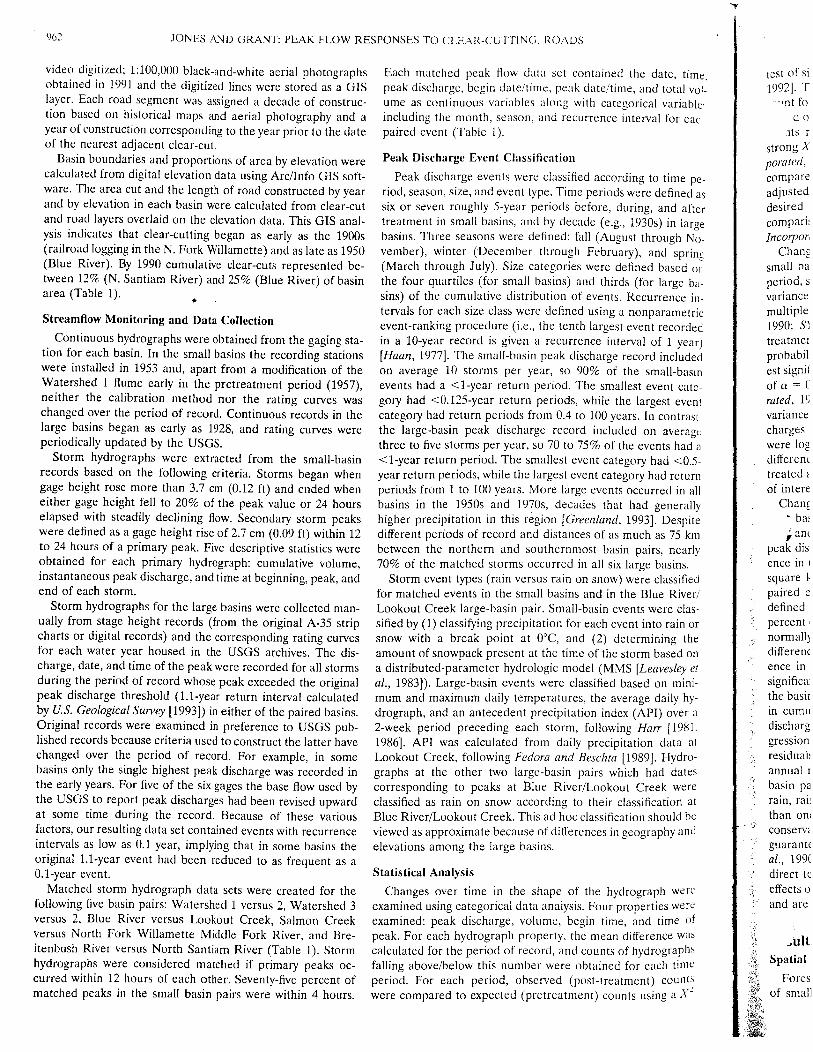
the date, time, test of significance with 1° of freedom [SYSTAT, Incorporated, over the six decades of cutting (Figures 2a-2c). Because ~. and total vol- 1992]. The expected count was defined as the pre-treatment wilderness and other restrictions, 86 and 85% of cuts in Blueorical variables count for the small basins, and the average count for the whole River/Lookout Creek, 72 and 78% in Salmon Creek/N. Fork~ter " each period of record for the large basins. In this analysis, expected Willamette, and 90 and 92% in N. Santiam/Breitenbush River
i counts ranged from 9.5 to 41.5, producing a comparatively were below 1200 m elevation. Thus almost all forest harvest instrong X2 test [Hosmer and Lemeshow, 1989; SYSTAT, Incor- large basins was concentrated in the transient snow zone (Fig-porated, 1992, p. 564]. Because multiple observed counts were ures 1 and 2).
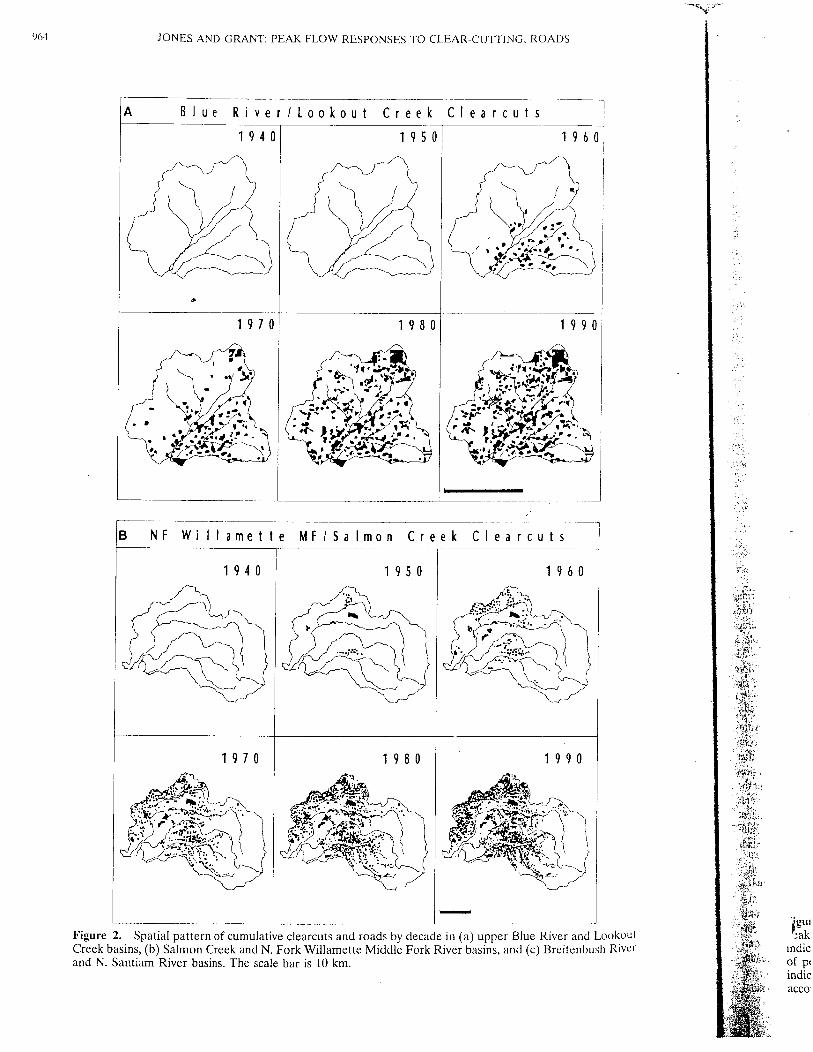
ing to time pc- :ompared to expected counts, probabilities were conservatively Cutting rates were low (less than 0.1% of basin area pervere defined as .:djusted to c~/k using a Bonferroni procedure where o~ is the year) in all basins until the 1945-1955 period. Starting in 1945ring, and after desired level of significance (0.05), and k is the number or 1950, cutting occurred at rates of 0.25% to 1% of basin area1930s) in large comparisons (5 or 6) [Miller, 1980; Neter et al., 1990; SYSTAT, per year until 1990 (lower panels of Figures 3a-3c). The Blue;t through No-- b~corporated, 1992]. River/Lookout Creek basin pair had the most dramatic con-/), and spring Changes in the average magnitude of peak discharges in the trast in harvests over the period of study. In the 1950s andined based on small basins in response to treatment (broken down by time 1960s Lookout Creek was cut at about 1% per year, compared(for large ba- period, season, size, and type) were examined using analysis of to <0.25% per year for Blue River, but from 1970 to 1990 Blue
’,ecurrence in- variance (ANOVA) followed by post hoc tests of effects using River was cut at more than 1% per year compared, to <0.25%lonparametric multiple comparisons procedures [Miller, t980; Neter et al., per year for Lookout Creek (lower panel in Figure 3a). Thevent recorded [990; SYSTAT, Incorporated, 1992]. Because multiple post- other two basin pairs had much smaller contrasts in harvestval of 1 year) reatment periods were compared to the pretreatment period, rates. These basins were cut at rates ranging from 0.25 to 0.5%cord included probabilities were conservatively adjusted using Tukey’s high- per year, starting in 1945 for Salmon Creek and the N. Forke small-basin est significant difference test to guarantee an overall protection Willamette and 1955 for Breitenbush River and N. Santiamst event cate- of o~ = 0.05 [Miller, 1980; Neter et al., 1990; SYSTAT, Incorpo- River (lower panels of Figures 3b and 3c). Roads were con-largest event rated, 1992]. Data were tested for independence, equality of structed to access clear-cuts in all six basins, and road construc-s. In contrast, variance, and normality before analysis. Small-basin peak dis- tion rates closely followed harvest rates (lower panel in Figuret on average charges and simple differences or ratios of peak discharges 3a).events had a were lognormally distributed. This was corrected by using the
~ry had <0.5- difference in log-transformed peak discharges between the Relationships Among Streamfl~w Event Types
ry had return treated and control basins for each paired event as the variable Part of our analysis examined the influence of event size,zcurred in all vf interest, following Eberhardt and Thomas [1991]. season, and event type on peak discharge response to forestad generally Changes in the average magnitude of peak discharges in the harvest. Event size, season, and type are correlated in small
~9,3J, ~ ~oitelarge basins in response to treatment (broken down by season, basins. About 40% of all storms but only about 10% of all
~c~ crnsize, and type) were examined using linear regression. The events are rain on snow in Watersheds 1, 2, and 3. Most large
pan~. .arly peak discharge (dependent) variable was defined as the differ- events (80%) occur in winter when soils are thoroughly wetted.rge basins, ence in unit area peak discharge (cubic meter per second per Over 60% of large winter events are rain on snow. In fall, 84%ere classified square kilometer) between the two adjacent basins for each of events are small or medium in size (less than 0.4-year returnBlue River/ paired event. The forest harvest (independent) variable was periods) and occur when soils are dry. In spring, nearly 90% of
ts were clas- defined as the difference between basins in the cumulative events have less than 0.4-year return periods and occur when: into rain or percent of area harvested. Both variables were continuous and soils are wetted by rain or snowmelt (R. Perkins, unpublishedrmining the normally distributed. Linear regression models tested how the data, 1995).rm based on difference in peak discharge varied as a function of the differ-!Leavesley et ence in cumulative percent harvested for each basin pair. A Small Basin Peak Discharge Response to Clear-Cuttinged on mini- significant positive slope in the regression model indicates that With No Roads
ge daily hy- the basin with relatively more area harvested (larger difference A significant number of storms had higher peak discharge,API) over in cumulative percent cut) has correspondingly higher peak higher volume, advanced begin times and delayed peak timesHarr [1981, discharges (larger difference in matched peak discharges). Re- in some or all periods after 100% clear-cutting of Watershed 1.[on data at gression models were tested for sensitivity to outliers, and Following clear-cutting, a higher-than-expected number of~9]. Hydro- residuals were plotted against the estimates, event size, and runoff events at Watershed I had higher unit area peaks andhad dates annual rainfall. Models were estimated for all events in each higher volumes compared io lYretreatment counts (Figure 4).
2reek were basin pair and for selected subsets of the data: for example, Average peak discharges for events of all sizes increased sig-;ification at rain, rain on snow, large events, or spring events. When more nificantly (by more than 50%) in the first 5 years after clear-n should be than one regression model was estimated, probabilities were cutting (Table 2, Figure 5). In the first 5 years after cutting, graphy and conservatively adjusted to a/k using a B0nferroni procedure to higher-than-expected number of storms had later peaks and
guarantee an overall significance of 0.05 [Miller, 1980, Neter et began to rise earlier (Figure 4). Increases in average peakal., 1990, SYSTAT, Incorporated, 1992]. This method was a discharges declined significantly starting in year 6 after treat-direct test of cutting effects but only an indirect test of road ment but were still significantly (nearly 40%) higher than pre-
:raph were effects on streamflow, because roads function as linear features treatment 16 to 22 years after clear-cutting (Table 2).erties were and are constructed a few to many years before cutting. The magnitude of peak discharge response differed by event~d,,ti" qf size and season. In the first 5 years after clear-cutting the mean.’re~ Results peak discharge of small events increased by more than 75%’dr(~ .s while the mean peak discharge of large events increased byeach time Spatial Patterns of Forest Harvest in the Western Cascades 25%, a statistically insignificant change (Tables 2 and 3, Figure~t) counts Forest harvest in large basins produced a dispersed pattern 5). Six to 22 years after treatment, only fall and winter eventsasing a X2 of small clear-cuts whose concentration increascd gradually had peak discharges significantly greater than pretreatment
964 JONES AND GRANT: PEAK FLOW RESPONSES TO CLEAR-CUTTING, ROADS
A Blue Rive /Lookout Creek Clearcuts
1940 1950 1960
1970 1980 1990
B NF Willamet e MF/Salmon Creek Clearcuts
1940 1950 1960
Figure 2. Spatial pattern of cumulative clearcuts and roads by decade in (a) upper Blue River and LookoutCreek basins, (b) Salmon Creek and N. Fork Willamette Middle Fork River basins, and (c) Breitenbush River ~ndicand N. Santiam River basins. The scale bar is 10 km. ~: of p~
indicaCCO
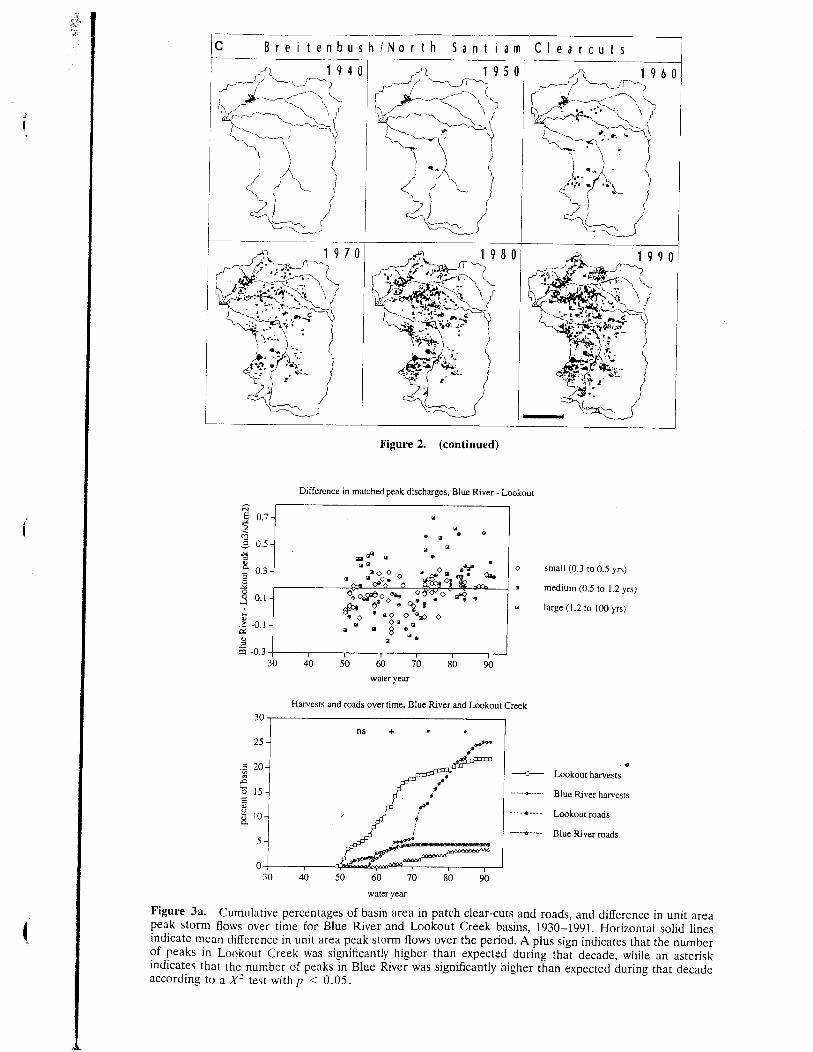
~ C Brei tenbush/North Sant iam Clea rcuts
1940 1950 1960
Figure 2. (e~ntinued)
Difference in matched peak discharges, Blue River - Lookout
~" 0.7-
~ 0.5
~ 0.3.~
Y " [ o small (0.3 to 0.5 yrs)0~-o~ ° ~ 06~o~
® medium (0.5 to 1.2 yrs)
~". .6~o ® ~o o ®~ o~ large (1.2 to lOO yrs)
~ -0.1
~ -0.330 50 60 7 80 90
water year
Harvests and roads overtime, Blue River and Lookout Creek
30
25
~ Lookout harvests~ 15 -~ ~’~’ .......
-*" ....... Blue River harvests
.... "~" .... Blue River roads
30 40 50 60 70 80 90
water year
Figure 3a. Cumulative percentages of basin area in patch clear-cuts and roads, and difference in unit areapeak storm flows over time for Blue River and Lookout Creek basins, 1930-1991. Horizontal solid linesindicate mean difference in unit area peak storm flows over the period. A plus sign indicates that the numberof peaks in Lookout Creek was significantly higher than expected during that decade, while an asteriskindicates that the number of peaks in Blue River was significantly higher than expected during that decadeaccording to a X2 test with p < 0.05.
966 JONES AND GRANT: PEAK FLOW RESPONSES TO CLEAR-CUTI’ING, ROADS
Difference in matched peak discharges, Sahnon - NF Willmnette
t~0.6
~$I 0.40 small (0.3 to 0.4 yrs)
[]
~ 0.2 ® medium (0.4 to 1.1 yrs)[]
io, ~o ~®.~ ~ ~ ~ ~ I~ge(I.ltol00yrs)
-0.2
water ye~
Ha~ests over time, Salmon and NF Willamette
25 -+ ns ~s ¯ ns
.~ 20-
~ 15 ~. + Salmon h~ests
~ ~ ........ * ........ NF Willamette h~ests10
030 40 50 60 70 80 90
water ye~
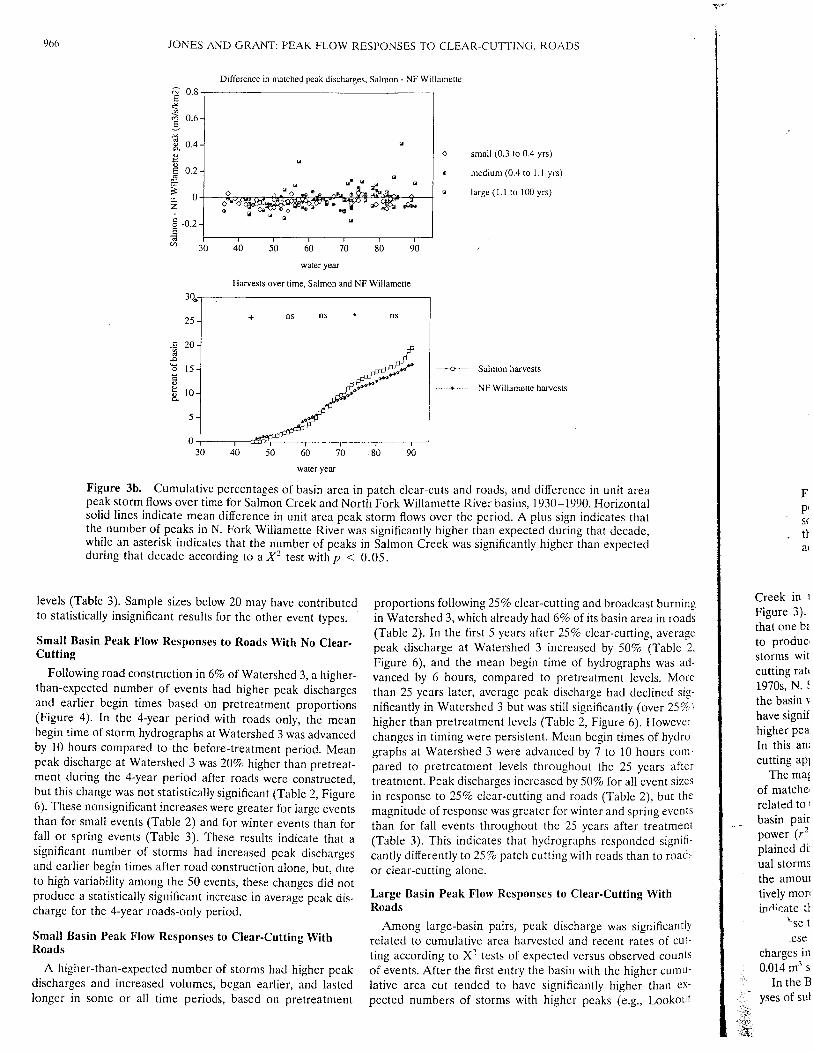
Figure 3b. Cumulative perccntages of basin area in patch clear-cuts and roads, and difference in unit area Fpeak storm flows over time for Salmon Creek and North Fork Willamette River basins, 1930-1990. Horizontal p~solid lines indicate mean difference in unit area peak storm flows over the period. A plus sign indicates that s~the number of peaks in N. Fork Willamette River was significantly higher than expected during that decade, ttwhilc an asterisk indicates that the number of peaks in Salmon Creek was significantly higher than expected a~during that decade according to a X~ test with p < 0.05.
levels (Table 3). Sample sizes below 20 may have contributed proportions following 25% clear-cutting and broadcast burning Creek in
to statistically insignificant results for the other event types, in Watershed 3, which already had 6% of its basin area in roads Figure 3).that one b~(Table 2). In the first 5 years after 25% clear-cutting, averagc
Small Basin Peak Flow Responses to Roads With No Clear-peak discharge at Watershed 3 increased by 50% (Table 2, to produo
CuttingFigure 6), and the mean begin time of hydrographs was ad- storms wit
Following road construction in 6% of Watershed 3, a higher- vanced by 6 hours, compared to pretreatment levels. More cutting rat~
than-expected number of events had higher peak discharges than 25 years later, average peak discharge had declined Sit- 1970s, N.the basinand earlier begin times based on pretreatment proportions nificantly in Watershed 3 but was still significantly (over 25~i
(Figure 4). In the 4-year period with roads only, the mean higher than pretreatment levels (Table 2, Figure 6). Howevez have signif
begin time of storm hydrographs at Watershed 3 was advanced changes in timing were persistent. Mean begin times of hydro- higher peaby 10 hours compared to the before-treatment period. Mean graphs at Watershed 3 were advanced by 7 to 10 hours corn- In this an~peak discharge at Watershed 3 was 20% higher than pretreat- pared to pretreatment levels throughout the 25 years after cutting aplment during the 4-year period after roads were constructed, treatment. Peak discharges increased by 50% for all event sizes The ma~,
but this change was not statistically significant (Table 2, Figure in response to 25% clear-cutting and roads (Table 2), but the of matche,related to6). These nonsignificant increases were greater for large events magnitude of response was greater for winter and spring events
than for small events (Table 2) and for winter events than for than for fall events throughout the 25 years after treatment _- basin pairfall or spring events (Table 3). These results indicate that (Table 3). This indicates that hydrographs responded signifi~ power (r~"
significant number of storms had increased peak discharges cantly differently to 25% patch cutting with roads than to road~ plainedand earlier begin times after road construction alone, but, due or clear-cutting alone, ual storms
to high variability among the 50 events, these changes did not the amom
produce a statistically significant increase in average peak dis- Large Basin Peak Flow Responses to Clear-Cutting With tively mor,
charge for the 4-year roads-only period. Roads i~,~icate tt
Among large-basin pairs, peak discharge was significantly ~se tSmall Basin Peak Flow Responses to Clear-Cutting With related to cumulative area harvested and recent rates of cut- :eseRoads ting according to X-~ tests of expected versus observed counts charges in
A higher-than-expected number of storms had higher peak of events. After the first entry the basin with the higher cumu- 0.014 m3 sdischarges and increased volumes, began earlier, and lasted lative area cut tended to have significantly higher thanlonger in some or all time periods, based on pretreatment pected numbers of storms with higher peaks (e.g., Lookot~ ~,~ yses of sut

JONES AND GRANT: PEAK FLOW RESPONSES TO CLEAR-CUTFING, ROADS 967
Difference in matched peak discharges, Breitenbush - N. Santiam
0.5
0.3£ ~:>~ 0 ~a®® ~ ~ ~t~0~ ®®~
0 small (0.25 to 0.5 yrs)
"= ~ 33;~i,:,o a ~,~b’c’o ~ ~o~^~ ~ ® medium (0.5 to 1.0 yrs)
~¯ large (1 to lO0 yrs)
~ -0.1 ®o o
"3 -0.3. 30 4’0 7’0 8’0 9’0water year
Harvests over time, Breitenbush and N. Santiam
3Ons ns + fls ns ns
25
.=. 20
I5 ~ Breitenbush harvests~
a~ .............
N. Santiam harvests~ tO
30 40 50 60 70 80 90
water year
Figure 3c. Cumulative percentages of basin area in patch clear-cuts and roads, and difference in unit areapeak storm flows over time for Breitenbush River and North Santiam River basins, 1930-1990. Horizontalsolid lines indicate mean difference in unit area peak storm flows over the period. A plus sign indicates thatthe number of peaks in the N. Santiam River basin was significantly higher than expected during that decadeaccording to a X2 test with p < 0.05.
;t burning Creek in the 1960s, N. Fork Willamette in the 1940s; see difference in the magnitude of harvest-related increase in peak
a in roads Figure 3). When there was a transition in cutting rates such discharges for events of different sizes, seasons, or types (Table
, average that one basin’s rate of cutting surpassed the other, this tended 4). Rain-on-snow events and rain events had nearly identical
~Table 2, to produce significantly higher than expected numbers of responses to timber harvest in the Blue River/Lookout Creek; was ad- storms with higher peaks in the basin with the more rapid basin pair. The regression model for this basin pair indicatesIs. More cutting rate (e.g., Blue River in the 1970s, Salmon Creek in the that on average, peak discharges in the basin with 15% moreined sig-. 1970s, N. Santiam River in the 1950s). After these transitions area harvested increased by an amount equivalent to 24 to 32%/er 25%) the basin with the higher cumulative area cut again tended to of the 1-year event (Table 4).towever, have significantly higher than expected numbers of storms with The regression model for the Salmon Creek/N. Fork Wil-)f hydro- higher peaks (e.g., Blue River and Salmon Creek in the 1980s). lamette basin pair indicates that on average, peak discharges inars corn- In this analysis both cumulative area cut and recent rate of the basin with 5% more area harvested increased by an amount~rs after cutting appeared to influence peak discharge proportions,
equivalent to 25 to 34% of the 1-year event (Table 4). Theent sizes The magnitude of the difference in unit area peak discharges ¯ ~. .. but the of matched storms is significantly (p < 0.05) and positively model for the Breitenbush/N. Santmm basra pair indicates that
g events ~elated to the difference in cumulative harvest area for all three on average, peak discharges in the basin with 4% more area
eatment basin pairs (Figure 7, Table 4). However,, the explanatory harvested increased by an amount equivalent to 10 to 16% of
I signifi- power (r2) of the relationships is very low, with large unex- the 1-year event, depending on which basin’s 1-year event is
to roads plained differences between basins in the behavior of individ- used as the reference point (Table 4). Regression models were
ual storms in each year. Each regression slope term measures also run for these two basin pairs using only large events and
the amount by which peak discharges increased in the rela- spring events, which occur when the soil mantle is thoroughly¢ith tively more cut basin in a pair. The nearly identical slope terms wetted and the channel network is likely to be fully extended.
indicate that unit area peak discharges show the same linear The regression models indicate that in the Salmon CreekfN.ficantlv response to cumulative harvests in all three basin pairs (Figure Fork Willamette and Breitenbush/N. Santiam basin pairs, on
of~" 7). These slopes imply that in all three basin pairs, peak dis- average, peak discharges of large and spring events in the basincot~ charges in the more heavily cut basin increased on average by with 4 to 5% more area harvested increased by an amount
¯ cumu- 0.014 m3 s-~ km-~- for each 1% difference in area cut (Table 4). equivalent to 30 to 52% of the 1-year event. The more pro-lan ex- In the Blue River/Lookout Creek basin pair, regression anal- nounced response of large events at Breitenbush/N. Santiam isookout yses of subsets of the data indicated that there was little or no evident in the upper panel of Figure 3c.
968 JONES AND GRANT: PEAK FLOW RESPONSES TO CLEAR-CUTTING, ROADS
Discussion1
(a) Clearcut This study demonstrated that road construction combinccl
"~with patch clear-cutting ranging from 10 to 25% of basinproduced significant, long-term increases in peak dischargessmall and large basins in the western Cascades. In two pairs
~, 3 small basins the magnitude and duration of increase indischarges after 25% clear-cutting with roads was no different
1"]]~
from that after 100% clear-cutting without roads, but the by-Roads drologic mechanisms are different. In the western Cascades.
clear-cutting and vegetation remow~l influence water balancesby affecting evapotranspiration and possibly snow accumulationand melt, whereas road construction influences hillslope flowpaths by converting subsurface flow td’surface flow (Figure 8).
Clear-cutting effects on water balances independent of road
........... effects can only be examined in small basins. Completel t~Road s + Clearcut
cutting produced significant increases in fall events, whichmostly small, and winter events, which range from small tolarge, but not for large events as a group. These results supportthe hypothesis that suppression of evapotranspiration after
4 removal of deep-rooted conifers led to increased deep subsur-
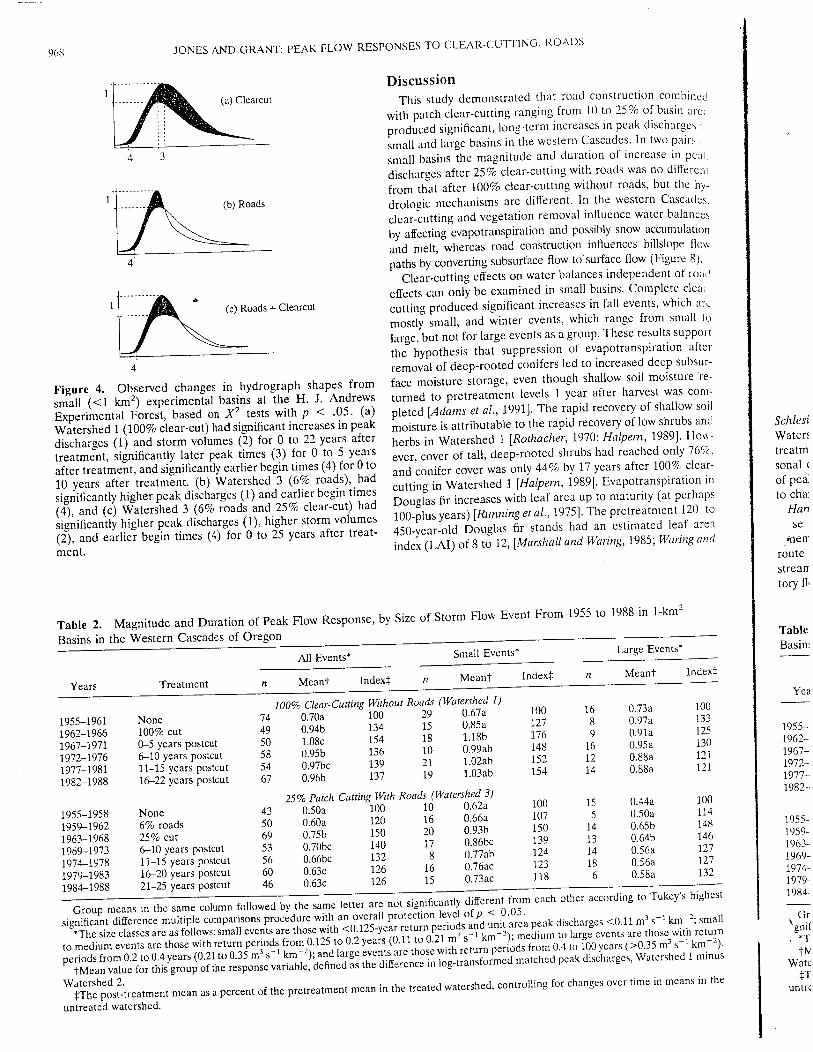
Figure 4. Observed changes in hydrograph shapes fromface moisture storage, even though shallow soil moisture re-
small (<1 km2) experimental basins at the H. J. Andrews turned to pretreatment levels 1 year after harvest was corn-
Experimental Forest, based on X2 tests with p < .05. (a) pleted [Adams et al., 1991]. The rapid recovery of shallow soil I
Watershed 1 (100% clear-cut) had significant increases in peak moisture is attributable to the rapid recovery of low shrubs and Schlesi
discharges (1) and storm volumes (2) for 0 to 22 years after herbs in Watershed 1 [Rothacher, 1970; Halpem, 1989]. How- Water,’
treatment, significantly later peak times (3) for 0 to 5 years ever, cover of tall, deep-rooted shrubs had reached only 76%. treatm
after treatment, and significantly earlier begin times (4) for 0 and conifer cover was only 44% by 17 years after 100% clear- sonal
10 years after treatment. (b) Watershed 3 (6% roads), significantly higher peak discharges (1) and earlier begin times
cutting in Watershed 1 [Halpern, 1989]. Evapotranspiration in of peal
(4), and (c) Watershed 3 (6% roads and 25% clear-cut) Douglas fir increases with leaf area up to maturity (at perhaps to cha:
significantly higher peak discharges (1), higher storm volumes100-plus years) [Running et al., 1975]. The pretreatment 120- to Ha~
(2), and earlier begin times (4) for 0 to 25 years after treat-450oyear-old Douglas fir stands had an estimated leaf area se
ment. index (LAI) of 8 to 12, [Marshall and Waring, 1985; Waring and,herr
routestreantory fl,
Table 2. Magnitude and Duration of Peak Flow Response, by Size of Storm Flow Event From 1955 to 1988 in 1-km-~Table
Basins in the Western Cascades of Oregon Basin,, IAll Events* Small Events* Large Events*
Years Treatment n Mean]. Index$ n Mean] lndex$ n Mean]. Index+,
Yea,100% Clear-Cutting Without Roads (Watershed 1)
’
1955-1961 None 74 0.70a 100 29 0.67a 100 16 0.73a 100
1962-1966 100% cut 49 0.94b 134 15 0.85a 127 8 0.97a 133
1967-1971 0-5 years postcut 50 1.08c 154 18 1.18b 176 9 0.91a 125 1955-
1972-1976 6-10 years postcut 58 0.95b 136 10 0.99ab 148 16 0.95a 130 1962-
1977-1981 11-15 years postcut 54 0.97bc 139 21 1.02ab 152 12 0.88a 121 1967-
1982-1988 16-22 years postcut 67 0.96b 137 19 1.03ab 154 14 0.88a 121 1972-1977-
25% Patch Cutting With Roads (Watershed 3)1982-
1955-1958 None 43 0.50a 100 10 0.62a 100 15 0.44a 100
1959-1962 6% roads 50 0.60a 120 16 0.66a 107 5 0.50a 114
1963-1968 25% cut 69 0.75b 150 20 0.93b 150 14 0.65b 148 1955-
1969-1973 6-10 years postcut 53 0.70bc 140 17 0.86bc 139 13 0.64b 146 1959-
1974-1978 11-15 years postcut 56 0.66bc 132 8 0.77ab 124 14 0.56a 127 1963-:
1979-1983 16-20 years postcut 60 0.63c 126 16 0.76ac 123 18 0.56a 127 1969-
1984-1988 21-25 years postcut 46 0.63c 126 15 0.73ac 118 6 0.58a 132 1974-1979-
Group means in the same column followed by the same letter are not significantly diilerent from each other according to Tukey’s highest 1984-significant difference multiple comparisons procedure with an overall protection level ofp < 0.05.
*The size classes are as follows: small events are those with <0.125-year return periods and unit area peak discharges <0.11 m3 s-~ kin-a; small ~,gGnirt!
to medium events are those with return periods from 0.125 to 0.2 years (0.11 to 0.21 -~ s-~ kin-2); medium to large events are those with r eturn , *Tperiods from 0.2 to 0.4 years (0.21 to 0.35 m3 s-~ kin-z); and large events are those with return periods from 0.4 to 100 years (>0.35 ~ s-a km-2)¯ ].Iv
~-Mean value for this group of the response variable, defined as the difference in log-transformed matched peak discharges, Watershed 1 minus Wat¢
Watershed 2. untrc{The post-treatment mean as a percent of the pretreatment mean in the treated watershed, controlling for changes over time in means in the~T.
untreated watershed.
JONES AND GRANT: PEAK FLOW RESPONSES TO CLEAR-CUTTING, ROADS 969
Watershed 1 v. Watershed 2 peak discharge over time
on combinedof basin area ~di~ es in ~- 1.6 a a
nt sof ~cease.., peak
~~.4
s no different ~ ~.2-s, but the hy- ~ ,~ ~o, o~." ~,~" "~ .0 ~ ~m~
. 1 ................ . ........ , ............ ~"" *’-’-i-----* ....... ~ ......... ~ ..........:rn Cascades, ~ ~,ater balances K 0.8 ~ n ~ 0 o x o ~ n = * . e - ¯ * medium-t~ge
hillslope flow 20.6-- ~
~~ ~ o 0 1 ~2oO’ (Figure 8). ~ 0.4 ....
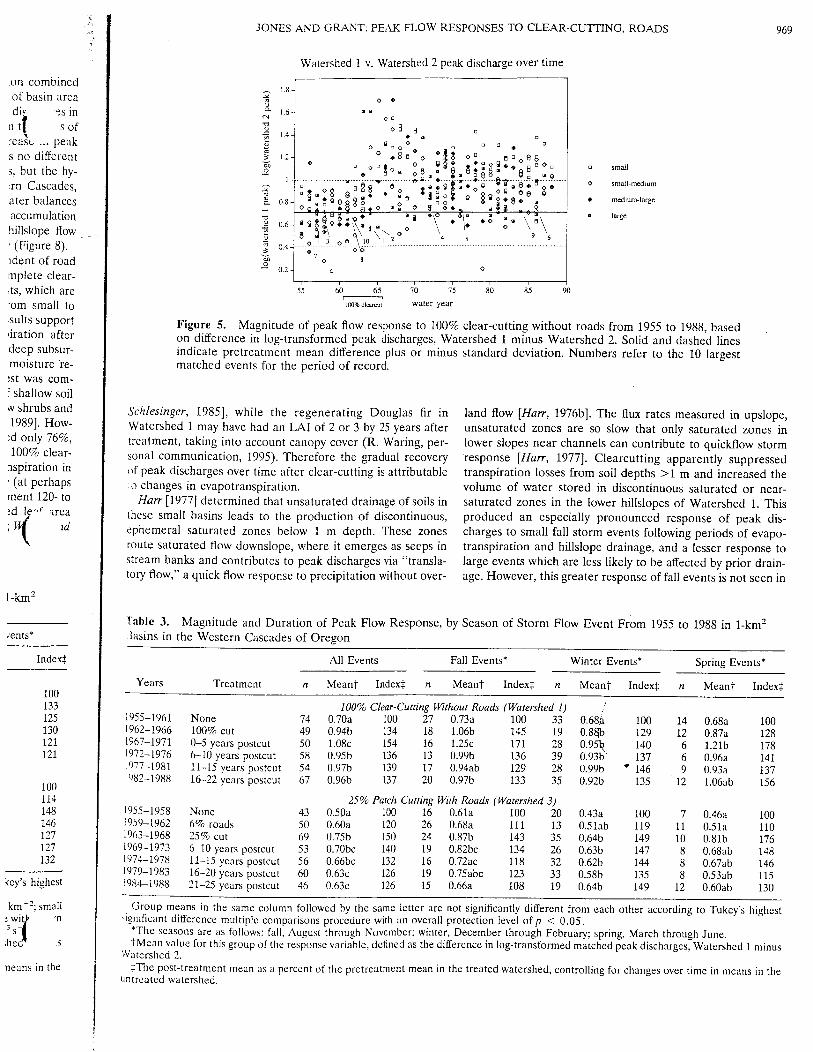
:~:~ ..........~- ..........................................................................:dent of road ~ 0.2- ~ omplete clear-:ts, which are 5:"ore small to ’~c~,’ water yearsults support Figure 5. Magnitude of peak flow response to 100% clear-cutting without roads from 1955 to 1988, based,iration after on difference in log-transformed peak discharges, Watershed 1 minus Watershed 2. Solid and dashed linesdeep subsur- indicate pretreatment mean difference plus or minus standard deviation. Numbers refer to the 10 largestmoisture re- matched events for the period of record.:st was corn-
: shallow soil~shrubs and Sc~lesinger, 1985], while the regenerating Douglas fir in land ~ow [Ha~, 1976b]. The fl~ rates measured in upslope,1989]. How- Watershed 1 may have had an LAI of 2 or 3 by 25 years after unsaturated zones are so slow that only saturated zones in:d only 76%, treatment, taking into account canopy cover (R. Waring, per- lower slopes near channels can contribute to quic~ow storm100% clear- sonal communication, 1995). Therefore the gradual recove: response [Ha~, 1977]. Clearcutting apparently suppressedaspiration in of peak discharges over time after clear-cutting is attributable transpiration losses from soil depths >1 m and increased the’ (at perhaps :o changes in evapotranspiration, volume of water stored in discontinuous saturated or near-ment 120- to Ha~ [1977] determined that unsaturated drainage of soils in saturated zones in the lower hillslopes of Watershed 1. This
:d:~lle~c areathese small basins leads to the production of discontinuous, produced an especially pronounced response of peak dis-
;~
,d ephemeral saturated zones below 1 m depth. These zones charges to small fall storm events following periods of evapo-route saturated flow downslope, where it emerges as seeps in transpiration and hillslope drainage, and a lesser response tostream banks and contributes to peak discharges via "transla- large events which are less likely to be affected by prior drain-tow flow," a quick flow response to precipitation without over- age. However, this greater response of hll events is not seen in
Table 3. Magnitude and Duration of Peak Flow Response, by Season of Storm Flow Event From 1955 to 1988 in 1-km2
/ents* 3asins in the Western Cascades of Oregon
Index~: All Events Fall Events* Winter Events* Spring Events*
Years Treatment n Mean? Index:l: n Mean? Index~: n Mean? Index~: n Mean? Index;100133 100% Clear-Cutting Without Roads (Watershed 1)125 1955-1961 None 74 0.70a 100 27 0.73a 100 33 0.68~b, 100 14 0.68a 100130 1962-1966 100% cut 49 0.94b 134 18 1.06b 145 19 0.88"o 129 12 0.87a 128121 1967-1971 0-5 years postcut 50 1.08c 154 16 1.25c 171 28 0.95~ 140 6 1.21b 178121 1972-1976 6-10 years postcut 58 0.95b 136 13 0.99b 136 39 0.93b 137 6 0.96a 141
1977-1981 11-15 years postcut 54 0.97b 139 17 0.94ab 129 28 0.99b " 146 9 0.93a 137!%2-1988 16-22 years postcut 67 0.96b I37 20 0.97b 133 35 0.92b 135 " 12 1.06ab 156100
114 25% Patch Cutting With Roads (Watershed 3)148 1955-1958 None 43 0.50a I00 16 0.61a I00 20 0.43a 100 7 0.46a 100146 1959-1962 6% roads 50 0.60a 120 26 0.68a 111 13 0.5lab 119 11 0.51a 110127 1963-1968 25% cut 69 0.75b 150 24 0.87b 143 35 0.64b 149 10 0.81b 176127 1969-1973 6-10 years postcut 53 0.70bc 140 19 0.82bc 134 26 0.63b 147 8 0.68ab 148132 1974-1978 i1-t5 years postcut 56 0.66bc 132 16 0.72ac 118 32 0.62b 144 8 0.67ab 1461979-1983 16-20 years postcut 60 0.63c 126 19 0.75abc 123 33 0.58b 135 8 0.53ab 115key’s highest 1984-1988 21-25 years postcut 46 0.63c 126 15 0.66a 108 19 0.64b 149 12 0.60ab 130
kin-2; small Group means in the same column followed by the same letter are not significantly different from eachother accordingto Tukey’shighest: wit, I, -n ,ignificant difference multiple comparisons procedure with an overall protection level ofp < 0.05.~ SeJ *The seasons are as follows: fall, August through November; winter, December through February; spring, March through June.1ll .s ?Mean value for this group of the response variable, defined as the difference in log-transformed matched peak discharges, Watershed 1 minus
Watershed 2.neans in the ;The post-treatment mean as a percent of the pretreatment mean in the treated watershed, controlling for changes over time in means in the
untreated watershed.

970 JONES AND GRANT: PEAK FLOW RESPONSES TO CLEAR-CUTFING, ROADS
Watershed 3 v. Watershed 2 peak discharge over time Table 4.Western Ca
K 1.6- Va= 1.4-
~~ m m small /sd[ events
, I ~ ~o
= o ~" ~ g " ~ .o ~o RainonSnm
< . .......,..-}~-~-~-.-~ ...... ..,.g..~.~.~ .......~....g....~.,.~..~.,-,.~.~*~ ...... ~g~
~ ~ ~’~o,~ ~ ~- .~. . -g ,~ ¯ , Large plusSt
~ ~-w~ ..... ~-~ ................................~ ....................o: ...............- o.~- " ~ ~9 : * ~ b ~1 Events
~ , Large plus S155 ,~ ,,~ 6’5 7; 7; 8; 8’5 90
6%r~s 25% patch cut water year The depenha~ested. TI
Figure 6. Magnitude of peak flow response to 25% clear-cutting with roads from 1955 to 1988, based on significantdifference in natural logs of storm peak flows, Watershed 3 minus Watershed 2. Solid and dashed lines indicate corrected sigpretreatment mean difference plus or minus standard deviation. Numbers refer to the 10 largest matched *Impliedevents for the period of record, ha~ests be~
Creek, 5% f:discharge.
?Value ofeither small or large basins where clear-cutting and roads were surface flow paths [Ha~ et al., 1975; King and Tennyson, 198~ SValue ofcombined. Thus water balance mechanisms associated with Wemple, 1994; Whght et aL, 1990]. Reid [1981] and Reid and }Value ofvegetation removal are inadequate to explain the response of Dunne [1984] estimated discharges from culvert outfalls inpeak discharges to clear-cutting with roads, western Washington and associated them with runoff from
The addition of roads to clear-cutting in small basins pro- road surfaces.duced a quite different hydrologic response than clear-cutting Roadside ditches in Watershed 3, which are normal to hill- conditions,alone, leading to significant increases in all sizes of peak dis- slope flow paths, appear to capture the increased subsurface e -~ngcharges in all seasons, and especially prolonged increases in moisture stored in clear-cuts above road cutbanks. This water t ~es ,
peak discharges of winter events. These results support the .can be routed directly to stream channels by ditches connected to ~,atershhypothesis that roads interact positively with clear-cutting to to streams and by new channels etched below culvert outfalls fers had reamodi~ water flow paths and speed the deliveu of water to [Wemple, 1994]. In Watershed 3, 50% of the road ne~ork i: comparedchannels during storm events (Figure 8), producing much connected to the stream by these surface flow paths, and in The re~greater changes in peak discharges than either clear-cutting or Lookout Creek and Blue River, 60% of the road ne~ork is could haveroads alone. Roads alone appear to advance the time of peak connected, producing up to 40% increases in stream drainage by reducindischarges and increase them slightly. Road surfaces, cutbanks, densi~ [Wemple, 1994]. Cutbank interception of subsurface increasingditches, and culverts all can convert subsurface flow paths to flow paths is most likely to be significant during wet soil mantle changes in
peak arriwmoral in 1
Pe~ discharge response to differences in cumulative area h~vested for all three basin pairs were delay
~0.v5{
in 1960 in
~ ~~ . y = 0.014x + 0.229, r2 = 0.13, p < .~I delaying p
. ¯ = /." 1960, prob~ 0.5- °~° L:y = 0"0tSx ~ 0’023’ r= = 0’08’ p <~19
~. ~ 8 ~ /" [’,y=0.014x+0.180, r =0.025 p< .05 tinued to
~ ~ ~ ~"~ / .~ ; debris flou~0.25 n ~ ~= = ~ . ~ ~,.. ...... of the chin=~ ~ f ~ , , ~ ~/’ = B~m .... ~okom, and road
~ ~ n.~ ~ = ~a 2a~ /." peak dischg
~~ ~ ~a aa ;~.o~ % f :’
rai ............... Road in
~ 0- ?,~£ ~ ~ ~vwiu ....... s,l ...... peakdisct~
~~ ~a all events size, geolo
~~ e ~ ~ o Breitenbush - N. Santiam, response t
, discharges-0.25
-~5 -~0 -5 0 c,~nlatiwDifference in cumulative ~ent of b~in harvested ~bal~
Figure 7. Magnitude of peak flow response to cumulative patch clearcutting with roads in 60- to 600-kin2 Mng
basins, based on relationship be~een difference in cumulative percent of basin ha~ested (independent are consis
variable) and difference in unit area peak discharge (dependent variable) for three pairs of large basins: upper indicatedBlue River~ookout Creek, Salmon Cree~. Fork Willamette Middle Fork River, and Breitenbush River/ importan¢North Santiam River. Lines show regression models for all events in each basin pair. sponse as
¯ JONES AND GRANT: PEAK FLOW RESPONSES TO CLEAR-CUTTING, ROADS 971
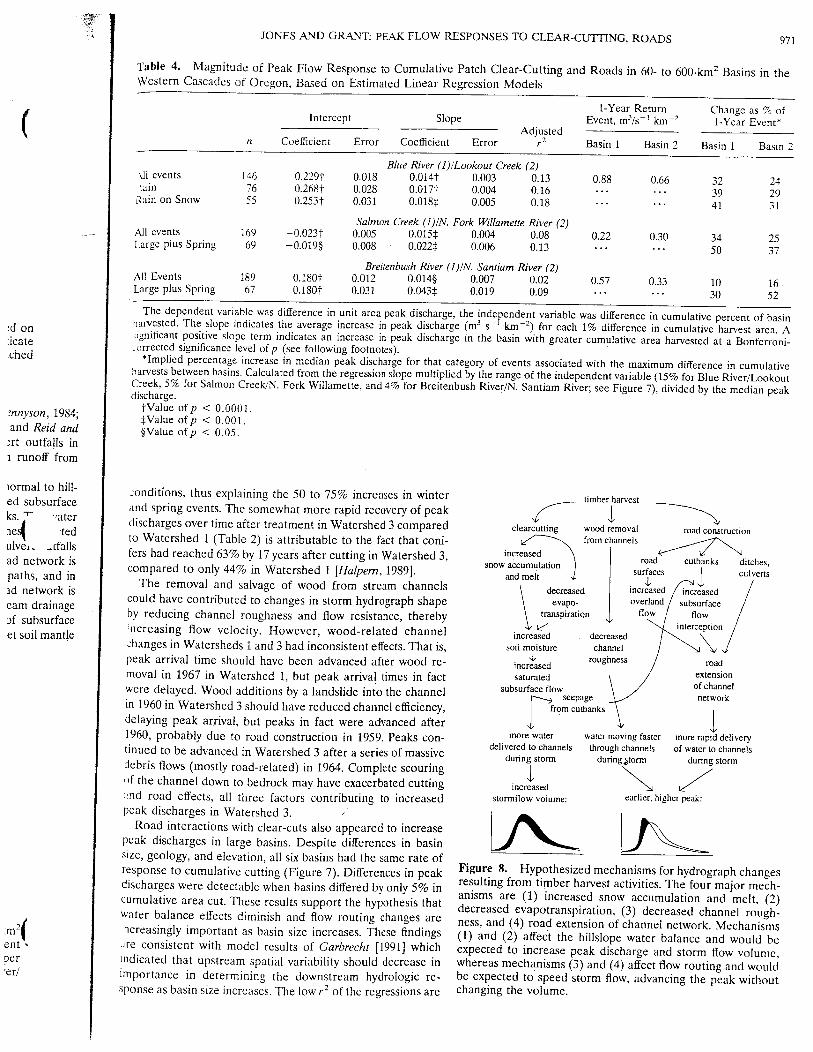
Table 4. Magnitude of Peak Flow Response to Cumulative Patch Clear-Cutting and Roads in 60- to 600-kin2 Basins in theWestern Cascades of Oregon, Based on Estimated Linear Regression Models
1-Year Return Change as % ofIntercept Slope Event, m3/s-~ km-2 1-Year Event*
Adjustedn Coefficient Error Coefficient Error rz Basin 1 Basin 2 Basin 1 Basin 2
Blue River (1)~Lookout Creek (2)\11 events 146 0.229? 0.018 0.0147 0.003 0.13 0.88 0.66 32 24’.ain 76 0.268? 0.028 0.0177 0.004 0.16 ...... 39 29Rain on Snow 55 0.253] 0.031 0.018~ 0.005 0.18 ...... 41 31
Salmon Creek (1)/N. Fork Willamette River (2)_~_ All events 169 -0.023? 0.005 0.015~: 0.004 0.08 0.22 0.30 34 25Large plus Spring 69 -0.019§ 0.008 0.022{ 0.006 0.13 ...... 50 37
Breitenbush River (1)/N. Santiam River (2)All Events 189 0.1807 0.012 0.014§ 0.007 0.02 0.57 0.33 10 16Large plus Spring 67 0.180~ 0.031 0.043:[: 0.019 0.09 ...... 30 52
The dependent variable was difference in unit area peak discharge, the independent variable was difference in cumulative percent of basin
.’d on harvested. The slope indicates the average increase in peak discharge (m~ s-l.krn-2) for each 1% difference in cumulative harvest area. A
licate ~ignificant positive slope term indicates an increase in peak discharge in the basin with greater cumulative area harvested at a Bonferroni-~orrected significance level ofp (see following footnotes).
:ched *Implied percentage increase in median peak discharge for that category of events associated with the maximum difference in cumulativeharvests between basins. Calculated from the regression slope multiplied by the range of the independent variable (15% for Blue River/LookoutCreek, 5% for Salmon Creek/N. Fork Willamette, and 4% for Breitenbush River/N. Santiam River; see Figure 7), divided by the median peakdischarge.
?Value ofp < 0.0001.~.nnyson, 1984; SValue ofp < 0.001.and Reid and §Value ofp < 0.05.~rt outfalls in1 runoff from
~ormal to hill- .:onditions, thus explaining the 50 to 75% increases in winter timber harvested subsurface and spring events. The somewhat more rapid recovery of peak,~ ,L ~""¢,ks.i -ater discharges over time after treatment in Watershed 3 compared
ne~ :ted to Watershed 1 (Table 2) is attributable to the fact that coni-clearcutting wood removal road construction
ulve~. .,tfallsincreased \ .fers had reached 63% by 17 years after cutting in Watershed 3,
snow accumulation } road cutbanks ditches,ad network iscompared to only 44% in Watershed 1 [Halpem, 1989]. and mel~ ,~ / surfaces | culverts
[ mcre~ased ~ -,1, /paths, and in
The removal and salvage of wood from stream channels\ decreased / ’ / increased /ad network is
could have contributed to changes in storm hydrograph shape\ evapo- ]
overland/ subsurface /eam drainage\ transpiration +
flo,,,w / . flow/af subsurface
by reducing channel roughness and flow resistance, thereby,~ k-/ ~ interception /
et soil mantle increasing flow velocity. However, wood-related channel increased . decreased / ~ ~ /changes in Watersheds 1 and 3 had inconsistent effects. That is, soil moisture channel /peak arrival time should have been advanced after wood re- incred’ased roughness~ roadmoral in 1967 in Watershed 1, but peak arrival times in fact saturated \ / ~tension
subsurface flow \ ~ of channelwere delayed. Wood additions by a landslide into the channel~ seepage .3~ network
in 1960 in Watershed 3 should have reduced channel efficiency,
,L tr0m cutbanks ~ ,Ldelaying peak arrival, but peaks in fact were advanced after1960, probably due to road construction in 1959. Peaks con- more water water moving faster more rapid deliverytinued to be advanced in Watershed 3 after a series of massive delivered to channelsthrough channels of water to channels
during storm during#torm during stormdebris flows (mostly road-related)in 1964. Complete scouring,L "~,ff the channel down to bedrock may have exacerbated cutting increased
:trio road effects, all three factors contributing to increased stormf~ow volume: earlier, higher peak:peak discharges in Watershed 3. /
Road interactions with clear-cuts also appeared to increasepeak discharges in large basins. Despite differences in basinsize, geology, and elevation, all six basins had the same rate ofresponse to cumulative cutting (Figure 7). Differences in peak Figure 8. Hypothesized mechanisms for hydrograph changes
discharges were detectable when basins differed by only 5% in resulting from timber harvest activities. The four major mech-anisms are (1) increased snow accumulation and melt, (2)cumulative area cut. These results support the hypothesis thatdecreased evapotranspiration, (3) decreased channel rough-water balance effects diminish and flow routing changes arehess, and (4) road extension of channel network. Mechanisms
2~t’ncreasingly important as basin size increases. These findings (1) and (2) affect the hillslope water balance and would
t ,~re consistent with model results of Garbrecht [1991] which expected to increase peak discharge and storm flow volume,9er indicated that upstream spatial variability should decrease in whereas mechanisms (3) and (4) affect flow routing and would’er/ importance in determining the downstream hydrologic re- be expected to speed storm flow, advancing the peak without
sponse as basin size increases. The low r2 of the regressions are changing the volume.

972 JONES AND GRANT: PEAK FLOW RESPONSES TO CLEAR-CUTTING, ROADS
in part attributable to between-basin differences in actual pre- vested (J. Miller, USGS, unpublished data, 1991). Increases Reference5cipitation received and antecedent moisture conditions for this magnitude also are consistent with our finding that three
Adams, P- W.,paired events. The 1--" also may be low because cumulative area five storms per year over the past 50 years exceeded the otis2, soi~ ,,,oistur~cut is all imperfect index of the mechanism contributing to inal USGS base flow, so that by 1990 the USGS 1.t-year rctu:increased peak discharges. That is, road effects may not be event had a return period as frequent as 0.3 years in th~ A~. H.
woo - f Unprecb~ely indexed by cutting history in extent or timing since basins. Sci., Gentbrcutting lags behind road construction. In Lookout Creek, Peak discharges of statistically tractable events (i.e., up Blackic. J. R.,1.8 km km 2 of roads (80% of final road network) had been 5-year events) may have doubled over the past 50 years in large in East afri~constructed by 1970 when only 17% of basin area had been basins of the Cascades. Such changes have implications for Callaham, R.
in westernharvested; in Blue River 1.2 km km-2 of roads had been con- stream geomorphology and ecology. If all peak discharges have Univ. of Calstructed by 1980 when only 18% of basin area had been bar- been increased systematically, there may be more frequent Christner, J.,vested. Rapid road network expansion during those early inundation of the riparian zone, more rapid turnover of ripar- snow znne,periods of basin entry also may account for the higher than Snow Confeexpected numbers of high peak discharges in periods of rapid Jan zone vegetationfand perhaps increased transport of wood\ Duncan, S. H.,acceleration of cutting (e.g., Blue River and Salmon Creek in debris and sediment. However, these changes will be diff~cul~ !: yield timber
the 1970s, N. Santiam in the 1950s; see Figure 3). discriminate since stream channels are annually subjected :, ton State, N,
Much debate has focused on’whether the largest (>10 years) fluctuations of 2 orders of magnitude in peak discharges. Dyrness, C. T..vegetation
peak discharges have been significantly affected by land use. PNW-31, U.{This inevitably is an inconclusive debate, despite the over- CollelusiOIiS and Further Work
vallis, Oreg.,
whelming importance of large peak discharges for channel Dyrness, C. T.
morphology. Because of the rate of vegetation recovery (i.e., The main conclusion of this study is that landscape-scale sheds in theFor. Serv. P
60% recovery of canopy cover and LAI within 30 years), on- forest harvesting has produced detectable changes in peak 1969.going land transformations such as road obliteration and aban- discharges in basins ranging up to 600 km~ in the western Dyrness, C. T.,donment, and limited record lengths (50 to 60 years at most), Cascades. These increases are attributable to changes in fl~m burning in tt
1973.sample sizes will always be inadequate to statistically test routing (due to roads) rather than to mere changes in war._ Eberhardt, L.changes in peak discharges with >10-year return periods. Even storage due to vegetation removal (i.e., evapotranspiratio~;, studies, Ecolsubdividing events by size or season in this study produced rain on snow, fog drip) invoked in early analyses of small-basin Fedora, M. A.:notable losses of significance when sample sizes fell below 20 hydrology. Three important implications arise from this study, antecedent~ 133, 1989.(Tables 2 and 3). The statistical analysis strongly suggests that First, there is much to be learned from more analyses of large- Freid, M., Thethe entire population of peak discharges is shifted upward by scale, long-term hydrologic data sets especially if they contain western Ore.clear-cutting and roads; we see no reason to expect the biggest nested, paired basin experiments. Second, we need to improve C" "~, 19’storms to behave differently from the rest of the population, our understanding of subsurface/surface flow path interactions Ga ZJ.,
Collectively, the statistical analyses reported here strongly and how they may be affected by roads, which at 2 to 3 km Grant, ~. E., asuggest that there has been a large increase in peak discharges km-2 [Freid, 1994] have densities at least equal to stream port after tiattributable to forest harvest in both small and large basins in drainage densities in forest landscapes of the Pacific Norti, USA, in Seathe western Cascades. The major mechanism responsible for Trends and Ethese changes is the increased drainage etficiency of basins west. Third, we need to reexamine channels of unregulated Sci., Gentbrt
attributable to the integration of the road/patch clear-cut net- fifth- to seventh-order streams for evidence of possible changes Greenland, D.,
work with the preexisting stream channel network. In small in channel morphology and stream ecology that might be at- and its regio~Serv., Pac. N
basins discharges increased by 50% in the first 5 years after tributable to these long-term increases in peak discharges. Greenland, D.,treatment and were 25 to 40% higher than pretreatment up to of the H. J.
25 years later. Peak discharges have increased even more in Acknowledgments. This research was supported by the USF8search site,
Haan, C. T., Stlarge basins, by 10 to 15% or 30 to 55% of the 1-year flow, Pacific Northwest Research Station and grants HRD-9103615 (Visiting " Ames, 1977.depending on the basin, for a 5% difference in area cut. When Professorships for Women) and BSR-9011663 (Long Term Ecologic~d Halpern, C. B.,extrapolated to the cumulative area cut (which ranged from 10 Research) from the National Science Foundation. We thank A. Lev>~ tions of life
to 25%) this implies that peak discharges have increased by at R. Fredriksen, and the USFS PNW Research Station for collectinn , : 1989.
least 50% and perhaps by as much as 250% of the 1-year flow long-term hydrograph records for Watersheds 1, 2, and 3 and hyd~- Ham R. D., Fcgraph records for Lookout Creek from 1955 to 1963; J. Miller and Tech. Rep. P!
over the 50-year period. For large basins our analysis must E. Hubbard of USGS Portland for provision of archival hydrograph Exp. Stn., Cchave underestimated the magnitude of peak discharge increase records for the large basins; D. Henshaw, H. Hammond, K. Farrclt. Harr, R. D., Fbecause it was based on comparisons between more- versus R. Perkins, A. Wolff, and the Quantitative Sciences Group for digitiz- Gen. Tech. R
less-harvested basins, not harvested versus control basins. Ex- ing and analysis of hydrograph records from Watersheds 1, 2. and 3. Range Exp.
trapolations of these rates into the future should be tempered provision of archival precipitation, temperature, and hydrograpl~ Hart, R. D., W
records from Lookout Creek, and data management support:by the fact that future management of public land may involveL. Rankin and D. Bates of Willamette National Forest for compilin:-’
Hart, R. D., Solower rates of cutting and road construction than those that maps of historical forest harvest data; Willamctte National F{~rc" ing rainfall
have occurred over the past 50 years, cartography lab for historical maps; University of Oregon map lib~:~ Hart, R. D., F~’ Water Resozo
Increases of this magnitude over the past 50 years are con- for historical aerial photography; J. Kiscr of the Oregon State Unix~sistent with USGS modifications over time of the size of the sity Forest Resources Department for video-digitizing road nem~rl,"
tlarr, R. D., EtOregon: A n
l.l-year peak discharge. This base was increased by 47% in from aerial photography; M. Freid, HI Hammond, G. LienkaempCl. : 11o" "q~6.
1959 after 10% of Lookout Creek had been harvested, by 25% B. Marks, R. Perkins, N. Sorenson, and B. Wemple for technical Ha~ an
in 1964 after 6% of Blue River had been harvested, by 11% insupport including ARC/INFO and GRASS geographic information ’
systems and digital elevation modeling; and R. Beschta, J. Hall. R. Ds~ off:
!’ termactplina01959 after 3% of Salmon Creek had been harvested, by 25% in Harr, S. Jones, K. Wright, W. Megahan, A. Sikka, F. Swanson, and :{ M. E. Jones1949 after 2% of Breitenbush River had been harvested, and R. Thomas for comments on statistical analyses and other aspects ol i Washington,by 16% in 1959 after 3% of N. Santiam River had been hat- the manuscript. I #~arr, R. D., anl
JONES AND GRANT: PEAK FLOW RESPONSES TO CLEAR-CUTTING, ROADS 973
). Increases of References size and timing of peak flows in a small watershed in western Ore-tg that three to gon, Wetter Resour. Res., 15(1), 90-94, 1979.eded the orig- Adams, P. W., A. L. Flint, and R. L. Fredriksen, Long-term patterns in Harr, R. D., W. C. Harper, J. T. Krygicr, and F. S. Hsieh, Changes in
soil moisture and revegetation after clearcut of a Douglas-fir forest storm hydrographs after road building and clear-cutting in the1.1-i -eturn in Oregon, Forest Ecol. Mamvge., 41,"~a49--63,9 1991. Oregon Coast Range, Water Resour. Res., 11(3), 436-444. 1975.ye~ hese Anderson, H. W.. and R. L. Hobba, Forests and floods in the north-
Ham R. D., R. L. Fredriksen, and J. Rothacher, Changes in stream-. western United States, Publ. 48, pp. 30-39, Int. Assoc. of Hydrol. flow following timber harvest in southwestern Oregon. Res. Pap.Sci., Gentbrugge, Belg., 1959. P~W-249, U.S. For. Serv., Corvallis, Oreg., 1979.:ts (i.e., up to t~lackie, J. R., K. A. Edwards, and R. T. Clarke, Hydrological research Hart, R. D., A. Levno, and R. Mersereau, Streamflow changes afteryears in large in East Africa, East A/}ican Agric. Forestry J., 43, 1-313, 1979.
logging 130-year-old Douglas fir in two small watersheds, Watertplications for dlaham, R. Z., (Ed.), Case studies and catalog of watershed projects
Resour. Res., 18, 637-644, 1982.ischarges have in western provinces and states, Rep. 22, Wildland Resour. Cnt.,
Hibbert, A. R., Forest treatment effects on water yield, in Forest Hv-Univ. of Calif., Berkeley, 1990.
aore frequent Christner, J., and R. D. Harr, Peak streamflows from the transient drology, edited by W. E. Sopper and H. W. Lull, pp. 527-543, Per-
rover of ripar- snow zone, Western Cascades, Oregon, paper presented at Western gamon, Tarrytown, N. Y., 1967.
port of woody Snow Conference, Reno, Nev., April 19-23, 1982. Hicks, B. J., R. L. Beschta, and R. D. Harr, Long-term changes in
Duncan, S. H., Peak stream discharge during thirty years of sustained streamflow following logging in western Oregon and associated fish-be diflqcult to
yield timber management in two fifth order watersheds in Washing- eries implications, Water Resour Bull., 27, 217-226, 1991.’ subjected to ton State, Northwest Sci., 60(4), 258-264, 1986. Hosmer, D. W., and S. Lemeshow, Applied Logistic Regressions, John
scharges. Dyrness, C. T., The effect of logging and slash burning on understory Wiley, New York, i989.
vegetation in the H. J. Andrews Experimental Forest, Res. Note lngebritsen, S. E., R. H. Mariner, and D. R. Sherrod, HydrothermalPNW-31, U.S. For. Serv. Pac. Northwest Range and Exp. Stn., Cor- systems of the Cascade Range, north-central Oregon, Open-File Rep.vallis, Oreg., 1965. 91-69, U.S. Geol. Surv., Portland, Ore&, 1991.
~vrness C. T., Hydrologic properties of soils on three small water- King, J. G., and L. C. Tennyson, Alteration of streamflow character-
ldscape-scale sheds in the western Cascades of Oregon, Res. Note PNW-III, U.S. istics following road construction in north central Idaho, Water Re-
~ges in peak For. Serv. Pac. Northwest Range and Exp. Stn., Corvallis, Oreg., sour. Res., 20(8), 1159-1163, 1984.1969. Leavesley, G., R. W. Lichty, B. M. Troutman, and L. G. Saindon,
the western Dyrness, C. T., Early stages of plant succession following logging and Precipitation-runoff modelling system: User’s manual, Water Resour.~nges in flow burning in the western Cascades of Oregon, Ecology, 54(1), 57-69, Invest. 83-4238, U.S. Geol. Surv., 1983.tges in water 1973. Lyons, J. K., and R. L. Beschta, Land use, floods, and channel changes:
Eberhardt, L. L., and J. T. Thomas, Designing environmental field Upper Middle Fork Willamette River, Oregon (1936-1980), Waterranspiration, studies, Ecol. Monogr., 61(1), 53-73, 1991. Resour. Res., 19(2), 463-471, 1983..f small-basin Fedora, M. A., and R. L. Beschta, Storm runoff simulation using an Marshall, J. D., and R. H. Waring, Comparative methods of estimatingm this study, antecedent precipitation index (API) model, J. Hydrol., 112, 121- leaf area in old-growth Douglas fir, Ecology, 67, 975-979, 1985.
eses of large- 133, 1989. Miller, R. G., Jr., Simultaneous Statistical Inference, Springer-Verlag,7reid, M., The effects of ownership patterns on forest road networks in New York, 1980.they contain western Oregon, M. S. thesis, Dep. of Geosci., Oreg. State Univ., Neter, J., W. Wasserman, and M. H. Kutner, Applied Linear Statistical
~ to. ; .... ove Corvallis, 1994. Models." Regression, Analysis of Variance, and Experimental Designs,in| ns Oarbrecht, J., Effects of spatial accumulation of runoff on watershed 3rd ed., Irwin, Homewood, II1., 1990.
response, J. Environ. Qual., 20, 31-35, 1991. Potter, K. W., Hydrological impacts of changing land management.t Km Grant, G. E., and A. L. Wolff, Long-term patterns of sediment trans- practices in a moderate-sized agricultural catchment, Water Resour.tl to stream port after timber harvest, western Cascade mountains, Oregon, Res., 27, 845-855, 1991.,cific North- USA, in Sediment and fVater Quality in a Changing Environment: Reid, L. M., Sediment production from gravel-surfaced forest roads,unregulated Trends and Explanation, Publ. 203, pp. 31-40, Int. Assoc. of Hydrol. Clearwater Basin, Washington, Master’s thesis, Dep. of Geol. Sci.,
Sci., Gentbrugge, Belg., 1990. Univ. of Wash., Seattle, 1981.ible changes Greenland, D., The climate of the H. J. Andrews Experimental Forest Reid, L. M., and T. Dunne, Sediment production from forest roadnight be at- and its regional synthesis, Coop. Agreement PHN 92-022I, U.S. For. surfaces, Water Resour. Res., 20(11), 1753-1761, 1984.;charges. Serv., Pac. Northwest Res. Stn., Corvallis, Oreg., 1993. Rothacher, J., Streamflow from small watersheds on the western slope
.3reenland, D., The Pacific Northwest regional context of the climate of the Cascade range of Oregon, Water Resour. Res., 1(1), 125-134,of the H. J. Andrews experimental forest long-term ecological re- 1965.
,y the USFS search site, Northwest Sci., 69, 81-96, 1994. Rothacher, J., Increases in water yield following clear-cut logging in
;615 (VisitingHaan, C. T., Statistical Methods in Hydrology, Iowa State Univ. Press, the Pacific Northwest, Water Resour. Res., 6(2), 653-658, 1970.
Ames, 1977. Rothacher, J., Regimes of streamflow and their modification by log-m EcologicalHalpern, C. B., Early successional patterns of forest species: Interac- ging, in A Symposium: Forest Land Uses and Stream Environment,nk A. Levno, tions of life history traits and disturbance, Ecology, 70, 704-720, p. 53, Oreg. State Univ., Corvallis, 1971.collection of 1989. Rothacher, J., Does harvest in west slope Douglas-fir increase peak
3 and hydro- Harr, R. D., Forest practices and streamflow in western Oregon, Gen. flow in small forest streams?, Res. Pap. PNW-163, U.S. For. Serv." Miller and Tech. Rep. PNW-49, U.S. For. Serv., Pac. Northwest For. and Range For., Pac. Northwest For. and R, oange Exp. Stn., Corvallis. Oreg.,hydrograph Exp. Stn., Corvallis, Oreg., 1976a. 1973.1, K. Farrell, !larr, R. D., Hydrology of small forest streams in western Oregon, Running, S. W., R. H. Waring, and R. A. Rydell, Physiological controlp for digitiz- ~"" Tech. Rep. ~ ~ 7 ~¢...... 3,,I-.~.~, U.S. For. Scrv., Pac. North;vest For. and of water flux in conifers: A simulation model, Oecoiogia, i8. i-i6,; l, 2, and 3, Range Exp. Stn., Corvallis, Oreg., 1976b. 1975.hydrograph Ham R. D., Water flux in soil and subsoil in a sleep forested slope, J. Sherrod, D. R., and J. G. Smith, Preliminary map of upper Eocene tont support; Hydrol., 33, 37-58, I977. Holocene volcanic and related rocks of the Cascade Range, Oregon,~r compiling Hart, R. D., Some characteristics and consequences of snowmelt dur- Open-File Rep. 89-14, U.S. Geol. Surv., Corvallis, Oreg.. 1989.onal Forest ing rainfall in western Oregon, J. Hwlrol. 53, 277-304, 1981. Swanson, F. J., and M. E. James, Geology and geomorphology of themap library Harr, R. D., Fog drip in the Bull Run municipal watershed, Oregon, H.J. Andrews Experimental Forest, western Cascades, Oregon, Res.tate Univer- Water Resour. Bull., 18(5), 785-789, 1982. Pap. PNW-188, U.S. For. Serv., Pac. Northwest For. and Range Exp.ad networks Hart, R. D., Effects of clearcutting on rain-on-snow runoff in western Stn., Corvallis, Oreg., 1975.enkaemper, Oregon: A new look at old studies, Water Resour. Res., 22, 1095- SYSTAT, Incorporated, SYSTAZ Statistics Version 5.2 Edition, Evan-
~r t~ "d 1100, 1986. ston, Ill., 1992.
inf~Ham R. D., and B. A. Coffin, Influence of timber harvest on rain-on- Trimble, S. W., and F. H. Weirich, Reforestation and the reduction of
Ha~,snow runoff: A mechanism for cumulative watershed effects, in In- water yield on the Southern Piedmont since circa I940, Waterterdisciplina~y Approaches in Hydrology and Hvdrogeology, edited by Resour. Res., 23, 425-437, 1987.eansnn, and M.E. Jones and A. Lacnen, pp. 455-469, ~m. Inst. of Hydrol., U.S. Forest Service, Soil Resource htventorv fViIlamette NationalForest.
r aspects of Washington, D. C., 1992. Pacific Northwest Region Willamette Nat For, Eugene Orcg., 1973.Hart, R. D.. and F. M. McCorison, Initial effects of dcarcut logging on U.S. Geologica~ Survey, Statistical Summaries of Strcamflow Data in
974 JONES AND GRANT: PEAK FLOW RESPONSES TO CLEAR-CU’V~
Oregon: Volume 2--Annual Low and High Flow and Instantaneous in small streams of north ia. ,.peak flow, Open-File Rep. 93-63, U.S. Geol. Surv., Corvallis, Oreg., 907-917, 1981.1993.
~’~nli~Waring, R. H., and W. H. Schlesinger, Forest Ecosystems: Concepts and G.E. Grant, Pacific Northv.. ~.,- ,carch Station, UManagement, Academic, San Diego, Calif., 1985. vice, Corvallis, OR 97331.
~lllJ~’~"Wemple, B., Potential hydrologic effects of logging-access roads in J.A. Jones, Department of, ,coscicnces, Oregon Sta:forested landscapes of the western Cascades, Oregon, M. S. thesis, 104 Wilkinson Hall, Corvalli,- OR 97331-5306. (e-mint:Dept. of Geosci., Oreg. State Univ., Corvallis, 1994. fsl.orst.edu) UpmanWright, K., K. H. Sendek, R. H. Rice, and R. B. Thomas, Loggingeffects on streamflow: Storm runoff at Caspar Creek in northwestern Utah Wat(California, Water Resour. Res., 26, 1657-1667, 1990. (Received June 26, 1995; revised November 10, 1995; University,
Ziemer, R. R., Storm flow response to road building and partial cutting accepted November 13, 1995.)Taiye SHydrosphe
Henry I
Departmm
Abstractare ofterof structmechanifor timeHere wenonlineaautoregrshort-terof the a[dimensicbiweekly
During
Utah undUnion Patry and tlproject w~estimatedcaused b3,high precrapidly fr~and dry.James etunpreced,series tryiysis of itsto 3-year)metric, n~series fro~[1993], ar
-- the dynmwhether tstochasticaverage l_limiting r~bo-,,een
~ by:im~
.:i! Copyright
~!: Paper nurr¯ :i~0043-1397/
Related Documents