PROJECT DESIGN DOCUMENT FORM (CDM PDD) - Version 03.1. CDM – Executive Board page 1 CLEAN DEVELOPMENT MECHANISM PROJECT DESIGN DOCUMENT FORM (CDM-PDD) Version 03 - in effect as of: 28 July 2006 CONTENTS A. General description of project activity B. Application of a baseline and monitoring methodology C. Duration of the project activity / crediting period D. Environmental impacts E. Stakeholders’ comments Annexes Annex 1: Contact information on participants in the project activity Annex 2: Information regarding public funding Annex 3: Baseline information Annex 4: Monitoring plan

Welcome message from author
This document is posted to help you gain knowledge. Please leave a comment to let me know what you think about it! Share it to your friends and learn new things together.
Transcript
PROJECT DESIGN DOCUMENT FORM (CDM PDD) - Version 03.1. CDM – Executive Board page 1
CLEAN DEVELOPMENT MECHANISM PROJECT DESIGN DOCUMENT FORM (CDM-PDD)
Version 03 - in effect as of: 28 July 2006
CONTENTS A. General description of project activity B. Application of a baseline and monitoring methodology C. Duration of the project activity / crediting period D. Environmental impacts E. Stakeholders’ comments
Annexes Annex 1: Contact information on participants in the project activity Annex 2: Information regarding public funding Annex 3: Baseline information
Annex 4: Monitoring plan
PROJECT DESIGN DOCUMENT FORM (CDM PDD) - Version 03.1. CDM – Executive Board page 2
SECTION A. General description of project activity A.1 Title of the project activity: >> Title: La Ventosa Wind Energy Project (the “La Ventosa Project” or the “Project”). Version: Document Version Number 3 Date: 13/06/2007 A.2. Description of the project activity: >> The La Ventosa Project consists of the construction and operation of a 102 MW wind farm in Mexico’s southern state of Oaxaca, in the municipalities of Juchitan de Zaragoza and Asunción Ixtlaltepec, in the vicinity of the La Ventosa town (Figure 1). The main objective of the Project is to generate electricity from wind, thus increasing the percentage of renewable sourced power in Mexico’s electricity grid, and, at the same time, contributing to the environmental, social and economic sustainability of the region. The La Ventosa Project is currently in development stages and it is expected to be fully operational by January 2008.
Figure 1: Location of La Ventosa Project.
PROJECT DESIGN DOCUMENT FORM (CDM PDD) - Version 03.1. CDM – Executive Board page 3
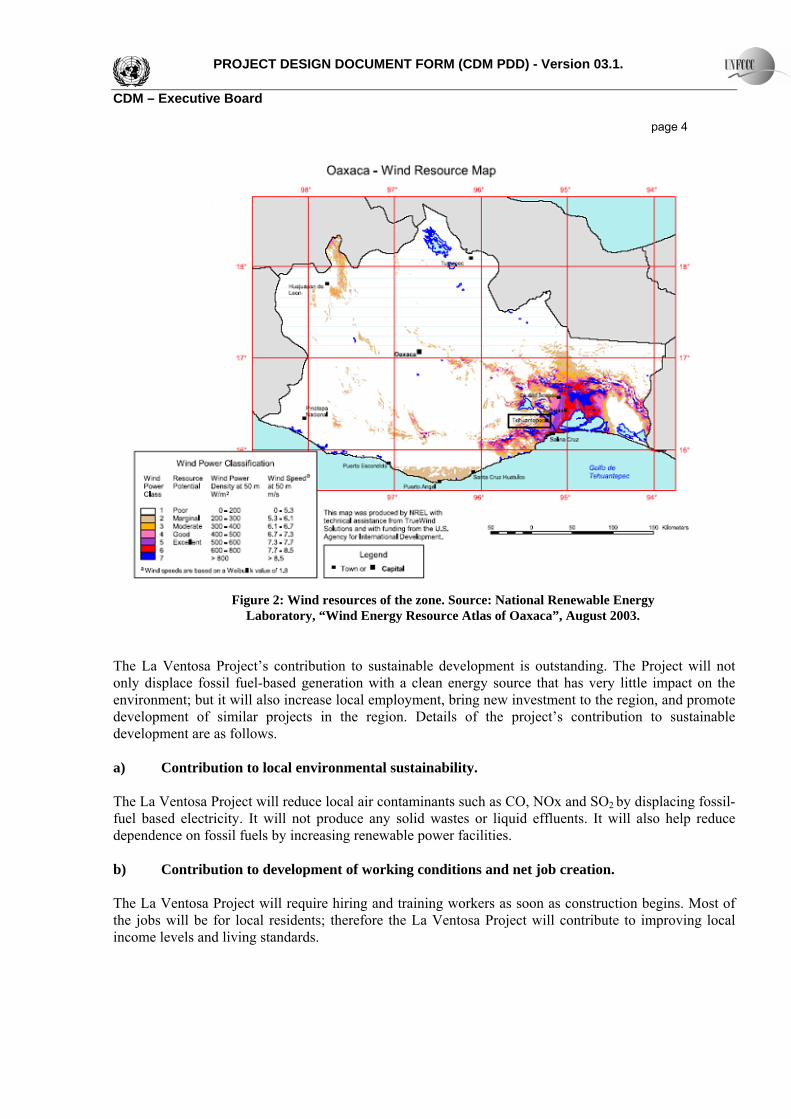
The existing transmission capacity to transport power from the generation site to the main grid has been reserved by Comisión Federal de Electricidad (“CFE”) for its own wind power projects (590 MW) that are planned to be developed over the next 6 years. Nevertheless, Mexico’s Energy Regulatory Commission (Comisión Reguladora de Energia or “CRE”) is overseeing an open season to allow private investors to reserve capacity on a future CFE-built transmission line to connect over 2.700 MW of proposed wind projects to the grid. This open season process is expected to be concluded by the end of 2006, in order to enable CFE to include this infrastructure upgrade project in its upcoming 2007 budget request to Congress. This new transmission line would connect a new sub-station in the La Ventosa region to the Juile connection node (in the state of Veracruz) of the grid’s main East-West 400 kV trunk line. The La Ventosa Project would be connected directly to the new La Ventosa sub-station. The La Ventosa Project is being developed under the Self-Supply scheme foreseen in the Ley del Servicio Publico de Energía Electrica. Consequently it would provide the generated power to its consuming partners. CRE has already issued the appropriate generation permit to the La Ventosa Project and the Power Purchase Agreements with the consuming partners have already been executed. Wind resources in Oaxaca are among the best in the world due to a mountainous topography that levels off at a point where the land mass tapers down to a narrow isthmus. This creates a natural wind tunnel for air currents flowing between the Gulf of Mexico and the Pacific Ocean. The Electrical Research Institute (or “IIE”) has developed records showing that the average monthly wind speeds in this region range from 4 m/s to 18 m/s, measured at 30 m above the ground. In addition, the US National renewable energy laboratory has developed a wind resource map showing that the region’s wind power can be classified from good (6.7 m/s at 50m) to excellent (more than 8.5 m/s), as shown in Figure 2 below. As a result of these excellent wind conditions, development of wind energy projects in the La Ventosa region is attractive. The wind resource calculation performed (equivalent annual operating hours) is provided.
PROJECT DESIGN DOCUMENT FORM (CDM PDD) - Version 03.1. CDM – Executive Board page 4
Figure 2: Wind resources of the zone. Source: National Renewable Energy
Laboratory, “Wind Energy Resource Atlas of Oaxaca”, August 2003. The La Ventosa Project’s contribution to sustainable development is outstanding. The Project will not only displace fossil fuel-based generation with a clean energy source that has very little impact on the environment; but it will also increase local employment, bring new investment to the region, and promote development of similar projects in the region. Details of the project’s contribution to sustainable development are as follows. a) Contribution to local environmental sustainability. The La Ventosa Project will reduce local air contaminants such as CO, NOx and SO2 by displacing fossil-fuel based electricity. It will not produce any solid wastes or liquid effluents. It will also help reduce dependence on fossil fuels by increasing renewable power facilities. b) Contribution to development of working conditions and net job creation. The La Ventosa Project will require hiring and training workers as soon as construction begins. Most of the jobs will be for local residents; therefore the La Ventosa Project will contribute to improving local income levels and living standards.
PROJECT DESIGN DOCUMENT FORM (CDM PDD) - Version 03.1. CDM – Executive Board page 5
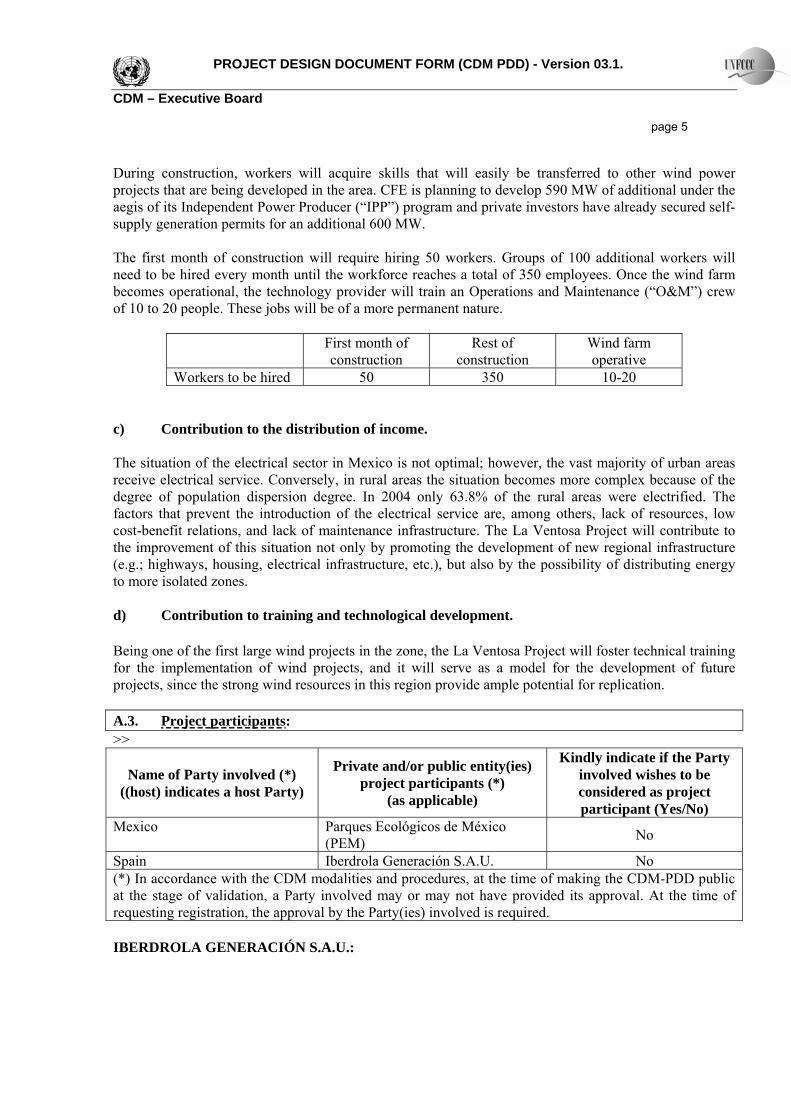
During construction, workers will acquire skills that will easily be transferred to other wind power projects that are being developed in the area. CFE is planning to develop 590 MW of additional under the aegis of its Independent Power Producer (“IPP”) program and private investors have already secured self-supply generation permits for an additional 600 MW. The first month of construction will require hiring 50 workers. Groups of 100 additional workers will need to be hired every month until the workforce reaches a total of 350 employees. Once the wind farm becomes operational, the technology provider will train an Operations and Maintenance (“O&M”) crew of 10 to 20 people. These jobs will be of a more permanent nature.
First month of construction
Rest of construction
Wind farm operative
Workers to be hired 50 350 10-20 c) Contribution to the distribution of income. The situation of the electrical sector in Mexico is not optimal; however, the vast majority of urban areas receive electrical service. Conversely, in rural areas the situation becomes more complex because of the degree of population dispersion degree. In 2004 only 63.8% of the rural areas were electrified. The factors that prevent the introduction of the electrical service are, among others, lack of resources, low cost-benefit relations, and lack of maintenance infrastructure. The La Ventosa Project will contribute to the improvement of this situation not only by promoting the development of new regional infrastructure (e.g.; highways, housing, electrical infrastructure, etc.), but also by the possibility of distributing energy to more isolated zones. d) Contribution to training and technological development. Being one of the first large wind projects in the zone, the La Ventosa Project will foster technical training for the implementation of wind projects, and it will serve as a model for the development of future projects, since the strong wind resources in this region provide ample potential for replication. A.3. Project participants: >>
Name of Party involved (*) ((host) indicates a host Party)
Private and/or public entity(ies) project participants (*)
(as applicable)
Kindly indicate if the Party involved wishes to be considered as project participant (Yes/No)
Mexico Parques Ecológicos de México (PEM) No
Spain Iberdrola Generación S.A.U. No (*) In accordance with the CDM modalities and procedures, at the time of making the CDM-PDD public at the stage of validation, a Party involved may or may not have provided its approval. At the time of requesting registration, the approval by the Party(ies) involved is required. IBERDROLA GENERACIÓN S.A.U.:
PROJECT DESIGN DOCUMENT FORM (CDM PDD) - Version 03.1. CDM – Executive Board page 6
Iberdrola Generación S.A.U. is a 100% subsidiary of Iberdrola S.A., a leading electric company in Europe and the second largest electric utility in Spain. It currently has 28.000 MW of installed capacity worldwide. The deployment of renewable energy, particularly wind power, has become one of Iberdrola’s strategic pillars; 4.000MW of its current capacity is powered by renewable sources. Iberdrola develops its wind energy projects through Iberdrola Energías Renovables II (“Iberenova”), a wholly-owned Iberdrola subsidiary. By mid-2006, Iberdrola reached 3.700 MW of wind power capacity, consolidating its position as the largest operator of wind farms in the world. Iberdrola´s strategy is to reach 11.000 MW of installed capacity based on renewable sources by 2011. Iberdrola’s international business focuses on Latin America, primarily Brazil and Mexico, although it also owns businesses in Guatemala, Bolivia and Chile. In Mexico, where Iberdrola is the largest private power producer, it currently operates natural gas-fired plants with a total installed capacity of 2.698 MW: the combined cycle gas turbine (“CCGT”) plants of Monterrey III (1.040 MW), Altamira III-IV (1.036 MW), and La Laguna II (500 MW), and the Enertek 120 MW cogeneration facility. In addition, the 1.000 MW Altamira V CCGT plant will become operational in the fall of 2006, followed by the 1.000 MW CCGT Tamazunchale I plant in the fall of 2007, bringing Iberdrola’s operational capacity to just under 5.000 MW. PEM: Parques Ecológicos de México (“PEM”) is the Mexican affiliate of Iberdrola .S.A. that will develop, own and operate the La Ventosa Project. It will be counterparty to the project-specific contracts and required permits. A.4. Technical description of the project activity: A.4.1. Location of the project activity: >> A.4.1.1. Host Party(ies): >> Mexico A.4.1.2. Region/State/Province etc.: >> State of Oaxaca. Isthmus of Tehuantepec. A.4.1.3. City/Town/Community etc: >> Towns of La Ventosa and La Mata in the municipalities of Juchitán de Zaragoza and Asunción Ixtlaltepec, Oaxaca. A.4.1.4. Detail of physical location, including information allowing the unique identification of this project activity (maximum one page): >>
PROJECT DESIGN DOCUMENT FORM (CDM PDD) - Version 03.1. CDM – Executive Board page 7
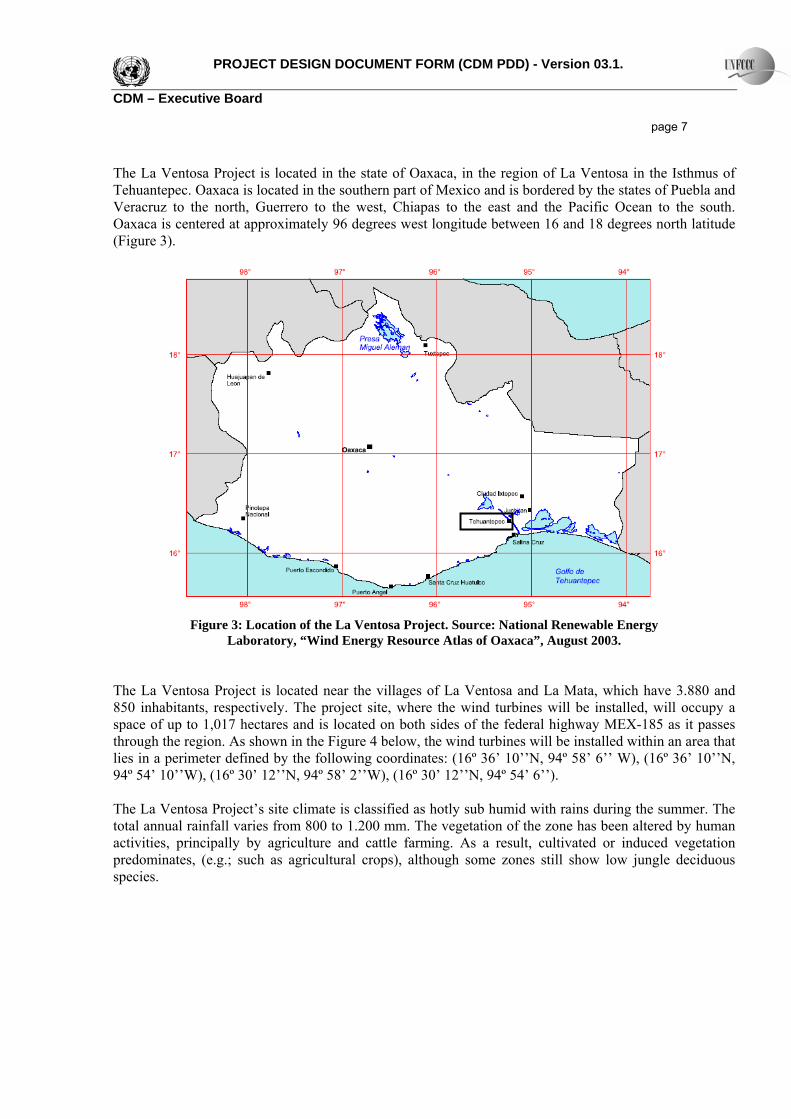
The La Ventosa Project is located in the state of Oaxaca, in the region of La Ventosa in the Isthmus of Tehuantepec. Oaxaca is located in the southern part of Mexico and is bordered by the states of Puebla and Veracruz to the north, Guerrero to the west, Chiapas to the east and the Pacific Ocean to the south. Oaxaca is centered at approximately 96 degrees west longitude between 16 and 18 degrees north latitude (Figure 3).
Figure 3: Location of the La Ventosa Project. Source: National Renewable Energy
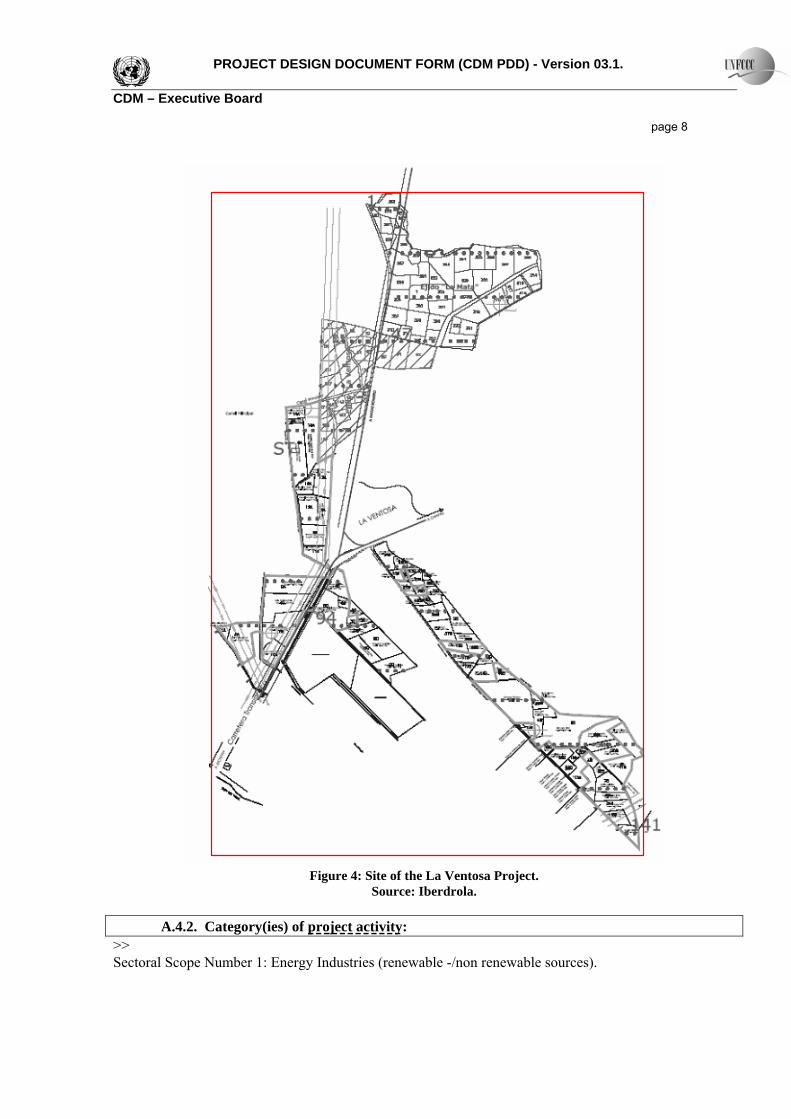
Laboratory, “Wind Energy Resource Atlas of Oaxaca”, August 2003. The La Ventosa Project is located near the villages of La Ventosa and La Mata, which have 3.880 and 850 inhabitants, respectively. The project site, where the wind turbines will be installed, will occupy a space of up to 1,017 hectares and is located on both sides of the federal highway MEX-185 as it passes through the region. As shown in the Figure 4 below, the wind turbines will be installed within an area that lies in a perimeter defined by the following coordinates: (16º 36’ 10’’N, 94º 58’ 6’’ W), (16º 36’ 10’’N, 94º 54’ 10’’W), (16º 30’ 12’’N, 94º 58’ 2’’W), (16º 30’ 12’’N, 94º 54’ 6’’). The La Ventosa Project’s site climate is classified as hotly sub humid with rains during the summer. The total annual rainfall varies from 800 to 1.200 mm. The vegetation of the zone has been altered by human activities, principally by agriculture and cattle farming. As a result, cultivated or induced vegetation predominates, (e.g.; such as agricultural crops), although some zones still show low jungle deciduous species.
PROJECT DESIGN DOCUMENT FORM (CDM PDD) - Version 03.1. CDM – Executive Board page 8
Figure 4: Site of the La Ventosa Project.
Source: Iberdrola. A.4.2. Category(ies) of project activity: >> Sectoral Scope Number 1: Energy Industries (renewable -/non renewable sources).
PROJECT DESIGN DOCUMENT FORM (CDM PDD) - Version 03.1. CDM – Executive Board page 9
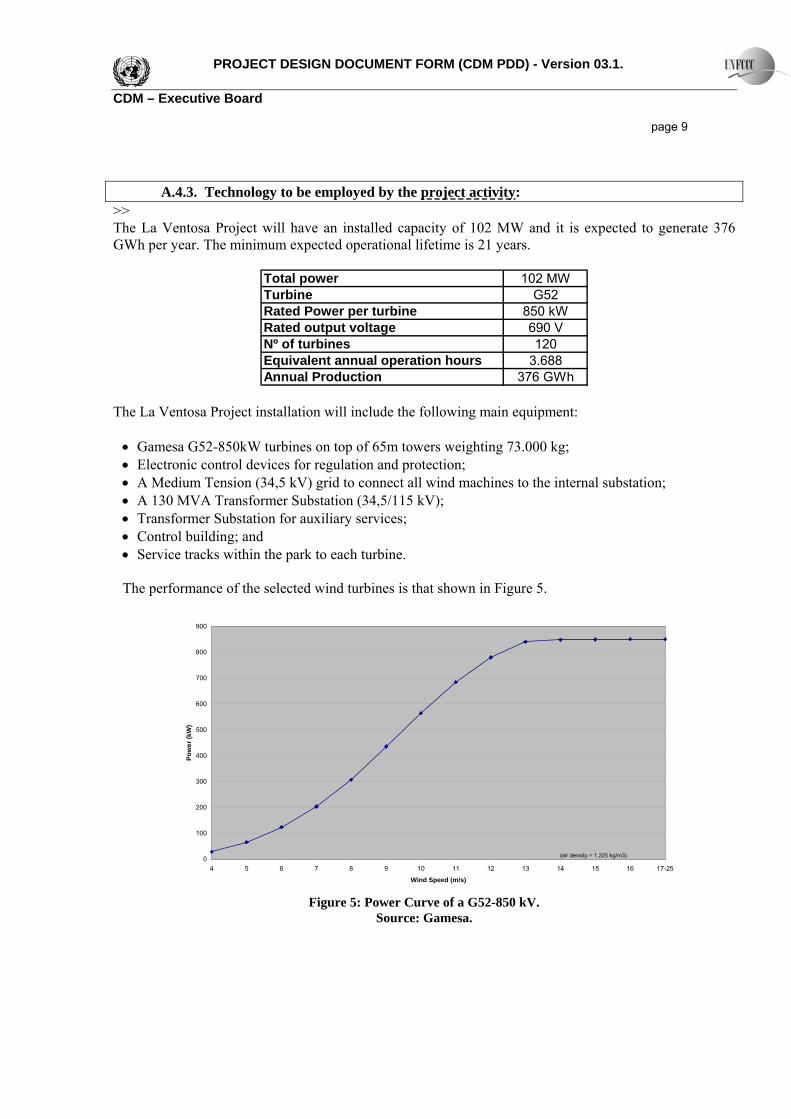
A.4.3. Technology to be employed by the project activity: >> The La Ventosa Project will have an installed capacity of 102 MW and it is expected to generate 376 GWh per year. The minimum expected operational lifetime is 21 years.
Total power 102 MWTurbine G52Rated Power per turbine 850 kWRated output voltage 690 VNº of turbines 120Equivalent annual operation hours 3.688Annual Production 376 GWh
The La Ventosa Project installation will include the following main equipment: • Gamesa G52-850kW turbines on top of 65m towers weighting 73.000 kg; • Electronic control devices for regulation and protection; • A Medium Tension (34,5 kV) grid to connect all wind machines to the internal substation; • A 130 MVA Transformer Substation (34,5/115 kV); • Transformer Substation for auxiliary services; • Control building; and • Service tracks within the park to each turbine. The performance of the selected wind turbines is that shown in Figure 5.
0
100
200
300
400
500
600
700
800
900
4 5 6 7 8 9 10 11 12 13 14 15 16 17-25
Wind Speed (m/s)
Pow
er (k
W)
(air density = 1.225 kg/m3)
Figure 5: Power Curve of a G52-850 kV.
Source: Gamesa.
PROJECT DESIGN DOCUMENT FORM (CDM PDD) - Version 03.1. CDM – Executive Board page 10
The interconnection point of the La Ventosa Project will be a new collecting substation, to be located within a 10 km radius of the Project, which will connect to the main national grid via a new 147 km-transmission line that CFE is developing as part of an open season procedure. Gamesa, as the technology provider, will be responsible for operation and maintenance due to a long term maintenance contract. This contract will be signed after expiring the two years guaranty project start-up contract. This contract covers maintenance during the first two years of operation of the wind farm. Not only the La Ventosa Project is based in environmentally safe technology, it will also contribute to sustainable development from different points of view, including technological transfer. See section A.2 for detailed information.
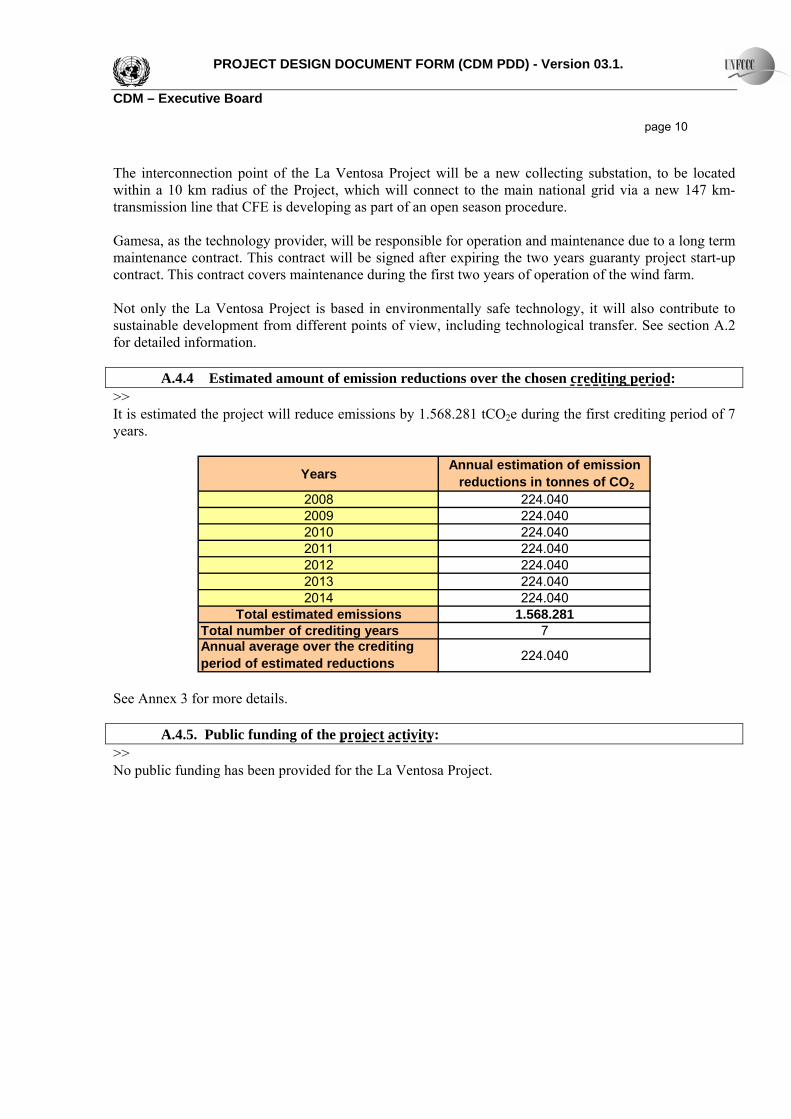
A.4.4 Estimated amount of emission reductions over the chosen crediting period: >> It is estimated the project will reduce emissions by 1.568.281 tCO2e during the first crediting period of 7 years.
YearsAnnual estimation of emission reductions in tonnes of CO2
2008 224.0402009 224.0402010 224.0402011 224.0402012 224.0402013 224.0402014 224.040
Total estimated emissions 1.568.281Total number of crediting years 7Annual average over the crediting period of estimated reductions 224.040
See Annex 3 for more details. A.4.5. Public funding of the project activity: >> No public funding has been provided for the La Ventosa Project.
PROJECT DESIGN DOCUMENT FORM (CDM PDD) - Version 03.1. CDM – Executive Board page 11
SECTION B. Application of a baseline and monitoring methodology B.1. Title and reference of the approved baseline and monitoring methodology applied to the project activity: >> Approved consolidated baseline methodology ACM0002 (version 6, 19 May 2006): “Consolidated baseline methodology for grid-connected electricity generation from renewable sources”, and “Tool for the demonstration and assessment of additionality” (version 3, 16 february 2007). B.2 Justification of the choice of the methodology and why it is applicable to the project activity: >> The consolidated baseline methodology for grid-connected electricity generation from renewable sources is justified because:
− The La Ventosa Project involves an electricity capacity addition using wind energy resources providing power to the grid;
− The La Ventosa Project does not involve switching from fossil fuels to renewable energy at the
site of the project activity; and
− The geographic and system boundaries for the relevant electricity grid can be clearly identified as shown in SENER´s “Prospectiva del sector eléctrico” document, which shows not only the geographic area and infrastructure within the Mexican territory, but also the energy exports and imports from/to the Mexican system. Detailed characteristics of the Mexican system, including electricity exports and imports, are publicly available and can be found in the CFE (www.cfe.gob.mx ) and SENER (www.sener.gob.mx) websites.
B.3. Description of the sources and gases included in the project boundary >>
Source Gas Included? Justification/Explanation
CO2 Yes
CH4 No Baseline
Electricity delivered to the grid by the
operation of grid-connected power plants and by the addition of
new generation sources. N2O No
According to ACM0002 methodology: For the baseline
determination, project participants shall only account CO2 emissions
from electricity generation in fossil fuel fired power that is displaced due
to the project activity. B.4. Description of how the baseline scenario is identified and description of the identified baseline scenario: >> The La Ventosa Project will reduce anthropogenic GHG emissions by supplying zero GHG emission power, which will displace fossil fuel-fired electricity generation. The project employs a non-GHG emitting technology, e.g.; wind power. Operation of the wind farm will displace marginal electricity
PROJECT DESIGN DOCUMENT FORM (CDM PDD) - Version 03.1. CDM – Executive Board page 12
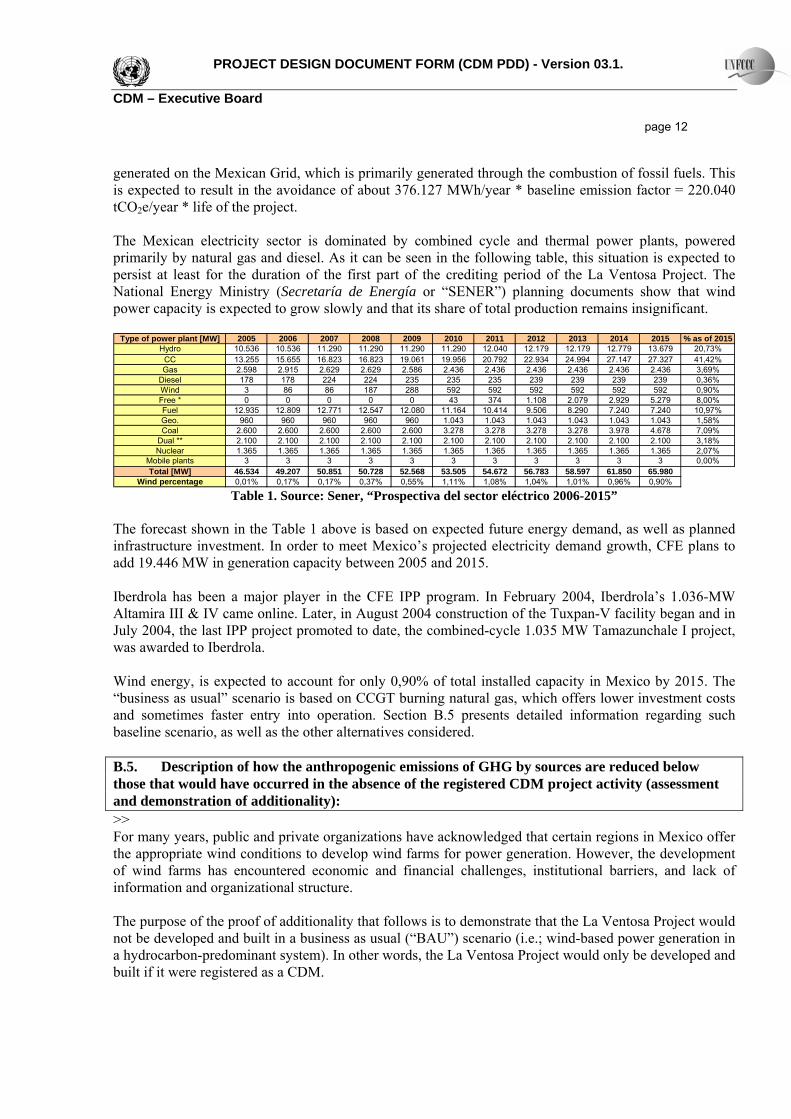
generated on the Mexican Grid, which is primarily generated through the combustion of fossil fuels. This is expected to result in the avoidance of about 376.127 MWh/year * baseline emission factor = 220.040 tCO2e/year * life of the project. The Mexican electricity sector is dominated by combined cycle and thermal power plants, powered primarily by natural gas and diesel. As it can be seen in the following table, this situation is expected to persist at least for the duration of the first part of the crediting period of the La Ventosa Project. The National Energy Ministry (Secretaría de Energía or “SENER”) planning documents show that wind power capacity is expected to grow slowly and that its share of total production remains insignificant.
Type of power plant [MW] 2005 2006 2007 2008 2009 2010 2011 2012 2013 2014 2015 % as of 2015Hydro 10.536 10.536 11.290 11.290 11.290 11.290 12.040 12.179 12.179 12.779 13.679 20,73%
CC 13.255 15.655 16.823 16.823 19.061 19.956 20.792 22.934 24.994 27.147 27.327 41,42%Gas 2.598 2.915 2.629 2.629 2.586 2.436 2.436 2.436 2.436 2.436 2.436 3,69%
Diesel 178 178 224 224 235 235 235 239 239 239 239 0,36%Wind 3 86 86 187 288 592 592 592 592 592 592 0,90%Free * 0 0 0 0 0 43 374 1.108 2.079 2.929 5.279 8,00%Fuel 12.935 12.809 12.771 12.547 12.080 11.164 10.414 9.506 8.290 7.240 7.240 10,97%Geo. 960 960 960 960 960 1.043 1.043 1.043 1.043 1.043 1.043 1,58%Coal 2.600 2.600 2.600 2.600 2.600 3.278 3.278 3.278 3.278 3.978 4.678 7,09%
Dual ** 2.100 2.100 2.100 2.100 2.100 2.100 2.100 2.100 2.100 2.100 2.100 3,18%Nuclear 1.365 1.365 1.365 1.365 1.365 1.365 1.365 1.365 1.365 1.365 1.365 2,07%
Mobile plants 3 3 3 3 3 3 3 3 3 3 3 0,00%Total [MW] 46.534 49.207 50.851 50.728 52.568 53.505 54.672 56.783 58.597 61.850 65.980
Wind percentage 0,01% 0,17% 0,17% 0,37% 0,55% 1,11% 1,08% 1,04% 1,01% 0,96% 0,90% Table 1. Source: Sener, “Prospectiva del sector eléctrico 2006-2015”
The forecast shown in the Table 1 above is based on expected future energy demand, as well as planned infrastructure investment. In order to meet Mexico’s projected electricity demand growth, CFE plans to add 19.446 MW in generation capacity between 2005 and 2015. Iberdrola has been a major player in the CFE IPP program. In February 2004, Iberdrola’s 1.036-MW Altamira III & IV came online. Later, in August 2004 construction of the Tuxpan-V facility began and in July 2004, the last IPP project promoted to date, the combined-cycle 1.035 MW Tamazunchale I project, was awarded to Iberdrola. Wind energy, is expected to account for only 0,90% of total installed capacity in Mexico by 2015. The “business as usual” scenario is based on CCGT burning natural gas, which offers lower investment costs and sometimes faster entry into operation. Section B.5 presents detailed information regarding such baseline scenario, as well as the other alternatives considered. B.5. Description of how the anthropogenic emissions of GHG by sources are reduced below those that would have occurred in the absence of the registered CDM project activity (assessment and demonstration of additionality): >> For many years, public and private organizations have acknowledged that certain regions in Mexico offer the appropriate wind conditions to develop wind farms for power generation. However, the development of wind farms has encountered economic and financial challenges, institutional barriers, and lack of information and organizational structure. The purpose of the proof of additionality that follows is to demonstrate that the La Ventosa Project would not be developed and built in a business as usual (“BAU”) scenario (i.e.; wind-based power generation in a hydrocarbon-predominant system). In other words, the La Ventosa Project would only be developed and built if it were registered as a CDM.
PROJECT DESIGN DOCUMENT FORM (CDM PDD) - Version 03.1. CDM – Executive Board page 13
The additionality of the La Ventosa Project is assessed using the stepwise procedure described in the “Tool for the demonstration and assessment of additionality”. This tool (version 3, 16 february 2007) is applied as follows:
Step 1. Identification of alternatives to the project activity consistent with current laws and regulations
Sub-step 1a. Define alternatives to the project activity: The alternatives available to the La Ventosa Project sponsor (i.e.; Iberdrola) or to developers of projects that could provide outputs or services comparable to the proposed CDM candidate project (i.e.; the La Ventosa Project) have been identified as the following:
1. BAU Utility-sponsored natural gas capacity addition. Over 70% of Mexico’s current installed capacity is powered with hydrocarbon fuels. Mexican authorities and CFE have planned the bulk of the expansion of this capacity based on natural gas-fired CCGT facilities. The latest planning document issued by SENER1 shows that 60,6% of the 7 GW of “fixed” planned capacity (i.e.; projects for which technology, dates, and the development scheme have been determined and are unlikely to be changed) will be based on combined cycle power plants. Therefore, if the decision were made not to invest in the La Ventosa Project due to inadequate financial returns, the BAU alternative would most likely be gas-fired power generation sponsored by CFE.
2. Implementation of an Iberdrola-sponsored gas-fired CCGT plant. Iberdrola´s growth
strategy relies upon the development or acquisition of new capacity using clean fuels and renewable energy sources. Consequently, Iberdrola´s interest in developing coal or oil-fired thermal plants would be limited. On the contrary the development and operation of natural gas-fired facilities are core businesses of Iberdrola´s. As a result, a realistic fossil fuel alternative to the La Ventosa Project would be a natural gas-fired project, similar to those that Iberdrola already owns and operates in Mexico, other Latin American countries, and Europe.
3. Implementation of the Project without CDM assistance. The 102 MW wind power project is
developed without obtaining the incremental revenues that result from CDM registration. Sub-step 1b. Enforcement of applicable laws and regulations: CFE and Luz y Fuerza Centro (“LFC”) are Mexico's state-owned utilities, although CFE continues to dominate the electric power sector. The country's Public Electricity Service Act (Ley del Servicio Público de la Energía Eléctrica) was amended in December 1992, allowing private participation in such generation activities. These formulae are described in article 36 from "Ley del Servicio Público de Energía Eléctrica" and can be found at: http://www.sener.gob.mx/wb2/SenerNva/mjMal2
− Independent Power Production (Producción Independiente): IPPs are large generation projects sponsored by CFE for which the developer designs, builds, and operates the generation assets. Investors have found this mechanism very attractive because the risk profile is very limited: all of the
1 Secretaría de Energía, 2005. “Prospectiva del Sector Eléctrico 2006-2015”, (p.79) that can be found at: http://www.sener.gob.mx/work/sites/SenerNva/resources/LocalContent/6781/1/prospsectelec2006.pdf
PROJECT DESIGN DOCUMENT FORM (CDM PDD) - Version 03.1. CDM – Executive Board page 14
power is sold to CFE at a fixed price under a long term PPA (typically of 25 years). The first IPP project initiated operations in 2000. By the end of 2005, 21 IPP projects, representing 12 GW, were either operating or under construction.
− Self-supply (Autoabastecimiento): Under this scheme, the producer generates power for its own consumption. Because there are no limits on the ownership of the shares of the production company, a single generating partner may join in a specific purpose company with a number of consumption partners. Because of the flexibility of this mechanism, most of non-IPP private generation in Mexico has been developed under this scheme.
− Cogeneration (Cogeneración): It is the generation of power generation combined with production of steam or other thermal energy for self-consumption. In order to develop a project under this scheme, it is a requirement that the efficiency of the whole system (i.e., electricity and thermal energy) is higher than that produced independently. The ownership structure of cogeneration facilities is similar to that of self-supply projects.
− Small energy producers (Pequeña producción): These are power plants smaller than 30 MW, located in specific areas determined by SENER, and which production must be sold to CFE. In addition, generation projects of less than 1 MW in rural communities that do not have access to the national grid can be permitted under this scheme.
As a result, at the present time, privately sponsored Mexican renewable projects can only be developed under the IPP or self-supply schemes. Because La Ventosa Project is not included in the expansion plan of CFE, it can only be developed under the Self-supply scheme.
Step 2. Investment analysis
In this step, it will be demonstrated that the proposed activity is economically or financially less attractive than other alternatives without the revenue from the sale of certified emission reductions (“CERs”). Sub-step 2a. Determine appropriate analysis method As the project activity generates incomes other than CDM related income, simple cost analysis cannot be applied. Instead, investment comparison analysis (Option II) will be used. Sub-step 2b.- Option II. Apply investment comparison analysis. The following analysis demonstrates that were the La Ventosa Project not to receive the CDM benefits, Iberdrola would unlikely develop it. The method to compare the economic viability of the project activity to the alternatives relies on the principle of levelized cost analysis, which consists in determining the constant level of revenues necessary each year to recover all expenses (e.g.;. O&M, investment, debt, interest, return on capital, and taxes) over the expected life of the project. After discounting to present value these revenues, and the annual generation, it is possible to determine a comparable levelized unit tariff of each alternative. The alternative with the lowest levelized tariff, the most economic technology to generate electricity, will likely be the technology based upon which any capacity expansion will be conducted.
PROJECT DESIGN DOCUMENT FORM (CDM PDD) - Version 03.1. CDM – Executive Board page 15
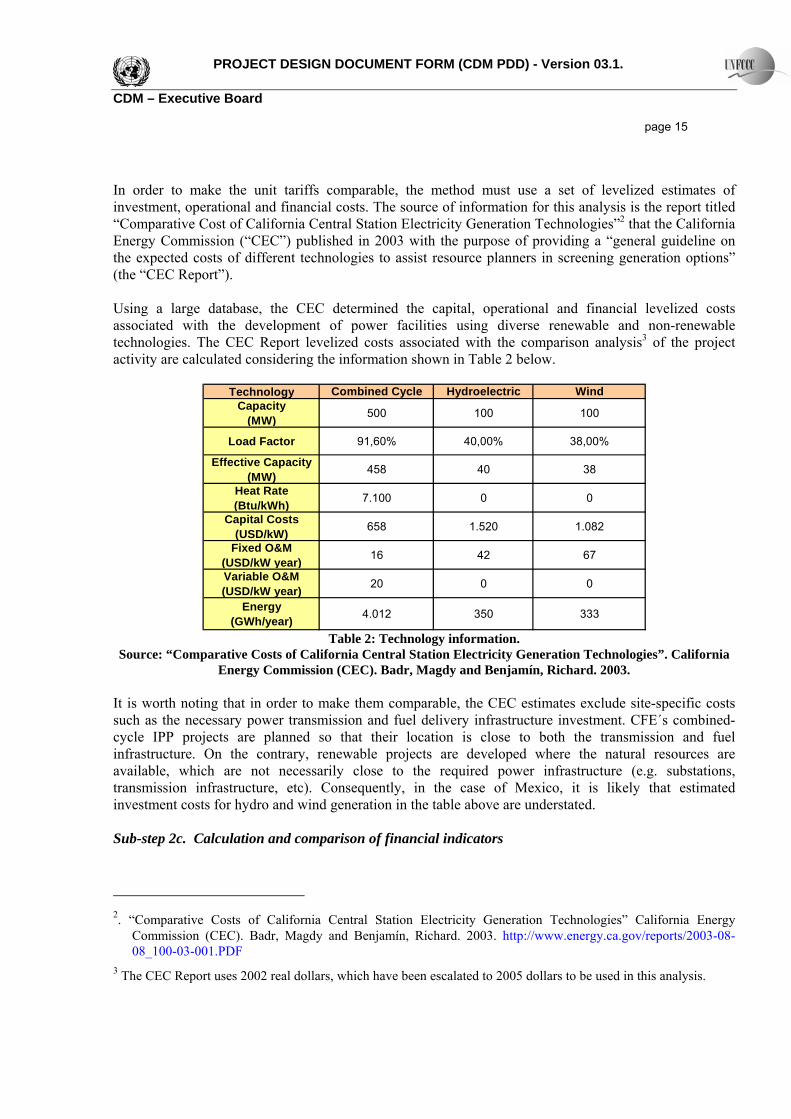
In order to make the unit tariffs comparable, the method must use a set of levelized estimates of investment, operational and financial costs. The source of information for this analysis is the report titled “Comparative Cost of California Central Station Electricity Generation Technologies”2 that the California Energy Commission (“CEC”) published in 2003 with the purpose of providing a “general guideline on the expected costs of different technologies to assist resource planners in screening generation options” (the “CEC Report”). Using a large database, the CEC determined the capital, operational and financial levelized costs associated with the development of power facilities using diverse renewable and non-renewable technologies. The CEC Report levelized costs associated with the comparison analysis3 of the project activity are calculated considering the information shown in Table 2 below.
Technology Combined Cycle Hydroelectric WindCapacity
(MW) 500 100 100
Load Factor 91,60% 40,00% 38,00%
Effective Capacity(MW) 458 40 38
Heat Rate(Btu/kWh) 7.100 0 0
Capital Costs(USD/kW) 658 1.520 1.082
Fixed O&M(USD/kW year) 16 42 67
Variable O&M(USD/kW year) 20 0 0
Energy(GWh/year) 4.012 350 333
Table 2: Technology information.
Source: “Comparative Costs of California Central Station Electricity Generation Technologies”. California Energy Commission (CEC). Badr, Magdy and Benjamín, Richard. 2003.
It is worth noting that in order to make them comparable, the CEC estimates exclude site-specific costs such as the necessary power transmission and fuel delivery infrastructure investment. CFE´s combined-cycle IPP projects are planned so that their location is close to both the transmission and fuel infrastructure. On the contrary, renewable projects are developed where the natural resources are available, which are not necessarily close to the required power infrastructure (e.g. substations, transmission infrastructure, etc). Consequently, in the case of Mexico, it is likely that estimated investment costs for hydro and wind generation in the table above are understated. Sub-step 2c. Calculation and comparison of financial indicators
2. “Comparative Costs of California Central Station Electricity Generation Technologies” California Energy
Commission (CEC). Badr, Magdy and Benjamín, Richard. 2003. http://www.energy.ca.gov/reports/2003-08-08_100-03-001.PDF
3 The CEC Report uses 2002 real dollars, which have been escalated to 2005 dollars to be used in this analysis.
PROJECT DESIGN DOCUMENT FORM (CDM PDD) - Version 03.1. CDM – Executive Board page 16
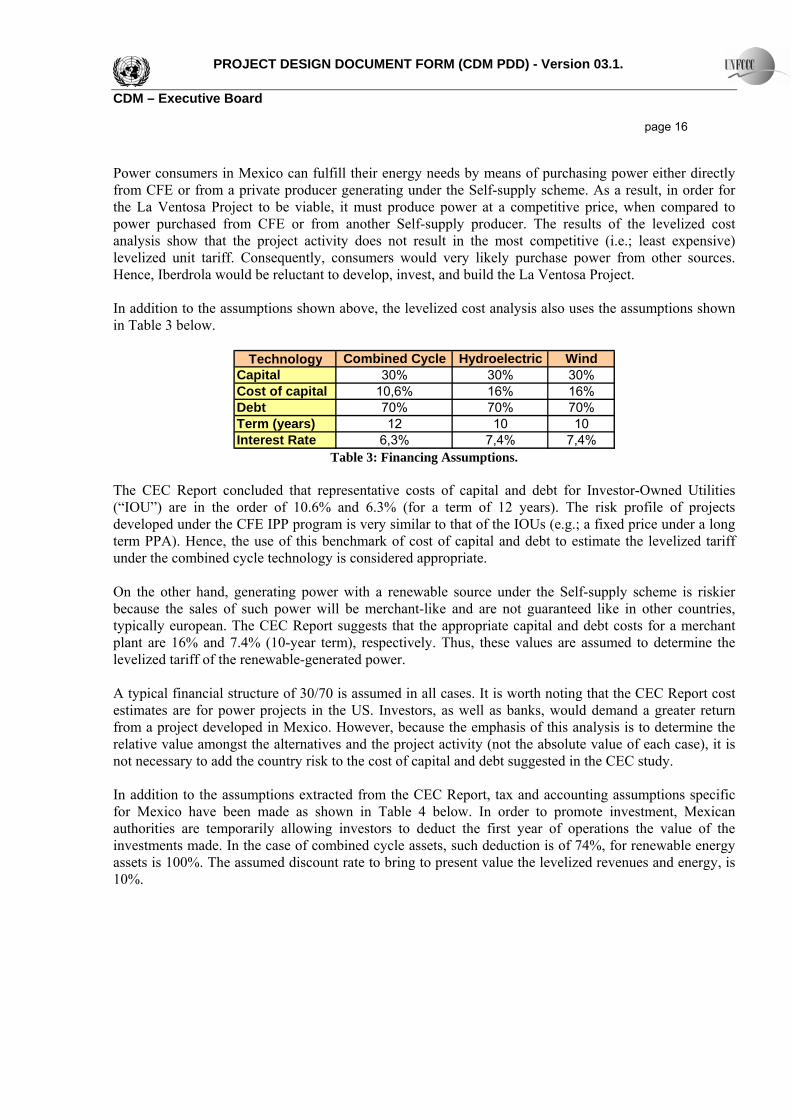
Power consumers in Mexico can fulfill their energy needs by means of purchasing power either directly from CFE or from a private producer generating under the Self-supply scheme. As a result, in order for the La Ventosa Project to be viable, it must produce power at a competitive price, when compared to power purchased from CFE or from another Self-supply producer. The results of the levelized cost analysis show that the project activity does not result in the most competitive (i.e.; least expensive) levelized unit tariff. Consequently, consumers would very likely purchase power from other sources. Hence, Iberdrola would be reluctant to develop, invest, and build the La Ventosa Project. In addition to the assumptions shown above, the levelized cost analysis also uses the assumptions shown in Table 3 below.
Technology Combined Cycle Hydroelectric WindCapital 30% 30% 30%Cost of capital 10,6% 16% 16%Debt 70% 70% 70%Term (years) 12 10 10Interest Rate 6,3% 7,4% 7,4%
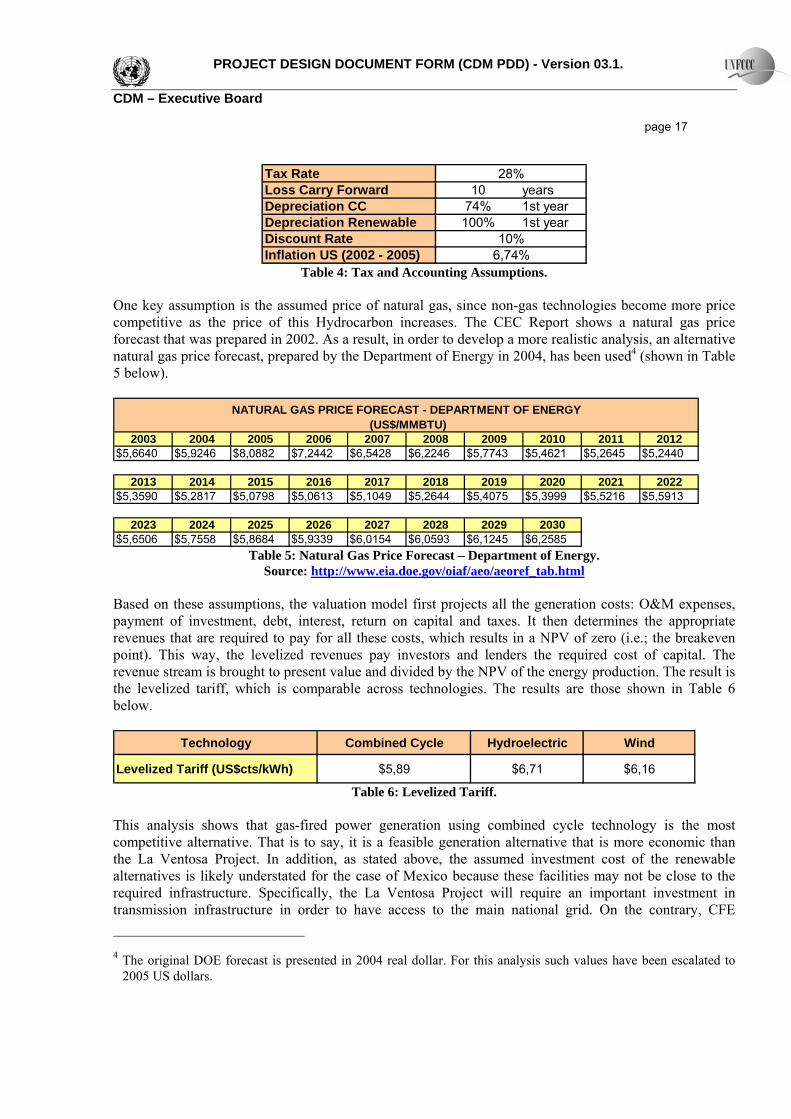
Table 3: Financing Assumptions. The CEC Report concluded that representative costs of capital and debt for Investor-Owned Utilities (“IOU”) are in the order of 10.6% and 6.3% (for a term of 12 years). The risk profile of projects developed under the CFE IPP program is very similar to that of the IOUs (e.g.; a fixed price under a long term PPA). Hence, the use of this benchmark of cost of capital and debt to estimate the levelized tariff under the combined cycle technology is considered appropriate. On the other hand, generating power with a renewable source under the Self-supply scheme is riskier because the sales of such power will be merchant-like and are not guaranteed like in other countries, typically european. The CEC Report suggests that the appropriate capital and debt costs for a merchant plant are 16% and 7.4% (10-year term), respectively. Thus, these values are assumed to determine the levelized tariff of the renewable-generated power. A typical financial structure of 30/70 is assumed in all cases. It is worth noting that the CEC Report cost estimates are for power projects in the US. Investors, as well as banks, would demand a greater return from a project developed in Mexico. However, because the emphasis of this analysis is to determine the relative value amongst the alternatives and the project activity (not the absolute value of each case), it is not necessary to add the country risk to the cost of capital and debt suggested in the CEC study. In addition to the assumptions extracted from the CEC Report, tax and accounting assumptions specific for Mexico have been made as shown in Table 4 below. In order to promote investment, Mexican authorities are temporarily allowing investors to deduct the first year of operations the value of the investments made. In the case of combined cycle assets, such deduction is of 74%, for renewable energy assets is 100%. The assumed discount rate to bring to present value the levelized revenues and energy, is 10%.
PROJECT DESIGN DOCUMENT FORM (CDM PDD) - Version 03.1. CDM – Executive Board page 17
Tax RateLoss Carry Forward 10 yearsDepreciation CC 74% 1st yearDepreciation Renewable 100% 1st yearDiscount RateInflation US (2002 - 2005) 6,74%
28%
10%
Table 4: Tax and Accounting Assumptions. One key assumption is the assumed price of natural gas, since non-gas technologies become more price competitive as the price of this Hydrocarbon increases. The CEC Report shows a natural gas price forecast that was prepared in 2002. As a result, in order to develop a more realistic analysis, an alternative natural gas price forecast, prepared by the Department of Energy in 2004, has been used4 (shown in Table 5 below).
2003 2004 2005 2006 2007 2008 2009 2010 2011 2012$5,6640 $5,9246 $8,0882 $7,2442 $6,5428 $6,2246 $5,7743 $5,4621 $5,2645 $5,2440
2013 2014 2015 2016 2017 2018 2019 2020 2021 2022$5,3590 $5,2817 $5,0798 $5,0613 $5,1049 $5,2644 $5,4075 $5,3999 $5,5216 $5,5913
2023 2024 2025 2026 2027 2028 2029 2030$5,6506 $5,7558 $5,8684 $5,9339 $6,0154 $6,0593 $6,1245 $6,2585
NATURAL GAS PRICE FORECAST - DEPARTMENT OF ENERGY (US$/MMBTU)
Table 5: Natural Gas Price Forecast – Department of Energy.
Source: http://www.eia.doe.gov/oiaf/aeo/aeoref_tab.html Based on these assumptions, the valuation model first projects all the generation costs: O&M expenses, payment of investment, debt, interest, return on capital and taxes. It then determines the appropriate revenues that are required to pay for all these costs, which results in a NPV of zero (i.e.; the breakeven point). This way, the levelized revenues pay investors and lenders the required cost of capital. The revenue stream is brought to present value and divided by the NPV of the energy production. The result is the levelized tariff, which is comparable across technologies. The results are those shown in Table 6 below.
Technology Combined Cycle Hydroelectric Wind
Levelized Tariff (US$cts/kWh) $5,89 $6,71 $6,16
Table 6: Levelized Tariff. This analysis shows that gas-fired power generation using combined cycle technology is the most competitive alternative. That is to say, it is a feasible generation alternative that is more economic than the La Ventosa Project. In addition, as stated above, the assumed investment cost of the renewable alternatives is likely understated for the case of Mexico because these facilities may not be close to the required infrastructure. Specifically, the La Ventosa Project will require an important investment in transmission infrastructure in order to have access to the main national grid. On the contrary, CFE
4 The original DOE forecast is presented in 2004 real dollar. For this analysis such values have been escalated to
2005 US dollars.
PROJECT DESIGN DOCUMENT FORM (CDM PDD) - Version 03.1. CDM – Executive Board page 18
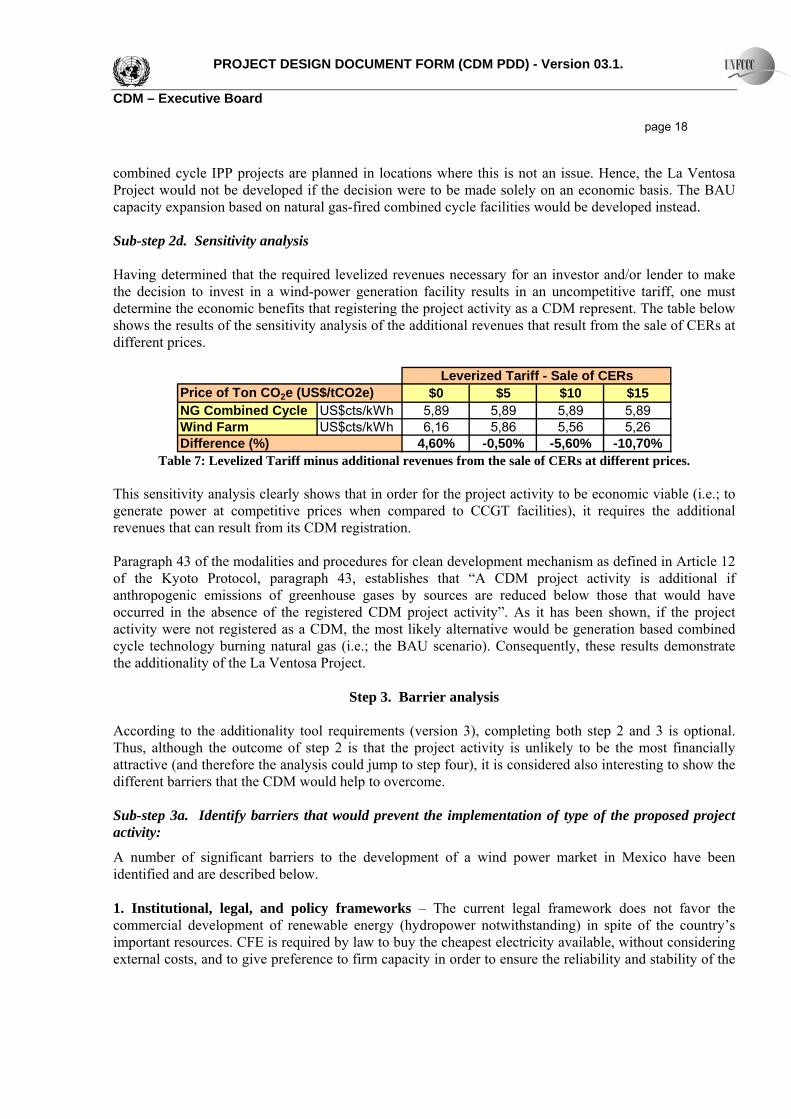
combined cycle IPP projects are planned in locations where this is not an issue. Hence, the La Ventosa Project would not be developed if the decision were to be made solely on an economic basis. The BAU capacity expansion based on natural gas-fired combined cycle facilities would be developed instead. Sub-step 2d. Sensitivity analysis Having determined that the required levelized revenues necessary for an investor and/or lender to make the decision to invest in a wind-power generation facility results in an uncompetitive tariff, one must determine the economic benefits that registering the project activity as a CDM represent. The table below shows the results of the sensitivity analysis of the additional revenues that result from the sale of CERs at different prices.
$0 $5 $10 $15NG Combined Cycle US$cts/kWh 5,89 5,89 5,89 5,89Wind Farm US$cts/kWh 6,16 5,86 5,56 5,26
4,60% -0,50% -5,60% -10,70%
Price of Ton CO2e (US$/tCO2e)Leverized Tariff - Sale of CERs
Difference (%) Table 7: Levelized Tariff minus additional revenues from the sale of CERs at different prices.
This sensitivity analysis clearly shows that in order for the project activity to be economic viable (i.e.; to generate power at competitive prices when compared to CCGT facilities), it requires the additional revenues that can result from its CDM registration. Paragraph 43 of the modalities and procedures for clean development mechanism as defined in Article 12 of the Kyoto Protocol, paragraph 43, establishes that “A CDM project activity is additional if anthropogenic emissions of greenhouse gases by sources are reduced below those that would have occurred in the absence of the registered CDM project activity”. As it has been shown, if the project activity were not registered as a CDM, the most likely alternative would be generation based combined cycle technology burning natural gas (i.e.; the BAU scenario). Consequently, these results demonstrate the additionality of the La Ventosa Project.
Step 3. Barrier analysis According to the additionality tool requirements (version 3), completing both step 2 and 3 is optional. Thus, although the outcome of step 2 is that the project activity is unlikely to be the most financially attractive (and therefore the analysis could jump to step four), it is considered also interesting to show the different barriers that the CDM would help to overcome. Sub-step 3a. Identify barriers that would prevent the implementation of type of the proposed project activity:
A number of significant barriers to the development of a wind power market in Mexico have been identified and are described below. 1. Institutional, legal, and policy frameworks – The current legal framework does not favor the commercial development of renewable energy (hydropower notwithstanding) in spite of the country’s important resources. CFE is required by law to buy the cheapest electricity available, without considering external costs, and to give preference to firm capacity in order to ensure the reliability and stability of the
PROJECT DESIGN DOCUMENT FORM (CDM PDD) - Version 03.1. CDM – Executive Board page 19
national grid. Buy-back prices for non-programmed electricity production are deeply discounted, making projects that must sell excess energy back to the grid unprofitable. No capacity payments5 are granted for intermittent power production, and CFE is under no obligation to purchase renewable energy production. Renewable power access to the electrical system is allowed by law, but not necessarily encouraged, in part because the effects of intermittent sources on the national grid have not been adequately explored. Since buy-back prices are based on consumer rates, as determined by the Finance Ministry, CFE currently has no authority to grant exceptions or provide incentives for renewable energy. 2. Economics of wind power – In Mexico, as is the case in most countries, the majority of wind power plants cannot compete with conventional power on the basis of cost per kWh alone. Wind resource availability does not generally coincide, in terms of location or time of day, with the most favorable buy-back prices. However, the average price of electricity in Mexico in the year 2000 was estimated at 6 US¢/kWh, which is close to the minimum buy-back price necessary for commercial wind power projects to become profitable (provided that favorable financial support can be obtained). It is therefore expected that with moderate incentives, such as the value of CERs provided by CDM projects, wind can become a competitive form of electricity generation in Mexico. 3. Financial limitations - In order for commercial wind projects to be implemented, potential project developers, both national and international, need to have confidence in the financial viability of the wind power market in the country. Given the lack of experience in commercial wind power development in Mexico, a potential financial network needs to be identified and strengthened so that it is able to identify and understand the business opportunities and risks associated with wind power development. The regulatory barriers outlined above can become financial constraints by perpetuating the perceived high investment risks associated with projects with elevated preparation costs and no guarantee that they can be implemented within a reasonable time frame. Without the additional revenue from CER sales, the project activity would unlikely be developed because a) alternative sources would make available power to consumers at more competitive prices, and b) the lack of CER related income would result in an unbalanced risk-return profile, which would prevent investors and lenders from investing in the project. The CDM registration and CER related income would solve both of these issues. 4. Market structure and human resources - Although several manufacturers of wind turbine components are already operating in Mexico, the market still needs to mature to ensure the existence of a healthy domestic industry that can supply wind turbine components on a competitive basis. Broader exchange and closer cooperation must be established between the manufacturing industry and the research institutions involved in wind power technology in order to consolidate national expertise. There is a significant lack of personnel with the appropriate training not only in the development and implementation of wind power projects; but also in the operation and maintenance of wind energy technologies. Several training initiatives aimed at developing specialized wind energy capacity in Mexico are under way, but these are still very limited. 5. Technical and information barriers – Except for a few sites, the wind resource data currently available for Mexico is very general and inadequate to conduct informed pre-investment studies. Although initiatives to expand Mexico’s wind energy database are in progress, they are insufficient to 5 Power producers normally receive a payment for their installed capacity available to the grid, in addition to what they are paid per kWh delivered. This payment is known as the capacity credit.
PROJECT DESIGN DOCUMENT FORM (CDM PDD) - Version 03.1. CDM – Executive Board page 20
develop a database that can facilitate the formulation, evaluation and negotiation of wind power projects. There are currently no national standards, nor recommended practices for the development of wind power projects in Mexico, to assist developers who wish to sponsor this type of projects. Potential developers will therefore be wary of bringing in technology that has not yet been implemented in Mexico. There is also a significant lack of knowledge among the main actors in the potential wind energy market regarding the state of development of wind technology, and the potential benefits that it could bring to society. Global trends6 indicate an annual growth rate of approximately 30% in grid-connected wind installed capacities; nevertheless, due to the reasons discussed in the preceding paragraphs, growth of grid-connected wind power facilities in Mexico has been negligible. Sub-step 3b. Show that the identified barriers would not prevent the implementation of at least one of the alternatives (except the proposed project activity): None of the barriers identified in Sub-step 3a would prevent the implementation of a natural gas-fired CCGT project with similar capacity to the La Ventosa Project’s (i.e.; 102 MW), which can be sponsored either by CFE (i.e., BAU) or a private investor (e.g.; Iberdrola).
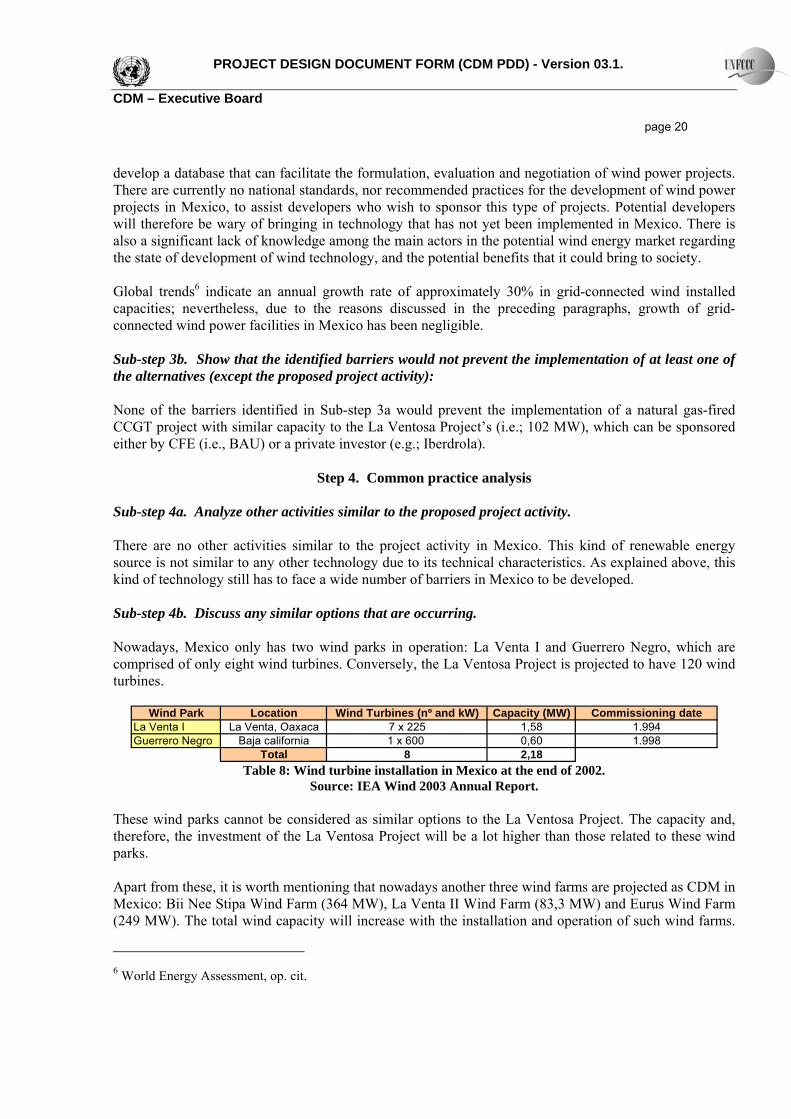
Step 4. Common practice analysis Sub-step 4a. Analyze other activities similar to the proposed project activity. There are no other activities similar to the project activity in Mexico. This kind of renewable energy source is not similar to any other technology due to its technical characteristics. As explained above, this kind of technology still has to face a wide number of barriers in Mexico to be developed. Sub-step 4b. Discuss any similar options that are occurring. Nowadays, Mexico only has two wind parks in operation: La Venta I and Guerrero Negro, which are comprised of only eight wind turbines. Conversely, the La Ventosa Project is projected to have 120 wind turbines.
Wind Park Location Wind Turbines (nº and kW) Capacity (MW) Commissioning dateLa Venta I La Venta, Oaxaca 7 x 225 1,58 1.994Guerrero Negro Baja california 1 x 600 0,60 1.998
Total 8 2,18 Table 8: Wind turbine installation in Mexico at the end of 2002.
Source: IEA Wind 2003 Annual Report. These wind parks cannot be considered as similar options to the La Ventosa Project. The capacity and, therefore, the investment of the La Ventosa Project will be a lot higher than those related to these wind parks. Apart from these, it is worth mentioning that nowadays another three wind farms are projected as CDM in Mexico: Bii Nee Stipa Wind Farm (364 MW), La Venta II Wind Farm (83,3 MW) and Eurus Wind Farm (249 MW). The total wind capacity will increase with the installation and operation of such wind farms.
6 World Energy Assessment, op. cit.
PROJECT DESIGN DOCUMENT FORM (CDM PDD) - Version 03.1. CDM – Executive Board page 21
However, it is clear that its development would be less probable in case they were not considered as CDM projects.
Step 5. Impact of CDM registration
The CDM has served to attract new players to the Mexican electricity market. Having extensive experience in the development of wind energy farms, these new players bring not only direct investment into the country; but also, and most importantly, the necessary know-how to implement this new technology. Iberdrola is a large electrical company headquartered in Spain; consequently, it is subject to the European ETS and is compelled to reduce its emissions to comply with Spain’s National Allocation Plan. Iberdrola is partly seeking to meet its compliance commitments through CERs generated by CDM projects. As a result, it is pushing forward clean energy projects, such as the La Ventosa Project, that would have not taken place without the CERs generated under the CDM. In a country where gas-fired CCGT projects are preferred, the La Ventosa Project is clearly not the business-as-usual generation alternative. As it has been demonstrated in the economic analysis in Step 2, wind energy projects are not the most likely alternative of energy generation in Mexico. Only the CER revenues that will accrue through the registration of the La Ventosa Project as a CDM project will enable it to be economically viable, allowing its successful development while other similar projects are at a standstill. Registration of the La Ventosa Project under the CDM will enable Iberdrola, the largest operator of wind farms in the world, to promote development of clean energy projects in a region of Mexico that for many years has offered excellent wind resources, but that have remained relatively untapped because of the lack of local capacity, technology, and expertise, which have been traditional barriers in the development of Mexico’s electricity market. B.6. Emission reductions:
B.6.1. Explanation of methodological choices: >> Baseline Emissions In accordance with the consolidated baseline methodology ACM0002, the emission factor (EFy) is calculated as a combined margin (CM), consisting of the combination of operating margin (OM) and build margin (BM) factors according to the following steps: Step 1. Calculate the Operating Margin emission factor(s) (EFOM.y) The ACM0002 consolidated methodology provides four methods to calculate the operating margin. For The La Ventosa Project, option (b) “Simple OM” has been chosen because:
i) sufficient data is not available for using the Dispatch Data Analysis option, and
PROJECT DESIGN DOCUMENT FORM (CDM PDD) - Version 03.1. CDM – Executive Board page 22
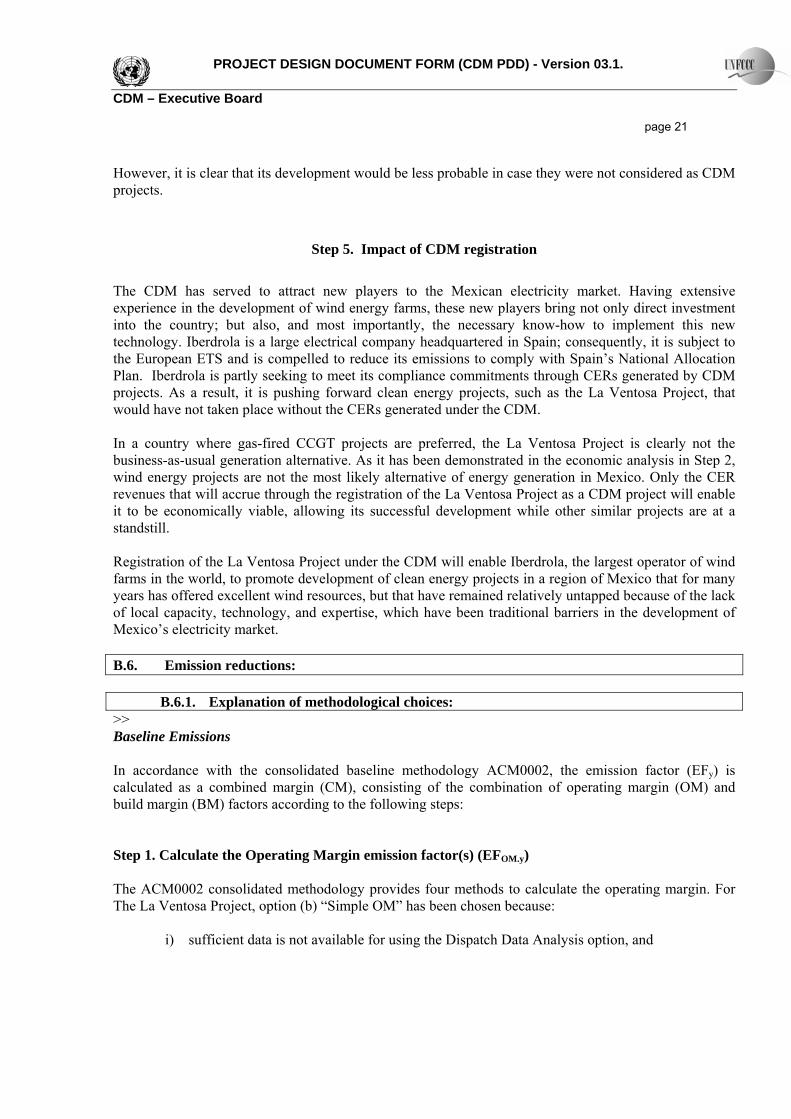
ii) low-cost/must-run resources in Mexico have represented less than 50% of total grid generation over the most recent years (see table below), as well as in long-term projections of hydroelectricity production. It is worth pointing out that the most recent data available is that relating to the period 2001-2004.
The Build Margin is calculated based on yearly statistics provided by the Mexican Energy Ministry SENER (Prospectiva del Sector Eléctrico 2006 – 2015, Prospectiva del Sector Eléctrico 2005 – 2014, Prospectiva del Sector Eléctrico 2004 – 2013, available at http://www.energia.gob.mx/wb2/Sener/Sene_185_publicaciones These statistics provide data on newly built plants (name, capacity, type of plant, location) as well as production data (total capacity, type of fuel used, capacity factor) for the most recent year.
2002 2003 2004 2005Combined Cycle 22,3% 27,0% 34,7% 33,5%
Turbogas 3,2% 3,4% 1,3% 0,6%Diesel 0,3% 0,4% 0,3% 0,4%Dual 6,9% 6,8% 3,8% 6,5%Coal 8,0% 8,2% 8,6% 8,5%
Geo+wind 2,7% 3,1% 3,1% 3,3%Nuclear 4,8% 5,2% 4,4% 4,9%Hydro 12,4% 9,7% 12,0% 12,6%
Thermal 39,4% 36,2% 31,8% 29,7%Low-cost/must-run 19,9% 18,0% 19,5% 20,8%
Total Generation (GWh) 201.059 203.555 208.634 218.971 Table 9: Percentage of electricity generation by energy source. Source: Sener’s POISE 2004-2013,
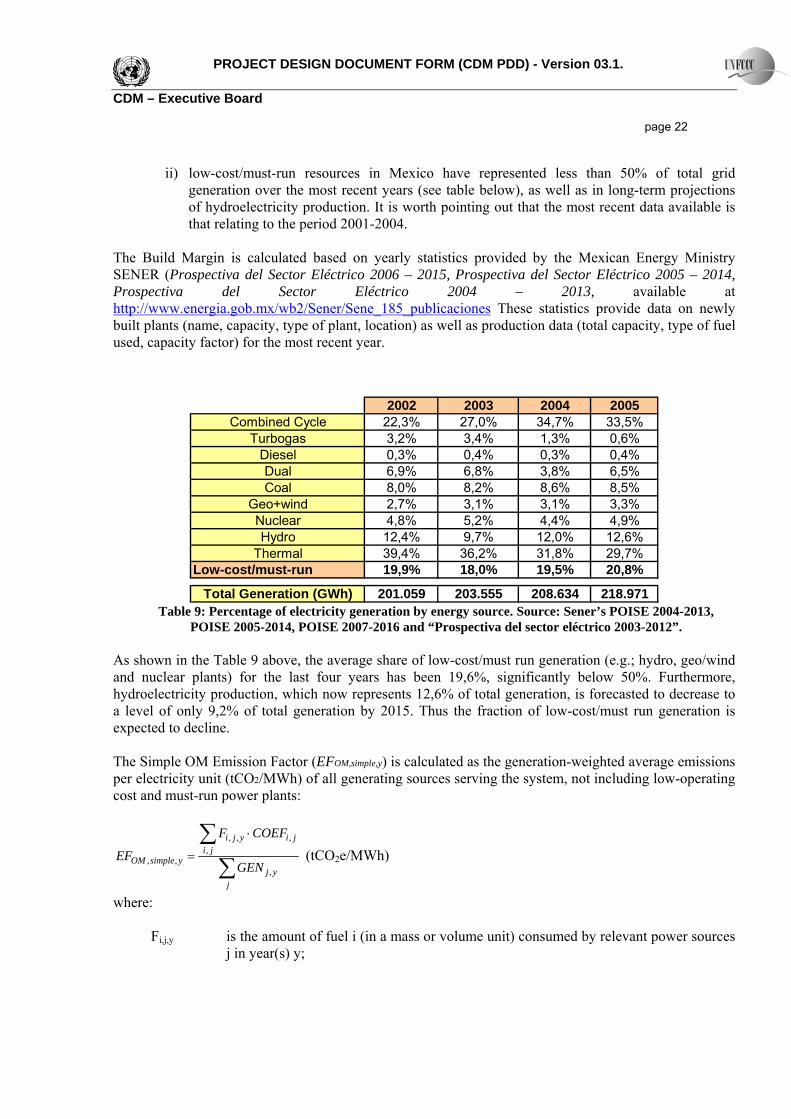
POISE 2005-2014, POISE 2007-2016 and “Prospectiva del sector eléctrico 2003-2012”. As shown in the Table 9 above, the average share of low-cost/must run generation (e.g.; hydro, geo/wind and nuclear plants) for the last four years has been 19,6%, significantly below 50%. Furthermore, hydroelectricity production, which now represents 12,6% of total generation, is forecasted to decrease to a level of only 9,2% of total generation by 2015. Thus the fraction of low-cost/must run generation is expected to decline. The Simple OM Emission Factor (EFOM,simple,y) is calculated as the generation-weighted average emissions per electricity unit (tCO2/MWh) of all generating sources serving the system, not including low-operating cost and must-run power plants:
∑∑ ⋅
=
jyj
jijiyji
ysimpleOM GEN
COEFF
EF,
,,,,
,, (tCO2e/MWh)
where:
Fi,j,y is the amount of fuel i (in a mass or volume unit) consumed by relevant power sources j in year(s) y;
PROJECT DESIGN DOCUMENT FORM (CDM PDD) - Version 03.1. CDM – Executive Board page 23
j refers to the power sources delivering electricity to the grid, not including low-operating cost and must-run power plants, and including imports to the grid;
COEFi,j is the CO2 emission coefficient of fuel i (tCO2/mass or volume unit of the fuel), taking into account the carbon content of the fuels used by relevant power sources j and the percent oxidation of the fuel in year(s) y; and
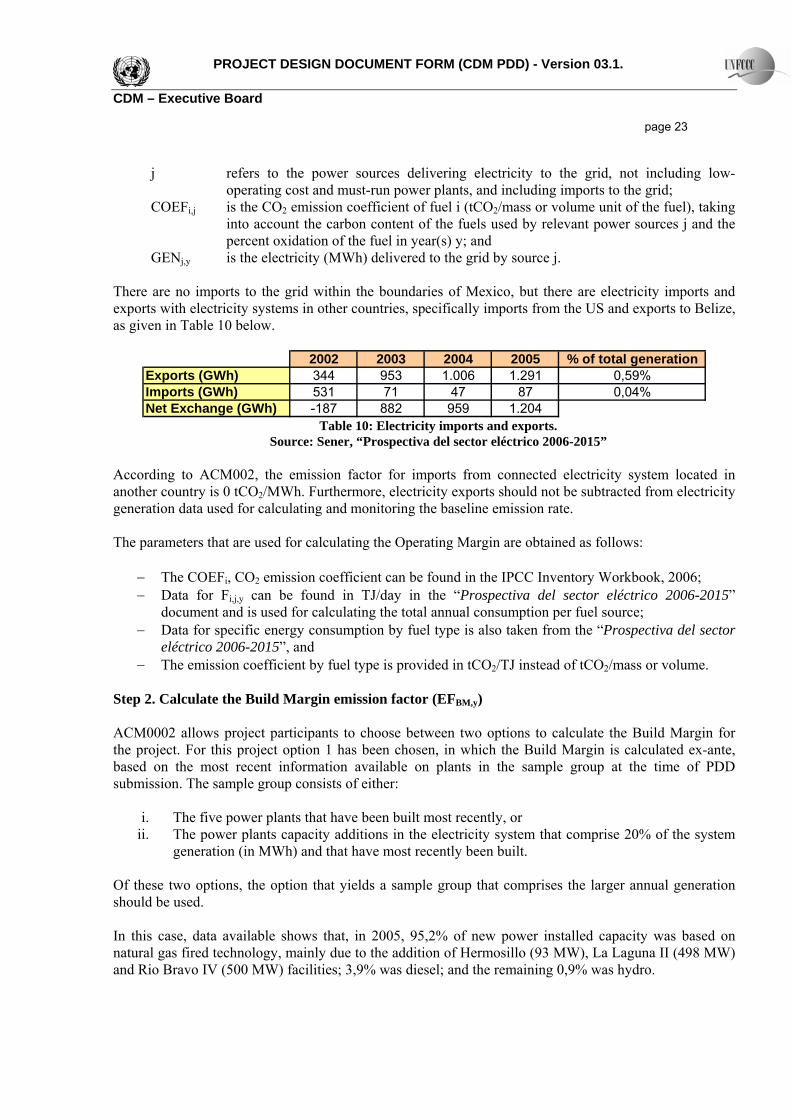
GENj,y is the electricity (MWh) delivered to the grid by source j. There are no imports to the grid within the boundaries of Mexico, but there are electricity imports and exports with electricity systems in other countries, specifically imports from the US and exports to Belize, as given in Table 10 below.
2002 2003 2004 2005 % of total generationExports (GWh) 344 953 1.006 1.291 0,59%Imports (GWh) 531 71 47 87 0,04%Net Exchange (GWh) -187 882 959 1.204
Table 10: Electricity imports and exports. Source: Sener, “Prospectiva del sector eléctrico 2006-2015”
According to ACM002, the emission factor for imports from connected electricity system located in another country is 0 tCO2/MWh. Furthermore, electricity exports should not be subtracted from electricity generation data used for calculating and monitoring the baseline emission rate. The parameters that are used for calculating the Operating Margin are obtained as follows:
− The COEFi, CO2 emission coefficient can be found in the IPCC Inventory Workbook, 2006; − Data for Fi,j,y can be found in TJ/day in the “Prospectiva del sector eléctrico 2006-2015”
document and is used for calculating the total annual consumption per fuel source; − Data for specific energy consumption by fuel type is also taken from the “Prospectiva del sector
eléctrico 2006-2015”, and − The emission coefficient by fuel type is provided in tCO2/TJ instead of tCO2/mass or volume.
Step 2. Calculate the Build Margin emission factor (EFBM,y) ACM0002 allows project participants to choose between two options to calculate the Build Margin for the project. For this project option 1 has been chosen, in which the Build Margin is calculated ex-ante, based on the most recent information available on plants in the sample group at the time of PDD submission. The sample group consists of either:
i. The five power plants that have been built most recently, or ii. The power plants capacity additions in the electricity system that comprise 20% of the system
generation (in MWh) and that have most recently been built. Of these two options, the option that yields a sample group that comprises the larger annual generation should be used. In this case, data available shows that, in 2005, 95,2% of new power installed capacity was based on natural gas fired technology, mainly due to the addition of Hermosillo (93 MW), La Laguna II (498 MW) and Rio Bravo IV (500 MW) facilities; 3,9% was diesel; and the remaining 0,9% was hydro.
PROJECT DESIGN DOCUMENT FORM (CDM PDD) - Version 03.1. CDM – Executive Board page 24
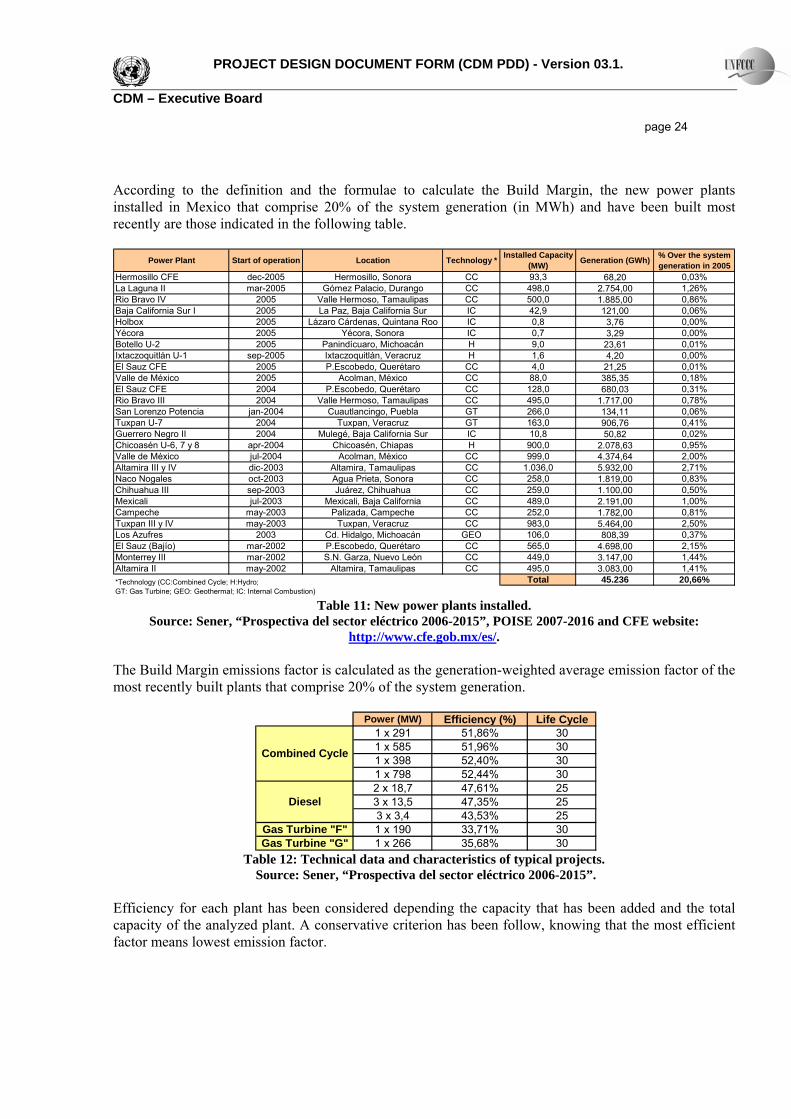
According to the definition and the formulae to calculate the Build Margin, the new power plants installed in Mexico that comprise 20% of the system generation (in MWh) and have been built most recently are those indicated in the following table.
Power Plant Start of operation Location Technology * Installed Capacity (MW) Generation (GWh) % Over the system
generation in 2005Hermosillo CFE dec-2005 Hermosillo, Sonora CC 93,3 68,20 0,03%La Laguna II mar-2005 Gómez Palacio, Durango CC 498,0 2.754,00 1,26%Rio Bravo IV 2005 Valle Hermoso, Tamaulipas CC 500,0 1.885,00 0,86%Baja California Sur I 2005 La Paz, Baja California Sur IC 42,9 121,00 0,06%Holbox 2005 Lázaro Cárdenas, Quintana Roo IC 0,8 3,76 0,00%Yécora 2005 Yécora, Sonora IC 0,7 3,29 0,00%Botello U-2 2005 Panindícuaro, Michoacán H 9,0 23,61 0,01%Ixtaczoquitlán U-1 sep-2005 Ixtaczoquitlán, Veracruz H 1,6 4,20 0,00%El Sauz CFE 2005 P.Escobedo, Querétaro CC 4,0 21,25 0,01%Valle de México 2005 Acolman, México CC 88,0 385,35 0,18%El Sauz CFE 2004 P.Escobedo, Querétaro CC 128,0 680,03 0,31%Rio Bravo III 2004 Valle Hermoso, Tamaulipas CC 495,0 1.717,00 0,78%San Lorenzo Potencia jan-2004 Cuautlancingo, Puebla GT 266,0 134,11 0,06%Tuxpan U-7 2004 Tuxpan, Veracruz GT 163,0 906,76 0,41%Guerrero Negro II 2004 Mulegé, Baja California Sur IC 10,8 50,82 0,02%Chicoasén U-6, 7 y 8 apr-2004 Chicoasén, Chiapas H 900,0 2.078,63 0,95%Valle de México jul-2004 Acolman, México CC 999,0 4.374,64 2,00%Altamira III y IV dic-2003 Altamira, Tamaulipas CC 1.036,0 5.932,00 2,71%Naco Nogales oct-2003 Agua Prieta, Sonora CC 258,0 1.819,00 0,83%Chihuahua III sep-2003 Juárez, Chihuahua CC 259,0 1.100,00 0,50%Mexicali jul-2003 Mexicali, Baja California CC 489,0 2.191,00 1,00%Campeche may-2003 Palizada, Campeche CC 252,0 1.782,00 0,81%Tuxpan III y IV may-2003 Tuxpan, Veracruz CC 983,0 5.464,00 2,50%Los Azufres 2003 Cd. Hidalgo, Michoacán GEO 106,0 808,39 0,37%El Sauz (Bajío) mar-2002 P.Escobedo, Querétaro CC 565,0 4.698,00 2,15%Monterrey III mar-2002 S.N. Garza, Nuevo León CC 449,0 3.147,00 1,44%Altamira II may-2002 Altamira, Tamaulipas CC 495,0 3.083,00 1,41%
Total 45.236 20,66%*Technology (CC:Combined Cycle; H:Hydro; GT: Gas Turbine; GEO: Geothermal; IC: Internal Combustion)
Table 11: New power plants installed. Source: Sener, “Prospectiva del sector eléctrico 2006-2015”, POISE 2007-2016 and CFE website:
http://www.cfe.gob.mx/es/. The Build Margin emissions factor is calculated as the generation-weighted average emission factor of the most recently built plants that comprise 20% of the system generation.
Power (MW) Efficiency (%) Life Cycle1 x 291 51,86% 301 x 585 51,96% 301 x 398 52,40% 301 x 798 52,44% 302 x 18,7 47,61% 253 x 13,5 47,35% 253 x 3,4 43,53% 25
Gas Turbine "F" 1 x 190 33,71% 30Gas Turbine "G" 1 x 266 35,68% 30
Diesel
Combined Cycle
Table 12: Technical data and characteristics of typical projects.
Source: Sener, “Prospectiva del sector eléctrico 2006-2015”. Efficiency for each plant has been considered depending the capacity that has been added and the total capacity of the analyzed plant. A conservative criterion has been follow, knowing that the most efficient factor means lowest emission factor.
PROJECT DESIGN DOCUMENT FORM (CDM PDD) - Version 03.1. CDM – Executive Board page 25
The Build Margin has been calculated by applying the following formula:
∑∑ ⋅
=
mym
mimiymi
yBMGEN
COEFF
EF,
,,,,
, (tCO2e/MWh)
For details on the calculations see Annex 3. Step 3. Calculate the baseline emission factor EFy. Finally, the baseline emission factor is calculated as the weighted average of the Operating Margin emission factor (EFOM,y) and the Build Margin emission factor (EFBM,y).
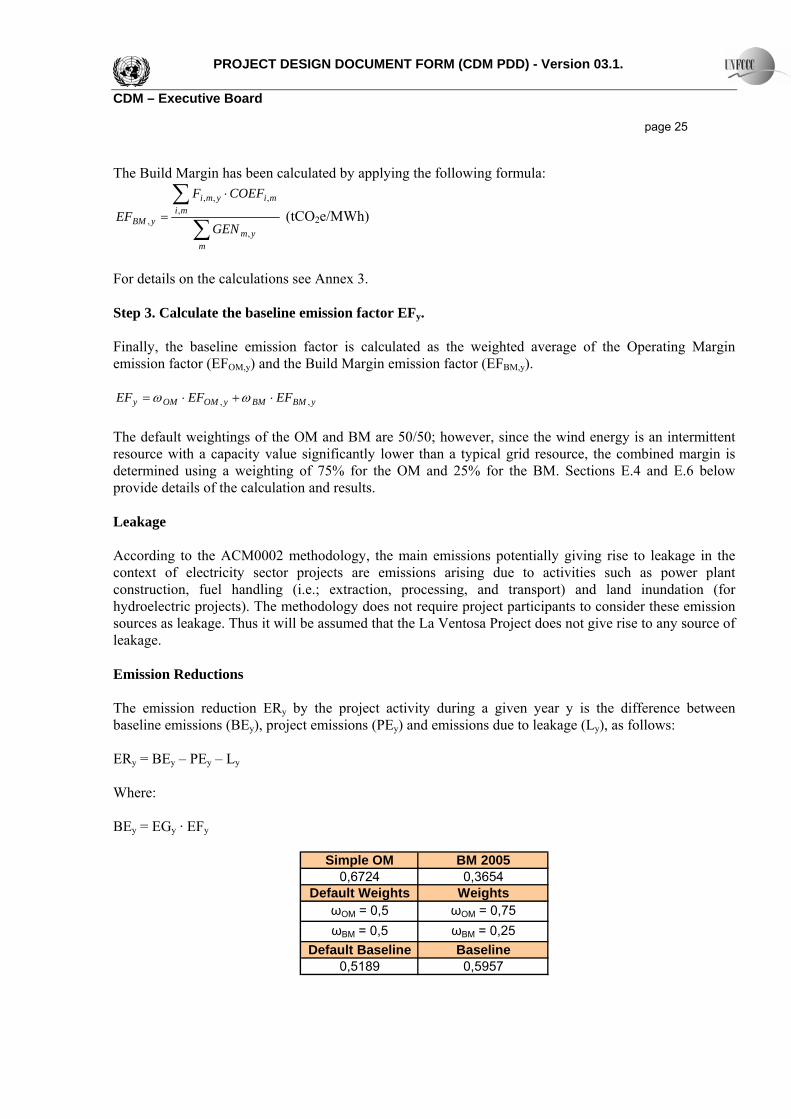
yBMBMyOMOMy EFEFEF ,, ⋅+⋅= ωω The default weightings of the OM and BM are 50/50; however, since the wind energy is an intermittent resource with a capacity value significantly lower than a typical grid resource, the combined margin is determined using a weighting of 75% for the OM and 25% for the BM. Sections E.4 and E.6 below provide details of the calculation and results. Leakage According to the ACM0002 methodology, the main emissions potentially giving rise to leakage in the context of electricity sector projects are emissions arising due to activities such as power plant construction, fuel handling (i.e.; extraction, processing, and transport) and land inundation (for hydroelectric projects). The methodology does not require project participants to consider these emission sources as leakage. Thus it will be assumed that the La Ventosa Project does not give rise to any source of leakage. Emission Reductions The emission reduction ERy by the project activity during a given year y is the difference between baseline emissions (BEy), project emissions (PEy) and emissions due to leakage (Ly), as follows: ERy = BEy – PEy – Ly Where: BEy = EGy · EFy
Simple OM BM 2005
0,6724 0,3654Default Weights Weights
ωOM = 0,5 ωOM = 0,75ωBM = 0,5 ωBM = 0,25
Default Baseline Baseline0,5189 0,5957
PROJECT DESIGN DOCUMENT FORM (CDM PDD) - Version 03.1. CDM – Executive Board page 26
Annex 3 provides details of the calculation and results.
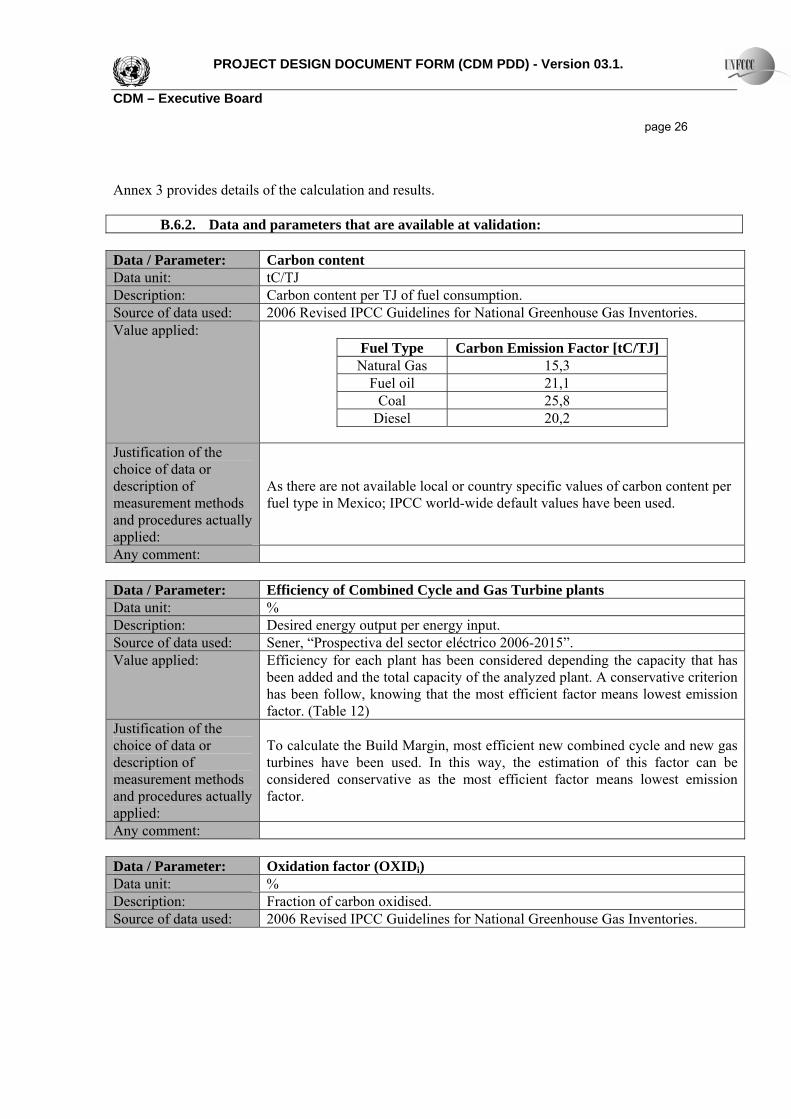
B.6.2. Data and parameters that are available at validation: Data / Parameter: Carbon content Data unit: tC/TJ Description: Carbon content per TJ of fuel consumption. Source of data used: 2006 Revised IPCC Guidelines for National Greenhouse Gas Inventories. Value applied:
Fuel Type Carbon Emission Factor [tC/TJ] Natural Gas 15,3
Fuel oil 21,1 Coal 25,8
Diesel 20,2
Justification of the choice of data or description of measurement methods and procedures actually applied:
As there are not available local or country specific values of carbon content per fuel type in Mexico; IPCC world-wide default values have been used.
Any comment:
Data / Parameter: Efficiency of Combined Cycle and Gas Turbine plants Data unit: % Description: Desired energy output per energy input. Source of data used: Sener, “Prospectiva del sector eléctrico 2006-2015”. Value applied: Efficiency for each plant has been considered depending the capacity that has
been added and the total capacity of the analyzed plant. A conservative criterion has been follow, knowing that the most efficient factor means lowest emission factor. (Table 12)
Justification of the choice of data or description of measurement methods and procedures actually applied:
To calculate the Build Margin, most efficient new combined cycle and new gas turbines have been used. In this way, the estimation of this factor can be considered conservative as the most efficient factor means lowest emission factor.
Any comment:
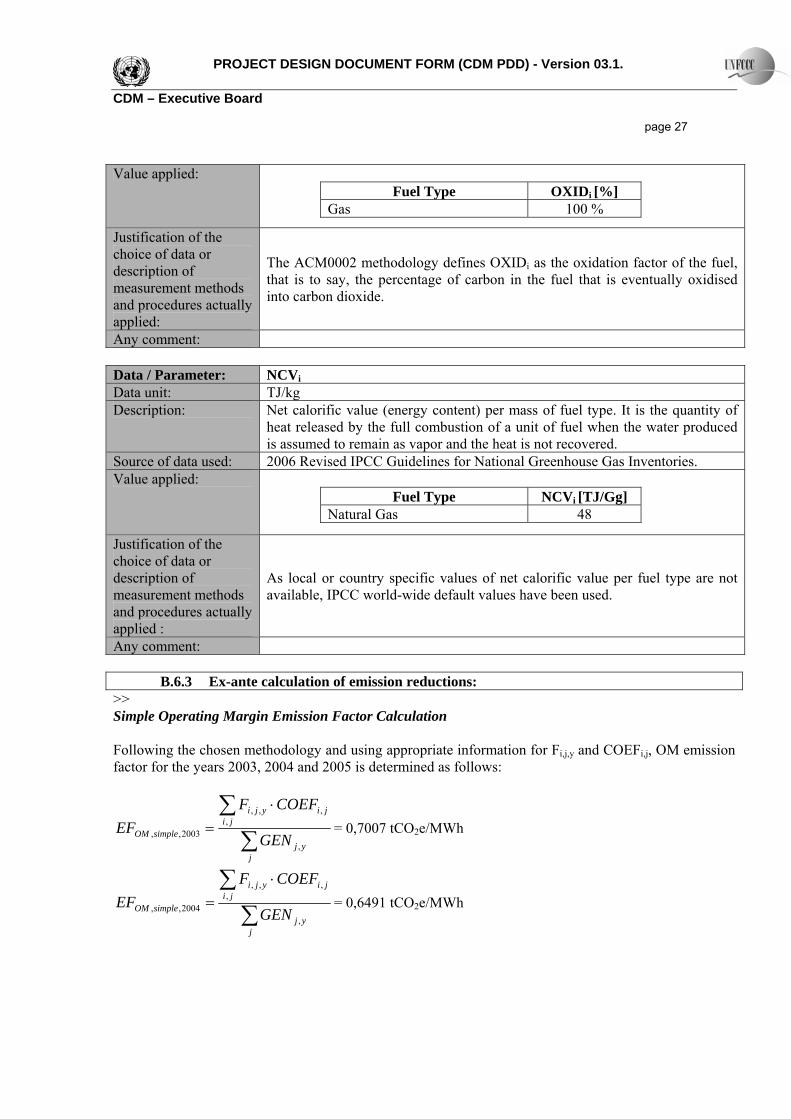
Data / Parameter: Oxidation factor (OXIDi) Data unit: % Description: Fraction of carbon oxidised. Source of data used: 2006 Revised IPCC Guidelines for National Greenhouse Gas Inventories.
PROJECT DESIGN DOCUMENT FORM (CDM PDD) - Version 03.1. CDM – Executive Board page 27
Value applied: Fuel Type OXIDi [%]
Gas 100 %
Justification of the choice of data or description of measurement methods and procedures actually applied:
The ACM0002 methodology defines OXIDi as the oxidation factor of the fuel, that is to say, the percentage of carbon in the fuel that is eventually oxidised into carbon dioxide.
Any comment:
Data / Parameter: NCVi Data unit: TJ/kg Description: Net calorific value (energy content) per mass of fuel type. It is the quantity of
heat released by the full combustion of a unit of fuel when the water produced is assumed to remain as vapor and the heat is not recovered.
Source of data used: 2006 Revised IPCC Guidelines for National Greenhouse Gas Inventories. Value applied:
Fuel Type NCVi [TJ/Gg] Natural Gas 48
Justification of the choice of data or description of measurement methods and procedures actually applied :
As local or country specific values of net calorific value per fuel type are not available, IPCC world-wide default values have been used.
Any comment:
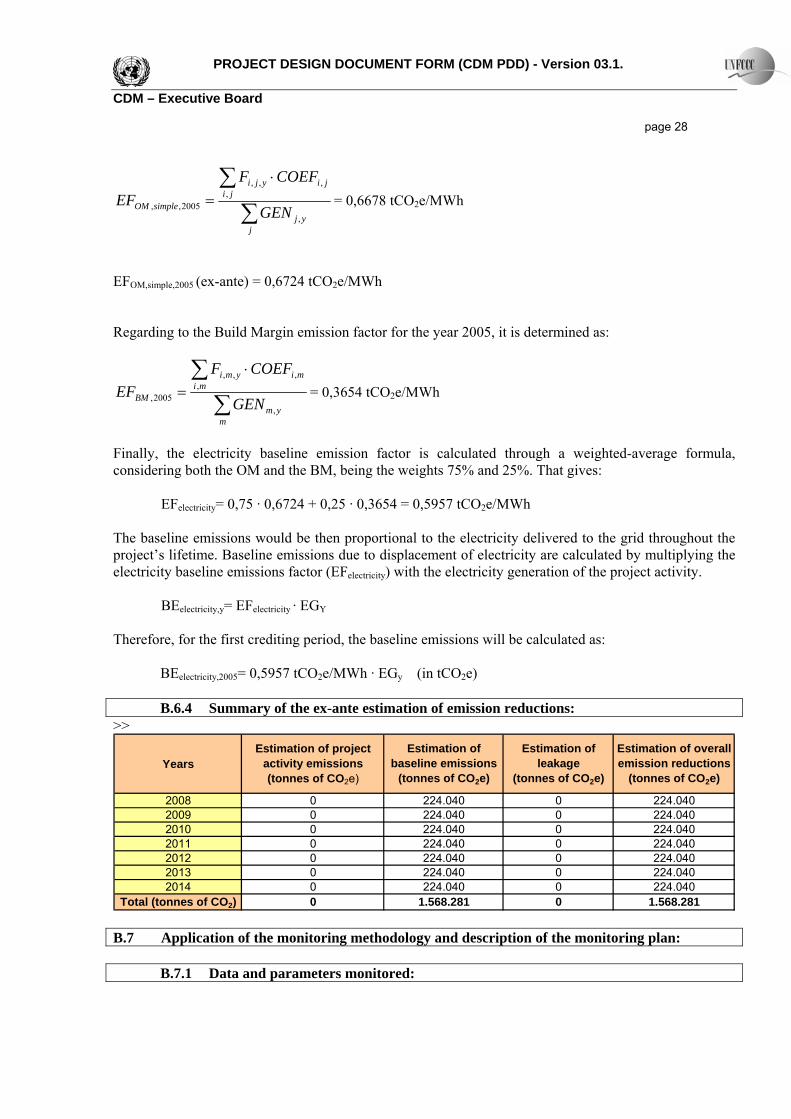
B.6.3 Ex-ante calculation of emission reductions: >> Simple Operating Margin Emission Factor Calculation Following the chosen methodology and using appropriate information for Fi,j,y and COEFi,j, OM emission factor for the years 2003, 2004 and 2005 is determined as follows:
∑∑ ⋅
=
jyj
jijiyji
simpleOM GEN
COEFFEF
,
,,,,
2003,, = 0,7007 tCO2e/MWh
∑∑ ⋅
=
jyj
jijiyji
simpleOM GEN
COEFFEF
,
,,,,
2004,, = 0,6491 tCO2e/MWh
PROJECT DESIGN DOCUMENT FORM (CDM PDD) - Version 03.1. CDM – Executive Board page 28
∑∑ ⋅
=
jyj
jijiyji
simpleOM GEN
COEFFEF
,
,,,,
2005,, = 0,6678 tCO2e/MWh
EFOM,simple,2005 (ex-ante) = 0,6724 tCO2e/MWh Regarding to the Build Margin emission factor for the year 2005, it is determined as:
∑∑ ⋅
=
mym
mimiymi
BM GEN
COEFFEF
,
,,,,
2005, = 0,3654 tCO2e/MWh
Finally, the electricity baseline emission factor is calculated through a weighted-average formula, considering both the OM and the BM, being the weights 75% and 25%. That gives:
EFelectricity= 0,75 · 0,6724 + 0,25 · 0,3654 = 0,5957 tCO2e/MWh The baseline emissions would be then proportional to the electricity delivered to the grid throughout the project’s lifetime. Baseline emissions due to displacement of electricity are calculated by multiplying the electricity baseline emissions factor (EFelectricity) with the electricity generation of the project activity.
BEelectricity,y= EFelectricity · EGY Therefore, for the first crediting period, the baseline emissions will be calculated as:
BEelectricity,2005= 0,5957 tCO2e/MWh · EGy (in tCO2e)
B.6.4 Summary of the ex-ante estimation of emission reductions: >>
YearsEstimation of project
activity emissions (tonnes of CO2e)
Estimation of baseline emissions
(tonnes of CO2e)
Estimation of leakage
(tonnes of CO2e)
Estimation of overall emission reductions
(tonnes of CO2e)
2008 0 224.040 0 224.0402009 0 224.040 0 224.0402010 0 224.040 0 224.0402011 0 224.040 0 224.0402012 0 224.040 0 224.0402013 0 224.040 0 224.0402014 0 224.040 0 224.040
Total (tonnes of CO2) 0 1.568.281 0 1.568.281 B.7 Application of the monitoring methodology and description of the monitoring plan:
B.7.1 Data and parameters monitored:
PROJECT DESIGN DOCUMENT FORM (CDM PDD) - Version 03.1. CDM – Executive Board page 29
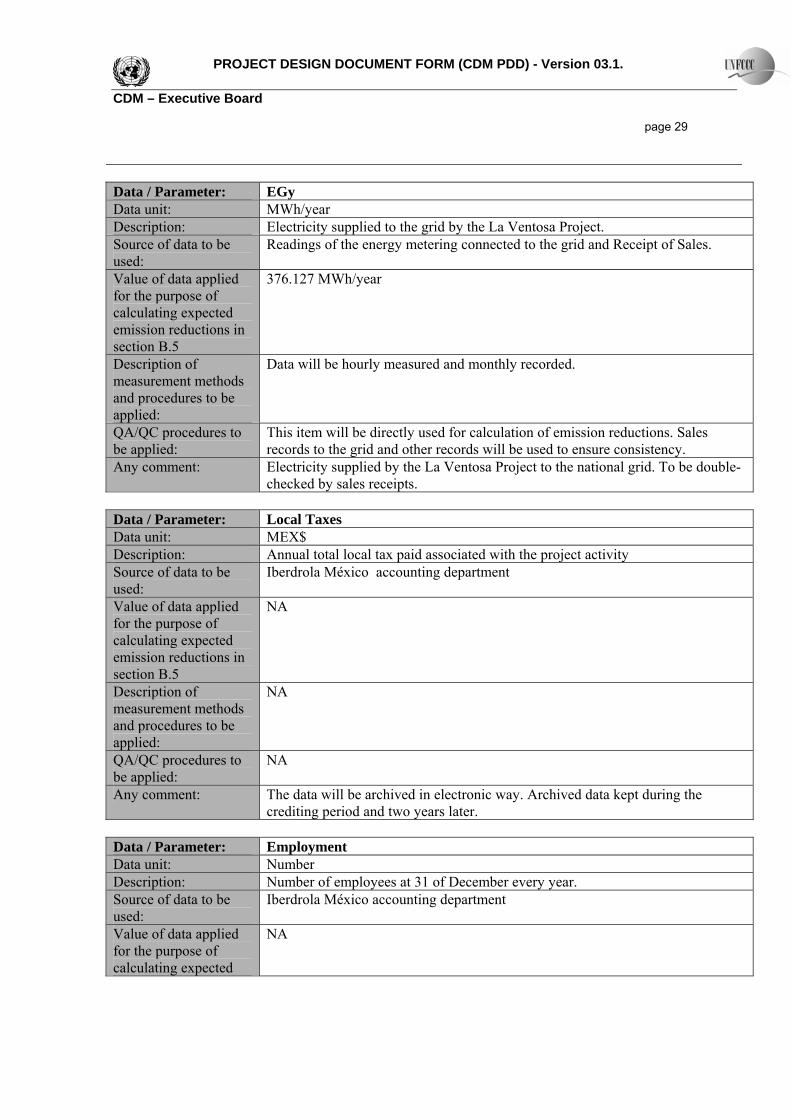
Data / Parameter: EGy Data unit: MWh/year Description: Electricity supplied to the grid by the La Ventosa Project. Source of data to be used:
Readings of the energy metering connected to the grid and Receipt of Sales.
Value of data applied for the purpose of calculating expected emission reductions in section B.5
376.127 MWh/year
Description of measurement methods and procedures to be applied:
Data will be hourly measured and monthly recorded.
QA/QC procedures to be applied:
This item will be directly used for calculation of emission reductions. Sales records to the grid and other records will be used to ensure consistency.
Any comment: Electricity supplied by the La Ventosa Project to the national grid. To be double-checked by sales receipts.
Data / Parameter: Local Taxes Data unit: MEX$ Description: Annual total local tax paid associated with the project activity Source of data to be used:
Iberdrola México accounting department
Value of data applied for the purpose of calculating expected emission reductions in section B.5
NA
Description of measurement methods and procedures to be applied:
NA
QA/QC procedures to be applied:
NA
Any comment: The data will be archived in electronic way. Archived data kept during the crediting period and two years later.
Data / Parameter: Employment Data unit: Number Description: Number of employees at 31 of December every year. Source of data to be used:
Iberdrola México accounting department
Value of data applied for the purpose of calculating expected
NA
PROJECT DESIGN DOCUMENT FORM (CDM PDD) - Version 03.1. CDM – Executive Board page 30
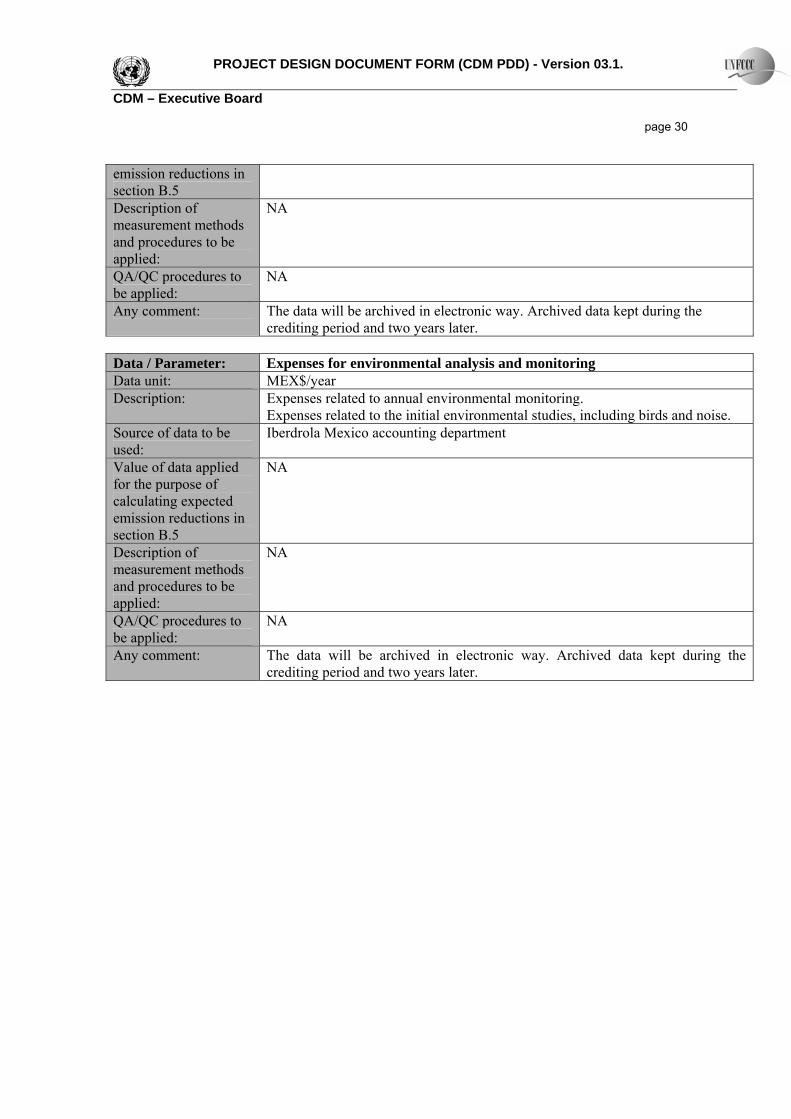
emission reductions in section B.5 Description of measurement methods and procedures to be applied:
NA
QA/QC procedures to be applied:
NA
Any comment: The data will be archived in electronic way. Archived data kept during the crediting period and two years later.
Data / Parameter: Expenses for environmental analysis and monitoring Data unit: MEX$/year Description: Expenses related to annual environmental monitoring.
Expenses related to the initial environmental studies, including birds and noise. Source of data to be used:
Iberdrola Mexico accounting department
Value of data applied for the purpose of calculating expected emission reductions in section B.5
NA
Description of measurement methods and procedures to be applied:
NA
QA/QC procedures to be applied:
NA
Any comment: The data will be archived in electronic way. Archived data kept during the crediting period and two years later.
PROJECT DESIGN DOCUMENT FORM (CDM PDD) - Version 03.1. CDM – Executive Board page 31
B.7.2 Description of the monitoring plan:
>> • Monitoring the generation output from the project activity (MWh) In accordance with monitoring methodology, the information that needs to be monitored shall include the electricity generation from the proposed project activity, measured from the control house on site. Electricity losses related to transportation will not be considered since they would be common to any power plant operating within the project boundaries. Total electricity generation energy will be monitored by Iberdrola México at the end of every month and an annual report of total generation for each year will be produced. Data will be obtained from the power meters located at the CFE substation. CFE defines the local standards and parameters to be followed in the electricity generation sector. For the emission reductions calculation, it will be used the following formula: Annual emission reduction = (project activity’s annual electricity dispatched to the grid) * (CO2 emission
factor (Ex-ante) of the estimated baseline) In order to monitor the generation output of the wind farm, the measurement systems from the control panel of the wind farm will be used. To check the generation output, the electricity measured will be compared with the electricity bill. • Monitoring the local taxes ( MEX$), expenses for environmental analysis and monitoring ( MEX$),
and number of employees In order to monitor the local taxes, expenses for environmental analysis and monitoring, and number of employees, Iberdrola Mexico accounting department will inform to the technical department once a year and the data will be archived in electronic way. Archived data kept during the crediting period and two years later. The technical department of Iberdrola México will be responsible for carrying out the Monitoring Plan. This department manages electricity billing; consequently, it regularly records the amount of electricity generated each month and compares it to the back-up electricity meters that are in place in the point of delivery to the grid. The manager of the O&M department will be directly responsible for monitoring activities for the first crediting period. Please see Annex 4 B.8 Date of completion of the application of the baseline study and monitoring methodology and the name of the responsible person(s)/entity(ies) >>
Garrigues Medio Ambiente Consultoría Técnica y de Gestión Integrada del Medio Ambiente, Hermosilla 3, 28001 Madrid SPAIN; and,
PROJECT DESIGN DOCUMENT FORM (CDM PDD) - Version 03.1. CDM – Executive Board page 32
Carolyn Luce, Solea Consulting Granada SPAIN
Date: 13/06/2007 SECTION C. Duration of the project activity / crediting period C.1 Duration of the project activity: C.1.1. Starting date of the project activity: >> The planned commercial operation date (“COD”) of the La Ventosa Project is January 2008. C.1.2. Expected operational lifetime of the project activity: >> The La Ventosa Project is expected to have a minimum operational life of 21 years from COD. C.2 Choice of the crediting period and related information: C.2.1. Renewable crediting period C.2.1.1. Starting date of the first crediting period: >> The crediting period will begin after the La Ventosa Project has been registered. However, to calculate the estimated emission reductions we will consider that starting date will be the La Ventosa Project’s COD, that is, January 1, 2008. C.2.1.2. Length of the first crediting period: >> The La Ventosa Project will select a renewable crediting period of 7 years. C.2.2. Fixed crediting period: C.2.2.1. Starting date: >> N/A C.2.2.2. Length: >> N/A
PROJECT DESIGN DOCUMENT FORM (CDM PDD) - Version 03.1. CDM – Executive Board page 33
SECTION D. Environmental impacts >> D.1. Documentation on the analysis of the environmental impacts, including transboundary impacts: >> In November 2005, the Environmental Impact Assessment (“EIA”) of the La Ventosa Project was submitted for approval under the title of “Parques Ecológicos de México, S.A. de C.V” to the General Office of Environmental Impact and Risk (Dirección General de Impacto y Riesgo Ambiental or “DGIRA”) of the Mexican Environment and Natural Resources Protection Ministry (Secretaría del Medio Ambiente y Recursos Naturales or “SEMARNAT”). On May 25, 2006, SEMARNAT, via the DGIRA, issued the appropriate environmental approval in favor of the La Ventosa Project (the “EIA Approval”).
The EIA presented a procedure to identify and mitigate the potential impact that the La Ventosa Project might have on the environment. First, an environmental characterization was developed in order to identify the project’s environmental components. Afterwards, potential positive and negative impacts on each component (e.g.; air, land, vegetation, fauna, social and economic, landscape) throughout the lifetime of the La Ventosa Project (i.e.: site preparation, construction, operation and maintenance and abandonment) were determined. For this purpose the EIA used Interaction Matrixes, which identified the environmental components versus the sources of potential environmental impact on these, according to their importance by means of discrimination and selection of the project’s activities. Next, the EIA presented a number of measures to prevent and mitigate any adverse impact. The implementation of prevention and mitigation measures will be conducted using an Environmental Management System created as part of the project’s activities. This system will consist of seven programs focused on specific activities related to vegetation, fauna, environmental monitoring, security and environmental contingencies, waste management, and environmental education. In addition, the EIA presented enough arguments demonstrating that the La Ventosa Project contributes to sustainable development. It stated that the La Ventosa Project’s construction, operation and maintenance activities sustain the quality of life, the maintenance of the continuous access to the natural resources, solves present needs and avoids lasting environmental damage without jeopardizing the capacity of future generations to solve their future necessities. Under the scope of the La Ventosa Project´s environmental tasks, an Environmental Quality Assessment and Management Program will be implemented (Programa de Seguimiento de Calidad Ambiental or “PSCA”), which will include the procedures and calendar to conduct the prevention, mitigation, and compensation activities presented in the approved EIA, and a monitoring study of the migratory and resident bird population, in order to identify and mitigate any environmental impacts that the Project could have on these subjects. After reviewing the EIA, SEMARNAT and all the other environmental authorities concluded that the La Ventosa Project is environmentally feasible because:
• It is not located in a reserved natural area; • It does not create a conflict with other regional development or environmental programs; • It is not located in an “Important Bird Conservation Area”; • It is not located in areas with historical or cultural value;
PROJECT DESIGN DOCUMENT FORM (CDM PDD) - Version 03.1. CDM – Executive Board page 34
• It is not introducing substantial additional alterations to the environmental as the surroundings to the Project’s site have previously been affected by agricultural activities; and
• The necessary measures to monitor and minimize any negative impact on the region have been taken into consideration and will be performed as required.
D.2. If environmental impacts are considered significant by the project participants or the host Party, please provide conclusions and all references to support documentation of an environmental impact assessment undertaken in accordance with the procedures as required by the host Party: >> Following the legal review, on May 25, 2006, SEMARNAT, via the DGIRA, issued the appropriate environmental approval in favor of the La Ventosa Project (the “EIA Approval”). In this way and in accordance with the terms and conditions of the resolution, an Environmental Program (EP) has been submitted to SEMARNAT on November 1, 2005. The Environmental Program includes a study on birds in the area. A bird survey will focus on gathering information on resident and migratory birds at the project site during at least a complete cycle (12-16 months). The bird monitoring plan will include the following terms:
• Migratory and resident bird diversity;
• distribution and estimated population per specie;
• flight behaviour (altitude, direction, arrival, etc);
• nesting areas and possible feeding;
• analysis of the information considering the project location and the regional context;
• estimate the dead potential risk of the birds due to collisions with the wing turbines;
• actions and/or measures to minimize the possible impacts on bird populations (These measurements will include the wind farm emergency shut down); and
• estimate direct and indirect costs due to the development of the Study and the application of the measurements taken account.
The considered actions and measures will be developed with the assistance of experts in the regional bird fauna and experience in this type of studies in the area. It is worth noting that the studies will help the environmental authorities to have a better knowledge of the bird behaviour. This is being a mayor investments not only related to the specific area of the project but which covers a wider area with the solely intention of getting a much better knowledge of nature who will help for the sustainable development in the whole region. Additionally, an evaluation of the noise level will be carried out in accordance to the NOM-081-SEMARNAT-1994 to guarantee that the project activity does not affect the bird populations (resident and migratory ones).
PROJECT DESIGN DOCUMENT FORM (CDM PDD) - Version 03.1. CDM – Executive Board page 35
Periodically reports will be submitted to SEMARNAT which will ensure that the projects is being handled according to the Environmental Plan, also possible visits from the authorities to the site will guarantee the correct implementation of the project. Once the obtained results had been analyzed, and in case that possible impact over fauna species had been identified according the NOM-059-SEMARNAT-2001, SEMARNAT could demand the appropriate insurances and guarantees related to the protection of those fauna species. Furthermore, La Ventosa Project will elaborate a Compensation Measurements Program (CMP) that will consist in the reforestation and conservation of native species strategy. The CMP will include the following conditions:
• Description of the biological, physical and socioeconomic environment;
• identify of the critical environmental factors;
• maps of the identified areas should be included to the application of the compensation measurement program;
• description of the activities that will be carried out in the compensation measurement program; and
• estimate direct and indirect costs due to the development of the Compensation Measurements Program.
La Ventosa Project will elaborate a report yearly during the project activity. These reports will be delivered to the SEMARNAT who will verify the application and fulfillment of the EP. SECTION E. Stakeholders’ comments >> E.1. Brief description how comments by local stakeholders have been invited and compiled: >> The following list shows the stakeholders that were informed about the La Ventosa Project and whose comments were invited: In order to guarantee the right to social participation and allow the involvement of the general public in the evaluation of the Project, SEMARNAT made the La Ventosa Project’s EIA available for public scrutiny in a document center located in Mexico City. No negative feedback was received. The DGIRA, the environmental authority in charge of determining the La Ventosa Project’s environmental feasibility, evaluated the La Ventosa Project’s EIA and made it available to all other environmental authorities involved in the evaluation of projects that might have an impact on the environment. The Office of Coordination of Conservation Programs of Central Mexico (Coordinación de Programas de Conservación Centro de México or “DUMAC”), the National Commission for the Knowledge and Use of Biodiversity (Comisión Nacional para el Conocimiento y Uso de la Biodiversidad or “CONABIO”), and General Office of Wild Life (Dirección General de Vida Silvestre or “DGVS”), all environmental authorities, received the EIA in order to determine if the La Ventosa Project could have an impact on the
PROJECT DESIGN DOCUMENT FORM (CDM PDD) - Version 03.1. CDM – Executive Board page 36
distribution areas of seaside birds, could affect migratory routes and/or have an impact on biological corridors of species of biological importance. The National Commission of Protected Natural Areas (Comisión Nacional de Áreas Naturales Protegidas or “CONANP”), another environmental authority, received and analyzed the EIA in order to determine if the La Ventosa Project would invade a natural protected area in the state of Oaxaca. The State Office of Ecology (Instituto Estatal de Ecología) and the Office of Urban Development of the State of Oaxaca (Dirección de Desarrollo Urbano del Estado de Oaxaca), both in representation of the State of Oaxaca’s Government, the Municipality of Asunción de Ixtaltepec, the Municipality of Juchitán de Zaragoza, and the General Office of Environmental Policy and Regional Integration of Office of the Vice-Secretary of Environmental Policy Planning (Dirección General de Política Ambiental e Integración Regional y Sectorial de la Subsecretaría de Planeación Política Ambiental or “DGPAIRS”) of SEMARNAT, received and analyzed the EIA in order to determine if the La Ventosa Project could be in conflict with any existing municipal and state urban development and environmental programs. All comments and observations expressed by the different agents were compiled by the DGIRA in the EIA Approval. E.2. Summary of the comments received: >> Society and authorities have given their approval to the development of the La Ventosa Project, as demonstrated by the comments listed below. As part of the administrative process to give anybody the right to express against the development of the La Ventosa Project, SEMARNAT made the EIA available for public scrutiny. No negative comments were received from either citizens, government or non-government organizations. Regional landowners have been consulted and have demonstrated their support for the development of the La Ventosa Project by signing the corresponding land lease agreements. SEMARNAT, the federal environmental authority, via the DGIRA, has approved the Project’s EIA and has authorized the execution of the La Ventosa Project. All appropriate environmental authorities were involved in the evaluation of the impact that the La Ventosa Project could have on the environment. All agreed that the La Ventosa Project is environmentally feasible, fulfills the applicable legislation, does not invade any natural protected areas, does not create conflict to other urban development and environmental programs, and supports sustainable development. The CONABIO identified 3 migratory routes of possible continental importance. Having limited bird migration information, it proposed the development of a bird study, in order to identify the potential environmental impact that the La Ventosa Project could have on the resident and migratory bird fauna so that preventive and corrective measures to minimize such impact can be implemented. CFE supports the development of wind power projects in the La Ventosa region. CFE is currently managing an open season procedure to build new transmission infrastructure to connect the new wind generation parks to the national grid.
PROJECT DESIGN DOCUMENT FORM (CDM PDD) - Version 03.1. CDM – Executive Board page 37
CRE has granted the required generation permit to The La Ventosa Project. E.3. Report on how due account was taken of any comments received: >> Based on the feedback received from the environmental authorities, the La Ventosa Project’s sponsor will:
1) Develop the PSCA, that will include the procedures and calendar to conduct the prevention, mitigation, and compensation activities presented in the approved EIA;
2) Conduct, with the assistance of experts, a twelve to sixteen-month bird monitoring study to identify and mitigate the potential impact that the La Ventosa Project could have on the migratory and resident bird populations in the Project’s area of influence;
3) Evaluate the noise levels to identify and mitigate any adverse impacts over the bird populations;
4) Develop an Environmental Compensation Plan, which will include actions to restore and preserve natural resources in the La Ventosa Project’s area of influence; and
5) Report annually to SEMARNAT the execution of the PSCA and the Environmental Compensation Plan.
Additionally, and even though any other mayor comments were not received, the following measures will be taken into account
• It will be created an office to manage the recruitment of employees, to offer information about the Project and to promote the integration of the community.
• In case that a considerable number of people would be interested on the La Ventosa Project,
future stakeholders meetings would be held to inform them about Project’s progress in its construction and its implementation and register as a CDM Project.
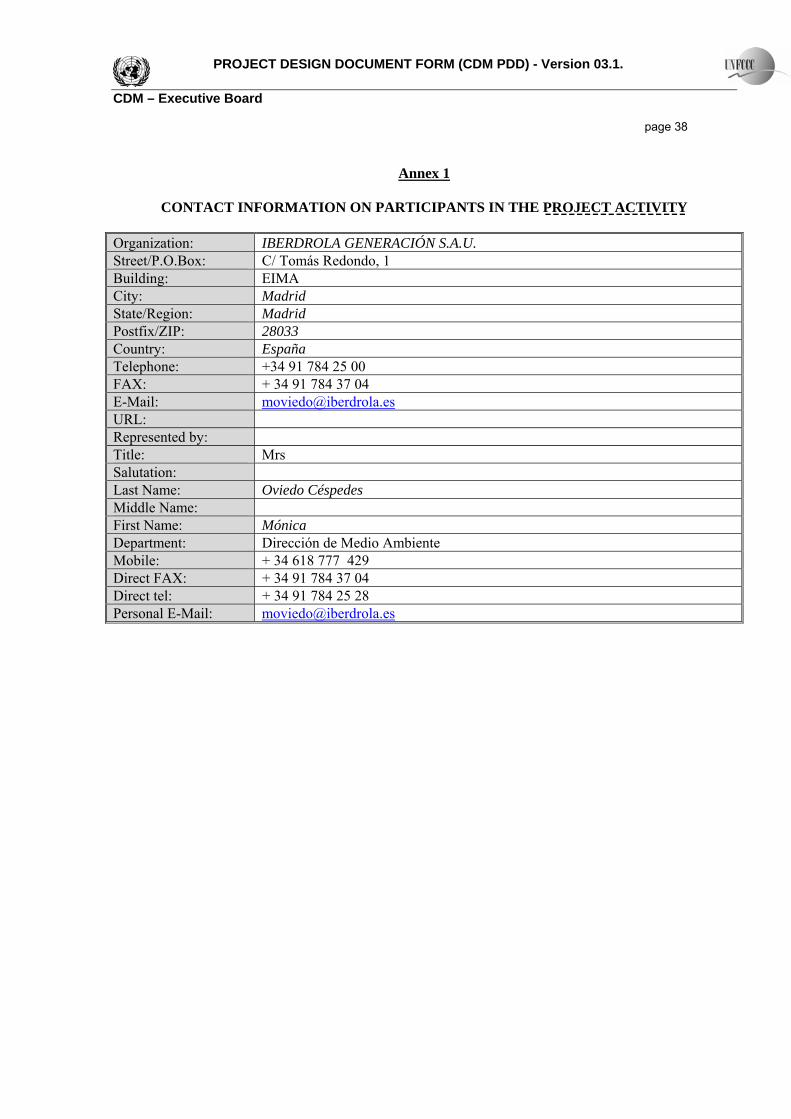
PROJECT DESIGN DOCUMENT FORM (CDM PDD) - Version 03.1. CDM – Executive Board page 38
Annex 1
CONTACT INFORMATION ON PARTICIPANTS IN THE PROJECT ACTIVITY Organization: IBERDROLA GENERACIÓN S.A.U. Street/P.O.Box: C/ Tomás Redondo, 1 Building: EIMA City: Madrid State/Region: Madrid Postfix/ZIP: 28033 Country: España Telephone: +34 91 784 25 00 FAX: + 34 91 784 37 04 E-Mail: [email protected] URL: Represented by: Title: Mrs Salutation: Last Name: Oviedo Céspedes Middle Name: First Name: Mónica Department: Dirección de Medio Ambiente Mobile: + 34 618 777 429 Direct FAX: + 34 91 784 37 04 Direct tel: + 34 91 784 25 28 Personal E-Mail: [email protected]
PROJECT DESIGN DOCUMENT FORM (CDM PDD) - Version 03.1. CDM – Executive Board page 39
Organization: Parques Ecológicos de México, S.A. de C.V. Street/P.O.Box: Blvd. Manuel Ávila Camacho 24, Piso 19, Col. Lomas de Chapultepec Building: Torre del Bosque City: Mexico State/Region: Distrito Federal Postfix/ZIP: 11000 Country: Mexico Telephone: +52 55 8503 4600 FAX: +52 55 8503 4605 E-Mail: [email protected] URL: Represented by: Title: Mr. Salutation: Last Name: Guijarro Rojas Middle Name: Enrique First Name: Tomás Department: Business Development Latin America Mobile: +52 55 1756 0191 Direct FAX: +52 55 8503 4605 Direct tel: +52 55 8503 4604 Personal E-Mail: [email protected]

PROJECT DESIGN DOCUMENT FORM (CDM PDD) - Version 03.1. CDM – Executive Board page 40
Annex 2
INFORMATION REGARDING PUBLIC FUNDING N/A
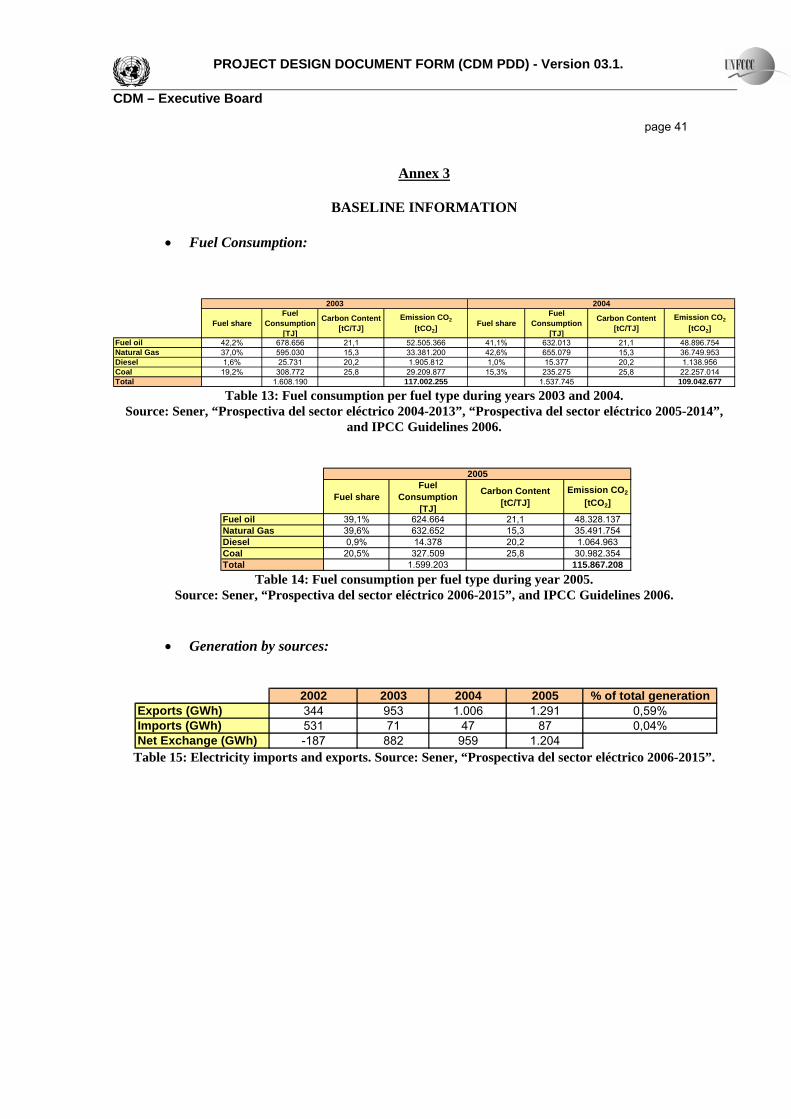
PROJECT DESIGN DOCUMENT FORM (CDM PDD) - Version 03.1. CDM – Executive Board page 41
Annex 3
BASELINE INFORMATION
• Fuel Consumption:
Fuel shareFuel
Consumption[TJ]
Carbon Content[tC/TJ]
Emission CO2
[tCO2]Fuel share
Fuel Consumption
[TJ]
Carbon Content[tC/TJ]
Emission CO2
[tCO2]
Fuel oil 42,2% 678.656 21,1 52.505.366 41,1% 632.013 21,1 48.896.754Natural Gas 37,0% 595.030 15,3 33.381.200 42,6% 655.079 15,3 36.749.953Diesel 1,6% 25.731 20,2 1.905.812 1,0% 15.377 20,2 1.138.956Coal 19,2% 308.772 25,8 29.209.877 15,3% 235.275 25,8 22.257.014Total 1.608.190 117.002.255 1.537.745 109.042.677
20042003
Table 13: Fuel consumption per fuel type during years 2003 and 2004.
Source: Sener, “Prospectiva del sector eléctrico 2004-2013”, “Prospectiva del sector eléctrico 2005-2014”, and IPCC Guidelines 2006.
Fuel shareFuel
Consumption[TJ]
Carbon Content[tC/TJ]
Emission CO2
[tCO2]
Fuel oil 39,1% 624.664 21,1 48.328.137Natural Gas 39,6% 632.652 15,3 35.491.754Diesel 0,9% 14.378 20,2 1.064.963Coal 20,5% 327.509 25,8 30.982.354Total 1.599.203 115.867.208
2005
Table 14: Fuel consumption per fuel type during year 2005.
Source: Sener, “Prospectiva del sector eléctrico 2006-2015”, and IPCC Guidelines 2006.
• Generation by sources:
2002 2003 2004 2005 % of total generationExports (GWh) 344 953 1.006 1.291 0,59%Imports (GWh) 531 71 47 87 0,04%Net Exchange (GWh) -187 882 959 1.204
Table 15: Electricity imports and exports. Source: Sener, “Prospectiva del sector eléctrico 2006-2015”.
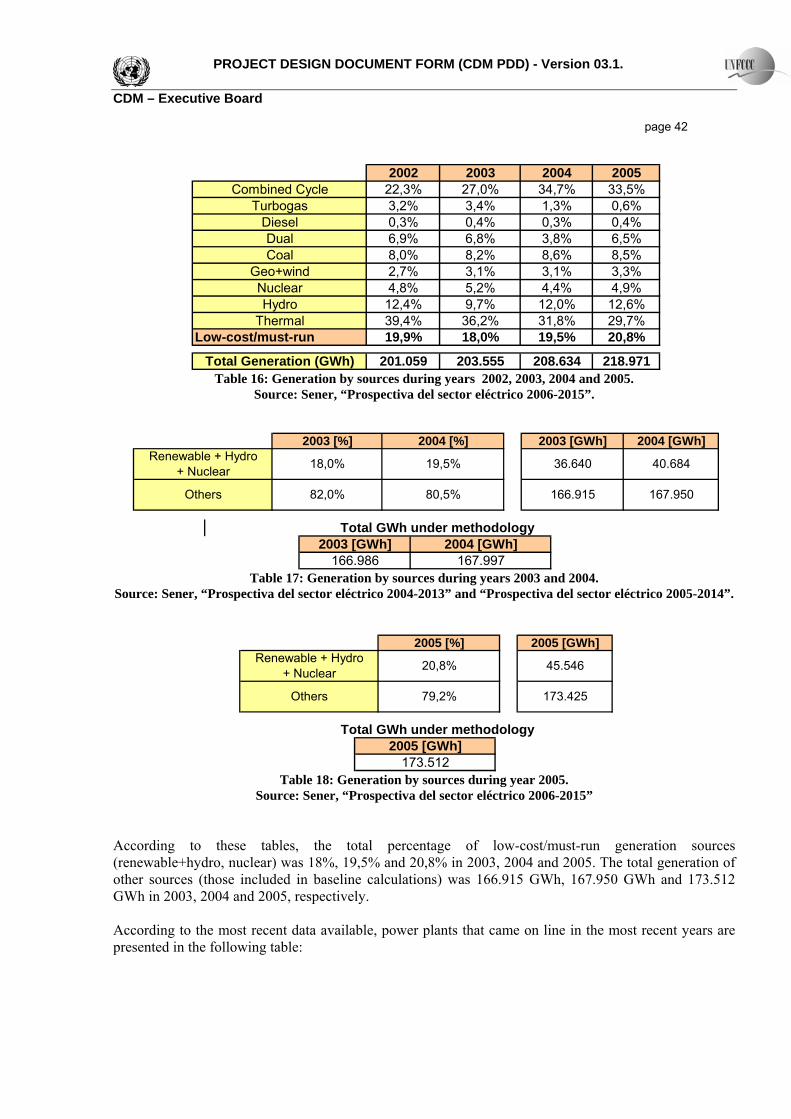
PROJECT DESIGN DOCUMENT FORM (CDM PDD) - Version 03.1. CDM – Executive Board page 42
2002 2003 2004 2005Combined Cycle 22,3% 27,0% 34,7% 33,5%
Turbogas 3,2% 3,4% 1,3% 0,6%Diesel 0,3% 0,4% 0,3% 0,4%Dual 6,9% 6,8% 3,8% 6,5%Coal 8,0% 8,2% 8,6% 8,5%
Geo+wind 2,7% 3,1% 3,1% 3,3%Nuclear 4,8% 5,2% 4,4% 4,9%Hydro 12,4% 9,7% 12,0% 12,6%
Thermal 39,4% 36,2% 31,8% 29,7%Low-cost/must-run 19,9% 18,0% 19,5% 20,8%
Total Generation (GWh) 201.059 203.555 208.634 218.971 Table 16: Generation by sources during years 2002, 2003, 2004 and 2005.
Source: Sener, “Prospectiva del sector eléctrico 2006-2015”.
2003 [%] 2004 [%] 2003 [GWh] 2004 [GWh]
166.915
40.684
167.950
Renewable + Hydro + Nuclear 18,0% 19,5% 36.640
Others 82,0% 80,5%
2003 [GWh] 2004 [GWh]
166.986 167.997
Total GWh under methodology
Table 17: Generation by sources during years 2003 and 2004.
Source: Sener, “Prospectiva del sector eléctrico 2004-2013” and “Prospectiva del sector eléctrico 2005-2014”.
2005 [%] 2005 [GWh]Renewable + Hydro
+ Nuclear 20,8% 45.546
173.425Others 79,2%
2005 [GWh]
173.512
Total GWh under methodology
Table 18: Generation by sources during year 2005.
Source: Sener, “Prospectiva del sector eléctrico 2006-2015”
According to these tables, the total percentage of low-cost/must-run generation sources (renewable+hydro, nuclear) was 18%, 19,5% and 20,8% in 2003, 2004 and 2005. The total generation of other sources (those included in baseline calculations) was 166.915 GWh, 167.950 GWh and 173.512 GWh in 2003, 2004 and 2005, respectively. According to the most recent data available, power plants that came on line in the most recent years are presented in the following table:
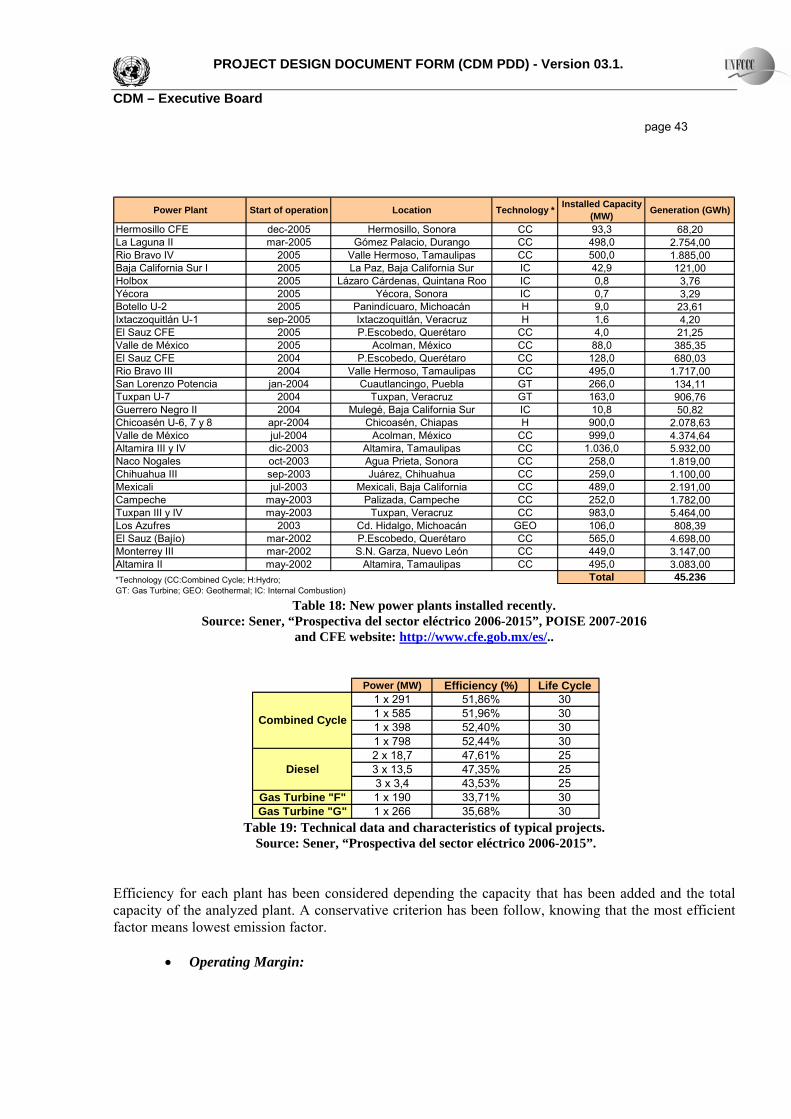
PROJECT DESIGN DOCUMENT FORM (CDM PDD) - Version 03.1. CDM – Executive Board page 43
Power Plant Start of operation Location Technology * Installed Capacity (MW) Generation (GWh)
Hermosillo CFE dec-2005 Hermosillo, Sonora CC 93,3 68,20La Laguna II mar-2005 Gómez Palacio, Durango CC 498,0 2.754,00Rio Bravo IV 2005 Valle Hermoso, Tamaulipas CC 500,0 1.885,00Baja California Sur I 2005 La Paz, Baja California Sur IC 42,9 121,00Holbox 2005 Lázaro Cárdenas, Quintana Roo IC 0,8 3,76Yécora 2005 Yécora, Sonora IC 0,7 3,29Botello U-2 2005 Panindícuaro, Michoacán H 9,0 23,61Ixtaczoquitlán U-1 sep-2005 Ixtaczoquitlán, Veracruz H 1,6 4,20El Sauz CFE 2005 P.Escobedo, Querétaro CC 4,0 21,25Valle de México 2005 Acolman, México CC 88,0 385,35El Sauz CFE 2004 P.Escobedo, Querétaro CC 128,0 680,03Rio Bravo III 2004 Valle Hermoso, Tamaulipas CC 495,0 1.717,00San Lorenzo Potencia jan-2004 Cuautlancingo, Puebla GT 266,0 134,11Tuxpan U-7 2004 Tuxpan, Veracruz GT 163,0 906,76Guerrero Negro II 2004 Mulegé, Baja California Sur IC 10,8 50,82Chicoasén U-6, 7 y 8 apr-2004 Chicoasén, Chiapas H 900,0 2.078,63Valle de México jul-2004 Acolman, México CC 999,0 4.374,64Altamira III y IV dic-2003 Altamira, Tamaulipas CC 1.036,0 5.932,00Naco Nogales oct-2003 Agua Prieta, Sonora CC 258,0 1.819,00Chihuahua III sep-2003 Juárez, Chihuahua CC 259,0 1.100,00Mexicali jul-2003 Mexicali, Baja California CC 489,0 2.191,00Campeche may-2003 Palizada, Campeche CC 252,0 1.782,00Tuxpan III y IV may-2003 Tuxpan, Veracruz CC 983,0 5.464,00Los Azufres 2003 Cd. Hidalgo, Michoacán GEO 106,0 808,39El Sauz (Bajío) mar-2002 P.Escobedo, Querétaro CC 565,0 4.698,00Monterrey III mar-2002 S.N. Garza, Nuevo León CC 449,0 3.147,00Altamira II may-2002 Altamira, Tamaulipas CC 495,0 3.083,00
Total 45.236*Technology (CC:Combined Cycle; H:Hydro; GT: Gas Turbine; GEO: Geothermal; IC: Internal Combustion)
Table 18: New power plants installed recently. Source: Sener, “Prospectiva del sector eléctrico 2006-2015”, POISE 2007-2016
and CFE website: http://www.cfe.gob.mx/es/..
Power (MW) Efficiency (%) Life Cycle1 x 291 51,86% 301 x 585 51,96% 301 x 398 52,40% 301 x 798 52,44% 302 x 18,7 47,61% 253 x 13,5 47,35% 253 x 3,4 43,53% 25
Gas Turbine "F" 1 x 190 33,71% 30Gas Turbine "G" 1 x 266 35,68% 30
Diesel
Combined Cycle
Table 19: Technical data and characteristics of typical projects.
Source: Sener, “Prospectiva del sector eléctrico 2006-2015”. Efficiency for each plant has been considered depending the capacity that has been added and the total capacity of the analyzed plant. A conservative criterion has been follow, knowing that the most efficient factor means lowest emission factor.
• Operating Margin:
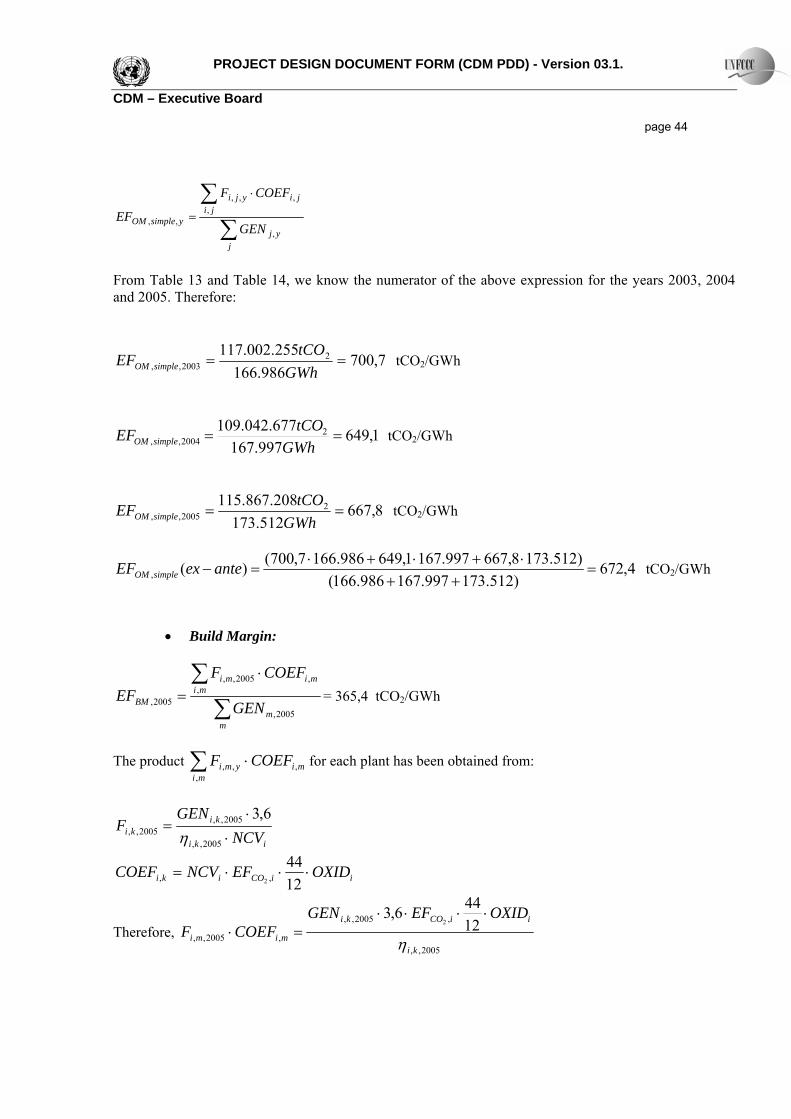
PROJECT DESIGN DOCUMENT FORM (CDM PDD) - Version 03.1. CDM – Executive Board page 44
∑∑ ⋅
=
jyj
jijiyji
ysimpleOMGEN
COEFF
EF,
,,,,
,,
From Table 13 and Table 14, we know the numerator of the above expression for the years 2003, 2004 and 2005. Therefore:
7,700986.166
255.002.117 22003,, ==
GWhtCOEF simpleOM tCO2/GWh
1,649997.167
677.042.109 22004,, ==
GWhtCOEF simpleOM tCO2/GWh
8,667512.173
208.867.115 22005,, ==
GWhtCOEF simpleOM tCO2/GWh
4,672)512.173997.167986.166(
)512.1738,667997.1671,649986.1667,700()(, =++
⋅+⋅+⋅=− anteexEF simpleOM tCO2/GWh
• Build Margin:
∑∑ ⋅
=
mm
mimimi
BM GEN
COEFFEF
2005,
,,2005,,
2005, = 365,4 tCO2/GWh
The product ∑ ⋅
mimiymi COEFF
,,,, for each plant has been obtained from:
iki
kiki NCV
GENF
⋅⋅
=2005,,
2005,,2005,,
6,3η
iiCOiki OXIDEFNCVCOEF ⋅⋅⋅=1244
,, 2
Therefore, 2005,,
,2005,,
,2005,,12446,3
2
ki
iiCOki
mimi
OXIDEFGENCOEFF
η
⋅⋅⋅⋅=⋅
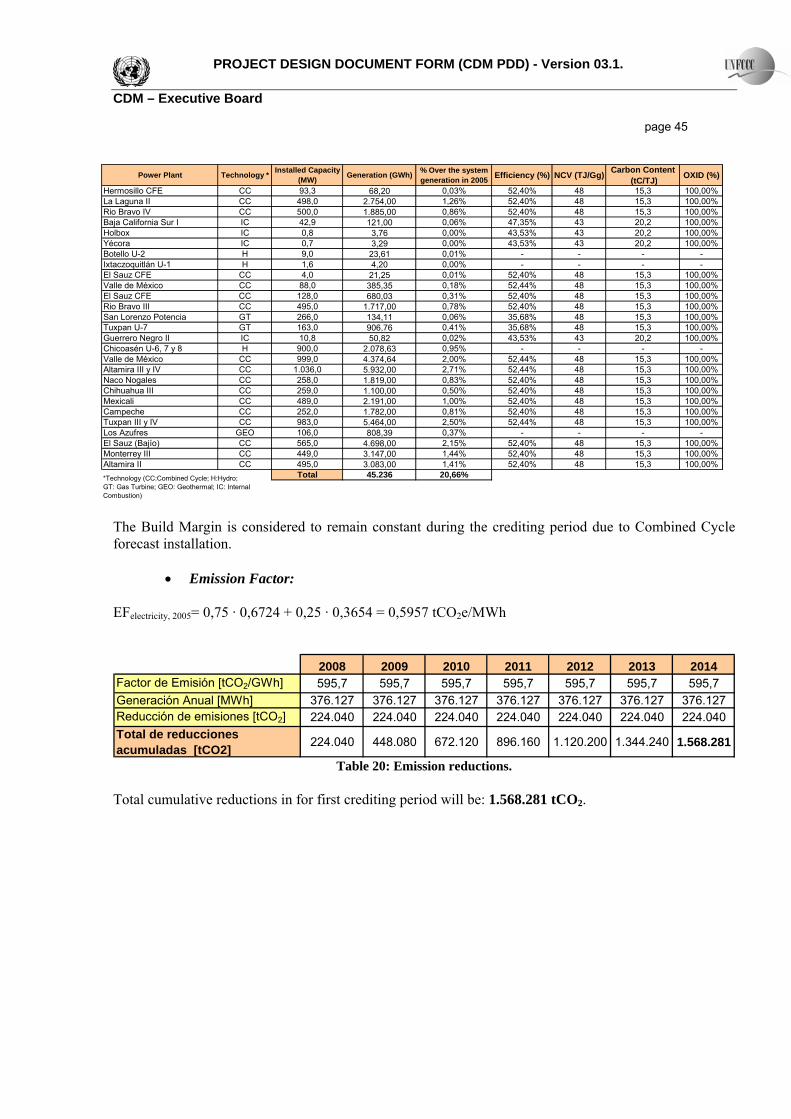
PROJECT DESIGN DOCUMENT FORM (CDM PDD) - Version 03.1. CDM – Executive Board page 45
Power Plant Technology * Installed Capacity (MW) Generation (GWh) % Over the system
generation in 2005 Efficiency (%) NCV (TJ/Gg) Carbon Content (tC/TJ) OXID (%)
Hermosillo CFE CC 93,3 68,20 0,03% 52,40% 48 15,3 100,00%La Laguna II CC 498,0 2.754,00 1,26% 52,40% 48 15,3 100,00%Rio Bravo IV CC 500,0 1.885,00 0,86% 52,40% 48 15,3 100,00%Baja California Sur I IC 42,9 121,00 0,06% 47,35% 43 20,2 100,00%Holbox IC 0,8 3,76 0,00% 43,53% 43 20,2 100,00%Yécora IC 0,7 3,29 0,00% 43,53% 43 20,2 100,00%Botello U-2 H 9,0 23,61 0,01% - - - -Ixtaczoquitlán U-1 H 1,6 4,20 0,00% - - - -El Sauz CFE CC 4,0 21,25 0,01% 52,40% 48 15,3 100,00%Valle de México CC 88,0 385,35 0,18% 52,44% 48 15,3 100,00%El Sauz CFE CC 128,0 680,03 0,31% 52,40% 48 15,3 100,00%Rio Bravo III CC 495,0 1.717,00 0,78% 52,40% 48 15,3 100,00%San Lorenzo Potencia GT 266,0 134,11 0,06% 35,68% 48 15,3 100,00%Tuxpan U-7 GT 163,0 906,76 0,41% 35,68% 48 15,3 100,00%Guerrero Negro II IC 10,8 50,82 0,02% 43,53% 43 20,2 100,00%Chicoasén U-6, 7 y 8 H 900,0 2.078,63 0,95% - - - -Valle de México CC 999,0 4.374,64 2,00% 52,44% 48 15,3 100,00%Altamira III y IV CC 1.036,0 5.932,00 2,71% 52,44% 48 15,3 100,00%Naco Nogales CC 258,0 1.819,00 0,83% 52,40% 48 15,3 100,00%Chihuahua III CC 259,0 1.100,00 0,50% 52,40% 48 15,3 100,00%Mexicali CC 489,0 2.191,00 1,00% 52,40% 48 15,3 100,00%Campeche CC 252,0 1.782,00 0,81% 52,40% 48 15,3 100,00%Tuxpan III y IV CC 983,0 5.464,00 2,50% 52,44% 48 15,3 100,00%Los Azufres GEO 106,0 808,39 0,37% - - - -El Sauz (Bajío) CC 565,0 4.698,00 2,15% 52,40% 48 15,3 100,00%Monterrey III CC 449,0 3.147,00 1,44% 52,40% 48 15,3 100,00%Altamira II CC 495,0 3.083,00 1,41% 52,40% 48 15,3 100,00%
Total 45.236 20,66%*Technology (CC:Combined Cycle; H:Hydro; GT: Gas Turbine; GEO: Geothermal; IC: Internal Combustion)
The Build Margin is considered to remain constant during the crediting period due to Combined Cycle forecast installation.
• Emission Factor: EFelectricity, 2005= 0,75 · 0,6724 + 0,25 · 0,3654 = 0,5957 tCO2e/MWh
2008 2009 2010 2011 2012 2013 2014Factor de Emisión [tCO2/GWh] 595,7 595,7 595,7 595,7 595,7 595,7 595,7Generación Anual [MWh] 376.127 376.127 376.127 376.127 376.127 376.127 376.127Reducción de emisiones [tCO2] 224.040 224.040 224.040 224.040 224.040 224.040 224.040Total de reducciones acumuladas [tCO2] 224.040 448.080 672.120 896.160 1.120.200 1.344.240 1.568.281
Table 20: Emission reductions.
Total cumulative reductions in for first crediting period will be: 1.568.281 tCO2.
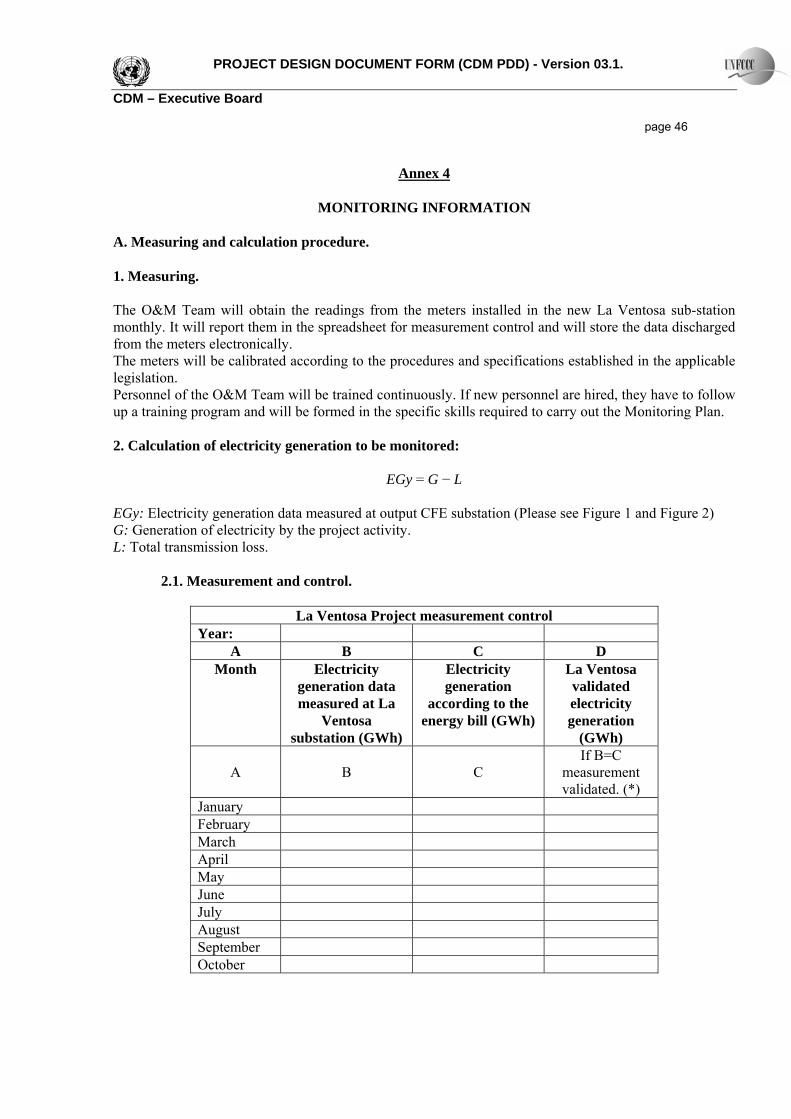
PROJECT DESIGN DOCUMENT FORM (CDM PDD) - Version 03.1. CDM – Executive Board page 46
Annex 4
MONITORING INFORMATION A. Measuring and calculation procedure. 1. Measuring. The O&M Team will obtain the readings from the meters installed in the new La Ventosa sub-station monthly. It will report them in the spreadsheet for measurement control and will store the data discharged from the meters electronically. The meters will be calibrated according to the procedures and specifications established in the applicable legislation. Personnel of the O&M Team will be trained continuously. If new personnel are hired, they have to follow up a training program and will be formed in the specific skills required to carry out the Monitoring Plan. 2. Calculation of electricity generation to be monitored:
EGy = G − L EGy: Electricity generation data measured at output CFE substation (Please see Figure 1 and Figure 2) G: Generation of electricity by the project activity. L: Total transmission loss.
2.1. Measurement and control.
La Ventosa Project measurement control Year:
A B C D Month Electricity
generation data measured at La
Ventosa substation (GWh)
Electricity generation
according to the energy bill (GWh)
La Ventosa validated electricity generation
(GWh)
A B C If B=C
measurement validated. (*)
January February March April May June July August September October
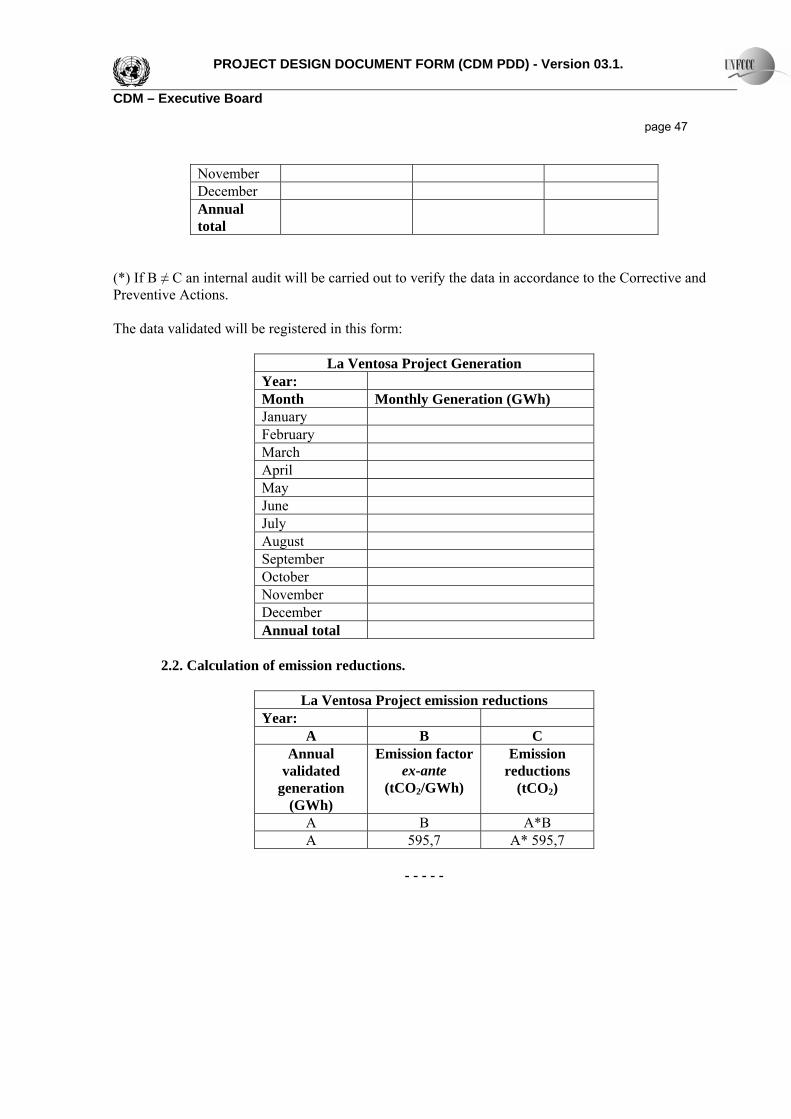
PROJECT DESIGN DOCUMENT FORM (CDM PDD) - Version 03.1. CDM – Executive Board page 47
November December Annual total
(*) If B ≠ C an internal audit will be carried out to verify the data in accordance to the Corrective and Preventive Actions. The data validated will be registered in this form:
La Ventosa Project Generation
Year: Month Monthly Generation (GWh) January February March April May June July August September October November December Annual total
2.2. Calculation of emission reductions.
La Ventosa Project emission reductions
Year: A B C
Annual validated
generation (GWh)
Emission factor ex-ante
(tCO2/GWh)
Emission reductions
(tCO2)
A B A*B A 595,7 A* 595,7
- - - - -
Related Documents