1 Patterns and drivers of herbivore diversity and invertebrate herbivory along elevational and land use gradients at Mt. Kilimanjaro, Tanzania Dissertation zur Erlangung des naturwissenschaftlichen Doktorgrades der Julius-Maximilians- Universität Würzburg vorgelegt von Henry Kenneth Njovu 03.08.1978 Würzburg, 2018

Welcome message from author
This document is posted to help you gain knowledge. Please leave a comment to let me know what you think about it! Share it to your friends and learn new things together.
Transcript
1
Patterns and drivers of herbivore diversity and invertebrate herbivory along elevational and
land use gradients at Mt. Kilimanjaro, Tanzania
Dissertation zur Erlangung des naturwissenschaftlichen Doktorgrades der Julius-Maximilians-
Universität Würzburg
vorgelegt von
Henry Kenneth Njovu
03.08.1978
Würzburg, 2018

2
Eingereicht am: ………………………………………..……..
Mitglieder der Promotionskommission:
Vorsitzender: ……………………………………………..
Prof. Dr. Ingolf Steffan-Dewenter
Gutachter: ………………………………………….….
Prof. Dr. Roland Brandl
Gutachter: ………………………………………….….
Tag des Promotionskolloquiums: ……………………….
Doktorurkunde ausgehändigt am: ………………….…….
3
Contents
Affidavit .............................................................................................................................................. 5
Summary ............................................................................................................................................. 6
Zusammenfassung ............................................................................................................................. 10
Chapter I: General Introduction ....................................................................................................... 14
Objectives and hypotheses of the studies .......................................................................................... 14
Mountain ecosystems ........................................................................................................................ 15
Elevational patterns of species diversity ........................................................................................... 15
Elevational patterns of herbivory ...................................................................................................... 16
Environmental (abiotic) factors changing with elevation .................................................................. 17
Land use changes along elevation gradients ..................................................................................... 18
Plant functional traits ......................................................................................................................... 18
Description of the study area ............................................................................................................. 19
Description of the study design ......................................................................................................... 20
Chapter II: Leaf traits mediate changes in invertebrate herbivory along broad environmental
gradients on Mt. Kilimanjaro, Tanzania. .......................................................................................... 22
Summary ........................................................................................................................................... 22
Introduction ....................................................................................................................................... 24
Methods ............................................................................................................................................. 28
Results ............................................................................................................................................... 35
Discussion ......................................................................................................................................... 40
Supplementary Information ............................................................................................................... 44
Chapter III: Temperature and resource diversity predict the diversity of phytophagous beetles
along elevation and land use gradients on Mt. Kilimanjaro............................................................ 46
Summary ........................................................................................................................................... 46
Introduction ....................................................................................................................................... 48
Methods ............................................................................................................................................. 51
Results ............................................................................................................................................... 58
Discussion ......................................................................................................................................... 62
Supplementary information ............................................................................................................... 69
Chapter IV: Primary productivity and habitat protection predict species richness and
community biomass of large mammals on Mt. Kilimanjaro. .......................................................... 72
Summary ........................................................................................................................................... 72
Introduction ....................................................................................................................................... 74
Methods ............................................................................................................................................. 78
Results ............................................................................................................................................... 84
Discussion ......................................................................................................................................... 95
Supplementary information ............................................................................................................. 100
4
Chapter V: General Discussion ........................................................................................................ 103
Patterns and drivers of community-level invertebrate herbivory (Chapter II) ................................ 103
Patterns and drivers of species diversity of phytophagous beetles (Chapter III) ............................ 105
Patterns and drivers of species richness and community biomass of large wild mammals (Chapter
IV) ................................................................................................................................................... 107
General conclusions ........................................................................................................................ 109
References .......................................................................................................................................... 111
Authors’ contributions ...................................................................................................................... 134
Acknowledgements ............................................................................................................................ 140
Publication list ................................................................................................................................... 142
Articles connected to the thesis ................................................................................................... 142
Other articles ............................................................................................................................... 142
Curriculum Vitae .............................................................................................................................. 145
5
Affidavit
Eidesstattliche Erklärung
Hiermit erkläre ich an Eides statt, dass ich, Henry Kenneth Njovu, die vorliegende Dissertation
mit dem Titel “Patterns and drivers of herbivore diversity and invertebrate herbivory along
elevational and land use gradients at Mt. Kilimanjaro, Tanzania” selbstständig und ohne Hilfe eines
kommerziellen Promotionsberaters angefertigt habe und dabei keine anderen, als die von mir
angegebenen Quellen und Hilfsmittel verwendet habe. Ich erkläre außerdem, dass die vorliegende
Dissertation weder in gleicher, noch in ähnlicher Form bereits in einem Prüfungsverfahren
vorgelegen hat. Des Weiteren habe ich außer den mit dem Zulassungsantrag urkundlich
vorgelegten Graden keine weiteren akademischen Grade erworben oder zu erwerben versucht.
Declaration
I, Henry Kenneth Njovu certify that the thesis entitled “Patterns and drivers of herbivore diversity
and invertebrate herbivory along elevational and land use gradients at Mt. Kilimanjaro, Tanzania”
results from my own work. I also certify that I did not receive any help or support from any
commercial consulting firm and that all sources and materials applied are listed and specified in
the thesis. Further to that, I certify that this thesis has not been submitted as part of another
examination process in similar or dissimilar form.
Würzburg, on Signature PhD-student
6
Summary
This thesis elucidates patterns and drivers of invertebrate herbivory, herbivore diversity, and
community-level biomass along elevational and land use gradients at Mt. Kilimanjaro,
Tanzania.
Chapter I provides background information on the response and predictor variables,
study system, and the study design. First, I give an overview of the elevational patterns of
species diversity/richness and herbivory published in the literature. The overview illuminates
existing debates on elevational patterns of species diversity/richness and herbivory. In
connection to these patterns, I also introduce several hypotheses and mechanisms put forward
to explain macroecological patterns of species richness. Furthermore, I explain the main
variables used to test hypotheses. Finally, I describe the study system and the study design used.
Chapter II explores the patterns of invertebrate herbivory and their underlying drivers
along extensive elevational and land use gradients on the southern slopes of Mt. Kilimanjaro. I
recorded standing leaf herbivory from leaf chewers, leaf miners and gall-inducing insects on 55
study sites located in natural and anthropogenic habitats distributed from 866 to 3060 meters
above sea level (m asl) on Mt. Kilimanjaro. Standing leaf herbivory was related to climatic
variables [mean annual temperature - (MAT) and mean annual precipitation - (MAP)], net
primary productivity (NPP) and plant functional traits (leaf traits) [specific leaf area (SLA),
carbon to nitrogen ratio (CN), and nitrogen to phosphorous ratio (NP)]. Results revealed an
unimodal pattern of total leaf herbivory along the elevation gradient in natural habitats. Findings
also revealed differences in the levels and patterns of herbivory among feeding guilds and
between anthropogenic and natural habitats. Changes in NP and CN ratios which were closely
linked to NPP were the strongest predictors of leaf herbivory. Our study uncovers the role of
leaf nutrient stoichiometry and its linkages to climate in explaining the variation in leaf
herbivory along climatic gradients.
7
Chapter III presents patterns and unravels direct and indirect effects of resource (food)
abundance (NPP), resource (food) diversity [Functional Dispersion (FDis)], resource quality
(SLA, NP, and CN rations), and climate variables (MAT and MAP) on species diversity of
phytophagous beetles. Data were collected from 65 study sites located in natural and
anthropogenic habitats distributed from 866 to 4550 m asl on the southern slopes of Mt.
Kilimanjaro. Sweep net and beating methods were used to collect a total of 3,186 phytophagous
beetles representing 21 families and 304 morphospecies. Two groups, weevils (Curculionidae)
and leaf beetles (Chrysomelidae) were the largest and most diverse families represented with
898 and 1566 individuals, respectively. Results revealed complex (bimodal) and dissimilar
patterns of Chao1-estimated species richness (hereafter referred to as species diversity) along
elevation and land use gradients. Results from path analysis showed that temperature and
climate-mediated changes in NPP had a significant positive direct and indirect effect on species
diversity of phytophagous beetles, respectively. The results also revealed that the effect of NPP
(via beetles abundance and diversity of food resources) on species diversity is stronger than that
of temperature. Since we found that factors affecting species diversity were intimately linked
to climate, I concluded that predicted climatic changes over the coming decades will likely alter
the species diversity patterns which we observe today.
Chapter IV presents patterns and unravels the direct and indirect effects of climate, NPP
and anthropogenic disturbances on species richness and community-level biomass of wild large
mammals which represent endothermic organisms and the most important group of vertebrate
herbivores. Data were collected from 66 study sites located in natural and anthropogenic
habitats distributed from 870 to 4550 m asl on the southern slopes of Mt. Kilimanjaro.
Mammals were collected using camera traps and used path analysis to disentangle the direct
and indirect effects of climatic variables, NPP, land use, land area, levels of habitat protection
and occurrence of domesticated mammals on the patterns of richness and community-level
biomass of wild mammals, respectively. Results showed unimodal patterns for species richness
8
and community-level biomass of wild mammals along elevation gradients and that the patterns
differed depending on the type of feeding guild. Findings from path analysis showed that net
primary productivity and levels of habitat protection had a strong direct effect on species
richness and community-level biomass of wild mammals whereas temperature had an
insignificant direct effect. Findings show the importance of climate-mediated food resources in
determining patterns of species richness of large mammals. While temperature is among key
predictors of species richness in several ectotherms, its direct influence in determining species
richness of wild mammals was insignificant. Findings show the sensitivity of wild mammals to
anthropogenic influences and underscore the importance of protected areas in conserving
biodiversity.
In conclusion, despite a multitude of data sets on species diversity and ecosystem
functions along broad climatic gradients, there is little mechanistic understanding of the
underlying causes. Findings obtained in the three studies illustrate their contribution to the
scientific debates on the mechanisms underlying patterns of herbivory and diversity along
elevation gradients. Results present strong evidence that plant functional traits play a key role
in determining invertebrate herbivory and species diversity along elevation gradients and that,
their strong interdependence with climate and anthropogenic activities will shape these patterns
in future. Additionally, findings from path analysis demonstrated that herbivore diversity,
community-level biomass, and herbivory are strongly influenced by climate (either directly or
indirectly). Therefore, the predicted climatic changes are expected to dictate ecological
patterns, biotic interactions, and energy and nutrient fluxes in terrestrial ecosystems in the
coming decades with stronger impacts probably occurring in natural ecosystems. Furthermore,
findings demonstrated the significance of land use effects in shaping ecological patterns. As
anthropogenic pressure is advancing towards more pristine higher elevations, I advocate
conservation measures which are responsive to and incorporate human dimensions to curb the
situation. Although our findings emanate from observational studies which have to take several

9
confounding factors into account, we have managed to demonstrate global change responses in
real ecosystems and fully established organisms with a wide range of interactions which are
unlikely to be captured in artificial experiments. Nonetheless, I recommend additional
experimental studies addressing the effect of top-down control by natural enemies on herbivore
diversity and invertebrate herbivory in order to deepen our understanding of the mechanisms
driving macroecological patterns along elevation gradients.
10
Zusammenfassung
In dieser Dissertation werden Muster und Determinanten von Herbivorendiversität, von
Herbivorieraten durch Invertebraten sowie die Diversität und Gesamtbiomasse von Säugetieren
entlang von Höhen- und Landnutzungsgradienten am Kilimandscharo (Tansania) untersucht.
Kapitel I liefert Hintergrundinformationen zu den betrachteten Variablen, dem
Untersuchungssystem und dem generellen Studiendesign: Zuerst fasse ich den aktuellen
Kenntnisstand über die Muster des Artenreichtums und der Herbivorie entlang von
Höhengradienten zusammen und erläutere in diesem Zusammenhang verschiedene
Hypothesen, die zur Erklärung von Gradienten des Artenreichtum herangezogen werden. Ich
erkläutere verschiedene Variablen, die zum Testen dieser Hypothesen erhoben wurden und
stelle dar, wie diese den Artenreichtum, die Herbivorieraten und die Biomasse beeinflussen
könnten. Anschließend beschreibe ich das Untersuchungssystem, sowie das generelle Design
der Studie.
In Kapitel II werden die Muster und Determinanten der Invertebratenherbivorie entlang
von Höhen- und Landnutzungsgradienten an den südlichen Hängen des Kilimandscharos
präsentiert. Auf insgesamt 55 Untersuchungsflächen, die sowohl natürliche als auch
anthropogen genutzte Habitate am Kilimandscharo in Höhenlagen zwischen 866 und 3060
Meter über Normalnull (m ü. NN) umfassten, wurden die Herbivorieraten ektophager,
minierender und gallbildener Insekten an Blättern erfasst. Die Blattherbivorie war sowohl mit
klimatischen Variablen [Jahresmitteltemperatur und mittlere Jahresniederschlagsmenge], der
Nettoprimärproduktivität (NPP) und mit funktionellen Blattmerkmalen von Pflanzen
[spezifische Blattfläche (SLA), Kohlenstoff (C) / Stickstoff (N)-Verhältnis, sowie N / Phosphor
(P)-Verhältnis] assoziiert. Die Gesamtherbivorie zeigte eine unimodale Verteilung über den
Höhengradienten, wurde aber sowohl von der Herbivorengilde, als auch vom Habitattyp
(natürlich versus anthropogen) beeinflusst. Das C/N-Verhältnis von Blättern war die stärkste
11
Determinante der Blattherbivorie und wurde selbst stark durch die NPP bestimmt.
Herbivorieraten sanken mit steigendem C/N-Verhältnis. Das C/N Verhältnis nahm mit
steigender NPP zu.- Letztere konnte fast vollständig durch Änderungen der mittleren
Jahrestemperatur (MAT) und des Jahresniederschlags (MAP) entlang des Höhengradienten
erklärt werden. Damit zeigt unsere Studie, dass sich durch klimatische Faktoren und Energie,
welche ihrerseits die Blattchemie beeinflussen und so Variationen in der Blattherbivorie entlang
großer Klimagradienten ergeben.
In Kapitel III werden die Muster im Artenreichtum phytophager Käfer entlang der
Höhen- und Landnutzungsgradienten untersucht und die direkten und indirekten Effekte von
klimatischen Faktoren (MAT, MAP), NPP und funktionellen Pflanzenmerkmalen (funktionelle
Dispersion, SLA, C/N - und N/P - Verhältnisse) auf diese Muster analysiert. Die
entsprechenden Daten wurden auf 65 Untersuchungsflächen, die sowohl natürliche als auch
anthropogene Habitate entlang eines Höhengradienten am Kilimandscharo von 866 bis 4550 m
ü. NN abdeckten, erhoben. Mittels Kescher wurden insgesamt 3186 phytophage Käfer aus 21
Familien gesammelt und in 304 Morphospezies eingeteilt. Der Artenreichtum phytophager
Käfer zeigte eine komplexe, zweigipflige Verteilung entlang der Höhen- und
Landnutzungsgradienten. Eine Pfadanalyse ergab, dass sowohl die MAT, als auch NPP
positiven direkte bzw. indirekte Effekt auf die Artendiversität phytophager Käfer hatte. Die
NPP war positiv mit der funktionellen Dispersion von Blattmerkmalen, ein Maß für die
Diversität der Nahrungsressourcen, korreliert. Letztere hatte einen positiven Effekt auf die
Diversität der Käfer. Die starken direkten und indirekten Effekte von Klima auf die Diversität
und Abundanz von phytophagen Käfern, lassen vermuten dass der Klimawandel in den
nächsten Dekaden großen Änderungen der Struktur von phytophagen Käfergemeinschaften
bewirken wird.
In Kapitel IV untersuchen wir den Effekt von Klima, NPP und anthropogener Störung
auf den Artenreichtum und die Gesamtbiomasse von Großwild. Dazu wurden auf 66
12
Untersuchungsflächen, welche natürliche und anthropogene Habitate in Höhenstufen zwischen
870 und 4550m ü. NN umfassten, Daten zum Artenreichtum un der Abundanz von Großwild
mittels Kamerafallen erfasst. Mittels einer Pfadanalyse wurden die direkten und indirekten
Effekte von klimatischen Variablen, NPP, Landnutzung, Größe und Schutzstatus der Flächen,
sowie der Präsenz von domestizierten Säugetieren auf den Artenreichtum und die Biomasse
von Großwild untersucht. Artenreichtum und Gesamtbiomasse dieser endothermen
Organismen zeigten eine unimodale Verteilung über den Höhengradienten. Verschiedene
Nahrungsgilden zeigten unterschiedliche Muster. Es konnte gezeigt werden, dass NPP und der
Schutzstatus der Fläche, aber nicht die Temperatur einen direkten, positiven Einfluss auf den
Artenreichtum und die Gesamtbiomasse des Großwildes hatte. Die vom Klima abhängige
Nahrungsressourcenverfügbarkeit ist also eine wichtige Determinante im Artenreichtum von
Großwild. Die Temperatur hingegen, die den Artenreichtum verschiedener ektothermer
Organismen entscheidend prägt, hatte keinen direkten Einfluss auf den Artenreichtum des
Großwildes Dafür reagiert das Großwild besonders sensibel auf anthropogene Einflüsse, was
wiederum die Wichtigkeit von Schutzgebieten unterstreicht.
Obwohl die Muster im Artenreichtum und in Ökosystemfunktionen entlang großer
klimatischer Gradienten bereits gut dokumentiert sind, ist das Wissen über die zu Grunde
liegenden Prozesse nach wie vor unzureichend. Mit meinen drei Studien über die Muster und
Determinanten der Herbivorendiversität, der Herbivorieraten und der Großwildbiomasse trage
ich somit zur Verbesserung des mechanistischen Verständnisses solcher makroökologischer
Muster bei. Wie die Pfadanalysen zeigten, wurden sowohl der Artenreichtum die Biomasse als
auch ökologische Prozesse direkt oder indirekt vom Klima beeinflusst. Es ist somit zu erwarten,
dass der vorhergesagte Klimawandel ökologische Muster, biotische Interaktionen, Energie- und
Nährstoffkreisläufe in terrestrischen Ökosystemen wesentlich umstrukturieren wird, wobei
natürliche Systeme wahrscheinlich besonders sensibel auf den Klimawandel reagieren werden.
Meine Ergebnisse demonstrieren auch den Einfluss von Landnutzung auf Artenreichtum und
13
ökologische Prozesse. Da der anthropogene Druck auf die natürlichen Ökosysteme des
Kilimandscharos immer weiter zunimmt, sollten objektive Biodiversitätsmaße implementiert
werden mit denen man Veränderungen in den Ökosystemen und in Ökosystemldienstleistungen
schnell detektieren kann. Meine Ergebnisse basieren auf Beobachtungsdaten, die von
bestimmten Nebenfaktoren im Feld beeinflusst werden können. Dennoch ist es mir gelungen
mit korrelativen Methoden, Organismen in ihrem biotischen und abiotischen
Interaktionsumfeld zu untersuchen – ein Szenario, welches in einem rein experimentellen
Aufbau in dieser Form wahrscheinlich nicht geschaffen werden kann. Über weiterführende
Experimente könnte jedoch zum Beispiel der Einfluss von Prädatoren auf die
Herbivorendiversität und Herbivorieraten quantifiziert werden, welches unser Verständnis über
die Determinanten makroökologischer Muster noch vertiefen würde.
14
Chapter I: General Introduction
Objectives and hypotheses of the studies
This thesis presents three important studies which in general elucidate patterns and drivers of
invertebrate herbivory, herbivore diversity and community-level biomass along elevational and
land use gradients at Mt. Kilimanjaro, Tanzania. The first study investigates patterns and drivers
of community-level standing invertebrate (leaf) herbivory (Chapter II). This study hinges on
four hypotheses which suggest that invertebrate (leaf) herbivory i) decline monotonically with
elevation due to temperature; ii) peaks at mid-elevations due to high net primary productivity;
iii) is highly influenced by leaf traits which vary with changing environmental conditions along
the elevational gradient, and iv) declines with increased intensity of human land use. The second
study investigates patterns and drivers of species diversity of phytophagous beetles (Chapter
III). The study tests three hypotheses which suggest that diversity of phytophagous beetles i)
peaks at mid-elevations due to high climate-mediated net primary productivity (i.e. resources
abundance); ii) declines monotonically with elevation due to temperature-mediated foraging
activity and speciation and iii) peaks at mid-elevation due to ambient environmental conditions
which resources diversity and species coexistence. The third study investigates patterns and
drivers of species richness and community-level biomass of large wild mammals (Chapter IV).
The study tests four hypotheses which suggest that species richness and biomass of wild
mammals i) correlate positively with net primary productivity which peaks at mid-elevations,
ii) are positively correlated with climate-mediated net primary productivity (indirectly) and
metabolic rate (directly), iii) decline with elevation due to decreased size of the available land
area, and iv) increase with the level of habitat protection.
15
Mountain ecosystems
Mountains occupy approximately 12% of the earth’s land surface (Körner 2007), they harbor
extremely high biodiversity and provide ecosystem services to billion inhabitants in the world
(Quintero and Jetz 2018, Woodwell 2004, Payne et al. 2017). Mountains also serve as hotspots
of biological diversity and centers of endemism (Barthlott and al. 1996, Merckx et al. 2015). In
tropical regions, it is not surprising to find mountains with several climatic and ecological zones
of the globe compressed over a short horizontal distance (Körner 2000). Despite their
importance, mountains have been subject to land use and climatic changes (Nogués-Bravo et
al. 2008, Payne et al. 2017). However, the magnitude of the impact is not uniformly distributed
along elevation gradients because lowlands often receive more impacts than the mid-elevations
(Nogués-Bravo et al. 2008).
Elevational patterns of species diversity
Mountains provide useful elevation gradients which serve as a model template for testing
hypotheses related to broad-scale patterns of species richness (Lomolino 2001, Rahbek and
Graves 2001, McCain and Grytnes 2010). In the past, it was claimed that species richness
declines monotonically from low to high elevations reflecting the latitudinal decline in species
richness from the equator to the poles (Allen et al. 2002, Körner 2007). However, it has now
been realized that several patterns of species richness exist (Rahbek 1995, McCain and Grytnes
2010, Rahbek 2005). Their understanding (Rowe 2009, Körner 2007) is an increasing challenge
as an understanding of diversity patterns along broad climate gradients may shed light on the
consequences of ongoing global climatic changes (Vitousek et al. 1997). Some of the factors
accounting for the contemporary lack of consensus on the general pattern of elevational species
diversity include variation in spatial scale attributed by sampling regimes and geographical area
covered (Rahbek 2005, Nogués-Bravo et al. 2008), taxonomic group and geographic region
being studied (Peters et al. 2016, McCain and Grytnes 2010), topography complexity (Werner
16
and Homeier 2015, Thormann et al. 2018), presence of local or regional characteristics which
are not related to altitude such as anthropogenic disturbances and drought (Körner 2007). So
far, several dissimilar elevational patterns of species richness have been reported (Novillo and
Ojeda 2014, Peters et al. 2016, Thormann et al. 2018), nevertheless, a monotonic decline and
the unimodal “hump-shaped” patterns are well documented (Rahbek 2005, Yu et al. 2013).
Several hypotheses and mechanisms have been proposed to explain patterns and drivers of
species richness in mountain ecosystems, respectively (Peters et al. 2016). Most often, the
proposed hypotheses and mechanisms are linked to climatic factors such as temperature and
precipitation (Brown et al. 2004, Peters et al. 2016), spatial factors (Rahbek 1997, Colwell et
al. 2004, McCain and Grytnes 2010), ecological processes such as primary productivity and
herbivory (Rowe 2009), and evolutionary and historical processes (Li et al. 2009, McCain and
Grytnes 2010, Yu et al. 2013).
Elevational patterns of herbivory
In contrast to elevational gradients of species richness, elevational gradients of insect herbivory
have been rarely documented in the ecological and evolutionary literature (Galmán et al. 2018).
To date, no consensus has been reached on the general patterns of herbivory along elevation
gradients. At first, it was claimed that herbivore pressure and herbivory decline monotonically
from low to high elevations (Andrew et al. 2012). But accumulating evidence suggests that
there is no uniform elevational pattern of herbivory (Galmán et al. 2018). Some of the potential
sources of variations in elevational patterns of herbivory include differences in local
characteristics of the mountain, plant growth form (Galmán et al. 2018) and feeding guilds
under investigation (Garibaldi et al. 2011) as well as differences in the way herbivory is
measured (Anstett et al. 2016). The level of herbivory is influenced by both bottom-up and top-
down controls (Castagneyrol et al. 2017, Vidal and Murphy 2018). Bottom-up controls include
resources availability such as water and soil nutrients (Coley et al. 1985), plant defense such as
17
phenolic compounds, primary productivity and plant nutritional traits such as leaf phosphorous
and nitrogen concentration (Abdala-Roberts et al. 2016) whereas top-down controls
encompasses the effect of predators and parasitoids on herbivores (Vidal and Murphy 2018).
There are also several environmental (biotic and abiotic) factors (Bale et al. 2002, Abdala-
Roberts et al. 2016) and land use practices which modulate the relative importance of the bottom
and top-down controls on herbivores abundance and ultimately herbivory.
Environmental (abiotic) factors changing with elevation
Elevation gradients facilitate the acquisition of useful information which provides explanations
for many ecological questions as it links biotic and abiotic factors in mountain ecosystems
(McCain and Grytnes 2010). Abiotic factors such as air temperature, precipitation in the form
of rain or snow, wind speed and atmospheric pressure are considered to be critical determinants
of species distribution, diversity and ecosystem processes in mountain ecosystems (Hodkinson
2005, Merrill et al. 2008, McCain and Grytnes 2010). Along elevation gradients, some abiotic
factors in particular atmospheric pressure and partial pressure of atmospheric gases and
temperature change predictably with elevation while others such as precipitation do not change
predictably with elevation (Körner 2007). It is reported that temperature and an atmospheric
pressure of atmospheric gases decline by ~ 5.5 ºC and ~11% per kilometer gain in altitude,
respectively (Körner 2007, Barry 1981). On the other hand, precipitation shows no clear pattern
(Körner 2003, 2007). Abiotic factors act synergistically to produce unique environmental
conditions within which mountain organisms reproduce and survive (Hodkinson 2005). The
unique environment created by various abiotic factors can potentially limit not only species
distribution and colonization but also influence species diversity, species interactions and
ecological processes (Hodkinson 2005). As the world is experiencing climatic changes
(Vitousek et al. 1997, Bale et al. 2002), abiotic factors are expected to become the strongest
predictors of species range shifts (Chen et al. 2011), species distribution (Parmesan 1996,
18
Merrill et al. 2008), species diversity and ecosystem processes in the future (Sala et al. 2000).
However, the extent to which and the mechanisms through which species and ecosystem
processes will be affected by the anticipated climatic changes remains poorly understood.
Mountains provide a feasible natural experiment to test the influence of climate on ecosystem
function (space for time approach) (Körner 2007) and thereby help to predict the consequences
of climatic changes.
Land use changes along elevation gradients
Human land use and associated activities have often been reported to alter the earth and affect
various ecosystems (Vitousek et al. 1997, Sala et al. 2000, Foster et al. 2003). Anthropogenic
activities can independently or synergistically pose either a direct effect through land
transformation, alteration of biogeochemistry and biotic composition, shaping species
interactions, changing ecosystem structure and functions or indirect by changing climate
(Vitousek et al. 1997, Foster et al. 2003, Jamieson et al. 2012). Mountain ecosystems are also
not immune to anthropogenic influences (Nogués-Bravo et al. 2008, Payne et al. 2017). Reports
show that foothills and lowland areas of several mountains (including Mt. Kilimanjaro) have
been encroached by human settlements and their natural habitats have been transformed to
agricultural fields and grazing land (Hemp 2006b, Kuppler et al. 2015). Empirical evidence also
suggests that anthropogenic influences have now advanced to higher elevations shaping biota
above the timberline zone through grazing and anthropogenic fire (Nogués-Bravo et al. 2008).
Since mountains are hotspots of biodiversity (Quintero and Jetz 2018), the increasing land use
intensification which is driven by the growing human population and associated demands are
likely to affect species diversity, biomass and ecological processes (Hemp 2006c).
Plant functional traits
Plant functional trait refers to any morphological, anatomical, biochemical, physiological,
structural, phenological or behavioral properties measured at an individual level which affects
19
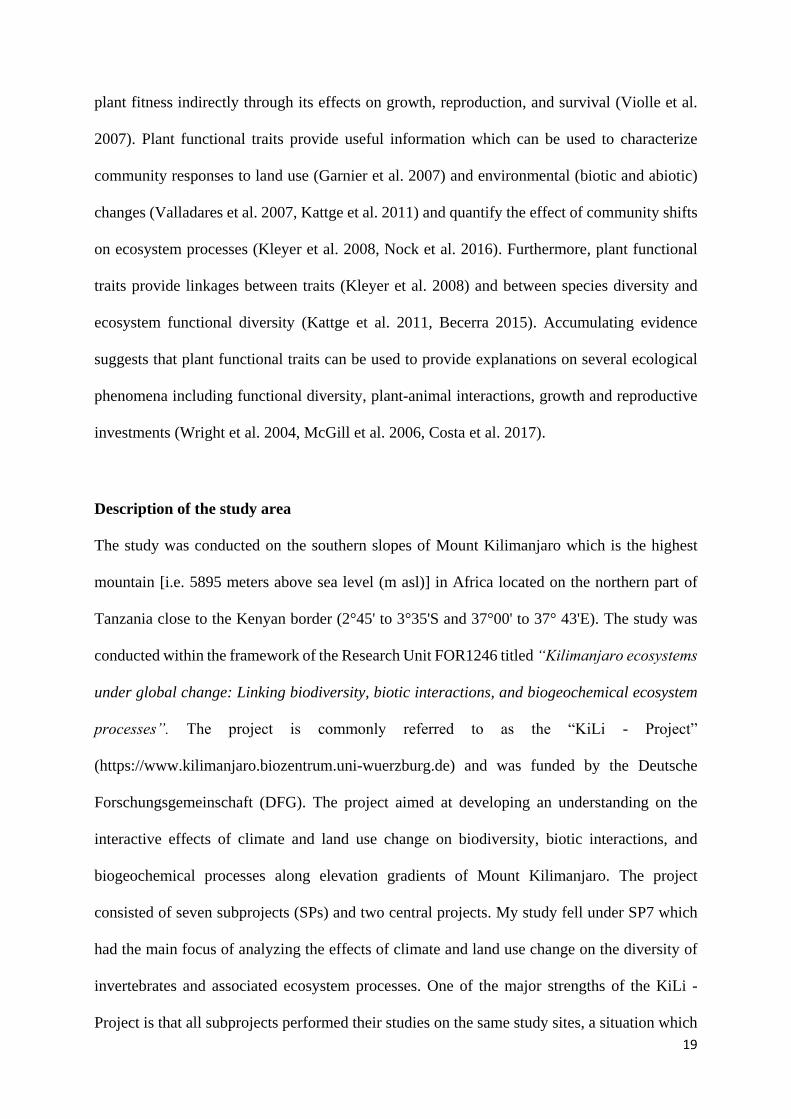
plant fitness indirectly through its effects on growth, reproduction, and survival (Violle et al.
2007). Plant functional traits provide useful information which can be used to characterize
community responses to land use (Garnier et al. 2007) and environmental (biotic and abiotic)
changes (Valladares et al. 2007, Kattge et al. 2011) and quantify the effect of community shifts
on ecosystem processes (Kleyer et al. 2008, Nock et al. 2016). Furthermore, plant functional
traits provide linkages between traits (Kleyer et al. 2008) and between species diversity and
ecosystem functional diversity (Kattge et al. 2011, Becerra 2015). Accumulating evidence
suggests that plant functional traits can be used to provide explanations on several ecological
phenomena including functional diversity, plant-animal interactions, growth and reproductive
investments (Wright et al. 2004, McGill et al. 2006, Costa et al. 2017).
Description of the study area
The study was conducted on the southern slopes of Mount Kilimanjaro which is the highest
mountain [i.e. 5895 meters above sea level (m asl)] in Africa located on the northern part of
Tanzania close to the Kenyan border (2°45' to 3°35'S and 37°00' to 37° 43'E). The study was
conducted within the framework of the Research Unit FOR1246 titled “Kilimanjaro ecosystems
under global change: Linking biodiversity, biotic interactions, and biogeochemical ecosystem
processes”. The project is commonly referred to as the “KiLi - Project”
(https://www.kilimanjaro.biozentrum.uni-wuerzburg.de) and was funded by the Deutsche
Forschungsgemeinschaft (DFG). The project aimed at developing an understanding on the
interactive effects of climate and land use change on biodiversity, biotic interactions, and
biogeochemical processes along elevation gradients of Mount Kilimanjaro. The project
consisted of seven subprojects (SPs) and two central projects. My study fell under SP7 which
had the main focus of analyzing the effects of climate and land use change on the diversity of
invertebrates and associated ecosystem processes. One of the major strengths of the KiLi -
Project is that all subprojects performed their studies on the same study sites, a situation which
20
permitted amalgamation of many datasets; which is critical for developing a broad
understanding of the consequences of climate and land use changes along elevation gradients
of Mt. Kilimanjaro. Due to this setting, we were able to incorporate data on climatic variables
from SP 1-3 and plant functional traits from SP 4 and 5.
The mean annual temperature (MAT) of the area declines quasi-linearly with elevation
(lapse rate of 0.56°C per 100 m); at the foothills, it is ca. 25°C and the temperature declines to
- 8°C at the peak of the mountain (Appelhans et al. 2016). Conversely, mean annual
precipitation (MAP) in terms of rainfall is bimodal with periods of long and heavy rains
between March and May and short rains around November (Hemp 2008). Annual precipitation
peaks with ~2700 mm at mid-elevations in the montane forest belt (Appelhans et al. 2016),
while in the lowlands it ranges from ca. 500-900 mm and ca. 200 mm in the alpine zone (Hemp
2006a).
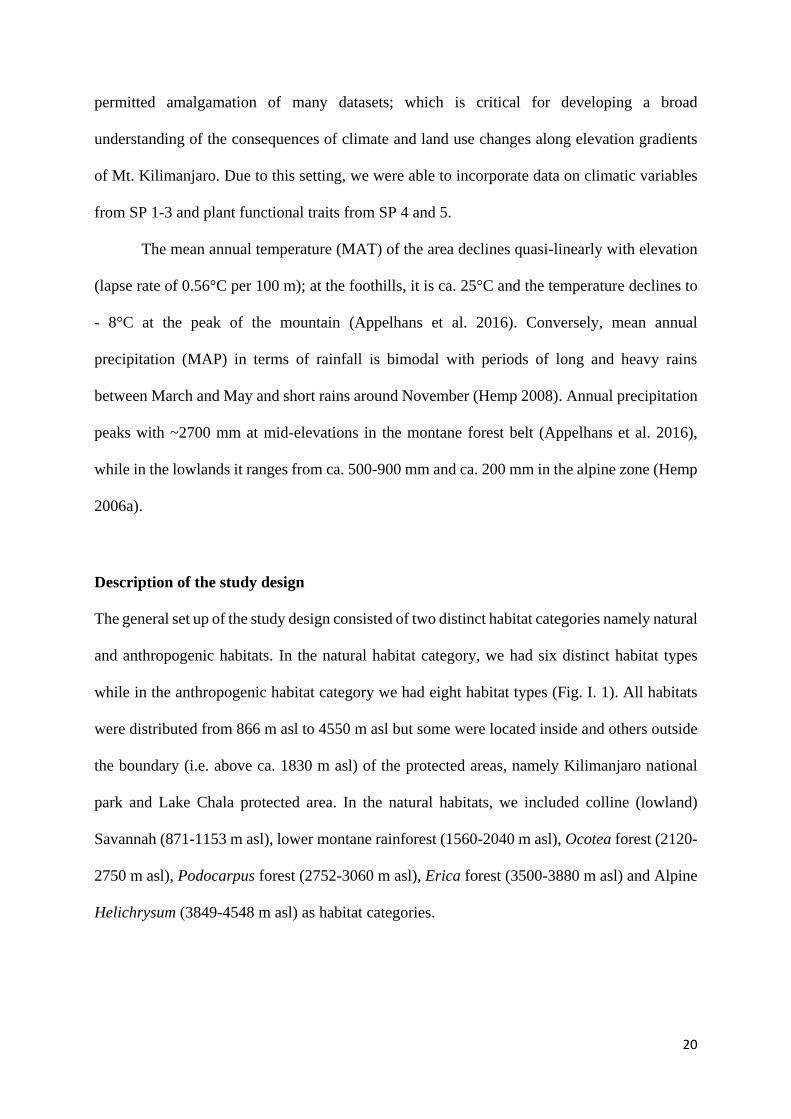
Description of the study design
The general set up of the study design consisted of two distinct habitat categories namely natural
and anthropogenic habitats. In the natural habitat category, we had six distinct habitat types
while in the anthropogenic habitat category we had eight habitat types (Fig. I. 1). All habitats
were distributed from 866 m asl to 4550 m asl but some were located inside and others outside
the boundary (i.e. above ca. 1830 m asl) of the protected areas, namely Kilimanjaro national
park and Lake Chala protected area. In the natural habitats, we included colline (lowland)
Savannah (871-1153 m asl), lower montane rainforest (1560-2040 m asl), Ocotea forest (2120-
2750 m asl), Podocarpus forest (2752-3060 m asl), Erica forest (3500-3880 m asl) and Alpine
Helichrysum (3849-4548 m asl) as habitat categories.
21
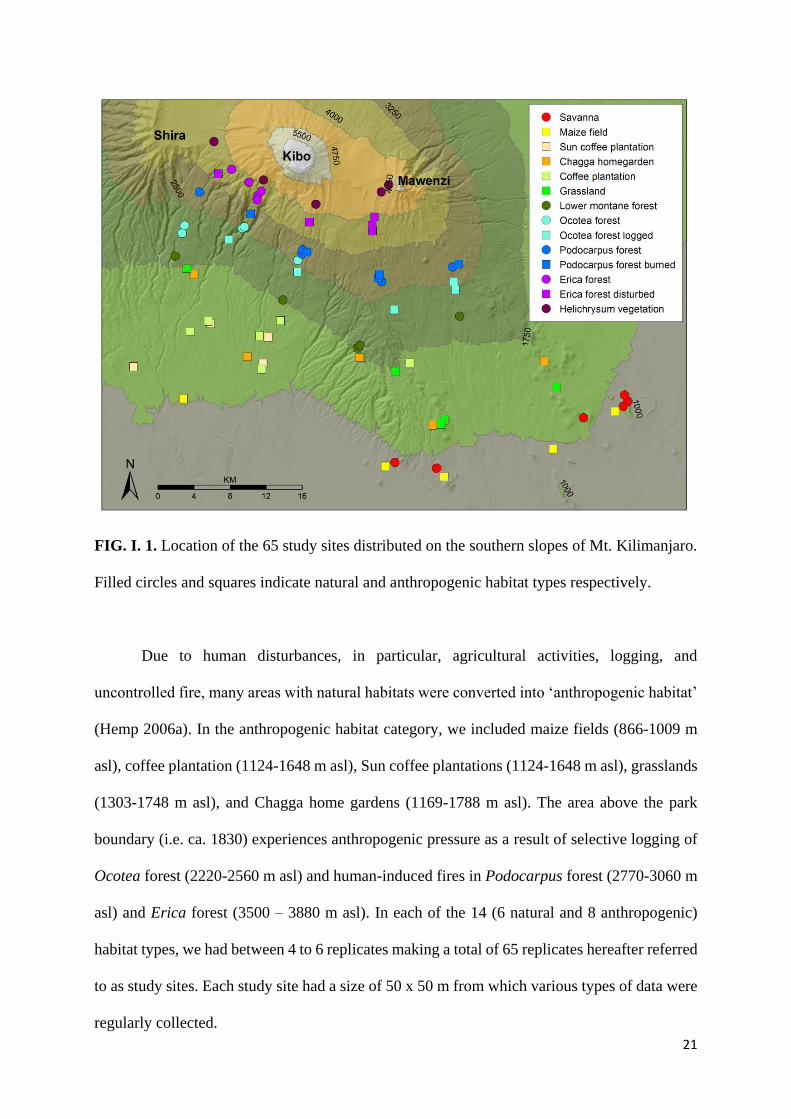
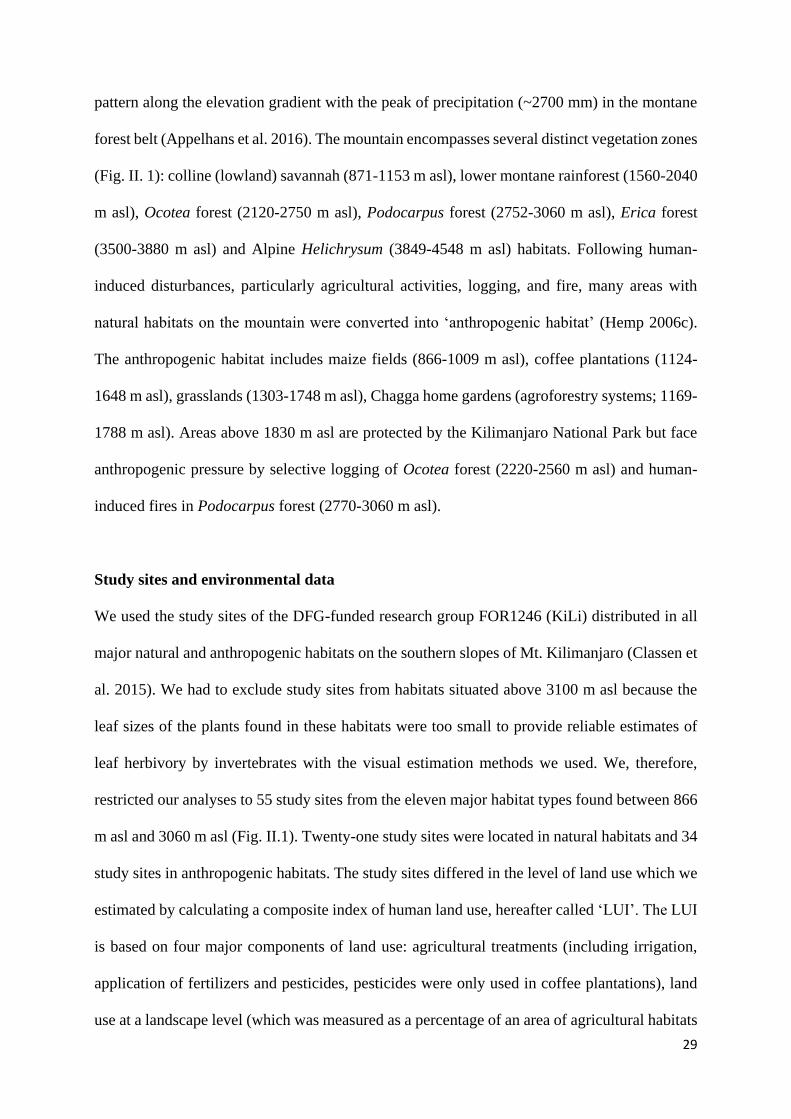
FIG. I. 1. Location of the 65 study sites distributed on the southern slopes of Mt. Kilimanjaro.
Filled circles and squares indicate natural and anthropogenic habitat types respectively.
Due to human disturbances, in particular, agricultural activities, logging, and
uncontrolled fire, many areas with natural habitats were converted into ‘anthropogenic habitat’
(Hemp 2006a). In the anthropogenic habitat category, we included maize fields (866-1009 m
asl), coffee plantation (1124-1648 m asl), Sun coffee plantations (1124-1648 m asl), grasslands
(1303-1748 m asl), and Chagga home gardens (1169-1788 m asl). The area above the park
boundary (i.e. ca. 1830) experiences anthropogenic pressure as a result of selective logging of
Ocotea forest (2220-2560 m asl) and human-induced fires in Podocarpus forest (2770-3060 m
asl) and Erica forest (3500 – 3880 m asl). In each of the 14 (6 natural and 8 anthropogenic)
habitat types, we had between 4 to 6 replicates making a total of 65 replicates hereafter referred
to as study sites. Each study site had a size of 50 x 50 m from which various types of data were
regularly collected.
22
Chapter II: Leaf traits mediate changes in invertebrate herbivory along broad
environmental gradients on Mt. Kilimanjaro, Tanzania.
Summary
1. Temperature, primary productivity, plant functional traits, and herbivore
abundances are considered key predictors of leaf herbivory but their direct and
indirect contributions to community-level herbivory are not well understood along
broad climatic gradients.
2. Here we determined elevational herbivory patterns and used a path analytical
approach to disentangle the direct and indirect effects of climate, land use and plant
functional traits on community-level invertebrate herbivory along the extensive
elevational and land use gradients at Mt. Kilimanjaro, Tanzania.
3. We recorded standing leaf herbivory of leaf chewers, leaf miners, and leaf gallers
on 55 study sites distributed in natural and anthropogenic habitats along a 3060 m
elevation gradient. We then determined total and guild-specific community-level
herbivory patterns and related the total community-level herbivory to climate
(temperature and precipitation), net primary productivity, plant functional traits
(specific leaf area, CN and NP ratios) and herbivore abundances.
4. Leaf herbivory ranged from 5 % to 11 % along the elevation gradient. Total leaf
herbivory showed a unimodal pattern in natural habitats but a strongly contrasting
bimodal pattern in anthropogenic habitats. We also detected some variation in the
patterns of leaf herbivory along environmental gradients across feeding guilds with
leaf chewers showing disproportionally large herbivory. Path analyses indicated that

23
the variation in leaf herbivory was mainly driven by changes in leaf CN and NP
ratios which were closely linked to changes in NPP.
5. Our study elucidates the strong role of leaf nutrient stoichiometry and its linkages to
climate and energy for explaining the variation in leaf herbivory along broad
climatic gradients. Furthermore, the study suggests that climatic changes and
nutrient inputs in the course of land use change may alter leaf herbivory and
consequently energy and nutrient fluxes in terrestrial habitats.
24
Introduction
Herbivory is an important antagonistic interaction between plants and animals which has
received a considerable attention in the ecological and evolutionary literature (Cebrian and
Lartigue 2004, Turcotte Martin M. et al. 2014, Rossetti et al. 2017). Herbivory serves as a
conduit through which chemical energy from autotrophs is made available to the entire food
web (Agrawal 2004), modulates nutrient cycling and primary productivity (Zavala et al. 2013,
Metcalfe et al. 2014), plant evolution (Boege 2005) and plant fitness (Lehndal and Ågren 2015).
Invertebrate herbivores are often specialized and cause a relatively low but prolonged damage
to plants (due to their small body and bite sizes relative to the plant size) compared to vertebrate
herbivores (Kotanen and Rosenthal 2000). In agriculture, invertebrate herbivory reduces
economic yields (Zavala et al. 2013), which in Africa alone, causes annual economic damages
of more than US$ 4 billion (Oerke et al. 1994). The effects of and response to invertebrate
herbivores and herbivory strongly vary along environmental gradients (Poorter et al. 2004,
Metcalfe et al. 2014). While the understanding of patterns of invertebrate herbivory is of large
importance for both basic and applied ecology (Bigger and Marvier 1998), the major factors
causing variation in the levels of herbivory among plants across broad environmental gradients
remain poorly understood. Knowledge of the broad-scale drivers of herbivory is, however, of
high value to quantify the environmental level of herbivory and to predict changes in the
functionality of ecosystems in a changing world.
The amount of plant biomass consumed by herbivores is a function of their abundance
(Garibaldi et al. 2011) and feeding rate which is partly associated with feeding pattern and diet
breadth (Schmitz 2008, Moreira et al. 2017). Abundance and feeding rate are constrained by a
complex interplay of climate and plant functional traits which are associated with plant defense
and food quality (Pellissier et al. 2016, Galmán et al. 2018). Climatic factors (e.g. precipitation)
and availability of resources such as soil nitrogen, phosphorous and water influence net primary
25
productivity and the ability of plants to defend against herbivory (Coley et al. 1985). For
instance, herbivory is expected to be higher in resource-rich and productive habitats than in
resource-poor and less productive habitats (Coley et al. 1985). Temperature may also influence
herbivory and herbivore abundance by influencing invertebrates' metabolic activities and per
capita consumption rates (Vucic-Pestic et al. 2011, Ehnes et al. 2011). Plant functional traits
(leaf traits) such as specific leaf area, life lifespan (Zhang et al. 2017), concentrations of leaf
carbon, nitrogen and phosphorous as well as the ratios of these elements determine leaf
palatability, influence foraging decisions by herbivores and thus regulate susceptibility of plants
to herbivory (Schädler et al. 2003, Behmer 2009, Paul et al. 2012, Leingärtner et al. 2014b).
Furthermore, climate- and land use-driven changes in the relative importance of top-down
control by natural enemies to bottom-up control might affect invertebrate herbivore
communities and thus herbivory (Martin et al. 2013, Péré et al. 2013, Tylianakis and Morris
2017).
Human land use and associated anthropogenic activities like agriculture or forestry, changes
in animal populations, and modification of natural disturbance regimes, in particular, fire have
repeatedly been reported to affect various ecosystem processes (Foster et al. 2003). These
anthropogenic activities have either independently or synergistically affected ecosystem
structure, composition, functions, soil properties, carbon and nitrogen cycles, and species
interactions (Foster et al. 2003, Tylianakis et al. 2008). Herbivory is influenced in various ways
by anthropogenic activities. For instance, agricultural practices may influence herbivory
directly by manipulating invertebrate abundance (both invertebrate herbivores and their natural
enemies) through the application of insecticides or indirectly by altering soil properties through
the application of fertilizers (Garibaldi et al. 2011, Gossner et al. 2014, Gagic et al. 2017). The
application of chemical fertilizer alters soil nutrient content (soil nitrogen and phosphorous)
which in turn influence leaf palatability and ultimately the amount of herbivory (Poorter et al.
2004). Conversely, it has been reported that fire can potentially trigger loss of nitrogen from
26
the soil through volatilization (Foster et al. 2003). Linked to the aforementioned factors, there
are several contrasting patterns of herbivory along elevation (and even latitude) gradient
(Anstett et al. 2016). A monotonic decline in herbivory with increasing elevation is perhaps the
pattern with most empirical support (Galmán et al. 2018). Evidence suggests that the monotonic
pattern is often observed when herbivory is related to temperature and stable climates along an
elevation gradient (Rasmann et al. 2014c, Galmán et al. 2018). However, alternative patterns
occur particularly when factors such as herbivore feeding guilds (Anstett et al. 2014, Galmán
et al. 2018), species and functional composition (Anstett et al. 2016), biogeographic zones
(Kozlov et al. 2015), scale effects (truncated vs. full-scale elevation gradients) (Nogués-Bravo
et al. 2008), shifts in vegetation types and position of more limiting conditions in relation to
elevation (e.g. drought or arid conditions in lowlands) are taken into account (Rasmann et al.
2014a, Moreira et al. 2017).
Here we used a path analytical approach to disentangle the direct and indirect effects of
climate, land use and plant functional traits on community-level invertebrate herbivory along
the extensive elevational and land use gradients at Mt. Kilimanjaro, Tanzania. Mountains
provide ideal conditions to study and test ecological hypotheses regarding broad scale gradients
of ecosystem functions and biotic interactions (Sundqvist et al. 2013, Hoiss et al. 2015, Roslin
et al. 2017). This is particularly true for large tropical mountains that allow standardized field
studies along extensive climatic gradients at feasible spatial scales. Specifically, we tested the
following non-exclusive hypotheses:
i. Leaf herbivory is related to temperature and shows a monotonic decline with increasing
elevation.
ii. Leaf herbivory is related to net primary productivity and thus peaks at mid elevations.

27
iii. The elevational pattern of leaf herbivory is mainly influenced by leaf traits which vary
with changing environmental conditions along the elevational gradient.
iv. Herbivore abundance and herbivory depend on the types and intensity of human land
use. We expect herbivory to be lower in extensively managed, mixed anthropogenic
habitats than in intensively managed agricultural habitats.
28
Methods
Study region
The study was conducted on the southern slopes of Mt. Kilimanjaro, Tanzania. Mount
Kilimanjaro is a dormant stratovolcano which is located in the northeastern part of Tanzania
contiguous to the Kenyan border (2°45' to 3°35'S and 37°00' to 37° 43'E, Fig. II. 1). Mt.
Kilimanjaro has a northwest-southeast diameter of ~90 km and rises from the savannah plains
at ~700 m elevation to a snow-clad summit at 5895 m above sea level (asl). The mean annual
temperature decreases quasi-linearly with elevation (lapse rate of 0.56°C per 100 m) starting
with 25°C at the foothills and decreasing to - 8°C at the top of the mountain (Appelhans et al.
2016).
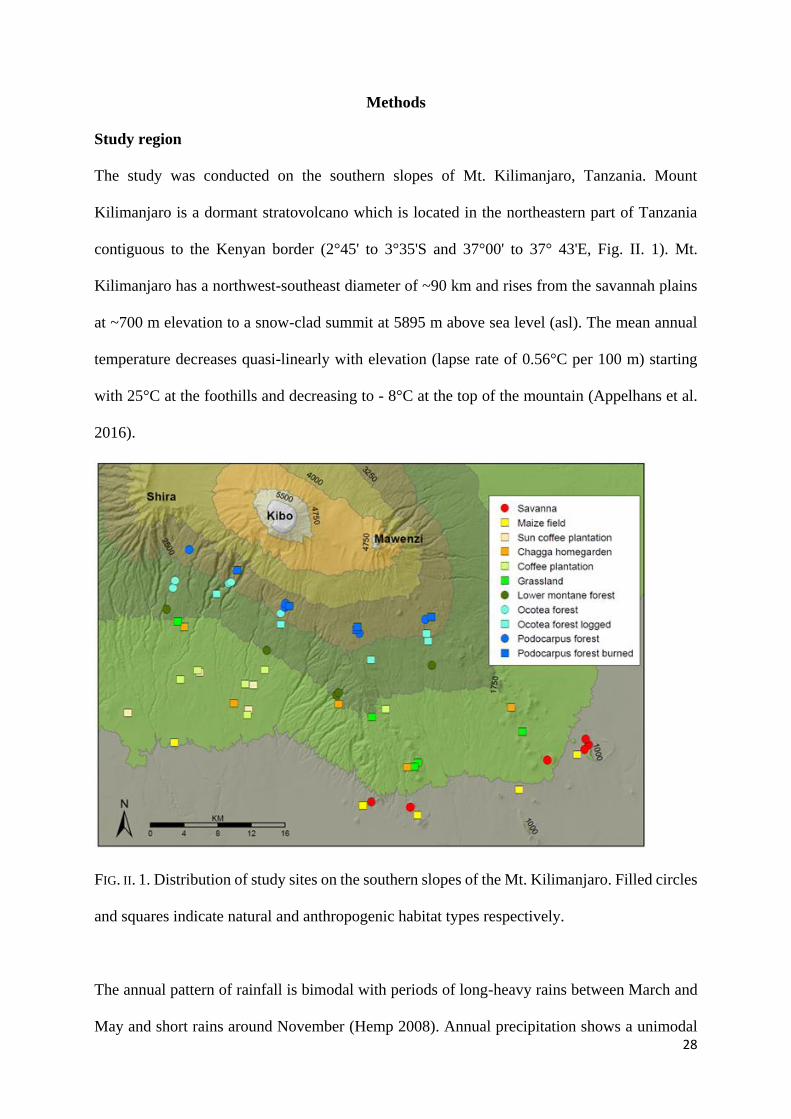
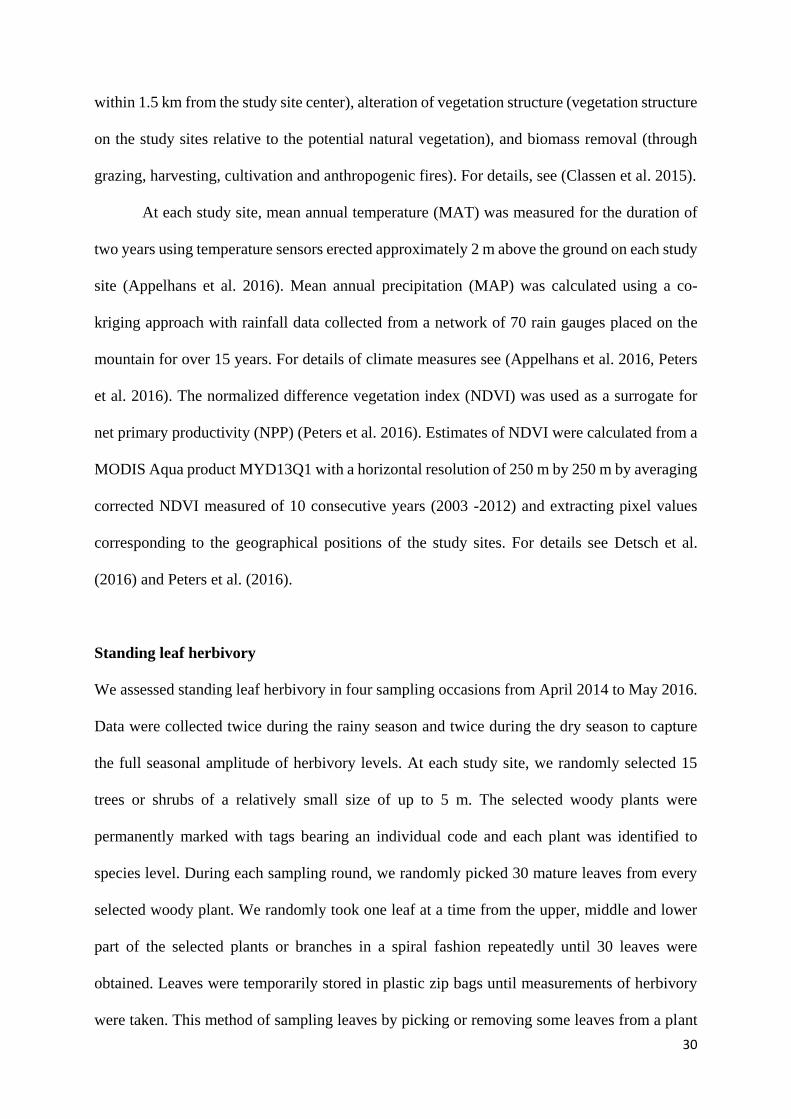
FIG. II. 1. Distribution of study sites on the southern slopes of the Mt. Kilimanjaro. Filled circles
and squares indicate natural and anthropogenic habitat types respectively.
The annual pattern of rainfall is bimodal with periods of long-heavy rains between March and
May and short rains around November (Hemp 2008). Annual precipitation shows a unimodal
29
pattern along the elevation gradient with the peak of precipitation (~2700 mm) in the montane
forest belt (Appelhans et al. 2016). The mountain encompasses several distinct vegetation zones
(Fig. II. 1): colline (lowland) savannah (871-1153 m asl), lower montane rainforest (1560-2040
m asl), Ocotea forest (2120-2750 m asl), Podocarpus forest (2752-3060 m asl), Erica forest
(3500-3880 m asl) and Alpine Helichrysum (3849-4548 m asl) habitats. Following human-
induced disturbances, particularly agricultural activities, logging, and fire, many areas with
natural habitats on the mountain were converted into ‘anthropogenic habitat’ (Hemp 2006c).
The anthropogenic habitat includes maize fields (866-1009 m asl), coffee plantations (1124-
1648 m asl), grasslands (1303-1748 m asl), Chagga home gardens (agroforestry systems; 1169-
1788 m asl). Areas above 1830 m asl are protected by the Kilimanjaro National Park but face
anthropogenic pressure by selective logging of Ocotea forest (2220-2560 m asl) and human-
induced fires in Podocarpus forest (2770-3060 m asl).
Study sites and environmental data
We used the study sites of the DFG-funded research group FOR1246 (KiLi) distributed in all
major natural and anthropogenic habitats on the southern slopes of Mt. Kilimanjaro (Classen et
al. 2015). We had to exclude study sites from habitats situated above 3100 m asl because the
leaf sizes of the plants found in these habitats were too small to provide reliable estimates of
leaf herbivory by invertebrates with the visual estimation methods we used. We, therefore,
restricted our analyses to 55 study sites from the eleven major habitat types found between 866
m asl and 3060 m asl (Fig. II.1). Twenty-one study sites were located in natural habitats and 34
study sites in anthropogenic habitats. The study sites differed in the level of land use which we
estimated by calculating a composite index of human land use, hereafter called ‘LUI’. The LUI
is based on four major components of land use: agricultural treatments (including irrigation,
application of fertilizers and pesticides, pesticides were only used in coffee plantations), land
use at a landscape level (which was measured as a percentage of an area of agricultural habitats
30
within 1.5 km from the study site center), alteration of vegetation structure (vegetation structure
on the study sites relative to the potential natural vegetation), and biomass removal (through
grazing, harvesting, cultivation and anthropogenic fires). For details, see (Classen et al. 2015).
At each study site, mean annual temperature (MAT) was measured for the duration of
two years using temperature sensors erected approximately 2 m above the ground on each study
site (Appelhans et al. 2016). Mean annual precipitation (MAP) was calculated using a co-
kriging approach with rainfall data collected from a network of 70 rain gauges placed on the
mountain for over 15 years. For details of climate measures see (Appelhans et al. 2016, Peters
et al. 2016). The normalized difference vegetation index (NDVI) was used as a surrogate for
net primary productivity (NPP) (Peters et al. 2016). Estimates of NDVI were calculated from a
MODIS Aqua product MYD13Q1 with a horizontal resolution of 250 m by 250 m by averaging
corrected NDVI measured of 10 consecutive years (2003 -2012) and extracting pixel values
corresponding to the geographical positions of the study sites. For details see Detsch et al.
(2016) and Peters et al. (2016).
Standing leaf herbivory
We assessed standing leaf herbivory in four sampling occasions from April 2014 to May 2016.
Data were collected twice during the rainy season and twice during the dry season to capture
the full seasonal amplitude of herbivory levels. At each study site, we randomly selected 15
trees or shrubs of a relatively small size of up to 5 m. The selected woody plants were
permanently marked with tags bearing an individual code and each plant was identified to
species level. During each sampling round, we randomly picked 30 mature leaves from every
selected woody plant. We randomly took one leaf at a time from the upper, middle and lower
part of the selected plants or branches in a spiral fashion repeatedly until 30 leaves were
obtained. Leaves were temporarily stored in plastic zip bags until measurements of herbivory
were taken. This method of sampling leaves by picking or removing some leaves from a plant
31
for leaf herbivory estimation is referred to as a discrete sampling method which yields a type
of herbivory known as standing herbivory or point herbivory (Lowman 1984, Anstett et al.
2016). Although the method underestimates herbivory as it does not capture completely
defoliated leaves and herbivory over time (i.e. cumulative herbivory) (Anstett et al. 2016), it is
a relatively fast, simple, accurate and frequently used method in large-scale studies (Anstett et
al. 2016). Individual-level leaf herbivory was quantified visually by estimating the percentage
leaf area damaged or consumed by invertebrates for each of the 15 selected plants per site across
the 55 study sites.
We then calculated a percentage community-level leaf herbivory by averaging
individual-level leaf herbivory of the 15 plants in each study site per phase. Because we had
four sampling phases, we eliminated non-independence of our data among years by averaged
community-level leaf herbivory resulting in one herbivory score for each of the 55 study sites.
We grouped leaf damages into three categories based on the feeding guilds of herbivores i.e.
invertebrate leaf chewers, leaf miners or gall-inducing insects (leaf gallers). We determined the
level of accuracy of this method by comparing the visual herbivory estimates for 108 leaves
(36 small, 36 medium, and 36 large leaves) to those obtained by quantifying the damaged leaf
area using a computer-aided image analysis (using the program ImageJ) as suggested by
(Robertson and Duke 1987) (Supplementary Fig. II. 1).
Plant functional traits
The Plant functional traits (hereafter referred to as leaf traits) we considered in our study were
specific leaf area (SLA, a measure of leaf surface area per leaf dry mass which includes rachis
and petiole), leaf carbon to nitrogen (CN) ratio and the leaf nitrogen to phosphorus (NP) ratio.
We chose these traits because they were found to be closely associated with susceptibility of
plants to herbivore attack (Poorter et al. 2004, Dussourd 2017). Within a study of plant
functional traits along elevation gradients of Mt. Kilimanjaro, a total of 758 woody plant
32
individuals, including the most abundant woody plant species from all study sites, have been
studied for plant functional traits (Schellenberger Costa et al. 2017). The studied species
collectively made up over 80 % of the maximum photosynthetic biomass on each study site.
Leaf traits were determined following protocols established by LEDA (www.leda-
traitbase.org) and as described by (Schellenberger Costa et al. 2017). From this trait data set,
we derived leaf traits of 640 (84 %) plant individuals screened for herbivory, representing 51
plant species. Leaf traits data for an additional 13 plant species representing a further 9 % of all
individuals were obtained from the TRY plant trait database (Kattge et al. 2011). A comparison
of leaf traits data for species that were sampled on study sites and for which data was
additionally available in the TRY database revealed a high overlap, justifying the use of the
additional trait data from the TRY database in our analyses. We did not manage to get leaf traits
data for 25 plant species of low general abundance which represented 7 % of individual plants
included in this study. However, these plants were randomly distributed along the elevational
gradient. For each study site, we calculated the mean species CN ratio, the mean NP ratio, and
the mean SLA by averaging the leaf traits of the fifteen plant individuals for which we measured
the percentage of leaf area damaged or missing and for which leaf trait data was available. A
comparison of the average leaf traits of the fifteen selected plants well reflected community-
level trait patterns calculated from all major plant species found on the study sites
(Supplementary Fig. II. 2).
Abundance of invertebrate herbivores
We used a sweep net sampling technique to sample invertebrates from two parallel,
permanently marked, 50 m long transects per study site. On each transect, we made 100 sweeps
using a 30 cm diameter sweep net to get a subsample. All invertebrates ≥ 1 mm collected from
two subsamples per site were put together to get one sampling unit per study site per season
(Ferger et al. 2014). Invertebrate sampling was conducted once in the dry and once in the wet
33
season. Invertebrate samples were pooled per site and identified at the order or family level.
For each study, we summed up the number of individuals belonging to taxa characterized by a
predominately herbivorous diet Coleoptera (Beetles), Hemiptera (Cicada and Sternorryncha),
Orthoptera (Grasshoppers and Crickets), Phasmatodea (Stick insects), Lepidoptera (Larva),
Thysanoptera (Thrips), and Gastropods).
Statistical analyses
Data were analyzed using the R statistic platform version 3.3.1 (R Core Team 2016). We used
generalized additive models (GAMs) from the mgcv R package to visualize and determine
relationships between invertebrate herbivory (total herbivory, herbivory by leaf chewers, leaf
miners and leaf gallers and elevation. We used Gaussian data family and set the basis dimension
of the smoothing function to k = 5 to estimate patterns of invertebrate herbivory along the
elevation gradient. We constructed three different model types for each response variable:
i. herbivory ~ elevation
ii. herbivory ~ elevation + land use (additive effect)
iii. herbivory ~ elevation * land use (interactive effect)
In the GAMs the main habitat type was included as a factorial variable (natural versus
anthropogenic habitats) as we aimed here at testing for and visualizing general differences in
herbivory between natural and anthropogenic habitats along the elevation gradient. For each
response variable, we selected the best-supported model type based on the Akaike-information
criterion (AIC). The AIC is based on the information theory and evaluates models on the basis
of model fit and model complexity (Burnham and Anderson 2004). As our sample size was
relatively low in comparison with the number of estimated parameters we used the AIC with a
second-order bias correction (AICC) instead of the standard AIC.
34
Path analysis was used to examine causal relationships (Shipley 2016) and untangle the
direct and indirect effects of explanatory variables (Classen et al. 2015, Herbst et al. 2017). The
term “direct effect” in a statistical context refers to the magnitude (strength) of change in a
response variable caused by a unit change in a predictor variable independently of an
intervening variable(s) in causal relationships, while, indirect effect refers to the magnitude of
change in a response variable caused by a unit change in a predictor variable completely through
an intervening variable(s) (Olobatuyi 2006). Based on an ecological understanding of
invertebrate herbivory, we postulated and constructed a conceptual path diagram that climatic
factors (MAT and MAP) and land use influence invertebrate herbivory directly or indirectly via
changes in NPP, herbivore abundance and leaf traits (SLA, CN and NP ratios) (see conceptual
path diagram Fig. II. 4a). In order to limit a large number of potential path models which can
be used to construct the final path model from the set of exogenous and endogenous variables,
we first determined for each response variable the best-supported paths using multi-model
inference based on AICC. For the construction of competitive path models, we just included
models which showed AICC values of < 2 in comparison to the best-supported model. The
multi-model inference was done using the function ‘dredge’ in R package MuMIn. We
compared all path models which could be constructed from the set of best supported linear
models and identified the best path model based on the AIC. For path analysis, the R package
lavaan was used.
35
Results
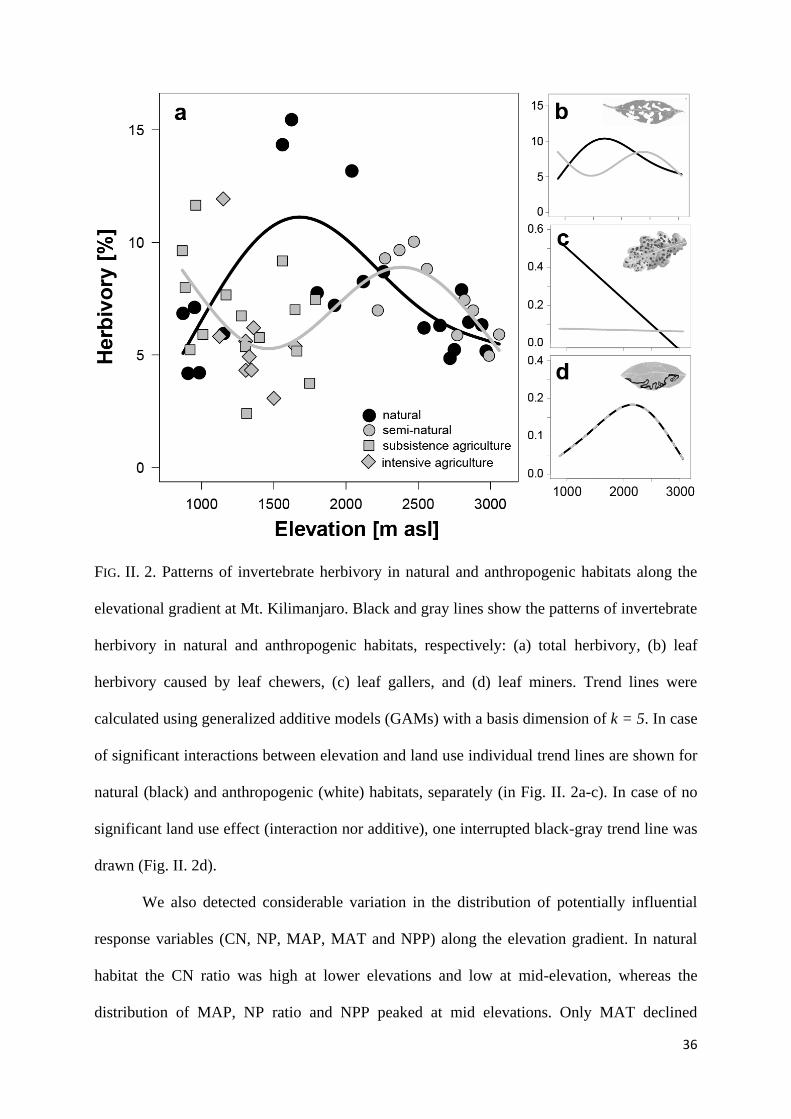
We estimated leaf herbivory from 99,000 leaves collected from 825 woody plants along
environmental gradients of Mt. Kilimanjaro. Mean leaf herbivory ranged from 5 % to 11 % in
the natural habitats and from 5 % to 9 % in anthropogenic habitats. We found contrasting
patterns of herbivory between natural and anthropogenic habitats and across feeding guilds of
invertebrates (GAM; n = 55, explained deviance (ED) = 46.4 %, Finteraction term = 5.1, Pinteraction
term < 0.0001; Fig. II. 2a). In natural habitats, total leaf herbivory exhibited a unimodal pattern
with elevation: leaf herbivory peaked in lower montane forests (at ca. 1700 m asl) and was
significantly lower in lowland savannah and higher montane forests (Fig. II. 2a). In
anthropogenic habitats, we found a bimodal pattern which strongly opposed the pattern detected
along the natural habitats. In anthropogenic and disturbed habitats, herbivory was highest in the
lowlands of Mt. Kilimanjaro (ca. 871 m asl) and in the mid-montane forests (at ca. 2400 m asl).
Leaf chewers were responsible for the majority of total leaf herbivory (mean 6.7 %) and
therefore their patterns closely followed patterns of total leaf herbivory (GAM; n = 55, ED =
43.9%, Finteraction term = 4.7, Pinteraction term < 0.001; Fig. II. 2b). Leaf herbivory by leaf gallers
declined monotonically with elevation in natural habitat but not in anthropogenic habitat, where
values were consistently low (GAM; n=55, ED = 18.3 %, Finteraction term = 4.6, Pinteraction term <
0.01; Fig. II. 2c). Leaf miners depicted a unimodal pattern of herbivory which did not
significantly differ between natural and anthropogenic habitats (GAM; n = 55, ED = 14.9 %,
Felevation = 2.3, Pelevation < 0.07; Fig. II. 2d).
36
FIG. II. 2. Patterns of invertebrate herbivory in natural and anthropogenic habitats along the
elevational gradient at Mt. Kilimanjaro. Black and gray lines show the patterns of invertebrate
herbivory in natural and anthropogenic habitats, respectively: (a) total herbivory, (b) leaf
herbivory caused by leaf chewers, (c) leaf gallers, and (d) leaf miners. Trend lines were
calculated using generalized additive models (GAMs) with a basis dimension of k = 5. In case
of significant interactions between elevation and land use individual trend lines are shown for
natural (black) and anthropogenic (white) habitats, separately (in Fig. II. 2a-c). In case of no
significant land use effect (interaction nor additive), one interrupted black-gray trend line was
drawn (Fig. II. 2d).
We also detected considerable variation in the distribution of potentially influential
response variables (CN, NP, MAP, MAT and NPP) along the elevation gradient. In natural
habitat the CN ratio was high at lower elevations and low at mid-elevation, whereas the
distribution of MAP, NP ratio and NPP peaked at mid elevations. Only MAT declined
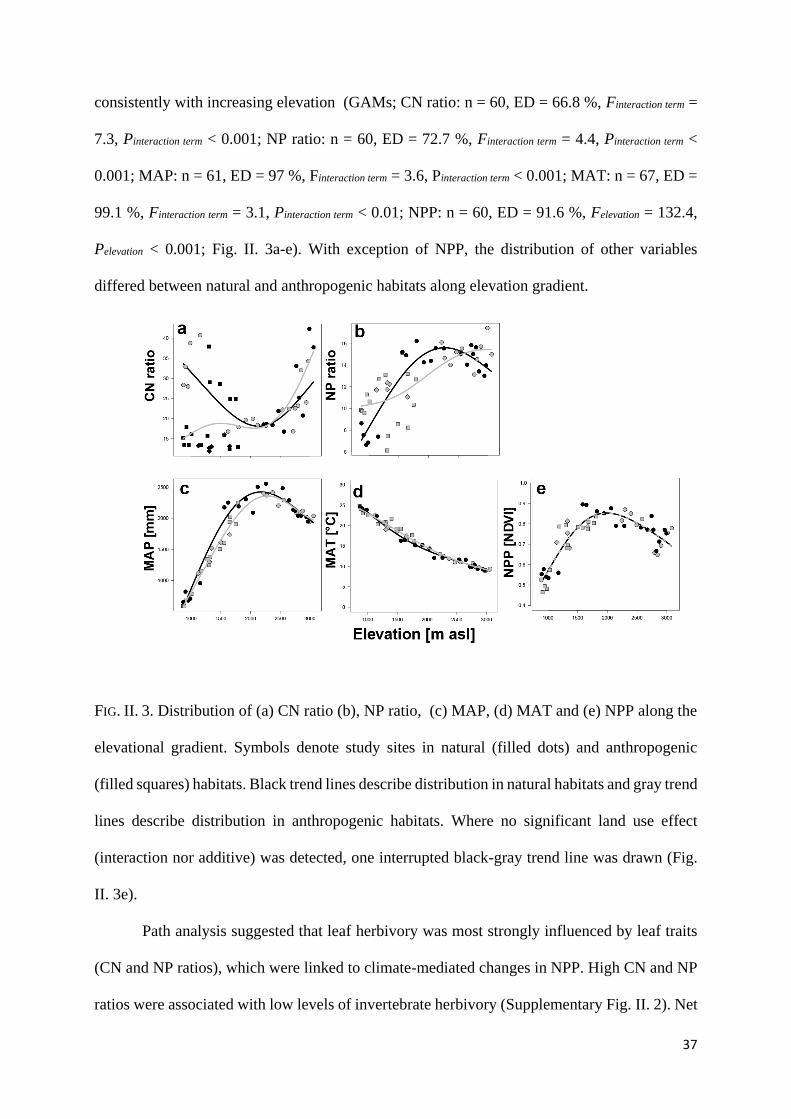
37
consistently with increasing elevation (GAMs; CN ratio: n = 60, ED = 66.8 %, Finteraction term =
7.3, Pinteraction term < 0.001; NP ratio: n = 60, ED = 72.7 %, Finteraction term = 4.4, Pinteraction term <
0.001; MAP: n = 61, ED = 97 %, Finteraction term = 3.6, Pinteraction term < 0.001; MAT: n = 67, ED =
99.1 %, Finteraction term = 3.1, Pinteraction term < 0.01; NPP: n = 60, ED = 91.6 %, Felevation = 132.4,
Pelevation < 0.001; Fig. II. 3a-e). With exception of NPP, the distribution of other variables
differed between natural and anthropogenic habitats along elevation gradient.
FIG. II. 3. Distribution of (a) CN ratio (b), NP ratio, (c) MAP, (d) MAT and (e) NPP along the
elevational gradient. Symbols denote study sites in natural (filled dots) and anthropogenic
(filled squares) habitats. Black trend lines describe distribution in natural habitats and gray trend
lines describe distribution in anthropogenic habitats. Where no significant land use effect
(interaction nor additive) was detected, one interrupted black-gray trend line was drawn (Fig.
II. 3e).
Path analysis suggested that leaf herbivory was most strongly influenced by leaf traits
(CN and NP ratios), which were linked to climate-mediated changes in NPP. High CN and NP
ratios were associated with low levels of invertebrate herbivory (Supplementary Fig. II. 2). Net
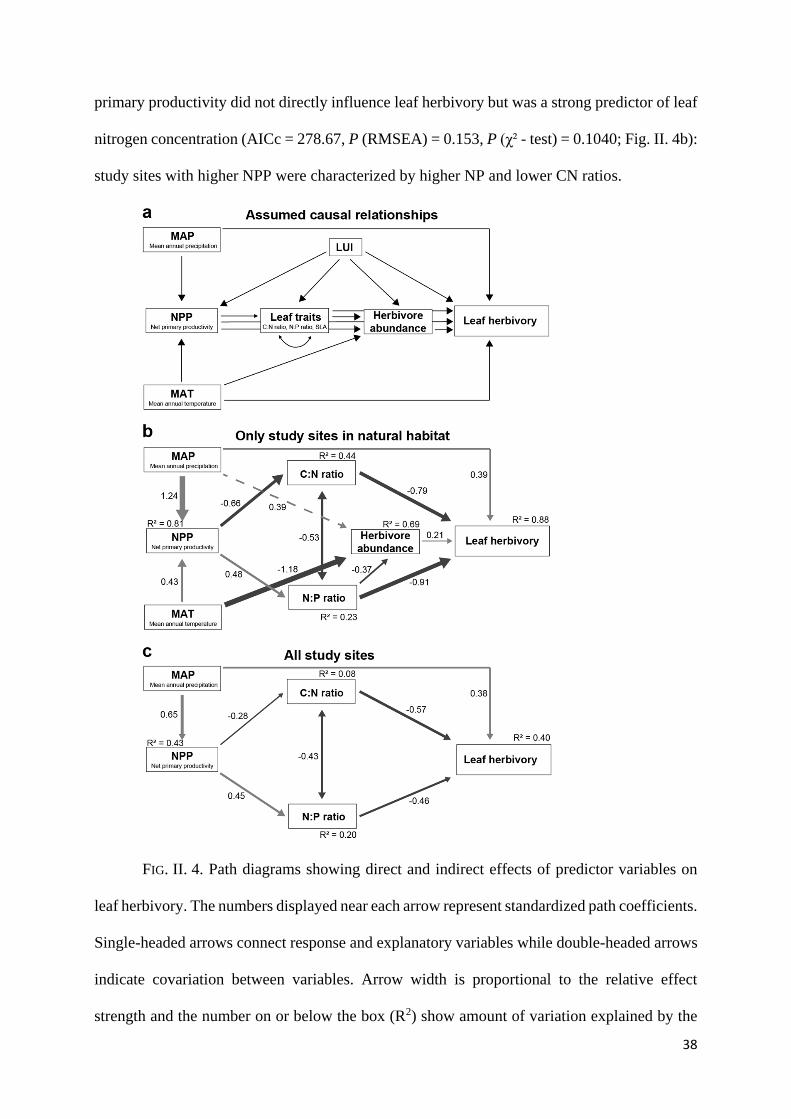
38
primary productivity did not directly influence leaf herbivory but was a strong predictor of leaf
nitrogen concentration (AICc = 278.67, P (RMSEA) = 0.153, P (χ² - test) = 0.1040; Fig. II. 4b):
study sites with higher NPP were characterized by higher NP and lower CN ratios.
FIG. II. 4. Path diagrams showing direct and indirect effects of predictor variables on
leaf herbivory. The numbers displayed near each arrow represent standardized path coefficients.
Single-headed arrows connect response and explanatory variables while double-headed arrows
indicate covariation between variables. Arrow width is proportional to the relative effect
strength and the number on or below the box (R2) show amount of variation explained by the

39
predictor variable where the arrow comes from. The solid lines and dashed lines represent path
described by the best supported path model (the most parsimonious model) and an additional
variable appearing in the best competitive model, respectively (a) Input path model showing
assumed causal relationships between predictor variables (MAT, MAP, NPP, LUI, SLA, CN
and NP ratio, herbivore abundance) and a response variable (leaf herbivory). (b) Output path
diagram from the best supported model (AICc= 278.67, P (RMSEA) = 0.153, P (χ² - test) =
0.1040) illustrating direct and indirect effects of predictor variables (MAT, MAP, NPP, CN
ratio, NP ratio and herbivore abundance) on a response variable (leaf herbivory) in natural
habitats, c) Output path diagram from the best supported model (AICc=650.805, P(RMSEA)
= 0.322, P (χ² - test) = 0.268) showing direct and indirect effects detected of predictor variables
(MAT, MAP, CN ratio and NP ratio) on a response variable (leaf herbivory) in all habitats (i.e.
anthropogenic and natural habitats).
Climate variables (MAP and MAT) had moderate direct and indirect effects on leaf
herbivory. First, leaf herbivory was positively correlated to MAP. Second, MAP and MAT were
strong predictors of NPP. For natural habitats, we additionally found a positive effect of
herbivore abundances on leaf herbivory, but the effect was rather small in comparison to the
effects of leaf traits and MAP. Although the patterns of leaf herbivory for natural and disturbed
habitats differed significantly, the differences in herbivory due to land use were best explained
by indirect effects on NP and CN ratios and perhaps also unknown variation e.g. in pest
management. With the exception of the effect of herbivore abundance, the final path models
and the main pathways by which leaf herbivory was determined were highly similar between a
dataset restricted to an elevation gradient of natural habitat and the one including data from the
extensive land use gradient on Mt. Kilimanjaro (AICc = 650.805, P (RMSEA) = 0.322, P (χ² -
test) = 0.268; Fig. II. 4c). The main difference between the final path models was found in the
predictability of endogenous variables (R² values in Fig. II. 3), which were much higher for the
natural habitat than for the complete data set.
40
Discussion
We found that leaf herbivory strongly varied along the elevational gradient of Mt. Kilimanjaro
with striking differences between natural and anthropogenic habitats. Contrary to our
hypothesis, herbivory was not directly related to temperature and did not monotonically decline
with elevation. Instead, herbivory in natural habitats peaked at mid-elevations whereas
anthropogenic habitats showed a nearly inverse pattern. The variation in leaf herbivory along
the elevational gradient could be explained by the direct and indirect effects of climate and net
primary productivity on leaf nutrient stoichiometry. Our study provides new insights into the
mechanisms linking between climate and community-level leaf herbivory across broad climatic
gradients.
Along the natural habitats gradient, total leaf herbivory showed a unimodal distribution
with a peak in the lower montane forest and significantly low values in colline (lowland)
savannah and higher elevations. The observed pattern is incongruent with the widespread view
that herbivory declines monotonically with elevation (Andrew et al. 2012). One of the possible
reasons could be that Mount Kilimanjaro (and other mountains in East Africa) experiences
moist conditions at mid-elevations but an arid environment at lower elevations in addition to
harsh conditions at higher elevations (i.e. low temperatures, low nutrients, high wind speed)
(Rasmann et al. 2014a, Moreira et al. 2017). This situation causes net primary productivity to
peak at mid elevations. Evidence suggests that plants in resource-rich and productive habitats
are often associated with high plant growth rates and low investments less in plant defense both
of which promote herbivory (Coley et al. 1985, Abdala-Roberts et al. 2016). Conversely, under
limiting environmental conditions plant growth and plants’ investments in defense against
herbivory are elevated due to the high cost of replacement of the damaged tissues (Coley et al.
1985, Pellissier et al. 2016).
41
At lower elevations where a relatively fire-prone and drought stressed savannah habitat
is found, plants produce tougher leaves and carbon-based defensive compounds such as
terpenes or alkaloids, both of which negatively affect foliage nutritional quality, to avoid
herbivory (Coley and Barone 1996, Rasmann et al. 2009). Likewise, at high elevation, the
climatically harsh conditions might increase plant physical defense traits against climatic and
mechanical stress which increase leaf toughness, lower leaf palatability and decrease ultimately
herbivory (Körner 1989, Rasmann et al. 2014b)
Results from path analysis show that in natural habitat precipitation and temperature
had moderate direct and indirect effects on herbivore abundance and leaf herbivory.
Precipitation showed a direct positive effect on herbivory while both precipitation and
temperature exhibited an indirect effect on herbivory via its influence on NPP and herbivore
abundance. The rather low effect of herbivore abundance on leaf herbivory could have been
attributed by the limitation of our study in capturing a wide range of invertebrate herbivores.
Collecting a wide spectrum of invertebrate herbivores in different vegetation types is a very
challenging task and a combination of different sampling methods could possibly lead to a
higher linkage between herbivory, MAT and herbivore abundance. Importantly, herbivory
rates are not only driven by the bottom-up process but may also be under top-down control
(Marczak et al. 2011, Terborgh 2015, Castagneyrol et al. 2017). Regulation of herbivore
abundance by natural enemies could be related to temperature with higher predation rates at
lower elevations (Roslin et al. 2017). Based on the relationship between temperature and
predation rates, the strong negative effect of MAT on herbivore abundance we observed in our
study could be associated with a stronger positive effect of temperature on predators and
predation rates than on herbivores abundance which could lead to a negative correlation
between herbivore abundance and MAT. We are not aware of other studies that have
systematically assessed the relative contribution of various environmental parameters on
42
herbivory rates in tropical elevational gradients and thus provide novel insights into the
determinants of plant herbivory.
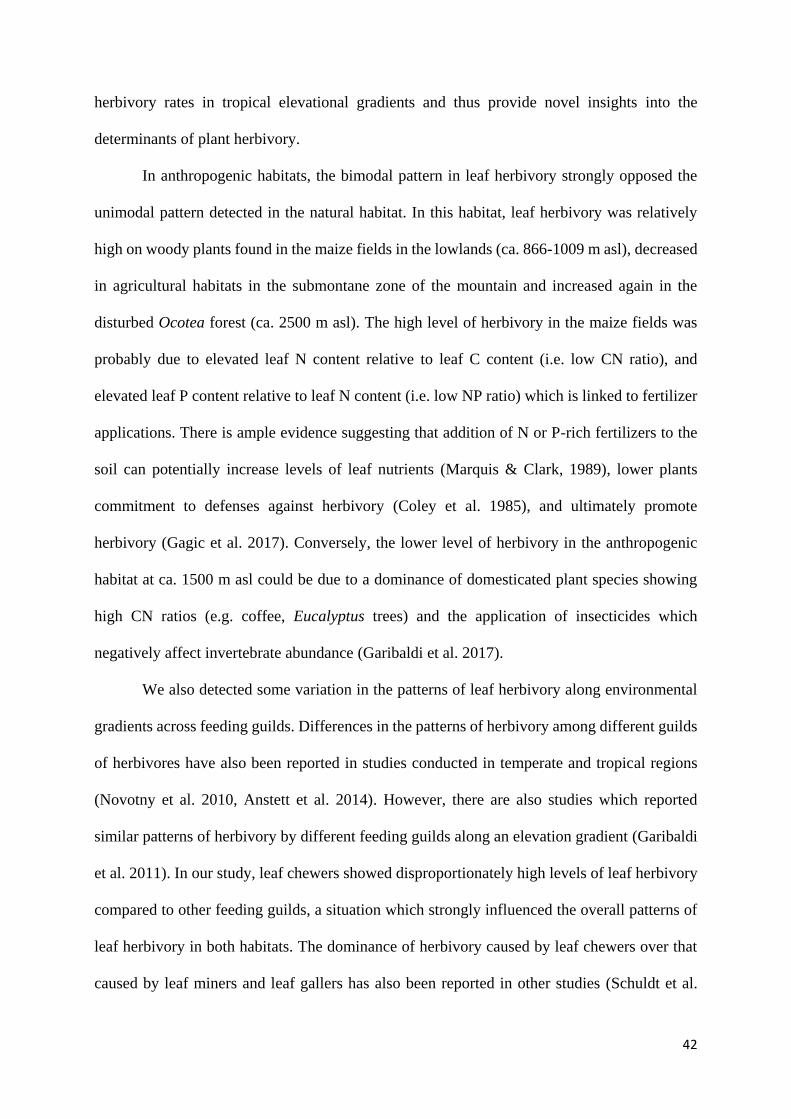
In anthropogenic habitats, the bimodal pattern in leaf herbivory strongly opposed the
unimodal pattern detected in the natural habitat. In this habitat, leaf herbivory was relatively
high on woody plants found in the maize fields in the lowlands (ca. 866-1009 m asl), decreased
in agricultural habitats in the submontane zone of the mountain and increased again in the
disturbed Ocotea forest (ca. 2500 m asl). The high level of herbivory in the maize fields was
probably due to elevated leaf N content relative to leaf C content (i.e. low CN ratio), and
elevated leaf P content relative to leaf N content (i.e. low NP ratio) which is linked to fertilizer
applications. There is ample evidence suggesting that addition of N or P-rich fertilizers to the
soil can potentially increase levels of leaf nutrients (Marquis & Clark, 1989), lower plants
commitment to defenses against herbivory (Coley et al. 1985), and ultimately promote
herbivory (Gagic et al. 2017). Conversely, the lower level of herbivory in the anthropogenic
habitat at ca. 1500 m asl could be due to a dominance of domesticated plant species showing
high CN ratios (e.g. coffee, Eucalyptus trees) and the application of insecticides which
negatively affect invertebrate abundance (Garibaldi et al. 2017).
We also detected some variation in the patterns of leaf herbivory along environmental
gradients across feeding guilds. Differences in the patterns of herbivory among different guilds
of herbivores have also been reported in studies conducted in temperate and tropical regions
(Novotny et al. 2010, Anstett et al. 2014). However, there are also studies which reported
similar patterns of herbivory by different feeding guilds along an elevation gradient (Garibaldi
et al. 2011). In our study, leaf chewers showed disproportionately high levels of leaf herbivory
compared to other feeding guilds, a situation which strongly influenced the overall patterns of
leaf herbivory in both habitats. The dominance of herbivory caused by leaf chewers over that
caused by leaf miners and leaf gallers has also been reported in other studies (Schuldt et al.
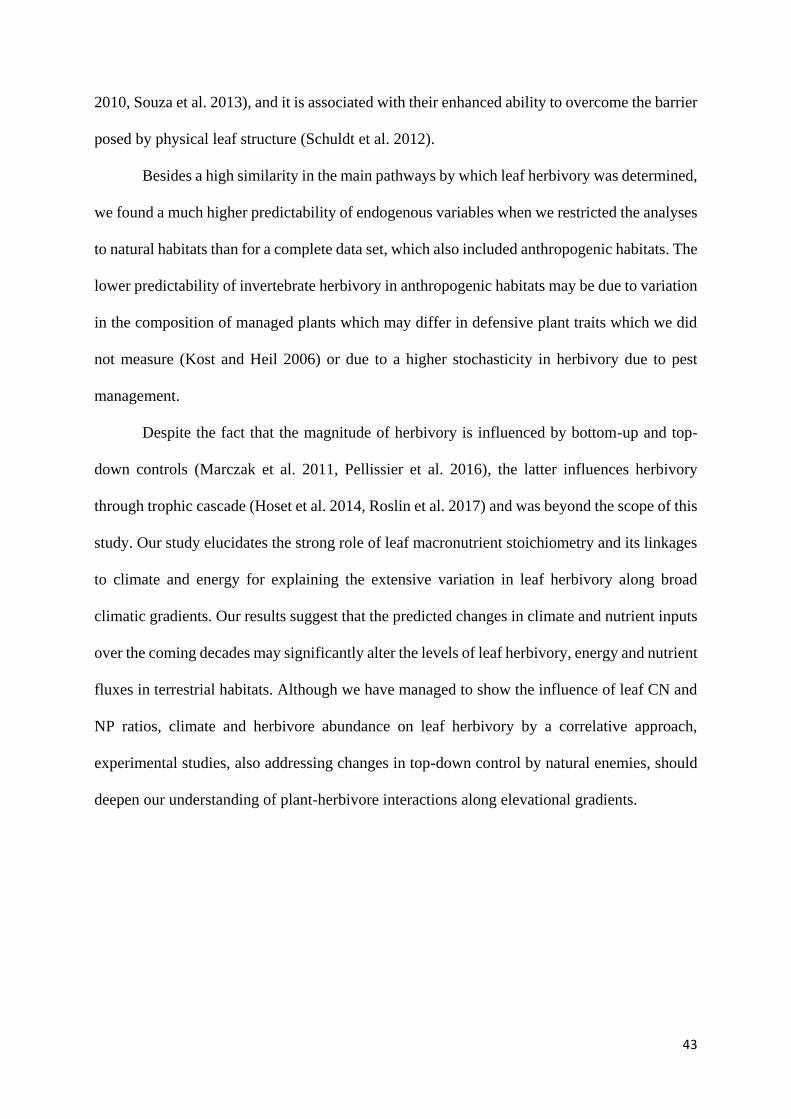
43
2010, Souza et al. 2013), and it is associated with their enhanced ability to overcome the barrier
posed by physical leaf structure (Schuldt et al. 2012).
Besides a high similarity in the main pathways by which leaf herbivory was determined,
we found a much higher predictability of endogenous variables when we restricted the analyses
to natural habitats than for a complete data set, which also included anthropogenic habitats. The
lower predictability of invertebrate herbivory in anthropogenic habitats may be due to variation
in the composition of managed plants which may differ in defensive plant traits which we did
not measure (Kost and Heil 2006) or due to a higher stochasticity in herbivory due to pest
management.
Despite the fact that the magnitude of herbivory is influenced by bottom-up and top-
down controls (Marczak et al. 2011, Pellissier et al. 2016), the latter influences herbivory
through trophic cascade (Hoset et al. 2014, Roslin et al. 2017) and was beyond the scope of this
study. Our study elucidates the strong role of leaf macronutrient stoichiometry and its linkages
to climate and energy for explaining the extensive variation in leaf herbivory along broad
climatic gradients. Our results suggest that the predicted changes in climate and nutrient inputs
over the coming decades may significantly alter the levels of leaf herbivory, energy and nutrient
fluxes in terrestrial habitats. Although we have managed to show the influence of leaf CN and
NP ratios, climate and herbivore abundance on leaf herbivory by a correlative approach,
experimental studies, also addressing changes in top-down control by natural enemies, should
deepen our understanding of plant-herbivore interactions along elevational gradients.
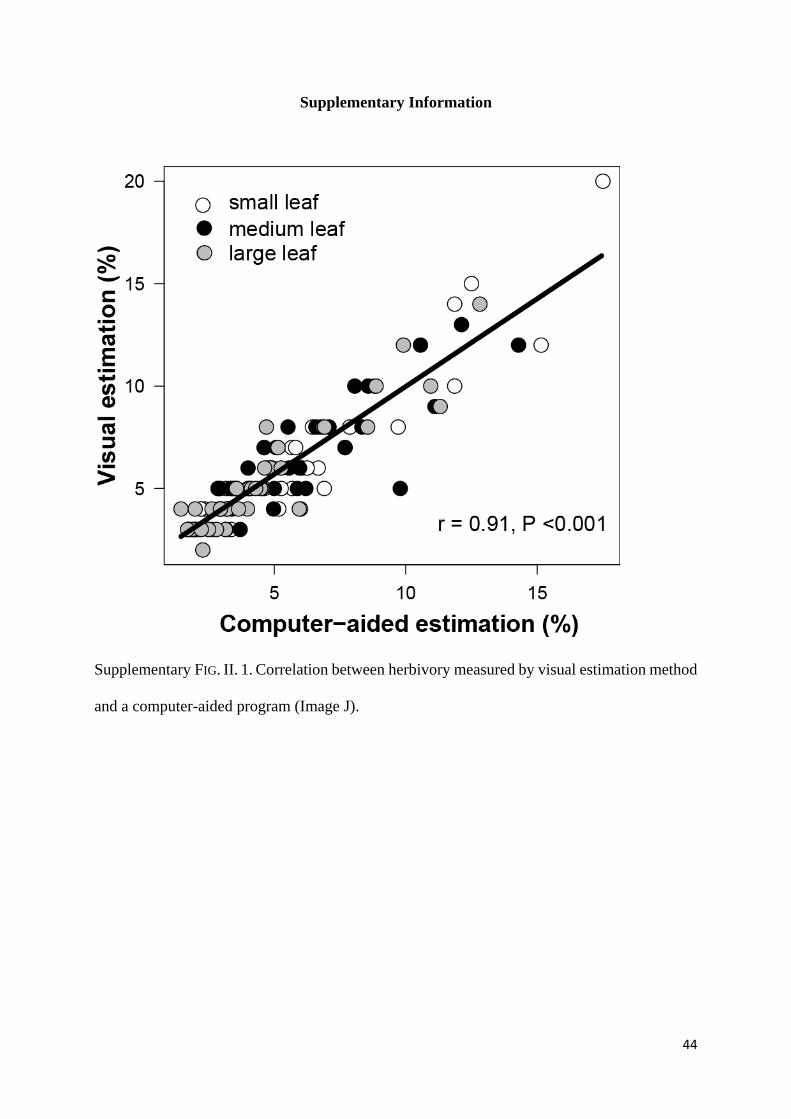
44
Supplementary Information
Supplementary FIG. II. 1. Correlation between herbivory measured by visual estimation method
and a computer-aided program (Image J).
45
Supplementary FIG. II. 2. Relationships between insect herbivory and leaf traits, i.e. for the (a)
leaf CN ratio and (b) leaf NP ratio dots show mean levels of leaf herbivory per study site. In
the right panel, dot size is proportional to the CN ratio of leaves (larger dots = higher CN ratios).
Trend lines are derived from simple linear regression models of herbivory (response) against
CN and NP ratios.
46
Chapter III: Temperature and resource diversity predict the diversity of phytophagous
beetles along elevation and land use gradients on Mt. Kilimanjaro.
Summary
Patterns of diversity along elevational gradients are well depicted in ecology but it remains little
tested on how variation in the quantity, quality, and diversity of food resources modulate these
patterns. Here we use phytophagous beetles as a model taxon to unravel direct and indirect
effects of climate, food resource abundance (estimated by net primary productivity), resource
quality (specific leaf area index, leaf nitrogen to phosphorus and leaf carbon to nitrogen ratio),
resource diversity (functional dispersion of leaf traits), on Chao1-estimated species richness
(here referred to as species diversity) of phytophagous beetles along extensive elevation and
land use gradients of Mt. Kilimanjaro. We sampled phytophagous beetles in 65 study sites
positioned in natural and anthropogenic habitats which were distributed from 866 - 4550 m asl.
We used path analysis to unravel the direct and indirect effects of predictor variables on species
diversity. A total of 3,186 phytophagous beetles representing 21 families and 304
morphospecies were collected. We found that the elevational diversity of phytophagous beetles
was bimodally distributed along the elevation gradient with peaks at lowest (~800 m asl) and
high elevations (~3000 m asl). Results from path analysis revealed temperature, climate-
mediated changes in resource abundance and resource diversity to be the best predictors of the
changes in the diversity of phytophagous beetles. We did not find an effect of land use intensity
on resource abundance, resource diversity, phytophagous beetle abundance, and species
diversity or of leaf quality traits (leaf SLA, CN and NP ratios of plant communities) on
abundance and species diversity of phytophagous beetles. The species diversity of
phytophagous beetles was related to temperature and the diversity of food resources suggesting

47
that future climate change and human-driven plant diversity loss will influence species diversity
and distribution patterns of herbivorous insects.
Keywords: climate change, elevation gradient, functional dispersion, land-use change, plant
functional traits, net primary productivity, phytophagous beetles, species richness, species
diversity
48
Introduction
The idea to understand mechanisms underlying variation in species diversity along elevational
gradients dates back to the 19th Century (Rahbek 2005, Yu et al. 2013, Peters et al. 2016). Since
then elevational gradients have become an integral part of ecological, evolutionary and
biogeographic studies (Rahbek 1995, Wang et al. 2011, Sundqvist et al. 2013). In such
macroecological studies, mountains play a central role as they host relatively natural habitats
composed of compressed life zones which are exposed to a great variation of climatic conditions
within a short horizontal distance (Spehn and Körner 2005, Hodkinson 2005). Tropical
mountains, in particular, harbor a significant amount of biodiversity with a unique evolutionary
history (Spehn and Körner 2005, Merckx et al. 2015). These mountains are often used as both,
observational and experimental study sites to identify ecological patterns and reveal
mechanisms underlying these patterns (McCoy 1990, McCain 2007, Körner 2007, Beck et al.
2017), to disentangle direct and indirect effects of biotic and abiotic factors on biological
diversity (Colwell et al. 2008, Sundqvist et al. 2013, Classen et al. 2015, Peters et al. 2016) and
to test several biological hypotheses (Wang et al. 2011, Dulle et al. 2016, Thormann et al. 2018).
Studies on species diversity along elevational gradients regardless of the taxon have
revealed several contrasting patterns (Rahbek 1995, Nogués-Bravo et al. 2008, Yu et al. 2013,
Thormann et al. 2018). So far, a monotonic decline and unimodal “hump-shaped” patterns of
species diversity along elevation gradients are most common (Nogués-Bravo et al. 2008,
González-Megías et al. 2009, Yu et al. 2013, Beck et al. 2017). However, it has now been
established that variation in the patterns of species diversity along elevation gradients may as
well arise from spatiotemporal settings of a given study (McCoy 1990, Rahbek 1995, Nogués-
Bravo et al. 2008). In connection to these patterns, there are several competing hypotheses
which incorporate over 30 explanatory variables attempting to explain mechanisms underlying
patterns of species diversity (González-Megías et al. 2009, Novillo and Ojeda 2014, Leingärtner
49
et al. 2014b). Although commentaries suggest that patterns of species diversity are influenced
by interactive effects of numerous factors (Baur et al. 2014, Novillo and Ojeda 2014),
temperature, precipitation, and availability of foraging resources (in terms of quantity and
quality) are considered key bottom-up factors driving the pattern of species diversity of insects
along elevation gradients (Hodkinson 2005, McCain 2007, Beck et al. 2017). Conversely,
studies have also shown that top-down control through predation plays an important role in
shaping species diversity patterns of insect herbivores (Vidal and Murphy 2018).
For ectothermic animals like insects, temperature imposes severe physiological
constraints particularly at higher altitudes (Brown et al. 2004); a situation which limits species
colonization (McCoy 1990, Fiedler et al. 2008) and modulates efficiency with which foraging
resources can be utilized (Suzuki 1998, Kaspari et al. 2000). Conversely, precipitation
influences not only net primary productivity, quality and quantity of foraging resources but also
plant functional traits which in turn could affect the abundance and species diversity of primary
consumers such as insect herbivores (Hodkinson 2005, Cardinale et al. 2009, Beck et al. 2017).
The influence of productivity on species diversity has been well-documented in ecology
(Abrams 1995) and several contrasting mechanisms have been proposed to explain
productivity-richness relationships (Rosenzweig and Abramsky 1993, Abrams 1995,
Mittelbach et al. 2001). For instance, studies on diversity-productivity relationships have
closely associated productivity with plant functional traits (Šímová and Storch 2017). Plant
functional traits have been frequently used in ecological studies as they provide insights on
several aspects of plant life strategies such as plant-animal interactions (incl. spinescence,
dispersal syndrome, diaspore and flower colors), growth (incl. leaf nitrogen, leaf phosphorous,
canopy height) and reproductive (incl. relative seed number, seed crop frequency) investments
(Costa et al. 2017). In addition, functional traits have also been linked to competition and
functional diversification. As various ecosystems are subjected to land-use and climatic
changes (Vitousek et al. 1997), environmental variables, net primary productivity (forage
50
resources) and plant functional traits are expected to respond to these changes (Vitousek et al.
1997, Hendrickx et al. 2007, Garnier et al. 2007, Garibaldi et al. 2017) and cause some
consequences to various animal species.
Here we determined the underlying reasons for various patterns of species diversity of
phytophagous beetles (Order: Coleoptera) along land use and elevation gradients and unraveled
direct and indirect effects of environmental factors (temperature and precipitation), net primary
productivity, plant functional traits and land use on species diversity. We used phytophagous
beetles because they are taxonomically hyperdiverse and a major herbivorous insect taxon in
the world (Rosenberg et al. 1986, Hunt et al. 2007, Fiedler et al. 2008, Stork et al. 2015). The
use of hyperdiverse groups in ecological studies is worth the effort as it presents an opportunity
to understand mechanisms underlying variation in the patterns of species diversity. We tested
the following non-exclusive hypotheses stating that
(i) Species diversity peaks at mid-elevation due to high climate-mediated net
primary productivity (i.e. the resource availability hypothesis);
(ii) Species diversity declines monotonically with elevation due to temperature-
mediated foraging activity (the temperature-mediated resource exploitation
hypothesis) and temperature-mediated speciation (i.e the temperature–
speciation hypothesis).
(iii) Species diversity peaks at mid-elevation due to ambient environmental
conditions which promote persistence of a wider range of plant functional
strategies (i.e. physiological tolerance hypothesis) (Spasojevic et al. 2014).
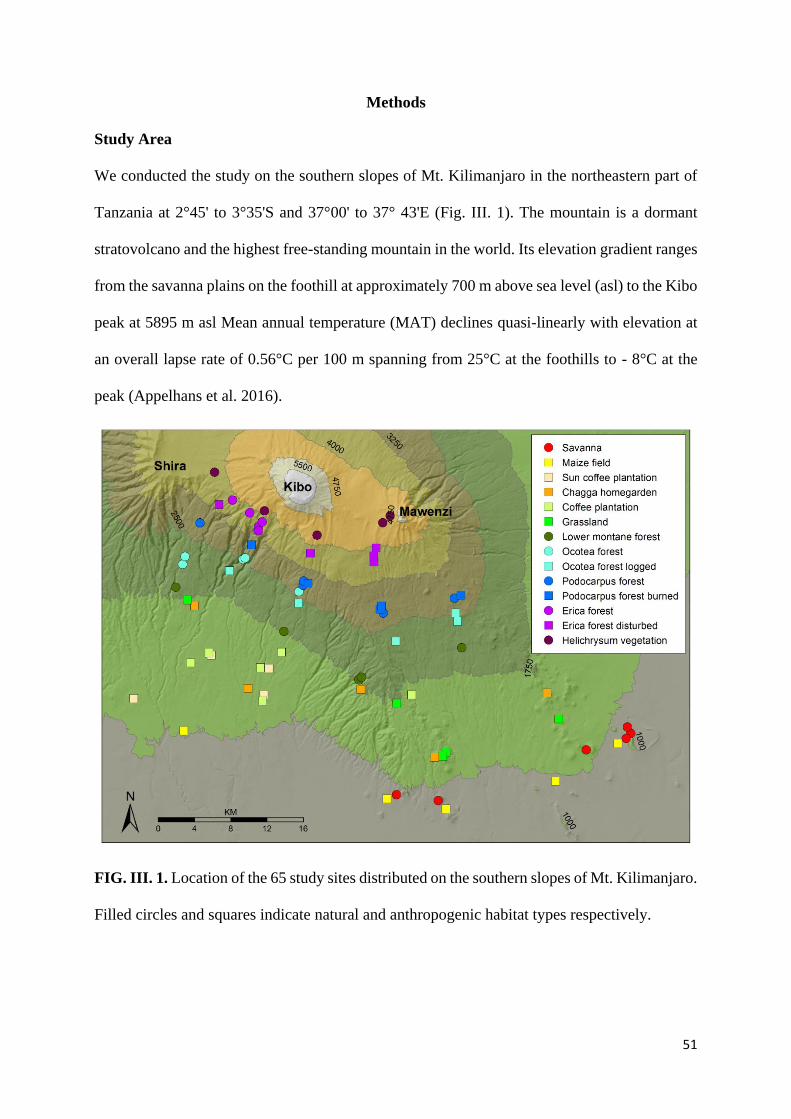
51
Methods
Study Area
We conducted the study on the southern slopes of Mt. Kilimanjaro in the northeastern part of
Tanzania at 2°45' to 3°35'S and 37°00' to 37° 43'E (Fig. III. 1). The mountain is a dormant
stratovolcano and the highest free-standing mountain in the world. Its elevation gradient ranges
from the savanna plains on the foothill at approximately 700 m above sea level (asl) to the Kibo
peak at 5895 m asl Mean annual temperature (MAT) declines quasi-linearly with elevation at
an overall lapse rate of 0.56°C per 100 m spanning from 25°C at the foothills to - 8°C at the
peak (Appelhans et al. 2016).
FIG. III. 1. Location of the 65 study sites distributed on the southern slopes of Mt. Kilimanjaro.
Filled circles and squares indicate natural and anthropogenic habitat types respectively.
52
The area experiences a bimodal rainfall pattern with the main rainy season occurring between
March and June and the more variable short rains occurring around November (Peters et al.
2016). Mean annual precipitation shows a hump-shaped pattern along the elevation gradient
with the maximum precipitation of ~2700 mm at 2300 m asl (Appelhans et al. 2016).
The mountain encompasses distinct natural habitats along the elevational gradient: the
lowland is characterized by colline savanna (871 - 1153 m asl), followed by lower montane
rainforest (1560-2040 m asl), Ocotea forest (2120 - 2750 m asl), Podocarpus forest (2752 -
3060 m asl), Erica forest (3500 - 3880 m asl) and alpine Helichrysum vegetation (3849 - 4548
m asl). Following anthropogenic disturbances, in particular, subsistence and commercial
farming activities, illegal logging, and fire, large parts of the natural habitats on the mountain
were converted into ‘anthropogenic habitat’ (Hemp 2006c) including maize fields (866 - 1009
m asl), coffee plantations (1124 - 1648 m asl), sun coffee plantations (1150 - 1360 m asl),
grasslands (1303 -1748 m asl), Chagga home gardens (agroforestry systems; 1169 - 1788 m
asl), logged Ocotea forest (2220 - 2560 m asl) and burned Podocarpus forest (2770 - 3060 m
asl).
Study design
This study is part of a larger research project (Kili Research Unit FOR1246
(https://www.kilimanjaro.biozentrum.uni-wuerzburg.de) from which we used a total of 65
study sites to sample phytophagous beetles, plant traits, and environmental data. Each study
site had a size of 50 x 50 m and was placed at least 300 m apart of each other with 97% of all
study site pairs being larger than 2 km. The study sites were located between 866 and 4550 m
asl in the six natural and eight major anthropogenic habitats on the south-southeastern slopes
of the Kilimanjaro (mentioned above). Each habitat type was represented with not less than five
study sites (with exception of Savannah and Coffee plantations which were 6 each, and Sun
coffee plantations and Helichrysum which were 4 each) which formed a small-scale within-
53
habitat elevation gradient (Fig. III. 1). We used a composite land use index established by the
KiLi Research Unit to described the land use intensity at each study site based on the level of
chemical inputs, removal of plant biomass, the difference of the vegetation structure to natural
habitats, and the proportion of agricultural land in a 1.5 km buffer zone surrounding each study
site (Classen et al. 2015).
The temperature was recorded every 5 minutes for the duration of two years using
temperature sensors positioned approximately 2 m above the ground on each study site (Classen
et al. 2015, Appelhans et al. 2016). Mean annual temperature (MAT) was calculated by
averaging all individual temperature measurements per study site (Classen et al. 2015). Data on
precipitation (rainfall) was estimated for each study site from a total of 70 rain gauges
distributed on Mt. Kilimanjaro for over 15 years. From this data, mean annual precipitation
(MAP) was mapped across the area using a co-kriging approach (Appelhans et al. 2016). For a
detailed description of how climatic variables were measured, please see Appelhans et al.
(2016) and Peters et al. (2016).
Richness and abundance of herbivorous beetles
We sampled phytophagous insects on all study sites in two sampling phases between March
2011 and October 2012 and in three sampling phases from April 2014 to May 2016. Insects
were collected in both dry and wet seasons and all sampling activities were restricted to hours
between 0900 and 1600 when most diurnal insects were believed to be active. In order to collect
a wide spectrum of insect herbivores in different vegetation types, a sweep net method in
tandem with a beating method was used to sample insects on each study site. We used a 30 cm
diameter sweep net to sample mainly active and flying insects from two parallel, permanently
marked, 50 m long transects per study site. A sampling unit constituted a total of 200-sweep
sample specimens (i.e. 100-sweep sample specimens from each transect).
54
In the last three sampling phases, we additionally used a beating method to dislodge and
sample insects resting or feeding on woody plants. At each study site, we sampled insects from
15 randomly selected woody plants (trees or shrubs) of a relatively small size of up to 5 m.
Each of the small-sized trees or shrubs was heavily hit five times (in case of relatively large
trees or shrubs, three branches were selected and each was hit five times) with a club to dislodge
insects onto a 72 cm diameter hand-held sample collection sheet. The collected insects were
sorted immediately from the vegetation debris and killed using ethyl acetate. All collected
insects were then enumerated and stored in vials with 70% ethanol for further processing in the
lab. For each site, we pooled all insects collected by the two sampling methods over the five
sampling phases.
Out of the collected insect specimens, we dealt with adult beetles (Order: Coleoptera)
for further taxonomic identification. All beetles were mounted and identified to the family level.
All beetles from mainly phytophagous beetle families including Curculionidae, Chrysomelidae,
Buprestidae, Cerambycidae, and Elateridae were then identified to species or morphospecies
level by Thomas Wagner (Hasenkamp and Wagner 2000, Wagner 2007, Thormann et al. 2016,
2018).
Food resource abundance, food resource quality, and food resource diversity
For each study site, we estimated measures of the food resource abundance
(approximated by the normalized difference vegetation index (NDVI), food resource quality
(resource quality) (leaf traits assumed to influence the digestibility of leaves for herbivores) and
food resource diversity (resource diversity) (approximated by the functional dispersion of leaf
traits). The NDVI is a proxy for the net primary productivity [food resource abundance
(resource abundance)] of ecosystems (Evans et al. 2005, Peters et al. 2016) and a measure for
the overall food resource availability of phytophagous insects. The NDVI was estimated from
a MODIS Aqua product MYD13Q1 with a horizontal resolution of 250 m by 250 m by
55
averaging corrected NDVI measures of 10 consecutive years (2003-2012) and extracting pixel
values corresponding to the geographical positions of the study sites. For details see Detsch et
al. (2016) and Peters et al. (2016).
We also determined a specific leaf area (SLA) (mm2 mg-1) as the ratio of leaf area to
dry mass. Low SLA scores are typically representative of leaves with a long lifespan, high
investments in physical defenses (Callis-Duehl et al. 2017) and low nutritional value (Schuldt
et al. 2012). The NP ratio indicates plant phosphorous availability per unit of nitrogen available
to herbivores whereas the CN ratio indicates plant nitrogen availability per unit of carbon
available to herbivores (Mattson 1980). These traits play a crucial role in regulating the
nutritional value of food resources for herbivores which in turn influence susceptibility of plants
to herbivore attacks (Schuldt et al. 2012, Leingärtner et al. 2014a). We used the LEDA protocol
to measure plant functional traits from the most abundant plant species making up 80% of total
plant biomass found on each study site. In order to account for intraspecific variability, we
sampled 15 individuals per plant species from different sites where possible. Details on these
traits and descriptions of trait measurements can be found in Costa et al. (2017) and Kleyer et
al. (2008).
We also used Functional Dispersion (FDis) of leaf traits (SLA, NP and CN ratios) as a
measure of resource diversity. FDis is a multidimensional functional diversity index which uses
data of multiple functionally relevant traits (Laliberté Etienne and Legendre Pierre 2010). FDis
is considered to be highly flexible as it accommodates traits of any number, type (qualitative,
quantitative or semi-quantitative) and those taken from any distance or dissimilar measures
(Laliberté Etienne and Legendre Pierre 2010). If species of phytophagous beetles are
specialized to feed on plants with certain functional traits, we expect strong correlations
between the functional diversity of plant leaves (FDis) and the diversity of phytophagous
beetles.
56
Statistical analyses
We used the R statistical platform version 3.3.1 to perform statistical analyses (R Core Team
2016). In order to counteract the potential problem of incomplete sampling of beetles’ species,
we estimated asymptotic species richness for each study site using the Chao1 index,
implemented in estimate function of the R-package vegan. The Chao1-estimated species
richness is hereafter referred to as species diversity. Generalized additive models (GAMs)
calculated with the mgcv package were used to examine the distribution of species diversity and
abundance of all phytophagous beetles, and additionally of weevils and leaf beetles along the
elevational gradient. In the GAMs the two major categories of habitat (natural and
anthropogenic habitats) were included as factor levels since we wanted to visualize potential
differences in species diversity trends between the two habitat categories. As our data showed
a signal of overdispersion we used the quasipoisson data family for modeling count data in
GAMs. We set the basis dimension of the smoothing function to k = 5 to prevent
overparameterization of GAM models (Peters et al. 2016).
We used path analysis to examine causal relationships (Shipley 2016) and unravel the direct
and indirect effects of all predictor variables on the species diversity of phytophagous beetles
(Herbst et al. 2017). Before analysis, we log-transformed Chao1- estimated species richness
(hereafter referred to as species diversity) and abundance of phytophagous beetles in order to
conform to the assumptions of a normal distribution. Based on our assumed linkages between
climate, plant resource variables and phytophagous beetle diversity we hypothesized and
constructed a conceptual path diagram (Fig. III. 3a) based on the following linkages:-
1) NDVI~MAT + MAP + LUI
2) Herbivore abundance ~MAT + MAP + LUI + NDVI + FDis + NP + CN + NDVI + SLA
3) Species diversity~ MAT + LUI + NDVI + FDis + Abundance + NP + CN + NDVI + SLA
4) FDis ~ LUI + NDVI
57
We then pre-selected possible path combinations, by analyzing the four response variables
of our path models (NDVI, FDis, herbivore abundance, and species diversity) with their
respective predictor variables using linear models. For each path model, we employed the
‘dredge’ of the R package MuMIn to identify a set of competitive models based on the Akaike
information criterion (AIC). The AIC is conceptually based on information theory and evaluates
statistical models on the basis of model fit and complexity (Burnham and Anderson 2004). We
used the AICc (AIC with a second-order bias correction) instead of the standard AIC because
our samples were relatively low compared with the number of estimated parameters. For the
construction of competitive path models, we just included models which showed AICC values
of < 2 in comparison to the best-supported model. We compared all path model combinations
which could be constructed from the set of the best supported linear models and identified the
best path model based on the AIC.
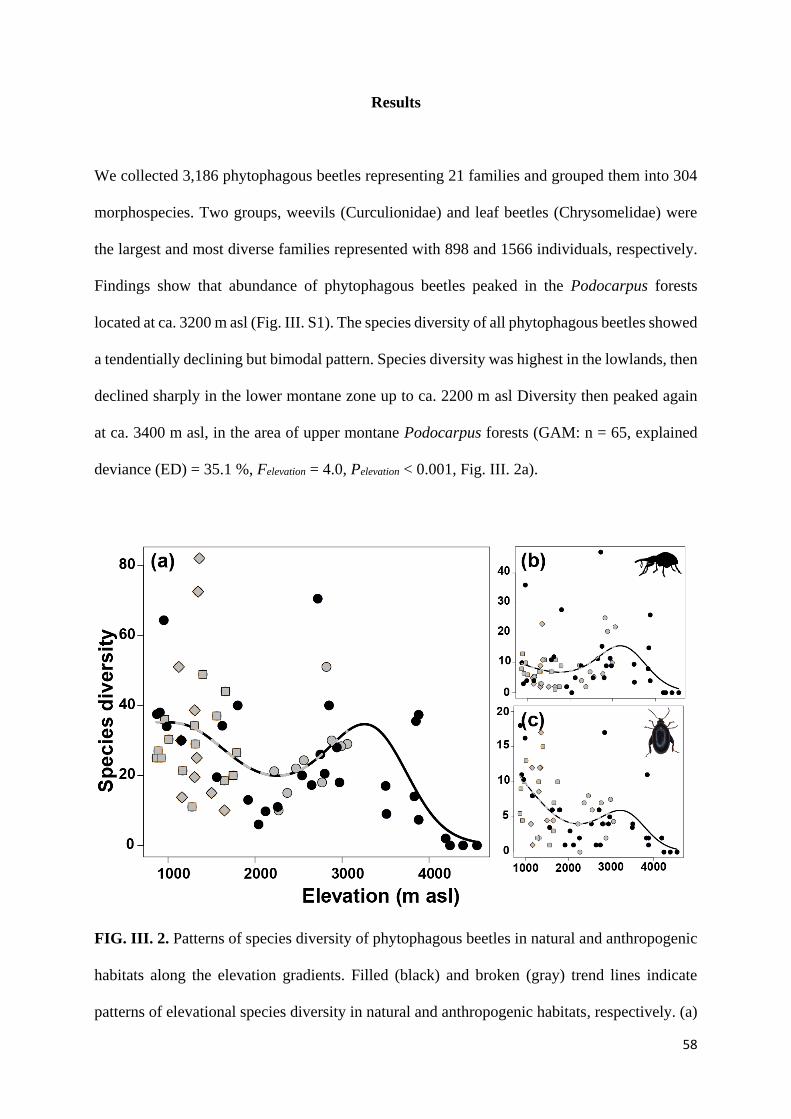
58
Results
We collected 3,186 phytophagous beetles representing 21 families and grouped them into 304
morphospecies. Two groups, weevils (Curculionidae) and leaf beetles (Chrysomelidae) were
the largest and most diverse families represented with 898 and 1566 individuals, respectively.
Findings show that abundance of phytophagous beetles peaked in the Podocarpus forests
located at ca. 3200 m asl (Fig. III. S1). The species diversity of all phytophagous beetles showed
a tendentially declining but bimodal pattern. Species diversity was highest in the lowlands, then
declined sharply in the lower montane zone up to ca. 2200 m asl Diversity then peaked again
at ca. 3400 m asl, in the area of upper montane Podocarpus forests (GAM: n = 65, explained
deviance (ED) = 35.1 %, Felevation = 4.0, Pelevation < 0.001, Fig. III. 2a).
FIG. III. 2. Patterns of species diversity of phytophagous beetles in natural and anthropogenic
habitats along the elevation gradients. Filled (black) and broken (gray) trend lines indicate
patterns of elevational species diversity in natural and anthropogenic habitats, respectively. (a)

59
Represents patterns of species diversity as described by all phytophagous beetles; (b) represents
patterns of species diversity for weevils; (c) represents patterns of species diversity for leaf
beetles. We used generalized additive models (GAMs) with a basis dimension of k = 5 to
calculate the trend lines.
We did not detect differences in the elevational distribution of phytophagous beetles between
natural and anthropogenic habitats (P > 0.1). Weevils exhibited a unimodal pattern, with rather
low diversity in the lowlands and the highest diversity at 3400 m asl (GAM: n = 65, explained
deviance (ED) = 19 %, Felevation = 2.1, Pelevation < 0.05, Fig. III. 2b). Leaf beetles, in contrast,
showed an elevational diversity pattern similar to that of the total phytophagous beetle
community (GAM: n = 65, explained deviance (ED) = 33.5 %, Felevation = 5.6, Pelevation < 0.0001,
Fig. III. 2c). Patterns for the observed (actual) species richness for the overall, weevils and leaf
beetles datasets were also similar to that of species diversity (i.e. Chao1-estimated species
richness) (Fig. III. S2 a-c).
Path analysis revealed that MAT, food resource abundance (NPP) and diversity of food
resources (FDis) were the strongest predictors of species diversity of phytophagous beetle. Out
of the two climatic variables (MAT and MAP), only MAT showed a strong direct positive effect
on species diversity (standardized path coefficient = 0.39, P = 0.0001). In addition, both MAT
and MAP showed a strong combined effect on species diversity through their positive effects
on resource abundance (MAT: standardized path coefficient = 0.83, P = 0.0001; MAP:
standardized path coefficient = 1.01, P = 0.0001). Conversely, the results also revealed a
significant direct effect of resource diversity (standardized path coefficient = 0.22, P = 0.007)
and herbivore abundance (standardized path coefficient = 0.54, P = 0.001) on species diversity
of phytophagous beetles. However, the effects of resource diversity and herbivore abundance
on species diversity were mediated by resource abundance (Fig. III. 3b). We did not find a
direct effect of MAT on beetle abundance or an effect of LUI on NPP, leaf traits, phytophagous
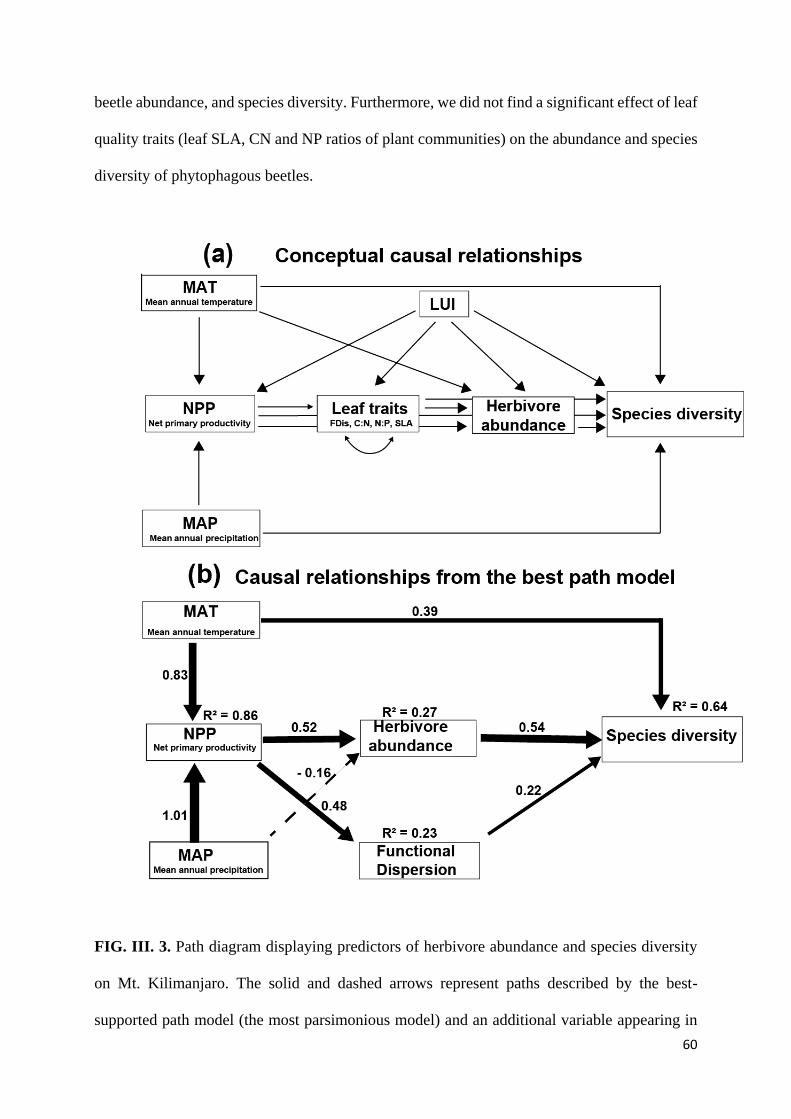
60
beetle abundance, and species diversity. Furthermore, we did not find a significant effect of leaf
quality traits (leaf SLA, CN and NP ratios of plant communities) on the abundance and species
diversity of phytophagous beetles.
FIG. III. 3. Path diagram displaying predictors of herbivore abundance and species diversity
on Mt. Kilimanjaro. The solid and dashed arrows represent paths described by the best-
supported path model (the most parsimonious model) and an additional variable appearing in
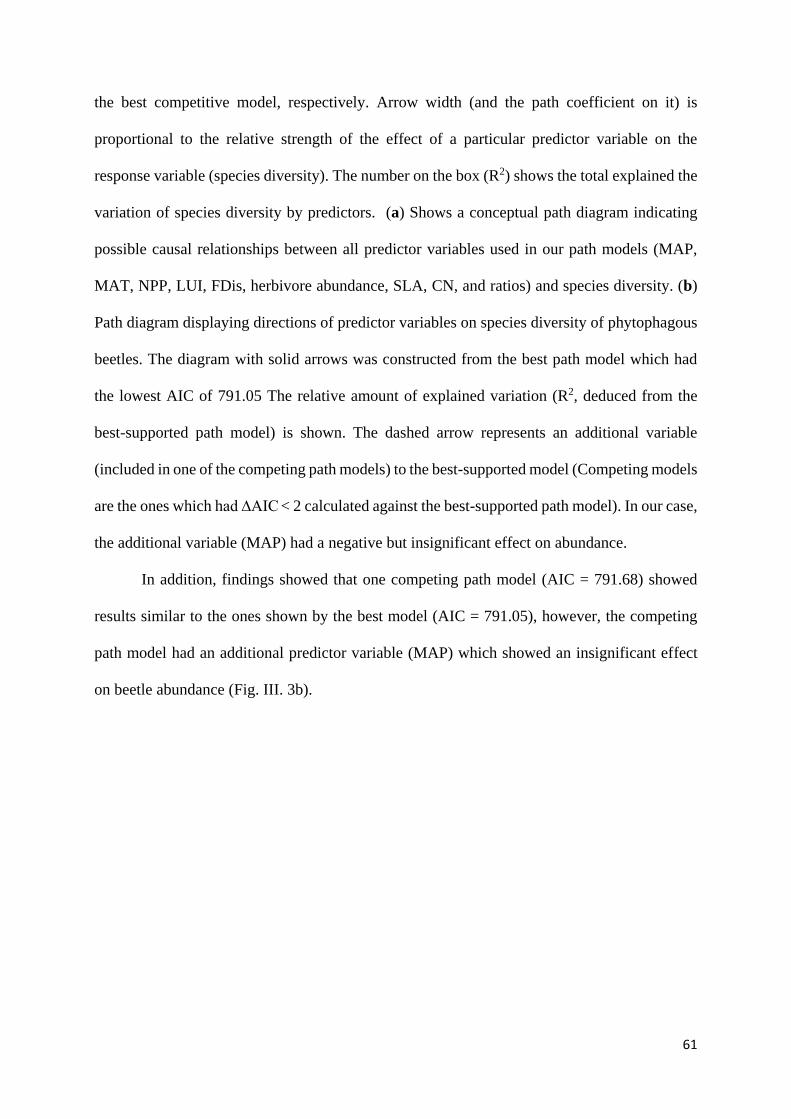
61
the best competitive model, respectively. Arrow width (and the path coefficient on it) is
proportional to the relative strength of the effect of a particular predictor variable on the
response variable (species diversity). The number on the box (R2) shows the total explained the
variation of species diversity by predictors. (a) Shows a conceptual path diagram indicating
possible causal relationships between all predictor variables used in our path models (MAP,
MAT, NPP, LUI, FDis, herbivore abundance, SLA, CN, and ratios) and species diversity. (b)
Path diagram displaying directions of predictor variables on species diversity of phytophagous
beetles. The diagram with solid arrows was constructed from the best path model which had
the lowest AIC of 791.05 The relative amount of explained variation (R2, deduced from the
best-supported path model) is shown. The dashed arrow represents an additional variable
(included in one of the competing path models) to the best-supported model (Competing models
are the ones which had ∆AIC < 2 calculated against the best-supported path model). In our case,
the additional variable (MAP) had a negative but insignificant effect on abundance.
In addition, findings showed that one competing path model (AIC = 791.68) showed
results similar to the ones shown by the best model (AIC = 791.05), however, the competing
path model had an additional predictor variable (MAP) which showed an insignificant effect
on beetle abundance (Fig. III. 3b).
62
Discussion
Our results show that species diversity of the overall phytophagous beetles community
exhibited a bimodal pattern and tendentially declined along the elevation gradient. In addition,
this study found less significant support for hypotheses advocating monotonic decline pattern
(i.e. temperature-mediated resource exploitation hypothesis and the temperature–speciation
hypothesis) and more significant support for hypotheses advocating hump-shaped patterns
along elevation gradients (i.e. the resource availability hypothesis and physiological tolerance
hypothesis). Conversely, findings revealed that food resource abundance (NPP) and diversity
of food resources (FDis of plant communities) were the strongest predictors of species diversity
of phytophagous beetle beside MAT.
Patterns of species diversity
Our results revealed complex patterns of species diversity for overall phytophagous beetles and
the most dominant groups, leaf beetles (Chrysomelidae) and weevils (Curculionidae). Both,
overall and leaf beetles had a similar elevational pattern of species diversity which contrasts
that of weevils. Although our patterns slightly differed from the widely found pattern of
monotonous diversity decline with elevation (Rahbek 1995, Trigas et al. 2013), high elevations
were characterized by low species diversity of overall and individual phytophagous beetle taxa.
We also found that temperature and climate-mediated resources abundance (NPP) at different
elevations were the most important predictors of species diversity of the overall phytophagous
beetles. Importantly, the effect of climate-mediated resource abundance on the diversity of the
overall phytophagous beetle was indirect through the abundance of phytophagous beetles and
resources diversity (FDis of plant communities), whereas temperature had a direct effect on
species diversity.
63
The overall species diversity of phytophagous beetles showed bimodal peaks along the
elevation gradient but we detected no modification of the diversity pattern by human land use.
A similar pattern was also observed in leaf beetles suggesting that the overall pattern of species
diversity for phytophagous beetles might have been shaped by the species diversity of leaf
beetles which were the most abundant among families of phytophagous beetles. In these (the
overall and leaf beetles) patterns, the first peak was detected at low elevations ca. 866m asl
where Savannah and maize fields are found and the second peak at left-skewed mid-elevations
where Podocarpus forests are found. Similar patterns to that of the overall and leaf beetles were
also observed for predators (spiders) and some plant groups in studies conducted in the same
region (Peters et al. 2016). The presence of high species diversity at low elevations and low
species diversity at high elevations could be associated with high and low temperatures,
respectively (Hodkinson 2005, Beck and Chey 2008, Classen et al. 2015). High temperature at
low elevations creates environments that enable high colonization, speciation, reproduction and
survival rates of ectothermic species whereas at high elevations, low temperature creates a harsh
and inhospitable environment which poses a barrier for colonization, gene flow, and speciation
particularly for ectothermic species (Baker and Williams 1988, Hodkinson 2005, Mittelbach et
al. 2007).
Conversely, high species diversity at the left-skewed mid-elevations could be associated
with high productivity of the forests which are found on mountains with dry and arid conditions
at the lowlands (McCain 2007). Evidence suggests high species diversity in habitats with a
larger resource base and vice versa in habitats with low resource base (Mittelbach et al. 2001,
Allen et al. 2002, Beck et al. 2017). Resource-rich habitats enhance bottom-up determinants of
species richness through trophic cascades, provide more diverse niche space in which more
species can coexist, and support larger herbivore populations which lower extinction risk. Thus
the detected bimodal pattern of beetle diversity along elevations was presumably shaped by
64
superimposed patterns driven by temperature (resulting in a monotonic decline) and resource
abundance (resulting in hump-shaped diversity patterns).
In the lowlands of Mt. Kilimanjaro, anthropogenic activities have cleared vegetation in
favor of settlement and agriculture; also the presence of fire-prone and dry savannah ecosystem
presumably has exerted a profound negative effect on resources abundance. Low resource
abundance at higher elevation particularly above the timberline could also be associated with
frequent anthropogenic fires and grazing pressure (Nogués-Bravo et al. 2008).
Interestingly, we observed a rarely described pattern with low species diversity in the
lower montane forests found at ca. 2000 m asl. We suspect variation in microclimate associated
with temperature and light availability within forest microhabitat could account for the
situation. The forest canopy cover (opened vs. closed) is likely to have a profound effect on
temperatures of the forest-floor (Frenne et al. 2013, Jiang et al. 2015, Scheffers et al. 2016,
Scheffers and Williams 2018). Temperature experienced by organisms living within the closed-
canopy forest is cooler than that of open surroundings (Frenne et al. 2013, Jiang et al. 2015).
Available evidence suggests that microhabitats have a differential buffering effect along
elevation and latitude gradients (Scheffers et al. 2014, Scheffers and Williams 2018). The effect
of temperature on organisms living in the forest-floor is likely to be even higher in montane
(than lowland) forests - due to the already low temperatures associated with altitude, in tropical
(than temperate) regions and in ectothermic (than endothermic) organisms. Thus the observed
pattern of low species diversity of phytophagous beetles in the denser and closed-canopy of the
lower montane forests could be due to cooler canopy-mediated temperatures within the lower
montane forests (as opposed to contiguous species-rich open-canopy Podocarpus forests in our
study system).
65
Additionally, forest canopy cover can also prevent penetration of sunlight to understorey
plants a situation which reduces availability of resources to understorey plants (Bartels and
Chen 2010), negatively affects species diversity of plants (Šímová and Storch 2017) and
ultimately that of primary consumers as described in plant diversity hypothesis (Novotny et al.
2006, Basset et al. 2012).
Factors influencing species diversity of phytophagous beetles
We found that temperature and climate-mediated resource abundance (NPP) were the
strongest predictors of species diversity. Temperature had a significant direct positive effect on
species diversity while climate-mediated resource abundance had a stronger but indirect effect
on species diversity through beetles’ abundance and resource diversity (FDis of plant
communities). The positive effect of temperature on species diversity along elevation gradients
has also been proposed in other studies (McCain 2007, Classen et al. 2015, Peters et al. 2016)
and is consistent with our conceptual diagram. Temperature poses differential physiological
effects on organisms by influencing metabolic rates along elevation gradients (Brown et al.
2004, Hodkinson 2005). At higher elevations, low temperatures limit species diversity because
species colonization is severely constraints (McCoy 1990) and resource consumption rates are
reduced (Kaspari et al. 2000, Brown et al. 2004). According to the diversification rate
hypothesis, low temperature slows rates of speciation as it limits biotic interactions, slows
molecular evolution and increases extinction rates (Mittelbach et al. 2007) and the reversed
trend is expected at low elevations.
We found strong evidence suggesting that climate-mediated changes in resource
abundance (NPP) had a positive effect on species diversity through herbivore abundance and
resources diversity (FDis of plant communities) as hypothesized, but we did not detect a direct
effect of climate-mediated changes in resource abundance on species diversity. Other studies
have elucidated the influence of resource abundance on species diversity, however, only a few
66
have managed to disentangle the direct and indirect effects of resource abundance on
biodiversity. The missing direct effect of resource abundance on species diversity underscores
the need to unravel direct and indirect effects when attempting to explain mechanisms affecting
ecological relationships along environmental gradients. Despite existing controversies on the
patterns and mechanisms by which productivity affects species diversity (Abrams 1995,
Mittelbach et al. 2001, Šímová et al. 2013), empirical evidence suggests that productivity may
affect species diversity by influencing the abundance of resources and enhancing the population
sizes of rare species which are often prone to demographic and genetic stochastic events
(Rosenzweig 1992), thereby promoting co-existence of species (Tilman 1982, Chesson 2000,
Brown et al. 2016). In our study, evidence for species co-existence is shown by a strong direct
positive effect of resource diversity (FDis of plant communities) on species diversity of
phytophagous beetles. FDis measures the diversity of plant functional traits in ecosystems
which reflects the degree of functional variability and complementarity of co-occurring species
(Petchey and Gaston 2002, Schleuter et al. 2010). The observed relationships support the
physiological tolerance hypothesis which posits higher diversity of phytophagous beetles in
suitable environmental conditions (Spasojevic et al. 2014). Empirical evidence suggests that
high resource diversity is usually observed in a community which experiences an intense
competition for resources, a situation which leads to a greater functional diversification and
coexistence of species (Grime 2006, Laliberté et al. 2013) rather than exclusion (Janzen 1970,
Bagchi et al. 2014). FDis is often positively correlated with resource abundance and
temperature suggesting that at mid-elevations where temperature and productivity are at
optimum, species diversity of plants (Jiang et al. 2016, Costa et al. 2017) and consumers such
as phytophagous beetles are expected to be highest (Crutsinger et al. 2006, Novotny et al. 2006,
Haddad et al. 2011, Moreira et al. 2016).
Although our results revealed the effect of climate variables on species diversity of
phytophagous beetles through a bottom-up control, there is also strong evidence which unearths
67
the effect of biotic and abiotic factors on insect herbivores through top-down control (Martin et
al. 2013, Roslin et al. 2017, Vidal and Murphy 2018). Studies have also shown that temperature
can have an indirect effect on insect herbivore populations through a top-down control
particularly at lower elevations where higher temperatures play a crucial role in fostering
predator activity and hunting success (Roslin et al. 2017).
Conclusion
Our study reveals interesting species diversity patterns and uncovers strong predictors of
species diversity along elevation gradients. Although the patterns detected in our study differ
from the commonly reported patterns (i.e. a monotonic decline or a hump-shaped pattern), they
provide valuable ecological insights. We associated unexpected decline of species diversity in
lower montane forests with idiosyncratic climatic conditions of the forest microhabitats. This
finding underscores the importance of taking into account unique microclimatic conditions of
complex ecosystems (such as forest microhabitats in our study system) when developing an
understanding of the mechanisms underlying macroecological patterns.
Furthermore, our findings elucidate how species diversity is linked to climate-mediated
resource abundance (NPP) through herbivore abundance and resource diversity (FDis of plant
communities). The lack of a direct pathway through which resource abundance affects species
diversity suggests that indirect effects are key to understanding mechanisms underlying
ecological relationships. Conversely, a strong positive relationship detected between species
diversity of phytophagous beetles and plant resource diversity suggests that as ecosystems
structural complexity is expected to shift towards structurally less complex ecosystems due to
increased human influences, species diversity and ecological patterns are likely to follow a
concordant decline and shift, respectively. In order to halt such decline and promote species
diversity, efforts to restore and conserve ecosystem structural complexity and associated
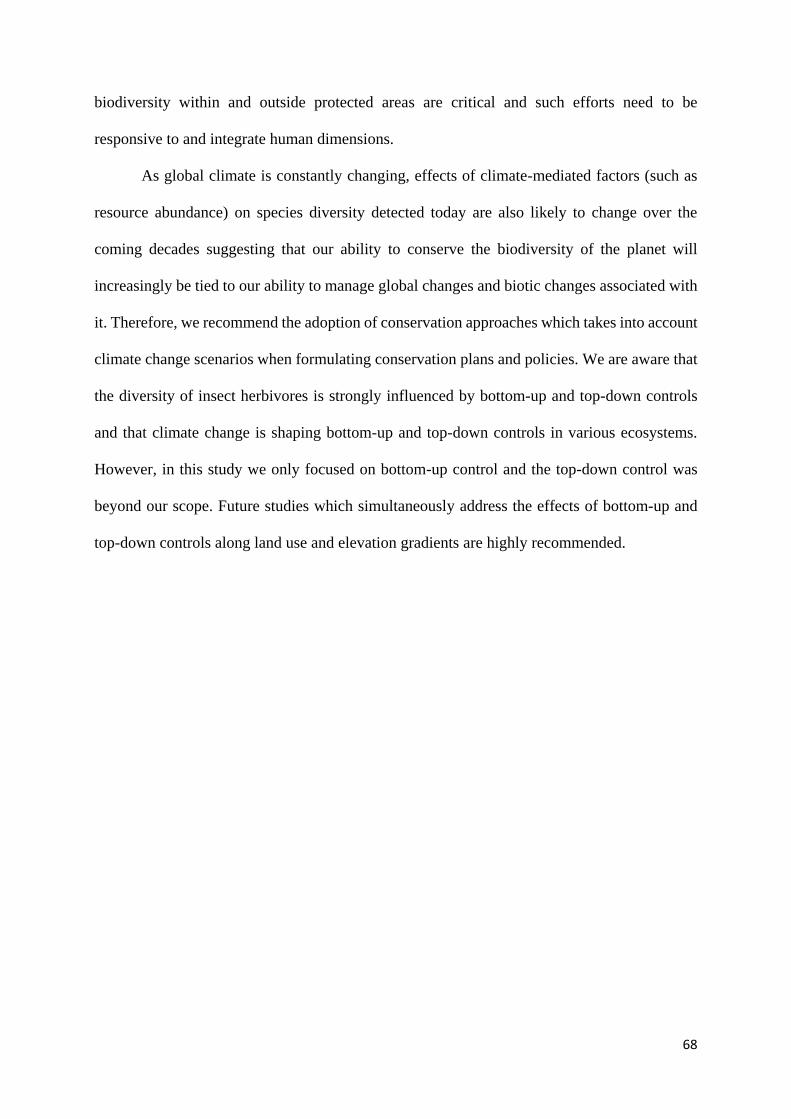
68
biodiversity within and outside protected areas are critical and such efforts need to be
responsive to and integrate human dimensions.
As global climate is constantly changing, effects of climate-mediated factors (such as
resource abundance) on species diversity detected today are also likely to change over the
coming decades suggesting that our ability to conserve the biodiversity of the planet will
increasingly be tied to our ability to manage global changes and biotic changes associated with
it. Therefore, we recommend the adoption of conservation approaches which takes into account
climate change scenarios when formulating conservation plans and policies. We are aware that
the diversity of insect herbivores is strongly influenced by bottom-up and top-down controls
and that climate change is shaping bottom-up and top-down controls in various ecosystems.
However, in this study we only focused on bottom-up control and the top-down control was
beyond our scope. Future studies which simultaneously address the effects of bottom-up and
top-down controls along land use and elevation gradients are highly recommended.
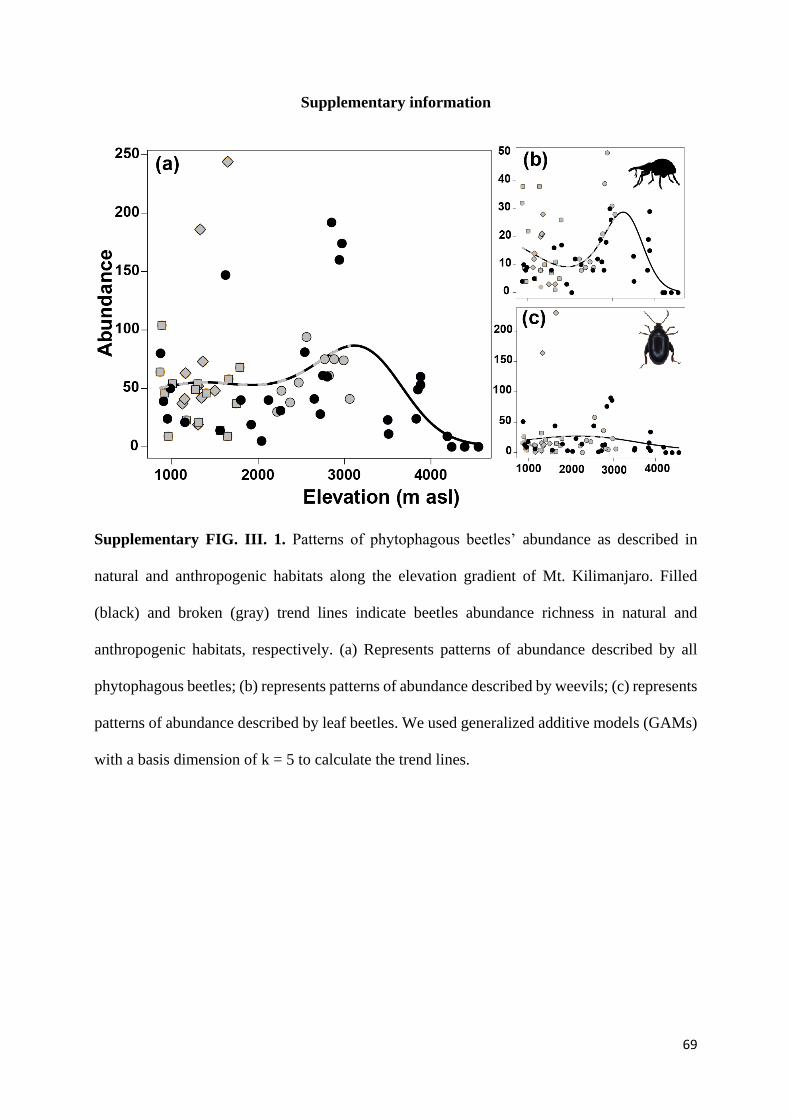
69
Supplementary information
Supplementary FIG. III. 1. Patterns of phytophagous beetles’ abundance as described in
natural and anthropogenic habitats along the elevation gradient of Mt. Kilimanjaro. Filled
(black) and broken (gray) trend lines indicate beetles abundance richness in natural and
anthropogenic habitats, respectively. (a) Represents patterns of abundance described by all
phytophagous beetles; (b) represents patterns of abundance described by weevils; (c) represents
patterns of abundance described by leaf beetles. We used generalized additive models (GAMs)
with a basis dimension of k = 5 to calculate the trend lines.
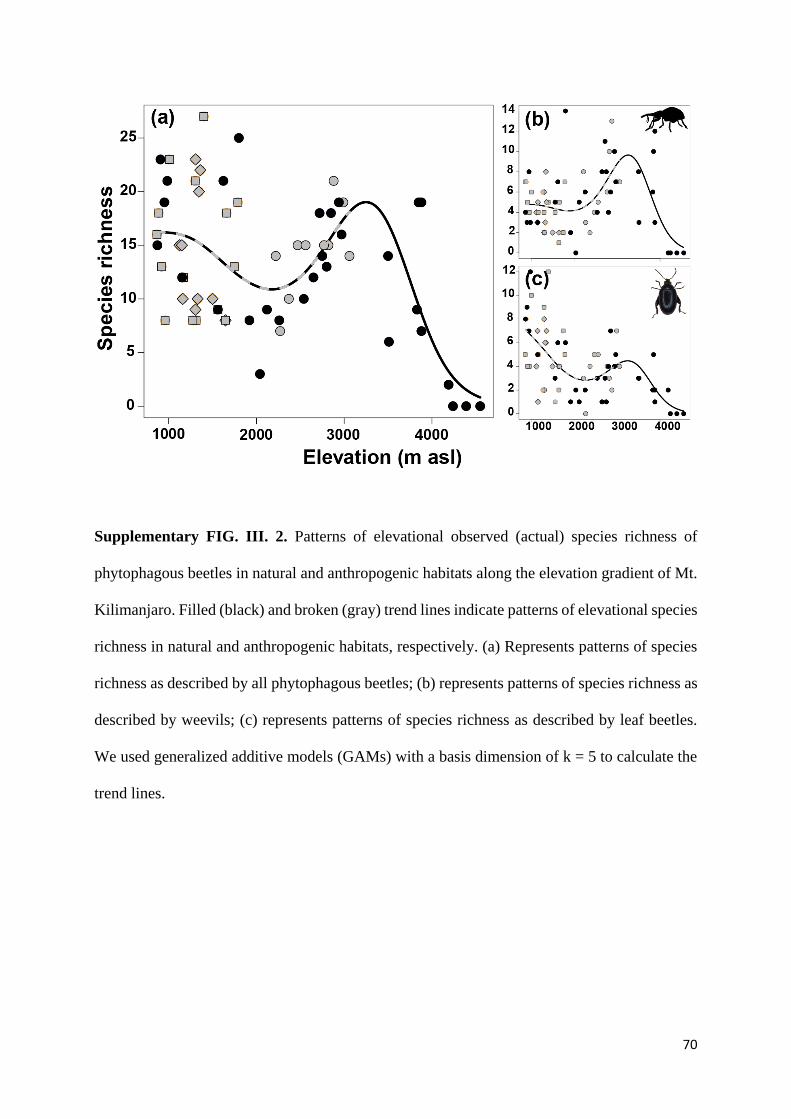
70
Supplementary FIG. III. 2. Patterns of elevational observed (actual) species richness of
phytophagous beetles in natural and anthropogenic habitats along the elevation gradient of Mt.
Kilimanjaro. Filled (black) and broken (gray) trend lines indicate patterns of elevational species
richness in natural and anthropogenic habitats, respectively. (a) Represents patterns of species
richness as described by all phytophagous beetles; (b) represents patterns of species richness as
described by weevils; (c) represents patterns of species richness as described by leaf beetles.
We used generalized additive models (GAMs) with a basis dimension of k = 5 to calculate the
trend lines.
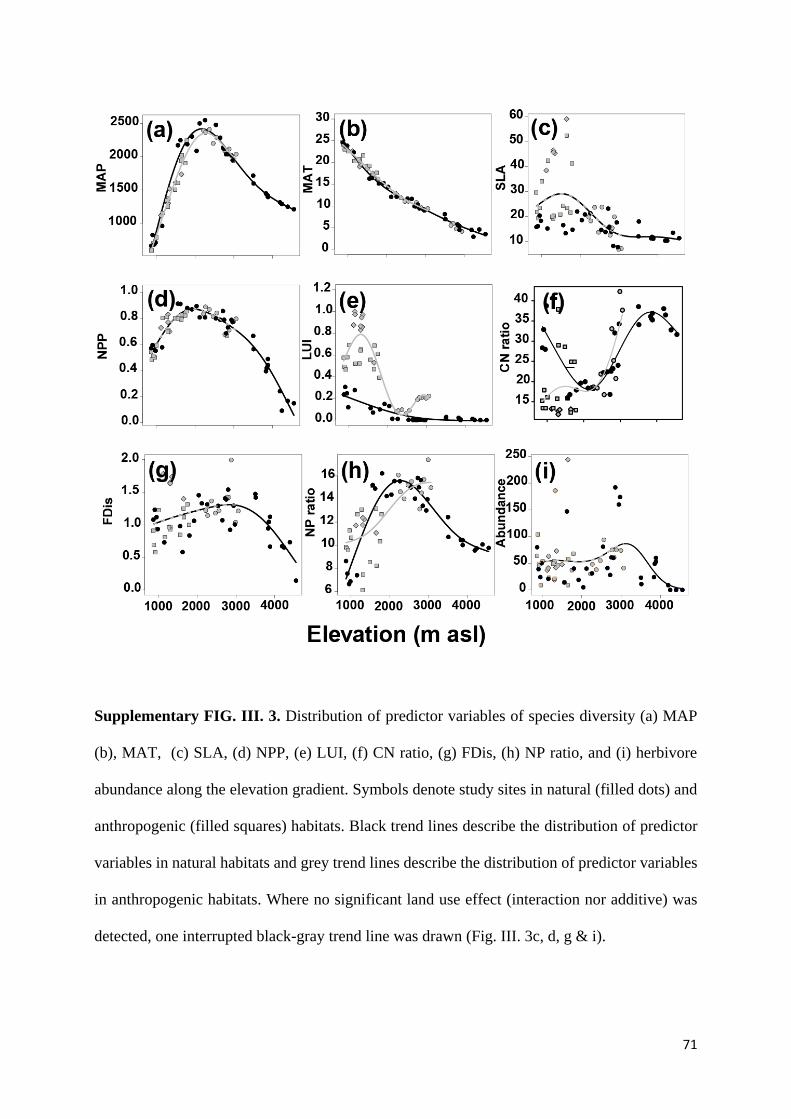
71
Supplementary FIG. III. 3. Distribution of predictor variables of species diversity (a) MAP
(b), MAT, (c) SLA, (d) NPP, (e) LUI, (f) CN ratio, (g) FDis, (h) NP ratio, and (i) herbivore
abundance along the elevation gradient. Symbols denote study sites in natural (filled dots) and
anthropogenic (filled squares) habitats. Black trend lines describe the distribution of predictor
variables in natural habitats and grey trend lines describe the distribution of predictor variables
in anthropogenic habitats. Where no significant land use effect (interaction nor additive) was
detected, one interrupted black-gray trend line was drawn (Fig. III. 3c, d, g & i).
72
Chapter IV: Primary productivity and habitat protection predict species richness and
community biomass of large mammals on Mt. Kilimanjaro.
Summary
Aim: Despite their large functional and cultural importance, the patterns and drivers of large
mammal diversity along elevational gradients of tropical mountains remain poorly understood.
Here, we evaluate the importance of climate, resources and human impact for the distribution,
species richness and community biomass of wild mammals along a 3600 m elevational gradient
on Mt. Kilimanjaro, Tanzania.
Location: Mt. Kilimanjaro, Tanzania
Methods: Mammal species richness was explored with camera traps on 66 study sites spread
over six natural and seven disturbed habitats along an elevational gradient from 870 to 4550 m
asl. We applied path analysis to unravel the direct and indirect effects of temperature and
precipitation, primary productivity, land use, land area, the protection of habitats and the
occurrence of domestic mammals on the species richness and community biomass of wild
mammals.
Results: Both species richness and community biomass of wild mammals showed a unimodal
distribution with elevation and peaked in the montane zone of Kilimanjaro. However, the peak
shifted significantly to lower elevations when only protected habitats were considered. Path
analyses revealed that wild mammal species richness and community biomass were mainly
driven by variation in net primary productivity, land area and the protection of habitats whereas
a direct temperature effect was less important.
Main conclusions: Our study underscores the importance of food resources for the
establishment of diversity gradients in large mammals. While temperature has been revealed as

73
an important direct driver of diversity in several ectothermic taxa, its effect on endothermic
organisms appears to be indirect, via a modulation of resources. Moreover, our study reveals
the sensitivity of large mammals to human impact and points to the pivotal role of protected
areas for their long-term conservation on tropical mountains.
Keywords altitudinal gradients, biomass, diversity gradients, energy-richness hypothesis, food
resources, land use, Mammalia, nature conservation, species-area hypothesis, temperature-
richness hypothesis
74
Introduction
Elevational gradients in species richness are well depicted in ecology, yet there is no consensus
about the major drivers (Rahbek 1995, Peters et al. 2016, Beck et al. 2017). A range of
deterministic hypotheses have been suggested that highlight the influence of energy
availability, climatic factors, and history on biodiversity gradients (Pianka 1966, McCain 2004,
2007, Brown 2014). However, it is often unclear how such environmental factors operate,
affecting species richness patterns either directly or indirectly, which hampers predictions on
the influence of environmental changes on biodiversity (Classen et al. 2015).
Amongst the most supported predictors of species richness are temperature and the
availability of energy resources (Allen et al. 2002, Mittelbach et al. 2007, Hurlbert and Stegen
2014). The ‘temperature-richness hypothesis’ predicts that temperature restricts species’
occurrence by imposing physiological constraints and by influencing ecological and
evolutionary processes (Belmaker and Jetz 2015). The ‘energy-richness hypothesis’, in
contrast, states that in ecosystems that are highly productive, resources are predicted to be so
abundant that more and larger populations are able to prevail than in less productive ecosystems
(Allen et al. 2002, Beck et al. 2017). Other hypotheses used for explaining gradients in species
richness are the ‘water availability hypothesis’ and the ‘area hypothesis’. The ‘water availability
hypothesis’ assumes that access to water is limiting species richness, either via a direct
dependence of species on water sources or via energy-related effects such as the positive effect
of precipitation on net primary productivity (Hawkins et al. 2003). The ‘area hypothesis’ rests
on the idea that larger areas can sustain larger and more viable populations and offer more
opportunities for allopatric speciation than smaller areas (Rosenzweig 1995, Hawkins et al.
2003, Romdal and Grytnes 2007).
Despite their large functional and cultural importance, little is known about the patterns
and drivers of large mammal diversity along elevations. Research on the distribution of
mammal diversity on mountains has until now focused on small mammals (mostly on
75
Insectivora, Rodentia with body weights of 2 g – 5 kg), which nearly exclusively show
unimodal distributions of elevational diversity (e.g. Brown 2001, McCain 2004, Rowe et al.
2014, McCain 2005, but see Di Bitetti et al. 2013, Ferreira de Pinho et al. 2017). In contrast,
research on large mammals along altitudinal gradients has been scarce. Large mammals are of
high ecological importance and are often used as flagship-species for conservation (Williams
et al. 2000). They play a crucial role in controlling ecosystem processes such as nutrient cycling
and energy flow by turning over high amounts of biomass (McNaughton et al. 1988, Veldhuis
et al. 2018). Meta-analyses suggest that large mammals are particularly threatened by the loss
of natural habitats and hunting (Hegerl et al. 2017). Of the known 5488 mammal species, 22%
have been categorized as threatened or extinct by the 2008 IUCN Red List (IUCN, 2016).
Here we investigated the species richness of large mammal communities and its
potential predictors along an elevational gradient spanning 3600 m and encompassing all major
natural and anthropogenic habitats of the southern slopes of the Mt. Kilimanjaro, Tanzania.
Tropical mountains are ideal model systems to understand the factors driving biodiversity. They
exhibit extreme climatic gradients at small spatial scales which permit standardized, unbiased
biodiversity assessments in differing environments. However, tropical mountains are under
pressure by increasing human impact (Nogués-Bravo et al. 2008). Due to the high sensitivity
of large mammal species to human impact, the occurrence of large mammals on mountains may
strongly depend on the intensity of land use and the existence of large protected areas in
mountain ecosystems.
Most studies on elevational biodiversity focus on patterns of species richness although
the utilization of mere taxonomic data may limit the predictive strength of assemblage studies
(Fountain-Jones et al. 2015). The assessment of functionally relevant traits such as body mass
may contribute to a more mechanistic understanding of the drivers of diversity and of the
changes in mammal-mediated ecosystem functions. Biomass is probably the single, most
important characteristic of individuals and communities, which defines metabolic rates,
76
energetic demands, and the susceptibility of animals to human impact (Brown et al. 2004,
Schipper et al. 2008).
By using path analysis, we unraveled the direct and indirect effects of climate, energy
availability, area, and human impact on the species richness and biomass of wild mammals. We
analysed the following predictions:
1. The biodiversity and community biomass of large mammals is constrained by energy
availability (Buckley et al. 2012). Due to their size and endothermic metabolism, large
mammals have very high energetic demands, which limit population sizes and constrain
the number of species which can coexist in local communities (Buckley et al. 2012).
We, therefore, expect that species richness and biomass of wild mammals is positively
correlated to the net primary productivity of ecosystems along elevation and land use
gradients on Mt. Kilimanjaro.
2. Elevational richness and community biomass is constrained by climate. Temperature
and precipitation may influence species richness indirectly, through their influence on
net primary productivity, or directly by influencing metabolic costs for endothermy
(Buckley et al. 2012), filtering species from unsuitable climates (i.e. from extremely dry
or cold elevations), or by a positive influence of temperature on speciation rates
(Mittelbach et al. 2007).
3. Smaller areas of land harbour fewer resources, less solar energy, less refugia and a lower
habitat diversity than larger areas which may limit the number of individuals and species
which can coexist (Lomolino 2001). We therefore expect that the decrease in land area
with increasing elevation is correlated with a loss of mammal species richness.

77
4. Mammal communities are influenced by human impact on mountains. We expect
species richness and community biomass of wild mammals to be higher in protected
than in unprotected areas. Additionally, we expect that the species richness of mammals
decreases with increasing land use intensity and with the occurrence of domestic
mammals (Di Bitetti et al. 2013).
78
Methods
Study area
The study was carried out on Mount Kilimanjaro (2°54’-3°25’S, 37°0’-37°43’E) in northern
Tanzania. Mt. Kilimanjaro is situated 300 km south from the equator and encompasses an
elevational range from 700 m to 5895 m asl. The mountain is exposed to an equatorial day-time
climate with two apparent rainy seasons: a long rainy season from around March to May and a
short rainy season around November. Temperature decreases linearly with elevation at
approximately 6.1 °C per 1000 m of elevation from about 25 °C at 870 m asl to -8°C at the
summit. Mean annual precipitation is unimodally distributed with a peak of ~2700 mm at
around 2200 m asl (Appelhans et al. 2016).
Research was conducted on 66 study plots established in the framework of the KiLi
project (DFG research unit FOR 1246) on the southern slopes of Mt. Kilimanjaro (Peters et al.
2016). The study plots ranged from 870 to 4550 m asl and were equally distributed among the
13 major natural and anthropogenic habitat types in the region (5-6 study plots per habitat type).
Each study plot covered an area of 0.25 ha. Natural habitats included savanna (871 – 1153 m
asl), lower montane forest (1560 – 2020 m asl), Ocotea forest (2120 – 2750 m asl), Podocarpus
forest (2800 – 2970 m asl), Erica forest (3500 – 3900 m asl) and alpine Helichrysum scrub
vegetation (3880 – 4550 m asl). Anthropogenic habitats consisted of maize fields (866 – 1009
m asl), grasslands (regularly cut by hand for cattle feeding, 1303 – 1748 m asl), commercial
coffee plantations (1124 – 1648 m asl) and Chagga agroforestry (1169 – 1788 m asl), selectively
logged Ocotea forest (2220 – 2560 m asl) and burned Podocarpus (2770 – 3060 m asl) and
Erica forests (3500 – 3880 m asl). The five study plots per habitat type were distributed in a
way to reflect a within-habitat type elevation gradient to detect fine-scale changes in
biodiversity with changing elevation. Spatial distances among study sites were larger than 300
m in all cases. If possible, study sites were established in core zones of larger areas of the
respective habitat type, so that effects of transition zones were minimized. Anthropogenic
79
habitats were classified as either ‘low land use intensity’ or ‘high land use intensity’ habitats
based on their level of disturbance (see Supplementary Table IV. 1). All study sites above 1800
m asl, which were situated inside Mt. Kilimanjaro National Park, and additionally two lowland
savanna sites, which were situated in wildlife conservation areas, were classified as ‘protected’.
All other study sites were classified as ‘unprotected’.
Climate and Net Primary Productivity (NPP)
Study plots were equipped with temperature sensors installed approximately 2 m above the
ground (Appelhans et al. 2016). The sensors measured temperatures in 5-min intervals over two
years and mean annual temperature (MAT) was calculated as the average across all
measurements per study site (Appelhans et al. 2016). Mean annual precipitation (MAP) was
collected with a network of about 70 rain gauges distributed over all habitat types and elevations
on Mt. Kilimanjaro (Appelhans et al. 2016). Since precipitation data was not available for all
study plots, mean annual precipitation was regionally interpolated using a co-kringing approach
(Appelhans et al. 2016). We used the normalized difference vegetation index (NDVI) as a
surrogate for net primary productivity (Detsch et al. 2016, Peters et al. 2016). NDVI estimations
were exclusively based on MODIS Aqua product MYD13Q1 with a horizontal resolution of
250 m x 250 m (Appelhans et al. 2016). More methodological details and original data are
presented in Appelhans et al. (2016), Detsch et al. (2016), and Peters et al. (2016).
Monitoring of mammals
Mammal monitoring was carried out from May to September 2016 with a combination of
camera trapping and standardized transect-based indirect observations on mammalian dung
(Trolle et al. 2008). Five camera traps (Bushnell Trophy Cam HD Essential, model 119736)
were installed on or in the direct vicinity (within a distance of 50 m) of each of the 66 study
plots. Cameras were placed along trails or at animal latrine sites to increase the chance of
80
mammal detection and were fastened to trees or poles at a height of 70 - 140 cm above the
ground depending on local topography. The camera traps were left in the field for a duration of
14 days at each plot, amounting to 70 trap nights per plot and 4620 trap nights in total. Camera
traps were activated through a motion sensor. After activation, the cameras were programmed
to take videos of a length of 20 seconds, with a minimum interval of 10 seconds between
sequences. At night, cameras operated with infrared light. For each plot, two videos of the same
mammal were only considered to be independent shots if there was a time lapse of > 1 h between
them. This approach is called hourly event count and is widely used to minimize the possibility
of counting dwelling individuals numerous times (Hegerl et al. 2017). In addition to camera
traps, systematic transect walks were conducted on each plot to document mammalian faeces.
Each study plot was divided into 25 parallel transects, 2 m apart and with a length of 50 m. The
observer walked all transects and recorded faeces located within a strip of 1 m each to the left
and right from each transect. Transect walks were performed twice on each plot, once at the
time of installing camera traps and once at the end of the experiment. Faeces were identified
using Stuart and Stuart (2000) while data on the corresponding mammal species body weight
and trophic guild was taken from Kingdon et al. (2013) and Kingdon (2015). In case the body
weight of males and females was listed, we always calculated the average body weight across
sexes. On each study plot, species richness was calculated by counting the number of all species
recorded by the five camera traps and by the systematic monitoring of mammalian faeces.
Community biomass was computed by summing up the body weight of the individuals of all
species across hourly event counts. For calculating the biomass of the mammal community,
only camera trap samples were taken into account. Please note that the way we measured
community biomass provides an estimate, which can only be evaluated relative to the estimates
at other sites but not as an absolute measure of the mammal community biomass.
81
Statistical analysis
The distribution of species richness and the community biomass of wild mammals (hereafter
termed mammal community biomass) and trophic subgroups (herbivores, omnivores,
carnivores) along the elevational gradient were examined with generalized additive models
(GAMs). GAMs were conducted jointly for all mammals and separately for the three trophic
guilds herbivores, omnivores and carnivores. Rather than designating a specific functional
formula to the relationship between the response and predictor variables, in GAMs, non-
parametric smoothers are employed to characterize potential nonlinear or linear relationships
between explanatory and response variables. GAMs were computed applying the ‘gam’
function from the R package ‘mgcv’ (Wood, 2006). In case of species richness, we set the data
family of GAMs to ‘Poisson’ and selected a log-link function. We checked for signs of
overdispersion in the data but did not detect strong deviations from a Poisson distribution. For
community biomass as the response variable we employed the Gaussian family. Due to the
extreme variation in the data, biomass data was log-transformed [log (x +1)] prior to analyses.
For both species richness and community biomass, the basis dimension of the smoothing term
(k) was set to five to prevent over-parameterization of GAMs.
For each response variable we, first, constructed a model including elevation and land
use type as explanatory variables (factorial: natural versus anthropogenic habitat) which models
individual trend lines for each land use type. If the interaction term showed a significance level
of P > 0.1, we deleted it and used a simple additive effect model (y ~ elevation + land use). In
this case, the model would have the same trend line in natural and anthropogenic habitats but
the intercepts are allowed to vary. We successively deleted elevation, land use or both
explanatory variables from the model in case their significance level exceeded P > 0.1. As we
detected a significant effect of protected areas on all response variables in path analyses (see
below), we additionally ran and visualized GAMs based on a data set including study plots
situated in protected areas only.
82
Applying path analysis, we disentangled the direct and indirect effects of climate, net
primary productivity (NPP), land area, land use, protection status, and the presence of domestic
animals on the species richness and community biomass of wild mammals. Due to the overall
low number of mammal species, we conducted path analyses only for total mammal species
richness and community biomass but not for single trophic guilds. In addition, we assumed that
NPP along the elevational gradient is driven by changes in mean annual temperature and mean
annual precipitation (Peters et al. 2016). Finally, we assumed that the species richness of
domestic mammals is determined by land use, the protection status of plots and NPP.
For the community biomass of wild mammals as the final endogenous variable, the same
response and predictor variables as for species richness were used, with the exception that
instead of species richness of domestic mammals, community biomass of domestic mammals
was used as an explanatory variable. Both the community biomass of domestic mammals and
the community biomass of wild mammals was log-transformed [log (x+1)] prior to analyses.
Potential path combinations were pre-selected by defining a set of competitive
explanatory models for each endogenous variable using multi-model inference based on the
Akaike information criterion (AIC). Due to a rather low sample size in comparison to the
number of estimated parameters we used the AICC with a second-order bias correction for
inferring the support of individual models. The ‘dredge’ function of the R package ‘MuMIn’
was applied to assess the AICC for the full model with all explanatory variables and for all
nested models including the null model. All models within the range of ∆AICC < 2 were
considered for path analyses.
Since species richness data of wild and domestic mammals followed a Poisson
distribution, it was not possible to use statistical applications for path analysis which presume
normally distributed data. Instead, we performed piecewise structural equation modelling
(SEM) on the basis of the d-sep test for all best-supported models with the ‘sem.fit’ function of
the R package ‘piecewiseSEM’ (Shipley 2009, 2013, Lefcheck 2016). For each path model, the

83
AICC was calculated and the path model with the lowest AICC was selected as the best model
(Shipley 2013). To assess whether path coefficients were significant and positive or negative,
the ‘sem.coefs’ function was employed. R²- values were allocated to endogenous variables with
the ‘sem.model.fits’ function.
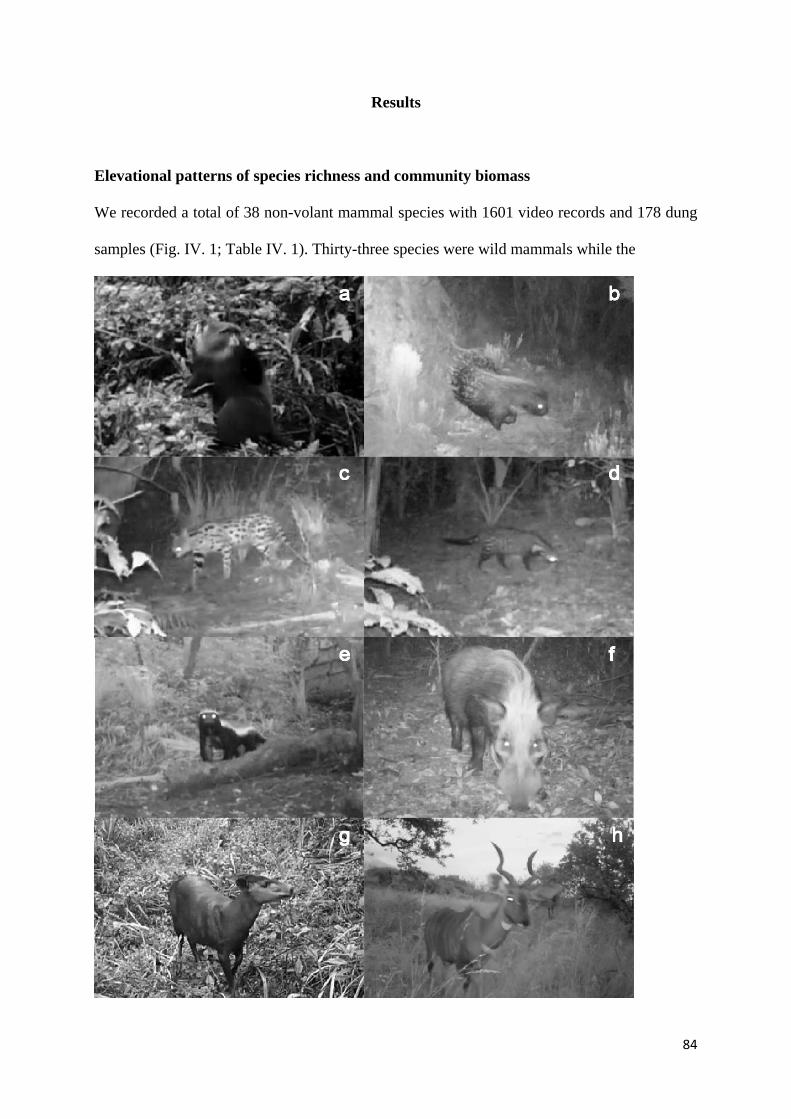
84
Results
Elevational patterns of species richness and community biomass
We recorded a total of 38 non-volant mammal species with 1601 video records and 178 dung
samples (Fig. IV. 1; Table IV. 1). Thirty-three species were wild mammals while the
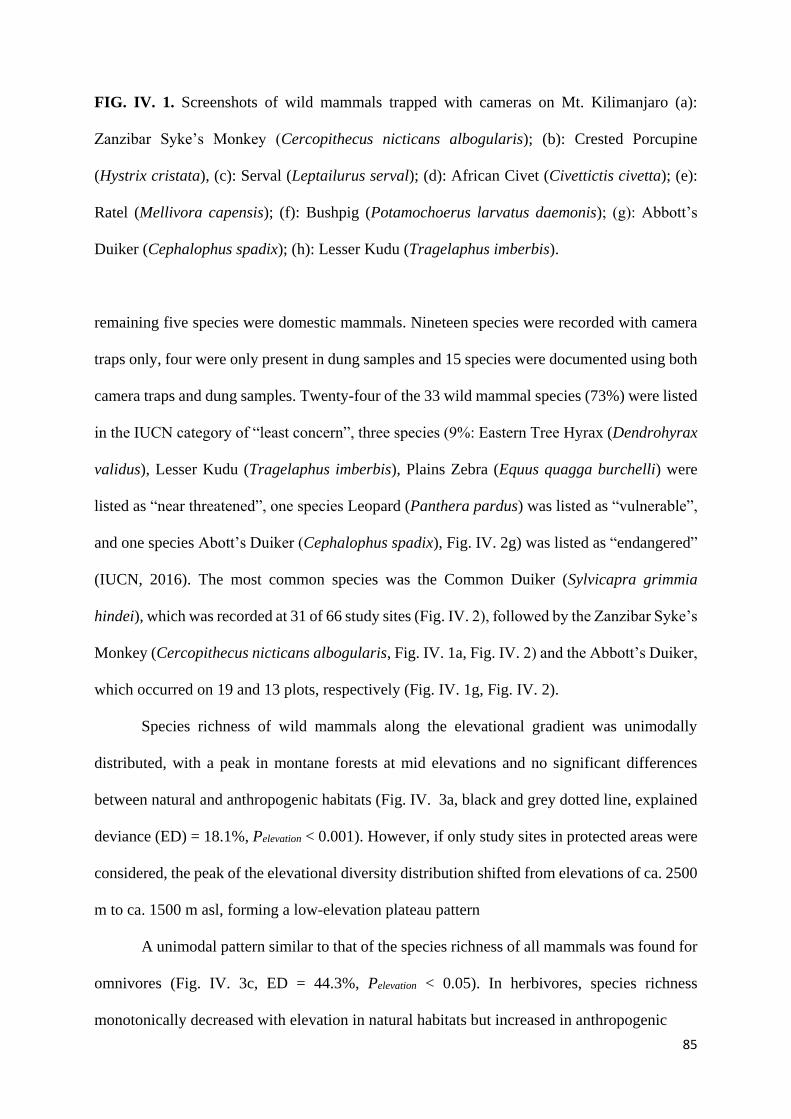
85
FIG. IV. 1. Screenshots of wild mammals trapped with cameras on Mt. Kilimanjaro (a):
Zanzibar Syke’s Monkey (Cercopithecus nicticans albogularis); (b): Crested Porcupine
(Hystrix cristata), (c): Serval (Leptailurus serval); (d): African Civet (Civettictis civetta); (e):
Ratel (Mellivora capensis); (f): Bushpig (Potamochoerus larvatus daemonis); (g): Abbott’s
Duiker (Cephalophus spadix); (h): Lesser Kudu (Tragelaphus imberbis).
remaining five species were domestic mammals. Nineteen species were recorded with camera
traps only, four were only present in dung samples and 15 species were documented using both
camera traps and dung samples. Twenty-four of the 33 wild mammal species (73%) were listed
in the IUCN category of “least concern”, three species (9%: Eastern Tree Hyrax (Dendrohyrax
validus), Lesser Kudu (Tragelaphus imberbis), Plains Zebra (Equus quagga burchelli) were
listed as “near threatened”, one species Leopard (Panthera pardus) was listed as “vulnerable”,
and one species Abott’s Duiker (Cephalophus spadix), Fig. IV. 2g) was listed as “endangered”
(IUCN, 2016). The most common species was the Common Duiker (Sylvicapra grimmia
hindei), which was recorded at 31 of 66 study sites (Fig. IV. 2), followed by the Zanzibar Syke’s
Monkey (Cercopithecus nicticans albogularis, Fig. IV. 1a, Fig. IV. 2) and the Abbott’s Duiker,
which occurred on 19 and 13 plots, respectively (Fig. IV. 1g, Fig. IV. 2).
Species richness of wild mammals along the elevational gradient was unimodally
distributed, with a peak in montane forests at mid elevations and no significant differences
between natural and anthropogenic habitats (Fig. IV. 3a, black and grey dotted line, explained
deviance (ED) = 18.1%, Pelevation < 0.001). However, if only study sites in protected areas were
considered, the peak of the elevational diversity distribution shifted from elevations of ca. 2500
m to ca. 1500 m asl, forming a low-elevation plateau pattern
A unimodal pattern similar to that of the species richness of all mammals was found for
omnivores (Fig. IV. 3c, ED = 44.3%, Pelevation < 0.05). In herbivores, species richness
monotonically decreased with elevation in natural habitats but increased in anthropogenic
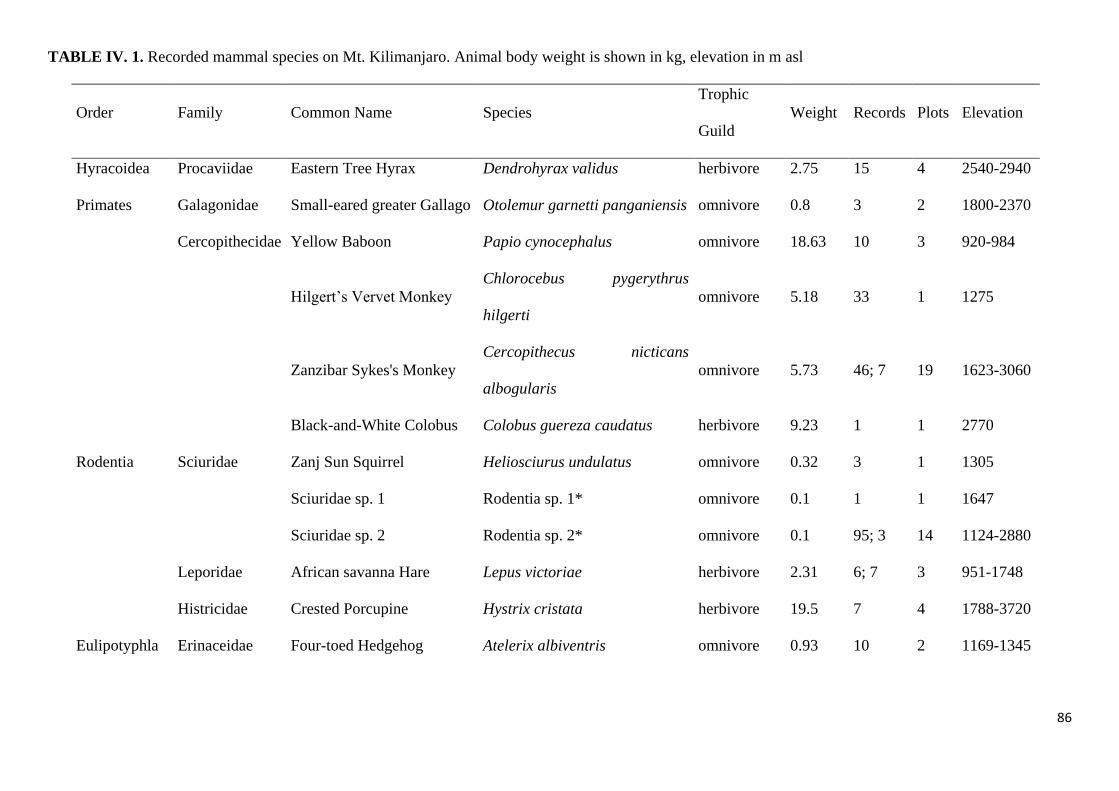
86
TABLE IV. 1. Recorded mammal species on Mt. Kilimanjaro. Animal body weight is shown in kg, elevation in m asl
Order Family Common Name Species
Trophic
Guild
Weight Records Plots Elevation
Hyracoidea Procaviidae Eastern Tree Hyrax Dendrohyrax validus herbivore 2.75 15 4 2540-2940
Primates Galagonidae Small-eared greater Gallago Otolemur garnetti panganiensis omnivore 0.8 3 2 1800-2370
Cercopithecidae Yellow Baboon Papio cynocephalus omnivore 18.63 10 3 920-984
Hilgert’s Vervet Monkey
Chlorocebus pygerythrus
hilgerti
omnivore 5.18 33 1 1275
Zanzibar Sykes's Monkey
Cercopithecus nicticans
albogularis
omnivore 5.73 46; 7 19 1623-3060
Black-and-White Colobus Colobus guereza caudatus herbivore 9.23 1 1 2770
Rodentia Sciuridae Zanj Sun Squirrel Heliosciurus undulatus omnivore 0.32 3 1 1305
Sciuridae sp. 1 Rodentia sp. 1* omnivore 0.1 1 1 1647
Sciuridae sp. 2 Rodentia sp. 2* omnivore 0.1 95; 3 14 1124-2880
Leporidae African savanna Hare Lepus victoriae herbivore 2.31 6; 7 3 951-1748
Histricidae Crested Porcupine Hystrix cristata herbivore 19.5 7 4 1788-3720
Eulipotyphla Erinaceidae Four-toed Hedgehog Atelerix albiventris omnivore 0.93 10 2 1169-1345
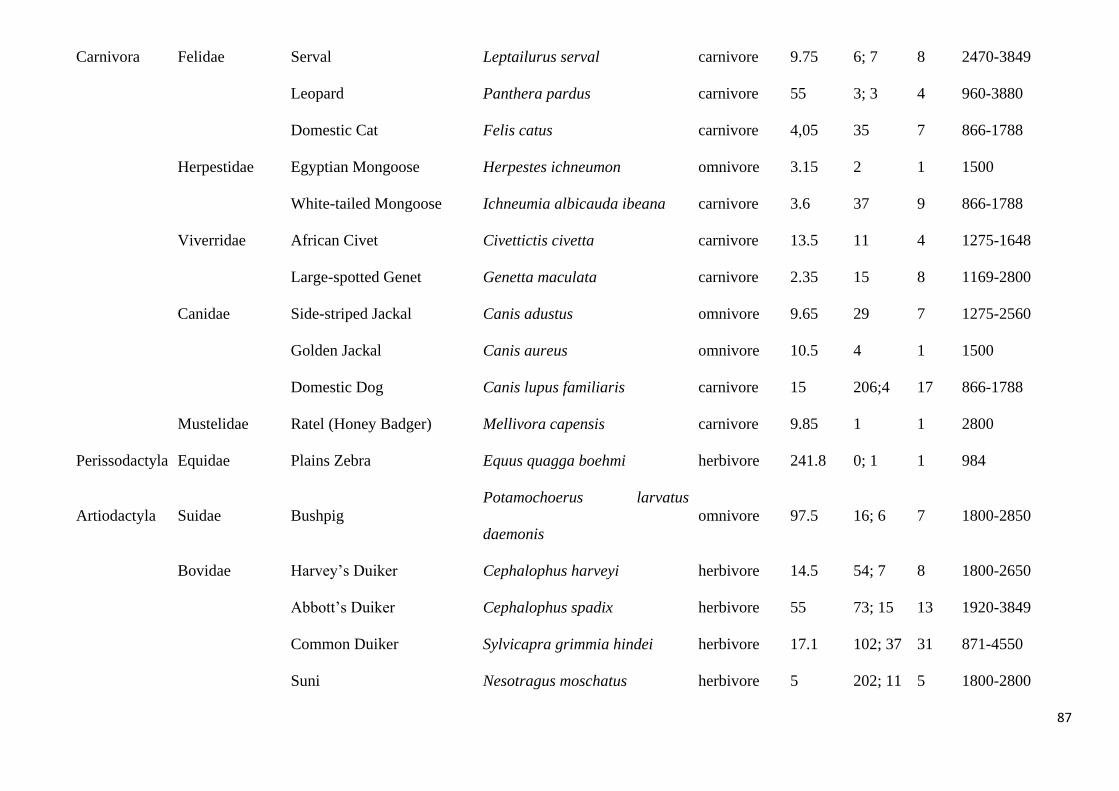
87
Carnivora Felidae Serval Leptailurus serval carnivore 9.75 6; 7 8 2470-3849
Leopard Panthera pardus carnivore 55 3; 3 4 960-3880
Domestic Cat Felis catus carnivore 4,05 35 7 866-1788
Herpestidae Egyptian Mongoose Herpestes ichneumon omnivore 3.15 2 1 1500
White-tailed Mongoose Ichneumia albicauda ibeana carnivore 3.6 37 9 866-1788
Viverridae African Civet Civettictis civetta carnivore 13.5 11 4 1275-1648
Large-spotted Genet Genetta maculata carnivore 2.35 15 8 1169-2800
Canidae Side-striped Jackal Canis adustus omnivore 9.65 29 7 1275-2560
Golden Jackal Canis aureus omnivore 10.5 4 1 1500
Domestic Dog Canis lupus familiaris carnivore 15 206;4 17 866-1788
Mustelidae Ratel (Honey Badger) Mellivora capensis carnivore 9.85 1 1 2800
Perissodactyla Equidae Plains Zebra Equus quagga boehmi herbivore 241.8 0; 1 1 984
Artiodactyla Suidae Bushpig
Potamochoerus larvatus
daemonis
omnivore 97.5 16; 6 7 1800-2850
Bovidae Harvey’s Duiker Cephalophus harveyi herbivore 14.5 54; 7 8 1800-2650
Abbott’s Duiker Cephalophus spadix herbivore 55 73; 15 13 1920-3849
Common Duiker Sylvicapra grimmia hindei herbivore 17.1 102; 37 31 871-4550
Suni Nesotragus moschatus herbivore 5 202; 11 5 1800-2800
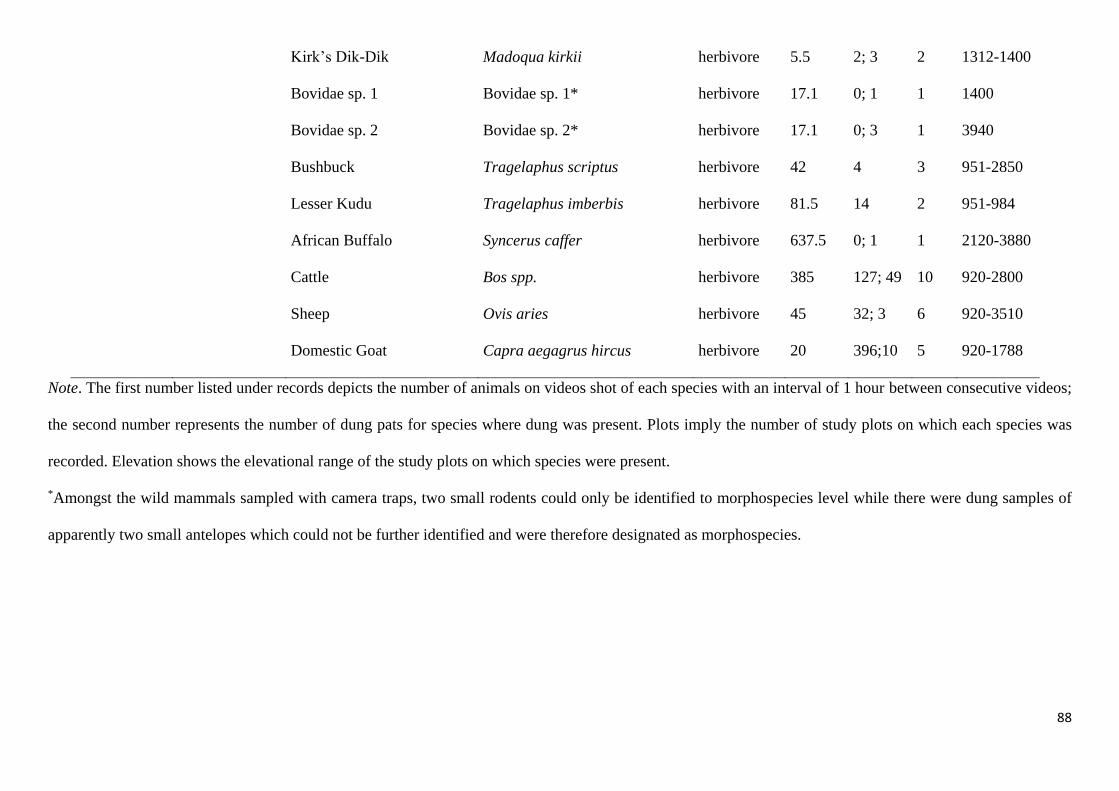
88
Kirk’s Dik-Dik Madoqua kirkii herbivore 5.5 2; 3 2 1312-1400
Bovidae sp. 1 Bovidae sp. 1* herbivore 17.1 0; 1 1 1400
Bovidae sp. 2 Bovidae sp. 2* herbivore 17.1 0; 3 1 3940
Bushbuck Tragelaphus scriptus herbivore 42 4 3 951-2850
Lesser Kudu Tragelaphus imberbis herbivore 81.5 14 2 951-984
African Buffalo Syncerus caffer herbivore 637.5 0; 1 1 2120-3880
Cattle Bos spp. herbivore 385 127; 49 10 920-2800
Sheep Ovis aries herbivore 45 32; 3 6 920-3510
Domestic Goat Capra aegagrus hircus herbivore 20 396;10 5 920-1788
Note. The first number listed under records depicts the number of animals on videos shot of each species with an interval of 1 hour between consecutive videos;
the second number represents the number of dung pats for species where dung was present. Plots imply the number of study plots on which each species was
recorded. Elevation shows the elevational range of the study plots on which species were present.
*Amongst the wild mammals sampled with camera traps, two small rodents could only be identified to morphospecies level while there were dung samples of
apparently two small antelopes which could not be further identified and were therefore designated as morphospecies.
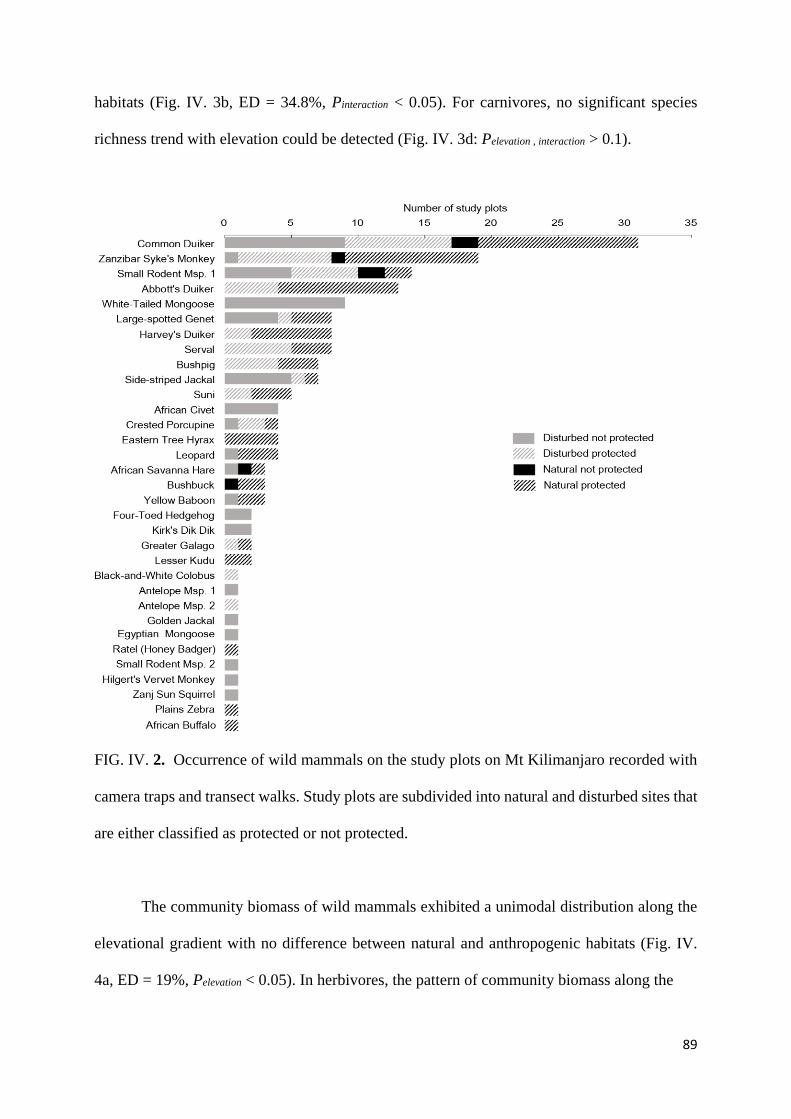
89
habitats (Fig. IV. 3b, ED = 34.8%, Pinteraction < 0.05). For carnivores, no significant species
richness trend with elevation could be detected (Fig. IV. 3d: Pelevation , interaction > 0.1).
FIG. IV. 2. Occurrence of wild mammals on the study plots on Mt Kilimanjaro recorded with
camera traps and transect walks. Study plots are subdivided into natural and disturbed sites that
are either classified as protected or not protected.
The community biomass of wild mammals exhibited a unimodal distribution along the
elevational gradient with no difference between natural and anthropogenic habitats (Fig. IV.
4a, ED = 19%, Pelevation < 0.05). In herbivores, the pattern of community biomass along the
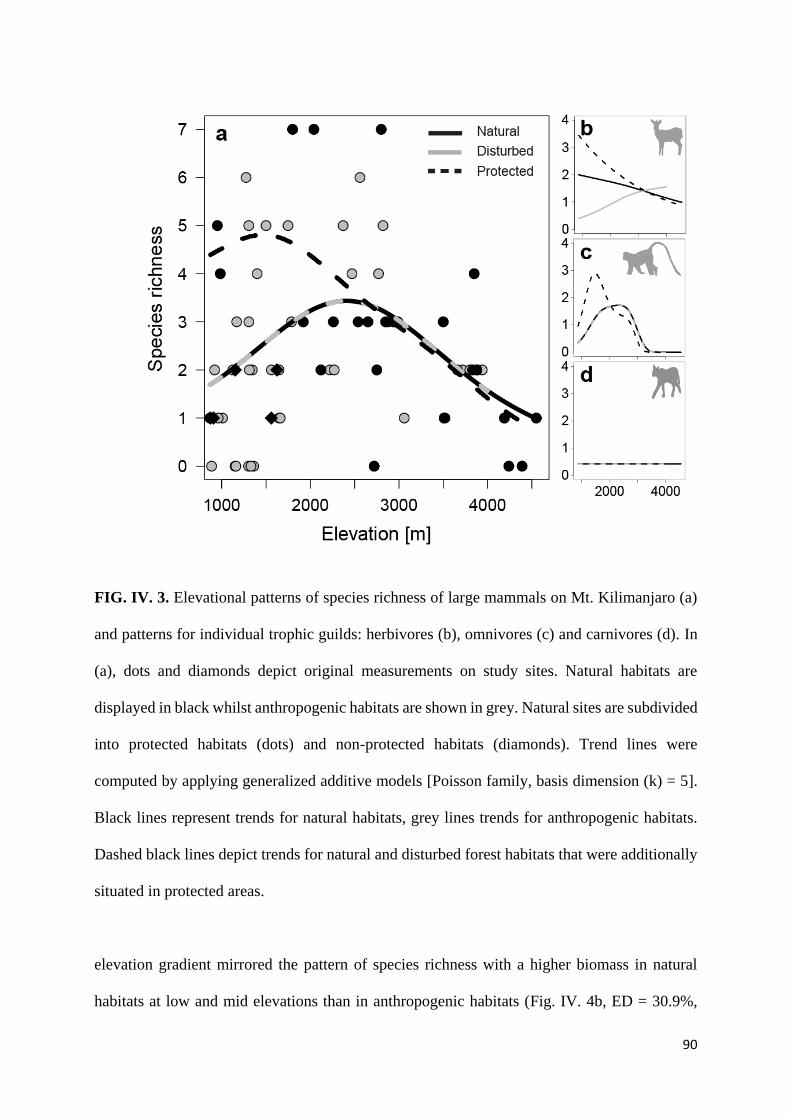
90
FIG. IV. 3. Elevational patterns of species richness of large mammals on Mt. Kilimanjaro (a)
and patterns for individual trophic guilds: herbivores (b), omnivores (c) and carnivores (d). In
(a), dots and diamonds depict original measurements on study sites. Natural habitats are
displayed in black whilst anthropogenic habitats are shown in grey. Natural sites are subdivided
into protected habitats (dots) and non-protected habitats (diamonds). Trend lines were
computed by applying generalized additive models [Poisson family, basis dimension (k) = 5].
Black lines represent trends for natural habitats, grey lines trends for anthropogenic habitats.
Dashed black lines depict trends for natural and disturbed forest habitats that were additionally
situated in protected areas.
elevation gradient mirrored the pattern of species richness with a higher biomass in natural
habitats at low and mid elevations than in anthropogenic habitats (Fig. IV. 4b, ED = 30.9%,
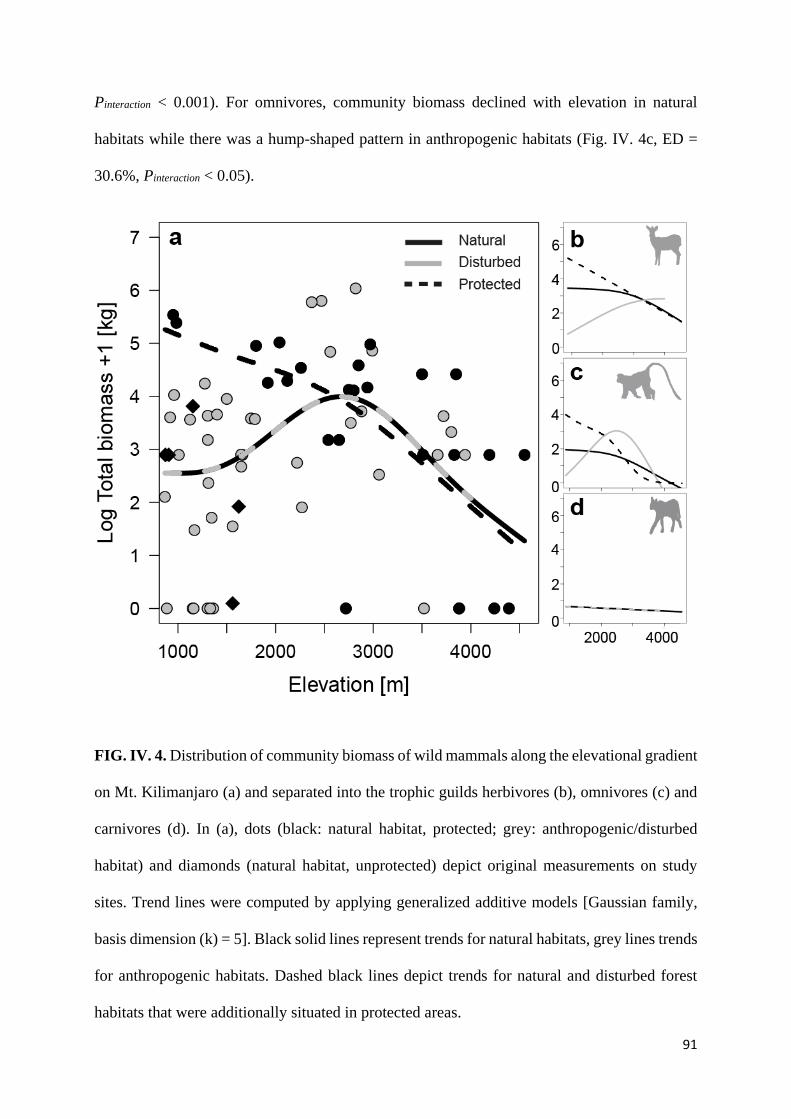
91
Pinteraction < 0.001). For omnivores, community biomass declined with elevation in natural
habitats while there was a hump-shaped pattern in anthropogenic habitats (Fig. IV. 4c, ED =
30.6%, Pinteraction < 0.05).
FIG. IV. 4. Distribution of community biomass of wild mammals along the elevational gradient
on Mt. Kilimanjaro (a) and separated into the trophic guilds herbivores (b), omnivores (c) and
carnivores (d). In (a), dots (black: natural habitat, protected; grey: anthropogenic/disturbed
habitat) and diamonds (natural habitat, unprotected) depict original measurements on study
sites. Trend lines were computed by applying generalized additive models [Gaussian family,
basis dimension (k) = 5]. Black solid lines represent trends for natural habitats, grey lines trends
for anthropogenic habitats. Dashed black lines depict trends for natural and disturbed forest
habitats that were additionally situated in protected areas.
92
Protected areas showed a significantly higher community biomass at low and mid elevations
than unprotected areas (all mammals: Fig. IV. 4a: ED = 27.7 %, Pinteraction < 0.05; herbivores:
b: ED = 30.9%, Pinteraction < 0.001; omnivores: c: ED = 47.3 %, Pinteraction < 0.001). This result
was largely driven by the mammal species with large body weight, which were regularly present
in natural protected areas but absent from unprotected areas (see Supplementary Fig. IV. 2). In
carnivores, no pattern of community biomass with elevation was observed (Fig. IV. 4d, ED =
0.9%, Pinteraction = 0.44)
Drivers of species richness and community biomass
For both, species richness and community biomass of wild mammals, energy and protection
status were the most important explanatory variables in path analysis (Fig. IV. 5). The best-
supported model suggested that the species richness of wild mammals increased with net
primary productivity (NPP) and was higher in protected areas than in unprotected habitats.
Additionally, we found a positive effect of land area on wild mammal species richness (Fig. IV.
5b). Competing path models included a positive relationship between the species richness of
domestic and wild mammals. There was also a positive effect of mean annual temperature on
wild mammal species richness. Both relationships were, however, not significant (p = 0.32; P
= 0.45, respectively). The community biomass of wild mammals increased with increasing NPP
and was higher in protected than in unprotected areas.
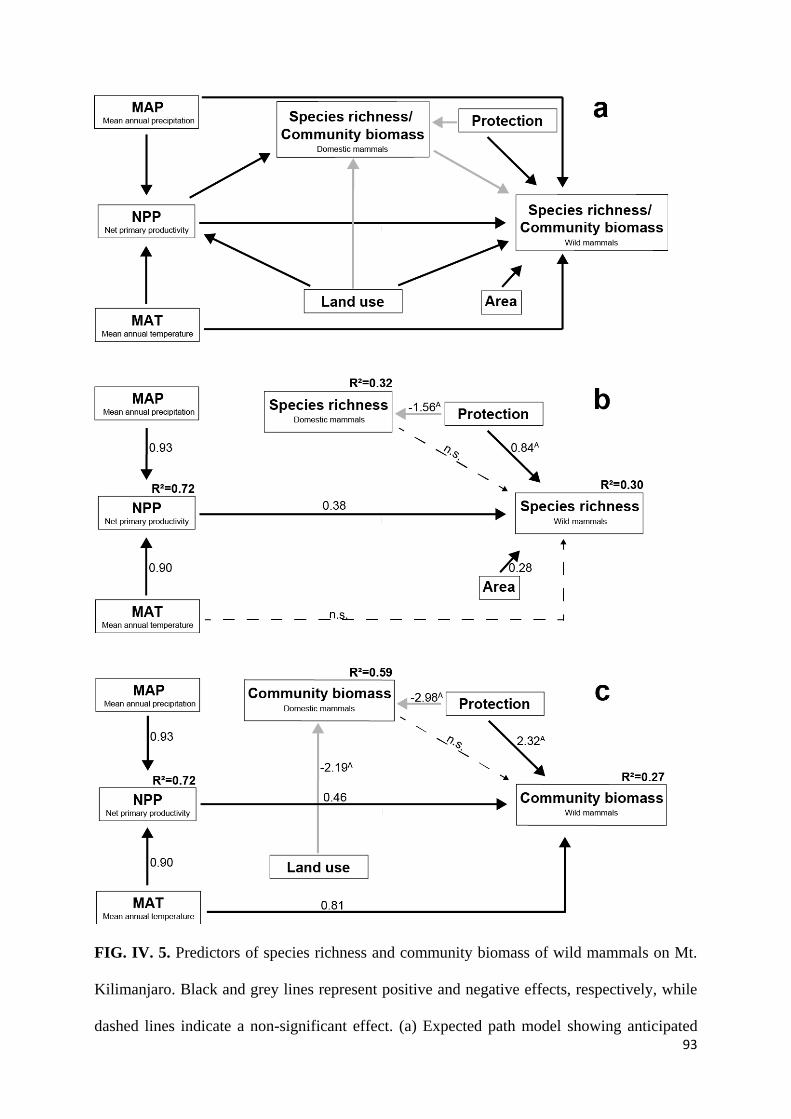
93
FIG. IV. 5. Predictors of species richness and community biomass of wild mammals on Mt.
Kilimanjaro. Black and grey lines represent positive and negative effects, respectively, while
dashed lines indicate a non-significant effect. (a) Expected path model showing anticipated
94
effects of predictor variables on species richness and community biomass of wild mammals.
(b) Predictors of wild mammal species richness. The best path model with the lowest (AICc =
33.96) is displayed with solid lines. The relative amount of explained variance (R2, deduced
from the best-supported path model) is shown. Dashed lines depict potential paths included in
competing paths models (all path models with ∆AICC < 2 determined by multi-model inference)
but eliminated from the final path model. (c) Predictors of community biomass of wild
mammals (best path model: AICc = 38.60). Species richness of domestic mammals was lower
in protected than in unprotected areas. For land use, the levels agricultural, disturbed and natural
were used. Numbers above paths represent standardized path coefficients. A Predictor variable
(protection, land use) is a factor, therefore path coefficients are not standardized.
Furthermore, community biomass significantly increased with temperature (Fig. IV.
5c). The best competing path model included a non-significant negative effect of community
biomass of domestic mammals on the community biomass of wild mammals (P = 0.25). The
species richness of wild mammals was positively correlated to the community biomass (r =
0.56) and abundance of wild mammals (r = 0.90).
95
Discussion
In this study, we present a detailed analysis of both the patterns and drivers of large mammal
elevational diversity. To our knowledge, this is the first study which combines data on the
elevational diversity of large mammals with detailed tests of multiple macroecological
hypotheses for explaining diversity gradients. Wild mammal species richness and community
biomass showed a unimodal distribution with elevation on Mt. Kilimanjaro, a pattern which
remarkably reflects the nearly universal unimodal diversity gradient observed in small
mammals along elevation gradients (Nor 2001, Rickart 2001, SÁnchez-Cordero 2001, Chen et
al. 2017). However, our data suggests that the unimodal distribution of wild mammals is largely
influenced by human impact at low elevations as in protected habitats mammal diversity was
high even in the lowlands and the pattern of elevational diversity consequently more strongly
resembled a lower plateau pattern (McCain and Grytnes 2010).
Net primary productivity and area as major drivers for endothermic species richness
Species richness and community biomass of wild mammals were determined by net primary
productivity (NPP) and the protection status of study plots, the former being additionally
positively regulated by area and the latter by temperature. In accordance with the energy-
richness hypothesis (Currie et al. 2004), both wild mammal species richness and community
biomass peaked at around 2500 m asl in the lower forest belt, an elevation which approximately
coincidences with the highest amount of NPP along the elevational gradient on Mt. Kilimanjaro
(Peters et al. 2016). This finding confirms that productive ecosystems with high amounts of
resources can sustain communities with higher species richness and larger biomass than less
productive ecosystems. In contrast to ectothermic organisms, for which tight correlations
between temperature and species richness are often detected (Classen et al. 2015), endotherms
appear to be more strongly depending on resource availability (Buckley et al. 2012). In
96
accordance with these findings, Ferger et al. (2014) showed that for birds, another group of
endothermic organisms, species richness on Mt Kilimanjaro was best explained by the
availability of food resources. The energy-richness hypothesis is also supported by a strong
correlation between species richness and biomass/abundance of wild mammals in our study
(Currie et al. 2004, Storch 2012).
In addition to NPP, we detected a positive effect of land area, a second energy-related
factor, on wild mammal species richness. Larger areas of land can sustain larger populations of
animals, which reduces the extinction risk of individual species and increases, on average, the
number of species in an area. The species-area relationship has been identified as an important
factor driving mammal species richness (Chen et al. 2017) and has been conceptually fused
with the energy-richness hypothesis in the so-called ‘species-energy hypothesis’. To sum up,
the significant effects of both NPP and land area give support to the view that food resources
are limiting the number of coexisting large mammal species along tropical elevation gradients.
The importance of temperature
In addition to the effect of NPP, we found a positive effect of temperature on wild mammal
community biomass. Temperature is a critical factor for endotherms, setting limits of species’
distributional ranges (Fernández and Vrba 2005). At low temperatures, there are increased
metabolic costs for endotherms which may result in reduced population densities (Buckley et
al. 2012). Furthermore, temperature has also been identified as an important driver of
diversification in mammals, with higher levels of species diversity and rates of diversification
observed at higher temperatures (Owen 1990, Brown 2001, Rolland et al. 2014). Very high or
low temperatures have been shown to be a more important factor for species of large mammals
compared to small mammals (Andrews and O’Brien 2000). One reason for this apparent
paradox might be that small mammals can find better shelter from extreme temperatures in
dense ground vegetation or by burrowing underground while large mammals are characterized
97
by greater mobility. For small mammals, NPP and precipitation are of greater importance than
temperature (Andrews and O’Brien 2000).
We did not find a positive effect of precipitation, neither on mammal species richness
nor on mammal community biomass. Presumably, water availability is more relevant in drier
ecosystems than the Mt. Kilimanjaro region, and this trend was mainly shown for small
mammals (Nor 2001, SÁnchez-Cordero 2001). In contrast to small mammals, large mammals
have been found to be less dependent on precipitation (Andrews and O’Brien 2000). We
expected the presence of domestic mammals to have a negative effect on wild mammals, either
directly via competition for the same resources and space, or indirectly via the transmission of
diseases (Pryke et al. 2016). However, neither species richness nor community biomass of wild
mammals was impacted by domestic mammals, probably due to the absence of intensive
grazing regimes on Mt. Kilimanjaro
Implications for conservation
In protected habitats, both species richness and community biomass of wild mammals were
higher than in unprotected areas. Large herbivores like Lesser Kudu and Plains Zebra and large
omnivores like Yellow Baboon were only found in protected areas but were absent from
unprotected areas, even if natural vegetation was still intact. In unprotected habitats, large
mammals are particularly vulnerable to losses through hunting, either through bushmeat
hunting or retaliatory killing for crop losses (Schipper et al. 2008, Kinnaird and O’brien 2012).
In addition, the presence of domestic mammals might have a negative impact on wild mammals
(Di Bitetti et al. 2013). As a result, the species richness, abundance, and body size of wild
mammals are often lower in unprotected than in protected habitats (Kinnaird and O’brien 2012).
Compared to the protection status of study plots, the impact of land use on the species richness
and the biomass of large mammals was low. One reason for the small influence of land use on
98
wild mammal diversity might be that in our study all plots above 1800 m asl were located inside
the boundaries of Mt. Kilimanjaro National Park. Furthermore, at low elevations, the landscape
on the mountain is characterized by a mosaic consisting of small fields of different cropping
systems used for subsistence farming and of semi-natural habitat and forest remnants in
between (Mmbaga et al. 2017). In its current form, the heterogeneous landscape on Mt.
Kilimanjaro can sustain high levels of biodiversity. However, increasing agricultural
intensification with the augmented use of pesticides and heavy machinery poses a growing
threat to the maintenance of biodiversity on the mountain (Newmark & IUCN Tropical Forest
Programme, 1991). The effect of land use and the protection status of study plots differed
between trophic guilds. Herbivores were the only guild which was negatively affected by land
use, evident mainly on mid and low elevation sites. In contrast to herbivores, the richness and
biomass of omnivores was barely influenced by human land use activities, a pattern which was
also found by Kinnaird and O’brien (2012). Carnivores were the guild with the fewest detected
species in this study, which might have been a reason why we observed no significant trend in
species richness or biomass with elevation and human impact. Commonly, carnivores are
expected to show both low species diversity and small body sizes in anthropogenically modified
landscapes (Kinnaird and O’brien 2012). A reason for this discrepancy could be that the
monitoring applied here was not intense enough to adequately measure the distribution of
carnivores, which typically occur at very low densities. We suspect that increases in monitoring
intensity would lead to better estimates of carnivore species richness on study sites, reduced
variation and clearer trends along gradients of elevation and human impact.
We recorded 27 (66%) of the 41 large mammal species that had been reported to occur
on the southern slopes of Mt. Kilimanjaro in 1995 (Grimshaw et al. 1995). Only the African
savanna Hare, which we encountered at low elevations, does not appear in Grimshaw’s species
list. The documented high presence of the Abbott’s Duiker in the forests of Mt. Kilimanjaro
National Park is worth a special note since hitherto the distribution of this endangered antelope
99
on Mt. Kilimanjaro was hardly known. Our results suggest that Mt. Kilimanjaro could be, apart
from the Udzungwa Mountains, a second population stronghold of this species (Bowkett et al.
2014).
Concluding remarks
A fundamental purpose of ecology is to explain the disparate distribution of species richness
around the globe. Elevational gradients, in particular, can help us to learn more about patterns
in biodiversity and to locate priority areas for conservation, particularly in times of climate
change and intense human land use. Our study shows that there is not a single factor influencing
mammal diversity and community biomass along an elevational gradient. Rather, there are
several not mutually exclusive factors, i.e. net primary productivity and, to a lesser degree, land
area and temperature, which determine elevational diversity of large mammals in natural habitat
on tropical mountains. Our study also emphasizes the importance of protected areas for the
preservation of large mammals. Our data confirmed that more mammal species, particularly
those of large body size, are able to persist in protected than in unprotected areas (Ferreira de
Pinho et al. 2017). Due to their high significance as keystone and umbrella species (Caro 2010),
the loss of large mammals from unprotected areas is probably connected to changes in the
structure of species communities and a decline of ecosystem functions (Dirzo et al. 2014).
Therefore, the maintenance and expansion of protected areas will be of vital importance for the
conservation of the diverse mammal fauna of Mt. Kilimanjaro and other mountains.
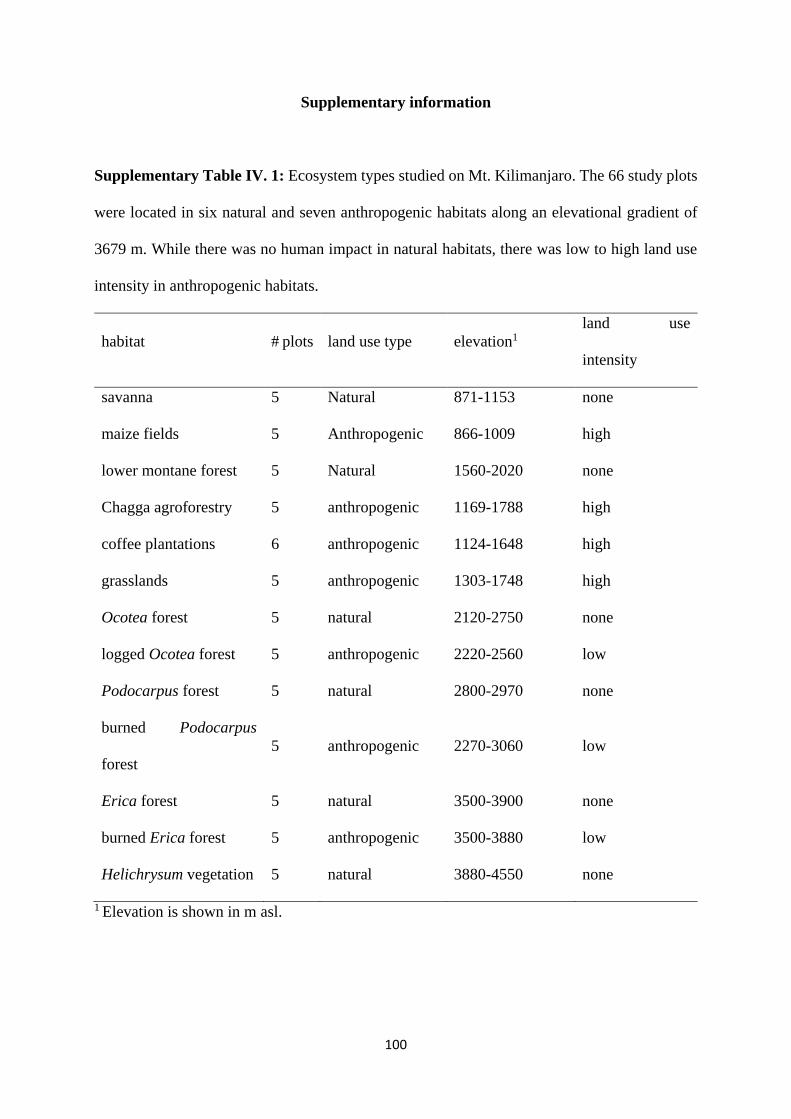
100
Supplementary information
Supplementary Table IV. 1: Ecosystem types studied on Mt. Kilimanjaro. The 66 study plots
were located in six natural and seven anthropogenic habitats along an elevational gradient of
3679 m. While there was no human impact in natural habitats, there was low to high land use
intensity in anthropogenic habitats.
habitat # plots land use type elevation1
land use
intensity
savanna 5 Natural 871-1153 none
maize fields 5 Anthropogenic 866-1009 high
lower montane forest 5 Natural 1560-2020 none
Chagga agroforestry 5 anthropogenic 1169-1788 high
coffee plantations 6 anthropogenic 1124-1648 high
grasslands 5 anthropogenic 1303-1748 high
Ocotea forest 5 natural 2120-2750 none
logged Ocotea forest 5 anthropogenic 2220-2560 low
Podocarpus forest 5 natural 2800-2970 none
burned Podocarpus
forest
5 anthropogenic 2270-3060 low
Erica forest 5 natural 3500-3900 none
burned Erica forest 5 anthropogenic 3500-3880 low
Helichrysum vegetation 5 natural 3880-4550 none
1 Elevation is shown in m asl.
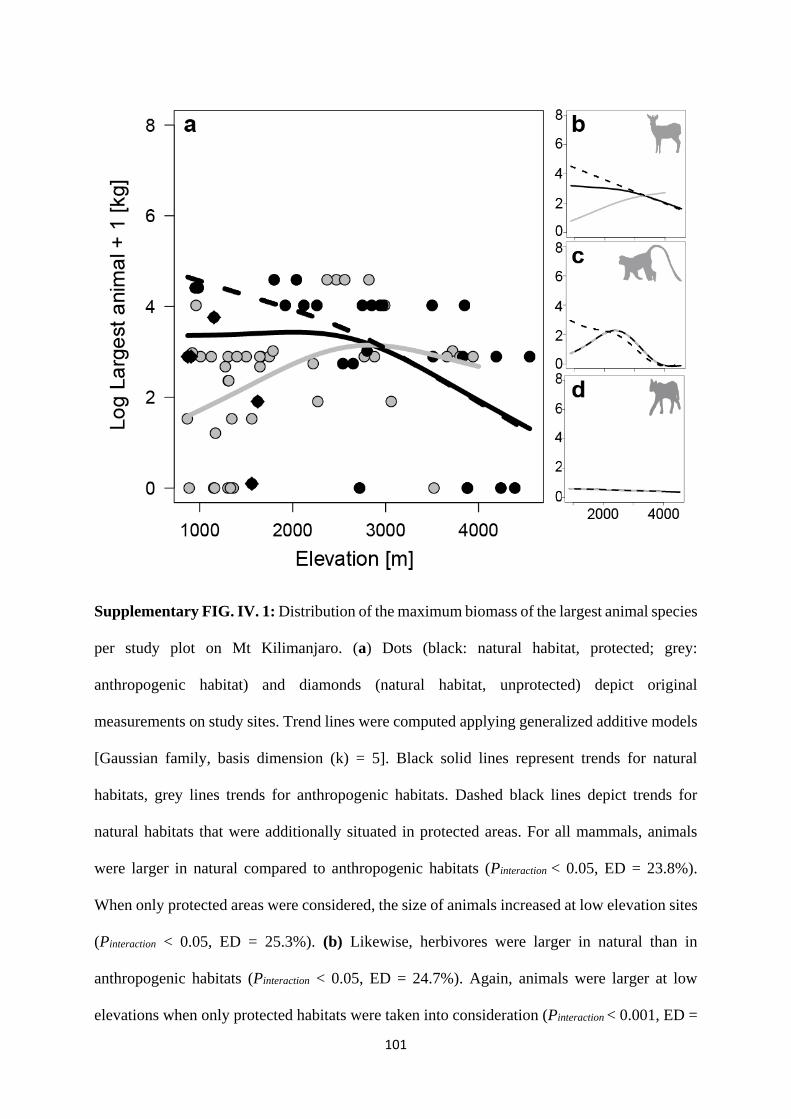
101
Supplementary FIG. IV. 1: Distribution of the maximum biomass of the largest animal species
per study plot on Mt Kilimanjaro. (a) Dots (black: natural habitat, protected; grey:
anthropogenic habitat) and diamonds (natural habitat, unprotected) depict original
measurements on study sites. Trend lines were computed applying generalized additive models
[Gaussian family, basis dimension (k) = 5]. Black solid lines represent trends for natural
habitats, grey lines trends for anthropogenic habitats. Dashed black lines depict trends for
natural habitats that were additionally situated in protected areas. For all mammals, animals
were larger in natural compared to anthropogenic habitats (Pinteraction < 0.05, ED = 23.8%).
When only protected areas were considered, the size of animals increased at low elevation sites
(Pinteraction < 0.05, ED = 25.3%). (b) Likewise, herbivores were larger in natural than in
anthropogenic habitats (Pinteraction < 0.05, ED = 24.7%). Again, animals were larger at low
elevations when only protected habitats were taken into consideration (Pinteraction < 0.001, ED =

102
27%). (c) The largest omnivores showed the same unimodal distribution for both natural and
anthropogenic habitats (Pelevation < 0.001, ED = 28.5%). In protected areas, the size of omnivores
increased at low elevation sites. (Pinteraction < 0.05, ED = 40.3%). (d) Regarding carnivores, there
was no relationship between the distribution of the largest mammals and elevation (Pinteraction =
0.54, ED = 0.6 %).
103
Chapter V: General Discussion
This thesis comprises the study of invertebrate (Chapter III) and vertebrate herbivore (Chapter
IV) taxa and the related ecosystem function [i.e. herbivory; (Chapter II)] conducted along a
large elevational gradient on a tropical mountain (Mt. Kilimanjaro).
Patterns and drivers of community-level invertebrate herbivory (Chapter II)
Findings revealed an unimodal pattern of the total community-level invertebrate herbivory in
natural habitats and the pattern strongly contrasted with the pattern detected in anthropogenic
habitats. The unimodal pattern of total herbivory detected in natural habitat is congruent with
our hypothesis suggesting that herbivory peaks at mid-elevations due to high levels of net
primary productivity. Most of the East African Mountains experience the highest rainfall and
most stable environmental conditions at mid-elevations and not at lower elevations as it may be
the case in other regions (Garibaldi et al. 2011, Galmán et al. 2018). It is further stated that, at
mid-elevations where resource-rich habitats (i.e. lower montane forests) are found at Mt.
Kilimanjaro, it is likely that high plant growth rates and low investments in plant defense
promote leaf herbivory (Coley et al. 1985). Alternatively, in resource-poor habitats where plants
nutritional quality is lower (e.g. at higher elevations) due to lower nitrogen content and higher
concentrations of plant defense compounds (e.g. at low elevations) herbivory is low (Coley et
al. 1985, Pellissier et al. 2016, Abdala-Roberts et al. 2016).
Interestingly, in anthropogenic habitats we detected a bimodal pattern of leaf herbivory
along the elevation gradient which was strongly contrasting to the patterns found in natural
habitats; the first peak was detected at lower elevations, in the elevational zone dominated by
maize fields and the second peak at mid-elevations in selectively logged Ocotea forests. The
first peak and a subsequent decline in total herbivory (and for leaf chewers) at lower elevations
104
in anthropogenic habitats could be connected to applications of N and P-rich fertilizers in the
maize fields which could have increased leaf nitrogen concentration thus reduce CN ratio and
increase NP ratio. Additionally, we found that the second peak which was detected at mid-
elevations in anthropogenic habitats slightly shifted towards higher elevations relative to the
peak in natural habitats. The finding of contrasting patterns in ecosystem functions in
anthropogenic versus natural habitats demonstrates empirically the significance of
anthropogenic effects in shaping the structure and functioning of mountain ecosystems and calls
for conservation measures which are responsive to and incorporate human dimensions. As
anthropogenic pressure on resources found in mountain ecosystems is increasing (Nogués-
Bravo et al. 2008), this interdependence might limit our ability to detect macroecological
patterns in the future.
On the other hand, findings also show that levels of herbivory were consistently lower
(except for leaf miners) in anthropogenic habitats than in natural habitats. Variation in the
patterns and levels of herbivory between natural and anthropogenic habitats not only provides
useful insights which deepen our understanding of the ecological patterns but also underscores
the need for future studies to take into account such differences in order to provide precise
recommendations for policy formulation. Among feeding guilds, leaf chewers showed a
disproportionally higher herbivory than leaf miners and leaf gallers finding which is consistent
with other studies (Garibaldi et al. 2011, Andrew et al. 2012, Souza et al. 2013). However, most
of these studies measured herbivory from a single host plant species rather than that of plant
communities (Garibaldi et al. 2011, Souza et al. 2013).
Path analysis revealed that leaf traits (NP and CN ratios) were the strongest predictors
of leaf herbivory in natural and anthropogenic habitats. However, the strength of their effect
was diluted by the addition of a dataset from anthropogenic habitats. Rooted from this finding,
it can be concluded that the increased human dependence on natural ecosystems is likely to
alter concentration and composition of phytochemical traits and consequently alter biotic
105
interactions and ecological patterns. Several studies have also shown the importance of leaf
traits in determining herbivory (Poorter et al. 2004, Garnier et al. 2007, Galmán et al. 2018).
However, these studies did not demonstrate simultaneously variation in the effect of
phytochemical traits on community-level herbivory between natural and anthropogenic
habitats. Here we have clearly shown that treating anthropogenic and natural habitats separately
is critical for improving our understanding of the ecological phenomenon and formulating
effective conservation and land use measures.
On the other hand, findings also revealed a strong influence climate has in mediating
the effect of leaf traits on herbivory through NPP. Studies conducted in the similar ecosystem
on other ecological functions have also the influence of climate in mediating biotic interactions
other than herbivory (Classen et al. 2015, Peters et al. 2016). The detected strong
interdependence between leaf herbivory and climate suggest that biotic interactions, energy and
nutrient fluxes in terrestrial ecosystems are likely to be altered as a global climate is changing.
We found that climate had a rather stronger effect in mediating leaf herbivory when we used a
dataset from natural habitats than when we used a dataset combining data from natural and
anthropogenic habitats. This finding provides an important insight that conducting studies
without considering idiosyncrasy of the study system (e.g. using a dataset combining data from
anthropogenic and natural habitats) may impede our ability to understand mechanisms
underlying macroecological patterns and provide effective recommendations. Furthermore,
findings highlight the expected climatic changes will likely have a more ecological effect on
natural ecosystems than on human-dominated ecosystems.
Patterns and drivers of species diversity of phytophagous beetles (Chapter III)
Findings revealed that species diversity of the overall phytophagous beetles depicted a bimodal
pattern which tendentially declined along the elevation gradient. A similar pattern was also
detected by the most dominant beetle group in our study, the leaf beetles (Chrysomelidae).
106
Similar patterns exhibited by the phytophagous beetles have also been detected in spiders and
some plant groups along the same elevation gradient (Peters et al. 2016). Interestingly, a pattern
exhibited by weevils (Curculionidae) – the second largest group in our study was dissimilar to
the patterns exhibited by leaf beetles. Based on the findings, it can be concluded that patterns
and so the drivers of species diversity may vary within and between families. The patterns we
detected were largely associated with high resource abundance and high resource diversity at
mid-elevations. However, findings revealed some unique modification on the hump-shaped
pattern which is associated with microclimatic conditions of the lower montane forests. Some
studies have shown that modifications to the widely documented species diversity patterns are
possible (Rahbek 2005, Nogués-Bravo et al. 2008), however, these studies focused on the scale
effect rather than the effect of microhabitats (and associated microclimates) in shaping
macroecological patterns. This finding underscores the importance of microclimatic conditions
of microhabitats in determining species diversity and macroecological patterns in complex
ecosystems.
Apart from species diversity patterns, path analysis revealed that temperature and
climate-mediated changes in food resources abundance and diversity were the strongest
predictors of species diversity of phytophagous beetles. Several studies have also shown the
relevance of resources abundance and temperature in determining species diversity.
Furthermore, reports have shown that there is a strong relationship between resource
availability and species diversity (Mittelbach et al. 2001, Šímová et al. 2013, Brown 2014),
however, mechanisms through which food resources influence species diversity are still unclear
(Rosenzweig 1992, Mittelbach et al. 2001). Unlike many studies investigating this relationship,
we have disentangled mechanisms through which food resources can affect species diversity,
i.e. through food resource diversity and food resource abundance rather than by food quality.
This approach and the finding thereof are of importance in improving our understanding of the
mechanisms determining biodiversity patterns. Available evidence also suggests that it is
107
possible to have a high abundance of resources but low species diversity (Rosenzweig 1992,
Brown 2014, Classen et al. 2015), suggesting that high resource abundance by itself is not a
sufficient explanation to account for species diversity in every scenario. Conversely,
accumulating evidence suggests that temperature is also an important predictor of species
diversity through its effect on speciation and evolution (Classen et al. 2015, Rabosky et al.
2018), resource production (Brown 2014) and biotic interactions (Schemske et al. 2009).
Evidence suggests that temperature can also influence species diversity by regulating resources
consumption (Classen et al. 2015).
Patterns and drivers of species richness and community biomass of large wild mammals
(Chapter IV)
Findings revealed that overall wild mammals depicted the unimodal pattern of species richness
and community biomass along elevation gradients and no significant variation in the pattern
was detected between natural and anthropogenic habitats. We associated the unimodal pattern
of species richness and community biomass of large mammals with high resource abundance
on the montane forest (at. ca. 2500m asl). On the other hand, path analysis revealed that resource
abundance and level of habitat protection were the strongest predators of species richness and
community biomass patterns of large wild mammals. Our findings suggest that overall species
richness and community biomass are likely driven by anthropogenic pressure on wildlife
resources particularly, at lower elevations.
However, patterns depicted by individual guilds showed clearly that impact of human
pressure among guilds is non-uniform as reported in other studies (Helbig-Bonitz et al. 2015).
Unlike omnivores (arboreal) most of which find a suitable habitat and food resources in the
lower mountain forests, herbivores species richness and community biomass were higher in
natural and protected areas located at lower elevations where savanna ecosystem is found.
Higher herbivore richness at lower elevations (despite high poaching risk) is possibly due to

108
higher high resource abundance particularly for large-bodied herbivores per unit area in
savannah ecosystem than in montane forest ecosystems. Conversely, lack of clear patterns for
carnivores’ species richness and community biomass in all habitats is probably due to their
behavior (i.e. feeding habit, relatively large home ranges and nocturnal lifestyle in which their
peak active time mismatch that of humans) and thus face a limited direct risk through illegal
hunting. It is also important to note that traditionally local communities around Mt. Kilimanjaro
do not eat meat from carnivorous animals unlike other regions in Tanzania or Africa, suggesting
that culture and traditions might play an important role in shaping species richness and
community biomass patterns of carnivore guild.
As anthropogenic pressure (through illegal hunting and logging, livestock grazing,
habitat conversion through agriculture) on mountain ecosystems is mounting towards higher
elevations (Nogués-Bravo et al. 2008), it is likely that patterns of species richness and
community biomass are likely to be modified in the future. Evidence from other studies
suggests that increased human pressure on mountain ecosystems is becoming a global trend
(Körner 2004, Nogués-Bravo et al. 2008). Our findings have clearly demonstrated that
anthropogenic activities pose a great threat to biodiversity and associated ecosystem functions;
however, it appears that sensitivity to these threats varies between feeding guilds. We call for
conservation action which promotes the protection of species-rich lowland habitats
109
General conclusions
Altitudinal gradients represent a robust model system through which several ecological
phenomena and hypotheses can be learned and tested, respectively. Unlike latitudinal gradients,
elevational gradient studies allow the use of standardized methods and only one observer can
work in different climates; a situation which ensures high data quality. Our study demonstrated
the importance of elevational gradients in developing our understanding of the mechanisms
underlying patterns of species diversity and ecosystem functions such as herbivory. Generally,
our findings concur with a view that establishing an overall pattern for macroecological patterns
along elevation gradient is a challenge (Andrew et al. 2012, Galmán et al. 2018). Findings
showed empirically that patterns exhibited by ectotherms or by individual guilds rarely predict
patterns exhibited by endotherms or by overall macroecological patterns, respectively.
Similarly, I have demonstrated that patterns exhibited in natural (or protected) habitat seldom
mirror patterns exhibited in anthropogenic (or unprotected) habitat and that, mixing of the two
datasets diluted the predictability of models. I recommend treating idiosyncratic study systems
separately in order to improve our understanding of the mechanisms driving macroecological
patterns and provide well-defined recommendations for policy formulation. Findings from path
analysis demonstrated that herbivore diversity, community biomass, and herbivory are strongly
influenced by climate (either directly or indirectly). Therefore, predicted climatic changes are
expected to strongly modify ecological patterns, biotic interactions, and energy and nutrient
fluxes in terrestrial ecosystems in the coming decades with more impacts probably felt by
natural ecosystems. On the other hand, this analytical method has enabled us to improve our
understanding by disentangling and unearthing some indirect mechanisms driving ecological
relationships which would otherwise not detected.
It is now evident that humans have strongly modified the tropical mountains in nearly
all parts of the world and their pressure is advancing towards more intact habitats at higher

110
elevations. Our findings indicate that this may have strong impacts on ecosystem functions and
diversity, particularly of large mammals. I recommend conservation measures which will
increase protection in species-rich areas and those measures should be responsive to and
incorporate human dimensions to curb the situation. Despite some ecological challenges, it
appears that Mt. Kilimanjaro ecosystem remains to be one of the world’s strongholds of
biodiversity and important refuge area for many species. Therefore, its conservation is of
paramount importance and conservation measures should not only focus on protected habitats
but also extend to conserving species-rich habitats in the lowland unprotected habitats with
attention given to guild-specific requirements.
Although findings emanate from observational studies which have to take into account
several confounding factors, they have managed to reveal patterns and drivers in real-world
near-natural settings and ecosystems with fully established organisms’ communities and a wide
range of biotic interactions which are unlikely to be captured in artificial experiments.
Elevational studies in more areas of the world, combined with experiments, to better understand
natural processes operating on mountains and their sensitivity to the on-going global changes.
Future studies addressing the effects of top-down forces by natural enemies (predators) on
herbivore diversity and invertebrate herbivory would deepen our understanding of the
mechanisms behind macroecological patterns along elevation gradients.
111
References
Abdala-Roberts, L., S. Rasmann, J. C. B.-M. y Terán, F. Covelo, G. Glauser, and X. Moreira.
2016. Biotic and abiotic factors associated with altitudinal variation in plant traits and
herbivory in a dominant oak species. American Journal of Botany, 103(12), 2070–
2078.
Abrams, P. A. 1995. Monotonic or unimodal diversity-productivity gradients: What does
competition theory predict? Ecology 76:2019–2027.
Agrawal, A. A. 2004. Plant defense and density dependence in the population growth of
herbivores. The American Naturalist 164:113–120.
Allen, A. P., J. H. Brown, and J. F. Gillooly. 2002. Global biodiversity, biochemical kinetics,
and the energetic-equivalence rule. Science 297:1545–1548.
Andrew, N. R., I. R. Roberts, and S. J. Hill. 2012. Insect herbivory along environmental
gradients. Open Journal of Ecology, 02(04), 202–213.
Andrews, P., and E. M. O’Brien. 2000. Climate, vegetation, and predictable gradients in
mammal species richness in southern Africa. Journal of Zoology 251:205–231.
Anstett, D. N., I. Naujokaitis-Lewis, and M. T. J. Johnson. 2014. Latitudinal gradients in
herbivory on Oenothera biennis vary according to herbivore guild and specialization.
Ecology 95:2915–2923.
Anstett, D. N., K. A. Nunes, C. Baskett, and P. M. Kotanen. 2016. Sources of controversy
surrounding latitudinal patterns in herbivory and defense. Trends in Ecology &
Evolution 31:789–802.
Appelhans, T., E. Mwangomo, I. Otte, F. Detsch, T. Nauss, and A. Hemp. 2016. Eco‐
meteorological characteristics of the southern slopes of Kilimanjaro, Tanzania.
International Journal of Climatology 36:3245–3258.
112
Bagchi, R., R. E. Gallery, S. Gripenberg, S. J. Gurr, L. Narayan, C. E. Addis, R. P.
Freckleton, and O. T. Lewis. 2014. Pathogens and insect herbivores drive rainforest
plant diversity and composition. Nature 506:85–88.
Baker, A. E. M., and J. S. Williams. 1988. Montane barriers to gene flow of Melanoplus
bivittatus (Orthoptera: Acrididae)*. Biological Journal of the Linnean Society 34:289–
307.
Bale, J. S., G. J. Masters, I. D. Hodkinson, C. Awmack, T. M. Bezemer, V. K. Brown, J. …
Whittaker. 2002. Herbivory in global climate change research: direct effects of rising
temperature on insect herbivores. Global Change Biology 8:1–16.
Barry, R.G. (1981) Mountain weather and climate, Methuen.
Bartels, S. F., and H. Y. H. Chen. 2010. Is understory plant species diversity driven by
resource quantity or resource heterogeneity? Ecology 91:1931–1938.
Barthlott, W., and et al. 1996. Global distribution of species diversity in vascular plants:
Towards a world map of phytodiversity. ERDKUNDE 50.
Basset, Y., L. Cizek, P. Cuénoud, R. K. Didham, F. Guilhaumon, O. Missa, V. … Leponce M.
2012. Arthropod diversity in a tropical forest. Science 338:1481–1484.
Baur, B., T. Meier, A. Baur, and D. Schmera. 2014. Terrestrial gastropod diversity in an
alpine region: disentangling effects of elevation, area, geometric constraints, habitat
type, and land-use intensity. Ecography 37:390–401.
Becerra, J. X. 2015. On the factors that promote the diversity of herbivorous insects and
plants in tropical forests. Proceedings of the National Academy of Sciences of the
United States of America, 112: 6098–6103.
Beck, J., and V. K. Chey. 2008. Explaining the elevational diversity pattern of geometrid
moths from Borneo: a test of five hypotheses. Journal of Biogeography 35:1452–1464.
Beck, J., C. M. McCain, J. C. Axmacher, L. A. Ashton, F. Bärtschi, G. Brehm, S.-W. …V.
Novotny. 2017. Elevational species richness gradients in a hyperdiverse insect taxon: a
113
global meta-study on geometrid moths. Global Ecology and Biogeography 26:412–
424.
Behmer, S. T. 2009. Insect herbivore nutrient regulation. Annual Review of Entomology
54:165–187.
Belmaker, J., and W. Jetz. 2015. Relative roles of ecological and energetic constraints,
diversification rates and region history on global species richness gradients. Ecology
Letters 18:563–571.
Bigger, D. S., and M. A. Marvier. 1998. How different would a world without herbivory be?:
A search for generality in ecology. Integrative Biology: Issues, News, and Reviews
1:60–67.
Boege, K. 2005. Herbivore attack in Casearia nitida influenced by plant ontogenetic variation
in foliage quality and plant architecture. Oecologia 143:117–125.
Bowkett, A., T. Jones, F. Rovero, M. Nielsen, T. Davenport, D. Hawkins, A. Plowman, and J.
Stevens. 2014. Distribution and genetic diversity of the Endangered Abbott’s duiker
Cephalophus spadix in the Udzungwa Mountains, Tanzania. Endangered Species
Research 24:105–114.
Brown, J. H. 2001. Mammals on mountainsides: elevational patterns of diversity. Global
Ecology and Biogeography 10:101–109.
Brown, J. H. 2014. Why are there so many species in the tropics? Journal of Biogeography
41:8–22.
Brown, J. H., J. F. Gillooly, A. P. Allen, V. M. Savage, and G. B. West. 2004. Toward a
metabolic theory of ecology. Ecology 85:1771–1789.
Brown, R. L., L. A. J. Reilly, and R. K. Peet. 2016. Species richness: Small scale. Pages 1–9
eLS. American Cancer Society.
114
Buckley, L. B., A. H. Hurlbert, and W. Jetz. 2012. Broad-scale ecological implications of
ectothermy and endothermy in changing environments. Global Ecology and
Biogeography 21:873–885.
Burnham, K. P., and D. R. Anderson. 2004. Multimodel inference: understanding aic and bic
in model selection. Sociological Methods & Research 33:261–304.
Callis-Duehl, K., P. Vittoz, E. Defossez, and S. Rasmann. 2017. Community-level relaxation
of plant defenses against herbivores at high elevation. Plant Ecology 218:291–304.
Cardinale, B. J., H. Hillebrand, W. S. Harpole, K. Gross, and R. Ptacnik. 2009. Separating the
influence of resource “availability” from resource “imbalance” on productivity-
diversity relationships. Ecology Letters 12:475–487.
Caro, T. 2010. Conservation by proxy: Indicator, umbrella, keystone, flagship, and other
surrogate species. Island Press.
Castagneyrol, B., D. Bonal, M. Damien, H. Jactel, C. Meredieu, E. W. Muiruri, and L.
Barbaro. 2017. Bottom-up and top-down effects of tree species diversity on leaf insect
herbivory. Ecology and Evolution 7:3520–3531.
Cebrian, J., and J. Lartigue. 2004. Patterns of herbivory and decomposition in aquatic and
terrestrial ecosystems. Ecological Monographs 74:237–259.
Chen, I.-C., J. K. Hill, R. Ohlemüller, D. B. Roy, and C. D. Thomas. 2011. Rapid range shifts
of species associated with high levels of climate warming. Science 333:1024–1026.
Chen, Z., K. He, F. Cheng, L. Khanal, and X. Jiang. 2017. Patterns and underlying
mechanisms of non-volant small mammal richness along two contrasting mountain
slopes in southwestern China. Scientific Reports 7:13277.
Chesson, P. 2000. Mechanisms of maintenance of species diversity. Annual Review of
Ecology and Systematics 31:343–366.
Classen, A., M. K. Peters, W. J. Kindeketa, T. Appelhans, C. D. Eardley, M. W. Gikungu, A.
Hemp, T. Nauss, and I. Steffan‐Dewenter. 2015. Temperature versus resource
115
constraints: which factors determine bee diversity on Mount Kilimanjaro, Tanzania?
Global Ecology and Biogeography 24:642–652.
Coley, P. D., and J. A. Barone. 1996. Herbivory and plant defenses in tropical forests. Annual
Review of Ecology and Systematics 27:305–335.
Coley, P. D., J. P. Bryant, and F. S. Chapin. 1985. Resource availability and plant
antiherbivore defense. Science (New York, N.Y.) 230:895–899.
Colwell, R. K., G. Brehm, C. L. Cardelús, A. C. Gilman, and J. T. Longino. 2008. Global
warming, elevational range shifts, and lowland biotic attrition in the wet tropics.
Science 322:258–261.
Colwell, R. K., C. Rahbek, and N. J. Gotelli. 2004. The mid‐domain effect and species
richness patterns: what have we learned so far? The American Naturalist 163:E1–E23.
Costa, D. S., F. Gerschlauer, H. Pabst, A. Kühnel, B. Huwe, R. Kiese, Y. Kuzyakov, and M.
Kleyer. 2017. Community‐weighted means and functional dispersion of plant
functional traits along environmental gradients on Mount Kilimanjaro. Journal of
Vegetation Science 28:684–695.
Crutsinger, G. M., M. D. Collins, J. A. Fordyce, Z. Gompert, C. C. Nice, and N. J. Sanders.
2006. Plant genotypic diversity predicts community structure and governs an
ecosystem process. Science 313:966–968.
Currie, D. J., G. G. Mittelbach, H. V. Cornell, R. Field, J.-F. Guégan, B. A. Hawkins, D. M.
…J. R. G. Turner. 2004. Predictions and tests of climate-based hypotheses of broad-
scale variation in taxonomic richness. Ecology Letters 7:1121–1134.
Detsch, F., I. Otte, T. Appelhans, and T. Nauss. 2016. A Comparative study of cross-product
NDVI dynamics in the Kilimanjaro Region—A Matter of sensor, degradation
calibration, and significance. Remote Sensing 8:159–176.
Di Bitetti, M. S., S. A. Albanesi, M. J. Foguet, C. De Angelo, and A. D. Brown. 2013. The
effect of anthropic pressures and elevation on the large and medium-sized terrestrial
116
mammals of the subtropical mountain forests (Yungas) of NW Argentina. Mammalian
Biology - Zeitschrift für Säugetierkunde 78:21–27.
Dirzo, R., H. S. Young, M. Galetti, G. Ceballos, N. J. B. Isaac, and B. Collen. 2014.
Defaunation in the Anthropocene. Science 345:401–406.
Dulle, H. I., S. W. Ferger, N. J. Cordeiro, K. M. Howell, M. Schleuning, K. Böhning-Gaese,
and C. Hof. 2016. Changes in abundances of forest understorey birds on Africa’s
highest mountain suggest subtle effects of climate change. Diversity and Distributions
22:288–299.
Dussourd, D. E. 2017. Behavioral sabotage of plant defenses by insect folivores. Annual
Review of Entomology 62:15–34.
Ehnes, R. B., B. C. Rall, and U. Brose. 2011. Phylogenetic grouping, curvature and metabolic
scaling in terrestrial invertebrates. Ecology Letters 14:993–1000.
Evans, K. L., J. J. D. Greenwood, and K. J. Gaston. 2005. Dissecting the species–energy
relationship. Proceedings of the Royal Society of London B: Biological Sciences
272:2155–2163.
Ferger, S. W., M. Schleuning, A. Hemp, K. M. Howell, and K. Böhning‐Gaese. 2014. Food
resources and vegetation structure mediate climatic effects on species richness of
birds. Global Ecology and Biogeography 23:541–549.
Fernández, M. H., and E. S. Vrba. 2005. Rapoport effect and biomic specialization in African
mammals: revisiting the climatic variability hypothesis. Journal of Biogeography
32:903–918.
Ferreira de Pinho, F., G. Braga Ferreira, and A. Pereira Paglia. 2017. Influence of vegetation
physiognomy, elevation and fire frequency on medium and large mammals in two
protected areas of the Espinhaço Range. Zoologia 34:1–11.
117
Fiedler, K., G. Brehm, N. Hilt, D. Süßenbach, and C. L. Häuser. 2008. Fauna: Composition
and function. Pages 167–179 Gradients in a tropical mountain ecosystem of Ecuador.
Springer, Berlin, Heidelberg.
Foster, D., F. Swanson, J. Aber, I. Burke, N. Brokaw, D. Tilman, and A. Knapp. 2003. The
Importance of land-use legacies to ecology and conservation. BioScience 53:77–88.
Fountain‐Jones, N. M., S. C. Baker, and G. J. Jordan. 2015. Moving beyond the guild
concept: developing a practical functional trait framework for terrestrial beetles.
Ecological Entomology 40:1–13.
Frenne, P. D., F. Rodríguez-Sánchez, D. A. Coomes, L. Baeten, G. Verstraeten, M. Vellend,
M. … K. Verheyen. 2013. Microclimate moderates plant responses to macroclimate
warming. Proceedings of the National Academy of Sciences 110:18561–18565.
Gagic, V., D. Kleijn, A. Báldi, G. Boros, H. B. Jørgensen, Z. Elek, M. P. D. … R. Bommarco.
2017. Combined effects of agrochemicals and ecosystem services on crop yield across
Europe. Ecology Letters 20:1427–1436.
Galmán, A., L. Abdala‐Roberts, S. Zhang, J. C. B.-M. y Teran, S. Rasmann, and X. Moreira.
2018. A global analysis of elevational gradients in leaf herbivory and its underlying
drivers: Effects of plant growth form, leaf habit and climatic correlates. Journal of
Ecology 106:413–421.
Garibaldi, L. A., B. Gemmill-Herren, R. D’Annolfo, B. E. Graeub, S. A. Cunningham, and T.
D. Breeze. 2017. Farming approaches for greater biodiversity, livelihoods, and food
security. Trends in Ecology & Evolution 32:68–80.
Garibaldi, L. A., T. Kitzberger, and E. J. Chaneton. 2011. Environmental and genetic control
of insect abundance and herbivory along a forest elevational gradient. Oecologia
167:117–129.
Garnier, E., S. Lavorel, P. Ansquer, H. Castro, P. Cruz, J. Dolezal, O. … M. P. Zarovali.
2007. Assessing the effects of land-use change on plant traits, communities and
118
ecosystem functioning in grasslands: A standardized methodology and lessons from an
application to 11 European Sites. Annals of Botany 99:967–985.
González-Megías, A., J. M. Gómez, and F. Sánchez-Piñero. 2008. Factors determining beetle
richness and composition along an altitudinal gradient in the high mountains of the
Sierra Nevada National Park (Spain). Ecoscience 15(4): 429-441
Gossner, M. M., W. W. Weisser, and S. T. Meyer. 2014. Invertebrate herbivory decreases
along a gradient of increasing land-use intensity in German grasslands. Basic and
Applied Ecology 15:347–352.
Grime, J. P. 2006. Trait convergence and trait divergence in herbaceous plant communities:
Mechanisms and consequences. Journal of Vegetation Science 17:255–260.
Grimshaw, J. M., N. J. Cordeiro, and C. a. H. Foley. 1995. The Mammals of Kilimanjaro.
Journal of East African Natural History 84:105–139.
Haddad, N. M., G. M. Crutsinger, K. Gross, J. Haarstad, and D. Tilman. 2011. Plant diversity
and the stability of foodwebs. Ecology Letters 14:42–46.
Hasenkamp, R., and T. Wagner. 2000. Revision of Afromaculepta gen. n., a monophyletic
group of Afrotropical galerucine leaf beetles (Coleoptera: Chrysomelidae). Insect
Systematics & Evolution 31:3–26.
Hawkins, B. A., Porter Eric E., and Felizola Diniz-Filho José Alexandre. 2003. Productivity
and history as predictors of the latitudinal diversity gradient of terrestrial birds.
Ecology 84:1608–1623.
Hegerl, C., N. D. Burgess, M. R. Nielsen, E. Martin, M. Ciolli, and F. Rovero. 2017. Using
camera trap data to assess the impact of bushmeat hunting on forest mammals in
Tanzania. Oryx 51:87–97.
Helbig‐Bonitz, M., S. W. Ferger, K. Böhning‐Gaese, M. Tschapka, K. Howell, and E. K. V.
Kalko. 2015. Bats are not birds – different responses to human land-use on a tropical
mountain. Biotropica 47:497–508.
119
Hemp, A. 2006a. The Banana forests of Kilimanjaro: Biodiversity and conservation of the
chagga homegardens. Biodiversity & Conservation 15:1193–1217.
Hemp, A. 2006b. Continuum or zonation? Altitudinal gradients in the forest vegetation of Mt.
Kilimanjaro. Plant Ecology 184:27–42.
Hemp, A. 2006c. Vegetation of Kilimanjaro: hidden endemics and missing bamboo. African
Journal of Ecology 44:305–328.
Hemp, A. 2008. Introduced plants on Kilimanjaro: tourism and its impact. Plant Ecology
197:17–29.
Hendrickx, F., J.-P. Maelfait, W. Van Wingerden, O. Schweiger, M. Speelmans, S. Aviron, I.
… R. Bugter. 2007. How landscape structure, land-use intensity and habitat diversity
affect components of total arthropod diversity in agricultural landscapes. Journal of
Applied Ecology 44:340–351.
Herbst, C., S. Arnold-Schwandner, T. Meiners, M. K. Peters, C. Rothenwöhrer, J. Steckel, N.
… E. Obermaier. 2017. Direct and indirect effects of agricultural intensification on a
host-parasitoid system on the ribwort plantain (Plantago lanceolata L.) in a landscape
context. Landscape Ecology 32:2015–2028.
Hodkinson, I. D. 2005. Terrestrial insects along elevation gradients: species and community
responses to altitude. Biological Reviews of the Cambridge Philosophical Society
80:489–513.
Hoiss, B., J. Krauss, and I. Steffan-Dewenter. 2015. Interactive effects of elevation, species
richness and extreme climatic events on plant–pollinator networks. Global Change
Biology 21:4086–4097.
Hoset, K. S., K. Kyrö, T. Oksanen, L. Oksanen, and J. Olofsson. 2014. Spatial variation in
vegetation damage relative to primary productivity, small rodent abundance and
predation. Ecography 37:894–901.
120
Hunt, T., J. Bergsten, Z. Levkanicova, A. Papadopoulou, O. S. John, R. Wild, P. M. …A. P.
Vogler. 2007. A Comprehensive phylogeny of beetles reveals the evolutionary origins
of a superradiation. Science 318:1913–1916.
Hurlbert, A. H., and J. C. Stegen. 2014. When should species richness be energy limited, and
how would we know? Ecology Letters 17:401–413.
IUCN (2008) The IUCN red list of threatened species. Version 2016-3.
<http://www.iucnredlist.org>. Downloaded on 28 March 2017
Jamieson, M. A., A. M. Trowbridge, K. F. Raffa, and R. L. Lindroth. 2012. Consequences of
climate warming and altered precipitation patterns for plant-insect and multitrophic
interactions. Plant Physiology 160:1719–1727.
Janzen, D. H. 1970. Herbivores and the number of tree species in tropical forests. The
American Naturalist 104:501–528.
Jiang, Z., K. Ma, and M. Anand. 2016. Can the physiological tolerance hypothesis explain
herb richness patterns along an elevational gradient? A trait-based analysis.
Community Ecology 17:17–23.
Jiang, Z., K. Ma, M. Anand, and Y. Zhang. 2015. Interplay of temperature and woody cover
shapes herb communities along an elevational gradient in a temperate forest in
Beijing, China. Community Ecology 16(2):215-222.
Kaspari, M., L. Alonso, and S. O’Donnell. 2000. Three energy variables predict ant
abundance at a geographical scale. Biological sciences, Proceedings of the Royal
Society B: Biological Sciences 267:485, 485–489.
Kattge, J., S. Díaz, S. Lavorel, I. C. Prentice, P. Leadley, G. Bönisch, E. …C. Wirth. 2011.
TRY – a global database of plant traits. Global Change Biology 17:2905–2935.
Kingdon, J. 2015. The Kingdon field guide to African mammals: Second edition. Princeton
University Press, Princeton, NJ.
121
Kingdon, J., T. M. Butynski, J. Kalina, D. C. D. Happold, M. Happold, and M. Hoffmann.
2013. Mammals of Africa.
Kinnaird, M. F., and T. G. O’brien. 2012. Effects of private-land use, livestock management,
and human tolerance on diversity, distribution, and abundance of large African
mammals. Conservation Biology 26:1026–1039.
Kleyer, M., R. M. Bekker, I. C. Knevel, J. P. Bakker, K. Thompson, M. Sonnenschein, P. …
B. Peco. 2008. The LEDA Traitbase: a database of life-history traits of the Northwest
European flora. Journal of Ecology 96:1266–1274.
Körner, C. 1989. The nutritional status of plants from high altitudes. Oecologia 81:379–391.
Körner, C. 2000. Why are there global gradients in species richness? Mountains might hold
the answer. Trends in Ecology & Evolution 15:513–514.
Körner, C. 2003. Alpine plant life: functional plant ecology of high mountain ecosystems.
Second edition. Springer-Verlag, Berlin Heidelberg.
Körner, C. 2004. Mountain biodiversity, its causes and function. Ambio Spec No 13:11–17.
Körner, C. 2007. The use of ‘altitude’ in ecological research. Trends in Ecology & Evolution
22:569–574.
Kost, C., and M. Heil. 2006. Herbivore-induced plant volatiles induce an indirect defence in
neighbouring plants. Journal of Ecology 94:619–628.
Kotanen, P. M., and J. P. Rosenthal. 2000. Tolerating herbivory: does the plant care if the
herbivore has a backbone? Evolutionary Ecology 14:537–549.
Kozlov, M. V., V. Lanta, V. Zverev, and E. L. Zvereva. 2015. Global patterns in background
losses of woody plant foliage to insects. Global Ecology and Biogeography 24:1126–
1135.
Kuppler, J., J. Fricke, C. Hemp, I. Steffan-Dewenter, and M. K. Peters. 2015. Conversion of
savannah habitats to small-scale agriculture affects grasshopper communities at Mt.
Kilimanjaro, Tanzania. Journal of Insect Conservation 19:509–518.
122
Laliberté, E., D. A. Norton, and D. Scott. 2013. Contrasting effects of productivity and
disturbance on plant functional diversity at local and metacommunity scales. Journal
of Vegetation Science 24:834–842.
Laliberté Etienne, and Legendre Pierre. 2010. A distance‐based framework for measuring
functional diversity from multiple traits. Ecology 91:299–305.
Lefcheck, J. S. 2016. piecewiseSEM: Piecewise structural equation modelling in r for
ecology, evolution, and systematics. Methods in ecology and evolution 7:573–579.
Lehndal, L., and J. Ågren. 2015. Herbivory differentially affects plant fitness in three
populations of the perennial herb Lythrum salicaria along a Latitudinal Gradient.
PLOS ONE 10:e0135939.
Leingärtner, A., B. Hoiss, J. Krauss, and I. Steffan-Dewenter. 2014a. Combined effects of
extreme climatic events and elevation on nutritional quality and herbivory of Alpine
plants. PLOS ONE 9:e93881.
Leingärtner, A., J. Krauss, and I. Steffan-Dewenter. 2014b. Species richness and trait
composition of butterfly assemblages change along an altitudinal gradient. Oecologia
175:613–623.
Li, J., Q. He, X. Hua, J. Zhou, H. Xu, J. Chen, and C. Fu. 2009. Climate and history explain
the species richness peak at mid-elevation for Schizothorax fishes (Cypriniformes:
Cyprinidae) distributed in the Tibetan Plateau and its adjacent regions. Global Ecology
and Biogeography 18:264–272.
Lomolino, M. V. 2001. Elevation gradients of species‐density: historical and prospective
views. Global Ecology and Biogeography 10:3–13.
Lowman, M. D. 1984. An Assessment of techniques for measuring herbivory: Is rainforest
defoliation more intense than we thought? Biotropica 16:264–268.
123
Marczak, L. B., C.-K. Ho, K. Więski, H. Vu, R. F. Denno, and S. C. Pennings. 2011.
Latitudinal variation in top‐down and bottom‐up control of a salt marsh food web.
Ecology 92:276–281.
Martin, E. A., B. Reineking, B. Seo, and I. Steffan-Dewenter. 2013. Natural enemy
interactions constrain pest control in complex agricultural landscapes. Proceedings of
the National Academy of Sciences of the United States of America 110:5534–5539.
Mattson, W. J. 1980. Herbivory in relation to plant nitrogen content. Annual Review of
Ecology and Systematics 11:119–161.
McCain, C. M. 2004. The mid-domain effect applied to elevational gradients: species richness
of small mammals in Costa Rica. Journal of Biogeography 31:19–31.
McCain, C. M. 2005. Elevational gradients in diversity of small mammals. Ecology 86:366–
372.
McCain, C. M. 2007. Area and mammalian elevational diversity. Ecology 88:76–86.
McCain, C. M., and J.-A. Grytnes. 2010. Elevational gradients in species richness. Page in
John Wiley & Sons, Ltd, editor. Encyclopedia of Life Sciences. John Wiley & Sons,
Ltd, Chichester, UK.
McCoy, E. D. 1990. The distribution of insects along elevational gradients. Oikos 58:313–
322.
McGill, B. J., B. J. Enquist, E. Weiher, and M. Westoby. 2006. Rebuilding community
ecology from functional traits. Trends in Ecology & Evolution 21:178–185.
McNaughton, S. J., R. W. Ruess, and S. W. Seagle. 1988. Large mammals and process
dynamics in African ecosystems herbivorous mammals affect primary productivity
and regulate recycling balances. BioScience 38:794–800.
Merckx, V. S. F. T., K. P. Hendriks, K. K. Beentjes, C. B. Mennes, L. E. Becking, K. T. C. A.
Peijnenburg, A. …M. Schilthuizen. 2015. Evolution of endemism on a young tropical
mountain. Nature 524:347–350.
124
Merrill, R. M., D. Gutiérrez, O. T. Lewis, J. Gutiérrez, S. B. Díez, and R. J. Wilson. 2008.
Combined effects of climate and biotic interactions on the elevational range of a
phytophagous insect. The Journal of Animal Ecology 77:145–155.
Metcalfe, D. B., G. P. Asner, R. E. Martin, J. E. Silva Espejo, W. H. Huasco, F. …Y. Malhi.
2014. Herbivory makes major contributions to ecosystem carbon and nutrient cycling
in tropical forests. Ecology Letters 17:324–332.
Mittelbach, G. G., D. W. Schemske, H. V. Cornell, A. P. Allen, J. M. Brown, M. B. Bush, S.
… M. Turelli. 2007. Evolution and the latitudinal diversity gradient: speciation,
extinction and biogeography. Ecology Letters 10:315–331.
Mittelbach, G. G., C. F. Steiner, S. M. Scheiner, K. L. Gross, H. L. Reynolds, R. B. Waide, …
L. Gough. 2001. What is the observed relationship between species richness and
productivity? Ecology 82:2381–2396.
Mmbaga, N. E., L. K. Munishi, and A. C. Treydte. 2017. How dynamics and drivers of land
use/land cover change impact elephant conservation and agricultural livelihood
development in Rombo, Tanzania. Journal of Land Use Science 12:168–181.
Moreira, X., L. Abdala-Roberts, S. Rasmann, B. Castagneyrol, and K. A. Mooney. 2016.
Plant diversity effects on insect herbivores and their natural enemies: current thinking,
recent findings, and future directions. Current Opinion in Insect Science 14:1–7.
Moreira, X., P. W. K, M. K. A, R. Sergio, and A.-R. Luis. 2017. Elevational gradients in plant
defences and insect herbivory: recent advances in the field and prospects for future
research. Ecography 0:1-12.
Newmark, W.D. & IUCN Tropical Forest Programme eds. (1991) The conservation of mount
Kilimanjaro, International Union for Conservation of Nature and Natural Resources,
Gland, Switzerland.
Nock, C. A., R. J. Vogt, and B. E. Beisner. 2016. Functional traits. Pages 1–8 eLS. American
Cancer Society.
125
Nogués-Bravo, D., M. B. Araújo, T. Romdal, and C. Rahbek. 2008. Scale effects and human
impact on the elevational species richness gradients. Nature 453:216–219.
Nor, S. M. 2001. Elevational diversity patterns of small mammals on Mount Kinabalu, Sabah,
Malaysia. Global Ecology and Biogeography 10:41–62.
Novillo, A., and R. A. Ojeda. 2014. Elevation patterns in rodent diversity in the dry Andes:
disentangling the role of environmental factors. Journal of Mammalogy 95:99–107.
Novotny, V., P. Drozd, S. E. Miller, M. Kulfan, M. Janda, Y. Basset, and G. D. Weiblen.
2006. Why Are There so many species of herbivorous insects in tropical rainforests?
Science 313:1115–1118.
Novotny, V., S. E. Miller, L. Baje, S. Balagawi, Y. Basset, L. Cizek, …G. D. Weiblen. 2010.
Guild-specific patterns of species richness and host specialization in plant–herbivore
food webs from a tropical forest. Journal of Animal Ecology 79:1193–1203.
Oerke, E. C., Dehne, H. W., Schönbeck, F., & Weber, A. (1994). Crop production and crop
protection: estimated losses in major food and cash crops. Retrieved from
https://www.cabdirect.org/cabdirect/abstract/19986770444 Downloaded on 10
September 2017.
Olobatuyi, M. E. 2006. A user’s guide to path analysis. University Press of America.
Owen, J. G. 1990. Patterns of mammalian species richness in relation to temperature,
productivity, and variance in elevation. Journal of Mammalogy 71:1–13.
Parmesan, C. 1996. Climate and species’ range. Nature 382:765–766.
Paul, G. S., F. Montagnini, G. P. Berlyn, D. J. Craven, M. van Breugel, and J. S. Hall. 2012.
Foliar herbivory and leaf traits of five native tree species in a young plantation of
Central Panama. New Forests 43:69–87.
Payne, D., E. M. Spehn, M. Snethlage, and M. Fischer. 2017. Opportunities for research on
mountain biodiversity under global change. Current Opinion in Environmental
Sustainability 29:40–47.
126
Pellissier, L., X. Moreira, H. Danner, M. Serrano, N. Salamin, N. M. van Dam, and S.
Rasmann. 2016. The simultaneous inducibility of phytochemicals related to plant
direct and indirect defences against herbivores is stronger at low elevation. Journal of
Ecology 104:1116–1125.
Péré, C., H. Jactel, and M. Kenis. 2013. Response of insect parasitism to elevation depends on
host and parasitoid life-history strategies. Biology Letters 9:20130028.
Petchey Owen L., and Gaston Kevin J. 2002. Functional diversity (FD), species richness and
community composition. Ecology Letters 5:402–411.
Peters, M. K., A. Hemp, T. Appelhans, C. Behler, A. Classen, F. Detsch, … I. Steffan-
Dewenter. 2016. Predictors of elevational biodiversity gradients change from single
taxa to the multi-taxa community level. Nature Communications 7:13736.
Peters, M. K., A. Mayr, J. Röder, N. J. Sanders, and I. Steffan‐Dewenter. 2014. Variation in
nutrient use in ant assemblages along an extensive elevational gradient on Mt
Kilimanjaro. Journal of Biogeography 41:2245–2255.
Pianka, E. R. 1966. Latitudinal gradients in species diversity: A review of concepts. The
American Naturalist 100:33–46.
Poorter, L., M. van de Plassche, S. Willems, and R. G. A. Boot. 2004. Leaf traits and
herbivory rates of tropical tree species differing in successional status. Plant Biology
6:746–754.
Pryke, J.S., Roets, F. & Samways, M.J. (2016) Wild herbivore grazing enhances insect
diversity over livestock grazing in an African grassland system. PLoS, 11, e0164198.
Quintero, I., and W. Jetz. 2018. Global elevational diversity and diversification of birds.
Nature 555:246–250.
R Core Team. 2016. R: A Language and environment for statistical computing. R Foundation
for Statistical Computing, Vienna, Austria.
127
Rabosky, D. L., J. Chang, P. O. Title, P. F. Cowman, L. Sallan, M. Friedman, …M. E. Alfaro.
2018. An inverse latitudinal gradient in speciation rate for marine fishes. Nature
559:392–395.
Rahbek, C. 1995. The elevational gradient of species richness: a uniform pattern? Ecography
18:200–205.
Rahbek, C. 1997. The Relationship among area, elevation, and regional species richness in
Neotropical birds. The American Naturalist 149:875–902.
Rahbek, C. 2005. The role of spatial scale and the perception of large-scale species-richness
patterns. Ecology Letters 8:224–239.
Rahbek, C., and G. R. Graves. 2001. Multiscale assessment of patterns of avian species
richness. Proceedings of the National Academy of Sciences 98:4534–4539.
Rasmann, S., N. Alvarez, and L. Pellissier. 2014a. The altitudinal niche-breadth hypothesis in
insect-plant interactions. Pages 339–359 Annual Plant Reviews. Wiley-Blackwell.
Rasmann, S., A. Buri, M. Gallot-Lavallée, J. Joaquim, J. Purcell, and L. Pellissier. 2014b.
Differential allocation and deployment of direct and indirect defences by Vicia sepium
along elevation gradients. Journal of Ecology 102:930–938.
Rasmann, S., M. D. Johnson, and A. A. Agrawal. 2009. Induced responses to herbivory and
jasmonate in three milkweed species. Journal of Chemical Ecology 35:1326–1334.
Rasmann, S., L. Pellissier, E. Defossez, H. Jactel, and G. Kunstler. 2014c. Climate-driven
change in plant–insect interactions along elevation gradients. Functional Ecology
28:46–54.
Rickart, E. A. 2001. Elevational diversity gradients, biogeography and the structure of
montane mammal communities in the intermountain region of North America. Global
Ecology and Biogeography 10:77–100.
Robertson, A. I., and N. C. Duke. 1987. Insect herbivory on mangrove leaves in North
Queensland. Austral Ecology 12:1–7.
128
Rolland, J., F. L. Condamine, F. Jiguet, and H. Morlon. 2014. Faster speciation and reduced
extinction in the tropics contribute to the mammalian latitudinal diversity gradient.
PLOS Biology 12:e1001775.
Romdal, T. S., and J.-A. Grytnes. 2007. An indirect area effect on elevational species richness
patterns. Ecography 30:440–448.
Rosenberg, D. M., H. V. Danks, and D. M. Lehmkuhl. 1986. Importance of insects in
environmental impact assessment. Environmental Management 10:773–783.
Rosenzweig, M. L. 1992. Species diversity gradients: We know more and less than we
thought. Journal of Mammalogy 73:715–730.
Rosenzweig, M. L. 1995. Species diversity in space and time. Cambridge University Press.
Rosenzweig, M. L., and Z. Abramsky. 1993. How are diversity and productivity related?
Species diversity in ecological communities.
Roslin, T., B. Hardwick, V. Novotny, W. K. Petry, N. R. Andrew, A. Asmus, … E. M. Slade.
2017. Higher predation risk for insect prey at low latitudes and elevations. Science
356:742–744.
Rossetti, M. R., T. Tscharntke, R. Aguilar, and P. Batáry. 2017. Responses of insect
herbivores and herbivory to habitat fragmentation: a hierarchical meta-analysis.
Ecology Letters 20:264–272.
Rowe, K. C., K. M. Rowe, M. W. Tingley, M. S. Koo, J. L. Patton, C. Conroy, … C. Moritz.
2014. Spatially heterogeneous impact of climate change on small mammals of
montane California. Proceedings. Biological sciences, Proceedings of the Royal
Society B: Biological Sciences 282:20141857–20141857.
Rowe, R. J. 2009. Environmental and geometric drivers of small mammal diversity along
elevational gradients in Utah. Ecography 32:411–422.
Sala, O. E., F. S. Chapin, III, J. J. Armesto, E. Berlow, J. Bloomfield, R. Dirzo, … D. H.
Wall. 2000. Global biodiversity scenarios for the year 2100. Science 287:1770–1774.
129
SÁnchez‐Cordero, Ví. 2001. Elevation gradients of diversity for rodents and bats in Oaxaca,
Mexico. Global Ecology and Biogeography 10:63–76.
Schädler, M., G. Jung, H. Auge, and R. Brandl. 2003. Palatability, decomposition and insect
herbivory: patterns in a successional old-field plant community. Oikos 103:121–132.
Scheffers, B. R., T. A. Evans, S. E. Williams, and D. P. Edwards. 2014. Microhabitats in the
tropics buffer temperature in a globally coherent manner. Biology Letters
10:20140819.
Scheffers, B. R., L. D. Meester, T. C. L. Bridge, A. A. Hoffmann, J. M. Pandolfi, R. T.
Corlett, S… J. E. M. Watson. 2016. The broad footprint of climate change from genes
to biomes to people. Science 354:aaf7671.
Scheffers, B. R., and S. E. Williams. 2018. Tropical mountain passes are out of reach – but
not for arboreal species. Frontiers in Ecology and the Environment 16:101–108.
Schellenberger Costa, D., A. Classen, S. Ferger, M. Helbig-Bonitz, M. Peters, K. Böhning-
Gaese, I. Steffan-Dewenter, and M. Kleyer. 2017. Relationships between abiotic
environment, plant functional traits, and animal body size at Mount Kilimanjaro,
Tanzania. PLOS ONE 12:e0174157.
Schemske, D. W., G. G. Mittelbach, H. V. Cornell, J. M. Sobel, and K. Roy. 2009. Is there a
latitudinal gradient in the importance of biotic interactions? Annual Review of
Ecology, Evolution, and Systematics 40:245–269.
Schipper, J., J. S. Chanson, F. Chiozza, N. A. Cox, M. Hoffmann, V. Katariya, … B. E.
Young. 2008. The status of the world’s land and marine mammals: diversity, threat,
and knowledge. Science 322:225–230.
Schleuter D., Daufresne M., Massol F., and Argillier C. 2010. A user’s guide to functional
diversity indices. Ecological Monographs 80:469–484.
Schmitz, O. J. 2008. Herbivory from individuals to ecosystems. Annual Review of Ecology,
Evolution, and Systematics 39:133–152.
130
Schuldt, A., M. Baruffol, M. Böhnke, H. Bruelheide, W. Härdtle, A. C. Lang, …J. Fridley.
2010. Tree diversity promotes insect herbivory in subtropical forests of south-east
China. The Journal of Ecology 98:917–926.
Schuldt, A., H. Bruelheide, W. Durka, D. Eichenberg, M. Fischer, W. Kröber, ...T. Assmann.
2012. Plant traits affecting herbivory on tree recruits in highly diverse subtropical
forests. Ecology Letters 15:732–739.
Shipley, B. 2009. Confirmatory path analysis in a generalized multilevel context. Ecology
90:363–368.
Shipley, B. 2013. The AIC model selection method applied to path analytic models compared
using a d-separation test. Ecology 94:560–564.
Shipley, B. 2016. Cause and correlation in biology: A user’s guide to path analysis, structural
equations and causal inference with R. Cambridge University Press.
Šímová, I., Y. M. Li, and D. Storch. 2013. Relationship between species richness and
productivity in plants: the role of sampling effect, heterogeneity and species pool.
Journal of Ecology 101:161–170.
Šímová, I., and D. Storch. 2017. The enigma of terrestrial primary productivity:
measurements, models, scales and the diversity–productivity relationship. Ecography
40:239–252.
Souza, D. G., B. A. Santos, R. Wirth, I. R. Leal, and M. Tabarelli. 2013. Community-level
patterns of insect herbivory in a fragmented Atlantic forest landscape. Environmental
Entomology 42:430–437.
Spasojevic, M. J., J. B. Grace, S. Harrison, and E. I. Damschen. 2014. Functional diversity
supports the physiological tolerance hypothesis for plant species richness along
climatic gradients. Journal of Ecology 102:447–455.
Spehn, E. M., and C. Körner. 2005. A global assessment of mountain biodiversity and its
function. Pages 393–400 Global Change and Mountain Regions. Springer, Dordrecht.
131
Storch, D. (2012) Biodiversity and its energetic and thermal controls. In R.M. Sibly, J.H.
Brown & A. Kodric-Brown (Eds.), Metabolic ecology: a scaling approach, (pp. 120–
131). John Wiley & Sons, Ltd, Chichester, UK.
Stork, N. E., J. McBroom, C. Gely, and A. J. Hamilton. 2015. New approaches narrow global
species estimates for beetles, insects, and terrestrial arthropods. Proceedings of the
National Academy of Sciences 112:7519–7523.
Stuart, C., and T. Stuart. 2000. A field guide to the tracks and signs of Southern and East
African wildlife. Struik, Cape Town.
Sundqvist, M. K., N. J. Sanders, and D. A. Wardle. 2013. Community and ecosystem
responses to elevational gradients: Processes, mechanisms, and insights for global
change. Annual Review of Ecology, Evolution, and Systematics 44:261–280.
Suzuki, S. 1998. Leaf phenology, seasonal changes in leaf quality and herbivory pattern of
Sanguisorba tenuifolia at different altitudes. Oecologia 117:169–176.
Terborgh, J. W. 2015. Toward a trophic theory of species diversity. Proceedings of the
National Academy of Sciences 112:11415–11422.
Thormann, B., D. Ahrens, C. I. Espinosa, D. M. Armijos, T. Wagner, J. W. Wägele, and M.
K. Peters. 2018. Small-scale topography modulates elevational α-, β- and γ-diversity
of Andean leaf beetles. Oecologia: 1–9.
Thormann, B., D. Ahrens, D. Marín Armijos, M. K. Peters, T. Wagner, and J. W. Wägele.
2016. Exploring the leaf beetle fauna (Coleoptera: Chrysomelidae) of an Ecuadorian
mountain forest using DNA barcoding. PloS One 11:e0148268.
Tilman, D. 1982. Resource competition and community structure. Princeton University Press.
Trigas, P., M. Panitsa, and S. Tsiftsis. 2013. Elevational gradient of vascular plant species
richness and endemism in Crete – the effect of post-isolation mountain uplift on a
continental island system. PLOS ONE 8:e59425.
132
Trolle, M., A. J. Noss, J. L. P. Cordeiro, and L. F. B. Oliveira. 2008. Brazilian Tapir density
in the Pantanal: a comparison of systematic camera-trapping and line-transect surveys.
Biotropica 40:211–217.
Turcotte M. M., Thomsen C. J. M., Broadhead G. T., Fine P. V. A., Godfrey R. M., Lamarre
G. P. A., … Johnson M. T. J. 2014. Percentage leaf herbivory across vascular plant
species. Ecology 95:788–788.
Tylianakis, J. M., R. K. Didham, J. Bascompte, and D. A. Wardle. 2008. Global change and
species interactions in terrestrial ecosystems. Ecology Letters 11:1351–1363.
Tylianakis, J. M., and R. J. Morris. 2017. Ecological networks across environmental
gradients. Annual Review of Ecology, Evolution, and Systematics 48:25–48.
Valladares, F., E. Gianoli, and J. M. Gómez. 2007. Ecological limits to plant phenotypic
plasticity. New Phytologist 176:749–763.
Veldhuis, M. P., M. I. Gommers, H. Olff, and M. P. Berg. 2018. Spatial redistribution of
nutrients by large herbivores and dung beetles in a savanna ecosystem. Journal of
Ecology 106:422–433.
Vidal, M. C., and S. M. Murphy. 2018. Bottom-up vs. top-down effects on terrestrial insect
herbivores: a meta-analysis. Ecology Letters 21:138–150.
Violle, C., M.-L. Navas, D. Vile, E. Kazakou, C. Fortunel, I. Hummel, and E. Garnier. 2007.
Let the concept of trait be functional! Oikos 116:882–892.
Vitousek, P. M., H. A. Mooney, J. Lubchenco, and J. M. Melillo. 1997. Human domination of
earth’s ecosystems. Science 277:494–499.
Vucic-Pestic, O., R. B. Ehnes, B. C. Rall, and U. Brose. 2011. Warming up the system: higher
predator feeding rates but lower energetic efficiencies. Global Change Biology
17:1301–1310.
133
Wagner, T. 2007. Monolepta Chevrolat, the most speciose Galerucine taxon: redescription of
the type species Monolepta bioculata (Fabricius) and key to related genera from
(Chrysomelidae, Coleoptera). Journal of Natural History 41:81–100.
Wang, J., J. Soininen, Y. Zhang, B. Wang, X. Yang, and J. Shen. 2011. Contrasting patterns
in elevational diversity between microorganisms and macroorganisms. Journal of
Biogeography 38:595–603.
Werner, F. A., and J. Homeier. 2015. Is tropical montane forest heterogeneity promoted by a
resource-driven feedback cycle? Evidence from nutrient relations, herbivory and litter
decomposition along a topographical gradient. Functional Ecology 29:430–440.
Williams, P. H., N. D. Burgess, and C. Rahbek. 2000. Flagship species, ecological
complementarity and conserving the diversity of mammals and birds in sub-Saharan
Africa. Animal Conservation 3:249–260.
Woodwell, G. M. 2004. Mountains: top down. Ambio Spec No 13:35–38.
Wright, I. J., P. B. Reich, M. Westoby, D. D. Ackerly, Z. Baruch, F. Bongers … R. Villar.
2004. The worldwide leaf economics spectrum. Nature 428:821–827.
Yu, X.-D., L. Lü, T.-H. Luo, and H.-Z. Zhou. 2013. Elevational gradient in species richness
pattern of epigaeic beetles and underlying mechanisms at East slope of Balang
Mountain in southwestern China. PLOS ONE 8:e69177.
Zavala, J. A., P. D. Nabity, and E. H. DeLucia. 2013, January 14. An emerging understanding
of mechanisms governing insect herbivory under elevated CO2.Annual Review of
Entomology 58:79-97
Zhang, S., Y. Zhang, and K. Ma. 2017. The association of leaf lifespan and background insect
herbivory at the interspecific level. Ecology 98:425–432.
134
Authors’ contributions
Chapter II: This chapter is submitted to the Journal of Animal Ecology: Ref #JAE-2018-
00420 as Henry K. Njovu, Marcell K. Peters, David Schellenberger Costa, Roland Brandl,
Michael Kleyer, and Ingolf Steffan-Dewenter. Leaf traits mediate changes in invertebrate
herbivory along broad environmental gradients on Mt. Kilimanjaro, Tanzania.
Corresponding author: Henry K. Njovu
Authors’ contribution: M.K.P., R.B., and I.S.-D. designed the project and supervised the
fieldwork at Mt. Kilimanjaro. H.K.N. conducted all field and laboratory work. D.S.C. and M.K.
contributed plant leaf trait data and helped with the identification of plant specimens. M.K.P.
and H.K.N. conducted data analysis. H.K.N. wrote the first version of the manuscript with input
from M.K.P. and I.S.-D. All authors contributed to the final revision of the manuscript.
Acknowledgements: We thank KiLi Project Management team particularly Dr. Anna Treydte
for administering field logistics and KiLi field staff, in particular, James Ndimioni, Flowin
Njelekela and Raymond Vitusy for helping us to collect data at Mt. Kilimanjaro. Tanzania’s
Commission for Science and Technology (COSTECH), the Tanzania Wildlife Research
Institute (TAWIRI) and the Tanzania National Parks (TANAPA) deserve a special credit for
granting us permission to access study sites located within and outside the Kilimanjaro National
Park. We are also thankful to all the companies and individual farmers for allowing us to collect
data on their land. We are grateful to Jie Zhang for creating the map of the study area and the
College of African Wildlife Management, Mweka for granting a study leave to Henry Njovu.

135
Funding: This study was conducted within the framework of the Research Unit FOR1246
(https://www.kilimanjaro.biozentrum.uni-wuerzburg.de) under the financial support of the
Deutsche Forschungsgemeinschaft (DFG).
Henry K. Njovu Marcell K. Peters, David Schellenberger Costa
Roland Brandl Michael Kleyer Ingolf Steffan-Dewenter
136
Chapter III: This chapter is in preparation for publication as Henry K. Njovu, Marcell K.
Peters, Friederike Gebert, Thomas Wagner, David Schellenberger Costa, Michael Kleyer, and
Ingolf Steffan-Dewenter. Temperature and resource diversity predict the diversity of
phytophagous beetles along elevation and land use gradients on Mt. Kilimanjaro.
Corresponding author: Henry K. Njovu
Authors’ contribution: M.K.P., and I.S.-D. designed the project and supervised the fieldwork
at Mt. Kilimanjaro. H.K.N. conducted all field and laboratory work. F.G. contributed in
laboratory work. D.S.C. and M.K. contributed plant leaf trait data. T.W. verified and identified
beetles specimens. H.K.N. and M.K.P. conducted data analysis. H.K.N. wrote the first version
of the manuscript with input from M.K.P. and I.S.-D. All authors contributed to the final
revision of the manuscript.
Acknowledgements: The authors thank the Deutsche Forschungsgemeinschaft (DFG) for the
financial support to carry out the study within the framework of the Research Unit FOR1246
(https://www.kilimanjaro.biozentrum.uni-wuerzburg.de). We also thank the Tanzania
Commission for Science and Technology, the Tanzania National Parks and the Tanzania
Wildlife Research Institute for granting us permissions to conduct this study. We are also
thankful to administrative and field staff of KiLi - Project for their support during fieldwork at
Mt. Kilimanjaro. We also convey our sincere gratitude to various landowners who permitted us
to set feet on their premises during field campaigns.
Funding: This study was conducted within the framework of the Research Unit FOR1246
(https://www.kilimanjaro.biozentrum.uni-wuerzburg.de) under the financial support of the
Deutsche Forschungsgemeinschaft (DFG).

137
Henry K. Njovu Marcell K. Peters Friederike Gebert
Thomas Wagner David Schellenberger Costa Michael Kleyer
Ingolf Steffan-Dewenter
138
Chapter IV: This chapter is submitted to the Diversity and Distributions Ref # DDI-2018-
0264 as Friederike Gebert, Henry K. Njovu, Anna C. Treydte, Ingolf Steffan-Dewenter, and
Marcell K. Peters. Primary productivity and habitat protection predict species richness and
community biomass of large mammals on Mt. Kilimanjaro
Corresponding author: Friederike Gebert
Authors’ contribution: Author contributions: M.K.P. and I.S.-D. conceived the idea for the
study; F.G., A.C.T, I.S.-D., and M.K.P. designed the study; F.G. collected the data; F.G,
H.K.N., and A.C.T. conducted taxonomic identification, F.G. and M.K.P analyzed the data;
F.G. wrote the first version of the manuscript; all authors contributed to the final version of the
manuscript.
Acknowledgements: We would like to thank the Tanzanian Commission for Science and
Technology (COSTECH), the Tanzanian Wildlife Research Institute (TAWIRI) and the
Kilimanjaro National Park authority for their continuous support and granting the necessary
research permit (COSTECH 2015-178-NA-96-44 and TANAPA TNP/HQ/C.10/13). We are
thankful to Zacharia Mwanga, Daudi Lusiba, Bahati Charles and all other Tanzanian field
assistants for their help in the field. We would also like to thank Katrin Böhning-Gaese for the
kind provision of camera traps. This study was accomplished within the scope of the Research
Unit FOR1246 (Kilimanjaro ecosystems under global change: linking biodiversity, biotic
interactions and biogeochemical processes, https://www.kilimanjaro.biozentrum.uni-
wuerzburg.de) and funded by the Deutscher Akademischer Austauschdienst (DAAD) and by
the Deutsche Forschungsgemeinschaft (DFG).

139
Funding: This study was conducted within the framework of the Research Unit FOR1246
(https://www.kilimanjaro.biozentrum.uni-wuerzburg.de) under the financial support of the
Deutscher Akademischer Austauschdienst (DAAD) and Deutsche Forschungsgemeinschaft
(DFG).
Friederike Gebert Henry K. Njovu Anna C. Treydte
Ingolf Steffan-Dewenter Marcell K. Peters

140
Acknowledgements
First of all, I am grateful to the God for the good health and well-being that were necessary to
complete my study. In a special way, I would like to express my sincere gratitude to my
supervisors Prof. Dr. Ingolf Steffan-Dewenter, Prof. Dr. Roland Brandl and Dr. Peters Marcell
for the continuous support of my Ph.D. study and related research, for sharing expertise,
technical discussions, and encouragement extended to me. Their constructive comments and
valuable guidance helped me in all the time of research and writing of manuscripts and this
thesis.
My special appreciations are extended to Dr. David Schellenberger Costa, Prof. Thomas
Wagner, and Ms. Friederike Gebert for their technical support in the identification work. I also
extend my gratitude to my fellow officemates, paper club and R club members for the
stimulating discussions, their cooperation, and of course for all the fun we have had during my
studies. I also place on record, my sense of gratitude to Alice Classen, Birgit Bünger, Jie Zhang,
Thomas Igerst, and all other staff in the Department of Animal Ecology and Tropical Biology,
the University of Würzburg for their regular help and support. I must say they really made me
feel at home.
A very special gratitude goes out to the Deutsche Forschungsgemeinschaft (DFG), KiLi -
Research Group and the KAAD for the funding. Connected to KiLi - Research Group, the
administration team of the KiLi – Project, the station Manager of our time Dr. Anna Treydte
and my fellow Ph.D. students, in particular, Tony Mayr, Friederike Gebert, Hawa Kaisi,
Emmanuel Ndossi, and Jerome Kimaro deserve a special mention. Similarly, from the KAAD

141
team, Dr. Hermann Weber, Dr. Marko Kuhn, Ms. Jana Geerken and Ms. Miriam Roßmerkel
deserve special a credit.
I would also like to place on record, my sincere gratitude to my employer, the College of African
Wildlife Management, Mweka for granting me a paid study leave for the four good years.
Tanzania’s Commission for Science and Technology (COSTECH), the Tanzania Wildlife
Research Institute (TAWIRI), the Tanzania National Parks (TANAPA) and landowners deserve
a special credit for granting me a permission to conduct this research.
I also thank my parents Mr. Kenneth O. Njovu and Tumpe F. Mwakatundu for their tremendous
moral support and unceasing encouragement throughout my studies. Most importantly, I wish
to thank my loving and supportive wife Atupakisye Mwaisaka and my wonderful children who
provide interminable inspiration. I am also very grateful to Mr. and Mrs. Benjamin Mgittu and
my other family members and friends who have supported me in many ways in my studies.
Lastly, but by no means the least, I am extending my heartfelt appreciations to my field
assistants particularly James Ndimioni, Flowin Njelekela, Raymond Vitusy and everyone with
whom I have had the pleasure to work within the four years of my studies.
Thank you all once again!
142
Publication list
Articles connected to the thesis
Henry K. Njovu, Marcell K. Peters, David Schellenberger Costa, Roland Brandl, Michael
Kleyer, Ingolf Steffan-Dewenter. Leaf traits mediate changes in invertebrate herbivory along
broad environmental gradients on Mt. Kilimanjaro, Tanzania. Submitted to the Journal of
Animal Ecology: Ref # JAE-2018-00420
Friederike Gebert, Henry K. Njovu, Anna C. Treydte, Ingolf Steffan-Dewenter, Marcell K.
Peters. Primary productivity and protection status predict species richness and community
biomass of large mammals on Mt. Kilimanjaro. Submitted to the Diversity and Distributions
Ref # DDI-2018-0264.
Henry K. Njovu, Marcell K. Peters, Friederike Gebert, Thomas Wagner, David Schellenberger
Costa, Michael Kleyer, and Ingolf Steffan-Dewenter. Temperature and plant functional
diversity predict the diversity of phytophagous beetles along elevation and land use gradients
on Mt. Kilimanjaro. (In preparation)
Other articles
Published articles
Henry K. Njovu, Domina Mgelwa, Elibariki H. Shilla, Obeid Mahenya, Rudolf F. Mremi
(2016). Influence of Mountaineers' Body Mass Index and Age on the Summiting Success of
Mt. Kilimanjaro (5895m) in Tanzania, High Altitude Medicine & Biology, 17 (3), 243-244.
143
Njovu H.K., Kahana L.W., Kamili E., Alfred G. and Mremi R., (2016). Estimating Vegetation
Change in Saadani National Park, International Journal of Molecular Evolution and
Biodiversity, 6(2), 1-6 (doi: 10.5376/ijmeb.2016.06.0002).
Kisingo A. W., Njovu, H. K., & Alfred, G., (2013) Biomes and Ecosystems. Tropical Savannas,
Salem Press, New York, Vol. 4, 193-199.
Kajembe, G. C., and Katani, J., …. Njovu, H. K., et al (2005). Impacts of Community Based
Conservation Projects in Tanzania; A case study of Wami–Mbiki Area in Bagamoyo and
Morogoro and Coast Rural Districts. Rural Planning Journal Vol. VII No. 2.
Submitted articles
Marcell K. Peters, Andreas Hemp, Tim Appelhans, Joscha N. Becker, Christina Behler, Alice
Classen, Florian Detsch, Andreas Ensslin, Stefan W. Ferger, Sara B. Frederiksen, Friederike
Gebert, Friederike Gerschlauer, Adrian Gütlein, Maria Helbig-Bonitz, Claudia Hemp, William
J. Kindeketa, Anna Kühnel, Antonia Mayr, Ephraim Mwangomo, Christine Ngereza, Henry
K. Njovu, Insa Otte, Holger Pabst, Marion Renner, Juliane Röder, Gemma Rutten, David
Schellenberger Costa, Natalia Sierra-Cornejo, Maximilian G.R. Vollstädt, Connal D. Eardley,
Alexander Keller, Ralph S. Peters, Axel Ssymank, Victor Kakengi, Jie Zhang, Christina
Bogner, Katrin Böhning-Gaese, Roland Brandl, Dietrich Hertel, Bernd Huwe, Ralf Kiese,
Michael Kleyer, Yakov Kuzyakov, Thomas Nauss, Matthias Schleuning Marco Tschapka,
Markus Fischer, Ingolf Steffan-Dewenter. Climate-land use interactions shape tropical
mountain biodiversity and ecosystem functions. Under review: Nature Ref # 2018-04-04712
144
Henry K. Njovu, Alex W. Kisingo, Thomas Hesselberg and Abraham Eustace. The spatial and
temporal distribution of mammal roadkills in the Kwakuchinja Wildlife Corridor in Tanzania.
Submitted to African Journal of Ecology: Ref # AFJE-18-124
Articles in preparation
Why honey bees urgently need in conservation. Fabrice Requier, Lionel Garnery, Patrick L.
Kohl, Henry K. Njovu, Christian W. W. Pirk, Robin M. Crewe, Ingolf Steffan-Dewenter.
Wilfred Kalumuna, Henry K. Njovu, Julius V. Lasway. Effects of farming systems on the
foliar herbivory of Coffea arabica on the slopes of Mt. Kilimanjaro, Tanzania.

145
Curriculum Vitae

146
Related Documents