Partisan Control, Media Bias, and Viewer Responses: Evidence from Berlusconi’s Italy * Ruben Durante † Brian Knight ‡ March 12, 2010 Abstract This paper examines whether and how viewers respond to changes in partisan bias in media news. We use data from Italy, where the main private television network is owned by Silvio Berlusconi, the leader of the center- right coalition, and the public television corporation is largely controlled by the ruling coalition. We first document that after the 2001 national elec- tions, when the control of the government moved from the center-left to the center-right, news content on public television shifted to the right. Using individual survey data, we find robust evidence that viewers responded to these changes by modifying their choice of favorite news programs. On the one hand, right-leaning viewers increased their propensity to watch pub- lic channels which, even after the change, remained to the left of private channels. On the other hand, left-wing viewers reacted by switching from the main public channel to another public channel that was controlled by the left during both periods. We show that this behavioral response, which tended to shift ideological exposure to the left, significantly, though only partially, offset the movement of public news content to the right. * We thank Constanca Esteves, Andrew Foster, Matt Gentzkow, Ethan Kaplan, Riccardo Puglisi, Jesse Shapiro and three anonymous referees for helpful comments. We also thank seminar partic- ipants at Brown University and participants to the 6th Workshop on Media Economics, the 10th Meeting of the LACEA Political Economy Group, and the 2010 Annual Meeting of the Midwest Economic Association for helpful discussion. We are grateful to the Italian Nation Election Studies group, to the Osservatorio dei Media di Pavia, and to GECA Italia for providing part of the data used in this study. † Brown University, Department of Economics. Contact: [email protected] ‡ Brown University, Department of Economics and NBER. Contact: [email protected]. 1

Welcome message from author
This document is posted to help you gain knowledge. Please leave a comment to let me know what you think about it! Share it to your friends and learn new things together.
Transcript

Partisan Control, Media Bias, and Viewer
Responses: Evidence from Berlusconi’s Italy∗
Ruben Durante† Brian Knight‡
March 12, 2010
Abstract
This paper examines whether and how viewers respond to changes inpartisan bias in media news. We use data from Italy, where the main privatetelevision network is owned by Silvio Berlusconi, the leader of the center-right coalition, and the public television corporation is largely controlledby the ruling coalition. We first document that after the 2001 national elec-tions, when the control of the government moved from the center-left to thecenter-right, news content on public television shifted to the right. Usingindividual survey data, we find robust evidence that viewers responded tothese changes by modifying their choice of favorite news programs. On theone hand, right-leaning viewers increased their propensity to watch pub-lic channels which, even after the change, remained to the left of privatechannels. On the other hand, left-wing viewers reacted by switching fromthe main public channel to another public channel that was controlled bythe left during both periods. We show that this behavioral response, whichtended to shift ideological exposure to the left, significantly, though onlypartially, offset the movement of public news content to the right.
∗We thank Constanca Esteves, Andrew Foster, Matt Gentzkow, Ethan Kaplan, Riccardo Puglisi,Jesse Shapiro and three anonymous referees for helpful comments. We also thank seminar partic-ipants at Brown University and participants to the 6th Workshop on Media Economics, the 10thMeeting of the LACEA Political Economy Group, and the 2010 Annual Meeting of the MidwestEconomic Association for helpful discussion. We are grateful to the Italian Nation Election Studiesgroup, to the Osservatorio dei Media di Pavia, and to GECA Italia for providing part of the dataused in this study.
†Brown University, Department of Economics. Contact: [email protected]‡Brown University, Department of Economics and NBER. Contact: [email protected].
1

1 Introduction
Since the introduction of newspapers, there has been substantial concern over
partisan control of the media. Some observers worry that impressionable voters
may be influenced by an ideological media and that this may result in an electoral
advantage for the favored party. According to this view, an overtly partisan media
may lead to the election of low quality candidates and to the enactment of poor
policies.
This argument rests upon three key assumptions. First, it assumes that ideo-
logical control of the media will lead to biased news content. The opposing view
is that, under private ownership of the media, market forces, and viewers’ ideol-
ogy in particular, are sufficiently strong such that the profit motive will dominate
any influence motive. If the media is publicly owned, by contrast, then the profit
motive may be less of a driving force. The second key assumption is that con-
sumers will not respond to ideological control of the media by shifting to outlets
more in line with their own ideology, a behavioral response that will only be pos-
sible with a sufficiently pluralistic media sector. Third, voters must respond to
media content when choosing between candidates.
In this paper, we investigate these issues in the context of the television in-
dustry in Italy, where a single politician with easily identified ideology, Silvio
Berlusconi, owns the main private television network, and where the public tele-
vision corporation is traditionally controlled by the ruling political coalition. In
particular, we examine news content and viewership of the six top national tele-
vision channels before and after the 2001 change in government, which shifted
control of the public television corporation from the center-left coalition to the
Berlusconi-led center-right coalition.
We first investigate whether or not partisan control of the media affects news
content. To address this question, we first develop an absolute, but time invariant,
measure of station ideology. We find that Berlusconi’s private network provided
more speaking time to the right during the period in which the right was in power
than to the left during the period in which the left was in power. Based upon this
2
finding of an asymmetry, we conclude that Berlusconi’s private network is biased
towards the right. We then develop a relative, but time varying, measure of station
ideology. Based upon this measure, we find that the public network shifted to the
right, relative to the private network, following the change in control of the public
network from the left to the right.
We then investigate whether and how viewers responded to these changes in
media control. Given our finding that the public network shifted to the right on
the ideological spectrum following the change in its control from the left to the
right party, did viewers respond to the change in content by switching to a chan-
nel with an ideological leaning closer to their own? To answer this question, we
develop an econometric model of viewer’s choice of media outlets. In the model,
viewers have incomplete information and thus potentially benefit from media re-
ports. This benefit, however, is larger when the ideology of the station is closer to
that of the voter. We then estimate this model using panel data on viewership and
ideology before and after the shift in control. Our primary finding is that, after
the change in control of the public network from the left to the right, right-leaning
viewers become much more likely to watch news on public television channels.
Conversely, we find that some left-wing viewers reacted to this change in control
by switching from the main public channel to another public channel that was
controlled by the left even after the change in government.
Given that: 1) the ideological content of public channels moved to the right
but remained to the left of the private channels, and 2) that viewers responded to
this change by switching to more like-minded channels, we next examine the net
change in the ideological exposure of viewers with differing political ideologies.
We find that, while those viewers who continued to watch public channels were
eventually exposed to a more right-leaning news coverage, this effect is offset in
part by an opposite effect on those viewers who switched channels and ended up
being exposed to a more left-leaning coverage. In fact, for one group of view-
ers we find that, on average, overall ideological exposure was largely unchanged
following the shift in control and content to the right.
Finally, we provide five additional pieces evidence on viewer responses. First,
3
we show that results are similar when using a measure of frequency of watching
each channel. Second, we investigate second choices by consumers. Third, we
show that the relationship between viewer trust in the public network and ideology
changed in an analogous manner following the change in government. Fourth, we
investigate measures using aggregate ratings of news programs. Finally, we inves-
tigate possible substitution between viewership of television news and newspaper
readership.
2 Literature Review
Our paper is related to a literature on the relationship between ideological control
of the media and media content. In terms of private media ownership, Besley and
Prat (2006) theoretically examine the case for government capture of the media
sector in the context of a political agency model. They find that capture is less
likely when voters have access to a wide variety of outlets and when ownership
is independent in the sense that it is costly for the government to provide trans-
fers to the media. They also find that media capture affects political outcomes.
Snyder and Strömberg (2008) empirically examine this relationship between me-
dia coverage and political accountability based upon a measure of the geographic
congruence between media markets and Congressional districts. Supply-driven
media bias can come from factors other than political capture. In a theoretical
contribution Baron (2006) studies how media bias can originate from the incen-
tive of career-oriented reporters to write sensationalized stories. In Baron’s model
profit-maximizing news organizations may tolerate bias if this allow them to hire
journalists at lower wages; as a consequence, media bias can persist even in com-
petitive market environments, and, in some case, an increase in the number of
independent media outlets can actually increase, rather than reduce, the level of
bias.
Several empirical studies provide support for the notion that control of the me-
dia matters for media content as well as other outcomes. Djankov et al. (2003) ex-
4

amine control of the media in a variety of countries and find that government con-
trol of the broadcast media is pervasive and that this public control is associated
with poor government outcomes. Gentzkow et al. (2006) document the move-
ment from a partisan to an informative press in the United States between 1880
and 1920. They argue that this shift is largely driven by reductions in marginal
costs of production and the associated increases in readership along with height-
ened competition in the marketplace. In a case study of coverage of Gary Hart’s
1988 Presidential campaign by the newspaper chain Glasser et al. (1989) demon-
strate that private group ownership of newspapers led to more uniform coverage
across newspapers in this instance. Pritchard (2002) examines the role of pri-
vate group ownership of newspapers in the United States on coverage of the 2000
Presidential campaign. Finally, Puglisi and Snyder (2008) find that bias in news
coverage of political scandals is related to a newspapers’ ideological leaning as
measured by editorial endorsements.1
An alternative view is that reader preferences are the dominant factor in driv-
ing news coverage. Mullainathan and Shleifer (2005) and Gentzkow and Shapiro
(2006) formalize this argument and demonstrate that viewers choose media out-
lets with content conforming to their own ideology. Gentzkow and Shapiro (2010)
empirically examine this issue in the U.S. newspaper industry and show that
newspaper content is closely related to the prevailing ideology of readers in the
marketplace. They argue that reader ideology, rather than private owner ideology,
is the key driver of newspaper slant.
3 Background on Italian Television
The Italian broadcast television industry is composed of two main national net-
works - one public and one private.2 The Italian public service broadcaster (RAI)
1There is also a larger literature on media bias and its effects on voters’ behavior. See Grosecloseand Milyo (2005), DellaVigna and Kaplan (2007), George and Waldfogel (2006), and Gerber et al.(2009).
2Along with a multitude of regional and local channels, there is a smaller national network(La7), which is currently owned by Telecom Italia Media. La7 is fairly small relative to the two
5

operates three national terrestrial channels: RAI 1, RAI 2 and RAI 3 (labeled
respectively P1, P2, and P3 henceforth, where P refers to public). RAI’s main
competitor is Mediaset, the main Italian commercial television network, founded
and controlled by Silvio Berlusconi through his family’s holding Fininvest, which
also broadcast three national channels: Canale 5, Italia 1, and Rete 4 (respectively
B1, B2 and B3 henceforth, where B refers to Berlusconi). Taken together RAI
and Mediaset account for approximately 85-90% of the average TV viewership.3
This high degree of concentration and corresponding lack of pluralism in this
market is particularly salient given that television represents the main source of
political information for the vast majority of the Italian population.4
For several reasons, the relationship between the political system and the me-
dia in Italy is particularly close. First, the leader of one of the two main political
coalitions is the owner of the top private media conglomerate. This issue has
generated debate about both Berlusconi’s potential use of the private media for
political gain and potential regulation of this conflict of interest. Second, the po-
litical majority has substantial influence over public television. During our sample
period, the news director of P1 - the most viewed and influential public channel
- was replaced following changes in the majority coalition (Table 1).5 These two
other networks and only represents about 3% of the market.3The average daily audience share of RAI and Mediaset combined was 90.4% in 2001, 89.6%
in 2002, 89.0% in 2003, 87.5% in 2004, 85.5% in 2005, 83.9% in 2006, and 82.7% in 2007. Thedata come from Auditel, the research company responsible for television audience measurement inItaly.
4According to a recent survey by Diamanti et al. (2007), for example, broadcast televisionrepresents one of the principle sources of information for 94% of the population. Other surveyspresent similar results (ISTAT, 2008; CENSIS, 2008). Furthermore, for a significant segment of thepopulation, broadcast television represents the only source of news.
5Traditionally, the executive body of the Italian public broadcasting corporation has been repre-sentative of the ruling political coalition. RAI is governed by a nine-member administrative council.Seven members are elected by a parliamentary committee while the remaining two, including thepresident, are nominated by the largest shareholder - the Ministry of Economy and Finance. Thecouncil appoints the director-general, the channels’ directors, and the directors of each channelnews service. The latter are very influential figures since they are responsible for setting the newsprogram editorial line and agenda, therefore influencing which issues or events are covered. Theseappointments are made according to a long-standing system of political quotas (lottizzazione). Infact, most of the time those appointed to these positions can be linked to one political coalition oreven to a specific political party according to previous political or professional experience.
6
issues were particularly salient between 2001 and 2006, when Silvio Berlusconi
was also the head of the ruling coalition and hence in a position to exert influ-
ence on both private and public television. Despite the undeniable influence of
the majority, the opposition is generally granted control of one of the three public
channels. During our entire sample period, P3 news remained within the sphere
of influence of the left-wing coalition, whereas P2 news directors were closer to
the center-right parties.
4 Content Analysis
We next investigate the evolution of news coverage of the two major coalitions,
the center-right and the center-left.6 Monthly data on content for the top six na-
tional channels are available from the Italian Communications Regulatory Au-
thority (AGCOM) and cover the period between January 2001 and September
2007. These data include measures of both speaking time - defined as airtime in
which each political actor speaks directly to the public (statements, interviews,
etc.) - and news time - defined as airtime devoted to the coverage of issues and/or
events related to a political actor.7
In constructing our measure of station ideology, we choose to focus on speak-
ing time rather than news time. Unlike news time, which may include both pos-
itive and negative reports, speaking time measures the opportunity for a political
actor to communicate its views directly to the audience, and can hence be consid-
ered a better measure of favorable coverage.8 To compute the speaking time of
6Over the course of the last decade the Italian political system has been characterized by thepresence of these two main political coalitions. Despite considerable within-coalition ideologicaldifferences and attrition, these alliances have not experienced major transformations over the periodunder examination (2001-2007). It seems therefore appropriate for the period under examinationto treat these coalitions as the key players in the Italian political arena.
7We also developed measures based upon coverage of different issues by channels. This analysisdocuments that Berlusconi’s private channels, relative to the public channels, tended to devote morecoverage to issues, such as crime and security, that are commonly considered to be more salient toright-leaning voters. See Durante and Knight (2009) for further details.
8Gentzkow and Shapiro (2010) circumvent this problem of negative coverage by measuringideology via the printing of political phrases in newspapers in the United States. Unfortunately,
7

a coalition, we aggregate the speaking time devoted to the affiliate parties, and,
for the coalition in power, we also include the time assigned to the government
(Prime Minister and other members of government) and to the Speakers of the
two Houses.9
Note that our speaking time measure may still include unfavorable coverage
if, for example, Berlusconi’s network provides airtime to extreme left parties that
are critical of the center-left coalition. For this reason, we also present results
focusing on the distribution of speaking time among the different members, such
as the Prime Minister, within the majority coalition. More generally, the presence
of negative coverage should only bias our analysis against the key hypotheses
since right-leaning channels may tend to air positive coverage of the center-right
coalition but negative coverage of the center-left coalition and likewise for left-
leaning channels.
We begin by developing an absolute, but time-invariant, measure of station
ideology. In particular, we examine how speaking time on each station is dis-
tributed between the majority and the opposition over this period. This measure
of station ideology is based upon a test for symmetry. If a channel provides equal
coverage of the right when the right is in power and the left when the left is in
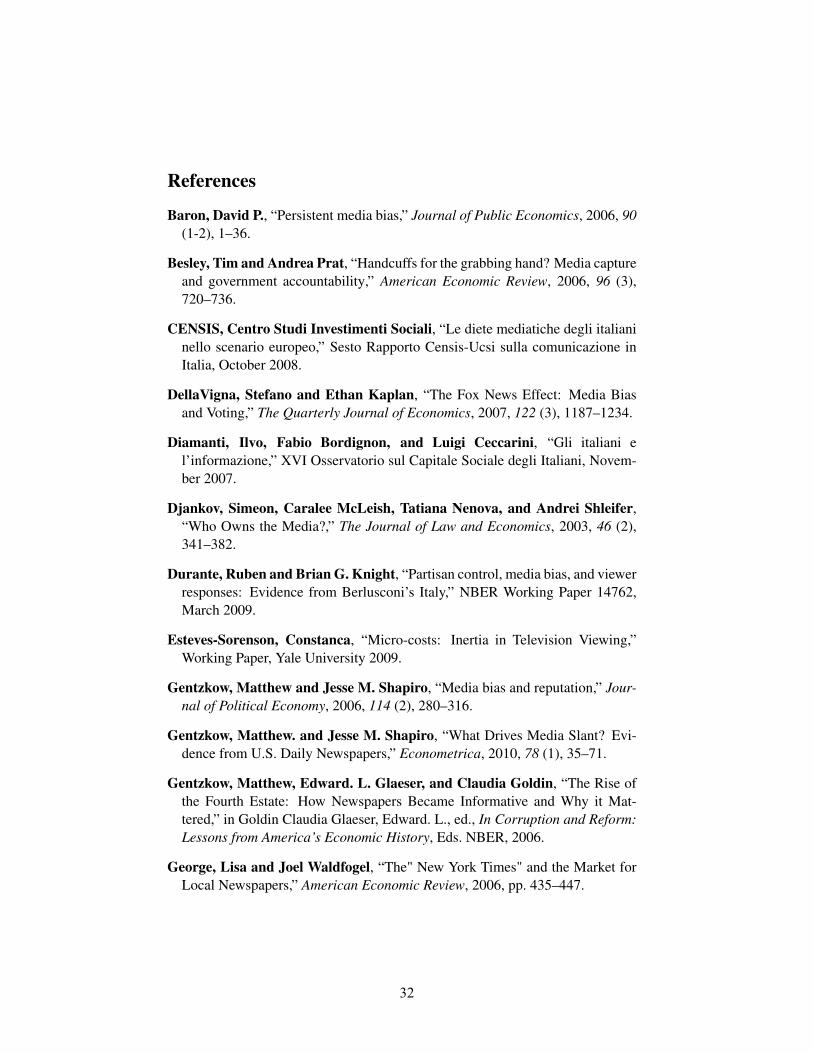
power, we conclude that this channel is unbiased, and deviations from symmetry
provide evidence of bias.
As shown in Figure 1a, the right receives more extensive coverage on Berlus-
coni’s channels than does the left, even when the latter is in power. Thus, we
find evidence that Berlusconi’s network is biased to the right. The same pattern
does not apply to public channels (Figure 1b) which, on aggregate, devote a fairly
stable fraction of time to the majority, regardless of who is in power. With regard
to differences between Mediaset channels (Figure 2), while news coverage on
B2 and B3 is more favorable to the right throughout the entire period, B1 covers
such a measure is infeasible in the Italian context, since, to the best of our knowledge, there is nosystematic database of television news transcripts.
9We do not consider the time devoted to the President of the Republic since this figure cannotbe associated with any of the coalitions. We also disregard the time devoted to the European Union,and to those parties that are not affiliated with any of the two major coalitions.
8

the two coalitions in a rather more balanced way, devoting more time to the left
when this is in power. Nevertheless, on B1, the gap between the majority and
the opposition is also much larger when Berlusconi is in power. Turning to public
television (Figure 3), all three channels devote on average a larger fraction of time
to the ruling coalition. However, on P2 the gap between majority and opposition
is larger during Berlusconi’s government, while the opposite is true for P3, which
provides particularly favorable coverage of the left-wing coalition when it is in
the opposition. P1 is characterized by the most regular pattern. Over the period
analyzed, in fact, time is distributed in a fairly stable fashion between majority
and opposition.
To further test these patterns we regress the share of total speaking time de-
voted to the majority on group dummies and interaction terms with a dummy for
Berlusconi being in power.10 The coefficient on this interaction term provides a
summary measure of the degree of bias towards to the right. As shown in col-
umn 1 of Table 2, the coefficient on the interaction term for Berlusconi’s channels
is large, positive and statistically significant, confirming a much more favorable
coverage of the majority when the right is in power.11 As depicted in column
2, this result is more pronounced for B2 and B3, but the difference is also large
and significant for B1. Turning to public channels, the coefficient on the inter-
action term for P2 is positive and significant, confirming a clear bias in favor of
the right-wing coalition. In contrast, coverage on P3 is more favorable to the left-
wing majority than to the right-wing majority. Finally, P1 slightly favors the right
coalition.
This measure of station ideology is based upon the assumption that an unbi-
ased station provides equal coverage to the majority regardless of which coalition
10Some members of the majority coalition may be particularly exposed to the media duringcertain periods of the year (e.g. the Ministry of Economy during the discussion of the budget law).To control for possible seasonal variations in the coverage of the majority, regressions in Table 2and 3 include calendar month fixed effects.
11Standard errors are corrected for possible correlation over time via GLS estimation assumingautocorrelation (AR1) within channel*time period (before, during, and after Berlusconi’s govern-ment) groups. Note that this procedure is related to, but different from, clustering based upon thesegroups; this clustering procedure tended to generate uniformly lower standard errors.
9

is in power. Even without this assumption, however, one can compare cover-
age across stations in order to measure the relative positions of the stations on
the ideological spectrum. According to this comparison, which is based upon the
coefficients on the interactions terms in column 2 of Table 2, we can order the sta-
tions from left to right as follows: P3, P1, P2, B1, B2, and B3. Thus, the public
stations all lie to the left of the private stations, and the public station controlled
by the left throughout the sample (P3) is the furthest to the left of the three.
One limitation of these measures of station ideology is that they do not ac-
count for changes over time in the party controlling the main public channel (P1),
which will be the key source of variation in the behavioral responses section to
follow. To examine the role of changes in control, we next develop a time-varying,
but relative, measure of station ideology. This measure gauges the change in con-
tent on the public network following changes in ideological control, relative to
the change in content on the private network, which was controlled by Berlusconi
for the entire sample.
In order to implement this relative measure, we use the fraction of speaking
time devoted to the right party rather than the fraction of speaking time devoted
to the majority. We again regress speaking time on group dummies and on inter-
action terms with a dummy for Berlusconi being in power. The coefficient on this
interaction term provides a measure of how each channel shifted their coverage
of the right after Berlusconi’s party is in control. We omit the key coefficients
for one channel, and all results should be interpreted as relative to this omitted
category. Thus, this measure captures changes in the relative positions of stations
on the ideological spectrum but cannot measure whether a particular station or
the sector as a whole is biased to the left or to the right.
As shown in column 3, we find that the private network devoted less coverage
to the right, relative to the public network, during the period in which Berlusconi
was in government and hence controlled the public network. This finding is con-
sistent with the idea that the public network shifted to the right when Berlusconi
was in power. This effect, however, is small and statistically insignificant, perhaps
reflecting the fact that the news director changes with the government in only one
10

of three public channels (P1). We next examine more fully this heterogeneity in
coverage within the public and private networks. As shown in column 4 of Table
2, where channel P1 is the omitted category, we find that, relative to each of the
five other channels, the main public network (P1) moved to the right during the
period in which the center-right was in control. These results are statistically sig-
nificant for channel P1 relative to channels B3 and P3. In terms of comparing P1
and the Mediaset channels (B1, B2, and B3), we can say that P1 remained to the
left of the Mediaset channels in all periods but that these ideological differences
between the two were smaller when the right was in power.12In terms of compar-
ing P3 and P1, we conclude that P1 was to the right of P3 in all periods and that
these ideological differences between the two were larger when the right was in
power. Taken together, these results document that P1 was a less extreme ver-
sion of P3 when the left was in power and a less extreme version of the Mediaset
channels when the right was in power.
While our interpretation is that these changes in content were due to changes
in control of the public channel, there are other possible explanations for this
result. If media outlets favor the party that is more popular among voters, as doc-
umented by Gentzkow and Shapiro (2010), then coverage of the majority may be
higher than the minority for this reason since majority status necessarily reflects
the preferences of voters for this party. If this demand-side view applies to both
the public and private networks, however, it would not explain why content on
the public shifts to the right relative to the private. On the other hand, it is possi-
ble that Berlusconi’s private network was already so biased to the right that there
was little capacity for increased coverage of the right when Berlusconi was in
power. This capacity issue would not explain, however, the variation within the
public channels and why, in particular, P1 shifts to the right, relative to P3, which
12In fact, some commentators suggested that news content on P1 might have become even morepro-Berlusconi than on B1. This impression, however, was not based on a systematic comparisonof political coverage on the two news channels, but rather on anecdotal evidence of P1’s patentlyunbalanced coverage of particular political events. One notable example was P1’s decision of notbroadcasting the EU Parliament session in which prime minister Berlusconi replied to Mr. MartinSchulz - a German MEP who had criticised Berlusconi’s domestic policy - by comparing him to aNazi concentration camp guard, an episode which was instead broadcast on B1’s news programs.
11

was always controlled by the center-left and had plenty of capacity for additional
coverage of the right. Of course, we cannot rule out an alternative explanation in
which P1 is simply more responsive to viewer preferences than other channels.
This duly noted, we see no reason why P1 would differentially respond in this
manner, and thus view changes in partisan control of media as the most likely
explanation for changes in the pattern of coverage.
Returning to our measure based upon speaking time devoted to the majority,
another question of interest is how this time is distributed among different mem-
bers of the ruling coalition and whether the distribution changes depending on
who is in power. As shown in Table 3, when Berlusconi is in power his channels
tend to cover the government disproportionately more. Interestingly, this result is
mostly driven by a steady increase in the coverage of the Prime Minister himself,
rather than coverage of others in governments, majority parties, and MPs, and
Speakers. For the public channels, by contrast, we find little increase in coverage
of the Prime Minister when right is in power.
In summary, we have found that the Italian television market for news appears
to be segmented along different lines. Overall, Berlusconi’s channels provide a
more favorable coverage of the right-wing coalition relative to public channels.
We also find evidence of substantial heterogeneity within Berlusconi’s channels
with B2 and B3 offering a more unbalanced coverage than B1. We find significant
heterogeneity within the public channels with P2 leaning towards the right and P3
toward the left. P1, by contrast, is not characterized by a particular left-right bias
and generally favors the ruling coalition over the opposition, regardless of the
color of the majority.
5 Theoretical Framework
In this section, we examine how viewers altered their viewing habits in response
to the changes in media ownership and content documented above. We begin by
deriving a theoretical model of consumer choice of media outlets. The model
12

is based upon a media sector that provides potentially valuable information to
imperfectly informed consumers. We then use the theoretical model to generate
an empirical specification of the choice of media outlet by viewers of differing
ideologies.
5.1 Preliminaries
Society must choose between two policy alternatives (p ∈ {L,R}). These options
could be interpreted in a variety of ways, including an election featuring two par-
ties, a decision over whether to go to war, or proposed changes to immigration
policy. There is a set of individual voters, indexed by v, and a set of news stations,
indexed by s. Voter’s payoffs from each policy option depend upon two factors.
First, each voter’s judgment of the policy options is affected by a certain ideo-
logical position. Thus, left-leaning voters are predisposed to the left-wing option
and likewise for right-wing voters. In addition to this ideological dimension, we
assume that there is a payoff that is common to all voters. We refer to this pay-
off as the quality of the policy option, and the options thus can be interpreted
as ‘good policy’ or ‘bad policy’. In the electoral context, this quality dimension
can be interpreted as the experience or integrity of the candidates. In the conflict
context, the common payoff would depend upon the degree of the threat posed by
the hostile nation.
More formally, we assume that voter v receives the following payoff from
policy option p:
Uvp = qp− τ(iv− ip)2 (1)
where qp represents the quality of p, iv represents voter ideology, ip represents
the policy’s position in the ideological spectrum, and τ represents the relative
importance of the ideological dimension. We assume that iL < iR so that increases
in ideology are associated with movements to the right. Defining relative utility
13

as ∆v = UvL−UvR, we have that:
∆v = q+α−β iv (2)
where q = qL− qR represents relative quality, α = τ(i2R− i2L) is a constant, and
β = 2τ(iR− iL) represents the coefficient on voter ideology.
We assume that voters know the ideological positions of the policy options
(iL, iR) but are uncertain over quality. Priors over relative quality (q = qL−qR) are
unbiased and normally distributed with variance σ2q . Voters potentially observe a
news report (ns) from station s. Before observing any news, voter v supports L if
his ideology is below a threshold:
E(∆v) > 0⇔ iv <α
β(3)
After observing a report, voter v supports L if his ideology is below a quality-
adjusted threshold:
E(∆v|ns) > 0⇔ iv <α +E(q|ns)
β(4)
Thus, if voters update favorably with respect to L upon observing report ns, then
E(q|ns) > 0, and the threshold thus shifts to the right. This convinces some voters
who supported R ex-ante to now support L. Similarly, if voters update favorably
with respect to R, then E(q|ns) < 0, and the threshold thus shifts to the left. In
order to understand how voters update their beliefs following news reports, we
next present a framework for news station coverage choices.
Similarly to voters, stations can be characterized by their ideology (is). We
take station ideology as exogenous and assume that it reflects the political prefer-
ences of the owner.13 News stations are assumed to have better information than13For several reasons, we have abstracted from endogenous station ideology. First, in a model
with endogenous ideology, one would have to make assumptions regarding the objectives of thedifferent stations. In our context, with a private media owned by a political leader and the publicmedia controlled by the majority party but financed heavily through advertising revenues, objectives
14

voters about the quality of the policy options and may provide valuable guidance.
In particular, we assume that station s receives an unbiased signal over the relative
quality of the two options:
θs = q+ εs (5)
where εs is the noise in the signal and is assumed to be normally distributed with
mean zero and variance σ2ε . Given this information, stations update over quality
as follows:
E(q|θs) = ωθs (6)
where the weight on the signal is given by ω = σ2q /(σ2
q +σ2ε ).
Following the literature, we assume that news reports are ‘coarse’ in the sense
that news organizations cannot feasibly provide all of their information gathered
during their investigations in a single news report.14 As a simplification of this
idea that news reports are coarse, we assume that news stations provide binary
reports, which are favorable to one of the two policy options. That is, voters
observe a news report from station n favoring either the left policy option (ns = L)
or favoring the right option (ns = R).
Given these assumptions, station s thus provides a report supportive of L if
the signal exceeds a station-specific threshold:
ns = L if θs ≥β is−α
ω(7)
where the threshold is increasing in the ideology of the owner. If the signal does
not exceed this threshold, the station provides a report supportive of R.
may involve a mix of ideological and profit motives and also differ across channels. In addition, ourcontext involves 6 channels, whereas most tractable models with an endogenous supply of slant,such as Mullainathan and Shleifer (2005), focus on the case of monopoly or duopoly. Gentzkow andShapiro (2006) allow for more than two firms but assume that, from the perspective of consumers,newspapers are ex-ante identical.
14See, for example, Suen (2004) and Baron (2006).
15

5.2 Value of an Informative Media
Readers attempt to learn about quality from these news reports but this inference
is potentially complicated by the ideological position of stations. The value of
information from station s thus depends upon the preferences of the voter. For a
left-leaning voter [α−β iv > 0], the value of information (W ) is the possibility of
a report favoring R:
W = Pr(R)E(−∆v|ns = R) (8)
Using the properties of the censored normal distribution, this value can be re-
written as follows:
W = Φ
(β is−α√
ωσq
)(β iv−α)+
√ωσqφ
(β is−α√
ωσq
)(9)
The first term is negative and represents the cost of voting against one’s prior.
The second term is positive and represents the value of information. This second
term is maximized at is = α/β , which can be interpreted as the ideology of an
unbiased station, and is thus declining in the degree of bias. For a right-leaning
voter [α−β iv < 0], the value of information is the possibility of a report favoring
L:
W = Pr(L)E(∆v|ns = L) (10)
=[
1−Φ
(β is−α√
ωσq
)](α−β iv)+
√ωσqφ
(β is−α√
ωσq
)
Combining these two measures into a single expression for the value of news to
consumers, we have that:
W = min(α−β iv,0)+Φ
(β is−α√
ωσq
)(β iv−α)+
√ωσqφ
(β is−α√
ωσq
)(11)
The first and second terms combined are negative for both left-leaning and right-
leaning voters and again represent the cost associated with voting against one’s
16

prior. The final term, by contrast, is positive and represents the value of informa-
tion to the voter. We next use this derived value of an informative media in order
to understand the choice of news stations by viewers of differing ideologies.
5.3 Analysis of Choice of Outlet
As a benchmark, consider the case in which voters with differing ideologies can
directly choose the ideology of the station (i∗s ). Using the fact that φ ′ (z) = −z
φ (z), we can show that the relevant first-order condition is given by:
∂W∂ is
= φ
(β is−α√
ωσq
)(iv− is√
ωσq
)= 0 (12)
Thus, readers prefer a station with ideology equal to their own (i∗s = iv). This
result is similar to Suen (2004), who examined a similar model but with binary
signals and binary payoffs.
As a first step towards generating an empirical specification of the choice of
media outlets, suppose next that voters cannot choose station ideology directly.
Instead, each chooses to watch one station from a limited menu of S + 1 outlets,
which are indexed by s = {0,1,2, ...,S}. In order to make this choice probabilistic,
we next assume that, in addition to the deterministic payoff in equation 11, voter
v receives an idiosyncratic payoff from station s equal to εvs. We can then write
the payoff to voter v from watching station s as follows:
Wvs = θv +θs +λsiv + εvs (13)
where θv = min(α−β iv,0), θs =√
ωσqφ
(β is−α√
ωσq
)−αΦ
(β is−α√
ωσq
), and λs = βΦ
(is−µ√
ασq
).
Thus, the station-specific coefficient on voter ideology (λs) is related to the ide-
ological leanings of the network. Assuming that εvs is distributed type-I extreme
value and normalizing the payoff from station 0 to equal zero, viewership proba-
17

bilities are given by:
Pr(v chooses s) =exp(θs +λsiv)
1+S
∑t=1
exp(θt +λt iv)
(14)
Thus, a multinomial logit model of the choice of station by viewers of differing
ideology allows for identification of the channel-specific parameters (λs), which,
as shown above, are closely related to the ideology of the station owner.
6 Empirical Analysis
In this section, we estimate a model of the individual choice of channel before
and after the 2001 change in government. This model suggests that viewers may
migrate to like-minded outlets following a change in control of the government
from center-left to center-right. Given the findings of the content analysis, we
hypothesize that left-leaning voters may switch from channel P1 to channel P3.
Correspondingly, we hypothesize that right-leaning voters may move from the
private network to channel P1.
6.1 Primary switching measures
To test these hypotheses, we use survey data on political attitudes and electoral
behavior from the Italian National Election Study series (ITANES), which in-
cludes a set of novel questions on individual media and news consumption.15 A
complete description of the questions used is provided in the Appendix. Follow-
ing the national elections on May 13, 2001, the first wave was conducted between
15The Italian National Election Study (ITANES) is a long-term research project on electoralbehavior established in the early nineties by the Istituto Carlo Cattaneo Research Foundation(www.cattaneo.org). Several pre- and post-electoral survey studies have been conducted in thecontext of the ITANES project over the course of the last fourteen years (1994, 1996, 2001, and2006). In many aspects the questions included in the ITANES surveys are analogous to those usedin the surveys of the American National Election Study (ANES).
18
May 18 and June 15 and involved 3209 individuals. 1882 of these (58.6% of the
original sample) were re-interviewed in the second wave, which was conducted
between April and June of 2004. Note that the first wave was conducted right
after the election but that almost all of the interviews were completed before the
change in government, which occurred on June 11, 2001. Thus, the first and sec-
ond waves can be interpreted as periods in which the left and right, respectively,
controlled the main public channel P1.
Before turning to the econometric results, we first present trends in viewer-
ship between 2001 and 2004 for viewers of differing ideologies. As shown in
Figure 4, there was no reduction among left-leaning viewers, defined as those
with self-reported political ideology equal to 1 or 2 on a 5-point scale in 2001,
in the propensity to view news on channel B1, which remained low in both peri-
ods. There is a noticeable increase, however, in viewership of channel P3, which
was controlled by the center-left coalition both before and after the elections.
This increase was associated primarily with a reduction in viewership of channel
P1. This switch from P1 to P3 is striking given that these two news programs
are broadcast at different times, and these viewers must thus alter their viewing
schedule in order to accommodate this change.16 Among centrists, defined as
those with political ideology equal to 3 on a 5-point scale, there was a small in-
crease in viewership of channel P3 news. The more prevalent factor, however, is
a significant shift in viewership away from channel B1, the most popular chan-
nel of the private network, to channel P1, the most popular channel of the public
network. As shown in the bottom panel, the shift from channel B1 to channel P1
is even stronger among right-wing voters, defined as those with a self-reported
political ideology equal to 4 or 5 on a 5-point scale. Taken together, these results
suggest that right-leaning viewers responded to the shift in control and content
of channel P1 to the right by increasing their consumption of this channel, while
left-leaning viewers responded by increasing their propensity to consume news
16The following are the broadcasting time for the main news programs on the six national chan-nels. P1 (TG1): 1:30 pm and 8 pm; P2 (TG2) 1:30 pm and 8:30 pm; P3 (TG3) 2:20 pm and 7 pm;B1 (TG5) 1 pm and 8 pm; B2 (Studio Aperto) 12.25 pm and 6:30 pm; B3 (TG4) 1:30 pm and 6:55pm.
19

from the left-leaning channel P3.
We investigate these patterns more completely by estimating an econometric
model of viewer choice of news channel. We start with a simple analysis of
the choice between public and private channels in which public is the omitted
category. As shown in the first column of Table 4, as voter ideology moves to
the right, viewers are more likely to watch private channels, relative to public
channels, prior to Berlusconi coming to power. More interestingly, however, is
the coefficient on the interaction between voter ideology and 2004, during which
Berlusconi controls the public network. As shown, right-wing viewers, relative
to left-wing viewers, are more likely to watch public channels, relative to private
channels, after Berlusconi assumes power.
We next extend the analysis to investigate potential heterogeneity within the
public and private networks. In particular, the final five columns of Table 4
presents results from a multinomial logit choice model in which channel P1,
which has the largest viewership of the public channels in both periods and whose
control shifted from the center-left to the center-right, is the omitted category.
Thus, these results can be interpreted as relative to P1. As shown, right-wing vot-
ers were much more likely to watch any of the private channels relative to channel
P1 prior to Berlusconi taking control of the public channels. Within the public
channels, left-wing voters were more likely to watch P3 than P1 even prior to
Berlusconi taking control. Most interestingly, however, is the interaction between
viewer ideology and Berlusconi controlling the public channels. As shown, the
ideological gap between B1 and P1 shrinks, but remains positive, after Berlusconi
takes control of P1. The ideological gap between P1 and P3, however, increases
as P1 becomes less of a substitute for P3 among left-leaning viewers. Taken to-
gether, these results are consistent with the content analysis, which demonstrated
that channel P1 was a less-extreme version of P3 when under center-left control
but was a less-extreme version of the Mediaset channels when under center-right
control.
20

6.2 Offset measures
Taken together, the above results provide significant evidence that viewers re-
sponded to the changes in content by shifting to channels with ideological con-
tent similar to their own ideology. Importantly, however, both the content analysis
and this revealed preference analysis suggest that the ideology of channel P1, the
public channel controlled by the center-right in 2004, remained to the left of the
private channels even after the change in control. These results, combined with
the shifting of right-wing viewers to channel P1 and the shifting of left-wing view-
ers to P3, suggests that the ideological exposure of some viewers actually moved
to the left following the shift in public control and content to the right. This be-
havioral response and the associated unanticipated effect of exposure moving to
the left may offset, partially or even fully, the direct effect of moving ideological
content to the right following the change in partisan control of the public media.
To explore this issue more formally, we define expected ideological consump-
tion for voter v at time t as follows:
E(Cv,t) =S
∑s=0
Pr(v chooses s at time t)×Pr(s reports R at time t) (15)
Thus, holding viewership probabilities fixed, increases in right-leaning content
are associated with increases in expected ideological consumption. In order to
motivate our offset measure, we next define the actual change in ideological
consumption (δ ) and the change in ideological consumption had viewers not
switched (δno switch) as follows:
δ = E(Cv,2004)−E(Cv,2001) (16)
δno switch = E(Cno switchv,2004 )−E(Cv,2001) (17)
where E(Cno switchv,2004 ) uses 2004 station ideology but 2001 choice probabilities. That
21

is,
E(Cno switchv,2004 )=
S
∑s=0
Pr(v chooses s at time t = 2001)×Pr(s reports R at time t = 2004)
(18)
Finally, percent offset, which is defined by the fraction of the potential change in
ideological consumption that is offset by consumer behavioral responses, is given
as follows:
Ov =δno switch−δ
δno switch(19)
To interpret this percent offset measure, consider two extreme cases. First, if
there is no behavioral response to changes in station ideology, then E(Cv,2004) =
E(Cno switchv,2004 ) and therefore δno switch = δ . Thus, in this case with no behavioral re-
sponse we have that Ov = 0. On the other hand, if the behavioral response is com-
plete in the sense that ideological exposure does not change, then E(Cv,2004) =
E(Cv,2001) and therefore δ = 0. Thus, in this case we have that Ov = 1.
In terms of measuring E(Cv,t), we use 2001 and 2004 predicted probabilities
from the multinomial logit in order to estimate viewership probabilities for each
channel for voters of differing ideologies. Also, using the fact that Pr(s reports
R) = Φ
(is−µ√
ασq
)= λs/β in the theoretical model above, we can estimate reporting
probabilities up to a scale by the channel-specific coefficients from the multino-
mial logit.17
Figure 5 provides the results from this analysis separately by viewer ideology.
As shown, the offset is sizable for left-wing viewers, reflecting the shift from P1
to P3 for many of these viewers. While significant, the offset is incomplete since
many left-wing viewers continued to watch P1 in 2004 and were hence exposed to
a more right-leaning coverage. The percent offset, by contrast, is small for center-
left voters. This reflects the fact that fewer of these viewers shifted from P1 to P3.
Comparing center-left to center, however, the percent offset increases, reflecting
the fact that more of these viewers were watching B1 prior to Berlusconi taking
17This scaling parameter β disappears when computing our percentage offset measures given byOv.
22

power and switched to P1 in 2004, when Berlusconi was in power. For center-
right and right-wing voters, the effects associated with the shift from B1 to P1
are very significant. For the extreme right, this shift almost completely offset
the change in content on channel P1. In addition to the shifting from B1 to P1,
this large offset also reflects the fact that relatively few of these viewers were
watching P1 prior to Berlusconi coming to power and thus the direct effect of
moving content to the right was relatively small.
6.3 Additional evidence on switching
We next provide five additional pieces of evidence on patterns of news consump-
tion and their relation to political ideology. The first analysis uses information
from additional survey questions regarding how often viewers watch each of the
six channels. For each channel, possible responses include never or almost never,
rarely, fairly often, and very often. We did not focus on this measure in our base-
line analysis since the question is not focused on news programming specifically
and thus incorporates both news and non-news consumption. Under the assump-
tion that non-news consumption is unaffected by changes in the political majority,
however, we would expect to see patterns using these measures that are similar to
those in our baseline analysis of favorite news program. As shown in Table 5, the
results from an ordered Probit model demonstrate that movements to the right in
viewer ideology are associated with a statistically significant increase in viewer-
ship of P1 when Berlusconi was in power in 2004, relative to 2001. For the other
channels, by contrast, we find no statistically significant differences in consump-
tion between 2001 and 2004 for viewers of differing political ideologies. Taken
together, these results using overall consumption of channels is consistent with
the baseline analysis of favorite news program, which demonstrated that right-
leaning viewers substituted towards P1 and left-leaning viewers substituted away
from P1 following the shift in majority from the left to the right.
Second, we investigate measures of second choices in news programming.
While our baseline analysis focused on favorites, or first choices, the survey also
23

included responses on second choices for 2,660 out of the 2,756 observations. Us-
ing both pieces of information, we consider first and second choices as a bundle
of information consumed by viewers and conduct of multinomial logit analysis of
the choice of this bundle. Since some combinations of first and second choices,
especially those involving the smaller Mediaset channels B2 and B3, were quite
rare, we combine the three Mediaset channels into one (B) for the purposes of
this analysis. For consistency with our baseline analysis, we choose P1 as the first
choice in the omitted category. For the second choice, we choose private channels
(B) since this was the most popular among the possible second choices to P1. As
shown in Table 6, relative to this (P1, B) bundle, we find that right-leaning view-
ers were less likely to consume the bundles (B, P1) and (B, P2) when Berlusconi
was in power in 2004. Thus, while many right-leaning viewers reduced their con-
sumption of Mediaset channels as a first choice after Berlusconi came to power,
many of these switched to Mediaset in terms of their second choice. We also find
that right-leaning viewers were more likely to consume the bundle (P1, B) than to
watch two Mediaset channels (B, B) in 2004. Finally, the negative coefficient on
the key measure 2004*Political Ideology for the bundle (P3, B) is consistent with
left-leaning viewers switching to this bundle, relative to the bundle (P1, B), after
Berlusconi came to power. These viewers may prefer to have access to a variety
of views across the political spectrum and to also have a mix of both public and
private news.
Third, we analyze questions in the survey regarding media credibility and
trust in the media. In particular, we investigate the relationship between political
ideology in 2001 and trust in public and private television in both 2001 and 2004.
As shown in the top panel of Figure 6, trust in public television is higher prior
to Berlusconi coming to power than in 2004 among left-of-center voters. For
centrist viewers, trust is public television is similar under both governments. For
right-of-center voters, by contrast, trust in public television is higher when Berlus-
coni is in power in 2004. These patterns are consistent with the content analysis,
which documented a shift to the right in public news content under Berlusconi,
and with the analysis of favorite news program, which documented an increase
24

in public viewership among right-leaning viewers following the change in gov-
ernment. As shown in the bottom panel, overall trust in Berlusconi’s channels
fell after Berlusconi took power. The relationship between ideology and trust in
Berlusconi’s channels, however, was relatively stable during these two periods,
with trust increasing as ideology moves to the right. If anything, the documented
decline in trust was strongest among right-leaning voters.
To test for the statistical significance of these results, Table 7 provides results
from a regression of trust on political ideology in which the coefficient is allowed
to vary between 2001 and 2004. As shown in the first column, trust in the public
channels is decreasing in ideology prior to Berlusconi coming to power but this
effect disappears in 2004, a period in which there was little or no relationship be-
tween trust in the media and political ideology. As shown in the second column,
the interaction between political ideology and trust in the private channels is pos-
itive under both center-left and center-right governments. Finally, the third col-
umn demonstrates that trust in public, relative to private, increased significantly
for right-leaning viewers, relative to left-leaning viewers. Taken together, these
results on trust help to explain why viewers of differing ideology switched their
choice of favorite channel after Berlusconi won the election and hence provide
evidence on a potential mechanism underlying the baseline results.
Fourth, we use data on aggregate viewership. These are available from AU-
DITEL, the research company responsible for television audience measurement
in Italy, on a monthly basis between 2001 and 2007 and report the average daily
number of viewers for each national news program.18 For the purposes of our
analysis, we compute the news market shares by dividing the average number
of viewers of each news program in a given month by the average number of
viewers across all news programs in that month.19 Our baseline analysis of fa-
18Esteves-Sorenson (2009)uses micro-level AUDITEL data to document significant inertia intelevision viewing in Italy.
19The original data also included market shares but calculated over the total number of TV view-ers (of both news and non-news programs). These do not correspond to shares of news viewerssince news programs are broadcast at different times. Since changes in the non-news offerings onother stations may affect these shares, we create our own shares based upon the total number ofviewers of news programs.
25

vorite news program suggests that viewership of the left-leaning public channel
(P3) should increase when Berlusconi is in power and that viewership of Medi-
aset channels should decrease. We have no clear prediction with respect to the
main public channel (P1) since left-leaning viewers are less likely to watch and
right-leaning viewers are more likely to watch when Berlusconi is in power. As
shown in Table 8, we do find support for the first prediction as viewership of P3
increases in a statistically significant manner when Berlusconi is in power. We
do not find support, however, for the second prediction since viewership of the
Mediaset channels B1-B3 does not decrease when Berlusconi is in power. There
are several possible interpretations for this discrepancy between these results and
our baseline analysis of favorite news program. First, as documented in Table 6,
many right-leaning viewers may have continued to watch Mediaset as a second
choice when Berlusconi was in power in 2004 even though they switched to P1
in terms of a favorite, or first choice. In this case, overall viewership of Berlus-
coni’s channel may not decline. Second, it could be that there were other changes
when Berlusconi was in power. Given the use of individual-level panel data, our
baseline analysis of first choices allows us to hold everything other than station
ideology, such as viewer ideology, constant. This test based upon aggregate data,
by contrast, is valid only if nothing other than station ideology changed during
this period. If viewers tended to become more conservative, for example, when
Berlusconi was in power, this could explain why we do not detect a decrease in
Mediaset viewership in the aggregate data.
Finally, we investigate a variety of issues involving readership of newspapers,
a key alternative source of information for voters. The first issue relates to sub-
stitution between television and newspapers. In particular, if these media sources
are substitutes, then left-leaning voters may be more likely to access the news-
paper for information after the movement of the main public channel (P1) to the
right. To investigate this hypothesis, we use responses to a binary survey question
on whether or not individuals report that they usually read the newspaper. As
shown in Table 9, we find no evidence of such substitution as the coefficient on
the interaction between 2001 ideology and the year 2004 dummy, which indicates
26

the Berlusconi-led government, is statistically insignificant. We also investigate
readership of La Repubblica, a key critic of Berlusconi, based upon whether re-
spondents list this paper as their favorite among newspapers. Again, if television
and newspapers are substitutes, then we would expect readership of La Repub-
blica to increase among left-leaning individuals when the main public channel
(P1) is controlled by the right. While we do find that left-leaning voters are more
likely to read this paper in general, we find no evidence of any change in this
relationship between these two time periods. Finally, we examine a more com-
prehensive set of newspapers, which we code according to the ideology of their
political leanings (left, center-left, center, center-right, and right).20 As shown, we
again find a strong correlation between newspaper ideology and reader ideology
but, unlike our analyses of television consumption, no change in this relation-
ship between these two time periods. Taken together, this analysis of newspaper
consumption provides no evidence of substitution between the newspaper and
television markets.
7 Conclusion
This paper investigates partisan control of the media in the context of Berlusconi’s
Italy. We find that a shift in control of the public media from the center-left coali-
tion to the center-right coalition led to a shift in ideological content, as expressed
in speaking time devoted to politicians from different parties, from the left to
the right. We also find that viewers responded to these changes. Most impor-
tantly, many viewers changed their choice of favorite news program in response.
20To define the political leaning of a newspaper we looked at whether: a) it is or has beenformally affiliated with one political party; or, b) it is controlled by Berlusconi or by his familymembers. For those newspapers not affiliated with a party or controlled by Berlusconi, we baseour categorization on how critically (or favorably) they have covered the Berlusconi governmentover the years. Based on these criteria, we coded the newspapers as follows: Liberazione (left);Il Manifesto (left), L’Unità (left), La Repubblica (center-left), Il Corriere della Sera (center), LaStampa (center), Il Messaggero (center), Il Sole 24 Ore (center), La Padania (center-right), Libero(center-right), Il Foglio (center-right), Il Secolo d’Italia (right). As a further check, we replicatedour analysis coding the newspapers in three ideological categories (left, center, right); when doingso we obtain very similar results.
27

Right-wing viewers switched to public television, which moved to the right de-
spite remaining to the left of private television in terms of ideological content.
Some left-wing viewers, by contrast, abandoned the majority-controlled channel
P1 and switched to the left-leaning channel P3. This switching partially offset
the change in ideology of the public stations, and the ideological consumption of
news thus did not move as far to the right as it would have in the absence of these
viewer responses. Taken together, these results demonstrate that partisan control
of the media does lead to biased coverage but that viewers are sufficiently sophis-
ticated that they respond to these changes and thereby offset, at least in part, the
direct effect of the manipulation of the news by the majority party. Furthermore,
since viewers’ capacity to respond to media bias is limited by the number of in-
dependent outlets in the market, our results suggest another way through which
increased competition in the media industry can enhance welfare and make media
capture less effective.
Given our focus on the Italian media, a key question involves the generaliz-
ability of our results. Our finding that consumers switch to like-minded outlets in
the face of changes in control of the media will only apply to situations in which
consumers have access to a variety of outlets. In U.S. newspaper markets, for
example, consumers often have no alternatives to the local monopoly newspaper.
With the advent of the internet, however, consumers have access to much greater
choice of media outlets across the ideological spectrum. A related issue involves
the structure of Italian television, in which public television is controlled by the
majority party and private television is controlled by the leader of the center-right
coalition. While seemingly unique, this situation is in fact quite common across
countries, with the rule, rather than the exception, being government control and
private ownership by families closely linked to politics (Djankov et al., 2003).
Thus, while our empirical results are derived specifically from Italian data, the
lessons to be learned from these findings are more general.
28

Appendix
ITANES 2001-04 Panel Survey – Relevant Questions
Political Self-Identification
Question: In political matters people talk of “the left” and “the right”. In thiscard there is a row of cells going from the left to the right. Thinking about yourpolitical opinions, where would you place yourself?
APPENDIX ITANES 2001-04 Panel Survey – Relevant Questions Politica Self-Identification Question: In political matters people talk of “the left” and “the right”. In this card there is a row of cells going from the left to the right. Thinking about your political opinions, where would you place yourself?
Left Right A B C D E F G H I L
Does not want to place him/herself Don’t know No answer Favorite TV Channel Q. : I am going to mention some television channels. Can you please tell me how often you usually watch each of them?
Channel Often Rather often Rarely
Never or almost never
No answer
1 Rai 1 1 2 3 4 -1 2 Rai 2 1 2 3 4 -1 3 Rai 3 1 2 3 4 -1 4 Canale 5 1 2 3 4 -1 5 Italia 1 1 2 3 4 -1 6 Rete 4 1 2 3 4 -1
7
Smaller channels or
local TV stations
1 2 3 4 -1
20
Does not want to place him/herselfDon’t knowNo answer
Favorite TV Channel
Q.: I am going to mention some television channels. Can you please tell me howoften you usually watch each of them?
APPENDIX ITANES 2001-04 Panel Survey – Relevant Questions Politica Self-Identification Question: In political matters people talk of “the left” and “the right”. In this card there is a row of cells going from the left to the right. Thinking about your political opinions, where would you place yourself?
Left Right A B C D E F G H I L
Does not want to place him/herself Don’t know No answer Favorite TV Channel Q. : I am going to mention some television channels. Can you please tell me how often you usually watch each of them?
Channel Often Rather often Rarely
Never or almost never
No answer
1 Rai 1 1 2 3 4 -1 2 Rai 2 1 2 3 4 -1 3 Rai 3 1 2 3 4 -1 4 Canale 5 1 2 3 4 -1 5 Italia 1 1 2 3 4 -1 6 Rete 4 1 2 3 4 -1
7
Smaller channels or
local TV stations
1 2 3 4 -1
20
29

News Consumption on TV
Q.: Do you usually watch news programs? If so, how often?
No, neverLess than once a week1 day a week2 days a week3 days a week4 days a week5 days a week6 days a weekEvery dayNo answer
Favorite TV News Program (first and second)
Q.: Which news program do you usually watch most? And next?
Tg1 (RAI1)Tg2 (RAI2)Tg3 (RAI3)Tg4 (Rete 4)Tg5 (Canale 5)Studio Aperto (Italia 1)TMC NewsLocal news programOther news program
30

Trust
Q.: Please tell me how much you trust each of the following institutions (i.e. verymuch, some what, little, not at all)
Trust Q.: Please tell me how much you trust each of the following institutions (i.e. very much, some what, little, not at all)
Very much Somewhat A little Not at all Don’t
know No
answer1 Parliament 1 2 3 4 9 -1 2 Political Parties 1 2 3 4 9 -1 3 President of the Republic 1 2 3 4 9 -1 4 Catholic Church 1 2 3 4 9 -1 5 Armed Forces 1 2 3 4 9 -1 6 Judiciary 1 2 3 4 9 -1 7 Press 1 2 3 4 9 -1 8 RAI-TV 1 2 3 4 9 -1
9 Mediaset TV Stations (Canale5, Rete4, Italia1) 1 2 3 4 9 -1
10 Trade Unions 1 2 3 4 9 -1 11 Police 1 2 3 4 9 -1 12 Public Administration 1 2 3 4 9 -1
13 Confindustria (Business’ union) 1 2 3 4 9 -1
14 European Union 1 2 3 4 9 -1 Newspaper Consumption Q. : Do you usually read newspapers (except of sport papers)? If so, how often? No, never Less than once a week 1 day a week 2 days a week 3 days a week 4 days a week 5 days a week 6 days a week Every day No answer Favorite Newspaper Q. : Which newspapers do you usually read? (If more than one, indicate only the most read)
22
Newspaper Consumption
Q. : Do you usually read newspapers (except of sport papers)? If so, how often?
No, neverLess than once a week1 day a week2 days a week3 days a week4 days a week5 days a week6 days a weekEvery dayNo answer
Favorite Newspaper
Q. : Which newspapers do you usually read? (If more than one, indicate only themost read)
31
References
Baron, David P., “Persistent media bias,” Journal of Public Economics, 2006, 90(1-2), 1–36.
Besley, Tim and Andrea Prat, “Handcuffs for the grabbing hand? Media captureand government accountability,” American Economic Review, 2006, 96 (3),720–736.
CENSIS, Centro Studi Investimenti Sociali, “Le diete mediatiche degli italianinello scenario europeo,” Sesto Rapporto Censis-Ucsi sulla comunicazione inItalia, October 2008.
DellaVigna, Stefano and Ethan Kaplan, “The Fox News Effect: Media Biasand Voting,” The Quarterly Journal of Economics, 2007, 122 (3), 1187–1234.
Diamanti, Ilvo, Fabio Bordignon, and Luigi Ceccarini, “Gli italiani el’informazione,” XVI Osservatorio sul Capitale Sociale degli Italiani, Novem-ber 2007.
Djankov, Simeon, Caralee McLeish, Tatiana Nenova, and Andrei Shleifer,“Who Owns the Media?,” The Journal of Law and Economics, 2003, 46 (2),341–382.
Durante, Ruben and Brian G. Knight, “Partisan control, media bias, and viewerresponses: Evidence from Berlusconi’s Italy,” NBER Working Paper 14762,March 2009.
Esteves-Sorenson, Constanca, “Micro-costs: Inertia in Television Viewing,”Working Paper, Yale University 2009.
Gentzkow, Matthew and Jesse M. Shapiro, “Media bias and reputation,” Jour-nal of Political Economy, 2006, 114 (2), 280–316.
Gentzkow, Matthew. and Jesse M. Shapiro, “What Drives Media Slant? Evi-dence from U.S. Daily Newspapers,” Econometrica, 2010, 78 (1), 35–71.
Gentzkow, Matthew, Edward. L. Glaeser, and Claudia Goldin, “The Rise ofthe Fourth Estate: How Newspapers Became Informative and Why it Mat-tered,” in Goldin Claudia Glaeser, Edward. L., ed., In Corruption and Reform:Lessons from America’s Economic History, Eds. NBER, 2006.
George, Lisa and Joel Waldfogel, “The" New York Times" and the Market forLocal Newspapers,” American Economic Review, 2006, pp. 435–447.
32

Gerber, Alan S., Dean Karlan, and Daniel Bergan, “Does the media matter?A field experiment measuring the effect of newspapers on voting behavior andpolitical opinions,” American Economic Journal: Applied Economics, 2009, 1(2), 35–52.
Glasser, Theodore L., David S. Allen, and Elizabeth S. Blanks, “The influenceof chain ownership on news play: A case study,” Journalism Quarterly, 1989,66 (3), 607–614.
Groseclose, Tim and Jeffrey Milyo, “A Measure of Media Bias,” The QuarterlyJournal of Economics, 2005, 120 (4), 1191–1237.
ISTAT, Istituto Nazionale di Statistica, “L’uso dei media e del cellulare inItalia,” Informazioni, 2, 2008.
Mullainathan, Sendhil and Andrei Shleifer, “The market for news,” AmericanEconomic Review, 2005, 95 (4), 1031–1053.
Prat, Andrea and David Strömberg, “Commercial Television and Voter Infor-mation,” CEPR Discussion Paper 4989, April 2005.
Pritchard, David, “Viewpoint diversity in cross-owned newspapers and televi-sion stations: A study of news coverage of the 2000 presidential campaign,”FCC Media Ownership Working Group Working Paper, 2002.
Puglisi, Riccardo and James M. Jr. Snyder, “Media Coverage of Political Scan-dals,” NBER Working Paper 14598, December 2008.
Reuter, Jonathan and Eric Zitzewitz, “Do ads influence editors? Advertisingand bias in the financial media,” Quarterly Journal of Economics, 2006, 121(1), 197–227.
Snyder, James M. Jr. and David Strömberg, “Press Coverage and PoliticalAccountability,” NBER Working Paper 13878, March 2008.
Suen, Wing, “The self-perpetuation of biased beliefs,” Economic Journal, 2004,114 (495), 377–396.
33
Figure 1: MAJORITY VS. OPPOSITION SHARE OF TOTAL SPEAKING TIME BY GROUP
34

Figure 2: MAJORITY VS. OPPOSITION SHARE OF TOTAL ST BY CHANNEL (MEDIASET)
35

Figure 3: MAJORITY VS. OPPOSITION SHARE OF TOTAL ST BY CHANNEL (RAI)
36

Figure 4: FAVORITE NEWS CHANNEL BY POLITICAL ID (2001-2004)46.1
46.1
46.114.8
14.8
14.815.3
15.3
15.31.6
1.6
1.620.3
20.3
20.31.8
1.8
1.80%
0%
0%10%
10%
10%20%
20%
20%30%
30%
30%40%
40%
40%50%
50%
50%P1
P1
P1P2
P2
P2P3
P3
P3B3
B3
B3B1
B1
B1B2
B2
B22001
2001
200141.8
41.8
41.813.2
13.2
13.221.9
21.9
21.91.1
1.1
1.120.1
20.1
20.11.8
1.8
1.80%
0%
0%10%
10%
10%20%
20%
20%30%
30%
30%40%
40%
40%50%
50%
50%P1
P1
P1P2
P2
P2P3
P3
P3B3
B3
B3B1
B1
B1B2
B2
B22004
2004
2004Left-Wing Voters Favorite News Channels 2001 vs. 2004Left-Wing Voters Favorite News Channels 2001 vs. 2004
Left-Wing Voters Favorite News Channels 2001 vs. 2004
37.2
37.2
37.28.4
8.4
8.47.9
7.9
7.93.0
3.0
3.042.4
42.4
42.41.2
1.2
1.20%
0%
0%10%
10%
10%20%
20%
20%30%
30%
30%40%
40%
40%P1
P1
P1P2
P2
P2P3
P3
P3B3
B3
B3B1
B1
B1B2
B2
B22001
2001
200142.4
42.4
42.46.4
6.4
6.49.4
9.4
9.43.9
3.9
3.935.5
35.5
35.52.5
2.5
2.50%
0%
0%10%
10%
10%20%
20%
20%30%
30%
30%40%
40%
40%P1
P1
P1P2
P2
P2P3
P3
P3B3
B3
B3B1
B1
B1B2
B2
B22004
2004
2004Center Voters Favorite News Channels - 2001 vs. 2004Center Voters Favorite News Channels - 2001 vs. 2004
Center Voters Favorite News Channels - 2001 vs. 2004
24.7
24.7
24.76.4
6.4
6.43.5
3.5
3.53.1
3.1
3.159.2
59.2
59.23.1
3.1
3.10%
0%
0%10%
10%
10%20%
20%
20%30%
30%
30%40%
40%
40%50%
50%
50%60%
60%
60%P1
P1
P1P2
P2
P2P3
P3
P3B3
B3
B3B1
B1
B1B2
B2
B22001
2001
200134.2
34.2
34.26.9
6.9
6.94.2
4.2
4.23.8
3.8
3.847.3
47.3
47.33.5
3.5
3.50%
0%
0%10%
10%
10%20%
20%
20%30%
30%
30%40%
40%
40%50%
50%
50%60%
60%
60%P1
P1
P1P2
P2
P2P3
P3
P3B3
B3
B3B1
B1
B1B2
B2
B22004
2004
2004Right-Wing Voters Favorite News Channels 2001 vs. 2004Right-Wing Voters Favorite News Channels 2001 vs. 2004
Right-Wing Voters Favorite News Channels 2001 vs. 2004
Note: The 2001 data refer to interviews conducted between May 18th and June 15th 2001, right
after the May 13th national elections, and mostly before the Berlusconi’s government assumed
power. The 2004 interviews were conducted between April 3rd and June 30th 2004, several years
into the Berlusconi’s government term.
37

Figure 5: PERCENTAGE OFFSET BY POLITICAL IDEOLOGY
0%
0%
0%20%
20%
20%40%
40%
40%60%
60%
60%80%
80%
80%100%
100%
100%Percent Offset
Perc
ent O
ffse
t
Percent OffsetLeft
Left
LeftCenter-Left
Center-Left
Center-LeftCenter
Center
CenterCenter-Right
Center-Right
Center-RightRight
Right
Right
38

Figure 6: TRUST IN PUBLIC AND BERLUSCONI’S CHANNELS BY POLITICAL ID (2001-2004)2
2
22.2
2.2
2.22.4
2.4
2.42.6
2.6
2.6Left
Left
LeftCenter-Left
Center-Left
Center-LeftCenter
Center
CenterCenter-Right
Center-Right
Center-RightRight
Right
Right2001
2001
20012004
2004
2004Trust in Public ChannelsTrust in Public Channels
Trust in Public Channels
2
2
22.2
2.2
2.22.4
2.4
2.42.6
2.6
2.62.8
2.8
2.8Left
Left
LeftCenter-Left
Center-Left
Center-LeftCenter
Center
CenterCenter-Right
Center-Right
Center-RightRight
Right
Right2001
2001
20012004
2004
2004Trust in Berlusconi's ChannelsTrust in Berlusconi's Channels
Trust in Berlusconi's Channels
39

Table 1: PUBLIC TV - NEWS DIRECTORS (2000-2007)
June 2000 G. Lerner (Center-Left)October 2000 A. Longhi (Center-Left)
2001 ElectionsApril 2002 C.Mimum (Center-Right)*
2006 ElectionsSeptember 2006 G. Riotta (Center)
1994-2002 C.Mimum (Center-Right)*April 2002 M. Mazza (Center-Right)
1998-2000 E. Chiodi (Center-Left)June 2000 A. Rizzo Nervo (Center-Left)July 2001 A. Di Bella (Center-Left)
P3 (Channel 3)
* From 1991 to 1994 and after July 2007 served respectively as deputy director and director of Berlusconi's Channel 5 News.
P1 (Channel 1)
P2 (Channel 2)
40

Table 2: DISTRIBUTION OF TOTAL SPEAKING TIME BY GROUP AND CHANNEL
(1) (2) (3) (4)
0.281*** 0.339***[0.030] [0.026]
0.471*** 0.187***[0.029] [0.035]
0.345*** -0.030[0.030] [0.043]
0.658***[0.029]0.000
[0.030]0.603*** 0.065**[0.025] [0.031]
0.143*** -0.024[0.025] [0.037]
0.492*** 0.176***[0.025] [0.031]
0.344*** -0.046[0.025] [0.037]
0.313*** 0.355***[0.025] [0.031]
0.550*** -0.198***[0.025] [0.037]
0.669***[0.025]0.037
[0.025]0.603*** 0.066**[0.025] [0.031]
0.127*** -0.042[0.025] [0.037]
0.707*** -0.038[0.025] [0.031]
-0.164*** -0.125***[0.025] [0.037]
0.356*** 0.350***[0.029] [0.026]
Observations 438 438 438 438
Dependent variable: Share of Total Monthly Speaking Time
Majority Right
Berlusconi_Gov
Berlusconi's Channels
P2
Berlusconi_Gov * B.'s Channels
Public Channels
Berlusconi_Gov * P. Channels
B1
Berlusconi_Gov * B1
B2
Berlusconi_Gov * P2
P3
Berlusconi_Gov * P3
Constant
Calendar month fixed effects included in all regressions. Public Channels is the base outcome in Column 3; P1 (Channel 1) is the base outcome in column 4.GLS estimates assuming autocorrelation (AR1) within channel*time period (before, during and after Berlusconi's government) group. Standard errors inbrackets; *** p<0.01, ** p<0.05, * p<0.1.
Berlusconi_Gov * B2
B3
Berlusconi_Gov * B3
P1
Berlusconi_Gov * P1
41

Table 3: DISTRIBUTION OF MAJORITY SPEAKING TIME ACROSS DIFFERENT MEMBERS OF THE RULING COALITION
(1) (2) (3) (4) (5)
0.490*** 0.112*** 0.389*** 0.484*** 0.036***[0.051] [0.037] [0.041] [0.054] [0.010]0.094* 0.108*** -0.006 -0.096 -0.008[0.056] [0.036] [0.042] [0.060] [0.010]
0.462*** 0.165*** 0.313*** 0.499*** 0.050***[0.051] [0.037] [0.041] [0.054] [0.010]0.104* 0.169*** -0.063 -0.066 -0.049***[0.056] [0.036] [0.042] [0.060] [0.010]
0.145*** 0.008 0.167*** 0.853*** 0.005[0.051] [0.037] [0.041] [0.054] [0.010]
0.498*** 0.400*** 0.084** -0.487*** -0.014[0.056] [0.036] [0.042] [0.060] [0.010]
0.432*** 0.135*** 0.319*** 0.530*** 0.047***[0.051] [0.037] [0.041] [0.054] [0.010]0.070 -0.025 0.089** -0.105* 0.027***
[0.056] [0.036] [0.042] [0.060] [0.010]0.359*** 0.125*** 0.264*** 0.614*** 0.036***[0.051] [0.037] [0.041] [0.054] [0.010]0.127** -0.027 0.137*** -0.156*** 0.022**[0.056] [0.036] [0.042] [0.060] [0.010]
0.408*** 0.124*** 0.322*** 0.557*** 0.046***[0.051] [0.037] [0.041] [0.054] [0.010]0.030 -0.022 0.028 -0.060 0.020**
[0.056] [0.036] [0.042] [0.060] [0.010]Observations 438 414 414 438 426
Dependent Variable: Share of Majority Speaking Time
Government Prime Minister Others in Government
Majority Parties MPs
Speakers
B1
Berlusconi_Gov * B1
B2
Berlusconi_Gov * B2
B3
Berlusconi_Gov * B3
Calendar month fixed effects included in all regressions. Public Channels is the base outcome in Column 3; P1 (Channel 1) is the base outcome in column 4. GLSestimates assuming autocorrelation (AR1) within channel*time period (before, during and after Berlusconi's government) group. Standard errors in brackets; ***p<0.01, ** p<0.05, * p<0.1.
P1
Berlusconi_Gov * P1
P2
Berlusconi_Gov * P2
P3
Berlusconi_Gov * P3
Table 4: FAVORITE NEWS CHANNEL BY POLITICAL IDEOLOGY (2001 VS. 2004)
(1) (2) (3) (4) (5) (6)
0.708*** 0.641*** 0.529** 0.537*** -0.100 -0.347***
[0.059] [0.064] [0.207] [0.184] [0.098] [0.105]
-0.173*** -0.223*** -0.135 -0.070 -0.060 -0.223*
[0.061] [0.071] [0.231] [0.201] [0.116] [0.123]
Observations 2756 2756 2756 2756 2756 2756
Multinomial logit regressions. Column 1 base outcome: Public channels. Other coulmns base outcome: P1 (Channel 1). The following controls and their respective interactionwith the 2004 dummy are included: gender, education, age, occupational status, social class, church attendance, index of political knowledge, TV exposure, regional fixed effects.Robust standard errors clustered by individuals in brackets. *** p<0.01, ** p<0.05, * p<0.1.
Dependent Variable: Favorite News Channel
Private Channels B1 B2 B3 P2 P3
Political Ideology (right leaning)
2004*Political Ideology
42

Table 5: CHANNEL CONSUMPTION BY POLITICAL IDEOLOGY (2001 VS. 2004)
(1) (2) (3) (4) (5) (6)
0.323*** 0.208*** 0.266*** -0.195*** -0.203*** -0.272***
[0.027] [0.026] [0.026] [0.027] [0.026] [0.026]
-0.026 0.035 0.010 0.096*** 0.053 0.006
[0.030] [0.030] [0.030] [0.032] [0.033] [0.030]
Observations 2750 2755 2751 2748 2751 2753
P1 P2 P3
Political Ideology (right leaning)
2004*Political Ideology
Ordered probit regressions based upon reported frequency of watching each Channel (never of almost never, rarely, fairly often, or very often). The followingcontrols and their respective interaction with the 2004 dummy are included: gender, education, age, occupational status, social class, church attendance,index of political knowledge, TV exposure, regional fixed effects. Robust standard errors clustered by individuals in brackets. *** p<0.01, ** p<0.05, * p<0.1.
Dependent Variable: Frequency of Watching each Channel
B1 B2 B3
Table 6: FAVORITE BUNDLE OF NEWS CHANNELS BY POLITICAL IDEOLOGY (2001 VS. 2004)
P1, P2 P1, P3 P2, P1 P2, P3 P2, B P3, P1 P3, P2 P3, B B, P1 B, P2 B, P3 B, B
(1) (2) (3) (4) (5) (6) (7) (8) (9) (10) (11) (12)
-0.318*** -0.680*** -0.603*** -0.892*** -0.001 -0.840*** -0.980*** -0.082 0.379*** 0.291*** 0.147 0.545***
[0.102] [0.134] [0.158] [0.234] [0.148] [0.151] [0.219] [0.203] [0.087] [0.101] [0.142] [0.106]
-0.150 -0.039 0.009 -0.178 -0.107 0.045 -0.341 -0.781*** -0.327** -0.376*** -0.110 -0.253**
[0.131] [0.178] [0.225] [0.349] [0.198] [0.202] [0.313] [0.253] [0.129] [0.143] [0.192] [0.121]
Observations 2480 2480 2480 2480 2480 2480 2480 2480 2480 2480 2480 2480
Dependent Variable: Favorite Bundle of News Channels
Political Ideology (right leaning)
2004*Political Ideology
Multinomial logit analysis of first and second choice bundles. Base outcome is the bundle (P1,B), where B refers to a Berlusconi channel. The following controls and their respective interaction with the2004 dummy are included: gender, education, age, occupational status, social class, church attendance, index of political knowledge, TV exposure. Robust standard errors clustered by individuals inbrackets. *** p<0.01, ** p<0.05, * p<0.1.
43

Table 7: TRUST IN PUBLIC AND BERLUSCONI’S TV (2001 VS. 2004)
(1) (2) (3)
-0.125*** 0.229*** -0.355***[0.016] [0.017] [0.021]
0.102*** -0.032 0.135***[0.021] [0.021] [0.026]
Observations 2721 2701 2701R-squared 0.069 0.183 0.177
Dependent variable: Self-Reported Level of Trust (1-4)
OLS regressions. The following controls and their respective interaction with the 2004 dummy are included: gender, education, age,occupational status, social class, church attendance, index of political knowledge, TV exposure, regional fixed effects. Robuststandard errors clustered by individuals in brackets. *** p<0.01, ** p<0.05, * p<0.1.
2004*Political Ideology
Political Ideology (right leaning)
Trust Public Trust Berlusconi Trust Public - Trust Berlusconi
Table 8: AGGREGATE RATINGS OF NEWS PROGRAMS BY CHANNEL
0.295***[0.005]
0.077***[0.005]
0.057***[0.005]
0.341***[0.005]
0.113***[0.005]
0.117***[0.005]0.005
[0.005]-0.007[0.005]0.006
[0.005]-0.019***
[0.005]0.005
[0.005]0.010**[0.005]
Observations 492
Dependent Variable: Ratings for Prime-Time News Programs
B1
B2
B3
P1
P2*Berlusconi_Gov
P3*Berlusconi_Gov
Auditel monthly market shares over 2001-2007. GLS estimates assuming autocorrelation(AR1) within channel*time period (before, during and after Berlusconi's government)group. Standard errors in brackets; *** p<0.01, ** p<0.05, * p<0.1.
P2
P3
B1*Berlusconi_Gov
B2*Berlusconi_Gov
B3*Berlusconi_Gov
P1*Berlusconi_Gov
44

Table 9: CONSUMPTION OF NEWSPAPERS BY POLITICAL IDEOLOGY (2001 VS. 2004)
(1) (2) (3)
-0.063 -0.740*** 0.305***
[0.061] [0.105] [0.036]
0.06 0.111 -0.022
[0.062] [0.118] [0.035]
Observations 2754 1909 760
2004*Political Ideology
Columns 1 and 2 represents coefficients from logit regressions. Column 3 represents an OLS regression in which newspaperideology is the dependent variable. The following controls and their respective interaction with the 2004 dummy areincluded: gender, education, age, occupational status, social class, church attendance, index of political knowledge, TVexposure, regional fixed effects. Robust standard errors clustered by individuals in brackets. *** p<0.01, ** p<0.05, * p<0.1.
Overall consumption La Repubblica Newspaper ideology (right leaning)
Political Ideology (right leaning)
Dependent Variable:
45
Related Documents