Parametric Analysis of Progressive Collapse in High-Rise Buildings By Taras Gamaniouk Bachelor of Science in Civil Engineering Queen’s University, 2012 Submitted to the Department of Civil and Environmental Engineering in Partial Fulfillment of the Requirements for the Degree of MASTER OF ENGINEERING in Civil and Environmental Engineering at the MASSACHUSETTS INSTITUTE OF TECHNOLOGY June 2014 © 2014 Taras Gamaniouk. All Rights Reserved. The author hereby grants to MIT permission to reproduce and to distribute publicly paper and electronic copies of this thesis document in whole or in part in any medium now known or hereafter created. Signature of Author: ________________________________________________________________________________ Department of Civil and Environmental Engineering May 9, 2014 Certified By: ________________________________________________________________________________ Pierre Ghisbain Lecturer of Civil and Environmental Engineering Thesis Supervisor Certified By: ________________________________________________________________________________ Jerome J. Connor Professor of Civil and Environmental Engineering Thesis Co-Supervisor Accepted By: ________________________________________________________________________________ Heidi M. Nepf Chair, Departmental Committee for Graduate Students

Welcome message from author
This document is posted to help you gain knowledge. Please leave a comment to let me know what you think about it! Share it to your friends and learn new things together.
Transcript
Parametric Analysis of Progressive Collapse in High-Rise Buildings
By
Taras Gamaniouk
Bachelor of Science in Civil Engineering Queen’s University, 2012
Submitted to the Department of Civil and Environmental Engineering in Partial Fulfillment of the Requirements for the Degree of
MASTER OF ENGINEERING in Civil and Environmental Engineering
at the
MASSACHUSETTS INSTITUTE OF TECHNOLOGY
June 2014
© 2014 Taras Gamaniouk. All Rights Reserved.
The author hereby grants to MIT permission to reproduce and to distribute publicly paper and electronic copies of this thesis document in whole or in part in any medium now
known or hereafter created.
Signature of Author: ________________________________________________________________________________ Department of Civil and Environmental Engineering
May 9, 2014
Certified By: ________________________________________________________________________________ Pierre Ghisbain
Lecturer of Civil and Environmental Engineering Thesis Supervisor
Certified By: ________________________________________________________________________________ Jerome J. Connor
Professor of Civil and Environmental Engineering Thesis Co-Supervisor
Accepted By: ________________________________________________________________________________ Heidi M. Nepf
Chair, Departmental Committee for Graduate Students

Parametric Analysis of Progressive Collapse in High-Rise Buildings
By
Taras Gamaniouk
Submitted to the Department of Civil and Environmental Engineering on May 9, 2014 in Partial Fulfillment of the Requirements for the
Degree of Master of Engineering in Civil and Environmental Engineering
Abstract
Progressive collapse has become a topic of interest in recent years leading to a greater focus on the resilience of structures. The propagation of a local failure can become catastrophic and lead to multiple deaths, injuries and destruction of property. These types of events have been predominant in mid to high-rise buildings under both accidental and intentional circumstances. The dire consequences associated with these types of buildings have fueled research efforts into preventative measures for progressive collapse.
Three main design methods have been implemented for the design of progressive collapse: tie forces, enhanced local resistance and alternate load path. Each method features its own advantages and disadvantages; however, the alternate load path is currently the preferred procedure as it is accurate and capable of dealing with complex systems. This method is investigated in detail with a specific focus on nonlinear dynamic analysis. The technique is applied for three different structural systems which are commonly used for high-rise buildings: moment frames, braced frames and truss tube systems.
A variety of 2D structural models are analysed for their performance under progressive collapse conditions with variable building parameters. The results of the investigation infer that taller buildings are inherently better at preventing progressive collapse as the load is diminished throughout the building allowing less plastic hinges to form. This result was common in all three structural models with the braced frames exhibiting a better structural response to local failure in comparison to moment frame buildings. The study identifies the advantage of implementing hybrid structural frames for the prevention of collapse in high-rise buildings. Integration of moment frames for the lower stories of buildings is shown to be an effective mitigation method for progressive collapse.
Thesis Supervisor: Pierre Ghisbain
Title: Lecturer, Department of Civil and Environmental Engineering
Thesis Co-Supervisor: Jerome J. Connor
Title: Professor of Civil and Environmental Engineering

5
Acknowledgements
I would like to thank Pierre Ghisbain for his guidance with this thesis and constant availability regardless of the subject matter. His commitment to his students is extraordinary and greatly appreciated by the entire class. I would also like to thank Professor Connor for his advice and encouragement throughout the year as well as the rest of the M. Eng. faculty and administration for their commitment to their students.
Secondly, a big thank you to the rest of the graduating class for an unforgettable year. The completion of my degree would not have been possible without this awesome group of people. I hope that the friendships we formed remain for the rest of our careers.
Lastly, I would like to thank my family and friends back home for their constant support and reassurance to pursue my goals.

6

7
Table of Contents
1 Introduction ................................................................................................................................................................... 11
1.1 Progressive Collapse ......................................................................................................................................... 11
1.2 Design Guidelines and State of Research ................................................................................................. 12
1.3 Scope of Work ...................................................................................................................................................... 13
2 Progressive Collapse Design Methods................................................................................................................. 15
2.1 Tie Forces .............................................................................................................................................................. 15
2.2 Enhanced Local Resistance ............................................................................................................................ 17
2.3 Alternate Path Method ..................................................................................................................................... 17
2.3.1 Linear Static Procedure .......................................................................................................................... 19
2.3.2 Nonlinear Static Procedure .................................................................................................................. 20
2.3.3 Nonlinear Dynamic Procedure ............................................................................................................ 22
3 Building Parameters ................................................................................................................................................... 23
3.1 Building Classification ...................................................................................................................................... 23
3.2 Structural Systems ............................................................................................................................................. 24
4 Analysis Procedure...................................................................................................................................................... 27
4.1 Overview ................................................................................................................................................................ 27
4.2 Implementation of Alternate Load Path Analysis ................................................................................. 27
4.2.1 Load and Mass Considerations ........................................................................................................... 27
4.2.2 Sizing Optimal Sections .......................................................................................................................... 29
4.2.3 Plastic Hinge Definition .......................................................................................................................... 30
4.2.4 Analysis Parameters ................................................................................................................................ 31
4.2.5 Column Removal ....................................................................................................................................... 31
5 Results .............................................................................................................................................................................. 35
5.1 Analysis Comparison ........................................................................................................................................ 35
5.2 Moment Frames .................................................................................................................................................. 38
5.3 Braced Frames with Outriggers ................................................................................................................... 43
5.4 Truss Tube System ............................................................................................................................................ 47
6 Conclusions..................................................................................................................................................................... 51
References ................................................................................................................................................................................ 53
Appendix ................................................................................................................................................................................... 55

8
List of Figures
Figure 1.1 - Partial collapse of the Ronan Point apartment building (Kokot & Solomos, 2012) .................................. 12
Figure 2.1 – Tie forces in a frame structure (Department of Defense, 2009) .............................................................. 15
Figure 2.2 – Column removal for alternate path analysis (Department of Defense, 2009) ......................................... 18
Figure 2.3 - Generalized plastic hinge definition (ASCE, 2007) .................................................................................... 21
Figure 3.1 - Steel structural systems used for high-rise design; a) Moment frame b) Braced frame with outriggers
c) Truss tube system .................................................................................................................................. 24
Figure 4.1 - Typical braced bays with designed sections and corresponding demand/capacity ratio ......................... 29
Figure 4.2 - Typical plastic hinge curve for flexural elements ...................................................................................... 30
Figure 4.3 - Comparison of moment diagrams between static and equivalent static case ......................................... 32
Figure 4.4 - Transition of structural model for column removal .................................................................................. 33
Figure 5.1 - Nonlinear dynamic results for overdesigned 10 story model ................................................................... 35
Figure 5.2 - Load-deformation curve for immediate occupancy plastic hinge ............................................................. 36
Figure 5.3 - Comparison of linear and nonlinear vertical deflection of joint at column removal ................................ 37
Figure 5.4 - Internal column removal for moment frames........................................................................................... 38
Figure 5.5 - Moment frame deflections for internal column removal.......................................................................... 39
Figure 5.6 - External column removal for moment frames .......................................................................................... 40
Figure 5.7 - Moment frame deflections for internal column removal.......................................................................... 41
Figure 5.8 - Percentage of hinges formed for moment frame structures .................................................................... 42
Figure 5.9 - Internal column removal for braced frames with outriggers .................................................................... 43
Figure 5.10 - Braced frame deflections for internal column removal .......................................................................... 44
Figure 5.11 - External column removal for braced frames with outriggers ................................................................. 45
Figure 5.12 - Braced frame deflections for external column removal.......................................................................... 46
Figure 5.13 - Internal column removal for truss tube system ...................................................................................... 47
Figure 5.14 – Truss tube system deflections for internal column removal .................................................................. 48
Figure 5.15 - External column removal for truss tube system ..................................................................................... 49
Figure 5.16 - Truss tube system frame deflections for external column removal ........................................................ 50
9
List of Tables
Table A1 - Summary of structural models used for moment frame analysis ............................................................... 55
Table A2 - Summary of structural models used for braced frame analysis ................................................................. 56
Table A3 - Summary of structural models used for truss tube analysis ....................................................................... 57

10
11
1 Introduction
1.1 Progressive Collapse
Progressive collapse is a phenomenon which has gained a lot of attention over the last few decades.
It is formally defined as “the spread of an initial local failure from element to element, eventually
resulting in the collapse of an entire structure or a disproportionately large part of it.” (ASCE,
2010). This propagation of a local failure has been creating concern for the structural integrity of
buildings. These types of events can become catastrophic as the collapse may lead to multiple
deaths, injuries and destruction of property in the immediate vicinity of the building. The
consequences associated with progressive collapse are incredibly dire, which is why the topic has
become of interest for government agencies, building owners and researchers.
The trigger of the phenomenon may be a result of one specific event or a combination of causes that
lead to local failure. Examples of these causes include vehicular impact, earthquakes, fire,
explosions as well as human error in design or construction of the structure. The majority of these
causes occur under accidental circumstances, however, in light of recent events there has been an
emphasis on deliberate initiation of progressive collapse. A typical example of this would be the
intentional removal of a column by an explosion. The structural components of the floors above this
column would experience a sudden increase in stress as well as large deflections. This amplification
of the load may continue to cause failure in other primary members of the structure until the
building stabilizes with noticeable deformations or until the complete collapse of the structure.
The interest in progressive collapse dates back to 1968 with the partial collapse of the Ronan Point
apartment building in London, UK. The 23 story building featured a structural system with precast
concrete walls and floors. The event originated from a leaking gas stove which caused an internal
gas explosion on the 18th floor of the apartment building. The explosion removed an external wall
which acted as the main support for the floors above. This caused the progressive collapse of the
upper floors and successive failure down to the ground floor triggered by the debris of the initial
explosion. The unfortunate accident, illustrated in Figure 1.1, resulted in four deaths and a number
of injuries but it also led to an increased research focus on progressive collapse. Following the
event, research was increased into preventative measures for this type of failure and the first
progressive collapse provisions were incorporated in design standards (Kokot & Solomos, 2012).

12
Figure 1.1 - Partial collapse of the Ronan Point apartment building (Kokot & Solomos, 2012)
The attention towards progressive collapse continued to grow as the number of events began to
increase over the years. A significant surge in research efforts occurred after two prominent
terrorist attacks. The first of these being the Oklahoma City bombing of the Alfred P. Murrah
Federal Building in 1995 followed by the collapse of the World Trade Center towers in 2001. These
events differed from previous records of progressive collapse as they were the first to feature
intentional damage which led to a large number of casualties associated with both events. The
terrorist attacks served as precedence for the engineering community to intensify the amount of
research in the field of structural engineering pertaining to progressive collapse (Starossek, 2009).
1.2 Design Guidelines and State of Research
With the impact of these tragic events, the engineering community began to implement standards
for preventing progressive collapse. This was evident from multiple governing bodies in different
countries around the world. The first standards to begin incorporating progressive collapse were
the British Standards, specifically BS 6399. This was followed by the Eurocodes which included
provisions for designing buildings against accidental and extreme loading conditions. The first
American codes to incorporate provisions were the American Society of Civil Engineers (ASCE)
Standard 7 as well as the US General Services Administration (GSA) Guidelines. The ASCE discussed
general strategies for reducing the potential of progressive collapse without providing any specific
requirements while the GSA guidelines provided design guidance relying on linear and nonlinear

13
analysis techniques. The latest code to provide design provisions for progressive collapse is the
Department of Defense’s (DOD) Unified Facilities Criteria (UFC 4-023-03) guidelines for design of
buildings to resist progressive collapse. UFC 4-023-03 offers guidelines for multiple design methods
including: the tie force method, enhanced local resistance and alternate path method. The
guidelines also offer a classification system for buildings which determines the type of design
method to be used for progressive collapse (Kokot & Solomos, 2012). With the development of UFC
4-023-03 guidelines, the GSA replaced their original requirements with the DOD’s procedures
focusing on the alternate path analysis and design methods.
The emergence of the topic in recent years has also led to a number of studies looking into different
aspects of progressive collapse. Early research into the topic was very case specific as it focused on
the actions that triggered the progressive collapse such as fire, impact or blast loading. This
continued into building specific studies such as the susceptibility of the US embassy building in
Russia (Starossek, 2009). The studies examined different design techniques which have been
proposed as a measure against progressive collapse. The majority of the publications implement
the alternate path method and predict the behaviour of the structure after a column has been
removed (Kwasniewski, 2009). Using this method, studies compare the effectiveness of the analysis
techniques which are summarized in the later sections of this thesis. The techniques mainly focus
on using either 2D or 3D finite element modelling to predict the structural response of the building.
As the research in the topic continues and design guidelines are further developed it is important to
generate a collectively accepted method for progressive collapse design. Even with the current
guidelines there is still a lack of globally recognized design procedures that agree on specific
acceptance criteria.
1.3 Scope of Work
The thesis focuses on the performance of high-rise buildings under the conditions of an internal and
external column removal. This local failure is used to investigate the ability to resist progressive
collapse for these types of buildings. An introduction to current progressive collapse design
methods is provided which identifies the advantages and limitations of each method. The nonlinear
dynamic alternate path method is utilized as the primary analysis technique due to its accuracy and
precision with complex systems. The goal of the analysis is to apply this technique and measure the
performance of high-rise buildings with varying number of stories. These buildings will also feature

14
three common structural systems used in practice: moment frames, braced frames with outriggers
and truss tube systems.
SAP2000 is used as the primary structural analysis software to model the buildings of interest. The
analysis is limited to 2D structural models due to computational and time constraints. The
parameter of interest is the impact of total number of floors on the resistance of the building to
progressive collapse. This parameter is investigated for multiple structural systems with the total
building height ranging from 35m to 140m. The analysis utilizes the nonlinear dynamic procedure
to solve for the development of plastic hinges within the structure. This formation of hinges serves
as an indicator of the structure’s capacity for progressive collapse. It is intended that the results are
used as preliminary data for the study of high-rise buildings which can be used to develop more
detailed and specific investigations into the performance of 3D models under progressive collapse
conditions.

15
2 Progressive Collapse Design Methods
The paper focuses on DOD’s UFC 4-023-03 guidelines for progressive collapse since the procedures
are outlined in great detail and offer multiple design methods which have been implemented since
the initial interest in the phenomenon. The three design methods include tie forces, enhanced local
resistance and the alternate path method. These methods are described in more detail below.
2.1 Tie Forces
The tie forces approach utilizes mechanical ties between structural members to ensure structural
integrity in the event of a local failure. The method simplifies an indeterminate structure to a locally
determinate one where these tie forces can be approximated. Depending on the location and the
function of the structural members, the structural ties are categorized into four types: longitudinal,
transverse, peripheral and vertical. These types of ties are illustrated in Figure 2.1 below.
Figure 2.1 – Tie forces in a frame structure (Department of Defense, 2009)
The tie forces are developed by the existing structural elements and connections. These elements
are designed using conventional methods to carry the standard loads that that are imposed on the
structure. When checking the structural system it is adequate to show that the structural members
(beams, girders or spandrels) and their connections can carry the tie forces while undergoing
16
rotations of 11.3°, as specified by the UFC guidelines, otherwise these tie forces are to be carried by
the floor and roof system. The only minimum structural requirement for this method is that the
number of bays for the building is greater than three in each direction.
Structural members that meet the rotation requirement must also satisfy tie strength requirements
which are dependent on the type of tie force in the structure. The consideration of these forces is
taken separately from the typical forces that are carried by each element due to standard load
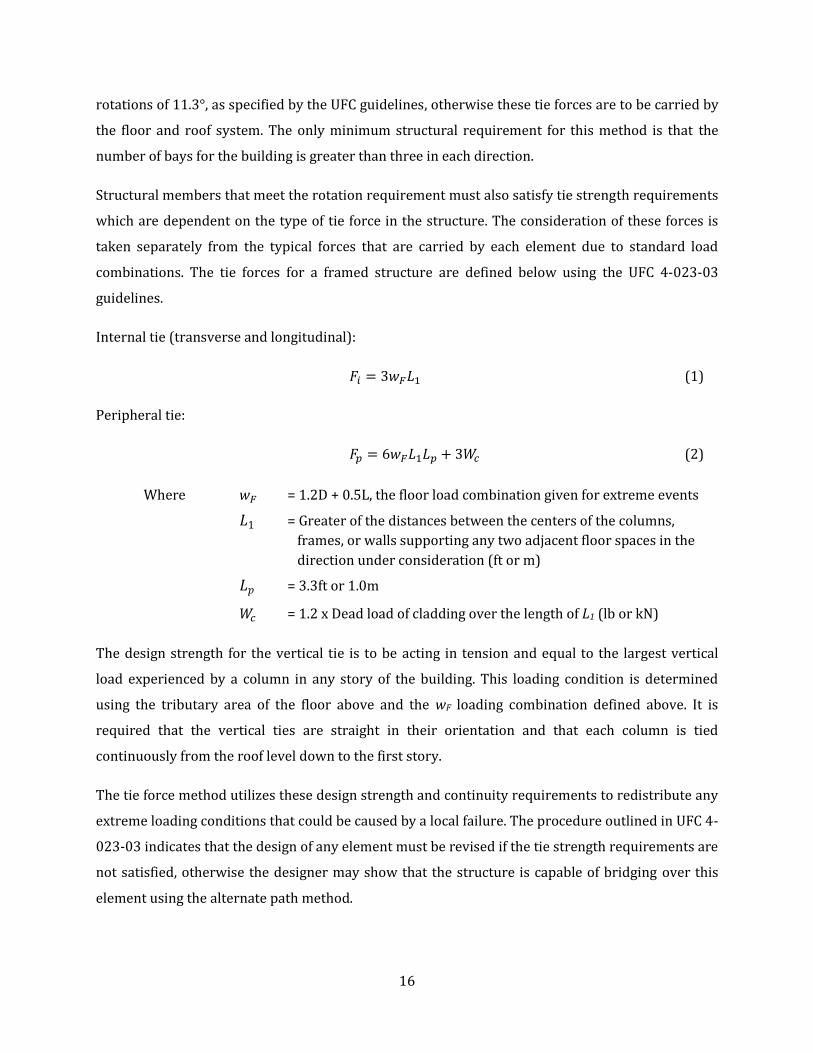
combinations. The tie forces for a framed structure are defined below using the UFC 4-023-03
guidelines.
Internal tie (transverse and longitudinal):
(1)
Peripheral tie:
(2)
Where = 1.2D + 0.5L, the floor load combination given for extreme events
= Greater of the distances between the centers of the columns,
frames, or walls supporting any two adjacent floor spaces in the
direction under consideration (ft or m)
= 3.3ft or 1.0m
= 1.2 x Dead load of cladding over the length of L1 (lb or kN)
The design strength for the vertical tie is to be acting in tension and equal to the largest vertical
load experienced by a column in any story of the building. This loading condition is determined
using the tributary area of the floor above and the wF loading combination defined above. It is
required that the vertical ties are straight in their orientation and that each column is tied
continuously from the roof level down to the first story.
The tie force method utilizes these design strength and continuity requirements to redistribute any
extreme loading conditions that could be caused by a local failure. The procedure outlined in UFC 4-
023-03 indicates that the design of any element must be revised if the tie strength requirements are
not satisfied, otherwise the designer may show that the structure is capable of bridging over this
element using the alternate path method.
17
2.2 Enhanced Local Resistance
The enhanced local resistance (ELR) method is intended to be used in conjunction with the other
progressive collapse methods such as tie forces or alternate path. It is not recommended that the
procedure is used as a standalone preventative measure against progressive collapse. The principle
of this design method is to ensure that a ductile failure mechanism can develop when the column is
laterally loaded to failure. In order for this to occur, the column cannot fail in shear prior to the
development of maximum flexural strength. The two main structural components which are
emphasized by this design method is the column or vertical load bearing component and the
connections between these elements and the lateral supports. An over strength factor is introduced
for the areas of interest to ensure that the design strength meets the flexural and shear demands of
the loading conditions.
The requirements for enhanced local resistance are established using the occupancy category of the
building. This occupancy category is determined using the provisions of UFC 3-301-01. Using the
occupancy classification, the guidelines summarize which columns should be targeted for ELR. For
typical high-rise buildings it is recommended that the ELR method is applied to all perimeter
columns of the first story above grade. Some exceptions may limit this requirement to only the
perimeter corner columns of the first story. The implementation of the ELR method allows for the
development of resistance for these critical elements and joints which may result in sufficient
strength and continuity to provide alternate load paths (Krauthammer, 2002). This approach is
recommended primarily for situations when the loss of an element cannot be tolerated by the
structure.
2.3 Alternate Path Method
The alternate path method is a direct design procedure which analyses the development of forces
throughout a building in the event of a local failure. In contrast to the tie force method, alternate
path utilizes various analysis techniques to solve for the internal forces and deformations of an
indeterminate structure. The fundamental concept of the method relies on the ductility and
continuity of the building to redistribute the forces within the structure once damage is present.
The method follows the general design philosophy employed by ASCE 7 for loading under
extraordinary events, similar to the load combinations used for tie forces. The method is
implemented using three analysis procedures: linear static, nonlinear static and nonlinear dynamic.
These analysis techniques are in accordance with ASCE 41 with specific modifications to

18
accommodate the particular issues associated with progressive collapse (Department of
Defense, 2009).
Some of the requirements to implement the alternate path method for progressive collapse consist
of proper designation of structural elements as well as correct removal of load bearing elements.
While analysing the building of interest, all structural elements and components must be classified
as primary or secondary members. The classification of these elements depends on their
contribution to resist collapse. An example of a secondary element would be a steel gravity beam
that is assumed to be pinned at both ends of a girder and flexural strength is ignored at the
connection. Should this beam be designed as a fixed connection or partially restrained, the beam
may be classified as a primary member as it provides resistance against the collapse of the
structure. An important aspect of the method to consider is that the removal of any load bearing
elements must maintain beam-to-beam continuity across the removal. A proper configuration of the
removal process is illustrated in Figure 2.2 below. This implies that any possible removal of a
column must be at a location of primary members in order to allow proper redistribution of forces.
Figure 2.2 – Column removal for alternate path analysis (Department of Defense, 2009)
The configuration of these primary members within a structure serves as a good indicator of the
building’s ability to resist progressive collapse. The lack of primary members indicates a large
19
number of pinned connections in the structural system. Under the removal of a column, these types
of connections allow the beams to freely rotate causing large deformations and further propagation
throughout the stories of the building. The rotation and deformation of the floor system is
frequently accompanied by large stresses that overcome the structural capacity of the members
and ultimately leads to progressive collapse. On the other hand, fixed connections allow for the
dissipation of forces throughout the structure which gives the building the potential to stabilize and
limit the progression of the structural failures within the building.
By using the alternate path method, this distribution of forces can be examined throughout the
structure. The component capacities can either be deformation or force controlled depending on
the analysis procedures; linear static, nonlinear static and nonlinear dynamic. The building is
deemed structurally adequate if none of the primary and secondary elements exceed the
acceptability criteria which is detailed in UFC 4-023-03. If the analysis procedure predicts that
certain components or connections do not meet the acceptability criteria, the elements must be
redesigned or retrofitted to meet the suitable limits for progressive collapse.
2.3.1 Linear Static Procedure
The linear static approach is regarded as the simple approach for the alternate path method. The
use of the procedure is only limited to structures that meet specific irregularities and demand-
capacity ratio (DCR), therefore, it is recommended for structures that have relatively simple
layouts. The irregularities defined by UFC 4-023-03 are summarized below –
1) Buildings that contain significant discontinuities in the gravity-load carrying and lateral
force resisting system.
2) Buildings that exhibit large variations in bay sizes.
3) Large variations in stiffness or strength for intersecting load-bearing walls in the structure.
4) Structural systems where the lateral-load resisting elements are not parallel to the major
orthogonal axes of the lateral force-resisting system.
If the structure does not feature any of the irregularities identified in 1) through 4) above, then a
linear static procedure may be performed without the need to calculate the DCR. Otherwise, if
irregularities are present then the procedure is limited to only when the DCR ratio of the elements
in the structure are less than or equal to 2.0. The DCR ratio is defined by the following equation –
(3)

20
Where = component or connection forces determined by the analysis
= ultimate capacity of the component or connection
The analysis itself is conducted by modelling all primary components of the structure while the
secondary members are not included since they lack the ability to redistribute the forces. The
column or vertical load bearing component is then removed from the structure while the continuity
is maintained at the joint, as shown in Figure 2.2. Once the removal is incorporated in the model,
the following load combination is applied on the structure –
( ) (4)
Where = dynamic amplification factor used for linear static analysis, typically
equal to 2.0 for suddenly-applied loads
The resultant stresses and forces for the components are then determined which provide the
ultimate demand forces (QUD) required for the DCR computation. If the linear static procedure is
deemed appropriate, these demand forces may be factored in accordance with Chapter 4 to 8 of
UFC 4-023-03. The factors in these chapters account for the ductility of the material as well as
governing structural conditions such as shear or flexure. The ultimate capacity of the components
must meet these factored loads for the structure to be resistant against progressive collapse.
Components that are determined to be sized inadequately must be redesigned to satisfy the
capacity requirements.
2.3.2 Nonlinear Static Procedure
The nonlinear static procedure is similar to linear static with the main difference being the
inclusion of plastic hinges within the components of the structure. The location of these hinges is up
to the discretion of the designer, however, it is recommended that they are placed in areas where
the highest stresses are likely to develop in the element. For a beam element this is likely to occur
either at the midspan or at the ends whereas only the ends of a column would include these hinges.
The plastic hinges are formed when the member transitions from elastic to plastic behaviour at a
certain bending moment. Once the hinge forms it allows for rotation about the hinge with no
additional bending moment. This type of behaviour is typical of an actual progressive collapse as
these hinges form throughout the structure and could ultimately lead to complete collapse if the
structure cannot stabilize. Typical hinge behaviour is defined by ASCE 41 with a variation in
performance depending on the type of component as well as material properties and connection
21
conditions. UFC 4-023-03 as well as the GSA guidelines utilize the defined hinge properties of ASCE
41 for their nonlinear procedures associated with the alternate path method. A generalized
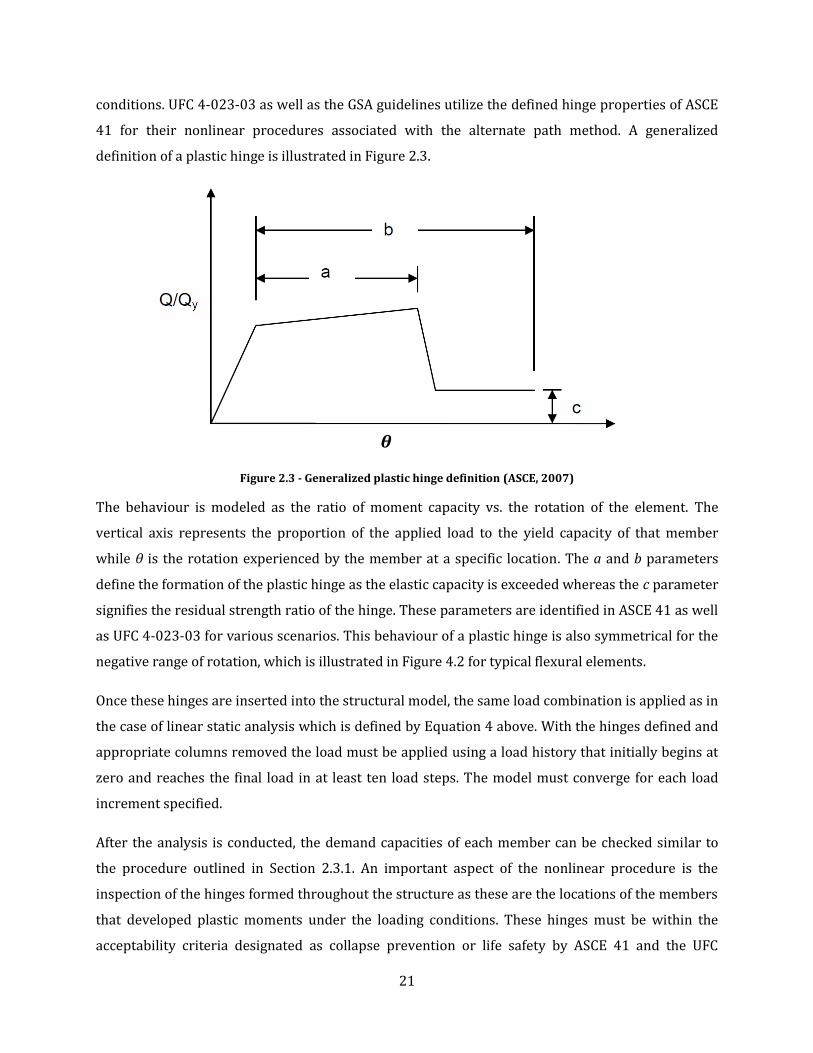
definition of a plastic hinge is illustrated in Figure 2.3.
Figure 2.3 - Generalized plastic hinge definition (ASCE, 2007)
The behaviour is modeled as the ratio of moment capacity vs. the rotation of the element. The
vertical axis represents the proportion of the applied load to the yield capacity of that member
while θ is the rotation experienced by the member at a specific location. The a and b parameters
define the formation of the plastic hinge as the elastic capacity is exceeded whereas the c parameter
signifies the residual strength ratio of the hinge. These parameters are identified in ASCE 41 as well
as UFC 4-023-03 for various scenarios. This behaviour of a plastic hinge is also symmetrical for the
negative range of rotation, which is illustrated in Figure 4.2 for typical flexural elements.
Once these hinges are inserted into the structural model, the same load combination is applied as in
the case of linear static analysis which is defined by Equation 4 above. With the hinges defined and
appropriate columns removed the load must be applied using a load history that initially begins at
zero and reaches the final load in at least ten load steps. The model must converge for each load
increment specified.
After the analysis is conducted, the demand capacities of each member can be checked similar to
the procedure outlined in Section 2.3.1. An important aspect of the nonlinear procedure is the
inspection of the hinges formed throughout the structure as these are the locations of the members
that developed plastic moments under the loading conditions. These hinges must be within the
acceptability criteria designated as collapse prevention or life safety by ASCE 41 and the UFC
θ

22
guidelines. If the conditions are exceeded at any portion of the building, the elements at this
location would need to be redesigned and the analysis would have to be repeated until the limits
are satisfied.
2.3.3 Nonlinear Dynamic Procedure
The final analysis procedure for alternate path is the nonlinear dynamic procedure. This method is
considered to be the most accurate and is recommended to be used for more complex systems.
However, care must be taken to ensure that the structure is modelled accurately as small
differences in the assumptions can cause large variations in the results. The main limitation of the
nonlinear dynamic procedure is that the analysis is computationally intensive and could require a
long amount of time for completion.
The loading procedure for this method differs from the previous two cases as the load is analysed
using dynamic loading conditions. The loading combination wF is to be applied for the nonlinear
dynamic procedure, where wF is the loading used for extraordinary events with factored loads of
1.2D and 0.5L. The analysis follows a two-step process where the model is initially brought to
equilibrium under the gravity loads. This initial step is to be done prior to the removal of the
column or vertical load bearing component. Once equilibrium is established, the column or wall is
removed with the duration of the removal dependent on the discretion of the designer. The
guidelines indicate that instantaneous column removal may be simulated by using a very small
interval of time. This duration is defined as less than one tenth of the period associated with the
mode shape that exhibits vertical motion of the bays located above the removed section. It is
recommended by UFC 4-023-03 that the analysis is continued until maximum displacement is
achieved or one cycle of vertical motion occurs at the column removal. However, the peak response
may not occur during the first cycle of motion as buildings that exhibit plastic behaviour can
continue to deflect. It is suggested that the analysis should continue until the model stabilizes
where the displacement of the joint reaches a near constant value and exhibits very small
oscillations. This may not always be possible if the building is prone to progressive collapse and
geometric nonlinearities continue to develop throughout the building (Kokot & Solomos, 2012).
After the model stabilizes and the analysis is complete the components and all plastic hinges can be
examined and redesigned if necessary. If the model does not stabilize, it is highly likely that the
building has experienced progressive collapse and the latest time steps of the analysis should be
examined for hinge formations to confirm the collapse of the structure. These areas of weakness
would need to be adjusted to accommodate the design requirements for progressive collapse.
23
3 Building Parameters
A typical building needs to be defined for the analysis of progressive collapse. Consideration must
be taken into the type of structural system the building uses as well the primary material used and
other parameters such as height to width ratio or the number of bays in the building. The sections
below present the reasoning for the selection of these parameters and summarize the typical
building that will be used for the analysis supporting this thesis.
3.1 Building Classification
Previous studies have mostly focused on relatively small structures with less than five stories. This
has been the typical case examined for progressive collapse because buildings this size are fairly
simple and do not require an intensive amount of computation. However, these types of buildings
are not very representative of true progressive collapse events as history dictates that the majority
of these events occur in mid to high-rise buildings. Examining buildings at this scale is highly
important as they are more likely to be experience trigger causes such as fire, impact and accidental
or intentional blast loading. This pattern is noticeable by examining the history of progressive
collapse where the majority of the cases involve buildings of at least ten stories with various causes
of local failure (Kokot & Solomos, 2012). Using this rationale, the paper will strictly focus on high-
rise buildings for the implementation of progressive collapse analysis methods. The study for these
buildings will emphasize their ability to mitigate progressive collapse.
A building is generally classified as a high-rise when the number of stories ranges from 12 to 40 or
the total height of the building is at least 35m (Emporis GmbH, 2014). Using this as a guideline, the
structures examined in this paper will range from 10 to 40 stories with a typical story height of
3.5m which is recommended by the Council on Tall Buildings for multi-use buildings (CTBUH,
2014). It will be assumed that the buildings are used for residential and office occupancy for the
determination of the loading conditions. The building design will feature five bays with a typical
width of 8m between the columns. This means that the minimum height to width ratio that will be
observed is 0.875 up to a maximum value of 3.5. The variation of the total height will demonstrate
how high-rise buildings perform under column removal and provide insight into the susceptibility
for progressive collapse. The final parameter of interest, detailed in Section 3.2, will be the type of
structural system used for the design of the building.
24
3.2 Structural Systems
An important factor to consider for progressive collapse is the type of structural system that is used
for the building design. The selection of these structural systems vary depending on a number of
factors such as architectural requirements, economics, loading conditions, material constraints as
well as general preferences of the client. In order to narrow the scope of the analysis, the paper will
focus on structural steel framed buildings which are relatively common for the construction of
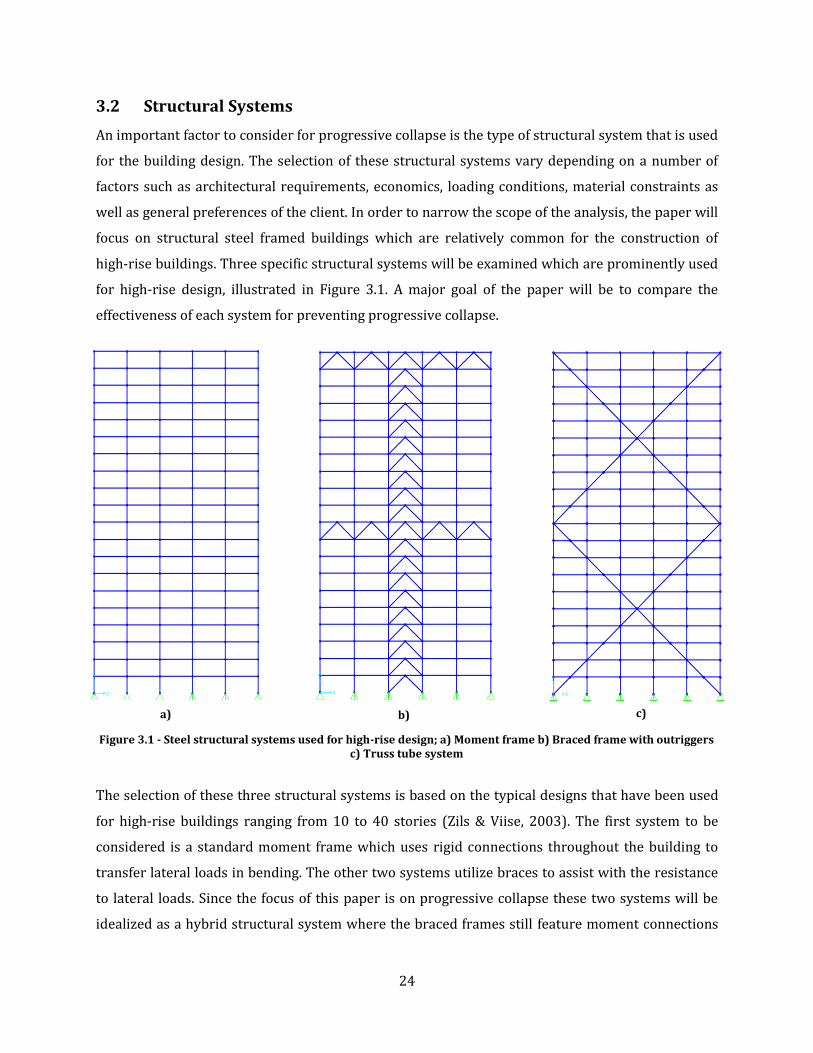
high-rise buildings. Three specific structural systems will be examined which are prominently used
for high-rise design, illustrated in Figure 3.1. A major goal of the paper will be to compare the
effectiveness of each system for preventing progressive collapse.
The selection of these three structural systems is based on the typical designs that have been used
for high-rise buildings ranging from 10 to 40 stories (Zils & Viise, 2003). The first system to be
considered is a standard moment frame which uses rigid connections throughout the building to
transfer lateral loads in bending. The other two systems utilize braces to assist with the resistance
to lateral loads. Since the focus of this paper is on progressive collapse these two systems will be
idealized as a hybrid structural system where the braced frames still feature moment connections
Figure 3.1 - Steel structural systems used for high-rise design; a) Moment frame b) Braced frame with outriggers c) Truss tube system
b) c) a)

25
throughout the building. The reasoning for this is that the framed structures require continuity to
deal with progressive collapse and the analysis would not be possible if the connections are
assumed to be pinned. The braces in these structural systems use standard pinned connections
where the moment is released at the ends of each member. These types of members would typically
be classified as secondary members; however, the contribution of these components to the vertical
forces of the structure provides resistance for the local failure.
It is expected that the majority of the brace contribution will occur in the first 10 stories of the
braced buildings. By the time the force reaches the 10th floor of the building it would have had the
opportunity to transfer to a load path to the base of the building through these braces. In the braced
frame system, the outriggers act as this transfer member to the core braced bay in the center of the
building. For the truss tube system, it is expected that the diagonals will pick up the load from the
axial reactions caused by the beams and columns that are pin connected throughout the length of
the brace. This transfer of load by the braces will limit the amount of force that is redistributed in
the floors above the 10th story of the building.

26
27
4 Analysis Procedure
4.1 Overview
The nonlinear dynamic alternate path method was selected to conduct the parametric analysis for
progressive collapse. The procedure provides the most accurate results for the behaviour of a
structure experiencing progressive collapse and has the least amount of limitations in comparison
to other methods.
SAP2000 was selected as the structural analysis program based on UFC recommendations and
previous studies conducted on the topic. This software package is fully capable of performing all of
the required steps for nonlinear dynamic analysis and also provides built in design packages that
produce optimal section sizes for given loading conditions. The software is used to model 2D
representations of high-rise buildings varying in the number of stories. It is important to mention
that the UFC 4-023-03 guidelines recommend that the analysis procedures are conducted on 3D
models, however, the research conducted for this paper is meant to provide preliminary behaviour
of high-rise buildings. The structural systems examined are expected to perform very differently
from one another therefore the potential error introduced by 2D modelling is not important in the
context of this paper.
The purpose of the analysis is to simulate the removal of an internal and external column of a
building. The building parameters used for the analysis is described in with Section 3.1. This
procedure is then repeated for three structural systems: a moment frame, braced frame with
outriggers and truss tube system.
4.2 Implementation of Alternate Load Path Analysis
The following procedure was formulated using the UFC guidelines as well as various standards
including ASCE 41 and ASCE 7-10. The step by step process for the nonlinear dynamic analysis is
detailed in the sections below.
4.2.1 Load and Mass Considerations
Three main loads were considered for sizing the structural components and for the analysis of
progressive collapse. The loading conditions were determined using ASCE 7-10 for dead, live and
wind loads. The summary for these loads is provided below.
28
1) Dead Loads – Considered weight of 6” concrete slab and finishes.
wDL = 4.55kPa Therefore, with 8m tributary width DL = 36.4kN/m
2) Live Loads – Building was classified as Category III occupancy in accordance with UFC 4-
023-03. The occupancy was assumed to be mixed use with residential/office occupancy.
wLL = 3.83kPa Therefore, with 8m tributary width LL = 30.64kN/m
3) Wind Loads – The wind load distribution for each model was determined in accordance
with ASCE 7-10 with the following factors –
v = 51.41 m/s
Kd = 0.85
Kt = 1.0
L = B = 40m
Level II (normal) importance factor was used with a ‘B’ exposure category as defined by
ASCE 7-10. The wind distributions included the combination of windward and leeward
pressure acting on the building with a tributary width of 8m. The resultant distribution
varied for each building model as the total height of the building changed. The load was
applied to the structure in a tapered distribution to accurately represent increasing wind
pressure as the building increased in height.
The nonlinear dynamic procedure utilizes the loading combination specified in Section 2.3.3 for
extraordinary events. Typical loading combinations specified by ASCE 7-10 were used for the
design of the structural members of each structural system.
The mass source was defined using the following load pattern –
(5)
The dead load includes self-weight of the members, slab and other imposed dead loads. The
approximate 10% of live load was determined using the requirements of Chapter 12 of ASCE 7-10
for seismic weight. The inclusion of this live load is recommended for the dynamic analysis of the
structure and considered in each analysis task used in SAP2000.
29
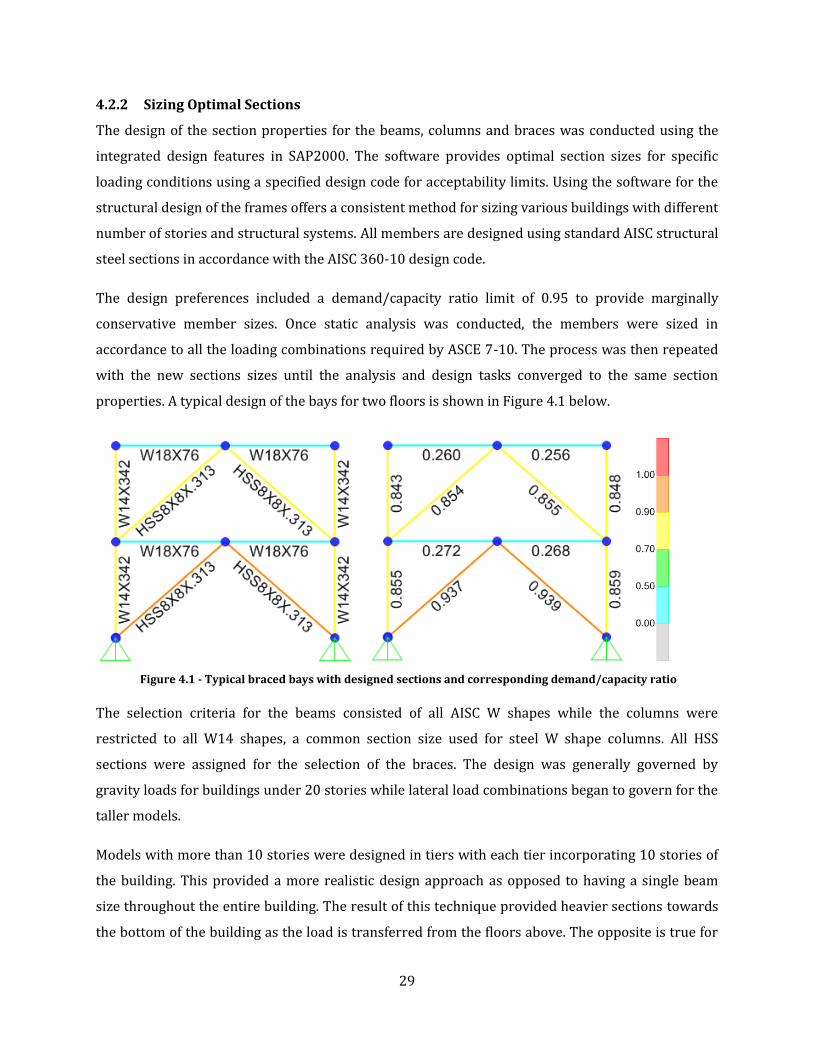
4.2.2 Sizing Optimal Sections
The design of the section properties for the beams, columns and braces was conducted using the
integrated design features in SAP2000. The software provides optimal section sizes for specific
loading conditions using a specified design code for acceptability limits. Using the software for the
structural design of the frames offers a consistent method for sizing various buildings with different
number of stories and structural systems. All members are designed using standard AISC structural
steel sections in accordance with the AISC 360-10 design code.
The design preferences included a demand/capacity ratio limit of 0.95 to provide marginally
conservative member sizes. Once static analysis was conducted, the members were sized in
accordance to all the loading combinations required by ASCE 7-10. The process was then repeated
with the new sections sizes until the analysis and design tasks converged to the same section
properties. A typical design of the bays for two floors is shown in Figure 4.1 below.
The selection criteria for the beams consisted of all AISC W shapes while the columns were
restricted to all W14 shapes, a common section size used for steel W shape columns. All HSS
sections were assigned for the selection of the braces. The design was generally governed by
gravity loads for buildings under 20 stories while lateral load combinations began to govern for the
taller models.
Models with more than 10 stories were designed in tiers with each tier incorporating 10 stories of
the building. This provided a more realistic design approach as opposed to having a single beam
size throughout the entire building. The result of this technique provided heavier sections towards
the bottom of the building as the load is transferred from the floors above. The opposite is true for
Figure 4.1 - Typical braced bays with designed sections and corresponding demand/capacity ratio
30
the higher tiers with the smaller sections corresponding to the lower loading conditions. The
summary of the designed sections is shown in the appendix for all of the models analysed in this
paper.
4.2.3 Plastic Hinge Definition
Nonlinear analysis requires plastic hinges to be defined throughout the structural model including
column and brace elements. These hinges were placed at locations of high stress as recommended
by UFC 4-023-03. Beam elements included plastic hinges at the midspan and ends of the members
whereas hinges for the columns were added only at the ends. Structural systems which featured
braces had plastic hinges included at the midspan of the member since the axial load is typically
constant throughout the element.
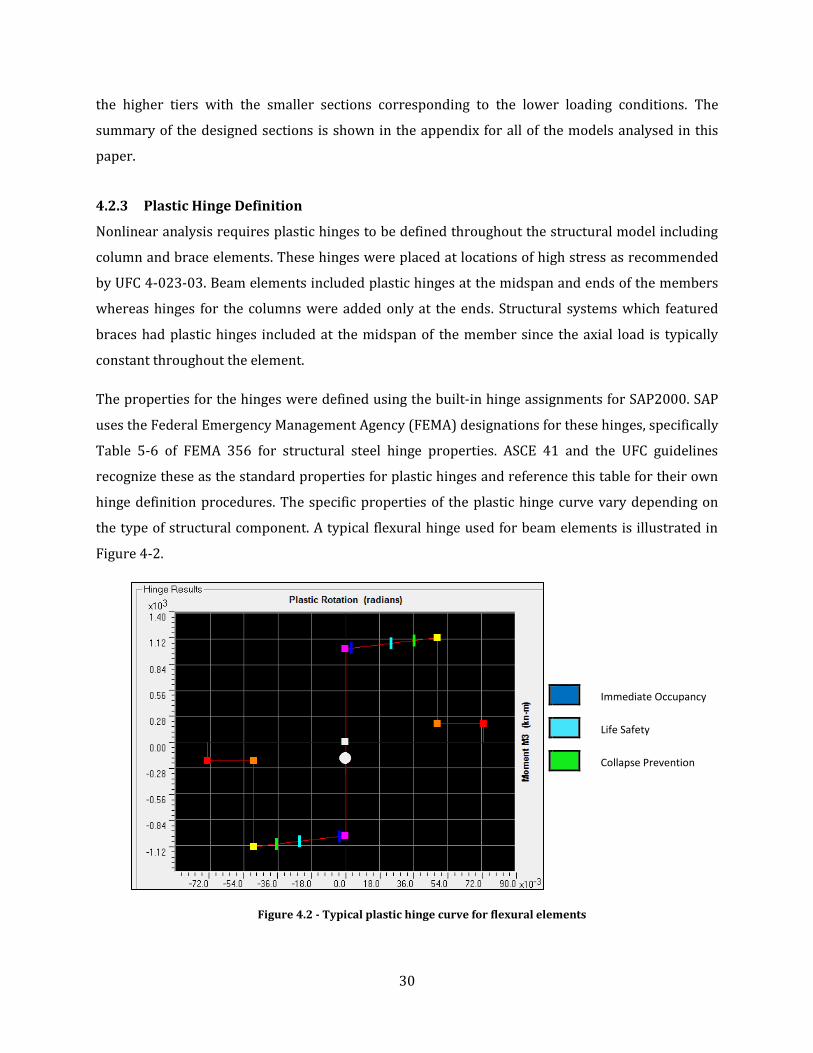
The properties for the hinges were defined using the built-in hinge assignments for SAP2000. SAP
uses the Federal Emergency Management Agency (FEMA) designations for these hinges, specifically
Table 5-6 of FEMA 356 for structural steel hinge properties. ASCE 41 and the UFC guidelines
recognize these as the standard properties for plastic hinges and reference this table for their own
hinge definition procedures. The specific properties of the plastic hinge curve vary depending on
the type of structural component. A typical flexural hinge used for beam elements is illustrated in
Figure 4-2.
Immediate Occupancy
Life Safety
Collapse Prevention
Figure 4.2 - Typical plastic hinge curve for flexural elements

31
Figure 4.2 shows how the elastic and plastic behaviour of a structural component is defined in
SAP2000. The initial vertical portion of the curve represents the elastic properties of the element.
Once the yield moment is reached, the member exhibits plastic behaviour which is demonstrated by
the bend in the curve. This plastic region of the curve allows for rotation of the member about the
hinge location and defines the acceptability limits for a plastic hinge. The coloured hatch marks on
the curve represent the three limit states defined by ASCE and FEMA. For the purpose of
progressive collapse, the hinge is determined to be inadequate if the life safety limit is exceeded.
The remainder of the curve is defined by the residual strength capacity of the member, which is
approximately 20% of the yield strength.
4.2.4 Analysis Parameters
Two main analysis tasks conducted are nonlinear static and dynamic. The nonlinear static case was
mainly used to establish equilibrium conditions prior to the removal of the column. The dynamic
analysis was performed using the Nonlinear Direct Integration Time History load case type with the
default settings provided by SAP2000. The other parameters used for the analysis are summarized
below –
1) Damping ratio = 2%, Typical value for inherent damping of steel structures (Paz, 2003)
2) Analysis time step = 0.01s
3) Total duration of analysis = 5s or until progressive collapse/multiple hinge failure has
occurred
4) Column removal duration =
The period (T) used for the column removal duration is the period of the first mode to exhibit
vertical motion at the location of the removed column after the column has been removed.
4.2.5 Column Removal
The next step of the procedure focused on determining the equilibrium conditions of the structure
prior to the removal of the column. This was followed by the removal of the column at the desired
location. This process may be done in several different ways depending on the type of software
used. The procedure detailed in this section was established with the recommendations outlined in
UFC 4-023-03.
32
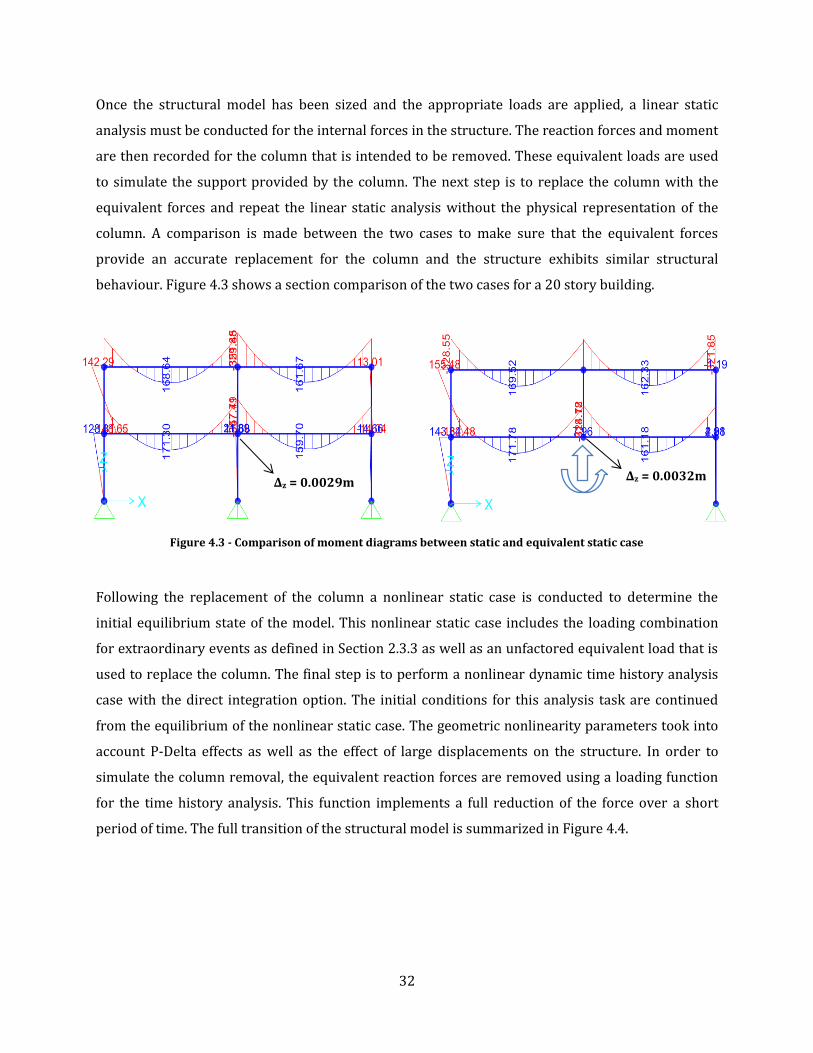
Once the structural model has been sized and the appropriate loads are applied, a linear static
analysis must be conducted for the internal forces in the structure. The reaction forces and moment
are then recorded for the column that is intended to be removed. These equivalent loads are used
to simulate the support provided by the column. The next step is to replace the column with the
equivalent forces and repeat the linear static analysis without the physical representation of the
column. A comparison is made between the two cases to make sure that the equivalent forces
provide an accurate replacement for the column and the structure exhibits similar structural
behaviour. Figure 4.3 shows a section comparison of the two cases for a 20 story building.
Following the replacement of the column a nonlinear static case is conducted to determine the
initial equilibrium state of the model. This nonlinear static case includes the loading combination
for extraordinary events as defined in Section 2.3.3 as well as an unfactored equivalent load that is
used to replace the column. The final step is to perform a nonlinear dynamic time history analysis
case with the direct integration option. The initial conditions for this analysis task are continued
from the equilibrium of the nonlinear static case. The geometric nonlinearity parameters took into
account P-Delta effects as well as the effect of large displacements on the structure. In order to
simulate the column removal, the equivalent reaction forces are removed using a loading function
for the time history analysis. This function implements a full reduction of the force over a short
period of time. The full transition of the structural model is summarized in Figure 4.4.
∆z = 0.0029m ∆z = 0.0032m
Figure 4.3 - Comparison of moment diagrams between static and equivalent static case

33
Figure 4.4 - Transition of structural model for column removal
The duration of the analysis was set to five seconds as this typically provided enough time for the
structure to stabilize and reach small oscillations at the location of the column removal. However,
some of the models did not display this type of performance as the hinges continued to fail and
distribute the forces into other parts of the structure. For these types of occurrences, the analysis
was conducted until multiple hinge failures have formed which served as an indication of
progressive collapse. This process was repeated for internal and external column removal of each
type of structural system at different number of stories. The number of hinges formed and their
severity were used as parameters to classify a structure’s susceptibility to progressive collapse.
Similarly, the joint at the column removal is examined for its vertical motion over the course of the
column removal.
𝒘 𝟏 𝟐𝑫 𝟎 𝟓𝑳 𝒘 𝟏 𝟐𝑫 𝟎 𝟓𝑳 Equivalent forces
t 0
1
T
Removal Equivalent forces

34
35
5 Results
The sections below summarize the SAP2000 analysis results for three main structural systems:
moment frames, braced frames with outriggers and truss tube systems. The nonlinear dynamic
analysis task is initially evaluated for its accuracy and then conducted for a variety of building
systems with heights ranging from 10 to 40 stories. A brief summary of building parameters and
modal results for each structural model is provided in the Appendix.
5.1 Analysis Comparison
An initial comparison was done between the nonlinear dynamic and linear dynamic tasks to verify
the accuracy of the procedure. It was expected that the nonlinear results would provide greater
deflections as the nonlinearity incorporates the plastic behaviour of the structure. This is opposite
to seismic loading where hinges dissipate energy and reduce the structural response. Under
progressive collapse scenarios, there is no time for the dissipation of energy to occur therefore the
maximum deflection is expected in the first cycle of the structure.
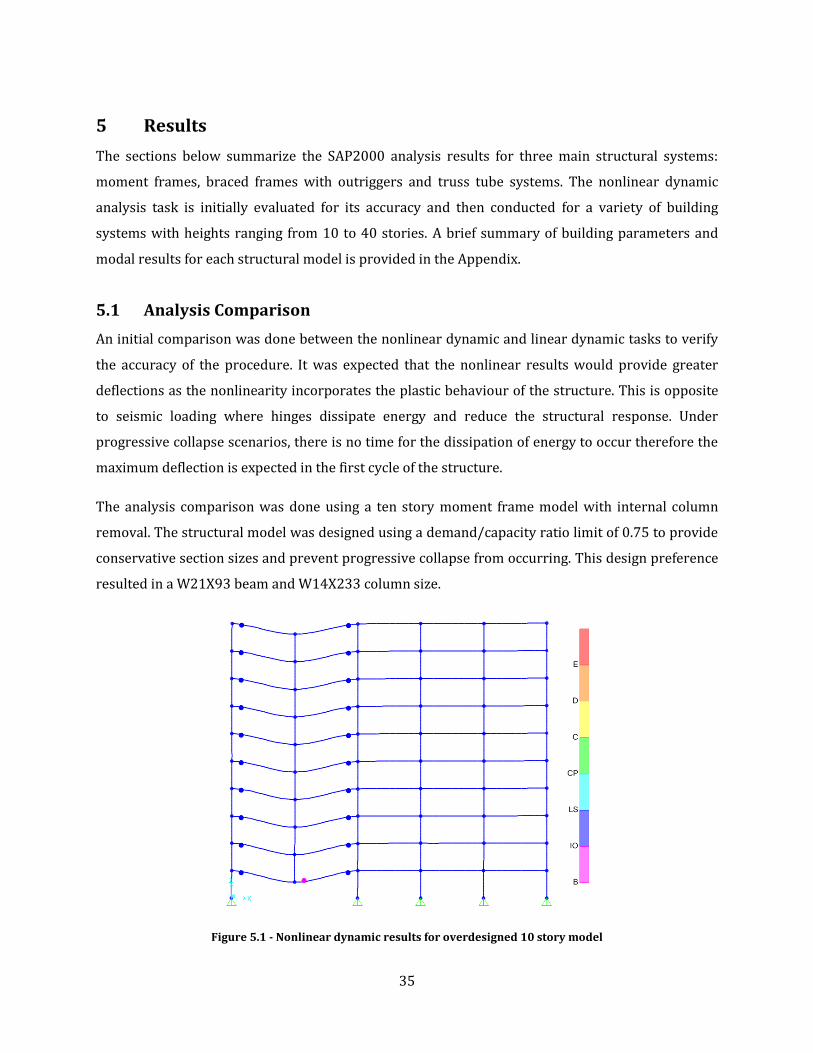
The analysis comparison was done using a ten story moment frame model with internal column
removal. The structural model was designed using a demand/capacity ratio limit of 0.75 to provide
conservative section sizes and prevent progressive collapse from occurring. This design preference
resulted in a W21X93 beam and W14X233 column size.
Figure 5.1 - Nonlinear dynamic results for overdesigned 10 story model

36
Figure 5.1 above illustrates the results from the internal column removal with the formation of
plastic hinges. The severity of the hinge is described by coloured legend to the right of the model.
The purple hinge formed at the joint signifies that the beam has exceeded its yield moment but has
not surpassed any of the limits defined by UFC 4-023-03 for plastic hinge behaviour. These are
illustrated by blue, teal and green colours with the classification of immediate occupancy, life safety
and collapse prevention, respectively. The remainder of the colours are defined by the curve in
Figure 5.2. The presence of a hinge that has reached the life safety limit serves as an indication that
the structure is inadequate for the purpose of progressive collapse and that the members exhibiting
this behaviour would need to be redesigned.
By examining the deformed shape of the ten story model, we can see that the highest level of hinge
formation is in the immediate occupancy range. The column removal would require the evacuation
of the building, however, the model suggests that the structure will stabilize and effectively deal
with the local failure of the column. The formation of this blue hinge is evident at both ends of the
beams above the column removal. As the forces are redistributed throughout the structure, the
hinge formation propagates to all of the floors above this location. The load-deformation curve in
Figure 5.2 shows the behaviour of a hinge located at the end of a beam above the column removal.
Figure 5.2 - Load-deformation curve for immediate occupancy plastic hinge

37
The load and rotation experienced at the hinge is detailed by the purple and blue curves in the
Figure 5.2 above. The curve demonstrates the hinge reaching a maximum moment of -1430kN∙m
and a rotation of 0.015rad. As the analysis continued with its time step operations, the load
decreased while the hinge maintained the permanent rotation caused by the plastic behaviour of
the material. The model stabilized with final loading conditions of -1090kN∙m at the hinge location.
Even though the stabilized condition is under the yield capacity of the beam, the analysis task was
able to capture the nonlinearity of the structural performance within the early steps of the time
history.
The last step of the preliminary analysis task was to compare the deformation of the structure to its
linear behaviour. Based on the hinge behaviour it was expected that the joint will experience
greater deflections as the yield capacity of the beams were exceeded and permanent rotations
formed at the ends of the members.
Figure 5.3 - Comparison of linear and nonlinear vertical deflection of joint at column removal
The vertical joint deflection in Figure 5.3 compares the results from the two analysis tasks. As
expected the nonlinear response of the structure reaches a higher maximum deflection and
stabilizes at approximately 0.15m while the linear case produces a stabilized deflection of 0.1m.
The difference in deflection is within the conservative 2.0 dynamic amplification factor that is
typically associated with a linear static procedure for progressive collapse (Meng-Hao & Bing-Hui,
2009). The outcome of the two analysis tasks suggests that the nonlinear dynamic procedure is
being conducted appropriately with accurate results.
-0.2
-0.18
-0.16
-0.14
-0.12
-0.1
-0.08
-0.06
-0.04
-0.02
0
0 0.5 1 1.5 2 2.5 3 3.5 4
Defl
ecti
on
(m
)
Time (s)
Nonlinear vs Linear Analysis
Nonlinear Dynamic
Linear Dynamic

38
5.2 Moment Frames
The first structural system to be analysed using the nonlinear dynamic procedure was a moment
frame model. This type of building system utilizes fixed beam to column connections to transfer the
lateral loads acting on the structure. The analysis task focused on the internal and external column
removal of this type of structural system with the number of stories ranging from 10 to 40. Figure
5.4 shows the results for the internal column removal.
Figure 5.4 - Internal column removal for moment frames
10 stories 15 stories 20 stories 25 stories
40 stories 35 stories 30 stories
39
The results for the moment frame models display a relationship between the number of stories and
the amount of plastic hinges formed within the structure. The first model examined was the 10
story building which exhibited progressive collapse characteristic throughout all of the floors of the
building. The majority of the hinges failed in the building and the analysis task was stopped due to
lack of convergence. As each hinge failed the load was redistributed throughout the building
creating a progression of the failures. As the number of stories increased, the building’s ability to
deal with the local failure improved. The 15 and 20 story buildings were not adequate in terms of
progressive collapse as a number of the hinges exceeded the acceptability limit, however, these two
models did not feature complete hinge failures as the 10 story model did. Once the buildings
reached at least 25 stories, the structures proved to be relatively resistant to progressive collapse
as the hinges met the acceptability criteria outlined by UFC 4-023-03. By examining the formation
of the hinges, we can see that the ends of the beams are relatively critical for the design of
progressive collapse as these areas are the first to develop plastic hinges. These hinges decrease in
severity on the floors above due to the dissipation of forces through the fixed connections.
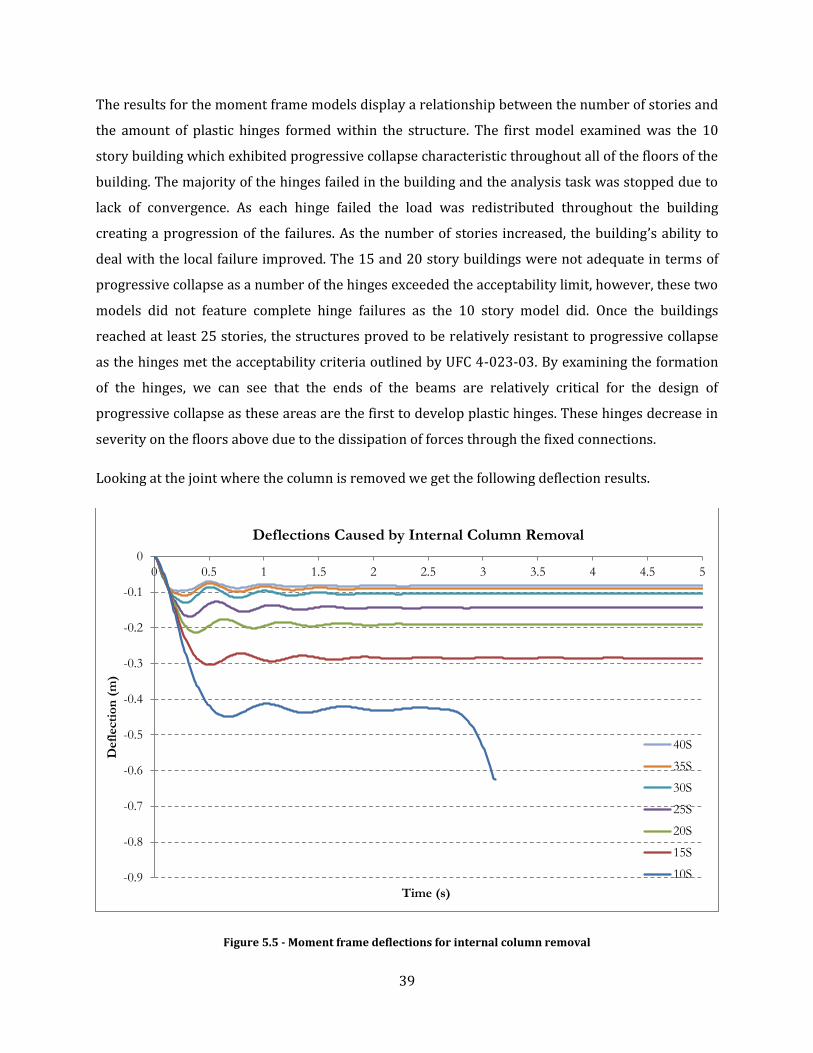
Looking at the joint where the column is removed we get the following deflection results.
Figure 5.5 - Moment frame deflections for internal column removal
-0.9
-0.8
-0.7
-0.6
-0.5
-0.4
-0.3
-0.2
-0.1
0
0 0.5 1 1.5 2 2.5 3 3.5 4 4.5 5
Defl
ecti
on
(m
)
Time (s)
Deflections Caused by Internal Column Removal
40S
35S
30S
25S
20S
15S
10S
40
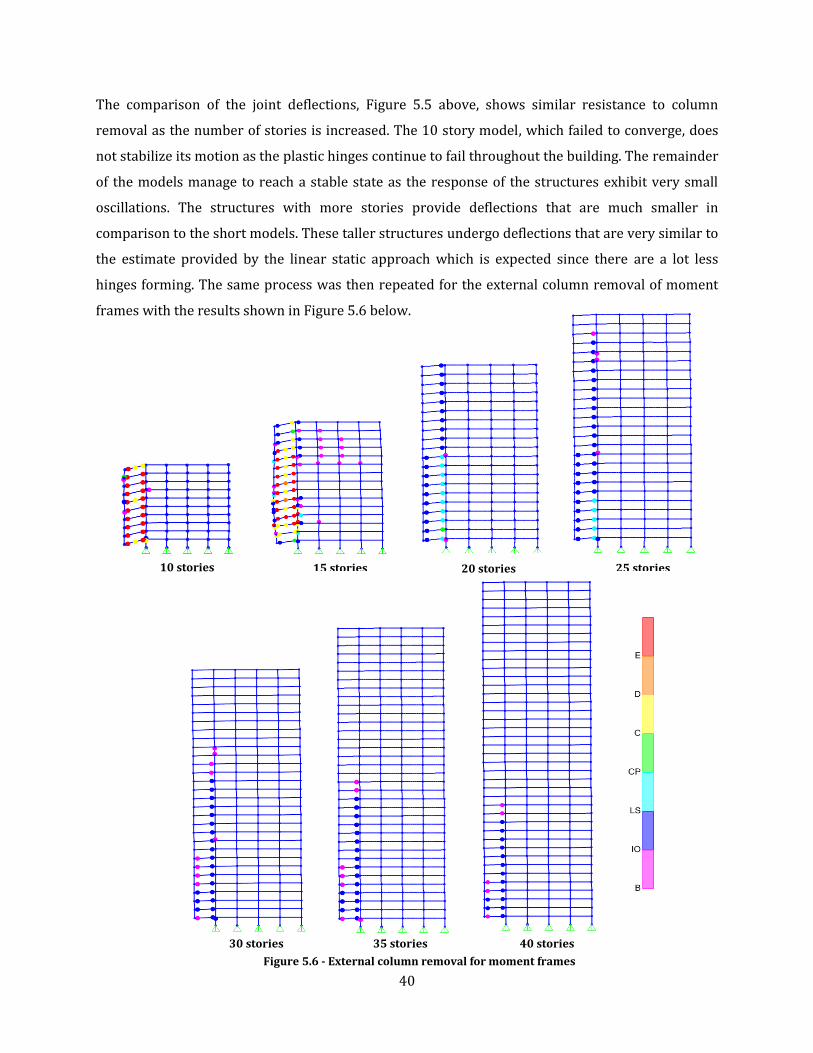
Figure 5.6 - External column removal for moment frames
The comparison of the joint deflections, Figure 5.5 above, shows similar resistance to column
removal as the number of stories is increased. The 10 story model, which failed to converge, does
not stabilize its motion as the plastic hinges continue to fail throughout the building. The remainder
of the models manage to reach a stable state as the response of the structures exhibit very small
oscillations. The structures with more stories provide deflections that are much smaller in
comparison to the short models. These taller structures undergo deflections that are very similar to
the estimate provided by the linear static approach which is expected since there are a lot less
hinges forming. The same process was then repeated for the external column removal of moment
frames with the results shown in Figure 5.6 below.
10 stories 15 stories 20 stories 25 stories
30 stories 35 stories 40 stories
41
The results of the external column removal are comparable to the removal of the internal column
shown in Figure 5.4. The dissipation of the forces is much more effective when the building features
a greater number of stories. Both of the 10 and 15 story models have a large number of hinge
failures, suggesting that buildings of this size are much more susceptible to progressive collapse. In
comparison to the internal removal, the severity of the hinges formed is greater as the taller models
produce more hinges that exceed the immediate occupancy and life safety limits. The analysis
suggests that moment frames are generally more vulnerable to progressive collapse when an
external column is removed. Both of the removal conditions show that the classification of the
hinges decrease to the lower limits as you the force spreads to the floors above the failure.
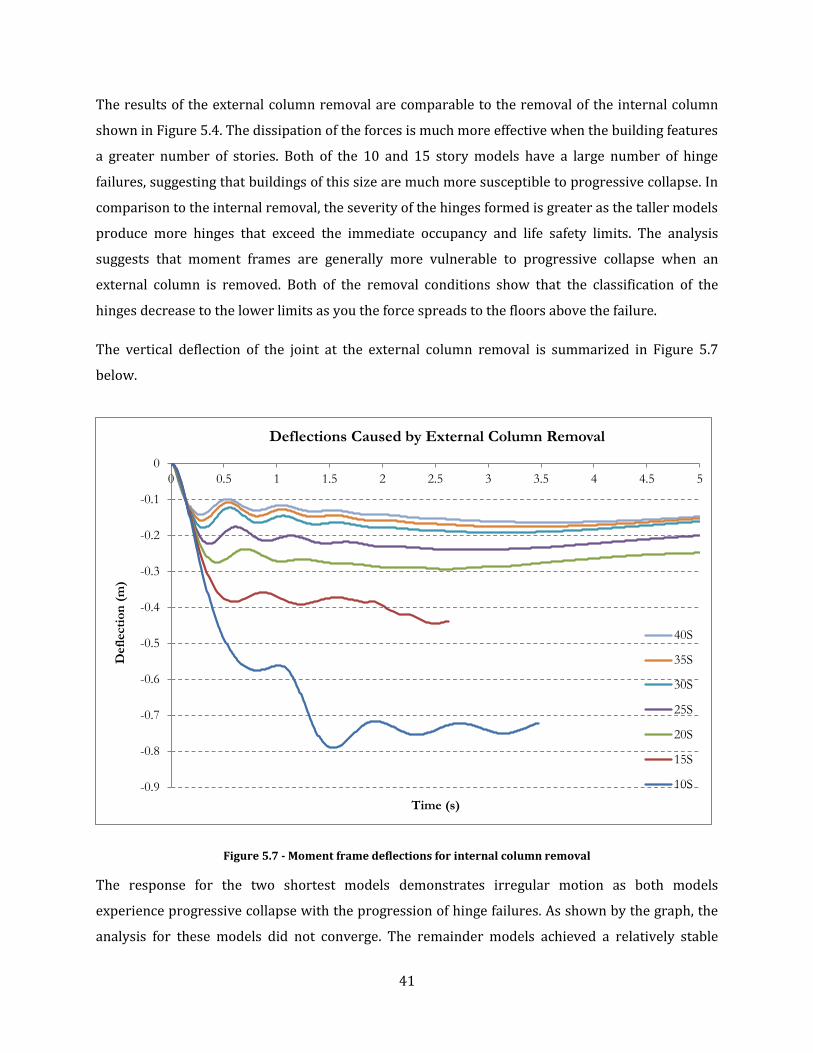
The vertical deflection of the joint at the external column removal is summarized in Figure 5.7
below.
Figure 5.7 - Moment frame deflections for internal column removal
The response for the two shortest models demonstrates irregular motion as both models
experience progressive collapse with the progression of hinge failures. As shown by the graph, the
analysis for these models did not converge. The remainder models achieved a relatively stable
-0.9
-0.8
-0.7
-0.6
-0.5
-0.4
-0.3
-0.2
-0.1
0
0 0.5 1 1.5 2 2.5 3 3.5 4 4.5 5
Defl
ecti
on
(m
)
Time (s)
Deflections Caused by External Column Removal
40S
35S
30S
25S
20S
15S
10S
42
deflection with the oscillations decreasing over time. Once again the structural response of the
taller structures is much more manageable with an average displacement of 0.15m for buildings
with 30 or more stories. There is a noticeable disparity, between the internal and external removal,
for the structure’s ability to stabilize the response after the first few cycles of motion. Even at
higher story levels, the structure exhibits noticeable oscillations for the vertical motion. This
behaviour continues for over 10 seconds until the damping of the structure finally reduces the
oscillations to negligible levels.
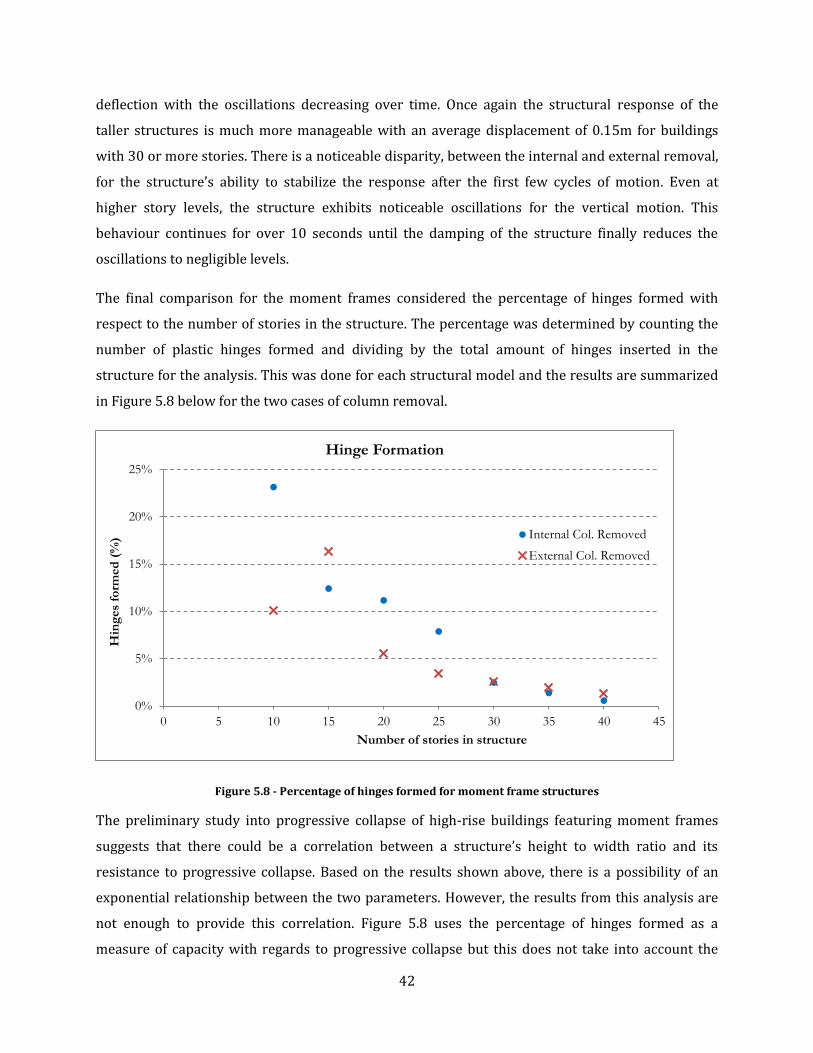
The final comparison for the moment frames considered the percentage of hinges formed with
respect to the number of stories in the structure. The percentage was determined by counting the
number of plastic hinges formed and dividing by the total amount of hinges inserted in the
structure for the analysis. This was done for each structural model and the results are summarized
in Figure 5.8 below for the two cases of column removal.
Figure 5.8 - Percentage of hinges formed for moment frame structures
The preliminary study into progressive collapse of high-rise buildings featuring moment frames
suggests that there could be a correlation between a structure’s height to width ratio and its
resistance to progressive collapse. Based on the results shown above, there is a possibility of an
exponential relationship between the two parameters. However, the results from this analysis are
not enough to provide this correlation. Figure 5.8 uses the percentage of hinges formed as a
measure of capacity with regards to progressive collapse but this does not take into account the
0%
5%
10%
15%
20%
25%
0 5 10 15 20 25 30 35 40 45
Hin
ges
form
ed
(%
)
Number of stories in structure
Hinge Formation
Internal Col. Removed
External Col. Removed

43
severity of the hinges that have formed. The analysis for this paper also maintained a constant
width and number of bays for each building. Similar research would need to be conducted on a
variety of building parameters and dimensions to provide a valid data set for the correlation
between the two factors.
5.3 Braced Frames with Outriggers
The second structural system which was focused on was a braced frame system with outriggers and
various levels that provide lateral support for the building. The structural models used for analysis
feature a hybrid structural system where the braces are pin connected in the structure while the
remainder of the beams to column connection are maintained as fixed connections. This effectively
made the structural system a braced moment frame for the purpose of progressive collapse
analysis. Figure 5.9 illustrates the results for the internal column removal of this type of structural
system.
Figure 5.9 - Internal column removal for braced frames with outriggers
10 stories 20 stories 30 stories 40 stories

44
The structural behaviour of the braced frame models demonstrated poor performance at lower
building heights while the capacity grew as the number of stories increased. The 10 story model
exhibited complete failure of the hinges above the location of the removal. The remainder of the
models managed to stabilize under internal column removal, however, all of them contained hinge
failure in at least one brace location of the building. The reason for this is that the force that is
redistributed from the local failure is much larger than what typical lateral braces are designed for.
The deflections for braced frames with outriggers are summarized in Figure 5.10 below.
Figure 5.10 - Braced frame deflections for internal column removal
The deflections for the models are fairly stable for 20 stories and higher while the 10 story model
shows signs of progressive collapse similar to the indications provided by Figure 5.9. The models
that managed to stabilize demonstrate much lower deflection values in comparison to the
equivalent story heights for moment frames. Based on the UFC criteria, the braced frames appear to
perform slightly better in comparison to moment frames as the number of critical hinges formed in
the structure is lower for the braced frame structures.
The external column removal was also conducted for the braced frame structural system with the
results summarized in Figure 5.11.
-0.9
-0.8
-0.7
-0.6
-0.5
-0.4
-0.3
-0.2
-0.1
0
0 0.5 1 1.5 2 2.5 3 3.5 4 4.5 5
Defl
ecti
on
(m
)
Time (s)
Deflections Caused by Internal Column Removal
40S
30S
20S
10S

45
The performance for the external column removal follows a similar pattern to the internal removal.
Shorter building heights provided conditions that failed to stabilize with the continuous formation
of hinges throughout the structure. Both models exhibit complete hinge failures at brace, beam and
column locations. The taller buildings once again demonstrated resistance to progressive collapse
within the beams however the braces did develop braces that exceeded the acceptability limits for
progressive collapse. The design of these systems for progressive collapse could be feasible if more
consideration is given for the sizing of the braces and if continuity is maintained at the lower levels
of the building since these sections of the building exhibit the largest amount of hinge formation.
Looking at the deflections of the external column removal we get similar deflections values. The
graph in Figure 5.12 summarizes the structural response of the building for the removal of the
external column.
30 stories 40 stories 20 stories 10 stories
Figure 5.11 - External column removal for braced frames with outriggers

46
Figure 5.12 - Braced frame deflections for external column removal
The deflections of the 10 and 20 story models failed to stabilize as there is presence of hinge failure
in both models. The result of the higher story levels is similar to the internal column removal with
small oscillations continuing throughout the length of the analysis. Relating the deflections of the
braced frame to the moment frame we see that both cases of column removal produce similar
results.
An important factor to consider is that when comparing the braced frame to the moment frames,
the section sizes differ at the different tiers of the building. The most important of these section
sizes is the first tier, 10 floors from ground level, as this section is in the direct vicinity of the local
failure. These structural components will experience the largest amount of forces before it is
distributed into the rest of the structure. Comparing the 40 story model of the moment frame and
brace frame, the beam sizes are W33X130 and W30X90, respectively. The inclusion of braces for
lateral loads decreases the demand requirements for the beams. This means that the beam sizes for
braced frame systems will generally be smaller with less capacity in comparison moment frames.
This makes braced frames inherently weaker with regards to progressive collapse. Secondly,
braced frames typically do not feature moment connections in the direction of the lateral bracing
making the structural system lack the continuity required to resist progressive collapse. The results
-0.9
-0.8
-0.7
-0.6
-0.5
-0.4
-0.3
-0.2
-0.1
0
0 0.5 1 1.5 2 2.5 3 3.5 4 4.5 5
Delf
ecti
on
(m
)
Time (s)
Deflections Caused by External Column Removal
40S
30S
20S
10S

47
of this analysis signify the importance of incorporating moment connections for the first few stories
of a braced frame system for the development of resistance to progressive collapse. With this type
of hybrid model, with a moment frame at the lower levels and pin connected braced frame
throughout the floors above, the structure can be designed to be relatively resistant to progressive
collapse. This type of structural system would provide a manageable structural response to local
failure that may occur at the bottom floors of the building.
5.4 Truss Tube System
The final structural system that was analysed using the nonlinear dynamic procedure was the truss
tube system. This structural model once again featured a hybrid system where the beams and
columns were moment connected while all the connections to the brace were pinned. The braces in
this system serve as the main lateral support with each brace spanning 10 stories in height. The
final analysis procedure focused on two cases of local failure; internal and external column removal.
Figure 5.13 shows the results of the internal removal of the column.
Figure 5.13 - Internal column removal for truss tube system
10 stories 20 stories 30 stories 40 stories
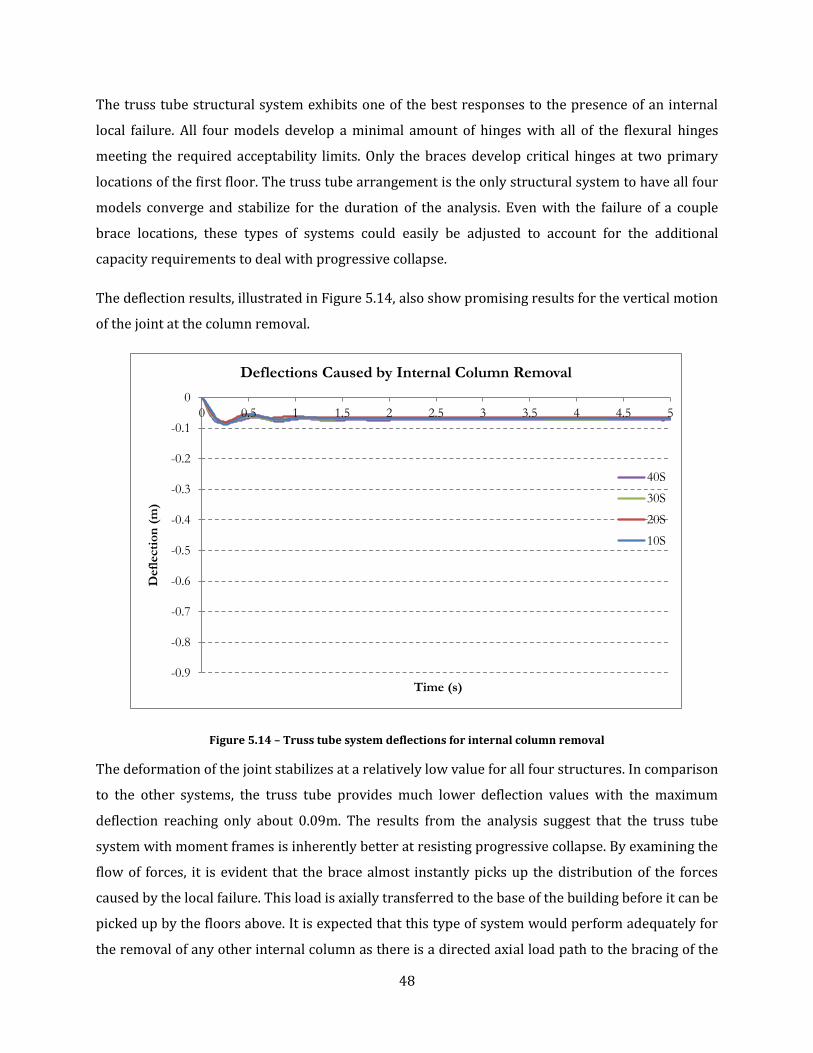
48
The truss tube structural system exhibits one of the best responses to the presence of an internal
local failure. All four models develop a minimal amount of hinges with all of the flexural hinges
meeting the required acceptability limits. Only the braces develop critical hinges at two primary
locations of the first floor. The truss tube arrangement is the only structural system to have all four
models converge and stabilize for the duration of the analysis. Even with the failure of a couple
brace locations, these types of systems could easily be adjusted to account for the additional
capacity requirements to deal with progressive collapse.
The deflection results, illustrated in Figure 5.14, also show promising results for the vertical motion
of the joint at the column removal.
Figure 5.14 – Truss tube system deflections for internal column removal
The deformation of the joint stabilizes at a relatively low value for all four structures. In comparison
to the other systems, the truss tube provides much lower deflection values with the maximum
deflection reaching only about 0.09m. The results from the analysis suggest that the truss tube
system with moment frames is inherently better at resisting progressive collapse. By examining the
flow of forces, it is evident that the brace almost instantly picks up the distribution of the forces
caused by the local failure. This load is axially transferred to the base of the building before it can be
picked up by the floors above. It is expected that this type of system would perform adequately for
the removal of any other internal column as there is a directed axial load path to the bracing of the
-0.9
-0.8
-0.7
-0.6
-0.5
-0.4
-0.3
-0.2
-0.1
0
0 0.5 1 1.5 2 2.5 3 3.5 4 4.5 5
Defl
ecti
on
(m
)
Time (s)
Deflections Caused by Internal Column Removal
40S
30S
20S
10S

49
building. The analysis was continued for the removal of an external column with the results
demonstrated in Figure 5.15 below.
The external column removal for the truss tube system provides a much different result from the
case of internal removal. All four models develop a substantial amount of hinge failures in beams,
columns as well as braces. The 10 story model appears to develop hinge failures at the top of the
structure as the load is transferred in tension up to the brace connection at the top of the building.
The failure of the brace at this location results in the transfer of this load into axial loads on the
beams and columns, ultimately resulting in the propagation of the failure. It appears that the lack of
a direct load path to the braces creates this instability in the model and vulnerability for
progressive collapse. The taller buildings also exhibit difficulty with adequately distributing the
force without causing the progression of hinge failures.
The deflections for this scenario, shown in Figure 5.16, also show the system’s inability to deal with
an external column removal.
10 stories 20 stories 30 stories 40 stories
Figure 5.15 - External column removal for truss tube system

50
Figure 5.16 - Truss tube system frame deflections for external column removal
All four models failed to stabilize in their motion as shown in the short deflection curves of the
graph above. The truss tube system proved to be less adequate at dealing with external column
removal in comparison to the other structural systems. It appears that the mechanism by which the
structure fails is highly dependent on the arrangement of the structure. The overall structural
system for these buildings is equivalent to a truss where the external column acts as the top and
bottom chords while the diagonals provide shear transfer. By removing a column at one of the
chord locations, we eliminate the structural performance of this truss system resulting in a
redistribution of forces that disrupts the rest of the system.
-0.9
-0.8
-0.7
-0.6
-0.5
-0.4
-0.3
-0.2
-0.1
0
0 0.5 1 1.5 2 2.5 3 3.5 4 4.5 5
Defl
ecti
on
(m
)
Time (s)
Deflections Caused by External Column Removal
40S
30S
20S
10S

51
6 Conclusions
The parametric study of progressive collapse for high-rise buildings has provided multiple
inferences for the performance of these buildings. Firstly, it is quite evident that the number of
stories in the building has a great impact on its ability to resist progressive collapse. As the number
of stories increase for a building, this creates the opportunity for the load to redistribute and
diminish to a level that is within the capacity of the structural components. The taller models for all
three structural systems were much more resistant to progressive collapse as fewer plastic hinges
were present in these models and the hinges that did form satisfied the acceptability limits.
The relationship between the percentage of hinges formed and number of stories was briefly
examined for moment frame structural systems. The results infer that there is a possibility of an
exponential correlation between the two factors as the number of hinges decrease dramatically
with an increase of stories in a building, however, the data set provided by this paper is not enough
to confirm this finding. Additional studies should be conducted with variable number of bays as
well as bay width spacing to provide more data on the relationship between the two factors.
The response of the braced frame structures provides similar results to the moment frames with
the main drawback being the hinge formation in the braces. This weakness in the braces can easily
be addressed and redesigned to meet the progressive collapse limits. It is important to note that
both the braced frame and truss tube structural systems used in this analysis are very specific and
there are many other variations of these systems used in practice. These types of systems will
typically not feature moment connections throughout the structure as portrayed in this paper. This
implies that both systems are inherently incapable of dealing with progressive collapse as there is a
lack of continuity in the structure. The purpose of the analysis in the paper was to illustrate how
these systems would function if a designer was to account for progressive collapse. Based on the
results presented, the systems could be modified to a hybrid frame where the bottom floors, which
are critical for the formation of plastic hinges, are moment connected and designed for local failure.
The remainder of the structure may feature a typical braced frame design that is optimized for
lateral loads and features pinned connections for the beams and columns. This type of efficient
system could provide enough stability and continuity in the structure for the resistance of
progressive collapse.
Lastly, the results of the 2D analysis show that tall buildings are fairly resilient with regards to local
failure within the structure. This type of analysis needs to be compared to more sophisticated 3D
52
models which would provide a more accurate representation of a buildings performance. It is
expected that the 3D models would provide better structural behaviour in comparison to the 2D
studies as the buildings may take advantage of two way action of load bearing components such as
the concrete slab within the building.

53
References
ASCE. (2007). Seismic Rehabilitation of Existing Buildings, ASCE/SEI 41-06. Reston: American Society of Civil Engineers.
ASCE. (2010). Minimum Design for Design Loads and Other Structures, ASCE 7-10. Reston: American Society of Civil Engineers.
CTBUH. (2014). Criteria for the Defining and Measuring of Tall Buildings. Retrieved April 14, 2014, from Council on Tall Buildings and Urban Habitat: http://www.ctbuh.org/LinkClick.aspx?fileticket=zvoB1S4nMug%3d&tabid=446&language=en-US
Department of Defense. (2009). Unified Facilities Criteria (UFC) Design of buildings to resist progressive collapse, UFC 4-023-03. Washington: United States Department of Defense.
Emporis GmbH. (2014). Building Standards. Retrieved April 15, 2014, from Emporis: http://www.emporis.com/building/standards/high-rise-building
Kokot, S., & Solomos, G. (2012). Progressive collapse risk analysis: literature review, construction standards and guidelines. Luxembourg: Publications Office of the European Union.
Krauthammer, T. (2002). Development of Progressive Collapse Analysis Procedure and Condition Assesment for Structures. State College: Protective Technology Center, Pennsylvania State University.
Kwasniewski, L. (2009). Nonlinear dynamic simulations of progressive collapse for a multistory building. Engineering Structures, 1223-1235.
McKay, A., Gomez, M., & Marchand, K. (2010). Non-Linear Dynamic Alternate Path Analysis for Progressive Collapse: Detailed Procedures Using UFC 4-023-03. Dripping Springs: Protection Engineering Consultants.
Meng-Hao, T., & Bing-Hui, L. (2009). Dynamic Amplification Factor for Progessive Collapse of an RC Building. The Structural Design of Tall and Special Buildings, 539-557.
Paz, M. (2003). Structural Dynamics, Theory and Computation. Norwell: Kluwer Academic Publishers.
Starossek, U. (2009). Progressive collapse of structures. London: Thomas Telford Limited.
Zils, J., & Viise, J. (2003). An Introduction to High-Rise Design. Structure Magazine, 12-16.

54
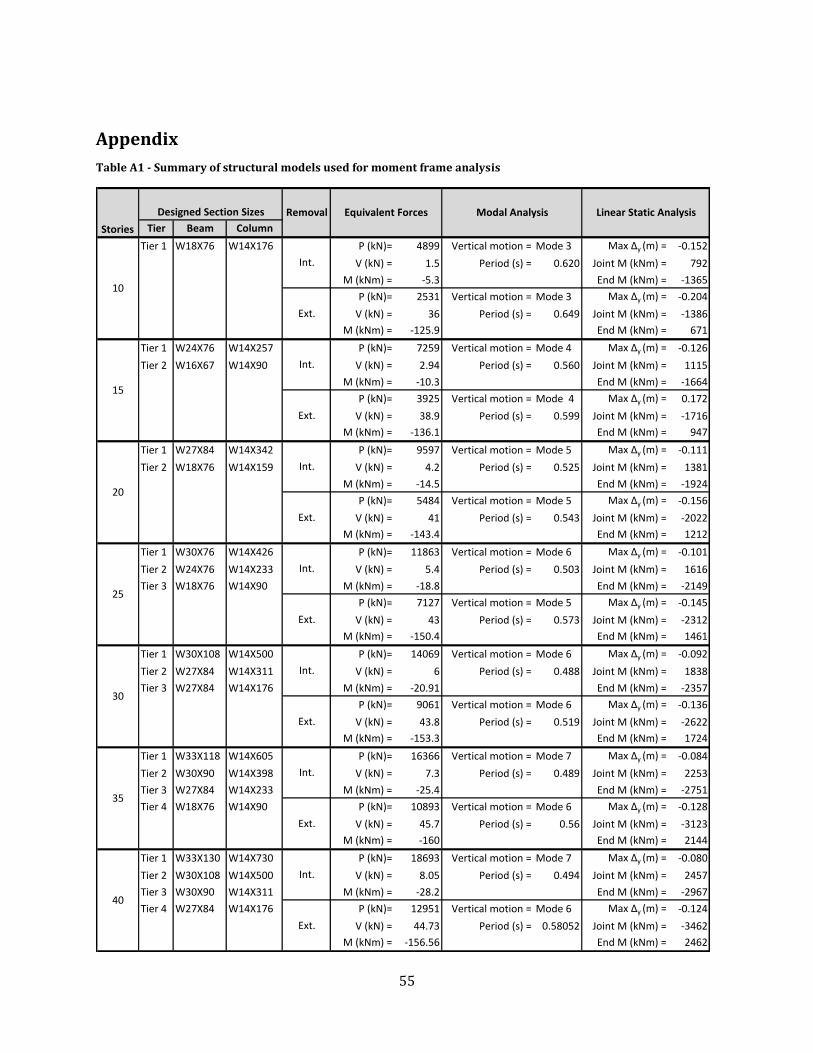
55
Appendix
Table A1 - Summary of structural models used for moment frame analysis
Tier Beam Column
Tier 1 W18X76 W14X176 P (kN)= 4899 Vertical motion = Mode 3 Max ∆y (m) = -0.152
V (kN) = 1.5 Period (s) = 0.620 Joint M (kNm) = 792
M (kNm) = -5.3 End M (kNm) = -1365
P (kN)= 2531 Vertical motion = Mode 3 Max ∆y (m) = -0.204
V (kN) = 36 Period (s) = 0.649 Joint M (kNm) = -1386
M (kNm) = -125.9 End M (kNm) = 671
Tier 1 W24X76 W14X257 P (kN)= 7259 Vertical motion = Mode 4 Max ∆y (m) = -0.126
Tier 2 W16X67 W14X90 V (kN) = 2.94 Period (s) = 0.560 Joint M (kNm) = 1115
M (kNm) = -10.3 End M (kNm) = -1664
P (kN)= 3925 Vertical motion = Mode 4 Max ∆y (m) = 0.172
V (kN) = 38.9 Period (s) = 0.599 Joint M (kNm) = -1716
M (kNm) = -136.1 End M (kNm) = 947
Tier 1 W27X84 W14X342 P (kN)= 9597 Vertical motion = Mode 5 Max ∆y (m) = -0.111
Tier 2 W18X76 W14X159 V (kN) = 4.2 Period (s) = 0.525 Joint M (kNm) = 1381
M (kNm) = -14.5 End M (kNm) = -1924
P (kN)= 5484 Vertical motion = Mode 5 Max ∆y (m) = -0.156
V (kN) = 41 Period (s) = 0.543 Joint M (kNm) = -2022
M (kNm) = -143.4 End M (kNm) = 1212
Tier 1 W30X76 W14X426 P (kN)= 11863 Vertical motion = Mode 6 Max ∆y (m) = -0.101
Tier 2 W24X76 W14X233 V (kN) = 5.4 Period (s) = 0.503 Joint M (kNm) = 1616
Tier 3 W18X76 W14X90 M (kNm) = -18.8 End M (kNm) = -2149
P (kN)= 7127 Vertical motion = Mode 5 Max ∆y (m) = -0.145
V (kN) = 43 Period (s) = 0.573 Joint M (kNm) = -2312
M (kNm) = -150.4 End M (kNm) = 1461
Tier 1 W30X108 W14X500 P (kN)= 14069 Vertical motion = Mode 6 Max ∆y (m) = -0.092
Tier 2 W27X84 W14X311 V (kN) = 6 Period (s) = 0.488 Joint M (kNm) = 1838
Tier 3 W27X84 W14X176 M (kNm) = -20.91 End M (kNm) = -2357
P (kN)= 9061 Vertical motion = Mode 6 Max ∆y (m) = -0.136
V (kN) = 43.8 Period (s) = 0.519 Joint M (kNm) = -2622
M (kNm) = -153.3 End M (kNm) = 1724
Tier 1 W33X118 W14X605 P (kN)= 16366 Vertical motion = Mode 7 Max ∆y (m) = -0.084
Tier 2 W30X90 W14X398 V (kN) = 7.3 Period (s) = 0.489 Joint M (kNm) = 2253
Tier 3 W27X84 W14X233 M (kNm) = -25.4 End M (kNm) = -2751
Tier 4 W18X76 W14X90 P (kN)= 10893 Vertical motion = Mode 6 Max ∆y (m) = -0.128
V (kN) = 45.7 Period (s) = 0.56 Joint M (kNm) = -3123
M (kNm) = -160 End M (kNm) = 2144
Tier 1 W33X130 W14X730 P (kN)= 18693 Vertical motion = Mode 7 Max ∆y (m) = -0.080
Tier 2 W30X108 W14X500 V (kN) = 8.05 Period (s) = 0.494 Joint M (kNm) = 2457
Tier 3 W30X90 W14X311 M (kNm) = -28.2 End M (kNm) = -2967
Tier 4 W27X84 W14X176 P (kN)= 12951 Vertical motion = Mode 6 Max ∆y (m) = -0.124
V (kN) = 44.73 Period (s) = 0.58052 Joint M (kNm) = -3462
M (kNm) = -156.56 End M (kNm) = 2462
40
Int.
Ext.
30
Int.
Ext.
35
Int.
Ext.
20
Int.
Ext.
25
Int.
Ext.
10
Int.
Ext.
15
Int.
Ext.
Stories
Designed Section Sizes Removal Equivalent Forces Modal Analysis Linear Static Analysis
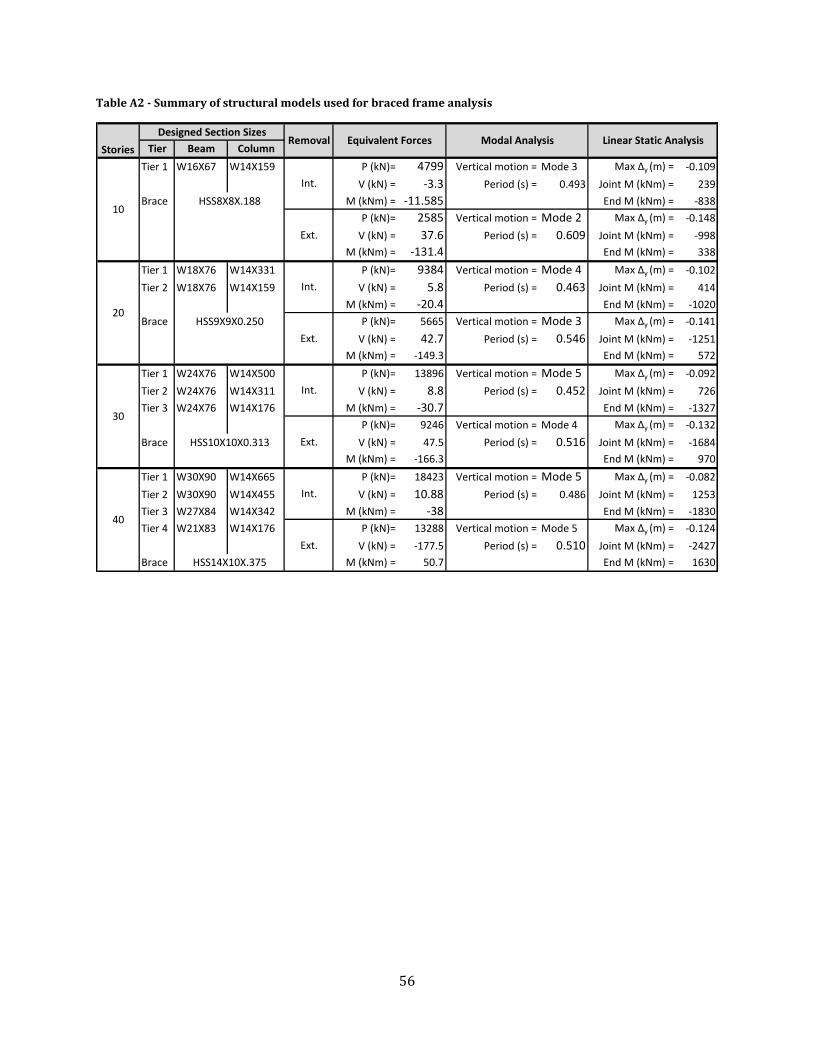
56
Table A2 - Summary of structural models used for braced frame analysis
Tier Beam Column
Tier 1 W16X67 W14X159 P (kN)= 4799 Vertical motion = Mode 3 Max ∆y (m) = -0.109
V (kN) = -3.3 Period (s) = 0.493 Joint M (kNm) = 239
Brace M (kNm) = -11.585 End M (kNm) = -838
P (kN)= 2585 Vertical motion = Mode 2 Max ∆y (m) = -0.148
V (kN) = 37.6 Period (s) = 0.609 Joint M (kNm) = -998
M (kNm) = -131.4 End M (kNm) = 338
Tier 1 W18X76 W14X331 P (kN)= 9384 Vertical motion = Mode 4 Max ∆y (m) = -0.102
Tier 2 W18X76 W14X159 V (kN) = 5.8 Period (s) = 0.463 Joint M (kNm) = 414
M (kNm) = -20.4 End M (kNm) = -1020
Brace P (kN)= 5665 Vertical motion = Mode 3 Max ∆y (m) = -0.141
V (kN) = 42.7 Period (s) = 0.546 Joint M (kNm) = -1251
M (kNm) = -149.3 End M (kNm) = 572
Tier 1 W24X76 W14X500 P (kN)= 13896 Vertical motion = Mode 5 Max ∆y (m) = -0.092
Tier 2 W24X76 W14X311 V (kN) = 8.8 Period (s) = 0.452 Joint M (kNm) = 726
Tier 3 W24X76 W14X176 M (kNm) = -30.7 End M (kNm) = -1327
P (kN)= 9246 Vertical motion = Mode 4 Max ∆y (m) = -0.132
Brace V (kN) = 47.5 Period (s) = 0.516 Joint M (kNm) = -1684
M (kNm) = -166.3 End M (kNm) = 970
Tier 1 W30X90 W14X665 P (kN)= 18423 Vertical motion = Mode 5 Max ∆y (m) = -0.082
Tier 2 W30X90 W14X455 V (kN) = 10.88 Period (s) = 0.486 Joint M (kNm) = 1253
Tier 3 W27X84 W14X342 M (kNm) = -38 End M (kNm) = -1830
Tier 4 W21X83 W14X176 P (kN)= 13288 Vertical motion = Mode 5 Max ∆y (m) = -0.124
V (kN) = -177.5 Period (s) = 0.510 Joint M (kNm) = -2427
Brace M (kNm) = 50.7 End M (kNm) = 1630
30
Int.
Ext.
40
Int.
Ext.
HSS14X10X.375
HSS10X10X0.313
10
Int.
Ext.
20
Int.
Ext.
HSS8X8X.188
HSS9X9X0.250
Stories
Designed Section SizesRemoval Equivalent Forces Modal Analysis Linear Static Analysis
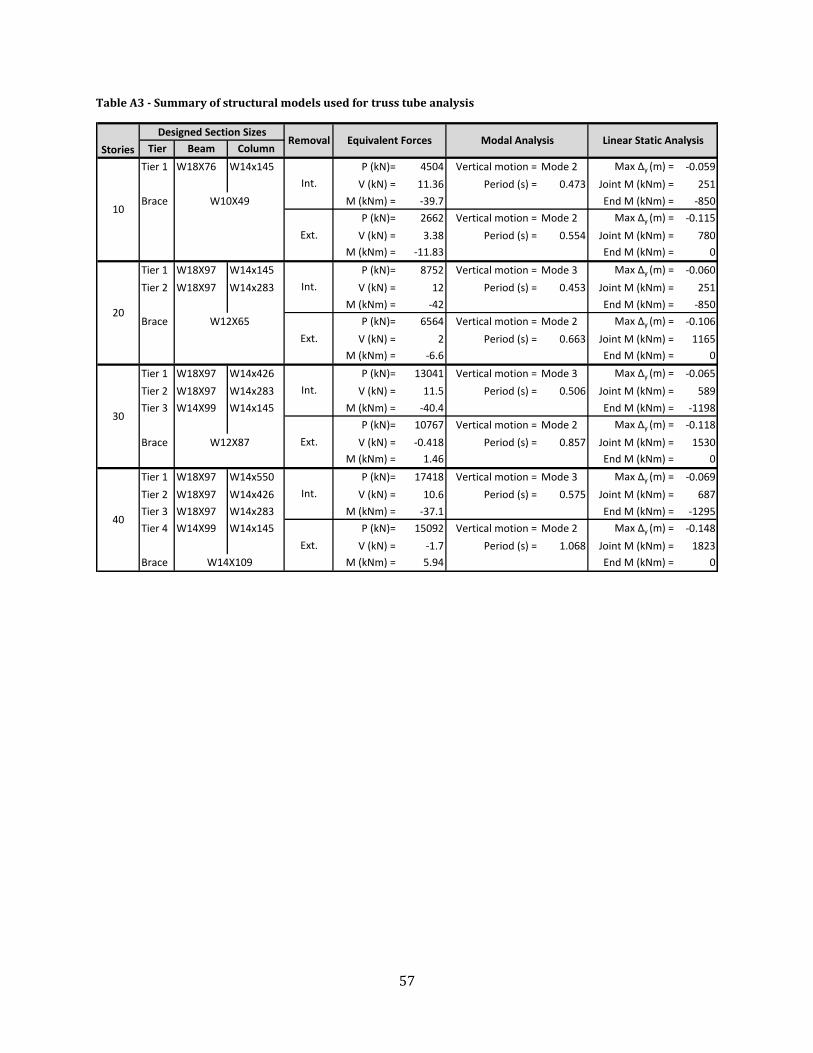
57
Table A3 - Summary of structural models used for truss tube analysis
Tier Beam Column
Tier 1 W18X76 W14x145 P (kN)= 4504 Vertical motion = Mode 2 Max ∆y (m) = -0.059
V (kN) = 11.36 Period (s) = 0.473 Joint M (kNm) = 251
Brace M (kNm) = -39.7 End M (kNm) = -850
P (kN)= 2662 Vertical motion = Mode 2 Max ∆y (m) = -0.115
V (kN) = 3.38 Period (s) = 0.554 Joint M (kNm) = 780
M (kNm) = -11.83 End M (kNm) = 0
Tier 1 W18X97 W14x145 P (kN)= 8752 Vertical motion = Mode 3 Max ∆y (m) = -0.060
Tier 2 W18X97 W14x283 V (kN) = 12 Period (s) = 0.453 Joint M (kNm) = 251
M (kNm) = -42 End M (kNm) = -850
Brace P (kN)= 6564 Vertical motion = Mode 2 Max ∆y (m) = -0.106
V (kN) = 2 Period (s) = 0.663 Joint M (kNm) = 1165
M (kNm) = -6.6 End M (kNm) = 0
Tier 1 W18X97 W14x426 P (kN)= 13041 Vertical motion = Mode 3 Max ∆y (m) = -0.065
Tier 2 W18X97 W14x283 V (kN) = 11.5 Period (s) = 0.506 Joint M (kNm) = 589
Tier 3 W14X99 W14x145 M (kNm) = -40.4 End M (kNm) = -1198
P (kN)= 10767 Vertical motion = Mode 2 Max ∆y (m) = -0.118
Brace V (kN) = -0.418 Period (s) = 0.857 Joint M (kNm) = 1530
M (kNm) = 1.46 End M (kNm) = 0
Tier 1 W18X97 W14x550 P (kN)= 17418 Vertical motion = Mode 3 Max ∆y (m) = -0.069
Tier 2 W18X97 W14x426 V (kN) = 10.6 Period (s) = 0.575 Joint M (kNm) = 687
Tier 3 W18X97 W14x283 M (kNm) = -37.1 End M (kNm) = -1295
Tier 4 W14X99 W14x145 P (kN)= 15092 Vertical motion = Mode 2 Max ∆y (m) = -0.148
V (kN) = -1.7 Period (s) = 1.068 Joint M (kNm) = 1823
Brace M (kNm) = 5.94 End M (kNm) = 0
30
Int.
Ext.W12X87
40
Int.
Ext.
W14X109
10
Int.
W10X49
Ext.
20
Int.
W12X65
Ext.
Stories
Designed Section SizesRemoval Equivalent Forces Modal Analysis Linear Static Analysis
Related Documents