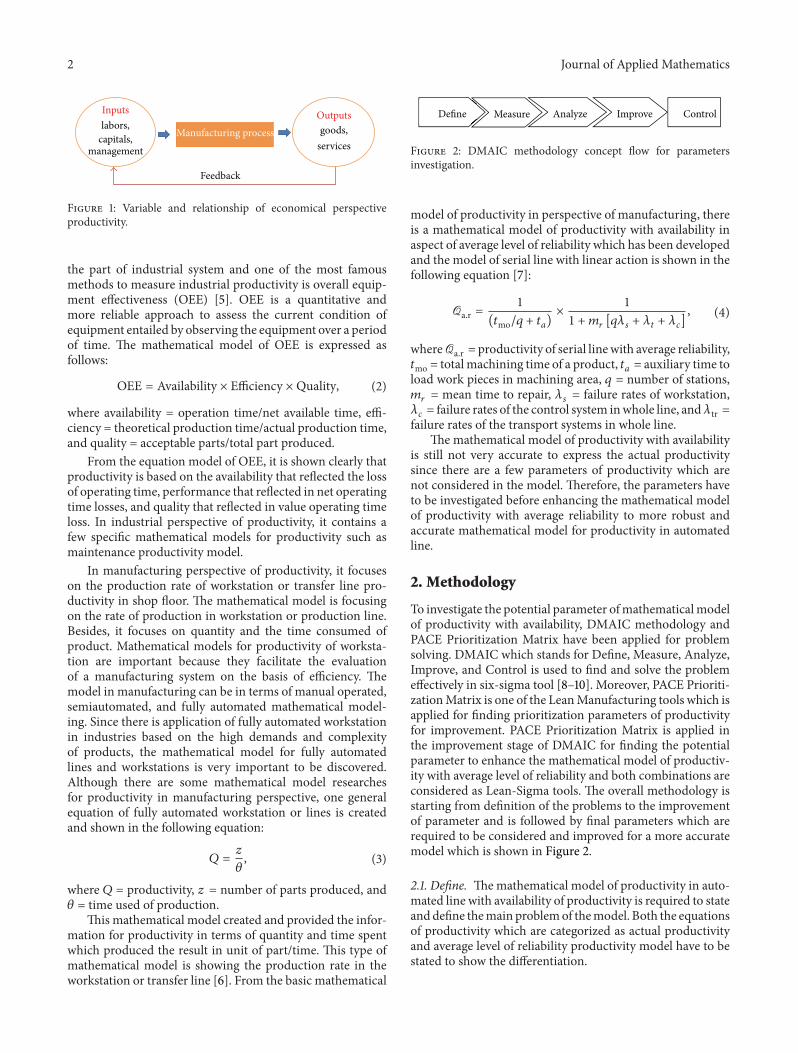
Research Article Parameters Investigation of Mathematical Model of Productivity for Automated Line with Availability by DMAIC Methodology Tan Chan Sin, Ryspek Usubamatov, Mohd Fidzwan B. Md. Amin Hamzas, Low Kin Wai, Teh Keat Yao, and Muhammad Syahril Bahari School of Manufacturing Engineering, Universiti Malaysia Perlis, 02600 Arau, Perlis, Malaysia Correspondence should be addressed to Tan Chan Sin; [email protected] Received 17 March 2014; Accepted 10 August 2014; Published 3 November 2014 Academic Editor: Livija Cveticanin Copyright © 2014 Tan Chan Sin et al. is is an open access article distributed under the Creative Commons Attribution License, which permits unrestricted use, distribution, and reproduction in any medium, provided the original work is properly cited. Automated line is widely applied in industry especially for mass production with less variety product. Productivity is one of the important criteria in automated line as well as industry which directly present the outputs and profits. Forecast of productivity in industry accurately in order to achieve the customer demand and the forecast result is calculated by using mathematical model. Mathematical model of productivity with availability for automated line has been introduced to express the productivity in terms of single level of reliability for stations and mechanisms. Since this mathematical model of productivity with availability cannot achieve close enough productivity compared to actual one due to lack of parameters consideration, the enhancement of mathematical model is required to consider and add the loss parameters that is not considered in current model. is paper presents the investigation parameters of productivity losses investigated by using DMAIC (Define, Measure, Analyze, Improve, and Control) concept and PACE Prioritization Matrix (Priority, Action, Consider, and Eliminate). e investigated parameters are important for further improvement of mathematical model of productivity with availability to develop robust mathematical model of productivity in automated line. 1. Introduction Productivity is considered as an important indicator to show the performance in an industry [1]. Since the productivity criteria play an important role in real industry sector, there are several methods or assessments to express or present the productivity. Productivity can be expressed in different phases regarding six ways which are differences of concepts, model variables, calculation order, theoretical framework, accounting technique, and adjustability of the model [2]. From the overview of the research in the productivity area, overall productivity can be categorized into three perspec- tives which are economic, industrial, and manufacturing perspective. In the economic perspective, productivity is defined as the ratio of outputs (goods and services) divided by the inputs (resources such as labor and capital) [3]. e definition of productivity is clearly shown in Figure 1. From Figure 1, the general mathematical model of pro- ductivity in economical aspect is Productivity = Output Produced Input Used . (1) Based on the principal of economy, the primary purpose is underlying the satisfaction of human needs. ere are two main activities concerned in productivity which are production and consumption [4]. Production stands for production input and output while consumption is focusing on the usage of manufacturing organization. Productivity in the economic aspect is focusing on few variables which are cost, quality, and quantity. e second category of productivity is industrial perspec- tive productivity. ere is requirement for more assessment in terms of technology criteria when compared to economical productivity which is more focusing on the profit and cost only. Industrial productivity is assessing the performance of Hindawi Publishing Corporation Journal of Applied Mathematics Volume 2014, Article ID 206717, 7 pages http://dx.doi.org/10.1155/2014/206717

Welcome message from author
This document is posted to help you gain knowledge. Please leave a comment to let me know what you think about it! Share it to your friends and learn new things together.
Transcript
Research ArticleParameters Investigation of Mathematical Model of Productivityfor Automated Line with Availability by DMAIC Methodology
Tan Chan Sin, Ryspek Usubamatov, Mohd Fidzwan B. Md. Amin Hamzas, Low Kin Wai,Teh Keat Yao, and Muhammad Syahril Bahari
School of Manufacturing Engineering, Universiti Malaysia Perlis, 02600 Arau, Perlis, Malaysia
Correspondence should be addressed to Tan Chan Sin; [email protected]
Received 17 March 2014; Accepted 10 August 2014; Published 3 November 2014
Academic Editor: Livija Cveticanin
Copyright © 2014 Tan Chan Sin et al. This is an open access article distributed under the Creative Commons Attribution License,which permits unrestricted use, distribution, and reproduction in any medium, provided the original work is properly cited.
Automated line is widely applied in industry especially for mass production with less variety product. Productivity is one of theimportant criteria in automated line as well as industry which directly present the outputs and profits. Forecast of productivity inindustry accurately in order to achieve the customer demand and the forecast result is calculated by using mathematical model.Mathematical model of productivity with availability for automated line has been introduced to express the productivity in terms ofsingle level of reliability for stations andmechanisms. Since thismathematicalmodel of productivity with availability cannot achieveclose enough productivity compared to actual one due to lack of parameters consideration, the enhancement ofmathematicalmodelis required to consider and add the loss parameters that is not considered in current model. This paper presents the investigationparameters of productivity losses investigated by using DMAIC (Define, Measure, Analyze, Improve, and Control) concept andPACE Prioritization Matrix (Priority, Action, Consider, and Eliminate). The investigated parameters are important for furtherimprovement of mathematical model of productivity with availability to develop robust mathematical model of productivity inautomated line.
1. Introduction
Productivity is considered as an important indicator to showthe performance in an industry [1]. Since the productivitycriteria play an important role in real industry sector, thereare several methods or assessments to express or presentthe productivity. Productivity can be expressed in differentphases regarding six ways which are differences of concepts,model variables, calculation order, theoretical framework,accounting technique, and adjustability of the model [2].From the overview of the research in the productivity area,overall productivity can be categorized into three perspec-tives which are economic, industrial, and manufacturingperspective.
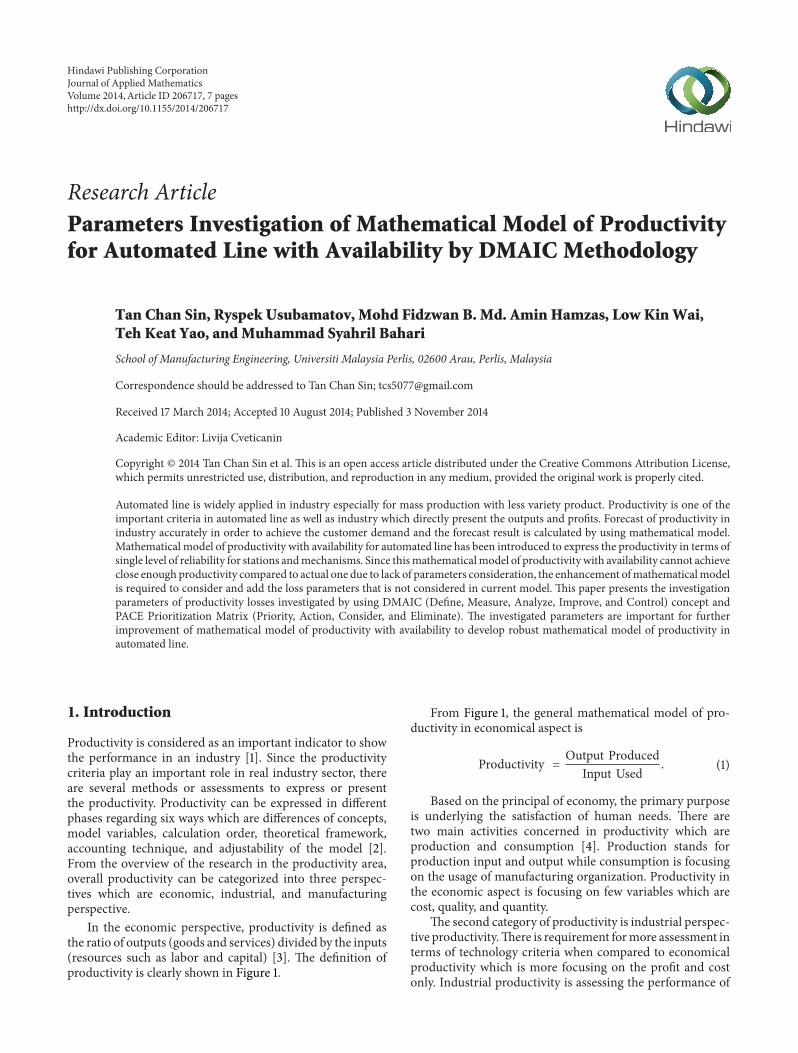
In the economic perspective, productivity is defined asthe ratio of outputs (goods and services) divided by the inputs(resources such as labor and capital) [3]. The definition ofproductivity is clearly shown in Figure 1.
From Figure 1, the general mathematical model of pro-ductivity in economical aspect is
Productivity = Output ProducedInput Used
. (1)
Based on the principal of economy, the primary purposeis underlying the satisfaction of human needs. There aretwo main activities concerned in productivity which areproduction and consumption [4]. Production stands forproduction input and output while consumption is focusingon the usage of manufacturing organization. Productivity inthe economic aspect is focusing on few variables which arecost, quality, and quantity.
The second category of productivity is industrial perspec-tive productivity.There is requirement formore assessment interms of technology criteria when compared to economicalproductivity which is more focusing on the profit and costonly. Industrial productivity is assessing the performance of
Hindawi Publishing CorporationJournal of Applied MathematicsVolume 2014, Article ID 206717, 7 pageshttp://dx.doi.org/10.1155/2014/206717
2 Journal of Applied Mathematics
Inputslabors,
capitals,management
Manufacturing process
Feedback
Outputsgoods,
services
Figure 1: Variable and relationship of economical perspectiveproductivity.
the part of industrial system and one of the most famousmethods to measure industrial productivity is overall equip-ment effectiveness (OEE) [5]. OEE is a quantitative andmore reliable approach to assess the current condition ofequipment entailed by observing the equipment over a periodof time. The mathematical model of OEE is expressed asfollows:
OEE = Availability × Efficiency ×Quality, (2)
where availability = operation time/net available time, effi-ciency = theoretical production time/actual production time,and quality = acceptable parts/total part produced.
From the equation model of OEE, it is shown clearly thatproductivity is based on the availability that reflected the lossof operating time, performance that reflected in net operatingtime losses, and quality that reflected in value operating timeloss. In industrial perspective of productivity, it contains afew specific mathematical models for productivity such asmaintenance productivity model.
In manufacturing perspective of productivity, it focuseson the production rate of workstation or transfer line pro-ductivity in shop floor. The mathematical model is focusingon the rate of production in workstation or production line.Besides, it focuses on quantity and the time consumed ofproduct. Mathematical models for productivity of worksta-tion are important because they facilitate the evaluationof a manufacturing system on the basis of efficiency. Themodel in manufacturing can be in terms of manual operated,semiautomated, and fully automated mathematical model-ing. Since there is application of fully automated workstationin industries based on the high demands and complexityof products, the mathematical model for fully automatedlines and workstations is very important to be discovered.Although there are some mathematical model researchesfor productivity in manufacturing perspective, one generalequation of fully automated workstation or lines is createdand shown in the following equation:
𝑄 =
𝑧
𝜃
, (3)
where 𝑄 = productivity, 𝑧 = number of parts produced, and𝜃 = time used of production.
This mathematical model created and provided the infor-mation for productivity in terms of quantity and time spentwhich produced the result in unit of part/time. This type ofmathematical model is showing the production rate in theworkstation or transfer line [6]. From the basic mathematical
Define Measure Analyze Improve Control
Figure 2: DMAIC methodology concept flow for parametersinvestigation.
model of productivity in perspective of manufacturing, thereis a mathematical model of productivity with availability inaspect of average level of reliability which has been developedand the model of serial line with linear action is shown in thefollowing equation [7]:
Qa.r =1
(𝑡mo/𝑞 + 𝑡𝑎)×
1
1 + 𝑚𝑟
[𝑞𝜆𝑠
+ 𝜆𝑡
+ 𝜆𝑐
]
, (4)
whereQa.r = productivity of serial linewith average reliability,𝑡mo = totalmachining time of a product, 𝑡
𝑎
= auxiliary time toload work pieces in machining area, 𝑞 = number of stations,𝑚𝑟
= mean time to repair, 𝜆𝑠
= failure rates of workstation,𝜆𝑐
= failure rates of the control system inwhole line, and𝜆tr =failure rates of the transport systems in whole line.
The mathematical model of productivity with availabilityis still not very accurate to express the actual productivitysince there are a few parameters of productivity which arenot considered in the model. Therefore, the parameters haveto be investigated before enhancing the mathematical modelof productivity with average reliability to more robust andaccurate mathematical model for productivity in automatedline.
2. Methodology
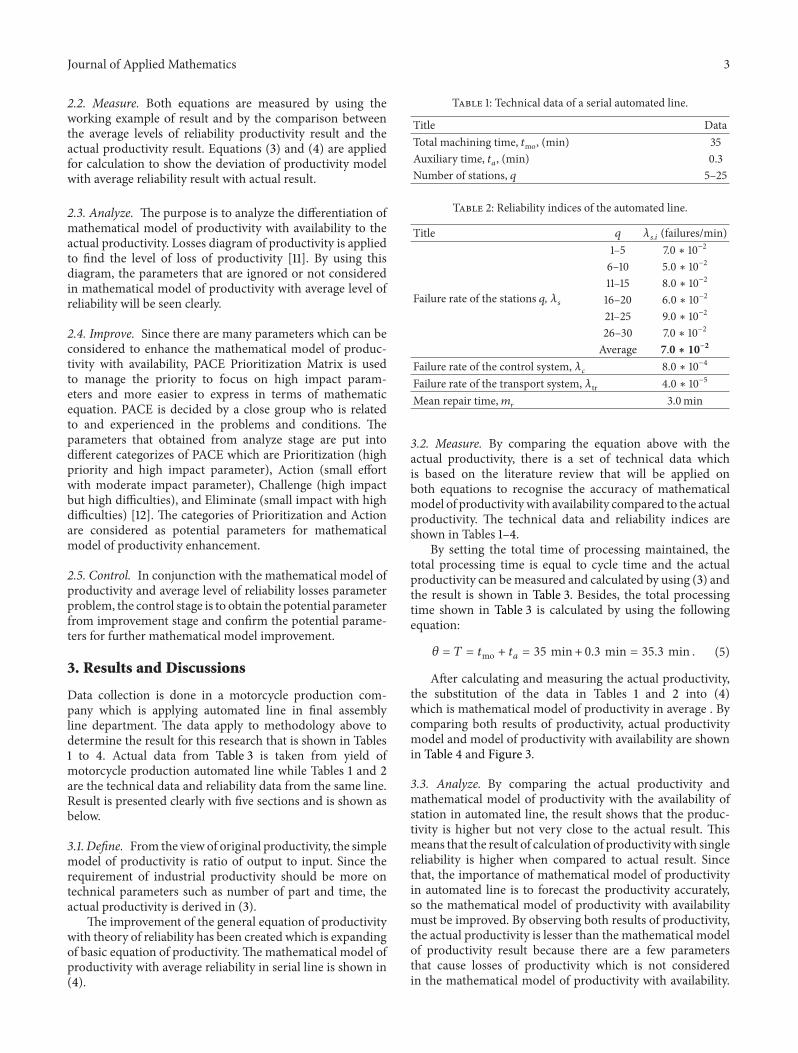
To investigate the potential parameter ofmathematicalmodelof productivity with availability, DMAIC methodology andPACE Prioritization Matrix have been applied for problemsolving. DMAIC which stands for Define, Measure, Analyze,Improve, and Control is used to find and solve the problemeffectively in six-sigma tool [8–10]. Moreover, PACE Prioriti-zationMatrix is one of the LeanManufacturing tools which isapplied for finding prioritization parameters of productivityfor improvement. PACE Prioritization Matrix is applied inthe improvement stage of DMAIC for finding the potentialparameter to enhance the mathematical model of productiv-ity with average level of reliability and both combinations areconsidered as Lean-Sigma tools. The overall methodology isstarting from definition of the problems to the improvementof parameter and is followed by final parameters which arerequired to be considered and improved for a more accuratemodel which is shown in Figure 2.
2.1. Define. Themathematical model of productivity in auto-mated line with availability of productivity is required to stateanddefine themain problemof themodel. Both the equationsof productivity which are categorized as actual productivityand average level of reliability productivity model have to bestated to show the differentiation.
Journal of Applied Mathematics 3
2.2. Measure. Both equations are measured by using theworking example of result and by the comparison betweenthe average levels of reliability productivity result and theactual productivity result. Equations (3) and (4) are appliedfor calculation to show the deviation of productivity modelwith average reliability result with actual result.
2.3. Analyze. The purpose is to analyze the differentiation ofmathematical model of productivity with availability to theactual productivity. Losses diagram of productivity is appliedto find the level of loss of productivity [11]. By using thisdiagram, the parameters that are ignored or not consideredin mathematical model of productivity with average level ofreliability will be seen clearly.
2.4. Improve. Since there are many parameters which can beconsidered to enhance the mathematical model of produc-tivity with availability, PACE Prioritization Matrix is usedto manage the priority to focus on high impact param-eters and more easier to express in terms of mathematicequation. PACE is decided by a close group who is relatedto and experienced in the problems and conditions. Theparameters that obtained from analyze stage are put intodifferent categorizes of PACE which are Prioritization (highpriority and high impact parameter), Action (small effortwith moderate impact parameter), Challenge (high impactbut high difficulties), and Eliminate (small impact with highdifficulties) [12]. The categories of Prioritization and Actionare considered as potential parameters for mathematicalmodel of productivity enhancement.
2.5. Control. In conjunction with the mathematical model ofproductivity and average level of reliability losses parameterproblem, the control stage is to obtain the potential parameterfrom improvement stage and confirm the potential parame-ters for further mathematical model improvement.
3. Results and Discussions
Data collection is done in a motorcycle production com-pany which is applying automated line in final assemblyline department. The data apply to methodology above todetermine the result for this research that is shown in Tables1 to 4. Actual data from Table 3 is taken from yield ofmotorcycle production automated line while Tables 1 and 2are the technical data and reliability data from the same line.Result is presented clearly with five sections and is shown asbelow.
3.1. Define. From the view of original productivity, the simplemodel of productivity is ratio of output to input. Since therequirement of industrial productivity should be more ontechnical parameters such as number of part and time, theactual productivity is derived in (3).
The improvement of the general equation of productivitywith theory of reliability has been created which is expandingof basic equation of productivity.The mathematical model ofproductivity with average reliability in serial line is shown in(4).
Table 1: Technical data of a serial automated line.
Title DataTotal machining time, 𝑡mo, (min) 35Auxiliary time, 𝑡
𝑎
, (min) 0.3Number of stations, 𝑞 5–25
Table 2: Reliability indices of the automated line.
Title 𝑞 𝜆𝑠.𝑖
(failures/min)
Failure rate of the stations 𝑞, 𝜆𝑠
1–5 7.0 ∗ 10−2
6–10 5.0 ∗ 10−2
11–15 8.0 ∗ 10−2
16–20 6.0 ∗ 10−2
21–25 9.0 ∗ 10−2
26–30 7.0 ∗ 10−2
Average 7.0 ∗ 10−2
Failure rate of the control system, 𝜆𝑐
8.0 ∗ 10−4
Failure rate of the transport system, 𝜆tr 4.0 ∗ 10−5
Mean repair time,𝑚𝑟
3.0min
3.2. Measure. By comparing the equation above with theactual productivity, there is a set of technical data whichis based on the literature review that will be applied onboth equations to recognise the accuracy of mathematicalmodel of productivitywith availability compared to the actualproductivity. The technical data and reliability indices areshown in Tables 1–4.
By setting the total time of processing maintained, thetotal processing time is equal to cycle time and the actualproductivity can bemeasured and calculated by using (3) andthe result is shown in Table 3. Besides, the total processingtime shown in Table 3 is calculated by using the followingequation:
𝜃 = 𝑇 = 𝑡mo + 𝑡𝑎 = 35 min+ 0.3 min = 35.3 min . (5)
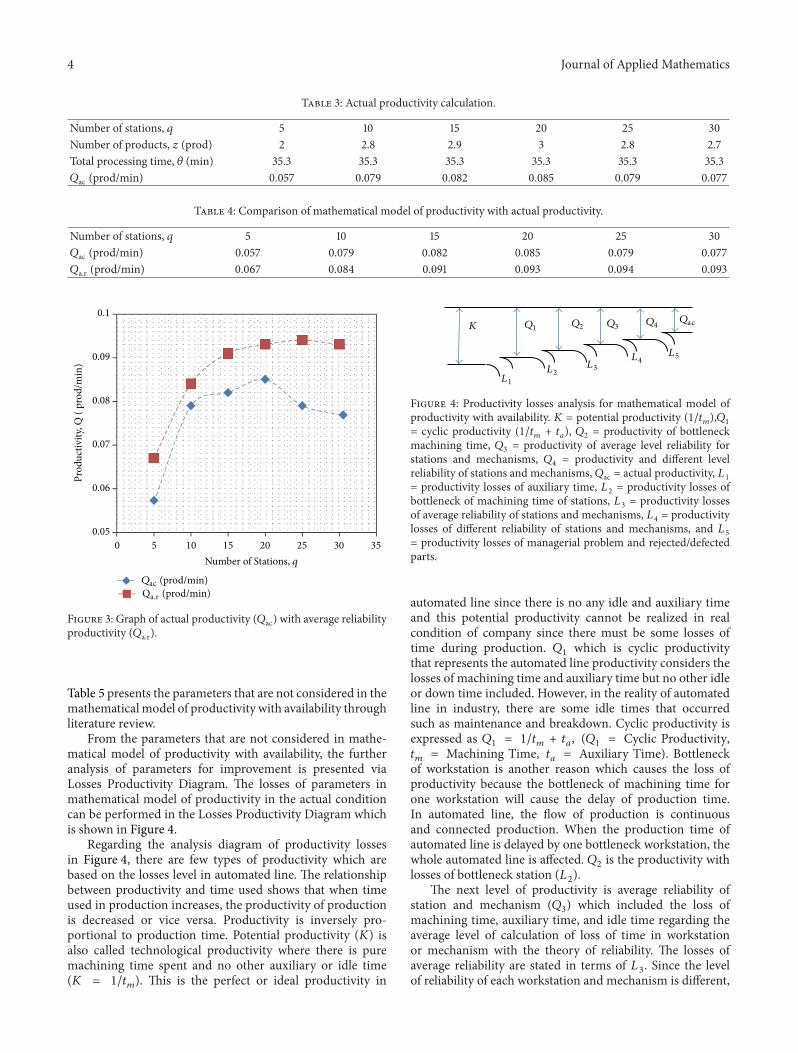
After calculating and measuring the actual productivity,the substitution of the data in Tables 1 and 2 into (4)which is mathematical model of productivity in average . Bycomparing both results of productivity, actual productivitymodel and model of productivity with availability are shownin Table 4 and Figure 3.
3.3. Analyze. By comparing the actual productivity andmathematical model of productivity with the availability ofstation in automated line, the result shows that the produc-tivity is higher but not very close to the actual result. Thismeans that the result of calculation of productivitywith singlereliability is higher when compared to actual result. Sincethat, the importance of mathematical model of productivityin automated line is to forecast the productivity accurately,so the mathematical model of productivity with availabilitymust be improved. By observing both results of productivity,the actual productivity is lesser than the mathematical modelof productivity result because there are a few parametersthat cause losses of productivity which is not consideredin the mathematical model of productivity with availability.
4 Journal of Applied Mathematics
Table 3: Actual productivity calculation.
Number of stations, 𝑞 5 10 15 20 25 30Number of products, 𝑧 (prod) 2 2.8 2.9 3 2.8 2.7Total processing time, 𝜃 (min) 35.3 35.3 35.3 35.3 35.3 35.3𝑄ac (prod/min) 0.057 0.079 0.082 0.085 0.079 0.077
Table 4: Comparison of mathematical model of productivity with actual productivity.
Number of stations, 𝑞 5 10 15 20 25 30𝑄ac (prod/min) 0.057 0.079 0.082 0.085 0.079 0.077𝑄a.r (prod/min) 0.067 0.084 0.091 0.093 0.094 0.093
0.05
0.06
0.07
0.08
0.09
0.1
0 5 10 15 20 25 30 35
Prod
uctiv
ity, Q
( pr
od/m
in)
Number of Stations, q
Qac (prod/min)Qa.r (prod/min)
Figure 3: Graph of actual productivity (𝑄ac) with average reliabilityproductivity (𝑄a.r).
Table 5 presents the parameters that are not considered in themathematicalmodel of productivity with availability throughliterature review.
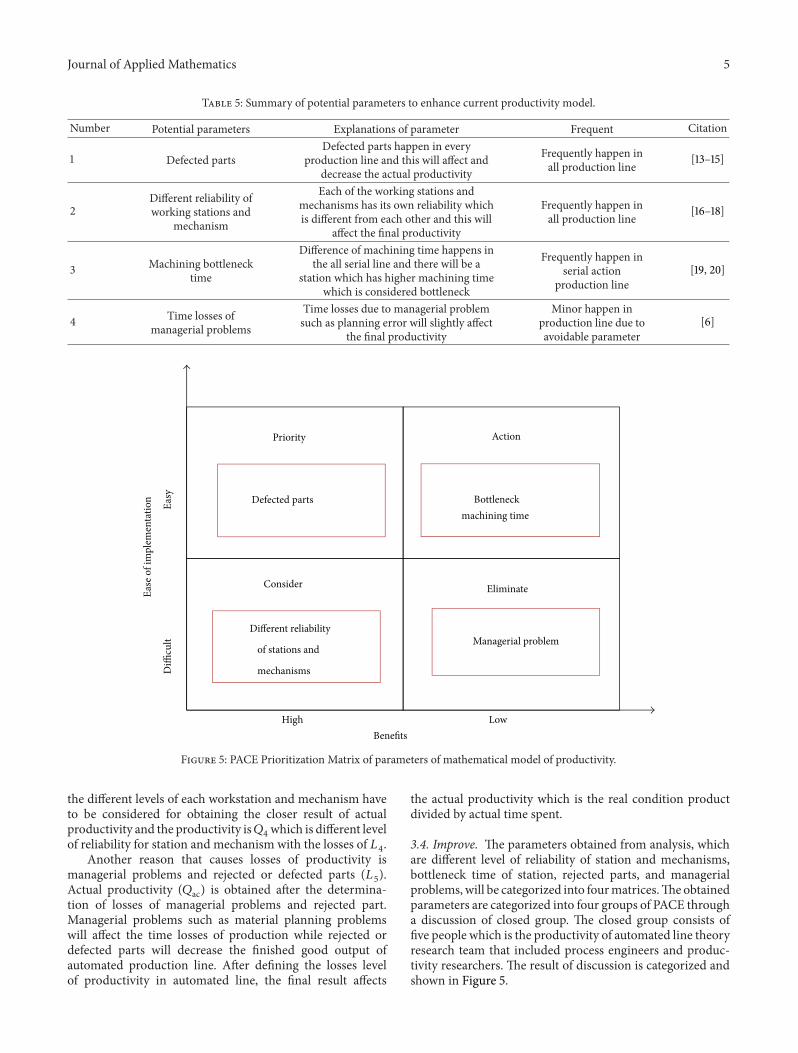
From the parameters that are not considered in mathe-matical model of productivity with availability, the furtheranalysis of parameters for improvement is presented viaLosses Productivity Diagram. The losses of parameters inmathematical model of productivity in the actual conditioncan be performed in the Losses Productivity Diagram whichis shown in Figure 4.
Regarding the analysis diagram of productivity lossesin Figure 4, there are few types of productivity which arebased on the losses level in automated line. The relationshipbetween productivity and time used shows that when timeused in production increases, the productivity of productionis decreased or vice versa. Productivity is inversely pro-portional to production time. Potential productivity (𝐾) isalso called technological productivity where there is puremachining time spent and no other auxiliary or idle time(𝐾 = 1/𝑡
𝑚
). This is the perfect or ideal productivity in
K Q1 Q2 Q3Q4
L1
L2L3
L4L5
Qac
Figure 4: Productivity losses analysis for mathematical model ofproductivity with availability. 𝐾 = potential productivity (1/𝑡
𝑚
),𝑄1
= cyclic productivity (1/𝑡𝑚
+ 𝑡𝑎
), 𝑄2
= productivity of bottleneckmachining time, 𝑄
3
= productivity of average level reliability forstations and mechanisms, 𝑄
4
= productivity and different levelreliability of stations and mechanisms, 𝑄ac = actual productivity, 𝐿
1
= productivity losses of auxiliary time, 𝐿2
= productivity losses ofbottleneck of machining time of stations, 𝐿
3
= productivity lossesof average reliability of stations and mechanisms, 𝐿
4
= productivitylosses of different reliability of stations and mechanisms, and 𝐿
5
= productivity losses of managerial problem and rejected/defectedparts.
automated line since there is no any idle and auxiliary timeand this potential productivity cannot be realized in realcondition of company since there must be some losses oftime during production. 𝑄
1
which is cyclic productivitythat represents the automated line productivity considers thelosses of machining time and auxiliary time but no other idleor down time included. However, in the reality of automatedline in industry, there are some idle times that occurredsuch as maintenance and breakdown. Cyclic productivity isexpressed as 𝑄
1
= 1/𝑡𝑚
+ 𝑡𝑎
, (𝑄1
= Cyclic Productivity,𝑡𝑚
= Machining Time, 𝑡𝑎
= Auxiliary Time). Bottleneckof workstation is another reason which causes the loss ofproductivity because the bottleneck of machining time forone workstation will cause the delay of production time.In automated line, the flow of production is continuousand connected production. When the production time ofautomated line is delayed by one bottleneck workstation, thewhole automated line is affected. 𝑄
2
is the productivity withlosses of bottleneck station (𝐿
2
).The next level of productivity is average reliability of
station and mechanism (𝑄3
) which included the loss ofmachining time, auxiliary time, and idle time regarding theaverage level of calculation of loss of time in workstationor mechanism with the theory of reliability. The losses ofaverage reliability are stated in terms of 𝐿
3
. Since the levelof reliability of each workstation and mechanism is different,
Journal of Applied Mathematics 5
Table 5: Summary of potential parameters to enhance current productivity model.
Number Potential parameters Explanations of parameter Frequent Citation
1 Defected partsDefected parts happen in every
production line and this will affect anddecrease the actual productivity
Frequently happen inall production line [13–15]
2Different reliability ofworking stations and
mechanism
Each of the working stations andmechanisms has its own reliability whichis different from each other and this will
affect the final productivity
Frequently happen inall production line [16–18]
3 Machining bottlenecktime
Difference of machining time happens inthe all serial line and there will be a
station which has higher machining timewhich is considered bottleneck
Frequently happen inserial action
production line[19, 20]
4 Time losses ofmanagerial problems
Time losses due to managerial problemsuch as planning error will slightly affect
the final productivity
Minor happen inproduction line due toavoidable parameter
[6]
Ease
of i
mpl
emen
tatio
n
Diffi
cult
Easy
High Low
Priority Action
Consider Eliminate
Defected parts Bottleneckmachining time
Different reliability
of stations and
mechanisms
Managerial problem
Benefits
Figure 5: PACE Prioritization Matrix of parameters of mathematical model of productivity.
the different levels of each workstation and mechanism haveto be considered for obtaining the closer result of actualproductivity and the productivity is𝑄
4
which is different levelof reliability for station and mechanism with the losses of 𝐿
4
.Another reason that causes losses of productivity is
managerial problems and rejected or defected parts (𝐿5
).Actual productivity (𝑄ac) is obtained after the determina-tion of losses of managerial problems and rejected part.Managerial problems such as material planning problemswill affect the time losses of production while rejected ordefected parts will decrease the finished good output ofautomated production line. After defining the losses levelof productivity in automated line, the final result affects
the actual productivity which is the real condition productdivided by actual time spent.
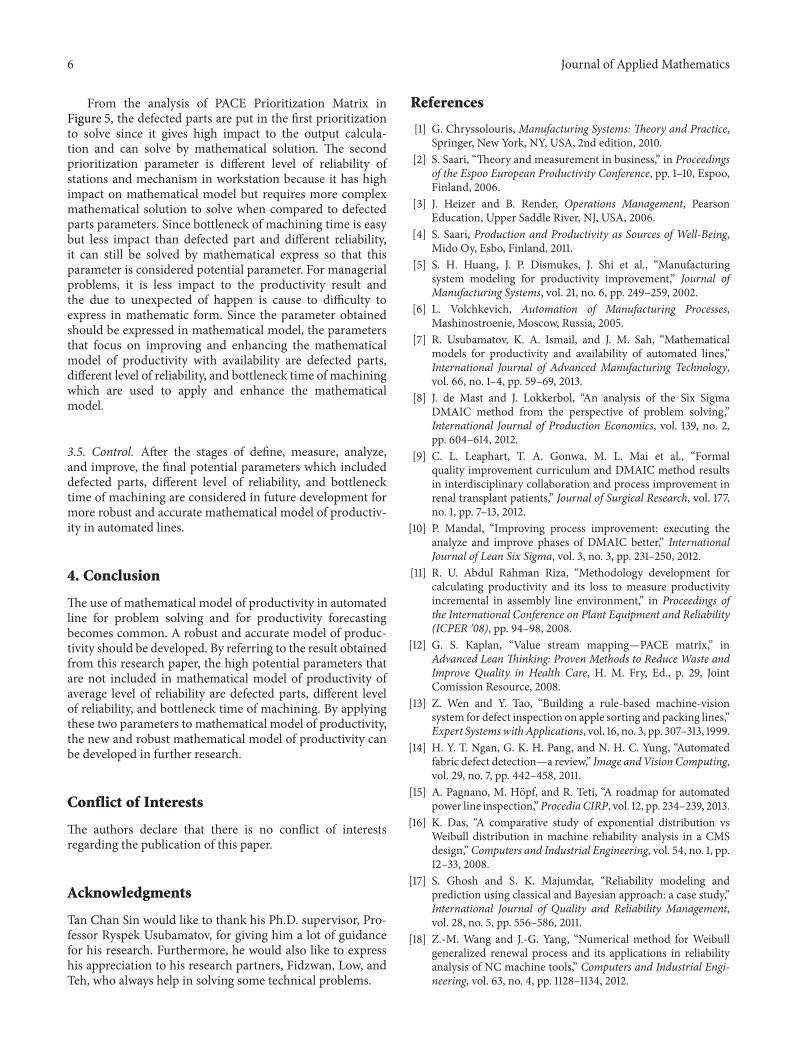
3.4. Improve. The parameters obtained from analysis, whichare different level of reliability of station and mechanisms,bottleneck time of station, rejected parts, and managerialproblems,will be categorized into fourmatrices.Theobtainedparameters are categorized into four groups of PACE througha discussion of closed group. The closed group consists offive people which is the productivity of automated line theoryresearch team that included process engineers and produc-tivity researchers. The result of discussion is categorized andshown in Figure 5.
6 Journal of Applied Mathematics
From the analysis of PACE Prioritization Matrix inFigure 5, the defected parts are put in the first prioritizationto solve since it gives high impact to the output calcula-tion and can solve by mathematical solution. The secondprioritization parameter is different level of reliability ofstations and mechanism in workstation because it has highimpact on mathematical model but requires more complexmathematical solution to solve when compared to defectedparts parameters. Since bottleneck of machining time is easybut less impact than defected part and different reliability,it can still be solved by mathematical express so that thisparameter is considered potential parameter. For managerialproblems, it is less impact to the productivity result andthe due to unexpected of happen is cause to difficulty toexpress in mathematic form. Since the parameter obtainedshould be expressed in mathematical model, the parametersthat focus on improving and enhancing the mathematicalmodel of productivity with availability are defected parts,different level of reliability, and bottleneck time of machiningwhich are used to apply and enhance the mathematicalmodel.
3.5. Control. After the stages of define, measure, analyze,and improve, the final potential parameters which includeddefected parts, different level of reliability, and bottlenecktime of machining are considered in future development formore robust and accurate mathematical model of productiv-ity in automated lines.
4. Conclusion
The use of mathematical model of productivity in automatedline for problem solving and for productivity forecastingbecomes common. A robust and accurate model of produc-tivity should be developed. By referring to the result obtainedfrom this research paper, the high potential parameters thatare not included in mathematical model of productivity ofaverage level of reliability are defected parts, different levelof reliability, and bottleneck time of machining. By applyingthese two parameters to mathematical model of productivity,the new and robust mathematical model of productivity canbe developed in further research.
Conflict of Interests
The authors declare that there is no conflict of interestsregarding the publication of this paper.
Acknowledgments
Tan Chan Sin would like to thank his Ph.D. supervisor, Pro-fessor Ryspek Usubamatov, for giving him a lot of guidancefor his research. Furthermore, he would also like to expresshis appreciation to his research partners, Fidzwan, Low, andTeh, who always help in solving some technical problems.
References
[1] G. Chryssolouris, Manufacturing Systems: Theory and Practice,Springer, New York, NY, USA, 2nd edition, 2010.
[2] S. Saari, “Theory and measurement in business,” in Proceedingsof the Espoo European Productivity Conference, pp. 1–10, Espoo,Finland, 2006.
[3] J. Heizer and B. Render, Operations Management, PearsonEducation, Upper Saddle River, NJ, USA, 2006.
[4] S. Saari, Production and Productivity as Sources of Well-Being,Mido Oy, Esbo, Finland, 2011.
[5] S. H. Huang, J. P. Dismukes, J. Shi et al., “Manufacturingsystem modeling for productivity improvement,” Journal ofManufacturing Systems, vol. 21, no. 6, pp. 249–259, 2002.
[6] L. Volchkevich, Automation of Manufacturing Processes,Mashinostroenie, Moscow, Russia, 2005.
[7] R. Usubamatov, K. A. Ismail, and J. M. Sah, “Mathematicalmodels for productivity and availability of automated lines,”International Journal of Advanced Manufacturing Technology,vol. 66, no. 1–4, pp. 59–69, 2013.
[8] J. de Mast and J. Lokkerbol, “An analysis of the Six SigmaDMAIC method from the perspective of problem solving,”International Journal of Production Economics, vol. 139, no. 2,pp. 604–614, 2012.
[9] C. L. Leaphart, T. A. Gonwa, M. L. Mai et al., “Formalquality improvement curriculum and DMAIC method resultsin interdisciplinary collaboration and process improvement inrenal transplant patients,” Journal of Surgical Research, vol. 177,no. 1, pp. 7–13, 2012.
[10] P. Mandal, “Improving process improvement: executing theanalyze and improve phases of DMAIC better,” InternationalJournal of Lean Six Sigma, vol. 3, no. 3, pp. 231–250, 2012.
[11] R. U. Abdul Rahman Riza, “Methodology development forcalculating productivity and its loss to measure productivityincremental in assembly line environment,” in Proceedings ofthe International Conference on Plant Equipment and Reliability(ICPER ’08), pp. 94–98, 2008.
[12] G. S. Kaplan, “Value stream mapping—PACE matrix,” inAdvanced Lean Thinking: Proven Methods to Reduce Waste andImprove Quality in Health Care, H. M. Fry, Ed., p. 29, JointComission Resource, 2008.
[13] Z. Wen and Y. Tao, “Building a rule-based machine-visionsystem for defect inspection on apple sorting and packing lines,”Expert SystemswithApplications, vol. 16, no. 3, pp. 307–313, 1999.
[14] H. Y. T. Ngan, G. K. H. Pang, and N. H. C. Yung, “Automatedfabric defect detection—a review,” Image andVision Computing,vol. 29, no. 7, pp. 442–458, 2011.
[15] A. Pagnano, M. Hopf, and R. Teti, “A roadmap for automatedpower line inspection,”ProcediaCIRP, vol. 12, pp. 234–239, 2013.
[16] K. Das, “A comparative study of exponential distribution vsWeibull distribution in machine reliability analysis in a CMSdesign,” Computers and Industrial Engineering, vol. 54, no. 1, pp.12–33, 2008.
[17] S. Ghosh and S. K. Majumdar, “Reliability modeling andprediction using classical and Bayesian approach: a case study,”International Journal of Quality and Reliability Management,vol. 28, no. 5, pp. 556–586, 2011.
[18] Z.-M. Wang and J.-G. Yang, “Numerical method for Weibullgeneralized renewal process and its applications in reliabilityanalysis of NC machine tools,” Computers and Industrial Engi-neering, vol. 63, no. 4, pp. 1128–1134, 2012.

Journal of Applied Mathematics 7
[19] A. D. Neely and M. D. Byrne, “A simulation study of bottleneckscheduling,” International Journal of Production Economics, vol.26, no. 1–3, pp. 187–192, 1992.
[20] A. Ingemansson, T. Ylipaa, andG. S. Bolmsjo, “Reducing bottle-necks in amanufacturing systemwith automatic data collectionand discrete-event simulation,” Journal of Manufacturing Tech-nology Management, vol. 16, no. 6, pp. 615–628, 2005.

Submit your manuscripts athttp://www.hindawi.com
Hindawi Publishing Corporationhttp://www.hindawi.com Volume 2014
MathematicsJournal of
Hindawi Publishing Corporationhttp://www.hindawi.com Volume 2014
Mathematical Problems in Engineering
Hindawi Publishing Corporationhttp://www.hindawi.com
Differential EquationsInternational Journal of
Volume 2014
Applied MathematicsJournal of
Hindawi Publishing Corporationhttp://www.hindawi.com Volume 2014
Probability and StatisticsHindawi Publishing Corporationhttp://www.hindawi.com Volume 2014
Journal of
Hindawi Publishing Corporationhttp://www.hindawi.com Volume 2014
Mathematical PhysicsAdvances in
Complex AnalysisJournal of
Hindawi Publishing Corporationhttp://www.hindawi.com Volume 2014
OptimizationJournal of
Hindawi Publishing Corporationhttp://www.hindawi.com Volume 2014
CombinatoricsHindawi Publishing Corporationhttp://www.hindawi.com Volume 2014
International Journal of
Hindawi Publishing Corporationhttp://www.hindawi.com Volume 2014
Operations ResearchAdvances in
Journal of
Hindawi Publishing Corporationhttp://www.hindawi.com Volume 2014
Function Spaces
Abstract and Applied AnalysisHindawi Publishing Corporationhttp://www.hindawi.com Volume 2014
International Journal of Mathematics and Mathematical Sciences
Hindawi Publishing Corporationhttp://www.hindawi.com Volume 2014
The Scientific World JournalHindawi Publishing Corporation http://www.hindawi.com Volume 2014
Hindawi Publishing Corporationhttp://www.hindawi.com Volume 2014
Algebra
Discrete Dynamics in Nature and Society
Hindawi Publishing Corporationhttp://www.hindawi.com Volume 2014
Hindawi Publishing Corporationhttp://www.hindawi.com Volume 2014
Decision SciencesAdvances in
Discrete MathematicsJournal of
Hindawi Publishing Corporationhttp://www.hindawi.com
Volume 2014 Hindawi Publishing Corporationhttp://www.hindawi.com Volume 2014
Stochastic AnalysisInternational Journal of
Related Documents