F Fe e a as s i i b bi i l l i i t t y y R Re ep po o r rt t T Th he e E Es st t a ab bl l i i s s h hm me e n nt t o of f C Co o m mm me e r r c c i i a al l W Wi i n nd d P Po ow we e r r P Pl l a an nt t o of f 1 18 8M MW W a at t G Gh ha ar r o o - - S Si i n nd dh h BY Dr. Qamar-uz-Zaman Chaudhry & Hazrat Mir, Muhammad Afzaal (Technical Report No. PMD-11/2004) PAKISTAN METEOROLOGICAL DEPARTMENT SECTOR H-8/2, P. O. BOX 1214, ISLAMABAD.

Welcome message from author
This document is posted to help you gain knowledge. Please leave a comment to let me know what you think about it! Share it to your friends and learn new things together.
Transcript
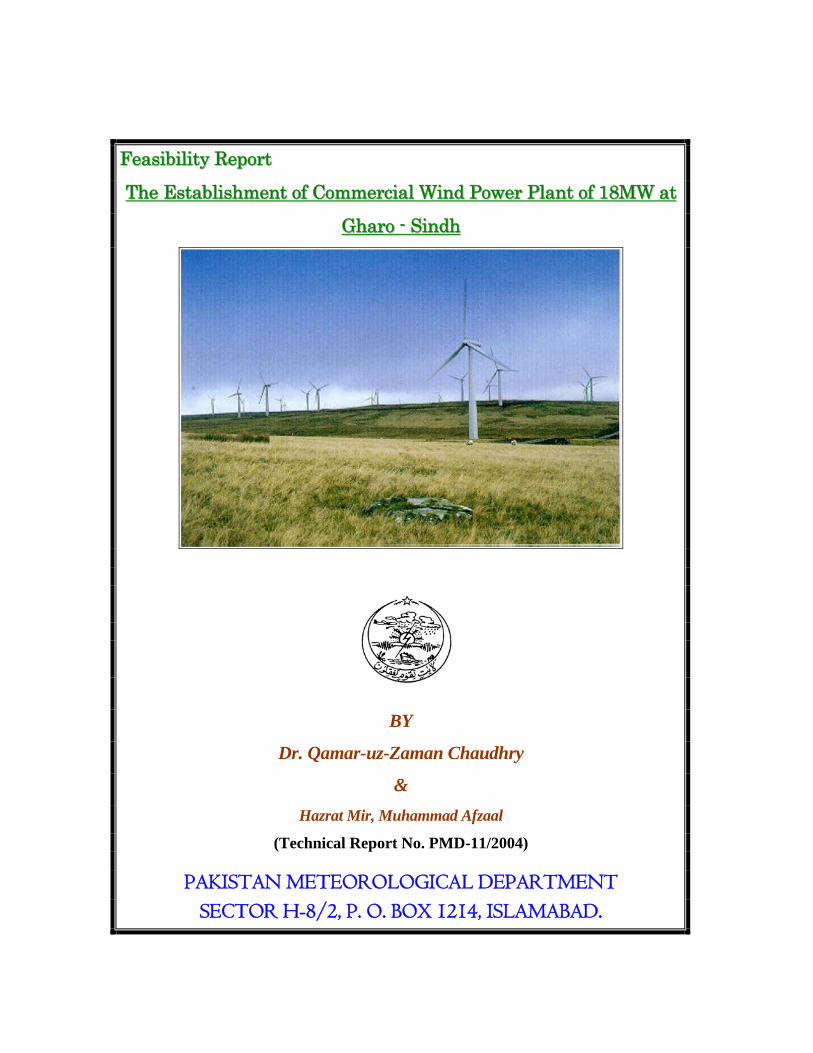
FFeeaassiibbiilliittyy RReeppoorrtt
TThhee EEssttaabblliisshhmmeenntt ooff CCoommmmeerrcciiaall WWiinndd PPoowweerr PPllaanntt ooff 1188MMWW aatt
GGhhaarroo -- SSiinnddhh
BY
Dr. Qamar-uz-Zaman Chaudhry
& Hazrat Mir, Muhammad Afzaal
(Technical Report No. PMD-11/2004)
PAKISTAN METEOROLOGICAL DEPARTMENT SECTOR H-8/2, P. O. BOX 1214, ISLAMABAD.
2
Contents Executive summary…………………………………………………………………………………………………………………...3
Introduction ……..................................................................................................................................................................................4 Wind Power Production ......................................................................................................................................................................5
Energy Production ...............................................................................................................................................................................6
Proposed map of wind farm ................................................................................................................................................................8
Performance ..........................................................................................................................................................................................9 Risks Associated with Investments in Wind Power...........................................................................................................................9 Critical Determinants of Financial Returns.......................................................................................................................................9
Wind potential Area of Sindh ............................................................................................................................................................12
Benefits of wind energy ......................................................................................................................................................................13
Tables o Table 1: Hypothetical wind generated electric energy output & capacity factor for a Bonus 600/44MK IV turbine at
Gharo (Year-2002).........................................................................................................................................................................6 o Table 2: Wind Turbine Specifications ........................................................................................................................................7 o Table 3: Wind Turbine Specifications ........................................................................................................................................7 o Table 4: Economic Aspects .........................................................................................................................................................10 o Table 5: Estimated Project Cost (Rs: Million) For 18 Mw Wind Farm ................................................................................10
o Table 6: Profitability Analysis - 18 MW Power Plants ............................................................................................................11
Figures
o Fig.1: Monthly Average Wind Speed at Gharo ........................................................................................................................15
o Fig. 2: Annual Wind Frequency Distribution at Gharo ..........................................................................................................16
o Fig. 3: Annual Percentage Wind Frequency Distribution at Gharo ......................................................................................16
o Fig 4: Gross Wind Power Potential (MW) of Different Sites in Sindh...................................................................................13
Maps
o Map 1: Schematic Wind Farm Spanned over 1 Km2 Area ........................................................................................................8
o Map 2: Wind Potential Area of Sindh .......................................................................................................................................12
Appendix
i. Average wind speed
ii. Wind frequency distribution
iii. Monthly average diurnal variation of wind generated electric power output
iv. Hourly wind generated electric power output
3
Executive Summary
Pakistan Meteorological Department has conducted a detailed Wind Power Potential
Survey of Coastal Areas of Pakistan and Ministry of Science and Technology has
provided the required funding for this purpose. This study has enabled us to identify the
potential areas where economically feasible wind farm can be established. One
interesting aspect of this study is that contrary to the general impression Sindh coastal
areas have greater wind power potential than Balochistan coastal areas. Potential areas
covering 9700 sq.km in Sindh has been shown in Map-2 at page 12. The gross wind
power potential of this area is 43000 MW and keeping in view the area utilization
constrains etc. the exploitable electric power generation potential of this area is
estimated to be about 11000MW.
Feasibility study for the installation of 18 MW Model wind power project is prepared.
Total cost of the project is estimated to be about Rs. 850 million and the pay back
period would be 7-8 years. The levelised cost of power generation is estimated as
Rs. 2.9/kwh. The profitability analysis of proposed 18 MW wind power plant is also
prepared and included in this report.
4
Introduction: The demand for energy has increased in tremendous proportions in the last few decades in Pakistan; the same is expected to increase further in the coming years. The primary sources of energy available in Pakistan are oil, natural gas, hydro and nuclear Power. At present oil accounts for approximately 45% of total commercial energy supply. The share of natural gas is 34% while that of hydel power remains roughly at 15%. The increase in cost of fossil fuel and the various environmental problems of large scale power generation have lead to increased appreciation of the potential of electricity generation from non-conventional sources. This has provided the planners and economists to find out other low cost energy resources.
Wind and Solar energies are the possible clean and low cost renewable resources available in the country. The potential, for the use of alternative technologies, has never been fully explored in Pakistan. Wind power provides opportunity to reduce dependence on imported fossil fuel and at the same time expands the power supply capacity to remote locations where grid expansion is not practical.
Recently conducted survey of Wind Power Potential along coastal areas of the
country by Pakistan Meteorological Department (PMD), indicates that a potential exists for harvesting wind energy using currently available technologies, especially along Sindh coast.
Gharo, one of the sites in Sindh where the wind data have been recorded and
studied by PMD, has been selected for this feasibility study. The wind measurements at Gharo have been carried out during 24 months period. The annual mean wind speed is estimated to be 6.86m/s at 50 meter above ground level. The annual power density of area is 408.6 W/m2, which bring the site into good category of power potential, which means this area is suitable for large economically viable wind farm.
Using the measured wind data the annual gross energy production by an 18 MW
wind farm consisting of thirty – 600 kW turbines will be 45 million kWh. Taking into account the wind turbine availability, net losses and wake effects in the wind farm the net annual energy production is estimated to 31 million kWh per year corresponding to a capacity factor of 28%.
The total investment will be Rs: 850 million and pay back period will be 7-8
years. The capital cost of wind power projects ranges Rs 4 to5 crore per MW. This gives a levelised cost of wind energy generation in the range of Rs: 2.50 to 3.00 per kWh, taking into consideration the fiscal benefits extended by the government.
5
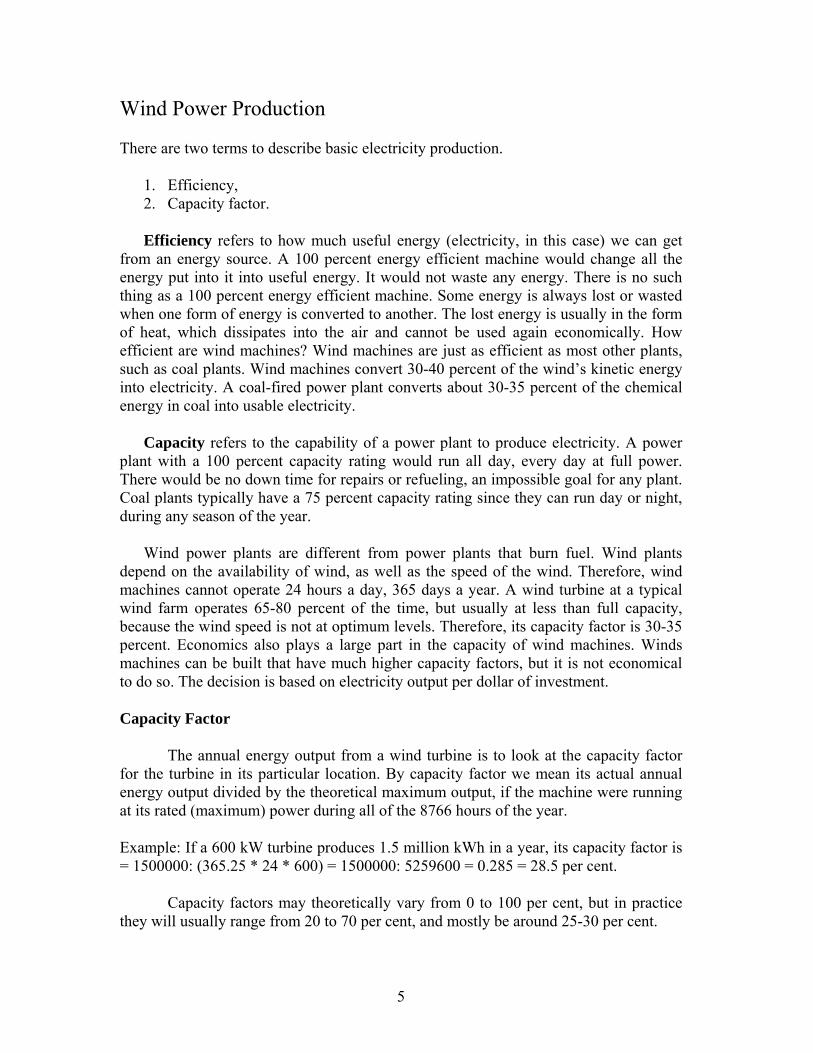
Wind Power Production
There are two terms to describe basic electricity production.
1. Efficiency, 2. Capacity factor.
Efficiency refers to how much useful energy (electricity, in this case) we can get from an energy source. A 100 percent energy efficient machine would change all the energy put into it into useful energy. It would not waste any energy. There is no such thing as a 100 percent energy efficient machine. Some energy is always lost or wasted when one form of energy is converted to another. The lost energy is usually in the form of heat, which dissipates into the air and cannot be used again economically. How efficient are wind machines? Wind machines are just as efficient as most other plants, such as coal plants. Wind machines convert 30-40 percent of the wind’s kinetic energy into electricity. A coal-fired power plant converts about 30-35 percent of the chemical energy in coal into usable electricity.
Capacity refers to the capability of a power plant to produce electricity. A power plant with a 100 percent capacity rating would run all day, every day at full power. There would be no down time for repairs or refueling, an impossible goal for any plant. Coal plants typically have a 75 percent capacity rating since they can run day or night, during any season of the year.
Wind power plants are different from power plants that burn fuel. Wind plants depend on the availability of wind, as well as the speed of the wind. Therefore, wind machines cannot operate 24 hours a day, 365 days a year. A wind turbine at a typical wind farm operates 65-80 percent of the time, but usually at less than full capacity, because the wind speed is not at optimum levels. Therefore, its capacity factor is 30-35 percent. Economics also plays a large part in the capacity of wind machines. Winds machines can be built that have much higher capacity factors, but it is not economical to do so. The decision is based on electricity output per dollar of investment.
Capacity Factor
The annual energy output from a wind turbine is to look at the capacity factor for the turbine in its particular location. By capacity factor we mean its actual annual energy output divided by the theoretical maximum output, if the machine were running at its rated (maximum) power during all of the 8766 hours of the year.
Example: If a 600 kW turbine produces 1.5 million kWh in a year, its capacity factor is = 1500000: (365.25 * 24 * 600) = 1500000: 5259600 = 0.285 = 28.5 per cent.
Capacity factors may theoretically vary from 0 to 100 per cent, but in practice they will usually range from 20 to 70 per cent, and mostly be around 25-30 per cent.

6
Energy Production
Wind generated electric power out put at Gharo has been estimated by using the
600kW wind turbine Bonus 600/40 MK IV type. The cut-in wind speed of turbine is 3m/s and cutout wind speed is 25m/s. Rotor diameter is 44 meters and hub height has been taken as 50 meter. The monthly and annual wind generated electric power out put at Gharo-Sindh along with capacity factor are given in Table-1a, b and the month-wise hourly wind power output is given in the Appendix. The minor differences between the output electric energy shown in Table-1a & b and in Appendix are due to calculations on monthly and hourly basis respectively.
Table-1: Hypothetical wind generated electric energy output & capacity factor for a Bonus 600/44MK IV turbine at Gharo (Year-2002)
PMD Calculator (using 50M)
Months Capacity Factor kWh per Month January 13% 57745 February 16% 65384 March 16% 69869 April 30% 127689 May 60% 268240 June 45% 194703 July 68% 305321
August 35% 157142 September 43% 187858
October 12% 53867 November 10% 44324 December 13% 59327 Annual 28% 1495808
7
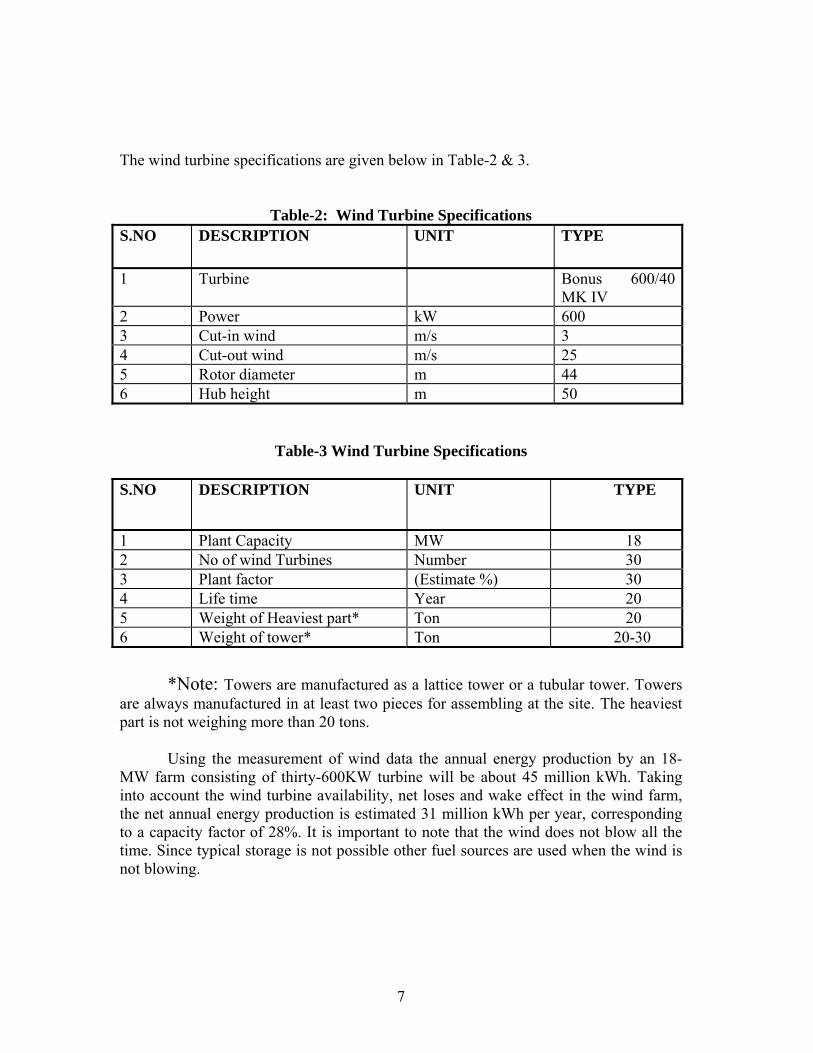
The wind turbine specifications are given below in Table-2 & 3.
Table-2: Wind Turbine Specifications S.NO DESCRIPTION UNIT TYPE
1 Turbine Bonus 600/40 MK IV
2 Power kW 600 3 Cut-in wind m/s 3 4 Cut-out wind m/s 25 5 Rotor diameter m 44 6 Hub height m 50
Table-3 Wind Turbine Specifications
S.NO DESCRIPTION UNIT TYPE
1 Plant Capacity MW 18 2 No of wind Turbines Number 30 3 Plant factor (Estimate %) 30 4 Life time Year 20 5 Weight of Heaviest part* Ton 20 6 Weight of tower* Ton 20-30 *Note: Towers are manufactured as a lattice tower or a tubular tower. Towers are always manufactured in at least two pieces for assembling at the site. The heaviest part is not weighing more than 20 tons.
Using the measurement of wind data the annual energy production by an 18-MW farm consisting of thirty-600KW turbine will be about 45 million kWh. Taking into account the wind turbine availability, net loses and wake effect in the wind farm, the net annual energy production is estimated 31 million kWh per year, corresponding to a capacity factor of 28%. It is important to note that the wind does not blow all the time. Since typical storage is not possible other fuel sources are used when the wind is not blowing.
8
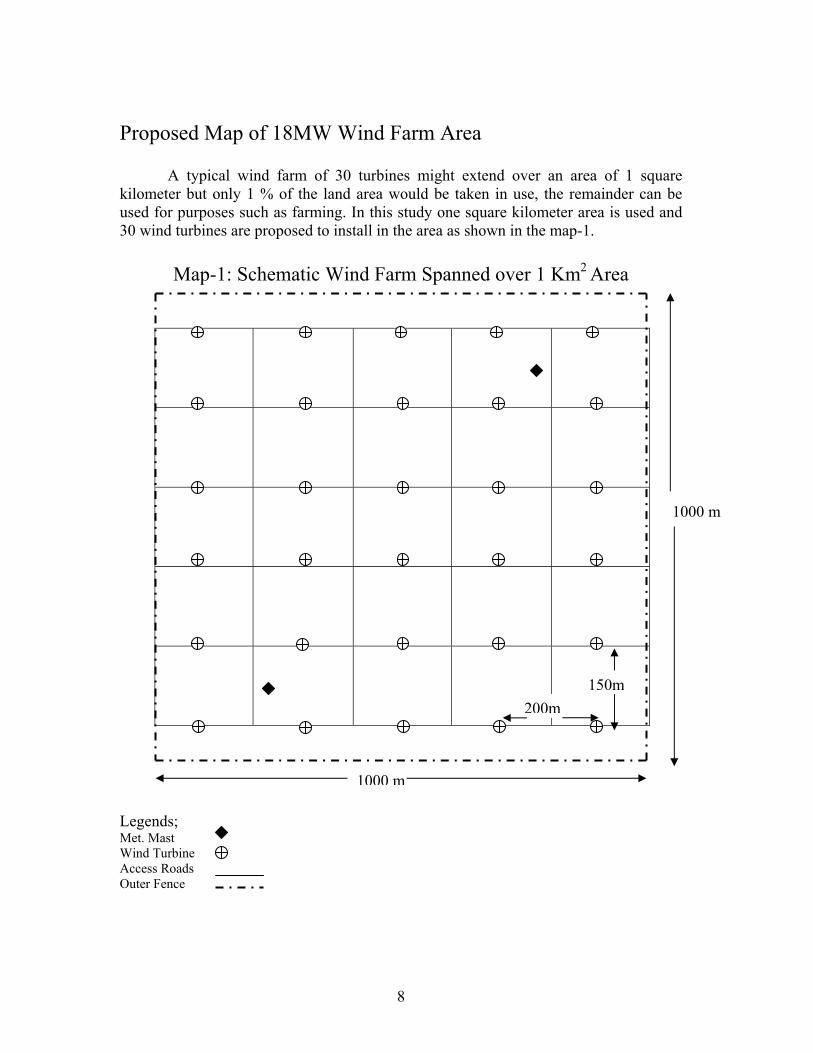
Proposed Map of 18MW Wind Farm Area
A typical wind farm of 30 turbines might extend over an area of 1 square kilometer but only 1 % of the land area would be taken in use, the remainder can be used for purposes such as farming. In this study one square kilometer area is used and 30 wind turbines are proposed to install in the area as shown in the map-1.
Map-1: Schematic Wind Farm Spanned over 1 Km2 Area
Legends; Met. Mast Wind Turbine Access Roads Outer Fence
1000 m
1000 m
200m150m

9
Performance
Generally wind farm located in area with good winds and having a typical value
of capacity factor i.e. 25% at least are economically viable. A typical life of wind turbine is 20 to 25 years. Maintenance is required at 6 months interval.
The total investment for the proposed project is Rs: 850 million and pay back period 7-8 years. The capital cost of a typical wind power project ranges Rs 4 to5 crore per MW. This gives a levelised cost of wind energy generation in the range of Rs: 2.5 to 3.00 per kWh, taking into consideration the fiscal benefits extended by the government. Different economic aspects of the project are shown in table 4, 5 & 6. Risks Associated with Investments in Wind Power
i. The returns from investments in this sector are very dependent on government policies, both in terms of the incentives given and the taxation structure imposed on businesses. Hence changes in either are a source of concern to the investors. For example, changes in the tax laws that make all companies liable to pay a minimum tax on their profits, may negatively affect the wind program because it reduces the benefit from the tax shelter that investments here could provide.
ii. The main “fuel” controlling generation in any year is the wind speed. This is beyond the investor’s control: there is always the risk that actual generation in any year could be below the expected level.
iii. Grid availability to evacuate the generated power is an essential requirement. Poor grid availability and reliability are again risks that have to be borne by the investors under the current situation.
Critical Determinants of Financial Returns
i. The capacity factor of the wind turbine or wind potential of an area, ii. The purchase price for the power generated, iii. The term structure of the loan taken for the project, iv. The rate of interest of the loan.
10
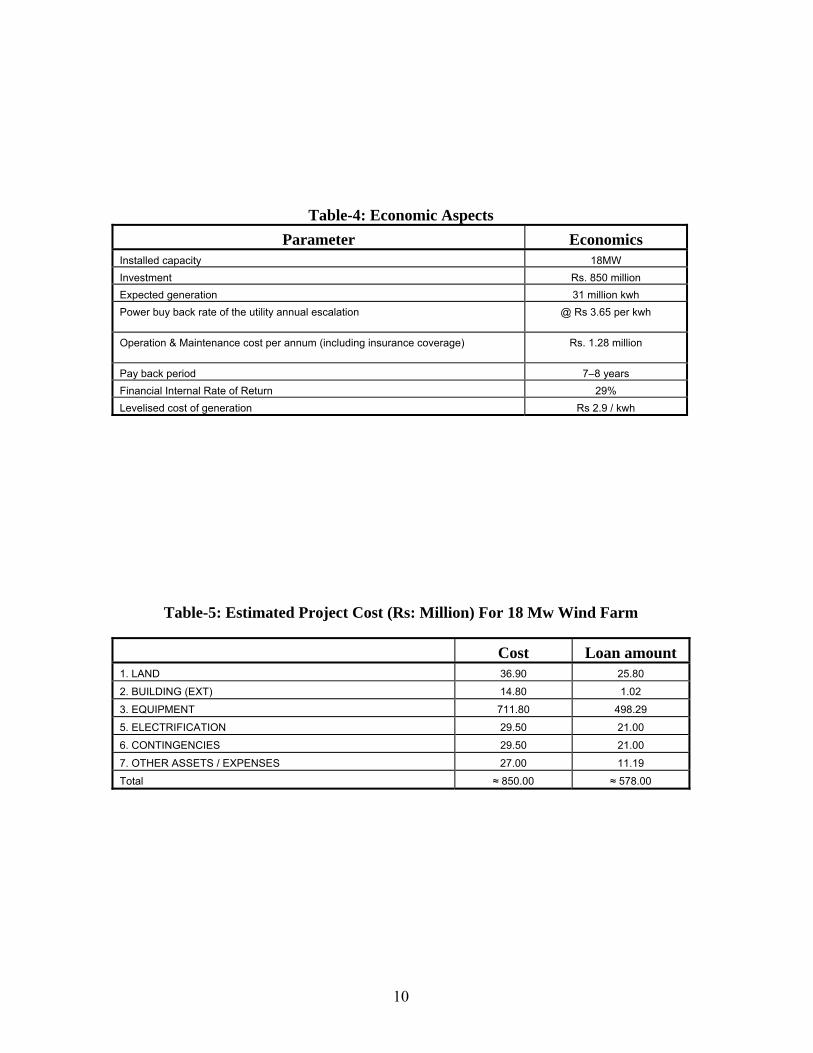
Table-4: Economic Aspects Parameter Economics
Installed capacity 18MW Investment Rs. 850 million Expected generation 31 million kwh Power buy back rate of the utility annual escalation @ Rs 3.65 per kwh
Operation & Maintenance cost per annum (including insurance coverage) Rs. 1.28 million
Pay back period 7–8 years Financial Internal Rate of Return 29% Levelised cost of generation Rs 2.9 / kwh
Table-5: Estimated Project Cost (Rs: Million) For 18 Mw Wind Farm
Cost Loan amount1. LAND 36.90 25.80
2. BUILDING (EXT) 14.80 1.02
3. EQUIPMENT 711.80 498.29
5. ELECTRIFICATION 29.50 21.00
6. CONTINGENCIES 29.50 21.00
7. OTHER ASSETS / EXPENSES 27.00 11.19
Total ≈ 850.00 ≈ 578.00

11
Profitability Analysis - 18 MW Power Plants
Expected energy generation is 31 million kWh per annum i.e. worth Rs: 93 million
@ Rs. 3.00 per unit. Table-6: Profitability Analysis of proposed 18 MW Power Plants
YEARS I II III IV V VI VII VIII IX
Production in Unit million kWh
45.00 45.00 45.00 45.00 45.00 45.00 45.00 45.00 45.00
Wake effect & net losses
12.20 12.20 12.20 12.20 12.20 12.20 12.20 12.20 12.20
4% Distribution and transmission charges
1.80 1.80 1.80 1.80 1.80 1.80 1.80 1.80 1.80
Energy generated 31.00 31.00 31.00 31.00 31.00 31.00 31.00 31.00 31.00
Income from energy generated Rs 3.00
93.00 94.55 96.10 97.65 99.20 100.75 102.30 103.85 105.40
Insurance 1.60 1.60 1.60 1.60 1.60 1.60 1.60 1.60 1.60 Operation and Maintenance Charges 2% of project cost5% rise every year
17.00 17.85 18.74 19.68 20.66 21.70 22.78 23.92 25.12
Interest 3% 17.34 17.34 15.38 13.41 11.45 9.48 7.52 5.55 3.59 Installment ..- 65.50 65.50 65.50 65.50 65.50 65.50 65.50 65.50 Total Expenditure 35.94 102.29 101.22 100.19 99.21 98.28 97.40 96.57 95.80
Net profit/loss (Yearly)
57.06 -7.74 -5.12 -2.54 -0.01 2.47 4.90 7.28 9.60
Carry Forwarded Net Profit/Loss
57.06 49.32 44.20 41.66 41.66 44.13 49.03 56.31 65.91
12
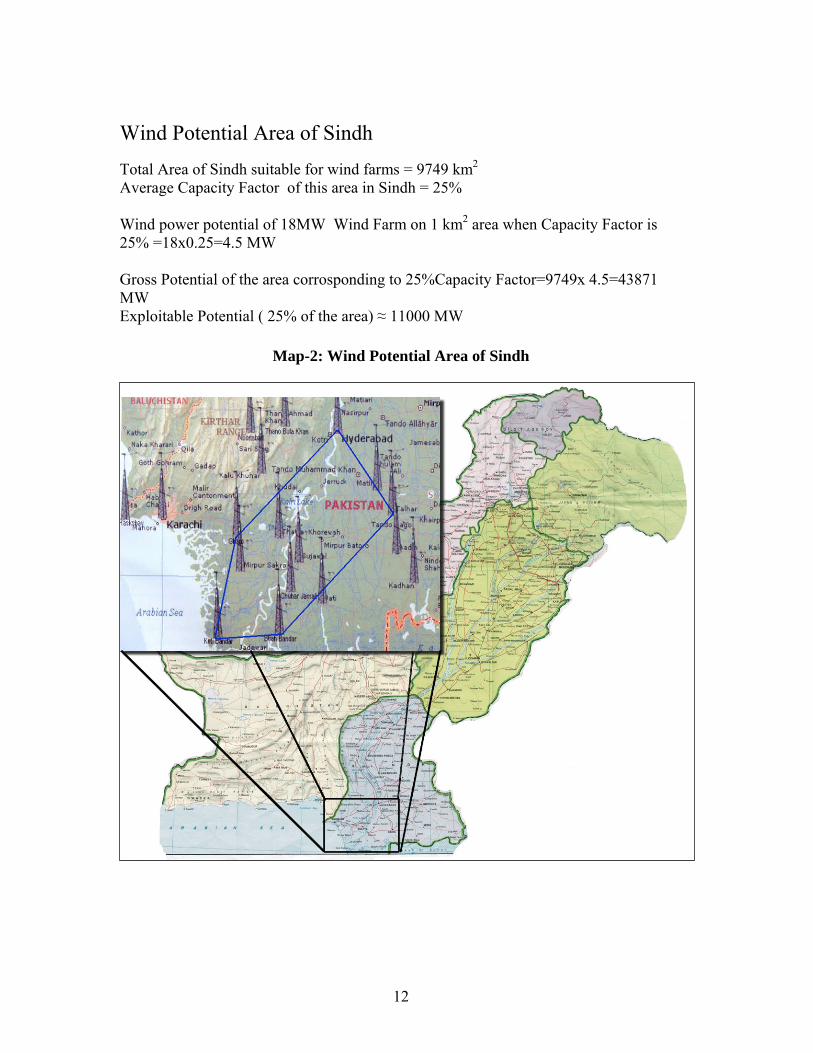
Wind Potential Area of Sindh Total Area of Sindh suitable for wind farms = 9749 km2 Average Capacity Factor of this area in Sindh = 25% Wind power potential of 18MW Wind Farm on 1 km2 area when Capacity Factor is 25% =18x0.25=4.5 MW Gross Potential of the area corrosponding to 25%Capacity Factor=9749x 4.5=43871 MW Exploitable Potential ( 25% of the area) ≈ 11000 MW
Map-2: Wind Potential Area of Sindh

13
Gross Wind Power Potential (MW) per km2 of Different Sites in the potential area of Sindh
0
1
2
3
4
5
6
Gro
ss P
oten
tial (
MW
)
ChuharJamali
Gharo Hyderabad Jati Keti Bunder Mirpur Sakro Shah Bunder Talhar
Station
The Benefits of Wind Energy
Wind energy is an ideal renewable energy because:
1. it is a pollution-free, infinitely sustainable form of energy 2. it doesn’t require fuel 3. it doesn’t create greenhouse gasses 4. it doesn’t produce toxic or radioactive waste.
• Wind energy is quiet and does not present any significant hazard to birds or other wildlife.
• When large arrays of wind turbines are installed on farmland, only about 2% of the land area is required for the wind turbines. The rest is available for farming, livestock, and other uses.
• Landowners often receive payment for the use of their land, which enhances their income and increases the value of the land.
• Ownership of wind turbine generators by individuals and the community allows people to participate directly in the preservation of our environment.
• Each megawatt-hour of electricity that is generated by wind energy helps to reduce 0.8 to 0.9 tones of greenhouse gas emissions that are produced by coal or diesel fuel generation each year.
Figure 4: Gross Wind Power Potential (MW) per km2 of Different Sites in Sindh
Appendix
i. Average Wind Speed.
ii. Wind Frequency Distribution.
iii. Monthly Average Diurnal Variation of Wind Generated
Electric Power Output.
iv. Hourly Wind Generated Electric Power Output.
15
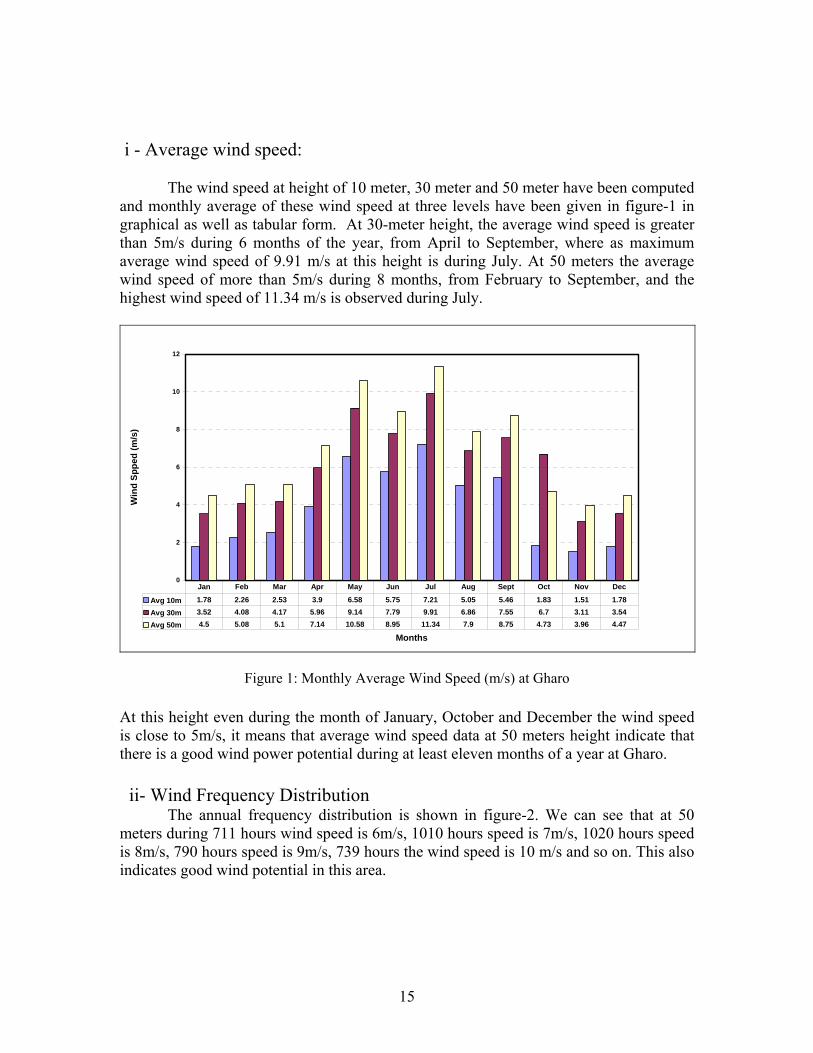
i - Average wind speed:
The wind speed at height of 10 meter, 30 meter and 50 meter have been computed and monthly average of these wind speed at three levels have been given in figure-1 in graphical as well as tabular form. At 30-meter height, the average wind speed is greater than 5m/s during 6 months of the year, from April to September, where as maximum average wind speed of 9.91 m/s at this height is during July. At 50 meters the average wind speed of more than 5m/s during 8 months, from February to September, and the highest wind speed of 11.34 m/s is observed during July.
0
2
4
6
8
10
12
Months
Win
d Sp
ped
(m/s
)
Avg 10m 1.78 2.26 2.53 3.9 6.58 5.75 7.21 5.05 5.46 1.83 1.51 1.78
Avg 30m 3.52 4.08 4.17 5.96 9.14 7.79 9.91 6.86 7.55 6.7 3.11 3.54Avg 50m 4.5 5.08 5.1 7.14 10.58 8.95 11.34 7.9 8.75 4.73 3.96 4.47
Jan Feb Mar Apr May Jun Jul Aug Sept Oct Nov Dec
At this height even during the month of January, October and December the wind speed is close to 5m/s, it means that average wind speed data at 50 meters height indicate that there is a good wind power potential during at least eleven months of a year at Gharo. ii- Wind Frequency Distribution
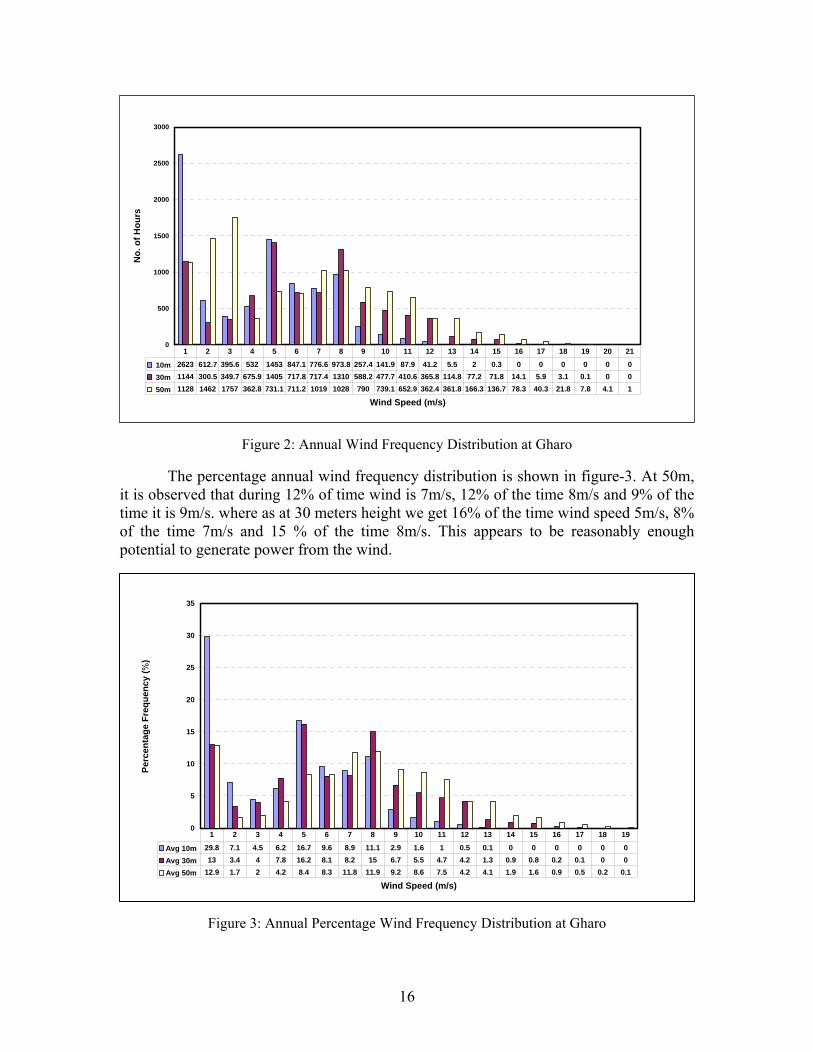
The annual frequency distribution is shown in figure-2. We can see that at 50 meters during 711 hours wind speed is 6m/s, 1010 hours speed is 7m/s, 1020 hours speed is 8m/s, 790 hours speed is 9m/s, 739 hours the wind speed is 10 m/s and so on. This also indicates good wind potential in this area.
Figure 1: Monthly Average Wind Speed (m/s) at Gharo
16
0
500
1000
1500
2000
2500
3000
Wind Speed (m/s)
No.
of H
ours
10m 2623 612.7 395.6 532 1453 847.1 776.6 973.8 257.4 141.9 87.9 41.2 5.5 2 0.3 0 0 0 0 0 0 30m 1144 300.5 349.7 675.9 1405 717.8 717.4 1310 588.2 477.7 410.6 365.8 114.8 77.2 71.8 14.1 5.9 3.1 0.1 0 0
50m 1128 1462 1757 362.8 731.1 711.2 1019 1028 790 739.1 652.9 362.4 361.8 166.3 136.7 78.3 40.3 21.8 7.8 4.1 1
1 2 3 4 5 6 7 8 9 10 11 12 13 14 15 16 17 18 19 20 21
0
5
10
15
20
25
30
35
Wind Speed (m/s)
Perc
enta
ge F
requ
ency
( %)
Avg 10m 29.8 7.1 4.5 6.2 16.7 9.6 8.9 11.1 2.9 1.6 1 0.5 0.1 0 0 0 0 0 0
Avg 30m 13 3.4 4 7.8 16.2 8.1 8.2 15 6.7 5.5 4.7 4.2 1.3 0.9 0.8 0.2 0.1 0 0Avg 50m 12.9 1.7 2 4.2 8.4 8.3 11.8 11.9 9.2 8.6 7.5 4.2 4.1 1.9 1.6 0.9 0.5 0.2 0.1
1 2 3 4 5 6 7 8 9 10 11 12 13 14 15 16 17 18 19
Figure 2: Annual Wind Frequency Distribution at Gharo
The percentage annual wind frequency distribution is shown in figure-3. At 50m, it is observed that during 12% of time wind is 7m/s, 12% of the time 8m/s and 9% of the time it is 9m/s. where as at 30 meters height we get 16% of the time wind speed 5m/s, 8% of the time 7m/s and 15 % of the time 8m/s. This appears to be reasonably enough potential to generate power from the wind.
Figure 3: Annual Percentage Wind Frequency Distribution at Gharo
Related Documents