DOCUMENT RESUME ED 270 837 EA 018 503 AUTHOR Apling, Richard; Padilla, Christine L. TITLE Funds Allocation and Expenditures under the Education Block Grant. A Special Issue Report from the National Study of Local Operations under Chapter 2 of the Education Consolidation and Improvement Act. INSTITUTION SRI International, Menlo Park, Calif. SPONS AGENCY Department of Education, Washington, DC. Office of Planning, Budget, and Evaluation. PUB DATE Jan 86 CONTRACT 300-83-0286 MOTE 150p.; For related documents, see EA 018 501-506. PUB TYPE Reports Research/Technical (143) EDRS PRICE M701/PC06 Plus Postage. DESCRIPTORS *Block Grants; Educational Finance; Elementary Secondary Education; Expenditures; *Federal Aid; *Federal Legislation; Government School Relationship; Resource Allocation; School Districts IDENTIFIERS *Education Consolidation Improvement Act Chapter 2; *National Study of Local Operations under Chapter 2 ABSTRACT This document presents the findings from one aspect of the National Study of Local Operations under Chapter 2 of the Education Consolidation and Improvement Act of 1981. The report examines the distribution of funds to school districts under Chapter 2, the federal education block grant. The introductory chapter reviews findings from early studies regarding the fiscal effects of Cha^ter 2, presents the research questions that motivated the aspect of the study reported here, and discusses the sources of the data used. The remaining chapters describe the distribution of Chapter 2 funds, analyze how districts spent the funds, and explain local spending patterns. The concerns addressed include the relationship of district size to fund allocation, the allocation of discretionary funds, the provision of services to private school students, shifts in fund allocation resulting from the consolidation of funding into the block grant, effects of district size on spending patterns, differences between expenditures for private and public school students, changes in spending patterns resulting from consolidation of funding into the block grant, and the nature of the factors influencing local spending decisions. Appendixes provide error values for the report's tables and a list of antecedent programs consolidated into the Chapter 2 block grant. (PGD) *********************************************************************** * Reproductions supplied by EDRS are the best that can be made * * from the original document. * ***********************************************************************

Welcome message from author
This document is posted to help you gain knowledge. Please leave a comment to let me know what you think about it! Share it to your friends and learn new things together.
Transcript

DOCUMENT RESUME
ED 270 837 EA 018 503
AUTHOR Apling, Richard; Padilla, Christine L.TITLE Funds Allocation and Expenditures under the Education
Block Grant. A Special Issue Report from the NationalStudy of Local Operations under Chapter 2 of theEducation Consolidation and Improvement Act.
INSTITUTION SRI International, Menlo Park, Calif.SPONS AGENCY Department of Education, Washington, DC. Office of
Planning, Budget, and Evaluation.PUB DATE Jan 86CONTRACT 300-83-0286MOTE 150p.; For related documents, see EA 018 501-506.PUB TYPE Reports Research/Technical (143)
EDRS PRICE M701/PC06 Plus Postage.DESCRIPTORS *Block Grants; Educational Finance; Elementary
Secondary Education; Expenditures; *Federal Aid;*Federal Legislation; Government School Relationship;Resource Allocation; School Districts
IDENTIFIERS *Education Consolidation Improvement Act Chapter 2;*National Study of Local Operations under Chapter2
ABSTRACTThis document presents the findings from one aspect
of the National Study of Local Operations under Chapter 2 of theEducation Consolidation and Improvement Act of 1981. The reportexamines the distribution of funds to school districts under Chapter2, the federal education block grant. The introductory chapterreviews findings from early studies regarding the fiscal effects ofCha^ter 2, presents the research questions that motivated the aspectof the study reported here, and discusses the sources of the dataused. The remaining chapters describe the distribution of Chapter 2funds, analyze how districts spent the funds, and explain localspending patterns. The concerns addressed include the relationship ofdistrict size to fund allocation, the allocation of discretionaryfunds, the provision of services to private school students, shiftsin fund allocation resulting from the consolidation of funding intothe block grant, effects of district size on spending patterns,differences between expenditures for private and public schoolstudents, changes in spending patterns resulting from consolidationof funding into the block grant, and the nature of the factorsinfluencing local spending decisions. Appendixes provide error valuesfor the report's tables and a list of antecedent programsconsolidated into the Chapter 2 block grant. (PGD)
************************************************************************ Reproductions supplied by EDRS are the best that can be made ** from the original document. *
***********************************************************************

N-ike N
CO FUNDS ALLOCATION ANDc) EXPENDITURES UNDER THErN-\J EDUCATION BLOCK GRANTcnw
A Special Issue Report from the NationalStudy of Local Operations Under Chapter 2of the Education Consolidation andImprovement Act
January 1986
Richard Apling, Policy Studies AssociatesChristine 1 . Padilla, SRI International
U S DEPARTMENT OF EDUCATIONOffice of Educational Research and Improvement
EDUCATIONAL RESOURCES INFORMATIONCENTER (ERIC)
This document has been reproduced asawed from the person or organizahon
originating itE Minor changes have been made to improve
reproducion quality
Points of view or opinions stated in thisdocumen( do not necessarily represent offico.OERI position or policy
Prepared for:
U.S. Department of Education,Office of Planning, Budget, and Evaluation
Washington, D.C. 20202
ED Contract No. 300-83-0286SRI Project No. 6684
SRI International333 Ravenswood AvenueMenlo Park, California 94025-3493(415) 326-6200TWX: 910-373-2046Telex. 334486
FUNDS ALLOCATION ANDEXPENDITURES UNDER THEEDUCATION BLOCK GRANT
A Special Issue Report from the NationalStudy of Local Operations Under Chapter 2of the Education Consolidation andImprovement Act
January 1986
Richard Apling, Policy Studies AssociatesChristine L. Padilla, SRI International
Prepared ,or:
U.S. Department of Education,Office of Planning, Budget, and Evaluation
Washington, D.C. 20202
ED Contract No. 300-83-0286SRI Project No. 6684
The conclusions of this report are those of the authors and contractors and do notnecessarily reflect the views of the U S. Department of Education or any otheragency of the government.
3

Reports from the
National Study of Local Operations under Chapter 2
Michael S. KnappCraig H. Blakely
Michael S. Knapp
Richard AplingChristine L. Padilla
The Education Block Grant at the Local Level:The Implementation of Chapter 2 of the EducationConsolidation and Improvement Act in Districts andSchools
Legislative Goals for the Education Block Grant:Have they been Achieved at the Local Level
Funds Allocation and Expenditures under the
Education Block Grant
Rhonda Ann Cooperstein Participation of Private School Students inServices Supported by the Education Block Grant
Craig H. BlakelyMarian S. Stearns
Brenda J. Turnbull
Ellen L. Marks
Involvement of Parents and Citizens in LocalDecisionmaking Under the Education Block Grant
The Education Block Grant and Intergovernmental
Relations: Effects at the Local Level
Elizabeth R. Reisner State and Local Evaluation Options Under the
Michael S. Knapp Federal Education Block Grant
ii

CONTENTS
LIST OF TABLES
LIST OF FIGURES vi
PREFACE vii
ACKNOWLEDGMENTS ix
NOTES FOR READING TABLES xi
I INTRODUCTION AND OVERVIEW 1
Themes in Existing Research 1
Research Questions 6
Sources of Data 7
II DISTRIBUTION OF CHAPTER 2 FUNDS 9
Summary 9
Total Amount of Funds Available to Serve Publicand Private School Students 10
Size of Local Chapter 2 Formula Grants 13Local Allocation of Chapter 2 Funds to Serve
Students in Private Schools 21Changes in Funds Distribution Over Time 24
III LOCAL EXPENDITURE? 33
Summary 33Public School District Spending Patterns 34
District Use of State Discretionary Funds 46Expenditures for Private School Students 46Changes in Spending Patterns Over Time 48
IV INFLUENCES ON LOCAL CHAPTER 2 SPENDING 57
Summary 57Size of the Chapter 2 Grant 59Loss of Chapter 2 Funds 62The Desire to Continue Antecedent Programs 66Uncertainty About Chapter 2 Funding 67Uncertainty About Chapter 2 Audit Requirements 70Local, State, and National Priorities 71
iii

V SUMMAR" AND CONCLUSIONS
Distribution of Chapter 2 FundsLocal Chapter 2 Spending PatternsInfluences on Chapter 2 Spending Patterns
REFERENCES
Appendix A:
Appendix B:
Technical Notes and Standard Error Valuesfor Tables
List of Antecedent Programs Consolidated intothe Chapter 2 Block Grant
iv
77
77
80
82
85
87
119

LIST OF TABLES
II-1 Funds Available to Local Education Agencies Under AntecedentPrograms and Chapter 2 (Through Formula Allocations)
11-2 Percentages of Funds Distributed According to FormulaCriteria
11-3 Average (Median) Formula, Discretionary, and Total Chapter 2Funding, by District Size (1984-85)
11-4 Number and Percentage of Districts Receiving VariousAmounts of Funding in 1984-85
11-5 Average (Median) Amount of District Chapter 2 FundsPer Pupil, by District Size
11-6 Distribution of State Chapter 2 Discretionary Funds,by District Size
11
14
16
17
18
20
11-7 District Allocations for Services to Public and PrivateSchool Students for School Year 1984-85, by DistrictSize 23
11-8 Median Antecedent Funding and Total Chapter 2 Fundingfor 1982-83, by District Size 25
11-9 Districts That Lost and Gained Funding Under Chapter 2,by District Size
II-10 Average (Median) Loss or Gain from Antecedent Fundingin 1981-82, by District Size (1984-85)
II-11 Districts That Lost and Gained Funding Under Chapter 2,by Orshansky Poverty Level
III-1 Chapter 2 Expenditures in Different Activity Areas
111-2 Number of Activity Areas in Which Districts SpendChapter 2 Resources, by District Size
111-3 Average Proportion of Chapter 2 Funds Allocated toEach Activity Area, by District Size
111-4 Total Chapter 2 Funds Allocated to Each Type ofPurchase
v
28
30
31
36
38
39
42
111-5 Average (Median) Chapter 2 Amounts Allocated to EachLine-Item Expenditure Category
111-6 Comparison of Services to Public and Private SchoolStudents
44
47
111-7 Spending Patterns for Antecedent Programs in 1981-82and for Chapter 2 in 1982-83, by District Size 49
111-8 Chapter 2 Spending Patterns Across the 3 Years of theBlock Grant, by District Size 53
IV-1 Percentages of Districts Allocating Chapter 2 Funds toActivity Categories, by Size of Chapter 2 Grant 60
IV-2 Average 2roportion of District's Chapter 2 Funds Allocatedto Each Activity Area, by Size of Chapter 2 Grant 61
IV-3 Loss of Chapter 2 Funds as an Influence on Chapter 2Spending, by District Size 63
IV-4 Influence of Funds Loss on Spending for Staff orStudent Services, by District Size 64
IV-5 Antecedent Programs as an Influence on Chapter 2Spending, by District Size 68
IV-6 Uncertainty About Chapter 2 Funding as an Influenceon Spending, by District Size 69
IV-7 Uncertainty About Audits as an Influence on Spending,
by District Size 72
IV-8 Influence of Local, State and National Priorities on
Use of Chapter 2 Funds 73
IV-9 Use of Chapter 2 Funds to Support Reform Priorities 74
LIST OF FIGURES
II-1 Percentage of All Districts and Those Formerly ReceivingESSA Funds Losing or Gaining Funds Under Chapter 2, by
Degree of Loss or Gain
vi
27

PREFACE
This document is one of a series of reports resulting from SRI'sNational Study of Local Operations Under Chapter 2 of the EducationConsolidation and Improvement Act (ECIA). Chapter 2--the first federallysupported education block grantconsolidated 28 former categorical programsinto a grant of funds to all school districts, to be used for any of thepurposes in the preceding programs. The block grant was implemented inschool districts across the nation in the 1982-83 school year, followingpassage of ECIA in 1981.
In response to numerous demands for information about the block
grant's implementation and effects from the U.S. Congress, other federalagencies, and interest groups, and in anticipation of its own need to informdebate on reauthorization and appropriations, th, U.S. Department ofEducation commissioned SRI, in collaboration with Policy Studies Associates(PSA), in 1983, to study Chapter 2. The two-year inventigation was to focusits data collection on the third year of implementation, the 1984-85 schoolyear, although information was also gathered to examine the first two yearsof Chapter 2 and the year preceding it, the last in which programsconsolidated into the block grant were operating.
The SRI study did not take place in a vacuum. For variousreasons--among them, the newness of the block grant mechanism in federaleducation aid, the lack of a formal reporting route from the local tofederal levels, the fact that shifting to a block grant format significantlyredistributed funds -- numerous smaller investigations were mounted by federalagencies (including ED), independent research, which we review in Section I,documented various effects in, but also left many questions unansweredabout, the first and second years of implementation, and especially withregard to the local level in longer-term perspective.
Building on the foundation 'milt by these earlier studies, the SRIinvestigation had the following purposes:
(1) Describe local activities and operations under Chapter 2 in theprogram's third year, noting changes over the first three years ofthe program and changes from antecedent programs.
(2) Assess the achievement of federal legislative goals, inparticular, educational improvement, reduction in administrativeburden, and an increase in programmatic discretion at the locallevel.
(3) Describe how the federal block grant mechanism (Chapter 2 fundingor guidelines and state actions or interpretations) influences LEAactivities.
(4) Determine how state and local education agencies evaluate theirChapter 2 programs and develope options so that the Deparmtnet ofEducation (ED) can offer technical assistance.
vii

(5) Draw lessons from Chapter 2 implementation and effects for future
federal policies.
To fulfill these purposes and obtain a comprehensive description of
local activities and operations under Chapter 2, the study is organized
around five major topics. Each of these represents a purpose of the law or
a set of issues regarding the block grant mechanism.
. Education service delivery (concerning the nature of educationservices supported by Chapter 2 and their contribution to educationimprovement).
. Funds allocation and expenditure (concerning the types ofexpenditures under Chapter 2 and the influences on local spending).
. Local program administration and decisionmakin (concerning the way
in which programs are administered and the effect on administration/
paperwork burden; the nature of the decision process, theparticipation of parents/citizens, and implications for the exercise
of local discretion; local evaluation activities).
. Services for private school students (concerning expenditures forservices to private school students and the delivery of theseservices; their participation in Chapter 2 supported activities, theadministration of these services).
.Intergovernmental relations (concerning the roles and interaction of
local, state, and federal levels under Chapter 2).
The results of the study have been reported in three ways:
(1) A comprehensive report, emphasizing descriptive findings in alltopic areas and summarizing the analyses in special issue reports.
(2) A series of shorter reports addressing five special issues:services for private school students, the achievement oflegislative goals, the allocation and expenditure of funds, theparticipation of parents and citizens in decisionmaking, and
intergovernmental relations.
(3) An options paper for state and local audiences regarding ways toevaluate activities supported by the block giant.
Titles and authors of all these reports are listed on the back of the
title page of this document.
Michael S. Knapp,
Project Director
December 1985
viii
1 (1
ACKNOWLEDGMENTS
A study of this magnitude represents the ideas, energy, andperseverance if many people. We wish to acknowledge their contributions andthank them for their willingness to help the study toward successfulcompletion.
First, we owe much to the patience and support Jf various state
Chapter 2 coordinators, who listened to plans for the study, madesuggestions, and encouraged their districts to participate. Those who saton the Study's Advisory Panel--Darrell Arnold, Weaver Rogers, and CarolynSkidmore--and the members of the State Chapter 2 Coordinator's SteeringCommittee deserve special mention.
The findings of our research synthesize the responses of many schooland district staff, school board members, parents, and others at the locallevel. To all who took the time to respond to our questionnaires or answerinterview questions, we owe the deepest gratitude--for taking the time fromtheir busy lives to provide information that helps those at a greaterdistance understand what the block grant contributes to their schools orschool districts. Particular school district staff, who advised us duringthe course of the study, deserve special mention: Todd Endo, Gerald King,Alan Osterndorf, Tom Rosica, and Ken Tyson.
Numerous national associations and interest groups have helped shapethe plans for the study, critiqued draft reports, or both, among them:
Susan Hennessy, Council of Chief State School Officers (also members of itsCommittee for Evaluation and Information Systems); Claudia Mansfield,American Association of School Administrators; Marilyn Rauth, AmericanFederation of Teachers; Robert Smith, American Council on Private Education;Joseph McElligott, California Catholic Conference; Michael Casserly, Councilof the Great City Schools; Arnold Fege, National Parent TeachersAssociation; James .Jess, Rural Education Association; Anne Henderson,National Committee for Citizens in Education.
In the U.S. Department of Education, individuals in many parts of theagency took an interest in the study ani helped focus its questions andapproach to research. The Project Officer, Carol Chelemer, of the Planningand Evaluation Service in the Office of Planning, Budget, and Evaluation,shepherded the investigation through its various stages with humor, insight,and unwavering support. We much appreciated the contributions of others inthe Department, among them: Janice Anderson, Charles Blum, Lois Bowman,Cecil Brown, Lawrence Davenport, Fred Graves, Linda Hall, Gary Hanna,Patricia Jones, Allen King, Stanley Kruger, Patsy Matthews, David Morgan,Kay Rigling, Robert Stonehill, Kenneth Terrell, and Zulla Toney.
ix

In other federal agencies and the U.S. Congress, we found individualswho were insightful about what needed to be studied, how to gather theinformation, and the ways to present our findings. We wish especially tothank: Mary Kennedy, National Institute of Education; Paul Grishkat, DavidBellis, and Frederick Mulhauser, U.S. General Accounting Office; KathyBurchard, Barry White, Richard O'Brien, and Barbara Young, U.S. Office ofManagement and Budget; Dan Koretz, Congressional Budget Oftice; JackJennings, Marc Smolonsky, and Richard DiEugenio, congressional staff in theU.S. House of Representatives; Bruce Post and Ann Young, congressional staffin the U.S. Senate.
Colleagues in universities, research firms, and elsewhere contributedwide-ranging technical expertise to the various design and analysis issues
confronting the study. In this regard, we are especially grateful to RobertGoettal who commented on an earli=r version of this report, and to WilliamMadow who helped with sampling and statistical issues.
Finally, the dedication and professionalism of the entire study teamwas the key to making this research successful. Marian Stearns, Director of
SRI's Social Sciences Department and Project Director during the study'sdesign phase, deserves special mention for her unflagging enthusiasm andgood sense about research on federal aid to education. Others on the study
team, besides the authors of other reports (see inside cover), include theseSRI staff: Linda Burr, Marion Collins, Carolyn Estey, Elaine Guagliardo,Mary Hancock, Deborah Jay, Ruth Krasnow, Klaus Krause, Lynn Newman, Debra
Richards, and Kathy Valdes. Other individuals who worked as field staff
helped us gather useful interview information on numerous field visits:Brian Delaney, Peggy Estrada, Gene Franks, Susan Peters, and Stephen
Thornton.
To all these people, we wish to say that your contributions were much
appreciated.

NOTES FOR READING TABLES
Tables in this report are generally broken out by district sizecategory, because the enormously skewed distribution of districts nationwidemay distort the reader's understanding of national estimates (the largenumber of very small districts, for example, means that most overallestimates are largely a reflection of these). The breakout also enables thereader to appreciate the considerable differences in block grant impact andimplementation in districts of different size.
Size categories also comprise differing proportions of the nation'sstudent population. We indicate below the number and percentage ofdistricts falling in each size category, as well as the proportion of thenation's students represented.
Where relevant, the "very large" category has been further subdividedinto urban districts and suburban county systems (wUch may include amoderate-sized city as well) because the characteristics and responses ofthese two types differ substantially.
Number (and percentage)District Size of districts(Enrollment) within range
Proportionof nation'sstudents
Very large 163 (1.0%) 25.8%(25,000 or greater)
Urban 92 (0.6%) 15.8
Suburban 71 (0.5%) 10.0
La:75e 466 (3.0%) 17.3(10,000 to 24,999)
Medium 3,027 (19.5%) 35.1(2,500 to 9,999)
Small 5,369 (34.6%, 17.9(600 to 2,499)
Very small 6,508 (41.9%) 3.8
(Less than 603)
TOTAL 15,533 (100%) 100.0%
xi
Ii

Wherever tables are presented without subdivision into these
categories, the reader may assume that the differences among categories are
statistically insignificant or irrelevant to the analysis in question.
To simplify presentation, tables do not include standard errors. These
and accompanying technical notes may be found in Appendix A.
For the most part, this report describes funds distribution and
spending patterns by presenting national estimates of local Chapter 2
allocations (in dollars) or numbers and percentages of districts spending
Chapter 2 dollars in particular ways. Unless otherwise noted, dollar
allocations will be reported as weighted medians, numbers of districts will
be reported as weighted counts, and percentages will be weighted means.* In
addition, ranges between the 10th and 90th percentiles will be reported with
medians (sae Standard Error Tables, Appendix A).
Although less often reported than means, medians are easily
interpreted. The median represents the midpoint of a group of numbers. For
example, the median total Chapter 2 budget for very large urban districts is
$451,385. This means that half the very large urban districts in the nation
received more than $451,385, and half received less. (See Technical Notes,
Appendix A).
*The mail survey sample represents roughly 10 percent of the nation's
districts. Survey responses were weighted by the proportion of districts
selected from each cell in the sampling stratification scheme.
xii
14
I INTRODUCTION AND OVERVIEW
This report examines the distribution of funds to school districts
under Clapter 2 of the Education Consolidation and Improvement Act (ECIA) of
1981, otherwise referred to as the federal education block grant, and the
way these funds are spent at the local level. In this introduction, we
review findings from early studies regarding the fiscal effects of
Chapter 2, present the research questions that motivated our investigation,
and discuss the sources of the data used in this 'report. Subsequent
sections describe the distribution of Chapter 2 funds, analyze how districts
spend the funds, and present explanations for local spending patterns.
Themes in Existing Research
The fiscal effects vf Chapter 2 have attracted more research attention
than other aspects of the block grant's implementation. Early studies
focused on the way the block grant redistributed funding, but also
identified possible spending patterns and key influences on these
expenditures. Although not based on comprehensive data, the findings of
these studies provided a useful starting point for our research.
One must keep in mind the national context for the fiscal effects of
the block grant. Federal appropriations for Chapter 2 represented an
initial loss of approximately 12% of federal funds compared with the
aggregate amount appropriated under the 32 cEtegorical programs*
*We will refer to these programs collectively as the "antecedent programa"and to funding for these programs as "antecedent funding." A completelisting of these programs and their authorizing laws appears in Appendix B.
1
10

consolidated into the education block grant. In dollar amounts, the
appropriations decreased from approximately $512 million in school year
1981-82 to $456 million for the next school year. Although the block grant
has often been described as the cause of these cuts, sizable reductions had
occurred in large antecedent programs such as the Emergency School Aid Act
(ESAA) and in Title IV-C of the Elementary and Secondary Education Act
(ESEA) before these were consolidated into Chapter 2 (Jung and Bartell,
1983). The decrease in funding for the block grant thus contributed to cuts
in funds that already were under way.
Distribution of Federal Funds
Chapter 2 has resulted in redistribution of funds among beneficiaries
of federal education dollars. An important aspect of this redistribution is
the change from allocation of funds based on enrollment together with
competitive grants for specific purposes to distribution mainly by
enrollment.* Early studies of the block grant suggested that this change
resulted in funding losses for many large urban districts, for recipients of
ESAA grants, and for many districts with the resources and skills to seek
competitive grants, while districts without these characteristics gained
(American Association of School Administrators, 1983). In case studies of
Chapter 2 in nine states (Kyle, 1983), the most common characteristics of
districts that gained money under Chapter 2 were small size and a lack of
participation in categorical programs.
Other studies noted that the formulas by which states distribute
Chapter 2 funds to LEAs may contribute to this redistribution. Although
same states allocate large percentages of their Chapter 2 money based on a
district's percentage of "high cost" children--for example, children from
low income families--other states base their formulas mostly on enrollment.
*States, however, may adjust their Chapt:a. 2 formulas to mitigate the
impact of redistribution based on enrollment.
2
16

The General Accounting Office (1984) reported that in the first year of the
block grant (school year 1982-83) 37 states distributed at least 60% of
their flow-through money on the basis of enrollment. Twenty-eight states'
formulas apportioned between 70% and 90% on the basis of enrollment.
Changes in the way funds were apportioned among states could also mean
redistribution among types of students served by Chapter 2 funds. Some
researchers have maintained that states with high numbers of minority-group
children and with districts receiving ESAA funds sustained the largest
reductions under Chapter 2: the initial "winners" under the block grant
ten--a to be the more sparsely settle states with few minority children and
prosperous economies (Verstegen, 1983).
Decisions at the state level also could have redistributional effects.
Fewer high-cost adjustments are employed in Chapter 2 than were used under
ESFA Title IV-B--one of the largest antecedent programs (Fries, 1983).
Apparently, there has been a net decrease in the number of states using
sp-rsity (an indicator of student dispersion in rural districts, which also
increases the cost of educating children) and counts of exceptional
students, limited-English-speaking students, and students in state
institutions in their formulas for allocating Chapter 2 funds. Probably
because of the goal of some states to reimburse those districts that lost
funding from ESAA cuts, there has been an increase in states using a
minority isolation or desegregation criterion for high-cost adjustments.
Early research also hinted at another type of redistribution: in some
districts the block grant could mean more funds for services to private
school children and therefore fewer funds for students in public schools.
Although many antecedent programs permitted services to private school
students, these students' participation in most of the programs that were
folded into Chapter 2 was minimal. (Title IV-B was the major exception to
this pattern.) Because Chapter 2 combines programs with broad and minimal
participation of private school students and requires "equitable
participation" for these students, some early research suggested that the
3

public schools provided more Chapter 2 resources to students in private
schools than they provided under the antecedent programs.
Use of Chapter 2 Funds
Initially, little was known--except through anecdotal data--about local
spending patterns. Researchers directed some attention to whether districts
purchased materials and equipment or pay staff salaries with Chapter 2
resources. The general finding was that most districts purchased materials
and equipment (American Association of School Administrators, 1983). One
estimate suggested that 88% of the districts spent at least half of their
grants on materials or equipment (Henderson, 1983). Early data indicated
that the purchase of computers was a popular use of the funds.
Preliminary findings are somewhat contradictory regarding whether
these equipment purchases were isolated acquisitions or integrated into
broader district goals of using educational technology. In many cases,
computer purchases seemed related to already identified district priorities
(Kyle, 1983). Other observers maintained that both teachers and students
were unprepared to use the computers that were purchased. and that few
training programs were planned or in place to fill this gap (Henderson,
1983).
Studies also investigated the degree to which districts had begun new
programs as opposed to continuing activities funded under antecedent
programs. The GAO (1984) reported that at least 80% of local districts
surveyed indicated that they either maintained or increased their level of
support for existing programs. Other findings suggested that Chapter 2
money was being used more often to maintain or expand existing programs
rather than to start new ones (Hood, 1982; Kyle, 1983). This could mean
continuing to support programs begun under Title IV-C, the antecedent
program aimed at developing innovative practices, rather than developing new
programs (Henderson, 1983).
4

Influences on Spending
In addition to describing initial spending patterns, some early studies
of the block grant's fiscal effects discussed possible influences on local
spending. Some research tried to explain districts' tendencies to fund
purchases and programs that were supported by antecedent programs (e.g. Fries,
1983). Two possible explanations were suggested for these "holding patterns."
First, the consolidation of programs under Chapter 2 coincided with cuts in
other federal and state programs in many districts. As a result, districts
tended to maintain what was in place (sometimes at a reduced level) rather than
begin new endeavors. Second, districts were uncertain that funding for
Chapter 2 would continue at initial levels. This uncertainty may have led some
districts to purchase library books, equipment, and materials rather than hire
new staff--in other words, to continue the expenditure pattern that prevailed
under ESEA Title IV-B. As "one time costs," buying equipment and materials is
less risky: recurrent costs and staff livelihoods are not at stake. Moreover,
if funds are cut, the district still has the books, computers, or film
projectors for use in subsequent years, whereas staff salaries would have to be
funded by other sources or staff would have to be laid off.
Another explanation suggested by these studies for purchasing equipment
and materials rather than paying salaries was the small amount of money
Chapter 2 provides to most districts. The Chapter 2 allocation for many small
and medium-size districts is not enough to pay even one teacher's salary and
fringe benefits (Verstegen, 1983). In addition, even when a district receives
enough Chapter 2 funding to pay for a few staff positions, district
administrators face the difficult decision of which programs or schools will
benefit. If they do not fund salaries, the decision is less painful. the
district can easily distribute Chapter 2 funds equitably by providing each
school with an allotment based on enrollment or some other criterion.
While reporting holding patterns in many districts, case study research
suggested that few generalizations about local responses to Chapter 2 are
possible because of differences in local contexts regarding, for example, other
5

cuts in federal programs, state and local fiscal conditions, and court orders
to maintain desegregated education (Kyle, 1983).
Federal requirements were another influence on local spending. Many
districts that had experience with other federal programs were concerned about
federal audits of Chapter 2, despite assurances that the money came with "no
strings attached" (Kyle, 1983). In this regard, the federal supplement-not-
supplant provision raised particular concern under the block grant
(Darling-Hammond and Marks, 1983). Like other federal programs such as ECIA
Chapter 1, Chapter 2 funds are supposed to add to state and local expenditures,
not replace them. This provision can limit the local flexibility that
Chapter 2 seeks to maximize. For example, if a state requires that all
students take courses in computer literacy, districts in that state might avoid
purchasing computers with Chapter 2 funds because that could be interpreted as
supplanting.
Although many early studies of Chapter 2 found th4., districts tended to
continue purchasing equipment and materials and to continue existing programs,
some identified factors that might lead districts to purchase different
services with Chapter 2 funds, such as a change in economic conditions or a
change in state or local priorities. For example, some state education
agencies (SEAs) reportedly recommended to their districts that they use
Chapter 2 funds for new programs or services in light of service cutbacks
resulting from state and local revenue shortages, so that LEAs could protect
themselves from charges of supplanting (Darling-Hammond and Marks, 1983).
Research Questions
Early studies of the block grant's fiscal effects have produced some
provocative data, but have left many questions unanswered. As a result, the
following research questions were formulated to guide our inquiry, so that we
would be able to substantiate or modify early findings and answer some
remaining questions.

Distribution of Chapter 2 Funds
(1) How are Chapter 2 funds distributed across districts of differentsizes?
(2) Are there differences in the relative size of Chapter 2 grants todistricts of different sizes?
(3) For districts of different sizes, what amounts and percentages ofChapter 2 funds are allocated for services to private schoolstudents?
(4) Which kinds of districts have gained and lost funds as a result ofChapter 2, and how much have they gained and lost?
Use of Chapter 2 Funds
(5) What do Chapter 2 funds purchase for students in public schools?
(6) What do Chapter 2 funds buy for private school students, and how dothese purchases compare with purchases for public school students?
(7) How do purchases under Chapter 2 compare with purchases underantecedent programs?
(8) To what extent have purchases changed over the first 3 years ofChapter 2?
Influences on Local Spending of Chapter 2 Funds
(9) To what extent does the size of the Chapter 2 grant influence howfunds are used?
(10) Do spending patterns differ for districts that gained and lostfunds under Chapter 2?
(11) To what extent do local perceptions of Chapter 2 influence how thefunds are used?
(12) To what extent do local, state, and national priorities influenceChapter 2 spending patterns?
Sources of Data
The data we use in this report come from the overall data collection
for the National Study of Local Operations Under Chapter 2:
7
2

. A mail questionnaire sent to a nationally representative sample of1,600 school districts in the middle of the 1984-85 school year, thethird year of Chapter 2's local implementation. Districts were
selected randomly within a stratification grid defined by threevariables: district ste, region of the country, and level ofantecedent funding per pupil. Questionnaires were filled out byChapter 2 coordinators (who often held other positions as well, suchas federal programs coordinator or superintendent). The overall
response rate was 78.2%, and about the same rate was obtained fromall strata of the sample.
. Visits to 48 school districts in 20 states. These districts were
two samples of 24 districts each. One sample, visited in the fallof 1984, was chosen to reflect the principal variations in districtsize, region, and antecedent funding represented in the samplinggrid for the mail survey. The second sample, visited in the springof 1985, consisted of an average of three districts of varying sizeand metropolitan status in each of eight states. These districtswere selected to include variation on state and local factors likely
to influence the implementation and impact of Chapter 2 (e.g., thedegree of state versus local control, local fiscal conditions, sizeof the private school population, degree of funding gain or lossunder the block grant, and interest group activity). In this
report, we use data gathered at the district level (e.g., from theChapter 2 coordinator, superintendent, and school board member) in
each sample.
Further information on the study's research methods appears in an
appendix to the main descriptive report of the National Study (Knapp and
Blakely, 1986).
8
2 ti

II DISTRIBUTION OF CHAPTER 2 FUNDS
This section describes the distribution of Chapter 2 funds in the most
recent school year (1984-85) and in preceding years. First, we discuss the
total funds available to local school districts under antecedent programs
and under Chapter 2. Next we report Chapter 2 funds distribution for
1984-85, both from formula and state discretionary sources. Then, we
discuss the allocation of funds for services to studente attending private
schools. The final part of this section reports changes in mounds
diatribution patterns from the year before the enactment of Chapter 2
(school year 1981-82) to the present.
Summa
The following are the major findings reported in this section:
(1) Because enrollment is an important factor in all state formulas,the distribution of Chapter 2 funds to local school districtsclosely matches district enrollment.
(2) On average, Chapter 2 funds make up less than 1% of a district'soperating budget and provide between $7.00 and $9.00 per pupil.(This represents a larger proportion of the funds over which localdecisionmakers have discretion.)
(3) Most local funds from Chapter 2 are distributed by formula.
. Very few districts receive additional funding from state
discretionary programs.
. State discretionary grants to LEAs tend to be small and usuallyprovide onetime funding.
(4) An estimated 37% of the nation's districts use Chapter 2 funds toprovide direct services to students in private schools.
9

. The average funding for Chapter 2 services to students attendingprivate schools ranges from $42,851 in large urban districts to$1,614 in districts with enrollments between 600 and 2,500students.
. The proportion of district Chapter 2 funding used to provide
services to private school students averages 10% of thedistrict's total Chapter 2 grant.
(5) Approximately three-quarters of all districts gained funding as aresult of Chapter 2, but some types of districts were more likely
to lose than others.
. Fifty-three percent of the largest urban districts (enrollment25,000 or more) lost funding.
. Overall, approximately one-fifth of districts with poverty ratesof 29% or higher lost funds as a result of Chapter 2.
. Three-fifths of the poorest large urban districts lost funding.
. Districts formerly receiving ESAA funds fared worst: more than
80% lost funding as a result of Chapter 2.
Total Amount of Funds Available to Serve Public and Private School Students
To put the subsequent discussion in context, we summarize in Table II-1
the total amounts of funds available to districts under antecedent programs
(in the 1981-82 school year) and under Chapter 2 (in the 1984-85 school
year) for both public and private school students. The table demonstrates
several points about the block grant mechanism in contrast with what
preceded it:
. Under either funding mechanism, the great majority of the funds,
slightly more than 80%, is available for direct use by districts,once the inapplicable portions of the Chapter 2 appropriation areremoved (e.g., the Secretary's Discretionary Fund).
. Overall, the total amount of funds available to districts hasdropped by approximately 16%. (This drop occurred in the first year
of the block grant; in the subsequent two years, it was funded atapproximately the same level.)
10
2,1

Table II-1
FUNDS AVAILABLE TO LOCAL EDUCATION AGENCIES UNDERANTECEDENT PROGRAMS AND CHAPTER 2 (THROUGH FORMULA ALLOCATIONS)
Antecedentprograms
FY 81
Chapter 2
FY 84
Total federal appropriations $536,378,000 $479,420,000
Funds not available fordirect use by LEAs:
Secretary's fund (25,446,000) (28,765,000)Trust territories (est.) (3,940,000) (4,800,000)Puerto Rico (est.) (9,126,000) (8,000,000)State administrative set-asides,grants to IHEs, othercontracting agencies (est.) (81,800,000)* (87,560,000)**
Remaining funds available fromformula allocations for directuse by LEAs (for public & privateschool students) 416,066,000 350,295,000
SRI estimate of district grantsBased on mail questionnaire sample 403,154,800 344,992,000Services for public school students 323,307,462Services for private school students 21,684,538
Extent to which SRI estimate deviatesfrom aggregate figures -3.1% -1.5%
*Based on estimates in Henderson, 1985.
**A proportion of this amount is reallocated to districts in the form ofstate discretionary grants. See discussion in text.
+Unavailable.
11
20

. Both the amount and proportion (of total federal funds under theblock grant and antecedent programs) available to stategovernments--that is the state set-aside--have increased slightlyunder the block grant.
The table also notes the precision of SRI's estimates of the formula
funds available to districts; although slightly underestimating the amounts
available in either year, the results of our mail survey paint an accurate
picture for the purposes of this study.
Although the analyses that follow concentrate on the funds directly
available to districts, this approach slightly understates the total of
services districts may have received under either funding mechanism,
especially antecedent programs, where a sizable portion of the funds for
state agencies (or agencies contracting with it) supported technical
assistance, training services, curriculum consultation, and other forms of
service that contributed to districts' instructional programs. There is
some evidence that these kinds of services have diminished tinder Chapter 2,
but our study does not have comprehensive information on what states did
with their share of block grant funds.
Some of the state cet-aside under the block grant may reach districts
in the form of direct grants--either through grant competitions or as
subsidies to compensate districts for losses from the antecedent programs
(as in the case of desegregating districts in acme states, which received
extra funds in the first and second years after the block grant to help
maintain programs formerly funded by ESAA). This means that the figures in
Table II-1 need to be slightly adjusted to represent the true amount of
funding available to districts:
Total funds available to districtsfrom formula allocations in1984-85 (SRI estimate) $344,992,000
Total state discretionary grantsin 1984-85 (SRI estimate) $ 5,770,968
$350,762,968
12
2b

The total amount allocated to districts by states through discretionary
grauts has declined somewhat over the three years of the block grant,
reflecting primarily the fact that some grants were meant as short-term
support while districts adjusted their desegregation programs in the first
few years of Chapter 2 implementation (carry over from antecedent programs
may have also influenced the funds states were able to share with districts).
Total state discretionary grants reported by districtsfor the three years of the block grant
1982-83 $7,500,b901983-84 $7,614,7,i1984-85 $5,770,568
Size of Local Chapter 2 Formula Grants
Allocation of formula funds is based on state-determined formulas, which
factor in enrollment and adjust for high costs associated with educating
certain groups of children. Discretionary funds are distributed by states
to selected districts through a separate process, often as competitive
grants. The total Chapter 2 funding for a district is the sum of these two
allocations.
Size of Formula Grants to Districts
ECIA requires that all states use enrollment as one criterion in their
formulas for distributing funds to districts. States also include
"high-cost" criteria in their formulas to compensate districts that, for
example, serve high proportions of students from low-income families or
students with limited English proficiency.
Table 11-2 summarizes the criteria states use in their Chapter 2
formulas. Although all states use district enrollment as one criterion for
distributing chapter 2 funds, the proportion allocated on this basis varies
from 21% to 100%. Forty two states use the number of students from
low-inlme Rallies as a criterion for distribution, but this proportion13
2

Formula
Criterion
Table 11-2
PERCENTAGES OF FUNDS DISTRIBUTEDACCORDING TO FORMULA CRITERIA
Number of statesusing criterionin their distri-bution formula
Median percentage of
of funds distributedaccording to each
criterion*
Range
Minimum Maximum
Enrollment 50 72 21 100
Lowincome 42 15 1 60
Sparsity 24 5 * * 30
Taxeffort 5 10 2 18
Limited
Englishproficient 7 5 * * 6
Gifted andtalented 6 8 1 8
Low/highAchievement 5 18 13 36
Desegregation 7 18 7 4:4
Handicapped 16 7 2 43
Other 2 1 1 1
**
Median calculated for districts that use each criterion.
Less than 1%.
Source: U.S. Department of Education.
14
2

varies from 1% to 60% in Chapter 2 formulas. Overall, 68% of Chapter 2
formula funds are distributed according to district enrollment; the
remainder are apportioned according to other criteria, which usually
compensate districts that serve high proportions of high-cost children.
Table 11-3 shows the vast range in formula or "flow-through" funds.
Since local enrollment is a major factor in all state formulas, it is not
surprising that allocations of formula funds closely follow district size.
Morever, since districts vary greatly in the number of children served,
there is vast range in Chapter 2 formula or "flow-through" funds districts
receive.
The number and percentage of districts receiving various amounts of
funding (Table 11-4) provides another perspective on Chapter 2 funds
distribution. While local Chapter 2 funding ranges from over $1,000,000 to
less than $100, it is clear from Table 11-4 that the great majority of the
nation's school districts receive less than $50,000 from Chapter 2 and that
over 40% receive less than $5,000.
Chapter 2 allocations represent a relatively small propertion of local
district revenues. Overall, Chapter 2 makes up roughly 0.3% of district
funding, in districts of all sizes. This percentage is not as small as it
may seem. The great majority of local district operating budgets are not
subject to district decisionmaker's discretion. Chapter 2 funds make up a
proportion of district discretionary money considerably larger than this
0.3%, though still small by comparison with other state and federal programs.
Table 11-5 shows that Chapter 2 is also a modest source of funding when
compared with the overall per pupil expenditure for districts in our sample,
which averages about $3,000 per pupil. In addition, we see some evidence
that larger urban and very small districts receive more money per pupil than
do districts of other sizes. This pattern reflects the extra compensation
that most state formulas provide for high-cost children, who tend to be
concentrated in larger urban areas, and state adjustments for sparse
population, which benefit very small districts.
15

Table 11-3
AVERAGE (MEDIAN) FORMULA, DISCRETIONARY, AND TOTAL CHAPTER 2 FUNDINGBY DISTRICT SIZE (1984-85)
District Size(Enrollment)
Medianformulafunds
Median statediscretionary
funds*
Mediantotalfunds
Very large
(25,000 or more) $397,587 $39,000 $399,709
Urban 451,385 40,000 451,385**
Suburban 310,301 34,000 341,704
Large 104,000 18,928 107,212
(10,000-24,999)
Medium 29,602 9,648 29,823(2,500 to 9,999)
Small 9,00. 10,000 9,000**
(600 to 2,499)
Very small
(under 600)
2,036 -0- 2,036**
All districts 6,422 10,000 6,422
*-Med!.ans are for districts that received discretionary funds.
**Because of the nature of medians and the fact that state discretionaryfunding went to few districts, the "total" figure may be the same as the"formula" figure.
16
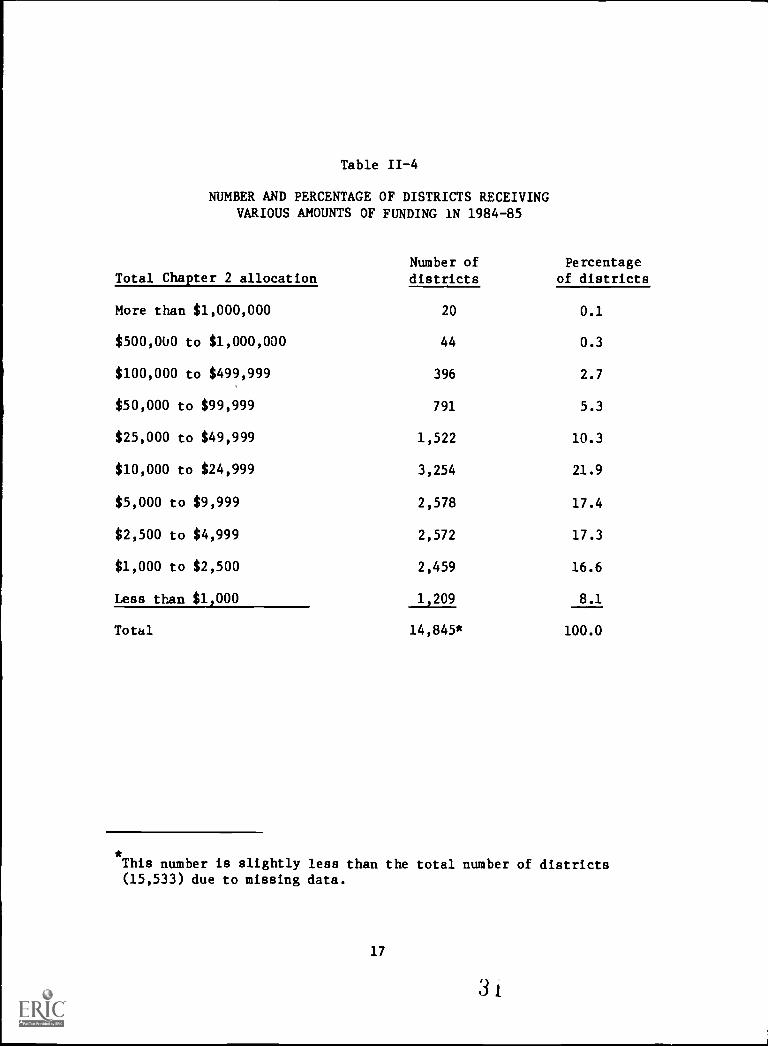
Table 11-4
NUMBER AND PERCENTAGE OF DISTRICTS RECEIVINGVARIOUS AMOUNTS OF FUNDING 1N 1984-85
Total Chapter 2 allocationNumber ofdistricts
Percentageof districts
More than $1,000,000 20 0.1
$500,000 to $1,000,000 44 0.3
$100,000 to $499,999 396 2.7
$50,000 to $99,999 791 5.3
$25,000 to $49,999 1,522 10.3
$10,000 to $24,999 3,254 21.9
$5,000 to $9,999 2,578 17.4
$2,500 to $4,999 2,572 17.3
$1,000 to $2,500 2,459 16.6
Less than $1,000 1,209 8.1
Total 14,845* 100.0
This number is slightly less than the total number of districts(15,533) due to missing data.
17

Table 11-5
AVERAGE (MEDIAN) AMOUNT OF DISTRICT CHAPTER 2 FUNDSPER PUPIL, BY DISTRICT SIZE
District Size
Median amountof 1984-85
district fundsPercentageof students
Percentageof nationalChapter 2
(Enrollment) per pupil nationwide funding
Very large $8.19 26 32
(25,000 or more)
Urban 9.19 16 22
Suburban 7.63 10 10
Large 7.16 17 16
(10,000-24,999)
Medium 6.85 35 30
(2,500 to 9,999)
Small 7.42 18 17
(600 to 2,499)
Very small
(under 600)
8.96 4 6
Total $7.89 100 100
18

Table 11-5 also compares the percentage of students nationwide with the
percentage of Chapter 2 funds for each district size category. Very large
urban districts and very small districts receive more of Chapter 2 funds
relative tr the number of students they serve while very large suburban
districts, large districts, small districts, and especially medium-size
districts receive relatively smaller amounts. Again, these patterns reflect
state formulas, which compensate very large urban districts for serving high
concentrations of high-cost students and compensate very small districts
because of sparse population.
Distribution of State Discretionary Funds
As the aggregate figures presented earlier make clear, state
discretionary funds going to LEAs represent a very small part of Chapter 2
funding, even for the nation's largest districts. The great majority of
districts in all size categories do not receive these funds.* While only an
estimated 1.6% of all districts received discretionary Chapter 2 funding in
school year 1984-85,** larger districts appear to be more likely to be
recipients (Table 11-6), partly because some states use their portion of
Chapter 2 funds as a mechanism to compensate districts that lost funds under
Chapter 2 and partly because larger districts often have more experience in
obtaining competitively distributed funding.
*One reason for this finding is that only eight states in 1984-85 had
programs providing part of the state set-aside portion of Chapter 2directly to districts: California, Connecticut, Florida, Michigan,Minnesota, North Carolina, Pennsylvania, Virginia.
* *
This finding is supported by the GAO (1984) report, which found that in 11of the 13 states in their study, the SEA retained the full 20% ofdiscretionary funds.
19
3,1
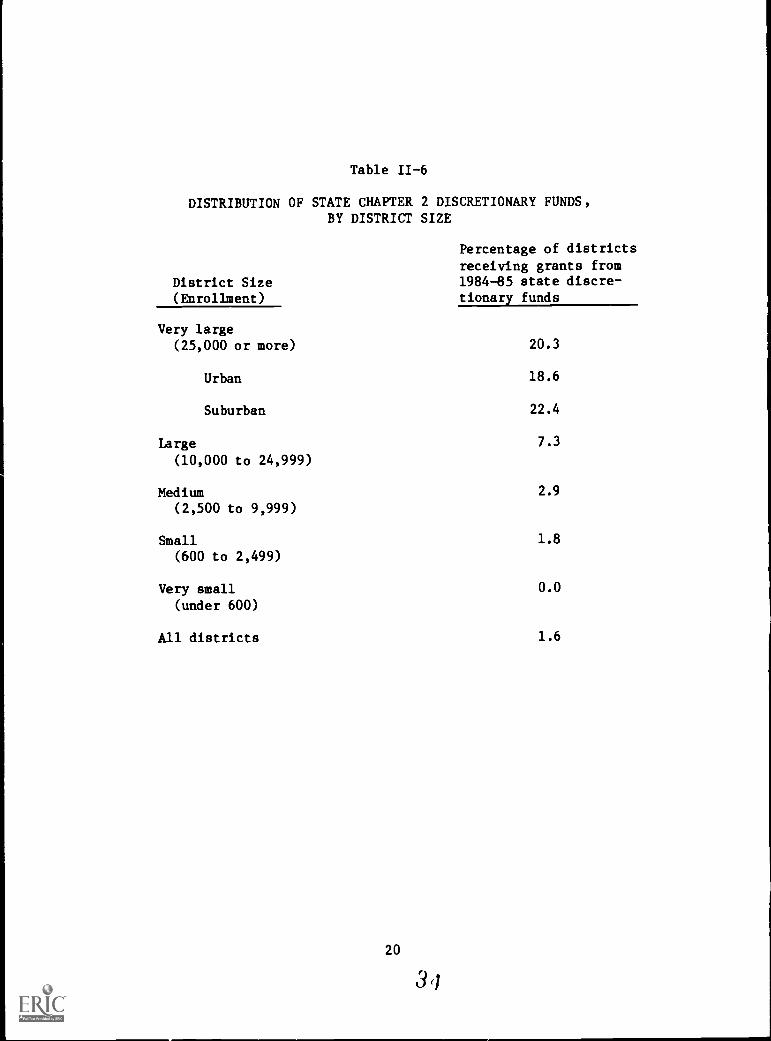
Table 11-6
DISTRIBUTION OF STATE CHAPTER 2 DISCRETIONARY FUNDS,BY DISTRICT SIZE
District Size(Enrollment)
Very large(25,000 or more)
Urban
Suburban
Large
(10,000 to 24,999)
Medium(2,500 to 9,999)
Small(600 to 2,499)
Very small
(under 600)
All districts
20
3`t
Percentage of districts
receiving grants from1984-85 state discre-tionary funds
20.3
18.6
22.4
7.3
2.9
1.8
0.0
1.6

State discretionary grants are typically modest ($10,000 T/as the median
award in 1984-85). States tend to "share the wealth" when tney do
distrilute discretionary funds to LEAs. That is, they tend to award
discretionary grants to different districts each year. Sixty-six percent of
the districts receiving discretionary funds were awarded funds for only one
of three years (school years 1982-83, 1983-84, or 1984-85). Nineteen
percent of the benefiting districts received state discretionary funding in
two of the three years since Chapter 2 was inaugurated. Sixteen percent
received this funding in all three years.
This pattern of discretionary funds distribution to LEAs tends to
support findings from other studies. For example, during the first two
years of Chapter 2, 12 states that gained funding under Chapter 2 funded
competitive grant programs for local districts out of their 20% share, but
in 1984-85, five of these states discontinued their programs; four of the
five had a heavy desegregation emphasis (Henderson, 1985). In general, SEAs
that used some of their 20% share to set up broad, competitive programs
tended to keep them, while SEAS that used the programs to hold ESAA
districts "harmless" tended to discontinue them once the transition period
passed. For example, one state we visited used some of its discretionary
money to offset ESAA losses by guaranteeing districts that had received
funds under this program 65% of their antecedent funding in the first year
of Chapter 2, 35% in the second year, and none thereafter.
Local Allocation of Chapter 2 Funds to Serve Students in Private Schools*
Districts are required to allocate a portion of their Chapter 2 funds to
serve students who attend eligible private schools within district
*For further detail on this topic, see another special report from thisstudy (Cooperstein, 1986).
21
boundaries. Chapter 2 specifies that public school districts provide
equitable Chapter 2 services to students enrolled in eligible private
schools that choose to participate in the program. In practice, "equitable
services" is often interpreted as allocating Chapter 2 funds on an equal per
pupil basis.
Overall, an estimated 37% of the nation's school districts provide
Chapter 2 services to students in private schools.* However, as the third
column in Table 11-7 shows, the proportion of districts providing services
to private school students varies greatly across districts of different
sizes. This is not surprising since a majority of private school students
attend schools in very large urban districts. We see that the median
allocation for private school students--reported in the second column of
Table II-7--is much larger in very large urban districts than in very large
suburban districts and large districts. This pattern also reflects the
concentration of private school students in large urban areas.
As expected, the median percentage of total Chapter 2 allocations used
to provide services to private school students is higher for very large
urban districts than for other districts (Table 11-7). The average
percentage of total Chapter 2 resources provided to private school students
in small districts may seem surprisingly high, but one must keep in mind
that only a few districts of this size provide Chapter 2 services to private
school students because the proportion of these districts with eligible
private schools is small. In those small districts that do serve private
school students, these students tend to make up a larger proportion of all
students. Our estimates indicate that private school enrollment in small
districts with eligible private schools averages 20% of total enrollment.
(The average in very large urban districts is 10%). Thus, larger
Seventy-five percent of the nation's school districts reported that therewere eligible private schools within their boundaries and that there wereno intermediate units or bypass provipions for Chapter 2 services to
students in these schools.
22
36

Table 11-7
DISTRICT ALLOCATIONS FOR SERVICES TO PUBLIC AND PRIVATE SCHOOL STUDENTSFOR SCHOOL YEAR 1984-85, BY DISTRICT SIZE
District Size(Enrollment)
Percentage of
Total LEAs providingpublic Private Chapter 2
allocations allocations* funds to private(median) (median) school students
Median percentage ofdistrict's total
Chapter 2 allocation(1984-85) used for
services for privateschool students
Very large(25,000 or more)
1373,216 130,881 87 8
Urban 394,417 42,851 90 9
Suburban 306,000 20,000 85 6
Large 101,112 7,817 75 7
(10,000-24,999)
Medium 28,258 2,393 47 8
(2,500 to 9,999)
Small 8,736 1,614 26 15
(600 to 2,499)
Very small(under 600)
- * * * * * * - * *
All districts 14,493 2,505 37 10
* Medians are based on those districts that reported Chapter 2 resources for
private school students greater than $0.00.
* *The number of responding districts is too small for reliable estimates.
23
3 r

proportions of the Chapter 2 grants in these small districts are required to
provide equitable services to private school children.
Table 11-7 may lead to the wrong conclusion about the amount of
Chapter 2 resources very large urban districts provide for services to
private school students. Although our national estimate is 10% of the
Chapter 2 grant, data from site visits indicate that this percentage can
vary significantly from one site to another. For example, one large
souaern district we visited, which had few students attending eligible
private schools, allocated just 4% of its Chapter 2 grant for serving these
students, as compel:2e. with 12% in a northeastern district of similar size.
One of the nation's largest school districts allocates 15% of its grant to
provide Chapter 2 services to private school students.
Changes in Funds Distribution Over Time
So far we have examined Chapter 2 funds distribution patterns for school
year 1984-85. However, the block grant has operated in school districts for
the last three school years. Prior to that, districts had various
combinations of the 32 antecedent programs that were consolidated into the
block grant. In the analyses that follow, we compare current funds
distribution to patterns under these antecedent programs, for all districts
and for those with high concentrations of poor children.
Overall Change in Fundin3 Since Antecedent Programs
Some of the initial controversy revolving around Chapter 2 resulted from
actual and perceived gains and losses when funding from the antecedent
programs was consolidated into the block grant. As Table 11-8 shows, the
median antecedent funding for school year 1981-82 was less, on average, than
Chapter 2 funding for the first year of the program, in all size categories
except the largest urban districts. Some districts lost money from
24
3

Table 11-8
MEDIAN ANTECEDENT FUNDING AND TOTAL CHAPTER 2 FUNDING
FOR 1982-83, BY DISTRICT SIZE
District Size Antecedent funds Total Chapter 2 funds Percent
(Enrollment) (1981-82) (1982-83) change
Very large(25,000 or more) $352,481 $382,716 9
Urban 543,923 433,100 -20
Suburban 250,281 329,171 32
Large 70,737 94,233 33
(10,000-24,999)
Medium 17,617 28,410 61
(2,500 to 9,999)
Small (n mg 5,369) 4,946 8,841 79
(600 to 2,499)
Very small(under 600)
1,399 1,972 41
All districts 4,706 6,532 39
25

antecedent funding even before the block grant was enacted, as we pointed
out in Section I. Some districts gained funds under Chapter 2 because they
did not participate in antecedent programs but now receive Chapter 2 funds.
These tended to be smaller districts that did not have the expertise or
interest to seek competitive grants, or else were districts not undergoing
desegregation and thus ineligible for ESAA.
Most districts gained funding when we compared the last year of
antecedent funding with Chapter 2 funding in 1984-85 (Figure II-1).
However, as the figure shows, a very different picture appears when we
examine the pattern of losses and gains for the approximately 600 districts
that received ESAA funding. Nearly all of these districts lost funding as a
result of Chapter 2; many ESAA districts lost large percentages of thei
antecedent funding.
Table 11-9 shows that roughly 75% of all districts gained some money
under Chapter 2. However, closer inspection of this table indicates that
gains and losses were not evenly distributed across different-sized
districts. For example, approximately 53% of all very large urban districts
lost funds as a result of Chapter 2, while 73% of all very small districts
gained funds. Approximately 2,800 very small districts received increases
of 75% or more over funding from antecedent programs.
At the same time, losing funds under Chapter 2 was not restricted to
large and very large districts. An estimated 110 small districts and 520
very small districts lost 75% or more of their antecedent funding. One of
the small districts visited in our study lost 52% of its funding. The
district had been very successful in obtaining grant money and did not
benefit from a distribution formula based on enrollment.
Although many large urban districts lost funds as a result of
Chapter 2, 20 such districts gained 75% or more over antecedent funds as a
result of Chapter 2. One very large urban district in our site visit sample
received over 3 times the funds it had received under antecedent
26
4 0

60
50
40
30
20
10
All districts
Districts that formerly receivedESAA funds
111,
. .s
Loss Loss Loss Little or Gain Gain Gainmore than between between No loss between between more than
75% 25% and 75% 5% and 25% or gain 5% and 25% 25% and 75% 75%
FIGURE II-1 PERCENTAGE OF ALL DISTRICTS AND THOSE FORMERLY RECEIVINGESAA FUNDS LOSING OR GAINING FUNDS UNDER CHAPTER 2, BYDEGREE OF LOSS OR GAIN
27
41

TaLle 11-9
DISTRICTS THAT LOST AND GAINED FUNDING UNDER CHAPTER 2, BY DISTRICT SIZE
District Size(Enrollment)
Percentage of districts that had ...
Greater than75% gain 26-75% gain 5-25% gain
Little lossor gain 5-25% loss 26-75% loss
Greater than75% loss
Very large(25,000 or more) 32* 12 8 5 15 23 6
Urban 26 11 8 3 13 29 11
Suburban 40 12 8 7 17 15 0
Large 47 15 8 3 6 18 3
(10,000-24,999)
Medium 50 19 5 4 5 14 4
(2,500 to 9,999)
cNJo Small 51 20 8 3 4 13 2
(600 to 2,499)
Very small
(under 600)
52 11 10 6 3 10 8
All districts 51 16 9 4 4 12 5
*
4
Rows may not sum to 100% because of rounding error.

programs. Unlike its neighboring large districts, this LEA was not an ESAA
recipient and had participated only in Title IV-B. As a result of high-cost
factors in the state Chapter 2 formula, which tended to benefit urban areas
(e.g., number of student's from low inccme families), the district became a
large "winner" under Chapter 2.
In addition to describing the percentage of districts that gained and
lost funding as a result of Chapter 2, it is instructive to indicate how
much districts lost or gained. Table II-10 reports median lost funds and
the average percentage lost for those districts that received less funding
under the block grant, and the median and percentage gains for those
districts that gained. This table reminds us of the difference in scale
among districts of vastly different size. A 50% loss in funds from
antecedent programs in a large urban district might mean $300,000, while a
medium-sized district might have lost $30,000. Similarly, a 50% increase
might mean an additional $150,000 for a very large suburb, but only $5,000
for a small rural district. The point is that a gain or loss may be the
same in terms of percentage, but orders of magnitude different in dollar
terms.
Loss or Gain in Districts With High Concentrations of Poor Children
An important concern when considering which districts lost or gained as
a result of Chapter 2 is how districts with high concentrations of poor
children fared. As we noted in Section I, some early studies of the effects
of Chapter 2 (for example, Verstegen, 1983) found that districts with large
numbers of children in poverty were worse off under Chapter 2 than under the
antecedent programs. We have also noted that state formulas often
compensate districts that serve high concentrations of poor students.
We found no clear relationship between rates of poverty and losing or
gaining funds as a result of the block grant, independent of the district
size factor. When all LEAs are considered, poverty concentration is not a
factor in gains cr losses: three out of every four districts gained,
29
4 4

Table II-10
AVERAGE (MEDIAN) LOSS OR GAIN FROM ANTECEDENT FUNDINGIN 1981-82, BY DISTRICT SIZE (1984-85)
District Size(Enrollment)
Districts that lost Districts that gained
Median
loss
Percentage
loss
Mediangain
Percentagegain
Very large $296,653 -41 $151,775 +107
(25,000 or more)
Urban 384,745 -46 150,942 + 79
Suburban 165,392 -21 158,338 +109
Large 75,144 -40 52,892 +118
(10,000-24,999)
Medium 29,912 -49 14,265 +110
(2,500 to 9,999)
Small 4,381 -39 4,934 +125(600 to 2,499)
Very small(under 600)
3,086 -59 1,288 +161
All districts $6,818 -48 $3,266 +127
30
4 6

irrespective of poverty concentration (Table II-11). The pattern is
different in large urban districts with higher concentrations of poor
children. In part because many of these districts received ESAA grants as
part of their antecedent funding, six out of ten large urban districts with
the highest concentrations of poverty lost funding as a result of Chapter 2.
Table II-11
DISTRICTS THAT LOST AND GAINED FUNDING UNDER CHAPTER 2,BY ORSHANSKY POVERTY LEVEL
Orshansky poverty level Lost Gained
For all districts 23%* 77%
Less than 10% 26 74
Between 10% and 19% 26 74
Between 20% and 29% 12 88
Greater than 29% 20 80
For very large urban districts 54 46
Less than 10% 40 60
Between 10% and 19% 61 39
Between 20% and 29% 45 55
Greater than 29% 60 40
*Rows sum to 100%.
31
4n

III LOCAL EXPENDITURES
In this section we analyze the ways districts spend the funds they
receive under the block great. We first examine expenditures for public
school activities, both in programmatic terms and by types of purchase. We
then turn to state discretionary funds received by districts and describe
how these funds are used. Following that, we briefly review the pattern of
expenditure for services to private school students. Finally, we examine
the changes in expenditure patterns over time, both across the 3 years of
the block grant and in contrast to antecedent programs.
Summary
Below are the major findings reported in this section. With regard to
expenditures for public school activities, we found that:
(1) Nearly sixty percent of local Chapter 2 funds are used to purchaseequipment, materials, and supplies.
(2) Onequarter of all local Chapter 2 funding goes for computerhardware purchases; another 5% was used for software.
(3) Districts with 10,000 or more students are more likely to use someof their Chapter 2 grants to pay for curriculum development,student support services, instructional services, and staffdevelopment.
(4) Larger districts tend to spread their Chapter 2 resources overseveral types of purchases, smaller districts usually concentratetheir purchases in one or two areasusually computer hardware andsoftware or other equipment and materials.
With regard to the use of funds for services to private school students, we
found that:
33
4'

(5) Chapter 2 services provided to students in private schools differedfrom services provided to public school stuuer.ts.
Ninety-two percent of the districts providing Chapter 2services to private school Ftudents purchase instructionalmaterials or equipment for these students' use.
Approximately two-thirds of these districts provide computersas part of the Chapter 2 services offered to private school
students, a large proportion (88%) of these districts providecomputers for stuaents in their own districts.
Only 6% provide instructional services to students in privateschools, although 24% use Chaptc.r 2 funds to provide
instruction for public school students.
Our findings about changes in expenditure patterns over time can be
summarized as follows:
(6) Spending patterns changed between the last year of the antecedentprograms and the first 3 years of Chapter 2.
. Only 19% of the nation's schools used antecedent funding forcomputer related purchases; 72% used Chapter 2 for such
purchases in 1984-85.
Fewer districts (68% vs. 89%) used the funds under the blockgrant for equipment and materials other than computers.
More districts (27% vs. 12%) used Chapter 2 for staff
development and teacher training.
Public School District Spending Patterns
Local expenditures under the block grant can be analyzed either
programmatically--that is, by the categories of activity supported by the
funds--or by type of purchase--that is, in terms of the line-item
expenditure categories (e.g., salaries, materials, consultants) that are
conventionally used in project budgets, applications for funding, and other
forms of fiscal reporting. We examine below the patterns of programmatic
expenditure and types of purchase for public school students.
34
46
Programmatic Expenditures
To assess how districts use Chapter 2 funds, we asked Chapter 2
coordinators who responded to the mail questionnaire how the block grant
funds were divided among a set of activity categories. The categories
provided in the mail questionnaire were:
. Computer applications ( involving computer hardware and softwarepurchased with Chapter 2 funds).
. Support for libraries, media centers, and other school departments(involving instructional materials and equipment other thancomputers--for example, books, films, and science equipment).
. Curriculum and new-program development.
. Student support services--for example, salaries for guidancecounselors.
. Instructional services--including salaries for teachers and aides.
. Staff development and training.
. Other activity areas--for example, administrators' salaries andconsultants' fees.
Several patterns are clear in Table III-1, which reports the percentages
of districts that spend some part of their Chapter 2 resources in one or
more of these categories. First, large and very large districts are more
likely than smaller districts to use Chapter 2 funds for curriculum
development, student support services, instructional services, and staff
development. (Later in the report, we shall explore possible reasons for
these differences besides just the size of the district.) Spending patterns
are more consistent across districts for purchases of computer hardware and
software and other instructional resources. A clear majority of all
districts in each size category used at least some of their 1984-85
Chapter 2 funding to buy hardware, software, and instructional resources.
In general, we see lower expenditure percentages for medium, small, and
very small districts, even in computer applications or library/media center
support. Because smaller districts receive less Chapter 2 money, they tend
35

5
Table III-1
CHAPTER 2 EXPENDITURES IN DIFFERENT ACTIVITY AREAS
Percentage of diatricta in each size category_indicating that 1984-85 Chapter 2 funds are spent in each area:
District Size(Enrollment)
Computerapplications
Support for library/mecia centers, otherschool departments*
Curriculum andnew programdevelopment
Very large(25,000 or more)
85 86 56
Urban 85 86 50
Suburban 87 85 62
Large 82 82 49
(10,000-24,999)
UJCN Medium 78 71 33
(2,500 to 9,999)
Small 80 64 25
(600 to 2,499)
Very small 62 68 18
(less than 600)
All districts 72 68 25
*
Student support Instructional Staffservices services development
Including instructional materials and equipment other than computer hardware or software.
52 54 79
54 62 83
49 44 73
42 36 68
22 25 40
17 12 27
7 13 16
15 16 27
5

to concentrate Chapter 2 resources in one activity area. Thus, whereas a
large district would receive enough Chapter 2 money to purchase significant
amounts of computer hardware, software, and media materials, the Chapter 2
allocation for a small or very small district might be so small that
decisionmakers must choose to buy either computers or audio-visual equipment.
Table 111-2 verifies the tendency for large districts to distribute
Chapter 2 funds among several budget areas and for ;mailer districts to
concentrate funding on one or two areas. Whereas more than three-quarters
of the nation's largest urban districts spent Chapter 2 money in three or
more areas, fewer than a quarter of the smallest districts did so. One very
large district visited during ttAs study used Chapter 2 resources to fund 13
diverse projects (e.g., tutoring and counseling, artists in residence,
equipment for a computer program, materials for the gifted and talented
program).
Because smaller districts concentrate their Chapter 2 funds more, they
often allocate a larger proportion of their annual Chapter 2 budget to
certain activities, as shown in Table 111-3. For example, although fewer
small districts put Chapter 2 money into computers (as we just saw in Table
III-1), those that do so use a greater share of their Chapter 2 resources
for this purpose than do larger districts. The same pattern can be seen for
instructional resources, which include books and other materials. Fewer
small districts purchase instructional resources; again because of the
tendency of small districts to concentrate Chapter 2 funds, those smaller
districts that do purchase them allocate more of their Chapter 2 money to
this purpose than do larger districts.
The opposite pattern is evident in expenditures for instructional or
student support services (and to some extent, staff development), which
involve salaries. As Table 111-3 shows, large districts are more likely to
allocate some Chapter 2 funds for these services, and those large districts
that do so tend to spend proportionately more of their Chapter 2 resources
for this purpose than do smaller districts. One explanation for this
37

Table 111-2
NUMBER OF ACTIVITY AREAS IN WHICH DISTRICTS SPEND CHAPTER 2 RESOURCES,BY DISTRICT SIZE
District Size(Enrollment)
Percentage of districts spending resourcesin each number of activity categories*:
One Two Three or more
Very large(25,000 or more) 0 10 90
Urban 0 8 92
Suburban 0 13 87
Large 6 13 81
(10,000-24,999)
Medium 15 32 54
(2,500 to 9,999)
Small 27 37 37
(600 to 2,499)
Very small(under 600)
43 36 21
All districts 30 34 35
* Out of seven possible categories. See explanation in text.
38
5,1
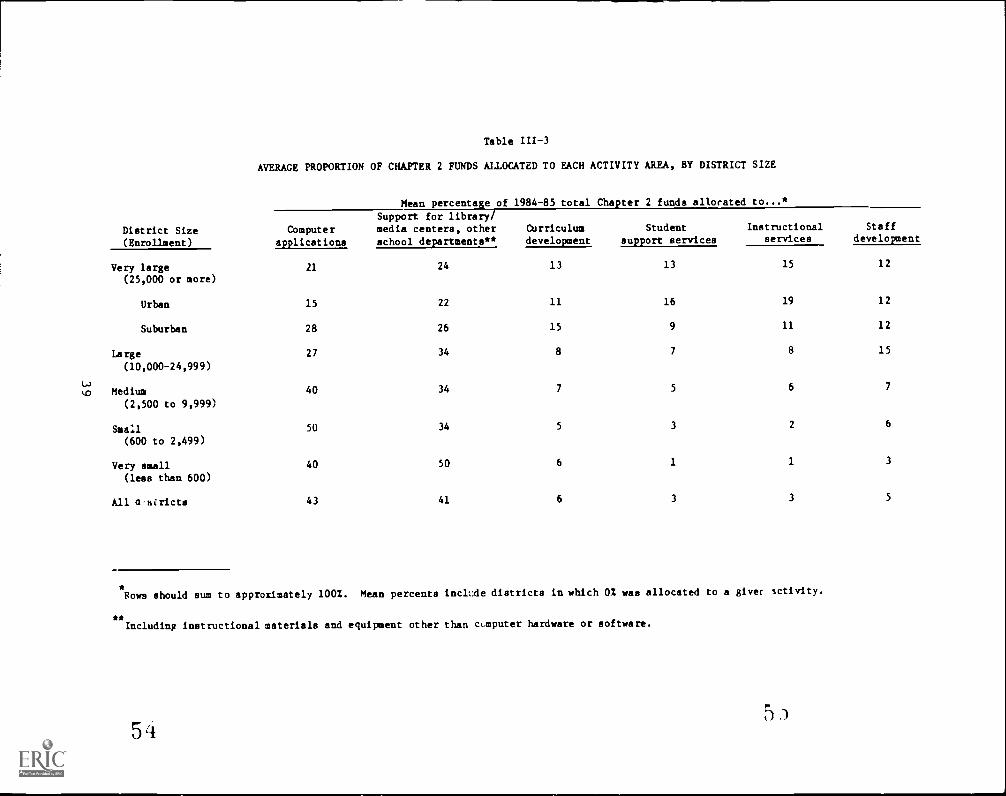
Table III-3
AVERAGE PROPORTION OF CHAPTER 2 FUNDS ALLOCATED TO EACH ACTIVITY AREA, BY DISTRICT SIZE
District Size(Enrollment)
Mean percentage of 1984-85 total Chapter 2 funds allocated to...*
Computerapplications
Support for library/media centers, otherschool departments**
Curriculumdevelopment
Student
support services
Instructionalservices
Staff
development
Very large 21 24 13 13 15 12
(25,000 or more)
Urban 15 22 11 16 19 12
Suburban 28 26 15 9 11 12
Large 27 34 8 7 8 15
(10,000-24,999)
LO%0 Medium 40 34 7 5 6 7
(2,500 to 9,999)
Small 50 34 5 3 2 6
(600 to 2,499)
Very small 40 50 6 1 1 3
(less than 600)
All asirlcts 43 41 6 3 3 5
*should sum to approximately 100%. Mean percents inclv.de districts in which OX was allocated to a giver activity.
**Including instructional materials and equipment other than computer hardware or software.
5 45 )

pattern is that the size of the grants in larger LEAs allows for allocations
to staff. In addition, many larger LEAs have chosen to continue antecedent
programs that often included staff.
Table 111-3 confirms the pattern that larger districts tend to spread
their allocations among several activity areas while smaller districts tend
to concentrate their attention on one or two. For example, large urban
districts spend, on average, 37% of their Chapter 2 budgets on computer
a;plications and instructional resources for libraries or media centers and
about 47% of their funds on categories that involve salaries (e.g., student
support, instructional services, and staff development). At the same time,
very small districts concentrate nearly 90% of their Chapter 2 resources on
computers and instructional resources. One reason why so few small
districts pay staff salaries with Chapter 2 funds and instead purchase
equipment and materials is the size of 0,- grants they receive. In our site
visits, we also found other factors influencing decisions to put money into
computer applications. For example, one small site used all of its
Chapter 2 funds to purchase computers because initiating a computer program
was a local priority. The timing of the Chapter 2 grant provided the
district with a convenient, flexible funding source to begin the program.
The administration was able to convince the school board to use Chapter 2
funds to help establish the program because they viewed these funds as seed
money--money for experimentation without the fear that, if the rzugram
failed, the public trust would be violated (which would be a concern if
local funds were used).
If we consider Tables III-1 and 111-2 together, we begin to see
"portfolios" of Chapter 2 expenditures in districts of different sizes.
Large and very large districts have sufficient resources to diversify their
Chapter 2 investments. They support new or expanded computer programs, in
addition to contributing to library support; many large districts also have
the resources to fund staff development, provide guidance counselors, or pay
some teachers' or aides' salaries as part of instructional services.
Smaller districts are like small investors. In most cases, these districts
40
5r)

concentrate their Chapter 2 resources for maximum impact. Moreover, the
preponderance of these districts have concentrated their Chapter 2 funds on
computer education or some form of support for libraries, media centers, or
other school departments in need of materials and equipment.
Types of Purchases
Although they overlap somewhat with the patterns of expenditure across
activity types, the types of purchases districts make with Chapter 2 funds
reveal more directly the kinds of resources the block grant allows districts
to acquire. We present in Table 111-4 the ove all distribution of Chapter 2
funds among "line-item" purchase categories.
Several patterns in this table characterize local Chapter 2 spending at
the aggregate level:
. Districts putting Chapter 2 funds into salaries are, for the mostpart, investing in staff that provide direct services to children.Approximately two-thirds of total Chapter 2 personnel expenditures
are for these kinds of staff.
. Computer hardware and software purchases are the most common type ofresource bought with Chapter 2 funds; together, they account for 30%of all local Chapter 2 money in 1984-85 and half of all Chapter 2expenditures for equipment, materials, and supplies.
. Chapter 2 funds are used for equipment and material purchases morethan for other kinds of resources. Three-fifths of all localChapter 2 money in 1984-85 goes to this type of expenditure.
. Most spending outside of district personnel, equipment, materials,and supplies goes for staff development costs (consultants aretypically hired for this purpose).
41
5'

Table
TOTAL CHAPTER 2TO EACH TYPE
III-4
FUNDS ALLOCATEDOF PURCHASE
ExpenditureCategory
Total spentby districts
on this categoryin 1984-85*
Proportionof total
LEA spending
PersonnelTeachers (specialist, classroom) $ 44,751,902 14%
Administrators 13,063,252 4
Other certificated personnel(e.g., counselors) 14,688,579 5
Noncertificated personnel(e.g., aides) 13,361,440 4
Other salaries 6,692,200 2
Subtotal 29%
Equipment, materials, and suppliesComputer hardware 79,124,142 25
Computer software 16,071,893 5
Other equipment (e.g., audiovisual) 33,703,282 10
Books and other materials 62,436,703 19
Subtotal 59
OtherConsultants 6,971,678 2
Training/staff development costs** 16,805,185 5
Indirect administrative costs 4,835,054 2
Other+ 11,213,291 4
Subtotal 12
Total $323,307,467 100%
*Districts reported this spending in the middle of the school year as a total
of funds spent and projected to be spent. Their projections underestimate
slightly the total district allocations.
**Not including consultants. Some other staff-development-related costs(e.g., the salary of a staff development coordinator) could be included in
other line items.
+Examples of other expenditures are travel, fiscal audits, testing, and
minigrants to schools.
42
53

. Administrative costs--here defined as the sum of administrators'salaries and indirect administrative costs--represent a relativelysmall proportion of Chapter 2 money, approximately 5.5% of total1984-85 Chapter 2 funds available to districts.*
Table 111-5 provides more detail on how districts have chosen to spend
their Chapter 2 funds by presenting the median amounts for each line-item
category by district size. (The first column of the table indicates median
public school portions of districts' 1984-85 total Chapter 2 allocation.
The remaining columns represent the median amounts of Chapter 2 funds
invested by category of expenditure, among those districts with expenditures
greater than zero.) Districts in all size categories are making purchases
in all categoried of expenditure. Again, we find that larger districts tend
to make more varied expenditures, while smaller districts tend to invest in
basic materials and supplies (books, audiovisual equipment). When smaller
districts do make purchases in areas such as teacher salaries, their
expenditure reflects a large proportion of the district Chapter 2 allocation.
Analyses of those expenditures describe only the resources that
districts acquire with Chapter 2 funds. They tell little about the
programmatic function of these resources, which has already been described
in earlier sections of this report and in other reports from this study (see
Knapp and Blakely, 1986). Computers are a case in point. Seen from the
perspective of a budget sheet, these may seem to represent an effort by
districts to fatten their stock of equipment at federal expense. From the
local perspective, educators usually see these purchases as part of a
venture into a new dimension of their instructional programs.
This measure of administrative costs is only an approximation. In alllikelihood, some of the "noncertificated salaries" covered secretarialtime, which could mean that the administrative costs figure could be anunderestimate; but this is probably offset by the fact that some"administrative salary" costs cover the time of staff providing directservices to students.
43
5

Table 111-5
AVERAGE (MEDIAN) CHAPTER 2 AMOUNTS ALLOCATED TO EACH LINE-ITEM EXPENDITURE CATEGORY
District Size(Enrollment)
Mediantotal publicallocation
Median amount per district put into the following expenditures:
Teachers'salaries
Administrators'salaries
Other certificatedsalaries
Noncertificatedsalaries
Othersalaries
Very large $373,216 $110,161 $ 44,826 $ 75,510 $ 38,807 $ 22,800(25,000 or more)
Urban 394,417 141,429 52,736 93,200 55,414 21,034
Suburban 306,000 87,261 41,448 40,670 26,143 25,849
Large 101,112 29,200 11,814 28,300 8,558 5,572(10,000 to 24,999)
Medium 28,258 13,452 8,189 13,974 6,867 3,375(2,500 to 9,999)
Small 8,736 4,000 7,000 7,154 3,000 90(600 to 2,499)
Very small(under 600)
7.106 531 100 1,300 886 1,750
All districts 6,349 7,938 4,009 15,926 4,126 2,781
Excluding cases where $0.00 were spent on each category.
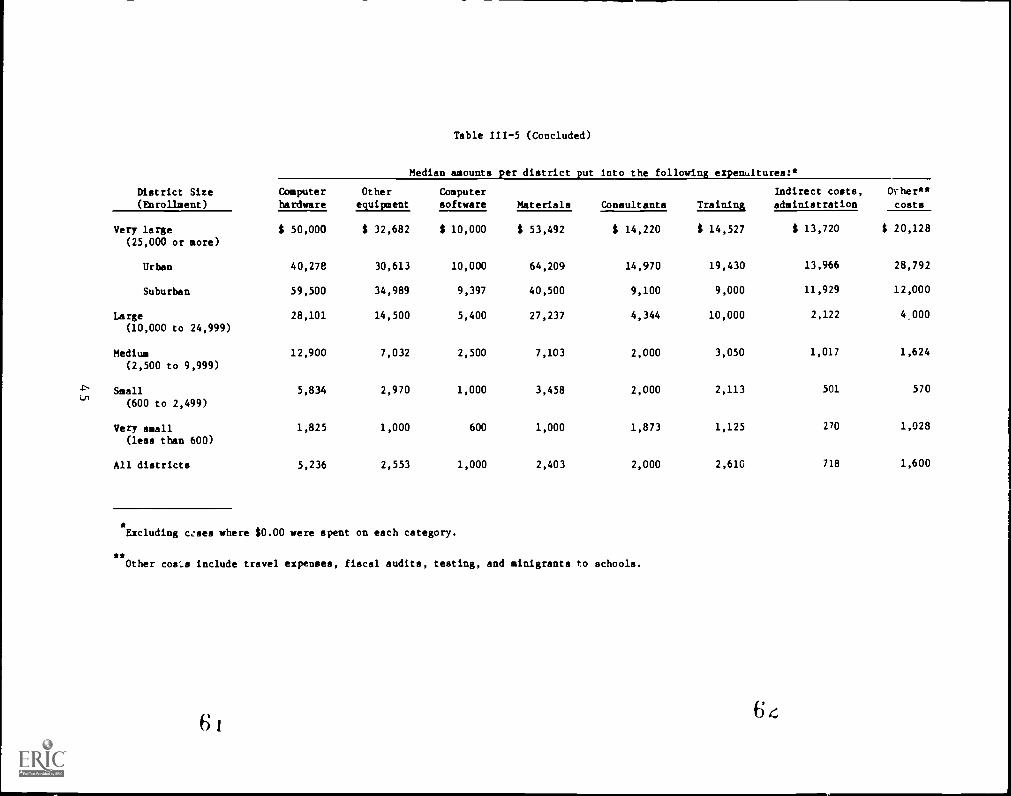
Table 111-5 (Concluded)
Median amounts per district put into the following expentatures:*
District Size(Enrollment)
Computerhardware
Other
equipment
Computer
software Materials Consultants Training
Indirect costs,
administration
Other**costs
Very large $ 50,000 $ 32,682 $ 10,000 $ 53,492 $ 14,220 $ 14,527 $ 13,720 $ 20,128
(25,000 or more)
Urban 40,278 30,613 10,000 64,209 14,970 19,430 13,966 28,792
Suburban 59,500 34,989 9,397 40,500 9,100 9,000 11,929 12,000
Large 28,101 14,500 5,400 27,237 4,344 10,000 2,122 4.000
(10,000 to 24,999)
Medium 12,900 7,032 2,500 7,103 2,000 3,050 1,017 1,624
(2,500 to 9,999)
.c, Small 5,834 2,970 1,000 3,458 2,000 2,113 501 5700(600 to 2,499)
Very small 1,825 1,000 600 1,000 1,873 1,125 270 1,028
(less than 600)
All districts 5,236 2,553 1,000 2,403 2,000 2,61G 718 1,600
Excluding crass where $0.00 were spent on each category.
**Other coar..8 include travel expenses, fiscal audits, testing, and minigrants to schools.

District Use of State Discretionary Funds
From our analysis of site visit data on how LEAs used the discretionary
funds they received, we found patterns that parallel the findings of the
studies noted in Section I. Several of the large districts used their
discretionary funding to help maintain ESAA programs that would have been
severely reduced as a result of funding losses under Chapter 2. This may be
one explanation of why mail questionnaire data indicated that larger
districts appear to be more likely to receive discretionary funding.
Some discretionary money was used by districts in areas targeted by the
SEA (e.g., education reform measures). Finally, some districts were
participating in, or planning to participate in, larger state education
programs that SEAS used--or are planning to use--part of their discretionary
funds to supplement (e.g., a master teacher program in one state we visited).
Expenditures for Private School Students
There are clear differences in how Chapter 2 money is spent to serve
students in public and private schools (Table 111-6). Almost all private
schools appear to request that instructional resources such as books, maps,
and science equipment be purchased for their students with block grant
funds. Public schools also use Chapter 2 funds for instructional resources,
but more often purchase computer hardware and software. In addition, public
schools are more likely to spend Chapter 2 money on curriculum development,
student support services (for example, counselors), instructional services,
and staff development. Private school students rarely receive
Chapter-2funded instructional services or support services, which often
involve professional or noncertified staff. (These differences do not
necessarily imply inequities in services provided to private school
students.) A more extended discussion on this subject appears in another
report from this study (Cooperstein, 1986).
46

Table 111-6
COMPARISON OF SERVICES TO PUBLIC AND PRIVATE SCHOOL STUDENTS
Type of Activity
Percentage of districts* in which each activityis supported by Chapter 2 funds for...
Public school students Private school students
Computer applications 88 68
Instructional resourcesupport 80 92
Curriculum or newprogram development 37 22
Student supportservices 24 9
Instructional services 24 6
Staff development 39 11
*Among districts with enrollment of at least 600, with participatingprivate schools, and in which the private school component is administeredat the district level.
476 ,1
Changes in Spending Patterns Over Time
We turn now to the way Chapter 2 spending patterns have changed from
antecedent programs to the present, and across the 3 years of the block
grant. The current patterns of spending just described do not match the way
antecedent program funds were used. Some of the shifts in expenditure
during the first year of the block grant have become more evident in
succeeding years, while others have not changed further.
Change or Continuity in Antecedent Spending Patterns
To understand changes in expenditures by comparison with antecedent
programs, one must keep in minu the absolute amounts involved, especially
when considering whether districts gained or lost funds. Gains or losses at
either end of the district size continuum meant entirely different things.
For example, an increase of $150,000 could buy additional computers or
library books, but it could also pay for several additional teachers to
begin or expand a pilot program. On the other hand, a $5,000 in
be used for books or computers; but, even if it represents a 50
it is not sufficient to pay the salary of even one teacher.
section of this report we will examine more closely the effe
or losing money under Chapter 2.)
The most striking change from expenditure patterns un
programs is the increase in the number of districts repo
computer hardware and software (Table 111-7). In 1981 -
nation's school districts reported computer-related p
antecedent funds.* For the first year of Chapter 2,
least some Chapter / funding for computers. Althou
the pattern holds for districts of all sizes.
*It should be noted that the purchase of computers was not permitted under
some antecedent programs.
crease can
% increase,
In the next
is of gaining
der antecedent
rting purchases of
82, only 19% of the
rchases with
49% reported using at
gh percentages differ,
48

Table III-7
SPENDING PATTERNS FOR ANTECEDENT PROGRAMS IN 1981-82 A. FOR CHAPTER 2 IN 1982-83, BY DISTRICT SIZE
Percentage of districts putting funding into...
Computerapplications
Support for libraries/mediacenters, other school departments
Curriculum and
new program development
District Size(Enrollment)
Antecedent1981-82
Chapter 21982-83
Antecedent1981-82
Chapter 21982-83
Antecedent Chapter 2
1981-82 1982-83
Very large(25,000 or more) 37 66 98 85 50 58
Urban 29 67 96 91 56 60
Suburban 47 64 100 78 43 56
Large 26 54 93 86 33 37
(10,000-24,999)
Medium 23 59 93 76 26 24
(2,500 to 9,999)
Small 23 58 85 72 17 15
(600 to 2,499)
Very small
(under 600)
13 34 89 69 10 16
All districts 19 49 39 72 17 19
Support for instructional resources (books, materials, etc.) other than computer hardware or software.
66

Table 111-7 (Concluded)
District Size
(Enrollment)
Percentage of districts putting funding into
Student support services Instructional services Staff development
Antecedent
1981-82Chapter 2
1982-83Antecedent1981,82
Chapter 2
1982-83Antecedent
1981-82Chapter 21982-83
Very large
(25,000 or sore) 57 39 44 58 42 59
Urban 50 46 55 66 48 66
Suburban 64 30 31 47 35 49
Large 31 27 20 28 29 49(10,000-24,999)
Mediu 23 15 15 17 22 30(2,A0 to 9,999)
Small 15 12 8 7 10 18(600 to 2,499)
Very small
(under 600)6 4 4 3 7 7
All distqcts 14 11 9 9 12 18
6 (

One 'ossible explan :ion for -his pattern has to do with the timing of
the block grant. Chapter 2 came along when interest in using computers in
education was high. For example, in a very large suturban district we found
Chapter 2 funds supporting hardware purchases as part of a larger fiveyear
computer education plan designed before the block grant. Interest in
computer education was the result of several converging factors: community
interest in computers, newly hired administrators who supported increased
use of computers in the classroom, and anticipatton of future state
requirements in computer literacy. Chapter 2 provided a convenient funding
source to expand the program.
A second change between antecedent and Chapter 2 purchases is the
decrease in purchases of instructional resources such as library books and
materials (Table III-7). Under antecedent funding, nearly all districts
used some resources for these purchases (primarily because most districts
received Title IVB funds). Significantly fewer districts reported using
Chapter 2 funds for such items in 1982-83. Again the pattern can be seer
across districts of all sizes.
Site visit data provide several possible explanations for this pattern.
In a number of sites, the flexibility of the block grant permitted LEAs to
use their Chapter 2 funding to address more pressing priorities (e.g., staff
development to provide emergency credentials to teachers to help ease a
teacher shortage, instructional programs to meet state competency test
requirements, or instructional services to serve a growing limited English
proficient population and support a Chapter 1 progtsm that faced declining
funding). Increased funding under Chapter 2, coupled with increased state
support for libraries, allowed one district to pay for salaries to establish
a student support program at the elementary level. Finally, some districts
viewed Chapter 2 money as a safer source of funds than local money to
experiment with (purchases such as more exotic equipment like computers).
Other patterns are less clear cut. For example, large and very large
districts reported spending more Chapter 2 funds for curriculum development
and new programs, instructional services, and staff development. Fewer of
516,5

these districts, however, purchased student -apport services under the block
grant. The lack of a clear pattern may be due to the variety of local
circumstances influencing Chapter 2 decisions. In three of the larger
districts we visited, for example, local forces influenced admin,9trators to
increase expenditures for instructional programs and staff development. One
of the districts was planning to increase investments in staff and
curriculum development to support its computer hardware purchases. Another
district, no longer under court order to desegregate and facing decreasing
Chapter 2 funds and other local priorities, moved away from student support
programs initiated with ESAA funds. The third district, which had gained
funds under Chapter 2, used them to support instructs _al programs that had
declining financial suf. ,ort from other sources.
Changes in Spending Over the 3 Years of the Block Grant
Two changes between the last year of antecedent funding and the first
year of Chapter 2 have continued across the 3 I.ars of the block grant
(1982-83, 1983-84, and 1984-85): first, the increase in the number of
districts reporting purchases of computer hardware and software; second, the
decrease in districts purchasing library books, supplementary materials, and
other instructional resources (Table 111-8).
Other patterns are more complex and seem to vary across district size
categories. For example, all but the largest districts show a growing
tendency to invest in instructional services. Site visit data indicate that
local priorities and use of Chapter 2 as seed money are two explanations for
some increase 1..1 support for staff salaries. In one small district, public
pressure to improve reading skills caused the administration to divert
Chapter 2 funds from inservice training to the development of a new reading
curriculum.

Table 111-8
CHAPTER 2 SPENDING PATTERNS ACROSS THE 3 YEARS OF ThE BLOCK GRANT, BY DISTRICT SIZE
District Size(Enrollment)
Percentage distritel using funds for...
Computer applications
Support for libraries/media
centers, other school departments*
Curriculum and
new-program development
1982 -83 1983-84 1984-85 1982-83 1983-84 1984-85 1982-83 1983-84 1984-85
Very large(25,000 or more) 66 74 85 85 84 86 58 61 56
Orbs: 67 74 85 91 89 86 60 61 50
Suburban 64 75 87 78 78 85 56 59 62
Large 54 72 82 86 83 82 37 43 49
(10,000-24,999)
Medium 59 74 78 76 67 71 24 28 33
(2,500 to 9,999)
Small 58 72 80 72 62 64 15 20 25
(600 to 2,499)
Very small(under 600)
34 41 62 69 71 68 16 11 18
All disrricts 49 60 72 72 67 68 19 19 25
*Support for instructional resources (books, materials, etc.) other than computer hardware or software.

Table 111-8 (Concluded)
CHAPTER 2 SPENDING PATTERNS ACROSS THE 3 YEARS OF THE BLOCK GRANT, BY DISTRICT SIZE
District Size
(Enrollment)
Percentage of districts using funds for...
Student support services Instructional services Staff development
1982-83 1983-84 1984-85 1982-83 1983-84 1984-85 1982-83 1983-84 1984-85
Very large
(25,00 or more) 39 38 52 58 59 54 59 60 79
Urban 46 44 54 66 66 62 66 66 83
Suburban 30 30 49 47 50 44 49 52 73
Large 27 31 42 28 27 36 49 48 68
(10,000-24,999)
Medium 15 15 22 17 18 25 30 30 40(2,500 to 9,999)
Small 12 12 17 7 6 12 18 18 27(600 to 2,499)
Very small
(less than 600)
4 12 7 3 1 13 7 6 16
All districts 112 142 15Z 9Z 8Z 16Z 18Z 172 27Z
7
Several other districts we visited viewed Chapter 2 funds as seed money
for new programs:*
. One small district used its Chapter 2 allocation for one year to
launch a gifted and talented program, which was subsequently pickedup by local funds (the state requires services to the gifted and
talented population, whi the LEA had not been providing).
. A medium-sized suburban district has used its Chapter 2 funds as seed
money (in conjunction with local funds) for new programs. One of
these programs--a summer preschool for children with low testscores--is expected to be picked up with local funds next year.
. Some districts are using part of their .hapter 2 allocations to fund
minigrants to experiment with innovative programs. Successful ones
may then be funded by other funding sources.
The superintendent in a very large district said that the purpose of
the Chapter 2 minigrants in his district was to "give teachers anincentive...to provide assistance for creative, exceptional teachers
over a broad range of activities."
The alight drop in large districts' use of Chapter 2 funds for
instruction may reflect a few such programs originally funded out of
antecedent sources that were continued with carry-over funds for 1 or 2
years of Chapter 2, but that finally succumbed to declining funding levels
under Chapter 2. One very large urban site we visited illustrated this
process. In this instance, Chapter 2 funds had to be juggled each year
because of declining Chapter 2 allocations (during the first 2 years, the
SEA had compensated former ESAA districts by funding competitive grants
related to desegregation efforts).
*Another report from the National Study (Knapp, 1986) explores this topic
in greater depth.
55
'7 4
IV INFLUENCES ON LOCAL CHAPTER 2 SPENDING
This section of the report discusses influences on districts' use of
Chapter 2 resources, drawing on both mail questionnaire data and data
collected during site visits. Our analyses concentrated on the effect on
district expenditures of (1) the amount of funds received (both in absolute
terms and relative to antecedent programs), (2) the desire to continue
antecedent programs, (3) uncertainty about auditors' requirements and the
stability of block grant funding, and (4) the relative impact of local,
state, and federal priorities.
Summary
The analyses described in this section lead to the following findings
regarding key influences on districts' decisions about the expenditure of
Chapter 2 funds.
The amount of funding districts receive under the block grant plays an
important role in decisions in two ways:
(1) The absolute size of yearly Chapter 2 allocations appears topredispose districts towards certain types of expenditures. Thosedistricts receiving less than $50,000 a year, for example, arereluctant on average to invest in staff, preferring to use funds tosupport materials and equipment for ins'Iructional programs or
libraries.
(2) The amount of funding relative to what had been received under theprograms consolidated into the block grant--in particular, thedegree of loss (or gain)--has played an important role inexpenditure decisions in districts where losses were substantial,especially in the largest districts, which lost the most under theblock grant. Two-thirds of the largest urban districts indicated
57
70

that the loss of funds was an important influence on theirdecisions; 69% of those that indicated this reported losing staffas a result of the cuts.
A third finding underscores the importance of what was in place prior
to the shift to the block grant.
(3) Prior commitments to staff or to the programmatic purposes ofantecedent programs remained a strong influence on spendingdecisions across all size categories, especially in large urbandistricts (twothirds of which reported this as a very importantfactor in their considerations). Obligations to existing staff and
the requirements of desegregation orders were the most salientforces driving decisions about continuation of these services withblock grant funds.
Two more findings show the influence of uncertainty in local expenditure
decisions:
(4) Uncertainty about Chapter 2 audit requirements appears to have ledsome districts co purchase materials or equipment rather than hire
staff. However, on the whole, concern about audits under the block
grant is low.
(5) Uncertainty about the stability of funding under the block grant
has not been a major influence on spending decisions in very manydistricts, although a small proportion of districts report this as
a concern.
A sixth finding relates to the impact of district, state and national
priorities on districts' decisions about the use of Chapter 2 funds:
(6) District priorities understandably exert a great deal of influence
on decisionmaking at the local level. Only a small fraction(approximately a tenth of the districts nationwide) indicate thatstate mandates and priorities or national reform recommendationsare major factors in their decisions about the use of Chapter 2
funds. However, many districts are using block grant funding tosupport activities relevant to federal or state priorities--inparticular, the use of educational technology and the developmentof programs based on effective schools research.
58 7,11

Size of the Chapter 2 Grant
In previous sections of this report we noted that one reason for
different expenditure patterns is simply the amount of money available to
districts. Here we examine in more detail the influence that size of grant
has on Chapter 2 purchases.
Table IV-1 presents a clear pattern: as size of grant increases, the
likelihood that a district uses Chapter 2 for instruction also increases.
Over 60% of the districts receiving $500,000 or more report using at least
some of those Chapter 2 funds for instructional services, which in most
cases involve teachers' or aides' salaries. At the same time, 12% of
districts receiving $5,000 or less used Chapter 2 for instructional services.
In part, this pattern can be explained by the fact that many of these
districts had hired staff under antecedent programs and chose to maintain
their positions with Chapter 2 funds. At the same time, it is evident that
a threshold of funding is probably necessary before very many districts
consider that hiring staff is feasible. It would appear that the threshold
for a large percentage of districts to be willing to use part of their
Chapter 2 budget for instruction is something over $50,000. The threshold
appears to be about the same for student support services, which also
involves salaries, and lower for staff development, for which 32% of even
the districts with grants of $5,000 to $50,000 have allocated some Chapter 2
funds.
Larger Chapter 2 grants also mean that districts can choose more
diversified "portfolios" of purchases and services (Table IV-2). A larger
grant permits substantial purchases of equipment and material while still
allowing sufficient resources for instructional services or staff
development. Districts with smaller grants tend to concentrate resources in
one or two areas. Even districts receiving as much as $50,000 tend to
concentrate funds on computer purchases and instructional resources. In
such districts, Chapter 2 is not seen as sufficient to pay for enough staff
salaries to make such expenditures educationally useful.
59
o

Table IV-1
PERCENTAGES OF DISTRICTS ALLOCATING CHAPTER 2 FUNDS TO ACTIVITY CATEGORIES,BY SIZE OF CHAPTER 2 GRANT
Per:entage of districts nationwide that allocated 1984-85 Chapter 2 funds to...
Support for libraries/ StudentComputer media centers, other Curriculum support Instructional Staff
Grant Size applications school departments* development services services development Other
$1,000,000 or more 94 88 66
$500,000 to $999,999 74 75 50
$100,000 to $499,999 83 83 54
cr,$50,000 to $99,999 80 86 38
C
$5,000 to $49,995 80 64 30
Less ttin $5,000 60 68 13
Overall 71 67 24
Including instructional materials and equipment 3ther than computer hardware or software.
71)
58 69 94 88
53 63 91 85
44 44 72 51
30 36 55 37
19 14 32 15
4 12 12 4
14 16 26 12
7

Table IV-2
AVERAGE PROPORTION OF DISTRICT'S CHAPTER 2 FUNDS ALLOCATED TO EACH ACTIVITY AREA, BY SIZE OF CHAPTER 2 GRANT
Chapter 2 grant size
Mean percentage of district's 1984-85 Chapter 2 funds allocated to...*
Computerapplications
Support for libraries/media centers, otherschool departments*
Curriculumdevelopment
Studentsupportservices
Instructionalservices
Staff
development Other
51,000,000 or more 16 23 18 19 15 6 12
5500,000 to 5999,999 18 15 12 12 16 18 15
5100,000 to 5499,999 26 32 10 9 11 14 8
cr-, 550,000 to 599,999 30 33 9 7 9 11 9
55,000 to 549,999 48 33 6 4 3 6 3
Less than 55,000 40 52 4 1 1 2 2
Overall 43 41 6 3 3 5 3
*Rows should sum to approximately 100%. Mean percents include district in which 0% was allocated to a giver activity.
**Including instructional materials and equipment other than computer hardware or software.
7t7 z-)

Loss of Chapter 2 Funds
As the reviews of earlier Chapter 2 studies in Section I suggested, the
loss of funding as a result of Chapter 2 could be an important influence on
district spending decisions. We found that where losses were substantial,
this factor was clearly important.
The effect of funds loss is obscured when one looks at data for all
districts that lost funds, regardless of size. Only an estimated 13% of
districts nationwide report that losing funds affected their use of
Chapter 2 resources (Table IV-3). (This figure compares with 21% of the
districts that--by our calculations--lost at least some money because of
Chapter 2.) Although most districts do not report that reduction in their
funds due to Chapter 2 was a major factor in expenditure decisions, the
larger the district (and greater the funds loss), the more likely it is for
districts to indicate otherwise. Sixty-three percent of the very large
urban districts that lost funds as a result of Chapter 2 indicated that
funds loss influenced Chapter 2 spending patterns.
Loss of funds appears to be most clearly related to spending for staff
and direct services to students. Table IV -4 presents the percentages of
districts in each size category reporting that lost funding influenced
spending patterns and that they lost staff or student services because of
Chaptel, 2.*
The data in Table IV-4 dramatize the difference between urban and
suburban districts with enrollments of 25,000 or more. A large percentage
of very large urban districts reported both belu6 affected by funds loss and
suffering loss of staff or student services, ,whereas no very large suburban
*One must be careful in interpreting this table because it combinesfrom two separate questions. We cannot claim with certainty that fundsloss led to loss of staff or student services (although we found this tobe the case in the larger ESAA districts we visited).
62
511

Table IV-3
LOSS OF CHAPTER 2 FUNDS AS AN INFLUENCE ON CHAPTER 2 SPENDING,BY DISTRICT SIZE
District Size(Enrollment)
Percentage of losingdistricts* reporting that
funds loss influenceduse of Chapter 2 funds
Very large 50
(25,000 or more)
Urban
Suburban
Large(10,000-24,999)
Medium(2,500 to 9,999)
Small
(600 /o ?.499)
Very small(under 600)
All districts
63
25
32
21
15
4
13
*Losing district = 1964-85 Chapter 2 allocation was less than total fundsreceived under antecedent programs in 1981-82.
63Si
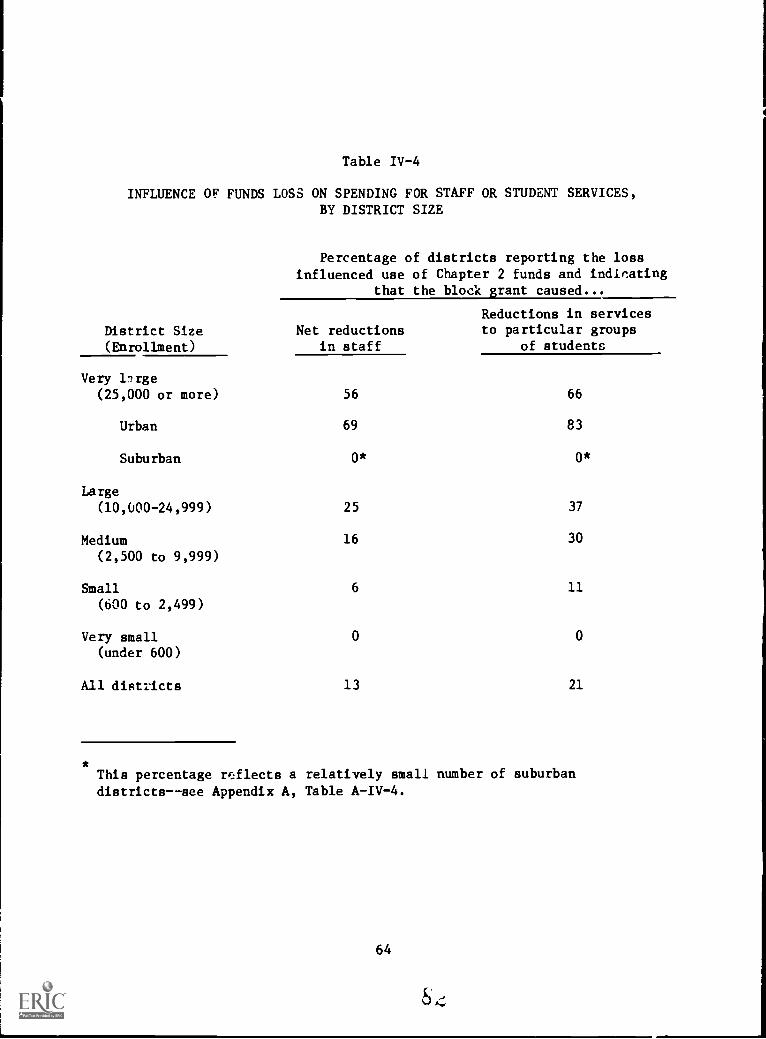
Table IV-4
INFLUENCE OF FUNDS LOSS ON SPENDING FOR STAFF OR STUDENT SERVICES,BY DISTRICT SIZE
Percentage of districts reporting the lossinfluenced use of Chapter 2 funds and indicating
that the block grant caused...
Reductions in services
District Size Net reductions to particular groups
(Enrollment) in staff of students
Very lirge(25,000 or more)
Urban
Suburban
Large
(10,000-24,999)
Medium(2,500 to 9,999)
Small
(600 to 2,499)
Very small(under 600)
All districts
56 66
69 83
0* 0*
25 37
16 30
6 11
0 0
13 21
*This percentage reflects a relatively small number of suburban
districts--see Appendix A, Table A-IV-4.
64

districts with funds reductions indicated staff losses, perhaps because the
median percentage loss was less for these LEAs--21% vs. 46% for very large
urban districts. We would not expect many medium-sized or smaller districts
to report losing staff or services because of Chapter 2, since we have seen
that few of these districts supported staff or provided services with
antecedent funds. Table IV -4 bears out this expectation. There is much
more potential for losses of staff or student services in larger districts
because those districts were more likely to support those expenditures with
antecedent funds.
Data from our site visits indicate that losses did not always create a
feeling of being worse off. For example, a large southern district lost
funds, but district staff viewed Chapter 2 as a means to meet needs as they
arose. Moreover, since cuts were made in programs that were less visible
than others, their view of the block grant was fairly positive.*
Districts that lost substantial funding under Chapter 2 often felt hard
pressed just to continue antecedent programs, which left few resources for
new programs or innovations. The Chapter 2 coordinator in one large urban
district that had lost nearly 80% of its funds as a result of Chapter 2
stated: "Chapter 2 stimulated nothing. No, it was a funeral pall...just
survival planning."
Site visit data also show that staff in some districts that experienced a"windfall" because of Chapter 2 may not really perceive th- 'selves as"winners." For example, one district we visited had experienced anincrease of nearly 50% when antecedent programs were consolidated intoChapter 2. However, administrative staff did not view themselves as beingbetter off under Chapter 2 because they had lost substantial Chapter 1funds during the same period and were using Chapter 2 funds to replacethese lost Chapter 1 funds.
65
Si
The Desire to Continue Antecedent Programs
We have seen that spending patterns changed in many districts when
Chapter 2 replaced antecedent programs in the school year 1982-83. At the
same time, district decisionmakers faced pressure to continue purchases and
services initiated with antecedent funds.
In particular, the success of some antecedent programs and the
commitment to staff programs hired with antecedent funds contributed to a
strong desire to maintain what was already in place when the block grant
came.* Some respondents described continuation of successful antecedent
programs as maintaining the tntent or "spirit" of Chapter 2. We found in
our site visits that many districts depended on Title IV-B to improve the
holdings of their school libraries; this activity remained a priority under
Chapter 2. Another reason for continuing antecedent projects was
obligations--such as staff hired under antecedent programs--that had to be
continued. In districts undergoing desegregation, administrators felt a
different obligation: to maintain projects begun with ESAA funding,
especially where these programs helped the district respond to external
desegregation requirements. For example, an administrator in a very large
urban district explained one of the dilemmas faced by districts under court
orders: "We couldn't just tell the court we didn't have the money to carry
out the court order [to desegregate] any longer." Thus, one would expect
that the desire (and possibly legal requirements) to continue antecedent
activities would be a significant influence on how funds are spent under
Chapter 2.
The obvious pat'..rn in Table III-5--which shows tl-e percentage of
districts reporting that continuing antecedent programs influenced Chapter 2
*See other reports from this study (Knapp, 1986; Turnbull and Marks, 1986)for additional analyses of the effects of antecedent programs onsubsequent decisions.
66
s4

spending patterns--is the relationship between size and desire to continue
prior expenditures. Two of the reasons just outlined for continuing
antecedent programs probably account for this pattern. Larger districts are
more likely to have hired staff with antecedent funds and thus face the
obligation to continue their support. Larger districts are also more likely
to have obligations to continue ESAA programs, which were started prior to
ECIA.
Uncertainty About Chapter 2 Funding
As noted in Section I, uncertainty about the stability of Chapter 2
funding could be a major influence on the way districts spent their funds.
We hypothesized that districts concerned about the continuation of Chapter 2
funding would be more likely to purchase computers and instructional
resources. These districts would be less likely to pay for salaries
because, if Chapter 2 funds were cut or the block grant was discontinued,
the district would have the obligation to pay these salaries with ot'er
sources of funds.
We found no consistent effect of funding uncertainty on expenditure
decisions. The data in Table IV-6, indicate that districts that are and are
not concerned about the certainty of future funding under the block grant
are etually likely to put funds into equipment purchases, services, or other
types of expenditures. For example, 89% of the very large urban districts
that reported concern about Chapter 2 funding purchased computer hardware or
software compared with 80% of those that reported no concern over funds
stability. With regard to expenditures for instructional services, the same
percentage of very lario urban districts reported concern and lack of
concern about funds stability. (We must remember that districts c u:q.,ned
about funding stability may not have invested .4.n staff if they had a choice,
but many of these districts--especially very large ones--probably had staff
positions funded by antecedent funds that they were obligated to continue
with Chapter 2 resources.)
67
8;)

Table IV-5
ANTECEDENT PROGRAMS AS ANINFLUENCE ON CHAPTER 2 SPENDING,
BY DISTRICT SIZE
District Size(Enrollment)
Percentage of districts
reporting antecedent
programs as an importantinfluence on decisions
about use of funds
Very large 59
(25,000 or more)
Urban
Suburban
Large
(10,000-24,999)
Medium(2,500 to 9,999)
Small
(600 to 2,499)
Very small(under 600)
All districts
68
St)
67
47
58
44
34
34
37

Table IV-6
UNCERTAINTY ABOUT CHAPTER 2 FUNDING AS AN INFLUENCE ON SPENDING,BY DISTRICT SIZE
Percentage of districts using Chapter 2 funds for...
Support for libraries/
Computer media centers, cther
applications school departmetts*
Student support Instructional
services and... services and...
District Size(Enrollment)
Uncertainabout
Chapter 2funding
Not
uncertain
aboutfylding
Uncertainabout
Chapter 2funding
Not
uncertain
aboutfunding
Uncertainabout
Chapter 2funding
Not
uncertainabout
funding
UncertainaboutChapter 2
funding
Not
uncertainaboutfunding
Very large(25,000 or more) 89 84 94 84 41 44 61 60
Urban 89 80 100 78 56 41 73 61
Suburban 87 91 86 91 21 4/ 36 58
Large 89 83 90 80 56 33 36 38
(10,000-24,999)
Medium 75 80 67 73 28 18 30 20
(2,500 to 9,999)
Small 69 77 66 65 22 10 15 9
(600 to 2,499)
Very small(under 600)
72 57 72 69 15 8 10 16
All districts 72 70 70 69 23 12 19 15
Including instructional materials and equipment other than computer hardware or software.
Si
Although there is no clear national pattern between uncertainty about
Chapter 2 funding and Chapter 2 spending patterns, during our site visits we
did find examples of the influence of uncertainty in the use of Chapter 2
resources. For example, the Chapter 2 coordinator in a large urban district
stated that concerns about the continuation of Chapter 2 funds made him
unwilling to support salaries:
"There was one overriding factor... When you tie block grant fundinginto recurring expenses then if there's a budget cut, you have aproblem. So we had a basic philosophy--put it into nonrecurringexpenses because of the uncertainty. We've seen the problem in otherblock grants, for example, in the city. Policemen and firemen wereleft on the payroll and couldn't be supported. The people werescreaming."
Uncertainty About Chapter 2 Audit Requirements
Uncertainty about what Chapter 2 auditors would require influenced some
districts to spend their Chapter 2 funds on what they perceived as "safe"
purchases, although the general level of anxiety about audits was low. Many
of the Chapter 2 coordinators we interviewed worried that federal auditors
eventually would require what had alwaya been required of federal programs.
As a result, some of these local officials were "playing it safe" and
keeping careful records of all Chapter 2 purchases and decisions.
One approach to playing it safe is to purchase equipment and
materials. Many local administrators believe that it is easier to
demonstrate compliance with federal regulations by purchasing computers or
books rather than funding staff positions. According to one Chapter 2
coordinator, equipment purchases provide tangible evidence of expendituk_s
and thus a clean audit trail. But with the funding of personnel it is
sometimes difficult to demonstrate that the LEA is "adding" to state and
local expenditures rather than replacing them when a staff member is hired
with Chapter 2 funds. For example, one large district that had continued
funding for ESAA guidance counselors wanted co extend it to schools not
70
8n
participating in busing, did not do so because they believed they were
constrained by supplement-not-supplant considerations to use local funds to
add these counselors in schools that did riot receive ESAA funds.
The data in Table IV -7 provide some evidence test "audit anxiety" may
influence Chapter 2 spending patterns--especially in larger districts.
However, the read'r should be cautiored that concern about audits was
generally low: only an estimated 16% of the very large urban districts
reported such concerns.* Very large urhra districts that are concerned
about audits, for example, are more likely to purchase computers and
instructional materials and less likely to fund student support services and
instructional services. Roughly the same pattern -.an be seen for very large
suburbs and large districts. These patterns are not apparent in smaller
districts, perhaps because very few of these districts reported that
uncertainties about audits influenced their Chapter 2 purchases. Moreover
the size of Chapter 2 grants for smaller districts usually precludes
purchasing anything but materials or equipment.
Local, State, and National Priorities
We also examined whether Chapter 2 funds are used to addre-3 local,
state, or national education priorities. Not surprisingly, local priorities
are perceived to be far more influential in determining how Chapter 2 funds
are allocated, as Table IV-8 suggests. Site visit data support this
finding. We also found several indications in site visits that state
priorities did have some influence on decisionmaking:
*See another report in this study (i'urnbull and Marks, 1986) for a moreextended analysis of audit anxiety.
71

District Size(Enrollment)
Very large
Table IV-7
IINCERTAINTY ABOUT AUDITS AS AN INFLUEt 2 ON SPENDING,BY DISTRICT SIZE
Percentage of districts using Chapter 2 funds for...
Computerapplications and...
Not
Uncertain uncertain
about about
audits audits
(25,000 or sore) 95
Urban 100
Suburban 91
Large 100
(10,000-24,999)
Medium 73
(2,500 to 9,999)
Small 88
(600 to 2,499)
Very small(under 600)
33
All districts 66
a
Support for Lbrarieedmedia centers, other
school departments* and...Not
Uncertain uncertainabout about
audits audits
84 95 86
81 100 84
88 92 88
82 96 81
80 79 70
74 40 67
62 92 68
71 73 69
Student supportservices and...
Uncertainabout
audits
Not
uncertainabout
audits
InatructIonalservices and...
Not
uncertai
aboutaudits
Uncertainaboutaudits
28 47 39
27 49 28
28 43 47
26 40 52
37 18 32
4 13 S
25 8 0
23 13 14
Including instructional materials and eqqipment other than computer hardware or software.
66
73
54
36
21
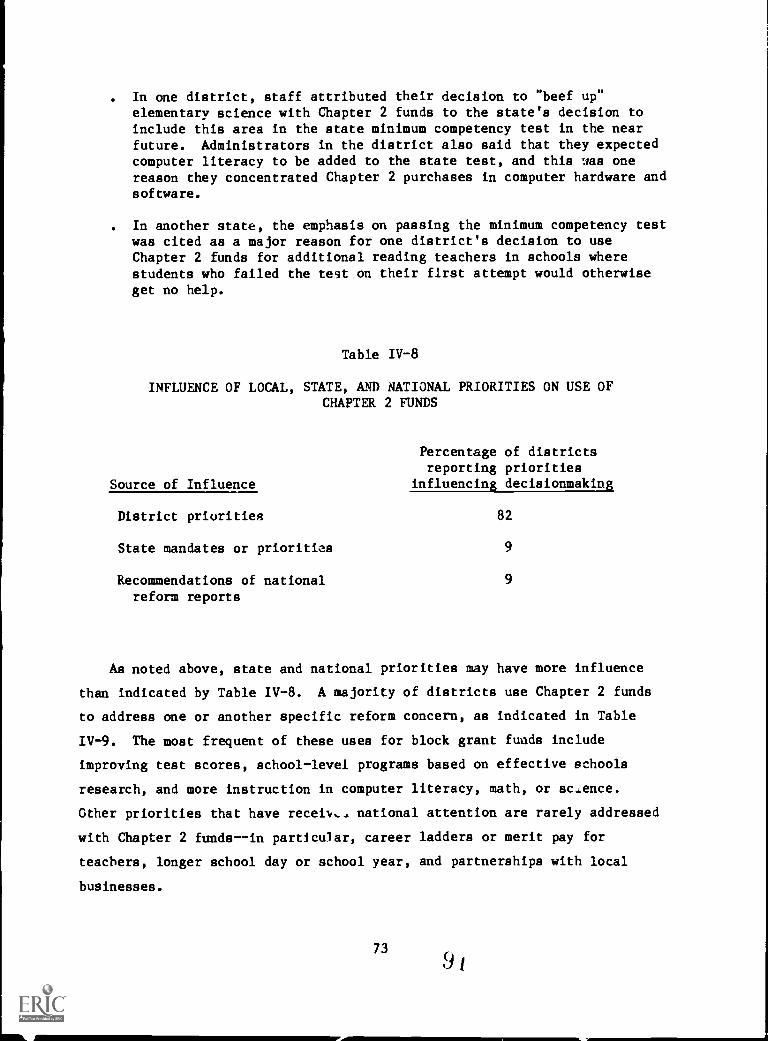
. In one district, staff attributed their decision to "beef up"elementary science with Chapter 2 funds to the state's decision toinclude this area in the state minimum competency test in the nearfuture. Administrators in the district also said that they expectedcomputer literacy to be added to the state test, and this was onereason they concentrated Chapter 2 purchases in computer hardware andsoftware.
. In another state, the emphasis on passing the minimum competency testwas cited as a major reason for one district's decision to useChapter 2 funds for additional reading teachers in schools wherestudents who failed the test on their first attempt would otherwiseget no help.
Table IV-8
INFLUENCE OF LOCAL, STATE, AND NATIONAL PRIORITIES ON USE OFCHAPTER 2 FUNDS
Percentage of districtsreporting priorities
Source of Influence influencing decisionmaking
District priorities 82
State mandates or priorities 9
Recommendations of national 9
reform reports
As noted above, state and national priorities may have more influence
than indicated by Table IV-8. A majority of districts use Chapter 2 funds
to address one or another specific reform concern, as indicated in Table
IV-9. The most frequent of these uses for block grant funds include
improving test scores, school-level programs based on effective schools
research, and more instruction in computer literacy, math, or science.
Other priorities that have receiy,.. national attention are rarely addressed
with Chapter 2 funds--in particular, career ladders or merit pay for
teachers, longer school day or school year, and partnerships with local
businesses.
73

Table IV-9
USE OF CHAPTER 2 FUNDS TO SUPPORT REFORM PRIORITIES
Educational
improvement goal
Improve computer literacy,
math, or science
Estimated
number Estimated percentageof districts of these districtswith goal as in which Chapter 2 wastop priority used to address the goal
10,065 85
Implement effective schoolsresearch 3,91.4 64
Improve test scores 5,712 60
Dropout prevention 1,360 33
Improve time on task 3,944 29
Raise graduationrequirements 3,808 22
Create partnerships with business 1,088 13
Career ladders ormerit pay for teachers 952 8
Lengthen school day or year 1,360 5
74
9 4.:

Apparently, the modest resources available through Chapter 2 are more
likely to have significant impact on some priorities than on others. For
example, instruction in computer literacy, math, or science can be
significantly influenced with purchases of computers or laboratory
equipment. Test sores can be improved by hiring one teacher for each high
school in the district to tutor low-scoring students. However, merit pa
for teachers or lergthening the 3chool day or year involves district-wide
efforts and considerable resources. Even the largest Chapter 2 grant would
make only minor contributions to achieving such goals Accordingly,
district officials appear to be using funds selectively 'zo address
priorities. For the most part, they appear to use Chapter 2 resources where
they expect to get "more bang for the buck."
75
90

SUMMARY AND CONCLUSIONS
This report oescribes the fiscal effects of ECIA Chapter 2 at the local
school district level. We have examined three aspects of the block grant's
fiscal impact:
. Distribution of Chapter 2 funds to local school districts
. Local patterns of spending Chapter 2 funds
. Influences on local spending.
In this section, we summarize and interpret the major pacterns described
with respect to each aspect.
Distribution of Chapter 2 Funds
Since local enrollment is a major factor in all state formulas for
distributing Chapter 2 funds to districts, it is not surprising that
allocations of formula funds closely follow district size. For example, the
nation's largest urban districts, on average, received $451,385 in 1984-85;
by comparison, districts with fewer than 600 students received an average of
$2,036 for the same school year.
In terms of dollars, Chapter 2 is a modest program. Although some of
the nation's largest school districts receive over $1,000,000 from the block
grant, 91% of all districts receive $50,000 or less. About 40% receive less
than $5,000. On average, Chapter 2 makes up less than 1% of a district's
operating budget and provides between $7.00 and $9.00 per pupil. (Since most
of the district budget goes to salaries and related costs determined by
personnel contracts, Chapter 2 funds may represent a more significant
percentage of the funding subject to the discretion of district
decisionmakers.)77
9 ei

Block grant funds allocated by formula within each state make up the
largest proportion of Chapter 2 funds that districts re....eive. Funds from
states' discretionary share of Chapter 2 (e.g., in the form of competitive
grants or reimbursements for adverse conditions) represent a very small part
of local Chapter 2 resources. Only 2% of all districts received this kind
of funding from their state education agencies in the school year 1984-85.
Even wren a district does receive additional money from the state
discretionary portion of Chapter 2, the grant tends to be small and
temporary. The median grant in 1)84-85 was $10,000; two-thirds of those
districts receiving discretionary grants received awards for only 1 of the 3
years in which Chapter 2 has operated.
Local Allocations of Funds to Serve Private School Childrea
ECIA requires districts to provide services from their Chapter 2 funds
for students attending eligible private schools. An estimated 37% of the
nation's school districts provide Chapter 2 services to these studats.*
The median allocation for these services ranges from $42,851 in urge rban
districts to $1,614 in districts with fewer than 2,500 studerr.. The
portion of a district's Chapter 2 funds that are used for services to
private school students is 10%, on average. However, even in school
districts of similar size, this percentage can range from as much as 56% to
less than 1% of the district's total Chapter 2 allocation, depending on
private school enrollment.
See two other reports from this study (Cooperstein, 1986; Knapp andBlakely, 1986) for a more extended discussior of funds allocation forservices to private school students.
78
90

Chan es in Funds Distribution with the Shift to the Block Grant
Chapter 2 represents a consolidation of 32 antecedent programs into a
single block grant. Some of the initial controversy involving Chapter 2
resulted from districts gaining or losing funds when these antecedent
programs were consolidated. Those districts that lost money tended to have
been the major beneficiaries of antecedent programs such as ESAA and ESEA
Title IV-C. Districts that gained funds from Chapter 2 tended to have
benefitted little or not at all from the programmatic predecessors of
Chapter 2.
In general, we found that a large majority of districts (75%) gained at
least some money as a result of Chapter 2. However, gains and losses were
not evenly distributed among districts of different sizes. For example,
fewer than 2% of districts with 600 to 2,499 students lost 75% or more of
their funds as a result of Chapter 2. By comparison, 11% of the largest
urban school districts lost at least 75% of their antecedent funding.
An initial criticism of Chapter 2 was that districts with high
concentrations of poor children tended to lose the most as a result of the
block grant. Our data do not show a clear relationship between poverty rate
and the fact of losing or gaining funds under Chapter 2. Overall,
approximately the same proportion (around 20%) of districts with high
concentrations of poor children lost funds as did districts with relatively
few poor students. The contrasts are sharper for particular size
categories. Forty percent of the largest urban districts with relatively
low poverty rates lost funding, compared with 60% of those with high poverty
rates.
See other reports from this study (Knapp, 1986; Knapp and Blakely, 1986)
for a more extended discussion of the instructional meaning of therse
purchasee.
79
9b

Local Chapter 2 Spending Patterns
Our data confirm the general impression that districts tend to use
Chapter 2 funds to purchase materials and equipment.* Nearly 60% of local
Chapter 2 funds were used for equipment, materials, and supplies in school
year 1984-85. The most frequent purchase in this category was computer
hardware; nearly one-quarter of all Chapter 2 funds was used for this
purpose. Another 5% went for computer software. At the same time,
approximately 29% of Chapter 2 funds were used for salaries. Teachers'
salaries made up the largest expenditure in this category (14% of all
Chapter 2 funds). The remaining 12% of Chapter 2 money was used for other
expenditures, such as consultants, staff development costs, and indirect
administrative costs.
We found important differences in spending patterns among districts of
different sizes. Whereas a clear majority of districts of all sizes use at
least some of their Chapter 2 funding to purchase computer hardware,
software, and other instructional equipment and materials, large and very
large districts (i.e., districts with at least 10,000 students) are more
likely than smaller districts to use Chapter 2 funds for curriculum
development, student support services, instructional services, and staff
development. One reason is that, because smaller districts receive less
Chapter 2 money, officials in these districts find that purchasing a few
computers is more effective than paying for half of a teacher's salary.
We also found that large districts tend to spread their Chapter 2
resources over several types of purchases while smaller districts usually
concentrate their purchases in one or two areas. For example, large urban
*See another report from the national study (Knapp and Blakely, 1986) for amore extended discussion of the educational meaning of equipment andmaterial purchases.
80
9'
districts, on average, spend 37% of tneir Chapter 2 budgets on computers;
those very small districts that purchase computers spend nearly 90% of their
Chapter 2 resources on this item.
In general, we found different "portfolios" of Chapter 2 purchases and
services in districts of different sizes. Larger districts have sufficient
resources to diversify their Chapter 2 purchases. They tend to purchase
computer hardware and software, books, and audiovisual equipment, and still
have sufficient resources to fund staff development, provide some guidance
counselors, or pay some teachers' salaries. Smaller districts do not have
sufficient resources to diversify. Instead, they tend to concentrate their
Chapter 2 purchases in one or two areas for maximum impact. In particular,
these districts tend to concentrate their Chapter 2 funds on computers,
library books, or other equipment purchases.
Comparing Spending for Public and Private School Students
We also found different patterns when comparing Chapter 2 purchases for
public and private school students.* More than 90% of the districts
providing services to private school students use Chapter 2 funds for
instructional resources such as books, maps, and science equipment. Nearly
as many (80%) provide the same kind of instructional resources for public
school students. More districts (88%) provide computer hardware or software
for public school use than for use by students attending private schools
(68%). In addition, districts are more likely to provide public school
students with instruction and student support services. For example, among
districts serving private school students, nearly a quarter (24%) provide
instructional services to students in public schools, but only 6% make these
kinds of services available to private school students.
*Two other reports from this study (Cooperstein, 1986; Knapp and Blakely,
1986) have more extended discussion of spending for private school
students.81
Changes in Spending Patterns with the Shift to the Block Grant
We found important changes in spending patterns between the last year
of the antecedent programs and the first 3 years of the block graLt. The
most striking change is the increase in the number of districts purchasing
computer hardware and software. Only 19% of the nation's schools used
antecedent funding for computer-related purchases. By 1984-85--the third
year of Chapter 2--72% of the nation's districts reported using at least
some of the block grant for computer purchases.
A second change came in the purchase of instructional materials and
equipment other than computers. Eighty-nine percent of all districts used
at least some of their antecedent funding for this type of purchase. By
1984-85, this figure had dropped to 68%.
We also found significant changes in the number of districts using
Chapter 2 to provide staff development. This percentage rose from 12% of
all districts in 1981-82 to 27% in 1984-85.
Influences on Chapter 2 Spending Patterns
We found several important influences on local decisions regarding the
use of Chapter 2 funding. The absolute amount of funding received under the
block grant appears to predispose districts toward certain types of
expenditures. As we have already noted, districts with larger grants tend
to diversify their Chapter 2 purchases and services. However, even
districts receiving as much as $50,000 tend to concentrate Chapter 2 funds
on computer purchases or other instructional resources. In these districts,
block grant funding is seen as insufficient to pay for enough staff salaries
to make such expenditures educationally practical.
82
9;)

Loss of funds under the block grant was an important factor in
expenditure decisions, but only in proportion to the size of the loss.
Overall, although a quarter of the nation's school districts lost funds,
only 5% reported that losing funds influenced their use of Chapter 2
resources. But in the larger districts, which lost the most under the block
grant, this percentage was much higher: sixty-three percent of the largest
urban districts indicated that funds loss affected their Chapter 2
expenditures. For the majority of these districts, losing funds apparently
led to reductions in staff (69% of these very large urban districts) or
resulted in reductions in services to students (83% of these districts).
Another influence on Chapter 2 spending was the desire to continue
antecedent programs. Nationwide, 37% of all districts indicated that
continuing such programs was an important influence on their use of
Chapter 2 money, Sixty-seven percent of all large urban districts cited
this as an important influence. Two reasons for the high percentage among
large urban districts are (1) that these districts were more likely to have
hired staff under antecedent programs and thus faced the obligation to
continue their support with Chapter 2 resources and (2) that larger
districts are more likely to have obligations to continue
desegregation-related activities that were begun under ESAA.
We found some evidence that uncertainty about Chapter 2 audit
requirements may have led some districts to purchase ma:erials and equipment
rather than hire staff. For example, the largest urban districts that
reported concern about audits were more likely to have purchased computers
and instructional material and less likely to fund student support services
or instruction. (It is important to note, however, that concern about
audits was generally low; only 16% of very large urban districts, for
examplg!, expressed concern about audit requirements.)
83
I 60
Finally, districts reported that local priorities (but rarely state or
national priorities) influenced the use of Chapter 2 funds. More than
fourfifths of all districts reported that district priorities influenced
decisions on Chapter 2 spending, compared with 9% reporting state mandates
or priorities, and the same percentage indicated that national reform
reports affected Chapter 2 decisions. However, particular reform
concerns--such as improving test scores, applying effective schools
research, and upgrading mathematics, science, and computer instruction--are
often addressed with Chapter 2 funds.*
Another report from this study (Turnbull and Marks, 1986) explores thistopic in greater detail.
84
10

RFFERENCES
American Association of School Administrators, The Impact of Chapter 2 of
the Education Consolidation and Improvement Act on Local Education
Agencies, Arlington, VA (May 1983).
Cooperstein, Rhonda A., The Participation of Privat School Students in
Services Su sorted b the Education Block Grant, SRI International,
Menlo Park, CA (1986).
Darling-Hammond, Linda, and Ellen Marks, The New Federalism in Education,
State Responses to the 1981 Education Consolidation and ImprovementAct, The Rand Corporation, Santa Monica, CA (February 1983).
Fries, Albert, The Education Block Grant (Preliminary Draft), The Urban
Institute, Washington, DC (June 1983).
General Accounting Office, Education Block Grant Alters State Role andProvides Greater Local Discretion, Report to the Congress of the United
States by the Comptroller General (November 'A, 1984).
Henderson, Anne, Anything Goes: A Summary Report on Chapter 2, National
Committee for Citizens in Education, Inc., Columbia, MD (1985).
Henderson, Anne, ed., No Strings Attached: An Interim Report on the NewEducation Block Grant, National Committee for Citizens in Education,
Inc., Columbia, MD (1983).
Hood, P., Research and School Improvement in the Far West: The Effects of
Federal and State Cutbacks, Consolidation, and Deregulation onEducation in California, Nevada and Utah, Far West Laboratory, SanFrancisco, CA (1982).
Jung, Richard K., and Ted Bartell, Fiscal Effects of the Chapter 2, ECIA
Block Grant on the Largest Districts and Cities, Advanced Technology,Inc., McLean, VA (May 1983).
Knapp, Michael S., Legislative Goals for the Education Block Grant: Have
They Been Achieved at the Local Level, SRI International, Menlo Park,CA (1986).
Knapp, Michael, and Craig Blakely, The Education Block Grant at the Local
Level: The Implementation of Chapter 2 of the Education Consolidation
and Improvement Act in Districts and Schools, SRI International, Menlo
Park, CA (1986).
Kyle, Regina M.J., Kaleidoscopes: Emerging Patterns of Response and Actionin ECIA Case Studies of Chapter 2 in Selected States, E.H. White andCompany (July 11, 1983).
85
104

Turnbull, Brenda and Ellen Marks, The Education Block Grant andIntergovernmental Relations: Effects at the Local Level, SRI
International, Menlo Park, CA (1986).
Verstegen, Deborah A., The Great Society Meets a New Federalism: Chapter 2
of the Education Consolidation and Im rovement Act of 1981, doctoraldissertation from the Wisconsin Center for Education Research,University of Wisconsin, Madison, WI (August 1983).
86
1')

Appendix A
TECHNICAL NOTES AND STANDARD ERROR VALUES FOR TABLES
This appendix contains row and column n's and standard error values forall the tables, followed by technical notes. Tables also include ranges aswell as medians for dollar values.
Technical Notes
We report median dollars instead of means because medians of these dataare better representations of reality than means. The figure belowillustrates part of the problem with reporting means of Chapter 2 budget
data. This graph show the total 1983-1984 Chapter 2 budgets for very large
urban districts. The weighted mean total budget for these districts is
$845,747. However, the figure shows clearly that four of these districtshave extremely large budgets, even comps,red to other large urban districts.If we remove the four districts with budgets greater than $3,000,000, themean drops to $524,058. Obviously, because their allocations are 60atypical, these four districts have an unwarranted influence on thecalculation of the mean. The weighted median budget for all large urbandistricts is $451,385. If the four extreme figures are removed, the medianis *396,379. Thus, by reporting weighted median dollar figures, we have asore accurate picture of the "central tendency"--the average--of thedistribution.
$8,000,000 +
$6,000,000 +
$4,000,000 +*
$2,000,000 + * * * 4.
* * * * ** *** * * * * * * ** * * ** 4
** * ** *** * * **** * * ** *0+
Figure A-1 DISTRIBUTION OF CHAPTER 2 ALLOCATIONS FORVERY LARGE URBAN DISTRICTS (1983-84)
87

For distributions that represent rare events--such as very smalldistricts using Chapter 2 funds to pay teachers' salaries--the median valueacross all cases is likely to be $0.00. In such instances, we will notethat the median is $0.00, then report the median dollar figure for thosedistricts for which the amount is greater than zero; the number of districtsfrom which the median was calculated is provided in the standard errortables.
Standard Error Values for Tables
This appendix replicates tables from the text of this report andincludes relevant population n's, standard error values and (Wiereapplicable) 11;h and 90th percentile ranges. Confidence iutervals aroundestimated population means (or proportions) can be calculated by:
[p <.05] ± 1.96 (Sex)
This significance of differences on nonoverlapping samples can be determinedfrom the normally distributed statistic:
where
(M1' - M2') / (Sq. 2 + se2 2)1/2
Mi Estimate population mean based on sample i
Sei = Corresponding standard errors
For the most part, this report describes funds distribution andspending patterns by presenting national estimates of local Chapter 2allocations (in dollars) or numbers and percentages of districts spendingChapter 2 dollars in particular ways. Unless otherwise noted, dollarallocations will be reported as weighted mediums, numbers of districts willbe reported as weighted ccants, and percentages will be weighted means.* In
addition, ranges between the 10th and 90th percentiles will be reported withmedians (see Standard Error Tables in this appendix).
Although less often reported than means, medians are easilyinterpreted. The median represents the midpoint of a group of numbers. For
example, the median total Chapter 2 budget for very large urban districts is$451,385. This means that half the very large urban districts in the nationreceived more than $451,385, and half received less.
Note: Tables A-II-1, A-II-2, and A-II-4 have been omitted.
*The mail survey sample represents roughly 10% of the nation's districts.Survey responses were weighted by the proportion of districts selectedfrom each cell in the sampling stratification scheme.
88
10

Table A-II-3
AVERAGE (MEDIAN) FORMULA, DISCRETIONARY, AND TOTAL Cl"...FTER 2 FUNDING,
BY DISTRICT SIZE (1984-85)
District Size(Enrollment)
Median formula funds Median discretionary funds* Median total funds
10th 90th
percentile Median percentile
10thpercentile Median
90thpercentile
10thpercentile Median
90th
percentile
Very large(25,000 or more) $222,276 $397,587 $1,074,483 $8,500 $39,000 $418,398 $222,276 $399,709 $1,078,775
(N -159) (N"32) (N°159)
Urban 234,901 451,385 1,691,437 4,000 40,000 418,398 234,901 451,385** 1,691,437
(N°90) (N°17) (N-90)
Suburban 187,763 310,301 864,177 8,500 34,000 98,875 187,763 341,704 867,704
(N°69) (N°15) (N-69)
Large 65,552 104,000 183,194 2,500 18,928 60,951 65,577 107,212 189,000
(10,000-24,999) (N -461) (N°33) (N-461)
Medium 15,230 29,602 63,398 1,162 9,648 38,000 15,230 29,823 46,465
(2,500 to 9,999) (N°2,888) (N°83) (N2,888)
Small 4,610 9,000 18,212 500 10,000 30,000 4,610 9,000** 18,476
(600 to 2,499) (N°5,043) (N-93) (N-5,043)
Very small 595 2,036 5,209 -0- -0- -0- 2,036 2,036** 5,209
(under 600) (N°6,293) (0) (N"6,293)
All districts 1,200 6,422 42,476 500 10,000 41,632 1,200 6,422 43,000
(N°14,844) (N°243) (N°14,844)
*Medians are for districts that received discretionary funds.
*aBecause of the mature of medians and the fact tha. state di.cretionary funding vent 'n few districts, the 'total' figure may be the
same as the 'formula' figure.
1 o 6
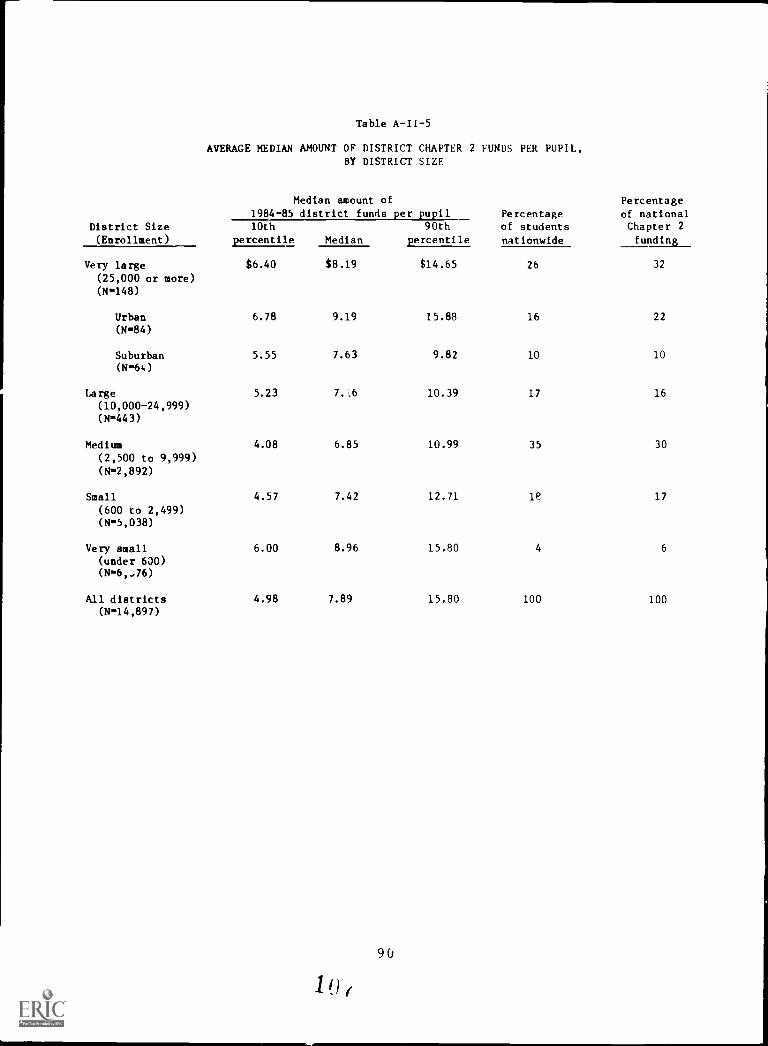
Table A-I1-5
AVERAGE MEDIAN AMOUNT OF DISTRICT CHAPTER 2 FUNDS PER PUPIL,BY DISTRICT SIZE
District Size
(Enrollment)
Median amount of1984-85 district funds per pupil Percentage
of students
nationwide
Percentage
of nationalChapter 2
funding
10th 90thpercentile Median percentile
Very large $6.40 $8.19 $14.65 26 32
(25,000 or more)(N -148)
Urban 6.78 9.19 15.88 16 22
(N=84)
Suburban 5.55 7.63 9.82 10 10
(N=64)
Large 5.23 7.16 10.39 17 16
(10,000-24,999)(N -443)
Medium 4.08 6.85 10.99 35 30
(2,500 to 9,999)(N=2,892)
Small 4.57 7.42 12.71 lE 17
(600 to 2,499)(N- 5,038)
Very small(under 600)
6.00 8.96 15.80 4 6
(N=6,,76)
All districts 4.98 7.89 15.80 100 100(N- 14,897)
90
101

Table A-II-6
DISTRIBUTION OF STATE CHAPTER 2 DISCRETIONARY FUNDS,
BY DISTRICT SIZE
(Standard error values are in parentheses)
District Size
(Enrollment)
Percentage of districts
receiving grants from1984-85 state
discretionary fund
Very large(25,000 or more) 20.3 (2)*
(N159)
Urban 18.6 (2)
(N&90)
Suburban 22.4 (3)
(Ni=69)
Large 7.3 (1)
(1C,000 to 24,999)
(N -461)
Medium 2.9 (1)
(2,500 to 9,999)
(N=1,888)
Small 1.8 (1)
(600 to 2,499)(N.6,043)
Very small(under 600)
0.0 * * )
(N6,293)
Total 1.6 * * )
(Nms14,844)
* Standard error values.
** Less than .5%.
91

Table A-II-7
DISTRICT ALLOCATIONS FOR SERVICES TO PUBLIC AND PRIVATE SCP^OL STUvENTSFOR SCHOOL YEAR 1984-85, BY DISTRICT SIZE
Median percentage ofdistrict's total allocation
Percentage of LEAs (1984-85) used for servicesTotal public allocations Private allocations' providing Chapter 2 for private school rtudents
District Site 10th 90th 10th 90th funds to private 10th 90th(Enrollment) percentile Median percentile percentile Median percentile school students percentile Median 1 .centile
Very large $206,610 $373,216 $1,000,000 $ 7,098 $ 30,881 $160,000 83 (3)+ 2 8 18(25,000 or more) (P159) (P143) (P135) (N143)
Urban 223,849 394,417 1,496,679 10,000 42,851 229,132 90 (4) 3 9 19(P90) (N-81) (P70) (N-81)
Suburban 179,820 306,000 807,173 3,823 23,000 143,126 85 (4) 1 6 12(N-69) (N-62) (N-65) (N-62)
Large 60,677 101,112 170,488 1,776 7,817 23,762 75 (4) 7 7 3(10,000-24,999) (N -461) (N -340) (P349) (N`340)VD
N.) Medium 14,794 28,258 60,815 616 2,393 8,988 47 (3) 2 8 23(2,500 to 9,999) (P2,933) (14-1,410) (N-344) (F.1,405)
Small 4,032 8,736 17,393 412 1,614 4,709 26 (4) 6 15 42(600 to 2,499) (P5,051) (P1,154) (P1,230) (N-1,154)
Very small
(under 600) (N-6,384) (P603) (N-489) (N-594)
All districts 5,013 14,493 64,303 633 2,505 11,344 37 (2) 3 10 28(P14,90) (N-3,650) (N- 3,537) (N-3,637)
Medians are for districts that received private allocations.
Because of the small number of very small districts serving private school students (and consequently few respondents to the survey), reliableestimates for this size category were not possible. The corresponding public allocation figures were left out becaure no comparison could be made.Standard error values.

Table A-II-8
MEDIAN ANTECEDENT FUNDING AND TOTAL CHAPTER 2 FUNDING
FOR 1982-83, BY DISTRICT SIZE
DiMtrict Size(Enrollment)
Antecedent funds (1981-82) Total Chapter 2 (1992-83)Percentchange
10thpercentile Median
90thpercentile
10th 90th
percentile Median percentile
Very large $ 97,547 $352,481 $3,008,188 $192,556 $382,716 $1,239,000 9
(25,000 or more) (8'162) (Nft154)
Urban 112,367 543,923 3,716,013 193,921 433,100 1,515,968 -20
(N-92) (8'87)
Suburban 89,092 250,281 1,034,592 180,328 329,171 899,411 32
(N -70) (N-67)
Large 26,100 70,737 250,040 47,814 94,233 191,556 33
(10,000-24,999) 04-450 (N -446)
Medium 7,284 17,617 80,990 14,593 28,410 62,624 61
(2,500 to 9,999) (142,934) (N=2,670)
Small 2,349 4,946 18,000 5,000 8,841 18,963 79
(600 to 2,499) (145,066) (144,605)
Very small 239 1,399 8,707 507 1,972 4,556 41
(under 600) (8"5,388) (N=5,496)
All districts 540 4,706 41,936 1,204 6,532 41,059 39
(K 14,005) (N- 13,371)
1 1 1
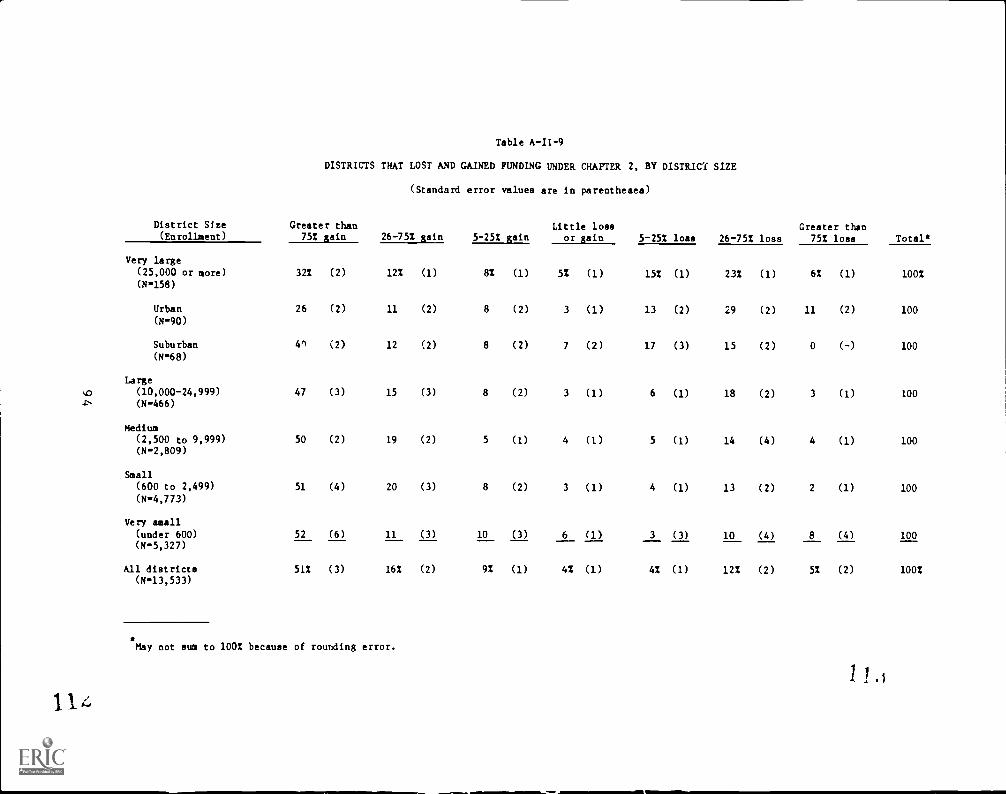
Table A-II-9
DISTRICTS THAT LOST AND GAINED FUNDING UNDER CHAPTER 2, BY DISTRICT SIZE
(Standard error values are in parentheses)
District Size(Enrollment)
Greater than752 gain 26-75% gain 5-25% gain
Little lossor gain 5-25% loss 26-75% loss
Greater than75% loss Total
Very large
(25,000 or more) 32% (2) 12% (1) 8% (1) 5% (1) 15% (1) 23% (1) 6% (1) 100%(N-158)
Urban 26 (2) 11 (2) 8 (2) 3 (1) 13 (2) 29 (2) 11 (2) 100(N -90)
Suburban 4n (2) 12 (2) 8 (2) 7 (2) 17 (3) 15 (2) 0 (-) 100(N-68)
Large
qp (10,000-24,999) 47 (3) 15 (3) 8 (2) 3 (1) 6 (1) 18 (2) 3 (1) 100-P- (N -466)
Medium(2,500 to 9,999) 50 (2) 19 (2) 5 (1) 4 (1) 5 (1) 14 (4) 4 (1) 100(N- 2,809)
Small(600 to 2,499) 51 (4) 20 (3) 8 (2) 3 (1) 4 (1) 13 (2) 2 (1) 100(N- 4,773)
Very small
(under 600) 52 (6) 11 (3) 10 (3) 6 (1) 3 (3) 10 (4) 8 (4) 100(N- 5,327)
All districts 51% (3) 16% (2) 9% (1) 4% (1) 4% (1) 12% (2) 5% (2) 100%(N- 13,533)
a
114
May not sum to 100% because of rounding error.

Table A-II-10
AVERAGE MEDIAN LOSS OR GAIN PROM ANTECEDENT FUNDING IN 1981-82BY DISTRICT SIZE (1984-85)
Districts that lost Districts that gained
District Size(Enrollment)
Amount lost Percentage lost Amount gained Percentage gained
10th
percentile Median90th
percentile10th
percentile Median
90th
percentile10th
percentile Median90th
iercentile10th
percentile Median90th
percentile
Very large $2,697,770 $296,653 $58,404 81 41 10 $66,141 $151,775 $403,762 10 107 385
(25,000 or more) (N.73)* (N.86)
Urban 3,088,580 384,745 97,806 81 46 17 71,888 150,942 530,920 10 79 632
(N -45) (N -39)
Suburban 662,133 165,392 26,699 66 21 8 43,672 158,338 304,349 10 109 385
(N -23) (N -40)
Large 380,085 75,144 11,384 68 40 8 20,456 52,892 116,492 23 118 288
(10,000-24,999) (N-129) (N-332)
%.0
Ln Medium 131,292 29,912 2,235 81 49 8 ti,909 14,265 36,970 29 110 323
(2,500-9,999) (N.679) (N2,694)
Small 53,700 4,381 347 76 39 5 1,600 4,934 11,127 23 125 287
(600-2,499) (N -939) (N-3,988)
Very small 59,416 3,086 80 96 59 5 247 1,288 3,015 21 161 343
(less than 600) (N.1,327) (N.4538)
Total $ 94,292 $ 6,818 185 90 48 5 $ 522 $ 3,266 $ 23,120 23 127 329
(N.3,146) (N- 11,138)
Weighted subsample count.
114
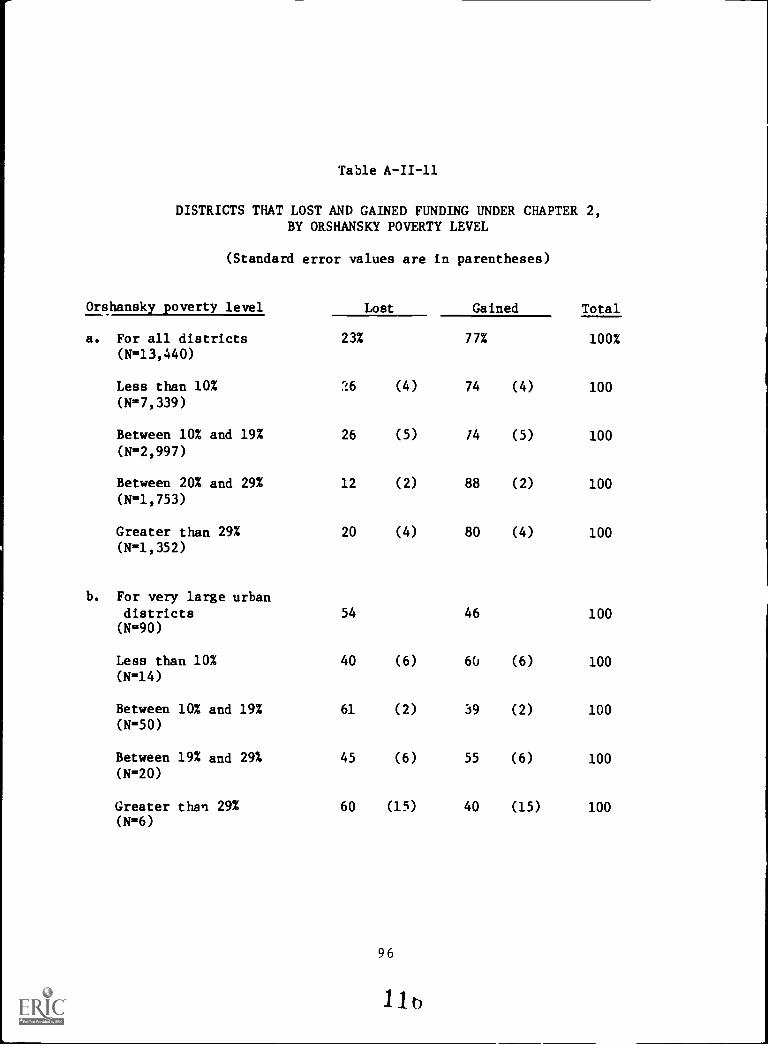
Table A-II-11
DISTRICTS THAT LOST AND GAINED FUNDING UNDER CHAPTER 2,BY ORSHANSKY POVERTY LEVEL
(Standard error values are in parentheses)
Orshansky poverty level Lost Gained Total
a. For all districts 23% 77% 100%(N- 13,440)
Less than 10% 26 (4) 74 (4) 100(N=7,339)
Between 10% and 19% 26 (5) 14 (5) 100(N=2,997)
Between 20% and 29% 12 (2) 88 (2) 100(N=1,753)
Greater than 29% 20 (4) 80 (4) 100
b.
(N=1,352)
For very large urbandistricts 54 46 100(N=90)
Less than 10% 40 (6) 60 (6) 100(N=14)
Between 10% and 19% 61 (2) 39 (2) 100(N=50)
Between 19% and 29% 45 (6) 55 (6) 100(N=20)
Greater than 29% 60 (15) 40 (15) 100(N=6)
96
11 b

qD
Table A-III-1
CHAPTER 2 EXPENDITURES IN DIFFERENT ACTIVITY AREAS
(Standard error values are in parentheses)
Percentage of districts in each size category indicating that 1984-85 Chapter 2 funds are spent in each area:
District Size(Enrollment)
Computerapplications
Support for library/
media centers, otherschool departments*
Curriculum and
new programdevelopment
Student supportservices
Instru ctional
services
Staffdevelopment
Very large 85 (2; 86 (2) 56 (2) 52 (2) 54 (2) 79 (2)
(25,000 or more)
(N162)
Urban 85 (2) 86 (2) 50 (2) 54 (3) 62 (2) 83 (2)
(N-92)
Suburban 87 (2) 85 (2) 62 (3) 49 (3) 44 (3) 73 (2)
(N70)
Large 82 (3) 82 (3) 49 (4) 42 (3) 36 (4) 68 (3)
(10,000-24,999)(N -47l)
Medium 78 (2) 71 (2) 33 (2) 22 (2) 25 (2) 40 (2)
(2,500 to 9,999)
(Nm3,009)
Small 80 (3) 64 (3) 25 (3) 17 (3) 12 (2) 27 (3)
(600 to 2,499)(Nm5,298)
Very small(under 600)
62 (5) 68 (5) 18 (4) 7 (3) 13 (4) 16 (4)
(N6,517)
All districts 72 (2) 68 (3) 25 (2) 15 (1) 16 (2) 27 (2)
(N15,457)
Including instructional materials and equipment other than computer hardware or software.
111 ho

Table A-III-2
NUMBER OF ACTIVITY AREAS IN WHICH DISTRICTS SPEND CHAPTER 2 RESOURCES,BY DISTRICT SIZE
(Standard error values are in parentheses)
District Size In each number of activity categories*:
(Enrollment) One Two Three or more
Very large(25,000 or more) 0% (0) 10% (1) 90% (1)
(N=162)
Urban 0 (0) 8 (2) 92 (2)
(N=92)
Suburban 0 (0) 13 (2) 87 (2)
(N=70)
Large 6 (2) 13 (3) 81 (3)
(10,000-24,999)(N=471)
Medium 15 (1) 32 (2) 54 (2)
(2,500 to 9,999)(N- 3,009)
Small 27 (3) 37 (3) 37 (3)
(600 to 2,499)(N=5,298)
Very small(under 600)
43 (5) 36 (5) 21 (4)
(N=6,517)
All districts 30 (3) 34 (3) 35 (2)(N=15,457)
*Out of seven possible categories. See explanation in text.
98
Int

Table A-III-3
AVERAGE (MEAN) PROPORTION OP CHAPTER 2 FUNDS ALLOCATED TO EACH ACTIVITY AREA, BY DISTRICT SIZE*
(Standard error values art in parentheses)
District Size(Enrollment Range) .43112Ite"
Other instructionalmaterials**
Curricultodevelopment
Student supportservices
Instructionalservices
Staff
development'sI
Very large 21 (1) 24 (1) 13 (1) 13 (1) 15 (1) 12 (1) '
(25,000 or more))(N -139)
Urban 15 (1) 22 (1) 11 (1) 16 (1) 19 (1) 12 (1)
(N -76)
Suburban 28 (2) 26 (1) 15 (2) 9 (1) 11 (2) 12 (2)
(N=63)
Large 27 (2) 34 (2) 8 (1) 7 (1) 8 (1) 15 (2)
(10,000-24,999)(N -442)
Medium 40 (1) 34 (1) 7 (1) 5 (1) 6 (1) 7 (1)
(2,500 to 9,999)(N- 2,847)
Small 50 (3) 34 (2) 5 (1) 3 (1) 2 (1) 6 (1)
(600 to 2,499)(N=5,145)
Very small(less than 600)
40 (5) 50 (5) 6 (2) 1 (1) 1 (1) 3 (1)
(N=6,058)
All districts 43 (2) 41 (2) 6 (1) 3 (***) 3 (***) 5 (1)
(N- 14,631)
* *
Rows should sum to approximately 100%. Mean percents include districts in which 02 was allocated to a given activity.
Including instructional materials and equipment other than computer hardware and software.
** *Between 02 and 52.
1 2 u

Table A-III-4
TOTAL CHAPTER 2 FUNDS ALLOCATEDTO EACH TYPE OF PURCHASE
Expenditurecategory
Total spentby districts
on this categoryin 1984-85*
Proportionof total.
LEA spend
Personnel
Teachers (specialist, classroom) $ 44,751,902 14%Administrators 13,063,252 4
Other certificated personnel(e.g., counselors) 14,688,579 5
Noncertificated personnel(e.g., aides) 13,361,440 4
Other salaries 6,692,200 2
Subtotal 29%
Equipment, materials, and supplies
Computer hardware 79,124,142 25
Computer software 16,071,893 5
Other equipment (e.g., audiovisual) 33,703,282 10
Books and other materials 62,436,703 19
Subtotal 59
OtherConsultants 6,971,678 2
Training/staff development costs** 16,805,185 5
Indirect administrative costs 4,835,054 2
Other+ 11,213,291 4
Subtotal 12
Total $323,307,467 100%
*Districts reported this spending in the middle of the school year as a totalof funds spent and projected to be spent. Their projections underestimateslightly the total district allocations.
**Not including consultants. Some other staff-development-related costs(e.g., the salary of a staff development coordinator) could be included inother line items.
+Examples of other expenditures are travel, fiscal audits, testing, andminigrants to schools.
100
121

Table A-III-5
AVERAGE (MEDIAN) CHAPTER 2 AMOUNTS ALLOCATED TO EACH LINE-ITEM EXPENDITURE CATEGORY
Median amount per district put into the following expenditures:*
District Site
(Enrc'lment)
Median total public allocation Teachers' salaries Administrators' salaries
10th
percentile Median
90th
percentile
10th
percentile Median
90th
percentile
10th
percentile Median
90th
percentile
Very large $206,61 0 $373,216 $1,000,000 $21,962 $110,161 $387 266 $10,047 $44,826 $186,250
(25,000 or more) (N*159) (N*113) (N*79)
Urban 223,849 394,417 1,496,679 37,345 $141,429 500,000 10,047 52,736 204,925
(N*90) (N*68) (N*49)
Suburban 179,820 306,000 807,173 19,850 87,261 379,418 4,629 41,448 171,976
o1-- (N*69) (N*45) (N-30)
1-
Large 60,678 101,112 170,488 7,650 29,200 75,694 1,019 11,814 46,604
(10.000 to 24,999) (N*461) (N*145) (N*64)
Medium 14,794 28,258 60,815 2,500 13,452 47,992 472 8,189 32,000
(2,500 to 9,999) (N*2,933) (N-544) (N*135)
Small 4,032 8,736 17,393 1,000 4,000 14,119 500 7,000 11,800
(600 to 2,499) (N*5,051) (N*399) (N*186)
Very small 694 2,106 5,209 200 531 7,938 100 100 100
(under 600) (N*6,384) (N*395) (N*141)
All districts 1,192 6,349 40,834 314 7,938 49,182 100 4,009 43,715
(N*14,989) (N*1,596)(N*605)
*Excluding cases where $0.00 were spent on each category.
1`212o

Table A-111-5 (Continued)
Median amount per district put into the following expenditures:*
District Size(Enrollment)
Other certificated salaries Noncertificated salaries Other salaries
10thpercentile Median
90thpercentile
10thpercentile Median
90thpercentile
10thpercentile Median
90thpercentile
Very large $11,900 $75,510 $283,821 $ 8, 334 $38,807 $164,851 $5,500 $22,800 $132,443
(25,000 or more) (N=48) :N=90) (N=68)
Urban 15,149 93,200 532,425 10,981 55,414 180,396 6.150 21,034 171,002
(N -31) (N -56) (N -43)
Suburban 9,786 40,670 180,309 6,346 26,143 100,449 5,500 25,849 103,126
(N -17) (N -34) (N -25)
Large 2,870 28,300 81,010 1,868 8,558 46,486 500 5,572 32,192
cD (10,000 to 24,999) (N -53) (N -135) (N=76)N.)
Medium 2,000 13,974 28,313 1,162 6,867 23,942 540 3,375 11,820
(2,500 to 9,999) (N -225) (N -327) (N=142)
Small 80G 7,154 53,932 1,550 3,000 4,126 90 90 90
(600 to 2,499) (N=100) (N=100) (N -7)
Very small 1,300 1,300 1,300 886 886 3,578 1,750 1,750 1,750
(under 600) (N=12) (N=153) (N -94)
All districts 1,300 15,926 61,020 886 4,126 31,179 600 2,781 30,328
(N -439) (N -805) (N -388)
Excluding cases where $0.00 were spent on each category.
12 (11 r;)

Table A-111-5 (Continued)
Median amount per district put into the following expenditures:*
District Size(Enrollment)
Computer hardware Other equipment Computer software Materials
10thpercentile Median
90thpercentile
10thpercentile Median
90thpercentile
10th
percentile Median
90th
percentile
10thpercentile Median
90thpercentile
Very large $ 5,330 $50,000 $313,605 $4,704 $32,682 $113,400 $2,000 $10,000 $80,000 $4,850 $53,492 $140,943
(25,000 or sore) (N"105) (N'95) (N'82) (N.144)
Urban 5,000 40,278 220,859 4,704 30,613 150,000 1,000 10,000 80,000 5,800 64,209 150,000
(N -54) (N'52) (N -41) (N -79)
Suburban 10,000 59,500 341,211 5,006 34,989 92,450 2,138 9,397 70,000 3,028 40,500 120,000
r-
(N"51) (N -43) (N -41) (N -65)
CD Large 3,000 28,101 80,000 3,000 14,500 40,640 1,317 5,400 24,099 4,475 27,237 72,500
L..) (10,000 to 24,999) (N -304) (N -280) (N'273) (N'370)
Medium 3,000 12,900 31,056 1,200 7,032 22,000 500 2,500 9,281 1,000 7,103 23,856
(2,500 to 9,999) (N.1,830) (N"1,312) (N- 1,369) (N'1,884)
Small 1,844 5,834 11,500 900 2,970 7,230 172 1,000 3,915 534 3,458 9,000
(600 to 2,499) (N- 3,180) (N- 1,922) (N- 2,267) (N'2,686)
Very small 521 1,825 7,456 375 1,000 5,191 160 600 1,768 192 1,000 3,083
(under 600) (N'2,402) (N'1,829) (N'2,039) (N'4,092)
A11 districts 1,000 5,237 19,461 500 2,553 15,000 200 1,000 5,000 300 2,403 13,680
(N- 7,820) (N- 5,438) (N- 6,030) (N.9,176)
*Excluding cases where $0.00 were spent on each category.
12r
12t

Table A-III-5 (Concluded)
Median amount per district put into the following expenditures:Consultants Training Indirect costs administration Other costa"
District Size 10th 90th 10th 90th 10th 90th 10th 90th
(Enrollment) percentile Median percentile percentile Median percentile percentile Median percentile percentile Median percentile
Very large $2,000 $14,220 $ 55,000 $3,000 $14,527 $100,000 $3,700 $13,720 $56,672 $1,532 $20,128 $165,410(25,000 or more) (N81) (N*95) (N=101) (N -92)
Urban 2,084 14,970 166,000 4,210 19,430 100,000 5,036 13,966 57,680 2,650 28,792 131,895(N49) (N=57) (N-66) (N-51)
Suburban 1,500 9,100 44,500 1,100 9,000 89,000 2,966 11,929 33,725 1,353 12,000 210,895(N32) (N38) (W95) (N -41)
Large 1,150 4,344 16,965 1,200 10,000 41,339 478 2,122 6,769 1,000 4,000 38,98C
(10,000 to 24,999) (N170) (W248) (N-235) (N-161)
Mediumx, (2,500 to 9,999)
400 2,000(N381)
6,793 1,000 3,050(N789)
11,860 200 1,017(N -414)
3,814 200 1,624
(N-605)
9,500
Small 500 2,000 21,000 453 7,113 8,170 200 501 1,851 75 570 7,000
(600 to 2,499) (N366) (W782) (N-586) (N-502)
Very small 152 1,873 2,550 100 1,125 3,744 125 270 390 200 1,028 5,500
(under 600) (N226) (W541) (N"116) (N-302)
All districts 500 2,000 10,400 400 2,610 13,800 159 718 4,790 200 1,600 10,000
(N1,225) (N2,456) (N.1,451) (N-1,662)
12
Excluding cases where $0.00 were spent on each category.
eft
Other costs include travel expenses, fiscal audits, testing, and mini-grants to schools.
BEST COPY AVAILABLE

Table A-III-6
COMPARISON OF SERVICES TO PUBLIC AND PRIVATE SCHOOL STUDENTS(Standard Errors Values are in Parenthesis)
Percentage of districts* in which each activityis supported by Chapter 2 funds for:
Type of activity Public school students Private school students
Computer applications 88% (2) 68% (5)
Instructional resource
support 80 (5) 92 (2)
Curriculum or newprogram development 37 (5) 22 (5)
Student supportservices 24 (4) 9 (4)
Instructional services 24 (3) 6 (2)
Staff development 39 (3) 11 (2)
(Nim3,110) (N- 2,990)
*Among districts with enrollment of at least 600, with participating
private schools, and in which the private school component is administered
at the district level.
105Li (

Table A-III-7
SPENDING PATTERNS FOR ANTECEDENT PROGRAMS IN 1981-82 AND VOR CHAER 2 IN 1982-83, BY DISTRICT SIZE
Percentage of districts in each size category putting funding into each activity category:
District Size(Enrollment)
Computerapplications
Support for libraries/media centers, otherschool departments**
Curriculum andnew-program development
Antecedent1981-82
Chapter 21982-83
Antecedent1981-82
Chapter 21982-83
Antecedent1981-82
Chapter 21982-83
Very large(25,000 or more) 37 (4) 66 (4) 98 (1) 85 (4) 50 (4) 58 (5)(H 151 /147)*
Urban 29 (4) 67 (5) 96 (2) 91 (4) 56 (5) 60 (6)(N-82/82)
Suburban 47 (6) 64 (6) 100 (0) 78 (5) 43 (6) 56 (6)(N-69/65)
Large 26 (4) 54 (5) 93 (2) 86 (2) 33 (3) 37 (5)(10,000-24,999)(N-460/438)
Medium 23 (2) 59 (3) 93 (2) 76 (2) 26 (3) 24 (2)(2,500 to 9,999)(N2,605/2,813)
Small 23 (4) 58 (4) 85 (3) 72 (4) 17 (3) 15 (3)(600 to 2,499)
(N-4,351/4,929)
Very small(under 600)
13 (5) 34 (8) 89 (6) 69 (9) 10 (5) 16 (4)
(N-4,802/4,736)
All districts 20 (3) 49 (4) 89 (3) 72 (4) 17 (2) 19 (2)(N-12,369/13,063)
First N corresponds to 1981-82 data; second N corresponds to 1982-83 data.
*Including instructional materials and equipment other than computer hardware or software.
1 31

Table A-III-7 (Concluded)
Percentage of districts in each size category putting funding into each activity category:
District Size
(Enrollment)
Student Support Services Instructional sQrvices Staff development
Antecedent1981-82
Chapter 2
1982-83
Antecedent
1981-82
Chapter 2
1982-83
Antecedent1981-82
Chapter 21982-83
Very large(25,000 or more) 57 (4) 39 (4) 44 (3) 58 (3) 42 (3) 59 (5)
(N=151/147)*
Urban 50 (5) 46 (5) 55 (5) 66 (5) 48 (5) 66 (5)
(N- 82/82)
Suburban 64 (6) 30 (5) 31 (5) 47 (6) 35 (5) 49 (7)
(N- 69/65)
Large 31 (4) 27 (4) 20 (:) 28 (5) 29 (4) 49 (5)
(10,000-24,999)(N- 460/438)
Medium 23 (2) 15 (2) 15 (2) 17 (2) 22 (2) 30 (3)
(2,500 to 9,999)(N=2,605/2,813)
Small 15 (4) 12 (3) 8 (3) 7 (2) 10 (2) 18 (3)
(600 to 2,499)(N- 4,351/4,929)
Very small(under 600)
6 (4) 4 (2) 4 (3) 3 (1) 7 (5) 7 (3)
(N°4,802/4,736)
All districts 142 (2) 112 (1) 82 (2) 92 (1) 122 (2) 182 (2)
(N-12069/13,063)
First N corresponds to 1981-82 data; second N corresponds to 1982-83 data.
13c

Table A-III-8
CHATTER 2 SPENDNG PATTERNS ACROSS ThE 3 YEARS OF THE BLOCK GRANT, BY DISTRICT SIZE
(Standard error values are in parentheses)
Percentage of districts in each size category using funds for the following in each year:
District Size(Enrollment)
Computer applicationsSupport for libraries/media
center!, other school departments**Curriculum and
new - program development
1982-83 1983-84 1984-85 1982-83 1983-84 1984-85 1982-83 1983-84 1984-85
Very large(25,000 or sore) 66% (4) 74% (3) 85% (2) 85% (4) 84% (3) 86% (2) 58% (5) 61% (4) 56% (2)
(N.147/153/1605*
Urban 67 (5) 74 (4) 85 (2) 91 (4) 89 ((3) 86 (2) 60 (6) 61 (5) 50 (2)
(N*82/87/91)
Suburbaa 64 (6) 75 (6) 87 (2) 78 (5) 78 (4) 85 (2) 56 (6) 59 (6) 62 (3)
(N*65,66 69)
Large 54 (5) 72 (5) 82 (3) 86 (2) 83 (3) 82 (3) 37 (5) 43 (5) 49 (4)
(10,000-24,999)(N*1,138/438/471)
Medium 59 (3) 74 (2) 78 (2) 76 (2) 67 (2) 71 (2) 24 (2) 28 (2) 33 (2)
(2,500 to 9,999)
(N-2,812/2,880/3,009)
Small 58 (4) 72 (4) 80 (3) 72 (4) 62 (4) 64 (3) 15 (3) 20 (4) 25 (3)
(600 to 2,499)(N-4,929/5,202/5,298)
Very small(under 600)
34 (8) 41 (8) 62 (5) 69 (9) 71 (8) 68 (5) 16 (4) 11 (4) 18 (4)
(N*4,736/5,341/6,517)
All districts 49 (4) 60 (4) 72 (2) 72 (4) 67 (4) 68 (3) 19 (2) 19 (2) 25 (2)
(N*13,062/14,014/15,455)
* *
First N corresponds to 1982-83 data; second N corresponds to 1983-84 data; third N corresponds to 1984-85 data.
Support for instructional resources (books, materials, etc.) other than computer hardware or software.
1 3,1
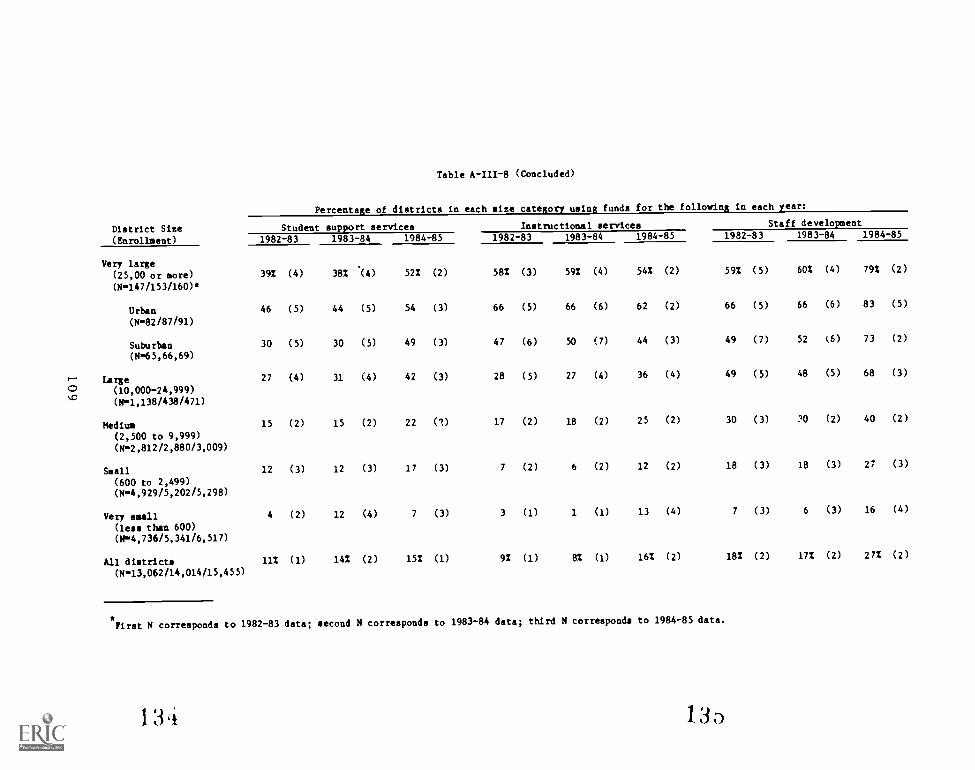
Table A-III-8 (Concluded)
Percentage of districts in each size category using funds for the following in each year:
District Size
(Enrollment)
Student support services Instructional services Staff development
1982-83 1983-84 1984-85 1982-83 1983-84 1984-85 1982-83 1983-84 1984-85
Very large(25,00 or more) 39% (4) 38% (4) 52% (2) 58% (3) 59% (4) 54% (2) 59% (5) 60% (4) 79% (2)
(M*147/153/160)
Urban 46 (5) 44 (5) 54 (3) 66 (5) 66 (6) 62 (2) 66 (5) 66 (6) 83 (5)
(N-82/87/91)
Suburban 30 (5) 30 (5) 49 (3) 47 (6) 50 (7) 44 (3) 49 (7) 52 (6) 73 (2)
(N65,66,69)
Large 27 (4) 31 (4) 42 (3) 28 (5) 27 (4) 36 (4) 49 (5) 48 (5) 68 (3)
C) (10,000-24,999)QD
(W1,138/438/471)
Medium 15 (2) 15 (2) 22 (1) 17 (2) 18 (2) 25 (2) 30 (3) X) (2) 40 (2)
(2,500 to 9,999)
(2,812/2,880/3,009)
Smell 12 (3) 12 (3) 17 (3) 7 (2) 6 (2) 12 (2) 18 (3) 18 (3) 27 (3)
(600 to 2,499)(N-4,929/5,202/5,298)
Very small 4 (2) 12 (4) 7 (3) 3 (1) 1 (1) 13 (4) 7 (3) 6 (3) 16 (4)
(less than 600)(N=4,736/5,341/6,517)
All districts 11% (1) 145 (2) 155 (1) 9% (1) 8% (1) 16% (2) 18% (2) 17% (2) 27% (2)
(N-13,062/14,014/15,455)
First N corresponds to 1982-83 data; second N corresponds to 1983-84 data; third N corresponds to 1984-85 data.
134 130

Table A-IV-1
PERCENTAL,2S OF DISTRICTS ALLOCATING CHAPTER 2 FUNDS TO ACTIVITY CATEGORIES,BY SIZE OF CHAPTER 2 GRANT
(Standard errs. falues are in parentheses)
Percentage of districts nationwide that allocated 1984-85 Chapter 2 funds to:
Support for libraries/Computer media centers, other Curriculum Student support Instructional Staff
Grant size applications school departments development services services development Other
$1,000,000 or more 942 (0) 882 (6) 662 (8) 582 (7) 692 (9) 94% (5) 88% (6)
(N*19)
$500,000 to $999,999 74 (5) 75 (3) 50 (4) 53 (6) 63 (4) 91 (2) 85 (3)
(N-44)-..
...
CD $100,000 to $499,999 83 (3) 83 (3) 54 (4) 44 (4) 44 (4) 72 (4) 51 (3)
(N*394)
$f0,000 to $99,999 80 (3) 86 (3) 38 (4) 30 (3) 36 (4) 55 (4) 37 (3)
(N -791)
$5,000 to $49,999 80 (3) 64 (3) 30 (3) 19 (2) 14 (2) 32 (3) 15 (2)
(N*7,310)
Less than $5,000 60 (5) 68 (5) 13 (3) 4 2) 12 (4) 12 (4) 4 (2)
(1416,240)
Overall 712 (2) 672 (3) 242 (2) 1.42 (1) 162 (2) 262 (2) 122 (1)
(N-14,797)
* Including instructional materials and equipment other than computzr hardware or software.
13t
:G

Table A-IV-2
PROPORTION OF DISTRICT'S CHAPTER 2 FUNDS ALLOCATED TO EACH ACTIVITY AREA, BY SILr. ^7 CHAPTL7 2 GRANT
(Standard error values are in parentheses)
Mean percentage of district's Chapter 2 allocetions (1984-85) allocated ro:
Chapter 2 rant siteComputer
applications
Support for
libraries /mediacenters, other
school departments**
Curriculum
development
Student
support
Instructionalservices
$1,000,000 or more 16 (2) 23 (7) 18 (2) 19 (7) 15 (6)
(N-16)
$500,000 to $999,999 18 (1) 15 (2) 12 (3) 12 (1) 16 (2)
(N -41)
$100,000 to $499,999 26 (3) 32 (2) 10 (1) 9 (1) 11 (1)
(N -356)
$50,000 to $99,999 30 (2) 33 (2) 9 (2) 7 (1) 9 (1)
(N -758)
$5,000 to $49,999 48 (2) 33 (2) 6 (2) 4 (1) 3 (**19
(N7,079)
Lees than $5,000 40 (5) 52 (5) 4 (2) 1 (1) 1 (1)
(N-5,747)
Overall 43 (2) 41 (2) 6 (1) 3 (***) 3 (***)
(N13,997)
*Rows should sum to approximately 100%. Mean percents include districts In which 0% was allocated to a given ac ivity.
A*Including instructional materials and equipment other than computer hardware or software.
As*Between 0% and .52.
13j
13
Staffdevelopment Other
6 (1) 12 (1)
18 (2) 15 (1)
14 (3) 8 (1)
11 (1) 9 (1)
6 (1) 3 (1)
2 (1) 2 (1)
5 (1; 3 (1)

Table A-IV-3
LOSS OF CHAPTER 2 FUNDS AS AN INFLUENCE ON CHAPTER SPENDING,
BY DISTRICT SIZE
(Standard error values are in parentheses)
Percentage of losingdistricts* reporting that
District Size funds loss influenced(Enrollment) use of Chanter 2 funds
Very large 50% (3)
(25,000 or more)
(N=72)
Urban 63 (3)
(N-48)
Suburban 25 (5)
(N=24)
Large 32 (6)
(10,000-24,999)(N=129)
Medium 21 (3)
(2,500 to 9,999)
(N=666)
Small 15 (6)
(600 to 2,499)(N=922)
Very small(under 600)
4 (3)
(N=1,281)
All districts 13% (2)(N=3,070)
*Losing district - 1984-85 Chapter 2 allocation was less than total fundsreceived under antecede:it programs in 1981-82.
1 1 2
Liu

Table A-IV-4
INFLUENCE OF FUNDS LOSS ON SPENDING FOR STAFF OR STUDENT SERVICES,BY DISTRICT SIZE
(Standard error values are in parentheses)
Percentage of districts reporting the lossinfluenced use of Chapter 2 funds and indicating
District Size(Enrollment)
that the block grant caused...
Net reductionsin staff
Reductions in services
to particular groupsof students
Very large(25,000 or more 56% (4) 66% (4)
(N -43)
Urban 69 (5) 83 (3)
(2Cm35)
Suburban 0 (-) 0 (-)
(N -8)
Large(10,000-24,999) 25 (7) 37 (7)
(N -48)
Medium 16 (5) 30 (6)
(2,500 to 9,999)(N -215)
Small 6 (4) 11 (4)
(600 to 2,499)(141278)
Very small(under 600)
0 (-) 0 (-)
(N -83)
All districts 13% (3) 21% (3)
(N -667)
1 1 3
141

Table A-IV-5
ANTECEDENT PROGRAMS AS ANINFLUENCE ON CHAPTER 2 SPENDING;
BY DISTRICT SIZE
(Standard error values are in parentheses)
District Size(Enrollment)
Percentage of districtsReporting antecedent
programs as an importantinfluence on decisions
about use of funds
Very large 59% (2)
(25,000 or more)
(N=162)
Urban 67 (2)
(N=92)
Suburban 47 (3)
(N=70)
Large 58 (4)
(10,000-24,999)
(N=461)
Medium 44 (2)
(2,500 to 9,999)
(N=2,954)
Small 34 (3)
(600 to 2,499)(N=5,2C4)
Very small(uncle' 60C)
34 (6)
(N=5,989)
All districts 37% (3)
(N- 14,771)
114
144

District Site
(Enrollment)
Very large
Table A -iV -6
UNCERTAINTY ABOUT CHAPTER 2 FUNDING AS Ad INFLUENCE ON SPENDING,BY DISTRICT SIZE
(Statu6..4 error values are in parentheses)
Percentage of districts using Chapter 2 funds for:
Computerapplications
Uncertain Not
about uncertainChapter 2 about
funding funding
Support for libraries/media centers, otherschool departments*
Uncertain Not
about uncertainChapter 2 about
funding funding
Student support services and...
Uncertain Not
about uncertainChapter 2 aboutfunding funding
Instructional services and...
Uncertain Not
about uncertainChapter 2 about
funding funding
(25,000 or sore) 89Z (5) 84Z (4) 94Z (3) 84% (4) 41Z (7) 44Z (5) 61Z (5) 60Z (5)
(8'38/65)**
Urban 89 (5) 80 (4) 100 (0) 78 (6) 56 (10) 41 (6) 73 (0) 61 (6)
(N- 23/36)
Suburban 87 (10) 91 (3) 86 (13) 91 (3) 21 (13) 47 (6) 36 (14) 58 (9)
(815/29)
Large 89 (5) 83 (4) 90 (5) 80 (4) 56 (11) 33 (5) 36 (11) 38 (6)
(10,000-24,999)(N- 69/225)
Medium 75 (4) 80 (2) 67 (5) 73 (3) 28 (5) 18 (2) 30 (5) 20 (2)
(2,500 to 9,999)
(N-480/1,506)
Small 69 (9) 77 (4) 66 (9) 65 (5) 22 (8) 10 (3) 15 (7) 9 (3)
(600 to 2,499)
(N0861/2,807)
Very small(under 600)
72 (8) 57 (8) 72 (19) 69 (8) 15 (14) 8 (4) 10 (10) 16 (7)
(N*611/3,169)
All districts 72 (5) 70 (4) 70 (7) 69 (4) 23 (6) 12 (2) 19 (5) 15 (3)
(N*2.059/7,772)
*Including insmictional materials and equipment other than computer hardware or software.
**1st figure corresponds to districts uncertain about Chapter 2 funding; 2nd figure corresponds to districts not uncertainabout Chapter 2 funding.
14jBEST COPY AVAILABLE

14 (I
Table A-IV-7
UNCERTAINTY ABOUT /OMITS AS AN INFLUENCE ON SPENDING,BY DISTRICT SIZE
(Standard error values are in parentheses)
Percentage of districts using Chapter 2 funds for:
Computerapplications and...
Support for librazies/media centers, other
school departments and... Student support services and... Instructional services and...
District Size(Enrollment)
Uncertain
aboutaudits
Not
uncertainaboutaudits
Uncertain
aboutaudits
Notuncertain
aboutaudits
Uncertainaboutaudits
Not
uncertainaboutaudits
Uncertainabout
audits
Not
uncertainabout
audits
Very large
(25,000 or more) 95Z (5) 84Z (3) 95Z (4) 86Z (3) 28Z (9) 47% (5) 391 (8) 661 (4)(N.77/80)"
Urban 100 (0) 81 (5) 100 (0) 84 (4) 27 (12) 49 (6) 28 (0) 73 (5)(N.9/50)
Suburban 91 (14) 88 (6) 92 (5) 88 (6) 28 (9) 43 (8) 47 (17) 54 (8)(N.13/30)
Large 100 (0) 82 (4) 96 (6) 81 (4) 26 (9) 40 (5) 52 (21) 36 (4)(10,000-24,999)
Cr, (N.301264)
Medium 73 (7) 80 (2) 79 (7) 70 (3) 37 (7) 18 (2) 32 (6) 21 (2)(2,500 to 9,999)
(N.263/1,716)
Small 88 (7) 74 (4) 40 (16) 67 (4) 4 (4) 13 (3) 5 (6) 11 (3)(600 to 2,499)
(N.262/3,338)
Very small 33 (0) 62 (7) 92 (0) 68 (8) 25 (0) 8 (4 0 (-) 16 (6)(under 600)
(N.297/3,483)
All districts 66 (3) 71 (3) 73 (5) 69 (4) 23 (2) 11 (2) 14 (3) 16 (3)(N.875(8,880)
Including instructional materials and equipment other than computer hardware or software.
O.
1st figure corresponds to districts uncertain about Chapter 2 funding; 2nd figure corresponds to districts not uncertain about Chapter 2 funding.
14 ;)

Table A-IV-8
INFLUENCE OF LOCAL, STATE, AND NATIONAL PRIORITIES ON USE OFCHAPTER 2 FUNDS
(Standard error values are in parentheses)
Percentage of districtsreporting priorities
Source of influence (N-14,771) influencing decisionmaking
District priorities
State mandates or priorities
Recommendations of national
reform reports
] 1 7
82% (2)
9 (1)
9 (2)
1 4 6

Table A-IV-9
USE OF CHAPTER 2 FUNDS TO SUPPORT REFORM PRIORITIES
(Standard error values are in parentheses)
Educationalimprovement goal
Improve computer literacy,math, or science
Estimated percentageEstimated number of these districtsof districts with in which Chapter 2 was
goal as top priority used to address the goal
10,065 15,097
Implement effective schoolsresearch 3,944 5,916
Improve test scores 5,712 8,568
Dropout prevention 1,360 2,040
Improve time on task 3,944 5,916
Raise graduationrequirements 3,808 5,712
Create partnerships 1,088 1,632with business
Career ladders ormerit pay for teachers 952 1,428
Lengthen school day or year 1,360 2,040
1 1 8
1 4 ,
85 (4)
64 (7)
60 (8)
33 (4)
29 (6)
22 (17)
13 (3)
8 (10)
5 (1)

Appendix B
LIST OF ANTECELENT PROGRAMSCONSOLIDATED INTO THE CHAPTER 2 BLOCK GRANT
Program Name Authorization
1. Basic Skills Improvement (Basic Grant) Title II, ESEA
Parent Participation- Out of School Program
2. Metric Education Part B, Title III, ESEA
3. Arts in Education Part C, Title III, ESEA
4. Preschool Partnership Programs Part D, Title III, ESEA
5. Consumer Education Part E, Title III, ESEA
6. Youth Employment Part F, Title III, ESEA
7. Law-Related Education Part G, Title III, ESEA
8. Environmental Education Part H, Title III, ESEA
9. Health Education Part I, Title III, ESEA
10. Correction Education Part J, Title III, ESEA
11. Dissemination of Information Part K, Title III, ESEA
12. Biomedical Sciences Part L, Title III, ESEA
13. Population Education Part M, Title III, ESEA
14. International Cultural Understanding Part N, Title III, ESEA
15. School Library Resources Pa.t B, Title DJ, ESEA
16. Support & Innovation Part C, Title IV, ESEA
17. Guidance & Counseling Part D, Title IV, ESEA
18. Strengthening State Agencled Part B, Title V, ESEA
19. Emergency School Aid Title VI, ESEA, (formally
ESAA)
119
148

Program Name Authorization
1) Basic Grants to LEAs- New- Continuation
2) Grants to Nonprofit Organizations- New- Continuation
3) Magnet Schools- New- Continuation
4) Special ProjectsPlanning Grants (new)
- Preimplementation- Out-of-Cycle Grants- Special Discretionary Grants- SEA Grants- Arts
20. Community Schools/Ed. Title VIII, ESEA- LEA- SEA
- Institutions of Higher Education- Nonprofit Organizations
21. Gifted & Talented Part A, Title IX, ESEA- Statewide Planning- Professional Development
- Model Demonstration Projects
22. Educational Proficiency Part B, Title IX, ESEA
23. Safe Schools Part D, Title IX, ESEA
24. Ethnic Heritage Part E, Title IX, ESEA
25. Teacher Corp Part A, Title V, HEA- 1978 Program- 1979 Program
26. Teacher Centers Part B, Title V, HEA- New
- Continuation
27. Follow Through Part B, Head Start &- LEAs (Compensatory Ed.) Follow Through Act- Sponsors (phase in to Chapter 2)- Resource Centers
120
14 d
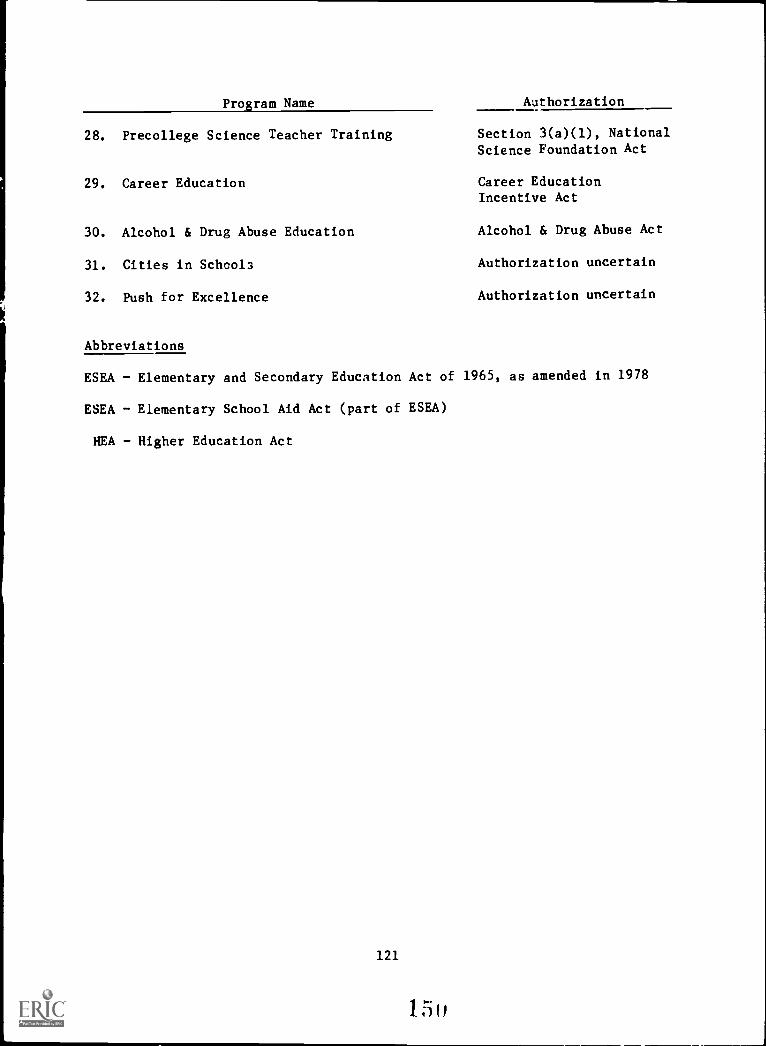
Program Name Authorization
28. Precollege Science Teacher Training Section 3(a)(1), NationalScience Foundation Act
29. Career Education Career EducationIncentive Act
30. Alcohol & Drug Abuse Education Alcohol & Drug Abuse Act
31. Cities in School3 Authorization uncertain
32. Push for Excellence Authorization uncertain
Abbreviations
ESEA Elementary and Secondary Education Act of 1965, as amended in 1978
ESEA - Elementary School Aid Act (part of ESEA)
HEA - Higher Education Act
121
15o
Related Documents