P-Searcher Team Green Eyes Mr. Pao-Nan Chou Mr. Cheng-Lung Lin Mr. Hsin-Chung Chen Mr. Jian-Ming Zheng Prof. Shiao-Li Tsao Dept. of Computer Science, National Chiao Tung University,Taiwan The Penn State University, University Park, 16802, PA, USA

Welcome message from author
This document is posted to help you gain knowledge. Please leave a comment to let me know what you think about it! Share it to your friends and learn new things together.
Transcript

P-Searcher
Team Green Eyes
Mr. Pao-Nan Chou Mr. Cheng-Lung Lin
Mr. Hsin-Chung Chen Mr. Jian-Ming Zheng
Prof. Shiao-Li Tsao
Dept. of Computer Science, National Chiao Tung University,Taiwan The Penn State University, University Park, 16802, PA, USA

P-Searcher
1. Executive Summary
The main culprit behind global warming is CO2 human beings produce in daily life. Air pollution
severely threatens the environment we live. Exposed to filthy pollutants in the air, our health
condition will be decreased. If we know where the CO2 exists, and who produces the CO2, as
well as how severe the CO2 accumulates in the air in our everyday life, our impression on air
pollution will be much deeper. Indirectly, our consciousness of environmental protection will be
increased.
Pollutant-Searcher(P-Searcher) proposed in the project allows people to identify the status of
CO2 in the air so that we could avoid staying on polluted environment and also upload the
pollution information to the server in which each user shares the concept of environmental
protection by social networking. In general, if users situates at polluted contexts, they can turn
on P-Searcher and obtain the status of CO2 in the air instantly.
The system is similar to PDA (personal digital assistant) people use in a daily life. The size of
the system would not exceed the size of a mini lap-top computer, meaning convenient to carry.
Three principle of the marketing strategy are low cost, simplicity and originality. Our product
may come to the market one day following the three principles. However, money issue is not
we most care. Keeping Clear environment is our goal. We hope through this product people
can understand the environment more around them. To see is to believe. When seeing the
CO2 status around us, we may believe how severe the global warming is.
Being global villagers, we should be responsible for saving our mother earth from a dangerous
condition. We are confident on that P-Searcher can improve the environment by
high-technology, which absolutely conforms to the spirit of the Imagine Cup: Imagine a world
where technology enables a sustainable environment.
2. Situational Analysis Problem Analysis
According to a scientific report from United Nations, climate change has caused millions of
casualties and economy loss around the world. In the Academy Award-winning documentary
film, An Inconvenient Truth, he accused the culprit behind global warming for the CO2 we
produce in daily life. For this reason, being global villagers, we should be responsible for
examining the phenomenon of which mother earth is situated in a dangerous condition.
In today’s modern society, we all know the danger which the CO2 bring to us. Unfortunately,
however, we are unsure where the CO2 exists, and who produces the CO2, as well as how
severe the CO2 accumulates in the air in our everyday life. Unlike thermometer telling us how
cold/warm it is, no small electronic gadgets we can use to examine the air quality around us.
However, scientists who can use high-technologies in the lab, if we attempt to obtain in-insight
information regarding the CO2 in the air, the problem we will face is that we can not afford to

P-Searcher
buy the heavy high-tech device. Furthermore, the air condition we check in the Internet is not
related to where we live or stay. Therefore, if an inexpensive, small, and mobile device which
can be used to detect the CO2 in the air is invented, then people around the world can use it to
engage in social networking where status of air quality in any places will be shared.
Project Analysis For the problem identified earlier, P-Searcher is proposed. The system is similar to PDA
people use in daily life. Also, the size of the system would not exceed the size of a mini lap-top
computer, which means people can carry with it in a convenient way. The system contains
several sophisticated devices, including a CO2 sensor, a searching program, a tracking
program, a global-positioning program, and an Internet-access program. In general, people
can use P-Searcher to identify the CO2 status in the air around them in order to avoid the
inconvenience of checking information in a scientific web site. As such, owners of P-Searcher
can understand where the CO2 exists, and who produces the CO2, as well as how severe the
CO2 accumulates in the air in our everyday life. From environmental protection perspectives,
P-Searcher also allows us to post the information regarding CO2 status identified in the
Internet so that people who concern about air pollution would share information and see the air
quality improved. Those online activities are just achieved by one of the functions of Web
2.0—Social Networking.
User Experience When people come to an unfamiliar environment and want to know air quality, they can take
the P-Searcher to examine it (See Figure 1). First, users click on preview function to scan CO2
status in the air by an embedded IR(Infrared Rays) device in the system. Then a ball will be
appeared on the P-Searcher screen used to choose the direction which user wants to observe.
If users tilt or shake the P-Searcher, the ball will be moved around according to the inclined
angle of P-Searcher collected by 3-axis accelerator. The location of moving ball is the direction
indicating IR to scan CO2 in the air. Besides, many dots with different colors accumulated in a
huge mass will show on the screen. If the identified CO2 value exceeds a default threshold,
the system will mark the dot with red color and form a red area, which will be marked with
coordinates. When users click the lock function, the system will compare a relative object
image pattern with coordinates defined before. Once a certain object is identified, users can
see the information of the pollutant with the CO2 value, longitude, latitude recorded.
Subsequently, users can take a picture and upload those valuable data to server in the Internet,
which serve those who concern air pollution or is a reference for those who study
environmental protection issues.

P-Searcher
Figure 1. Usage scenarios of the proposed P-Searcher system
Market Analysis
Three ways guide the marketing strategy: (1) low cost, (2) simplicity and (3) originality. We
hope our product can come into the market by the combination of those three elements. For
low cost, our product reduce price significantly for single user and the manufactured cost for
the company. Traditionally, the CO2 detectors are static-designed and expensive. In order to
detect the CO2 for a wide area, many CO2 detectors should be purchased, wasting much
electronic power. In contrast, our product is mobile-designed. Our product only absorbs less
electronic power but decrease the manufacture cost largely. With respect to simplicity, like
PDA, our product focuses on user-friendly design. In other words, users can easily understand
how to operate the P-Searcher. As for originality, until now, no related products have combined
the mobile technology. Our product will be embedded into a mobile phone. Therefore, people
can not only receive phone calls, but also use it to detect the CO2 around them.
Cost Analysis The key components of system include IR LED, IR Control Receiver, IR Control Transmitter,
high pass filter, accelerometer sensor, Camera module, GPS Receiver and eBox-4300. First,
we divide the system into several function blocks and verify it individually to make sure the
functions are work and correctness. On the design stage, we set eBox-4300 as the base
system, utilizing the ORCAD tool to design schematic circuit of CO2 subsystem which links
GPS unit, camera module and accelerometer circuit. Then, the ORCAD generate the net-list
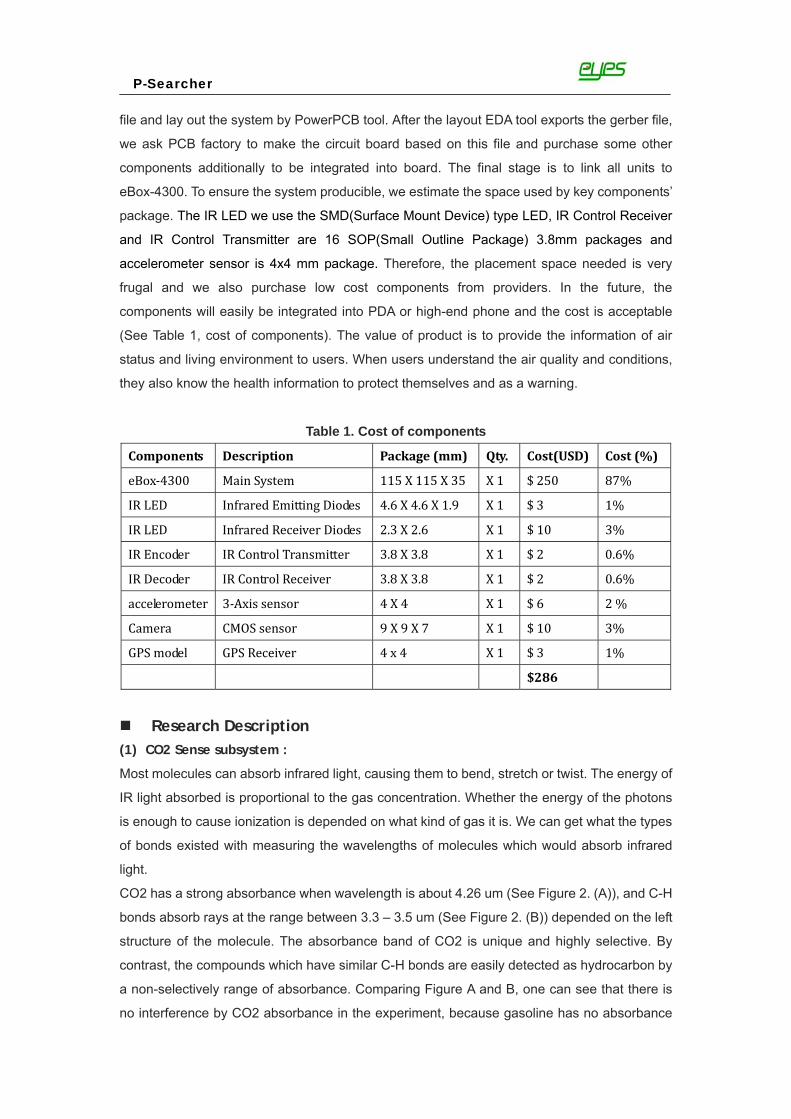
P-Searcher
file and lay out the system by PowerPCB tool. After the layout EDA tool exports the gerber file,
we ask PCB factory to make the circuit board based on this file and purchase some other
components additionally to be integrated into board. The final stage is to link all units to
eBox-4300. To ensure the system producible, we estimate the space used by key components’
package. The IR LED we use the SMD(Surface Mount Device) type LED, IR Control Receiver
and IR Control Transmitter are 16 SOP(Small Outline Package) 3.8mm packages and
accelerometer sensor is 4x4 mm package. Therefore, the placement space needed is very
frugal and we also purchase low cost components from providers. In the future, the
components will easily be integrated into PDA or high-end phone and the cost is acceptable
(See Table 1, cost of components). The value of product is to provide the information of air
status and living environment to users. When users understand the air quality and conditions,
they also know the health information to protect themselves and as a warning.
Table 1. Cost of components
Components Description Package (mm) Qty. Cost(USD) Cost (%)
eBox‐4300 Main System 115 X 115 X 35 X 1 $ 250 87%
IR LED Infrared Emitting Diodes 4.6 X 4.6 X 1.9 X 1 $ 3 1%
IR LED Infrared Receiver Diodes 2.3 X 2.6 X 1 $ 10 3%
IR Encoder IR Control Transmitter 3.8 X 3.8 X 1 $ 2 0.6%
IR Decoder IR Control Receiver 3.8 X 3.8 X 1 $ 2 0.6%
accelerometer 3‐Axis sensor 4 X 4 X 1 $ 6 2 %
Camera CMOS sensor 9 X 9 X 7 X 1 $ 10 3%
GPS model GPS Receiver 4 x 4 X 1 $ 3 1%
$286
Research Description (1) CO2 Sense subsystem :
Most molecules can absorb infrared light, causing them to bend, stretch or twist. The energy of
IR light absorbed is proportional to the gas concentration. Whether the energy of the photons
is enough to cause ionization is depended on what kind of gas it is. We can get what the types
of bonds existed with measuring the wavelengths of molecules which would absorb infrared
light.
CO2 has a strong absorbance when wavelength is about 4.26 um (See Figure 2. (A)), and C-H
bonds absorb rays at the range between 3.3 – 3.5 um (See Figure 2. (B)) depended on the left
structure of the molecule. The absorbance band of CO2 is unique and highly selective. By
contrast, the compounds which have similar C-H bonds are easily detected as hydrocarbon by
a non-selectively range of absorbance. Comparing Figure A and B, one can see that there is
no interference by CO2 absorbance in the experiment, because gasoline has no absorbance

P-Searcher
at 4.26um (2350 cm-1). The absorbance of the gas is directly proportional to its concentration,
in accordance with the Lambert-Beer law.
(A) (B)
Figure 2. (A) IR Spectrum of CO2 (B) IR Spectrum of gasoline
One can detect a gas and measure its concentration by monitoring the absorption of an
infrared light beam. An equipment capable of processing of this task consists of an IR light
source, a measurement volume in which the gas to be detected is confined, an element which
allows to pick out the desired wavelength region, and a detector that measures the intensity of
radiation.
If an IR photon with the right frequency interact with the given gas, flying through a thin slice
with thickness ∆ x of the measurement volume, the probability to be “got caught” by a molecule
is proportional to that thickness and the concentration c of the absorbing gas. The
proportionality constant, k, is called the absorption or extinction coefficient. Thus a beam of
intensity I passing through this slice will be decreased under original intensity given by
(1) Through summing up over all slices of the measurement volume with length l, come up with
the fundamental law of absorption
(2)
For Beer law, where I0 is the initial light intensity emitted from lamp (measured in pure air), I is
the intensity of light detector received (with sample gas present). It can be seen that with given
measurement length l, the important quantity to be determined by a gas detector is the
intensity ratio I / I0. This ratio is a measurement for the gas concentration. Finally, we can know
the types and concentration of gas by the relationship. The measuring structure and regarding
IR components are showed below (See Figure 3).

P-Searcher
Figure 3. Measuring structure and regarding IR components
Dispersive IR detectors use a grating or prism to pre-select the desired wavelength of light and
pass the chose one through the sample gas to the detector. Dispersive IR detectors are
usually used in bench top analytic instruments for the ability to scan a broad wavelength range.
However, they tend to be larger, heavier, more complicated, and more expensive. Therefore
they are unsuitable for portable instruments. See Figure 4. Dispersive IR.
Figure 4. Only selected wavelength light goes through sample
(2) Tracking system :
Frame Difference Algorithm : In stream video sequences, the frame rate is more than one
shot per second. Thus, if there is any object moving, it will have a slight position change and
the maximum change will occur at the edges of the image since the discontinuity bounds are
there. Supposing that the intensity of a pixel at location (x, y) and time t is represented by f (x, y,
t). Then the difference of two consecutive frames can be represented as.
The noise occurring in D(x,y,t) is removed by convolving it with gaussian low pass filter, since
noise is made up of high frequency components.
Background Subtraction Algorithm : Background subtraction and threshold are performed
to produce difference images. The difference image is preprocessed by a morphological
opening operator (erosion followed by dilation) to remove small clusters in the image. Then,
each object is matched the corresponding object in the previous captured image according to
their center positions. This tracking information is used for motion tracking.
These two difference images contain different information of newly incoming objects. The left
flow generates a background-subtracted image where moving objects appeared. However, if

P-Searcher
the pattern of moving object is similar to that of background, the moving object can not be
distinguished. The other difference image is obtained by subtracting two successive images.
This image can provide motion (boundary) tracking information of moving object even when
the moving object is similar to the background. However, when the object stays on the same
position, we could not catch it by motion tracking information. On the other hand, when the
object moves fast, the boundary information is blurred and incorrect. See Figure 5. (A) and (B)
are software flowchart of background subtraction and frame difference algorithm.
(A) (B)
Figure 5. (A) and (B) Software flowchart of background subtraction/frame difference 3. Technical Analysis
Overall Architecture In P-Searcher, the main systems are (1) CO2 Sense subsystem and (2) Tracking system.
Subsystems are (1) accelerometer, (2) GPS receiver and (3) image sensor (See Figure 6).
With respect to the integration of the hardware, the P-Searcher is implemented by the platform
of eBox-4300. As such, the platform will combine these devices through difference interface
and run the Windows Mobile CE system.
The scanning direction of CO2 Sense subsystem would also base on the inclined angle of the
P-Searcher. Once a certain object is identified in the scanning direction, the system will display
several dots with different colors on the screen. Finally, users can observe the CO2 status in
the air, recording the information of pollutant and tracking the pollutant.

P-Searcher
Figure 6. A diagram of the components and architecture in the P-Searcher
Software Overview
Figure 7. Software overview of P-Searcher
The figure is the Software overview of P-Searcher (See Figure 7). Below is the introduction.
Low Level (Driver): The components eBox-4300 connects need to be initialized and
configured so that system could fully utilize the functionality of components.
OS: We will build our own Windows Mobile CE 6.0 kernel image to manage the resource.
Middleware: We implement the algorithm of motion tracking/detection to trace the
moving pollutant. We use C#.NET and VB.NET according to the method of frame
difference and background subtraction.
Functions : We collect several function blocks, Accelerometer API, CO2_sense API,

P-Searcher
Getting_Location API and Image pipeline. The CO2_sense function is based on Beer law
to detect CO2.
High Level(Application) : When the system locates the position of CO2, we can use
different colors to mark the CO2 value. Red spot represents the polluted area. If the
polluted area is static building, we can constantly observe the change process of CO2.
On the other hand, if the pollutant is a moving object, the system will use the Tracking
system to track the object. Finally, Image pipeline, system time, and Getting_Location
API will be used to obtain the image of the polluted object, polluted time and 3D value.
Deployment Analysis P-Searcher collects the longitude and latitude by GPS receiver in order to record the place of
pollutant and uses the timer to calculate the period of pollution time, and then process the
photo of pollutant by using image pipeline. We will discuss these by two part, CO2 Sense
subsystem and Tracking system.
(1) CO2 Sense subsystem:
The IR have the characteristic of absorbed by CO2 molecule and we utilize the energy
consuming and signal strength of IR through the gas. To measure the type and concentration
is feasible (See Figure 8). We know the IR have the reflection capability. The receiver would
get the modulated signal whose structure is showed as below figure.
(A) (B) Figure 8. (A) IR sub-system and (B) IR wavelengths through different gases
For real system, the transmitter and receiver would be put together with fixed distance to
measure the air status by ray reflection of object. The spec of maximum sense distance is 10M
and response time is 40ms. The same IR would get different signal strength through general
air and CO2 space. The values of signal strength are I0 and I0.exp(-kcl) respectively. The
strength and concentration c have relations with distance L and we find some way to find
distance L. The signal would be modulated by encoder and emitted by transmitter. The
receivers then get the modulated signal and pass to decoder. Suppose the frequency of
encoder output is P1 Hz and decoder frequency is P2 Hz. The P2 value is verified based on

P-Searcher
different distance and can be matched relative distance. We can use the ratio to define relative
distance. Beside, the U1 and U2 are voltages with two gases in direct ratio. The type and
concentration can be known by ratio of U1 and U2. For reference, the wavelength of CO2 is
about 4.2 to 4.4um (See figure).
HVAC stands for heating, ventilation and air conditioning and IAQ(Indoor Air Quality) for indoor
air quality. To reduce the energy used, most people closed air conditioning. Generally, the air
quality gets worse when the CO2 increase. The OSHA(Occupational Safety & Health
Administration) the air quality rule as of 1995 that there need a fresh air supply, if the CO2 level
exceeds 800 ppm. Therefore, during system development, we use 800 ppm as a threshold. If
the CO2 level exceeds this value, a red spot will be shown on the screen. (Green spot
represent safe gas)
(2) Tracking system:
Motion detection: There are many approaches for motion detection in a continuous video
stream. All of them are based on comparing the current video frame with one from the previous
fetched or with something called background. One of the most common approaches is to
compare the current frame with the previous one. It's useful in video compression when to
estimate changes and just write the difference rather than the whole frame (See Figure 9).
(A) (B) (C)
Figure 9. Tracking of frame difference algorithm by different objects
But it is not the best method of detection applications. Assume that we have an original 24 bpp
RGB image called current frame (Image), a grayscale copy, and previous video frame is also
grayscale (Background Frame). First of all, find the regions where these two frames are
differing. For the purpose we can use difference and threshold filters. We'll get an image with
white pixels on the position where the current frame is different from the previous frame on the
specified threshold value. It's already possible to count the pixels, and if the amounts of
different bits are greater than a predefined alarm number, we can signal a motion tracking
event. Because of most cameras producing a noisy image, we'll get motion detection on such

P-Searcher
places, where there is no motion at all. To remove random noisy pixels, we can use an Erosion
filter. For example, if the object is moving smoothly we'll receive small changes from frame to
frame. Therefore, it's impossible to get the whole moving object. Things seem becoming worse
when the object is moving so slowly so that the algorithms would not detect any object at all. In
Visual Studio 2005 tool, we write program by using C#.NET and VB.NET. The following figures
are the results of programming.
The most efficient algorithms are based on building the so called background of the scene and
then comparing each current frame with the background. There are many approaches to build
the scene, but most of them are too complex. I'll describe here an approach to build the
background. It's rather simple and can be realized very quickly. As in the previous case, let's
assume that we have an original 24 bpp(bits per pixel) RGB image called current frame
(image), At the beginning, we get the first frame of the video sequence as the background
frame, and then we would always compare the frame we get later with the background one.
But it will give us the result I've described above, which we obviously don't want too much.
Using BlobCounter we can get the number of objects, their position and the dimension on a
binary image. We'll apply it to the binary image containing moving objects, the result of
Threshold filter. The following figures are the results of perform mathematical calculations. (See Figure 10).
(A) (B) (C)
Figure 10. Tracking of background subtraction algorithm by different objects
Performance Analysis After the whole system completed, we evaluate the system from several point. From the
functionality point, we partition the system into CO2 Sense subsystem analysis and Tracking
subsystem analysis. From the power efficiency point, we analyze the performance of power
saving mode or real-time mode which system runs. The better the evaluation based on these
factors is, the higher performance the system is.
(1) CO2 sense analysis:
To offer the logical and meaningful CO2 value is the goal of our design. Based on the
characteristic of CO2 strongly absorbs in IR causing the energy attenuation, we could know

P-Searcher
the concentration of CO2 and whether the other gas existed with the help of Beer Law by
calculating the range of attenuation and the energy of penetrating air. In addition, we could also predict distance from the pollutant to our system from the Beer law
indirectly by the encoded and decoded signal of IR. Figure 11. (A) provide the data of 8 bits IR
signal we measured. The signal is emitted by encoder and a restrict distance far from receiver,
the max distance about 10 M. If the distance is less than 10M, the decoder in receiver could
decode the signal successful. However, if the distance is over 10M, the period of received
signal would be longer than the normal period. The further the distance is, the longer the
period is until receiver could not catch the encoded signal.
Therefore, once we have received encoded signal, we can know the distance by the maximum
distance and the relationship between received waves. Get the concentration of CO2 by
formula. The received signal is much important so that when we design the IR correction, the
high-pass filter used to filter the noise should design carefully. To offer a clear signal to be
processed by processor, no matter what interfere, the filter ensures the signal is free from
noise. The Figure 11. (B) is the signal without filter, and Figure 11. (C) is free from noise.
(A) (B) (C)
Figure 11. Data of 8 bits IR signal and (B) Received signal without filter, (C) Received
signal free from noise
(2) Tracking system analysis:
Our system traces the pollutant by using motion tracking and CO2 sense. There are two
methods, frame difference algorithm and background subtraction algorithm.
The advantage of frame difference algorithm has high resistance for the light, but it is hard to
detect the low variance of moving object or short time interval between frames. Background
subtraction algorithm keeps the original image as a standard to compare with the last image so
that the difference is what we need to check. The advantage is the background may be change,
so the difference of brightness may affect the correctness of judgment about moving object.
Our system use the two algorithms alternated based on the variance of brightness and the
motion rate of object to improving the performance of motion tracking.
In addition, when system has detected the pollutant, we take an Auto Zoom in policy to find the
logical region to reduce the error of tracking and the CO2 subsystem is also more suitable for
smaller range to monitor the CO2. When CO2 cannot detect normally, system would auto
zoom out to the original range to process again. Within the acceptant range of CO2 subsystem

P-Searcher
can work accurately, motion tracking zoom in and out automatically to find the optimal region to
enhance the performance.
(3) Power-saving analysis :
Power is a very important issue in embedded system development. In our system, there are
several components needed to consider the power consumption. In CO2 subsystem, the
transmitter needs enough power to emit the 1KHZ frequency IR signal so that receiver could
be able to catch signal to determine the concentration of CO2, but system need large amount
of energy to generate the 1KHZ frequency signal.
We must check the status of detection CO2 to turn on or off the power alternately to minimize
the power consumption of system. Furthermore, in Tracking system, the Frame rate also affect
the power consumption of system. No matter the frame difference algorithm or background
subtraction algorithm, we all need to update the frame to do judgment. Keeping the system
work correctness and minimal power consumption.
(4) Real-time analysis :
We design our Tracking system could act real time and detect pollutant as soon as possible.
The latency of CO2 Sense system is also small. The IR emitted from transmitter of CO2 Sense
subsystem need 40MS to be received by receiver within 10M. But if there are barrier reflect the
signal, receivers need more time to ensure the signal received successful. To improve the
performance, we add the number of IR LED transmitters and make the IR concentrated with
casing pipe. We also add IR LED receivers to enhance the efficiency of detect the CO2
concentration and the tracing latency. In the Tracking system, the system speed now is
enough for tracking object quickly, but the frame rate affect the motion tracking speed a lot,
causing a power-speed trade-off. The only one we consider now is to determine motion object
correctness 30 object per second in real time.
Testing Procedures CO2 Sense testing : Measuring CO2 in the airtight space, it will be taken to build numerical
for reduced signal and strength of IR and matched relative CO2 concentration. The built
numerical seem very important. In the CFD (Computational Fluid Dynamic) in airtight space
model, we use the technology of classic hydromechanics, Numerical Methods, and computer
calculating to find the solution of hydromechanics equation and analyze the behavior of fluid by
the tool of numerical analysis. We use the Direct Numerical Simulation method and CFD tool
to find out the CO2 energy by its difference energy, mass, momentum. We simulate the CO2 in
space and use IR to test the model and set up the data base. Below is the simulation of CO2
distribution (See Figure 12).

P-Searcher
(A) (B)
Figure 12. Measuring CO2 value and numerical analysis
Tracking system : The advantage in frame difference algorithm is high resistance to the
variance of brightness, not caring so much about the consistence of background so we could
ignore the variance of background. In the test flow, the system detects and scans first. If there
is no moving object, user could go on another place to test. Contrarily, if the moving object id
detected, system store the photo or send a message automatically and restart the new period.
If time is up and there is still moving object, we record video rather than taking photo.
In addition, in background subtraction algorithm, the design principle focuses on the
consistence of background so the position user stand is the maximize error source. Therefore,
with the scene changed, we use the AF(Auto Focus) algorithm to search the variance of two
continuous photos background which could be the whole or partial background. The
successfully search means there are no variances between the background of photos.
Otherwise, the characteristic position is affected deeply by moving object so that the system
will restart and return to the initial setting to record the background and characteristic position.
The searching characteristic position operation is needed only when the scene changed and
we want to eliminate the error from the background subtraction. If searching characteristic
position failed, it means the characteristic position may be affect by moving object so that we
update background and characteristic position and use the new background to do the motion
detection. Under the model, the updating rate is quick to reduce the effect of variance of
brightness, if there is no moving object in the searching range.
Prototype testing : We test the CO2 Sense subsystem and Tracking system to verify the
performance(see the following Figure 13).
Figure 13. A picture of prototype

P-Searcher
Embedded Analysis Embedded Image
To compile kernel, we need to install visual studio 2005, VS2005sp1, Wince6.0, eBox4300
BSP, ebox4300_Wince6.0 SDK and VS2005_CoreCon_x86_WINCE600. After installing the
developed software, open VS2005 to generate a new project and choose OS design option.
Based on the eBox4300 platform and our project consideration, we do not have the application
on the Applications & Media part so that we choose no other support function to build in kernel.
Because we need the network function to help us connect to server or transfer some data, we
enable LAN and WAN in Networking & Communications. After the configuration, we choose
the release mode to speed up the compiling rate to get the kernel image.
To download the kernel image to eBox4300, we connect the RS-232 and crossover line and
set the IP address of the developed pc. After ensuring the connection is established, from the
Target |Attached device, we can start the download action and boot Wince6.0 within several
minutes. There is no tough work to build kernel. The only one we feel annoyed is we often can
not know whether the connection is established successful and transferring could be start, so
we tried a lot of setting to ensure the configure is right.
Embedded Software Design
There is neither high clock rate processor nor large memory space in embedded system. Most
of all, there is usually no electric power support. In the general mobile embedded system, we
use battery so that the power saving by efficient software and sufficient hardware used is the
important consideration. Therefore we have to realize the specialty of hardware to write the
high performance program. In the memory usage, there is unlike the PC now that we have
many memory could use. We should always use pointer to substitute for array to reduce the
unnecessary usage. We also need to free the pointer after use to avoid the memory leakage.
Embedded Component
Our project is to monitor the concentration of CO2 and record the variance, so it needs
assistance of sensors to detect the environment status. It is unsuitable for implementing it on
PC due to the sensors. The only one device we need is a microcontroller which could help us
to integrate the information come from every sensor and communicate with server. The other
advantage of using embedded system is the low cost. A control board and sensors is cheaper
than the PC, which is compose of a lot of unnecessary hardware and importable. Besides, our
project emphasizes on “monitor every time and every where”, so it could be not too heavy so
that user is willing to carry. Even though we use lap-top, it still too heavy and power wasted. A
simple mobile embedded system could be used for a long time and portable is the best
solution for our project.

P-Searcher
4. Project Status We have analyzed the P-Searcher system, structure and also highlighted some key sections.
The sections we describe the progress of our system including (1) Prototype of CO2
subsystem, (2) Tracking system and (3) Windows Mobile CE 6.0 image built. We explain the
detail status of key sections.
Prototype of CO2 sub-system: The prototype is the integrated circuit of IR LED, IR
Encoder, IR Decoder and filter Circuit. And the receiver is selected to attach with simply
filters for back-end signal processing. The encoder and decoder modulate the data by 8
bits. The different cycle of received data can be judged for different distance and find out
relative CO2 concentration. To avoid noise, we need to design the filter. Our progress
now is to design better filter, select IR mechanism for far-distance detecting, increase the
numbers of IR LED and to improve the performance with Tracking system matching.
Tracking system: We have tested for Tracking system code and measured motion and
object (refer to development analysis). For integrated system, the CO2 region on screen
and motion matching would be improved for the performance of tracking.
Windows Mobile CE 6.0: We have built our image of windows mobile CE 6.0. The
operation and questions can be referred to embedded analysis.
Then, we arrange our organization and schedule as below (See Table 2 and 3).
Table 2. Division of labor for team members
Members Working Items Notes
Mr. Pao‐Nan Chou (1) Manage the progress of the project, (2) Evaluate the
technical solutions in the system, (3) Write the system
specification, design document and proposal
Mr. Cheng‐Lung Lin (1) Design the system, (2) Design and implement the image
process, (3) Test the image process
Mr. Hsin‐Chung Chen (1) Design the system, (2) Design and implement the CO2
subsystem, (3) Test the CO2 subsystem
Mr. Jian‐Ming Zheng (1) Design the system, (2) Integrate the system, (3) Test the
system
Prof. Shiao‐Li Tsao (1) Guide the project, (2) Provide comments and suggest
technical solutions, (3) Review the proposal, system design
and project plan

P-Searcher
Table 3. P-Searcher project schedule
JAN FER MAR APR MAY JUN JUL AUG SEP OCT NOV DEC
Research/Survey
Planning
Testing
Development
Verification
Production
Improvement
Popularization
5. Conclusions Globe warming is a severe problem for our environment. The CO2 is the main culprit of the
globe warming. Rather than clearing the CO2, we only focus on how to detect the existence of
CO2. Our product can tell people where the CO2 is, who produces it, and how severe the
pollution situation. As a global villager, we must know and track the polluted area around us.
During the project development, due to the limited expertise, we must consult several
environmentalists about environmental issues. Also, we need to increase our understanding
on the gas measurement (i.e. CO2). Although our team faces above obstacles, we still learn a
lot of new information beyond computer science. When we face similar problems in the future,
we will have enough experience to deal with. Our product may come to the market one day.
However, money issue is not we care. Clear environment is our focus. We hope through this
product people can better understand the environment around them. To see is to believe.
When seeing the CO2 status around us, we may believe how severe the global warming is.
6. References [1] IR Sensors, http://optoelectronics.perkinelmer.com/
[2] Camera SDK, http://www.sq.com.tw/english/english.htm
[3] Beer-Lambert law, http://en.wikipedia.org/wiki/Beer-Lambert_law
[4] Theory CO2 – Measurement, http://www.epluse.com/
[5] IR Encoder/Decoder, http://www.princeton.com.tw
[6] THEORY AND OPERATION OF NDIR SENSORS, www.raesystems.com
[7] Xue Mei, Shaohua Kevin Zhouy, Hao Wu, Fatih Porikli, “Integrated Detection,
Tracking and Recognition for IR Video-based Vehicle Classification,” JOURNAL OF
COMPUTERS, VOL. 2, NO. 6, AUGUST 2007
[8] Jinman Kang, Kalpitkumar Gajera, Isaac Cohen and Gérard Medioni, “Detection and
Tracking of Moving Objects from Overlapping EO and IR Sensors,” OTCBVS’04 and
CVPR’2004
Related Documents


