Welcome message from author
This document is posted to help you gain knowledge. Please leave a comment to let me know what you think about it! Share it to your friends and learn new things together.
Transcript


P R I N C I P L E S O F
COST
ACCOUNTING

This page intentionally left blank

P R I N C I P L E S O F
COST
ACCOUNTING
15E
ED W A R D J. VA NDE R B E C KProfe s sor Emeri tus
Department of AccountancyXavier Univer s i ty

Principles of Cost Accounting, 15th EditionEdward J. VanDerbeck
Vice President of Editorial, Business: Jack W. Calhoun
Acquisitions Editor: Matt Filimonov
Developmental Editor: Lauren Athmer
Marketing Manager: Kristen Hurd
Marketing Coordinator: Heather McAuliffe
Content Project Manager: Corey Geissler
Production Technology Analyst: Starratt Alexander
Media Editor: Scott Fidler
Sr. Manufacturing Coordinator: Doug Wilke
Production Service: Cadmus
Sr. Art Director: Stacy Shirley
Internal Designer: Jennifer Lambert, Jen2Design, LLC
Cover Designer: cmiller design
Cover Image: ªGetty Images
Printed in the United States of America1 2 3 4 5 6 7 13 12 11 10 09
ª 2010, 2008 South-Western, Cengage Learning
ALL RIGHTS RESERVED. No part of this work covered by the copy-
right herein may be reproduced, transmitted, stored or used in any
form or by any means graphic, electronic, or mechanical, including but
not limited to photocopying, recording, scanning, digitizing, taping,
Web distribution, information networks, or information storage and
retrieval systems, except as permitted under Section 107 or 108 of the
1976 United States Copyright Act, without the prior written permission
of the publisher.
For product information and technology assistance, contact us at
Cengage Learning Customer & Sales Support, 1-800-354-9706
For permission to use material from this text or product, submit all
requests online at www.cengage.com/permissions
Further permissions questions can be emailed to
Library of Congress Control Number: 2009935270
ISBN-10: 0-8400-3703-1
ISBN-13: 978-0-8400-3703-9
South-Western Cengage Learning,
5191 Natorp Boulevard
Mason OH 45040,
USA
Cengage Learning products are represented in Canada by Nelson
Education, Ltd.
For your course and learning solutions, visit www.cengage.com
Purchase any of our products at your local college store or at our
preferred online store www.ichapters.com

PREFACE
Why Study Cost Accounting?
The 15th edition of Principles of Cost Accounting, in an easily accessiblepresentation, applies cost concepts, cost behavior, and cost accountingtechniques to manufacturing, merchandising, and service businesses. Stu-dents learn how to determine costs of products and services more accu-rately; use the knowledge of product and service costs to set selling prices,to bid on contracts, and to analyze the relative profitability of variousproducts and services; use techniques to measure the performance ofmanagers and subunits within an organization; design an accounting systemto fit the production and distribution system of an organization; and use theaccounting system as a tool to motivate managers towards the organiza-tion’s goals.
What Does the 15th Edition Offer?
. Appropriate content for a one-quarter or one-semester cost accountingcourse.
. A ten-chapter format—a distinguishing feature of the text that makes itmost appropriate for shorter courses.
. Directed assignments at intervals within each chapter.
. A very readable and relevant text that covers the essentials of costaccounting in a logical sequence and concise manner.
. The inclusion of cost accounting techniques for service businesses.
. A discussion of the special purpose reports and analytical techniquesused for management decision making.
. Emphasis on nonfinancial performance measures via the balancedscorecard.
. An increase in the number of end-of-chapter exercises, problems, andSelf-Study Problems.

What Is New in the 15th Edition?
The 15th edition includes the following changes:
. All new chapter-opening vignettes with real-world applications.
. Increased use of graphics, including Excel spreadsheet ‘‘screen shots’’and flow diagrams.
. An increase in the number of end-of-chapter self-study problems.
. An increased emphasis on ethical decision making in the end-of-chapterMini-Cases.
. Newly added ‘‘real company’’ examples throughout the text.
. First-time inclusion of corporate governance, lean manufacturing, de-mand software, and Web-based budgeting.
. An integrated illustration of materials control procedures.
. An illustration of the least squares regression method using MicrosoftExcel.
What Are the Features of the 15th Edition?
The 15th edition includes several features that facilitate the learningprocess for the student and allow the instructor to teach with ease.
Directed Assignments
At specific points within each chapter, students are directed to appropriateend-of-chapter assignments. This allows students to work practice itemswithout completing the entire chapter.
Self-Study Problems
Two demonstration problems are included at the end of each chapter, witha step-by-step explanation of how to solve them. These Self-Study Pro-blems are constructed from difficult concepts in the chapter and reinforcethe techniques and procedures discussed in the chapter. An added feature isend-of-chapter problems that reference students back to Self-Study Pro-blems that are similar in topic and difficulty.
End-of-Chapter Materials
The end-of-chapter questions, exercises, problems, mini-cases, and Internetactivities have been carefully written, revised, added to, and verified toreflect the coverage as it appears in the chapters. There has been aconcerted effort to provide the instructor with a wide choice of subjectmatter and degree of difficulty when assigning end-of-chapter materials.Where appropriate, comprehensive review problems have been added thatcover concepts from more than one chapter. Additionally, selected pro-blems may be solved using spreadsheet software.
vi Principles of Cost Accounting

Integrated Learning ObjectivesLearning objectives begin each chapter. Each learning objective is indicatedin the text where first discussed. All end-of-chapter exercises, problems,mini-cases, and Internet activities are identified by learning objectives.
Key TermsKey terms are highlighted as they are introduced. They are listed, alongwith page references, at the end of each chapter. A comprehensive glossaryis included at the end of the book, providing definitions for all the keyterms. Actual companies are highlighted where their practices are discussedin the chapters.
Appendixes
The Institute of Management Accountants ‘‘Statement of Ethical Profes-sional Practice’’ is included in an appendix at the end of Chapter 1. Anappendix at the end of Chapter 9 illustrates the four-variance and three-variance methods of analyzing factory overhead.
What Supplementary Materials Are Available?
A complete package of supplementary materials is available with the 15thedition of Principles of Cost Accounting to assist both instructors and students.The package includes materials that have been carefully prepared andreviewed.
Available to InstructorsAll instructor resources are available online on the Instructor Compa-nion Web Site (www.cengage.com/accounting/vanderbeck), as well ason the Instructor Resource CD-ROM (IRCD).
Solutions Manual. This manual contains the answers to all end-of-chapterquestions, exercises, problems, Internet exercises, and mini-cases.
Test Bank. The test bank is available in a computerized version forWindows. The user may select, mix, edit, and add questions or problems tocreate the type of test or problem set needed.
ExamView ProTM Testing Software. The printed test bank is available in acomputerized version for Windows. The user may select, mix, edit, and addquestions or problems to create the type of test or problem set needed.ExamView is available on the Instructor’s Resource CD.
PowerPoint Presentations. This resource provides presentations for eachchapter, created specifically for this edition; thus, they follow along closely
Preface vii

with the text. The presentations for each chapter are also available onlinefor students to use as an additional study resource.
Instructor Resource CD-ROM (IRCD). This convenient resource includesthe Test Bank, ExamView, the Solutions Manual, PowerPoint Presenta-tions, and the Instructor Spreadsheet Templates (with solutions).
Instructor Spreadsheet Templates. The Instructor Spreadsheet Templatesshow the completed spreadsheet solutions for exercises within the end-of-chapter materials. These files are available on the IRCD, or they can bedownloaded from the Instructor Companion Web Site.
Instructor Companion Web Site (www.cengage.com/accounting/vander-
beck). The text-specific Web site provides access to all instructor resourcesorganized by chapter and topic, and are password protected. All of theseresources are also available on the IRCD: Test Bank, ExamView, SolutionsManual, PowerPoint Presentations, and the Instructor Spreadsheet Tem-plates (with solutions).
Available to StudentsAll student resources are available online on the Student CompanionWeb Site (www.cengage.com/accounting/vanderbeck).
Study Guide. The study guide provides a review summary for each chapteras well as questions and problems to test comprehension of chaptermaterial. Solutions for all questions and problems are included in a separatesection at the end of the study guide.
Student Spreadsheet Templates. The Student Spreadsheet Templatescorrelate to exercises within the end-of-chapter materials. These files areavailable for downloading on the Student Companion Web Site.
PowerPoint Presentations. This study resource provides presentations foreach chapter, created specifically for this edition; thus, they follow alongclosely with the text.
Experience Accounting Videos. Highlight progressive companies and allowyou to effectively visualize critical chapter concepts—enhancing what youlearn in class! The Experience Accounting Videos can be bundled at noadditional cost with new copies of the text or can be purchased separately. Youcan access the videos at www.cengage.com/accounting/eav.
viii Principles of Cost Accounting

AcknowledgmentsWe would like to thank all of those individuals who have helped during therevision of this text by providing constructive comments and suggestions.
Josephine M. MathiasMercer County Community College
Joanne E. ShurbertConcord’s Community College and Manchester Community College
Ann BikofskyCollege of West Chester
Theresa Laws-DahlBlackhawk Technical College
Sam LesterMiddle Georgia Technical College
Edward KufuorASA Institute
Jim MurrayWestern Technical College
David A. FlanneryBryant & Stratton College, Virginia Beach
James EmigVillanova University
Preface ix

This page intentionally left blank

ABOUT THE AUTHOR
Ed VanDerbeck has been a professor of accounting for 32 years and wasChair of the Department of Accountancy at Xavier University, Cincinnati,Ohio, for 24 years. Before retiring in 2008, Professor VanDerbeck special-ized in teaching cost accounting to accounting majors and managerialaccounting to undergraduate and MBA students. He has taught at thetwo-year college level at SUNY–Delhi. He has a BA in Accounting fromBinghamton University (formerly SUNY–Binghamton) and an MS inBusiness Administration from the University of Albany (formerly SUNY–Albany). He is licensed as a CPA (inactive) in the state of Ohio. ProfessorVanDerbeck has worked as an internal revenue agent, performed afaculty internship at what was formerly the Big Eight accounting firm ofTouche-Ross. He has served as a developmental editor and marketingmanager for accounting publications with South-Western College Publish-ing. Professor VanDerbeck is an avid tennis player and a student of casinogaming strategies.

This page intentionally left blank

BRIEF CONTENTS
Chapter 1 Introduction to Cost Accounting 1
Chapter 2 Accounting for Materials 63
Chapter 3 Accounting for Labor 123
Chapter 4 Accounting for Factory Overhead 169
Chapter 5 Process Cost Accounting—General Procedures 237
Chapter 6 Process Cost Accounting—Additional Procedures;
Accounting for Joint Products and By-Products 287
Chapter 7 The Master Budget and Flexible Budgeting 337
Chapter 8 Standard Cost Accounting—Materials, Labor, and
Factory Overhead 379
Chapter 9 Cost Accounting for Service Businesses and the
Balanced Scorecard 447
Chapter 10 Cost Analysis for Management Decision Making 481
Glossary 531
Index 543

This page intentionally left blank

CONTENTS
1 Introduction to Cost Accounting 1
Uses of Cost Accounting Information 4
Determining Product Costs and Pricing, Planning and ControlProfessional Ethics, CMA Certification, and Corporate Governance 9
Relationship of Cost Accounting to Financial and Management Accounting 10
Costs of Goods Sold, InventoriesElements of Manufacturing Costs 15
Direct Materials, Direct Labor, Factory Overhead, Summary of Manufacturing Costs,Flow of Costs
Illustration of Accounting for Manufacturing Costs 18
Cost Accounting Systems 27
Special Order, Continuous or Mass Production, Combination of Systems, Standard CostingIllustration of a Job Order Cost System 30
Work in Process in the Manufacturing StatementIMA Statement of Ethical Professional Practice 36
Principles, Standards, Resolution of Ethical Conflict
2 Accounting for Materials 63
Materials Control 64
Physical Control of Materials, Controlling the Investment in MaterialsMaterials Control Procedures 70
Materials Control Personnel, Control during Procurement, Control during Storage andIssuance
Accounting for Materials 79
Determining the Cost of Materials Issued, Accounting ProceduresJust-in-Time Materials Control 91
JIT and Cost Control, JIT and Cost FlowsScrap, Spoiled Goods, and Defective Work 97
Scrap Materials, Spoiled and Defective Work

3 Accounting for Labor 123
Wage Plans 125
Hourly Rate Plan, Piece-Rate Plan, Modified Wage PlansControlling Labor Cost 128
Labor Time Records, Payroll FunctionAccounting for Labor Costs and Employers’ Payroll Taxes 132
Employers’ Payroll Taxes, Illustration of Accounting for Labor CostsPayroll Accrual 141
Special Labor Cost Problems 144
Shift Premium, Employee Pension Costs, Bonuses, Vacation and Holiday Pay, Accountingfor Bonuses, Vacations, and Holiday Pay
4 Accounting for Factory Overhead 169
Identifying Cost Behavior Patterns 170
Analyzing Semivariable Factory Overhead Costs 172
Observation Method, High-Low Method, Scattergraph Method, Limitations of High-Lowand Statistical Scattergraph Methods, Least-Squares Regression Method
Budgeting Factory Overhead Costs 179
Accounting for Actual Factory Overhead 180
Factory Overhead Analysis Spreadsheets, Schedule of Fixed Costs, General FactoryOverhead Expenses, Summary of Factory Overhead
Distributing Service Department Expenses 185
Applying Factory Overhead to Production 192
Direct Labor Cost Method, Direct Labor Hour Method, Machine Hour Method,Activity-based Costing Method
Accounting for Actual and Applied Factory Overhead 198
5 Process Cost Accounting—General Procedures 237
Comparison of Basic Cost Systems 238
Materials and Labor Costs, Factory Overhead CostsProduct Cost in a Process Cost System 239
Nondepartmentalized Factory, Departmentalized FactoryWork in Process Inventories 240
Cost of Production Summary—One Department, No Beginning Inventory 244
Cost of Production Summary—One Department, Beginning Inventory 247
Cost of Production Summary—Multiple Departments, No Beginning Inventory 250
Cost of Production Summary—Multiple Departments, Beginning Inventory 259
Changes in Prior Department’s Unit Transfer Costs 266
xvi Principles of Cost Accounting

6 Process Cost Accounting—Additional Procedures;Accounting for Joint Products and By-Products 287
Equivalent Production—Materials Not Uniformly Applied 288
Illustrative Problem No. 1, Illustrative Problem No. 2, Illustrative Problem No. 3Units Lost in Production 296
Units Gained in Production 298
Equivalent Production—First-In, First-Out Method 299
Illustrative Problem No. 1, Illustrative Problem No. 2Joint Products and By-Products 309
Accounting for Joint Products, Accounting for By-Products
7 The Master Budget and Flexible Budgeting 337
Principles of Budgeting 338
Preparing the Master Budget 338
Sales Budget, Production Budget, Direct Materials Budget, Direct Labor Budget,Factory Overhead Budget, Cost of Goods Sold Budget, Selling and Administrative ExpensesBudget, Budgeted Income Statement, Other Budgets, Evaluating Budget Performance
Flexible Budgeting 350
Preparing the Flexible Budget, Preparing a Performance Report Based on FlexibleBudgeting
Preparing the Flexible Budget for Factory Overhead 355
Using the Flexible Budget, Semifixed and Semivariable Costs, Service Department Budgetsand Variances, Summary of the Budgeting Process
8 Standard Cost Accounting—Materials, Labor, andFactory Overhead 379
Types of Standards 381
Standard Cost Procedures 381
Determination of Standard Costs for Materials and Labor, Recording Standard Costs forMaterials and Labor
Determination of Variances 384
Alternative Method of Recording Materials CostAccounting for Variances 389
Alternative Method of Recording Materials Cost, Disposition of Standard Cost VariancesInterpreting Variances 392
Features of Standard Cost Accounting 397
Illustration of Standard Cost in a Departmentalized Factory 398
Analysis of Factory Overhead Standard Cost Variances 405
Two-Variance Method of Analysis 406
Four-Variance and Three-Variance Methods of Analysis 412
Four-Variance Method of Analysis 412
Three-Variance Method of Analysis 414
Contents xvii

9 Cost Accounting for Service Businesses and theBalanced Scorecard 447
Job Order Costing for Service Businesses 448
Job Cost Sheet for a Service Business, Choosing the Cost Allocation Base, Tracing DirectCosts to the Job, Cost Performance Report
Budgeting for Service Businesses 451
The Revenue Budget, The Labor Budget, The Overhead Budget, The Other DirectExpenses Budget, The Budgeted Income Statement
Activity-Based Costing in a Service Firm 455
Converting Indirect Costs to Direct Costs, Multiple Indirect Cost Pools, Job Cost Sheet—Activity-Based Costing
Allocations Using Simplified Costing Versus Activity-Based Costing 459
The Balanced Scorecard 463
The Four Categories of a Balanced Scorecard, Guidelines for a Good Balanced Scorecard,The Balanced Scorecard Illustrated
10 Cost Analysis for Management Decision Making 481
Variable Costing and Absorption Costing 482
Product Costs Versus Period Costs, Illustration of Variable and Absorption CostingMethods
Merits and Limitations of Variable Costing 486
Segment Reporting for Profitability Analysis 488
Cost-Volume-Profit Analysis 491
Break-even Analysis, Break-even Chart, Break-even Analysis for Management Decisions,Effect of Sales Mix on Break-even Analysis
Contribution Margin Ratio and Margin of Safety 499
Effect of Income Tax on Break-even Point and Net Income 501
Differential Analysis 502
Accept or Reject a Special Order, Make or BuyDistribution Costs 505
Glossary 531
Index 543
xviii Principles of Cost Accounting

P R I N C I P L E S O F
COST
ACCOUNTING

This page intentionally left blank

CHAPTER 1
Introduct ion to CostAccount ing
An article in the August 22, 2008 Wall Street Journal, ‘‘Burger
King Battles Costs with Small Whopper Jr.,’’ describes Burger
King’s attempt to ‘‘overcome high ingredient costs that are
eating into its profit.’’ Chief Executive John Chidsey said, ‘‘To
combat costs, Burger King is testing its $1 Whopper Jr. with
smaller hamburger pattie—down to two ounces apiece from 2.2
ounces—in some markets and experimenting with different
beverage sizes.’’ The article went on to explain that ‘‘McDonald’s
is testing modifications to its $1 double cheeseburger, including
selling a different version and raising the price of the traditional
double cheeseburger.’’
. What is the total cost to make and sell each Whopper Jr. or
McDonald’s double cheeseburger?
. How many burgers must be sold and at what prices to cover
costs and to provide shareholders with an acceptable return
on their investment?
. Given that fast-food prices are constrained by competitors’
prices, what other cost-cutting measures might Burger King
employ to return operations to normal profit margins?
These questions can be best answered with the aid of cost
information introduced in this and the following chapters.
T he importance of cost accounting information to the successfuloperation of a business has long been recognized. However, in thecurrent global economic environment, such information is more
Learning Objectives
After studying this
chapter, you should
be able to:
LO1Explain the
uses of cost
accounting information.
LO2Describe the
ethical res-
ponsibilities and certi-
fication requirements
for management
accountants, as well
as corporate
governance.
LO3Describe the
relationship
of cost accounting to
financial and manage-
ment accounting.
LO4Identify the
three basic
elements of manufac-
turing costs.
LO5Illustrate
basic cost
accounting procedures.
LO6Distinguish
between the
two basic types of cost
accounting systems.
LO7Illustrate a job
order cost
system.

crucial than ever. Automobiles from Korea, clothing from China, electronicequipment from Japan, and laptop computers from Poland are just a fewexamples of foreign-made products that have provided stiff competition toU.S. manufacturers both at home and abroad. As a result of these pressures,companies today are placing more emphasis on controlling costs in anattempt to keep their products competitive. For example, U.S. companiesare outsourcing production and service activities to other countries, such asproduction operations in Honduras and Indonesia and technical supportcall centers in India.
Cost accounting provides the detailed cost information that manage-ment needs to control current operations and plan for the future. Figure 1-1illustrates the production process for goods and services for which costaccounting provides information. Management uses this information todecide how to allocate resources to the most efficient and profitable areas ofthe business.
All types of business entities—manufacturing, merchandising, andservice businesses—require cost accounting information systems to tracktheir activities. Manufacturers convert purchased raw materials into fin-ished goods by using labor, technology, and facilities. Merchandiserspurchase finished goods for resale. They may be retailers, who sellproducts to individuals for consumption, or wholesalers, who purchasegoods from manufacturers and sell to retailers. For-profit service busi-nesses, such as health clubs, accounting firms, and NBA basketball teams,sell services rather than products. Not-for-profit service agencies, such ascharities, governmental agencies, and some health care facilities, provideservices at little or no cost to the user.
The nature of the manufacturing process requires that the accountinginformation systems of manufacturers be designed to accumulate detailedcost data relating to the production process. It is common today formanufacturers of all sizes to have cost accounting systems that track the
Figure 1-1 Production Process for Goods and Services
Raw materials
Conversion process
OutputsInputs (factors of production)
Natural resources
Human resources Capital
Goods
Services
2 Principles of Cost Accounting

costs incurred to produce and sell their diverse product lines. While thecost accounting principles and procedures discussed in the text mostlyemphasize manufacturers, many of the same principles apply to merchan-dising and service businesses. Cost accounting is essential to the efficientoperation of fast-food restaurants, athletic teams, fine arts groups, hospitals,social welfare agencies, and numerous other entities. Chapter 9 and variousother sections throughout the text illustrate cost accounting procedures forservice businesses.
In many ways, the activities of a manufacturer are similar to those of amerchandiser. They purchase, store, and sell goods; both must haveefficient management and adequate sources of capital; and they may employhundreds or thousands of workers. The manufacturing process itself high-lights the differences between the two: merchandisers, such as Target, buygoods in marketable form to resell to their customers; manufacturers, suchas Procter & Gamble, must make the goods they sell. Once a merchan-diser has acquired goods, it can perform the marketing function. Thepurchase of raw materials by a manufacturer, however, is only the begin-ning of a long and sometimes complex chain of events that results in afinished product for sale.
The manufacturing process requires the conversion of raw materialsinto finished goods through the use of labor and various other factoryresources. A manufacturer must make a major investment in physical assets,such as property, plant, and equipment. To produce finished goods, amanufacturer must purchase appropriate quantities of raw materials andsupplies, and develop a workforce. In addition to the cost of materials andlabor, the manufacturer incurs other expenses in the production process.Many of these costs, such as depreciation, taxes, insurance, and utilities, aresimilar to those incurred by a merchandising concern. Costs such asmachine maintenance and repair, materials handling, production setup,production scheduling, and inspection are unique to manufacturers. Othercosts, such as selling and administrative expenses, are similar to thoseincurred by merchandisers and service businesses. The methods of account-ing for sales, cost of goods sold, and selling and administrative expenses fora manufacturer are similar to those of merchandisers. Service businesses, bycomparison, have no inventories because the service is consumed at thetime it is provided. Service businesses have revenue and operating expenses,but no cost of goods sold.
Note that product quality is as important a competitive weapon as costcontrol in the global arena. Originally issued for companies marketingproducts in Europe, a set of international standards for quality manage-ment, known as the ISO 9000 family, was designed by the InternationalOrganization for Standardization, based in Switzerland. The standardsrequire that manufacturers have a well-defined quality control system, thatthey consistently maintain a high level of product quality to enhancecustomer satisfaction, and that they achieve continual improvement of theirperformance in pursuit of these objectives. The standards are accepted in158 countries, 106 of which are ‘‘member bodies’’ with full voting rights on
Chapter 1 – Introduction to Cost Accounting 3

technical and policy issues.1 Major U.S. companies such as GeneralElectric and Procter & Gamble require their suppliers to obtain ISO9000 certification.
Uses of Cost Accounting InformationPrinciples of cost accounting have been developed to enable manufacturersto process the many different costs associated with manufacturing and toprovide built-in control features. The information produced by a costaccounting system provides a basis for determining product costs andselling prices, and it helps management to plan and control operations.
Determining Product Costs and Pricing
Cost accounting procedures provide the means to determine product coststhat enable the preparation of meaningful financial statements and otherreports needed to manage a business. The cost accounting informationsystem must be designed to permit the determination of unit costs as wellas total product costs. For example, the fact that a manufacturer spent$100,000 for labor in a certain month is not, in itself, meaningful; but ifthis labor produced 5,000 finished units, the fact that the cost of labor was$20 per unit is significant. This figure can be compared to the company’sunit labor cost for prior periods and, often, to the labor cost of majorcompetitors.
Unit cost information is also useful in making a variety of importantmarketing decisions such as:
1. Determining the selling price of a product. Knowing the manufacturingcost of a product aids in determining the desired selling price. It shouldbe high enough to cover the cost of producing the item and themarketing and administrative expenses attributable to it, as well as toprovide a satisfactory profit to the owners.
2. Meeting competition. If a product is being undersold by a competitor,detailed information regarding unit costs can be used to determinewhether the problem can be resolved by reducing the selling price, byreducing manufacturing and selling expenses attributable to the product,or by some combination of the above that will still result in profitable sales.
3. Bidding on contracts. Many manufacturers must submit competitive bidsin order to be awarded contracts. Knowledge of the unit costs attribu-table to a particular product is of great importance in determining thebid price.
4. Analyzing profitability. Unit cost information enables management todetermine the amount of profit that each product earns, thereby allocat-ing the company’s scarce resources to those that are most profitable.
1 International Organization for Standardization, ‘‘ISO Members,’’ www.iso.org.
LO1Explain the
uses of cost
accounting information.
4 Principles of Cost Accounting

It is not uncommon, however, for some companies to retain a certainproduct line, known as a loss leader, that yields a very low profit, oreven a loss, in order to maintain the product variety that will attractthose customers who also purchase the more profitable items.
Planning and Control
One of the most important aspects of cost accounting is the preparation ofreports that management can use to plan and control operations.
Planning is the process of establishing objectives or goals for the firmand determining the means by which they will be met. Effective planning isfacilitated by the following:
1. Clearly defined objectives of the manufacturing operation. These objectivesmay be expressed in terms of the number of units to be produced, thedesired quality, the estimated unit cost, the delivery schedules, and thedesired inventory levels.
2. A production plan that will assist and guide the company in reaching itsobjectives. This detailed plan includes a description of the manufacturingoperations to be performed, a projection of human resource needs forthe period, and the coordination of the timely acquisition of materialsand facilities.
Cost accounting information enhances the planning process by provid-ing historical costs that serve as a basis for future projections. Managementcan analyze the data to estimate future costs and operating results and tomake decisions regarding the acquisition of additional facilities, any changesin marketing strategies, and the availability of capital.
The word ‘‘control’’ is used in many different ways, but from theviewpoint of the manufacturing concern, control is the process of monitor-ing the company’s operations and determining whether the objectivesidentified in the planning process are being accomplished. Effective controlis achieved as follows:
1. Assigning Responsibility. Responsibility should be assigned for eachdetail of the production plan. All managers should know precisely whattheir responsibilities are in terms of efficiency, operations, production, andcosts. The key to proper control involves the use of responsibility account-ing and cost centers.
The essence of responsibility accounting is the assignment of account-ability for costs or production results to those individuals who have themost authority to influence them. It requires a cost information system thattraces the data to cost centers and their managers.
A cost center is a unit of activity within the factory to which costs maybe practically and equitably assigned. A cost center may be a department or agroup of workers; it could represent one job, one process, or one machine.The criteria for a cost center are (1) a reasonable basis on which manufactur-ing costs can be traced or allocated and (2) a person who has control over andis accountable for many of the costs charged to that center.
Chapter 1 – Introduction to Cost Accounting 5

With responsibility accounting, the manager of a cost center isaccountable only for those costs that the manager controls. For example,labor and materials costs will be charged to the cost center, but themanager may be responsible only for the quantity of materials used andthe number of labor hours worked. This manager would probably not beaccountable for the unit cost of raw materials or the hourly rate paid toemployees. These decisions are normally beyond the manager’s controland are the responsibility of the purchasing and human resource depart-ments, respectively. The manager may be responsible for the cost ofmachinery maintenance and repair due to misuse in the cost center, but notresponsible for the costs of depreciation, taxes, and insurance on themachinery if the decision to purchase the machinery was made at a higherlevel in the organization. If production in the cost center for a given periodis lower than planned, this could be due to poor supervision of productionworkers, which is the manager’s responsibility. If the decrease in productionis caused by less-skilled workers being hired by Human Resources, how-ever, that would be beyond the manager’s control.
Cost and production reports for a cost center reflect its costs, indollars, and its production activity, in units. In a responsibility accountingsystem, the specific data for which the manager is responsible would behighlighted for the purpose of performance evaluation. Quite often, both acost and production report and a separate performance report will be preparedfor a cost center. The performance report will include only those costs andproduction data that the center’s manager can control. An illustration of aperformance report appears in Figure 1-2. Note the ‘‘variance columns’’that appear in the illustration. A variance represents the amount by whichthe actual result differs from the budgeted or planned amount. If the actualamount spent is less than the amount budgeted for, the variance is favorable(F); if more than budgeted, it is unfavorable (U). An in-depth discussion ofbudgeting and variance analysis appears in Chapters 7 and 8.
These reports must be furnished at regular intervals (monthly, weekly,or daily) on a timely basis. To provide the maximum benefit, the reportsshould be available as soon as possible after the end of the period beingreported. Reports not produced in a timely fashion are not effective incontrolling future operations.
2. Periodically Measuring and Comparing Results. Actual operating resultsshould be reviewed periodically and compared to the objectives establishedin the planning process. This analysis, which may be made monthly,weekly, daily, or even hourly in the case of production and scrap reports, isa major part of cost control because it compares current performance withthe overall plan. The actual dollars, units produced, hours worked, ormaterials used are compared with the budget, which is management’soperating plan expressed in quantitative terms (units and dollars). Thiscomparison is a primary feature of cost analysis. The number of dollarsspent or the quantity of units produced has little significance untilcompared with the budgeted amounts. Note that the appropriateness of the
6 Principles of Cost Accounting

Figure 1-2 Performance Report
1
2
3
4
5
6
7
8
9
10
11
12
A B C D E H I J K L M NF G
Leonardo’s Italian Café
Performance Report—Kitchen
September 30, 2011 Budgeted Actual Variance Expense September Year-to- September Year-to- September Year-to- Date Date Date
Kitchen wages $5,500 $47,000 $5,200 $46,100 $300 F $900 F
Food 17,700 155,300 18,300 157,600 600 U 2,300 U
Supplies 3,300 27,900 3,700 29,100 400 U 1,200 U
Utilities 1,850 15,350 1,730 16,200 120 F 850 U
Total $28,350 $245,550 $28,930 $249,000 $580 U $3,450 U
F = Favorable; U = Unfavorable
Ch
ap
ter
1–
Intro
du
ctio
nto
Co
st
Acco
un
ting
7

$157,600 actual year-to-date expenditure for ‘‘Food’’ in Figure 1-2 can beevaluated only when compared to the budgeted amount of $155,300.
3. Taking Necessary Corrective Action. The performance reports mayidentify problem areas and deviations from the business plan. Appropriatecorrective action should be implemented where necessary. A significantvariance from the plan is a signal for attention. An investigation may reveala weakness to be corrected or a strength to be better utilized. Managementwants to know not only the results of operations, but also how the results—whether favorable or unfavorable—compare with the plan, why thingshappened, and who was responsible. For example, management may wantto determine the causes of the unfavorable year-to-date variance of $2,300for ‘‘Food’’ in Figure 1-2. The variance may be due to an uncontrollable risein food prices or to a controllable waste of food at the restaurant, or acombination of both. Based on the variance analysis, management must beprepared to improve existing conditions by such means as implementing moreeconomical purchasing methods and standard portion sizes. Otherwise, theperiodic measurement of activity has little value. The relationship of planningand control is illustrated in Figure 1-3.
Figure 1-3 Relationship of Planning and Control
for Leonardo’s Italian Cafe
• CLEARLY DEFINED OBJECTIVE:
INCREASE PROFIT BY 15%
• PLAN TO REACH THE OBJECTIVE:
REDUCE FOOD COSTS BY 10%
PLANNING
BU
ILD
CO
RR
EC
TIV
E A
CT
ION
S I
NT
O P
LA
N
• MEASURE AND COMPARE RESULTS:
COMPARE BUDGETED TO ACTUAL
FOOD COSTS, MONTHLY.
• TAKE CORRECTIVE ACTION:
IDENTIFY MORE ECONOMICAL
SUPPLIERS AND CONTROL FOOD
WASTE
CONTROL
8 Principles of Cost Accounting

Professional Ethics, CMA Certification, andCorporate GovernanceThe Institute of Management Accountants (IMA) is the largest organiza-tion of accountants in industry in the world. Comparable to the CPAcertification for public accountants, the Certified Management Accountant(CMA) certificate—which is awarded by the IMA after the candidatecompletes a four-year college degree, two years of relevant professionalexperience in management accounting and financial management, and arigorous four-part examination whose topics include business analysis,management accounting and reporting, strategic management, and businessapplications with a strong emphasis on ethics—evidences a high level ofcompetency in management accounting.
In addition to competency, the need for ethical conduct in managingcorporate affairs has never been greater. Individual employees, investors,and the economy as a whole have been negatively impacted by recentaccounting scandals where management, including controllers and chieffinancial officers, has ‘‘cooked the books’’ to make reported financial resultsseem better than actual. Enron, WorldCom, Health South, Tyco Interna-tional, Rite Aid, and AOL Time Warner are just a few examples of firmsthat have had major accounting scandals in recent years. To help curbfuture abuses, the Sarbanes-Oxley Act of 2002 was written to protectshareholders and other stakeholders of publicly-traded companies by im-proving corporate governance. Corporate governance is the means by whicha company is directed and controlled. Key elements of the act include:
. certification by the CEO and CFO that the financial statements fairlyrepresent the results of business operations.
. the establishment of the Public Company Accounting Oversight Board(PCAOB) to provide oversight of the accounting profession.
. prohibiting a public accounting firm from providing many nonauditingservices to a company that it audits.
. the requirement that a company’s annual report contain an internalcontrol report that includes management’s opinion on the effectivenessof its internal controls.
. the placement of responsibility for hiring, compensating, and terminat-ing the audit firm in the hands of the board of directors’ auditcommittee, not top management.
. severe criminal penalties for the destruction or alteration of businessdocuments and for retaliation against ‘‘whistleblowers.’’2
2 American Institute of Certified Public Accountants, ‘‘The Sarbanes-Oxley Act,’’ www.aicpa.org.
LO2Describe
the ethical
responsibilities and
certification require-
ments for manage-
ment accountants, as
well as corporate
governance.
Chapter 1 – Introduction to Cost Accounting 9

It is equally important that the internal accounting reports prepared bymanagement accountants be as accurate and unbiased as possible. To that end,the IMA has issued a Statement of Ethical Professional Practice that must beadhered to by its members. These standards address members’ responsibilityin areas such as maintaining appropriate levels of professional competence,refraining from disclosing confidential information, avoiding conflicts ofinterest, and communicating information fairly and objectively. The secondpart of the document provides guidance for resolving ethical conflicts. Thecomplete IMA Statement of Ethical Professional Practice may be found inthe appendix to this chapter and at the IMA Web site, which is linked tothe text Web site at http://www.cengage.com/accounting/vanderbeck.
Relationship of Cost Accounting to Financialand Management AccountingThe objective of accounting is to accumulate financial information for usein making economic decisions. Financial accounting focuses on gatheringhistorical financial information to be used in preparing financial statementsthat meet the needs of investors, creditors, and other external users offinancial information. The statements include a balance sheet, incomestatement, retained earnings statement, and statement of cash flows.Although these financial statements are useful to management as well as toexternal users, additional reports, schedules, and analyses are required formanagement’s use in planning and controlling operations. Managementspends most of its time evaluating the problems and opportunities ofindividual departments and divisions of the company rather than looking atthe entire company at once. As a result, the external financial statements forthe whole company are of little help to management in making day-to-dayoperating decisions.
Management accounting focuses on both historical and estimateddata that management needs to conduct ongoing operations and do long-range planning. Cost accounting includes those parts of both financial andmanagement accounting that collect and analyze cost information. Itprovides the product cost data required for special reports to management(management accounting) and for inventory costing in the financial state-ments (financial accounting). For example, cost accounting information isneeded to determine: whether to make or buy a product component;whether to accept a special order at a discounted price; the amount at whichcost of goods sold should be reported on the income statement; and thevaluation of inventories on the balance sheet. The various users and uses ofcost accounting data are illustrated in Figure 1-4, and Figure 1-5 showshow cost accounting intersects both financial and management accounting.‘‘What Is Management Accounting?’’, a description prepared by the Insti-tute of Management Accountants as to the role performed by managementaccountants, appears on the following page.
LO3Describe the
relationship
of cost accounting to
financial and manage-
ment accounting.
10 Principles of Cost Accounting

WHAT IS MANAGEMENT ACCOUNTING?1
Management accounting is the internal business build-ing role of accounting and finance professionals whowork inside organizations. These professionals areinvolved in designing and evaluating business pro-cesses, budgeting and forecasting, implementing andmonitoring internal controls, and analyzing, synthe-sizing, and aggregating information—to help driveeconomic value.
The role of management accounting differs from thatof public accounting, since management accountantswork at the ‘‘beginning’’ of the value chain, supportingdecision making, planning, and control, while audit andtax functions involve checking the work after the fact.Management accountants are valued business partners,directly supporting an organization’s strategic goals.With a renewed emphasis on good internal controlsand sound financial reporting, the role of the manage-ment accountant is more important than ever.
It obviously takes more people to ‘‘do’’ the work thanit does to ‘‘check’’ the work. In fact, of the five millionfinance function professionals in the U.S., more than90% work inside organizations as management accoun-tants and finance professionals. Some common job titlesfor management accountants in organizations of allsizes and structure include:
. Staff Accountant
. Cost Accountant
. Senior Accountant
. Corporate or Division Planner
. Financial Analyst
. Budget Analyst
. Internal Auditor
. Finance Manager
. Controller
. Vice President, Finance
. Treasurer
. Chief Financial Officer (CFO)
. Chief Executive Officer (CEO)
To learn more about IMA and the managementaccounting profession, please visit Frequently AskedQuestions.
Figure 1-4 Users and Uses of Cost Accounting Information
Cost Accounting System(Accumulates Cost Information)
Characteristics Managerial Accounting
• Internal Parties (Managers)
Users:
Focus:
Uses of CostInformation:
• External Parties (Shareholders, Creditors, Governments)
• Managers
Entire Business
Product Costs for Calculating Cost of Goods Sold (Income Statement) and Finished Goods, Work in Process, and Raw Materials Inventories (Balance Sheet) Using Historical Costs and Generally Accepted Accounting Principles
Segments of the Business
• Budgeting
• Special Decisions Such as Make or Buy a Component, Keep or Replace a Facility, and Sell a Product at a Special Price
• Nonfinancial Information Such as Defect Rates, Percentage of Products Returned, and Percentage of On-Time Deliveries (All of the Above Using a Combination of Historical Data, Estimates, and Future Projections)
Financial Accounting
1 Reprinted with permission from IMA, Montvale, N.J.,‘‘About Management Accounting’’ from www.imanet.org.
Chapter 1 – Introduction to Cost Accounting 11

Costs of Goods Sold
Merchandising concerns compute cost of goods sold as follows (the amountof purchases represents the cost of goods acquired for resale during theperiod):
Beginning merchandise inventoryPlus purchases (merchandise)Merchandise available for saleLess ending merchandise inventoryCost of goods sold
Because a manufacturer makes, rather than buys, the products it hasavailable for sale, the term finished goods inventory replaces merchandiseinventory, and the term cost of goods manufactured replaces purchases indetermining the cost of goods sold, as shown below (the cost of goodsmanufactured amount is supported by a schedule detailing the costs ofmaterial and labor and the expenses of maintaining and operating afactory.):
Beginning finished goods inventoryPlus cost of goods manufacturedFinished goods available for saleLess ending finished goods inventoryCost of goods sold
The format of the income statement for a manufacturer is not signifi-cantly different from that of a merchandiser. However, the cost accountingprocedures needed to determine the cost of goods manufactured areconsiderably more complex than the procedures needed to determine thecost of merchandise purchased in its finished form. Note that the incomestatements for service businesses do not have a cost of goods sold section,because they provide a service rather than a product.
Figure 1-5 Uses of Product Cost Data in Financial and Management
Accounting
Financial Accounting(for inventory costing
purposes in thefinancial statements)
Cost Accounting(product costinformation)
Managerial Accounting(for special reports to
management for decision-making purposes)
12 Principles of Cost Accounting

InventoriesIf a merchandiser has unsold items on hand at the end of an accountingperiod, the cost of the merchandise is reflected in the current assets sectionof the balance sheet in the following manner:
Current assets:CashAccounts receivableMerchandise inventory
On the balance sheet of a manufacturing concern, the current assetssection is expanded as follows:
Current assets:CashAccounts receivableInventories:
Finished goodsWork in processMaterials
The balance of the finished goods account represents the total costincurred in manufacturing goods completed but still on hand at the end ofthe period. The balance of the work in process account includes allmanufacturing costs incurred to date for goods in various stages of produc-tion but not yet completed. The balance of the materials account repre-sents the cost of all materials purchased and on hand to be used in themanufacturing process, including raw materials, prefabricated parts, andother factory materials and supplies. Raw materials for one company areoften the finished product of another company. For example, rolled steel tobe used in the production of Honda Accord automobiles in its Marysville,Ohio plant would be the final product of A.K. Steel, the steel mill inMiddletown, Ohio, but raw materials to Honda. Prefabricated parts wouldinclude units, such as electric motors, produced by another manufacturer to beused in the assembly of a product such as copying machines. Other materialsand supplies might include screws, nails, rivets, lubricants, and solvents.
Service entities do not have inventories on their balance sheets becausethey provide a service rather than a product. A summary comparison ofmanufacturing, merchandising, and service businesses appears in Figure 1-6.
Valuation of Inventories. Many procedures used to gather costs are uniqueto manufacturers. Manufacturers’ inventories are valued for external finan-cial reporting purposes by using inventory costing methods—such as first-in, first-out (FIFO); last-in, first-out (LIFO); and moving average—that arealso used by merchandisers. Most manufacturers maintain a perpetualinventory system that provides a continuous record of purchases, issues,and balances of all goods in stock. Generally, these data are verified by
Chapter 1 – Introduction to Cost Accounting 13

periodic counts of selected items throughout the year. Under a perpetualsystem, inventory valuation data for financial statement purposes are avail-able at any time, as distinguished from a periodic inventory system thatrequires estimating inventory during the year for interim financial state-ments and shutting down operations to count all inventory items at the endof the year.
In addition to providing inventory valuation data for the financial state-ments, the detailed cost data and perpetual inventory records provide theinformation necessary to control inventory levels, to ensure the timelyavailability of materials for production, and to detect pilferage, waste, andspoilage. Inventory valuation and control are discussed in detail in Chapter 2.
Inventory Ledgers. Generally, both merchandisers and manufacturersmaintain various subsidiary ledgers, such as those for accounts receivableand accounts payable. In addition, manufacturers usually maintain subsidi-ary ledgers for the general ledger inventory control accounts: FinishedGoods; Work in Process; and Materials. These subsidiary ledgers arenecessary to track the individual raw materials, jobs in process, and finishedjobs on hand. They support the balances in the control accounts, asillustrated in Figure 1-7, and aid in managing the business on a daily basis.
Figure 1-6 Comparison of Service, Merchandising, and Manufacturing Businesses
Business Sector Examples Product or ServiceInventoryAccount(s)
Service Hotels, accountants, hairstylists, sports franchises
Intangible benefits such aslodging, tax preparation,grooming, entertainment
None
Merchandising Bookstores, electronics stores,sports memorabilia shops,beverage wholesalers
Tangible products purchasedfrom suppliers in finishedform
Merchandiseinventory
Manufacturing Segway producers, manufac-turers of electronic games,home builders
Physical products created by theapplication of labor and tech-nology to raw materials
Finished Goods,Work in Process,Materials
Figure 1-7 Relationship between General and Subsidiary Ledgers
SUBSIDIARY LEDGERS
FOR INVENTORY
GENERAL LEDGER
INVENTORY
CONTROL ACCOUNTS
MATERIALS
MATERIALS LEDGER:
Rolled steelGlass
Rubber
14 Principles of Cost Accounting

Elements of Manufacturing CostsManufacturing or production costs are classified into three basic ele-ments: (1) direct materials, (2) direct labor, and (3) factory overhead.
Direct Materials
The materials that become part of a certain manufactured product and canbe readily identified with that product are classified as direct materials.Examples include lumber used in making furniture, fabric used in theproduction of clothing, iron ore used in the manufacture of steel products,and rubber used in the production of athletic shoes.
Figure 1-7 Continued
WORK
IN
PROCESS
FINISHED
GOODS
JOB COST LEDGER
(UNFINISHED JOBS):
FINISHED GOODS LEDGER
(FINISHED JOBS):
Job 103Job 104
Job 105
Job 101Job 102
Recall and Review 1
The Recall and Review exercises are aimed at testing your understanding of
a key concept in the reading before you proceed to the end-of-chapter
materials. Work the exercises independently and then check your solutions
at the designated pages.
Samson Manufacturing had finished goods inventory of $45,000 on
March 1, March cost of goods manufactured of $228,000, and March 31
finished goods of $53,000. Compute the cost of goods sold for the month of
March. $__________
(After working this exercise, see page 39 for the solution.)
You should now be able to work the following:
Questions 1–21; Exercises 1-1 to 1-3; Problems 1-1 and 1-2; Mini-Case; and
Internet Exercises 1 and 2.
Chapter 1 – Introduction to Cost Accounting 15

Many types of materials and supplies necessary for the manufacturingprocess either cannot be readily identified with any particular manufactureditem or have a relatively insignificant cost. Items such as sandpaper used insanding furniture, lubricants used on machinery, and other items forgeneral factory use are classified as indirect materials. Similarly classifiedare materials that actually become part of the finished product, such asthread, screws, rivets, nails, and glue, but whose costs are relatively insignif-icant, making it not cost effective to trace them to specific products.
Direct Labor
The labor of employees who work directly on the product manufactured,such as machine operators or assembly-line workers, is classified as directlabor. The employees who are required for the manufacturing process butwho do not work directly on the units being manufactured are consideredindirect labor. This classification includes department heads, inspectors,materials handlers, and maintenance personnel. Payroll-related costs, suchas payroll taxes, group insurance, sick pay, vacation and holiday pay,retirement program contributions, and other fringe benefits are usuallytreated as indirect costs. Some companies, however, more appropriately,treat the fringe benefits paid for direct laborers as additional direct laborcost for the purpose of more precisely determining how much each hour ofdirect labor really costs.
As manufacturing processes have become increasingly automated, directlabor cost as a percentage of total product cost has decreased for manycompanies. Harley-Davidson, the motorcycle manufacturer, stopped track-ing direct labor as a separate cost category because it was only 10% of totalproduct cost but required an inordinate amount of time to trace directly tothe individual products manufactured.3
Factory OverheadFactory overhead, also known as manufacturing overhead and factoryburden, includes all costs related to the manufacture of a product exceptdirect materials and direct labor. Thus, factory overhead includes thepreviously mentioned indirect materials and indirect labor, plus othermanufacturing expenses, such as depreciation on the factory building andthe machinery and equipment, heat, light, power, maintenance, insurance,and taxes. As factories have become more automated, factory overhead as apercentage of total manufacturing cost has increased dramatically.
Summary of Manufacturing Costs
The costs of direct materials and direct labor are sometimes combined anddescribed as the prime cost of manufacturing a product. Prime cost plus
3 W. Turk, ‘‘Management Accounting Revitalized: The Harley-Davidson Experience,’’Journal of Cost Management, Vol. 3, No. 4, 1990, 28–39.
16 Principles of Cost Accounting

factory overhead equals the total manufacturing cost. Direct labor cost andfactory overhead, which are necessary to convert the direct materials intofinished goods, can be combined and described as conversion cost. Theserelationships are illustrated in Figure 1-8.
Marketing expenses, general administrative costs, and other nonfactoryexpenditures are not included in the costs of manufacturing. Some costsincurred by a manufacturer, however, may benefit both factory andnonfactory operations. Examples include depreciation, insurance, and prop-erty taxes on a building that houses both the factory and the administrativeoffices. In this situation, an allocation of cost must be made to each businessfunction.
Flow of Costs
All three elements of manufacturing cost flow through the work in processinventory account. The costs of direct materials and direct labor used inproduction are charged (debited) directly to Work in Process. All otherfactory costs—indirect labor, indirect materials, and other factoryexpenses—are charged to the factory overhead account and later trans-ferred to Work in Process. When goods are completed, the total costsincurred in producing the goods are transferred from Work in Process toFinished Goods. When goods are sold, the costs incurred to manufacturethe goods are transferred from Finished Goods to Cost of Goods Sold.Figure 1-9 illustrates the flow of manufacturing costs.
Figure 1-8 Prime Cost and Conversion Cost
Direct Materials
Direct Labor
Factory Overhead
Elementsof Cost
Prime Cost
Conversion Cost
Figure 1-9 Flow of Manufacturing Costs
Direct Materials
Direct Labor
Factory Overhead
Work in Process(Asset)
Finished Goods(Asset)
Cost of GoodsSold(Expense)
Chapter 1 – Introduction to Cost Accounting 17

Illustration of Accounting forManufacturing CostsCost accounting procedures are used to accumulate and allocate all ele-ments of manufacturing cost in a manner that will produce meaningful datafor the internal use of management and for the preparation of externalfinancial statements. The following example illustrates basic cost account-ing procedures, utilizing the terminology and principles that were discussedpreviously.
Wicker Works, Inc., a small, newly organized corporation, manufactureswicker furniture—both tables and chairs. The firm sells products directly toretailers. The basic steps in the company’s production process are asfollows:
1. Pieces of rattan, a natural fiber grown in Asia, are purchased in precutspecifications. The pieces are assembled to form the frame of the tableor chair.
2. The legs and back uprights of the chair and the legs and the outline ofthe tabletop are then wrapped in binding cane.
3. The seat and back of the chair and the tabletop are now ready to bewoven into place, and the chair or table is finished.
All of the previous steps are performed in a single department. The flow ofmanufacturing costs for Wicker Works is illustrated in Figure 1-10.
Figure 1-10 Flow of Costs Related to the Production Process
MaterialsInventory
(Rattan, BindingCane)
Work in ProcessInventory
(Tabletops,Chair Legs, etc.)
Finished GoodsInventory
(Completed Tablesand Chairs)
Cost of GoodsSold
(ManufacturingCost of Items Sold)
LO5Illustrate
basic cost
accounting procedures.
18 Principles of Cost Accounting

The beginning balance sheet for the company on January 1 of thecurrent year is presented as follows:
Wicker Works, Inc.Balance Sheet January 1, 2011
Assets Liabilities and Stockholders’ EquityCash . . . . . . . . . . . . . . . . . . . . . . . . . . $ 40,000 Liabilities . . . . . . . . . . . . . . . . . . . . . . $ -0-
Building . . . . . . . . . . . . . . . . . . . . . . . 250,000 Capital stock . . . . . . . . . . . . . . . . . . . 365,000
Machinery and equipment . . . . . . 75,000Total liabilities and
stockholders’ equity . . . . . . . . . . $365,000Total assets . . . . . . . . . . . . . . . . . . . . $365,000
Assume, for the purpose of simplification, in the following example,that the company is currently making only one style of table and no chairs.During January the following transactions are completed and recorded, insummary form:
1. Materials (rattan, binding cane, nails, tacks, staples, glue, and solvents)are purchased on account at a cost of $25,000.
Materials . . . . . . . . . . . . . . . . . . . . . . . . . . . . . . . . . . . . . . . . . . . . . . . . . . . . . . . 25,000
Accounts Payable . . . . . . . . . . . . . . . . . . . . . . . . . . . . . . . . . . . . . . . . . . . . 25,000
The cost of materials purchased on credit increases the asset account,Materials, and the liability account, Accounts Payable. Note that only asingle materials control account that contains both the cost of directand indirect materials appears in the general ledger.
2. During the month, direct materials (rattan and binding cane) costing$20,000 and indirect materials (nails, tacks, staples, glue, and solventsfor cleaning) costing $995 are issued into production.
Work in Process (Direct Materials) . . . . . . . . . . . . . . . . . . . . . . . . . . . . . . . 20,000
Factory Overhead (Indirect Materials) . . . . . . . . . . . . . . . . . . . . . . . . . . . . 995
Materials . . . . . . . . . . . . . . . . . . . . . . . . . . . . . . . . . . . . . . . . . . . . . . . . . . . . . 20,995
Direct materials issued are charged directly to the work in process controlaccount because they can be readily traced to the individual jobs, but theindirect materials are charged to the factory overhead account becausethey cannot be easily identified with specific jobs. The factory overheadaccount will be used to accumulate various factory expenses that will laterbe allocated to individual jobs using some equitable formula.
3. Total gross wages and salaries for the month were: factory employeesworking on the product, $10,000; factory supervision, maintenance, andcustodial employees, $3,500; and sales and administrative employees,$6,500. The entries to record the payroll and the payments to employ-ees (ignoring payroll deductions) would be as follows:
Payroll . . . . . . . . . . . . . . . . . . . . . . . . . . . . . . . . . . . . . . . . . . . . . . . . . . . . . . . . . 20,000
Wages Payable . . . . . . . . . . . . . . . . . . . . . . . . . . . . . . . . . . . . . . . . . . . . . . . 20,000
Wages Payable . . . . . . . . . . . . . . . . . . . . . . . . . . . . . . . . . . . . . . . . . . . . . . . . . 20,000
Cash . . . . . . . . . . . . . . . . . . . . . . . . . . . . . . . . . . . . . . . . . . . . . . . . . . . . . . . . . 20,000
Chapter 1 – Introduction to Cost Accounting 19
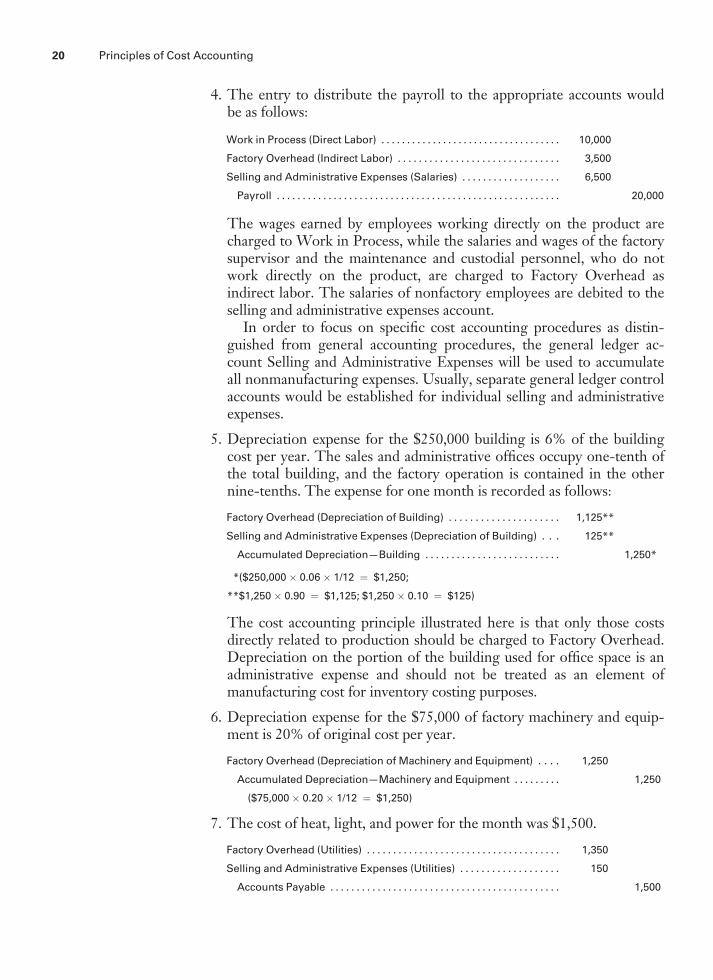
4. The entry to distribute the payroll to the appropriate accounts wouldbe as follows:
Work in Process (Direct Labor) . . . . . . . . . . . . . . . . . . . . . . . . . . . . . . . . . . . 10,000
Factory Overhead (Indirect Labor) . . . . . . . . . . . . . . . . . . . . . . . . . . . . . . . 3,500
Selling and Administrative Expenses (Salaries) . . . . . . . . . . . . . . . . . . . 6,500
Payroll . . . . . . . . . . . . . . . . . . . . . . . . . . . . . . . . . . . . . . . . . . . . . . . . . . . . . . . 20,000
The wages earned by employees working directly on the product arecharged to Work in Process, while the salaries and wages of the factorysupervisor and the maintenance and custodial personnel, who do notwork directly on the product, are charged to Factory Overhead asindirect labor. The salaries of nonfactory employees are debited to theselling and administrative expenses account.
In order to focus on specific cost accounting procedures as distin-guished from general accounting procedures, the general ledger ac-count Selling and Administrative Expenses will be used to accumulateall nonmanufacturing expenses. Usually, separate general ledger controlaccounts would be established for individual selling and administrativeexpenses.
5. Depreciation expense for the $250,000 building is 6% of the buildingcost per year. The sales and administrative offices occupy one-tenth ofthe total building, and the factory operation is contained in the othernine-tenths. The expense for one month is recorded as follows:
Factory Overhead (Depreciation of Building) . . . . . . . . . . . . . . . . . . . . . 1,125**
Selling and Administrative Expenses (Depreciation of Building) . . . 125**
Accumulated Depreciation—Building . . . . . . . . . . . . . . . . . . . . . . . . . . 1,250*
*($250,000 � 0.06 � 1/12 ¼ $1,250;
**$1,250 � 0.90 ¼ $1,125; $1,250 � 0.10 ¼ $125)
The cost accounting principle illustrated here is that only those costsdirectly related to production should be charged to Factory Overhead.Depreciation on the portion of the building used for office space is anadministrative expense and should not be treated as an element ofmanufacturing cost for inventory costing purposes.
6. Depreciation expense for the $75,000 of factory machinery and equip-ment is 20% of original cost per year.
Factory Overhead (Depreciation of Machinery and Equipment) . . . . 1,250
Accumulated Depreciation—Machinery and Equipment . . . . . . . . . 1,250
($75,000 � 0.20 � 1/12 ¼ $1,250)
7. The cost of heat, light, and power for the month was $1,500.
Factory Overhead (Utilities) . . . . . . . . . . . . . . . . . . . . . . . . . . . . . . . . . . . . . 1,350
Selling and Administrative Expenses (Utilities) . . . . . . . . . . . . . . . . . . . 150
Accounts Payable . . . . . . . . . . . . . . . . . . . . . . . . . . . . . . . . . . . . . . . . . . . . 1,500
20 Principles of Cost Accounting

Because one-tenth of the building is used for office purposes, it wasdecided that 10% of the total utilities cost should be allocated to Sellingand Administrative Expenses. If there were separate meters for eachpart of the building, the usage could be determined directly rather thanby allocation.
8. Miscellaneous selling and administrative expenses for telephone andfax, copying charges, office supplies, travel, and rental of office furnitureand equipment totaled $3,750, on account.
Selling and Administrative Expenses . . . . . . . . . . . . . . . . . . . . . . . . . . . . 3,750
Accounts Payable . . . . . . . . . . . . . . . . . . . . . . . . . . . . . . . . . . . . . . . . . . . . 3,750
A manufacturer may incur many other expenses, but for simplicity it isassumed that Wicker Works incurred no other expenses. After postingthe journal entries to the appropriate ledger accounts, Factory Over-head will reflect the following debits:
Transaction Description Amount2. Indirect materials . . . . . . . . . . . . . . . . . . . . . . . . . . . . . . . . . . $ 995
4. Indirect labor . . . . . . . . . . . . . . . . . . . . . . . . . . . . . . . . . . . . . . 3,500
5. Depreciation of building . . . . . . . . . . . . . . . . . . . . . . . . . . . . 1,125
6. Depreciation of machinery and equipment . . . . . . . . . . 1,250
7. Utilities . . . . . . . . . . . . . . . . . . . . . . . . . . . . . . . . . . . . . . . . . . . 1,350
Total . . . . . . . . . . . . . . . . . . . . . . . . . . . . . . . . . . . . . . . . . . . . $8,220
9. The balance in Factory Overhead is transferred to Work in Process bythe following entry:
Work in Process . . . . . . . . . . . . . . . . . . . . . . . . . . . . . . . . . . . . . . . . . . . . . . . . 8,220
Factory Overhead . . . . . . . . . . . . . . . . . . . . . . . . . . . . . . . . . . . . . . . . . . . . 8,220
The three elements of manufacturing cost—direct materials, directlabor, and factory overhead—are now accumulated in Work in Process.The debits in the account are as follows:
Transaction Description Amount2. Direct materials . . . . . . . . . . . . . . . . . . . . . . . . . . . . . . . . . . . . $20,000
4. Direct labor . . . . . . . . . . . . . . . . . . . . . . . . . . . . . . . . . . . . . . . . 10,000
9. Factory overhead . . . . . . . . . . . . . . . . . . . . . . . . . . . . . . . . . . 8,220
Total . . . . . . . . . . . . . . . . . . . . . . . . . . . . . . . . . . . . . . . . . . . . $38,220
10. If we assume that all goods started in process have been finished by theend of the month, then the following entry transfers the cost of thesegoods from Work in Process to Finished Goods:
Finished Goods . . . . . . . . . . . . . . . . . . . . . . . . . . . . . . . . . . . . . . . . . . . . . . . . . 38,220
Work in Process . . . . . . . . . . . . . . . . . . . . . . . . . . . . . . . . . . . . . . . . . . . . . . 38,220
Chapter 1 – Introduction to Cost Accounting 21

Assuming that 500 tables were produced during the month, we find thatthe unit cost is $76.44 ($38,220/500). The unit cost for each element ofmanufacturing cost is calculated as follows:
TotalUnits
ProducedUnitCost
Direct materials . . . . . . . . . . . . . . . . . . . . . $20,000 500 $40.00
Direct labor . . . . . . . . . . . . . . . . . . . . . . . . . 10,000 500 20.00
Factory overhead . . . . . . . . . . . . . . . . . . . . 8,220 500 16.44
$38,220 $76.44
If the same type of table is produced in future periods, the unit costs ofthose periods can be compared with the unit costs for this month. Anysignificant differences can be analyzed so that management might takeappropriate action.
The unit cost also serves as a basis for establishing the selling price ofthe tables. After also considering the selling and administrative ex-penses, management establishes a selling price that should provide areasonable profit. The selling price may be determined by adding amark-on percentage, which is a percentage of the manufacturing costper unit. For example, if management decides that a 50% mark-onpercentage is necessary to cover the product’s share of selling andadministrative expenses and to earn a satisfactory profit, the sellingprice per unit, rounded to the nearest cent, would be calculated asfollows:
Manufacturing cost . . . . . . . . . . . . . . . . . . . . . . . . . . . . . . . . . . . . . . . . . . . . . . . . . . . . . $ 76.44
Mark-on percentage (50%) . . . . . . . . . . . . . . . . . . . . . . . . . . . . . . . . . . . . . . . . . . . . . . 38.22
Selling price . . . . . . . . . . . . . . . . . . . . . . . . . . . . . . . . . . . . . . . . . . . . . . . . . . . . . . . . . . . $114.66
In later periods, owing to intense competition, it might be foundthat this particular item cannot be sold at a price that will be highenough to cover all of its costs and provide a normal profit margin.Through analysis of the unit costs, management might effect cost-cutting measures or perhaps even discontinue production of theitem.
From this example, it is apparent that, at any given time, the cost ofeach item in inventory is available. It should be reemphasized that onefunction of cost accounting is the accurate determination of the cost ofmanufacturing a unit of product. This knowledge of unit cost helpsmanagement to plan and control operations and to make marketingdecisions.
To continue with the example, assume that the following additionaltransactions take place in January:
22 Principles of Cost Accounting

11. Invoices of $25,000, representing costs of materials, utilities, and sellingand administrative expenses, are paid.
Accounts Payable . . . . . . . . . . . . . . . . . . . . . . . . . . . . . . . . . . . . . . . . . . . . . . . 25,000
Cash . . . . . . . . . . . . . . . . . . . . . . . . . . . . . . . . . . . . . . . . . . . . . . . . . . . . . . . . . 25,000
12. A total of 400 tables are sold to retailers at a net price of $114.66 each.
Accounts Receivable (400 � $114.66) . . . . . . . . . . . . . . . . . . . . . . . . . . . . 45,864
Sales . . . . . . . . . . . . . . . . . . . . . . . . . . . . . . . . . . . . . . . . . . . . . . . . . . . . . . . . 45,864
Cost of Goods Sold (400 � $76.44) . . . . . . . . . . . . . . . . . . . . . . . . . . . . . . . 30,576
Finished Goods . . . . . . . . . . . . . . . . . . . . . . . . . . . . . . . . . . . . . . . . . . . . . . . 30,576
13. Cash totaling $33,000 is collected on accounts receivable.
Cash . . . . . . . . . . . . . . . . . . . . . . . . . . . . . . . . . . . . . . . . . . . . . . . . . . . . . . . . . . . 33,000
Accounts Receivable . . . . . . . . . . . . . . . . . . . . . . . . . . . . . . . . . . . . . . . . . . 33,000
The accounts in the general ledger will reflect the entries as follows:
Cash Accounts Receivable
1/1 Bal. 40,000 3. 20,000 12. 45,864 13. 33,000
13. 33,000 11. 25,000 12,864
73,000 45,000
28,000
Finished Goods
10. 38,220 12. 30,576
7,644
Work in Process
2. Directmaterials 20,000
10. 38,220
4. Directlabor 10,000
9. Factoryoverhead 8,220
38,220
Materials Building
1. 25,000 2. 20,995 1/1 Bal. 250,000
4,005
Chapter 1 – Introduction to Cost Accounting 23

Accumulated Depreciation—Building Machinery and Equipment
5. 1,250 1/1 Bal. 75,000
Accumulated Depreciation—Machineryand Equipment Accounts Payable
6. 1,250 11. 25,000 1. 25,000
7. 1,500
8. 3,750
30,250
5,250
Wages Payable
3. 20,000 3. 20,000
Capital Stock Sales
1/1 Bal. 365,000 12. 45,864
Cost of Goods Sold Payroll
12. 30,576 3. 20,000 4. 20,000
Factory Overhead
2. Indirect materials 995 9. 8,220
4. Indirect labor 3,500
5. Depreciation of building 1,125
6. Depreciation of machinery& equip. 1,250
7. Utilities 1,350
8,220
Selling and Administrative Expenses
4. Salaries 6,500
5. Depreciation of building 125
7. Utilities 150
8. Other 3,750
10,525
After calculating the balance of each general ledger account, theequality of the debits and credits is proven by preparing a trial balance, asfollows.
24 Principles of Cost Accounting

1
2
3
4
5
6
7
8
9
10
11
12
13
14
15
16
17
18
19
20
21
22
23
A B C D E F
Wicker Works, Inc.
Trial Balance
January 31, 2011
Cash $28,000
Accounts Receivable 12,864
Finished Goods 7,644*
Work in Process -0-
Materials 4,005
Building 250,000
Accumulated Depreciation—Building $1,250
Machinery and Equipment 75,000
Accumulated Depreciation—Mach. and Eq. 1,250
Accounts Payable 5,250
Wages Payable -0-
Capital Stock 365,000
Sales 45,864
Cost of Goods Sold 30,576
Payroll -0-
Factory Overhead -0-
Selling and Administrative Expenses 10,525
Total $418,614 $418,614
*The finished goods control account reflects the cost of the 100 units still on
hand—100 × $76.44 = $7,644.
From an analysis of the general ledger accounts and the trial balance, astatement of cost of goods manufactured, an income statement, and abalance sheet can be prepared:
1
2
3
4
5
6
7
8
9
10
11
12
13
14
15
16
17
18
19
20
21
22
A B C D E F G
Wicker Works, Inc.
Statement of Cost of Goods Manufactured
For the Month Ended January 31, 2011
Direct Materials:
Inventory, January 1 $-0-
Purchases 25,000
Total cost of available materials $25,000
Less inventory, January 31 4,005
Cost of materials used $20,995
Less indirect materials used 995
Cost of direct materials used in production $20,000
Direct labor 10,000
Factory overhead:
Indirect materials $995
Indirect labor 3,500
Depreciation of building 1,125
Depreciation of machinery and equipment 1,250
Utilities 1,350
Total factory overhead 8,220
Cost of goods manufactured during the month $38,220
Chapter 1 – Introduction to Cost Accounting 25

The cost of goods manufactured includes the manufacturing costs related tothe goods that were finished during the period. The figures in the cost ofgoods manufactured statement were obtained by analyzing the appropriategeneral ledger accounts. The materials inventory account had no beginningbalance but had an ending balance of $4,005. The amount of purchasesduring the period was determined by analyzing the debits to the materialsaccount. The cost of direct materials used of $20,000 and the direct laborcost of $10,000 were obtained from the work in process account. All otheritems in the statement of cost of goods manufactured represent factoryoverhead and are determined from the factory overhead account in thegeneral ledger. If there had been beginning or ending work in process, itwould have appeared in the statement of cost of goods manufactured.
1
2
3
4
5
6
7
8
9
10
11
12
13
14
15
A B C D E F G
Wicker Works, Inc.
Income Statement
For the Month Ended January 31, 2011
Net sales: $45,864
Cost of goods sold:
Finished goods inventory, January 1 $-0-
Add cost of goods manufactured 38220
Goods available for sale $38,220
Less finished goods inventory, January 31 7,644 30,576
Gross profit on sales: $15,288
Selling and administrative expenses 10,525
Net income $4,763
123456789101112131415161718192021222324252627282930
Wicker Works, Inc. Balance Sheet January 31, 2011
Assets Current assets: Cash $28,000 Accounts receivable 12,864Inventories: Finished goods $7,644 Work in process -0- Materials 4,005 11,649 Total current assets $52,513Plant and equipment: Building $250,000 Less accumulated depreciation 1,250 $248,750 Machinery and equipment $75,000 Less accumulated depreciation 1,250 73,750 Total plant and equipment $322,500Total assets $375,013
Liabilities and Stockholders’ EquityCurrent liabilities: Accounts payable $5,250Stockholders’ equity Capital stock $365,000 Retained earnings 4,763 Total stockholders’ equity 369,763Total liabilities and stockholders’ equity $375,013
A B C D E F G
26 Principles of Cost Accounting

Note that the retained earnings on the balance sheet represent theamount of net income for the period, $4,763, because this was the firstmonth of business operations.
This discussion has presented a complete cycle in cost accountingprocedures. Before proceeding, carefully review the basic elements ofterminology and the flow of costs. A firm grasp of the fundamentals alreadycovered is necessary to comprehend the more complex material in subse-quent chapters. Figure 1-11 presents a graphic illustration of the flow ofcosts through the ledger accounts. You should study this illustration care-fully, following each line to trace the flow of costs.
Figure 1-11 Flow of Costs through the Ledger Accounts
Materials
Cost of materials purchased
Cost of direct materials used
Cost of indirect materials used
Cost of direct materialsCost of direct laborFactory overhead
Cost of goods finished
Work in Process
Payroll Finished Goods
Factory Overhead Cost of Goods Sold
Gross wages Cost of direct labor
Cost of indirect labor
Cost of goods finished
Cost of finished goods sold
Cost of finished goods sold
Transferred to Work in Process
Cost of indirect materialsCost of indirect laborOther indirect factory expenses
Chapter 1 – Introduction to Cost Accounting 27

Cost Accounting SystemsThe previous example presented the basic foundation of a cost accountingsystem. In that illustration, costs were accumulated for one month. At the endof the month, the costs were divided by the total units produced to determinethe cost per unit. This accomplished one function of cost accounting: thedetermination of product costs—both total costs for the period and unitcost. However, another important objective of a cost accounting system—cost control—could not be satisfactorily achieved with this informationalone. For example, assume that in a subsequent month the cost of directlabor had risen from $20 to $22 per unit. Labor costs went up, but did theygo up because of a general rise in wages or because of worker inefficiency?Did labor costs increase throughout the manufacturing process or only fora particular department or job? Answers to such questions would not bereadily available using the procedures described in the earlier example.
To provide management with the data needed for effective cost control,two basic types of cost accounting systems have been developed: the processcost system and the job order cost system. Both systems are used to gathercost data and to allocate costs to goods manufactured. The selection of onemethod or the other depends on the type of manufacturing operation usedby a given company. To determine the appropriate method, manufacturingoperations are classified into two types: special order and continuous ormass production.
Special Order
In a job order cost system the output consists of special or custom-madeproducts; in other words, each product is made to order. Special-orderindustries include those manufacturing or producing ships, aircraft, custom-
Recall and Review 2
Classify each of the following items as direct materials (DM), direct labor
(DL), factory overhead (FO), or selling and administrative expense (SA):
Electricity used in heating a factory._______________
Automobile expense for customer service representatives.______________
Wages of a bricklayer employed by a home builder.___________________
Car batteries used by an automobile manufacturer.____________________
Supplies used to clean the factory floor.________________
Wages of a forklift operator in a plant that makes auto parts.___________
(After working this exercise, see page 39 for the solution.)
You should now be able to work the following:
Questions 22–28; Exercises 1-4 to 1-8; Problems 1-3 to 1-7; and Self-Study
Problem 1.
LO6Distinguish
between the
two basic types of cost
accounting systems.
28 Principles of Cost Accounting

built homes, machine tools, engines, structural steel, books and magazines,directories and catalogs, and specialty shops producing custom-made pro-ducts such as clothing, shoes, and hats.
A job order cost system provides a separate record for the cost ofeach special-order job, as illustrated by the block for ‘‘Job Cost Sheets’’ inFigure 1-12. Each job would have its costs tracked on a separate cost sheetor computer file. Job order cost accounting techniques are also used byfirms, such as accounting, architecture, and law, that provide a servicerather than a product. It is important for these firms to be able to track thevarious costs of serving different clients. For example, a law firm wouldexpend many more resources defending a client in a capital murder casethan it would in defending another client against petty theft charges.
Continuous or Mass Production
This type of operation produces a continuous output of homogeneousproducts. Such a factory may produce a single product, such as a ToyotaPrius automobile, or many different products, such as Pepsi, Diet Pepsi, andPepsi One soft drinks. The factory generally is departmentally organized.Continuous or mass production industries include those manufacturingautomobiles, tires, cement, chemicals, canned goods, lumber, paper, candy,foodstuffs, flour, glass, soap, toothpaste, chewing gum, petroleum products,textiles, plastics, paints, and firms engaged in such processes as rubbercompounding and vulcanizing. A process cost system accumulates costsfor each department or process in the factory as illustrated in Figure 1-13.
Process cost accounting is appropriate for manufacturing situations inwhich all units of the final product are substantially identical. Wicker Works
Figure 1-13 Flow of Costs in a Process Cost System
Work in ProcessDept. 1
Work in ProcessDept. 2
Finished Goods
DirectMaterials
DirectLabor
FactoryOverhead
DirectMaterials
DirectLabor
FactoryOverhead
Figure 1-12 Flow of Costs in a Job Order Cost System
Direct Materials
Direct Labor
Factory Overhead
Job Cost Sheets
Work in ProcessAccount
Finished Goods
Chapter 1 – Introduction to Cost Accounting 29

utilized a process cost system in the preceding example to account for its onlyproduct, a single style of table. Finished units are placed in stock and removedas needed to fill customer orders. There are no separate jobs presentingsubstantially different characteristics. Rather, the company (or a departmentwithin the company) produces large numbers of virtually identical items thatare sold (or transferred to other departments) as orders are received. Processcost accounting techniques also may be used by organizations that provide aservice such as for determining the cost of a particular type of MRI in ahospital’s radiology department or the cost per passenger-mile for anairline. Chapters 5 and 6 cover process cost accounting. Figure 1-14 showsexamples of the use of job order cost and process cost systems in service,merchandising, and manufacturing businesses.
Combination of Systems
Some companies use both a job order cost and a process cost system. Forexample, a company that manufactures equipment on specific order but alsoproduces, on a continuous basis, a number of small motors that are componentparts of many of the equipment orders, may benefit from combining thesystems. The costs of making these motors would be accumulated on a processcost basis, while the costs for each unique piece of equipment would begathered using job order costing. Similarly, although the cost of making a basicToyota Prius would be tracked using process costing, the optional equipmentadded to an individual Prius would be tracked using job order costing.
Standard Costing
The job order and process cost accounting systems are the principal systemsused by manufacturing organizations. However, as useful as they are inproviding cost data, these systems are still limited with regard to costcontrol. Although they make it possible to determine what a productactually costs, they provide no means to determine what the product shouldhave cost. A standard cost system, which is not a third system but may beused with either a job order or a process cost system, uses predeterminedstandard costs to furnish a measurement that helps management makedecisions regarding the efficiency of operations.
Standard costs are costs that would be incurred under efficient operat-ing conditions and are forecast before the manufacturing process begins.During operations, an organization compares the actual costs incurred with
Figure 1-14 Uses of Cost Systems
Cost System Service BusinessMerchandisingBusiness Manufacturing Business
Job Order Accounting firm, manage-ment consultant
Lumber company, perso-nal computer retailer
Custom home builder,printer
Process Hospital X-ray depart-ment, hotel housekeeping
Newspaper publishing,agricultural wholesaler
Soft drink bottler, Paperproducer
30 Principles of Cost Accounting

these predetermined standard costs. ‘‘Variances,’’ or differences, are thencalculated. These variances reveal which performances deviate from thestandard, and thus they provide a basis on which management can takeappropriate action to eliminate inefficient operating conditions. Standardcost accounting will be discussed in depth in Chapter 8.
Illustration of a Job Order Cost SystemWith a job order cost system, costs are accumulated by job (or lot). Oneadvantage of a job order cost system is that the accumulation of costs for aparticular job helps to determine its selling price. Or, if a job is done undercontract with a set price, the profit or loss on the job can be readilydetermined by comparing the cost with the contract price. At the sametime, costs that have been accumulated for a certain type of work will assistmanagement in preparing bids for similar jobs in the future.
To illustrate the use of a job order cost accounting system, assume thatWicker Works, Inc. is now manufacturing custom tables and chairs andthat it accepts two orders to manufacture certain items during the month ofFebruary. These special orders are as follows:
1. From Strictly Wicker: to manufacture 500 chairs to their specifications;contract price, $36,000. Job No. 101 is assigned to this order.
2. From Patio Providers: to manufacture 500 tables to their specifications;contract price, $59,300. Job No. 102 is assigned to this order.
After accepting these orders and planning the manufacturing requirementsas to materials, labor, and overhead, the cost accounting department sets upa job cost sheet for each job. A job cost sheet, also known as a job costrecord in an automated accounting system, records and accumulates all thecosts assigned to a specific job. Figure 1-15 illustrates this form for theStrictly Wicker order. All costs applicable to each job will be accumulatedon these forms. Note that Wicker Works has changed from process costingto job order costing now that it is making custom products for specificcustomers.
Transactions and journal entries for the month of February appear asfollows. To highlight job order cost accounting procedures, only thoseentries relating to the manufacture of goods will be illustrated. Routineentries, such as those for recording the purchase of materials, the incur-rence of selling and administrative expenses, or payments to creditors, willbe ignored. Those entries are made in the same way as previouslyillustrated, regardless of the cost system used.
1. Indirect materials with a cost of $5,250 are issued to the factory, anddirect materials are issued as follows:
Job 101 Job 102Rattan . . . . . . . . . . . . . . . . . . . . . . . . . . . . . . . . . . . . . . . . . . . . . . . . . . $ 8,200 $16,000
Binding Cane . . . . . . . . . . . . . . . . . . . . . . . . . . . . . . . . . . . . . . . . . . . 4,000 2,000
$12,200 $18,000
LO7llustrate a job
order cost
system.
Chapter 1 – Introduction to Cost Accounting 31

The entry at the end of the month to record the issues of materialsappears as:
Work in Process (Jobs 101 and 102) . . . . . . . . . . . . . . . . . . . . . . 30,200
Factory Overhead (Indirect Materials) . . . . . . . . . . . . . . . . . . . . 5,250
Materials . . . . . . . . . . . . . . . . . . . . . . . . . . . . . . . . . . . . . . . . . . . . . 35,450
Note that in the previous entry the $30,200 debit to Work in Processcomprises $12,200 of direct materials issued to Job 101 and $18,000 ofdirect materials issued to Job 102. There is only one general ledgerwork in process account, but the individual amounts of direct materialsissued to each job would appear on the respective job cost sheets in thesubsidiary job cost ledger.
If the indirect materials could be directly traced to a specific job, thecost could be charged to that job. However, it is often difficult and notcost effective to determine which job benefited from the use of varioussupplies such as glue, nails, and cleaning fluid. Thus, indirect materialscosts are usually charged to Factory Overhead and later distributedamong the various jobs in some equitable way.
2. Indirect labor costs of $4,360 and direct labor costs are incurred as follows:
Job 101 Job 102Direct Labor . . . . . . . . . . . . . . . . . . . . . . . . . . . . . . . . . . . . . . . . . . . . $6,000 $7,500
Figure 1-15 Job Cost Sheet
WICKER WORKS INC.Job Cost Sheet
Customer Name:
Address:
Quantity:
Product:
Description:
Job No:
Date Started:
Date Completed:
DIRECT MATERIALS DIRECT LABOR FACTORY OVERHEAD
Mat’l
Req.
No.
Date Amount Date Time
Tkt. No.Amount Date
Remarks:
Basis
AppliedAmount
Total
SUMMARY
Direct materials
Direct labor
Factory overhead
Total cost
Unit cost
Selling price
Mfg. cost
Gross profit
Strictly Wicker
5525 Skyway Dr.
Houston, TX 77057
500
CHAIRS
39" wicker
101
2/24/11
2/28/11
2/242/26
2/28
8,200 4,000
12,200
2,5001,5002,000
6,000
5,262
5,262
55056211
210128263902
2/252/272/28
40% oftotalover-head
$12,2006,0005,262
$23,462$ 46.92
$36,00023,462
$12,538
A
1
2
3
4
5
6
7
8
9
10
11
12
13
14
15
16
17
18
19
20
21
22
23
B C D E F G H I
32 Principles of Cost Accounting

The monthly entry to distribute these costs is recorded as follows:
Work in Process (Jobs 101 and 102) . . . . . . . . . . . . . . . . . . . . . . 13,500
Factory Overhead (Indirect Labor) . . . . . . . . . . . . . . . . . . . . . . . . 4,360
Payroll . . . . . . . . . . . . . . . . . . . . . . . . . . . . . . . . . . . . . . . . . . . . . . . 17,860
The debit of $13,500 to Work in Process comprises $6,000 of directlabor issued to Job 101 and $7,500 of direct labor issued to Job 102.The explanation for why indirect labor costs are charged to FactoryOverhead rather than to Work in Process is similar to the previousexplanation for indirect materials.
3. Monthly depreciation expense for the building, allocated according tothe square footage used by manufacturing (90%) and selling andadministrative (10%), is recorded as follows:Factory Overhead (Depreciation of Building) . . . . . . . . . . . . . . . . . . . . . 1,125
Selling and Administrative Expenses (Depreciation of Building) . . . 125
Accumulated Depreciation—Building . . . . . . . . . . . . . . . . . . . . . . . . . . 1,250
4. The entry to record monthly depreciation for machinery and equipment,all of which is used for manufacturing operations, is recorded as follows:
Factory Overhead (Depreciation of Machinery and Equipment) . . . . 1,250
Accumulated Depreciation—Machinery and Equipment . . . . . . . . . 1,250
5. The cost of utilities for the month of February is $1,300, again allocatedby building square footage, recorded as follows:
Factory Overhead (Utilities) . . . . . . . . . . . . . . . . . . . . . . . . . . . . . . . . . . . . . 1,170
Selling and Administrative Expenses (Utilities) . . . . . . . . . . . . . . . . . . . 130
Accounts Payable . . . . . . . . . . . . . . . . . . . . . . . . . . . . . . . . . . . . . . . . . . . . 1,300
6. Total charges to Factory Overhead for the month are shown as follows:
Indirect materials . . . . . . . . . . . . . . . . . . . . . . . . . . . . . . . . . . . . . . . . . . . . . . . . . . . . $ 5,250
Indirect labor . . . . . . . . . . . . . . . . . . . . . . . . . . . . . . . . . . . . . . . . . . . . . . . . . . . . . . . . 4,360
Depreciation of building . . . . . . . . . . . . . . . . . . . . . . . . . . . . . . . . . . . . . . . . . . . . . . 1,125
Depreciation of machinery and equipment . . . . . . . . . . . . . . . . . . . . . . . . . . . . 1,250
Utilities . . . . . . . . . . . . . . . . . . . . . . . . . . . . . . . . . . . . . . . . . . . . . . . . . . . . . . . . . . . . . . 1,170
Total . . . . . . . . . . . . . . . . . . . . . . . . . . . . . . . . . . . . . . . . . . . . . . . . . . . . . . . . . . . . . . . . $13,155
Assume that Jobs 101 and 102 are the only jobs worked on during theperiod and that factory overhead is allocated as follows: 60% to Job101, 40% to Job 102.
40% 60%
Total Factory Overhead Job 101 Job 102$13,155 $5,262 $7,893
The distribution of factory overhead would then be recorded as follows:
Work in Process (Jobs 101 and 102) . . . . . . . . . . . . . . . . . . . . . . . . . . . . . . 13,155
Factory Overhead . . . . . . . . . . . . . . . . . . . . . . . . . . . . . . . . . . . . . . . . . . . . 13,155
Chapter 1 – Introduction to Cost Accounting 33

The debit of $13,155 to Work in Process comprises $5,262 of overheadallocated to Job 101 and $7,893 of overhead charged to Job 102. At theend of the month, the work in process and factory overhead accountswould appear as follows:
Work in Process
1. Direct materials 30,200
2. Direct labor 13,500
6. Factory overhead 13,155
56,855
Factory Overhead
1. Indirect materials 5,250 6. Transfer to Work in Process 13,155
2. Indirect labor 4,360
3. Depreciation of building 1,125
4. Depreciation of mach. and equip. 1,250
5. Utilities 1,170
13,155
The costs shown in the work in process account represent monthlytotals (summary entries) for each element of manufacturing cost for bothjobs combined. These same costs are shown for each individual job in ajob cost ledger. It is a subsidiary ledger that has a record of each job.The details on the job cost sheets in the job cost ledger support thebalance of the work in process control account in the general ledger.
7. Assuming that both jobs were completed by the end of the month, thecosts of the completed jobs would be transferred to the finished goodsinventory control account:
Finished Goods . . . . . . . . . . . . . . . . . . . . . . . . . . . . . . . . . . . . . . . . . . . . . . . . . 56,855
Work in Process . . . . . . . . . . . . . . . . . . . . . . . . . . . . . . . . . . . . . . . . . . . . . . 56,855
8. When the goods are shipped and billed to the customers, the followingentries are made to record the sale and the cost of the jobs:
Accounts Receivable . . . . . . . . . . . . . . . . . . . . . . . . . . . . . . . . . . . . . . . . . . . . 95,300
Sales . . . . . . . . . . . . . . . . . . . . . . . . . . . . . . . . . . . . . . . . . . . . . . . . . . . . . . . . 95,300
Cost of Goods Sold . . . . . . . . . . . . . . . . . . . . . . . . . . . . . . . . . . . . . . . . . . . . . 56,855
Finished Goods . . . . . . . . . . . . . . . . . . . . . . . . . . . . . . . . . . . . . . . . . . . . . . . 56,855
The costs of producing the two jobs can be summarized as follows:
Job 101 (500 Chairs) Job 102 (500 Tables)
Total Cost Unit Cost Total Cost Unit CostDirect materials . . . . . . . . . . . $12,200 $24.40 $18,000 $36.00
Direct labor . . . . . . . . . . . . . . . 6,000 12.00 7, 500 15.50
Factory overhead . . . . . . . . . 5,262 10.52 7,893 15.79
Total . . . . . . . . . . . . . . . . . . . $23,462 $46.92 $33.393 $67.29
34 Principles of Cost Accounting

The gross profit realized on each job is determined as follows:
Job 101 (500 Chairs) Job 102 (500 Tables)
Total Per Unit Total Per UnitSelling price . . . . . . . . . . . . . . . . . $36,000 $72.00 $59,300 $118.60
Cost . . . . . . . . . . . . . . . . . . . . . . . . 23,462 46.92 33,393 67.29
Gross profit . . . . . . . . . . . . . . . . . $12,538 $25.08 $25,907 $ 51.31
The job cost sheets would reflect the previous information in moredetail, so that a short time after each job was completed, the gross profitcould be determined. In addition, if management bids on similar jobs in thefuture, an accurate record of all costs would be available to assist manage-ment in determining contract prices.
Work in Process in the Manufacturing StatementIf there is work in process at the beginning and at the end of the month, itwill be shown in the statement of cost of goods manufactured. To illustrate,assume that Wicker Works, Inc.’s statement for June is as follows:
1
2
3
4
5
6
7
8
9
10
11
12
13
14
15
16
17
18
19
20
21
22
23
24
25
26
27
Wicker Works, Inc.
Statement of Cost of Goods Manufactured
For the Month Ended June 30, 2011
Direct Materials:
Inventory, June 1 $15,000
Purchases 310,000
Total cost of available materials $325,000
Less inventory, June 30 25,000
Cost of materials used $300,000
Less indirect materials used 10,000
Cost of direct materials used in production $290,000
Direct labor 240,000
Factory overhead:
Indirect materials $10,000
Indirect labor 47,000
Depreciation of building 35,000
Depreciation of machinery and equipment 15,000
Utilities 23,000
Total factory overhead 130,000
Total manufacturing cost during the month $660,000
Add work in process inventory, June 1 85,000
$745,000
Less work in process inventory, June 30 125,000
Cost of goods manufactured during the month $620,000
A B C D E F G
In the above statement of cost of goods manufactured, the total manu-facturing cost of $660,000 represents the cost of direct materials, direct labor,and factory overhead used during the month of June. Wicker Works, Inc.,incurred costs of $85,000 during the previous month for goods that were not
Chapter 1 – Introduction to Cost Accounting 35

completed at the end of that month. The cost of these goods constitutesJune’s beginning work in process. The total of $745,000 represents manu-facturing cost that the company must account for. Work in Process at theend of June is $125,000, which represents the cost incurred to date foritems that were not finished at the end of June. Therefore, the cost of goodsmanufactured (completed) in June, some of which were started in produc-tion the previous month, is $620,000. The work in process ledger account,in T-account form, would appear as follows at the end of the month:
Work in Process
6/1 Balance 85,000 To Finished Goods 620,000
Direct materials 290,000
Direct labor 240,000
Factory overhead 130,000
745,000
125,000
Appendix
IMA Statement of Ethical Professional PracticeMembers of IMA shall behave ethically. A commitment to ethical profes-sional practice includes: overarching principles that express our values, andstandards that guide our conduct.
PRINCIPLES
IMA’s overarching ethical principles include: Honesty, Fairness, Objectiv-ity, and Responsibility. Members shall act in accordance with these
Recall and Review 3
The following information was taken from the books of Sunrise Manufactur-
ing after all postings had been completed at the end of July, its first month
of operations: direct materials cost, $7,200; direct labor cost, $8,000; factory
overhead, consisted of indirect materials of $1,800 and indirect labor of
$1,400. All jobs worked on during the month were completed and sold by
the end of the month. Prepare the journal entries to: (1) charge the July cost
of materials to work in process and factory overhead; (2) charge the July
cost of labor to work in process and factory overhead; (3) record the closing
of factory overhead to work in process; and (4) record the completion of all
jobs.
(After working this exercise, see page 40 for the solution.)
You should now be able to work the following:
Questions 29–34; Exercises 1-9 and 1-10; Problems 1-8 to 1-10; and Self-Study
Problem 2.
36 Principles of Cost Accounting

principles and shall encourage others within their organizations to adhereto them.
STANDARDS
A member’s failure to comply with the following standards may result indisciplinary action.
I. Competence
Each member has a responsibility to:
1. Maintain an appropriate level of professional expertise by continuallydeveloping knowledge and skills.
2. Perform professional duties in accordance with relevant laws, regula-tions, and technical standards.
3. Provide decision support information and recommendations that areaccurate, clear, concise, and timely.
4. Recognize and communicate professional limitations or other con-straints that would preclude responsible judgment or successful perfor-mance of an activity.
II. Confidentiality
Each member has a responsibility to:
1. Keep information confidential except when disclosure is authorized orlegally required.
2. Inform all relevant parties regarding appropriate use of confidentialinformation. Monitor subordinates’ activities to ensure compliance.
3. Refrain from using confidential information for unethical or illegaladvantage.
III. Integrity
Each member has a responsibility to:
1. Mitigate actual conflicts of interest. Regularly communicate with busi-ness associates to avoid apparent conflicts of interest. Advise all partiesof any potential conflicts.
2. Refrain from engaging in any conduct that would prejudice carryingout duties ethically.
3. Abstain from engaging in or supporting any activity that might discreditthe profession.
IV. Credibility
Each member has a responsibility to:
1. Communicate information fairly and objectively.
2. Disclose all relevant information that could reasonably be expected toinfluence an intended user’s understanding of the reports, analyses, orrecommendations.
Chapter 1 – Introduction to Cost Accounting 37

3. Disclose delays or deficiencies in information, timeliness, processing, orinternal controls in conformance with organization policy and/orapplicable law.
RESOLUTION OF ETHICAL CONFLICT
In applying the Standards of Ethical Professional Practice, you mayencounter problems identifying unethical behavior or resolving an ethicalconflict. When faced with ethical issues, you should follow your organiza-tion’s established policies on the resolution of such conflict. If these policiesdo not resolve the ethical conflict, you should consider the followingcourses of action:
1. Discuss the issue with your immediate supervisor except when itappears that the supervisor is involved. In that case, present the issue tothe next level. If you cannot achieve a satisfactory resolution, submit theissue to the next management level. If your immediate superior is thechief executive officer or equivalent, the acceptable reviewing authoritymay be a group such as the audit committee, executive committee,board of directors, board of trustees, or owners. Contact with levelsabove the immediate superior should be initiated only with your super-ior’s knowledge, assuming he or she is not involved. Communication ofsuch problems to authorities or individuals not employed or engaged bythe organization is not considered appropriate, unless you believe thereis a clear violation of the law.
2. Clarify relevant ethical issues by initiating a confidential discussion withan IMA Ethics Counselor or other impartial advisor to obtain a betterunderstanding of possible courses of action.
3. Consult your own attorney as to legal obligations and rights concerningthe ethical conflict.
Source: Institute of Management Accountants, ‘‘IMA’s Statement of Ethical Professional Practice,’’www.imanet.org.
KEY TERMS
Accounting information systems, 2
Budget, 6
Control, 5
Conversion cost, 17
Corporate governance, 9
Cost accounting systems, 2
Cost accounting, 2
Cost and production reports, 6
Cost center, 5
Direct labor, 16
Direct materials, 15
Factory overhead, 16
Financial accounting, 10
Finished goods, 13
For-profit service businesses, 2
Indirect labor, 16
Indirect materials, 16
ISO 9000 family, 3
Job cost ledger, 34
Job cost sheet, 31
Job order cost system, 28
Loss leader, 5
38 Principles of Cost Accounting

Management accounting, 10
Manufacturers, 2
Manufacturing or production costs, 15
Manufacturing process, 3
Mark-on percentage, 22
Materials, 13
Merchandisers, 2
Not-for-profit service agencies, 2
Performance report, 6
Periodic inventory system, 14
Perpetual inventory system, 13
Planning, 5
Prime cost, 16
Process cost system, 29
Purchases, 12
Responsibility accounting, 5
Retailers, 2
Standard cost system, 30
Standard costs, 30
Unit costs, 4
Variance, 6
Wholesalers, 2
Work in process, 13
ANSWERS TO RECALL AND REVIEW EXERCISES
R&R 1
Finished goods inventory 3/1 $ 45,000
Cost of goods manufactured 228,000
Finished goods available for sale $ 273,000
Finished goods inventory 3/31 53,000
Cost of goods sold $ 220,000
R&R 2
ItemDirectMaterials Direct Labor
FactoryOverhead
Selling andAdministrative
Electricity used in
heating factory
X
Automobile expense
for customer service
reps.
X
Wages of a bricklayer
employed by a home
builder
X
Car batteries used by
an automobile
manufacturer
X
Supplies used to
clean the factory floor
X
Wages of a forklift
operator in a plant
that makes auto parts
X
Chapter 1 – Introduction to Cost Accounting 39

SELF-STUDY PROBLEM 1
Basic Cost System; Journal Entries; FinancialStatements
Lone Star Manufacturing Co.
The post-closing trial balance of Lone Star Manufacturing Co. at Septem-
ber 30 is reproduced as follows.
Lone Star Manufacturing Co.Post-Closing Trial Balance
September 30, 2011
Cash . . . . . . . . . . . . . . . . . . . . . . . . . . . . . . . . . . . . . . . . . . . . . . . . . . . . . . . . . . . . 15,000
Accounts Receivable . . . . . . . . . . . . . . . . . . . . . . . . . . . . . . . . . . . . . . . . . . . . . 18,000
Finished Goods . . . . . . . . . . . . . . . . . . . . . . . . . . . . . . . . . . . . . . . . . . . . . . . . . . 25,000
Work in Process . . . . . . . . . . . . . . . . . . . . . . . . . . . . . . . . . . . . . . . . . . . . . . . . . 4,000
Materials . . . . . . . . . . . . . . . . . . . . . . . . . . . . . . . . . . . . . . . . . . . . . . . . . . . . . . . . 8,000
Building . . . . . . . . . . . . . . . . . . . . . . . . . . . . . . . . . . . . . . . . . . . . . . . . . . . . . . . . . 156,000
Accumulated Depreciation—Building . . . . . . . . . . . . . . . . . . . . . . . . . . . . . 23,400
Factory Equipment . . . . . . . . . . . . . . . . . . . . . . . . . . . . . . . . . . . . . . . . . . . . . . . 108,000
Accumulated Depreciation—Factory Equipment . . . . . . . . . . . . . . . . . . . 54,000
Office Equipment . . . . . . . . . . . . . . . . . . . . . . . . . . . . . . . . . . . . . . . . . . . . . . . . 12,000
Accumulated Depreciation—Office Equipment . . . . . . . . . . . . . . . . . . . . . 2,000
Accounts Payable . . . . . . . . . . . . . . . . . . . . . . . . . . . . . . . . . . . . . . . . . . . . . . . . 30,000
Capital Stock . . . . . . . . . . . . . . . . . . . . . . . . . . . . . . . . . . . . . . . . . . . . . . . . . . . . 175,000
Retained Earnings . . . . . . . . . . . . . . . . . . . . . . . . . . . . . . . . . . . . . . . . . . . . . . . 8 61,600
346,000 346,000
R&R 3
Work in Process 7,200
Factory Overhead 1,800
Materials 9,000
Work in Process 8,000
Factory Overhead 1,400
Payroll 9,400
Work in Process 3,200
Factory
Overhead
3,200
Finished Goods 18,400
Work in Process 18,400
40 Principles of Cost Accounting

During the month of October, the following transactions took place:
a. Raw materials at a cost of $50,000 and general factory supplies costing
$8,000 were purchased on account. (Materials and supplies are recorded
in the materials account.)
b. Raw materials to be used in production costing $41,000 and miscella-
neous factory supplies costing $5,500 were issued.
c. Wages and salaries incurred and paid for the month were as follows:
factory wages (including $2,500 indirect labor), $34,000, and selling
and administrative salaries, $5,000. (Ignore payroll withholdings and
deductions.)
d. Distributed the payroll in (c).
e. Depreciation was recorded for the month at an annual rate of 5% on
the building and 20% on the factory equipment and office equipment.
The sales and administrative staff uses approximately one-fifth of the
building for its offices.
f. During the month, various other expenses totaling $5,200 were in-
curred on account. The company has determined that one-fourth of
this amount is allocable to the office function.
g. Total factory overhead costs were transferred to Work in Process.
h. During the month, goods with a total cost of $79,000 were completed
and transferred to the finished goods storeroom.
i. Sales for the month totaled $128,000 for goods costing $87,000 to
manufacture. (Assume that all sales were made on account.)
j. Accounts receivable in the amount of $105,000 were collected.
k. Accounts payable totaling $55,000 were paid.
Required:
1. Prepare journal entries to record the transactions.
2. Set up T-accounts for all accounts listed in the September 30, 2011,
Post-Closing Trial Balance and for Cost of Goods Sold, Factory Over-
head, Selling and Administrative Expenses, Sales, and Wages Pay-
able. Post the beginning trial balance and the journal entries prepared
in Part 1 to the accounts and calculate the balances in the accounts on
October 31.
3. Prepare a statement of cost of goods manufactured, an income state-
ment, and a balance sheet.
SOLUTION TO SELF-STUDY PROBLEM
Suggestions:
Read the entire problem thoroughly, keeping in mind what you are required
to do:
1. Journalize the transactions.
2. Post the beginning trial balance and the journal entries to the
T-accounts that you set up and calculate the ending balance for each
account.
3. Using the ending account balances, prepare a cost of goods manufac-
tured statement, an income statement, and a balance sheet.
Chapter 1 – Introduction to Cost Accounting 41

The Specifics in the Problem Highlight the Following Facts:
1. The company is a manufacturer; therefore, three inventory accounts,
Materials, Work in Process, and Finished Goods, will be used.
2. A temporary account, Factory Overhead, will be used to record all
of the indirect materials, indirect labor, and other manufacturing
expenses for the period.
Preparing the Journal Entries:
a. and b. Note that there is only one inventory account for materials,
which includes the cost of both direct and indirect materials. When the
materials are issued into production, the direct materials are charged
to Work in Process and the indirect materials are charged to Factory
Overhead.
a. Materials . . . . . . . . . . . . . . . . . . . . . . . . . . . . . . . . . . . . . . . . . . . . . . . . . . . . 58,000
Accounts Payable . . . . . . . . . . . . . . . . . . . . . . . . . . . . . . . . . . . . . . . . . . 58,000
b. Work in Process . . . . . . . . . . . . . . . . . . . . . . . . . . . . . . . . . . . . . . . . . . . . . . 41,000
Factory Overhead (Indirect Materials) . . . . . . . . . . . . . . . . . . . . . . . . . . 5,500
Materials . . . . . . . . . . . . . . . . . . . . . . . . . . . . . . . . . . . . . . . . . . . . . . . . . . 46,500
c. The entries to record the payroll and the payments to employees use
the payroll and wages payable accounts.
Payroll . . . . . . . . . . . . . . . . . . . . . . . . . . . . . . . . . . . . . . . . . . . . . . . . . . . . . . . . . 39,000
Wages Payable . . . . . . . . . . . . . . . . . . . . . . . . . . . . . . . . . . . . . . . . . . . . . . . 39,000
Wages Payable . . . . . . . . . . . . . . . . . . . . . . . . . . . . . . . . . . . . . . . . . . . . . . . . . 39,000
Cash . . . . . . . . . . . . . . . . . . . . . . . . . . . . . . . . . . . . . . . . . . . . . . . . . . . . . . . . . 39,000
d. The entry to distribute the payroll requires the use of the work in
process account for the wages of employees who work directly on the
product, the factory overhead account for the wages of employees
who work in the factory but not directly on the product, and the selling
and administrative expenses account for the wages of salespeople and
administrative personnel.
Work in Process . . . . . . . . . . . . . . . . . . . . . . . . . . . . . . . . . . . . . . . . . . . . . . . . 31,500
Factory Overhead (Indirect Labor) . . . . . . . . . . . . . . . . . . . . . . . . . . . . . . . 2,500
Selling and Administrative Expenses (Salaries) . . . . . . . . . . . . . . . . . . . 5,000
Payroll . . . . . . . . . . . . . . . . . . . . . . . . . . . . . . . . . . . . . . . . . . . . . . . . . . . . . . . 39,000
e., f., and g. The depreciation on the building and equipment and the
other expenses are divided between Factory Overhead and Selling and
Administrative Expenses, depending on the portion of the expense
that relates to the factory and the portion that relates to the selling and
administrative function. The balance in the factory overhead account
at the end of the month is transferred to Work in Process.
e. Factory Overhead (Depreciation of Building) . . . . . . . . . . . . . . . . . . . . . 520
Factory Overhead (Depreciation of Factory Equipment) . . . . . . . . . . . 1,800
Selling and Administrative Expenses (Depreciation of Building) . . . 130
42 Principles of Cost Accounting

Selling and Administrative Expenses (Depreciation of OfficeEquipment) . . . . . . . . . . . . . . . . . . . . . . . . . . . . . . . . . . . . . . . . . . . . . . . . . . 200
Accumulated Depreciation—Building . . . . . . . . . . . . . . . . . . . . . . . . . 650
Accumulated Depreciation—Factory Equipment . . . . . . . . . . . . . . . 1,800
Accumulated Depreciation—Office Equipment . . . . . . . . . . . . . . . . . 200
f. Factory Overhead (Miscellaneous) . . . . . . . . . . . . . . . . . . . . . . . . . . . . . . 3,900
Selling and Administrative Expenses (Miscellaneous) . . . . . . . . . . . . 1,300
Accounts Payable . . . . . . . . . . . . . . . . . . . . . . . . . . . . . . . . . . . . . . . . . . . . 5,200
g. Work in Process . . . . . . . . . . . . . . . . . . . . . . . . . . . . . . . . . . . . . . . . . . . . . . . . 14,220
Factory Overhead . . . . . . . . . . . . . . . . . . . . . . . . . . . . . . . . . . . . . . . . . . . . 14,220
h., i., j., and k. When goods are completed, the cost of the goods is taken
out of Work in Process and recorded in Finished Goods. When the
completed goods are sold, the cost of these goods is removed from
the finished goods inventory account and recorded in the cost of
goods sold expense account, the receivable and revenue are recorded
for the amount of the sale, and accounts payable are paid.
h. Finished Goods . . . . . . . . . . . . . . . . . . . . . . . . . . . . . . . . . . . . . . . . . . . . . . . . 79,000
Work in Process . . . . . . . . . . . . . . . . . . . . . . . . . . . . . . . . . . . . . . . . . . . . . . 79,000
i. Accounts Receivable . . . . . . . . . . . . . . . . . . . . . . . . . . . . . . . . . . . . . . . . . . . 128,000
Sales . . . . . . . . . . . . . . . . . . . . . . . . . . . . . . . . . . . . . . . . . . . . . . . . . . . . . . . . 128,000
Cost of Goods Sold . . . . . . . . . . . . . . . . . . . . . . . . . . . . . . . . . . . . . . . . . . . . . 87,000
Finished Goods . . . . . . . . . . . . . . . . . . . . . . . . . . . . . . . . . . . . . . . . . . . . . . 87,000
j. Cash . . . . . . . . . . . . . . . . . . . . . . . . . . . . . . . . . . . . . . . . . . . . . . . . . . . . . . . . . . 105,000
Accounts Receivable . . . . . . . . . . . . . . . . . . . . . . . . . . . . . . . . . . . . . . . . . 105,000
k. Accounts Payable . . . . . . . . . . . . . . . . . . . . . . . . . . . . . . . . . . . . . . . . . . . . . . 55,000
Cash . . . . . . . . . . . . . . . . . . . . . . . . . . . . . . . . . . . . . . . . . . . . . . . . . . . . . . . . 55,000
Posting the Beginning Trial Balance and the Journal Entries
to the T-Accounts:
Cash Accounts Receivable
9/30 15,000 c. 39,000 9/30 18,000 j. 105,000
j. 105,000 k. 55,000 i. 128,000
120,000 146,000
26,000 41,000
Finished Goods Work in Process
9/30 25,000 i. 87,000 9/30 4,000 h. 79,000
h. 79,000 b. 41,000
104,000 d. 31,500
17,000 g. 14,220
90,720
11,720
Chapter 1 – Introduction to Cost Accounting 43

Materials Building
9/30 8,000 b. 46,500 9/30 156,000
a. 58,000
66,000
19,500
Accumulated Depreciation—Building Factory Equipment
9/30 23,400 9/30 108,000
e. 650
24,050
Accumulated Depreciation—FactoryEquipment Office Equipment
9/30 54,000 9/30 12,000
e. 1,800
55,800
Accumulated Depreciation—OfficeEquipment Accounts Payable
9/30 2,000 k. 55,000 9/30 30,000
e. 200 a. 58,000
2,200 f. 5,200
93,200
38,200
Wages Payable
c. 39,000 c. 39,000
Capital Stock Retained Earnings
9/30 175,000 9/30 61,600
Sales Cost of Goods Sold
i. 128,000 i. 87,000
Payroll
c. 39,000 d. 39,000
44 Principles of Cost Accounting

Factory Overhead Selling and Administrative Expenses
b. 5,500 g. 14,220 d. 5,000
d. 2,500 e. 130
e. 520 e. 200
e. 1,800 f. 1,300
f. 3,900 6,630
14,220
Preparing a Statement of Cost of Goods Manufactured, an
Income Statement, and a Balance Sheet:
The total manufacturing cost of $86,720 represents the cost of direct
materials, direct labor, and factory overhead incurred during the month of
October. Note that the cost of the indirect materials is subtracted in
calculating the cost of direct materials used in production because it is
included as a separate item under factory overhead. To determine the cost
of goods manufactured for October, which really means the cost of the
goods completed for the month, you have to add the cost of the beginning
work in process inventory, $4,000, and subtract the cost of the ending
work in process inventory, $11,720, from the total manufacturing cost for
October:
Lone Star Manufacturing Co.Statement of Cost of Goods Manufactured
For the Month Ended October 31, 2011
Direct materials:
Inventory, October 1 . . . . . . . . . . . . . . . . . . . . . . . . . . . . . . . . . . . $ 8,000
Purchases . . . . . . . . . . . . . . . . . . . . . . . . . . . . . . . . . . . . . . . . . . . . . 58,000
Total cost of available materials . . . . . . . . . . . . . . . . . . . . . . . . . $66,000
Less inventory, October 31 . . . . . . . . . . . . . . . . . . . . . . . . . . . 19,500
Cost of materials used . . . . . . . . . . . . . . . . . . . . . . . . . . . . . . . . . . . . $46,500
Less indirect materials used . . . . . . . . . . . . . . . . . . . . . . . . . . . . 5,500
Cost of direct materials used in production . . . . . . . . . . . . . . $41,000
Direct labor . . . . . . . . . . . . . . . . . . . . . . . . . . . . . . . . . . . . . . . . . . . . . . 31,500
Factory overhead:
Indirect materials . . . . . . . . . . . . . . . . . . . . . . . . . . . . . . . . . . . . . . $ 5,500
Indirect labor . . . . . . . . . . . . . . . . . . . . . . . . . . . . . . . . . . . . . . . . . . 2,500
Depreciation of building . . . . . . . . . . . . . . . . . . . . . . . . . . . . . . . . 520
Depreciation of factory equipment . . . . . . . . . . . . . . . . . . . . . . 1,800
Miscellaneous expenses . . . . . . . . . . . . . . . . . . . . . . . . . . . . . . . . 3,900
Total factory overhead . . . . . . . . . . . . . . . . . . . . . . . . . . . . . . . . . 14,220
Total manufacturing cost during October . . . . . . . . . . . . . . . . . . $86,720
Add work in process inventory, October 1 . . . . . . . . . . . . . . . 4,000
$90,720
Less work in process inventory, October 31 . . . . . . . . . . . . . . 11,720
Cost of goods manufactured . . . . . . . . . . . . . . . . . . . . . . . . . . . . . . $79,000
Chapter 1 – Introduction to Cost Accounting 45

In preparing an income statement for a manufacturer, remember that the
beginning finished goods inventory for the month must be added to the
cost of goods manufactured to obtain the cost of goods available for sale.
Then the ending finished goods inventory must be subtracted to obtain
the cost of goods sold:
Lone Star Manufacturing Co.Income Statement
For the Month Ended October 31, 2011
Net sales . . . . . . . . . . . . . . . . . . . . . . . . . . . . . . . . . . . . . . . . . . . . . . . . $128,000
Cost of goods sold:
Finished goods inventory, October 1 . . . . . . . . . . . . . . . . . . . . $ 25,000
Add cost of goods manufactured . . . . . . . . . . . . . . . . . . . . . . . . 79,000
Goods available for sale . . . . . . . . . . . . . . . . . . . . . . . . . . . . . . . . $104,000
Less finished goods inventory, October 31 . . . . . . . . . . . . . . . 17,000 87,000
Gross profit on sales . . . . . . . . . . . . . . . . . . . . . . . . . . . . . . . . . . . . . $ 41,000
Selling and administrative expenses:
Selling and administrative salaries . . . . . . . . . . . . . . . . . . . . . . $ 5,000
Depreciation of building . . . . . . . . . . . . . . . . . . . . . . . . . . . . . . . . 130
Depreciation of office equipment . . . . . . . . . . . . . . . . . . . . . . . . 200
Miscellaneous . . . . . . . . . . . . . . . . . . . . . . . . . . . . . . . . . . . . . . . . . 1,300 6,630
Net income . . . . . . . . . . . . . . . . . . . . . . . . . . . . . . . . . . . . . . . . . . . . . . $ 34,370
In preparing a balance sheet for a manufacturer, note that there are three
separate inventory accounts, rather than the single inventory account
used by a merchandiser:
Lone Star Manufacturing Co.Balance Sheet
October 31, 2011Assets
Current assets:
Cash . . . . . . . . . . . . . . . . . . . . . . . . . . . . . . . . . . . . . . . $ 26,000
Accounts receivable . . . . . . . . . . . . . . . . . . . . . . . . 41,000
Inventories:
Finished goods . . . . . . . . . . . . . . . . . . . . . . . . . . . $ 17,000
Work in process . . . . . . . . . . . . . . . . . . . . . . . . . . 11,720
Materials . . . . . . . . . . . . . . . . . . . . . . . . . . . . . . . . 19,500 48,220
Total current assets . . . . . . . . . . . . . . . . . . . . . . . . . $115,220
Plant and equipment:
Building . . . . . . . . . . . . . . . . . . . . . . . . . . . . . . . . . . . $156,000
Less accumulated depreciation . . . . . . . . . . . . 24,050 $131,950
Factory equipment . . . . . . . . . . . . . . . . . . . . . . . . . $108,000
Less accumulated depreciation . . . . . . . . . . . . 55,800 52,200
Office equipment . . . . . . . . . . . . . . . . . . . . . . . . . . . $ 12,000
Less accumulated depreciation . . . . . . . . . . . . 2,200 9,800
Total plant and equipment . . . . . . . . . . . . . . . . . . 193,950
Total assets . . . . . . . . . . . . . . . . . . . . . . . . . . . . . . . . . . $309,170
46 Principles of Cost Accounting

Liabilities and Stockholders’ EquityCurrent liabilities:
Accounts payable . . . . . . . . . . . . . . . . . . . . . . . . . . . . . . . . . . . . . . . . . . $ 38,200
Stockholders’ equity:
Capital stock . . . . . . . . . . . . . . . . . . . . . . . . . . . . . . . . . . . . . . . . . . . . . . . $175,000
Retained earnings* . . . . . . . . . . . . . . . . . . . . . . . . . . . . . . . . . . . . . . . . 95,970
Total stockholders’ equity . . . . . . . . . . . . . . . . . . . . . . . . . . . . . . . . . . 270,970
Total liabilities and stockholders’ equity . . . . . . . . . . . . . . . . . . . . . . . $309,170
*$61,600 (bal. on 9/30) þ $34,370 (Net income for Oct.) ¼ $95,970
SELF-STUDY PROBLEM 2
Job Cost; Journal Entries; Inventory Analysis;Manufacturing StatementMesa Manufacturing Co. manufactures engines that are made only on
customers’ orders and to their specifications. During January, the com-
pany worked on Jobs 2525, 2526, 2527, and 2528. The following figures
summarize the cost records for the month:
Job 2525(200 units)
Job 2526(120 units)
Job 2527(50 units)
Job 2528(200 units)
Direct materials put into process:
July 2 . . . . . . . . . . . . . . . . . . . . . . . . . . . $ 30,000 $10,000 8 8
18 . . . . . . . . . . . . . . . . . . . . . . . . . . . 40,000 32,000 $10,000 8
22 . . . . . . . . . . . . . . . . . . . . . . . . . . . 30,000 2,000 20,000 $12,000
28 . . . . . . . . . . . . . . . . . . . . . . . . . . . 8 8 7,000 4,000
Direct labor cost (week ending):
July 2 . . . . . . . . . . . . . . . . . . . . . . . . . . . $ 2,000 $ 2,000 8 8
9 . . . . . . . . . . . . . . . . . . . . . . . . . . . 54,000 18,000 8 8
16 . . . . . . . . . . . . . . . . . . . . . . . . . . . 64,000 54,000 8 8
23 . . . . . . . . . . . . . . . . . . . . . . . . . . . 40,000 6,000 $10,000 $ 1,000
30 . . . . . . . . . . . . . . . . . . . . . . . . . . . 8 8 36,000 23,000
Factory overhead . . . . . . . . . . . . . . . . $120,000 $64,000 $35,000 $21,000
Engines completed . . . . . . . . . . . . . . 100 60 25 8
Jobs 2525 and 2526 have been completed and delivered to the customers
at a total selling price of $852,000, on account. Job 2527 is finished but has
not yet been delivered. Job 2528 is still in process. There was no work in
process at the beginning of the month.
Required:
1. Prepare the summary journal entries for the month to record the
distribution of materials, labor, and overhead costs.
Chapter 1 – Introduction to Cost Accounting 47

2. Prepare a summary showing the total cost of each job completed
during the month or in process at the end of the month. Also,
determine the cost of the inventories of completed engines and
engines in process at the end of the month.
3. Prepare the journal entries to record the completion of the jobs and
the sale of the jobs.
4. Prepare a statement of cost of goods manufactured.
SOLUTION TO SELF-STUDY PROBLEM
Read the entire problem thoroughly, keeping in mind what you are required
to do:
1. Prepare the summary journal entries to record the distribution of
materials, labor, and overhead costs.
2. Prepare a summary that shows the total cost of each job and then
determine the cost of the end-of-month finished goods and work in
process inventories.
3. Journalize the cost and sales price of the completed jobs.
4. Prepare a statement of cost of goods manufactured for the month of
January.
The Specifics in the Problem Highlight the following Facts:
1. The company is a manufacturer; therefore, three inventory accounts,
Materials, Work in Process, and Finished Goods, will be used.
2. Four jobs were in process during the month: three of which were
finished (Jobs 2525, 2526, and 2527); two of which were sold (Jobs
2525 and 2526); and one of which was still in process at the end of the
month (Job 2528).
1. Preparing the Journal Entries:
The cost of direct materials issued to production increases the inven-
tory account, work in process, and decreases the inventory account,
materials:
Work in Process . . . . . . . . . . . . . . . . . . . . . . . . . . . . . . . . . . . . . . . . . . . . . . 197,000
Materials . . . . . . . . . . . . . . . . . . . . . . . . . . . . . . . . . . . . . . . . . . . . . . . . . . 197,000
The cost of direct labor worked during the period also increases the
inventory account, work in process:
Work in Process . . . . . . . . . . . . . . . . . . . . . . . . . . . . . . . . . . . . . . . . . . . . . . . . . 310,000
Payroll . . . . . . . . . . . . . . . . . . . . . . . . . . . . . . . . . . . . . . . . . . . . . . . . . . . . . . . . 310,000
The cost of factory overhead incurred during the period is allocated to
the various jobs and summarized in work in process:
Work in Process . . . . . . . . . . . . . . . . . . . . . . . . . . . . . . . . . . . . . . . . . . . . . . 240,000
Factory Overhead. . . . . . . . . . . . . . . . . . . . . . . . . . . . . . . . . . . . . . . . . . . 240,000
48 Principles of Cost Accounting

2. Prepare a Summary Showing the Total Cost of each Job
Job
DirectMaterials
Cost
DirectLaborCost
FactoryOverhead
TotalProduction
Cost2525 $100,000 $160,000 $120,000 $380,000
2526 44,000 80,000 64,000 188,000
2527 37,000 46,000 35,000 118,000
2528 16,000 24,000 21,000 61,000
Total $197,000 $310,000 $240,000 $747,000
The cost of direct materials issued to production increase the inventory
account, work in process, and decreases the inventory account, materials:
Determine the Cost of The Ending Finished Goods and Work in Process
Inventories
Job 2527 was completed but not sold by the end of the month:
Finished Goods Inventory (Job 2527) . . . . . . . . . . . . . . . . . . . . . . . . . . . . $118,000
Job 2528 was the only job that was still in process at the end of the month:
Work in Process Inventory
(Job 2528) . . . . . . . . . . . . . . . . . . . . . . . . . . . . . . . . . . . . . . . . . . . . . . . . . . . . . . . $ 61,000
3. Journalize the Cost of Jobs Finished and the Cost and Sales Price of
Jobs Sold
Finished Goods . . . . . . . . . . . . . . . . . . . . . . . . . . . . . . . . . . . . . . . . . . . . . . . . . . 686,000
Work in Process (Jobs 2525, 2526, 2527) . . . . . . . . . . . . . . . . . . . . . . . . 686,000
Accounts Receivable . . . . . . . . . . . . . . . . . . . . . . . . . . . . . . . . . . . . . . . . . . . . . 852,000
Sales (Jobs 2525 and 2526) . . . . . . . . . . . . . . . . . . . . . . . . . . . . . . . . . . . . . 852,000
Cost of Goods Sold (Jobs 2525 and 2526) . . . . . . . . . . . . . . . . . . . . . . . . . . 568,000
Finished Goods . . . . . . . . . . . . . . . . . . . . . . . . . . . . . . . . . . . . . . . . . . . . . . . . 568,000
4. Preparing a Statement of Cost of Goods Manufactured
The total manufacturing cost of $747,000 represents the cost of direct
materials, direct labor, and factory overhead incurred during the month of
January. To determine the cost of goods manufactured for January, which
really means the cost of the goods completed for the month, you have to
subtract the cost of the ending work in process inventory of $61,000. (There
was no beginning work in process inventory.)
Mesa Manufacturing Co.Statement of Cost of Goods Manufactured
For the Month Ended January 31, 2011
Direct materials used . . . . . . . . . . . . . . . . . . . . . . . . . . . . . . . . . . . . . . . . . . . . . $197,000
Direct labor . . . . . . . . . . . . . . . . . . . . . . . . . . . . . . . . . . . . . . . . . . . . . . . . . . . . . . 310,000
Factory overhead . . . . . . . . . . . . . . . . . . . . . . . . . . . . . . . . . . . . . . . . . . . . . . . . 240,000
Total manufacturing cost . . . . . . . . . . . . . . . . . . . . . . . . . . . . . . . . . . . . . . . . . $747,000
Less work in process inventory, January 31 . . . . . . . . . . . . . . . . . . . . . . . . 61,000
Cost of goods manufactured . . . . . . . . . . . . . . . . . . . . . . . . . . . . . . . . . . . . . . $686,000
Chapter 1 – Introduction to Cost Accounting 49

QUESTIONS
1. How does the cost accounting function
assist in the management of a business?
2. What is ISO 9000, and why is it an impor-
tant designation for competing globally?
3. How do the activities of manufacturers,
merchandisers, and service businesses
differ?
4. In what ways does a typical manufacturing
business differ from a merchandising con-
cern? In what ways are they similar?
5. How is cost accounting information used
by management?
6. Why is unit cost information important to
management?
7. For a manufacturer, what does the plan-
ning process involve, and how is cost
accounting information used in planning?
8. How is effective control achieved in a man-
ufacturing concern?
9. Define ‘‘responsibility accounting.’’
10. What criteria must be met for a unit of
activity within the factory to qualify as a
cost center?
11. What are the requirements for becoming a
Certified Management Accountant?
12. What are the four major categories of ethi-
cal conduct that must be adhered to by
CMAs? (Appendix)
13. What actions should a CMA take when the
established policies of the organization do
not resolve an ethical conflict? (Appendix)
14. Define the term corporate governance and
explain why good corporate governance is
important to shareholders and other corpo-
rate stakeholders.
15. What circumstances created the need for
the Sarbanes-Oxley Act, and how are CEOs
and CFOs affected by it?
16. Name five key elements of the Sarbanes-
Oxley Act.
17. How is cost accounting related to: financial
accounting?; managerial accounting?
18. How does the computation of cost of
goods sold for a manufacturer differ from
that of a merchandiser?
19. How would you describe the following
accounts—Finished Goods, Work in Pro-
cess, and Materials?
20. Compare the manufacturing, merchan-
dising, and service sectors. How do they
differ as to the kinds of businesses in each
category, the nature of their output, and
type of inventory, if any?
21. What is the difference between a perpetual
inventory system and a periodic inventory
system?
22. What are the basic elements of production
cost?
23. How would you define the following costs:
direct materials, indirect materials, direct
labor, indirect labor, and factory overhead?
24. Distinguish prime cost from conversion
cost. Does prime cost plus conversion cost
equal the total manufacturing cost?
25. In what way does the accounting treatment
of factory overhead differ from that of
direct materials and direct labor costs?
26. How do ‘‘cost of goods sold’’ and ‘‘cost
of goods manufactured’’ differ for a
manufacturer?
27. How are nonfactory costs and costs that
benefit both factory and nonfactory opera-
tions accounted for?
28. What is a mark-on percentage?
29. When is job order costing appropriate, and
what types of businesses use it?
50 Principles of Cost Accounting

30. When is process costing appropriate, and
what types of businesses use it?
31. What are the advantages of accumulating
costs by departments or jobs rather than
for the factory as a whole?
32. What is a job cost sheet, and why is it
useful?
33. What are standard costs, and what is the
purpose of a standard cost system?
34. If the factory operations and selling and
administrative offices are housed in the
same building, what would be a good cost
allocation basis to use in dividing the de-
preciation expense between the two areas?
Why would it be important to make this
allocation?
EXERCISES
E1-1 Performance reportStudy the performance report for Leonardo’s Italian Cafe in
Figure 1-2 of the chapter and write a brief explanation of the
strengths and weaknesses of September and year-to-date
operations.
E1-2 Cost of goods sold—merchandiserThe following data were taken from the general ledger of Thorn-
ton Merchandisers on January 31, the end of the first month of
operations in the current fiscal year:
Merchandise inventory, January 1 . . . . . . . . . . . . . . . . . . . . . . . . . . . . . . . . . . $ 22,000
Purchases . . . . . . . . . . . . . . . . . . . . . . . . . . . . . . . . . . . . . . . . . . . . . . . . . . . . . . . . . 183,000
Merchandise inventory, January 31 . . . . . . . . . . . . . . . . . . . . . . . . . . . . . . . . . 17,000
Compute the cost of goods sold for the month of January.
E1-3 Cost of goods sold—manufacturerThe following data were taken from the general ledger and other
data of Thomas Manufacturing on July 31:
Finished goods, July 1 . . . . . . . . . . . . . . . . . . . . . . . . . . . . . . . . . . . . . . . . . . . . . $ 85,000
Cost of goods manufactured in July . . . . . . . . . . . . . . . . . . . . . . . . . . . . . . . . . 343,000
Finished goods, July 31 . . . . . . . . . . . . . . . . . . . . . . . . . . . . . . . . . . . . . . . . . . . . 93,000
Compute the cost of goods sold for the month of July.
E1-4 Cost classificationClassify the following as direct materials, direct labor, factory
overhead, or selling and administrative expense.
a. Steel used in an overhead door plant.
b. Cloth used in a shirt factory.
c. Fiberglass used by a sailboat builder.
d. Cleaning solvent for the factory floor.
e. Wages of a binder employed in a printing plant.
f. Insurance on factory machines.
g. Rent paid for factory buildings.
LO0
LO3
LO3
LO4
Chapter 1 – Introduction to Cost Accounting 51

h. Wages of the Machining Department supervisor.
i. Leather used in a shoe factory.
j. Wages of a factory janitor.
k. Electric power consumed in operating factory machines.
l. Depreciation on corporate offices.
m. Fuel used in heating a factory.
n. Paint used in the manufacture of jet skis.
o. Wages of an ironworker in the construction business.
p. Electricity used in lighting sales offices.
E1-5 Cost flowExplain in narrative form the flow of direct materials, direct labor,
and factory overhead costs through the ledger accounts.
E1-6 Statement of cost of goods manufactured; cost of goods soldThe following data are taken from the general ledger and other
records of Black Hills Manufacturing Co. on January 31, the end
of the first month of operations in the current fiscal year:
Sales . . . . . . . . . . . . . . . . . . . . . . . . . . . . . . . . . . . . . . . . . . . . . . . . . . . . . . . . . . . . . . $75,000
Materials inventory (January 1) . . . . . . . . . . . . . . . . . . . . . . . . . . . . . . . . . . . . . 25,000
Work in process inventory (January 1) . . . . . . . . . . . . . . . . . . . . . . . . . . . . . . 24,000
Finished goods inventory (January 1) . . . . . . . . . . . . . . . . . . . . . . . . . . . . . . . 32,000
Materials purchased . . . . . . . . . . . . . . . . . . . . . . . . . . . . . . . . . . . . . . . . . . . . . . . 21,000
Direct labor cost . . . . . . . . . . . . . . . . . . . . . . . . . . . . . . . . . . . . . . . . . . . . . . . . . . . 18,000
Factory overhead (including $1,000 of indirect materials used and$3,000 of indirect labor cost) . . . . . . . . . . . . . . . . . . . . . . . . . . . . . . . . . . . . . . 12,000
Selling and administrative expenses . . . . . . . . . . . . . . . . . . . . . . . . . . . . . . . . 10,000
Inventories at January 31:
Materials . . . . . . . . . . . . . . . . . . . . . . . . . . . . . . . . . . . . . . . . . . . . . . . . . . . . . . . . 22,000
Work in process . . . . . . . . . . . . . . . . . . . . . . . . . . . . . . . . . . . . . . . . . . . . . . . . . 20,000
Finished goods . . . . . . . . . . . . . . . . . . . . . . . . . . . . . . . . . . . . . . . . . . . . . . . . . . 30,000
a. Prepare a statement of cost of goods manufactured.
b. Prepare the cost of goods sold section of the income statement.
E1-7 Determining materials, labor, and cost of goods soldThe following inventory data relate to Niagara Corp.:
Inventories
Ending BeginningFinished goods . . . . . . . . . . . . . . . . . . . . . . . . . . . . . . . . . . . . $75,000 $110,000
Work in process . . . . . . . . . . . . . . . . . . . . . . . . . . . . . . . . . . . 80,000 70,000
Direct materials . . . . . . . . . . . . . . . . . . . . . . . . . . . . . . . . . . . . 95,000 90,000
Revenues and Costs for the Period:
Sales . . . . . . . . . . . . . . . . . . . . . . . . . . . . . . . . . . . . . . . . . . . $900,000
Cost of goods available for sale . . . . . . . . . . . . . . . . . . . 775,000
Total manufacturing costs . . . . . . . . . . . . . . . . . . . . . . . . 675,000
Factory overhead . . . . . . . . . . . . . . . . . . . . . . . . . . . . . . . . 175,000
Direct materials used . . . . . . . . . . . . . . . . . . . . . . . . . . . . 205,000
LO4
LO5
LO4
LO5
52 Principles of Cost Accounting

Calculate the following for the year:
a. Direct materials purchased.
b. Direct labor costs incurred.
c. Cost of goods sold.
d. Gross profit.
(Hint: The answers to subsequent parts may require using solu-
tions from earlier parts.)
E1-8 Journal entriesThe following is a list of manufacturing costs incurred by Orleans
Products Co. during the month of July:
Direct materials used . . . . . . . . . . . . . . . . . . . . . . . . . . . . . . . . . . . . . . . . . . . . . . . $21,000
Indirect materials used . . . . . . . . . . . . . . . . . . . . . . . . . . . . . . . . . . . . . . . . . . . . . . 5,000
Direct labor employed . . . . . . . . . . . . . . . . . . . . . . . . . . . . . . . . . . . . . . . . . . . . . . 15,000
Indirect labor employed . . . . . . . . . . . . . . . . . . . . . . . . . . . . . . . . . . . . . . . . . . . . . 3,000
Rent expense . . . . . . . . . . . . . . . . . . . . . . . . . . . . . . . . . . . . . . . . . . . . . . . . . . . . . . . 4,000
Utilities expense . . . . . . . . . . . . . . . . . . . . . . . . . . . . . . . . . . . . . . . . . . . . . . . . . . . . 1,200
Insurance expense . . . . . . . . . . . . . . . . . . . . . . . . . . . . . . . . . . . . . . . . . . . . . . . . . 500
Depreciation expense (machinery and equipment) . . . . . . . . . . . . . . . . . . . 1,500
Prepare the journal entries to record the preceding information
and to transfer Factory Overhead to Work in Process.
E1-9 Journal entries for job order costing; total and unit costcomputationBristol Manufacturing, Inc., uses the job order cost system of ac-
counting. The following information was taken from the company’s
books after all posting had been completed at the end of May:
JobsCompleted
DirectMaterials Cost
Direct LaborCost
FactoryOverhead
UnitsCompleted
1040 $3,600 $4,000 $1,600 400
1065 2,380 2,500 1,000 240
1120 1,800 1,700 680 200
a. Prepare the journal entries to charge the costs of materials,
labor, and factory overhead to Work in Process.
b. Compute the total production cost of each job.
c. Prepare the journal entry to transfer the cost of jobs com-
pleted to Finished Goods.
d. Compute the unit cost of each job.
e. Compute the selling price per unit for each job, assuming a
mark-on percentage of 40%.
E1-10 Journal entries for job order costingMarine World manufactures goods on a job order basis. During
the month of June, three jobs were started in process. (There
was no work in process at the beginning of the month.) Jobs
Racers and Cruisers were completed and sold, on account,
LO5
LO7
LO7
Chapter 1 – Introduction to Cost Accounting 53

during the month (selling prices: Racers, $22,000; Cruisers,
$ 27,000); Job Floaters was still in process at the end of June.
The following data came from the job cost sheets for each
job. The factory overhead includes a total of $1,200 of indirect
materials and $900 of indirect labor.
Racers Cruisers FloatersDirect materials . . . . . . . . . . . . . . . . . . . . . . . $5,000 $6,000 $3,500
Direct labor . . . . . . . . . . . . . . . . . . . . . . . . . . . 4,000 5,000 2,500
Factory overhead . . . . . . . . . . . . . . . . . . . . . 3,000 4,500 2,000
Prepare journal entries to record the following:
a. Materials used.
b. Factory wages and salaries earned.
c. Factory Overhead transferred to Work in Process.
d. Jobs completed.
e. Jobs sold.
PROBLEMS
P1-1 Performance report
Prepare a performance report for the dining room of Leonardo’s
Italian Cafe for the month of February 2011, using the following
data:
Budgeted Data: January February
Dining room wages . . . . . . . . . . . . . . . . . . . . . . . . . . . . . . . . . . . . $4,300 $4,150
Laundry and housekeeping . . . . . . . . . . . . . . . . . . . . . . . . . . . . 1,650 1,500
Utilities . . . . . . . . . . . . . . . . . . . . . . . . . . . . . . . . . . . . . . . . . . . . . . . 2,200 2,050
Depreciation . . . . . . . . . . . . . . . . . . . . . . . . . . . . . . . . . . . . . . . . . . 1,500 1,500
Actual Data: January February
Dining room wages . . . . . . . . . . . . . . . . . . . . . . . . . . . . . . . . . . . . $4,700 $4,400
Laundry and housekeeping . . . . . . . . . . . . . . . . . . . . . . . . . . . . 1,600 1,400
Utilities . . . . . . . . . . . . . . . . . . . . . . . . . . . . . . . . . . . . . . . . . . . . . . . 2,350 2,100
Depreciation . . . . . . . . . . . . . . . . . . . . . . . . . . . . . . . . . . . . . . . . . . 1,500 1,500
P1-2 Cost of goods sold—merchandiser and manufacturer
The following data were taken from the general ledgers and
other data of Alpha Manufacturing, Inc., and Bravo Merchandis-
ing Co. on April 30 of the current year:
Merchandise inventory, April 1 . . . . . . . . . . . . . . . . . . . . . . . . . . . . . . . . . . $ 38,000
Finished goods, April 1 . . . . . . . . . . . . . . . . . . . . . . . . . . . . . . . . . . . . . . . . . . 67,000
Purchases . . . . . . . . . . . . . . . . . . . . . . . . . . . . . . . . . . . . . . . . . . . . . . . . . . . . . . 121,000
Cost of goods manufactured . . . . . . . . . . . . . . . . . . . . . . . . . . . . . . . . . . . . 287,000
Merchandise inventory, April 30 . . . . . . . . . . . . . . . . . . . . . . . . . . . . . . . . . 33,000
Finished goods, April 30 . . . . . . . . . . . . . . . . . . . . . . . . . . . . . . . . . . . . . . . . 61,000
LO1
LO3
54 Principles of Cost Accounting

Required:
1. Compute the cost of goods sold for Bravo Merchandising Co.,
selecting the appropriate items from the previous list.
2. Compute the cost of goods sold for Alpha Manufacturing,
Inc., selecting the appropriate items from the previous list.
P1-3 Statement of cost of goods manufactured; income statement;balance sheet
The adjusted trial balance for Indy Furniture Company on
November 30, the end of its first month of operation, is as
follows:
Indy Furniture CompanyTrial Balance
November 30, 2011
Cash . . . . . . . . . . . . . . . . . . . . . . . . . . . . . . . . . . . . . . . . . . . . . . $21,800
Accounts Receivable . . . . . . . . . . . . . . . . . . . . . . . . . . . . . . . 16,200
Finished Goods . . . . . . . . . . . . . . . . . . . . . . . . . . . . . . . . . . . . 13,900
Work in Process . . . . . . . . . . . . . . . . . . . . . . . . . . . . . . . . . . . —
Materials . . . . . . . . . . . . . . . . . . . . . . . . . . . . . . . . . . . . . . . . . . 7,400
Building . . . . . . . . . . . . . . . . . . . . . . . . . . . . . . . . . . . . . . . . . . . 300,000
Accumulated Depreciation—Building . . . . . . . . . . . . . . . $3,000
Machinery and Equipment . . . . . . . . . . . . . . . . . . . . . . . . . 88,000
Accumulated Depreciation—Mach. and Equip. . . . . . . 2,200
Accounts Payable . . . . . . . . . . . . . . . . . . . . . . . . . . . . . . . . . . 8,900
Payroll . . . . . . . . . . . . . . . . . . . . . . . . . . . . . . . . . . . . . . . . . . . . —
Capital Stock . . . . . . . . . . . . . . . . . . . . . . . . . . . . . . . . . . . . . . 422,550
Sales . . . . . . . . . . . . . . . . . . . . . . . . . . . . . . . . . . . . . . . . . . . . . 68,300
Cost of Goods Sold . . . . . . . . . . . . . . . . . . . . . . . . . . . . . . . . 42,450
Factory Overhead . . . . . . . . . . . . . . . . . . . . . . . . . . . . . . . . . . —
Selling and Administrative Expenses . . . . . . . . . . . . . . . 15,200
$504,950 $504,950
The general ledger reveals the following additional data:
a. There were no beginning inventories.
b. Materials purchases during the period were $33,000.
c. Direct labor cost was $18,500.
d. Factory overhead costs were as follows:
Indirect materials . . . . . . . . . . . . . . . . . . . . . . . . . . . . . . . . . . . . . . . . . . . . . . . $ 1,400
Indirect labor . . . . . . . . . . . . . . . . . . . . . . . . . . . . . . . . . . . . . . . . . . . . . . . . . . . 4,300
Depreciation—building . . . . . . . . . . . . . . . . . . . . . . . . . . . . . . . . . . . . . . . . . 3,000
Depreciation—machinery and equipment . . . . . . . . . . . . . . . . . . . . . . . . 2,200
Utilities . . . . . . . . . . . . . . . . . . . . . . . . . . . . . . . . . . . . . . . . . . . . . . . . . . . . . . . . 2,750
$13,650
Required:
1. Prepare a statement of cost of goods manufactured for the
month of November.
LO4
LO5
Chapter 1 – Introduction to Cost Accounting 55

2. Prepare an income statement for the month of November.
(Hint: Check to be sure that your figure for Cost of Goods Sold
equals the amount given in the trial balance.)
3. Prepare a balance sheet as of November 30. (Hint: Do not
forget Retained Earnings.)
P1-4 Basic cost system; journal entries; financial statementssimilar to Self-Study Problem 1
The post-closing trial balance of Beamer Manufacturing Co. on
April 30 is reproduced as follows:
Beamer Manufacturing Co.Post-Closing Trial Balance
April 30, 2011
Cash . . . . . . . . . . . . . . . . . . . . . . . . . . . . . . . . . . . . . . . . . . . . $ 25,000
Accounts Receivable . . . . . . . . . . . . . . . . . . . . . . . . . . . . . 65,000
Finished Goods . . . . . . . . . . . . . . . . . . . . . . . . . . . . . . . . . . 120,000
Work in Process . . . . . . . . . . . . . . . . . . . . . . . . . . . . . . . . . 35,000
Materials . . . . . . . . . . . . . . . . . . . . . . . . . . . . . . . . . . . . . . . . 18,000
Building . . . . . . . . . . . . . . . . . . . . . . . . . . . . . . . . . . . . . . . . . 480,000
Accumulated Depreciation—Building . . . . . . . . . . . . . $ 72,000
Factory Equipment . . . . . . . . . . . . . . . . . . . . . . . . . . . . . . 220,000
Accumulated Depreciation—Factory Equipment . . . 66,000
Office Equipment . . . . . . . . . . . . . . . . . . . . . . . . . . . . . . . . 60,000
Accumulated Depreciation—Office Equipment . . . . 36,000
Accounts Payable . . . . . . . . . . . . . . . . . . . . . . . . . . . . . . . . 95,000
Capital Stock . . . . . . . . . . . . . . . . . . . . . . . . . . . . . . . . . . . . 250,000
Retained Earnings . . . . . . . . . . . . . . . . . . . . . . . . . . . . . . . 8 504,000
$ 1,023,000 $ 1,023,000
During the month of May, the following transactions took place:
a. Purchased raw materials at a cost of $45,000 and general
factory supplies at a cost of $13,000 on account (recorded
materials and supplies in the materials account).
b. Issued raw materials to be used in production, costing
$47,000, and miscellaneous factory supplies, costing
$15,000.
c. Recorded the payroll, the payments to employees, and the
distribution of the wages and salaries earned for the month
as follows: factory wages (including $12,000 indirect labor),
$41,000; and selling and administrative salaries, $7,000.
Additional account titles include Wages Payable and Payroll.
(Ignore payroll withholdings and deductions.)
d. Recognized depreciation for the month at an annual rate of
5% on the building, 10% on the factory equipment, and 20%
on the office equipment. The sales and administrative staff
uses approximately one-fifth of the building for its offices.
e. Incurred various other expenses totaling $11,000. One-fourth
of this amount is allocable to the office function.
f. Transferred total factory overhead costs to Work in Process.
LO4
LO5
56 Principles of Cost Accounting

g. Completed and transferred goods with a total cost of $91,000
to the finished goods storeroom.
h. Sold goods costing $188,000 for $362,000. (Assume that all
sales were made on account.)
i. Collected accounts receivable in the amount of $345,000.
j. Paid accounts payable totaling $158,000.
Required:
1. Prepare journal entries to record the transactions.
2. Set up T-accounts. Post the beginning trial balance and the
journal entries prepared in (1) to the accounts and determine
the balances in the accounts on May 31.
3. Prepare a statement of cost of goods manufactured, an
income statement, and a balance sheet. (Round amounts to
the nearest whole dollar.)
P1-5 Journal entries; account analysis
Selected account balances and transactions of Alpine Manufac-
turing Co. follow:
Account Balances
May 1 May 31Raw materials . . . . . . . . . . . . . . . . . . . . . . . . . . . . . . . . . . . . . $ 6,000 $ 5,500
Factory supplies . . . . . . . . . . . . . . . . . . . . . . . . . . . . . . . . . . . 800 900
Work in process . . . . . . . . . . . . . . . . . . . . . . . . . . . . . . . . . . . 3,500 6,500
Finished goods . . . . . . . . . . . . . . . . . . . . . . . . . . . . . . . . . . . . 12,000 13,200
May Transactions:
a. Purchased raw materials and factory supplies on account at
costs of $45,000 and $10,000, respectively. (One inventory
account is maintained.)
b. Incurred wages during the month of $65,000 ($15,000 was for
indirect labor).
c. Incurred factory overhead costs in the amount of $42,000 on
account.
d. Made adjusting entries to record $10,000 of factory overhead
for items such as depreciation (credit Various Credits). Fac-
tory overhead was closed to Work in Process. Completed
jobs were transferred to Finished Goods, and the cost of jobs
sold was charged to Cost of Goods Sold.
Required:
Prepare journal entries for the following:
1. The purchase of raw materials and factory supplies.
2. The issuance of raw materials and supplies into production.
(Hint: Be certain to consider the beginning and ending bal-
ances of raw materials and supplies as well as the amount of
the purchases.)
3. The recording of the payroll.
4. The distribution of the payroll.
5. The payment of the payroll.
6. The recording of factory overhead incurred.
LO5
Chapter 1 – Introduction to Cost Accounting 57

7. The adjusting entry for factory overhead.
8. The entry to transfer factory overhead costs to Work in Process.
9. The entry to transfer the cost of completed work to Finished
Goods. (Hint: Be sure to consider the beginning and ending
balances of Work in Process as well as the costs added to
Work in Process this period.)
10. The entry to record the cost of goods sold. (Hint: Be sure to
consider the beginning and ending balances of Finished
Goods as well as the cost of the goods finished during the
month.)
P1-6 Data analysis, manufacturing statement, cost terminology
O’Reilly Manufacturing, Inc.’s cost of goods sold for the month
ended July 31 was $345,000. The ending work in process inven-
tory was 90% of the beginning work in process inventory.
Factory overhead was 50% of the direct labor cost. Other infor-
mation pertaining to O’Reilly’s inventories and production for
the month of July is as follows:
Beginning inventories, July 1:
Direct materials . . . . . . . . . . . . . . . . . . . . . . . . . . . . . . . . . . . . . . . . . . . . . . . . . $ 20,000
Work in process . . . . . . . . . . . . . . . . . . . . . . . . . . . . . . . . . . . . . . . . . . . . . . . . 40,000
Finished goods . . . . . . . . . . . . . . . . . . . . . . . . . . . . . . . . . . . . . . . . . . . . . . . . . 102,000
Purchases of direct materials during July . . . . . . . . . . . . . . . . . . . . . . . . . . 110,000
Ending inventories, July 31:
Direct materials . . . . . . . . . . . . . . . . . . . . . . . . . . . . . . . . . . . . . . . . . . . . . . . . . 26,000
Work in process . . . . . . . . . . . . . . . . . . . . . . . . . . . . . . . . . . . . . . . . . . . . . . . . ?
Finished goods . . . . . . . . . . . . . . . . . . . . . . . . . . . . . . . . . . . . . . . . . . . . . . . . . 105,000
Required:
1. Prepare a statement of cost of goods manufactured for the
month of July. (Hint: Set up a statement of cost of goods
manufactured, putting the given information in the appropri-
ate spaces and solving for the unknown information.)
2. Prepare a schedule to compute the prime cost incurred during
July.
3. Prepare a schedule to compute the conversion cost charged
to Work in Process during July.
P1-7 Data analysis; manufacturing statement
Fayetteville Manufacturing Co. produces only one product. You
have obtained the following information from the corporation’s
books and records for the year ended December 31, 2011:
a. Total manufacturing cost during the year was $1,000,000,
including direct materials, direct labor, and factory overhead.
b. Cost of goods manufactured during the year was $970,000.
c. Factory overhead charged to work in process was 75% of
direct labor cost and 27% of the total manufacturing cost.
d. The beginning work in process inventory, January 1, was
40% of the ending work in process inventory, December 31.
LO4
LO5
LO4
LO5
58 Principles of Cost Accounting

Required:
Prepare a statement of cost of goods manufactured for the year
ended December 31 for Fayetteville Manufacturing. (Hint: Set up
a statement of cost of goods manufactured, putting the given
information in the appropriate spaces and solving for the
unknown information.)
P1-8 Job order cost; journal entries; ending work in process;inventory analysis
Hidalgo Company manufactures goods to special order and uses
a job order cost system. During its first month of operations, the
following selected transactions took place:
a. Materials purchased on account . . . . . . . . . . . . . . . . . . . . . . . . . . . . . . . . . $37,000
b. Materials issued to the factory:
Job 101 . . . . . . . . . . . . . . . . . . . . . . . . . . . . . . . . . . . . . . . . . . . . . . . . . . . . . . . . $ 2,200
Job 102 . . . . . . . . . . . . . . . . . . . . . . . . . . . . . . . . . . . . . . . . . . . . . . . . . . . . . . . . 5,700
Job 103 . . . . . . . . . . . . . . . . . . . . . . . . . . . . . . . . . . . . . . . . . . . . . . . . . . . . . . . . 7,100
Job 104 . . . . . . . . . . . . . . . . . . . . . . . . . . . . . . . . . . . . . . . . . . . . . . . . . . . . . . . . 1,700
For general use in the factory . . . . . . . . . . . . . . . . . . . . . . . . . . . . . . . . . . . . 1,350
c. Factory wages and salaries earned:
Job 101 . . . . . . . . . . . . . . . . . . . . . . . . . . . . . . . . . . . . . . . . . . . . . . . . . . . . . . . . $ 2,700
Job 102 . . . . . . . . . . . . . . . . . . . . . . . . . . . . . . . . . . . . . . . . . . . . . . . . . . . . . . . . 6,800
Job 103 . . . . . . . . . . . . . . . . . . . . . . . . . . . . . . . . . . . . . . . . . . . . . . . . . . . . . . . . 9,200
Job 104 . . . . . . . . . . . . . . . . . . . . . . . . . . . . . . . . . . . . . . . . . . . . . . . . . . . . . . . . 2,100
For general work in the factory . . . . . . . . . . . . . . . . . . . . . . . . . . . . . . . . . . 2,250
d. Miscellaneous factory overhead costs on account . . . . . . . . . . . . . . . . $ 2,400
e. Depreciation of $2,000 on the factory machinery recorded.
f. Factory overhead allocated as follows:
Job 101 . . . . . . . . . . . . . . . . . . . . . . . . . . . . . . . . . . . . . . . . . . . . . . . . . . . . . . . . $ 1,200
Job 102 . . . . . . . . . . . . . . . . . . . . . . . . . . . . . . . . . . . . . . . . . . . . . . . . . . . . . . . . 2,000
Job 103 . . . . . . . . . . . . . . . . . . . . . . . . . . . . . . . . . . . . . . . . . . . . . . . . . . . . . . . . 3,800
Job 104 . . . . . . . . . . . . . . . . . . . . . . . . . . . . . . . . . . . . . . . . . . . . . . . . . . . . . . . . 1,000
g. Jobs 101, 102, and 103 completed.
h. Jobs 101 and 102 shipped to the customer and billed at $39,000.
Required:
1. Prepare a schedule reflecting the cost of each of the four jobs.
2. Prepare journal entries to record the transactions.
3. Compute the ending balance in Work in Process.
4. Compute the ending balance in Finished Goods.
LO7
Chapter 1 – Introduction to Cost Accounting 59

P1-9 Job order cost; journal entries; profit analysis
Spokane Manufacturing Co. obtained the following information
from its records for the month of July:
Jobs Completed and Sold
230 320 560Direct materials cost . . . . . . . . . . . . . . . . . . $ 25,000 $ 15,000 $ 29,000
Direct labor cost . . . . . . . . . . . . . . . . . . . . . . 70,000 60,000 55,000
Factory overhead . . . . . . . . . . . . . . . . . . . . . 50,000 40,000 63,000
Units manufactured . . . . . . . . . . . . . . . . . . . 10,000 5,000 14,000
Selling price . . . . . . . . . . . . . . . . . . . . . . . . . . 152,000 120,000 175,250
Required:
1. Prepare, in summary form, the journal entries that would
have been made during the month to record the distribution
of materials, labor, and overhead costs; the completion of the
jobs; and the sale of the jobs.
2. Prepare schedules showing the gross profit or loss for July
for the following:
a. The business as a whole.
b. Each job completed and sold.
c. Each unit manufactured and sold. (Round to the nearest
cent.)
P1-10 Job cost; journal entries; inventory analysis;manufacturing statementsimilar to Self-Study Problem 2
St. Lawrence Manufacturing Co. manufactures engines that are
made only on customers’ orders and to their specifications. Dur-
ing January, the company worked on Jobs 007, 008, 009, 010.
The following figures summarize the cost records for the month:
Job 007(100 units)
Job 008(60 units)
Job 009(25 units)
Job 010(100 units)
Direct materials put into process:
Jan. 2 . . . . . . . . . . . . . . . . . $15,000 $ 5,000 — —
18 . . . . . . . . . . . . . . . . . 20,000 16,000 $ 5,000 —
22 . . . . . . . . . . . . . . . . . 15,000 1,000 10,000 $ 6,000
28 . . . . . . . . . . . . . . . . . — — 3,500 2,000
Direct labor cost: Week ending
Jan. 2 . . . . . . . . . . . . . . . . . $ 1,000 $ 1,000 — —
9 . . . . . . . . . . . . . . . . . 27,000 9,000 — —
16 . . . . . . . . . . . . . . . . . 32,000 27,000 — —
23 . . . . . . . . . . . . . . . . . 20,000 3,000 $ 5,000 $ 500
30 . . . . . . . . . . . . . . . . . — — 18,000 11,500
Factory overhead . . . . . . . . $60,000 $32,000 $17,500 $10,500
Engines completed . . . . . . 100 60 25 —
Jobs 007 and 008 have been completed and delivered to the
customer at a total selling price of $426,000, on account. Job 009 is
finished but has not yet been delivered. Job 010 is still in process.
There was no work in process at the beginning of the month.
LO7
LO7
60 Principles of Cost Accounting

Required:
1. Prepare the summary journal entries for the month to record
the distribution of materials, labor, and overhead costs.
2. Prepare a summary showing the total cost of each job com-
pleted during the month or in process at the end of the month.
Also, determine the cost of the inventories of completed
engines and engines in process at the end of the month.
3. Prepare the journal entries to record the completion of the
jobs and the sale of the jobs.
4. Prepare a statement of cost of goods manufactured.
MINI-CASE
Required Ethics
Marta Johns is the Division Controller and Kevin Deere is the Division Vice
President of Tuffy Tractor, Inc. Due to pressures to meet earnings esti-
mates for 2011, Deere instructs Johns to record as revenue $5,000,000 of
orders for tractors that are still in production and will not be shipped until
January 2012.
Required:
1. Using the IMA’s Standards of Ethical Conduct as a guide, what are
Johns’s ethical responsibilities in this matter?
2. What should Johns do if Deere does not acquiesce and still insists that
she record the revenue in 2011?
INTERNET EXERCISE 1
Ethics
Required:Accounting organizations, such as the Institute of Management Accountants,encourage ethical conduct. Go to the companion Website at www.cengage.com/accounting/vanderbeck and click on the link to ‘‘Ethics Articles/Strategic Finance.’’Choose a recent ethics article, and write a one-page summary of it.
INTERNET EXERCISE 2
Ethics, Corporate Governance
Required:Go to the companion Website at www.cengage.com/accounting/vanderbeck andclick on the link to ‘‘The Sarbanes-Oxley Act.’’ Read the accompanying PowerPointpresentation, and write a one-page summary of it.
LO2
LO2
LO2
Chapter 1 – Introduction to Cost Accounting 61

This page intentionally left blank

CHAPTER 2
Account ing for Mater ia l s
Raw materials costs are not just a concern of manufacturers. An
article, ‘‘Restaurant Costs Harder to Stomach,’’ in the June 7,
2008 Cincinnati Enquirer, explained how rapidly food costs were
rising and how difficult it was to pass those costs on to diners in
a sluggish economy. Bob Conway Jr., vice president of Bistro
Group, which operates Friday’s, McAlister’s, and Karlo’s in the
Greater Cincinnati area, said that in the past six months, ‘‘Food
prices increased more than anyone in the industry thought they
would. Pasta went up 130 percent. Other big jumps have been
eggs up 73 percent and rice up 39 percent . . . flour jumped
87 percent in the first three months of 2008 and fats and oils
were up 49 percent.’’
What cost management techniques must purchasers of raw
materials employ to survive in such a difficult environment? This
chapter will discuss basic aspects of materials control, internal
control procedures for materials, and adoption of a lean production
manufacturing system to maximize efficiency and minimize waste.
T he total inventory cost of a manufactured product consists of theexpenditures made for raw materials, direct labor, and its fairshare of factory overhead. The principles and procedures for
controlling and accounting for these cost elements are discussed in Chap-ters 2, 3, and 4, respectively. Each chapter examines the accountingprocedures and controls that apply to one of the cost elements. Certainprocedures and controls, however, pertain to all of the cost elements. Themajor function of a cost control system is to keep expenditures within thelimits of a preconceived plan. The control system should also encourage
Learning Objectives
After studying this
chapter, you should
be able to:
LO1Recognize the
two basic
aspects of materials
control.
LO2Specify
internalcontrol
procedures for
materials.
LO3Account for
materials and
relate materials
accounting to the
general ledger.
LO4Account for
inventories in
a just-in-time (lean
production) system.
LO5Account for
scrap materi-
als, spoiled goods,
and defective work.

cost reductions by eliminating waste and operational inefficiencies. Aneffective system of cost control is designed to control the actions of peopleresponsible for the expenditures, because people control costs. Costs do notcontrol themselves.
An effective cost control system should include the following:
1. A specific assignment of duties and responsibilities.
2. A list of individuals who are authorized to approve expenditures.
3. An established plan of objectives and goals.
4. Regular reports showing the differences between goals and actualperformance.
5. A plan of corrective action designed to prevent unfavorable variancesfrom recurring.
6. Follow-up procedures for corrective measures.
Recall from Chapter 1 that responsibility accounting is an integral partof a cost control system because it focuses attention on specific individualswho have been designated to achieve the established goals. Of the threemajor objectives of cost accounting—cost control, product costing, andinventory pricing—cost control is often the most difficult to achieve. Aweakness in cost control can often be overcome by placing more emphasison responsibility accounting. This makes the people who incur costsaccountable for those costs.
Materials ControlThe two basic aspects of materials control are (1) the physical control orsafeguarding of materials and (2) control over the investment in materials,as illustrated in Figure 2-1. Physical control protects materials from misuseor misappropriation. Controlling the investment in materials maintainsappropriate quantities of materials in inventory.
Figure 2-1 Physical Control and Controlling the Investment in Materials
Investment ControlPhysical Control
Limited Access
Segregation of Duties
Accuracy in Recording
Order Point
Economic Order
Quantity (EOQ)
LO1Recognize the
two basic
aspects of materials
control.
64 Principles of Cost Accounting

Physical Control of MaterialsEvery business requires a system of internal control that includes proce-dures for the safeguarding of assets. Because highly liquid assets, such ascash and marketable securities, are particularly susceptible to misappropria-tion, the protection provided for such assets is usually more than adequate.However, other assets, including inventories, must also be protected fromunauthorized use or theft.
Because raw materials usually represent a significant portion of amanufacturer’s current assets and often comprise more than 50% of aproduct’s manufacturing cost, a business must control its materials from thetime they are ordered until the time they are shipped to customers in theform of finished goods. In general, to effectively control materials, abusiness must maintain: (1) limited access, (2) segregation of duties, and(3) accuracy in recording. Note that manufacturers are not the only oneswho have direct materials. Although Taco Bell, for example, is considereda service business, it has direct materials such as ground beef, tortillas, andsalsa that are used in the preparation of its meals, over which physicalcontrol must be exercised.
Limited Access. Only authorized personnel should have access to materialsstorage areas. Raw materials should be issued for use in production only ifrequisitions are properly documented and approved. Also, proceduresshould be established within each production area for safeguarding work inprocess. Finished goods should be safeguarded in limited-access storageareas and not released for shipment in the absence of appropriate documen-tation and authorization.
Segregation of Duties. A basic principle of internal control is the segrega-tion of employee duties to minimize opportunities for misappropriation ofassets. With respect to materials control, the following functions should besegregated: purchasing, receiving, storage, use, and recording. The inde-pendence of personnel assigned to these functions does not eliminate thedanger of misappropriation or misuse because the possibility of collusionstill exists. However, the appropriate segregation of duties limits anindividual employee’s opportunities for misappropriation and concealment.In smaller organizations, it is frequently not possible to achieve optimumsegregation of duties due to the limited number of employees. Smallbusinesses must therefore rely on specially designed control procedures tocompensate for the lack of independence of assigned functions.
Accuracy in Recording. An effective materials control system requires theaccurate recording of the purchase and issuance of materials. Inventoryrecords should document the inventory quantities on hand, and costrecords should provide the data needed to assign a cost to inventories forthe preparation of financial statements. Periodically, recorded inventoriesshould be compared with a physical inventory count, and any significantdiscrepancies should be investigated. Differences may be due to recording
Chapter 2 – Accounting for Materials 65

errors or to inventory losses through theft or spoilage. Once the cause hasbeen determined, appropriate corrective action should be taken.
Controlling the Investment in Materials
Maintaining an appropriate level of raw materials inventory is one of themost important objectives of materials control. An inventory of sufficientsize and variety for efficient operations must be maintained, but the sizeshould not be excessive in relation to scheduled production needs.
Because funds invested in inventories are unavailable for other uses,management should consider other working capital needs in determininginventory levels. In addition to the alternative uses of funds that otherwisewould be invested in inventories, management should consider the materi-als costs of handling, storage, personal property taxes, and casualty insur-ance. Also, higher than needed inventory levels may increase the possibilityof loss from the damage, deterioration, or obsolescence of materials. Theplanning and control of the materials investment requires that all of thesefactors be carefully studied to determine (1) when orders should be placedand (2) how many units should be ordered.
Order Point. A minimum level of inventory should be determined for eachtype of raw material, and inventory records should indicate how much ofeach type is on hand. A subsidiary materials ledger, in which a separateaccount is maintained for each material, is needed.
The point at which an item should be ordered, called the order point,occurs when the predetermined minimum level of inventory on hand isreached. Calculating the order point is based on the following data:
1. Usage—the anticipated rate at which the material will be used.
2. Lead time—the estimated time interval between the placement of anorder and the receipt of the material.
3. Safety stock—the estimated minimum level of inventory needed toprotect against stockouts (running out of stock). Stockouts may occurdue to inaccurate estimates of usage or lead time or various otherunforeseen events, such as the receipt of damaged or inferior materialsfrom a supplier or a work stoppage at a supplier’s plant.
Assume that a company’s expected daily usage of an item of material is100 lb, the anticipated lead time is five days, and the desired safety stock is1,000 lb. The following calculation shows that the order point is reachedwhen the inventory on hand reaches 1,500 lb:
100 lb (daily usage) � 5 days (lead time) . . . . . . . . . . . . . . . . . . . . . . . . . . . . . . . . . 500 lb
Safety stock required . . . . . . . . . . . . . . . . . . . . . . . . . . . . . . . . . . . . . . . . . . . . . . . . . . . 1,000 lb
Order point . . . . . . . . . . . . . . . . . . . . . . . . . . . . . . . . . . . . . . . . . . . . . . . . . . . . . . . . . . . . 1,500 lb
If estimates of usage and lead time are accurate, the level of inventorywhen the new order is received would be equal to the safety stock of 1,000lb. If, however, the new order is delivered three days late, the company
66 Principles of Cost Accounting

would need to issue 300 lb of material from its safety stock to maintain theproduction level during the delay.
Economic Order Quantity (EOQ). The order point establishes the timewhen an order should be placed, but it does not indicate the mosteconomical number of units to be ordered. To determine the quantity to beordered, the cost of placing an order (order costs) and the cost of carryinginventory in stock (carrying costs) must be considered, as illustrated inFigure 2-2.
Order costs and carrying costs move in opposite directions—annualorder costs decrease when the order size increases, while annual carryingcosts increase when the order size increases. The optimal quantity to orderat one time, called the economic order quantity, is the order size thatminimizes the total order and carrying costs over a period of time, such asone year.
The factors to be considered in determining order and carrying costsfor a particular company vary with the nature of operations and theorganizational structure. Special analyses are usually required to identifyrelevant costs, because these data are not normally accumulated in anaccounting system. Care must be exercised in determining which costs arerelevant. For example, a company may have adequate warehouse space tocarry a large additional quantity of inventory. If the space cannot be usedfor some other profitable purpose, the cost of the space is not a relevantfactor in determining carrying costs. If, however, the space in the companywarehouse could be leased to others or if additional warehouse space mustbe leased to accommodate increased inventories, then the costs associatedwith the additional space are relevant in determining carrying costs.
The interest cost associated with carrying an inventory in stock shouldbe considered whether or not funds are borrowed to purchase the inven-tory. If these funds were not used to purchase inventory, they could havebeen profitably invested in other alternatives. The rate of interest to beused in the calculations will vary depending on the cost of borrowing or the
Figure 2-2 Order Costs and Carrying Costs
Storage and Handling Costs
Interest, Insurance, and PropertyTaxes on the Inventory
Loss due to Theft, Spoilage, or Obsolescence
Accounting and Recordkeeping
Order Costs
Purchasing, Receiving,and Inspection Wages
Telephone and FaxCharges, Software,Postage and Stationery
Accounting andRecordkeeping
Carrying Costs
Chapter 2 – Accounting for Materials 67

rate that could be earned by the funds if they were used for some otherpurpose.
Quantitative models or formulas have been developed for calculating theeconomic order quantity. One formula that can be used is the following:
EOQ ¼ffiffiffiffiffiffiffiffiffiffi2CN
K
r whereEOQ ¼ economic order quantity
C ¼ cost of placing an orderN ¼ number of units required annuallyK ¼ annual carrying cost per unit of inventory
To illustrate this formula, assume that the following data have beendetermined by analyzing the factors relevant to materials inventory forPacific Paint Company:
Number of gallons of material required annually . . . . . . . . . . . . . . . . . . . . . . . . . 10,000
Cost of placing an order . . . . . . . . . . . . . . . . . . . . . . . . . . . . . . . . . . . . . . . . . . . . . . . . $ 10.00
Annual carrying cost per gallon of inventory . . . . . . . . . . . . . . . . . . . . . . . . . . . . . $ 0.80
Using the EOQ formula, 500 gallons should be ordered at one time:
EOQ ¼ffiffiffiffiffiffiffiffiffiffiffiffiffiffiffiffiffiffiffiffiffiffiffiffiffiffiffiffiffiffiffiffiffiffiffiffiffiffiffiffiffiffiffiffiffiffiffiffiffiffiffiffiffiffiffiffiffiffiffiffiffiffiffiffiffiffiffiffiffiffiffiffiffiffiffiffiffiffiffiffiffiffiffiffiffiffiffiffiffiffiffiffiffiffiffiffiffiffiffiffiffiffiffiffiffiffiffi2� cost of order� number of units required annually
carrying cost per unit
s
¼
ffiffiffiffiffiffiffiffiffiffiffiffiffiffiffiffiffiffiffiffiffiffiffiffiffiffiffiffiffiffiffiffiffiffiffi2� $10� 10,000
$0:80
s
¼
ffiffiffiffiffiffiffiffiffiffiffiffiffiffiffiffiffiffiffi$200,000
$0:80
s
¼ffiffiffiffiffiffiffiffiffiffiffiffiffiffiffiffi250,000
p¼ 500 gal:
The EOQ can also be determined by constructing a table using a rangeof order sizes. A tabular presentation of the data from the previous example,assuming no safety stock, follows:
(1) (2) (3) (4) (5) (6)
OrderSize
Numberof Orders
TotalOrder Cost
AverageInventory
TotalCarrying Cost
Total Order &Carrying Cost
100 100 $1,000 50 $ 40 $1,040
200 50 500 100 80 580
300 33 330 150 120 450
400 25 250 200 160 410
500 20 200 250 200 400
600 17 170 300 240 410
700 14 140 350 280 420
800 13 130 400 320 450
900 11 110 450 360 470
1,000 10 100 500 400 500
68 Principles of Cost Accounting

In this table, the amounts in each column are determined as follows:
1. Number of gallons per order
2. 10,000 annual gallons / order size in column (1)
3. Number of orders � $10 per order
4. Order size / 2 ¼ average inventory on hand during the year
5. Average inventory � $0.80 per gal. carrying cost for one year
6. Total order cost in column (3) þ total carrying cost in column (5)
The graph in Figure 2-3 shows the total annual order cost decreasing asthe order size increases because the order cost is a function of the number oforders placed, not the number of units ordered. Meanwhile, the total annualcarrying cost increases as the order size increases because of the necessity tomaintain a large quantity of inventory in stock. At the 500-gallon level, thecombined carrying and order costs are at their minimum point of $400. This isalways the point at which the total carrying costs equal the total order costs, asdemonstrated by their intersection in Figure 2-3, when no safety stock isprovided for.
Figure 2-3 Costs of Ordering and Carrying Inventory
TO
TAL A
NN
UA
L C
OS
TS
$1,100
1,000
900
800
700
600
500
400
300
200
100
0
TOTAL COST—CARRYING AND ORDERING
TOTAL CARRYING COST
TOTAL ORDERING COST
ORDER SIZE (GALLONS)
0 100 200 300 400 500 600 700 800 900 1,000
TOTAL COSTOF $400 ATORDER OF500 GALLONS
Chapter 2 – Accounting for Materials 69

Assume in the preceding example that the company desires a safetystock of 400 gallons to protect against stockouts. The average number ofgallons in inventory then would be calculated as follows:
Average number ofgallons in inventory ¼ ð1=2 � EOQÞ þ Safety stock
¼ ð1=2 � 500Þ þ 400¼ 650 gal.
The total carrying cost then would be
Carrying cost ¼ Average inventory � Carrying cost per unit¼ 650 � $0:80¼ $520
Note that the order cost of $200, which doesn’t change in this examplebecause the number of orders is the same as before, is significantly less thanthe carrying cost of $520 when safety stock is present.
Limitations of Order Point and EOQ Calculations. The techniques illu-strated for determining when to order (order point) and how much to order(EOQ) may give a false impression of exactness. However, because thesecalculations are based on estimates of factors such as production volume,leadtime, and order and carrying costs, they are really approximations thatserve as a guide to planning and controlling the investment in materials.
In addition, other factors may influence the time for ordering or thequantity ordered. Such factors include the availability of materials fromsuppliers, the proximity of suppliers, fluctuations in the purchase price ofmaterials, and trade (volume) discounts offered by suppliers.
Companies often increase safety stock due to strong expected demand.In recent years, both the automotive and electronics industries haveexperienced occasional shortages of parts due to such increased demandand/or work slowdowns or strikes at certain plants. The cost of suchstockouts may include the lost revenue from the current sale, as well as apermanent loss of customers due to the ill will created.
Materials Control ProceduresSpecific internal control procedures for materials should be tailored to acompany’s needs. However, materials control procedures generally relateto the following functions: (1) purchase and receipt of materials, (2) storageof materials, and (3) requisition and consumption of materials.
Materials Control Personnel
Although actual job titles and duties may vary from one company to another,the personnel involved in materials control usually include (1) purchas-ing agent, (2) receiving clerk, (3) storeroom keeper, and (4) productiondepartment supervisor.
LO2Specify
internalcontrol
procedures for
materials.
70 Principles of Cost Accounting

Purchasing Agent. The purchasing agent is responsible for buying thematerials needed by a manufacturer. In a small plant, the employee who doesthe buying may also perform other duties, while in a large plant, the purchas-ing agent may head a department established to perform buying activities. Theduties of a purchasing agent and staff may include the following:
1. Working with the production manager to prevent delays caused by thelack of materials.
2. Compiling and maintaining information that identifies where thedesired materials can be obtained at the most economical price.
3. Placing purchase orders.
4. Supervising the order process until the materials are received.
5. Verifying purchase invoices and approving them for payments.
Receiving Clerk. The receiving clerk is responsible for supervising thereceipt of incoming shipments. All incoming materials must be checked asto quantity and quality and sometimes as to price.
Storeroom Keeper. The storeroom keeper, who has charge of thematerials after they have been received, must see that the materials areproperly stored and maintained. The materials must be placed in stock andissued only on properly authorized requisitions. The purchasing agentshould be informed of the reorder point and economic order quantity as aguide to purchasing additional materials.
Production Department Supervisor. Each production department has aperson who is responsible for supervising the operational functions withinthe department. This individual may be given the title of productiondepartment supervisor or another similar designation. One of the as-signed duties of a department supervisor is to prepare or approve therequisitions designating the quantities and kinds of material needed for thework to be done in the department.
Control during Procurement
Materials are ordered to maintain the adequate levels of inventory necessary tomeet scheduled production needs. The storeroom keeper is responsible formonitoring quantities of materials on hand. When the order point is reachedfor a particular material, the procurement process is initiated. In most compa-nies, computers store data pertaining to inventories on hand, predeterminedorder points, and economic order quantities. When properly programmed,computers can simplify the task of maintaining appropriate inventory levels.
Supporting documents are essential to maintaining control during theprocurement process. In general, the documents should be prenumberedand protected from unauthorized use. The documents commonly used inprocuring materials include: (1) purchase requisitions, (2) purchase orders,(3) vendor’s invoices, (4) receiving reports, and (5) debit-credit memoranda.Increasingly, the supporting documents are in the form of computer files,which will be discussed at the appropriate points in the following narrative.
Chapter 2 – Accounting for Materials 71

Purchase Requisitions. The form used to notify the purchasing agent thatadditional materials are needed is known as a purchase requisition. It is animportant part of the materials control process because it authorizes theagent to buy. Purchase requisitions should originate with the storeroomkeeper or some other individual with similar authority and responsibility.
Purchase requisitions should be prenumbered serially to help detect theloss or misuse of any of these forms. They are generally prepared induplicate. The first copy goes to the purchasing agent, and the storeroomkeeper retains the second copy. Figure 2-4 shows a purchase requisition forHawke Mfg., a company that manufactures skateboards and needs topurchase lumber for use in production.
Purchase Order. The purchase requisition gives the purchasing agentauthority to order the materials described in the requisition. The purchas-ing agent should maintain or have access to an up-to-date list of vendors,which includes prices, available discounts, estimated delivery time, and any
Figure 2-4 Purchase Requisition. (Notifies purchasing agent that addi-
tional materials should be ordered.)
PURCHASE REQUISITION No. 3246
Date
Date wanted
January 3, 2011
February 1, 2011
300
1482
3313
ForJob No .
Account No.
Authorization No .
DESCRIPTIONQUANTITY
20,000 BD.FT. Hard Rock Maple Plywood
Approved by Signed by
Purchase order no.
Ordered from
Date ordered1982Forrest Corporation
January 6, 2011
HAWKE
MFG
72 Principles of Cost Accounting

other relevant information. From this list, the purchasing agent selects avendor from whom high-quality materials can be obtained when needed ata competitive price. If this information is not available from the list for aparticular type of material, the purchasing agent may communicate withseveral prospective vendors and request quotations on the materials needed.
The purchasing agent then completes a purchase order, as shown inFigure 2-5 below, and addresses it to the chosen vendor, describing thematerials wanted, stating price and terms, and fixing the date and methodof delivery. This purchase order should be prenumbered serially andprepared in quadruplicate. The first copy goes to the vendor, one copy goesto the accounting department, one copy goes to the receiving clerk, and thepurchasing agent retains a copy.
The purchasing agent’s copy of the order should be placed in anunfilled orders file. Before the order is filed, the purchase requisition onwhich it is based should be attached to it. This last important step beginsthe assembly of a complete set of all the forms pertaining to the purchase
Figure 2-5 Purchase Order. (Prepared by purchasing agent and sent to
vendor to order materials.)
PURCHASE ORDER Order No. 1982HAWKE
MFG
Date
Terms
Ship Via
January 6, 2011
3/10 eom n/60
Truck (to arriveJanuary 21, 2011)
To:
DESCRIPTIONQUANTITY
20,000 BD.FT. Hard Rock Maple Plywood
Purchasing Agent
By
Forrest CorporationAdirondack, NY
Mark Order No. on invoiceand on all packages
PRICE
$105,000 00
Chapter 2 – Accounting for Materials 73

transaction. To identify each document relating to a transaction with allothers of the same set, the purchase order number should be shown on eachof the documents. The sets can then be compiled according to therespective purchase order numbers.
A computerized purchasing system greatly simplifies the process pre-viously described. The necessary computer files include an inventory file, asupplier file, and an open purchase order file. The storeroom keeper wouldinitiate the process by transmitting a purchase requisition electronically tothe purchasing agent. The purchasing agent would then browse thesupplier file to choose the most appropriate supplier for the materialrequested. The purchase order would be prepared electronically, and theopen purchase order file would be updated. The transmission of theelectronic purchase order to the supplier’s computer is an example ofElectronic Data Interchange (EDI), which is the process of business-to-business electronic communication for the purpose of expediting com-merce and eliminating paperwork.
Vendor’s Invoice. The company should receive a vendor’s invoice beforethe materials arrive at the factory. As soon as it is received, the vendor’sinvoice goes to the purchasing agent, who compares it with the purchaseorder, noting particularly that the description of the materials is the same aswhat was ordered, that the price and the payment terms agree with thepurchase order, and that the method of shipment and the date of deliveryconform to the instructions on the order. When satisfied that the invoice iscorrect, the purchasing agent initials or stamps the invoice indicating that ithas been reviewed and agrees with the purchase order. The invoice is thenfiled together with the purchase order and the purchase requisition in theunfilled orders file until the materials arrive.
Receiving Report. As noted previously, a copy of the purchase order goesto the receiving clerk to give advance notice in preparation for the arrival ofthe materials ordered. This is done to facilitate planning and to providespace for the incoming materials. The receiving clerk works in the receivingdepartment where all incoming materials are received, opened, counted orweighed, and tested for conformity with the order. If the materials receivedare of too technical a nature to be tested by the receiving clerk, an engineerfrom the production manager’s office may perform the inspection, or thematerials may be sent to the plant laboratory for testing.
The receiving clerk counts and identifies the materials received and prepares areceiving report similar to the one presented in Figure 2-6. Each report isnumbered serially and shows the vendor, when the materials were received,what the shipment contained, and the number of the purchase order thatidentifies the shipment. If prepared manually, the report should be pre-pared in quadruplicate. Two copies go to the purchasing agent, one copygoes with the materials or supplies to the storeroom keeper to ensure thatall of the materials that come to the receiving department are put intothe storeroom, and the receiving clerk retains one copy. In some plants, the
74 Principles of Cost Accounting

receiving clerk is given a copy of the purchase order with the quantityordered omitted, thus ensuring that the items received will be counted.
The purchasing agent compares the receiving report with the vendor’sinvoice and the purchase order to determine that the materials received arethose ordered and billed. If the documents agree, the purchasing agentinitials or stamps the two copies of the receiving report. One copy is thenattached to the other forms already in the file, and the entire set of forms issent to the accounting department where the purchase of merchandise onaccount is recorded. The other copy of the receiving report is sent to theperson in the accounting department who maintains inventory records. Asummary of the document flows in the purchasing system is illustrated inFigure 2-7.
In the previously mentioned computerized purchasing system, thereceiving clerk would enter the quantity of the materials counted into thesystem. The computer program would then compare the items in the openpurchase order file with the items received and generate a receiving report aswell as update the inventory file, supplier file, and open purchase order file.
Figure 2-6 Receiving Report. (Incoming materials opened, counted,
weighed, or tested for conformity with purchase order.)
RECEIVING REPORT No. 496HAWKE
MFG
RECEIVED FROM
Via
Forrest Corporation
Ace Trucking $210.85
To the purchasing agent:
Transportation Charges
DESCRIPTIONQUANTITY
20,000 BD.FT. Hard Rock Maple Plywood
Counted by
Purchase order no.
Inspected by
1982
Date January 21, 2011
Chapter 2 – Accounting for Materials 75

Debit-Credit Memorandum. Occasionally, a shipment of materials does notmatch the order and the invoice. The purchasing agent will discover thisdiscrepancy when comparing the receiving report with the purchase orderand the vendor’s invoice. Whatever the cause, the difference will lead tocorrespondence with the vendor, and copies of the letters should be addedto the file of forms relating to the transaction. If a larger quantity has beenreceived than has been ordered and the excess is to be kept for future use, acredit memorandum is prepared notifying the vendor of the amount ofthe increase (to accounts payable) in the invoice.
If, on the other hand, the shipment is short, one of two courses ofaction may be taken. If the materials received can be used, they may beretained and a debit memorandum (decrease to accounts payable) pre-pared notifying the vendor of the amount of the shortage. If the materials
Figure 2-7 Materials Procurement Document Flows
STOREROOM KEEPER
PREPARES PURCHASEREQUISITION
VENDOR
PREPARES VENDOR’SINVOICE
RECEIVING CLERK
PREPARES RECEIVING
REPORT
For activities up to and including purchase order preparationKEY:
Represent activities subsequent to purchase order preparation
ACCOUNTANT
RECORDS THEPURCHASE OFMERCHANDISE
PURCHASING AGENT
PREPARES PURCHASEORDER
APPROVED S
ET OF P
URCHASE ORDER
RECEIVIN
G R
EPORT A
ND VENDO
R’S IN
VOIC
E
ARE S
ENT TO
ACCO
UNTING
DEPARTM
ENT
76 Principles of Cost Accounting

received cannot be used, perhaps due to a defect, a return shipping orderis prepared and the materials are returned.
Figure 2-8 shows one form of debit-credit memorandum. This memoshows that the vendor has delivered 500 board feet of lumber that do notmeet the buyer’s specifications. The purchasing agent will prepare a returnshipping order and return the materials to the vendor. In our computerizedpurchasing system example, the receiving clerk would enter the purchaseorder number of the returned items into the system, and the computerwould generate a credit or debit memorandum and a return shipping order,if necessary.
Control during Storage and Issuance
The preceding discussion outlined ways to maintain the control of materialsduring the procurement process. The procedures and forms described arenecessary for control of the ordering and receiving functions and the
Figure 2-8 Debit-Credit Memorandum. (Discrepancy between order, ship-
ment, and vendor invoice. Price adjustment shown on debit-
credit memo.)
MEMORANDUMDEBIT
CREDITHAWKE
MFG
To:
January 23, 2011
Forrest Corporation
Adirondak, NY
Poor Quality
00
Date
$2,625
We have today your account for the following:
Explanation
DESCRIPTIONQUANTITY
500 BD.FT. Hard Rock Maple Plywood
Purchase order no.
Your invoice date
1982January 15, 2011
UNIT PRICE AMOUNT
$5.25
Debited
Credited
Purchasing AgentBy
Chapter 2 – Accounting for Materials 77

transfer of incoming materials to the storeroom. The next step to beconsidered is the storage and issuance of materials and supplies.
Materials Requisition. As discussed earlier, materials should be protected fromunauthorized use. To lessen the chance of theft, carelessness, or misuse, nomaterials should be issued from the storeroom except on written authorization.The form used to provide this control is known as the materials requisition,illustrated in Figure 2-9, and is prepared by factory personnel authorized towithdraw materials from the storeroom. The personnel authorized toperform this function may differ from company to company, but suchauthority must be given to someone of responsibility. Often, departmentsupervisors are required to sign materials requisitions that are issued bytheir respective departments. When the storeroom keeper receives aproperly signed requisition, the requisitioned materials are released. Boththe storeroom keeper and the employee to whom materials are issuedshould be required to sign the requisition. (Note that in a computerizedsystem, signatures are replaced with passwords and other security codes.)
Figure 2-9 Materials Requisition. (Authorization to withdraw materials
from storeroom.)
MATERIALS REQUISITIONHAWKE
MFG
To: D. Graham
00$5,250
DESCRIPTIONQUANTITY
1000 BD.FT. Hard Rock Maple Plywood
Approved by
Received by
UNIT PRICE AMOUNT
$5.25
No. 834January 24, 2011Date
Charged to Job/Dept.
Issued by
Factory Overhead Expense Account
78 Principles of Cost Accounting

In a paper-based system, the materials requisition is usually prepared inquadruplicate. Two copies go to the accounting department for recording;one copy goes to the storeroom keeper and serves as authorization forissuing the materials; and the department supervisor who approved itretains one copy.
Identification is an important factor in the control of materials. For thisreason, the materials requisition should indicate the job number, such asJob 320 in Figure 2-9, or the department (in process costing) to which thematerials are issued. When indirect materials, such as cleaning materials,lubricants, and paint that cannot be identified with a specific job are issued,the requisition will indicate the name or number of the factory overheadaccount to be charged.
Returned Materials Report. After materials are requisitioned, occasionallysome or all of the materials must be returned to the storeroom. Perhapsmore materials were requested than were needed, or the wrong type ofmaterials was issued. Whatever the reason, a written report, called areturned materials report, describing the materials and the reason for thereturn, must accompany the materials to the storeroom.
Accounting for MaterialsA company’s inventory records should show (1) the quantity of each kind ofmaterial on hand and (2) its cost. The most desirable method of achievingthis result is to integrate the materials accounting system with the generalledger accounts. All purchases of materials on account are recorded as adebit to Materials in the general ledger. (The corresponding credit is toAccounts Payable.) The materials account is a control account that issupported by a subsidiary materials ledger containing an individual accountfor each type of material carried in stock. Periodically, the balance of thecontrol account and the total of the subsidiary ledger accounts arecompared, and any significant variation between the two is investigated.
Recall and Review 1
Dennis Company predicts that it will use 200,000 lb of material during the
year. Dennis anticipates that it will cost $25 to place each order. The annual
carrying cost per lb is $10.
1. Determine the most economical order quantity, using the EOQ formula. ______
2. Determine the total annual order and carrying cost at this level. _________
(After working this exercise, see page 102 for the solution.)
You should now be able to work the following:
Questions 1–16; Exercises 2-1 to 2-3; Problems 2-1 to 2-3; and Self-Study
Problem 1.
LO3Account for
materials and
relate materials
accounting to the
general ledger.
Chapter 2 – Accounting for Materials 79

Each of the individual materials accounts in the materials ledger shows(1) the quantity on hand and (2) the cost of the materials. To keep thisinformation current, it is necessary to record in each individual account, ona timely basis, the quantity and the cost of materials received, issued, andon hand. The materials ledger accounts are usually maintained on computerfiles similar in design to the one shown in Figure 2-10.
Copies of the purchase order and receiving report are approved by thepurchasing agent and sent to the accounting department. Upon receivingthe purchase order, the accountant enters the date, purchase order number,and quantity in the ‘‘On Order’’ columns of the appropriate materials ledgeraccount. When materials arrive, the accounting department’s copy of thereceiving report serves as the basis for posting the receipt of the materialsto the materials ledger account. The posting shows the date of receipt, thenumber of the receiving report, the quantity of materials received, and theirunit and total cost.
When materials are issued, two copies of the materials requisition go to theaccounting department. One copy is used in posting the cost of requisitionedmaterials to the appropriate accounts in the job cost ledger (individual jobs inprocess) and factory overhead ledger (individual factory overhead accounts).Direct materials are charged to the job to which they were issued, and indirectmaterials are charged to the appropriate factory overhead account. The othercopy of the materials requisition becomes the basis for posting to the materialsledger accounts. The posting shows the date of issue, the number of therequisition, the quantity of materials issued, and their unit and total cost.
When materials are returned to the storeroom, a copy of the returnedmaterials report goes to the accounting department. The cost of thereturned materials is entered on the report and posted to the appropriatematerials ledger account. The cost assigned to the returned materials shouldbe the same as that recorded when the materials were issued to the factory.
The copy of the returned materials report is then routed to the costaccountant in charge of the job cost and factory overhead ledgers. Directmaterials returned are credited to the specific job for which they wereinitially issued, and indirect materials returned are credited to the appro-priate factory overhead account.
After each receipt and issue of materials is posted to the materials ledgeraccounts, the balances are updated. These updates could be made at the end ofthe accounting period, when ending inventories are determined for financialreporting purposes. However, to wait until then would not make it possible todetermine when stock of individual items were falling below minimumrequirements. Most companies now have automated inventory systems thatutilize online information processing, such as bar coding and optical scanningtechnology to update the inventory records on a ‘‘real-time’’ basis.
Determining the Cost of Materials IssuedAn important area of materials accounting is the costing of materialsrequisitioned from the storeroom for factory use. The unit cost of incomingmaterials is known at the time of purchase. The date of each purchase is
80 Principles of Cost Accounting

Figure 2-10 Materials Ledger Account
Description
Maximum Minimum
Location in Storeroom
Stores Ledger Acct. No.
Bin 8
141110,000 BD.FT.
Hard Rock Maple Plywood
30,000 BD.FT.
BALANCEISSUEDRECEIVEDON ORDER
ReceivingReport No./(ReturnedShipping
Order No.)
Date PurchaseOrder No.
Quantity UnitPrice
Amount Quantity UnitPrice
Amount Quantity UnitPrice
MaterialsRequisition/(ReturnedMaterials
Report No.)
Quantity Amount
Jan. 156
212324
1982 20,000825 500
10,0005 2,625 00 49,875 009,500 5 25
52,500 005 2525
20,000 5 25 105,000 00(234) 500 5 2,625 00 152,250 0029,000 5 2525
154,875 0029,500 5 25
834 1,000 5 5,250 00 147,000 0028,000 5 2525
Ch
ap
ter
2–
Acco
un
ting
for
Ma
teria
ls8
1

also known, but the materials on hand typically include items purchased ondifferent dates and at different prices. Items that look alike usually arecommingled in the storeroom. As a result, it may be difficult or impossibleto identify an issue of materials with a specific purchase when determiningwhat unit cost should be assigned to the materials being issued.
Several practical methods of solving this problem are available. In selectingthe method to be employed, the accounting policies of the firm and the federaland state income tax regulations must be considered. As the methods arediscussed, it is important to remember that the flow of materials does not dictatethe flow of costs. The flow of materials is the order in which materials areactually issued for use in the factory. The flow of costs is the order inwhich unit costs are assigned to materials issued. The following examplesassume the use of a perpetual inventory system where the materials ledgeraccounts are updated each time materials are received or issued.
First-In, First-Out Method. The first-in, first-out (FIFO) method ofcosting has the advantage of simplicity. The FIFO method assumes thatmaterials issued are taken from the oldest materials in stock. Therefore, thematerials are costed at the prices paid for the oldest materials. In manycompanies, the flow of costs using FIFO closely parallels the physical flowof materials. For example, if materials have a tendency to deteriorate instorage, the oldest materials would be issued first. However, as notedpreviously, the flow of costs does not have to be determined on the basis ofthe flow of materials. As a result, any organization may use FIFO.
The FIFO method can be illustrated using the data below. (Note that,for simplicity, the ‘‘On Order’’ columns were omitted from the followingmaterials ledger accounts.)
Dec. 1 Balance, 1,000 lb @ $20
10 Issued 500 lb
15 Purchased 1,000 lb @ $24
20 Issued 250 lb
26 Issued 500 lb
28 Purchased 500 lb @ $26
30 Issued 500 lb
31 Balance, 750 lb
Using FIFO, we would assign costs to materials issued during themonth and to materials on hand at the end of the month as follows (also seeFigure 2-11: First-In, First-Out Method):
Dec. 10 Issued from the December 1 balance: 500 lb @ $20, total cost, $10,000.
20 Issued from the December 1 balance: 250 lb @ $20, total cost, $5,000.
26 Issued from the December 1 balance: 250 lb @ $20, total cost, $5,000.
Issued from the December 15 purchase: 250 lb@ $24, total cost, $6,000.
Total cost of materials issued: $5,000 þ $6,000 ¼ $11,000.
30 Issued from the December 15 purchase: 500 lb @ $24, total cost, $12,000.
31 The ending inventory of materials, 750 lb, consists of the following:
82 Principles of Cost Accounting

Date of Purchase Lb Unit Cost Total CostDecember 15 . . . . . . 250 $24 $ 6,000
December 28 . . . . . . 500 26 13,000
750 $ 19,000
As illustrated in the example, ending inventories using FIFO arecosted at the prices paid for the most recent purchases. With an ending
Figure 2-11 Comparison of Inventory Valuation Methods
1
2
3
4
5
6
7
8
9
10
11
12
13
14
15
16
17
18
19
20
21
22
23
24
25
26
27
28
29
30
31
32
33
34
35
36
37
38
39
40
41
42
43
44
45
46
47
48
A B C D E F G H I J
First-In, First-Out Method
Received Issued Balance
Date Quantity Unit Price Amount Quantity Unit Price Amount Quantity Unit Price Amount
Dec. 1 1,000 20.00 20,000.00
10 500 20.00 10,000.00 500 20.00 10,000.00
15 1,000 24.00 24,000.00 500 20.00
1,000 24.00 34,000.00
20 250 20.00 5,000.00 250 20.00
1,000 24.00 29,000.00
26 250 20.00
250 24.00 11,000.00 750 24.00 18,000.00
28 500 26.00 13,000.00 750 24.00
500 26.00 31,000.00
30 500 24.00 12,000.00 250 24.00
500 26.00 19,000.00
Last-In, First-Out method
Received Issued Balance
Date Quantity Unit Price Amount Quantity Unit Price Amount Quantity Unit Price Amount
Dec. 1 1,000 20.00 20,000.00
10 500 20.00 10,000.00 500 20.00 10,000.00
15 1,000 24.00 24,000.00 500 20.00
1,000 24.00 34,000.00
20 250 24.00 6,000.00 500 20.00
750 24.00 28,000.00
26 500 24.00 12,000.00 500 20.00
250 24.00 16,000.00
28 500 26.00 13,000.00 500 20.00
250 24.00
500 26.00 29,000.00
30 500 26.00 13,000.00 500 20.00
250 24.00 16,000.00
Moving Average Method
Received Issued Balance
Date Quantity Unit Price Amount Quantity Unit Price Amount Quantity Unit Price Amount
Dec. 1 1,000 20.00 20,000.00
10 500 20.00 10,000.00 500 20.00 10,000.00
15 1,000 24.00 24,000.00 1,500 22.6667 34,000.00
20 250 22.6667 5,666.67 1,250 22.6667 28,333.33
26 500 22.6667 11,333.33 750 22.6667 17,000.00
28 500 26.00 13,000.00 1,250 24.00 30,000.00
30 500 24.00 12,000.00 750 24.00 18,000.00
Chapter 2 – Accounting for Materials 83

inventory of 750 lb, 500 lb are assigned a unit cost of $26, the unit cost ofthe December 28 purchase. The remaining 250 lb on hand are priced at$24 per lb, the unit cost of the next most recent purchase on December15.
Last-In, First-Out Method. The last-in, first-out (LIFO) method of cost-ing materials, as the name implies, assumes that materials issued formanufacturing are the most recently purchased materials. Thus, materialsissued are costed at the most recent purchase prices, and inventories onhand at the end of the period are costed at prices paid for the earliestpurchases. The LIFO method of costing closely approximates the physicalflow of materials in some industries. For example, in the smelting of ironore, the raw material is stored in mountainous piles. As ore is needed forproduction, it is drawn from the pile in such a way that the material beingused is the last ore to have been received. As emphasized previously,however, physical flow does not have to determine the costing methodused.
Using the same data given to illustrate the FIFO method, we determinecosts under the LIFO method as follows (also see Figure 2-11: Last-In,First-Out Method):
Dec. 10 Issued from the December 1 balance: 500 lb @ $20, total cost, $10,000.
20 Issued from the December 15 purchase: 250 lb @ $24, total cost, $6,000.
26 Issued from the December 15 purchase: 500 lb @ $24, total cost, $12,000.
30 Issued from the December 28 purchase: 500 lb @ $26, total cost, $13,000.
31 The ending inventory of materials, 750 lb, consists of the following:
Date of Purchase Lb Unit Cost Total CostBalance, December 1 . . . . . . 500 $20 $10,000
December 15 . . . . . . . . . . . . . 250 24 6,000
750 $16,000
As illustrated in the example, ending inventories under LIFO are costedat the prices paid for the earliest purchases. With an ending inventory of750 lb, 500 lb are priced at the beginning inventory unit cost of $20 per lband the remaining 250 lb are costed at the $24 per lb price of the earliestpurchase.
Moving Average Method. The moving average method assumes that thematerials issued at any time are simply withdrawn from a mixed group oflike materials in the storeroom and that no attempt is made to identifythe materials as being from the earliest or the latest purchases. Thismethod has the disadvantage of requiring more frequent computationsthan the other methods. However, the use of software packages hasovercome this disadvantage, and many firms have adopted this method.A basic requirement of the moving average method is that an average
84 Principles of Cost Accounting

unit price must be computed every time a new lot of materials isreceived, and this average unit price must be used to cost all issues ofmaterials until another lot is purchased. Therefore, the issuances in theillustration would be computed as follows (also see Figure 2-11, MovingAverage Method):
Dec. 10 Issued from the December 1 balance: 500 lb @ $20, total cost, $10,000.
15 The balance of materials on hand on December 15 consists of 500 lb fromDecember 1 and 1,000 lb acquired on December 15, for a total of 1,500 lbthat cost $34,000. The average cost is $22.6667 per lb ($34,000/1,500).
20 Issued 250 lb @ $22.6667, total cost, $5,666.67.
26 Issued 500 lb @ $22.6667, total cost, $11,333.33.
28 The balance of materials on hand on December 28 consists of 750 lbcosting $17,000 (purchased prior to December 28) and 500 lb @ $26(purchased on December 28) costing $13,000. The total cost is $30,000 for1,250 lb, representing an average cost of $24 per lb ($30,000/1,250).
30 Issued 500 lb @ $24, total cost, $12,000.
31 The ending inventory of materials is $18,000, consisting of 750 lb at $24per lb.
Analysis of FIFO, LIFO, and Moving Average. FIFO, LIFO, and movingaverage are the most commonly used methods of inventory costing. Any ofthese methods may be adopted to maintain the materials ledger. Because noone method best suits all situations, the method chosen should be the onethat most accurately reflects the income for the period in terms of thecurrent economic conditions. One factor to consider is the effect thecosting method has on reported income for tax purposes. A higher taxableincome will subject a firm to higher taxes.
In an inflationary environment, LIFO is sometimes adopted so that thehigher prices of the most recently purchased materials may be chargedagainst the increasingly higher sales revenue. The resulting lower grossmargin is assumed to reflect a more accurate picture of earnings because thefirm will have to replace its inventory at the new higher costs. Also, thelower gross margin, brought about by the use of the LIFO method, resultsin a smaller tax liability for the firm.
To illustrate the effects that the different costing methods have onprofit determination, assume that A, B, and C are competing companiesthat use FIFO, moving average, and LIFO, respectively. The companieshave no beginning inventories, and they purchase identical materials atthe same time, as follows (assume also that each purchase is for oneunit):
Purchase No. 1 @ $0.10
Purchase No. 2 @ $0.50
Purchase No. 3 @ $0.90
Assume that one unit of material is used and sold at a price of $1.00after the last purchase has been made, that operating expenses are $.08, andthat the tax rate is 50%. The net income is calculated as follows:
Chapter 2 – Accounting for Materials 85

Co. AFIFO
(Per Unit)
Co. BMoving Avg.
(Per Unit)
Co. CLIFO
(Per Unit)Net sales . . . . . . . . . . . . . . . . . . . . . . . . $1.00 $1.00 $1.00
Less cost of goods sold . . . . . . . . . . 0.10 0.50* 0.90
Gross margin on sales . . . . . . . . . . . $0.90 $0.50 $0.10
Operating expenses . . . . . . . . . . . . . 0.08 0.08 0.08
Income before income taxes . . . . . $0.82 $0.42 $0.02
Less income taxes (50%) . . . . . . . . . 0.41 0.21 0.01
Net income . . . . . . . . . . . . . . . . . . . . . $0.41 $0.21 $0.01
*$0.10 þ $0.50 þ $0.90 ¼ $1.50/3 units ¼ $0.50 per unit.
As shown in the example, LIFO costing has a definite tax advantagewhen prices are rapidly rising. Notice that Company C pays $0.01 per unitfor taxes, while Companies A and B pay taxes per unit of $0.41 and $0.21,respectively. Thus, Company C has after-tax cash flow of $0.99 ($1.00 –$0.01) from each sales dollar to pay for replacement merchandise, operatingexpenses, and dividends, while Company A has only $0.59 after-tax cashflow ($1.00 – $0.41) and Company B has only $0.79 after-tax cash flow($1.00 – $0.21) available from each dollar of sales.
As previously mentioned, each unit of material currently costs $0.90(Purchase No. 3). Therefore, Company A requires additional funding of$0.31 ($0.90 – $0.59) and Company B requires additional funding of $0.11($0.90 – $0.79) just to replace a unit of material. Only Company C canreplace materials and still have a positive cash flow of $0.09 ($0.99 – $0.90).The companies, using their respective costing methods and the data for thethree purchases, have the following ending materials inventory balances forthe two remaining units:
Company A (FIFO) $1.40 ($0.50 þ $0.90)
Company B (moving average) $1.00 ($0.50 þ $0.50)
Company C (LIFO) $0.60 ($0.10 þ $0.50)
Company C has the most conservatively valued inventory at $0.60, andCompany A shows the highest inventory value at $1.40. The Company Ainventory value also may be detrimental because inventory often is subject tostate and local property taxes that are based on the inventory valuation chosenby the company. It is important to realize that differences between the threemethods usually will not be as extreme as they were in this example. Companiesthat turn their inventory over very rapidly will not be as concerned with thechoice of methods as will companies that hold their inventory for a longer time.
Many companies have adopted the LIFO method to match currentmaterials costs with current revenue as well as to minimize the effect ofincome taxes in periods of rising prices. Companies considering the adop-tion of the LIFO method, however, should carefully analyze economicconditions and examine the tax regulations that pertain to LIFO. If thereshould be a downward trend of prices, these companies would probablydesire to change to the FIFO method to have the same competitive
86 Principles of Cost Accounting

advantages that were gained by using LIFO when prices were rising.However, the LIFO election cannot be rescinded for tax purposes unlessauthorized or required by the Internal Revenue Service.
Accounting Procedures
The purpose of materials accounting is to provide a summary from thegeneral ledger of the total cost of materials purchased and used inmanufacturing. The forms commonly used in assembling the required datahave already been discussed. The purchase invoices provide the informationneeded to prepare the entry in the purchases journal. Note that forillustrative purposes in this text, all entries are recorded in general journalformat. At the end of the month, the total of the materials purchased onaccount during the month is posted as a debit to Materials and as a credit toAccounts Payable. The materials account in the general ledger serves as acontrol account for the subsidiary materials ledger.
All materials issued during the month and materials returned to stockare recorded on a Summary of Materials Issued and Returned form(Figure 2-12). When the summary is completed at the end of the month,the total cost of direct materials issued, $22,660.50 in Figure 2-12, isrecorded by debiting Work in Process and crediting Materials. The totalcost of indirect materials issued, $1,139.50 in this example, is recorded bydebiting Factory Overhead and crediting Materials.
Any undamaged materials returned to the storeroom should also berecorded on the Summary of Materials Issued and Returned so that thetotals may be recorded at the end of the month. The entries required torecord undamaged materials returned are the reverse of the entries requiredto record materials requisitioned. Thus, the total cost of direct materialsreturned to the storeroom, $779.20 in Figure 2-12, should be debited toMaterials and credited to Work in Process, while the total cost of indirectmaterials returned, $27.50 in this example, should be debited to Materialsand credited to Factory Overhead.
Any materials returned to the original vendors should be debited toAccounts Payable and credited to Materials. All transactions relating tomaterials should be recorded so that the balance of the materials account inthe general ledger will represent the cost of materials on hand at the end of aperiod. The balance of the materials account in the general ledger may beproven by comparing it to the total of the individual materials ledger accountbalances. A summary of the procedures involved in accounting for materialsis shown in Figure 2-13, which presents the recordings required for themore typical materials transactions, both at the time of the transaction andat the end of the period. At the time of the transaction, the recordings to bemade affect the subsidiary ledgers, such as the materials ledger and the jobcost ledger. At the end of the period, the recordings to be made affect thecontrol accounts for materials, work in process, and factory overhead in thegeneral ledger. Note that in most computerized accounting systems thegeneral ledger accounts are updated during the period, at the same timethat transactions are recorded in the subsidiary ledgers.
Chapter 2 – Accounting for Materials 87

Figure 2-12 Summary of Materials Issued and Returned
SUMMARY OF MATERIALS ISSUED AND RETURNED Month Ending
Materials Issued Materials Returned to Storeroom
Indirect MaterialsDirect MaterialsIndirect MaterialsDirect MaterialsDate
Req. No. Report No.Job Amount Amount Job Amount Amount
OverheadAcct. No.
OverheadAcct. No.
8111417171819202427293031
825826827828829830831832833834835836837838
315316317317316317318319319320321322321320
$2,150 003,210 00
280 00415 00340 00820 00290 00224 20975 90
5,250 006,500 00
550 00785 40870 00
$22,660 50
31213121
3121
3121
$ 440 00132 50
135 00
432 00
$1,139 50
232
233234
319
320321
$ 12 10
448 90318 20
$ 779 20
3121
3121
$ 12 50
15 00
$ 27 50
Jan. 31 2011
Jan. 5
88
Prin
cip
les
of
Co
st
Acco
un
ting

Inventory Verification. The materials ledger contains an account for eachmaterial used in the manufacturing process. Each account shows thenumber of units on hand and their cost. The materials ledger provides aperpetual inventory of the individual items of material in the storeroom.
Errors in recording receipts or issues of materials in the materials ledgermay affect the reliability of the inventory totals. To guard against error, thematerials on hand should be checked periodically against the individualmaterials ledger account balances. The usual practice is to count one lot ofmaterials at a time, spacing the time of the counts so that a complete check
Figure 2-13 Summary of Materials Transactions
Entry at Time of Transaction Entry at End of Accounting Period
TransactionSource
Document
Book ofOriginal
EntrySubsidiary
Ledger Posting
Sourceof
Data
Book ofOriginal
EntryJournal
Entry
Purchase ofmaterials
Vendor’sInvoiceReceivingReport
PurchasesJournal
MaterialsLedger
PurchasesJournal
None MaterialsAccounts Payable
Materialsreturnedto vendor
ReturnShippingOrder
GeneralJournal
MaterialsLedger
GeneralJournal
None AccountsPayable Materials
Payment ofinvoices
ApprovedVoucher
CashPaymentsJournal
None CashPaymentsJournal
None AccountsPayable Cash
Direct materialsissued
MaterialsRequisitions
None Materials LedgerJob Cost Ledger
MaterialsSummary
GeneralJournal
Work in ProcessMaterials
Indirect materi-als issued
MaterialsRequisitions
None Materials LedgerFactoryOverhead Ledger
MaterialsSummary
GeneralJournal
Factory OverheadMaterials
Direct materialsreturned fromfactory tostoreroom
ReturnedMaterialsReport
None MaterialsLedgerJob Cost Ledger
MaterialsSummary
GeneralJournal
MaterialsWork in Process
Indirectmaterialsreturned fromfactory tostoreroom
ReturnedMaterialsReport
None MaterialsLedgerFactoryOverhead Ledger
MaterialsSummary
GeneralJournal
MaterialsFactory Overhead
Inventoryadjustment:
(a) Materials onhand lessthan materi-als ledgerbalance
InventoryReport
GeneralJournal
FactoryOverhead LedgerMaterials Ledger
GeneralJournal
None Factory OverheadMaterials
(b) Materials onhand morethan materi-als ledgerbalance
InventoryReport
GeneralJournal
FactoryOverhead LedgerMaterials Ledger
GeneralJournal
None Factory OverheadMaterials
Chapter 2 – Accounting for Materials 89

of all inventories in the storeroom can be made within a fixed period oftime, such as three months. These periodic checks have the advantage ofeliminating the costly and time-consuming task of counting the entireinventory at one time. To guard against carelessness or dishonesty, thecount should be made by someone other than the storeroom keeper or thestores ledger clerk.
The person making the count should prepare an inventory reportsimilar to the one shown in Figure 2-14. If the total indicated in the countdiffers from the balance in the materials ledger account, an immediatecorrecting entry should be made in the affected materials ledger account.The correcting entries in the general ledger accounts may be made intotal at the end of the month, prior to the preparation of the monthlyfinancial statements. If the materials on hand exceed the balance in thematerials control account, the balance should be increased by the followingentry:
Materials . . . . . . . . . . . . . . . . . . . . . . . . . . . . . . . . . . . . . . . . . . . . . . . . . . . . . . . . . . . . xxx
Factory Overhead (Inventory Short and Over) . . . . . . . . . . . . . . . . . . . . . . . xxx
Figure 2-14 Inventory Report. (Compares book inventory and physical
inventory quantities.)
INVENTORY REPORTHAWKE
MFGMaterial
Location in storeroom
Stores ledger acct. no.
Date of verification
Hard Rock Maple Plywood
Bin 8
1411
January 31, 2011
Units in storeroom
Units in receiving
department
Total number units on hand
Balance per stores ledger
Difference
Counted by
Supervised by
BD.FT.
BD.FT.
BD.FT.
BD.FT.
BD.FT.
90 Principles of Cost Accounting

If the amount of materials on hand is less than the balance in thematerials control account, as was the case in Figure 2-14, the balance shouldbe decreased by the following entry:
Factory Overhead (Inventory Short and Over) . . . . . . . . . . . . . . . . . . . . . . . . . xxx
Materials . . . . . . . . . . . . . . . . . . . . . . . . . . . . . . . . . . . . . . . . . . . . . . . . . . . . . . . . . . xxx
Such inventory differences are almost always a shortage and may arise fromdamage or shrinkage during handling, theft, or issuing quantities to productionthat are in excess of those called for and recorded. Shortages (or overages) arerecorded in a factory overhead account, usually entitled Inventory Short andOver, because they cannot be easily identified with specific jobs.
Visual Aid. For a cost accounting system to function properly, eachemployee must understand the assigned duties and the purpose of thevarious forms and records. Figure 2-15 shows the interrelationship of theaccounts and how internal control procedures can be established.
Figure 2-15 Interrelationship of Materials Documents and Accounts
PURCHASE
REQUISITION
PURCHASE
ORDER
VENDORRECEIVING
REPORT
MATERIALSREQUISITIONS
MATERIALSSUMMARY
DIRECT INDIRECT
TOTAL TOTAL
PURCHASES JOURNAL
DEBIT CREDIT
MATERIALS
TOTAL
ACCOUNTSPAYABLE
MATERIALS LEDGER ACCOUNT
MATERIALS LEDGER:
BAL.OUTIN
INDIRECT MATERIALS
DEPT. AMOUNT
JOB ORDER COST SHEET
JOB COST LEDGER:
FACTORY OVERHEAD LEDGER:
ORDEPT. WORK IN PROCESS
GENERAL LEDGERCONTROL ACCOUNTS
SUBSIDIARYLEDGERS
MATERIALS
WORK IN PROCESS
FACTORYOVERHEAD
INVOICE
Chapter 2 – Accounting for Materials 91

Just-in-Time Materials Control
Boston Company is trying to decide whether or not to change from atraditional inventory system to a just-in-time (JIT) system. Thepresident, Teresa Francona, wants to know whether this changemerely will affect how goods are ordered and produced, or if it willalso impact the financial health of the company, as well as theaccounting system itself. The controller, Donna Ortiz, is preparing areport estimating any expected cost savings and changes to theaccounting system resulting from a move to JIT.
. What are some of the costs that should be affected by the introduc-tion of a JIT system?
. Should Francona’s customers reap any benefits from the change toJIT?
. Will Donna have to make any changes to the way that inventory isaccounted for under a JIT system?
These are some of the questions that will be answered in thissection of the chapter and in Mini-Case 2 at the end of the chapter.
In a just-in-time (JIT) inventory system, also known as a leanproduction system, materials are delivered to the factory immediately priorto their use in production. A lean production system significantly reducesinventory carrying costs by requiring that the raw materials be delivered justin time to be placed into production. Also, many manufacturing functions that
Recall and Review 2
Using FIFO, LIFO, and moving average perpetual inventory costing, and the
following information, determine the cost of the May 31 inventory under
each of the above inventory costing methods:
May 1 Beginning inventory 500 yards @ $5.00 per yard
10 Purchased 250 yards @ $5.25 per yard
20 Issued 350 yards into production
30 Issued 250 yards into production
FIFO________; LIFO_________; Moving Average______________
(After working this exercise, see page 102 for the solution.)
You should now be able to work the following:
Questions 17–20; Exercises 2-4 to 2-11; Problems 2-4 to 2-8 and P2-14R, the
review problem for Chapters 1 and 2.
LO4Account for
inventories in
a just-in-time (lean
production) system.
92 Principles of Cost Accounting

were performed in individual departments in a traditional manufacturingsystem are combined into work centers, called manufacturing cells.
Work in process inventory is minimized by eliminating inventorybuffers between manufacturing cells. For example, the work is performedon a unit in Manufacturing Cell 1 only after the department receives therequest from Manufacturing Cell 2 for a certain number of the units. Thiscontrasts with traditional ‘‘push’’ manufacturing systems, as illustrated inFigure 2-16, which produce goods for inventory with the hope that thedemand for these goods then will be created. Disadvantages of a ‘‘push’’manufacturing system include having too many dollars invested in inven-tory; defects not being detected, because partially completed goods areinventoried rather than completed immediately; and obsolete products dueto the long lead time from start to finish.
The JIT ‘‘pull’’ manufacturing system credo is, ‘‘Don’t make anythingfor anybody until they ask for it.’’ For JIT to work successfully, a highdegree of coordination and cooperation must exist between the supplierand the manufacturer, among manufacturing work centers, and betweenthe manufacturer and the customer. For example, Wal-Mart works closelywith its major suppliers, such as Procter & Gamble and Lever Brothers,sharing sales data as to the quantity and timing of sales, so that goods arrivefor shelving just in time to meet customer demand. This coordinationbetween supplier, shipper, manufacturer, and customer is known as supplychain management. An illustration of a JIT ‘‘pull’’ production systemappears in Figure 2-17.
Performing all of the production in one or two manufacturing cells hasmany advantages. These include fewer and shorter movements of materials,production in smaller lot sizes because other products do not also have to
Figure 2-16 Traditional ‘‘Push’’ System of Production Flow
Purchasing
As
Nee
ded
As
Need
ed
Cutting andAssembly Department
Testing andFinishing Department
Finished GoodsStoreroom
Raw MaterialsStoreroom Sales
Wh
en
So
ld
Work in ProcessStoreroom
Chapter 2 – Accounting for Materials 93

be produced in the same cell, and more worker motivation and satisfactiondue to the teamwork approach within the cell. The workers within a celllearn all of the tasks performed in the cell, and they also performmaintenance when ‘‘pull’’ production results in downtime.
Just-in-time production techniques first were utilized by Toyota Mo-tors where a kanban (card) indicated a manufacturing cell’s need for moreraw materials or component parts. These techniques have become popularwith U.S. manufacturers in recent years. Dell, General Electric, Harley-Davidson, Hewlett-Packard, IBM, John Deere, and Xerox are just afew examples of the many U.S. companies that have adopted the principlesof lean production. For example, Dell can produce and ship a customizedcomputer to the customer within 36 hours, without ordering componentsor doing any assembly until the customer’s order is received.1
Although lean production has its roots in the Toyota ProductionSystem of the 1950s, it took decades to catch on with U.S. manufacturers.Today, the service sector’s adoption of lean techniques is moving at a muchfaster pace. ‘‘Lean experts’’ in manufacturing companies are being hired byhospitals and banks at 30 to 40% pay increases. Banks, for example, areusing these experts for projects such as identifying bottlenecks in mortgageprocessing so that decisions on the prospective loans can be made inone day.2
JIT and Cost Control
Reducing inventory levels through the use of lean production techniquesmay increase processing speed, thereby reducing the time it takes for a unit
Figure 2-17 JIT ‘‘Pull’’ System of Production Flow
Purchasing Sales
The need formore materials
to cut andassemble triggers
the requestto purchasing
The need formore finishedgoods triggersthe request for
more assembledproducts
Customer ordertriggers therequest for
more finishedgoods
3 2 1
ManufacturingCell 1
(Cutting andAssembly)
ManufacturingCell 2
(Testing andFinishing)
1 ‘‘Inside Dell’s Lean Machine,’’ Works Management, December 2002.2 ‘‘Toyota’s Success Pleases Proponents of ‘Lean,’’’ USA Today, April 4, 2007.
94 Principles of Cost Accounting

to make it through production. For example, if 10,000 units are producedeach day and the average number of units in work in process is 40,000, thenthe throughput time, or time that it takes a unit to make it through thesystem, is 40,000/10,000, or four days. If the same daily output can beachieved while reducing the work in process by 75% or 30,000 units, thethroughput time will be reduced to one day, 10,000/10,000, and thevelocity, or speed with which units are produced in the system, will havequadrupled. If production speed can be increased dramatically, all productsmay be made to order, thus eliminating the need for finished goodsinventory. Also, reducing throughput time can lower costs because therewill be fewer nonvalue-added activities—operations that include costs butdo not add value to the product, such as moving, storing, and inspecting theinventories.
If the velocity of production is quadrupled, as in the preceding example,the inventory carrying costs can be reduced. For example, assume an annualinventory carrying cost percentage of 20% and an average work in processinventory of $400,000, resulting in annual carrying costs of $80,000(20% � $400,000). Further assume that through the use of JIT productiontechniques, the velocity of production is quadrupled without changing thetotal annual output, thus necessitating only one-fourth as much work inprocess (WIP). The new annual carrying costs would be calculated asfollows:
Carrying cost percentage � Average WIP ¼ Annual carrying cost
20% � (1/4 � $400,000) ¼ $20,000
or a $60,000 reduction from the previous level of $80,000.Another advantage of reduced throughput time is increased customer
satisfaction due to quicker delivery. Studies have shown that delivery speedand delivery reliability improve by 70 to 90% in a lean production system.3
Also, production losses are reduced due to not having great quantities ofpartially completed units piling up at the next workstation before an errorin their production is detected and corrected.
JIT and Cost Flows
Figure 2-18 contrasts the journal entries made in a traditional manufactur-ing cost accounting system with the entries made in a JIT system. Back-flush costing is the name for the accounting system used with leanmanufacturing. It derives its name from the fact that costs are not ‘‘flushedout’’ of the accounting system and charged to the products until the goodsare completed and sold.
3 ‘‘How Customers Benefit from Lean Manufacturing Strategies,’’ page 1, http://www.strategosinc.com/lean_benefits_5.htm (visited February 10, 2009).
Chapter 2 – Accounting for Materials 95

Entries A and B in Figure 2-18 indicate that a single account, Raw andIn-Process, is used in backflush costing for both raw materials and work inprocess inventories. This is done because, in a lean production system,raw materials are issued to production as soon as they are received fromthe supplier, thus negating the need for storing materials and creating aseparate raw materials inventory account. Also, note that a single journalentry, entry A in Figure 2-18, reflects both the purchase and the issuanceof materials into production using backflush costing. Entries C and Dillustrate that a single account, Conversion Costs, contains both directlabor and factory overhead costs in a backflush system. This is becausedirect labor usually is so insignificant in a highly automated JIT settingthat it is not cost effective to account for it as a separate category ofmanufacturing cost.
Entry F, and the ‘‘No Entry’’ in E, illustrate that materials, labor, andoverhead costs are not attached to products in a backflush system until theyare completed. The rationale for this approach is that products movethrough the system so rapidly in a lean production environment that itwould not be cost effective to track production costs to them while inprocess. Critics of backflush costing argue that it is not consistent withGenerally Accepted Accounting Principles (GAAP) because it does notaccurately account for inventories. Proponents of backflush costing arguethat Work in Process and Finished Goods are immaterial in a lean
Figure 2-18 Journal Entries for Traditional and Backflush Accounting
Transaction Journal Entries: Traditional System Journal Entries: Backflush SystemA. Purchase of raw
materialsMaterials . . . . . . . . . . . . . 50,000 Raw and In-Process . . . . . 50,000
Accounts Payable . . . 50,000 Accounts Payable . . . . 50,000
B. Raw materialsrequisitioned toproduction
Work in Process . . . . . . . 50,000 No Entry
Materials . . . . . . . . . . . 50,000
C. Direct labor cost Work in Process . . . . . . . 25,000 Conversion Costs . . . . . . . 25,000
Payroll . . . . . . . . . . . . . 25,000 Payroll . . . . . . . . . . . . . . . 25,000
D. Manufacturingoverhead costsincurred
Factory Overhead . . . . . 75,000 Conversion Costs . . . . . . . 75,000
Various Credits . . . . . 75,000 Various Credits . . . . . . . 75,000
E. Transfer of factoryoverhead costs towork in process
Work in Process . . . . . . . 75,000 No Entry
Factory Overhead . . . 75,000
F. Completion of allproducts
Finished Goods . . . . . . . 150,000 Finished Goods . . . . . . . . 150,000
Work in Process . . . . . 150,000 Raw and In-Process . . . 50,000
Conversion Costs . . . . . 100,000
G. Sale of all products Cost of Goods Sold . . . . 150,000 Cost of Goods Sold . . . . . 150,000
Finished Goods . . . . . 150,000 Finished Goods . . . . . . 150,000
96 Principles of Cost Accounting

production environment and, therefore, their omission does not materiallymisstate the financial statements.
Note that different companies choose different points in the productionprocess, called trigger points, from the purchase of raw materials to thesale of finished goods, at which to record journal entries in a backflushsystem. Accountants make this decision based on what points adequatelydescribe the product flows with the least amount of recording. In Figure 2-19,the three trigger points are: (1) the purchase of materials; (2) the comple-tion of work in process; and(3) the sale of finished goods. If the only triggerpoints were the purchase of materials and the sale of finished goods, entriesF and G in Figure 2-18 would be:
F. No entry
G. Cost of Goods Sold . . . . . . . . . . . . . . . . . . . . . . . . . . . . . . . . . . . . . . . . . . . . . . 150,000
Raw and In-Process . . . . . . . . . . . . . . . . . . . . . . . . . . . . . . . . . . . . . . . . . . . . 50,000
Conversion Costs . . . . . . . . . . . . . . . . . . . . . . . . . . . . . . . . . . . . . . . . . . . . . . 100,000
Scrap, Spoiled Goods, and Defective WorkManufacturing operations usually produce some imperfect units that can-not be sold as regular items. The controls over imperfect items andoperations that waste materials are important elements of inventory con-trol. Scrap materials may result naturally from the production process, orthey may be spoiled or defective units that result from avoidable orunavoidable mistakes during production. Because the sale of imperfectitems tends to damage a company’s reputation, most companies introducequality control techniques that prevent imperfect items from being sold.Also, many companies are helping the environment by recycling andreducing waste. For example, 99% of scrap steel generated by Toyota
Figure 2-19 Three Trigger Points: Purchase of Materials, Completion of
Goods, Sale of Goods
100,000
150,000
RAW AND IN-PROCESS
50,000 50,000
150,000
FINISHED GOODS
50,000
150,000
COST OF GOODS SOLD
75,000
100,000 100,000
CONVERSION COSTS
25,000
1
2
3
LO5Account for
scrap materi-
als, spoiled goods,
and defective work.
Chapter 2 – Accounting for Materials 97

plants is now recycled, and total recycling at its Georgetown, KY, plantalone is in excess of 100,000 tons per year, as well as 40,000 light bulbs.4
Since scrap, spoiled goods, and defective work usually have some value,each of their costs is accounted for separately.
Scrap Materials
The procedures to use in accounting for scrap are determined by theexpected sales value of the scrap. When the scrap value is small, no entry ismade for it until the scrap is sold, at which time the following journal entrywould be made:
Cash (or Accounts Receivable) . . . . . . . . . . . . . . . . . . . . . . . . . . . . . . . . . . . . . . . . xxx
Scrap Revenue . . . . . . . . . . . . . . . . . . . . . . . . . . . . . . . . . . . . . . . . . . . . . . . . . . . . xxx
The revenue from scrap sales is usually reported as ‘‘Other Income’’ inthe income statement. If the accountant chooses to treat the revenue fromscrap as a reduction in manufacturing costs, rather than as ‘‘Other Income,’’Work in Process and the individual job in the job cost ledger may becredited if the scrap can be readily identified with a specific job. If the scrapcannot be identified with a specific job, Factory Overhead may be credited.
When the value of the scrap is relatively high, an inventory file shouldbe prepared and the scrap transferred to a controlled materials storage area.If both the quantity and the market value of the scrap are known, thefollowing journal entries are made to record the inventory and thesubsequent sale:
Scrap Materials . . . . . . . . . . . . . . . . . . . . . . . . . . . . . . . . . . . . . . . . . . . . . . . . . . . . . . xxx
Scrap Revenue (or Work in Process or Factory Overhead) . . . . . . . . . . . . xxx
Transferred scrap to inventory.
Cash (or Accounts Receivable) . . . . . . . . . . . . . . . . . . . . . . . . . . . . . . . . . . . . . . . . xxx
Scrap Materials . . . . . . . . . . . . . . . . . . . . . . . . . . . . . . . . . . . . . . . . . . . . . . . . . . . . xxx
Sold scrap at inventoried market value.
If the market value of the scrap is not known, no journal entry is madeuntil the scrap is sold. At the time of sale, the following entry is thenrecorded:
Cash (or Accounts Receivable) . . . . . . . . . . . . . . . . . . . . . . . . . . . . . . . . . . . . . . . . xxx
Scrap Revenue (or Work in Process or Factory Overhead) . . . . . . . . . . . . xxx
Sold scrap.
Spoiled and Defective Work
Scrap is an unexpected by-product of the production of the primaryproduct. Spoiled or defective goods are not by-products but imperfect unitsof the primary product. Spoiled units have imperfections that cannot beeconomically corrected. They are sold as items of inferior quality or
4 ‘‘Steel Recycling,’’ www.toyotageorgetown.com/envsteel.asp (visited February 16, 2009).
98 Principles of Cost Accounting

‘‘seconds.’’ Defective units have imperfections considered correctablebecause the increase in market value by correcting the unit exceeds the costto correct it.
Spoiled Work. The loss associated with spoiled goods may be treated aspart of the cost of the job or department that produced the spoiled units, orthe loss may be charged to Factory Overhead and allocated among all jobsor departments. Generally, Factory Overhead is charged unless the lossresults from a special order and the spoilage is due to the type of workrequired on that particular order. In both cases, the spoiled goods arerecorded in Spoiled Goods Inventory at the expected sales price.
To illustrate, assume a garment manufacturer using job order costingcompletes an order for 1,000 jackets (Job 350) at the following unit costs:
Materials . . . . . . . . . . . . . . . . . . . . . . . . . . . . . . . . . . . . . . . . . . . . . . . . . . . . . . . . . . . . . . . . . $20
Labor . . . . . . . . . . . . . . . . . . . . . . . . . . . . . . . . . . . . . . . . . . . . . . . . . . . . . . . . . . . . . . . . . . . . 20
Factory overhead . . . . . . . . . . . . . . . . . . . . . . . . . . . . . . . . . . . . . . . . . . . . . . . . . . . . . . . . . 10
Total cost per unit . . . . . . . . . . . . . . . . . . . . . . . . . . . . . . . . . . . . . . . . . . . . . . . . . . . . . . . . . $50
The journal entry to record the costs of production is as follows:
Work in Process (Job 350) . . . . . . . . . . . . . . . . . . . . . . . . . . . . . . . . . . . . . . . . . . . . 50,000
Materials . . . . . . . . . . . . . . . . . . . . . . . . . . . . . . . . . . . . . . . . . . . . . . . . . . . . . . . . . . 20,000
Payroll . . . . . . . . . . . . . . . . . . . . . . . . . . . . . . . . . . . . . . . . . . . . . . . . . . . . . . . . . . . . 20,000
Factory Overhead . . . . . . . . . . . . . . . . . . . . . . . . . . . . . . . . . . . . . . . . . . . . . . . . . . 10,000
Recognized production costs for Job 350.
During the final inspection, 50 jackets are found to be inferior and areclassified as irregulars or seconds. They are expected to sell for $10 each. Ifthe unrecovered costs of spoilage are to be charged to Factory Overhead,the following entry is recorded:
Spoiled Goods Inventory . . . . . . . . . . . . . . . . . . . . . . . . . . . . . . . . . . . . . . . . . . . . . 500
Factory Overhead . . . . . . . . . . . . . . . . . . . . . . . . . . . . . . . . . . . . . . . . . . . . . . . . . . . . 2,000
Work in Process (Job 350) . . . . . . . . . . . . . . . . . . . . . . . . . . . . . . . . . . . . . . . . . . 2,500
Recognized spoiled goods at market value of $500 (50 jackets @ $10),charged Factory Overhead for loss of $2,000 (50 jackets @ $40),and reduced cost of Job 350 by $2,500 (50 jackets @ $50 because theloss is charged to all jobs).
If the loss from spoilage is caused by the unique production require-ments of Job 350, the entry to record the market value is as follows:
Spoiled Goods Inventory . . . . . . . . . . . . . . . . . . . . . . . . . . . . . . . . . . . . . . . . . . . . 500
Work in Process (Job 350) . . . . . . . . . . . . . . . . . . . . . . . . . . . . . . . . . . . . . . . . . 500
Recognized spoiled goods at market value and reduced thecost of Job 350 by the $500 sales price of spoiled goods.
Spoilage costs charged to Factory Overhead are allocated among all jobsin production. When spoilage is attributed to a specific job, however, theentire cost of spoilage is reflected in the cost of that job. In the example, Job350 will be charged with only a portion of the $2,000 loss from spoilage
Chapter 2 – Accounting for Materials 99

when Factory Overhead is allocated to all of the jobs worked on during theperiod. When Factory Overhead is not charged for the spoilage costs,however, the entire $2,000 loss is included in the total cost of Job 350. (Notehow the credit to Work in Process in the previous entry reduces the spoilageloss from the $2,500 cost of the 50 jackets included in Work in Process to$2,000, after considering the $500 sales value of the spoiled goods.)
Defective Work. The procedures used in recording the cost of defectivework are similar to those employed in accounting for spoiled goods. Thereare, however, additional costs for correcting the imperfections in defectiveunits. If these costs are incurred on orders that the company regularlyproduces, they are charged to Factory Overhead. For special orders, theadditional costs are charged to the specific job on which the defective workoccurs. An inventory account is not established for goods classified asdefective because the defects are corrected and the units become first-quality merchandise.
As in the previous illustration, assume that it costs $50 to manufactureeach jacket. Upon final inspection of the 1,000 jackets completed, 50 jacketsare defective because one sleeve is a slightly different shade of blue than theother parts of the jacket. Management decides to recut the sleeves from abolt of material identical in color to the rest of the jacket. The costs ofcorrecting the defect on the 50 jackets are $500 for materials, $400 forlabor, and $300 for factory overhead, representing a total cost of $1,200.
If the additional costs are charged to Factory Overhead, the cost ofcorrecting defective work is spread over all jobs that go through theproduction cycle. The journal entry is as follows:
Factory Overhead . . . . . . . . . . . . . . . . . . . . . . . . . . . . . . . . . . . . . . . . . . . . . . . . . . . . 1,200
Materials . . . . . . . . . . . . . . . . . . . . . . . . . . . . . . . . . . . . . . . . . . . . . . . . . . . . . . . . . . 500
Payroll . . . . . . . . . . . . . . . . . . . . . . . . . . . . . . . . . . . . . . . . . . . . . . . . . . . . . . . . . . . . 400
Factory Overhead . . . . . . . . . . . . . . . . . . . . . . . . . . . . . . . . . . . . . . . . . . . . . . . . . . 300
Recognized costs of correcting defective units.
If the order for 1,000 jackets was a special order and the defects resultedfrom the exacting specifications of the order, the additional costs would becharged to the specific job as follows:
Work in Process (Job 350) . . . . . . . . . . . . . . . . . . . . . . . . . . . . . . . . . . . . . . . . . . . . 1,200
Materials . . . . . . . . . . . . . . . . . . . . . . . . . . . . . . . . . . . . . . . . . . . . . . . . . . . . . . . . . . 500
Payroll . . . . . . . . . . . . . . . . . . . . . . . . . . . . . . . . . . . . . . . . . . . . . . . . . . . . . . . . . . . . 400
Factory Overhead . . . . . . . . . . . . . . . . . . . . . . . . . . . . . . . . . . . . . . . . . . . . . . . . . . 300
Charged Job 350 with cost of correcting defective work.
In this instance, the total cost of Job 350 will be higher because theadditional costs to correct the defects were charged to the order rather thanto the factory overhead account. The unit cost of each completed jacket isincreased from $50 ($50,000/1,000) to $51.20 ($51,200/1,000) because ofthe additional costs charged to the work in process account.
100 Principles of Cost Accounting

KEY TERMS
Backflush costing, 95
Carrying costs, 67
Credit memorandum, 76
Debit memorandum, 76
Defective units, 99
Economic order quantity, 67
Electronic Data Interchange (EDI), 74
First-in, first-out (FIFO), 82
Flow of costs, 82
Flow of materials, 82
Inventory report, 90
Just-in-time (JIT) inventory system, 92
Kanban, 94
Last-in, first-out (LIFO), 84
Lead time, 66
Lean production system, 92
Manufacturing cells, 93
Materials control, 64
Materials ledger, 66
Materials requisition, 78
Moving average, 84
Nonvalue-added activities, 95
Order costs, 67
Order point, 66
Production department supervisor, 71
Purchase order, 73
Purchase requisition, 72
Purchasing agent, 71
‘‘Pull’’ manufacturing systems, 93
‘‘Push’’ manufacturing systems, 93
Receiving clerk, 71
Receiving report, 74
Return shipping order, 77
Returned materials report, 79
Safety stock, 66
Scrap materials, 97
Spoiled units, 98
Stockouts, 66
Storeroom keeper, 71
Summary of Materials Issued and
Returned, 87
Supply chain management, 93
Throughput time, 95
Trigger points, 97
Usage, 66
Velocity, 95
Vendor’s invoice, 74
Recall and Review 3
Angel Industries produces 25,000 units each day, and the average number
of units in work in process inventory is 50,000.
1. If it is determined that the same daily output can be achieved while
reducing the work in process by 50%, determine (a) the current through-
put time________ and (b) the projected new throughput time___________.
2. Assuming the above doubling of the velocity of production, an average
annual carrying cost of 15%, and an average work in process inventory
of $500,000, determine (a) the current annual carrying cost_____________
and (b) the projected new annual carrying cost_______________.
(After working this exercise, see page 102 for the solution.)
You should now be able to work the following:
Questions 21–28; Exercises 2-12 to 2-17; Problems 2-9 to 2-13; Mini-Cases 1
and 2; Internet Exercise; and Self-Study Problem 2.
Chapter 2 – Accounting for Materials 101

ANSWERS TO RECALL AND REVIEW EXERCISES
R&R 1
1.EOQ ¼
ffiffiffiffiffiffiffiffiffiffiffiffiffiffiffiffiffiffiffiffiffiffiffiffiffiffiffiffiffiffiffiffiffiffiffiffiffiffiffiffiffiffiffiffiffiffiffiffiffiffiffiffiffiffið2� $25� 200,000Þ=$10
q¼
ffiffiffiffiffiffiffiffiffiffiffiffiffiffiffiffiffiffiffiffiffiffi1,000,000
p¼ 1,000 lb
2. Ordering cost ¼ 200,000 lb=1,000 lb per order ¼ 200 orders
¼ 200 orders� $25 per order ¼ $5,000
Carrying Cost ¼ 1,000 lb=2 ¼ 500 lb average inventory
¼ 500 lb� $10 ¼ $5,000
R&R 2
Using FIFO:
Dec. 20, Issued from the Dec. 1 inventory 350 yd @ $5.00, $1,750
Dec. 30, Issued 250 yd from:
Dec. 1 inventory 150 yd @ $5.00, $750
Dec. 10 purchase 100 yd @ $5.25, $525
The ending inventory consists of 150 yd @ $5.25, $787.50
Using LIFO:
Dec. 20, Issued 350 yd from:
Dec. 10 purchase 250 yd @ $5.25, $1,312.50
Dec. 1 inventory, 100 yd @ $5.00, $500
Dec. 30, Issued 250 yd from Dec. 1 inventory @ $5.00, $1,250
The ending inventory consists of 150 yd @ $5.00, $750
Using moving average:
Dec. 20, Issued 350 yd @ the moving average cost of $5.08 ($3,812.50/
750 yd), $1,778
Dec. 30, Issued 250 yd @ the moving average cost of $5.08, $1,270
The ending inventory consists of 150 yd @ $5.08, $762
R&R 3
1. (a) 50,000/25,000 ¼ 2 days
(b) (50,000 � .50)/25,000 ¼ 1 day
2. (a) $500,000 � .15 ¼ $75,000
(b) ($500,000 � ½) � .15 ¼ $37,500
102 Principles of Cost Accounting

SELF-STUDY PROBLEM 1
Order Point; Economic Order Quantity; Ordering andCarrying Costs
Brooklyn Bat Company
Brooklyn Bat Company, manufacturer of top-of-the-line baseball bats from
Northern white ash, predicts that 8,000 billets of lumber will be used
during the year. (A billet is the quantity of rough lumber needed to make
one bat.) The expected daily usage is 32 billets. The expected lead time is
10 days, and there is a safety stock of 500 billets. The company expects the
lumber to cost $4 per billet. It anticipates that it will cost $40 to place each
order. The annual carrying cost is $0.25 per billet.
Required:
1. Calculate the order point.
2. Calculate the most economical order quantity (EOQ).
3. Calculate the total cost of ordering and carrying at the EOQ point.
SOLUTION TO SELF-STUDY PROBLEM
Suggestions:
Read the entire problem thoroughly, keeping in mind that you are required
to calculate (1) order point, (2) EOQ, and (3) total ordering and carrying
costs. The specifics in the problem highlight the following facts relevant to
computing the order point:
Expected daily usage is 32 billets.
Expected lead time is 10 days.
Required safety stock is 500 billets.
The order point is the inventory level at which an order should be placed.
It is determined by adding the estimated number of billets to be used
between placement and receipt of the order:
Estimated usage during lead time
¼ 32 billets (daily usage) x 10 days (lead time) = 320
Add the number of billets of safety stock (500 in this problem) needed
to protect against abnormally high usage and unforeseen delays in receiv-
ing good materials from the supplier:
Order Point¼ Expected usage during lead time þ safety stock
¼ 320þ 500
¼ 820 billets
The specifics in the problem highlight the following facts relevant to
computing the EOQ:
Estimated annual usage of materials . . . . . . . . . . . . . . . . . . . . . . . . . . . . . . . . . . 8,000 billets
Cost of placing an order . . . . . . . . . . . . . . . . . . . . . . . . . . . . . . . . . . . . . . . . . . . . . . $40
Annual carrying cost per billet . . . . . . . . . . . . . . . . . . . . . . . . . . . . . . . . . . . . . . . . $0.25
Chapter 2 – Accounting for Materials 103

The EOQ is the order size that minimizes total order and carrying costs. It
can be calculated by using the EOQ formula:
EOQ¼
ffiffiffiffiffiffiffiffiffiffiffiffiffiffiffiffiffiffiffiffiffiffiffiffiffiffiffiffiffiffiffiffiffiffiffiffiffiffiffiffiffiffiffiffiffiffiffiffiffiffiffiffiffiffiffiffiffiffiffiffiffiffiffiffiffiffiffiffiffiffiffiffi2� order cost � annual demand
annual carrying cost per unit
s
¼
ffiffiffiffiffiffiffiffiffiffiffiffiffiffiffiffiffiffiffiffiffiffiffiffiffiffiffiffiffiffiffiffiffiffiffi2� $40� 8,000
$0:25
s
¼
ffiffiffiffiffiffiffiffiffiffiffiffiffiffiffiffiffiffi$640,00
$0:25
s
¼ffiffiffiffiffiffiffiffiffiffiffiffiffiffiffiffiffiffiffiffiffiffi2,560,000
p¼ 1,600 billets
The specifics in the problem highlight the following facts that are relevant to
computing the total ordering and carrying costs at the EOQ point:
Annual usage . . . . . . . . . . . . . . . . . . . . . . . . . . . . . . . . . . . . . . . . . . . . . . . . . . . . . . . . 8,000 billets
EOQ . . . . . . . . . . . . . . . . . . . . . . . . . . . . . . . . . . . . . . . . . . . . . . . . . . . . . . . . . . . . . . . . 1,600 billets
Ordering costs . . . . . . . . . . . . . . . . . . . . . . . . . . . . . . . . . . . . . . . . . . . . . . . . . . . . . . . $40 per order
Carrying cost . . . . . . . . . . . . . . . . . . . . . . . . . . . . . . . . . . . . . . . . . . . . . . . . . . . . . . . . $0.25 per billet
Safety stock . . . . . . . . . . . . . . . . . . . . . . . . . . . . . . . . . . . . . . . . . . . . . . . . . . . . . . . . . 500 billets
To determine the annual ordering cost, you must first determine the
number of orders by dividing the annual usage by the EOQ:
Number of orders¼ annual usage = EOQ
¼ 8,000 billets = 1,600 billets
¼ 5
The annual order cost is determined by multiplying the number of orders
by the cost per order:
5 orders �$40 per order = $200
To determine the annual carrying cost, you must first determine the
average number of billets in inventory:
ð1=2� EOQÞ þ safety stock
ð1=2� 1,600Þ þ 500 ¼ 1,300 billets
The average number of billets in inventory would consist of one-half
of the amount ordered plus the 500 billets that are kept as a cushion
against unforeseen events. The total carrying cost would then be as
follows:
Average inventory� carrying cost per billet
1,300� $0:25 ¼ $325
Total cost of ordering and carrying:
Order costsþ carrying costs
$200þ $325 ¼ $525
104 Principles of Cost Accounting

SELF-STUDY PROBLEM 2
Journal Entries for Backflush Costing
Speedy Manufacturing Company
Speedy uses backflush costing to account for its manufacturing costs. The
trigger points for recording inventory transactions are the purchase of
materials, the completion of products, and the sale of completed products.
The following transactions occurred during the period:
a. Purchased raw materials on account, $75,000.
b. Requisitioned raw materials to production, $75,000.
c. Distributed direct labor costs, $12,500.
d. Incurred manufacturing overhead costs, $50,000. (Use Various Credits
for the credit part of the entry.)
e. Cost of products completed, $137,500.
f. Completed products sold for $200,000, on account.
Required:
Prepare the necessary journal entries to record the above transactions.
SOLUTION TO SELF-STUDY PROBLEM
Suggestions:
Read the entire problem thoroughly, keeping in mind that you are required
to prepare journal entries for a JIT manufacturer using backflush costing.
The specifics in the problem highlight the following relevant facts:
. Speedy uses backflush costing to account for its manufacturing costs.
. The trigger points for the recording of inventory transactions are:
the purchase of materials
the completion of products
the sale of products
Preparing the Journal Entries:
a. Raw and In-Process . . . . . . . . . . . . . . . . . . . . . . . . . . . . . . . . . . . . . . . . . . . . . . 75,000
Accounts Payable . . . . . . . . . . . . . . . . . . . . . . . . . . . . . . . . . . . . . . . . . . . . . . . . 75,000
Raw and In-Process is the single account that is used in backflush costing
for both the purchase of raw materials and the issuance of those materials
into production.
b. No entry required.
Note that the debit in a. above to Raw and In-Process reflects both the
purchase of materials and their issuance into production, thus negating
the need for a separate entry here.
c. Conversion Costs . . . . . . . . . . . . . . . . . . . . . . . . . . . . . . . . . . . . . . . . . . . . . . . . 12,500
Payroll . . . . . . . . . . . . . . . . . . . . . . . . . . . . . . . . . . . . . . . . . . . . . . . . . . . . . . . . 12,500
Because direct labor is usually immaterial in a JIT system, a single
account, Conversion Costs, is usually debited for both direct labor and
factory overhead.
Chapter 2 – Accounting for Materials 105

d. Conversion Costs . . . . . . . . . . . . . . . . . . . . . . . . . . . . . . . . . . . . . . . . . . . . . . . . 50,000
Various Credits . . . . . . . . . . . . . . . . . . . . . . . . . . . . . . . . . . . . . . . . . . . . . . . . 50,000
(See the explanation in c. above.)
e. Finished Goods . . . . . . . . . . . . . . . . . . . . . . . . . . . . . . . . . . . . . . . . . . . . . . . . . . 137,500
Raw and In-Process . . . . . . . . . . . . . . . . . . . . . . . . . . . . . . . . . . . . . . . . . . . . 75,000
Conversion Costs . . . . . . . . . . . . . . . . . . . . . . . . . . . . . . . . . . . . . . . . . . . . . . 62,500
All products started in this JIT system were completed during the
period; therefore all materials, labor, and overhead costs should be
closed to finished goods.
f. Cost of Goods Sold . . . . . . . . . . . . . . . . . . . . . . . . . . . . . . . . . . . . . . . . . . . . . . 137,500
Finished Goods . . . . . . . . . . . . . . . . . . . . . . . . . . . . . . . . . . . . . . . . . . . . . . . . 137,500
As in a traditional costing system, the sale of completed products
causes the product cost to be transferred from an asset account,
Finished Goods, to an expense account, Cost of Goods Sold.
Accounts Receivable . . . . . . . . . . . . . . . . . . . . . . . . . . . . . . . . . . . . . . . . . . . . . 200,000
Sales . . . . . . . . . . . . . . . . . . . . . . . . . . . . . . . . . . . . . . . . . . . . . . . . . . . . . . . . . . 200,000
Revenue from the sale is recorded in an asset account, Accounts
Receivable, and in a revenue account, Sales.
QUESTIONS
1. What are the two major objectives of mate-
rials control?
2. Materials often represent a substantial por-
tion of a company’s assets; therefore, they
should be controlled from the time orders
are placed to the time finished goods are
shipped to the customer. What are the con-
trol procedures used for safeguarding
materials?
3. What factors should management consider
when determining the amount of invest-
ment in materials?
4. What is the meaning of the term order point?
5. What kind of information and data are
needed to calculate an order point?
6. How would you define the term economic
order quantity?
7. What kind of information and data are needed
to calculate the economic order quantity?
8. What factors should be considered when
determining the cost of placing an order?
9. What are the costs associated with carrying
materials in stock?
10. Briefly, what are the duties of the following
employees?
a. Purchasing agent
b. Receiving clerk
c. Storeroom keeper
d. Production supervisor
11. Proper authorization is required before or-
ders for new materials can be placed. What
is the difference between a purchase requi-
sition and a purchase order?
12. Purchasing agents are responsible for con-
tacting vendors from which to purchase
materials required by production. Why is
the purchasing agent also responsible for
reviewing and approving incoming ven-
dors’ invoices?
106 Principles of Cost Accounting

13. Illustrations of forms for requisitioning, or-
dering, and accounting for materials are
presented in the chapter. Would you expect
these forms, as shown, to be used by all
manufacturers? Discuss.
14. What internal control procedures should be
established for incoming shipments of ma-
terials purchased?
15. What is the purpose of a debit-credit
memorandum?
16. Who originates each of the following forms?
a. Purchase requisition
b. Purchase order
c. Receiving report
d. Materials requisition
e. Debit-credit memorandum
17. Normally, a manufacturer maintains an ac-
counting system that includes a materials
ledger and a general ledger account for
Materials. What is the relationship between
the materials ledger and the materials ac-
count in the general ledger?
18. A company may select an inventory cost-
ing method from a number of commonly
used procedures. Briefly, how would you
describe each of the following methods?
a. First-in, first-out
b. Last-in, first-out
c. Moving average
19. Why do companies adopt the LIFO method
of inventory costing? Your discussion
should include the effects on both the in-
come statement and balance sheet.
20. Which of the forms shown in the chapter is
the source for the following entries to sub-
sidiary ledger accounts?
a. Debits in materials ledger to record
materials purchased
b. Credits in materials ledger to record
materials requisitioned
c. Debits in job cost ledger to record ma-
terials placed in process
21. How does the just-in-time approach to pro-
duction differ from the traditional approach?
22. Explain the meaning of the terms push
manufacturing and pull manufacturing.
23. List three disadvantages of the ‘‘push’’
manufacturing approach to production.
24. What is the difference between throughput
time and velocity?
25. List three advantages to producing all units
of a specific product in a single manufac-
turing cell?
26. What are the arguments for and against
‘‘backflush’’ costing?
27. A manufacturing process may produce a
considerable quantity of scrap material be-
cause of the nature of the product. What
methods can be used to account for the
sales value of scrap material?
28. After a product is inspected, some units
may be classified as spoiled and others as
defective. What distinguishes a product as
being spoiled or defective?
EXERCISES
E2-1 Order PointAztec Company expects daily usage of 500 pounds of material
Inca, an anticipated lead time of seven days, and a desired safety
stock of 2,500 pounds.
a. Determine the order point.
b. Determine the number of pounds to be issued from safety
stock if the new order is four days late.
LO1
Chapter 2 – Accounting for Materials 107

E2-2 Economic order quantity; order cost; carrying costPatriot Company predicts that it will use 360,000 gallons of
material during the year. The material is expected to cost $5 per
gallon. Patriot anticipates that it will cost $72 to place each order.
The annual carrying cost is $4 per gallon.
a. Determine the most economical order quantity by using the
EOQ formula.
b. Determine the total cost of ordering and carrying at the EOQ
point.
E2-3 Materials control proceduresMatch the materials control form in the left column with the
person responsible for its preparation in the right column.
(A selection may be used more than once.)
a. Purchase requisition 1. Production department supervisor
b. Purchase order 2. Storeroom keeper
c. Receiving report 3. Purchasing agent
d. Debit-credit memo 4. Receiving clerk
e. Materials requisition 5. Accountant
E2-4 Journalizing materials requisitionsCatskill Manufacturing, Inc., records the following use of materi-
als during the month of June:
Materials Requisitions
Date Req. No. UseDirect
MaterialsIndirect
Materials1 110 Material A, Job 10 $20,000
5 111 Material B, Job 11 18,000
9 112 Material B, Job 12 16,000
12 113 Factory supplies $ 1,800
18 114 Material C, Job 10 3,000
21 115 Material D, Job 10 9,000
23 116 Material D, Job 11 2,000
28 117 Factory supplies 1,300
30 118 Factory supplies 1,700
Prepare a summary journal entry for the materials requisitions.
E2-5 Recording materials transactionsPrepare a journal entry to record each of the following materials
transactions:
a. Total materials purchased on account during the month
amounted to $200,000.
b. Direct materials requisitioned for the month totaled
$175,000.
c. Indirect materials requisitioned during the month totaled
$12,000.
LO1
LO2
LO3
LO3
108 Principles of Cost Accounting

d. Direct materials returned to the storeroom from the factory
amounted to $2,500.
e. Total materials returned to vendor during the month
amounted to $1,800.
f. Payment during the month for materials purchases totaled
$165,000.
E2-6 FIFO costingUsing first-in, first-out; perpetual inventory costing; and the
following information, determine the cost of materials used and
the cost of the July 31 inventory:
July 1 Balance on hand, 1,000 yd of linen @ $4.00 each.
3 Issued 250 yd.
5 Received 500 yd@ $4.50 each.
6 Issued 150 yd.
10 Issued 110 yd.
11 Factory returned 10 yd, which were issued on the 10th, to thestoreroom.
15 Received 500 yd @ $5.00 each.
20 Returned 300 yd to the vendor from the July 15 purchase.
26 Issued 600 yd.
E2-7 LIFO costingUsing last-in, first-out; perpetual inventory costing; and the
information presented in E2-6, compute the cost of materials
used and the cost of the July 31 inventory.
E2-8 Moving average costingUsing the moving average method of perpetual inventory cost-
ing and the information presented in E2-6, compute the cost of
materials used and the cost of the July 31 inventory. (Round unit
prices to four decimal places and totals to the nearest whole
dollar.)
E2-9 Comparison of FIFO, LIFO, and moving average methodsIn tabular form, compare the total materials cost transferred to
Work in Process and the cost of the ending inventory for each
method used in E2-6, E2-7, and E2-8. Discuss the effect that each
method will have on profits, depending on whether it is a period
of rising prices or a period of falling prices.
E2-10 Impact of costing methods on net incomeBenson Company was franchised on January 1, 2011. At the end
of its third year of operations, December 31, 2013, management
requested a study to determine what effect different materials
inventory costing methods would have had on its reported net
income over the three-year period.
LO3
LO3
LO3
LO3
LO3
Chapter 2 – Accounting for Materials 109

The materials inventory account, using LIFO, FIFO, and mov-
ing average, would have had the following ending balances:
Materials Inventory Balances
December 31 LIFO FIFO Average2010 $20,000 $22,000 $21,000
2011 20,000 24,000 23,000
2012 20,000 30,000 27,667
a. Assuming the same number of units in ending inventory at
the end of each year, were material costs rising or falling
from 2011 to 2013?
b. Which costing method would show the highest net income
for 2011?
c. Which method would show the lowest net income for 2013?
d. Which method would show the highest net income for the
three years combined?
E2-11 Recording materials transactionsMystic Manufacturing Company maintains the following ac-
counts in the general ledger: Materials, Work in Process, Factory
Overhead, and Accounts Payable. On June 1, the materials
account had a debit balance of $5,000. Following is a summary
of materials transactions for the month of June:
1. Materials purchased, $23,750.
2. Direct materials requisitioned to production, $19,250.
3. Direct materials returned to storeroom, $1,200.
4. Indirect materials requisitioned to production, $2,975.
5. Indirect materials returned to storeroom, $385.
a. Prepare journal entries to record the materials transactions.
b. Post the journal entries to ledger accounts (in T-account
form).
c. What is the balance of the materials inventory account at
the end of the month?
E2-12 JIT and cost controlIwamura Industries produces 10,000 units each day, and the
average number of units in work in process is 40,000.
1. Determine the throughput time.
2. If the same daily output can be achieved while reducing the
work in process by 75%, determine the new throughput
time.
E2-13 Backflush costingRDI Company uses backflush costing to account for its manufac-
turing costs. The trigger points are the purchase of materials, the
completion of goods, and the sale of goods. Prepare journal
entries to account for the following:
a. Purchased raw materials, on account, $80,000.
b. Requisitioned raw materials to production, $80,000.
c. Distributed direct labor costs, $10,000.
LO3
LO4
LO4
110 Principles of Cost Accounting

d. Manufacturing overhead costs incurred, $60,000. (Use Var-
ious Credits for the account in the credit part of the entry.)
e. Completed all of the production started.
f. Sold the completed production for $225,000, on account.
(Hint: Use a single account for raw materials and work in process.)
E2-14 Backflush costingIn E2-13, prepare any journal entries that would have been
different if the only trigger points had been the purchase of
materials and the sale of finished goods.
E2-15 Scrap materialsA machine shop manufactures a stainless steel part that is used
in an assembled product. Materials charged to a particular job
amounted to $600. At the point of final inspection, it was dis-
covered that the material used was inferior to the specifications
required by the engineering department; therefore, all units had
to be scrapped.
Record the entries required for scrap under each of the
following conditions:
a. The revenue received for scrap is to be treated as a reduction
in manufacturing cost but cannot be identified with a specific
job. The value of stainless steel scrap is stable and estimated
to be $125 for this job. The scrap is sold two months later for
cash at the estimated value of $125.
b. Revenue received for scrap is to be treated as a reduction in
manufacturing cost but cannot be identified with a specific
job. A firm price is not determinable for the scrap until it is
sold. It is sold eventually for $75 cash.
c. The production job is a special job, and the $85 received on
account for the scrap is to be treated as a reduction in
manufacturing cost. (A firm price is not determinable for the
scrap until it is sold.)
d. Only $40 cash was received for the scrap when it was sold in
the following fiscal period. (A firm price is not determinable
for the scrap until it is sold, and the amount to be received
for the scrap is to be treated as other income.)
E2-16 Spoiled workVenus, Inc., manufactures tennis clothing. During the month, the
company cut and assembled 8,000 skirts. One hundred of the
skirts did not meet specifications and were considered ‘‘sec-
onds.’’ Seconds are sold for $9.95 per skirt, whereas first-quality
skirts sell for $39.95. During the month, Work in Process was
charged $108,000: $36,000 for materials, $48,000 for labor, and
$24,000 for factory overhead.
Record the entries to first charge production costs for the
period and to then record the loss due to spoiled work, under
each of the following conditions:
LO4
LO5
LO5
Chapter 2 – Accounting for Materials 111

a. The loss due to spoiled work is spread over all jobs in the
department.
b. The loss due to spoiled work is charged to the specific job
because it is a special order.
E2-17 Defective workDavid Mfg. Company manufactures an integrated transistor cir-
cuit board for repeat customers but also accepts special orders
for the same product. Job No. MS1 incurred the following unit
costs for 1,000 circuit boards manufactured:
Materials . . . . . . . . . . . . . . . . . . . . . . . . . . . . . . . . . . . . . . . . . . . . . . . . . . . . $ 6.00
Labor . . . . . . . . . . . . . . . . . . . . . . . . . . . . . . . . . . . . . . . . . . . . . . . . . . . . . . . . 3.00
Factory overhead . . . . . . . . . . . . . . . . . . . . . . . . . . . . . . . . . . . . . . . . . . . . 2.00
Total cost per unit . . . . . . . . . . . . . . . . . . . . . . . . . . . . . . . . . . . . . . . . . . . . $11.00
When the completed products were tested, 50 circuit boards
were found to be defective. The costs per unit of correcting the
defects follow:
Materials . . . . . . . . . . . . . . . . . . . . . . . . . . . . . . . . . . . . . . . . . . . . . . . . . . . . $3.00
Labor . . . . . . . . . . . . . . . . . . . . . . . . . . . . . . . . . . . . . . . . . . . . . . . . . . . . . . . . 2.00
Factory overhead . . . . . . . . . . . . . . . . . . . . . . . . . . . . . . . . . . . . . . . . . . . . 1.00
Record the journal entry for the costs to correct the defective
work:
a. If the cost of the defective work is charged to factory
overhead.
b. If the cost of the defective work is charged to the specific job.
PROBLEMS
P2-1 Economic order quantity; ordering and carrying costs.similar to Self-Study Problem 1
Marino Company predicts that it will use 25,000 units of material
during the year. The expected daily usage is 200 units, and there
is an expected leadtime of five days and a desired safety stock of
500 units. The material is expected to cost $5 per unit. Marino
anticipates that it will cost $50 to place each order. The annual
carrying cost is $0.10 per unit.
Required:
1. Compute the order point.
2. Determine the most economical order quantity by use of the
formula.
3. Calculate the total cost of ordering and carrying at the EOQ
point.
P2-2 Economic order quantity; tabular computation
Cortez Chemical, Inc., requires 20,000 gallons of material an-
nually; the cost of placing an order is $20, and the annual
carrying cost per gallon is $5.
LO5
LO1
112 Principles of Cost Accounting

Required:
Determine the EOQ from potential order sizes of 300, 400, 500,
600, 700, and 800 gallons by constructing a table similar to the
one appearing on page 68.
P2-3 Economic order quantity; safety stock
In P2-2, assume that the company desires a safety stock of 500
gallons.
Required:
1. Compute the average number of gallons in inventory.
2. Compute the total carrying cost.
3. Compute the total order cost. Did it differ from your answer in
P2-2 above?
P2-4 Inventory costing methods
The purchases and issues of rubber gaskets (Materials Ledger
#11216) as shown in the records of HD Corporation for the
month of November follow:
Units Unit PriceNov. 1 Beginning balance . . . . . . . . . . . . . . . . . . . . 30,000 $3.00
4 Received, Rec. Report No. 112 . . . . . . . . . 10,000 3.10
5 Issued, Mat. Req. No. 49 . . . . . . . . . . . . . . . 30,000
8 Received, Rec. Report No. 113 . . . . . . . . . 50,000 3.30
15 Issued, Mat. Req. No. 50 . . . . . . . . . . . . . . . 20,000
22 Received, Rec. Report No. 114 . . . . . . . . . 25,000 3.50
28 Issued, Mat. Req. No. 51 . . . . . . . . . . . . . . . 30,000
Required:
1. Complete a materials ledger account similar to Figure 2-10 (the
‘‘On Order’’ columns should be omitted) for each of the follow-
ing inventory costing methods, using a perpetual inventory
system:
a. FIFO
b. LIFO
c. Moving average (carrying unit prices to five decimal
places)2. For each method, prepare a schedule that shows the total
cost of materials transferred to Work in Process and the cost
of the ending inventory.
3. If prices continue to increase, would you favor adopting the
FIFO or the LIFO method? Explain.
4. When prices continue to rise, what is the effect of FIFO versus
LIFO on the inventory balance for materials reported in the
balance sheet? Discuss.
LO1
LO3
Chapter 2 – Accounting for Materials 113

P2-5 Inventory costing methods
The following transactions affecting materials occurred in
February:
Feb. 1 Balance on hand, 1,200 ft @ $2.76, $3,312.00 (plastic tubing, materialsledger account #906).
5 Issued 60 ft to production on Materials Requisition No. 108.
11 Issued 200 ft on Materials Requisition No. 210.
14 Received 800 ft from a supplier, Receiving Report No. 634, price $2.80per ft.
15 Issued 400 ft, Materials Requisition No. 274.
16 Returned to a supplier for credit, 90 ft purchased on February 14, whichwere found to be defective.
18 Received 1,000 ft, Receiving Report No. 712, price $2.83 per ft.
21 Issued 640 ft, Materials Requisition No. 318.
Required:
Record the transactions on materials ledger accounts similar to
Figure 2-10. (The ‘‘On Order’’ columns should be omitted.) Use
the following inventory methods, assuming the use of a perpe-
tual inventory system. Carry unit prices to four decimal places.
1. FIFO
2. LIFO
3. Moving average
P2-6 Journalizing materials transactions
Milano’s Specialty Clothing, Inc., uses a job order cost system. A
partial list of the accounts being maintained by the company,
with their balances as of November 1, follows:
Cash . . . . . . . . . . . . . . . . . . . . . . . . . . . . . . . . . . . . . . . . . . . . . . . . . . . . . . . . $82,250
Materials . . . . . . . . . . . . . . . . . . . . . . . . . . . . . . . . . . . . . . . . . . . . . . . . . . . . 29,500
Work in process . . . . . . . . . . . . . . . . . . . . . . . . . . . . . . . . . . . . . . . . . . . . . . 27,000
Accounts payable (credit) . . . . . . . . . . . . . . . . . . . . . . . . . . . . . . . . . . . . . 21,000
Factory overhead . . . . . . . . . . . . . . . . . . . . . . . . . . . . . . . . . . . . . . . . . . . . none
The following transactions were completed during the month of
November:
a. Materials purchases on account during the month, $74,000.
b. Materials requisitioned during the month:
1. Direct materials, $57,000.
2. Indirect materials, $11,000.
c. Direct materials returned by factory to storeroom during the
month, $1,100.
d. Materials returned to vendors during the month prior to
payment, $2,500.
e. Payments to vendors during the month, $68,500.
LO3
LO3
114 Principles of Cost Accounting

Required:
1. Prepare general journal entries for each of the transactions.
2. Post the general journal entries to T-accounts.
3. Balance the accounts and report the balances of November
30 for the following:
a. Cash
b. Materials
c. Accounts Payable
P2-7 Analyzing materials and other transactionsScarlatta’s Manufacturing Company uses a job order cost sys-
tem. The following accounts have been taken from the books of
the company:
Materials
Bal. Inventory 7,000 b. Requisitions for month 19,000
a. Purchases for month 22,000
Work in Process
Bal. Inventory 3,600 e. To finished goods 47,500
b. Material Requisitions 19,000
c. Direct Labor 17,000
d. Factory Overhead 12,000
Finished Goods
Bal. Inventory 11,650 f. Cost of Goods Sold 55,000
e. Goods Finished 47,500
Required:
1. Analyze the accounts and describe in narrative form what
transactions took place. (Use the reference letters a. through
f. in your explanations and note that some accounts needed
in your explanation have been purposely omitted.)
2. List the supporting documents or forms required to record
each transaction involving the receipt or issuance of materials.
3. Determine the ending balances for Materials, Work in Pro-
cess, and Finished Goods.
P2-8 Comprehensive analysis of materials accounting procedures
The following actions occurred at Sanibel Sheet Metal Company
relative to accounting for materials costs for April.
Mar. 31 The factory manager informs the storeroom keeper that for the monthof April, 2,000 sheets of aluminum are the forecasted usage. A checkof the stock shows 500 aluminum sheets, costing $23 each, on hand.A minimum stock of 300 sheets must be maintained, and the purchas-ing agent is notified of the need for 1,800 sheets. This quantity willcover the April production requirements and, at the same time,maintain the minimum inventory level.
Apr. 1 After checking with a number of different vendors, the purchasingagent orders the requested number of sheets at $25 each.
LO3
LO2
LO3
Chapter 2 – Accounting for Materials 115

6 The shipment of aluminum sheets is received, inspected, and found tobe in good condition. However, the order is short 100 sheets, whichare backordered and expected to be shipped in five days. The invoicefrom the vendor covering the aluminum sheets is also received, and itis approved for later payment.
Apr. 11 The aluminum sheets that were backordered are received andapproved.
11 The vendor’s invoice for the backordered shipment is received andapproved for payment.
16 The April 6 invoice is paid, less a cash discount of 2%.
30 During the month, 1,900 sheets are issued to the factory. The com-pany uses FIFO costing and a job order cost system.
30 The factory returns 20 unused sheets to the storeroom. The returnedsheets have a cost of $25 each.
30 At the end of the day, 398 sheets are on hand.
Required:
1. In tabular form, answer the following questions pertaining to
each of the preceding decisions and transactions:
a. What forms, if any, were used?
b. What journal entries, if any, were made?
c. What books of original entry, if any, were used to record
the data?
d. What subsidiary records were affected?
(Hint: To solve a. through d., use a columnar format with
columns for Date, Form, Journal Entry, Book of Original
Entry, and Subsidiary Ledger—see Figure 2-13.)
2. Calculate and show your computations for the following:
a. The materials inventory balance as of April 30.
b. The cost of materials used in production during April.
P2-9 JIT and cost control
Yusane Bolts, Inc., produces 50,000 units each day, and the
average number of units in work in process is 200,000. The
average annual inventory carrying cost percentage is 25%, and
the average work in process is $1,000,000.
Required:
1. Determine the throughput time.
2. Compute the annual carrying costs.
3. If the same daily output can be achieved while reducing the
work in process by 50%, determine the new throughput time.
4. What has happened to the velocity of production in part 3?
5. Compute the annual carrying costs for part 3.
P2-10 Backflush costingsimilar to Self-Study Problem 2
T. Hilliary, Inc., uses backflush costing to account for its manu-
facturing costs. The trigger points for recording inventory trans-
actions are the purchase of materials, the completion of
products, and the sale of completed products.
LO4
LO4
116 Principles of Cost Accounting

Required:
1. Prepare journal entries, if needed, to account for the following
transactions.
a. Purchased raw materials on account, $150,000.
b. Requisitioned raw materials to production, $150,000.
c. Distributed direct labor costs, $25,000.
d. Incurred manufacturing overhead costs, $100,000. (Use
Various Credits for the credit part of the entry.)
e. Cost of products completed, $275,000.
f. Completed products sold for $400,000, on account.
2. Prepare any journal entries that would be different from the
above, if the only trigger points were the purchase of materi-
als and the sale of finished goods.
P2-11 Materials inventory shortage; returns; scrap; spoiled goods
An examination of Frosty Corporation’s records reveals the
following transactions:
a. On December 31, the physical inventory of raw material was
9,950 gallons. The book quantity, using the moving average
method, was 10,000 gal @ $0.52 per gal.
b. Production returned to the storeroom materials that cost
$775.
c. Materials valued at $770 were charged to Factory Overhead
(Repairs and Maintenance), but should have been charged to
Work in Process.
d. Defective material, purchased on account, was returned to
the vendor. The material returned cost $234, and the return
shipping charges (our cost) of $35 were paid in cash.
e. Goods sold to a customer, on account, for $5,000 (cost
$2,500) were returned because of a misunderstanding of the
quantity ordered. The customer stated that the goods re-
turned were in excess of the quantity needed.
f. Materials requisitioned totaled $22,300, of which $2,100 re-
presented supplies used.
g. Materials purchased on account totaled $25,500. Freight on
the materials purchased was $185.
h. Direct materials returned to the storeroom amounted to
$950.
i. Scrap materials sent to the storeroom were valued at an
estimated selling price of $685 and treated as a reduction in
the cost of all jobs worked on during the period.
j. Spoiled work sent to the storeroom valued at a sales price of
$60 had production costs of $200 already charged to it. The
cost of the spoilage is to be charged to the specific job
worked on during the period.
k. The scrap materials in (i) were sold for $685 cash.
Required:
Record the entries for each transaction.
LO3
LO5
Chapter 2 – Accounting for Materials 117

P2-12 Spoiled goods; loss charged to factory overhead; loss chargedto job
One of the tennis racquets that Set Point manufactures is a
titanium model (Ace) that sells for $149. The cost of each Ace
consists of:
Materials . . . . . . . . . . . . . . . . . . . . . . . . . . . . . . . . . . . . . . . . . . . . . . . . . . . . . . . . . . . . $35
Labor . . . . . . . . . . . . . . . . . . . . . . . . . . . . . . . . . . . . . . . . . . . . . . . . . . . . . . . . . . . . . . . 15
Factory overhead . . . . . . . . . . . . . . . . . . . . . . . . . . . . . . . . . . . . . . . . . . . . . . . . . . . . 25
Total . . . . . . . . . . . . . . . . . . . . . . . . . . . . . . . . . . . . . . . . . . . . . . . . . . . . . . . . . . . . . . . . $75
Job 100 produced 100 Aces, of which 6 racquets were spoiled
and classified as seconds. Seconds are sold to discount stores
for $50 each.
Required:
1. Under the assumption that the loss from spoilage will be
distributed to all jobs produced during the current period, use
general journal entries to (a) record the costs of production,
(b) put spoiled goods into inventory, and (c) record the cash
sale of spoiled units.
2. Under the assumption that the loss due to spoilage will be
charged to Job 100, use general journal entries to (a) record
the costs of production, (b) put spoiled goods into inventory,
and (c) record the cash sale of spoiled units.
P2-13 Spoiled goods and defective work
Torre, Inc., manufactures electrical equipment from specifications
received from customers. Job X10 was for 1,000 motors to be
used in a specially designed electrical complex. The following
costs were determined for each motor:
Materials . . . . . . . . . . . . . . . . . . . . . . . . . . . . . . . . . . . . . . . . . . . . . . . . . . . . . . . . . . . $117
Labor . . . . . . . . . . . . . . . . . . . . . . . . . . . . . . . . . . . . . . . . . . . . . . . . . . . . . . . . . . . . . . 100
Factory overhead . . . . . . . . . . . . . . . . . . . . . . . . . . . . . . . . . . . . . . . . . . . . . . . . . . . 83
Total . . . . . . . . . . . . . . . . . . . . . . . . . . . . . . . . . . . . . . . . . . . . . . . . . . . . . . . . . . . . . . . $300
At final inspection, Torre discovered that 33 motors did not meet
the exacting specifications established by the customer. An
examination indicated that 18 motors were beyond repair and
should be sold as spoiled goods for $75 each. The remaining 15
motors, though defective, could be reconditioned as first-quality
units by the addition of $1,650 for materials, $1,500 for labor, and
$1,200 for factory overhead.
Required:
Prepare the journal entries to record the following:
1. The scrapping of the 18 motors, with the income from spoiled
goods treated as a reduction in the manufacturing cost of the
specific job.
2. The correction of the 15 defective motors, with the additional
cost charged to the specific job.
LO5
LO5
118 Principles of Cost Accounting

3. The additional cost of replacing the 18 spoiled motors with
new motors.
4. The sale of the spoiled motors for $75 each.
P2-14R Review Problem for Chapters 1 and 2
Lift It, Inc., manufactures chain hoists. The raw materials inven-
tories on hand on October 1 were as follows:
Chain . . . . . . . . . . . . . . . . . . . . . . . . . . . . . . . . . . . . . . . . . . . . 12,000 pounds, $24,000
Pulleys . . . . . . . . . . . . . . . . . . . . . . . . . . . . . . . . . . . . . . . . . . 4,000 sets, $20,000
Bolts and taps . . . . . . . . . . . . . . . . . . . . . . . . . . . . . . . . . . . . 10,000 pounds, $5,000
Steel plates . . . . . . . . . . . . . . . . . . . . . . . . . . . . . . . . . . . . . . 4,000 units, $2,000
The balances in the ledger accounts on October 1 were as
follows:
Cash . . . . . . . . . . . . . . . . . . . . . . . . . . . . . . . . . . . . . . . . . . . . . . $ 12,000
Work in process . . . . . . . . . . . . . . . . . . . . . . . . . . . . . . . . . . . 35,000
Materials . . . . . . . . . . . . . . . . . . . . . . . . . . . . . . . . . . . . . . . . . . 51,000
Prepaid insurance . . . . . . . . . . . . . . . . . . . . . . . . . . . . . . . . . 3,000
Machinery . . . . . . . . . . . . . . . . . . . . . . . . . . . . . . . . . . . . . . . . 125,000
Accumulated depreciation—machinery . . . . . . . . . . . . . $ 10,500
Office equipment . . . . . . . . . . . . . . . . . . . . . . . . . . . . . . . . . . 30,000
Accumulated depreciation—office equipment . . . . . . . 4,800
Office furniture . . . . . . . . . . . . . . . . . . . . . . . . . . . . . . . . . . . . 20,000
Accumulated depreciation—office furniture . . . . . . . . . 2,500
Accounts payable . . . . . . . . . . . . . . . . . . . . . . . . . . . . . . . . . . 30,000
Capital stock . . . . . . . . . . . . . . . . . . . . . . . . . . . . . . . . . . . . . . 182,200
Retained earnings . . . . . . . . . . . . . . . . . . . . . . . . . . . . . . . . . 46,000
$276,000 $276,000
Transactions during October were as follows:
a. Payroll recorded during the month: direct labor, $28,000;
indirect labor, $3,000.
b. Factory supplies purchased for cash, $1,000. (Use a separate
inventory account, Factory Supplies.)
c. Materials purchased on account: chain—4,000 pounds,
$8,800; pulleys—2,000 sets, $10,200; steel plates—5,000
units, $3,000.
d. Sales on account for the month, $126,375.
e. Accounts receivable collected, $72,500.
f. Materials used during October (FIFO costing): chain, 14,000
pounds; pulleys, 4,400 sets; bolts and taps, 4,000 pounds;
steel plates, 3,800 units.
g. Payroll paid, $31,000.
h. Factory supplies on hand, October 31, $350.
i. Factory heat, light, and power costs for October, $3,000 (not
yet paid).
j. Office salaries paid, $6,000.
Chapter 2 – Accounting for Materials 119

k. Advertising paid, $2,000.
l. Factory superintendence paid, $1,800.
m. Expired insurance—on office equipment, $100; on factory
machinery, $300.
n. Factory rent paid, $2,000.
o. Depreciation on office equipment, $400; on office furniture,
$180; on machinery, $1,200.
p. Factory overhead charged to jobs, $11,950.
q. Work in Process, October 31, $31,000. (Hint: The difference
between the sum of the beginning balance in Work in Pro-
cess plus the total charges to it during the period less the
ending balance in Work in Process represents the cost of the
goods completed during the period.)
r. Cost of goods sold during the month, $84,250.
s. Accounts payable paid, $33,750.
Required:
1. Set up T-accounts and enter the balances as of October 1.
2. Prepare journal entries to record each of the previous
transactions.
3. Post the journal entries to the accounts, setting up any new
ledger accounts necessary. Only controlling accounts are to
be maintained; however, show the calculation for the cost of
materials used.
4. Prepare a statement of cost of goods manufactured for October.
5. Prepare an income statement.
6. Prepare a balance sheet showing the classifications of current
assets, plant and equipment, current liabilities, and stock-
holders’ equity.
MINI-CASE 1
Financial and Nonfinancial Aspects of Changing to JIT
Katy, Inc., manufactures ‘‘smart phones.’’ It is considering the implementa-
tion of a JIT system. Costs to reconfigure the production line will amount
to $200,000 annually. Estimated benefits from the change to JIT are as
follows:
. The quality advantages of JIT should reduce current rework cost of
$300,000 by 25%.
. Materials storage, handling, and insurance costs of $250,000 would be
reduced by an estimated 40%.
. Average inventory is expected to decline by 300,000 units, and the
carrying cost per unit is $0.35.
Required:
1. What is the estimated financial advantage (disadvantage) of changing
to a JIT system?
2. Are there any nonfinancial advantages (disadvantages) of changing to
a JIT system?
LO1
LO4
120 Principles of Cost Accounting

MINI-CASE 2
Changing from a Traditional System to a JIT System
In the scenario on page 91, Boston Company was trying to decide whether
or not to change from a traditional inventory system to a just-in-time (JIT)
system. The president, Teresa Francona, wanted to know whether this
change would merely affect how goods were ordered and produced, or if
it would also impact the financial health of the company, as well as the
accounting system itself. The controller, Donna Ortiz, was asked to pre-
pare a report estimating any expected cost savings and changes to the
accounting system resulting from a move to JIT.
Required:
1. What costs should be affected by the introduction of a JIT system?
2. Should Francona’s customers reap any benefits from the change to
JIT?
3. Will Ortiz have to make any changes in the way that inventory is
accounted for under a JIT system?
INTERNET EXERCISE 1
Just-in-Time Inventory Systems
Go to the text Website at http://www.cengage.com/accounting/vanderbeck
and click on the link to the following article: Benefits From Lean
and Cellular Manufacturing, by Strategos, Inc.-Consultants, Engineers,
Strategists
Required:
Read the article and answer the following questions:
1. Name some general principles for using ‘‘lean metrics.’’
2. What are some materials handling benefits that result from applying
lean manufacturing principles?
3. Why do lot sizes tend to be larger in a functional manufacturing
environment?
4. How do employees benefit from a lean manufacturing environment?
5. Why is it difficult to make quality improvements in a functional
manufacturing environment?
6. How do customers benefit when their suppliers adopt lean manufac-
turing principles?
LO4
LO4
Chapter 2 – Accounting for Materials 121

This page intentionally left blank

CHAPTER 3
Account ing for Labor
Why has Toyota been much more profitable than General
Motors (GM) in recent years? Part of the explanation lies in a
comparison of total hourly labor costs. The difference does not
lie in the average hourly wage rate where the average Toyota
worker holds a slight advantage over the average GM worker—
$30 per hour versus $29.78 per hour. It is explained by the
difference in pension and health care costs for both active work-
ers and retirees that caused the total hourly labor cost in 2008 to
be, on average, $69 for a GM worker and $48 for a Toyota
worker. The United Auto Workers union has negotiated much
richer benefits over the years for GM, Ford, and Chrysler work-
ers than have been provided by nonunion, foreign automakers
in the United States, such as Toyota and Honda.1
Note that filings for bankruptcy protection in 2009 by both
GM and Chrysler have helped shed some of these expensive
labor agreements, in an effort to make both companies more
competitive with their foreign rivals. For example, an article in
the July 6, 2009 Wall Street Journal discussed GM’s plan to
build its first U.S.-made compact in its Orion, Michigan plant by
2011. Relative to the labor costs at the plant, the article stated:
‘‘The UAW agreed to allow GM to employ lower-cost workers
making $14 to $16.23 an hour, compared with the current base
wage of $28 an hour, with less-expensive benefits than tradi-
tional assembly-line personnel.’’
Learning Objectives
After studying this
chapter, you should
be able to:
LO1Distinguish
between the
features of hourly rate
and piece-rate plans.
LO2Specify
procedures
for controlling labor
costs.
LO3Account for
labor costs
and payroll taxes.
LO4Prepare
accruals for
payroll earnings and
taxes.
LO5Account for
special prob-
lems in labor costing.
1 ‘‘GM Vs. Toyota Wages and Benefits,’’ December 12, 2008, www.topix.com (visited3/10/2009) and ‘‘More on Total Hourly Labor Costs: GM Vs. Toyota,’’ November 24,2008, www.dailymarkets.com (visited 3/10/2009).

How can companies control labor costs in a highly competi-
tive, global environment? What incentive wage plans can be put
in place to ensure that workers are compensated for providing
value-added activity? How should bonuses, holiday pay, and
vacation pay be accounted for? These are some of the major
issues that will be discussed in the chapter.
F actory payroll costs are divided into two categories: direct laborand indirect labor. Direct labor, also known as touch labor,represents payroll costs traced directly to an individual job. Direct
labor costs include the wages of machinists, assemblers, and other workerswho physically convert raw materials to finished goods—thus the termtouch. For example, a painter on the production line at the Toyota plant inGeorgetown, Kentucky is a direct laborer. The cost of direct labor isdebited to Work in Process. Indirect labor consists of labor costs incurredfor a variety of jobs related to the production process but not readilytraceable to the individual jobs worked on during the period. Indirect laborcosts include the salaries and wages of the factory superintendent, super-visors, janitors, clerks, and factory accountants who support all jobs workedon during the period. For example, the plant manager of the Toyotamanufacturing facility is an indirect laborer. Indirect labor costs are chargedto Factory Overhead. As was mentioned in Chapter 1, robotics, illustratedin Figure 3-1, is increasingly replacing humans on the production line. Thisresults in a trend of direct labor becoming a smaller percentage of totalproduction costs while indirect manufacturing costs such as maintenance,depreciation, insurance, and personal property taxes on the robots areincreasing as a percentage of total product cost.
You may also think of the distinction between direct labor and indirectlabor relative to service firms. For example, auditors with a public account-ing firm would be considered direct labor relative to the individual jobs thatthey worked on, whereas the salary of the managing partner would beindirect labor that should be allocated to all of the clients audited indetermining the total cost of servicing clients. Other examples of indirectlabor in an accounting firm would include the human resources function,the technical support staff, and the secretarial function.
The accounting system of a manufacturer must include the followingprocedures for recording payroll costs:
1. Recording the hours worked or quantity of output by employees in totaland by job, process, or department.
2. Analyzing the hours worked by employees to determine how labor timeis to be charged.
3. Charging payroll costs to jobs, processes, departments, and factoryoverhead accounts.
4. Preparing the payroll, which involves computing and recordingemployee gross earnings, withholdings and deductions, and netearnings.
124 Principles of Cost Accounting

Wage Plans
Stacey Womack is considering the implementation of an incentive wageplan to increase productivity in her small manufacturing plant. Theplant is nonunion, and employees have been compensated with only anhourly rate plan. Jane Moore, Vice President–Manufacturing, is con-cerned that the move to an incentive compensation plan will causedirect laborers to speed up production and, thus, compromise quality.
How might Womack accomplish her goals while alleviatingMoore’s concerns? Does the compensation have to be all hourly rateor all incentive compensation? Can incentive compensation also applyto service businesses? These are some of the questions that will beanswered in this section of the chapter and in Mini-Case 1 at the endof the chapter.
Employees’ wages are based on plans that have been established bymanagement, approved by the unions, if present, and that comply with theregulations of governmental agencies. A manufacturer may use many varia-tions of wage plans. This chapter covers the wage plans most frequentlyencountered, including hourly rate, piece-rate, and modified wage plans.
Figure 3-1 The Use of Robotics in Manufacturing
(ª Photodisc/Getty Images)
LO1Distinguish
between the
features of hourly rate
and piece-rate plans.
Chapter 3 – Accounting for Labor 125

Hourly Rate PlanAn hourly rate plan establishes a definite rate per hour for each employee.An employee’s wages are computed by multiplying the number of hoursworked in the payroll period by the established rate per hour. The hourlyrate plan is widely used and is simple to apply. Critics argue that it providesno incentive for the employee to maintain or achieve a high level ofproductivity. An employee is paid for merely ‘‘being on the job’’ for anestablished period of time. The plan gives no extra recognition or rewardfor doing more than the minimum required of the position. Proponents ofthe plan argue that because productivity is not an important factor of such aplan, employees will not be tempted to sacrifice the quality of the productby speeding up production to earn a higher wage. Productivity is measuredas the amount of output per hour of work. In the 12 months endedDecember 2008, worker productivity in manufacturing increased 2.8% overthe previous 12-month period—the nation’s largest productivity increasesince 2003.2
To illustrate the hourly rate plan, assume that an employee earns $15 perhour and works 40 hours per week. The employee’s gross earnings would be$600 (40 � $15 per hour).
Piece-Rate Plan
A company that gives a high priority to the quantity produced by eachworker should consider using an incentive wage plan, such as a piece-rateplan, that bases earnings on the employee’s quantity of production. Toillustrate, assume that a machine operator will earn $0.30 for each part (or‘‘piece’’) finished. If the operator finishes 2,200 parts in a week, he or shewill earn $660 ($0.30 � 2,200 parts). The plan provides an incentive foremployees to produce a high level of output, thereby maximizing theirearnings and also increasing the company’s revenue. However, a seriousshortcoming of such plans is that they may encourage employees tosacrifice quality in order to maximize their earnings, unless the plan is basedon only the production of good units. Also, piece rates are not appropriateif machines, rather than people, control production speed.
Modified Wage PlansModified wage plans combine some features of the hourly rate and piece-rate plans. An example of a modified wage plan would be to set a basehourly wage that the company will pay if an employee does not attainan established quota of production. If the established quota is exceeded, anadditional payment per piece would be added to the wage base. This typeof plan rewards high-performing employees and directs management’sattention to employees unable to meet the established quotas.
2 U.S. worker productivity rose 2.8% in 2008 (according to figures released by the LaborDepartment), www.bloomberg.com (visited March 2, 2009).
126 Principles of Cost Accounting

Labor–management negotiations create many variations of the hourlyrate and piece-rate plans. These variations occur because managementwishes to minimize costs and maximize profits, while labor attempts tomaximize employee earnings. To illustrate a modified wage plan, assumethat an employee earns $15 per hour for up to 400 units of production perday. The employee who produces more than 400 units per day will receivean additional piece rate of $0.30 per unit. When the employee producesfewer than 400 units, the difference, referred to as a make-up guarantee,will be charged to Factory Overhead rather than to Work in Processbecause it represents the cost of inefficient production, rather than anecessary cost of the specific jobs worked on.
Assume that an employee’s production and earnings for one week are asfollows:
HoursWorked
PiecesFinished
(Quota 400)
Earnings@ $15
per Hour
Earnings@ $0.30per Unit
Make-UpGuarantee
PayrollEarnings
Mon. . . . . . . . . . . . 8 400 $120 $120 $120
Tues. . . . . . . . . . . . 8 360 120 108 $12 120
Wed. . . . . . . . . . . . 8 420 120 126 126
Thurs. . . . . . . . . . . 8 450 120 135 135
Fri. . . . . . . . . . . . . . 8 340 120 102 18 120
40 $600 $591 $30 $621
Note that the employee’s daily earnings are the larger of the amounts incolumn (3) or column (4). The employee earned $591 for the week on apiece-rate basis, but the daily guarantee of $120 per day compensated forthe days when the employee did not reach the quota. A make-up guaranteeof $30 is charged to Factory Overhead because the employee did not meetthe quota on Tuesday ($12) and Friday ($18). The payroll distribution forthe week would be as follows:
Work in Process . . . . . . . . . . . . . . . . . . . . . . . . . . . . . . . . . . . . . . . . . . . . . . . . 591
Factory Overhead . . . . . . . . . . . . . . . . . . . . . . . . . . . . . . . . . . . . . . . . . . . . . . . 30
Payroll . . . . . . . . . . . . . . . . . . . . . . . . . . . . . . . . . . . . . . . . . . . . . . . . . . . . . . . 621
Distributed payroll.
If the number of pieces finished depends on a group effort, then a singleincentive plan for the group would be appropriate. In recent years, U.S.manufacturers have adopted the concept of production work teams,where output is dependent on contributions made by all members of thework crew or department. The wages may be computed in a manner similarto the previous illustration, except that all members of the group wouldshare the piece-rate bonus.
Chapter 3 – Accounting for Labor 127

Incentive compensation plans are not limited to manufacturing work-ers. Salespersons in service businesses often are paid on a commission orsalary-plus-commission basis. Managers and other employees may alsoparticipate in incentive wage plans. For example, at the restaurant chainP. F. Chang’s, ‘‘restaurant general managers and chefs are eligible toreceive monthly incentive payments based upon the profitability of therestaurant, as well as participate in an incentive program that rewards long-term improvements in the operating performance of the restaurant.’’3
Controlling Labor CostThe timekeeping and payroll departments have the responsibility of main-taining labor records. The timekeeping and payroll functions may beestablished as separate departments or organized as subdivisions of a singledepartment. Increasingly, automated timekeeping technology has replaced‘‘timekeeping’’ as a separate department. For example, many companiesissue magnetic cards to direct laborers who use them to ‘‘log on’’ and ‘‘logoff’’ to specific job assignments. They slide the card through a magneticcard reader connected to a remote computer terminal, much as you woulddo to pay for your groceries at the supermarket. The computer sends thislabor time information to the accounting department for preparation of thepayroll and distribution of labor costs to the appropriate jobs.
The payroll department, or payroll function within the accountingdepartment, uses the labor time records, whether manually or electronicallygenerated, to compute each employee’s gross earnings, the amount of with-holdings and deductions, and the net earnings to be paid to the employee.The payroll function includes completing and maintaining the payrollrecords, the employees’ earnings records, and the payroll summaries.
Labor Time Records
The labor time record, illustrated in Figure 3-2, shows the employee’stime spent on each job, as well as the time spent as indirect labor onmachine repair. Given the magnetic card-reading technology mentionedearlier, the time record typically takes the form of a computer file. None-theless, a production supervisor should review the labor hours recordedon the time record for accuracy, because the time record is the sourcedocument for allocating the cost of labor to jobs or departments in the jobcost ledger and factory overhead ledger, as shown by the arrows to the jobcost sheets in Figure 3-2.
The employer must compensate the employee for the time spent onassigned jobs. When time is not fully utilized, the employer suffers a lossjust as if a theft of some tangible good had occurred. Therefore, if timespent in the factory has been unproductive, the idle time, along with thereason for it, should be recorded and charged to Factory Overhead. Just as
3 P. F. Chang’s China Bistro, Inc., 2007 Annual Report.
LO2Specify
procedures
for controlling labor
costs.
128 Principles of Cost Accounting

the make-up guarantee discussed earlier was charged to Factory Overheadbecause it did not add value to any specific jobs, the unproductive idle timespent in the factory should also be charged to Factory Overhead.
Payroll Function
The payroll function’s primary responsibility is to compute the employees’wages and salaries. It involves combining the daily wages, determining thetotal earnings, and computing deductions and withholdings for eachemployee. Payroll is often a function within a single accounting depart-ment, as opposed to being a separate department. Also, many companiesnow outsource their payroll function to payroll preparation services such asADP or Paychex, Inc.
The department must maintain current information concerning regula-tory requirements regarding wages and salaries because a specified amountof the employee’s wages are subject to social security (FICA) and incometax deductions. Additional deductions, approved by the employee, canbe taken for group insurance premiums, union dues, contributions to a tax-sheltered annuity, and so on.
Payroll Records. Forms used to record earnings information may varyconsiderably from company to company; however, all forms possess somecommon characteristics. The payroll record shown in Figure 3-3, for the
Figure 3-2 Labor Time Record
Record No: LTR 126
Employee Name: Ira Weiss
Employee No. 174-03-9273
Employee Classification: Grade 1 Assembler
Hourly Rate: $15
Week: Feb. 10–16
Job No. Su M Tu W Th F Sa Total
402 0 7 5 0 0 0.0 0 12.0
437 0 0 3 6 8 6.5 0 23.5
Machine
Repair 0 1 0 2 0 1.0 0 4.0
Total 0 8 8 8 8 7.5 0 39.5
Supervisor: L. Verst
Date: February 16, 2011
JOB COST SHEETS
Factory overhead xxx
Job 437Job 402
Direct materials………………………..$xxxDirect materials…………… $xxx
Direct labor (23.5 hrs.×$15)……..352.50
Factory overhead…………………........xxxDirect labor (12 hrs.×$15) 180
Chapter 3 – Accounting for Labor 129

period ending February 16, provides typical information. It assembles andsummarizes each period’s payroll data and serves as a subsidiary record forthe preparation of a general journal entry. For example, the entry to recordthe payroll data in Figure 3-3 would be as shown below.
Payroll . . . . . . . . . . . . . . . . . . . . . . . . . . . . . . . . . . . . . . . . . . . . . . . . . . . . . . . . . 1,840.50
FICA Tax Payable . . . . . . . . . . . . . . . . . . . . . . . . . . . . . . . . . . . . . . . . . . . . . 147.24
Employees Income Tax Payable . . . . . . . . . . . . . . . . . . . . . . . . . . . . . . . 386.11
Health Insurance Payable . . . . . . . . . . . . . . . . . . . . . . . . . . . . . . . . . . . . . 120.00
Employee Receivable . . . . . . . . . . . . . . . . . . . . . . . . . . . . . . . . . . . . . . . . . 50.00
Wages Payable . . . . . . . . . . . . . . . . . . . . . . . . . . . . . . . . . . . . . . . . . . . . . . . 1,137.15
Recorded payroll liability
Note that the distribution of the gross payroll between Work in Process(for direct labor) and Factory Overhead (for indirect labor) will be illu-strated in the next section. Also note that a prior cash advance was deductedfrom the paycheck this period, reducing the asset account EmployeeReceivable.
Employees’ Earnings Records. In addition to the payroll record, payroll keepsa record of the earnings for each employee. Figure 3-4 shows an employeeearnings record. This cumulative record of employee earnings is neededto compute the amount of employee earnings subject to FICA and otherpayroll taxes. It also serves as the basis for reporting payroll information togovernmental agencies, such as individual employee earnings to the SocialSecurity Administration and Wage and Tax Statements (Form W-2) toemployees for the purpose of preparing their individual tax returns.
Payment of Net Earnings. The accounting department sends the payrollrecord (Figure 3-3) to the treasurer’s office, which is responsible for makingthe payments to the employees. The earnings usually are paid by check.
Figure 3-3 Payroll Record
1
2
3
4
5
6
7
8
9
10
11
12
13
14
15
16
17
A B C D E F G H I J
For Period Ending 2/16/2011 Earnings
Employee No. of Regular Overtime Total
Name No. M/s Allow. Rate Hours Amount Hours Amount Earnings
Donovan, F 123-45-9876 M 0 14.00 40.0 560.00 0 00.00 560.00
Fry, R. 987-65-1234 M 2 16.00 40.0 640.00 2 48.00 688.00
Weiss I. 174-03-9273 S 1 15.00 39.5 592.50 0 00.00 592.50
1,792.50 48.00 1,840.50
Withholdings Deductions Net Pay
FICA FICA Income Taxes Health Check Check
Earnings Tax Federal State Local Insurance Other No. Amount
560.00 44.80 84.00 28.00 5.60 40.00 8441 357.60
688.00 55.04 103.20 34.00 6.88 40.00 50.00 Repay advance 8442 398.88
592.50 47.40 88.88 29.62 5.93 40.00 8443 380.67
1,840.50 147.24 276.08 91.62 18.41 120.00 1,137.15
130 Principles of Cost Accounting

Figure 3-4 Employee Earnings Record
02/16/2011Social Security No.: 174-03-9273Employee Name: Ira Weiss
Mar. St.: S No. Allow.: 1 Sex: M Department: Grinding Occupation: Machinist Date of Birth: 4/4/57
Period
No.
Date
2011
Regular Overtime Total
Earnings
FICA
Tax
Income Taxes Health
Ins
Check
Federal State Local Other No. Amount
371.84
380.67
2817.43
2817.43
7971
8443
40.00
40.00
280.00
280.00
5.76
5.93
44.02
44.02
86.40 28.80
29.62
220.10
220.10
88.88
660.30
660.30
43.20
47.40
330.15
330.15
576.00576.004014.401/051
592.50
4402.00
4402.00
592.50
4096.00 306.00
306.004096.00
39.515.002/167
50.00
50.00
Qtr Ttl
Yrl Ttl
Rate Hours HoursAmount Amount
Ch
ap
ter
3–
Acco
un
ting
for
La
bo
r1
31

A check for the total amount to be paid is drawn to create a special payrollfund from which the employees will be paid. The special account is usedonly for payroll, and the individual payroll checks, when cashed, arecharged to the special account. A new payroll account may be establishedfor each payroll period, numbering the accounts sequentially. The checksdrawn for each payroll period can then be identified as belonging to aspecific payroll period. This system facilitates the reconciliation of bankstatements. The entry to record the payment of net pay to employees forthe period ending February 16, 2011, would be as follows:
Wages Payable . . . . . . . . . . . . . . . . . . . . . . . . . . . . . . . . . . . . . . . . . . . . . . . . . 1,137.15
Cash . . . . . . . . . . . . . . . . . . . . . . . . . . . . . . . . . . . . . . . . . . . . . . . . . . . . . . . . . 1,137.15
Paid employees
In the rare instance where employees are paid cash, a check is cashed forthe total amount of net earnings. The cash is then divided into amounts earnedby individual employees. These cash amounts are placed in envelopes anddistributed to the employees. The employee’s receipt or signature acknowl-edges the payment. Most employers now allow employees to authorize thedirect electronic deposit of their net pay to their checking accounts.
Accounting for Labor Costs and Employers’Payroll TaxesFor all regular hourly employees, the hours worked should be recorded ona labor time record. The payroll department enters pay rates and grossearnings and forwards the reports to accounting. Cost accountants examinethe labor time records and charge the labor costs to the appropriate jobs ordepartment and to factory overhead. This analysis of labor costs is recordedon a labor cost summary (Figure 3-5) that summarizes the direct laborand indirect labor charges to a department for the period.
Recall and Review 1
An employee earns $20 per hour for up to 200 units of production per day. An
employee who produces more than 200 units per day receives an additional
piece rate of $.50 per unit. Assume that an employee worked eight hours per
day with the following unit production for the week: Monday, 200; Tuesday,
175; Wednesday, 225; Thursday, 250; and Friday, 150. Calculate the employ-
ee’s gross earnings for the week. $____
(After working this exercise, see page 149 for the solution.)
You should now be able to work the following:
Questions 1–8; Exercises 3-1 to 3-3; Problems 3-1 and 3-2; and Mini-Case 1.
LO3Account for
labor costs
and payroll taxes.
132 Principles of Cost Accounting

Salaried employees, such as department supervisors, are often notrequired to prepare labor time records. Payroll sends a list of salariedemployees to accounting showing the names of employees, the nature ofwork performed, and the salaries. The accounting department records theearnings on the labor cost summary and in factory overhead ledgeraccounts, because the salaried factory employees are supervisors and otherfactory managers who do not physically convert the raw materials tofinished goods, and therefore their salaries are indirect labor.
The labor cost summary becomes the source for making a general journalentry, shown below, to distribute payroll to the appropriate accounts.
Work in Process . . . . . . . . . . . . . . . . . . . . . . . . . . . . . . . . . . . . . . . . . . . . . . . . 27,950
Factory Overhead . . . . . . . . . . . . . . . . . . . . . . . . . . . . . . . . . . . . . . . . . . . . . . . 5,330
Payroll . . . . . . . . . . . . . . . . . . . . . . . . . . . . . . . . . . . . . . . . . . . . . . . . . . . . . . . 33,280
Distributed payroll
The entry is then posted to the control accounts, Work in Process andFactory Overhead, in the general ledger. The labor time records have beenused to record the labor costs in both the subsidiary job cost ledger andfactory overhead ledger, as well as in the labor cost summary. Therefore,the debit to the work in process control account must equal the total directlabor cost charged to the individual jobs, and the debit to the factoryoverhead control account must equal the total indirect labor costs recordedin the factory overhead ledger. The flow of costs to and from the labor costsummary is illustrated in Figure 3-6.
In preparing the labor cost summary from the labor time records, anyovertime must be separated from an employee’s regular time because the
Figure 3-5 Labor Cost Summary
LABOR COST SUMMARY
Date
Dr.
Work in Progress
(Direct labor-regular
time)
Dr.
Factory Overhead
(Indirect labor and
overtime premium)
Cr.
Payroll
(Total)
Dept. Month EndingGrinding May 31, 2011
5/14
5/28
5/31
11,050 00
13,000 00
3,900 00
1,950 00
2,600 00
780 00
13,000 00
15,600 00
4,680 00
Totals 27,950 00 5,330 00 33,280 00
Chapter 3 – Accounting for Labor 133

accounting treatment may be different for each type of pay. Regular timeworked by direct laborers is charged to Work in Process. Overtime paymay be charged to Work in Process, to Factory Overhead, or allocatedpartly to Work in Process and partly to Factory Overhead. Overtimedistribution depends on the conditions creating the need for overtime hoursas the following explains.
If an employee works beyond the regularly scheduled time but is paidat the regular hourly rate, the extra pay is called overtime pay. If anadditional rate is allowed for the extra hours worked, the additionalrate earned is referred to as an overtime premium. The premium payrate is added to the employee’s regular rate for the additional hours worked.The premium rate is frequently one-half the regular rate, resulting in atotal hourly rate for overtime that is 150% of the regular rate. Underthese circumstances, overtime pay is often referred to as ‘‘time-and-a-half’’pay. In some cases, such as work done on Sundays and holidays, theovertime premium may be equal to the regular rate, resulting in ‘‘double-time’’ pay.
To illustrate how a payroll is computed where an overtime premiumis a factor, assume that an employee regularly earns $15 per hour for an8-hour day. If called upon to work more than 8 hours in a working day, thecompany pays time-and-a-half for overtime hours. Assuming that theemployee works 12 hours on Monday, the earnings would be computed asfollows:
Direct labor—8 hours @ $15 . . . . . . . . . . . . . . . . . . . . . . . . . . . . . . . . . . . . . $120
Overtime wages:
Direct labor—4 hours @ $15 . . . . . . . . . . . . . . . . . . . . . . . . . . . . . . . . . . . 60
Factory overhead (overtime premium)—4 hours @ $7.50 . . . . . . . 30 90
Total earnings . . . . . . . . . . . . . . . . . . . . . . . . . . . . . . . . . . . . . . . . . . . . . . . . . . $210
Figure 3-6 Flow of Costs from Subsidiary Records to General Ledger
General Journaland General Ledger
(Work in Process—Direct LaborFactory Overhead—Indirect Labor)
Job CostLedger(Direct Labor)
Factory OverheadLedger
(Indirect Labor)
Labor CostSummary(Direct and IndirectLabor)
Labor Time Records
134 Principles of Cost Accounting

Work in Process would be charged with the direct labor cost of $180($120 þ $60), earned at the regular rate of $15 per hour. The additionalrate of $7.50 was used to compute the $30 cost of the overtime premium,which was charged to Factory Overhead because the job worked on duringthe overtime period was a result of the random scheduling of jobs. Bycharging the overtime premium to the factory overhead account, all jobsworked on during the period share the cost of overtime premiums paid. Ifan individual job contract stipulated that it was a rush order and theovertime premium resulted from the time limitation in the contract, itwould be appropriate to charge the premium pay to Work in Process forthe specific job worked on during the overtime period instead of to afactory overhead account.
Employers’ Payroll Taxes
Payroll taxes imposed on employers include social security tax and federaland state unemployment taxes. Employers must periodically report and paythe taxes to the appropriate government agencies. Employers who fail tofile required reports or pay taxes due are subject to civil and, in some cases,criminal penalties.
The Federal Insurance Contributions Act (FICA) requires employ-ers to pay social security taxes on wages and salaries equal to the amountwithheld from employees’ earnings. The employers and employees, there-fore, share equally in the cost of the social security program. FICA includesa tax to finance the Federal Old Age, Survivors, and Disability Insuranceprogram (OASDI) and the Medicare program. The legislation that governsFICA is frequently amended. These amendments change the wage base sub-ject to FICA and the percentage rate of tax to be charged. For example, in1980 the tax rate for the employer was 6.13% and the wage base was$25,900. For 2009, the FICA tax rate was 7.65% on the first $106,800 inannual earnings; earnings beyond $106,800 were taxed 1.45% for Medicare.(Due to the uncertainty that surrounds both the rate and the base wage, anarbitrary FICA tax rate of 8% will be applied to the first $100,000 ofearnings in all discussions, examples, and problems in this text. Earningsbeyond $100,000 will not be taxed. The selected arbitrary rate and wagebase will simplify the tax calculations related to FICA, but they are notpredictive of future legislation that may alter the social security system.)
The Federal Unemployment Tax Act (FUTA) requires employers topay an established rate of tax on wages and salaries to provide for compensa-tion to employees if they are laid off from their regular employment. For2009, employers were subject to a tax of 6.2%, which may be reduced to0.8% for credits for state unemployment compensation tax, on the first$7,000 of wages or salaries paid to each employee during the calendar year.
Unemployment benefits, however, are actually paid by individual statesand not the federal government, which merely administers the program. As of2009, the maximum state rate recognized by the federal unemployment systemwas 5.4% of the first $7,000 of each employee’s annual earnings, which goesto the state government to accumulate funds for paying unemployment
Chapter 3 – Accounting for Labor 135

compensation. Each state has its own unemployment tax laws, althoughsuch laws must conform to certain requirements established under FUTA.Both tax rates and wage bases vary among states, and the actual amount ofcombined federal and state unemployment taxes paid depends on a numberof factors, including an experience rating for an employer who providessteady employment that may result in a state rate substantially below the5.4% federal credit maximum. For example, the state of Texas has a taxablewage base of $9,000 and a maximum and minimum tax rate of 6.26% and0.26%, respectively. (Because of the variation among states and becauseFUTA taxes are subject to amendments, the examples, exercises, andproblems in the text will assume a 4% rate for state unemployment taxesand a 1% rate for federal unemployment taxes. These tax rates will beapplied to the first $8,000 of an employee’s annual earnings.)
The employer’s payroll taxes are directly related to the costs of directlabor and indirect labor, and theoretically should be charged to thesecategories of labor cost. However, due to the additional expense and time suchallocations would require, it is usually more practical to record all factory-related payroll taxes as factory overhead. The entry to record the payroll taxesfor the payroll in Figure 3-3 (page 130), assuming that no employee hadexceeded the maximum for unemployment taxes, would be as follows:Factory Overhead . . . . . . . . . . . . . . . . . . . . . . . . . . . . . . . . . . . . . . . . . . . . . . . 239.27
FICA Tax Payable . . . . . . . . . . . . . . . . . . . . . . . . . . . . . . . . . . . . . . . . . . . . . 147.24
Federal Unemployment Tax Payable . . . . . . . . . . . . . . . . . . . . . . . . . . . 18.41*
State Unemployment Tax Payable . . . . . . . . . . . . . . . . . . . . . . . . . . . . . 73.62**
Recognized payroll taxes.
*$1,840.50 � 0.01**$1,840.50 � 0.04
Illustration of Accounting for Labor Costs
Magnum Manufacturing Company pays employees every two weeks. Mon-day, May 1, is the beginning of a new payroll period. The companymaintains the following records:
Payroll record
Employee earnings records
General journal
General ledger
Job cost ledger
Factory overhead ledger
Magnum uses the following general ledger accounts in accounting for laborcosts:
Cash
Work in Process
136 Principles of Cost Accounting

Wages Payable
FICA Tax Payable
Employees Income Tax Payable
Federal Unemployment Tax Payable
State Unemployment Tax Payable
Health Insurance Premiums Payable
Payroll
Factory Overhead
Sales Salaries
Administrative Salaries
Payroll Tax Expense—Sales Salaries
Payroll Tax Expense—Administrative Salaries
Applicable withholding and payroll tax rates and wage bases follow:
RatesAnnual Wages/Salaries Sub-
ject to TaxEmployee
WithholdingsEmployer
Payroll TaxesFederal income tax . . . . . . . . . . . . . . . . Graduated* 100%
FICA . . . . . . . . . . . . . . . . . . . . . . . . . . . . . . 8% 8% $100,000
Federal unemployment . . . . . . . . . . . . 1% $ 8,000
State unemployment . . . . . . . . . . . . . . 4% $ 8,000
*Federal income tax withholdings are determined from tables. State and local income taxesare not shown in this example.
The following payroll summary is prepared by the payroll departmentand forwarded to accounting for recording:
Payroll SummaryFor the Period May 1–14
FactoryEmployees
Sales andAdministrative
Employees TotalGross earnings . . . . . . . . . . . . . . . . . . . . $100,000 $30,000 $130,000
Withholdings and deductions:
FICA tax . . . . . . . . . . . . . . . . . . . . . . . . . $ 8,000 $ 2,400 $ 10,400
Income tax . . . . . . . . . . . . . . . . . . . . . . 11,250 3,500 14,750
Health insurance premiums . . . . . . 2,100 700 2,800
Total . . . . . . . . . . . . . . . . . . . . . . . . . . $ 21,350 $ 6,600 $ 27,950
Net earnings . . . . . . . . . . . . . . . . . . . . . . $ 78,650 $23,400 $102,050
Chapter 3 – Accounting for Labor 137

After the data are verified, a general journal entry records the payroll:
(A) Payroll . . . . . . . . . . . . . . . . . . . . . . . . . . . . . . . . . . . . . . . . . . . . . . . . . 130,000
FICA Tax Payable . . . . . . . . . . . . . . . . . . . . . . . . . . . . . . . . . . . . . 10,400
Employees Income Tax Payable . . . . . . . . . . . . . . . . . . . . . . . 14,750
Health Insurance Premiums Payable . . . . . . . . . . . . . . . . . . . 2,800
Wages Payable . . . . . . . . . . . . . . . . . . . . . . . . . . . . . . . . . . . . . . . 102,050
Incurred payroll for period ended May 14
To record the payment of the net earnings to employees, the followingentry must be made:
(B) Wages Payable . . . . . . . . . . . . . . . . . . . . . . . . . . . . . . . . . . . . . . . . . 102,050
Cash . . . . . . . . . . . . . . . . . . . . . . . . . . . . . . . . . . . . . . . . . . . . . . . . . 102,050
Paid payroll for period ended May 14
The schedule of earnings and payroll taxes shown below provides theinformation necessary to distribute the total payroll of $130,000 to the appro-priate accounts and to record the employer’s payroll taxes for the period.
Schedule of Earnings and Payroll TaxesFor Payroll Period May 1–14
UnemploymentTaxes
Nonfactory EmployeesGross
EarningsFICA8%
Federal1%
State4%
TotalPayrollTaxes
Sales . . . . . . . . . . . . . . . . . . . . $20,000 $ 1,600 $200 $ 800 $2,600
Administrative . . . . . . . . . . . 10,000 800 100 400 1,300
$30,000 $ 2,400 $300 $1,200 $3,900
Factory EmployeesDirect labor:
Regular . . . . . . . . . . . . . . . $ 85,000 $ 6,800 $ 850 $3,400 $11,050
Overtime premium . . . . 10,000 800 100 400 1,300
Indirect labor . . . . . . . . . . . . 5,000 400 50 200 650
$100,000 $ 8,000 $1,000 $4,000 $13,000
Total . . . . . . . . . . . . . . . . . . . . $130,000 $10,400 $1,300 $5,200 $16,900
The distribution of the payroll and the employer’s payroll taxes arerecorded as follows:
(C) Work in Process 85,000
Factory Overhead . . . . . . . . . . . . . . . . . . . . . . . . . . . . . . . . . . . . . . . 15,000*
Sales Salaries . . . . . . . . . . . . . . . . . . . . . . . . . . . . . . . . . . . . . . . . . . 20,000
Administrative Salaries . . . . . . . . . . . . . . . . . . . . . . . . . . . . . . . . . 10,000
Payroll . . . . . . . . . . . . . . . . . . . . . . . . . . . . . . . . . . . . . . . . . . . . . . . 130,000
Distributed payroll for period ended May 14
*Overtime premium ($10,000) þ Indirect factory labor ($5,000)
138 Principles of Cost Accounting

(D) Factory Overhead . . . . . . . . . . . . . . . . . . . . . . . . . . . . . . . . . . . . . . . . . . . . . . . 13,000**
Payroll Tax Expense—Sales Salaries . . . . . . . . . . . . . . . . . . . . . . . . . . . . . 2,600***
Payroll Tax Expense—Administrative Salaries . . . . . . . . . . . . . . . . . . . . 1,300****
FICA Tax Payable . . . . . . . . . . . . . . . . . . . . . . . . . . . . . . . . . . . . . . . . . . . . . 10,400
Federal Unemployment Tax Payable . . . . . . . . . . . . . . . . . . . . . . . . . . . 1,300
State Unemployment Tax Payable . . . . . . . . . . . . . . . . . . . . . . . . . . . . . 5,200
Recognized employer’s payroll taxes for period ended May 14
**FICA ($8,000) þ FUTA ($1,000) þ SUTA ($4,000)***FICA ($1,600) þ FUTA ($200) þ SUTA ($800)
****FICA ($800) þ FUTA ($100) þ SUTA ($400)
The general ledger accounts that reflect the entries related to theMay 1–14 payroll period follow, assuming a beginning cash balance of$250,000:
Cash Work in Process
May 1 250,000 (B) 102,050 (C) 85,000
Wages Payable FICA Tax Payable
(B) 102,050 (A) 102,050 (A) 10,400
(D) 10,400
Employees Income Tax Payable Federal Unemployment Tax Payable
(A) 14,750 (D) 1,300
State Unemployment Tax Payable Health Insurance Premiums Payable
(D) 5,200 (A) 2,800
Payroll Factory Overhead
(A) 130,000 (C) 130,000 (C) 15,000
(D) 13,000
Sales Salaries Administrative Salaries
(C) 20,000 (C) 10,000
Payroll Tax Expense—Sales Salaries Payroll Tax Expense—Admin. Salaries
(D) 2,600 (D) 1,300
Chapter 3 – Accounting for Labor 139

The next payroll period is May 15 to May 28. At the end of the two-week period, the following schedule for payroll is prepared:
Payroll SummaryFor the Period May 15–28
FactoryEmployees
Sales andAdministrative
Employees TotalGross earnings . . . . . . . . . . . . . . . . . . . . . . . . $120,000 $30,000 $150,000
Withholdings and deductions:
FICA tax . . . . . . . . . . . . . . . . . . . . . . . . . . . . . $ 9,600 $ 2,400 $ 12,000
Income tax . . . . . . . . . . . . . . . . . . . . . . . . . . 13,000 3,500 16,500
Health insurance premiums . . . . . . . . . . 2,300 700 3,000
Total . . . . . . . . . . . . . . . . . . . . . . . . . . . . . . $ 24,900 $ 6,600 $ 31,500
Net earnings . . . . . . . . . . . . . . . . . . . . . . . . . . . $ 95,100 $23,400 $118,500
The payroll data are verified, and a general journal entry is prepared asshown below.
(E) Payroll . . . . . . . . . . . . . . . . . . . . . . . . . . . . . . . . . . . . . . . . . . . . . . . . . 150,000
FICA Tax Payable . . . . . . . . . . . . . . . . . . . . . . . . . . . . . . . . . . . . . 12,000
Employees Income Tax Payable . . . . . . . . . . . . . . . . . . . . . . . 16,500
Health Insurance Premiums Payable . . . . . . . . . . . . . . . . . . . 3,000
Wages Payable . . . . . . . . . . . . . . . . . . . . . . . . . . . . . . . . . . . . . . . 118,500
Incurred payroll for period ending May 28
The payment of the net earnings to employees requires the followingentry:
(F) Wages Payable . . . . . . . . . . . . . . . . . . . . . . . . . . . . . . . . . . . . . . . . . 118,500
Cash . . . . . . . . . . . . . . . . . . . . . . . . . . . . . . . . . . . . . . . . . . . . . . . . . 118,500
Paid payroll for period ended May 28
The schedule of earnings and payroll taxes provides the informationnecessary to distribute the total payroll of $150,000 to the appropriateaccounts and to record the employer’s payroll taxes for the period.
Schedule of Earnings and Payroll TaxesFor Payroll Period May 15–28
UnemploymentTaxes
Nonfactory EmployeesGross
EarningsFICA8%
Federal1%
State4%
TotalPayrollTaxes
Sales . . . . . . . . . . . . . . . . . . . . . . $20,000 $1,600 $200 $ 800 $2,600
Administrative . . . . . . . . . . . . . 10,000 800 100 400 1,300
$30,000 $2,400 $300 $1,200 $3,900
140 Principles of Cost Accounting

Factory EmployeesDirect labor:
Regular . . . . . . . . . . . . . . . . . . $100,000 $ 8,000 $1,000 $4,000 $13,000
Overtime premium . . . . . . . 12,000 960 120 480 1,560
Indirect labor . . . . . . . . . . . . . . . 8,000 640 80 320 1,040
$120,000 $ 9,600 $1,200 $4,800 $15,600
Total . . . . . . . . . . . . . . . . . . . . . . . $150,000 $12,000 $1,500 $6,000 $19,500
The distribution of the payroll and the employer’s payroll taxes arerecorded as follows:
(G) Work in Process . . . . . . . . . . . . . . . . . . . . . . . . . . . . . . . . . . . . . . . . . . . . . . . . 100,000
Factory Overhead . . . . . . . . . . . . . . . . . . . . . . . . . . . . . . . . . . . . . . . . . . . . . . . 20,000*
Sales Salaries . . . . . . . . . . . . . . . . . . . . . . . . . . . . . . . . . . . . . . . . . . . . . . . . . . 20,000
Administrative Salaries . . . . . . . . . . . . . . . . . . . . . . . . . . . . . . . . . . . . . . . . . 10,000
Payroll . . . . . . . . . . . . . . . . . . . . . . . . . . . . . . . . . . . . . . . . . . . . . . . . . . . . . . . 150,000
Distributed payroll for period ended May 28
*Overtime premium ($12,000) þ Indirect factory labor ($8,000)
(H) Factory Overhead . . . . . . . . . . . . . . . . . . . . . . . . . . . . . . . . . . . . . . . . . . . . . . . 15,600
Payroll Tax Expense—Sales Salaries . . . . . . . . . . . . . . . . . . . . . . . . . . . . . 2,600
Payroll Tax Expense—Administrative Salaries . . . . . . . . . . . . . . . . . . . . 1,300
FICA Tax Payable . . . . . . . . . . . . . . . . . . . . . . . . . . . . . . . . . . . . . . . . . . . . . 12,000
Federal Unemployment Tax Payable . . . . . . . . . . . . . . . . . . . . . . . . . . . 1,500
State Unemployment Tax Payable . . . . . . . . . . . . . . . . . . . . . . . . . . . . . 6,000
Recognized employer’s payroll taxes for period ended May 28
Payroll AccrualWhen the financial statement date does not coincide with the endingdate for a payroll period, an accrual for payroll earnings and payrolltax expense should be made. The accrual computations will not includethe employees’ withholdings because they do not affect the employer’sincome or total liabilities to be reported. However, the employer’s payrolltaxes are accrued to avoid understating the expenses and liabilities for theperiod.
The next two-week payroll period for Magnum Manufacturing Com-pany begins on May 29 and ends June 11. However, the financial state-ments to be prepared for May require an accrual of payroll earnings andtaxes for the period May 29–31. The employee earnings and the payrolltaxes for the accrual period are shown here, followed by the journal entriesto record and distribute the accrued payroll and to record the employer’spayroll taxes.
LO4Prepare
accruals for
payroll earnings and
taxes.
Chapter 3 – Accounting for Labor 141

Schedule of Earnings and Payroll TaxesFor Payroll Period May 29–31
Unemployment Taxes
Nonfactory EmployeesGross
EarningsFICA8%
Federal1%
State4%
TotalPayrollTaxes
Sales . . . . . . . . . . . . . . . . . . . . . . $6,000 $480 $60 $240 $ 780
Administrative . . . . . . . . . . . . . 3,000 240 30 120 390
$9,000 $720 $90 $360 $1,170
Factory EmployeesDirect labor:
Regular . . . . . . . . . . . . . . . . . . $30,000 $2,400 $300 $1,200 $3,900
Overtime premium . . . . . . . 4,000 320 40 160 520
Indirect labor . . . . . . . . . . . . . . . 2,000 160 20 80 260
$36,000 $2,880 $360 $1,440 $4,680
Total . . . . . . . . . . . . . . . . . . . . . . . $45,000 $3,600 $450 $1,800 $5,850
(I) Payroll . . . . . . . . . . . . . . . . . . . . . . . . . . . . . . . . . . . . . . . . . . . . . . . . . 45,000
Wages Payable . . . . . . . . . . . . . . . . . . . . . . . . . . . . . . . . . . . . . . . 45,000
Incurred payroll for May 29–31
(J) Work in Process . . . . . . . . . . . . . . . . . . . . . . . . . . . . . . . . . . . . . . . . 30,000
Factory Overhead . . . . . . . . . . . . . . . . . . . . . . . . . . . . . . . . . . . . . . . 6,000*
Sales Salaries . . . . . . . . . . . . . . . . . . . . . . . . . . . . . . . . . . . . . . . . . . 6,000
Administrative Salaries . . . . . . . . . . . . . . . . . . . . . . . . . . . . . . . . . 3,000
Payroll . . . . . . . . . . . . . . . . . . . . . . . . . . . . . . . . . . . . . . . . . . . . . . . 45,000
Distributed payroll for period May 29–31
*Overtime premium ($4,000) þ Indirect labor ($2,000)
(K) Factory Overhead . . . . . . . . . . . . . . . . . . . . . . . . . . . . . . . . . . . . . . . 4,680
Payroll Tax Expense—Sales Salaries . . . . . . . . . . . . . . . . . . . . . 780
Payroll Tax Expense—Administrative Salaries . . . . . . . . . . . . 390
FICA Tax Payable . . . . . . . . . . . . . . . . . . . . . . . . . . . . . . . . . . . . . 3,600
Federal Unemployment Tax Payable . . . . . . . . . . . . . . . . . . . 450
State Unemployment Tax Payable . . . . . . . . . . . . . . . . . . . . . 1,800
Recognized employer’s payroll taxes for period May 29–31
Before June transactions are recorded, the entry for accruing payrollshould be reversed:
(L) Wages Payable . . . . . . . . . . . . . . . . . . . . . . . . . . . . . . . . . . . . . . . . . 45,000
Payroll . . . . . . . . . . . . . . . . . . . . . . . . . . . . . . . . . . . . . . . . . . . . . . . 45,000
Reversed May 31 adjusting entry for accrued payroll
The amount earned by the employees during the May 29–31 period is aportion of the total costs and expenses for production, sales, and
142 Principles of Cost Accounting

administration for the month of May. However, the employees will not bepaid until June 11 for the payroll period from May 29 to June 11. Thecredit balance in the payroll account, created by the reversing entry, willassure that only the payroll costs accumulated during the June 1 to June 11period will be included in the June production, sales, and administrativecosts. The ledger accounts would appear, as follows, after posting all of thepreceding entries:
Cash Work in Process
May 1 250,000 (B) 102,050 (C) 85,000
(F) 118,500 (G) 100,000
220,550 (J) 30,000
29,450 215,000
Wages Payable FICA Tax Payable
(B) 102,050 (A) 102,050 (A) 10,400
(F) 118,500 (E) 118,500 (D) 10,400
(L) (reversing) 45,000 (I) 45,000 (E) 12,000
(H) 12,000
(K) 3,600
48,400
Employees Income Tax Payable Federal Unemployment Tax Payable
(A) 14,750 (D) 1,300
(E) 16,500 (H) 1,500
31,250 (K) 450
3,250
State Unemployment Tax Payable Health Insurance Premiums Payable
(D) 5,200 (A) 2,800
(H) 6,000 (E) 3,000
(K) 1,800 5,800
13,000
Payroll Factory Overhead
(A) 130,000 (C) 130,000 (C) 15,000
(E) 150,000 (G) 150,000 (D) 13,000
(I) 45,000 (J) 45,000 (G) 20,000
325,000 (L) (reversing) 45,000 (H) 15,600
370,000 (J) 6,000
45,000 (K) 4,680
74,280
Chapter 3 – Accounting for Labor 143

Sales Salaries Administrative Salaries
(C) 20,000 (C) 10,000
(G) 20,000 (G) 10,000
(J) 6,000 (J) 3,000
46,000 23,000
Payroll Tax Expense—Sales SalariesPayroll Tax Expense—Administrative Salaries
(D) 2,600 (D) 1,300
(H) 2,600 (H) 1,300
(K) 780 (K) 390
5,980 2,990
Special Labor Cost ProblemsAn employer may be required to account for a variety of labor-related coststhat do not fall into the normal routine of accounting for payroll costs.These special costs may include shift premiums, pensions (such as employercontributions to a 401k plan), bonuses, and vacation and holiday pay. If
Recall and Review 2
The total wages and salaries earned by all employees of Dilbert Mfg. Co.
during the month of April, as shown in the labor cost summary and the
schedule of fixed administrative and sales salaries, are classified as follows:
Direct labor . . . . . . . . . . . . . . . . . . . . . . . . . . . . . . . . . . . . . . . . . . . . . . . . . . . . $312,563
Indirect labor . . . . . . . . . . . . . . . . . . . . . . . . . . . . . . . . . . . . . . . . . . . . . . . . . . . 81,060
Administrative salaries . . . . . . . . . . . . . . . . . . . . . . . . . . . . . . . . . . . . . . . . . . 70,100
Sales salaries . . . . . . . . . . . . . . . . . . . . . . . . . . . . . . . . . . . . . . . . . . . . . . . . . . 86,250
Total wages . . . . . . . . . . . . . . . . . . . . . . . . . . . . . . . . . . . . . . . . . . . . . . . . . . . . $549,973
a. Prepare a journal entry to distribute the wages earned during April.
b. What is the total amount of payroll taxes that will be imposed on the
employer, assuming that two administrative employees with combined
earnings this period of $2,000 have exceeded $8,000 in earnings prior to
the period?__________________________________
(After working this exercise, see page 149 for the solution.)
You should now be able to work the following:
Questions 9–16; Exercises 3-4 to 3-11; Problems 3-3 to 3-10; and
Self-Study Problem 1.
LO5Account for
special prob-
lems in labor costing.
144 Principles of Cost Accounting

encountered, the employer should systematically record and recognize eachof these costs related to manufacturing labor as costs of the productionprocess. Some companies identify the fringe benefits of direct laborers withthe specific job being worked on (Work in Process), while others allocatethe fringe benefits to all jobs worked on during the period (Factory Over-head). It is theoretically more correct to trace the fringe benefit costs to thespecific jobs because, if highly paid workers with their higher fringe benefitsare required for a certain job, that job should also bear a greater amount offringe benefit costs. In practice, however, fringe benefits more often thannot are charged to Factory Overhead and spread over all jobs workedduring the period.
Shift Premium
A work shift is defined as a regularly scheduled work period for adesignated number of hours. If a company divides each workday into twoor three 8-hour shifts, the employees working on shifts other than theregular daytime shift may receive additional pay, called a shift premium.For example, assume that a manufacturer operates three shifts: day shift,8 A.M. to 4 P.M.; evening or ‘‘swing’’ shift, 4 P.M. to midnight; night or‘‘graveyard’’ shift, midnight to 8 A.M. The company pays an additional $1.00per hour to employees who work the ‘‘swing’’ shift and an additional $1.50per hour to workers on the ‘‘graveyard’’ shift. The additional payroll costsfor the shift premiums do not increase the productivity of the shifts, but arepaid because of the social and other lifestyle adjustments required of thelate-shift workers. The ‘‘other-than-normal’’ sleep and work schedulesdeprive the workers from participating in many established social activitiesand routines. The shift premiums are designed to attract workers to thelater, less desirable shifts scheduled by a company. In reality, even thoughlater shift workers are paid at higher rates, the productivity level of the dayworkers usually exceeds the productivity of the higher paid, late-shiftemployees due to the difficult adjustment to working other-than-normaldaytime hours. To avoid a distortion in costing jobs depending on the timeof day that they are worked on, shift premiums are usually charged toFactory Overhead and allocated to all jobs worked on during the period,regardless of the shift on which they happened to be produced.
Employee Pension Costs
Pension costs originate from an agreement between a company and itsemployee group, by which the company promises to provide income toemployees after they retire. In what is called a defined benefit plan, theamount of pension benefits paid to a retired employee is commonly basedon the employee’s past level of earnings and length of service with thecompany. A defined contribution plan specifies the maximum amount ofcontributions that can be made to the plan by employer and employee, butthe amount of the pension benefits is tied to the performance of thecompany stock or other investments. Noncontributory plans are
Chapter 3 – Accounting for Labor 145

completely funded (paid for) by the company. Contributory plans,which are more common in practice, require a partial contribution fromthe employee. When a pension plan is initiated, it is usually retroactiveand recognizes the previous years of each employee’s service with thecompany.
A 401(k) plan is an example of a defined contribution plan. Employeesmay contribute a prescribed percentage of their income to the plan (up to amaximum of $16,500 and $22,000 for employees under 50 years old and50 years of age or greater, respectively, in 2009) for the purchase ofcompany stock, mutual funds, or other investments. In most 401(k) plans,employers match a certain portion of the employee investment. Advantagesof the plan, in addition to the employer matching contribution, include thetax-deferred features of the wages invested in the plan and the earnings onplan investments until withdrawals are made at retirement. Figure 3-7illustrates the potential tax saving from investing in a 401(k).
A basic provision of all plans is to systematically accrue, over the periodof active service, the total estimated pension cost from the beginning dateof the pension plan to the employee’s retirement date. If, for example, anemployee works a 40-hour week and the company incurs a pension cost of$2 per hour, the amount of pension cost chargeable to the payroll periodfor this employee is $80. The pension costs related to the factory employees
Figure 3-7 Annual tax saving from a 401(k) contribution
Taxpayer A(no 401(k))
Taxpayer B(401(k)
contribution)
Gross Income $100,000 $ 100,000
401(k) Reduction -0- 20,000
Adjusted Gross Income $100,000 $ 80,000
Itemized Deductions 30,000 30,000
Taxable Income $ 70,000 $ 50,000
Tax (@ 30%* Rate) 21,000 15,000
After-Tax Income $ 49,000 $ 35,000
Savings in 401(k) Plan -0- 20,000
Total $ 49,000 $ 55,000
*Example ignores the possibility that taxpayer B may also be taxed at a lower rate than taxpayer A, because lowertaxable income may result in lower tax bracket.
146 Principles of Cost Accounting

could be charged to general or administrative expenses under the premisethat the existence of a pension plan is beneficial to the company as a whole.However, it is also considered appropriate to charge pension costs directlyto the individual employee’s department, such as to Factory Overhead forthe pension costs of manufacturing employees.
Bonuses
Employees may receive bonus pay for a variety of reasons, such as higher-than-usual company profits, exceeding departmental quotas for selling orproduction, or for any other achievement that the company feels meritsadditional pay. Bonus plans may include some or all employees. The cost ofbonuses is generally charged to the department in which the employeeworks. Therefore, factory workers’ bonuses are charged to Factory Over-head, and sales and administrative employees’ bonuses are charged toSelling and Administrative Expense.
Vacation and Holiday Pay
All permanent employees of a company expect a paid vacation each year.The vacation pay is earned by the employee for daily service on the jobover the course of the year. Therefore, the vacation cost is accruedthroughout the year and assigned to the employee’s department. Forexample, assume that an employee earns $600 per week and is entitled to afour-week vacation. The total cost of the vacation to the company would be$2,400. For each of the 48 weeks that the employee works, the employee’sdepartment would be charged $50 [$2,400/(52 weeks – 4 weeks vacation)]for vacation pay expense.
Holiday pay is based on an agreement between management andcompany employees. The agreement stipulates that certain holidays duringthe year will be paid for by the company, but they are nonworking days forthe employees.
Accounting for Bonuses, Vacations, and Holiday PayTo illustrate accounting for bonuses, vacations, and holiday pay, assumethat a factory worker, who is classified as direct labor, earns $700 eachweek. In addition, the worker will receive a $1,000 bonus at year-end, a2-week paid vacation, and 10 paid holidays. The following entry recordsthe weekly payroll and the costs and liabilities related to the bonus,vacation, and holiday pay as an expense of the 50 weeks (52 weeks – 2 weeksvacation) that the employee actually worked:
Work in Process . . . . . . . . . . . . . . . . . . . . . . . . . . . . . . . . . . . . . . . . . . . . . . . . . . . . . 700
Factory Overhead (Bonus)* . . . . . . . . . . . . . . . . . . . . . . . . . . . . . . . . . . . . . . . . . . . 20
Factory Overhead (Vacation)** . . . . . . . . . . . . . . . . . . . . . . . . . . . . . . . . . . . . . . . 28
Factory Overhead (Holiday)*** . . . . . . . . . . . . . . . . . . . . . . . . . . . . . . . . . . . . . . . 28
Payroll . . . . . . . . . . . . . . . . . . . . . . . . . . . . . . . . . . . . . . . . . . . . . . . . . . . . . . . . . . . . 700
Bonus Liability . . . . . . . . . . . . . . . . . . . . . . . . . . . . . . . . . . . . . . . . . . . . . . . . . . . . . 20
Chapter 3 – Accounting for Labor 147

Vacation Pay Liability . . . . . . . . . . . . . . . . . . . . . . . . . . . . . . . . . . . . . . . . . . . . . . 28
Holiday Pay Liability . . . . . . . . . . . . . . . . . . . . . . . . . . . . . . . . . . . . . . . . . . . . . . . 28
Incurred payroll and bonus, vacation, and holiday pay
*Bonus: $1,000/50 weeks ¼ $20 per week.**Vacation Pay: ($700 per week � 2 weeks)/50 weeks ¼ $28 per week.***Holiday Pay: ($700 per week � 5 days) � 10 paid holidays ¼ $1,400
$1,400/50 weeks ¼ $28 per week.
Note in the previous example that Factory Overhead was debited forthe cost of the bonus, vacation, and holiday pay earned by the directlaborers. If, instead, the workers’ fringe benefits had been tracked to theindividual jobs they had worked on, Work in Process would have beendebited. If these fringe benefits had related to sales workers or generaloffice workers, Sales Salaries and Administrative Salaries would have beendebited, respectively.
KEY TERMS
Bonus pay, 147
Contributory plans, 146
Defined benefit plan, 145
Defined contribution plan, 145
Direct labor, 124
Employee earnings record, 130
Federal Insurance Contributions Act (FICA), 135
Federal Unemployment Tax Act (FUTA), 135
Holiday pay, 147
Hourly rate plan, 126
Incentive wage plan, 126
Labor cost summary, 132
Labor time record, 128
Make-up guarantee, 127
Modified wage plans, 126
Noncontributory plans, 145
Overtime pay, 134
Overtime premium, 134
Payroll record, 129
Payroll taxes, 135
Pension costs, 145
Piece-rate plan, 126
Production work teams, 127
Productivity, 126
Shift premium, 145
Touch labor, 124
Vacation pay, 147
Work shift, 145
Recall and Review 3
Larry Riester earns $1,000 per week for a five-day week, and he is entitled
to 10 paid holidays and four weeks of paid vacation per year. What is the
amount of the total holiday pay and how much of it should be expensed
per week? $_____________.
What is the total vacation pay and how much of it should be expensed per
week? $____________________.
(After working this exercise, see page 149 for the solution.)
You should now be able to work the following:
Questions 17– 22; Exercises 3-12 to 3-14; Problems 3-11 and 3-12;
Mini-Case 2; Internet Exercise; and Self-Study Problem 2.
148 Principles of Cost Accounting

SELF-STUDY PROBLEM 1
Payment and Distribution of Payroll
Bronx Company
The general ledger of the Bronx Company showed the following credit
balances on March 15:
FICA Tax Payable . . . . . . . . . . . . . . . . . . . . . . . . . . . . . . . . . . . . . . . . . . . . . . . . . . . . . . . $1,550
Employees Income Tax Payable . . . . . . . . . . . . . . . . . . . . . . . . . . . . . . . . . . . . . . . . . 975
FUTA Tax Payable . . . . . . . . . . . . . . . . . . . . . . . . . . . . . . . . . . . . . . . . . . . . . . . . . . . . . . 95
State Unemployment Tax Payable . . . . . . . . . . . . . . . . . . . . . . . . . . . . . . . . . . . . . . . 380
ANSWERS TO RECALL AND REVIEW EXERCISES
R&R 1
Day Hours UnitsHourly
EarningsPiece-rateEarnings
TotalEarnings
Monday 8 200 $ 160.00 $ 160.00
Tuesday 8 175 160.00 160.00
Wednesday 8 225 160.00 $ 12.50 172.50
Thursday 8 250 160.00 25.00 185.00
Friday 8 150 160.00 160.00
Total 40 1,000 $ 800.00 $ 37.50 $ 837.50
R&R 2Work in Process . . . . . . . . . . . . . . . . . . . . . . . . . . . . . . . . . . . . . . . . . . . 312,563
Factory Overhead (Indirect Labor) . . . . . . . . . . . . . . . . . . . . . . . . . 81,060
Administrative Salaries . . . . . . . . . . . . . . . . . . . . . . . . . . . . . . . . . . . . 70,100
Sales Salaries . . . . . . . . . . . . . . . . . . . . . . . . . . . . . . . . . . . . . . . . . . . . . 86,250
Payroll . . . . . . . . . . . . . . . . . . . . . . . . . . . . . . . . . . . . . . . . . . . . . . . . . . 549,973
Employer payroll taxes ¼ 8.0% (FICA) þ 1.0% (Federal Unemployment) þ 4.0%
(State Unemployment) ¼ 13% of total wages for the period, reduced by 5% of
portion of wages directed to employees whose calendar-year earnings prior to
period have exceeded $8,000 (.13 � $549,973) � (.05 � $2,000) ¼ $71,396.
R&R 3
Holiday pay: ð$1,000 wk.=5 daysÞ � 10 paid holidays ¼ $2,000
Expensed per wk.: $2,000=48 wks. worked ¼ $41:67 per wk.
Vacation pay: $1,000� 4 wks. ¼ $4,000
Expensed per wk.: 4,000=48 wks. worked ¼ $83:33 per wk.
Chapter 3 – Accounting for Labor 149

Direct labor earnings amounted to $5,100, and indirect labor was $3,400
for the period from March 16 to March 31. The sales and administrative
salaries for the same period amounted to $1,500.
Use the following tax rates and bases for this problem:
FICA: 8% on the first $100,000.
State unemployment: 4% on the first $8,000.
FUTA: 1% on the first $8,000.
Federal income tax: 10% of each employee’s gross earnings.
Required:
1. Prepare the journal entries for the following:
a. Recording the payroll.
b. Paying the payroll.
c. Recording the employer’s payroll tax liability.
d. Distributing the payroll for March 16 to 31.
2. Prepare the journal entries to record the payment of the amounts due
for the month for FICA and income tax withholdings.
SOLUTION TO SELF-STUDY PROBLEM
Suggestions:
Read the entire problem thoroughly, keeping in mind what you are required
to do:
1. Journal entries to record the payroll, pay the payroll, record the
employer’s payroll taxes, and distribute the payroll.
2. Journal entries for the payment of FICA taxes and federal income tax
withholdings.
The specifics of the problem highlight the fact that there are three
separate categories of labor: direct labor, indirect factory labor, and
salespersons and administrators.
1. a. Journal entry to record the payroll for the period March 16–31: To
determine the amount of the debit to Payroll, the earnings of
direct labor, indirect labor, and sales and administrative must be
added together to obtain $10,000. The $800 of FICA to be withheld
can be obtained by multiplying the $10,000 payroll (assuming
that no employee’s salary has already exceeded the $100,000
base for the year) by the 8% rate. The $1,000 withholding for
income taxes is determined by multiplying the $10,000 payroll by
the assumed withholding percentage of 10%. Lastly, the credit to
Wages Payable for $8,200 represents the amount of net pay that
is to appear on employees’ paychecks.
Payroll . . . . . . . . . . . . . . . . . . . . . . . . . . . . . . . . . . . . . . . . . . . . . . . . . . 10,000
FICA Tax Payable . . . . . . . . . . . . . . . . . . . . . . . . . . . . . . . . . . . . . . 800
Employees Income Tax Payable . . . . . . . . . . . . . . . . . . . . . . . . . 1,000
Wages Payable . . . . . . . . . . . . . . . . . . . . . . . . . . . . . . . . . . . . . . . . 8,200
b. Journal entry to pay the payroll: A check drawn by the company
for the total payroll net earnings is deposited in a separate payroll
account at the bank, and individual checks are issued to the
employees.
150 Principles of Cost Accounting

Wages Payable . . . . . . . . . . . . . . . . . . . . . . . . . . . . . . . . . . . . . . . . . . 8,200
Cash . . . . . . . . . . . . . . . . . . . . . . . . . . . . . . . . . . . . . . . . . . . . . . . . . . 8,200
c. Journal entry to record the payroll tax liability: Payroll taxes
consist of the employer’s share of the FICA taxes and the federal
and state unemployment insurance premiums. The employer
pays an amount of FICA taxes that matches the employees’
contributions and unemployment insurance premiums that are
based on an experience rating related to the business’s employ-
ment history. (In this example, $800 represents the employer’s
FICA contributions, $400 is the state unemployment insurance
premium, and $100 is the federal unemployment insurance pre-
mium.) An important fact to note in the following journal entry is
that the payroll taxes on factory labor, whether direct or indirect,
are all charged to Factory Overhead, whereas the payroll taxes on
the sales and administrative salaries are charged to Payroll Tax
Expense (Sales and Administrative Salaries).
Factory Overhead . . . . . . . . . . . . . . . . . . . . . . . . . . . . . . . . . . . . . . . . 1,105*
Payroll Tax Expense (Sales and Administrative Salaries) . . . . 195**
FICA Tax Payable . . . . . . . . . . . . . . . . . . . . . . . . . . . . . . . . . . . . . . 800
Federal Unemployment Tax Payable . . . . . . . . . . . . . . . . . . . . 100
State Unemployment Tax Payable . . . . . . . . . . . . . . . . . . . . . . 400
*[0.08 ($5,100 þ $3,400) þ 0.01 ($8,500) þ0.04 ($8,500)]**[0.08 ($1,500) þ 0.01 ($1,500) þ 0.04 ($1,500)]
d. Journal entry to distribute the payroll: In distributing the payroll
to the appropriate accounts, it is important to distinguish direct
labor, which is charged to Work in Process, from indirect labor,
which is debited to Factory Overhead.
Work in Process . . . . . . . . . . . . . . . . . . . . . . . . . . . . . . . . . . . . . . . . . . 5,100
Factory Overhead . . . . . . . . . . . . . . . . . . . . . . . . . . . . . . . . . . . . . . . . 3,400
Sales and Administrative Salaries . . . . . . . . . . . . . . . . . . . . . . . . . 1,500
Payroll . . . . . . . . . . . . . . . . . . . . . . . . . . . . . . . . . . . . . . . . . . . . . . . . 10,000
2. At appropriate times as designated by law, the employer payroll taxes
and employee withholdings must be remitted to the proper authori-
ties. In this example, FICA taxes and employee income taxes are
remitted monthly. The entry would be as follows:
FICA Tax Payable . . . . . . . . . . . . . . . . . . . . . . . . . . . . . . . . . . . . . . . . . . . . . . 3,150*
Employees Income Tax Payable . . . . . . . . . . . . . . . . . . . . . . . . . . . . . . . . . 1,975**
Cash . . . . . . . . . . . . . . . . . . . . . . . . . . . . . . . . . . . . . . . . . . . . . . . . . . . . . . . . 5,125
*$1,550 þ $800 þ $800**$975 þ $1,000
Chapter 3 – Accounting for Labor 151

SELF-STUDY PROBLEM 2
Accounting for Bonus, Vacation Pay, and Holiday Pay
Glacier, Inc.
The factory payroll for the week is $100,000, consisting of $70,000 earned
by 100 direct laborers and $30,000 earned by 30 indirect laborers. The total
of factory bonuses to be received at year-end is estimated at $200,000. All
factory workers receive a four-week paid vacation and 10 paid holidays.
Required:
1. Prepare the entry to distribute the weekly payroll.
2. Prepare the entry to record the cost and liabilities related to the bonus,
vacation, and holiday pay, assuming that the fringe benefits of direct
laborers are charged to Factory Overhead.
SOLUTION TO SELF-STUDY PROBLEM
Suggestions:
Read the entire problem thoroughly, keeping in mind what you are
required to do:
1. Prepare a journal entry to distribute the payroll to Work in Process and
Factory Overhead depending on whether the wages are for direct or
indirect labor.
2. Prepare a journal entry to record the expense and liability for the
bonus pay, vacation pay, and holiday pay, keeping in mind that fringe
benefits should be charged to all jobs (Factory Overhead) worked on
during the period.
1. The total payroll for the week of $100,000 needs to be distributed to
Work in Process for the amount of the direct labor, $70,000, and to
Factory Overhead for the amount of the indirect labor, $30,000. The
entry would be:
Work in Process . . . . . . . . . . . . . . . . . . . . . . . . . . . . . . . . . . . . . . . . . . . . . . . 70,000
Factory Overhead . . . . . . . . . . . . . . . . . . . . . . . . . . . . . . . . . . . . . . . . . . . . . 30,000
Payroll . . . . . . . . . . . . . . . . . . . . . . . . . . . . . . . . . . . . . . . . . . . . . . . . . . . . . . 100,000
2. Computations must be performed for each of the fringe benefits
before the journal entry can be made:
Bonus—the estimated bonuses of $200,000 should be allocated
equally to the 48 weeks that employees actually work: $200,000/48
weeks ¼ $4,166.67 per week.
Vacation—the total vacation pay is the $100,000 weekly payroll times
the 4 weeks of vacation pay, allocated over the 48 weeks that employ-
ees work: ($100,000 � 4 weeks)/48 weeks ¼ $8,333.33 per week.
Holiday—the total holiday pay is the weekly pay of $100,000 times the
2 weeks of holiday pay (10 days), allocated over the 48 weeks that
152 Principles of Cost Accounting

employees work: ($100,000 � 2 weeks)/48 weeks ¼ $4,166.67 per
week.
Because the fringe benefits are to be charged to all jobs, the debits in
the entry to record the cost of the fringe benefits are to Factory
Overhead and the credits are to the individual liability accounts:
Factory Overhead (Bonus Pay) . . . . . . . . . . . . . . . . . . . . . . . . . . . . . . . . . 4,166.67
Factory Overhead (Vacation Pay) . . . . . . . . . . . . . . . . . . . . . . . . . . . . . . . 8,333.33
Factory Overhead (Holiday Pay) . . . . . . . . . . . . . . . . . . . . . . . . . . . . . . . . 4,166.67
Bonus Pay Liability . . . . . . . . . . . . . . . . . . . . . . . . . . . . . . . . . . . . . . . . . . 4,166.67
Vacation Pay Liability . . . . . . . . . . . . . . . . . . . . . . . . . . . . . . . . . . . . . . . . 8,333.33
Holiday Pay Liability . . . . . . . . . . . . . . . . . . . . . . . . . . . . . . . . . . . . . . . . . 4,166.67
QUESTIONS
1. What is the difference between direct and
indirect labor?
2. Briefly stated, what are the advantages and
disadvantages of (a) the hourly rate wage
plan and (b) the piece-rate wage plan?
3. What is a modified wage plan?
4. What is the concept of production work
teams as it relates to incentive wage plans?
5. What is the function of the payroll
department?
6. In a payroll system, what purpose is served
by a labor time record? How is the informa-
tion that is recorded on labor time records
used?
7. What purpose do digital records and re-
mote computer terminals serve in a payroll
system?
8. Although payroll records may vary in de-
sign, what types of employee data would
be found in the payroll records of most
manufacturing companies?
9. What are the sources for posting direct
labor cost to (a) individual jobs in the job
cost ledger and (b) the work in process
account in the general ledger?
10. What are the sources for posting indirect
labor cost to the indirect labor account in
the factory overhead ledger?
11. In accounting for labor costs, what is the
distinction between the accounting treat-
ment for regular pay and overtime pre-
mium pay?
12. Maintaining internal control over labor
cost is necessary for a cost accounting
system to function effectively. What are the
internal control procedures regarding the
charge to the work in process account and
the credit to the payroll account in the
general ledger?
13. What accounts are used to record employ-
ees’ withholding taxes and the employer’s
payroll taxes?
14. What are the procedures involved in ac-
counting for labor cost, and what support-
ing forms are used for each procedure?
15. What is the source of data used to:
a. record the distribution of the payroll.
b. record the employer’s payroll taxes.
16. In what circumstance should an accrual for
payroll earnings and payroll tax expense
be made?
17. What is a shift premium, and how is it
usually accounted for?
18. What is a basic requirement of all pension
plans?
Chapter 3 – Accounting for Labor 153

19. a. Distinguish between defined benefit
pension plans and defined contribution
pension plans.
b. Distinguish between contributory and
noncontributory pension plans.
20. In 2009, what was the maximum amount
that an employee could contribute to a
401(k) plan?
21. What accounting treatments do factory bo-
nuses, vacation pay, and holiday pay for
factory employees have in common?
22. What are the two alternatives for accounting
for the fringe benefits of direct laborers?
EXERCISES
Note: For the exercises and problems in this chapter, use the following tax
rates:
FICA—Employer and employee, 8% of the first $100,000 of earnings per
employee per calendar year.
State unemployment—4% of the first $8,000 of earnings per employee per
calendar year.
Federal unemployment—1% of the first $8,000 of earnings per employee,
per calendar year.
Federal income tax withholding—10% of each employee’s gross earnings,
unless otherwise stated.
E3-1 Computing payroll earnings and taxes
A. Jolly of Pittsburgh Manufacturing Company is paid at the rate of
$20 an hour for an 8-hour day, with time-and-a-half for overtime and
double-time for Sundays and holidays. Regular employment is on
the basis of 40 hours a week, five days a week. At the end of a week,
the labor time record shows the following:
Job or Indirect Labor Su. M Tu. W Th. F Sa. Total
007 5 5 3 5.0 6 24.0
009 3 3 5 6.5 5 22.5
Machine repair 4 6.5 10.5
Total 4 8 8 8 11.5 11 6.5 57.0
Because jobs are randomly scheduled for the overtime per-
iod, any overtime premium is charged to Factory Overhead.
a. Compute Jolly’s total earnings for the week.
b. Present the journal entry to distribute Jolly’s total earnings.
LO1
LO2
154 Principles of Cost Accounting

E3-2 Recording payrollUsing the earnings data developed in E3-1 and assuming that
this was the first week of employment for A. Jolly with Pittsburgh
Manufacturing Company, prepare the journal entries for the
following:
a. The week’s payroll.
b. Payment of the payroll.
(Note: These single journal entries here and in E3-7 and E3-8 are
for the purpose of illustrating the principle involved. Normally,
the entries would be made for the total factory payroll plus the
administrative and sales payroll.)
E3-3 Modified wage planMarcia Young earns $25 per hour for up to 400 units of produc-
tion per day. If she produces more than 400 units per day, she
will receive an additional piece rate of $0.50 per unit. Assume
that her hours worked and pieces finished for the week just
ended were as follows:
Day Hours Worked Pieces FinishedMonday 8 400
Tuesday 8 380
Wednesday 8 440
Thursday 8 450
Friday 8 360
a. Determine Young’s earnings for each day and for the week.
b. Prepare the journal entry to distribute the payroll, assuming
that any make-up guarantees are charged to Factory
Overhead.
E3-4 Overtime AllocationAlbert Machine Tool Company produces tools on a job order
basis. During May, two jobs were completed, and the following
costs were incurred:
Job 401 Job 402Direct materials . . . . . . . . . . . . . . . . . . . . . . . . . . . . . . . . . . . . . . . $28,000 $37,000
Direct labor: Regular . . . . . . . . . . . . . . . . . . . . . . . . . . . . . . . . . . . 18,000 23,000
Overtime premium . . . . . . . . . . . . . . . . . . . . . . . . . . . . . . . . . . — 6,000
Other factory costs for the month totaled $16,800. Factory over-
head costs are allocated one-third to Job 401 and two-thirds to
Job 402.
a. Describe two alternative methods for assigning the overtime
premium cost to Jobs 401 and 402 and explain how the
appropriate method would be determined.
b. Compute the cost of Job 401 and Job 402 under each of the
two methods described in part a.
LO1
LO2
LO1
LO3
LO3
Chapter 3 – Accounting for Labor 155

E3-5 Journal entries for payrollA partial summary of the payroll data for Burrington Manufactur-
ing Company for each week of June is as follows:
June 7 June 14 June 21 June 28Gross earnings . . . . . . . . . . . . . $ 36,500 $ 34,200 $ 37,300 $ 38,400
Deductions:
FICA tax, 8% . . . . . . . . . . . . . $? $? $? $?
Tax-sheltered annuity . . . . 1,825 1,780 1,855 1,870
Income tax . . . . . . . . . . . . . . . 4,215 4,120 4,320 4,410
Health insurance . . . . . . . . . 600 600 600 600
Total deductions . . . . . . . . . . . $? $? $? $?
Net earnings . . . . . . . . . . . . . . . $? $? $? $?
a. Compute the missing amounts in the summary, assuming that
no employees have reached the $100,000 FICA maximum.
b. For each payroll period, prepare journal entries to (1) record
the payroll and (2) record the payments to employees.
E3-6 Payroll taxesFontana Fabricating Company paid wages to its employees dur-
ing the year as follows:
Burris . . . . . . . . . . . . . . . . . . . . . . . . $ 15,400
Combs . . . . . . . . . . . . . . . . . . . . . . . 16,700
Detrick . . . . . . . . . . . . . . . . . . . . . . . 13,000
Edwards . . . . . . . . . . . . . . . . . . . . . . 23,300
Hobbs . . . . . . . . . . . . . . . . . . . . . . . . 33,200
McCormack . . . . . . . . . . . . . . . . . . 36,100
Otto . . . . . . . . . . . . . . . . . . . . . . . . . . 66,700
Sylvester . . . . . . . . . . . . . . . . . . . . . 102,000
a. How much of the total payroll is exempt from the FICA rate
of 8%?
b. How much of the total payroll is exempt from federal and
state unemployment taxes?
c. How much of the total payroll is exempt from federal income
tax withholding?
E3-7 Recording the payroll and payroll taxesUsing the earnings data developed in E3-1, and assuming that
this was the eighth week of employment for Jolly and the
previous earnings to date were $7,900, prepare the journal
entries for the following:
a. The week’s payroll.
b. Payment of the payroll.
c. The employer’s payroll taxes.
LO2
LO3
LO3
LO2
LO3
156 Principles of Cost Accounting

E3-8 Recording the payroll and payroll taxesUsing the earnings data developed in E3-1, and assuming that
this was the fiftieth week of employment for Jolly and the
previous earnings to date were $99,800, prepare the journal
entries for the following:
a. The week’s payroll.
b. Payment of the payroll.
c. The employer’s payroll taxes.
E3-9 Payroll distributionThe total wages and salaries earned by all employees of Cutler
Manufacturing Company during the month of March, as shown
in the labor cost summary and the schedule of fixed adminis-
trative and sales salaries, are classified as follows:
Direct labor . . . . . . . . . . . . . . . . . . . . . . . . . . . . . . . . . . . . . . . . . . . . . . . . . . $ 625,125
Indirect labor . . . . . . . . . . . . . . . . . . . . . . . . . . . . . . . . . . . . . . . . . . . . . . . . 162,120
Administrative salaries . . . . . . . . . . . . . . . . . . . . . . . . . . . . . . . . . . . . . . . 140,200
Sales salaries . . . . . . . . . . . . . . . . . . . . . . . . . . . . . . . . . . . . . . . . . . . . . . . . 172,500
Total wages earned . . . . . . . . . . . . . . . . . . . . . . . . . . . . . . . . . . . . . . . . . . $1,099,945
a. Prepare a journal entry to distribute the wages earned during
March.
b. What is the total amount of payroll taxes that will be im-
posed on the employer for the payroll, assuming that two
administrative employees with combined earnings this per-
iod of $3,000 have exceeded $8,000 in earnings prior to the
period?
E3-10 Employees’ earnings and taxesA weekly payroll summary made from labor time records shows
the following data for Musketeer Manufacturing Company:
HourlyRate
HoursEmployee Classification Regular OvertimeBrown, D. Direct $12 40 2
Jackson, D. Direct 12 40 3
Love, J. Direct 15 40 4
Anderson, C. Indirect 9 40
Raymond, B. Indirect 18 40
Overtime is payable at one-and-a-half times the regular rate of
pay for an employee and is distributed to all jobs worked on
during the period.
a. Determine the net pay of each employee. The income taxes
withheld for each employee amount to 15% of the gross
wages.
b. Prepare journal entries for the following:
1. Recording the payroll.
2. Paying the payroll.
LO2
LO3
LO3
LO2
LO3
Chapter 3 – Accounting for Labor 157

3. Distributing the payroll. (Assume that overtime premium
will be charged to all jobs worked on during the period.)
4. The employer’s payroll taxes. (Assume that none of the
employees has achieved the maximum wage bases for
FICA and unemployment taxes.)
E3-11 Employees’ earnings using hourly and piece-rate methodsThe payroll records of Torero Machining Company show the
following information for the week ended April 17:
Employee ClassificationHours
WorkedProduction
(Units) Rate
IncomeTax
W/heldBrown, D. Direct 42 $18.00/hr $ 80
Dorr, M. Direct 48 $17.60/hr 84
Ginty, D. Direct 39 2,000 $0.44/piece 110
Jackson, D. Direct 40 1,800 $0.44/piece 100
Jones, R. Indirect 40 $800/wk 100
Lewis, C. Indirect 50 $1,600/wk 240
Pomare, G. Indirect 40 $1,400/wk 120
Hourly workers are paid time-and-a-half for overtime.
a. Determine the net earnings of each employee.
b. Prepare the journal entries for the following:
1. Recording the payroll.
2. Paying the payroll.
3. Distributing the payroll. (Assume that overtime premium
will be distributed to all jobs worked on during the
period.)
4. Recording the employer’s payroll taxes. (Assume that
none of the employees has achieved the maximum wage
bases for FICA and unemployment taxes.)
E3-12 Accounting for bonus and vacation payBeth Elkins, a factory worker, earns $1,000 each week. In addi-
tion, she will receive a $4,000 bonus at year-end and a four-week
paid vacation. Prepare the entry to record the weekly payroll and
the costs and liabilities related to the bonus and the vacation
pay, assuming that Elkins is the only employee.
E3-13 Accounting for holiday and vacation payClark Kent earns $800 per week for a five-day week, and he is
entitled to 12 paid holidays and four weeks of paid vacation.
a. Over how many weeks should the holiday pay and vacation
pay be expensed?
b. What is the amount of the total holiday pay, and how much
of it should be expensed per week?
c. How much is the amount of the total vacation pay, and how
much of it should be expensed per week?
LO1
LO3
LO5
LO5
158 Principles of Cost Accounting

PROBLEMS
P3-1 Payroll computation with incentive bonus
Fifteen workers are assigned to a group project. The production
standard calls for 500 units to be completed each hour to meet a
customer’s set deadline for the products. If the required units
can be delivered before the target date on the order, the custo-
mer will pay a substantial premium for early delivery. The
company, wishing to encourage the workers to produce beyond
the established standard, has offered an excess production
bonus that will be added to each project employee’s pay. The
bonus is to be computed as follows:
a. Group’s excess production over standard�50%Standard units for week
¼ bonus percentage
b. Individual’s hourly wage rate � bonus percentage ¼ hourly
bonus rate
c. Hourly wage rate þ hourly bonus rate ¼ new hourly rate for
week
d. Total hours worked � new hourly rate ¼ earnings for week
The average wage rate for the project workers is $15 per hour.
The production record for the week shows the following:
HoursWorked
Production(Units)
Monday . . . . . . . . . . . . . . . . . . . . . . . . . . . . . . . . . . . . . . . . . . . . . 112 61,040
Tuesday . . . . . . . . . . . . . . . . . . . . . . . . . . . . . . . . . . . . . . . . . . . . . 112 60,032
Wednesday . . . . . . . . . . . . . . . . . . . . . . . . . . . . . . . . . . . . . . . . . . 112 60,480
Thursday . . . . . . . . . . . . . . . . . . . . . . . . . . . . . . . . . . . . . . . . . . . . 112 65,632
Friday . . . . . . . . . . . . . . . . . . . . . . . . . . . . . . . . . . . . . . . . . . . . . . . 108 57,344
Saturday . . . . . . . . . . . . . . . . . . . . . . . . . . . . . . . . . . . . . . . . . . . . . 60 26,000
616 330,528
Required:
1. Determine the hourly bonus rate and the total amount of
the bonus for the week. (Round the bonus percentage to
five decimal places and the bonus rate to the nearest whole
cent.)
2. What are the total wages of B. Moxie, who worked 40 hours
at a base rate of $15 per hour?
3. What are the total wages of C. Flood, who worked 35 hours at
a base rate of $20 per hour?
P3-2 Labor time record, direct vs. indirect labor
Terri Whelan, SS# 036-47-2189, is a Grade 1 Machinist who
earns $20 per hour. On Monday June 12 through Wednesday
June 14, she worked four hours per day on each of Jobs 007 and
2525. On Thursday and Friday of the week, she worked six hours
per day on Job 2525 and two hours per day on maintenance. Her
LO1
LO2
Chapter 3 – Accounting for Labor 159

supervisor is Tom Culver, who signs off on all labor time records
on Saturday of the week just ended.
Required:
1. Prepare a labor time record (LTR 999) for Whelan for the week
ended June 17, 2011.
2. Compute the amounts of direct labor costs, by job, and
indirect labor costs created by Terri’s work for the week.
P3-3 Payroll calculation and distribution; overtime and idle time
A rush order was accepted by San Diego Machine Conversions
for five van conversions. The labor time records for the week
ended January 27 show the following:
Labor TimeRecords—Hour Distribution
Employees HoursVan#1
Van#2
Van#3
Van#4
Van#5
Peavy (Supervisor) 42
Bell . . . . . . . . . . . . . . . . 45 10 10 10 10 5
Gonzalez . . . . . . . . . . . 48 24 24
Hairston . . . . . . . . . . . 48 24 24
Headley . . . . . . . . . . . . 45 15 15 15
Rodriguez . . . . . . . . . . 42 24 8
Young . . . . . . . . . . . . . 40 20 10
All employees are paid $10.00 per hour, except Peavy, who
receives $20 per hour. All overtime premium pay, except Pea-
vy’s, is chargeable to the job, and all employees, including
Peavy, receive time-and-a-half for overtime hours.
Required:
1. Calculate the total payroll and total net earnings for the week.
Assume that an 18% deduction for federal income tax is
required in addition to FICA deductions. Assume that none of
the employees has achieved the maximums for FICA and
unemployment taxes. Hours not worked on vans are idle time
and are not charged to the job.
2. Prepare the journal entries to record and pay the payroll.
3. Prepare the journal entry to distribute the payroll to the
appropriate accounts.
4. Determine the dollar amount of labor that is chargeable to
each van, assuming that the overtime costs are proportionate
to the regular hours used on the vans. (First compute an
average labor rate for each worker, including overtime pre-
mium, and then use that rate to charge all workers, hours
to vans.)
LO2
LO3
160 Principles of Cost Accounting

P3-4 Computing and journalizing employer’s payroll taxes
The following form is used by MoJo Manufacturing Company to
compute payroll taxes incurred during the month of April:
UnemploymentTaxes
Classification ofWages and Salaries
Earningsfor
Month
FICATax8%
FederalTax1%
StateTax4%
Total PayrollTaxes Imposed
on EmployerDirect labor . . . . . . . . . . . . . . . . . . . $ 88,180
Indirect labor . . . . . . . . . . . . . . . . . 16,220
Payroll taxes on factory wages ?
Administrative salaries . . . . . . . . 12,000
Sales salaries . . . . . . . . . . . . . . . . . 11,500
Total payroll taxes . . . . . . . . . . . . ?
Required:
1. Using the above form, calculate the employer’s payroll taxes
for April. Assume that none of the employees has achieved
the maximums for FICA and unemployment taxes.
2. Assuming that the employer payroll taxes on factory wages
are treated as factory overhead, the taxes covering adminis-
trative salaries are an administrative expense, and the taxes
covering sales salaries are a selling expense, prepare a gen-
eral journal entry to record the employer’s liability for the
April payroll taxes.
P3-5 Payroll for piece-rate wage system
WTA Manufacturing Company operates on a modified wage
plan. During one week’s operation, the following direct labor
costs were incurred:
EmployeePiece Rate per
100 Units
Units Completed
M T W T FJ. Jankovic . . . . . $1.20 6,800 7,100 6,500 8,000 4,800
M. Sharapova . . 1.10 6,300 6,400 2,900 2,800 7,000
S. Williams . . . . . 1.30 6,200 6,100 7,100 6,000 2,800
The employees are machine operators. Piece rates vary with the
kind of product being produced. A minimum of $70 per day is
guaranteed each employee by union contract.
Required:
1. Compute the weekly earnings for Jankovic, Sharapova, and
Williams.
2. Prepare journal entries to:
a. Record the week’s payroll, assuming that none of the
employees has achieved the maximum base wage for
FICA taxes.
LO3
LO1
LO3
Chapter 3 – Accounting for Labor 161

b. Record payment of the payroll.
c. Record the employer’s share of payroll taxes, assuming
that none of the employees has achieved the maximum
base wage for FICA or unemployment taxes.
P3-6 Payment and distribution of payrollsimilar to Self-Study Problem 1
The general ledger of Smokey Mountain Mfg., Inc., showed the
following credit balances on January 15:
FICA Tax Payable . . . . . . . . . . . . . . . . . . . . . . . . . . . . . . . . . . . . . . . . . . . . . . . 3,100.00
Employees Income Tax Payable . . . . . . . . . . . . . . . . . . . . . . . . . . . . . . . . . 1,937.50
FUTA Tax Payable . . . . . . . . . . . . . . . . . . . . . . . . . . . . . . . . . . . . . . . . . . . . . . 193.75
State Unemployment Tax Payable . . . . . . . . . . . . . . . . . . . . . . . . . . . . . . . 775.00
Direct labor earnings amounted to $10,500 from January 16 to
31. Indirect labor was $5,700, and sales and administrative
salaries for the same period amounted to $3,800. All wages are
subject to FICA, FUTA, state unemployment taxes, and 10%
income tax withholding.
Required:
1. Prepare the journal entries for the following:
a. Recording the payroll.
b. Paying the payroll.
c. Recording the employer’s payroll tax liability.
d. Distributing the payroll costs for January 16 to 31.
2. Prepare the journal entry to record the payment of the
amounts due for the month for FICA and income tax
withholdings.
3. Calculate the amount of total earnings for the period from
January 1 to 15.
P3-7 Payroll work sheet and journal entries
The payroll records of XU Corporation for the week ending
October 7, the fortieth week in the year, show the following:
Employee Classification
Salary orWage per
40-Hour WeekHours
Worked
IncomeTax
Withheld
Gross Earningsthrough
Thirty-Ninth WeekAllen President $2,489 40 $488 $109,560
Devine Vice President—Administration 2,238 40 402 99,500
Fiorelli Supervisor—Production 700 40 180 27,300
O’Clock Factory—Direct 500 48 150 19,820
O’Reilly Factory—Direct 400 46 160 17,200
Pawlukiewicz Factory—Direct 400 44 110 16,600
Surdick Factory—Direct 380 42 120 15,200
Trebbi Factory—Indirect 300 42 80 7,800
Webb Factory—Indirect 300 42 60 6,600
LO3
LO2
LO3
162 Principles of Cost Accounting

Required:
1. Complete a work sheet with the following column headings:
Employee
3 columns for Earnings for Week:. Use one for Regular Pay.. Use one for Overtime Premium Pay. (The company pays
time-and-a-half for overtime for all employees below the
supervisory level.). Use one for Total for Week.
Total Earnings through Fortieth Week
FICA Taxable Earnings
FICA
Income Tax Withheld
Net Earnings
2. Prepare journal entries for the following:
a. Payroll for the fortieth week.
b. Payment of payroll for the week.
c. Distribution of the payroll costs, assuming that overtime
premium is charged to all jobs worked on during the period.
d. Employer’s payroll tax liability.
3. The company carries a disability insurance policy for the
employees at a cost of $15 per week for each employee.
Journalize the employer’s cost of insurance premiums for the
week.
P3-8 Estimating labor costs for bids
Pan-Am Manufacturing Company prepares cost estimates for
projects on which it will bid. In order to anticipate the labor cost
to be included in a request to bid on a contract for 1,200,000
units that will be delivered to the customer at the rate of 100,000
units per month, the company has compiled the following data
related to labor:
a. The first 100,000 units will require 5 hours per unit.
b. The second 100,000 units will require less labor due to the
skills learned on the first 100,000 units finished. It is expected
that labor time will be reduced by 10% if an incentive bonus
of one-half of the labor savings is paid to the employees.
c. For the remaining 1,000,000 units, it is expected that the
labor time will be reduced 20% from the original estimate
(the first 100,000 units) if the same incentive bonus (1/2 of the
savings) is paid to the employees.
d. Overtime premiums are to be excluded when savings are
computed.
The contract will require 2,250 employees at a base rate of
$20.00 per hour, with time-and-a-half for overtime. The plant
operates on a 5-day, 40-hour-per-week basis. Employees are
paid for a two-week vacation in August and for eight holidays.
The scheduled production for the 50-week work year shows:
January—June: 26 weeks with 4 holidays
July—December: 24 weeks with 4 holidays
LO1
LO3
Chapter 3 – Accounting for Labor 163

Required:
Prepare cost estimates for direct labor and labor-related costs for
the contract, showing the following:
1. Wages paid at the regular rate.
2. Overtime premium payments. (Don’t forget holidays in com-
puting regular hours available.)
3. Incentive bonus payments.
4. Vacation and holiday pay.
5. Employer’s payroll taxes (13% of total wages, assuming that
no employee has exceeded the wage bases for FICA and the
unemployment insurance taxes).
P3-9 Summary of payroll procedures
An analysis of the payroll for the month of November for Holly-
wood, Inc., reveals the information shown:
Gross Earnings*—Week Ending
Employee Name 11/8 11/15 11/22 11/29R. Crowe $ 300 $ 280 $ 290 $ 320
C. Eastwood 280 270 260 280
J. Carey 320 300 340 280
S. Penn 2,032 2,032 2,032 2,032
P. Giamatti 800 760 850 870
*All regular time
Crowe, Eastwood, and Carey are production workers, and Penn
is the plant manager. Giamatti is in charge of the office.
Cumulative earnings paid (before deductions) in this calendar
year prior to the payroll period ending November 8 were as
follows: Crowe, $12,000; Eastwood, $7,800; Carey, $11,500;
Penn, $89,400; and Giamatti, $32,800.
Required:
The solution to this problem requires the following forms, using
the indicated column headings:
EmployeeEarnings Record Payroll Record Labor Cost SummaryWeek Ending Employee’s Name Week Ending
Weekly GrossEarnings Gross Earnings
Dr. Work in Process(Direct Labor)
Accumulated GrossEarnings
Withholdings (2 columns):FICA TaxIncome Tax (10%)
Dr. Factory Overhead(Indirect Labor)
Weekly Earnings Subjectto FICA Net Amount Paid
Dr. AdministrativeSalaries (Office)
Withholding (2 columns): Cr. Payroll (Total)
FICA Tax
Income Tax (10%)
Net Amount Paid
LO2
LO3
164 Principles of Cost Accounting

1. Prepare an employee earnings record for each of the five
employees.
2. Prepare a payroll record for each of the four weeks.
3. Prepare a labor cost summary for the month.
4. Prepare journal entries to record the following:
a. The payroll for each of the four weeks.
b. The payment of wages for each of the four payrolls.
c. The distribution of the monthly labor costs per the labor
cost summary.
d. The company’s payroll taxes covering the four payroll
periods.
P3-10 Summary of payroll procedures
Giovanni Construction Company uses the job order cost system.
In recording payroll transactions, the following accounts are
used:
Cash Administrative Salaries
Wages Payable Miscellaneous Administrative Expense
FICA Tax Payable Sales Salaries
Federal Unemployment Tax Payable Miscellaneous Selling Expense
State Unemployment Tax Payable Factory Overhead
Employees Income Tax Payable Work in Process
Payroll
Factory employees are paid weekly, while all other employees
are paid semimonthly on the fifteenth and the last day of each
month. All salaries and wages are subject to all taxes.
Following is a narrative of transactions completed during the
month of January:
Jan. 7 Recorded total earnings of factory employees, amounting to $68,200,less deductions for employees’ income taxes and FICA taxes.
7 Issued check for payment of the payroll.
14 Recorded total earnings of factory employees amounting to $66,300,less deductions for employees’ income taxes and FICA taxes.
14 Issued check for payment of the payroll.
15 Recorded administrative salaries, $10,000, and sales salaries, $18,000,less deductions for employees’ income taxes and FICA taxes.
15 Issued check for payment of the salaries.
21 Recorded total earnings of factory employees amounting to $72,500,less deductions for employees’ income taxes and FICA taxes.
21 Issued check for payment of the payroll.
28 Recorded total earnings of factory employees amounting to $74,200,less deductions for employees’ income taxes and FICA taxes.
28 Issued check for payment of the payroll.
31 Recorded administrative salaries, $10,000, and sales salaries, $18,000,less deductions for employees’ income taxes and FICA taxes.
31 Issued check for payment of the salaries.
31 The following wages and salaries were earned or accrued duringJanuary:
LO3
LO4
Chapter 3 – Accounting for Labor 165

Direct labor . . . . . . . . . . . . . . . . . . . . . . . . . . . . . . . . . . . . . . . . . . . . . . . . . . $302,500
Indirect labor . . . . . . . . . . . . . . . . . . . . . . . . . . . . . . . . . . . . . . . . . . . . . . . . 22,500
Administrative salaries . . . . . . . . . . . . . . . . . . . . . . . . . . . . . . . . . . . . . . . 20,000
Sales salaries . . . . . . . . . . . . . . . . . . . . . . . . . . . . . . . . . . . . . . . . . . . . . . . . 36,000
Total . . . . . . . . . . . . . . . . . . . . . . . . . . . . . . . . . . . . . . . . . . . . . . . . . . . . . . . . $381,000
Giovanni Construction Company used the following form to
compute the amount of payroll taxes incurred:
ItemsTaxableEarnings
FICATax
FederalUnemployment
Tax
StateUnemployment
Tax
TotalPayrollTaxes
Factory wages . . . . . . . .
Administrative salaries
Sales salaries . . . . . . . . .
Total . . . . . . . . . . . . . . . . .
Required:
1. Complete the previous form to show the payroll taxes im-
posed on the employer for the month of January.
2. Prepare the journal entries to record the foregoing transac-
tions, including the distribution of payroll costs and payroll
taxes, assuming that the payroll taxes imposed on the em-
ployer for factory wages are to be charged to Factory Over-
head, the taxes for administrative salaries are to be charged to
Miscellaneous Administrative Expense, and the taxes for sales
salaries are to be charged to Miscellaneous Selling Expense.
3. Assume that the factory employees worked on January 29,
30, and 31. What was the amount of accrued wages on
January 31?
P3-11 Accounting for bonus, vacation pay, and holiday paysimilar to Self-Study Problem 2
The factory payroll for the week is $200,000, consisting of
$140,000 earned by 100 direct laborers and $60,000 earned by 30
indirect laborers. The total of factory bonuses to be received at
year-end is estimated at $400,000. All factory workers receive a
two-week paid vacation and five paid holidays.
Required:
Prepare the entries to distribute the weekly payroll and the costs
and liabilities related to the bonus, vacation pay, and holiday
pay, assuming that the fringe benefits of the direct laborers are
charged to Factory Overhead.
P3-12 Accounting for bonus, vacation pay, and holiday pay
In P3-11 above, prepare the entries to distribute the weekly
payroll and the costs and liabilities related to the bonus, vaca-
tion, and holiday pay, assuming that the fringe benefits of the
direct laborers are charged to the individual jobs worked on
during the period.
LO5
LO5
166 Principles of Cost Accounting

MINI-CASE 1
Incentive wage plan
Stacey Womack is considering the implementation of an incentive wage
plan to increase productivity in her small manufacturing plant. The plant is
nonunion, and employees have been compensated with only an hourly
rate plan. Jane Moore, Vice President—Manufacturing, is concerned that
the move to an incentive compensation plan will cause direct laborers to
speed up production and, thus, compromise quality.
Required:
1. How might Womack accomplish her goals while alleviating Moore’s
concerns?
2. Does the compensation have to be all hourly rate or all incentive?
3. Can incentive compensation also apply to service businesses?
MINI-CASE 2
Allocating overtime premium and bonus costs
Elite Manufacturing Company uses a job order cost system to cost its
products. It recently signed a new contract with the union that calls for
time-and-a-half for all work over 40 hours a week and double-time for
Saturday and Sunday. Also, a bonus of 1% of the employees’ earnings for
the year is to be paid to the employees at the end of the fiscal year. The
controller, the plant manager, and the sales manager disagree as to how
the overtime pay and the bonus should be allocated.
An examination of the first month’s payroll under the new union
contract provisions shows the following:
Direct labor:
Regular—40,200 hours @ $10 . . . . . . . . . . . . . . . . . . . . . . . . . . . . . . . $402,000
Overtime:
Weekdays—1,700 hours @ $15 . . . . . . . . . . . . . . . . . . . . . . . . . . . . . $25,500
Saturdays—400 hours @ $20 . . . . . . . . . . . . . . . . . . . . . . . . . . . . . . . 8,000
Sundays—300 hours @ $20 . . . . . . . . . . . . . . . . . . . . . . . . . . . . . . . . 6,000 39,500
Indirect labor . . . . . . . . . . . . . . . . . . . . . . . . . . . . . . . . . . . . . . . . . . . . . . . . 14,800
$456,300
Analysis of the payroll supporting documents revealed the following:
a. More production was scheduled each day than could be handled in a
regular workday, resulting in the need for overtime.
b. The Saturday and Sunday hours resulted from rush orders with special
contract arrangements with the customers.
The controller believes that the overtime premiums and the bonus
should be charged to factory overhead and spread over all production of
the accounting period, regardless of when the jobs were completed.
LO1
LO3
LO5
Chapter 3 – Accounting for Labor 167

The plant manager favors charging the overtime premiums directly to
the jobs worked on during overtime hours and the bonus to administrative
expense.
The sales manager states that the overtime premiums and bonus are
not factory costs chargeable to regular production but are costs created
from administrative policies and, therefore, should be charged only to
administrative expense.
Required:
1. Evaluate each position—the controller’s, the plant manager’s, and the
sales manager’s. If you disagree with all of the positions taken, present
your view of the appropriate allocation.
2. Prepare the journal entries to illustrate the position you support,
including the accrual for the bonus.
INTERNET EXERCISE
401(k) Plans
Go to the Vanguard Investments’ Web site https://retirementplans.vanguard
.com/VGApp/pe/PubHome for retirement information that is linked to the
text Web site at www.cengage.com/accounting/vanderbeck. Enter ‘‘401(k)
plans’’ in the search area and find the answers to the following questions:
Required:
1. Why have IRAs become the largest pool of retirement assets in the
United States?
2. Which assets should you tap first in retirement? Why?
3. What is a ‘‘bear market’’? On average, how often can one be expected
to occur?
168 Principles of Cost Accounting

CHAPTER 4
Account ing for FactoryOverhead
Sherwin-Williams offered the following advice to its painting
contractors at the company Web site:
‘‘Overhead costs are a very big deal costing companies, large
and small, thousands of dollars each year . . . Cost estimation
isn’t just about labor expenses and material costs. It’s about
making a profit, a profit that’s built into every job bid. It begins
with identifying and accounting for all costs—labor, materials,
taxes, scaffolding, permits, lights, gas, office supplies, rent and
everything else associated with operating your business.’’1
This advice is equally important for manufacturers, whose
overhead costs are often in the millions, in costing the jobs that
they produce. This chapter covers accounting for factory over-
head that must be allocated in a rational way to all the jobs
produced during the period, so that each job contributes to the
company’s ‘‘bottom line.’’
A ll costs incurred in the factory that are not chargeable directly tothe finished product are called factory overhead. These operatingcosts of the factory cannot be traced specifically to a unit of
production. A variety of other terms have been used to describe this type ofcost, such as indirect expenses, indirect manufacturing costs, or factoryburden. These costs are also referred to simply as ‘‘overhead’’ or ‘‘burden.’’
Learning Objectives
After studying this
chapter, you should
be able to:
LO1Identify cost
behavior
patterns.
LO2Separate
semivariable
costs into variable and
fixed components.
LO3Prepare a
budget for
factory overhead
costs.
LO4Account for
actual factory
overhead.
LO5Distribute
service
department factory
overhead costs to
production
departments.
LO6Apply factory
overhead
using predetermined
rates.
LO7Account for
actual and
applied factory
overhead.
1 ‘‘Don’t Underestimate Overhead Costs,’’ http://www.sherwin-williams.com (visited 3/18/2009).

One method of determining whether a factory expenditure is an over-head item is to compare it to the classification standards established fordirect materials and direct labor costs. If the expenditure cannot be chargedto either of these two categories, it is classified as factory overhead. Thus,all indirect factory expenditures are factory overhead items. Factory over-head includes (1) indirect materials consumed in the factory, such as glueand nails in the production of wooden furniture and oil used for maintain-ing factory equipment; (2) indirect factory labor, such as wages of janitors,forklift operators, and supervisors and overtime premiums paid to allfactory workers; and (3) all other indirect manufacturing expenses, such asinsurance, property taxes, and depreciation on the factory building andequipment.
Accounting for factory overhead involves the following procedures:
1. Identifying cost behavior patterns.
2. Budgeting factory overhead costs.
3. Accumulating actual overhead costs.
4. Applying factory overhead estimates to production.
5. Calculating and analyzing differences between actual and applied fac-tory overhead.
Identifying Cost Behavior PatternsDirect materials and direct labor are classified as variable costs. Variablecosts are costs that vary in direct proportion to volume changes. In contrastare those costs that remain the same, in total, when production levelsincrease or decrease. These unchanging costs are referred to as fixed costs.Semivariable costs, also called mixed costs, have characteristics of bothvariable and fixed costs.
Whether a particular cost, such as labor, is classified as variable or fixeddepends on how it reacts to changes in business activity. For example,workers at fast-food restaurants, such as Taco Bell, are only guaranteed afew hours per shift. If business is slow, they are sent home. This is anexample of labor as a variable cost because the amount of labor used is tiedto business activity. By comparison, the restaurant manager’s salary wouldbe a fixed cost because the restaurant needs a manager whether businessactivity is busy or slow. Recent studies indicate that companies in variouscountries classify costs differently. For example, 82% of U.S. companiessurveyed classified materials-handling labor as either variable or semivari-able, whereas 61% of Japanese companies classified it as fixed.2
2 NAA Tokyo Affiliate, ‘‘Management Accounting in Advanced Manufacturing.’’
LO1Identify cost
behavior
patterns.
170 Principles of Cost Accounting

Factory overhead expenses include costs that may be classified asvariable, fixed, or mixed. Therefore, factory overhead creates a difficultproblem for most companies because they must predict costs that will beincurred at various levels of production. The factory overhead costs, such assupplies, that behave in the same pattern as direct materials costs and directlabor costs are considered variable costs and are readily forecasted becausethey move up or down proportionately with production volume changes.The factory overhead charges deemed fixed costs, such as the plantmanager’s salary, remain unchanged when production varies; therefore,they are also quite predictable. The factory overhead costs that aresemivariable, such as the cost of utilities, have to be first broken into theirvariable and fixed components before they can be predicted at differentvolume levels. In many companies, semivariable costs constitute a substan-tial portion of the factory overhead charges, and the method used toforecast these costs must be carefully selected.
Figure 4-1 shows the basic patterns of factory overhead costs as volumechanges are encountered.
Examples of variable, fixed, and semivariable factory overhead costsinclude the following:
Variable: Electricity used to power the machines; depreciation expensecomputed on the units-of-production basis; supplies and smalltools expense.
Fixed: Electricity used to heat and light the factory; factory propertytaxes; depreciation of equipment computed on a straight-linebasis; plant manager’s salary; insurance on factory building andequipment.
Semivariable:Type A: Changes as various levels of production are reached. This type of
cost, also known as a step-variable cost, will remain constantover a range of production, then abruptly change. The increasesare not continuous, and costs will plateau before another costchange occurs. Examples are inspection and handling costs, andother indirect labor costs where up to a certain level of produc-tion a fixed number of employees can handle the task, but beyondthis level new hires need to be made to handle the increasedvolume. If the steps are especially wide before moving up to thenext level of costs, the item is known as a step-fixed cost. The
Figure 4-1 Cost Behavior Patterns
Cost
Volume
Semivariable Type B
CostCost
VolumeVolume
FixedVariable
Cost
Volume
Semivariable Type A
Chapter 4 – Accounting for Factory Overhead 171

salaries of factory supervisors, which would stay the same in totalover a wide range of production, would be a good example of thistype of cost.
Type B: Varies continuously, but not in direct proportion to volumechanges. Examples include utility costs and maintenance of fac-tory equipment. For example, the electricity used to power themachines would vary in direct proportion to the level of produc-tion, whereas electricity used to light and heat the factory wouldnot vary with the number of units produced.
The composition of the different semivariable factory overhead costsmakes the prediction of a specific amount of overhead cost for a given levelof production very challenging. Before a good approximation of overheadcosts at various levels of production can be made, these semivariable costsneed to be separated into their fixed and variable components. Mathema-tical techniques can be used to determine these fixed and variable compo-nents that comprise semivariable costs.
Analyzing Semivariable FactoryOverhead CostsMany different techniques and theories exist regarding the prediction offuture events. Most mathematical techniques attempt to establish a patternfrom the historic evidence available, and then use the pattern as a model forpredicting future outcomes. If history repeats itself, the model will satisfac-torily simulate the future events, and the predictions will be beneficial tothe decision-making process.
The statistical techniques to be discussed in this chapter use therelationships of historical costs to past activity levels to isolate variable andfixed costs. The nonmathematical (observation) method relies on personalexperience and managerial judgment.
Observation Method
The observation method, also called the account analysis method, reliesheavily on the ability of an observer to detect a pattern of cost behavior byreviewing past cost and volume data. The reaction of an expense to pastchanges in production is observed, and a decision is made to treat theexpense as either a variable cost or a fixed cost, depending on which type ofcost behavior it more closely resembles. The analyzed overhead item wouldthereafter be treated as either a variable or fixed cost, ignoring the fact thatmany overhead costs are semivariable. For example, electricity expensewould be classified as a variable cost if the majority of the kilowatt hoursused were for powering the machines rather than for heating and lightingthe factory. Companies that use the observation method believe that thediscrepancy between the actual costs and the forecast costs will be insignif-icant and will not affect management strategies or operations.
LO2Separate
semivariable
costs into variable and
fixed components.
172 Principles of Cost Accounting

Some companies still use the observation method. Due to an increasingemphasis on quantifying business data and the availability of informationtechnology to ease the task, however, mathematical methods have increasedin popularity. Three of these methods are discussed in the followingsections: (1) the high-low method, (2) the statistical scattergraph method,and (3) the least squares regression method. These methods isolate anelement of a semivariable cost, then suggest that the remainder of the costis the other element.
High-Low Method
The high-low method compares a high production volume and its relatedcost to a low production volume with its related cost. The difference involume between the two points being compared is linear and will fall alonga straight line.
To illustrate, assume that the following overhead costs were incurred attwo different levels of production:
1,000 Units 2,000 UnitsDepreciation (fixed) . . . . . . . . . . . . . . . . . . . . . . . . . . . . . . . . . $2,000 $2,000
Electricity costs (semivariable) . . . . . . . . . . . . . . . . . . . . . . . 3,000 5,000
Factory supplies (variable) . . . . . . . . . . . . . . . . . . . . . . . . . . . 1,000 2,000
Total cost . . . . . . . . . . . . . . . . . . . . . . . . . . . . . . . . . . . . . . . . . . . $6,000 $9,000
Straight-line depreciation is a fixed cost and remained unchanged intotal as production doubled. Factory supplies is a variable cost of $1 perunit, and it doubled in total when production volume doubled. Electricityexpense, however, was neither entirely fixed, nor did it change proportio-nately with volume. It had an element of variable cost—the cost to run themachines that produce the product—and a fixed cost element—the cost tolight and heat the plant. By using the high-low technique, part of theelectricity cost will be determined to be variable and the remaining partfixed. The variable rate is determined by comparing the amount of volumechange when moving from the lowest to the highest points in a data set tothe amount of change in costs between those two points. In the followingexample only the high and low points are given, not the entire data set fromwhich they were determined:
Variable cost:
UnitsProduced
ElectricityCosts
High volume . . . . . . . . . . . . . . . . . . . . . . . . . . . . . . . . . . . . . . . . 2,000 $5,000
Low volume . . . . . . . . . . . . . . . . . . . . . . . . . . . . . . . . . . . . . . . . 1,000 3,000
Change . . . . . . . . . . . . . . . . . . . . . . . . . . . . . . . . . . . . . . . . . . . . . 1,000 $2,000
Variable cost per unit ¼ Change in costs/Change in units
Variable cost per unit ($2,000/1,000 units) ¼ $2
Chapter 4 – Accounting for Factory Overhead 173

The amount of fixed cost, which will be the same for either level ofvolume, is computed by subtracting total variable cost from total cost ateach volume level:
Fixed cost:
1,000 Units 2,000 UnitsTotal cost . . . . . . . . . . . . . . . . . . . . . . . . . . . . . . . . . . . . . . . . . . . $3,000 $5,000
Variable cost @ $2 per unit . . . . . . . . . . . . . . . . . . . . . . . . . . 2,000 4,000
Fixed cost (remainder) . . . . . . . . . . . . . . . . . . . . . . . . . . . . . . $1,000 $1,000
Electricity costs at various levels of production can now be estimatedusing the following formula:
Electricity costs ¼ Fixed costsþ Variable costsElectricity costs ¼ $1; 000þ ð$2� number of units producedÞ
Assume that management wishes to estimate total factory overheadcosts for one month at a production level of 4,000 units. Using the previousdata and the formula for the semivariable cost, projected factory overheadcosts for the month would be $15,000, computed as follows:
Depreciation (fixed) . . . . . . . . . . . . . . . . . . . . . . . . . . . . . . . . . . . . . . . . . . . . . . . . . . . . . . . . $ 2,000
Electricity costs [semivariable, $1,000 þ $2 (4,000)] . . . . . . . . . . . . . . . . . . . . . . . . . . 9,000
Factory supplies (variable, $1 � 4,000) . . . . . . . . . . . . . . . . . . . . . . . . . . . . . . . . . . . . . . . 4,000
Total estimated factory overhead at 4,000 units . . . . . . . . . . . . . . . . . . . . . . . . . . . . . . $15,000
Cost per unit . . . . . . . . . . . . . . . . . . . . . . . . . . . . . . . . . . . . . . . . . . . . . . . . . . . . . . . . . . . . . . . $ 3.75
Note that the cost per unit is $3.75 if 4,000 units are produced. If only1,000 units are produced, the cost per unit is $6 ($6,000/1,000), as wasshown earlier. This difference exists because the fixed costs remain thesame in total as the number of units increases, thus lowering the unit cost asmore units are produced.
Scattergraph Method
The scattergraph method estimates a straight line along which thesemivariable costs will fall. The cost being analyzed is plotted on the y-axisof the graph, and the activity level, such as the number of units produced, isplotted on the x-axis. After the past observations of cost and productiondata are plotted on graph paper, such as shown in Figure 4-2, a line isdrawn by visual inspection representing the trend shown by most of thedata points. Usually an equal number of data points fall above and belowthe line. The point where the straight line intersects the y-axis representsthe total fixed costs. The variable cost per unit is computed by subtractingfixed costs from total costs at any point on the graph and then dividing bythe activity level for that point read from the x-axis.
174 Principles of Cost Accounting

The following data will be used to illustrate the determination of thefixed and variable components of electricity cost, using cost and productiondata for the past six months:
MonthElectricity Cost
for MonthUnits
ProducedJuly $ 4,500 1,600
August 3,000 1,000
September 4,600 1,800
October 5,000 2,000
November 4,050 1,500
December 3,350 1,200
Total $24,500 9,100
Figure 4-2 shows the scattergraph of these data. A line is visually fit tothese data by positioning a ruler so that it is on or near all the data points,with an equal number of data points above and below the line. (The fact
Figure 4-2 Scattergraph Method
400 800 1,200 1,600 2,000
$1,000
$2,000
$5,000
$3,000
$4,000
UNITS PRODUCED
TO
TA
L C
OS
T
1,000
Chapter 4 – Accounting for Factory Overhead 175

that more than one such line might be drawn, depending on who is doingthe drawing, is among the limitations explained in the following section.) Thecost line in Figure 4-2 intersects the y-axis at $1,100. This is the estimate ofthe fixed cost portion of the mixed cost for electricity. Subtract the fixedcost from the total cost at any volume level to determine the total variablecost at that level. For example, the total cost at a volume level of 1,000 unitsis $3,000, as indicated by the broken lines in Figure 4-2. The total variablecost would then be $3,000 (total cost) � $1,100 (fixed cost) ¼ $1,900. Thevariable cost per unit would then be $1.90 ($1,900/1,000 units).
Note that because of the imprecision of the high-low and scattergraphmethods, the difference in fixed costs between methods is $100 ($1,100 –$1,000), and the difference in variable costs per unit is $0.10 ($2.00 – $1.90).
Limitations of High-Low and StatisticalScattergraph MethodsThe high-low and statistical scattergraph methods both use historical costpatterns to predict future costs and are, therefore, subject to the limitationsthat apply to all forecasting techniques. The use of mathematical techniquesdoes not ensure accurate forecasts. To a great extent, the accuracy of aforecast depends on the validity of the data used with the chosen method.
Cost analysis is more useful for decision making when all costs aresegregated into two categories: variable and fixed. Therefore, the semivari-able costs should be analyzed and subdivided into the two categories. Thehigh-low method bases its solution on two observations and assumes thatall other unanalyzed relationships will fall along a straight line betweenthese selected observations. Such an assumption may prove to be highlyunrealistic because the two observations used may not be representative ofthe group from which the data were selected. The method may be con-sidered reliable, however, if additional pairs of data are analyzed and theresults approximate those obtained from the first observations.
The scattergraph method is an improvement over the high-low methodbecause it uses all of the available data. Also, visual inspection of the graphenables nonrepresentative data points, called outliers, to be identified. Themajor disadvantage of the scattergraph method is that the cost line is drawnthrough the data points based on visual inspection rather than mathematicaltechniques. For example, two persons drawing a trend line through the samedata set could end up with somewhat different results. Both the high-low andscattergraph methods stress the importance of the relationship of cost factorsto volume of activity, such as units of production or direct labor hoursworked; however, many other factors may affect cost behavior and shouldnot be ignored. For example, consideration should also be given to pricechanges, and changes in the technology used to manufacture the products.Also, management policies directly influence the behavior of most costs.
Least-Squares Regression Method
More sophisticated techniques, using statistical software packages and usuallycovered in statistics courses, can be used to determine mathematically a line
176 Principles of Cost Accounting

of best fit through a set of plotted points. These techniques, such as theleast-squares regression method, use all of the data to separate asemivariable cost into its fixed and variable elements based on the equationfor a straight line: Y ¼ aþ bX, where:
X ¼ the activity level,Y ¼ the total semivariable cost,a ¼ the total fixed cost, andb ¼ the variable cost per unit
Spreadsheet applications such as Microsoft Excel, as illustrated in Figures 4-3and 4-4, can also be used to perform regression analysis. In Figure 4-3,the units produced are entered in cells B4 through B9, and the electricitycosts are entered in cells C4 through C9. The total fixed costs, variablecost per unit, and R2 are then computed using the Excel functions andformulas: INTERCEPT (C4:C9,B4:B9), SLOPE (C4:C9,B4:B9), and RSQ(C4:C9,B4:B9), respectively, and the graph of the relationship betweenunits of production and electricity costs in Figure 4-4 is plotted by choosingthe range of values to be included, B4:C9, and using Chart Wizard on thetoolbar.
Using the least-squares regression method, note that the more precisefigures for total fixed cost and variable cost per unit are $961.86 (slightlybelow the $1,000 point on the y-axis in Figure 4-4) and $2.06, respectively.RSQ, in Figure 4-3, indicates the percentage of the variation in thedependent variable (electricity cost) that is explained by variation in theindependent variable (units of production). The electricity cost is known asthe dependent variable because the amount of cost incurred for the periodis dependent upon the level of activity for the period. The level of activity isthe independent variable because the number of units produced cause thevariation in electricity cost. R2 ¼ .974 means that 97.4% of the variation inelectricity cost is explained by the variation in the number of units produced.
Figure 4-3 Least-Squares Regression Worksheet
1
2
3
4
5
6
7
8
9
10
11
12
13
14
15
A B C D
Month
July 1,600 $4,500
August 1,000 $3,000
September 1,800 $4,600
October 2,000 $5,000
November 1,500 $4,050
December 1,200 $3,350
Intercept $961.86
Slope $2.06
RSQ 0.974
Units Produced Electricity CostsX Y
Chapter 4 – Accounting for Factory Overhead 177

This is very high, and it is an indication that units of production are a goodvariable to use in explaining changes in electricity cost.
Note that the formula derived from using the scattergraph method($1,100þ $1.90 per unit) is substantially less correct than the formulaobtained by using the high-low method ($1,000þ $2 per unit) whencompared to the least-squares regression formula ($961.86þ $2.06 perunit). The reason for this is that the scattergraph method is subject topreparer error in setting the trend line by inspection, and, in this instance,neither the high point nor the low point was an outlier. In other instances,the scattergraph method may more closely depict the regression line.
Figure 4-4 Regression Analysis Using Microsoft Excel
0 500 1,000 1,500 2,000
$1,000
$
$2,000
$5,000
$6,000
$3,000
$4,000
MONTHLY UNITS OF PRODUCTION
y = 961.86 + 2.06 ×R2 = 0.974
TO
TA
L E
LE
CT
RIC
ITY
CO
ST
S
Data Points
Linear (Data Points)
Semivariable Costs Scattergraph/Regression
178 Principles of Cost Accounting

Budgeting Factory Overhead CostsBudgets are management’s operating plans expressed in quantitative terms,such as units of production and related costs. After factory overhead costshave been classified as either fixed or variable, budgets can be prepared forexpected levels of production. The segregation of fixed and variable costcomponents permits the company to prepare a flexible budget. A flexiblebudget is a budget that shows estimated costs at different production volumes.
Assume that management desires to budget factory overhead costs atthree levels of production—10,000, 20,000, and 40,000 units. The variablefactory overhead cost is $5 per unit, and fixed overhead costs total $50,000.The budgeted costs at these volumes are as follows:
10,000units
20,000units
40,000units
Variable cost @ $5 per unit . . . . . . . . . . . . . . . . . . $ 50,000 $100,000 $200,000
Fixed cost . . . . . . . . . . . . . . . . . . . . . . . . . . . . . . . . . . . 50,000 50,000 50,000
Total factory overhead . . . . . . . . . . . . . . . . . . . . . . . $100,000 $150,000 $250,000
Factory overhead per unit . . . . . . . . . . . . . . . . . . . . $ 10.00 $ 7.50 $ 6.25
As the volume of production increases, the factory overhead cost perunit decreases because the total fixed cost, $50,000, is spread over a largernumber of units. For example, the fixed cost per unit will add $5 to the per-unit cost ($50,000/10,000 units) at the 10,000-unit level but only $1.25($50,000/40,000 units) when 40,000 units are produced. The variable costremains constant at $5 per unit for the entire range of production.
Budgeting is a valuable management tool for planning and controllingcosts. A flexible budget aids management in establishing realistic produc-tion goals and in comparing actual costs with budgeted costs.
Recall and Review 1
Valley View Company has accumulated the following data over a four-
month period:
MonthMachine
HoursElectricityExpense
September 10,000 $4,500
October 12,000 5,200
November 14,000 6,100
December 9,000 4,100
Using the high-low method, the variable cost per machine hour would
be $______________ and the total fixed cost would be $___________.
(After working this exercise, see page 209 for the solution.)
You should now be able to work the following:
Questions 1–10; Exercises 4-1 to 4-4; and Problems 4-1 to 4-4.
LO3Prepare a
budget for
factory overhead
costs.
Chapter 4 – Accounting for Factory Overhead 179

Accounting for Actual Factory OverheadCost accounting systems are designed to accumulate, classify, and summar-ize the factory overhead costs actually incurred. The specific proceduresused to account for actual factory overhead costs depend on the nature andorganization of the manufacturing firm.
In a small manufacturing company that has only one productiondepartment, factory overhead may be accounted for in much the samemanner as selling and administrative expenses. All of the factory overheadaccounts, such as for indirect materials, indirect labor, and each of the otherindirect manufacturing expenses, may be kept in the general ledger.
Indirect materials and indirect labor costs are recorded first in the generaljournal. These entries are made from the summary of materials issued andreturned and from the labor cost summary. Other factory overhead expensesalso are recorded in the general journal, from which they are posted to theappropriate accounts in the general ledger. The invoices that have been receivedare the sources for these entries. Schedules of fixed costs should be prepared andused as the source for general journal adjusting entries to record the amount oftaxes, depreciation, insurance, and other similar expenses for the period.
A substantial modification must be made in the accounting system whenthe number of factory overhead accounts becomes sizable. A factory over-head subsidiary ledger should be created and maintained, along with acontrol account in the general ledger. The subsidiary ledger is known as thefactory overhead ledger, and the control account is entitled ‘‘FactoryOverhead’’ or ‘‘Manufacturing Overhead.’’ At the end of each accountingperiod, the balance of the factory overhead control account is proved bycomparing its balance to the total of the account balances in the subsidiaryfactory overhead ledger as shown in Figure 4-5.
Accounts in the factory overhead ledger should have titles clearlydescriptive of the nature of the expenditure. Examples of typical factoryoverhead accounts include the following:
Defective Work
Depreciation—Machinery
Employee Fringe Benefits
Fuel
Heat and Light
Indirect Labor
Indirect Materials
Insurance
Janitorial Service
Lubricants
Maintenance
Materials Handling
Overtime Premium
Plant Security
Power
Property Tax
Rent
Repairs
Small Tools
Spoilage
Supplies
Telephone/Fax
Water
Workers’ Compensation Insurance
LO4Account for
actual factory
overhead.
180 Principles of Cost Accounting

In manufacturing companies with several departments, the accountingsystem is designed to accumulate costs by department. Separate budgets areprepared for each department and then combined into a master budget forthe company. The actual costs incurred can be readily compared withbudgeted costs for each department.
Factory overhead expenses must be carefully analyzed before theexpenses are assigned to departments. For example, total factory deprecia-tion would be analyzed to determine the distribution of depreciationcharges among the departments, using an allocation base such as the squarefootage of factory floor space. The accounting system should be designedto provide the necessary data promptly and accurately.
Factory Overhead Analysis Spreadsheets
Instead of expanding the factory overhead ledger to include a separateaccount for each department’s share of different expenses, factory over-head analysis spreadsheets may be used to keep a subsidiary record offactory overhead expenses. A separate analysis spreadsheet may be used torecord each type of expense, with individual columns for the departmentalclassification of the expense. Alternatively, a separate analysis spreadsheetcan be used for each department, with individual columns for the expenseclassification.
Figure 4-5 Relationship of Control Account to Factory
Overhead Ledger
General Ledger:
Factory Overhead
100,000
Factory Overhead Ledger:
Depreciation - Equipment22,000
Indirect Labor
20,000
Indirect Materials
15,000
Maintenance
18,000
Power
25,000
Chapter 4 – Accounting for Factory Overhead 181

Figure 4-6 shows an example of a factory overhead analysis spreadsheetused to keep individual records for each kind of factory overhead expense.The expense-type analysis spreadsheet provides a separate amountcolumn for each department, making it possible to distribute chargesamong departments as expenses are recorded. Each column represents adepartment; therefore, each analysis spreadsheet replaces as many separateaccounts as there are departments in the factory. In Figure 4-6, whichillustrates the distribution of one month’s depreciation to departments, thedepreciation cost assignable to the various departments was determined bymultiplying the cost basis of the equipment in each department (A:$36,000; B: $24,000; C: $18,000; D: $60,000) by the annual rate ofdepreciation (10%) applicable to the machinery. The estimated monthlydepreciation (1/12 of the annual depreciation) was recorded in the generaljournal and became the source of posting to the analysis spreadsheet. Forexample, the depreciation expense allocated to Department A would havebeen computed as follows: $36,000 � 10% � 1/12 ¼ $300.
The department-type analysis spreadsheet in Figure 4-7 provides aseparate amount column for each kind of expense. This makes it possible todistribute expenses on a departmental basis as they are recorded. Eachcolumn represents a different expense. Therefore, each analysis spreadsheetreplaces as many separate accounts as there are types of overhead expensesin the factory. Figure 4-7 shows all expenses incurred for Department Aduring January. Only the totals are entered. Expenses are posted from the
Figure 4-6 Factory Overhead Analysis Spreadsheet—Expense Type
1
2
3
4
5
6
7
A B C D E F G H I J
Distribution Base: Cost BasisAccount No. 3113
Account Depreciation Expense—Machinery
DEPARTMENTAL ANALYSIS
Post.
Dept. A Dept. B Dept. C Dept. D Date Description Ref. Debit Credit Balance
300.00 200.00 150.00 500.00 Jan. 31 Depreciation for January GJ 1,150.00 1,150.00
Figure 4-7 Factory Overhead Analysis Spreadsheet—Department Type
4
5
6
H I J K L M N O
Misc. Factory Expenses Post.
No. Amount Date Description Ref. Debit Credit Balance
Jan. 31 Total expenses-January 1,772.00 1,772.00
1
2
3
4
5
6
A B C D E F G
FACTORY OVERHEAD—DEPARTMENT A Depreciation General
Indirect Indirect Expense— Factory Factory
Materials Labor Power Machinery Property Tax Insurance Expenses
No. 3110 No. 3111 No. 3112 No. 3113 No. 3114 No. 3115 No. 3116
300.00 200.00 150.00 300.00 280.00 392.00 150.00
182 Principles of Cost Accounting

books of original entry either in total or as of the date incurred. The fixedexpenses are posted from the general journal at the end of the month.
Factory overhead analysis spreadsheets, both expense and departmenttype, serve as subsidiary ledgers and are controlled by the factory overheadaccount in the general ledger. The advantage of using an expense-typeanalysis spreadsheet is that it provides only as many amount columns asthere are departments within the factory (see Figure 4-6). However, asummary should be prepared at the end of an accounting period todetermine the total expenses incurred for each department.
The advantage of using a department-type analysis spreadsheet is thatfewer sheets are required and the preparation of a separate summary isnot required at the end of an accounting period, because the totaloverhead charged to a department appears all in one place (see Figure 4-7).When a factory is departmentalized, the factory overhead must be recordeddepartmentally to determine the total cost of operating each department.Spreadsheet software facilitates the distribution of departmental factoryoverhead.
Schedule of Fixed CostsFixed costs are assumed not to vary in amount from month to month. Somefixed costs, such as insurance and property taxes, are either prepaid expensesor accrued expenses. Because these costs are considered to be very pre-dictable, schedules for the periodic amount of fixed costs to be allocated tothe various departments can be prepared in advance. A schedule of fixedcosts similar to Figure 4-8 can be prepared for several periods. By referringto the schedule at the end of the period, a journal entry can be prepared torecord the total for each of the fixed costs. The schedule also can be used asthe source from which fixed costs can be posted to the departmental factoryoverhead analysis spreadsheets.
In Figure 4-8, the schedule of fixed costs shows that for the month ofJanuary, the total depreciation expense for machinery, $1,150, is allocatedto the departments, based on the total cost of the equipment in eachdepartment, as follows: A, $300; B, $200; C, $150; D, $500. Figure 4-8 alsoshows the monthly departmental fixed costs for property tax and insuranceon the factory building that were distributed on the basis of the squarefootage of space occupied by each department. For example, if DepartmentA occupies 2,800 square feet of space in a building with a total of 10,000square feet, its allocation for the monthly property tax of $1,000 would becomputed as [(2,800/10,000) � $1,000], or $280. At the end of the month,the accountant would post the amounts from the schedule of fixed costs toeach department’s analysis spreadsheet.
General Factory Overhead ExpensesAll factory overhead expenses are recorded in a regular, systematic mannerso that at the end of an accounting period, all expenses chargeable to theperiod have already been distributed to the factory departments. Theallocation of overhead to departments would have been made in proportion
Chapter 4 – Accounting for Factory Overhead 183

to the measurable benefits received from such expenses. However, for someitems of factory overhead, it is difficult to measure the benefits departmen-tally. Instead, the factory as a whole is the beneficiary. An example is thesalary of the plant manager, who has the responsibility to oversee all factoryoperations. Another example would be the wages of the company securityguards.
General factory overhead expenses not identified with a specificdepartment are charged to departments by a process of allocation. Thisallocation is usually made on a logical basis, such as allocating heating coststo departments based on the factory space devoted to each department ordistributing the plant manager’s salary based on the estimated amount oftime the manager devoted to each department. The allocation may be madefor each item of expense as incurred and recorded, or expenses may beaccumulated as incurred and the allocation of the total expenses made atthe end of the accounting period. If the allocation is made at the end of theperiod, each kind of general factory overhead expense incurred duringthe period is recorded on a separate analysis spreadsheet. At the end of theperiod, the total is allocated and recorded on the departmental analysisspreadsheets.
Figure 4-8 Schedule of Fixed Costs
Schedule of Fixed CostsItem of Cost January February March April May June
Depreciation—machinery
Dept. A . . . . . . . . . . $ 300.00 $ 300.00 $ 300.00 $ 300.00 $ 300.00 $ 300.00
Dept. B . . . . . . . . . . . 200.00 200.00 200.00 200.00 200.00 200.00
Dept. C . . . . . . . . . . . 150.00 150.00 150.00 150.00 150.00 150.00
Dept. D . . . . . . . . . . 500.00 500.00 500.00 500.00 500.00 500.00
Total . . . . . . . . . . . $ 1,150.00 $1,150.00 $1,150.00 $1,150.00 $1,150.00 $1,150.00
Property tax:
Dept. A . . . . . . . . . . $ 280.00 $ 280.00 $ 280.00 $ 280.00 $ 280.00 $ 280.00
Dept. B . . . . . . . . . . . 270.00 270.00 270.00 270.00 270.00 270.00
Dept. C . . . . . . . . . . . 250.00 250.00 250.00 250.00 250.00 250.00
Dept. D . . . . . . . . . . 200.00 200.00 200.00 200.00 200.00 200.00
Total . . . . . . . . . . . $ 1,000.00 $1,000.00 $1,000.00 $1,000.00 $1,000.00 $1,000.00
Insurance:
Dept. A . . . . . . . . . . $ 392.00 $ 392.00 $ 392.00 $ 392.00 $ 392.00 $ 392.00
Dept. B . . . . . . . . . . . 378.00 378.00 378.00 378.00 378.00 378.00
Dept. C . . . . . . . . . . . 350.00 350.00 350.00 350.00 350.00 350.00
Dept. D . . . . . . . . . . 280.00 280.00 280.00 280.00 280.00 280.00
Total . . . . . . . . . . . $ 1,400.00 $1,400.00 $1,400.00 $1,400.00 $1,400.00 $1,400.00
Total fixed cost . $ 3,550.00 $3,550.00 $3,550.00 $3,550.00 $3,550.00 $3,550.00
184 Principles of Cost Accounting

Summary of Factory Overhead
All factory overhead expenses incurred during the accounting period, bothvariable and fixed, are recorded on factory overhead analysis spreadsheetsand in the factory overhead control account in the general ledger. At theend of the accounting period, the balance of the factory overhead controlaccount is proved by preparing a summary of factory overhead from theanalysis spreadsheets (see Figure 4-9). This summary shows the items ofexpense by department and in total.
Distributing Service Department ExpensesAll job order and process cost systems are designed to accumulate the totalcost of each job or product. To include factory overhead as part of the totalcost, the amount of factory overhead incurred by each production depart-ment must be determined.
In a factory, the manufacturing process consists of a series of operationsperformed in departments or cost centers. Departments are divided intotwo classes: service departments and production departments. A servicedepartment is an essential part of the organization, but it does not workdirectly on the product. The function of a service department is to serve theneeds of the production departments and other service departments. Theproduct indirectly receives the benefit of the work performed by the servicedepartment. Examples of service departments include a department thatgenerates power for the factory, a building maintenance department that isresponsible for maintaining the buildings, or the cost accounting depart-ment that maintains the factory accounting records.
A production department performs the actual manufacturing opera-tions that physically change the units being processed. Because the
Figure 4-9 Summary of Factory Overhead
Summary of Factory OverheadFor the Month Ended January 31, 2011
Departmental ClassificationExpenses Dept. A Dept. B Dept. C Dept. D Total
Indirect materials . . . . . . . . . . . . . . . . . . . . . . . . $ 300 $ 50 $ 40 $ 30 $ 420
Indirect labor . . . . . . . . . . . . . . . . . . . . . . . . . . . . 200 150 140 160 650
Power . . . . . . . . . . . . . . . . . . . . . . . . . . . . . . . . . . 150 140 120 100 510
Depreciation . . . . . . . . . . . . . . . . . . . . . . . . . . . . 300 200 150 500 1,150
Factory property tax . . . . . . . . . . . . . . . . . . . . . 280 270 250 200 1,000
Insurance . . . . . . . . . . . . . . . . . . . . . . . . . . . . . . . 392 378 350 280 1,400
General factory expenses . . . . . . . . . . . . . . . . 150 350 200 300 1,000
Total . . . . . . . . . . . . . . . . . . . . . . . . . . . . . . . . . $1,772 $1,485 $1,200 $1,715 $6,172
LO5Distribute
service
department factory
overhead costs to
production
departments.
Chapter 4 – Accounting for Factory Overhead 185

production departments receive the benefit of the work performed by theservice departments, the total cost of production must include not only thecosts incurred directly in the production departments but also a portion ofthe costs of operating the service departments. Therefore, the total productcosts should include a share of service department costs.
The distribution of the service department costs to production depart-ments requires an analysis of the service department’s relationship to theother departments before an apportionment can be made. The cost ofoperating each service department should be distributed in proportion tothe benefits received by the various other departments. The apportionmentof service department costs is complicated because some service departmentsrender service to other service departments as well as to the productiondepartments. For example, the human resources department may providepersonnel services to the maintenance department, and the maintenancedepartment may clean the human resources offices. For a distribution to beequitable, the cost of operating a service department should be dividedamong all departments that it serves, service and production alike.
The first requirement of the distribution process is to determine how aparticular service department divides its services among the other depart-ments. In some cases, the services performed for another department maybe determined precisely. More often, however, the distribution must bebased on approximations. For example, the power department may befurnishing power for the operation of the machines and for lighting thebuilding and the surrounding grounds. If the power used in each depart-ment is metered, the meters can be read at the end of the period and thedepartments charged for the exact amount of power used. This type ofcharge to a department would be termed a direct charge.
On the other hand, a department such as building maintenance, whichkeeps the building clean and in repair, cannot measure exactly the benefitsit provides to the other departments that it serves. The cost of operatingthe building maintenance department is therefore distributed to the otherdepartments on some equitable basis, such as square footage of floor spaceoccupied by each department.
Common bases for distributing service department costs include thefollowing:
Service Departments Basis for DistributionBuilding Maintenance Floor space occupied by other departments
Inspection and Packing Production volume
Machine Shop Value of machinery and equipment
Human Resources Number of workers in departments served
Purchasing Number of purchase orders
Shipping Quantity and weight of items shipped
Store Room Units of materials requisitioned
Tool Room Total direct labor hours in departments served
186 Principles of Cost Accounting

After the bases for distribution have been selected for the servicedepartments, the next step is to distribute the total cost of each servicedepartment to the other departments. To illustrate the distribution process,assume the following conditions:
1. The maintenance department services the power plant building.
2. The power plant furnishes power to the maintenance department torun its maintenance equipment.
3. The power department and the maintenance department service thehuman resources department facilities.
4. The human resources department services the power and maintenancedepartments through its functions of hiring personnel and maintainingthe departments’ personnel records.
The first step is to compute the total cost of any one of these over-lapping departments. Three different methods are available for use:
1. The direct distribution method distributes service department costsonly to production departments, even though the service departmentsperform services for other service departments.
2. The sequential distribution or step-down method distributes servicedepartment costs regressively to other service departments and then toproduction departments. There are many ways to determine the orderin which to allocate service department costs. Two of the morecommon methods are:
a. The number of other departments served.
b. The magnitude of total costs in each service department.
3. The algebraic distribution method takes into consideration that someservice departments not only may provide service to, but also mayreceive service from, other service departments. Companies that usethis method have software, based on a series of simultaneous equations,which performs the intricate calculations.
The direct distribution method makes no attempt to determine theextent to which one service department renders its services to anotherservice department. Instead, the service department’s costs are allocateddirectly and only to the production departments. For example, in Figure4-10, Human Resources and Maintenance are ignored in the distributionof Power costs, even though the Power Department provides energy tothem. This method has the advantage of simplicity, but it may produce lessaccurate results than the other methods. Use of the direct method isjustified if the costs allocated to the production departments do not differmaterially from the costs that would be allocated using another, moreprecise method.
Chapter 4 – Accounting for Factory Overhead 187

Figure 4-10 Method 1—Spreadsheet for Direct Distribution of Service Department Costs to Production Departments
1
2
3
4
5
6
7
8
9
10
11
12
13
14
15
16
17
18
19
20
21
22
23
24
25
26
27
28
29
30
31
32
33
34
A B C D E F G H I
Human Main- Dept. Dept. Dept. Dept.
Power Resources tenance A B C D Total
Total from factory overhead
analysis spreadsheets......................... $30,000.00 $10,000.00 $20,000.00 $50,000.00 $40,000.00 $60,000.00 $90,000.00 $300,000.00
Power distribution—
(kw hours)
A— 12,000 @ $0.30*............ 3,600.00
B— 18,000 @ 0.30 ............. 5,400.00
C— 20,000 @ 0.30 ............. 6,000.00
D— 50,000 @ 0.30 ............. 15,000.00
Human Resources
distribution—(number
of employees served)
A— 30 @ $100**....................... 3,000.00
B— 10 @ 100 .........................
C— 20 @ 100 .........................
D— 40 @ 100 .........................
Maintenance distribution—
(square feet)
A— 5,000 @ $1.00*** ............. 5,000.00
B— 6,000 @ 1.00 ................. 6,000.00
C— 4,000 @ 1.00 ................. 4,000.00
D— 5,000 @ 1.00 ................. 5,000.00
$61,600.00 $52,400.00 $72,000.00 $114,000.00 $300,000.00
*$30,000 � 100,000 (kilowatt hours) = $0.30 per kilowatt hour
**$10,000 � 100 (number of employees served) = $100 per employee
***$20,000 � 20,000 (square feet) = $1.00 per square foot
100,000 kilowatt hours
100 employees
20,000 sq ft
(20,000.00)
$0$0$0
(10,000.00)
(30,000.00)
1,000.00
2,000.00
4,000.00
18
8P
rincip
les
of
Co
st
Acco
un
ting

The sequential distribution method recognizes the interrelationships ofthe service departments. The power department costs are divided amongthe human resources, maintenance, and production departments. After thepower department cost distribution, the human resources department’stotal costs—which now include a portion of the power department costs—will be allocated to the maintenance and the production departments.Finally, the maintenance department’s costs will be distributed to theproduction departments. Note in Figure 4-11, that even though Mainte-nance and Human Resources provide service to Power, once Power hasbeen fully allocated no reciprocal services are allocated back to it.
The distribution sequence for allocating service department costs is ahigh-priority decision when the sequential distribution method is used. Thesequential procedure should first distribute the costs of the service depart-ment that services the greatest number of other departments. It shouldcontinue until all service department costs have been distributed to theproduction departments. The sequential distribution method can be longand laborious if software is not used to perform the allocations, but it has theadvantage of being more accurate if the sequence established is based on asound analysis of services rendered to the various departments. If each servicedepartment services the same number of other departments, the servicedepartment with the largest total overhead cost should be distributed first.This order of distribution is based on the assumption that the departmentsrender services in direct proportion to the amount of expense they incur.
Figure 4-10 shows the direct distribution of service department costs toproduction departments, whereas Figure 4-11 shows the sequential distribu-tion to service departments and production departments based on the magni-tude of the total costs in each of the service departments. (Note that themagnitude of costs in each service department is used as the criterion fordetermining the order of distribution because each service department servicesthe same number of other departments.) The organizational and operationalstructure of a company determines which distribution method should beselected and used. If the variation from one method to another is insignificant,the direct distribution method will be suitable because it saves time and effort.
The completed distribution work sheets are the basis for a series ofgeneral journal entries. The following entries are based on the distributionsshown in Figure 4-11.
Factory Overhead—Power Department . . . . . . . . . . . . . . . . . . . 30,000
Factory Overhead—Maintenance Department . . . . . . . . . . . . 20,000
Factory Overhead—Human Resources Department . . . . . . . 10,000
Factory Overhead—Department A . . . . . . . . . . . . . . . . . . . . . . . 50,000
Factory Overhead—Department B . . . . . . . . . . . . . . . . . . . . . . . 40,000
Factory Overhead—Department C . . . . . . . . . . . . . . . . . . . . . . . 60,000
Factory Overhead—Department D . . . . . . . . . . . . . . . . . . . . . . . 90,000
Factory Overhead . . . . . . . . . . . . . . . . . . . . . . . . . . . . . . . . . . . . . 300,000
Closed factory overhead expenses to service andproduction departments.
Chapter 4 – Accounting for Factory Overhead 189

Figure 4-11 Method 2—Spreadsheet for Sequential Distribution of Service Department Costs
Based on Magnitude of Total Costs in Service Departments
1
2
3
4
5
6
7
8
9
10
11
12
13
14
15
16
17
18
19
20
21
22
23
24
25
26
27
28
29
30
31
32
33
34
35
36
37
38
39
A B C D E F G H I
Main- Human Dept. Dept. Dept. Dept.
Power tenance Resources A B C D Total
Total from factory overhead
analysis spreadsheets .................. $30,000.00 $20,000.00 $10,000.00 $50,000.00 $40,000.00 $60,000.00 $90,000.00 $300,000.00
Power distribution—
(kw hours) (30,000.00)
Maintenance—
10,000 @ $0.25* ....... 2,500.00
Human Resources—
10,000 @ $0.25 ........ 2,500.00
A— 12,000 @ 0.25* ....... 3,000.00
B— 18,000 @ 0.25 ........ 4,500.00
C— 20,000 @ 0.25 ........ 5,000.00
D— 50,000 @ 0.25 ........ 12,500.00
120,000 $22,500.00
Maintenance distribution—
(square feet) (22,500.00)
Human Resources—
5,000 @ $0.90** ...... 4,500.00
A— 5,000 @ 0.90** ...... 4,500.00
B— 6,000 @ 0.90 ........ 5,400.00
C— 4,000 @ 0.90 ........ 3,600.00
D— 5,000 @ 0.90 ......... 4,500.00
25,000 $17,000.00
Human Resources
distribution—(number of
employees served) (17,000.00)
A— 30 @ $170*** .....
B— 10 @ 170 .........
C— 20 @ 170 .........
D— 40 @ 170 .........
100 $62,600.00 $51,600.00 $72,000.00 $113,800.00 $300,000.00
*$30,000 � 120,000 (kilowatt hours) = $0.25 per kilowatt hour
**$22,500 � 25,000 (square feet) = $0.90 per square foot
***$17,000 � 100 (number of employees served) = $170 per employee
5,100.00
1,700.00
3,400.00
6,800.00
$0$0$0
19
0P
rincip
les
of
Co
st
Acco
un
ting
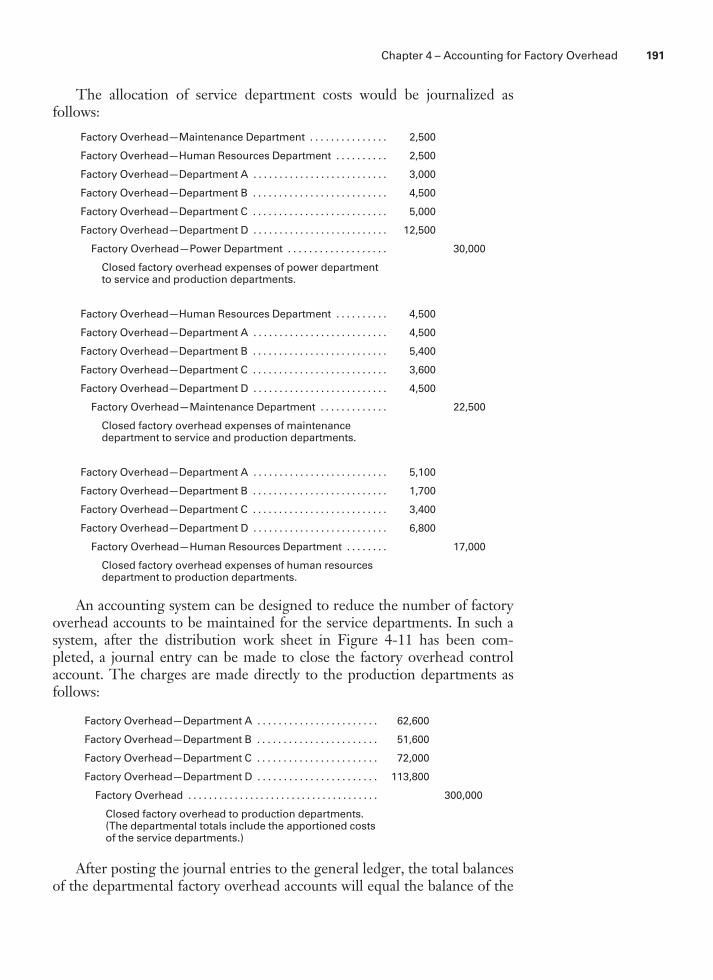
The allocation of service department costs would be journalized asfollows:
Factory Overhead—Maintenance Department . . . . . . . . . . . . . . . 2,500
Factory Overhead—Human Resources Department . . . . . . . . . . 2,500
Factory Overhead—Department A . . . . . . . . . . . . . . . . . . . . . . . . . . 3,000
Factory Overhead—Department B . . . . . . . . . . . . . . . . . . . . . . . . . . 4,500
Factory Overhead—Department C . . . . . . . . . . . . . . . . . . . . . . . . . . 5,000
Factory Overhead—Department D . . . . . . . . . . . . . . . . . . . . . . . . . . 12,500
Factory Overhead—Power Department . . . . . . . . . . . . . . . . . . . 30,000
Closed factory overhead expenses of power departmentto service and production departments.
Factory Overhead—Human Resources Department . . . . . . . . . . 4,500
Factory Overhead—Department A . . . . . . . . . . . . . . . . . . . . . . . . . . 4,500
Factory Overhead—Department B . . . . . . . . . . . . . . . . . . . . . . . . . . 5,400
Factory Overhead—Department C . . . . . . . . . . . . . . . . . . . . . . . . . . 3,600
Factory Overhead—Department D . . . . . . . . . . . . . . . . . . . . . . . . . . 4,500
Factory Overhead—Maintenance Department . . . . . . . . . . . . . 22,500
Closed factory overhead expenses of maintenancedepartment to service and production departments.
Factory Overhead—Department A . . . . . . . . . . . . . . . . . . . . . . . . . . 5,100
Factory Overhead—Department B . . . . . . . . . . . . . . . . . . . . . . . . . . 1,700
Factory Overhead—Department C . . . . . . . . . . . . . . . . . . . . . . . . . . 3,400
Factory Overhead—Department D . . . . . . . . . . . . . . . . . . . . . . . . . . 6,800
Factory Overhead—Human Resources Department . . . . . . . . 17,000
Closed factory overhead expenses of human resourcesdepartment to production departments.
An accounting system can be designed to reduce the number of factoryoverhead accounts to be maintained for the service departments. In such asystem, after the distribution work sheet in Figure 4-11 has been com-pleted, a journal entry can be made to close the factory overhead controlaccount. The charges are made directly to the production departments asfollows:
Factory Overhead—Department A . . . . . . . . . . . . . . . . . . . . . . . 62,600
Factory Overhead—Department B . . . . . . . . . . . . . . . . . . . . . . . 51,600
Factory Overhead—Department C . . . . . . . . . . . . . . . . . . . . . . . 72,000
Factory Overhead—Department D . . . . . . . . . . . . . . . . . . . . . . . 113,800
Factory Overhead . . . . . . . . . . . . . . . . . . . . . . . . . . . . . . . . . . . . . 300,000
Closed factory overhead to production departments.(The departmental totals include the apportioned costsof the service departments.)
After posting the journal entries to the general ledger, the total balancesof the departmental factory overhead accounts will equal the balance of the
Chapter 4 – Accounting for Factory Overhead 191

factory overhead control account before it was closed. The journal entrieshave not affected the total of the factory overhead expenses. However, thegeneral ledger now shows the amount of factory overhead expense beingallocated to each of the production departments. This is as it should be,because overhead is only applied to products as they move throughproducing departments. That is why the service department costs need toend up in the producing departments, so that the products can be assignedtheir fair share of all the factory costs.
Applying Factory Overhead to ProductionHome Entertainment, Inc., manufactures two types of DVD players:standard and deluxe. It attempts to set selling prices based on a 50%markup on manufacturing costs to cover selling and administrativeexpenses and to earn an acceptable return for shareholders. TomSales, Vice President–Marketing, is confused because the numbersprovided by Anne Cash, Controller, indicate that standard DVDplayers should be priced at $150 per unit and deluxe DVD players at$300 per unit. The competition is selling comparable models for $145and $525, respectively.
Sales informs Cash that there must be something wrong with thejob costing system. He had recently attended a seminar where thespeaker stated that ‘‘All production costs are not a function of howmany units are produced, or of how many labor hours, labor dollars,or machine hours are expended.’’ He knows that the company usesdirect labor dollars as its only cost allocation base. Tom thinks that,perhaps, this explains why the product costs and, therefore sellingprices, are so different from the competitors.
This part of the chapter describes a more sophisticated costingsystem than the one that Home Entertainment is using. The Mini-Case at the end of the chapter is a continuation of the HomeEntertainment saga.
Recall and Review 2
Posh Perfumes, Inc., budgeted for 6,000 bottles of ‘‘Monique’’ during the
month of June. Its unit cost was $10, consisting of direct materials, $3.00;
direct labor, $4.50; fixed factory overhead, $1.50; and variable factory over-
head, $1.00. The unit cost of ‘‘Monique’’ would be $_____________ if 5,000
bottles were manufactured and $______________ if 7,500 bottles were
manufactured.
(After working this exercise, see page 210 for the solution.)
You should now be able to work the following:
Questions 11–16; Exercises 4-5 to 4-7; Problems 4-5 to 4-7; and Self-Study
Problem 1.
LO6Apply factory
overhead
using predetermined
rates.
192 Principles of Cost Accounting

In previous discussions, companies avoided estimating and applyingfactory overhead to production by charging the actual factory overheadcosts to the work in process account. These procedures were used toemphasize the flow of costs and the basic cost accounting techniqueswithout unduly complicating the fundamentals. However, factory overheadincludes many different costs, some of which will not be known until theend of the accounting period. Because it is desirable to know the approx-imate cost of a job or product soon after its completion, some method mustbe established for estimating the amount of factory overhead that should beapplied to the finished product. Through the estimating procedure, a job orproduct will be charged an estimated amount of factory overhead expenseas it is worked on. At the end of a period, the actual factory overhead costscan be compared to the estimated factory overhead applied to jobs. If thecompany encounters a difference, it can determine the reasons for thevariance and distribute it to the appropriate accounts.
The advantages of estimating and charging factory overhead on a currentbasis include timely billing of customers and more accurate bidding on newcontracts. Many jobs are priced on the basis of cost plus a markup to coverselling and administrative expenses and to earn a profit. If it were not possible tobill a customer for a job until a month or more after its completion because allfactory overhead costs were not known, the extension of time in collecting suchaccounts would negatively affect the company’s cash flow. Also, many compa-nies rely heavily on a bidding process to obtain new jobs. If a companycannot include a fairly accurate estimate of factory overhead in the cost of abid, the financial health of the enterprise can be adversely affected.
The flexible budget, which includes the expected departmental factoryoverhead costs at given levels of production, is used to establish predeter-mined factory overhead rates. The rates are computed by dividing thebudgeted factory overhead cost by the budgeted production. The budgetedproduction may be expressed in such terms as machine hours, direct laborhours, direct labor cost, and units produced; the first three of which areillustrated in the following sections. The accuracy of the rate depends on theaccuracy of the cost projections and the production estimates included in theflexible budget. In budget projections, the fixed and variable cost components,historical cost behavior patterns, and possible future economic and opera-tional differences must be carefully considered. Specifically, these factorsinclude the anticipated volume of production, the variability of expenses, thefixed costs relevant to the production levels, the activity of the industry asforecast, and the possible price changes that may occur. Because of the manyunknowns, absolute accuracy cannot be expected. Nevertheless, managementshould give a high priority to attaining the most accurate rate possible.
In a departmentalized company, factory overhead should be budgetedfor each department. The procedures for distributing the budgeted depart-mental expenses are identical to those used to allocate the actual factoryoverhead expenses. The departmental overhead budgets should also includean allotment of budgeted fixed expenses, such as depreciation and a portionof the budgeted service department expenses.
Chapter 4 – Accounting for Factory Overhead 193

Upon completing the factory overhead expense budget, the companymust choose a method to use when allocating the estimated expenses to thedepartments. The usual allocation methods require that data from theperiod’s production budgets be obtained. The production budgets willprovide information such as the estimated direct labor cost, direct laborhours, or machine hours.
From the production estimates for the plant or for each department,the company can select a method that will charge the product with its fairshare of the estimated factory overhead. The departmental composition ofhuman labor versus machines will influence the method chosen for applyingfactory overhead to the product. A department with little automation willusually apply overhead using either the estimate of direct labor cost ordirect labor hours for the coming period. A highly automated productiondepartment will normally use an estimate of machine hours to be worked inapplying overhead to products. The point is to use as a cost allocation basean item that causes overhead costs to occur.
Direct Labor Cost Method
The direct labor cost method uses the amount of direct labor cost thathas been charged to the job as the basis for applying factory overhead. Theoverhead rate to be used for the coming period is predetermined bydividing the estimated (budgeted) factory overhead cost by the estimated(budgeted) direct labor cost. The relationship of the overhead to the directlabor cost is expressed as a percentage of direct labor cost.
For example, assume that the budgeted factory overhead cost forDepartment A amounts to $100,000, and the estimated direct labor cost isexpected to be $200,000. The predetermined overhead rate would be 50%of direct labor dollars ($100,000/$200,000). Also, assume that during thefirst month of operations, Job 100 incurred $1,000 for direct materials and$3,000 for direct labor, and that the job is completed by the end of themonth. Using the predetermined rate to estimate factory overhead, thetotal job cost is computed as follows:
Job 100Direct materials . . . . . . . . . . . . . . . . . . . . . . . . . . . . . . . . . . . . . . . . . . . . . . . . . . . . . . . . . . . . . . . . $1,000
Direct labor . . . . . . . . . . . . . . . . . . . . . . . . . . . . . . . . . . . . . . . . . . . . . . . . . . . . . . . . . . . . . . . . . . . . 3,000
Factory overhead (50% of direct labor $) . . . . . . . . . . . . . . . . . . . . . . . . . . . . . . . . . . . . . . . . . 1,500
Total cost of completed job . . . . . . . . . . . . . . . . . . . . . . . . . . . . . . . . . . . . . . . . . . . . . . . . . . . . . $5,500
The direct labor cost method is appropriate in departments that requiremostly human labor and in which the direct labor cost charges are relativelystable from one job to another. If a labor force generates direct labor costthat varies widely due to the hourly rate range of the employees, anothermethod should be used. For example, assume that a lower-paid hourlyemployee is replaced on a job by a higher-paid hourly employee. Thehigher-paid employee would increase the direct labor cost and thereby
194 Principles of Cost Accounting

increase the amount of factory overhead charged to the job. Such increasesin factory overhead charges to a department are usually unwarrantedbecause the higher-paid employee would not necessarily increase the actualfactory overhead expense incurred. Any fluctuation in the direct labor cost,not accompanied by a proportional increase in actual factory overheadexpenses, will cause a distortion in a job’s total cost. This can be detrimentalto the company’s ability to control costs and to make good production andmarketing decisions.
Direct Labor Hour MethodThe direct labor hour method overcomes the problem of varying wagerates by applying factory overhead using the number of direct labor hoursworked on a job or process. The predetermined rate is computed bydividing the budgeted factory overhead cost for the upcoming period by theestimated direct labor hours to be worked. For example, assume that thebudgeted factory overhead cost for the coming period is $100,000 and thatproduction is expected to require 25,000 direct labor hours. The predeter-mined overhead rate would be $4 per direct labor hour ($100,000/25,000hours).
If factory overhead is applied to Job 100 using the direct labor hourmethod, the records must include the number of direct labor hours workedon each job. Assuming that it took 500 direct labor hours to complete Job100, and that the direct materials and direct labor costs were $1,000 and$3,000, respectively, the cost of Job 100 is as follows:
Job 100Direct materials . . . . . . . . . . . . . . . . . . . . . . . . . . . . . . . . . . . . . . . . . . . . . . . . . . . . . . . . . . . . . . . . $1,000
Direct labor (500 hours) . . . . . . . . . . . . . . . . . . . . . . . . . . . . . . . . . . . . . . . . . . . . . . . . . . . . . . . . . 3,000
Factory overhead (500 hours @ $4) . . . . . . . . . . . . . . . . . . . . . . . . . . . . . . . . . . . . . . . . . . . . . . 2,000
Total cost of completed job . . . . . . . . . . . . . . . . . . . . . . . . . . . . . . . . . . . . . . . . . . . . . . . . . . . . . $6,000
An advantage of the direct labor hour method is that the amount ofoverhead applied to production is not affected by the mix of labor rates, asit is in the direct labor cost method. However, if factory overhead consistsprimarily of items that are more closely tied to employees’ wages, such asfringe benefits, the direct labor hour method may not be as accurate as thedirect labor cost method.
Machine Hour Method
A highly automated department is normally best served by the machinehour method. In such a department, the factory overhead cost should bemore proportionate to the machine hours generated by the equipment thanthe direct labor hours or costs incurred by the employees operating themachinery. It is common in automated departments for one employee tooperate more than one piece of equipment. Therefore, one direct laborhour may generate, possibly, five machine hours.
Chapter 4 – Accounting for Factory Overhead 195

The machine hour method requires substantial preliminary studybefore installation, and an additional quantity of records needs to bemaintained. However, the advantages to be gained by a more dependablefactory overhead application rate may far outweigh the additional effort andcosts involved. The machine hour rate is determined by dividing thebudgeted factory overhead cost by the estimated machine hours to be usedby production during the period.
For example, assume that the factory overhead budget is $100,000,consisting mostly of machine-related costs, and it is expected that 10,000machine hours will be required to meet production. The predeterminedrate would be $10 per machine hour ($100,000/10,000 hours). Assumingthat Job 100, now completed, used $1,000 for direct materials, $3,000 fordirect labor, and required 300 machine hours, its cost is as follows:
Job 100Direct materials . . . . . . . . . . . . . . . . . . . . . . . . . . . . . . . . . . . . . . . . . . . . . . . . . . . . . . . . . . . . . . . . $1,000
Direct labor . . . . . . . . . . . . . . . . . . . . . . . . . . . . . . . . . . . . . . . . . . . . . . . . . . . . . . . . . . . . . . . . . . . . 3,000
Factory overhead (300 machine hours @ $10) . . . . . . . . . . . . . . . . . . . . . . . . . . . . . . . . . . . . 3,000
Total cost of completed job . . . . . . . . . . . . . . . . . . . . . . . . . . . . . . . . . . . . . . . . . . . . . . . . . . . . . $7,000
Activity-based Costing Method
The preceding methods of applying overhead to products assumed that alloverhead costs incurred were related to volume. This means that all of theoverhead costs incurred were a function of how many direct labor hours ormachine hours, volume-related activities, were worked. In a modernfactory that produces many products, a substantial portion of the overheadmay be more a function of the complexity of the product being made thanthe number of units produced, labor hours worked, or machine hours used.Activity-based costing (ABC) considers these non-volume-related ac-tivities that create overhead costs, such as the number of machine setups orproduct design changes required of a particular product line.
A product that is difficult to make may also be produced in small numbers,perhaps owing to its unusual nature and to the resulting limited demand. Ifoverhead were applied to products strictly on the basis of the number of unitsproduced, the direct labor hours worked, or the machine hours used, verylittle overhead would be charged to such a product due to its low productionvolume. Its complexity to produce, however, may have created a lot ofadditional overhead costs in the form of machine setups and design changes,even though the number of units in the production run was small.
To successfully employ an ABC system, a company must first identifynon-volume-related factory activities that create costs. Examples of suchactivities would include design changes, inspections, materials movements,material requisitions, and machine setups. The cost of performing each ofthese activities in the coming period must then be estimated. The next stepis to decide on the cost driver, or the basis used to allocate each of the
196 Principles of Cost Accounting

activity cost pools. For example, for machine setup costs, the cost drivermay be the total estimated setup time for the coming period or, moresimply, the estimated number of setups to be performed. Lastly, theestimated cost in each activity pool would be divided by the estimatednumber of cost driver units, such as number of machine setups, related tothat pool. This results in an overhead or activity rate that is used to chargeeach product or job based on its consumption of the resources required tosustain each activity.
For example, assume that the factory overhead budget is $100,000. Theallocation bases, expected levels of activity for each cost pool, and overheadrates follow:
Factory Overhead Cost PoolExpectedAmount
Expected Level ofAllocation Base
OverheadRate
Direct labor usage
(such as the wages of the supervisorsand maintenance staff that supportthe direct laborers) . . . . . . . . . . . . . . . . . . $ 30,000
10,000 direct laborhours
$3/direct laborhour
Machine usage:
(such as electricity expense to run themachines) . . . . . . . . . . . . . . . . . . . . . . . . . . 40,000
5,000 machinehours
$8/machinehour
Machine setups:
(cost of wages and technology neededto reconfigure production line) . . . . . . . 20,000 100 setups $200/setup
Design changes:
(engineering salaries and computer-assisted design software) . . . . . . . . . . . . 10,000 25 design changes
$400/designchange
$100,000
Assume that Job 100, now completed, required $1,000 for directmaterials, $3,000 for direct labor, 500 direct labor hours, 75 machine hours,two setups, and two design changes. The cost of the job would be computedas follows:
Job 100Direct materials . . . . . . . . . . . . . . . . . . . . . . . . . . . . . . . . . . . . . . . . . . . . . . . . . . . . . . . . . . . . . . . . $1,000
Direct labor (500 hours) . . . . . . . . . . . . . . . . . . . . . . . . . . . . . . . . . . . . . . . . . . . . . . . . . . . . . . . . . 3,000
Factory overhead related to:
Direct labor usage (500 hours � $3/direct labor hour) . . . . . . . . . . . . . . . . . . . . . . . . . . . 1,500
Machine usage (75 hours � $8/machine hour) . . . . . . . . . . . . . . . . . . . . . . . . . . . . . . . . . 600
Machine setups (2 setups � $200/setup) . . . . . . . . . . . . . . . . . . . . . . . . . . . . . . . . . . . . . . . 400
Design changes (2 changes � $400/design change) . . . . . . . . . . . . . . . . . . . . . . . . . . . . 800
Total cost of complete job . . . . . . . . . . . . . . . . . . . . . . . . . . . . . . . . . . . . . . . . . . . . . . . . . . . . . . $7,300
Note that the overhead charged to this job using activity-based costingis greater than it was under any of the other methods of charging overhead.
Chapter 4 – Accounting for Factory Overhead 197

In this instance, activity-based costing better reflects the additional costs ofproducing a job that requires two design changes and two setups. The useof activity-based costing is not limited to manufacturers. A recent survey ofIrish hospitals indicated that hospitals changed to activity-based costing forthe following reasons: more accurate cost information (78%), better use ofhospital resources (50%), improved cost control (44.5%), more accurateperformance measures for evaluating personnel (40%), and better insightinto what causes costs to occur (37.5%).3 Activity-based management(ABM) is the use of activity-based costing information to improve businessperformance by reducing costs and improving processes.
Accounting for Actual and AppliedFactory OverheadAfter selecting the overhead application method and computing the pre-determined rate to be used, all jobs or processes should be charged with theestimated overhead cost rather than the actual factory overhead costs beingincurred. The estimated factory overhead is applied to production by adebit to Work in Process and a credit to an account entitled AppliedFactory Overhead. Use of the separate applied factory overhead accountrather than the credit side of the factory overhead control account avoidsconfusing the actual factory overhead charges, which are debited to thefactory overhead control account, with the estimated charges that aredebited to work in process. At the end of a period, the debit balance inFactory Overhead is compared to the credit balance in Applied FactoryOverhead to determine the accuracy of the predetermined rates.
3 ‘‘An Empirical Survey of Adoption/Non-Adoption of Activity-Based Costing in Hospitalsin Ireland,’’ Working Paper, Doyle, Duffy, and McCahey, August 2002.
Recall and Review 3
If the ABC Company uses the machine hour method to apply factory
overhead and the predetermined overhead rate is $20 per hour,
$__________ is the amount that should be charged to Job 2525 for factory
overhead and $__________ would be the total cost of the job. Assume that
direct materials used totaled $3,000; direct labor was $2,200; direct labor
hours were 150; and machine hours were 175.
(After working this exercise, see page 210 for the solution.)
You should now be able to work the following:
Questions 17–25; Exercises 4-8 to 4-10; Problems 4-8 to 4-10; Mini-Case; and
Internet Exercise.
LO7Account for
actual and
applied factory
overhead.
198 Principles of Cost Accounting

Factory Overhead Applied Factory Overhead
Debited for Debited Credited for estimated
actual when overhead
overhead closed to applied to jobs
incurred Factory Overhead
To illustrate the use of a predetermined overhead rate, assume that acompany has estimated a rate of $5 per direct labor hour and thatproduction jobs actually required 1,000 direct labor hours to complete.Using the direct labor hour method, we see that $5,000 of estimated factoryoverhead cost would be applied to all jobs worked on during the period asfollows:
(a) Work in Process . . . . . . . . . . . . . . . . . . . . . . . . . . . . . . . . . . . . . . . . 5,000
Applied Factory Overhead . . . . . . . . . . . . . . . . . . . . . . . . . . . . . 5,000
Applied factory overhead to jobs (1,000 hours @ $5).
Also assume that the actual factory overhead for the period was $5,500,recorded as follows:
(b) Factory Overhead . . . . . . . . . . . . . . . . . . . . . . . . . . . . . . . . . . . . . . . 5,500
Accounts Payable . . . . . . . . . . . . . . . . . . . . . . . . . . . . . . . . . . . . . 5,500
At the end of the period, the applied factory overhead account is closedto the factory overhead control account:
(c) Applied Factory Overhead . . . . . . . . . . . . . . . . . . . . . . . . . . . . . . . 5,000
Factory Overhead . . . . . . . . . . . . . . . . . . . . . . . . . . . . . . . . . . . . . 5,000
Closed applied factory overhead account to control account.
After the previous entries are posted, if a balance (debit or credit)remains in the factory overhead control account, it indicates that the actualfactory overhead incurred did not equal the estimated factory overheadapplied to jobs:
Factory Overhead
(b) 5,500 (c) 5,000
Bal. 500 (d) 500
Applied Factory Overhead
(c) 5,000 (a) 5,000
The remaining debit balance of $500 in Factory Overhead indicatesthat a smaller amount of overhead was applied to production than wasactually incurred during the period. The debit balance indicates that thefactory overhead costs were underapplied or underabsorbed. In otherwords, the work in process account and the individual jobs worked on were
Chapter 4 – Accounting for Factory Overhead 199

undercharged for the costs of factory overhead incurred in the accountingperiod. Probable causes for the underapplication could include: (1) a lowerlevel of operating capacity was achieved than was budgeted for when thepredetermined rate was established or (2) the actual factory overheadexpenses were more than budgeted for the operating level achieved. If, onthe other hand, a credit balance remains in Factory Overhead after theapplied factory overhead account is closed to the control account, the creditbalance would represent overapplied or overabsorbed factory overhead.This means that more overhead was applied to production than was actuallyincurred in the period. To begin each new month with a zero balance inFactory Overhead, the debit or credit balance in the account is usuallytransferred to an account entitled Under- and Overapplied FactoryOverhead, as follows:
(d) Under- and Overapplied Factory Overhead . . . . . . . . . . . . . . . 500
Factory Overhead . . . . . . . . . . . . . . . . . . . . . . . . . . . . . . . . . . . . . . . 500
Closed debit balance (underapplied) in factory overhead control account.
The special account, Under- and Overapplied Factory Overhead, willaccumulate the month-to-month differences. At the end of the year, thebalance of the under- and overapplied account will be closed to Cost ofGoods Sold, as illustrated in Figure 4-12, or allocated on a pro rata basis toWork in Process, Finished Goods, and Cost of Goods Sold. The balanceshould be prorated if it will materially distort net income to charge theentire amount to Cost of Goods Sold.
The following table illustrates how under- and overapplied factoryoverhead costs typically offset each other over a given period of time asseasonal demands and production levels change:
Under- and Overapplied Factory Overhead
MonthDr
UnderappliedCr
OverappliedDr (Cr)
BalanceJanuary . . . . . . . . . . . . . . . . . . . . . . . . . . . . . . . . $1,200 $ 1,200
February . . . . . . . . . . . . . . . . . . . . . . . . . . . . . . . . 800 2,000
March . . . . . . . . . . . . . . . . . . . . . . . . . . . . . . . . . . $3,500 (1,500)
April . . . . . . . . . . . . . . . . . . . . . . . . . . . . . . . . . . . . 2,000 (3,500)
May . . . . . . . . . . . . . . . . . . . . . . . . . . . . . . . . . . . . 1,000 (4,500)
June . . . . . . . . . . . . . . . . . . . . . . . . . . . . . . . . . . . . 500 (5,000)
July . . . . . . . . . . . . . . . . . . . . . . . . . . . . . . . . . . . . 700 (4,300)
August . . . . . . . . . . . . . . . . . . . . . . . . . . . . . . . . . 1,100 (3,200)
September . . . . . . . . . . . . . . . . . . . . . . . . . . . . . . 2,500 (700)
October . . . . . . . . . . . . . . . . . . . . . . . . . . . . . . . . . 1,000 300
November . . . . . . . . . . . . . . . . . . . . . . . . . . . . . . 500 800
December . . . . . . . . . . . . . . . . . . . . . . . . . . . . . . 600 200
$7,800 $7,600
200 Principles of Cost Accounting

If a small balance, such as the $200 in the preceding example, remainsin Under- and Overapplied Factory Overhead at year-end, it may be closeddirectly to Cost of Goods Sold because it will not materially misstate netincome:
Cost of Goods Sold . . . . . . . . . . . . . . . . . . . . . . . . . . . . . . . . . . . . . . . . . . . . . . . . . . . . . 200
Under- and Overapplied Factory Overhead . . . . . . . . . . . . . . . . . . . . . . . . . . . . . 200
Closed debit balance in Under- and Overapplied Factory Overhead.
A large remaining balance, however, could distort the year’s net incomeif it were closed entirely to Cost of Goods Sold when the company hadmaterial amounts of ending work in process and finished goods inventoriesthat also would contain applied factory overhead. Therefore, an adjustmentis required to restate the balances of the Work in Process, Finished Goods,and Cost of Goods Sold accounts.
To illustrate the proration procedure, assume that a debit balance of$10,000 (underapplied factory overhead) remained in the under- and over-applied factory overhead account at the end of the period. The year-endbalances, before adjustment, of the following accounts were as follows:
Percent ofTotal
Work in Process . . . . . . . . . . . . . . . . . . . . . . . . . . . . . . . . . . . . . . . . . . . . . . . $ 10,000 10%
Finished Goods . . . . . . . . . . . . . . . . . . . . . . . . . . . . . . . . . . . . . . . . . . . . . . . 30,000 30
Cost of Goods Sold . . . . . . . . . . . . . . . . . . . . . . . . . . . . . . . . . . . . . . . . . . . . 60,000 60
Total . . . . . . . . . . . . . . . . . . . . . . . . . . . . . . . . . . . . . . . . . . . . . . . . . . . . . . . . . . $100,000 100%
The pro rata amount of the $10,000 underapplied factory overhead thatwould be added to each account is computed as follows:
Work in Process ($10,000 � 10%) . . . . . . . . . . . . . . . . . . . . . . . . . . . . . . . . . . . . . . . . . . . . . . . $ 1,000
Finished Goods ($10,000 � 30%) . . . . . . . . . . . . . . . . . . . . . . . . . . . . . . . . . . . . . . . . . . . . . . . 3,000
Cost of Goods Sold ($10,000 � 60%) . . . . . . . . . . . . . . . . . . . . . . . . . . . . . . . . . . . . . . . . . . . . 6,000
$10,000
Figure 4-12 Effects of Underapplied and Overapplied Overhead
If overhead is underapplied
Closing under-and overappliedfactory overhead
Causes cost ofgoods sold toincrease
If overhead is overapplied
Closing under-and overappliedfactory overhead
Causes cost ofgoods sold todecrease
Chapter 4 – Accounting for Factory Overhead 201

The journal entry to close the debit balance in Under- and OverappliedFactory Overhead would be as follows:
Work in Process . . . . . . . . . . . . . . . . . . . . . . . . . . . . . . . . . . . . . . . . . . . . . . . . . . . . . 1,000
Finished Goods . . . . . . . . . . . . . . . . . . . . . . . . . . . . . . . . . . . . . . . . . . . . . . . . . . . . . . 3,000
Cost of Goods Sold . . . . . . . . . . . . . . . . . . . . . . . . . . . . . . . . . . . . . . . . . . . . . . . . . . 6,000
Under- and Overapplied Factory Overhead . . . . . . . . . . . . . . . . . . . . . . . . . . 10,000
Closed debit balance in Under- and Overapplied Factory Overhead.
The amount allocated to Cost of Goods Sold becomes a period costthat directly reduces net income for the current period. The amountsallocated to Work in Process and Finished Goods become part of theproduct cost of the inventories and will be deferred, along with the otherinventory costs, to the next period when the inventories are completed and sold.
The preceding sections of this chapter have presented and illustratedthe various aspects of accounting for factory overhead, including depart-mentalizing factory overhead costs, distributing service department costs,applying factory overhead to production using predetermined rates, andaccounting for differences between actual and applied factory overhead.Figures 4-13 through 4-19 tie together these various aspects and show theflow of factory overhead costs through the accounting system.
Figure 4-13 Actual Factory Overhead Expenses
FACTORY OVERHEAD
MAINTENANCE$20,000
HUMAN RESOURCES
$10,000
$300,000
GENERALJOURNAL$300,000
POWER
$30,000
DEPT. A$50,000 DEPT. B
$40,000 DEPT. C
$60,000 DEPT. D
$90,000
202 Principles of Cost Accounting

Figure 4-13 shows the flow of actual factory overhead expensesthrough the accounting records. The example assumes that the amountsposted to the factory overhead control account were originally recorded inthe general journal. The total charge to the control account of $300,000equals the sum of the actual factory overhead expenses incurred by theindividual departments and recorded on the factory overhead analysisspreadsheets.
Figure 4-14 is a spreadsheet for actual factory overhead costsaccumulated during the month and distributed at the end of themonth, using the same data and sequential distribution methodpresented in Figure 4-11. Factory overhead was applied to the produc-tion departments as jobs were worked on throughout the month, asfollows:
Department A $ 66,000
Department B 56,000
Department C 70,000
Department D 110,000
Figure 4-14 also shows the under- or overapplied factory overhead, bydepartment and in total, as follows:
Actual Costs Applied Under/(Over)Department A . . . . . . . . . . . . . . . . . . . . . . . . . . . . . . $ 62,600 $ 66,000 $(3,400)
Department B . . . . . . . . . . . . . . . . . . . . . . . . . . . . . . 51,600 56,000 (4,400)
Department C . . . . . . . . . . . . . . . . . . . . . . . . . . . . . . 72,000 70,000 2,000
Department D . . . . . . . . . . . . . . . . . . . . . . . . . . . . . . 113,800 110,000 3,800
Total . . . . . . . . . . . . . . . . . . . . . . . . . . . . . . . . . . . . . $300,000 $302,000 $(2,000)
In Figure 4-15, the $300,000 balance in the factory overhead controlaccount is transferred to the factory overhead accounts for both the serviceand production departments. The factory overhead analysis spreadsheetsprovide the data necessary for the distribution.
Figure 4-16 shows the distribution of the service department’s coststo the production department’s factory overhead accounts, using thesequential distribution method of service department costs, with the servicedepartment with the greatest total cost being distributed first. Figure 4-17shows the application of factory overhead, based on predeterminedrates, to the individual production departments. In Figure 4-18, theapplied factory overhead accounts are closed to the departmentalfactory overhead accounts. Finally, as shown in Figure 4-19, thebalances in the departmental factory overhead accounts are closed to
Chapter 4 – Accounting for Factory Overhead 203

Figure 4-14 Spreadsheet Summary of Actual and Applied Factory Overhead
1
2
3
4
5
6
7
8
9
10
11
12
13
14
15
16
17
18
19
20
21
22
23
24
25
26
27
28
29
30
31
32
33
34
35
36
37
38
39
40
A B C D E F G H I
Main- Human Dept. Dept. Dept. Dept.
Power tenance Resources A B C D Total
Total actual expenses from factory
overhead analysis spreadsheets .......... $30,000.00 $20,000.00 $10,000.00 $50,000.00 $40,000.00 $60,000.00 $90,000.00 $300,000.00
Power distribution—
(kw. hours)
Maintenance—
10,000 @ $0.25............. 2,500.00
Human Resources—
10,000 @ 0.25 .............
A— 12,000 @ 0.25 ............. 3,000.00
B— 18,000 @ 0.25 ............. 4,500.00
C— 20,000 @ 0.25 ............. 5,000.00
D— 50,000 @ 0.25 .............
120,000 $22,500.00
Maintenance distribution—
(square feet)
Human Resources—
5,000 @ $0.90.............
A— 5,000 @ 0.90............. 4,500.00
B— 6,000 @ 0.90............. 5,400.00
C— 4,000 @ 0.90............. 3,600.00
D— 5,000 @ 0.90............. 4,500.00
25,000 $17,000.00
Human Resources distribution—
(number of employees served)
A— 30 @ $170.................. 5,100.00
B— 10 @ 170.................. 1,700.00
C— 20 @ 170.................. 3,400.00
D— 40 @ 170..................
100 $62,600.00 $51,600.00 $72,000.00 $113,800.00 $300,000.00
Applied factory overhead $66,000.00 $56,000.00 $70,000.00 $110,000.00 $302,000.00
(Over-) or underapplied
factory overhead ($3,400.00) ($4,400.00) $2,000.00 $3,800.00 ($2,000.00)
6,800.00
12,500.00
2,500.00
4,500.00
20
4P
rincip
les
of
Co
st
Acco
un
ting

Figure 4-15 Distribution of Actual Factory Overhead to Service and Production Departments
FACTORY OVERHEAD
300,000 300,000
FACTORY O/H FACTORY O/H FACTORY O/H FACTORY O/H FACTORY O/H FACTORY O/H
POWER MAINTENANCEHUMAN
RESOURCES DEPT. B DEPT. C DEPT. D
30,000 20,000 10,000 50,000 40,000 60,000 90,000
FACTORY O/H
DEPT. A
Figure 4-16 Distribution of Service Department Costs
Distribution of PowerDepartment Costs
30,000 30,000 20,000
2,500
10,000
2,500
50,000
3,000
40,000
4,500
60,000
5,000
90,000
12,500
Distribution of Human ResourcesDepartment Costs
10,000 17,000 50,000
2,500 3,000
4,500 4,500
5,100
40,000
4,500
5,400
1,700
60,000
5,000
3,600
3,400
90,000
12,500
4,500
6,800
Distribution of MaintenanceDepartment Costs
20,000 22,500 10,000
2,500 2,500
4,500
50,000
3,000
4,500
40,000
4,500
5,400
60,000
5,000
3,600
90,000
12,500
4,500
POWER MAINTENANCE
HUMANRESOURCES
FACTORYOVERHEAD—
DEPT. A
FACTORYOVERHEAD—
DEPT. B
FACTORYOVERHEAD—
DEPT. C
FACTORY OVERHEAD—
DEPT. D
FACTORYOVERHEAD—
DEPT. A
HUMAN
RESOURCES
FACTORYOVERHEAD—
DEPT. B
FACTORY
OVERHEAD—DEPT. C
FACTORY
OVERHEAD—DEPT. D
MAINTENANCEHUMAN
RESOURCES
FACTORY OVERHEAD—
DEPT. A
FACTORY OVERHEAD—
DEPT. B
FACTORY OVERHEAD—
DEPT. C
FACTORY
OVERHEAD—DEPT. D
Chapter 4 – Accounting for Factory Overhead 205

Figure 4-17 Departmental Applied Factory Overhead
APPLIED FACTORY OVERHEAD–DEPT. A
66,000
APPLIED FACTORY OVERHEAD–DEPT. B
56,000
APPLIED FACTORY OVERHEAD–DEPT. C
70,000
WORK IN PROCESS
302,000
APPLIED FACTORY OVERHEAD–DEPT. D
110,000
Figure 4-18 Closing Applied Factory Overhead Accounts to
Departmental Factory Overhead Accounts
FACTORY OVERHEAD–DEPT. A
66,00062,600
APPLIED FACTORY OVERHEAD–DEPT. A
66,00066,000
FACTORY OVERHEAD–DEPT. B
56,00051,600
APPLIED FACTORY OVERHEAD–DEPT. B
56,00056,000
FACTORY OVERHEAD–DEPT. C
70,00072,000
APPLIED FACTORY OVERHEAD–DEPT. C
70,00070,000
FACTORY OVERHEAD–DEPT. D
110,000113,800
APPLIED FACTORY OVERHEAD–DEPT. D
110,000110,000
206 Principles of Cost Accounting

Under- and Overapplied Factory Overhead. The net amount of over-applied factory overhead, $2,000, is relatively small and most probablywould be deducted from Cost of Goods Sold rather than prorated amongCost of Goods Sold and the inventory accounts. Figure 4-20 shows insummary form the transactions involved in accounting for factoryoverhead.
Figure 4-19 Closing Balances in Departmental Factory
Overhead Accounts
FACTORY OVERHEAD–
DEPT. A66,00062,600
3,400
FACTORY OVERHEAD–DEPT. B
56,00051,6004,400
UNDER- AND OVERAPPLIEDFACTORY OVERHEAD
2,000
FACTORY OVERHEAD–DEPT. C
70,0002,000
72,000
FACTORY OVERHEAD–DEPT. D
110,0003,800
113,800
Chapter 4 – Accounting for Factory Overhead 207

Figure 4-20 Summary of Factory Overhead Transactions
1
2
3
4
5
6
7
9
10
11
12
13
14
15
16
17
18
19
20
21
22
23
24
25
26
27
28
29
30
31
32
33
34
35
36
37
38
39
40
41
42
43
44
45
46
47
48
49
50
51
52
53
54
55
56
57
A B C D E
ACCOUNTING FOR FACTORY OVERHEAD Source Book of Subsidiary
of Original Cost
Transaction Data Entry General Journal Entry RecordsIndirect materials
requisitioned from
storeroom for factory use
Indirect labor employed
in factory
Payroll taxes imposed
on the employer
Incurred factory overhead
such as rent, power, and
repairs
Adjustments for factory
overhead such as expired
insurance, accrued
property tax, and
depreciation
Distribution of factory
overhead to service and
production departments
Distribution of service
department expenses to
production department
expense accounts
Application of factory
overhead to jobs
Close applied factory
overhead accounts to
factory overhead control
Close factory overhead
control balances to under-
and overapplied factory
overhead accounts
Materials issued summary
Labor cost summary
Payroll record
Invoices
Schedule of fixed costs
Summary of factory
overhead
Schedules
Schedule of predetermined
departmental application
rates
Applied factory overhead
accounts
Factory overhead control
accounts
General Journal or
Materials Requisition
Journal
General Journal
General Journal
General Journal
General Journal
General Journal
General Journal
General Journal
General Journal
General Journal
Factory Overhead
Materials
Factory Overhead
Payroll
Factory Overhead
FICA Tax Payable
FUTA Tax Payable
State Unemployment
Tax Payable
Factory Overhead
Accounts Payable
Factory Overhead
Prepaid Insurance
Accrued Property
Tax Payable
Accumulated
Depreciation
Departmental Factory
Overhead Accounts
Factory Overhead
Production Department
Factory O/H Accts.
Service Department
Expense Accounts
Work in Process
Applied Factory
Overhead
Accounts
Applied Factory Overhead
Accounts
Factory Overhead
Under- and Overapplied
Factory Overhead
Factory Overhead
(if underapplied)
Factory Overhead
Under- and
Overapplied Factory
Overhead
(if overapplied)
Factory overhead
analysis sheets
Materials ledger cards
Factory overhead
analysis sheets
Factory overhead
analysis sheets
Factory overhead
analysis sheets
Factory overhead
analysis sheets
None
Factory overhead
analysis sheets
Job cost sheets
None
None
208 Principles of Cost Accounting

KEY TERMS
Account analysis method, 172
Activity-based costing (ABC), 196
Activity-based management (ABM), 198
Algebraic distribution method, 187
Applied Factory Overhead, 198
Budgets, 179
Cost driver, 196
Department-type analysis spreadsheet, 182
Dependent variable, 177
Direct charge, 186
Direct distribution method, 187
Direct labor cost method, 194
Direct labor hour method, 195
Expense-type analysis spreadsheet, 182
Factory overhead, 169
Factory overhead analysis spreadsheets, 181
Factory overhead ledger, 180
Fixed costs, 170
Flexible budget, 179
General factory overhead expenses, 184
High-low method, 173
Independent variable, 177
Least-squares regression method, 177
Machine hour method, 195
Mixed costs, 170
Non-volume-related activities, 196
Observation method, 172
Outliers, 176
Overapplied or overabsorbed factory
overhead, 200
Period cost, 202
Predetermined factory overhead rates, 193
Product cost, 202
Production department, 185
Scattergraph method, 174
Schedule of fixed costs, 183
Semivariable costs, 170
Sequential distribution or step-down
method, 187
Service department, 185
Step-fixed cost, 171
Step-variable cost, 171
Summary of factory overhead, 185
Under- and Overapplied Factory
Overhead, 200
Underapplied or underabsorbed, 199
Variable costs, 170
Volume-related activities, 196
Recall and Review 4
RDI Co. had a year-end remaining debit balance of $15,000 in its under-and
overapplied factory overhead account. The balance was considered to be
large and, therefore, should be closed to Work in Process, Finished Goods,
and Cost of Goods Sold. The year-end balance of these accounts, before
adjustment, showed the following: Work in Process, $35,000; Finished
Goods, $65,000; and Cost of Goods Sold, $100,000. The prorated amount of
the underapplied factory overhead that is chargeable to each of the
accounts would be Work in Process, $_______________, Finished Goods,
$_____________, and Cost of Goods Sold, $________________.
(After working this exercise, see page 210 for the solution.)
You should now be able to work the following:
Questions 26 and 27; Exercises 4-11 to 4-14; Problems 4-11 to 4-16; Problem
4-17R, the Review Problem for Chapters 1–4; and Self-Study Problem 2.
Chapter 4 – Accounting for Factory Overhead 209

ANSWERS TO RECALL AND REVIEW EXERCISES
R&R 1
Hours ExpenseHigh volume . . . . . . . . . . . . . . . . . . . . . . . . . . . . . . . . 14,000 $6,100
Low volume . . . . . . . . . . . . . . . . . . . . . . . . . . . . . . . . 9,000 4,100
Difference . . . . . . . . . . . . . . . . . . . . . . . . . . . . . . . . . . 5,000 $2,000
Variable cost per hour ¼ $2,000/5,000 hrs ¼ $.40
9,000 hours 14,000 hours
Total cost . . . . . . . . . . . . . . . . . . . . . . . . . . . . . . . . . . . $4,100 $6,100
Variable cost @
$.40 per hour . . . . . . . . . . . . . . . . . . . . . . . . . . . . . . . 3,600 5,600
Fixed cost . . . . . . . . . . . . . . . . . . . . . . . . . . . . . . . . . . . $ 500 $ 500
R&R 2
5,000 units 7,500 unitsDirect materials . . . . . . . . . . . . . . . . . . . . . . . . . . . . . $ 3.00 $3.00
Direct labor . . . . . . . . . . . . . . . . . . . . . . . . . . . . . . . . . 4.50 4.50
Fixed overhead . . . . . . . . . . . . . . . . . . . . . . . . . . . . . 1.80* 1.20**
Variable overhead . . . . . . . . . . . . . . . . . . . . . . . . . . 1.00 1.00
Unit cost . . . . . . . . . . . . . . . . . . . . . . . . . . . . . . . . . . . . $10.30 $9.70
*(6,000 units � $1.50)/5,000
**(6,000 units � $1.50)/7,500
R&R 3
$20 � 175 machine hours ¼ $3,500.
Total cost of job ¼ $3,000 þ $2,200 þ $3,500 ¼ $8,700
R&R 4
Year-End Balances % of TotalWork in Process . . . . . . . . . . . . . . . . . . . . . $ 35,000 17.5 %
Finished Goods . . . . . . . . . . . . . . . . . . . . . . 65,000 32.5
Cost of Goods Sold . . . . . . . . . . . . . . . . . . 100,000 50.0
Total . . . . . . . . . . . . . . . . . . . . . . . . . . . . . . . . $200,000 100.0 %
Work in Process . . . . . . . . . . . . . . . . . . . . . $15,000 � 17.5% ¼ $2,625
Finished Goods . . . . . . . . . . . . . . . . . . . . . . $15,000 � 32.5% ¼ $4,875
Cost of Goods Sold . . . . . . . . . . . . . . . . . . $15,000 � 50.0% ¼ $7,500
210 Principles of Cost Accounting

SELF-STUDY PROBLEM 1
Distributing Service Department Expenses
Silicon Valley Manufacturing, Inc.
Silicon Valley Manufacturing, Inc., is divided into five departments that
consist of three producing departments (Machining, Assembly, and Finish-
ing) and two service departments (Building Maintenance and Storeroom).
During September, the following factory overhead was incurred for the
various departments:
Machining . . . . . . . . . . . . . . . . . . . . . . . . . . . . . . . . . . . . . . . . . . . . . . . . . . . . . . . $125,000
Assembly . . . . . . . . . . . . . . . . . . . . . . . . . . . . . . . . . . . . . . . . . . . . . . . . . . . . . . . 155,000
Finishing . . . . . . . . . . . . . . . . . . . . . . . . . . . . . . . . . . . . . . . . . . . . . . . . . . . . . . . . 85,000
Building Maintenance . . . . . . . . . . . . . . . . . . . . . . . . . . . . . . . . . . . . . . . . . . . . 60,000
Storeroom . . . . . . . . . . . . . . . . . . . . . . . . . . . . . . . . . . . . . . . . . . . . . . . . . . . . . . . 45,000
The bases for distributing service department expenses to the other
departments were as follows:
Bldg. Maintenance—on the basis of square feet of floor space occupied:
Machining, 5,000 sq ft; Assembly, 10,000 sq ft; Finishing, 3,000 sq ft;
Storeroom, 2,000 sq ft.
Storeroom—on the basis of the number of materials requisitions pro-
cessed: Machining, 400; Assembly, 250; Finishing, 100.
Required:
Rounding off allocated amounts to the nearest whole cent, prepare
schedules showing the distribution of the service departments’ expenses
using:
1. The direct distribution method.
2. The sequential distribution method.
Suggestions:
1. When using the direct distribution method, you must realize that one
service department’s use of another service department is ignored in
performing the distribution.
2. When using the sequential distribution method, you must first deter-
mine the order in which service departments will be distributed.
SOLUTION TO SELF-STUDY PROBLEM 1
Performing the Direct Distribution Method:
1. Observe that the distribution of Building Maintenance ignores the fact
that the maintenance workers also clean and repair the 2,000-sq-ft
Chapter 4 – Accounting for Factory Overhead 211

Storeroom. The denominator used in doing the allocations only includes
the combined 18,000 sq ft for Machining, Assembly, and Finishing.
2. Note that when distributing the Storeroom, the amount of the denomi-
nator is not an issue because the Storeroom does not provide any
services to Building Maintenance.
Performing the Sequential Distribution Method:
1. Since the number of departments served is the most common
criterion for determining what service department to allocate first,
Building Maintenance will be allocated first because it services four
other departments, whereas Storeroom only services three other
departments.
2. Note that the denominator used in doing the Building Maintenance
distribution includes all 20,000 sq ft of factory floor space.
3. Note that the Storeroom amount distributed includes costs that origi-
nated in its department, as well as its share of the Building Mainte-
nance costs.
4. Note that once a department’s costs have been distributed, its share of
other service departments’ costs is not allocated back to it. (Note that
it is not an issue here, because Building Maintenance is not serviced
by the Storeroom.)
DIRECT DISTRIBUTION METHOD:
1
2
3
4
5
6
7
8
9
10
11
12
13
14
15
16
17
18
19
20
21
22
23
24
25
A B C D E F
Total from factory overhead
analysis spreadsheets.......................... $60,000 $45,000 $125,000 $155,000 $85,000
Building Maintenance distribution— ....
(sq ft):
Machining ( 5,000 sq ft @ $3.33*)......... $16,650
Assembly (10,000 sq ft @ $3.33)......... $33,330
Finishing (3,000 sq ft @ $3.33)............. $9,990
Storeroom distribution— $(60,000)
(# of requisitions):
Machining (400 reqs. @ $60**)............. $24,000
Assembly (250 reqs. @ $60)................. $15,000
Finishing (100 reqs. @ $60).................. $6,000
Total $165,650 $203,330 $100,990
*$60,000/18,000 sq ft
**$45,000/750 requisitions
Dept. Bldg. Maint. Storeroom Machining Assembly Finishing
$(45,000)
212 Principles of Cost Accounting

SEQUENTIAL DISTRIBUTION METHOD
SELF-STUDY PROBLEM 2
Job Cost Sheets, Journal Entries
Water Wonders, Inc.
Water Wonders, Inc., makers of custom-made Jet Skis, completed Job 500
on March 31, and there were no jobs in process in the plant. Prior to April
1, the predetermined overhead application rate for April was computed
from the following data, based on an estimate of 40,000 direct labor hours:
Estimated variable factory overhead . . . . . . . . . . . . . . . . . . . . . . . . . . . . . . . . . . . . . . . . . $100,000
Estimated fixed factory overhead . . . . . . . . . . . . . . . . . . . . . . . . . . . . . . . . . . . . . . . . . . . . 200,000
Total estimated factory overhead . . . . . . . . . . . . . . . . . . . . . . . . . . . . . . . . . . . . . . . . . . $300,000
Estimated variable factory overhead per hour . . . . . . . . . . . . . . . . . . . . . . . . . . . . . . . . $ 2.50
Estimated fixed factory overhead per hour . . . . . . . . . . . . . . . . . . . . . . . . . . . . . . . . . . . 5.00
Predetermined overhead rate per direct labor hour . . . . . . . . . . . . . . . . . . . . . . . . . $ 7.50
The factory has one production department, and the direct labor hour
method is used to apply factory overhead.
1
2
3
4
5
6
7
8
9
10
11
12
13
14
15
16
18
19
20
21
22
23
24
25
26
27
28
29
30
31
32
A B C D E F
Total from factory overhead
analysis spreadsheets:........................ $60,000 $45,000 $125,000 $155,000 $85,000
Building Maintenance
distribution— (sq ft)............................. $(60,000)
Dept. Bldg. Maint. Storeroom Machining Assembly Finishing
Storeroom (2,000 @ $3*)...................... 6,000
Machining (5,000 @ $3)....................... 15,000
Assembly (10,000 @ $3) ............... 30,000
Finishing (3,000 @ $3)................... 9,000
$51,000
Storeroom distribution— $(51,000)
(# of reqs.)..........................................
Machining (400 @ $68**)...................... 27,200
Assembly (250 @ $68).......................... 17,000
Finishing (100 @ $68) 6,800
Total $167,200 $202,000 $100,800
*$60,000/20,000 sq ft
**$51,000/750 requisitions
$0$0
Chapter 4 – Accounting for Factory Overhead 213

Three jobs are started during the month, and postings are made daily
to the job cost sheets from the materials requisitions and labor-time
records. The following schedule shows the jobs and the amounts posted
to the job cost sheets:
JobDate
StartedDirect
MaterialsDirectLabor
Direct LaborHours
401 April 1 $100,000 $120,000 12,000
402 April 12 200,000 250,000 18,000
403 April 15 80,000 75,000 8,000
$380,000 $445,000 38,000
The factory overhead control account was debited during the month
for actual factory overhead expenses of $325,000. On April 11, Job 401
was completed and delivered to the customer at a markup of 25% on
manufacturing cost. On April 24, Job 402 was completed and transferred
to Finished Goods. On April 30, Job 403 was still in process.
Required:
1. Prepare job cost sheets for Jobs 401, 402, and 403, including factory
overhead applied when the job was completed or at the end of the
month for partially completed jobs.
2. Prepare journal entries as of April 30 for the following:
a. Applying factory overhead to production.
b. Closing the applied factory overhead account.
c. Closing the factory overhead account.
d. Transferring the cost of the completed jobs to Finished Goods.
e. Recording the cost of the sale and the sale of Job 401.
Suggestions:
1. When completing the job cost sheets, you must first determine how
much overhead should be applied to each job.
2. When closing the factory overhead account, the balance will represent
the under- or overapplied factory overhead.
SOLUTION TO SELF-STUDY PROBLEM 2
Preparing the Job Cost Sheets:
1. On April 11, Job 401 was completed and factory overhead was applied
as follows:
Job 401Direct materials . . . . . . . . . . . . . . . . . . . . . . . . . . . . . . . . . . . . . . . . . . . . . . . . . . . . . . $100,000
Direct labor . . . . . . . . . . . . . . . . . . . . . . . . . . . . . . . . . . . . . . . . . . . . . . . . . . . . . . . . . . 120,000
Applied factory overhead (12,000 hours � $7.50) . . . . . . . . . . . . . . . . . . . . . . . 90,000
Total cost . . . . . . . . . . . . . . . . . . . . . . . . . . . . . . . . . . . . . . . . . . . . . . . . . . . . . . . . . . . $310,000
On April 24, Job 402 was completed and factory overhead was
applied as follows:
Job 402Direct materials . . . . . . . . . . . . . . . . . . . . . . . . . . . . . . . . . . . . . . . . . . . . . . . . . . . . . . $200,000
Direct labor . . . . . . . . . . . . . . . . . . . . . . . . . . . . . . . . . . . . . . . . . . . . . . . . . . . . . . . . . . 250,000
Applied factory overhead (18,000 hours � $7.50) . . . . . . . . . . . . . . . . . . . . . . . 135,000
Total cost . . . . . . . . . . . . . . . . . . . . . . . . . . . . . . . . . . . . . . . . . . . . . . . . . . . . . . . . . . . $585,000
214 Principles of Cost Accounting

On April 30, Job 403 is not completed; however, factory overhead is
applied to the partially completed job to estimate the total cost
incurred during the month of April, as follows:
Job 403Direct materials . . . . . . . . . . . . . . . . . . . . . . . . . . . . . . . . . . . . . . . . . . . . . . . . . . . . . . $ 80,000
Direct labor . . . . . . . . . . . . . . . . . . . . . . . . . . . . . . . . . . . . . . . . . . . . . . . . . . . . . . . . . . 75,000
Applied factory overhead (8,000 hours � $7.50) . . . . . . . . . . . . . . . . . . . . . . . . 60,000
Total cost (for month of April) . . . . . . . . . . . . . . . . . . . . . . . . . . . . . . . . . . . . . . . . $215,000
Preparing the Journal Entries:
2. a. The total factory overhead applied to the three jobs during April
was $285,000. The general journal entry made on April 30 to apply
factory overhead to production follows:
April 30 Work in Process . . . . . . . . . . . . . . . . . . . . . . . . . . . 285,000
Applied Factory Overhead . . . . . . . . . . . . . . . . 285,000
The applied factory overhead of $285,000 has already been re-
corded on the job cost sheets. The preceding general journal entry
brings the work in process control account into agreement with the
subsidiary job cost ledger.
b. and c. The next procedure is to close the applied factory overhead
account to Factory Overhead. Then, transfer any remaining
balance to the under- and overapplied factory overhead
account.
April 30 Applied Factory Overhead . . . . . . . . . . . . . . . . . . 285,000
Factory Overhead . . . . . . . . . . . . . . . . . . . . . . . . 285,000
April 30 Under- and Overapplied Factory Overhead . . 40,000
Factory Overhead . . . . . . . . . . . . . . . . . . . . . . . . 40,000
Closed factory overhead ($325,000 actual– $285,000 applied).
d. and e. During April, the following entries were made to transfer the
cost of completed Jobs 401 and 402 to Finished Goods, and
to record the cost of the sale and the sale of Job 401:
Finished Goods . . . . . . . . . . . . . . . . . . . . . . . . . . . . . . . . . . . . . . . . . . 895,000
Work in Process . . . . . . . . . . . . . . . . . . . . . . . . . . . . . . . . . . . . . . . . 895,000
Completed Jobs 401 ($310,000) and 402 ($585,000) andtransferred to finished goods.
Accounts Receivable . . . . . . . . . . . . . . . . . . . . . . . . . . . . . . . . . . . . . 387,500
Sales . . . . . . . . . . . . . . . . . . . . . . . . . . . . . . . . . . . . . . . . . . . . . . . . . . 387,500
Delivered Job 401 to customer and billed at 25% markup($310,000 � 125%).
Cost of Goods Sold . . . . . . . . . . . . . . . . . . . . . . . . . . . . . . . . . . . . . . . 310,000
Finished Goods . . . . . . . . . . . . . . . . . . . . . . . . . . . . . . . . . . . . . . . . 310,000
Recorded cost of Job 401 delivered to customer.
Chapter 4 – Accounting for Factory Overhead 215

QUESTIONS
1. What are factory overhead expenses, and
what distinguishes them from other manu-
facturing costs? What other terms are used
to describe factory overhead expenses?
2. What are three categories of factory over-
head expenses? Give examples of each.
3. What are the distinguishing characteristics
of variable, fixed, and semivariable factory
overhead costs?
4. When a product’s cost is composed of both
fixed and variable costs, what effect does
the increase or decrease in production
have on per unit cost?
5. What effect does a change in volume have on
total variable, fixed, and semivariable costs?
6. Distinguish between a step-variable cost
and a step-fixed cost.
7. What is the basic premise underlying the
high-low method of analyzing semivariable
costs?
8. What are the advantages and disadvan-
tages of the scattergraph method as com-
pared to the high-low method?
9. Differentiate between an independent vari-
able and a dependent variable and give an
example of each.
10. What does R2 measure, and how would it
be useful?
11. How does accounting for factory overhead
differ in small enterprises versus large
enterprises?
12. What is the function and use of each of the
two types of factory overhead analysis
spreadsheets?
13. What are two types of departments found
in a factory? What is the function or pur-
pose of each?
14. What are the two most frequently used
methods of distributing service department
costs to production departments?
15. When using the step-down method of dis-
tributing service department costs, if a
service department receives services
from other service departments, will
those costs be allocated back to it even
though it was the first service department
distributed?
16. When using the step-down method of dis-
tributing service department costs, if each
of two service departments services the
same number of other departments, how is
it determined as to which service depart-
ment to allocate first?
17. What are the shortcomings of waiting until
the actual factory overhead expenses are
known before recording such costs on the
job cost sheets?
18. What are the two types of budget data
needed to compute predetermined over-
head rates?
19. What are three methods traditionally used
for applying factory overhead to jobs? Dis-
cuss the allocation base used in each
method.
20. What factory operating conditions and
data are required for each of the tradi-
tionally used methods for applying fac-
tory overhead to products? Discuss the
strengths and weaknesses of each
method.
21. Under what conditions would it be desir-
able for a company to use more than one
method to apply factory overhead to jobs
or products?
22. How does activity-based costing differ from
traditional methods of applying overhead
to products?
23. What steps must a company take to suc-
cessfully employ activity-based costing?
24. What is the relationship between activity-
based costing and activity-based mana-
gement?
216 Principles of Cost Accounting

25. Distinguish between volume-related and
non-volume-related overhead costs.
26. If the factory overhead control account has
a debit balance of $1,000 at the end of the
first month of the fiscal year, has the over-
head been under- or overapplied for the
month? What are some probable causes
for the debit balance?
27. What are two ways that an under- or over-
applied factory overhead balance can be dis-
posed of at the end of a fiscal period? How
can one decide which method to choose?
EXERCISES
E4-1 Classifying fixed and variable costsClassify each of the following items of factory overhead as either
a fixed or a variable cost. (Include any costs that you consider to
be semivariable within the variable category. Remember that
variable costs change in total as the volume of production
changes.)
a. Indirect labor
b. Indirect materials
c. Insurance on building
d. Overtime premium pay
e. Depreciation on building (straight-line)
f. Polishing compounds
g. Depreciation on machinery (based on machine hours used)
h. Employer’s payroll taxes
i. Property taxes
j. Machine lubricants
k. Employees’ hospital insurance (paid by employer)
l. Labor for machine repairs
m. Vacation pay
n. Janitor’s wages
o. Rent
p. Small tools
q. Plant manager’s salary
r. Factory electricity
s. Product inspector’s wages
E4-2 High-low methodsCopper Mountain Company has accumulated the following data
over a six-month period:
IndirectLabor Hours
IndirectLabor Costs
January . . . . . . . . . . . . . . . . . . . . . . . . . . . . . . . . . . . 400 $ 6,000
February . . . . . . . . . . . . . . . . . . . . . . . . . . . . . . . . . . 500 7,000
March . . . . . . . . . . . . . . . . . . . . . . . . . . . . . . . . . . . . . 600 8,000
April . . . . . . . . . . . . . . . . . . . . . . . . . . . . . . . . . . . . . . 700 9,000
May . . . . . . . . . . . . . . . . . . . . . . . . . . . . . . . . . . . . . . . 800 10,000
June . . . . . . . . . . . . . . . . . . . . . . . . . . . . . . . . . . . . . . 900 11,000
3,900 $51,000
LO1
LO2
Chapter 4 – Accounting for Factory Overhead 217

Separate the indirect labor into its fixed and variable compo-
nents, using the high-low method.
E4-3 Scattergraph methodUsing the data in E4-2 and a piece of graph paper:
1. Plot the data points on the graph and draw a line by visual
inspection, indicating the trend shown by the data points.
2. Determine the variable cost per unit and the total fixed cost
from the information on the graph.
E4-4 Least-squares regression methodUsing the data in E4-2 and Microsoft Excel, determine:
1. The variable cost per unit, the total fixed cost, and R2.
2. The plotted data points using Chart Wizard.
3. Compare the results to your solutions in E4-2 and E4-3.
E4-5 Computing unit costs at different levels of productionScentsation, Inc., budgeted for 12,000 bottles of perfume Oui
during the month of May. The unit cost of Oui was $20, consist-
ing of direct materials, $7; direct labor, $8; and factory overhead,
$5 (fixed, $2; variable, $3).
a. What would be the unit cost if 10,000 bottles were manufac-
tured? (Hint: You must first determine the total fixed costs.)
b. What would be the unit cost if 20,000 bottles were
manufactured?
c. Explain why a difference occurs in the unit costs.
E4-6 Identifying basis for distribution of service department costsWhat would be the appropriate basis for distributing the costs
of each of the following service departments to the user
departments?
a. Building maintenance
b. Inspection and packing
c. Machine repair
d. Human resources
e. Purchasing
f. Shipping
g. Raw materials storeroom
E4-7 Direct method and sequential method of distributing servicedepartment costsA manufacturing company has two service and two production
departments. Building Maintenance and Factory Office are the
service departments. The production departments are Assembly
and Machining.
The following data have been estimated for next year’s
operations:
Direct labor hours: Assembly, 80,000; Machining, 40,000
Floor space occupied: Factory Office, 10%; Assembly, 40%;Machining, 50%
LO2
LO2
LO3
LO5
LO5
218 Principles of Cost Accounting

The direct charges identified with each of the departments
are as follows:
Building maintenance . . . . . . . . . . . . . . . . . . . . . . . . . . . . . . . . . . . . . . . . . . . $ 90,000
Factory office . . . . . . . . . . . . . . . . . . . . . . . . . . . . . . . . . . . . . . . . . . . . . . . . . . . 171,000
Assembly . . . . . . . . . . . . . . . . . . . . . . . . . . . . . . . . . . . . . . . . . . . . . . . . . . . . . . 378,000
Machining . . . . . . . . . . . . . . . . . . . . . . . . . . . . . . . . . . . . . . . . . . . . . . . . . . . . . 328,000
The building maintenance department services all depart-
ments of the company, and its costs are allocated using floor
space occupied, while factory office costs are allocable to As-
sembly and Machining on the basis of direct labor hours.
1. Distribute the service department costs, using the direct
method.
2. Distribute the service department costs, using the sequential
distribution method, with the department servicing the great-
est number of other departments distributed first.
E4-8 Determining job cost, using direct labor cost, direct labor hour,and machine hour methodsa. If the direct labor cost method is used in applying factory
overhead and the predetermined rate is 100%, what amount
should be charged to Job 2010 for factory overhead? As-
sume that direct materials used totaled $5,000 and that the
direct labor cost totaled $3,200.
b. If the direct labor hour method is used in applying factory
overhead and the predetermined rate is $10 an hour, what
amount should be charged to 2010 for factory overhead?
Assume that the direct materials used totaled $5,000, the
direct labor cost totaled $3,200, and the number of direct
labor hours totaled 250.
c. If the machine hour method is used in applying factory over-
head and the predetermined rate is $12.50 an hour, what
amount should be charged to 2010 for factory overhead?
Assume that the direct materials used totaled $5,000, the
direct labor cost totaled $3,200, the direct labor hours were
250 hours, and the machine hours were 295 hours.
E4-9 Determining job costs, using ABC methodJob 401k required $5,000 for direct materials, $2,000 for direct
labor, 200 direct labor hours, 100 machine hours, two setups,
and three design changes. The cost pools and overhead rates for
each pool follow:
Cost Pool Overhead RateAssembly support $5/direct labor hour
Machining support $10/machine hour
Machine setups $250/setup
Design changes $500/design change
Determine the cost of Job 401k.
LO6
LO6
Chapter 4 – Accounting for Factory Overhead 219

E4-10 ABC matching of cost pools and cost allocation basesMatch each of the following cost pools with the most appropriate
cost allocation base and determine the overhead rates:
Cost Pool AmountAssembly support . . . . . . . . . . . . . . . . . . . . . . . . . . . . . . . . . . . . . . . . . . . . . . . . . $50,000
Machining support . . . . . . . . . . . . . . . . . . . . . . . . . . . . . . . . . . . . . . . . . . . . . . . . . 80,000
Machine setups . . . . . . . . . . . . . . . . . . . . . . . . . . . . . . . . . . . . . . . . . . . . . . . . . . . . 25,000
Design changes . . . . . . . . . . . . . . . . . . . . . . . . . . . . . . . . . . . . . . . . . . . . . . . . . . . 15,000
Allocation BaseNumber of setups . . . . . . . . . . . . . . . . . . . . . . . . . . . . . . . . . . . . . . . . . . . . . . . . . 200
Machine hours . . . . . . . . . . . . . . . . . . . . . . . . . . . . . . . . . . . . . . . . . . . . . . . . . . . . 2,000
Design hours . . . . . . . . . . . . . . . . . . . . . . . . . . . . . . . . . . . . . . . . . . . . . . . . . . . . . . 500
Direct labor cost . . . . . . . . . . . . . . . . . . . . . . . . . . . . . . . . . . . . . . . . . . . . . . . . . . . $ 75,000
E4-11 Determining actual factory overheadThe books of Prestige Products Company revealed that the
following general journal entry had been made at the end of the
current accounting period:
Factory Overhead . . . . . . . . . . . . . . . . . . . . . . . . . . . . . . . . . . . . . . . 2,000
Under- and Overapplied Factory Overhead . . . . . . . . . . . . . 2,000
Closed credit balance in factory overhead controlaccount.
The total direct materials cost for the period was $40,000.
The total direct labor cost, at an average rate of $10 per hour for
direct labor, was one and one-half times the direct materials
cost. Factory overhead was applied on the basis of $4 per direct
labor hour. What was the total actual factory overhead incurred
for the period? (Hint: First solve for direct labor cost and then for
direct labor hours.)
E4-12 Determining labor and factory overhead costsThe general ledger of Stephens Products, Inc. contains the
following control account:
Work in Process
Materials 15,000 Finished goods 40,000
Labor 16,000
Factory overhead 16,000
If the materials charged to the one uncompleted job still in
process amounted to $3,400, what amount of labor and factory
overhead must have been charged to the job if the factory over-
head rate is 100% of direct labor cost? (Hint: First determine the
balance in Work in Process.)
LO6
LO6
LO7
LO6
LO7
220 Principles of Cost Accounting

E4-13 General ledger account analysisThe following form represents an account taken from the general
ledger of Brodsky Costumes Company:
Indirect materials 500 Work in Process 8,000
Supervisor’s salary 1,200 (50% of $16,000 direct labor)
Power 5,000
Building expenses 1,000
Miscellaneous overhead 1,400
Bal. 1,100 9,100
Answer the following questions:
a. What is the title of the account?
b. Is this a departmentalized factory?
c. What does the balance of $1,100 represent?
d. How was the 50% rate determined? (Explain without numbers.)
e. What disposition should be made of the balance, assuming
that this is the end of the fiscal year?
E4-14 Computing under- and overapplied overheadETA Company had a remaining credit balance of $20,000 in its
under- and overapplied factory overhead account at year-end.
The balance was deemed to be large and, therefore, should be
closed to Work in Process, Finished Goods, and Cost of Goods
Sold. The year-end balances of these accounts, before adjust-
ment, showed the following:
Work in Process . . . . . . . . . . . . . . . . . . . . . . . . . . . . . . . . . . . . . . . . . . . . . . . . . . . $ 75,000
Finished Goods . . . . . . . . . . . . . . . . . . . . . . . . . . . . . . . . . . . . . . . . . . . . . . . . . . . 25,000
Cost of Goods Sold . . . . . . . . . . . . . . . . . . . . . . . . . . . . . . . . . . . . . . . . . . . . . . . . 100,000
Total . . . . . . . . . . . . . . . . . . . . . . . . . . . . . . . . . . . . . . . . . . . . . . . . . . . . . . . . . . . . . . $200,000
a. Determine the prorated amount of the overapplied factory
overhead that is chargeable to each of the accounts.
b. Prepare the journal entry to close the credit balance in
Under- and Overapplied Factory Overhead.
PROBLEMS
P4-1 Variable and fixed cost pattern analysis
The cost behavior patterns on page 222 are lettered A through H.
The vertical axes of the graphs represent total dollars of ex-
pense, and the horizontal axes represent production in units,
machine hours, or direct labor hours. In each case, the zero point
is at the intersection of the two axes. Each graph may be used no
more than once.
LO7
LO7
LO1
Chapter 4 – Accounting for Factory Overhead 221

Required:
Select the graph that matches the lettered cost described here.
a. Depreciation of equipment—the amount of depreciation
charged is computed based on the number of machine hours
that the equipment was operated.
b. Electricity bill—flat fixed charge, plus a variable cost after a
certain number of kilowatt hours are used.
c. City water bill—computed as follows:
First 1,000,000 gallons or less . . . . . . . . . . . . . . . . . . . . $1,000 flat fee
Next 10,000 gallons . . . . . . . . . . . . . . . . . . . . . . . . . . . . . 0.003 per gallon used
Next 10,000 gallons . . . . . . . . . . . . . . . . . . . . . . . . . . . . . 0.006 per gallon used
Next 10,000 gallons . . . . . . . . . . . . . . . . . . . . . . . . . . . . . 0.009 per gallon used
d. Depreciation of equipment—the amount is computed by the
straight-line method.
e. Rent on a factory building donated by the city—the agree-
ment calls for a fixed fee payment, unless 200,000 labor
hours are worked, in which case no rent need be paid.
f. Salaries of repair workers—one repair worker is needed for
every 1,000 machine hours or less (i.e., 0 to 1,000 hours
requires one repair worker, 1,001 to 2,000 hours requires two
repair workers, etc.).
P4-2 Variable and fixed cost analysis; high-low method
Fahrenheit Company manufactures a product that requires the
use of a considerable amount of natural gas to heat it to a
desired temperature. The process requires a constant level of
heat, so the furnaces are maintained at a set temperature for 24
hours a day. Although units are not continuously processed,
management desires that the variable cost be charged directly to
the product and the fixed cost to the factory overhead. The
following data have been collected for the year:
DBA C
HGFE
LO2
222 Principles of Cost Accounting

Units Cost Units CostJanuary . . . . . . . . . . . . . . 2,400 $4,400 July . . . . . . . . . . . . . 2,200 $4,400
February . . . . . . . . . . . . . . 2,300 4,300 August . . . . . . . . . . 2,100 4,100
March . . . . . . . . . . . . . . . . 2,200 4,200 September . . . . . . 2,000 3,800
April . . . . . . . . . . . . . . . . . . 2,000 4,000 October . . . . . . . . . 1,400 3,400
May . . . . . . . . . . . . . . . . . . 1,800 3,800 November . . . . . . . 1,900 3,700
June . . . . . . . . . . . . . . . . . 1,900 3,900 December . . . . . . . 1,800 4,050
Required:
1. Separate the variable and fixed elements, using the high-low
method.
2. Determine the cost to be charged to the product for the year.
(Hint: First determine the number of annual units produced.)
3. Determine the cost to be charged to factory overhead for the
year.
P4-3 Scattergraph method
Using the data in P4-2 and a piece of graph paper:
1. Plot the data points on the graph and draw a line by visual
inspection, indicating the trend shown by the data points.
2. Determine the variable cost per unit and the total fixed cost
from the information on the graph.
3. Determine the cost to be charged to the product for the year.
4. Determine the cost to be charged to factory overhead for the
year.
5. Do these answers agree with the answers to P4-2? Why or
why not?
P4-4 Least-squares regression method
Using the data in P4-2 and Microsoft Excel:
1. Separate the variable and fixed elements.
2. Determine the cost to be charged to the product for the year.
3. Determine the cost to be charged to factory overhead for the
year.
4. Determine the plotted data points using Chart Wizard.
5. How do these solutions compare to the solutions in P4-2 and
P4-3?
P4-5 Budgeted factory overhead costs
Listed below are the budgeted factory overhead costs for 2011
for Muncie Manufacturing, Inc., at a projected level of 2,000 units:
Expenses:Indirect materials . . . . . . . . . . . . . . . . . . . . . . . . . . . . . . . . . . . . . . . . . . . . . . . . . . $ 10,000
Indirect labor . . . . . . . . . . . . . . . . . . . . . . . . . . . . . . . . . . . . . . . . . . . . . . . . . . . . . 20,000
Power . . . . . . . . . . . . . . . . . . . . . . . . . . . . . . . . . . . . . . . . . . . . . . . . . . . . . . . . . . . . 15,000
Straight-line depreciation . . . . . . . . . . . . . . . . . . . . . . . . . . . . . . . . . . . . . . . . . . 30,000
Factory property tax . . . . . . . . . . . . . . . . . . . . . . . . . . . . . . . . . . . . . . . . . . . . . . . 28,000
Factory insurance . . . . . . . . . . . . . . . . . . . . . . . . . . . . . . . . . . . . . . . . . . . . . . . . . 22,000
Total . . . . . . . . . . . . . . . . . . . . . . . . . . . . . . . . . . . . . . . . . . . . . . . . . . . . . . . . . . . . . $125,000
LO2
LO2
LO3
Chapter 4 – Accounting for Factory Overhead 223

Required:
Prepare flexible budgets for factory overhead at the 1,000, 2,000,
and 4,000 unit levels. (Hint: You must first decide which of the
listed costs should be considered variable and which should be
fixed.)
P4-6 Distribution of service department costs to productiondepartments using the direct methodsimilar to Self-Study Problem 1
Bakery Products, Inc., is divided into five departments, Mixing,
Blending, Finishing, Factory Office, and Building Maintenance.
The first three departments are engaged in production work.
Factory Office and Building Maintenance are service depart-
ments. During the month of June, the following factory overhead
was incurred for the various departments:
Mixing . . . . . . . . . . . . . . . . $21,000 Factory Office . . . . . . . . . . . $9,000
Blending . . . . . . . . . . . . . . 18,000 Building Maintenance . . . . 6,400
Finishing . . . . . . . . . . . . . 25,000
The bases for distributing service department expenses to the
other departments follow:
Building Maintenance—On the basis of floor space occupied
by the other departments as follows: Mixing, 10,000 sq ft;
Blending, 4,500 sq ft; Finishing, 10,500 sq ft; and Factory
Office, 7,000 sq ft.
Factory Office—On the basis of number of employees as follows:
Mixing, 30; Blending, 20; and Finishing, 50.
Required:
Prepare a schedule showing the distribution of the service
departments’ expenses using the direct distribution method.
P4-7 Distribution of service department costs to productiondepartments using the sequential distribution methodsimilar to Self-Study Problem 1
Required:
Using the information in P4-6 above, prepare a schedule show-
ing the distribution of the service departments’ expenses
using the sequential distribution method in the order of num-
ber of other departments served. (Hint: First distribute the
service department that services the greater number of other
departments.)
P4-8 Determining total job costs, using predetermined overhead rate
Barbara-Lee Manufacturing Company uses the job order cost
system of accounting. The following is a list of the jobs com-
pleted during the month of March, showing the charges for
materials requisitioned and for direct labor.
LO5
LO5
LO6
224 Principles of Cost Accounting

Job Materials Requisitioned Direct Labor18AX . . . . . . . . . . . . . . . . . . . . . . . $ 300.00 $ 600.00
19BT . . . . . . . . . . . . . . . . . . . . . . . . 1,080.00 940.00
20CD . . . . . . . . . . . . . . . . . . . . . . . . 720.00 1,400.00
21FB . . . . . . . . . . . . . . . . . . . . . . . . 4,200.00 5,120.00
Assume that factory overhead is applied on the basis of direct
labor costs and that the predetermined rate is 200%.
Required:
1. Compute the amount of overhead to be added to the cost of
each job completed during the month.
2. Compute the total cost of each job completed during the
month.
3. Compute the total cost of producing all the jobs finished
during the month.
P4-9 Determining job cost—calculation of predetermined rate forapplying overhead by direct labor cost and direct labor hourmethods
Lexus Products, Inc., has its factory divided into three depart-
ments, with individual factory overhead rates for each depart-
ment. In each department, all the operations are sufficiently alike
for the department to be regarded as a cost center. The esti-
mated monthly factory overhead for the departments is as
follows: Forming, $64,000; Shaping, $36,000; and Finishing,
$10,080. The estimated production data include the following:
Forming Shaping FinishingMaterials used . . . . . . . . . . . . . . . . . . . . . . . . . . $20,000 $10,000 $10,000
Direct labor cost . . . . . . . . . . . . . . . . . . . . . . . . $16,000 $15,000 $ 8,400
Direct labor hours . . . . . . . . . . . . . . . . . . . . . . . 800 500 350
The job cost ledger shows the following data for GS300, which
was completed during the month:
Forming Shaping FinishingMaterials used . . . . . . . . . . . . . . . . . . . . . . . . . . $120 $140 $120
Direct labor cost . . . . . . . . . . . . . . . . . . . . . . . . $220 $270 $240
Direct labor hours . . . . . . . . . . . . . . . . . . . . . . . 12 10 8
Required:
Determine the cost of GS300. Assume that the factory overhead
is applied to production orders, based on the following:
1. Direct labor cost
2. Direct labor hours
(Hint: You must first determine overhead rates for each depart-
ment, rounding rates to the nearest cent.)
LO6
Chapter 4 – Accounting for Factory Overhead 225

P4-10 Determining job costs, using activity-based costing
Julio Manufacturing Company uses activity-based costing. The
factory overhead budget for the coming period is $500,000,
consisting of the following:
Cost Pool Budgeted AmountDirect labor support . . . . . . . . . . . . . . . . . . . . . . . . . . . . . . . . . $150,000
Machine support . . . . . . . . . . . . . . . . . . . . . . . . . . . . . . . . . . . . 200,000
Machine setups . . . . . . . . . . . . . . . . . . . . . . . . . . . . . . . . . . . . . 100,000
Design changes . . . . . . . . . . . . . . . . . . . . . . . . . . . . . . . . . . . . . 50,000
Total . . . . . . . . . . . . . . . . . . . . . . . . . . . . . . . . . . . . . . . . . . . . . $500,000
The potential allocation bases and their estimated amounts were
as follows:
Cost Pool Budgeted AmountNumber of design changes . . . . . . . . . . . . . . . . . . . . . . . . . . . 50
Number of setups . . . . . . . . . . . . . . . . . . . . . . . . . . . . . . . . . . . . 200
Machine hours . . . . . . . . . . . . . . . . . . . . . . . . . . . . . . . . . . . . . . . 10,000
Direct labor hours . . . . . . . . . . . . . . . . . . . . . . . . . . . . . . . . . . . . 20,000
Required:
1. Determine the overhead rate for each cost pool, using the
most appropriate allocation base for each pool.
2. Job 2525 required $25,000 for direct materials, $10,000 for
direct labor, 500 direct labor hours, 1,000 machine hours, five
setups, and three design changes. Determine the cost of Job
2525.
P4-11 General journal entries for factory overhead
GGT Products, Inc., uses a job order cost system. Selected
transactions dealing with factory items for the month follow:
a. Requisitioned indirect materials from storeroom, $3,200.
b. Purchased, on account, factory supplies for future needs,
$4,400.
c. Purchased parts, on account, for repairing a machine, $1,400.
d. Requisitioned factory supplies from storeroom, $900.
e. Returned other defective factory supplies to vendor, $700.
f. Factory rent accrued for the month, $2,400.
g. Returned previously requisitioned factory supplies to store-
room, $350.
h. Depreciation of machinery and equipment, $2,800.
i. Payroll taxes liability for month, $3,200.
j. Heat, light, and power charges payable for the month,
$6,400.
k. Expired insurance on inventories, $1,350.
l. Factory overhead applied to production, $34,600.
LO6
LO4
LO6
LO7
226 Principles of Cost Accounting

m. Indirect labor for the month, $2,600.
n. Goods completed and transferred to finished goods: materi-
als, $14,400; labor, $40,400; factory overhead, $30,400.
Required:
Record the previous transactions. Assume that the records
include a control account and a subsidiary ledger for factory
overhead, to which the entries will be posted at some later
date.
P4-12 Determining overhead rates, using direct labor cost, direct laborhour, and machine hour methods; determining job cost;computing underapplied and overapplied overhead
Lubbock Manufacturing Company is studying the results of
applying factory overhead to production. The following data
have been used: estimated factory overhead, $60,000; esti-
mated materials costs, $50,000; estimated direct labor costs,
$60,000; estimated direct labor hours, 10,000; estimated ma-
chine hours, 20,000; work in process at the beginning of the
month, none.
The actual factory overhead incurred for the month of Novem-
ber was $80,000, and the production statistics on November 30
are as follows:
JobMaterials
CostsDirect Labor
CostsDirect Labor
HoursMachine
HoursDate JobsCompleted
101 . . . . . . . . . . . . . $ 5,000 $ 6,000 1,000 3,000 Nov. 10
102 . . . . . . . . . . . . . 7,000 12,000 2,000 3,200 Nov. 14
103 . . . . . . . . . . . . . 8,000 13,500 2,500 4,000 Nov. 20
104 . . . . . . . . . . . . . 9,000 15,600 2,600 3,400 In process
105 . . . . . . . . . . . . . 10,000 29,000 4,500 6,500 Nov. 26
106 . . . . . . . . . . . . . 11,000 2,400 400 1,500 In process
Total . . . . . . . . . . . . $50,000 $78,500 13,000 21,600
Required:
1. Compute the predetermined rate, based on the following:
a. Direct labor cost
b. Direct labor hours
c. Machine hours
2. Using each of the methods, compute the estimated total cost
of each job at the end of the month.
3. Determine the under- or overapplied factory overhead, in
total, at the end of the month under each of the methods.
4. Which method would you recommend? Why?
LO6
LO7
Chapter 4 – Accounting for Factory Overhead 227

P4-13 Determining overhead rate, using direct labor cost, direct laborhour, and machine hour methods
The following information, taken from the books of Nicholas
Company, represents the operations for the month of January:
Bronzing Casting FinishingMaterials used . . . . . . . . . . . . . . . . . . . . . . . . . . $20,000 $10,000 $10,000
Direct labor cost . . . . . . . . . . . . . . . . . . . . . . . . $ 8,000 $ 5,000 $ 9,000
Direct labor hours . . . . . . . . . . . . . . . . . . . . . . . 1,000 500 1,620
Machine hours . . . . . . . . . . . . . . . . . . . . . . . . . . 4,000 5,000 2,025
Factory overhead . . . . . . . . . . . . . . . . . . . . . . . $20,000 $10,000 $16,200
The job cost system is used, and the February cost sheet for Job
M45 shows the following:
Bronzing Casting FinishingMaterials . . . . . . . . . . . . . . . . . . . . . . . . . . . . . . . $20.00 $40.00 $20.00
Direct labor . . . . . . . . . . . . . . . . . . . . . . . . . . . . . $64.00 $60.00 $54.00
Direct labor hours . . . . . . . . . . . . . . . . . . . . . . . 8 6 6
Machine hours . . . . . . . . . . . . . . . . . . . . . . . . . . 2 3 1
The following actual information was accumulated during
February:
Bronzing Casting FinishingDirect labor hours . . . . . . . . . . . . . . . . . . . . . . . 15,000 9,800 20,000
Factory overhead . . . . . . . . . . . . . . . . . . . . . . . $350,000 $220,000 $325,000
Required:
1. Using the January data, ascertain the factory overhead appli-
cation rates to be used during February, based on the
following:
a. Direct labor cost
b. Direct labor hours
c. Machine hours
2. Prepare a schedule showing the total production cost of Job
M45 under each method of applying factory overhead.
3. Prepare the entries to record the following for February
operations:
a. The liability for total factory overhead.
b. Distribution of factory overhead to the departments.
c. Application of factory overhead to the work in process,
using direct labor hours. (Use the predetermined rate
calculated in 1. and separate applied overhead accounts
for each department.)
d. Closing of the applied factory overhead accounts.
e. Recording under- and overapplied factory overhead and
closing the actual factory overhead accounts.
LO6
LO7
228 Principles of Cost Accounting

P4-14 Determining the under- and overapplied overhead
Ko-Be Corporation has four departmental accounts: Building
Maintenance, General Factory Overhead, Machining, and As-
sembly. The direct labor hour method is used to apply factory
overhead to the jobs being worked on in Machining and Assem-
bly. The company expects each production department to use
30,000 direct labor hours during the year. The estimated over-
head rates for the year include the following:
Machining AssemblyVariable cost per hour . . . . . . . . . . . . . . . . . . . . . . . . . . . . . . . $1.30 $1.50
Fixed cost per hour . . . . . . . . . . . . . . . . . . . . . . . . . . . . . . . . . . 2.70 3.00
$4.00 $4.50
During the year, both Machining and Assembly used 28,000
direct labor hours. Factory overhead costs incurred during the
year follow:
Building maintenance . . . . . . . . . . . . . . . . . . . . . . . . . . . . . . . . . . . . . . . . . . . . . . $30,000
General factory overhead . . . . . . . . . . . . . . . . . . . . . . . . . . . . . . . . . . . . . . . . . . 75,400
Machining . . . . . . . . . . . . . . . . . . . . . . . . . . . . . . . . . . . . . . . . . . . . . . . . . . . . . . . . . 45,800
Assembly . . . . . . . . . . . . . . . . . . . . . . . . . . . . . . . . . . . . . . . . . . . . . . . . . . . . . . . . . 68,800
In determining application rates at the beginning of the year,
cost allocations were made as follows, using the sequential
distribution method:
Building Maintenance to General Factory Overhead, 10%; to
Machining, 50%; to Assembly, 40%.
General factory overhead was distributed according to direct
labor hours.
Required:
Determine the under- or overapplied overhead for each produc-
tion department. (Hint: First you must distribute the service
department costs.)
P4-15 Job cost sheets, journal entriessimilar to Self-Study Problem 2
Planet Products, Inc., completed Job 2525 on May 31, and there
were no jobs in process in the plant. Prior to June 1, the
predetermined overhead application rate for June was com-
puted from the following data, based on an estimate of 5,000
direct labor hours:
Estimated variable factory overhead . . . . . . . . . . . . . . . . . . . . . . . . . . . . . . . . $20,000
Estimated fixed factory overhead . . . . . . . . . . . . . . . . . . . . . . . . . . . . . . . . . . . 10,000
Total estimated factory overhead . . . . . . . . . . . . . . . . . . . . . . . . . . . . . . . . . $30,000
Estimated variable factory overhead per hour . . . . . . . . . . . . . . . . . . . . . . . $4
Estimated fixed factory overhead per hour . . . . . . . . . . . . . . . . . . . . . . . . . . 2
Predetermined overhead rate per direct labor hour . . . . . . . . . . . . . . . . $6
LO5
LO6
LO7
LO6
LO7
Chapter 4 – Accounting for Factory Overhead 229

The factory has one production department and uses the
direct labor hour method to apply factory overhead.
Three jobs are started during the month, and postings are
made daily to the job cost sheets from the materials requisitions
and labor-time records. The following schedule shows the jobs
and amounts posted to the job cost sheets:
JobDateStarted
DirectMaterials
DirectLabor
Direct LaborHours
2526 . . . . . . . . . . . . . . . . . . June 1 $ 5,000 $10,000 1,600
2527 . . . . . . . . . . . . . . . . . . June 12 10,000 15,000 1,900
2528 . . . . . . . . . . . . . . . . . . June 15 4,000 7,000 1,300
$19,000 $32,000 4,800
The factory overhead control account was debited during the
month for actual factory overhead expenses of $27,000. On
June 11, Job 2526 was completed and delivered to the customer
at a markup of 50% on manufacturing cost. On June 24, Job
2527 was completed and transferred to Finished Goods. On
June 30, Job 2528 was still in process.
Required:
1. Prepare job cost sheets for Jobs 2526, 2527, and 2528, includ-
ing factory overhead applied when the job was completed or
at the end of the month for partially completed jobs.
2. Prepare journal entries as of June 30 for the following:
a. Applying factory overhead to production.
b. Closing the applied factory overhead account.
c. Closing the factory overhead account.
d. Transferring the cost of the completed jobs to finished
goods.
e. Recording the cost of the sale and the sale of Job 2526.
P4-16 Closing under- and overapplied overhead at year-end
Plano Products, Inc., had a remaining credit balance of $10,000
in its under- and overapplied factory overhead account at year-
end. It also had year-end balances in the following accounts:
Work in Process . . . . . . . . . . . . . . . . . . . . . . . . . . . . . . . . . . . . . . . . . . . . . . . . . . . $ 25,000
Finished Goods . . . . . . . . . . . . . . . . . . . . . . . . . . . . . . . . . . . . . . . . . . . . . . . . . . . 15,000
Cost of Goods Sold . . . . . . . . . . . . . . . . . . . . . . . . . . . . . . . . . . . . . . . . . . . . . . . . 85,000
Total . . . . . . . . . . . . . . . . . . . . . . . . . . . . . . . . . . . . . . . . . . . . . . . . . . . . . . . . . . . . . $125,000
Required:
1. Prepare the closing entry for the $10,000 of overapplied over-
head, assuming that the balance is not considered to be
material.
2. Prepare the closing entry for the $10,000 of overapplied over-
head, assuming that the balance is considered to be material.
LO7
230 Principles of Cost Accounting

P4-17R Review Problem for Chapters 1–4
Chrome-It, Inc., manufactures special chromed parts made to the
order and specifications of the customer. It has two production
departments, stamping and plating, and two service departments,
power and maintenance. In any production department, the job in
process is wholly completed before the next job is started.
The company operates on a fiscal year, which ends September
30. Following is the post-closing trial balance as of September 30:
Chrome-It, Inc.Post-Closing Trial Balance
September 30, 2011
Cash . . . . . . . . . . . . . . . . . . . . . . . . . . . . . . . . . . . . . . . . . . . . . . . . . $ 22,500
Accounts Receivable . . . . . . . . . . . . . . . . . . . . . . . . . . . . . . . . . 21,700
Finished Goods . . . . . . . . . . . . . . . . . . . . . . . . . . . . . . . . . . . . . . 8,750
Work in Process . . . . . . . . . . . . . . . . . . . . . . . . . . . . . . . . . . . . . . 3,600
Materials . . . . . . . . . . . . . . . . . . . . . . . . . . . . . . . . . . . . . . . . . . . . 15,000
Prepaid Insurance . . . . . . . . . . . . . . . . . . . . . . . . . . . . . . . . . . . . 4,320
Factory Building . . . . . . . . . . . . . . . . . . . . . . . . . . . . . . . . . . . . . . 64,000
Accum. Depr.—Factory Building . . . . . . . . . . . . . . . . . . . . . . $ 22,500
Machinery and Equipment . . . . . . . . . . . . . . . . . . . . . . . . . . . . 38,000
Accum. Depr.—Machinery and Equipment . . . . . . . . . . . . . 16,000
Office Equipment . . . . . . . . . . . . . . . . . . . . . . . . . . . . . . . . . . . . . 10,500
Accum. Depr.—Office Equipment . . . . . . . . . . . . . . . . . . . . . 7,500
Accounts Payable . . . . . . . . . . . . . . . . . . . . . . . . . . . . . . . . . . . . 2,500
FICA Tax Payable . . . . . . . . . . . . . . . . . . . . . . . . . . . . . . . . . . . . . 3,120
Federal Unemployment Tax Payable . . . . . . . . . . . . . . . . . . 364
State Unemployment Tax Payable . . . . . . . . . . . . . . . . . . . . . 1,404
Employees Income Tax Payable . . . . . . . . . . . . . . . . . . . . . . . 5,200
Capital Stock . . . . . . . . . . . . . . . . . . . . . . . . . . . . . . . . . . . . . . . . . 75,000
Retained Earnings . . . . . . . . . . . . . . . . . . . . . . . . . . . . . . . . . . . . 54,782
$188,370 $188,370
Additional information:
1. The balance of the materials account represents the following:
Materials Units Unit Cost TotalA . . . . . . . . . . . . . . . . . . . . . . . . . . . . . . . . . . . . . . . . . 120 $25 $ 3,000
B . . . . . . . . . . . . . . . . . . . . . . . . . . . . . . . . . . . . . . . . . 320 15 4,800
C . . . . . . . . . . . . . . . . . . . . . . . . . . . . . . . . . . . . . . . . . 180 30 5,400
Factory Supplies . . . . . . . . . . . . . . . . . . . . . . . . . . . 1,800
$15,000
The company uses the FIFO method of accounting for all
inventories. Material A is used in the stamping department,
and materials B and C are used in the plating department.
Chapter 4 – Accounting for Factory Overhead 231

2. The balance of the work in process account represents the
following costs that are applicable to Job 905. (The custo-
mer’s order is for 1,000 units of the finished product.)
Direct materials . . . . . . . . . . . . . . . . . . . . . . . . . . . . . . . . . . . . . . . . . . . . . . . . $1,500
Direct labor . . . . . . . . . . . . . . . . . . . . . . . . . . . . . . . . . . . . . . . . . . . . . . . . . . . . 1,200
Factory overhead . . . . . . . . . . . . . . . . . . . . . . . . . . . . . . . . . . . . . . . . . . . . . . . 900
$3,600
3. The finished goods account reflects the cost of Job 803,
which was finished at the end of the preceding month and is
awaiting delivery orders from the customer.
4. At the beginning of the year, factory overhead application
rates were based on the following data:
StampingDept.
PlatingDept.
Estimated factory overhead for the year . . . . . . . . . . . . $145,000 $115,000
Estimated direct labor hours for the year . . . . . . . . . . . 29,000 6,000
In October, the following transactions were recorded:
a. Purchased the following materials and supplies on
account:
Material A . . . . . . . . . . . . . . . . . . . . . . . . . . . . . . . . . . . . . . 1,100 units @ $26
Material B . . . . . . . . . . . . . . . . . . . . . . . . . . . . . . . . . . . . . . 900 units @ $17
Material C . . . . . . . . . . . . . . . . . . . . . . . . . . . . . . . . . . . . . . 800 units @ $28
Factory Supplies . . . . . . . . . . . . . . . . . . . . . . . . . . . . . . . . $3,200
b. The following materials were issued to the factory:
Job 905 Job 1001 Job 1002Material A . . . . . . . . . . . . . . . . . . . . . . 600 units 400 units
Material B . . . . . . . . . . . . . . . . . . . . . . 400 units 200 units
Material C . . . . . . . . . . . . . . . . . . . . . . 200 units 400 units
Factory Supplies—$2,450
Customers’ orders covered by Jobs 1001 and 1002 are for
1,000 and 500 units of finished product, respectively.
c. Factory wages and office, sales, and administrative sal-
aries are paid at the end of each month. The following
data, provided from an analysis of labor-time records and
salary schedules, will be sufficient for the preparation of
the entries to record the payroll. (Assume FICA and fed-
eral income tax rates of 8% and 10%, respectively.) Re-
cord the company’s liability for state and federal
unemployment taxes. (Assume rates of 4% and 1%, re-
spectively.) Record the payroll distribution for the month
of October.
232 Principles of Cost Accounting

StampingDept.
PlatingDept.
Job 905 . . . . . . . . . . . . . . . . . . . . . . . . . . . . . . . . . 100 hr @ $9 300 hr @ $11
Job 1001 . . . . . . . . . . . . . . . . . . . . . . . . . . . . . . . . 1,200 hr @ $9 300 hr @ $11
Job 1002 . . . . . . . . . . . . . . . . . . . . . . . . . . . . . . . . 800 hr @ $9
Wages of the supervisors, custodial personnel, etc., to-
taled $9,500; administrative salaries were $18,300.
d. Miscellaneous factory overhead incurred during October
totaled $4,230. Miscellaneous selling and administrative
expenses were $1,500. These items as well as the FICA tax
and federal income tax withheld for September were paid.
(See account balances on the post-closing trial balance for
September 30.)
e. Annual depreciation on plant assets is calculated using
the following rates:
Factory buildings—5%
Machinery and equipment—20%
Office equipment—20%
f. The balance of the prepaid insurance account represents
a three-year premium for a fire insurance policy covering
the factory building and machinery. It was paid on the last
day of the preceding month and became effective on
October 1.
g. The summary of factory overhead prepared from the
factory overhead ledger is reproduced here:
Summary of Factory Overhead for OctoberTransaction Account Stamping Plating Power Maintenance Total
a. Factory supplies $ 940.00 $ 750.00 $ 260.00 $ 500.00 $ 2,450.00
b. Indirect labor 3,780.00 2,860.00 970.00 1,890.00 9,500.00
c. Payroll taxes 2,948.40 1,229.80 126.10 245.70 4,550.00
d. Miscellaneous 1,692.00 1,410.00 752.00 376.00 4,230.00
e. Depreciation 360.00 270.00 90.00 180.00 900.00
f. Insurance 48.00 40.00 16.00 16.00 120.00
Total $9,768.40 $6,559.80 $2,214.10 $3,207.70 $21,750.00
h. The total expenses of the maintenance department are
distributed on the basis of floor space occupied by the
power department (8,820 sq ft), stamping department
(19,500 sq ft), and plating department (7,875 sq ft). The
power department expenses are then allocated equally to
the stamping and plating departments.
i. After the actual factory overhead expenses have been
distributed to the departmental accounts and the applied
factory overhead has been recorded and posted, any
balances in the departmental accounts are transferred to
Under- and Overapplied Overhead.
Chapter 4 – Accounting for Factory Overhead 233

j. Jobs 905 and 1001 were finished during the month. Job
1002 is still in process at the end of the month.
k. During the month, Jobs 803 and 905 were sold at a
markup of 50% on cost.
l. Received $55,500 from customers in payment of their
accounts.
m. Checks were issued in the amount of $43,706 for payment
of the payroll.
Required:
1. Set up the beginning trial balance in T-accounts.
2. Prepare materials inventory ledger cards and enter October 1
balances.
3. Set up job cost sheets as needed.
4. Record all transactions and related entries for the month of
October and post to T-accounts.
5. Prepare a service department expense distribution work
sheet for October.
6. At the end of the month:
a. Analyze the balance in the materials account, the work in
process account, and the finished goods account.
b. Prepare the statement of cost of goods manufactured,
income statement, and balance sheet for October 31.
MINI-CASE
Activity-based Costing
Home Entertainment, Inc., manufactures two types of DVD players: stan-
dard and deluxe. It attempts to set selling prices based on a 50% markup
on manufacturing costs to cover selling and administrative expenses and
to earn an acceptable return for shareholders. Tom Sales, Vice President–
Marketing, is confused because the numbers provided by Anne Cash,
Controller, indicate that standard DVD players should be priced at $150
per unit and deluxe DVD players at $300 per unit. The competition is
selling comparable models for $145 and $525, respectively.
Sales informs Cash that there must be something wrong with the job
costing system. He had recently attended a seminar where the speaker
stated that ‘‘All production costs are not a function of how many units are
produced, or of how many labor hours, labor dollars, or machine hours
are expended.’’ He knows that the company uses direct labor dollars as its
only cost allocation base. Tom thinks that perhaps this explains why the
product costs and, therefore selling prices, are so different from those of
the competitors.
Currently, the costs per unit are determined as follows:
Standard DeluxeDirect materials . . . . . . . . . . . . . . . . . . . . . . . . . . . . . . . . . . . . . . . . . . . . . . . . . . $ 30.00 $ 50.00
Direct labor . . . . . . . . . . . . . . . . . . . . . . . . . . . . . . . . . . . . . . . . . . . . . . . . . . . . . . 17.50 37.50
Factory overhead (300% of direct labor $) . . . . . . . . . . . . . . . . . . . . . . . . . . 52.50 112.50
Manufacturing cost per unit . . . . . . . . . . . . . . . . . . . . . . . . . . . . . . . . . . . . . . . $100.00 $200.00
LO6
234 Principles of Cost Accounting

Factory overhead is currently applied using a plantwide rate based on
direct labor cost. This year’s rate was computed as follows:
Budgeted factory overhead:
Direct labor support . . . . . . . . . . . . . . . . . . . . . . . . . . . . . . . . . . . . . . . . . . . . . . . . . . . . . . . . . . $ 300,000
Machine support . . . . . . . . . . . . . . . . . . . . . . . . . . . . . . . . . . . . . . . . . . . . . . . . . . . . . . . . . . . . . 400,000
Setup costs . . . . . . . . . . . . . . . . . . . . . . . . . . . . . . . . . . . . . . . . . . . . . . . . . . . . . . . . . . . . . . . . . . 200,000
Design costs . . . . . . . . . . . . . . . . . . . . . . . . . . . . . . . . . . . . . . . . . . . . . . . . . . . . . . . . . . . . . . . . . 100,000
Total . . . . . . . . . . . . . . . . . . . . . . . . . . . . . . . . . . . . . . . . . . . . . . . . . . . . . . . . . . . . . . . . . . . . . . . . $1,000,000
Budgeted direct labor cost is $333,333.
Budgeted factory overhead rate ¼ $1;000; 000=$333; 333 ¼ 300% of direct labor dollars
Cash, knowing that you had recently studied activity-based costing in
your cost accounting course, employs you as a consultant to determine
what effect its usage would have on the product costs. You first gathered
the following data:
Standard Deluxe TotalUnits produced . . . . . . . . . . . . . . . . . . . . . . . . . . . . . . . . . . . . . . 10,000 2,000 12,000
Direct labor hours . . . . . . . . . . . . . . . . . . . . . . . . . . . . . . . . . . . . 60,000 40,000 100,000
Machine hours . . . . . . . . . . . . . . . . . . . . . . . . . . . . . . . . . . . . . . 30,000 20,000 50,000
Machine setups . . . . . . . . . . . . . . . . . . . . . . . . . . . . . . . . . . . . . . 200 800 1,000
Design changes . . . . . . . . . . . . . . . . . . . . . . . . . . . . . . . . . . . . . 50 200 250
Required:
1. From the data that you gathered, determine the best allocation base
for each of the four components of factory overhead.
2. Compute an overhead rate for each of the four components.
3. Determine the new unit cost for standard and deluxe models using
activity-based costing.
4. Why are the product costs so dramatically different when activity-
based costing is used?
5. Would Home Entertainment’s selling prices be closer to those of the
competition if activity-based costing were used?
INTERNET EXERCISE
Activity-based Costing
Go to the companion Web site at www.cengage.com/accounting/vanderbeck
and click on the link to Activity-based costing from Economist.com.4
0 ‘‘Activity-based costing,’’ www.economist.com (viewed 7/12/2009).
LO6
Chapter 4 – Accounting for Factory Overhead 235

Required:
Answer the following questions based on the article:
1. If two activities use the same amount of direct costs, will they also
consume approximately the same amount of overhead costs? Explain
with an example.
2. As new technologies make it easier for firms to customize products,
will activity-based costing become more or less important?
3. Name four activities that ‘‘purchasing’’ could be subdivided into for the
purpose of allocating costs in an activity-based costing system.
4. Has activity-based costing been consistently popular since its intro-
duction in the 1980s?
5. What did Kaplan say were the only two questions that needed to be
answered in applying time-driven activity-based costing?
236 Principles of Cost Accounting

CHAPTER 5
Process Cost Account ing—Genera l Procedures
Fenway Cola, Inc., manufactures 2-liter bottles of a carbonated
beverage in a continuous production manufacturing process.
Fenway’s only in-house financial person is Michael Lowell, a
bookkeeper with limited formal accounting education. To deter-
mine the unit cost per bottle for inventory costing purposes,
Michael adds all of the materials, labor, and overhead costs for
the period, and then divides that total by the number of filled
and unfilled bottles produced.
Davida Ortiz, Vice President–Marketing, uses the unit cost
figures to determine a selling price, and based on her percep-
tions, the cost figures are lower than would be expected, even
with the current efficient manufacturing operations.
Why might the unit cost figures actually be higher than
Michael’s calculations? The answer lies in the computation of
the number of bottles of cola manufactured. The unfilled bottles
should not be given the same weight as the finished bottles in
computing the number of units of production. This chapter
introduces the concept of ‘‘equivalent units of production,’’ an
understanding of which would enable Michael to obtain a more
accurate unit cost per bottle. The Ethics Mini-Case at the end of
this chapter indicates how an incorrect computation of equiva-
lent units of production can affect employee compensation.
C ost accounting provides management with accurate informationabout the cost of manufacturing a product. The type of costaccounting system a business uses depends on the nature of its
manufacturing operations. The preceding chapters focused on the job order
Learning Objectives
After studying this
chapter, you should
be able to:
LO1Recognize the
differences
between job order and
process cost accounting
systems.
LO2Compute unit
costs in a
process cost system.
LO3Assign costs to
inventories,
using equivalent units of
production with the
average cost method.
LO4Prepare a cost of
production sum-
mary and journal entries
for one department with
no beginning inventory.
LO5Prepare a cost
of production
summary and journal en-
tries for one department
with beginning inventory.
LO6Prepare a cost
of production
summary and journal
entries for multiple
departments with no
beginning inventory.
LO7Prepare a cost of
production sum-
mary and journal entries
for multiple departments
with beginning inventory.
LO8Prepare a cost
of production
summary with a change
in the prior department’s
unit transfer cost.

cost system. Chapters 5 and 6 focus on procedures applicable to a processcost system.
Comparison of Basic Cost SystemsAs explained in Chapter 1, a job order cost system is appropriate whendifferentiated products or services are provided on a special-order basis. Aprocess cost system is used when goods or services of a similar nature areprovided.
The focal point of a job order cost system is the job. The costs ofmaterials, labor, and overhead are accumulated for each job and are dividedby the number of units produced to determine the cost per unit. Theprimary objective of job order costing is to determine the cost of producingeach job completed during the period and the cost that has been incurredto date on each unfinished job. Management uses this information forinventory valuation as well as for planning and controlling operations. Thefocus of a process cost system is the cost center to which costs are assigned.It is usually a department, but it could be a process or an operation. Costsaccumulated by a cost center are divided by the number of units producedin that cost center to compute the cost per unit. The primary objectives,like that of the job order cost system, are to compute the unit cost of theproducts completed and the cost to be assigned to the ending work inprocess inventory.
Many of the procedures utilized for job order cost accounting also applyto process cost accounting. The main difference in the two methods isthe manner in which costs are accumulated. Examples of industries andcompanies within industries that would use process costing include: Cloth-ing (Levi Strauss); Beverages (Coca-Cola); Food (General Mills); Petro-leum (ExxonMobil); and Pharmaceuticals (Merck & Co.). The morehomogeneous the products that a firm produces, the more apt it is to useprocess costing. For example, most firms in the food industry and the textileindustry use process costing, whereas furniture and fixtures producers, aswell as makers of computers and machinery, use job order costing becauseof their diversified product lines.
Note that service firms may also use process costing. For example, ifSouthwest Airlines wants to know its cost per passenger mile—the cost tomove one passenger one mile—it would use process costing and divide itssystemwide costs by the total number of passenger miles.
Materials and Labor Costs
Under a job order cost system, the costs of materials and labor, asdetermined from the summaries of materials requisitions and labor-timerecords, are charged to specific jobs or orders. Under a process cost system,the costs of materials and labor are charged directly to the departments inwhich they are incurred. Indirect materials, however, such as custodialsupplies for the factory, and indirect labor, such as the salary of the plant
LO1Recognize the
differences
between job order and
process cost account-
ing systems.
238 Principles of Cost Accounting

manager, that cannot be directly associated with a particular department arecharged to Factory Overhead.
A process cost system requires less clerical effort than a job order costsystem, because costs are charged to a few departments rather than to manyjobs. For example, in a process cost system, detailed labor-time records foran employee who only works in one department are not needed because thecost object (the item that you want to know the cost of) is the individualdepartment where that employee works. By contrast, in a job order costsystem, if a direct laborer works on several different jobs, the total hoursworked must be traced to the individual jobs worked.
Other than these limited differences, the procedures for acquiring,controlling, accounting for, and paying for materials and labor are similarin both systems. At the end of each month, the materials requisitionssummary provides the data for the journal entry debiting Work in Processfor direct materials, debiting Factory Overhead for indirect materials, andcrediting Materials. Similarly, the labor cost summary provides the data forthe journal entry debiting Work in Process for direct labor, debitingFactory Overhead for indirect labor, and crediting Payroll.
Factory Overhead CostsIn a process cost system, overhead costs are accumulated from the variousjournals in the same manner as in a job order cost system. The actual costsfor the period are collected in a general ledger control account to whichpostings are made from the appropriate journals. The control account issupported by a subsidiary ledger, which consists of factory overheadanalysis sheets that show the detailed allocation of costs to the departments.At the end of the month, based on the data reflected in the analysis sheets,the total actual factory overhead is distributed to the departmentalizedoverhead accounts.
Application of Factory Overhead. In a job order cost system, overhead isapplied to the jobs through predetermined rates. The use of predeterminedrates is also common in a process cost system, but overhead is applied todepartments rather than to jobs. As in the job order cost system, theamount of overhead applied is calculated by multiplying the predeterminedrate by the selected allocation base. The base may be direct labor cost,direct labor hours, machine hours, or any other method that will equitablydistribute overhead to the departments in proportion to the benefitreceived. Any under- or overapplied overhead at the end of the period istreated in the same manner as discussed in Chapter 4.
Product Cost in a Process Cost SystemA basic principle established in comparing the two cost systems is that in aprocess cost system, all costs of manufacturing are charged to productiondepartments, either directly or indirectly. The unit cost in each department
LO2Compute unit
costs in a pro-
cess cost system.
Chapter 5 – Process Cost Accounting—General Procedures 239

is calculated by dividing the total cost charged to the department by thenumber of units produced during the period. The total cost of each unitfinished equals the combined unit costs of all departments used in themanufacture of the product.
Nondepartmentalized Factory
When the factory is operated as a single department producing a singleproduct in a continuous output, the process cost system is relatively simple.The costs of operating the factory are summarized at the end of eachaccounting period. Then the total costs incurred are divided by the quantityof units produced to calculate the cost of each unit manufactured during theperiod.
The following cost of production summary illustrates this procedure:
Materials . . . . . . . . . . . . . . . . . . . . . . . . . . . . . . . . . . . . . . . . . . . . . . . . . . . . . . . $ 50,000
Labor . . . . . . . . . . . . . . . . . . . . . . . . . . . . . . . . . . . . . . . . . . . . . . . . . . . . . . . . . . 75,000
Factory overhead . . . . . . . . . . . . . . . . . . . . . . . . . . . . . . . . . . . . . . . . . . . . . . . 35,000
Total cost of production . . . . . . . . . . . . . . . . . . . . . . . . . . . . . . . . . . . . . . . $160,000
Unit output for the period . . . . . . . . . . . . . . . . . . . . . . . . . . . . . . . . . . . . . . . 40,000 units
Unit cost for the period . . . . . . . . . . . . . . . . . . . . . . . . . . . . . . . . . . . . . . . . . . $ 4.00*
*$160,000 � 40,000 units ¼ $4
Departmentalized FactoryGenerally, a company has several production and service departments.Products accumulate costs as they pass through each successive productiondepartment. Departments record costs according to the following proce-dure: (1) the costs of materials, labor, and factory overhead directlyidentifiable with a department, are charged to the department; (2) the costsof the factory service departments, such as maintenance and humanresources, are allocated to the production departments; and (3) the costsadded by prior production departments are carried over to successiveproduction departments. The unit cost within a department is calculated bydividing the total costs by the number of units produced during the period.Figure 5-1 illustrates the accumulation of production costs in two depart-ments for Fenway Cola, a company that makes and bottles a carbonatedbeverage.
Work in Process InventoriesIf there is no work in process at the end of an accounting period, calculatingthe unit cost using a process cost system is a simple procedure: merelydivide the total production cost incurred for the period by the number ofunits produced. Departments, however, often have ending work in process.The calculation of the degree of completion of unfinished work in processpresents one of the biggest challenges in process costing.
LO3Assign costs
to inventories,
using equivalent units
of production with the
average cost method.
240 Principles of Cost Accounting

Normally, a factory will have units in varying stages of completion such as:
1. Units started in a prior period and completed during the currentperiod.
2. Units started and finished during the current period.
3. Units started during the current period but not finished by the endof the period.
Because some materials, labor, and overhead may have been applied to eachof the unfinished units, such charges cannot be ignored in computing theunit costs. Consideration must be given not only to the number of itemsfinished during the period but also the units in process at the beginning andat the end of the period. The primary task is allocating total cost between(1) units finished during the period and (2) units still in process at the endof the period.
Two procedures are commonly used for assigning costs to the inventories:the average cost method and the first-in, first-out (FIFO) method. Theaverage cost method is discussed and illustrated in the remainder of thischapter. Chapter 6 explains the first-in, first-out method.
Under the average cost method, the cost of the work in process at thebeginning of the period is added to the production costs incurred in thecurrent period. Average unit cost for the period is then calculated bydividing the total costs (costs in beginning inventory plus costs added thisperiod) by the total equivalent production. Equivalent production repre-sents the number of whole units that could have been completed during a
Figure 5-1 Production Process and Cost Flows
Plastic bottles,caps, packing
material
Direct laborof bottlers
Indirect materials,Indirect labor, etc.
Carbonated water,Caramel color,
Artificial flavors,Caffeine
Direct laborof assemblyline workers
Indirect materials,Indirect labor,
Depreciation onfactory and
equipment, etc.
Production Costs Assigned to Formulating Department: Production Costs Assigned to Bottling Department:
Materials Requistions
LaborTime Records
FactoryOverheadApplied
Materials Requistions
LaborTime Records
FactoryOverheadApplied
Total Production Costs ÷Liters Produced =Cost per liter in Formulating Department
Transferred-in Costs from Formulating + Production Costs in Bottling =Total Production Costs ÷2-Liter Bottles Produced =Costs per 2-Liter Bottle Transferred to Finished Goods
FENWAYCOLA 2LT
Chapter 5 – Process Cost Accounting—General Procedures 241

period, given the amount of work that was performed. For example, if1,000 units were 50% completed, that would represent the equivalentamount of work to fully complete 500 units. Therefore, calculating equiva-lent production requires that the ending work in process be restated interms of completed units. To illustrate, assume that the production costs ofa department during a given period are as follows:
Materials . . . . . . . . . . . . . . . . . . . . . . . . . . . . . . . . . . . . . . . . . . . . . . . . . . . . . . . . . . . . . . . . . . . $12,000
Labor . . . . . . . . . . . . . . . . . . . . . . . . . . . . . . . . . . . . . . . . . . . . . . . . . . . . . . . . . . . . . . . . . . . . . . 18,000
Factory overhead . . . . . . . . . . . . . . . . . . . . . . . . . . . . . . . . . . . . . . . . . . . . . . . . . . . . . . . . . . . 6,000
Total cost of production . . . . . . . . . . . . . . . . . . . . . . . . . . . . . . . . . . . . . . . . . . . . . . . . . . . . . $36,000
If 18,000 units are produced during the period and no work in processexists either at the beginning or end of the period, the unit cost ofproduction is easily calculated to be $2 ($36,000 � 18,000), and $36,000 ofinventory cost would be transferred to Finished Goods from Work inProcess.
Assume, instead, that the production report for the period shows nobeginning work in process, 17,000 units that were completed during theperiod, and an ending inventory of 2,000 units. The production cost for theperiod, $36,000, must be allocated between the goods completed and thegoods still in process at the end of the period. What portion of the totalproduction cost should be charged to the 17,000 units that were completedduring the period and to the 2,000 units in ending work in process?
If the 2,000 units are almost finished, more cost should be assigned tothem than if they had just been started in process. To make an accuratemeasurement, the stage of completion of the units still in process must beconsidered. Stage of completion represents the fraction or percentage ofmaterials, labor, and overhead costs of a completed unit that has beenapplied to goods that have not been completed by the end of the month.The department manager estimates the stage of completion. The possibilityof error is minimized because the manager usually has the expertise to makereliable estimates. In the event that the product is of a highly technicalnature, the engineering staff can assist in determining the percentage ofcompletion.
At the end of the month, the department manager submits a produc-tion report showing the following:
1. Number of units in the beginning work in process.
2. Number of units completed.
3. Number of units in the ending work in process and their estimatedstage of completion.
Assume that the 2,000 units in the ending work in process inventory areone-half complete. If materials, labor, and overhead are applied evenlythroughout the process, one-half of the total cost for completing 2,000units can be applied to these units. Expressed in another way, the cost to
242 Principles of Cost Accounting

bring these 2,000 units to the halfway point of completion is equivalent tothe cost of fully completing 1,000 units. Therefore, in terms of equivalentproduction, 2,000 units 50% complete equal 1,000 units fully completed.The calculation of equivalent units for the situation described above isillustrated in Figure 5-2.
The cost per equivalent unit, in the previous example, is calculated bydividing the total cost of production by the equivalent units, as shown below.
$36; 000 � 18; 000 ¼ $2 per equivalent unit
Figure 5-2 Calculation of Equivalent Units
December 31, 2010: February 2011:
No Ending Work inProcess or FinishedGoods Inventories
2,000 Unitsin EndingWork in Process,50% Complete, to beCompleted in February
17,000 UnitsCompleted byJanuary 31
1,000 EquivalentUnits of Production
1,000EquivalentUnits of Production(To Be Added to OtherFebruary Production)
18,000Equivalent Unitsof Productionin January
Summary of calculations:
Units finished during the period 17,000
Equivalent units of work in process at the end of the period (2,000 units one-half completed) 1,000
Equivalent production for the period 18,000 units
19,000 Units Startedin Production
+
=
January 2011:
Chapter 5 – Process Cost Accounting—General Procedures 243

The inventory cost at the end of the month can now be calculated asfollows:
Transferred to finished goods (17,000 units at $2) . . . . . . . . . . . . . . . . . . . . . . . . . . . . . $34,000
Work in process (2,000 units � 1/2 � $2) . . . . . . . . . . . . . . . . . . . . . . . . . . . . . . . . . . . . . . 2,000
Total production costs accounted for . . . . . . . . . . . . . . . . . . . . . . . . . . . . . . . . . . . . . . . $36,000
Cost of Production Summary—OneDepartment, No Beginning InventoryIn a process cost system, the reporting of production and related costs ineach department involves the following:
1. Accumulating costs for which the department is accountable.
2. Calculating equivalent production for the period.
3. Computing the unit cost for the period.
4. Summarizing the disposition of the production costs.
These data are reported on a cost of production summary that presentsthe necessary information for inventory valuation and serves as a source forsummary journal entries that are posted to the work in process account foreach department, as illustrated in Figure 5-3. To illustrate a cost ofproduction summary, assume that Cleveland Can Company manufactures
Figure 5-3 Relationship of Cost of Production Summaries to Cost Flows
June 30
1,000 Units inWork in Processat End of Month
43,000 UnitsCompleted byJuly 31
+
=
3,333 EquivalentUnits of Production
1,667 EquivalentUnits of Production(To Be Added to OtherAugust Production)
46,333 EquivalentUnits of Productionin July
5,000 Units inEnding Workin Process,2/3 Completed
July 31 August 31
47,000 Units Standardin Production, with42,000 Completed
LO4Prepare a cost
of production
summary and journal
entries for one depart-
ment with no begin-
ning inventory.
244 Principles of Cost Accounting

aluminum cans on a continuous basis in a single department. The smallfactory, which had no inventory on January 1, places finished goods in stockto be withdrawn as orders are received. At the end of January, the firstmonth of operation for the company, the factory supervisor submits theJanuary production report that appears in Figure 5-4. The estimate ofthe stage of completion indicates that the cans in process at the end of themonth were, on average, one-half completed.
After receiving the production report, the accountant begins thepreparation of the following cost of production summary by collecting theperiod’s production costs from summaries of materials requisitions, payroll,and factory overhead analysis sheets. The units in process are then convertedto equivalent units. The estimate that the 2,000 cans in process are one-halfcompleted means that one-half the total cost of the materials, labor, andfactory overhead needed to produce 2,000 units has been incurred. Theequivalent of 2,000 units in process, one-half completed, is 1,000 completedunits. Therefore, the cost incurred to partially complete 2,000 units isconsidered to be equivalent to the total cost of fully producing 1,000 units.The work required producing 49,000 fully completed units and 2,000 unitsone-half completed is equivalent to the work required to produce 50,000 fullycompleted units, as illustrated in the following cost of production summary:
Cleveland Can CompanyCost of Production Summary
For the Month Ended January 31, 2011
Cost of production for month:
Materials . . . . . . . . . . . . . . . . . . . . . . . . . . . . . . . . . . . . . . . . . . . . . . . . . . . . $ 50,000
Labor . . . . . . . . . . . . . . . . . . . . . . . . . . . . . . . . . . . . . . . . . . . . . . . . . . . . . . . 30,000
Factory overhead . . . . . . . . . . . . . . . . . . . . . . . . . . . . . . . . . . . . . . . . . . . . 20,000
Total costs to be accounted for . . . . . . . . . . . . . . . . . . . . . . . . . . . . $100,000
Figure 5-4 Production Report, January 31
In process, beginning of month
Finished during the month
In process, end of month
Estimated stage of completion of work in process, end of month
For Month Ending
Remarks
Supervisor
none49,000 units2,000 units
1/2
January 31, 2011
PRODUCTION REPORT
R.L.B.
Chapter 5 – Process Cost Accounting—General Procedures 245

Unit output for month:
Finished during month . . . . . . . . . . . . . . . . . . . . . . . . . . . . . . . . . . . . . . . 49,000
Equivalent units of work in process, end of month (2,000 units,one-half completed) . . . . . . . . . . . . . . . . . . . . . . . . . . . . . . . . . . . . . . . . . 1,000
Total equivalent production . . . . . . . . . . . . . . . . . . . . . . . . . . . . . . . . 50,000
Unit cost for month:
Materials ($50,000 � 50,000 units) . . . . . . . . . . . . . . . . . . . . . . . . . . . . $ 1.00
Labor ($30,000 � 50,000 units) . . . . . . . . . . . . . . . . . . . . . . . . . . . . . . . . 0.60
Factory overhead ($20,000 � 50,000 units) . . . . . . . . . . . . . . . . . . . . 0.40
Total . . . . . . . . . . . . . . . . . . . . . . . . . . . . . . . . . . . . . . . . . . . . . . . . . . . . . . $ 2.00
Inventory costs:
Cost of goods finished during month (49,000 � $2) . . . . . . . . . . . . $ 98,000
Cost of work in process, end of month:
Materials (2,000 � 1/2 � $1) . . . . . . . . . . . . . . . . . . . . . . . . . . . . . . . . $1,000
Labor (2,000 � 1/2 � $0.60) . . . . . . . . . . . . . . . . . . . . . . . . . . . . . . . . . 600
Factory overhead (2,000 � 1/2 � $0.40) . . . . . . . . . . . . . . . . . . . . . . 400 2,000
Total production costs accounted for . . . . . . . . . . . . . . . . . . . . . . . . . . . $100,000
At the end of the month, the following journal entries record thefactory operations for January:
Jan. 31 Work in Process . . . . . . . . . . . . . . . . . . . . . . . . . . . . . . . . . . . . . . . . . . . . 50,000
Materials . . . . . . . . . . . . . . . . . . . . . . . . . . . . . . . . . . . . . . . . . . . . . . . . . 50,000
Issued direct materials into production.
Work in Process . . . . . . . . . . . . . . . . . . . . . . . . . . . . . . . . . . . . . . . . . . . . 30,000
Payroll . . . . . . . . . . . . . . . . . . . . . . . . . . . . . . . . . . . . . . . . . . . . . . . . . . . 30,000
Direct labor used in production.
Work in Process . . . . . . . . . . . . . . . . . . . . . . . . . . . . . . . . . . . . . . . . . . . . 20,000
Factory Overhead . . . . . . . . . . . . . . . . . . . . . . . . . . . . . . . . . . . . . . . . . 20,000
Applied factory overhead to production.
Factory Overhead . . . . . . . . . . . . . . . . . . . . . . . . . . . . . . . . . . . . . . . . . 20,000
Various Accounts (Accumulated Depreciation, PrepaidInsurance, Accrued Taxes, Accounts Payable) . . . . . . . . . . . . 20,000
Recorded actual factory overhead for the period. (Note that, for the ease ofillustration, there is no under- or overapplied overhead and a single account,Factory Overhead, is used to record both actual [debit] and applied [credit]overhead.)
After preparing the cost of production summary, the accountant canmake the following entry for the cost of the goods completed during theperiod:
Jan. 31 Finished Goods . . . . . . . . . . . . . . . . . . . . . . . . . . . . . . . . . . . . . . . . . . 98,000
Work in Process . . . . . . . . . . . . . . . . . . . . . . . . . . . . . . . . . . . . . . . . 98,000
After posting these entries, the work in process account has a debitbalance of $2,000, representing the cost of the work in process on January31, shown as follows:
246 Principles of Cost Accounting

Work in Process
Jan. 31 50,000 Jan. 31 98,000
30,000
20,000
100,000
2,000
The January statement of the cost of goods manufactured can now beprepared as follows:
Cleveland Can CompanyStatement of Cost of Goods Manufactured
For the Month Ended January 31, 2011
Materials . . . . . . . . . . . . . . . . . . . . . . . . . . . . . . . . . . . . . . . . . . . . . . . . . . . . . . . . . . . . $ 50,000
Labor . . . . . . . . . . . . . . . . . . . . . . . . . . . . . . . . . . . . . . . . . . . . . . . . . . . . . . . . . . . . . . . 30,000
Factory overhead . . . . . . . . . . . . . . . . . . . . . . . . . . . . . . . . . . . . . . . . . . . . . . . . . . . . 20,000
Total . . . . . . . . . . . . . . . . . . . . . . . . . . . . . . . . . . . . . . . . . . . . . . . . . . . . . . . . . . . . . . . . $100,000
Less work in process inventory, January 31 . . . . . . . . . . . . . . . . . . . . . . . . . 2,000
Cost of goods manufactured during the month . . . . . . . . . . . . . . . . . . . . . . . . $ 98,000
Cost of Production Summary—OneDepartment, Beginning InventoryAt the end of February, the second month of operations for Cleveland CanCompany, the factory supervisor submits the February production reportshown in Figure 5-5. The cost of production summary for February,assuming materials, labor, and factory overhead costs of $70,000, $42,000,and $28,000 respectively, is prepared as follows:
Cleveland Can CompanyCost of Production Summary
For the Month Ended February 28, 2011
Cost of work in process, beginning of month:*
Materials . . . . . . . . . . . . . . . . . . . . . . . . . . . . . . . . . . . . . . . . . . . . . . . . . $ 1,000
Labor . . . . . . . . . . . . . . . . . . . . . . . . . . . . . . . . . . . . . . . . . . . . . . . . . . . . 600
Factory overhead . . . . . . . . . . . . . . . . . . . . . . . . . . . . . . . . . . . . . . . . . 400 $ 2,000
Cost of production for month:
Materials . . . . . . . . . . . . . . . . . . . . . . . . . . . . . . . . . . . . . . . . . . . . . . . . . $70,000
Labor . . . . . . . . . . . . . . . . . . . . . . . . . . . . . . . . . . . . . . . . . . . . . . . . . . . . 42,000
Factory overhead . . . . . . . . . . . . . . . . . . . . . . . . . . . . . . . . . . . . . . . . . 28,000 140,000
Total costs to be accounted for . . . . . . . . . . . . . . . . . . . . . . . . . . $142,000
Unit output for month:
Finished during month . . . . . . . . . . . . . . . . . . . . . . . . . . . . . . . . . . . . 69,000
Equivalent units of work in process, end of month (6,000units, one-third completed) . . . . . . . . . . . . . . . . . . . . . . . . . . . . . . . . 2,000
Total equivalent production . . . . . . . . . . . . . . . . . . . . . . . . . . . . . 71,000
LO5Prepare a cost
of production
summary and journal
entries for one depart-
ment with beginning
inventory.
Chapter 5 – Process Cost Accounting—General Procedures 247

Unit cost for month:
Materials [($1,000 þ $70,000) � 71,000] . . . . . . . . . . . . . . . . . . . . $ 1.00
Labor [($600 þ $42,000) � 71,000] . . . . . . . . . . . . . . . . . . . . . . . . . 0.60
Factory overhead [($400 þ $28,000) � 71,000] . . . . . . . . . . . . . . 0.40
Total . . . . . . . . . . . . . . . . . . . . . . . . . . . . . . . . . . . . . . . . . . . . . . . . . . . $ 2.00
Inventory costs:
Cost of goods finished during month (69,000 � $2) . . . . . . . . . $138,000
Cost of work in process, end of month:
Materials (6,000 � 1/3 � $1) . . . . . . . . . . . . . . . . . . . . . . . . . . . . . $ 2,000
Labor (6,000 � 1/3 � $0.60) . . . . . . . . . . . . . . . . . . . . . . . . . . . . . . 1,200
Factory overhead (6,000 � 1/3 � $0.40) . . . . . . . . . . . . . . . . . . . 800 4,000
Total production costs accounted for . . . . . . . . . . . . . . . . . . . . . . . . $142,000
*The beginning inventory in February was the ending work in process inventory for themonth of January.
All costs incurred or assigned must be accounted for. Therefore, the costof the ending work in process in January, which is the beginning inventory inFebruary, is added to the total costs incurred during the month of February.The calculation of unit output for the month includes the units finishedduring the month and the equivalent units in process at the end of the currentmonth. The calculation of equivalent units is illustrated in Figure 5-6. Thefact that one-half of the work had been completed on 2,000 units in theprior month does not have to be considered separately in this calculationbecause the dollar cost of that work is added to the current month’s costsfor the purpose of calculating unit costs. This procedure is the identifyingcharacteristic of the average costing method for process costing.
From the data developed on the cost of production summary, thefollowing entry can now be made for the cost of the goods completedduring the period:
Work in Process
Jan. 31 50,000 Jan. 31 98,000
30,000
20,000
100,000
2,000
Figure 5-5 Production Report, February 28
In process, beginning of month
Finished during the month
In process, end of month
Estimated stage of completion of work in process, end of month
For Month Ending
2,000 units69,000 units6,000 units
1/3
February 28, 2011PRODUCTION REPORT
248 Principles of Cost Accounting

Work in Process
Feb. 28 70,000 Feb. 28 138,000
42,000
28,000
240,000 236,000
4,000
After posting this entry and the entries for the month’s productioncosts, the work in process account has a debit balance of $4,000, as shown:
Feb. 28 Finished Goods . . . . . . . . . . . . . . . 138,000
Work in Process . . . . . . . . . . . . 138,000
The following statement of the cost of goods manufactured can now beprepared:
Cleveland Can CompanyStatement of Cost of Goods Manufactured
For the Month Ended February 28, 2011
Materials . . . . . . . . . . . . . . . . . . . . . . . . . . . . . . . . . . . . . . . . . . . . . . . . . . . . . . . . . . . . $ 70,000
Labor . . . . . . . . . . . . . . . . . . . . . . . . . . . . . . . . . . . . . . . . . . . . . . . . . . . . . . . . . . . . . . . 42,000
Factory overhead . . . . . . . . . . . . . . . . . . . . . . . . . . . . . . . . . . . . . . . . . . . . . . . . . . . . 28,000
Figure 5-6 Calculation of Equivalent Units with Beginning Work in Process
69,000 UnitsCompleted byFebruary 29
2,000 EquivalentUnits of Production
4,000 Equivalent Unitsof Production (To BeAdded to Other MarchProduction)
71,000 EquivalentUnits of Productionin February
March 2011
+
=
73,000 Units Started inProduction, with 67,000of Them Completed
February 2011January 31, 2011
2,000 Units in Workin Process at Endof Month
6,000 Units in EndingWork in Process,1/3 Completed
Chapter 5 – Process Cost Accounting—General Procedures 249

Total . . . . . . . . . . . . . . . . . . . . . . . . . . . . . . . . . . . . . . . . . . . . . . . . . . . . . . . . . . . . . . . . $140,000
Add work in process inventory, February 1 . . . . . . . . . . . . . . . . . . . . . . . . . . 2,000
Total . . . . . . . . . . . . . . . . . . . . . . . . . . . . . . . . . . . . . . . . . . . . . . . . . . . . . . . . . . . . $142,000
Less work in process inventory, February 28 . . . . . . . . . . . . . . . . . . . . . . . . . 4,000
Cost of goods manufactured during the month . . . . . . . . . . . . . . . . . . . . . . . . $138,000
Cost of Production Summary—MultipleDepartments, No Beginning Inventory
The business of Cleveland Can Company continued to grow until manage-ment decided to departmentalize the factory and reorganize the costrecords. Accordingly, on January 1 of the following year, the factory wasdivided into three departments as follows:
Blanking
Forming
Finishing
Materials are placed into production in the Blanking Department, wheredirect labor and factory overhead are added before transfer to the FormingDepartment. More materials are added in Forming, and additional proces-sing costs are incurred before transfer to Finishing. In the Finishing Depart-ment, coatings are added to the cans before they emerge as finished goods.
Separate control accounts are maintained in the general ledger torecord the costs of operating each department. Departmental expenseanalysis sheets are used to record the manufacturing expenses incurred.Production reports are prepared for each department for January. Thereare no beginning inventories of work in process in any department. Theproduction report for Blanking is shown in Figure 5-7.
After receiving the production report from the manager of Blanking,the accountant prepares the following cost of production summary. Journal
LO0Prepare a cost
of production
summary and journal
entries for multiple de-
partments with no be-
ginning inventory.
Recall and Review 1
Xanadu Company had 400 units in Work in Process at the beginning of the
month. During the month, 14,600 units were started in production, 13,400 of
which, along with the beginning work in process, were completed by the
end of the month. The uncompleted units were in ending inventory, one-
fourth complete. The equivalent units of production for the month were
______________.
(After working this exercise, see page 269 for the solution.)
You should now be able to work the following:
Questions 1–11; Exercises 5-1 to 5-6; Problems 5-1 to 5-3; Self-Study
Problem 1; and the Mini-Case (Ethics).
250 Principles of Cost Accounting

entries are then made from the cost of production summary to record theoperations of the department and to transfer costs to Forming.
Cleveland Can CompanyCost of Production Summary—BlankingFor the Month Ended January 31, 2012
Cost of production for month:
Materials . . . . . . . . . . . . . . . . . . . . . . . . . . . . . . . . . . . . . . . . . . . . . $160,000
Labor . . . . . . . . . . . . . . . . . . . . . . . . . . . . . . . . . . . . . . . . . . . . . . . . 86,400
Factory overhead . . . . . . . . . . . . . . . . . . . . . . . . . . . . . . . . . . . . . 73,600
Total costs to be accounted for . . . . . . . . . . . . . . . . . . . . . . $320,000
Unit output for month:
Finished and transferred to Forming during month . . . . . 27,000
Equivalent units of work in process, end of month(10,000 units, one-half completed) . . . . . . . . . . . . . . . . . . . . . 5,000
Total equivalent production . . . . . . . . . . . . . . . . . . . . . . . . . 32,000
Unit cost for month:
Materials ($160,000 � 32,000 units) . . . . . . . . . . . . . . . . . . . . $ 5.00
Labor ($86,400 � 32,000 units) . . . . . . . . . . . . . . . . . . . . . . . . . 2.70
Factory overhead ($73,600 � 32,000 units) . . . . . . . . . . . . . . 2.30
Total . . . . . . . . . . . . . . . . . . . . . . . . . . . . . . . . . . . . . . . . . . . . . . . $ 10.00
Inventory costs:
Cost of goods finished and transferred to Forming duringmonth (27,000 � $10.00) . . . . . . . . . . . . . . . . . . . . . . . . . . . . . . . $270,000
Cost of work in process, end of month:
Materials (10,000 � 1/2 � $5.00) . . . . . . . . . . . . . . . . . . . . . $25,000
Labor (10,000 � 1/2 � $2.70) . . . . . . . . . . . . . . . . . . . . . . . . . 13,500
Factory overhead (10,000 � 1/2 � $2.30) . . . . . . . . . . . . . . 11,500 50,000
Total production costs accounted for . . . . . . . . . . . . . . . . . . . . $320,000
Figure 5-7 Production Report, Blanking
In process, beginning of period
Stage of completion
Placed in process during period
Received from dept.
Transferred to dept.
Transferred to stockroom during period
In process, end of period
Stage of completion
For Month Ending
Dept.
none
37,000 units
27,000 unitsnone
10,000 units1/2
January 31, 2012
Blanking
PRODUCTION REPORT
during period
during periodForming
Chapter 5 – Process Cost Accounting—General Procedures 251

Note that the costs accumulated in the department are transferred tothe next department along with the units completed during the period.Thus, costs follow the flow of goods through the process.
After posting the usual end-of-month entries, the work in processaccount for Blanking has a debit balance of $50,000, as shown below. Thebalance represents the cost of the partially completed ending inventory of10,000 units.
Work in Process—Blanking
Jan. 31 160,000 Jan. 31 270,000
86,400
73,600
50,000 320,000
The only difference in procedure between this example and the one fora single-department factory is that the goods completed in Blanking aretransferred to Forming for further processing rather than being transferredto the stockroom as finished goods.
The production report for Forming is shown in Figure 5-8. Note thatas the goods flow through the manufacturing process, the units transferredto Forming and their related costs are treated as completed products inBlanking, but they are considered to be raw materials that will be added atthe beginning of the processing operation in Forming. The transferred costof the units includes the costs of materials, labor, and factory overheadincurred in Blanking. The individual cost elements, however, are combinedand transferred in total to Forming.
In reviewing the cost of production summary for Forming, note thatthe calculation of unit cost for the month in Forming takes into considera-tion only those costs incurred for materials, labor, and factory overhead
Figure 5-8 Production Report, Forming
In process, beginning of period
Stage of completion
Placed in process during period
Received from dept.
Transferred to dept.
Transferred to stockroom during period
In process, end of period
Stage of completion
For Month Ending
Dept.
none
none27,000 units22,000 units
none5,000 units
2/5
January 31, 2012
Forming
PRODUCTION REPORT
during period
during period
BlankingFinishing
252 Principles of Cost Accounting

during the month and the equivalent units produced in the department.The transferred-in costs and units from the prior department are notincluded in the computations. In determining the cost transferred toFinishing, however, the prior department costs, along with Forming’sproduction costs, must be considered. Also, in calculating the ending workin process valuation, the full cost of $10 per unit from Blanking is attachedto the 5,000 units still in process in Forming. The transferred-in units havebeen fully completed by Blanking, while only a fraction of the cost ofadditional work performed by Forming, based on the stage of completion,is considered.
Cleveland Can CompanyCost of Production Summary—FormingFor the Month Ended January 31, 2012
Cost of goods received from Blanking during month(27,000 units � $10.00) . . . . . . . . . . . . . . . . . . . . . . . . . . . . . . . . . . . . . . . . . $270,000
Cost of production for month—Forming:
Materials . . . . . . . . . . . . . . . . . . . . . . . . . . . . . . . . . . . . . . . . . . . . . . . . . . . . . . $ 12,000
Labor . . . . . . . . . . . . . . . . . . . . . . . . . . . . . . . . . . . . . . . . . . . . . . . . . . . . . . . . . 30,000
Factory overhead . . . . . . . . . . . . . . . . . . . . . . . . . . . . . . . . . . . . . . . . . . . . . . 18,000 60,000
Total costs to be accounted for . . . . . . . . . . . . . . . . . . . . . . . . . . . . . . . $330,000
Unit output for month:
Finished and transferred to Finishing during month . . . . . . . . . . . . . . 22,000
Equivalent units of work in process, end of month(5,000 units, two-fifths completed) . . . . . . . . . . . . . . . . . . . . . . . . . . . . 2,000
Total equivalent production . . . . . . . . . . . . . . . . . . . . . . . . . . . . . . . . . . 24,000
Unit cost for month—Forming:
Materials ($12,000 � 24,000 units) . . . . . . . . . . . . . . . . . . . . . . . . . . . . . . . $ 0.50
Labor ($30,000 � 24,000 units) . . . . . . . . . . . . . . . . . . . . . . . . . . . . . . . . . . 1.25
Factory overhead ($18,000 � 24,000 units) . . . . . . . . . . . . . . . . . . . . . . . 0.75
Total . . . . . . . . . . . . . . . . . . . . . . . . . . . . . . . . . . . . . . . . . . . . . . . . . . . . . . . . $ 2.50
Inventory costs:
Cost of goods finished and transferred to Finishing during month:
Cost in Blanking (22,000 � $10.00) . . . . . . . . . . . . . . . . . . . . . . . . . . . . $220,000
Cost in Forming (22,000 � 2.50) . . . . . . . . . . . . . . . . . . . . . . . . . . . . . . . 55,000 275,000
Cost of work in process, end of month:
Cost in Blanking (5,000 � $10.00) . . . . . . . . . . . . . . . . . . . . . . . . . . . . . $ 50,000
Cost in Forming:
Materials (5,000 � 2/5 � $0.50) . . . . . . . . . . . . . . . . . $1,000
Labor (5,000 � 2/5 � $1.25) . . . . . . . . . . . . . . . . . . . . 2,500
Factory overhead (5,000 � 2/5 � $0.75) . . . . . . . . . 1,500 5,000 55,000
Total production costs accounted for . . . . . . . . . . . . . . . . $330,000
After posting the end-of-month entries, the work in process account forForming has a debit balance of $55,000, as shown on the following page.
Chapter 5 – Process Cost Accounting—General Procedures 253

Work in Process—Forming
Jan. 31 12,000 Jan. 31 275,000
30,000
18,000
270,000
55,000 330,000
The production report for Finishing is shown in Figure 5-9. The costof production summary for Finishing, shown below, is prepared in amanner similar to the Forming summary. Note that the inventory costssection of the report shows the cost of goods finished and transferred to finishedgoods during the month. The $16.50 unit cost of goods finished andtransferred represents the total unit cost of the goods through all of thedepartments. The detailed unit cost of completed goods, department bydepartment, shows the accumulation of the total unit cost.
Cleveland Can CompanyCost of Production Summary—Finishing
For the Month Ended January 31, 2012
Cost of goods received from Forming during month (22,000 units � $12.50) $275,000
Cost of production for month—Finishing:
Materials . . . . . . . . . . . . . . . . . . . . . . . . . . . . . . . . . . . . . . . . . . . . . . . . . . . . . $31,500
Labor . . . . . . . . . . . . . . . . . . . . . . . . . . . . . . . . . . . . . . . . . . . . . . . . . . . . . . . . 23,100
Factory overhead . . . . . . . . . . . . . . . . . . . . . . . . . . . . . . . . . . . . . . . . . . . . . 29,400 84,000
Total costs to be accounted for . . . . . . . . . . . . . . . . . . . . . . . . . . . . . . $359,000
Unit output for month:
Finished and transferred to finished goods during month . . . . . . . 20,000
Equivalent units of work in process, end of month(2,000 units, one-half completed) . . . . . . . . . . . . . . . . . . . . . . . . . . . . 1,000
Total equivalent production . . . . . . . . . . . . . . . . . . . . . . . . . . . . . . . . . 21,000
Figure 5-9 Production Report, Finishing
In process, beginning of period
Stage of completion
Placed in process during period
Received from dept.
Transferred to dept.
Transferred to stockroom during period
In process, end of period
Stage of completion
For Month Ending
Dept.
none
none22,000 units
20,000 units2,000 units
1/2
January 31, 2011
Finishing
PRODUCTION REPORT
during period
during period
Forming
254 Principles of Cost Accounting

Unit cost for month—Finishing:
Materials ($31,500 � 21,000 units) . . . . . . . . . . . . . . . . . . . . . . . . . . . . . $ 1.50
Labor ($23,100 � 21,000 units) . . . . . . . . . . . . . . . . . . . . . . . . . . . . . . . . . 1.10
Factory overhead ($29,400 � 21,000 units) . . . . . . . . . . . . . . . . . . . . . 1.40
Total . . . . . . . . . . . . . . . . . . . . . . . . . . . . . . . . . . . . . . . . . . . . . . . . . . . . . . . $ 4.00
Inventory costs:
Cost of goods finished and transferred to finished goods during month:
Cost in Blanking (20,000 � $10.00) . . . . . . . . . . . . . . . . . . . . . . . . . . . $200,000
Cost in Forming (20,000 � $2.50) . . . . . . . . . . . . . . . . . . . . . . . . . . . . 50,000
Cost in Finishing (20,000 � $4.00) . . . . . . . . . . . . . . . . . . . . . . . . . . . . 80,000
(20,000 � $16.50) . . . . . . . . . . . . . . . . . . . . . . . . . . $330,000
Cost of work in process, end of month:
Cost in Blanking (2,000 � $10.00) . . . . . . . . . . . . . . . . . . . . . . . . . . . . $20,000
Cost in Forming (2,000 � $2.50) . . . . . . . . . . . . . . . . . . . . . . . . . . . . . 5,000
Cost in Finishing:
Materials (2,000 � 1/2 � $1.50) . . . . . . . . . . . . . . . $1,500
Labor (2,000 � 1/2 � $1.10) . . . . . . . . . . . . . . . . . . . 1,100
Factory overhead (2,000 � 1/2 � $1.40) . . . . . . . . 1,400 4,000 29,000
Total production costs accounted for . . . . . . . . . . . . . . . $359,000
After posting the end-of-month entries, the work in process account forFinishing has a debit balance of $29,000.
Work in Process—Finishing
Jan. 31 31,500 Jan. 31 330,000
23,100
29,400
275,000
359,000
29,000
As a means of classifying and summarizing the factory operations forJanuary, the ‘‘Summary’’ portion of the work sheet in Figure 5-10 providesthe information for the following statement of cost of goods manufactured:
Cleveland Can CompanyStatement of Cost of Goods Manufactured
For the Month Ended January 31, 2012
Materials . . . . . . . . . . . . . . . . . . . . . . . . . . . . . . . . . . . . . . . . . . . . . . . . . . . . . . . . . . . . . . $203,500
Labor . . . . . . . . . . . . . . . . . . . . . . . . . . . . . . . . . . . . . . . . . . . . . . . . . . . . . . . . . . . . . . . . . . 139,500
Factory overhead . . . . . . . . . . . . . . . . . . . . . . . . . . . . . . . . . . . . . . . . . . . . . . . . . . . . . . . 121,000
Total . . . . . . . . . . . . . . . . . . . . . . . . . . . . . . . . . . . . . . . . . . . . . . . . . . . . . . . . . . . . . . . . . . . $464,000
Less work in process inventories, January 31 . . . . . . . . . . . . . . . . . . . . . . . . . . 134,000
Cost of goods manufactured during the month . . . . . . . . . . . . . . . . . . . . . . . . . . . $330,000
Chapter 5 – Process Cost Accounting—General Procedures 255

Figure 5-10 Work Sheet, January 31
1
2
3
4
5
6
7
8
9
10
11
12
13
14
15
16
17
18
19
20
21
22
23
24
25
26
27
28
29
30
31
32
33
34
35
36
37
38
39
40
41
42
43
44
45
46
47
48
49
50
51
52
53
54
55
56
57
58
59
60
A B C D E F
Blanking:
Started in process....................................... 37,000
Costs for month:
Materials.............................................. $160,000
Labor................................................... 86,400
Factory overhead ................................ 73,600
Finished and transferred to Forming ........ $10.00 27,000 $270,000
Closing work in process ............................ 10,000 50,000
Total..................................................... 37,000 37,000 $320,000 $320,000
Forming:
Received during month from Blanking..... 27,000 $270,000
Costs added during month:
Materials.............................................. 0.50 12,000
Labor.................................................... 1.25 30,000
Factory overhead ................................ 0.75 18,000
Finished and transferred to Finishing ....... $12.50 22,000 $275,000
Closing work in process ............................. 5,000 55,000
Total...................................................... 27,000 27,000 $330,000 $330,000
Finishing:
Received during month from Forming...... 22,000 $275,000
Costs added during month:
Materials.............................................. 1.50 31,500
Labor.................................................... 1.10 23,100
Factory overhead ................................ 1.40 29,400
Finished and transferred to stock .............. $16.50 20,000 $330,000
Closing work in process ............................. 2,000 29,000
Total...................................................... 22,000 22,000 $359,000 $359,000
Amount Total
Summary:
Materials:
Blanking ............................................... $160,000
Forming ................................................ 12,000
Finishing............................................... 31,500 $203,500
Labor:
Blanking ............................................... $86,400
Forming ................................................ 30,000
Finishing............................................... 23,100 139,500
Factory overhead:
Blanking ............................................... $73,600
Forming ................................................ 18,000
Finishing............................................... 29,400 121,000
Total production costs for January ............ $464,000
Deduct work in process inventory, end of month:
Blanking ............................................... $50,000
Forming ................................................ 55,000
Finishing............................................... 29,000 134,000
Costs of production, goods fully
manufactured during January ........... $330,000
Units
received in
department
Amount
charged to
department
Amount
credited to
department
Units
transferred
or on hand
Cleveland Can Company
Departmental Cost Work Sheet
For the Month Ended January 31, 2012
Analysis
Cost
per unit
transferred
256 Principles of Cost Accounting

At the end of the month, the following journal entries are made:
Jan. 31 Work in Process—Blanking . . . . . . . . . . . . . . 160,000
Work in Process—Forming . . . . . . . . . . . . . . . 12,000
Work in Process—Finishing . . . . . . . . . . . . . . 31,500
Factory Overhead* . . . . . . . . . . . . . . . . . . . . . . 10,000
Materials . . . . . . . . . . . . . . . . . . . . . . . . . . . . . 213,500
*The amount charged to Factory Overhead for the actual amount of indirect materials is anarbitrary amount chosen for this example to illustrate how the costs are collected anddistributed. This amount represents the cost of various supplies issued that could not becharged directly to a department as direct materials.
Jan. 31 Work in Process—Blanking . . . . . . . . . . . . . . 86,400
Work in Process—Forming . . . . . . . . . . . . . . . 30,000
Work in Process—Finishing . . . . . . . . . . . . . . 23,100
Factory Overhead** . . . . . . . . . . . . . . . . . . . . . 15,000
Payroll . . . . . . . . . . . . . . . . . . . . . . . . . . . . . . . . 154,500
**Again, the amount charged to the factory overhead control account is an arbitrary amountchosen to illustrate payroll costs, such as the plant manager’s salary, that could not becharged directly to any given department as direct labor.
Jan. 31 Work in Process—Blanking . . . . . . . . . . . . . . 73,600
Work in Process—Forming . . . . . . . . . . . . . . . 18,000
Work in Process—Finishing . . . . . . . . . . . . . . 29,400
Factory Overhead—Blanking . . . . . . . . . . . 73,600
Factory Overhead—Forming . . . . . . . . . . . 18,000
Factory Overhead—Finishing . . . . . . . . . . 29,400
Note that for ease of illustration, a single factory overhead account is used for eachdepartment, with applied overhead recorded as a credit and actual overhead as a debit.
The previous entry charges the applied factory overhead appearing onthe cost of production summaries to the work in process control accounts.The amounts are calculated by multiplying a predetermined overheadapplication rate by the base used for applying overhead to each department,such as labor hours or machine hours. A different base might be used fordifferent departments, so that overhead would be equitably applied accord-ing to the benefit each department has received.
Jan. 31 Factory Overhead . . . . . . . . . . . . . . . . . . . . . . . . . . . . 90,000
Various Accounts (Accumulated Depreciation,Prepaid Insurance, Payroll Taxes) . . . . . . . . . . . . 90,000
The previous entry summarizes several entries made in the generaljournal to reflect the actual amount of the current month’s provision fordepreciation, insurance, payroll taxes, and other factory overhead expenses.
Jan. 31 Factory Overhead—Blanking . . . . . . . . . . . . . 66,000
Factory Overhead—Forming . . . . . . . . . . . . . 21,000
Factory Overhead—Finishing . . . . . . . . . . . . 28,000
Factory Overhead . . . . . . . . . . . . . . . . . . . . . 115,000
The previous entry distributes the actual overhead for the period to thedepartments. The basis for this entry would be the factory overhead analysis
Chapter 5 – Process Cost Accounting—General Procedures 257

sheets, which show in detail the allocation or apportionment of the actualexpenses to the various departments based on usage. Note that these actualamounts do not appear on the cost of production summaries, which containthe estimated amounts of factory overhead applied to production. Also notethat the credit to Factory Overhead (see previous page) consists of thepreviously mentioned $10,000 of indirect materials and $15,000 of indirectlabor, as well as the other factory overhead of $90,000.
The cost of production summary is used to develop the entries torecord the transfer of costs from one department to another and to FinishedGoods, as follows:
Jan. 31 Work in Process—Forming . . . . . . . . . . . . . . . . . . . . 270,000
Work in Process—Blanking . . . . . . . . . . . . . . . . . 270,000
31 Work in Process—Finishing . . . . . . . . . . . . . . . . . . . 275,000
Work in Process—Forming . . . . . . . . . . . . . . . . . . 275,000
31 Finished Goods . . . . . . . . . . . . . . . . . . . . . . . . . . . . . . 330,000
Work in Process—Finishing . . . . . . . . . . . . . . . . . 330,000
These journal entries are reflected in the following T-accounts. Thebalances remaining in the work in process accounts are reflected in total onthe statement of cost of goods manufactured. The balances in the depart-mental factory overhead accounts represent under- or overapplied overheadand would usually be carried forward to future months. However, thesebalances can be transferred to an under- and overapplied factory overheadaccount. As discussed in previous chapters, these amounts of under- andoverapplied overhead would be analyzed to determine whether they areexpected normal seasonal variances, or whether they represent inefficienciesthat should be corrected.
Work in Process—Blanking Work in Process—Forming
Jan. 31 160,000 Jan. 31 270,000 Jan. 31 12,000 Jan. 31 275,000
86,400 30,000
73,600 18,000
320,000 270,000
50,000 330,000
55,000
Work in Process—Finishing Finished Goods
Jan. 31 31,500 Jan. 31 330,000 Jan. 31 330,000
23,100
29,400
275,000
359,000
29,000
258 Principles of Cost Accounting
Factory Overhead Materials
Jan. 31 10,000 Jan. 31 115,000 xxx Jan. 31 213,500
15,000
90,000 Payroll
115,000 xxx Jan. 31 154,500
Factory Overhead—Blanking Factory Overhead—Forming
Jan. 31 66,000 Jan. 31 73,600 Jan. 31 21,000 Jan. 31 18,000
7,600 3,000
Factory Overhead—Finishing
Jan. 31 28,000 Jan. 31 29,400
1,400
Cost of Production Summary—MultipleDepartments, Beginning InventoryThe February production reports submitted by the department supervisorsfor Cleveland Can Company differ from the January production reports.There are now inventories for work in process in each department at thebeginning of the month. After receiving the production reports for Febru-ary, the accountant prepares a cost of production summary for eachdepartment and makes entries to record the operations of each departmentin the general ledger accounts.
The February production report for Blanking is shown in Figure 5-11.Note that the number of units in process at the beginning of the period plusthe units placed in process or received from another department during the
Recall and Review 2
Without dollar amounts, list the account(s) debited and credited for each of
the following types of transactions:
1. Issuance of raw materials and supplies to the factory.________
2. Incurrence of direct and indirect factory labor costs.________
3. Distribution of actual factory overhead costs to individual departments.________
4. Application of factory overhead to individual departments.________
(After working this exercise, see page 269 for the solution.)
You should now be able to work the following:
Questions 12–14; Exercises 5-7 to 5-9; and Problems 5-4 to 5-6.
LO6Prepare a cost
of production
summary and journal
entries for multiple de-
partments with begin-
ning inventory.
Chapter 5 – Process Cost Accounting—General Procedures 259

period equal the total number of units to be accounted for by thedepartment.
In the following cost of production summary for Blanking, the unit costis determined by adding the cost of beginning work in process from theprior month to the total costs incurred during the current month anddividing by the equivalent units. The prior month’s cost of materials isadded to the current month’s cost of materials, and the total materials costis divided by the equivalent production for materials. The same procedureis followed for labor and factory overhead. The calculation of unit outputfor the month takes into consideration all units finished during the month,including those in process at the beginning of the month, plus those unitsthat are still in process at the end of the period.
Cleveland Can CompanyCost of Production Summary—BlankingFor the Month Ended February 28, 2012
Cost of work in process, beginning of month:
Materials . . . . . . . . . . . . . . . . . . . . . . . . . . . . . . . . . . . . . . . . . . . . . . . . . . . . . $ 25,000
Labor . . . . . . . . . . . . . . . . . . . . . . . . . . . . . . . . . . . . . . . . . . . . . . . . . . . . . . . . 13,500
Factory overhead . . . . . . . . . . . . . . . . . . . . . . . . . . . . . . . . . . . . . . . . . . . . . 11,500 $ 50,000
Cost of production for month:
Materials . . . . . . . . . . . . . . . . . . . . . . . . . . . . . . . . . . . . . . . . . . . . . . . . . . . . . $190,000
Labor . . . . . . . . . . . . . . . . . . . . . . . . . . . . . . . . . . . . . . . . . . . . . . . . . . . . . . . . 102,600
Factory overhead . . . . . . . . . . . . . . . . . . . . . . . . . . . . . . . . . . . . . . . . . . . . . 87,400 380,000
Total costs to be accounted for . . . . . . . . . . . . . . . . . . . . . . . . . . . . . . $430,000
Unit output for month:
Finished and transferred to Forming during month . . . . . . . . . . . . . 39,000
Equivalent units of work in process, end of month(5,000 units, four-fifths completed) . . . . . . . . . . . . . . . . . . . . . . . . . . 4,000
Total equivalent production . . . . . . . . . . . . . . . . . . . . . . . . . . . . . . . . . 43,000
Figure 5-11 Production Report, Blanking, February 28
In process, beginning of period
Stage of completion
Placed in process during period
Received from dept.
Transferred to dept.
Transferred to stockroom during period
In process, end of period
Stage of completion
For Month Ending
Dept.
10,000 units1/2
34,000 unitsnone
39,000 unitsnone
5,000 units4/5
February 28, 2012
Blanking
PRODUCTION REPORT
during period
during periodForming
260 Principles of Cost Accounting

Unit cost for month:
Materials [($25,000 þ $190,000) � 43,000] . . . . . . . . . . . . . . . . . . . . . . $ 5.00
Labor [($13,500 þ $102,600) � 43,000] . . . . . . . . . . . . . . . . . . . . . . . . . 2.70
Factory overhead [($11,500 þ $87,400) � 43,000] . . . . . . . . . . . . . . . 2.30
Total . . . . . . . . . . . . . . . . . . . . . . . . . . . . . . . . . . . . . . . . . . . . . . . . . . . . . . . $ 10.00
Inventory costs:
Cost of goods finished and transferred to Forming during month(39,000 � $10.00) . . . . . . . . . . . . . . . . . . . . . . . . . . . . . . . . . . . . . . . . . . . $390,000
Cost of work in process, end of month:
Materials (5,000 � 4/5 � $5.00) . . . . . . . . . . . . . . . . . . . . . . . . . . . . . . $ 20,000
Labor (5,000 � 4/5 � $2.70) . . . . . . . . . . . . . . . . . . . . . . . . . . . . . . . . . . 10,800
Factory overhead (5,000 � 4/5 � $2.30) . . . . . . . . . . . . . . . . . . . . . . . 9,200 40,000
Total production costs accounted for . . . . . . . . . . . . . . . . . . . . . . . . . . . . $430,000
At this time, the following journal entry can be made:Feb. 28 Work in Process—Forming . . . . . . . . . . . . . . . 390,000
Work in Process—Blanking . . . . . . . . . . . . 390,000
The work in process account for Blanking now appears as follows:Work in Process—Blanking
Jan. 31 160,000 Jan. 31 270,000
86,400
73,600
320,000
50,000
Feb. 28 190,000 Feb. 28 390,000
102,600
87,400
700,000 660,000
40,000
The February production report for Forming is shown in Figure 5-12.
Figure 5-12 Production Report, Forming, February 28
In process, beginning of period
Stage of completion
Placed in process during period
Received from dept.
Transferred to dept.
Transferred to stockroom during period
In process, end of period
Stage of completion
For Month Ending
Dept.
5,000 units2/5
none39,000 units41,000 units
none3,000 units
1/3
February 28, 2012
Forming
PRODUCTION REPORT
during period
during period
BlankingFinishing
Chapter 5 – Process Cost Accounting—General Procedures 261

The February cost of production summary for Forming is shownon the following page. In calculating the unit cost in Forming at theend of February, the amounts considered include (a) the productioncosts incurred by the department during the month, plus (b) thedepartmental cost of work in process at the beginning of the month.The costs from Blanking included in the beginning work in processvaluation ($50,000) and in the goods received during the month($390,000) are not used in this unit cost calculation because they area prior department’s costs.
Cleveland Can CompanyCost of Production Summary—FormingFor the Month Ended February 28, 2012
Cost of work in process, beginning of month—Forming:
Cost in Blanking . . . . . . . . . . . . . . . . . . . . . . . . . . . . . $ 50,000*
Cost in Forming:
Materials . . . . . . . . . . . . . . . . . . . . . . . . . . . . . . . . . . $1,000
Labor . . . . . . . . . . . . . . . . . . . . . . . . . . . . . . . . . . . . . 2,500
Factory overhead . . . . . . . . . . . . . . . . . . . . . . . . . . 1,500 5,000 $ 55,000
Cost of goods received from Blankingduring month . . . . . . . . . . . . . . . . . . . . . . . . . . . . . . . .
390,000*
Cost of production for month—Forming:
Materials . . . . . . . . . . . . . . . . . . . . . . . . . . . . . . . . . . . . $ 16,640
Labor . . . . . . . . . . . . . . . . . . . . . . . . . . . . . . . . . . . . . . . 50,000
Factory overhead . . . . . . . . . . . . . . . . . . . . . . . . . . . . 33,360 100,000
Total costs to be accounted for . . . . . . . . . . . . . $545,000
Unit output for month:
Finished and transferred to Finishing duringmonth . . . . . . . . . . . . . . . . . . . . . . . . . . . . . . . . . . . . 41,000
Equivalent units of work in process,end of month (3,000 units, one-thirdcompleted) . . . . . . . . . . . . . . . . . . . . . . . . . . . . . . . . 1,000
Total equivalent production . . . . . . . . . . . . . . . . 42,000
Unit cost for month—Forming:
Materials [($1,000 þ $16,640) � 42,000] . . . . . . . $ 0.42
Labor [($2,500 þ $50,000) � 42,000] . . . . . . . . . . . 1.25
Factory overhead [($1,500 þ $33,360) �42,000] . . . . . . . . . . . . . . . . . . . . . . . . . . . . . . . . . . . . 0.83
Total . . . . . . . . . . . . . . . . . . . . . . . . . . . . . . . . . . . . . . $ 2.50
Inventory costs:
Costs of goods finished and transferred to Finishing during month:
Cost in Blanking (41,000 � $10.00) . . . . . . . . . . $410,000
Cost in Forming (41,000 � $2.50) . . . . . . . . . . . 102,500
(41,000 � $12.50) . . . . . . . . . . $512,500
262 Principles of Cost Accounting

Cost of work in process, end of month:
Cost in Blanking (3,000 � $10.00) . . . . . . . . . . . . . $ 30,000
Cost in Forming:
Materials (3,000 � 1/3 � $0.42) . . . . . . . . . . . . . . $ 420
Labor (3,000 � 1/3 � $1.25) . . . . . . . . . . . . . . . . . 1,250
Factory overhead (3,000 � 1/3 � $0.83) . . . . . . 830 2,500 32,500
Total production costs accounted for . . . . . . . . . . . $545,000
*Not to be considered in calculating February unit cost in Forming.
The following journal entry can now be made.
Feb. 28 Work in Process—Finishing . . . . . . . . . . . . . . 512,500
Work in Process—Forming . . . . . . . . . . . . . . . 512,500
The general ledger account for work in process in Forming appears asfollows:
Work in Process—Forming
Jan. 31 12,000 Jan. 31 275,000
30,000
18,000
270,000
330,000
55,000
Feb. 28 16,640 Feb. 28 512,500
50,000
33,360
390,000
820,000 787,500
32,500
The February production report for Finishing is shown in Figure 5-13.
Figure 5-13 Production Report, Finishing, February 28
In process, beginning of period
Stage of completion
Placed in process during period
Received from dept.
Transferred to dept.
Transferred to stockroom during period
In process, end of period
Stage of completion
For Month Ending
Dept.
2,000 units1/2
none41,000 units
39,000 units4,000 units
1/2
February 28, 2012
Finishing
PRODUCTION REPORT
during period
during period
Forming
Chapter 5 – Process Cost Accounting—General Procedures 263

The February cost of production summary for Finishing is shown below.
Cleveland Can CompanyCost of Production Summary—FinishingFor the Month Ended February 28, 2012
Cost of work in process, beginning of month:
Cost in Blanking . . . . . . . . . . . . . . . . . . . . . . . . . . . . . . . . . . . . . . . . . . . . . . $ 20,000*
Cost in Forming . . . . . . . . . . . . . . . . . . . . . . . . . . . . . . . . . . . . . . . . . . . . . . 5,000*
Cost in Finishing:
Materials . . . . . . . . . . . . . . . . . . . . . . . . . . . . . . . . . . . . . . $1,500
Labor . . . . . . . . . . . . . . . . . . . . . . . . . . . . . . . . . . . . . . . . . 1,100
Factory overhead . . . . . . . . . . . . . . . . . . . . . . . . . . . . . . 1,400 4,000 $ 29,000
Cost of goods received from
Forming during month . . . . . . . . . . . . . . . . . . . . . . . . . . . . . . . . . . . . . . . . 512,500*
Cost of production for month—Finishing:
Materials . . . . . . . . . . . . . . . . . . . . . . . . . . . . . . . . . . . . . . . . . . . . . . . . . . . . . $ 57,130
Labor . . . . . . . . . . . . . . . . . . . . . . . . . . . . . . . . . . . . . . . . . . . . . . . . . . . . . . . . 45,640
Factory overhead . . . . . . . . . . . . . . . . . . . . . . . . . . . . . . . . . . . . . . . . . . . . . 57,230 160,000
Total costs to be accounted for . . . . . . . . . . . . . . . . . . . . . . . . . . . . . . $701,500
Unit output for month:
Finished and transferred to finished goodsduring month . . . . . . . . . . . . . . . . . . . . . . . . . . . . . . . . . . . . . . . . . . . . . . 39,000
Equivalent units of work in process, end of month(4,000 units, one-half completed) . . . . . . . . . . . . . . . . . . . . . . . . . . . . 2,000
Total equivalent production . . . . . . . . . . . . . . . . . . . . . . . . . . . . . . . . . 41,000
Unit cost for month—Finishing:
Materials [($1,500 þ $57,130) � 41,000] . . . . . . . . . . . . . . . . . . . . . . . . $ 1.43
Labor [($1,100 þ $45,640) � 41,000] . . . . . . . . . . . . . . . . . . . . . . . . . . . . 1.14
Factory overhead [($1,400 þ $57,230) � 41,000] . . . . . . . . . . . . . . . . 1.43
Total . . . . . . . . . . . . . . . . . . . . . . . . . . . . . . . . . . . . . . . . . . . . . . . . . . . . . . . $ 4.00
Inventory costs:
Cost of goods finished and transferred to finished goods during month:
Cost in Blanking (39,000 � $10.00) . . . . . . . . . . . . . . . . . . . . . . . . . . . $ 390,000
Cost in Forming (39,000 � $2.50) . . . . . . . . . . . . . . . . . . . . . . . . . . . . 97,500
Cost in Finishing (39,000 � $4.00) . . . . . . . . . . . . . . . . . . . . . . . . . . . . 156,000
(39,000 � $16.50) $ 643,500
Cost of work in process, end of month:
Cost in Blanking 4,000 � $10.00) . . . . . . . . . . . . . . . . . . . . . . . . . . . . . . . $ 40,000
Cost in Forming (4,000 � $2.50) . . . . . . . . . . . . . . . . . . . . . . . . . . . . . . . . 10,000
Cost in Finishing:
Materials (4,000 � 1/2 � $1.43) . . . . . . . . . . . . . . . . . $2,860
Labor (4,000 � 1/2 � $1.14) . . . . . . . . . . . . . . . . . . . . . 2,280
Factory overhead (4,000 � 1/2 � $1.43) . . . . . . . . . . 2,860 8,000 58,000
Total production costs accounted for . . . . . . . . . . . . . . . . . . . . . . . . . . . . $701,500
*Not to be considered in calculating February unit cost in Finishing.
264 Principles of Cost Accounting

The following journal entry can now be made:
Feb. 28 Finished Goods . . . . . . . . . . . . . . . . . . . . . . . . . 643,500
Work in Process—Finishing . . . . . . . . . . . . 643,500
The general ledger account for work in process in Finishing appears asfollows:
Work in Process—Finishing
Jan. 31 31,500 Jan. 31 330,000
23,100
29,400
275,000
359,000
29,000
Feb. 28 57,130 Feb. 28 643,500
45,640
57,230
512,500
1,031,500 973,500
58,000
The work sheet in Figure 5-14 can now be prepared. It summarizes thefactory operations for February and provides the data needed for preparingthe following statement of cost of goods manufactured:
Cleveland Can CompanyStatement of Cost of Goods Manufactured
For the Month Ended February 28, 2012
Materials . . . . . . . . . . . . . . . . . . . . . . . . . . . . . . . . . . . . . . . . . . . . . . . . . . . . . . . $263,770
Labor . . . . . . . . . . . . . . . . . . . . . . . . . . . . . . . . . . . . . . . . . . . . . . . . . . . . . . . . . . 198,240
Factory overhead . . . . . . . . . . . . . . . . . . . . . . . . . . . . . . . . . . . . . . . . . . . . . . . 177,990
Total . . . . . . . . . . . . . . . . . . . . . . . . . . . . . . . . . . . . . . . . . . . . . . . . . . . . . . . . . . . $640,000
Add work in process inventories, February 1 . . . . . . . . . . . . . . . . . . . 134,000
$774,000
Less work in process inventories, February 28 . . . . . . . . . . . . . . . . . . 130,500
Cost of goods manufactured during the month . . . . . . . . . . . . . . . . . . . $643,500
Occasionally, finished goods in a department at the end of themonth may not be transferred to the next department until the follow-ing month. Because these units are still on hand in the department atthe end of the month, they cannot be considered transferred. They areaccounted for as ‘‘goods completed and on hand,’’ and their cost is shownat the full unit price. They are considered work in process for financialstatement purposes. Although the goods are finished in the department,they are considered in process until they are officially transferred tofinished goods.
Chapter 5 – Process Cost Accounting—General Procedures 265

Changes in Prior Department’s Unit TransferCostsIn the preceding illustrations, it was assumed that this month’s unitcost from prior departments was the same transferred-in unit cost as that oflast month. This assumption permitted the prior department’s unit cost tobe used without determining a new average unit cost for the goodstransferred in, even though the transfers came from two differentperiods of production. However, the prior department’s transfers from
Figure 5-14 Work Sheet, February 28
1
2
3
4
5
6
7
8
9
10
11
12
13
14
15
16
17
18
19
20
21
22
23
24
25
26
27
28
29
30
31
32
33
34
35
36
37
38
39
40
A B C D E F
Blanking:
Opening inventory in process ................... 10,000 $50,000
Started in process....................................... 34,000
Costs for month:
Materials.............................................. 190,000
Labor................................................... 102,600
Factory overhead ............................... 87,400
Finished and transferred to Forming ........ $10.00 39,000 $390,000
Closing work in process ............................ 5,000 40,000
Total..................................................... 44,000 44,000 $430,000 $430,000
Forming:
Opening inventory in process ................... 5,000 $55,000
Received during month from Blanking 39,000 390,000
Costs added during month:
Materials.............................................. 0.42 16,640
Labor................................................... 1.25 50,000
Factory overhead ............................... 0.83 33,360
Finished and transferred to Finishing ....... $12.50 41,000 $512,500
Closing work in process ............................ 3,000 32,500
Total...................................................... 44,400 44,000 $545,000 $545,000
Finishing:
Opening inventory in process ................... 2,000 $29,000
Received during month from Forming...... 41,000 512,500
Costs added during month:
Materials.............................................. 1.43 57,130
Labor................................................... 1.14 45,640
Factory overhead ............................... 1.43 57,230
Finished and transferred to stock ............. $16.50 39,000 $643,500
Closing work in process ............................ 4,000 58,000
Total...................................................... 43,000 43,000 $701,500 $701,500
Cleveland Can Company
Departmental Cost Work Sheet
For the Month Ended February 28, 2012
Units
received in
department
Units
transferred
or on hand
Amount
charged to
department
Amount
credited to
department
Cost
per unit
transferredAnalysis
LO7Prepare a cost
of production
summary with a
change in the prior de-
partment’s unit trans-
fer cost.
266 Principles of Cost Accounting

two different periods will often have different unit costs each month.Therefore, these previous department costs must be averaged as a separategrouping so that these transferred-in costs can be properly allocated tothe products being produced in the department. The method resemblesthat used for the cost of materials, labor, and factory overhead in thedepartment when the cost of these elements represents two differentperiods of time.
To illustrate, assume that 20,000 units are in process in Formingat the beginning of the month with a transferred cost of $106,000from Blanking. During the month, 100,000 units with a total cost of$500,000 are received from Blanking; 110,000 units are finished andtransferred to Finishing; and 10,000 units are in process in Forming atthe end of the month, one-half completed. Processing costs in Form-ing for the month are $230,000 ($20,000 þ $210,000) for materials,$161,000 ($14,000 þ $147,000) for labor, and $115,000 ($10,000 þ$105,000) for overhead. By using these data, the unit costs are calculated inthe cost of production summary for Forming on page 268. Note theportion of the report where the unit cost from the prior department isadjusted to $5.05.
Figure 5-14 (Continued)
41
42
43
44
45
46
47
48
49
50
51
52
53
54
55
56
57
58
59
60
61
62
63
64
65
66
A B C D E F
Amount Total
Summary:
Materials:
Blanking .................................................................................................................................. $190,000
Forming ................................................................................................................................... 16,640
Finishing.................................................................................................................................. 57,130 $263,770
Labor:
Blanking .................................................................................................................................. $102,600
Forming ................................................................................................................................... 50,000
Finishing.................................................................................................................................. 45,640 198,240
Factory overhead:
Blanking .................................................................................................................................. $87,400
Forming ................................................................................................................................... 33,360
Finishing.................................................................................................................................. 57,230 177,990
Total production costs for February ............................................................................................. $640,000
Add work in process, begining of month:
Blanking .................................................................................................................................. $50,000
Forming ................................................................................................................................... 55,000
Finishing.................................................................................................................................. 29,000 134,000
Total.................................................................................................................................................. $774,000
Deduct work in process, end of month:
Blanking .................................................................................................................................. $40,000
Forming ................................................................................................................................... 32,500
Finishing.................................................................................................................................. 58,000 130,500
Costs of production, goods fully
manufactured during February............................................................................................. $643,500
Chapter 5 – Process Cost Accounting—General Procedures 267

Cleveland Can CompanyCost of Production Summary—FormingFor the Month Ended February 28, 2012
Cost of work in process, beginning of month:
Cost in Blanking . . . . . . . . . . . . . . . . . . . . . . . . . . . . . . . . . . . . . . . . . . $106,000
Cost in Forming:
Materials . . . . . . . . . . . . . . . . . . . . . . . . . . . . . . . . $20,000
Labor . . . . . . . . . . . . . . . . . . . . . . . . . . . . . . . . . . . . 14,000
Overhead . . . . . . . . . . . . . . . . . . . . . . . . . . . . . . . . 10,000 44,000 $ 150,000
Cost of goods received from Blanking 500,000
Cost in Forming:
Materials . . . . . . . . . . . . . . . . . . . . . . . . . . . . . . . . . . . . . . . . . . . . . . . . . $210,000
Labor . . . . . . . . . . . . . . . . . . . . . . . . . . . . . . . . . . . . . . . . . . . . . . . . . . . . 147,000
Overhead . . . . . . . . . . . . . . . . . . . . . . . . . . . . . . . . . . . . . . . . . . . . . . . . 105,000 462,000
Total costs to be accounted for . . . . . . . . . . . . . . . . . . . . . . . . . . $1,112,000
Unit output for month:
Finished and transferred to Finishing . . . . . . . . . . . . . . . . . . . . . . . 110,000
Equivalent production of work in process (10,000 units,one-half completed) . . . . . . . . . . . . . . . . . . . . . . . . . . . . . . . . . . . . 5,000
Total equivalent production . . . . . . . . . . . . . . . . . . . . . . . . . . . . . 115,000
Unit cost for month:
Cost from prior department:
Beginning inventory (20,000 units) . . . . . . . . . . . . . . . . . . . . . . . $106,000
Transferred in this month (100,000 units) . . . . . . . . . . . . . . . . . 500,000
Average cost per unit (120,000 units) . . . . . . . . . . . . . . . . . . . . . $606,000 $ 5.05
Cost in Forming:
Materials [($20,000 þ $210,000) � 115,000] . . . . . . . . . . . . . . . $ 2.00
Labor [($14,000 þ $147,000) � 115,000] . . . . . . . . . . . . . . . . . . 1.40
Overhead [($10,000 þ $105,000) � 115,000] . . . . . . . . . . . . . . . 1.00
$ 4.40
Inventory costs:
Cost of goods finished and transferred:
Cost in Blanking (110,000 � $5.05) . . . . . . . . . . . . . . . . . . . . . . . $555,500
Cost in Forming (110,000 � $4.40) . . . . . . . . . . . . . . . . . . . . . . . 484,000
Total finished and transferred (110,000 � $9.45) . . . . . . . . . . . . $1,039,500
Cost of work in process, end of month:
Cost in Blanking (10,000 � $5.05) . . . . . . . . . . . . . . . . . . . . . . . . $ 50,500
Materials (10,000 � 1/2 � $2.00) . . . . . . . . . $10,000
Labor (10,000 � 1/2 � $1.40) . . . . . . . . . . . . 7,000
Overhead (10,000 � 1/2 � $1.00) . . . . . . . . . 5,000 22,000 72,500
Total production costs accounted for . . . . . . . . . . . . . . . . . . . . . . . . $1,112,000
268 Principles of Cost Accounting

ANSWERS TO RECALL AND REVIEW EXERCISES
R&R 1
Units completed from beginning work
in process . . . . . . . . . . . . . . . . . . . . . . . . . . . . . . . . . . . . . . 400
Units started and completed this month . . . . . . . . . . 13,400
Equivalent units in ending work in process . . . . . . . 300 [(14,600 – 13,400) � .25]
Total equivalent units of production . . . . . . . . . . . . . . 14,100
R&R 2
Debit Credit:1. Work in Process, Factory Overhead Materials
2. Work in Process, Factory Overhead Payroll
3. Factory Overhead (each department) Factory Overhead
4. Work in Process (each department) Factory Overhead (each department)
KEY TERMS
Average cost method, 241
Cost center, 238
Cost object, 239
Cost of production summary, 244
Equivalent production, 241
First-in, first-out (FIFO) method, 241
Job order cost system, 238
Process cost system, 238
Production report, 242
Stage of completion, 242
Recall and Review 3
Gurry Company has 2,000 units in process in Blending at the beginning of
the month that have a transferred-in cost of $10,000 from Mixing. During
the month, an additional 15,000 units are received from Mixing with a
transferred-in cost of $77,000. Fourteen thousand units are completed and
transferred to Finishing during the month, with the remaining units two-
thirds complete at the end of the month. The adjusted unit cost from the
prior department that should appear on the Blending cost of production
summary is $_______________. (Round unit cost to three decimal places.)
(After working this exercise, see page 270 for the solution.)
You should now be able to work the following:
Questions 15 and 16; Exercises 5-10 to 5-12; Problems 5-7 to 5-11;
Self-Study Problem 2; and the Internet Exercise.
Chapter 5 – Process Cost Accounting—General Procedures 269

SELF-STUDY PROBLEM 1
Cost of Production Summary, One Department;Beginning Work in Process
Michaels, Inc.
Michaels, Inc., uses the process cost system. The following data, taken
from the organization’s books, reflect the results of manufacturing opera-
tions during the month of June in its only department, Machining:
Production Costs
Work in process, beginning of period:
Materials . . . . . . . . . . . . . . . . . . . . . . . . . . . . . . . . . . . . . . . . . . . . . . . . . . . . . $ 5,200
Labor . . . . . . . . . . . . . . . . . . . . . . . . . . . . . . . . . . . . . . . . . . . . . . . . . . . . . . . . 4,600
Factory Overhead . . . . . . . . . . . . . . . . . . . . . . . . . . . . . . . . . . . . . . . . . . . . 2,000 $11,800
Costs during the month:
Materials . . . . . . . . . . . . . . . . . . . . . . . . . . . . . . . . . . . . . . . . . . . . . . . . . . . . . $20,000
Labor . . . . . . . . . . . . . . . . . . . . . . . . . . . . . . . . . . . . . . . . . . . . . . . . . . . . . . . . 15,000
Factory overhead . . . . . . . . . . . . . . . . . . . . . . . . . . . . . . . . . . . . . . . . . . . . . 12,000 $47,000
Total . . . . . . . . . . . . . . . . . . . . . . . . . . . . . . . . . . . . . . . . . . . . . . . . . . . . . . . $58,800
Production Report UnitsFinished and transferred to stockroom during month . . . . . . . . . . . . . 19,000
Work in process, end of period, 4,000 units, one-fourth completed
Required:
Prepare a cost of production summary for June.
SOLUTION TO SELF-STUDY PROBLEM
Suggestions:
Read the entire problem carefully, keeping in mind what you are required
to do: Prepare a cost of production summary for a single department. The
specifics of the problem highlight the following facts:
R&R 3
Units CostBeginning inventory 2,000 $10,000
Transferred-in during month 15,000 77,000
Total 17,000 $87,000
Average cost per unit ¼ $87,000 / 17,000 ¼ $5.118
270 Principles of Cost Accounting

1. There is a single department: Machining
2. To prepare a cost of production summary:
a. Determine the total cost to be accounted for.
b. Calculate the equivalent units of production.
c. Using the beginning inventory costs and the costs incurred
during the period, determine the total costs of material, labor,
and factory overhead.
d. Divide the total costs in each of the three categories by the
equivalent units of production to obtain the individual unit costs
for materials, labor, and factory overhead.
e. Using the unit costs for materials, labor, and factory overhead,
determine the following:
1. The cost of goods completed and transferred to finished goods.
2. The cost of the ending work in process inventory.
Prepare the cost of production summary for the Machining
Department:
Michaels, Inc.Cost of Production Summary—Machining
For the Month Ended June 30, 2011
First: Account for the total cost charged to the Machining Department.
Cost of work in process, beginning of month:
Materials . . . . . . . . . . . . . . . . . . . . . . . . . . . . . . . . . . . . . . . . . . . . . . . . . . $ 5,200
Labor . . . . . . . . . . . . . . . . . . . . . . . . . . . . . . . . . . . . . . . . . . . . . . . . . . . . . 4,600
Factory overhead . . . . . . . . . . . . . . . . . . . . . . . . . . . . . . . . . . . . . . . . . . 2,000 $ 11,800
Costs of production for the month:
Materials . . . . . . . . . . . . . . . . . . . . . . . . . . . . . . . . . . . . . . . . . . . . . . . . . . $ 20,000
Labor . . . . . . . . . . . . . . . . . . . . . . . . . . . . . . . . . . . . . . . . . . . . . . . . . . . . . 15,000
Factory overhead . . . . . . . . . . . . . . . . . . . . . . . . . . . . . . . . . . . . . . . . . . 12,000 47,000
Total cost to be accounted for . . . . . . . . . . . . . . . . . . . . . . . . . . . . $ 58,800
Second: Determine the equivalent units of production for the month. Materials, labor, andfactory overhead are added uniformly throughout the process. The average cost method ofprocess costing is used.
Units of output for month:
Finished and transferred to finished goods . . . . . . . . . . . . . . . . . . 19,000
Equivalent units of work in process, end of month: 4,000 units,one-fourth completed . . . . . . . . . . . . . . . . . . . . . . . . . . . . . . . . . . . . . . 1,000
Total equivalent production . . . . . . . . . . . . . . . . . . . . . . . . . . . . . . 20,000
Third: Determine unit costs for each element of manufacturing cost for the month. Theaverage cost method requires that the beginning inventory cost be added to the currentmonth’s cost for each cost element. The total cost for each cost element is then divided bythe equivalent units of production to obtain the unit cost for each cost element.
Unit cost for month:
Materials ($5,200 þ $20,000) � 20,000 . . . . . . . . . . . . . . . . . . . . . . . $ 1.26
Labor ($4,600 þ $15,000) � 20,000 . . . . . . . . . . . . . . . . . . . . . . . . . . 0.98
Factory overhead ($2,000 þ $12,000) � 20,000 . . . . . . . . . . . . . . . 0.70
Total . . . . . . . . . . . . . . . . . . . . . . . . . . . . . . . . . . . . . . . . . . . . . . . . . . . . $ 2.94
Chapter 5 – Process Cost Accounting—General Procedures 271

Fourth: Using the units costs computed on the previous page determine the cost of goodstransferred to finished goods and the cost of the ending work in process inventory.
Inventory Costs:
Cost of goods finished and transferred tofinished goods (19,000 � $2.94) . . . . . . . . . . . . . . . . . . . . . . . . . . . . . $55,860
Cost of work in process, end of month:
Materials (4,000 � 1/4 � $1.26) . . . . . . . . . . . . . . . . . . . . . . . . . . . . . . $ 1,260
Labor (4,000 � 1/4 � .98) . . . . . . . . . . . . . . . . . . . . . . . . . . . . . . . . . . . . 980
Factory overhead (4,000 1/4 � .70) . . . . . . . . . . . . . . . . . . . . . . . . . . 700 2,940
Total production costs accounted for . . . . . . . . . . . . . . . . . . . . . . . . . . $58,800
SELF-STUDY PROBLEM 2
Cost of Production, Two Departments; BeginningInventory
Shiloh Chemicals, Inc.
Shiloh Chemicals, Inc., which manufactures products on a continuous
basis, had 800 units in process in Dept. 1, one-half completed, at the
beginning of May. The costs in April for processing these units were as
follows: materials, $1,200; labor, $900; and factory overhead, $1,000.
During May, Dept. 1 finished and transferred 10,000 units to Dept. 2 and
had 400 units in process at the end of May, one-half completed.
Dept. 2 had 200 units in process at the beginning of the month, one-
half completed. April costs for these units were as follows: cost transferred
from Dept. 1, $1,550; materials, $200; labor, $175; and factory overhead,
$225. During May, Dept. 2 completed 9,000 units and had 1,200 units in
process at the end of the period, two-thirds completed.
Production costs incurred by the two departments during May were as
follows:
Dept. 1 Dept. 2Materials . . . . . . . . . . . . . . . . . . . . . . . . . . . . . . . . . . . . . . . $29,400 $19,400
Labor . . . . . . . . . . . . . . . . . . . . . . . . . . . . . . . . . . . . . . . . . . . 22,050 16,975
Factory overhead . . . . . . . . . . . . . . . . . . . . . . . . . . . . . . . 24,500 21,825
Required:
Prepare a cost of production summary for each department.
SOLUTION TO SELF-STUDY PROBLEM
Suggestions:
Read the entire problem thoroughly, keeping in mind what you are
required to do: Prepare a cost of production summary for each
department.
272 Principles of Cost Accounting

The Specifics in the Problem Highlight the Following Facts:
1. There are two departments: Dept. 1 and Dept. 2.
2. Dept. 1 had 800 units in process, one-half completed, at the beginning
of May. This statement indicates that materials, labor, and factory
overhead are being added uniformly to production.
3. To prepare a cost of production summary:
a. Determine the total cost to be accounted for in the department.
b. Calculate the equivalent production.
c. Using the beginning inventory costs and the costs incurred
during the period, determine the total cost of materials, the total
cost of labor, and the total cost of factory overhead. Then divide
the total cost of materials by the equivalent production of materi-
als to calculate the unit cost of materials for the period. Also,
divide the total cost of labor and factory overhead by the equiva-
lent production determined for them.
d. Using the calculated unit costs for materials, labor, and factory
overhead, determine the following:
1. The cost of goods finished and transferred.
2. The cost of the ending work in process inventory.
Prepare the Cost of Production Summary for Dept. 1:
Shiloh Chemicals, Inc.Cost of Production Summary—Dept. 1
For the Month Ended May 31, 2011
First: Account for the total cost charged to Dept. 1.
Cost of work in process, beginning of month:
Materials . . . . . . . . . . . . . . . . . . . . . . . . . . . . . . . . . . . . . . . . . . . . . . . $ 1,200
Labor . . . . . . . . . . . . . . . . . . . . . . . . . . . . . . . . . . . . . . . . . . . . . . . . . . . 900
Factory overhead . . . . . . . . . . . . . . . . . . . . . . . . . . . . . . . . . . . . . . . . 1,000 $3,100
Cost of production for month:
Materials . . . . . . . . . . . . . . . . . . . . . . . . . . . . . . . . . . . . . . . . . . . . . . . $29,400
Labor . . . . . . . . . . . . . . . . . . . . . . . . . . . . . . . . . . . . . . . . . . . . . . . . . . . 22,050
Factory overhead . . . . . . . . . . . . . . . . . . . . . . . . . . . . . . . . . . . . . . . . 24,500 75,950
Total costs to be accounted for . . . . . . . . . . . . . . . . . . . . . . . . . $79,050
Second: Determine equivalent production for the month. (Materials, labor, and factoryoverhead are added uniformly. Method of costing—average cost.)
Units of output for month:
Finished and transferred to Dept. 2 . . . . . . . . . . . . . . . . . . . . . . . 10,000
Equivalent units of work in process, end of month:
400 units, one-half completed . . . . . . . . . . . . . . . . . . . . . . . . . . 200
Total equivalent production . . . . . . . . . . . . . . . . . . . . . . . . . . . . . . . . 10,200
Third: Determine unit cost, by elements, for the month. The average cost methodrequires that the beginning inventory’s element cost be added to the current month’selement cost. The total cost for each element is then divided by the equivalentproduction for that element.
Chapter 5 – Process Cost Accounting—General Procedures 273

Unit cost for month:
Materials ($1,200 þ $29,400) � 10,200 . . . . . . . . . . . . . . . . . . . . $3.00
Labor ($900 þ $22,050) � 10,200 . . . . . . . . . . . . . . . . . . . . . . . . . . 2.25
Factory overhead ($1,000 þ $24,500) � 10,200 . . . . . . . . . . . . . 2.50
Total . . . . . . . . . . . . . . . . . . . . . . . . . . . . . . . . . . . . . . . . . . . . . . . . . $7.75
Fourth: Using the unit costs, calculate the cost of goods transferred and the cost of theending work in process.
Inventory costs:
Cost of goods finished and transferred to Dept. 2 during the month(10,000 � $7.75) . . . . . . . . . . . . . . . . . . . . . . . . . . . . . . . . . . . . . . . $77,500
Cost of work in process, end of month:
Materials (400 � 1/2 � $3.00) . . . . . . . . . . . . . . . . . . . . . . . . . . . $ 600
Labor (400 � 1/2 � $2.25) . . . . . . . . . . . . . . . . . . . . . . . . . . . . . . 450
Factory overhead (400 � 1/2 � $2.50) . . . . . . . . . . . . . . . . . . . 500 1,550
Total production costs accounted for . . . . . . . . . . . . . . . . . . . . . . . $79,050
Prepare the Cost of Production Summary for Dept. 2:
Shiloh Chemicals, Inc.Cost of Production Summary—Dept. 2
For the Month Ended May 31, 2011
First: Account for all costs charged to Dept. 2.
Cost of work in process, beginning of month:
Cost in Dept. 1 (preceding department) . . . . . . . . . . . . . . . . $ 1,550
Cost in Dept. 2:
Materials . . . . . . . . . . . . . . . . . . . . . . . . . . . . . $ 200
Labor . . . . . . . . . . . . . . . . . . . . . . . . . . . . . . . . . 175
Factory overhead . . . . . . . . . . . . . . . . . . . . . . 225 600 $2,150
Cost of goods received from Dept. 1 during month 77,500
Cost of production for month:
Materials . . . . . . . . . . . . . . . . . . . . . . . . . . . . . . . . . . . . . . . . . . . . $19,400
Labor . . . . . . . . . . . . . . . . . . . . . . . . . . . . . . . . . . . . . . . . . . . . . . . 16,975
Factory overhead . . . . . . . . . . . . . . . . . . . . . . . . . . . . . . . . . . . . 21,825 58,200
Total costs to be accounted for . . . . . . . . . . . . . . . . . . . . . $137,850
Second: Determine the equivalent production.
Finished and transferred to finished goodsduring month . . . . . . . . . . . . . . . . . . . . . . . . . . . . . . . . . . . . . . . . 9,000
Equivalent units of work in process, end of month(1,200 units, two-thirds completed) . . . . . . . . . . . . . . . . . . . . 800
Total equivalent production . . . . . . . . . . . . . . . . . . . . . . . . . . 9,800
Third: Determine unit cost by element. Add beginning inventory element cost to currentmonth element cost and divide total by the equivalent production for that element.
Unit cost for month:
Materials ($200 þ $19,400) � 9,800 . . . . . . . . . . . . . . . . . . . . $2.00
Labor ($175 þ $16,975) � 9,800 . . . . . . . . . . . . . . . . . . . . . . . 1.75
Factory overhead ($225 þ $21,825) � 9,800 . . . . . . . . . . . . 2.25
Total unit cost for Dept. 2 . . . . . . . . . . . . . . . . . . . . . . . . . . . $6.00
274 Principles of Cost Accounting

Fourth: Using the unit costs from Dept. 1 and Dept. 2, calculate the cost of goodstransferred and the cost of the ending work in process.
Inventory costs:
Cost of goods finished and transferred to finished goods during month:
Cost in Dept. 1 (9,000 � $7.75) . . . . . . . . . . . . . . . . . . . . . . $69,750
Cost in Dept. 2 (9,000 � $6.00) . . . . . . . . . . . . . . . . . . . . . . 54,000
Total (9,000 � $13.75) $123,750
Cost of work in process, end of month:
Cost in Dept. 1 (1,200 � $7.75) . . . . . . . . . . . . . . . . . . . . . . . . $ 9,300
Cost in Dept. 2:
Materials (1,200 � 2/3 � $2.00) . . . . . . . $1,600
Labor (1,200 � 2/3 � $1.75) . . . . . . . . . . 1,400
Overhead (1,200 � 2/3 � $2.25) . . . . . . . 1,800 4,800 14,100
Total production costs accounted for . . . . . . . . . . . . . . . . . . . . $137,850
Note that, in the above ending work in process inventory, the unit cost
from Dept. 1 is multiplied by the full 1,200 units because all of those units
are complete as to Dept. 1 processing.
QUESTIONS
1. What are the two basic systems of cost
accounting, and under what conditions may
each be used advantageously?
2. Following is a list of manufactured pro-
ducts. For each product, would a job order
or a process cost system be used to ac-
count for the costs of production?
a. lumber
b. buildings
c. airplanes
d. gasoline
e. cereal
f. textbooks
g. paint
h. jeans
3. What is the primary difference between the
two cost accounting systems regarding the
accumulation of costs and the calculation
of unit costs?
4. What is the difference between the term
unit cost as commonly used in a process
cost system and the term job cost as com-
monly used in a job order system of cost
accounting?
5. How do the two cost accounting systems
differ in accounting for each of the follow-
ing items?
a. materials
b. labor
c. factory overhead
6. What is the primary objective in accumulat-
ing costs by departments?
7. What is meant by the term equivalent pro-
duction as used in the process cost system?
8. Why is it necessary to estimate the stage or
degree of completion of work in process at
the end of the accounting period under the
process cost system?
9. What would be the effect on the unit cost of
finished goods if an estimate of the stage of
completion of work in process was too high?
10. What information is reflected on a produc-
tion report?
11. What are the four main sections of a cost of
production summary?
12. What is the major difference between the
disposition of units transferred out of a first
department in a single-department factory
versus a multiple-department factory?
Chapter 5 – Process Cost Accounting—General Procedures 275

13. Does the calculation of unit cost in a depart-
ment subsequent to the first department
take into consideration the costs trans-
ferred in from the previous departments?
14. In determining the costs transferred to a
third department from a second depart-
ment, are the costs from a first department
considered? Are they considered in the
computation of the ending work in process
in the second department?
15. If finished goods are still on hand in a
department at the end of the month, how
are they reported on the cost of production
summary and on the balance sheet?
16. If the prior department’s transfers from two
different periods have different unit costs
each month, how are they treated for pur-
poses of the cost of production summary
for the department to which they were
transferred?
EXERCISES
E5-1 Computing equivalent productionCompute the equivalent production (unit output) for the month
for each of the following situations:
Units CompletedDuring Month
Units in Process,End of Month
Stage ofCompletion
a. 10,000 5,000 1/2
b. 22,000 4,000 3/4
c. 8,000 1,000 1/4
500 2/5
d. 25,000 5,000 1/2
5,000 3/4
e. 48,000 1,500 4/5
4,000 1/4
E5-2 Computing units in process, units completed, and equivalentproductionUsing the following data, determine which figures should be
inserted in the blank spaces.
BeginningUnits inProcess
UnitsStarted in
Production
UnitsTransferred to
Finished GoodsEnding Unitsin Process
EquivalentUnits
a. 600 8,000 8,600 — —
b. 900 6,500 — 400—1/2 completed —
c. 1,500 — 12,900 1,200—1/4completed
—
d. — 7,250 7,200 150—1/2 completed —
e. — 8,400 8,200 200—1/2 completed —
f. 400 6,200 6,200 — 6,300
LO3
LO3
276 Principles of Cost Accounting

E5-3 Computing unit costDuring the month, a company with no departmentalization in-
curred costs of $45,000 for materials, $36,000 for labor, and
$22,500 for factory overhead. There were no units in process at
the beginning or at the end of the month, and 20,000 units were
completed. Determine the unit cost for the month for materials,
labor, and factory overhead.
E5-4 Computing unit costChavez Chemical Co. recorded costs for the month of $18,900 for
materials, $44,100 for labor, and $26,250 for factory overhead.
There was no beginning work in process, 8,000 units were
finished, and 3,000 units were in process at the end of the period,
two-thirds completed. Compute the month’s unit cost for each
element of manufacturing cost and the total per unit cost. (Round
unit costs to three decimal places.)
E5-5 Computing unit costThe records of Reuben, Inc., reflect the following data:
Work in process, beginning of month—2,000 units one-half com-
pleted at a cost of $1,250 for materials, $675 for labor, and $950 for
overhead.
Production costs for the month—materials, $99,150; labor,
$54,925; factory overhead, $75,050.
Units completed and transferred to stock—38,500.
Work in process, end of month—3,000 units, one-half completed.
Calculate the unit cost for the month for materials, labor, and
factory overhead.
E5-6 Computing unit costJason Manufacturing Co. had 500 units, three-fifths completed,
in process at the beginning of the month. During the month,
2,000 units were started in process and finished. There was no
work in process at the end of the month. Unit cost of production
for the month was $1.20. Costs for materials, labor, and factory
overhead incurred in the current month totaled $2,655. Calculate
the unit cost for the prior month. (Hint: You must first determine
what the dollar balance in work in process must have been at the
beginning of the month.)
E5-7 Computing unit cost for department and for completed unitsNorth Arlington Company has two production departments. The
nature of the process is such that no units remain in process in
Finishing at the end of the period. During the period, 10,000 units
with a cost of $30,000 were transferred from Assembly to Finish-
ing. Finishing incurred costs of $8,800 for materials, $7,200 for
labor, and $8,800 for factory overhead, and finished 10,000 units
during the month.
LO4
LO4
LO5
LO5
LO6
Chapter 5 – Process Cost Accounting—General Procedures 277

a. Determine the unit cost for the month in Finishing.
b. Determine the unit cost of the products transferred to fin-
ished goods.
E5-8 In E5-7 above, prepare a statement of cost of goodsmanufactured for the period.
E5-9 Identifying cost flows in process cost systemList in columnar form the transactions and the accounts debited
and credited to reflect the flow of costs through a process cost
accounting system for the:
1. purchase of materials and supplies, on account
2. issuance of materials and supplies to the factory
3. factory labor costs incurred
4. other factory costs incurred
5. distribution of actual factory overhead to the individual
departments
6. application of factory overhead to the departments
7. transfer of units from one department to another
8. completion of units
9. sale of units
E5-10 Computing unit cost for department and for completed unitswith beginning inventoryU.S. Grant Company has two production departments. Blending
had 1,000 units in process at the beginning of the period, two-
fifths complete. During the period 7,800 units were received from
Mixing, 8,200 units were transferred to Finished Goods, and 600
units were in process at the end of the period, 1/3 complete. The
cost of the beginning work in process was:
Cost in Mixing . . . . . . . . . . . . . . . . . . . . . . . . . . . . . . . . . . . . . . . . . . . . . $10,000
Cost in Blending:
Materials . . . . . . . . . . . . . . . . . . . . . . . . . . . . . . . . . . . . . . . . . . . . . . . 200
Labor . . . . . . . . . . . . . . . . . . . . . . . . . . . . . . . . . . . . . . . . . . . . . . . . . . . 500
Factory overhead . . . . . . . . . . . . . . . . . . . . . . . . . . . . . . . . . . . . . . . . 300
The costs during the month were:
Cost of goods received from Mixing . . . . . . . . . . . . . . . . . . . . . . . . $78,000
Cost in Blending:
Materials . . . . . . . . . . . . . . . . . . . . . . . . . . . . . . . . . . . . . . . . . . . . . . . 3,328
Labor . . . . . . . . . . . . . . . . . . . . . . . . . . . . . . . . . . . . . . . . . . . . . . . . . . . 10,000
Factory overhead . . . . . . . . . . . . . . . . . . . . . . . . . . . . . . . . . . . . . . . . 6,672
a. Determine the unit cost for the month in Blending.
b. Determine the total cost of the products transferred to
finished goods.
c. Determine the total cost of the ending work in process
inventory.
LO6
LO6
LO7
278 Principles of Cost Accounting

E5-11 Cost of production summary and journal entries
1. For E5-10, prepare a cost of production summary for the
month for Blending.
2. Prepare a journal entry to transfer the completed units from
Blending to Finished Goods.
E5-12 Adjusted unit cost computationColbert Company has 1,000 units in process in Forming at the
beginning of the month with a transferred cost of $21,200 from
Blanking. During the month, 5,000 units with a total cost of
$100,000 are received from Blanking; 4,000 units are finished and
transferred to Finishing; and 2,000 units are in process in Form-
ing at the end of the month, one-half completed.
Required:
Compute the adjusted unit cost from the prior department in the
Forming Department.
(Round the unit cost to three decimal places.)
PROBLEMS
P5-1 Cost of production summary, one department; no beginningwork in process
Hugo Products Co. produces a latex paint and uses the process
cost system. Materials, labor, and overhead are added evenly
throughout the process. The following information was obtained
from the company’s accounts at the end of February.
Production CostsCosts incurred during month:
Materials . . . . . . . . . . . . . . . . . . . . . . . . . . . . . . . . . . . . . . . . . . . $30,000
Labor . . . . . . . . . . . . . . . . . . . . . . . . . . . . . . . . . . . . . . . . . . . . . . 20,000
Factory overhead . . . . . . . . . . . . . . . . . . . . . . . . . . . . . . . . . . . 40,000 $90,000
Production Report UnitsFinished and transferred to stockroom during month . . . . . . . . . . . . . . . 60,000
Work in process, end of period, one-fourth completed . . . . . . . . . . . . . . 10,000
Required:
Prepare a cost of production summary for February.
P5-2 Cost of production summary, one department; beginning workin processsimilar to Self-Study Problem 1
Andrews Company uses the process cost system. The following
data, taken from the organization’s books, reflect the results of
manufacturing operations during the month of October:
LO7
LO8
LO5
LO5
Chapter 5 – Process Cost Accounting—General Procedures 279

Production CostsWork in process, beginning of period:
Materials . . . . . . . . . . . . . . . . . . . . . . . . . . . . . . . . . . . . . . . . . . . $ 2,600
Labor . . . . . . . . . . . . . . . . . . . . . . . . . . . . . . . . . . . . . . . . . . . . . . 2,300
Factory overhead . . . . . . . . . . . . . . . . . . . . . . . . . . . . . . . . . . . 1,000 $ 5,900
Costs incurred during month:
Materials . . . . . . . . . . . . . . . . . . . . . . . . . . . . . . . . . . . . . . . . . . . $10,000
Labor . . . . . . . . . . . . . . . . . . . . . . . . . . . . . . . . . . . . . . . . . . . . . . 7,500
Factory overhead . . . . . . . . . . . . . . . . . . . . . . . . . . . . . . . . . . . 6,000 23,500
Total . . . . . . . . . . . . . . . . . . . . . . . . . . . . . . . . . . . . . . . . . . . . . $29,400
Production Report UnitsFinished and transferred to stockroom during month . . . . . . . . . . . . . . . 13,000
Work in process, end of period, one-half completed . . . . . . . . . . . . . . . . 2,000
Required:
Prepare a cost of production summary for October.
P5-3 Cost of production summary, one department; beginninginventory
Greene Company provides the following information regarding
its units of production:
1,000 units in ending work in process, one-third complete, on
June 30.
47,000 units started in production during July, with 42,000
completed in addition to the beginning work in process, by the
end of July.
The ending work in process inventory was two-thirds complete
at the end of July.
Required:
Map the calculation of the equivalent units of production for
July, using the format in Figure 5-6 of the chapter.
P5-4 Cost of production summary, multiple departments; nobeginning inventory
Department-Bravo, the second department in a three-department
production process for Military, Inc., received 10,000 units with a
total cost of $25,000 from Department-Alpha during the month of
May. Production costs in Bravo during the month were: materials,
$6,000; labor, $3,000; and factory overhead, $9,000. Of the 10,000
units transferred in, 8,000 were completed and transferred to
Department-Charlie during the month and 2,000 remained in work
in process at the end of the month, one-fourth complete.
Required:
Prepare a cost of production summary for Department-Bravo for
the month ended May 31.
LO5
LO6
280 Principles of Cost Accounting

P5-5 Departmental cost work sheet analysis; cost of productionsummary, three departments, no beginning inventories
Cubbies Manufacturing Co. has three departments and uses the
process cost system of accounting. A portion of the departmen-
tal cost work sheet prepared by the cost accountant at the end of
July is reproduced below.
Cubbies Manufacturing Co.Departmental Cost Work Sheet
For the Month Ended July 31, 2011
Analysis
Cost perunit
transferred
Unitsreceived indepartment
Unitstransferredor on hand
Amountcharged todepartment
Amountcredited todepartment
Cutting:
Started in process . . . . . . . . . . . . . . . . . . . . . . 6,600
Costs for month:
Materials . . . . . . . . . . . . . . . . . . . . . . . . . . . . . $30,000
Labor . . . . . . . . . . . . . . . . . . . . . . . . . . . . . . . . 16,000
Factory overhead . . . . . . . . . . . . . . . . . . . . . 14,000
Completed and transferred to Shaping . . . $10.00 5,400 $54,000
Closing inventory in process(1/2 completed) . . . . . . . . . . . . . . . . . . . . . . . 1,200 6,000
Total . . . . . . . . . . . . . . . . . . . . . . . . . . . . . . . . . 6,600 6,600 $60,000 $60,000
Shaping:
Received during month from Cutting . . . . 5,400 $54,000
Costs added during month:
Materials . . . . . . . . . . . . . . . . . . . . . . . . . . . . . 0.25 1,200
Labor . . . . . . . . . . . . . . . . . . . . . . . . . . . . . . . . 1.25 6,000
Factory overhead . . . . . . . . . . . . . . . . . . . . . 1.00 4,800
Completed and transferred to Finishing . . $12.50 4,400 $55,000
Closing inventory in process(2/5 completed) . . . . . . . . . . . . . . . . . . . . . . . 1,000 11,000
Total . . . . . . . . . . . . . . . . . . . . . . . . . . . . . . . . . 5,400 5,400 $66,000 $66,000
Finishing:
Received during month from Shaping . . . 4,400 $55,000
Costs added during month:
Materials . . . . . . . . . . . . . . . . . . . . . . . . . . . . . 1.50 6,300
Labor . . . . . . . . . . . . . . . . . . . . . . . . . . . . . . . . 1.00 4,200
Factory overhead . . . . . . . . . . . . . . . . . . . . . 1.50 6,300
Completed and transferred to stock . . . . . . $16.50 4,000 $66,000
Closing inventory in process(1/2 completed) . . . . . . . . . . . . . . . . . . . . . . . 400 5,800
Total . . . . . . . . . . . . . . . . . . . . . . . . . . . . . . . . . 4,400 4,400 $71,800 $71,800
Required:
Prepare a cost of production summary for each department. (Round
unit costs to three decimal places.)
LO6
Chapter 5 – Process Cost Accounting—General Procedures 281

P5-6 Journal entries and cost of goods manufactured statement
Required:
Using the data in P5-5:
1. Draft the necessary entries to record the manufacturing costs
incurred during the month of July.
2. Prepare a statement of cost of goods manufactured for the
month ended July 31.
P5-7 Change in unit cost from prior department and valuation ofinventory
Gomez Products Co. has two departments: Mixing and Cooking.
At the beginning of the month, Cooking had 4,000 units in
process with costs of $8,600 from Mixing, and its own depart-
mental costs of $500 for materials, $1,000 for labor, and $2,500
for factory overhead. During the month, 10,000 units were re-
ceived from Mixing with a cost of $25,000. Cooking incurred
costs of $4,250 for materials, $8,500 for labor, and $21,250 for
factory overhead, and finished 12,000 units. At the end of the
month, there were 2,000 units in process, one-half completed.
Required:
1. Determine the unit cost for the month in Cooking.
2. Determine the new average unit cost for all units received
from Mixing.
3. Determine the unit cost of goods finished.
4. Determine the accumulated cost of the goods finished and of
the ending work in process.
(Round unit costs to three decimal places.)
P5-8 Cost of production summary, two departments; beginninginventorysimilar to Self-Study Problem 2
Roberts Corporation uses a process cost system. The records for
the month of May show the following information:
Production Report Cutting GrindingUnits in process, May 1 . . . . . . . . . . . . . . . . . . . . . . . . . . . . 5,000 10,000
Started during the month . . . . . . . . . . . . . . . . . . . . . . . . . . 20,000 —
Received from prior department . . . . . . . . . . . . . . . . . . . . — 15,000
Finished and transferred . . . . . . . . . . . . . . . . . . . . . . . . . . . 15,000 10,000
Finished and on hand . . . . . . . . . . . . . . . . . . . . . . . . . . . . . . 5,000 —
Units in process, May 31 . . . . . . . . . . . . . . . . . . . . . . . . . . . 5,000 15,000
Stage of completion . . . . . . . . . . . . . . . . . . . . . . . . . . . . . . . 1/5 1/3
Production CostsWork in process, May 1:
Costs in Cutting: . . . . . . . . . . . . . . . . . . . . . . . . . . . . . . . . . $50,000
Materials . . . . . . . . . . . . . . . . . . . . . . . . . . . . . . . . . . . . . . $5,000
Labor . . . . . . . . . . . . . . . . . . . . . . . . . . . . . . . . . . . . . . . . . 6,450
Factory overhead . . . . . . . . . . . . . . . . . . . . . . . . . . . . . . 3,550
LO6
LO7
LO7
282 Principles of Cost Accounting

Production CostsCost in Grinding:
Materials . . . . . . . . . . . . . . . . . . . . . . . . . . . . . . . . . . . . . . 5,000
Labor . . . . . . . . . . . . . . . . . . . . . . . . . . . . . . . . . . . . . . . . . 5,500
Factory overhead . . . . . . . . . . . . . . . . . . . . . . . . . . . . . . 3,500
Costs incurred during the month:
Materials . . . . . . . . . . . . . . . . . . . . . . . . . . . . . . . . . . . . . . 37,000 40,000
Labor . . . . . . . . . . . . . . . . . . . . . . . . . . . . . . . . . . . . . . . . . 45,000 44,000
Factory overhead . . . . . . . . . . . . . . . . . . . . . . . . . . . . . . 50,000 37,000
Total . . . . . . . . . . . . . . . . . . . . . . . . . . . . . . . . . . . . . . . . . . . . . . $147,000 $185,000
Required:
Prepare a cost of production summary for each department.
P5-9 Ledger account analysis; cost of production summary
Analyze the information presented in the following general
ledger account of Mantle Manufacturing Co., which has three
departments: Shaping, Forming, and Finishing:
Work in Process—Forming
Mar. 1 10,250 Mar. 31 50,000
31 Materials 4,000
31 Labor 8,000
31 Factoryoverhead
6,000
31 Shaping 36,000
Additional facts:
a. 2,000 units were in process at the beginning of the month,
one-half completed.
b. 10,000 units were received from Shaping during the month.
c. 8,000 units were transferred to Finishing during the month.
d. Unit costs in Shaping and Forming were the same for March
as for the prior month.
e. The ratio of materials, labor, and factory overhead costs for
Forming in the beginning and ending balances of Work in
Process was in the same ratio as the costs incurred in
Forming during the current month.
Required:
Prepare a cost of production summary for March.
P5-10 Journal entries
Required:
Using the data in P5-9, determine:
1. The cost of goods received from Shaping during the month.
2. The production costs incurred in Forming during the month.
3. The cost of goods completed and transferred to Finishing
during the month.
LO7
LO7
Chapter 5 – Process Cost Accounting—General Procedures 283

P5-11 Cost of production summary, three departments; change in unitcost from prior department; departmental cost work sheet;journal entries; manufacturing statement
Ichiro Manufacturing Co. uses the process cost system. The
following information for the month of December was obtained
from the company’s books and from the production reports
submitted by the department heads:
Production Report Mixing Blending BottlingUnits in process, beginning of period 2,500 1,500 3,000
Started in process during month 12,500 — —
Received from prior department — 13,000 10,000
Finished and transferred 13,000 10,000 11,000
Finished and on hand — 500 —
Units in process, end of period 2,000 4,000 2,000
Stage of completion 1/4 4/5 1/2
Production CostsWork in process, beginning of period:
Cost in Mixing . . . . . . . . . . . . . . . . . . . $3,075 $6,150
Materials . . . . . . . . . . . . . . . . . . . . . . $1,470
Labor . . . . . . . . . . . . . . . . . . . . . . . . . 650
Factory overhead . . . . . . . . . . . . . . 565
Cost in Blending . . . . . . . . . . . . . . . . . 3,660
Materials . . . . . . . . . . . . . . . . . . . . . . 240
Labor . . . . . . . . . . . . . . . . . . . . . . . . . 905
Factory overhead . . . . . . . . . . . . . . 750
Cost in Bottling
Materials . . . . . . . . . . . . . . . . . . . . . . 900
Labor . . . . . . . . . . . . . . . . . . . . . . . . . 3,100
Factory overhead . . . . . . . . . . . . . . 3,080
Costs incurred during month:
Materials . . . . . . . . . . . . . . . . . . . . . . . . 15,000 2,500 1,500
Labor . . . . . . . . . . . . . . . . . . . . . . . . . . . . 4,750 8,000 6,500
Factory overhead . . . . . . . . . . . . . . . . 5,240 6,100 7,000
Total . . . . . . . . . . . . . . . . . . . . . . . . . . $27,675 $21,570 $31,890
Required:
1. Prepare cost of production summaries for the Mixing, Blend-
ing, and Bottling departments.
2. Prepare a departmental cost work sheet.
3. Draft the journal entries required to record the month’s
operations.
4. Prepare a statement of cost of goods manufactured for
December.
LO7
LO8
284 Principles of Cost Accounting

MINI-CASE
Ethics; Equivalent units of production
New York Beverages, Inc., has three plants that make and bottle cola,
lemon-lime, and miscellaneous flavored beverages, respectively. The raw
materials, labor costs, and automated technology are comparable among
the three plants. Top management has initiated an incentive compensa-
tion plan whereby the workers and managers of the plant with the lowest
unit cost per bottle will receive a year-end bonus. The results, approved by
the plant manager and reported by the plant controllers at each location,
were as follows:
(Note: tabular presentation not necessary in final draft.)
Item Bronx Brooklyn QueensMaterials . . . . . . . . . . . . . . . . . . . . $200,000 $450,000 $325,000
Labor . . . . . . . . . . . . . . . . . . . . . . . 170,000 375,000 250,000
Overhead . . . . . . . . . . . . . . . . . . . 340,000 750,000 500,000
Total . . . . . . . . . . . . . . . . . . . . . . . . $710,000 $1,575,000 $1,075, 000
Equivalent units of production:
Completed . . . . . . . . . . . . . . . . . . 3,500,000 6,200,000 6,450,000
Ending work in process . . . . . . 100,000(50% complete)
400,000(25% complete)
__________
Equivalent units . . . . . . . . . . . . . 3,550,000 6,300,000 6,450,000
Unit cost . . . . . . . . . . . . . . . . . . . . $0.20 $0.25 $0.167
Required:
1. When provided copies of the results as a justification for distributing
the bonus to the Queens employees, the plant controllers at Bronx and
Brooklyn accused Queens of manipulating the inventory figures. Re-
viewing the above schedule, what do you think is the nature of the
accusation and how would such action affect the unit cost
computation?
2. Is there anything in the Institute of Management Accountants (IMA)
Code of Professional Ethics that the Queens plant controller should be
aware of in this situation?
3. Assume that the Queens plant controller revises the unit cost to more
accurately reflect reality. What should she do if the plant manager
insists that the unit cost computation remain as is?
INTERNET EXERCISE
Process Costing
General Mills is a company that uses process costing extensively. Go to
the companion Web site at www.cengage.com/accounting/vanderbeck
and click on the file for General Mills.
LO2
LO1
LO3
Chapter 5 – Process Cost Accounting—General Procedures 285

Required:
Answer the following questions while navigating General Mills’s ‘‘A Cham-
pion’s Code of Conduct’’:
1. What guidance are supervisors given on how to handle a request from
an outsider, claiming to be working as a General Mills consultant, for
information on employees’ start dates, titles, and base salaries?
2. What guidance is given to an employee who was planning to make a
General Mills stock trade prior to becoming aware of material non-
public information?
3. What advice is given to an employee working in Europe who received
an expensive gift from a supplier in recognition of a new contract?
4. What advice is given to an employee who was told that she had to pay
a gratuity to a minor official to clear General Mills’s products through
customs?
286 Principles of Cost Accounting

CHAPTER 6
Process Cost Account ing—Addit iona l Procedures ;
Account ing for Joint Productsand By-Products
An article, ‘‘PepsiCo offers to buy 2 bottlers for $6 billion,‘‘ in the
April 21, 2009 San Diego Union Tribune reported that PepsiCo, a
company whose manufacturing process is ideal for process
costing because its major brands (Pepsi-Cola, Frito-Lay, Tropi-
cana, Quaker, and Gatorade) are produced in a continuous flow
of identical bottles of soda, bags of chips, and the like, is
attempting to acquire its two largest bottlers. If successful, ‘‘the
company will handle about 80% of its total North American
beverage volume.’’ This is a competitive move taken ‘‘in an
effort to update the way it delivers its products.’’ In 1999 PepsiCo
spun off Pepsi Bottling Group, but since then soft drink sales
have fallen as the sales of noncarbonated beverages have
soared. To learn more about PepsiCo and its brands visit
www.pepsico.com.
T he illustrative problems presented in Chapter 5 are based on theassumption that materials, labor, and factory overhead were uni-formly applied during the processing period. When the work in
process at the end of the accounting period was considered to be one-halfcompleted, it was assumed that one-half of the materials cost, one-half ofthe labor cost, and one-half of the factory overhead cost had been added.Chapter 6 illustrates process cost accounting when materials, labor, andoverhead are not applied uniformly during the period. Additional topicscovered in this chapter include accounting for units lost and gained duringproduction, assigning costs to inventories using the first-in, first-outmethod, and accounting for joint products and by-products.
Learning Objectives
After studying this
chapter, you should
be able to:
LO1Compute unit
costs when
materials are not
added uniformly
throughout the
process.
LO2Account for
units lost in
the production
process.
LO3Account for
units gained
in the production
process.
LO4Assign
costs to
inventories, using the
first-in, first-out
method.
LO5Identify the
methods
used to apportion joint
costs to joint products
and account for
by-products.

Equivalent Production—Materials NotUniformly AppliedIn industries that use continuous production systems, materials may be putinto production in varying quantities and at different points in the processingcycle. Before any manufacturing process can begin, some material must beintroduced in the first production department. For example, in the produc-tion of chemicals, various ingredients may be mixed, blended, and thenpackaged by direct laborers using machinery and other factory overheaditems. In this example, all of the ingredients are added at the beginning ofprocessing in the first department, Mixing. Then, labor and factory overheadare used to convert the raw material into a finished product. The stage ofcompletion of the partially completed units in ending work in process is100% as to materials because all materials will have been added at the verybeginning of production. Some labor and overhead costs will need to beapplied to the ending work in process during the next period to complete it.
In the second production department, Blending, the chemical ingredi-ents are processed further through another labor operation. At the end ofthe process in the second department, several new ingredients are added.The ending work in process inventory in the second department, therefore,would have had a part of the departmental labor and overhead costs appliedto them, but no materials cost would have been added because the extraingredients are added at the very end of the process.
In the third department, Packaging, other materials, such as coloring,may be added to the units at the start of production. Then, the finishedchemicals are placed in plastic containers, which are yet another type of rawmaterial. In this department, the units in ending work in process will havehad some new materials (coloring) and some labor and overhead added, whilethe packaging materials (plastic containers) will not have been added untilthe completion stage. This is an example of a single cost item (materials)requiring two equivalent unit computations because the coloring additive andthe packaging materials are added at different times in the same department.
To illustrate the problems involved in calculating unit costs under theseconditions, this chapter presents three problems using the average costmethod. In these examples, materials are added at different stages in theprocess. Labor and factory overhead are assumed to be applied evenlythroughout the process. This assumption is reasonable in a manufacturingprocess where direct labor is significant, because the application of over-head is usually so closely related to the incurrence of labor costs thatoverhead is generally thought of as being incurred or applied in the sameratio as labor expense.
Illustrative Problem No. 1
Computing the unit cost in the Mixing Department where all the materials areadded at the beginning of processing—average cost method. The productionreport for the month submitted by the department head, presented inFigure 6-1, resembles those studied in the previous chapter. This
LO1Compute unit
costs when
materials are not
added uniformly
throughout the
process.
288 Principles of Cost Accounting

illustration is for the Newark Chemical Company, which has the followingdepartments: Mixing, Blending, and Packaging.
The cost of production summary, Figure 6-2, is similar to the summa-ries previously discussed, but it has the added highlighted feature ofdetermining equivalent units of production for materials separately fromthose for labor and factory overhead.
In Mixing, because all materials are added at the start of processing, it iseasy to determine the equivalent units for materials. The production reportfrom the factory indicates that 500 units were in process at the beginning ofthe month with all materials added, and enough materials were issued toproduction during the month to make another 2,500 units. Therefore, theequivalent production for materials is 3,000 units. Another way to calculatethe figure by the method used in this chapter is as follows: the 2,600 unitsfinished during the month plus the 400 units in process at the end of themonth have all of the materials added. Thus, the total equivalent produc-tion for materials is 3,000 units (2,600 þ 400).
The equivalent production for labor and factory overhead is calculatedas shown in the preceding chapter: 2,600 completed units, plus theequivalent of 300 completed units (400 units in ending work in process,three-fourths completed), for a total of 2,900.
With the equivalent production figures calculated for materials, labor,and overhead, the unit cost for the month can now be calculated. The costof each element in the beginning work in process is added to the cost forthat element incurred in the current month. The total cost for the elementis then divided by the appropriate equivalent production figure to determinethe unit cost for each element. In this example, the unit costs are: materials,$3.00; labor, $1.25; and overhead, $0.75; for a total unit cost of $5.00.
The 2,600 units transferred to Blending are costed at $5.00, amountingto a total cost of $13,000. In costing the ending work in process, the stageof completion and the point at which materials were added must be
Figure 6-1 Production Report, Mixing
In process, beginning of period
Stage of completion
Placed in process during period
Received from dept.
Transferred to dept.
Transferred to stockroom during period
In process, end of period
Stage of completion
For Month Ending
Dept.
500 units2/5
2,500 units
2,600 units
400 unitsAll materials; 3/4 labor and overhead
January 31, 2011
Mixing
PRODUCTION REPORT
during period
during periodBlending
Chapter 6 – Process Cost Accounting—Additional Procedures 289

considered. In this instance, because materials were put into production atthe beginning of the manufacturing cycle, the 400 units in process at the endof the period have had all materials added and are, therefore, costed at thefull unit cost of $3.00 for materials. Because the goods are only three-fourths
Figure 6-2 Cost of Production Summary, Mixing
Newark Chemical CompanyCost of Production Summary—Mixing Department
For the Month Ended January, 31, 2011Cost of work in process, beginning of month:
Materials . . . . . . . . . . . . . . . . . . . . . . . . . . . . . . . . . . . . . . . . . . . . . $1,500
Labor . . . . . . . . . . . . . . . . . . . . . . . . . . . . . . . . . . . . . . . . . . . . . . . . 250
Factory overhead . . . . . . . . . . . . . . . . . . . . . . . . . . . . . . . . . . . . . 150 $ 1,900
Cost of production for month:
Materials . . . . . . . . . . . . . . . . . . . . . . . . . . . . . . . . . . . . . . . . . . . . . $7,500
Labor . . . . . . . . . . . . . . . . . . . . . . . . . . . . . . . . . . . . . . . . . . . . . . . . 3,375
Factory overhead . . . . . . . . . . . . . . . . . . . . . . . . . . . . . . . . . . . . . 2,025 12,900
Total costs to be accounted for . . . . . . . . . . . . . . . . . . . . . . . . . . $14,800
Unit output for month:
Materials:
Finished and transferred to Blending during month . . . 2,600
Equivalent units of work in process, end of month(400 units, all materials) . . . . . . . . . . . . . . . . . . . . . . . . . . 400
Total equivalent production . . . . . . . . . . . . . . . . . . . . . . . . . 3,000
Labor and factory overhead:
Finished and transferred to Blending during month . . . 2,600
Equivalent units of work in process, end of month(400 units, three-fourths completed) . . . . . . . . . . . . . . 300
Total equivalent production . . . . . . . . . . . . . . . . . . . . . . . . . 2,900
Unit cost for month:
Materials [($1,500 þ $7,500) � 3,000] . . . . . . . . . . . . . . . . . . . $3.00
Labor [($250 þ $3,375) � 2,900] . . . . . . . . . . . . . . . . . . . . . . . . 1.25
Factory overhead [($150 þ $2,025) � 2,900] . . . . . . . . . . . . . 0.75
Total . . . . . . . . . . . . . . . . . . . . . . . . . . . . . . . . . . . . . . . . . . . . . . . $ 5.00
Inventory costs:
Cost of goods finished and transferred to Blendingduring month (2,600 � $5) . . . . . . . . . . . . . . . . . . . . . . . . . . $13,000
Cost of work in process, end of month:
Materials (400 � $3) . . . . . . . . . . . . . . . . . . . . . . . . . . . . . . . . . $1,200
Labor (400 � 3/4 � $1.25) . . . . . . . . . . . . . . . . . . . . . . . . . . . . 375
Factory overhead (400 � 3/4 � $0.75) . . . . . . . . . . . . . . . . 225 1,800
Total production costs accounted for . . . . . . . . . . . . . . . . . . . . . $14,800
290 Principles of Cost Accounting

completed as to labor and factory overhead, the 400 partially completedunits have the equivalent amount of labor and overhead added that wouldbe needed to complete 300 whole units (400 � 3/4).
Illustrative Problem No. 2
Computing the unit cost in the Blending Department where all the materials areadded at the close of processing—average cost method. Figure 6-3 shows theproduction report for Blending. Because the materials are added at the endof the process in Blending, those costs will be applied only to those unitsfinished and transferred out of Blending. Therefore, the equivalent produc-tion for the month for materials in Blending is the same as the number ofunits completed and transferred out, 2,500. The equivalent unit computa-tion for labor and factory overhead adds the 2,500 finished units to theequivalent production of the ending work in process, 350 units two-fifthscompleted, or 140 (350 � 2/5), for a total of 2,640. The cost of productionsummary for Blending, with the equivalent unit computations highlighted,is illustrated in Figure 6-4.
As was done for Mixing, the unit cost for each element is determined byadding the cost in the beginning work in process to the cost for that elementincurred during the month and then dividing the total by the equivalent unitsof production. For Blending, these unit costs for materials, labor, and factoryoverhead are $4, $4, and $2, respectively, for a total cost of $10.
The units finished and transferred to the Packaging Department arevalued at the full unit cost of $5 from Mixing, plus the unit cost of $10 addedin Forming, for a total cost transferred of $37,500 (2,500 units � $15).
The cost of the units in process at the end of the period in Blendingincludes the full cost of $5 from Mixing. There is no Blending Departmentmaterials cost in the ending work in process inventory for that department,because materials are added only at the end of the process. Because the unitsare two-fifths completed as to labor and factory overhead in Blending, the
Figure 6-3 Production Report, Blending
In process, beginning of period
Stage of completion
Placed in process during period
Received from dept.
Transferred to dept.
Transferred to stockroom during period
In process, end of period
Stage of completion
For Month Ending
Dept.
250 units1/2
2,600 units2,500 units
350 units No materials; 2/5 labor and overhead
January 31, 2011
Blending
PRODUCTION REPORT
during period
during periodPackagingMixing
Chapter 6 – Process Cost Accounting—Additional Procedures 291

Figure 6-4 Cost of Production Summary, Blending
Newark Chemical CompanyCost of Production Summary—Blending Department
For the Month Ended January 31, 2011Cost of work in process, beginning of month—Blending:
Cost in Mixing . . . . . . . . . . . . . . . . . . . . . . . . . . . . . . . . . . . . . . . . . . . . $ 1,250
Cost in Blending:
Materials . . . . . . . . . . . . . . . . . . . . . . . . . . . . . . . . . . . . . . -0-
Labor . . . . . . . . . . . . . . . . . . . . . . . . . . . . . . . . . . . . . . . . . $1,560
Factory overhead . . . . . . . . . . . . . . . . . . . . . . . . . . . . . . 780 750 $ 2,000
Cost of goods received from Mixing during month . . . . . . . . . . . 13,000
Cost of production for month:
Materials . . . . . . . . . . . . . . . . . . . . . . . . . . . . . . . . . . . . . . . . . . . . . . . . $10,000
Labor . . . . . . . . . . . . . . . . . . . . . . . . . . . . . . . . . . . . . . . . . . . . . . . . . . . 9,000
Factory overhead . . . . . . . . . . . . . . . . . . . . . . . . . . . . . . . . . . . . . . . . 4,500 25,090
Total costs to be accounted for . . . . . . . . . . . . . . . . . . . . . . . . . . . . . $40,090
Unit output for month:
Materials:
Finished and transferred to Packaging during month . . . . . 2,500
Equivalent units of work in process, end of month . . . . . . . -0-
Total equivalent production . . . . . . . . . . . . . . . . . . . . . . . . . . . . . . . . . 2,500
Labor and factory overhead:
Finished and transferred to Packaging during month . . . . . . . 2,500
Equivalent units of work in process, end of month(350 units, two-fifths completed) . . . . . . . . . . . . . . . . . . . . . . . . 140
Total equivalent production . . . . . . . . . . . . . . . . . . . . . . . . . . . . . . . . . 2,640
Unit cost for month—Blending:
Materials ($10,000 � 2,500) . . . . . . . . . . . . . . . . . . . . . . . . . . . . . . . $ 4.00
Labor [($1,560 þ $9,000) � 2,640] . . . . . . . . . . . . . . . . . . . . . . . . . 4.00
Factory overhead [($780 þ $4,500) � 2,640] . . . . . . . . . . . . . . . . 2.00
Total . . . . . . . . . . . . . . . . . . . . . . . . . . . . . . . . . . . . . . . . . . . . . . . . . . $ 10.00
Inventory costs:
Cost of goods finished and transferred to Packaging during month:
Cost in Mixing (2,500 � $ 5) . . . . . . . . . . . . . . . . . . . . . . . . . . $12,500
Cost in Blending (2,500 � $10) . . . . . . . . . . . . . . . . . . . . . . . . . . 25,000
(2,500 � $15) . . . . . . . . . . . . . . . . . . . . . . . . . . $37,500
Cost of work in process, end of month:
Cost in Mixing (350 � $5) . . . . . . . . . . . . . . . . . . . . . . . . . . . . . . . $ 1,750
Cost in Blending:
Materials . . . . . . . . . . . . . . . . . . . . . . . . . . . . . . . . . . . . -0-
Labor (350 � 2/5 � $4) . . . . . . . . . . . . . . . . . . . . . . . $ 560
Factory overhead (350 � 2/5 � $2) . . . . . . . . . . . . 280 840 2,590
Total production costs accounted for . . . . . . . . . . . . . . . . . . . . . . . $40,090
292 Principles of Cost Accounting

350 partially completed units in ending work in process have the equivalentamount of labor and overhead added that would be needed to complete 140(350 � 2/5) whole units. The combination of these items results in a cost of$2,590 for the ending work in process, as shown in Figure 6-4.
Illustrative Problem No. 3
Computing the unit cost in the Packaging Department, where 60% of thematerials cost is added to production at the beginning of processing and 40% of thematerials are added when the processing is one-half completed—average costmethod. In Packaging, the calculation of equivalent production is moredifficult because materials are added at different points throughout theprocess. The stage of completion of units in process cannot be averaged butmust be reported in separate groups of units at various points in themanufacturing operation as indicated in the production report, shown inFigure 6-5. In calculating the units of output for the period, as highlightedin the cost of production summary for Packaging (Figure 6-6), the stage ofcompletion for each type of material must be computed separately.
The equivalent production for materials for the month is calculated asfollows: 2,400 units were finished, which included all of the materials; 200units in ending work in process are one-fourth completed—because theyare not yet at the halfway point of the production process, only 60% of thematerials and the color additives, but no packaging materials, have beenadded to these uncompleted units, which is an equivalent of 120 units(200 � 60%); and 400 units in ending work in process are three-fourthscompleted. Since these 400 units have passed the halfway stage, both thecoloring and packaging materials have been added to these units, represent-ing a total of 400 equivalent units. Combining these figures—2,400, 120,and 400—results in equivalent production for materials of 2,920 units.
Figure 6-5 Production Report, Packaging
200 units 3/4 completed; 300 units 1/3 completedIn process, beginning of period
Stage of completion
Placed in process during period
Received from dept.
Transferred to dept.
Transferred to stockroom during period
In process, end of period
Stage of completion
For Month Ending
500 units
2,500 units
2,400 units 600 units
400 units 100% completed and 200 units 60% completed as to materials; 200 units 1/4 completed and 400 units 3/4 completed as to labor and overhead
January 31, 2011
Packaging
PRODUCTION REPORT
during period
during period
Blending
Chapter 6 – Process Cost Accounting—Additional Procedures 293

Figure 6-6 Cost of Production Summary, Packaging
Newark Chemical CompanyCost of Production Summary—Packaging Department
For the Month Ended January 31, 2011Cost of work in process, beginning of month—Packaging:
Cost in Mixing . . . . . . . . . . . . . . . . . . . . . . . . . . . . . . . . . . . . . . . . $ 2,500
Cost in Blending . . . . . . . . . . . . . . . . . . . . . . . . . . . . . . . . . . . . . . 5,000
Cost in Packaging
Materials . . . . . . . . . . . . . . . . . . . . . . . . . . . . . . . . . . . $665
Labor . . . . . . . . . . . . . . . . . . . . . . . . . . . . . . . . . . . . . . 300
Factory overhead . . . . . . . . . . . . . . . . . . . . . . . . . . . 150 1,115 $ 8,615
Cost of goods received from Blending during month . . . . . . 37,500
Cost of production for month:
Materials . . . . . . . . . . . . . . . . . . . . . . . . . . . . . . . . . . . . . . . . . . . . . $ 4,445
Labor . . . . . . . . . . . . . . . . . . . . . . . . . . . . . . . . . . . . . . . . . . . . . . . . . 3,000
Factory overhead . . . . . . . . . . . . . . . . . . . . . . . . . . . . . . . . . . . . . 1,500 8,945
Total costs to be accounted for . . . . . . . . . . . . . . . . . . . . . . . . . . . $55,060
Unit output for month:
Materials:
Finished and transferred to finished goodsduring month . . . . . . . . . . . . . . . . . . . . . . . . . . . . . . . . . . . 2,400
Equivalent units of work in process, end of month:
200 units, one-fourth completed (60% of materials) . 120
400 units, three-fourths completed (all materials) . . . 400
Total equivalent production . . . . . . . . . . . . . . . . . . . . . . . 2,920
Labor and overhead:
Finished and transferred to finished goodsduring month . . . . . . . . . . . . . . . . . . . . . . . . . . . . . . . . . . . 2,400
Equivalent units of work in process, end of month:
200 units, one-fourth completed . . . . . . . . . . . . . . . . . . . 50
400 units, three-fourths completed . . . . . . . . . . . . . . . . 300
Total equivalent production . . . . . . . . . . . . . . . . . . . . . . . 2,750
Unit cost for month—Packaging:
Materials [($665 þ $4,445) � 2,920] . . . . . . . . . . . . . . . . . . . . . $ 1.75
Labor [($300 þ $3,000) � 2,750] . . . . . . . . . . . . . . . . . . . . . . . . 1.20
Factory overhead [($150 þ $1,500) � 2,750] . . . . . . . . . . . . . 0.60
Total . . . . . . . . . . . . . . . . . . . . . . . . . . . . . . . . . . . . . . . . . . . . . . . $ 3.55
Inventory costs:
Cost of goods finished and transferred to finishedgoods during month:
Cost in Mixing (2,400 � $ 5.00) . . . . . . . . . . . . . . . . . . . $12,000
Cost in Blending (2,400 � $10.00) . . . . . . . . . . . . . . . . . . . 24,000
Cost in Packaging (2,400 � $ 3.55) . . . . . . . . . . . . . . . . . . . 8,520
(2,400 � $18.55) . . . . . . . . . . . . . . . . . . . $44,520
(Continued )
294 Principles of Cost Accounting

It is simpler to calculate the equivalent units for labor and factoryoverhead: 2,400 completed units, plus the equivalent of 50 completed units(200 � ¼), plus the equivalent of 300 completed units (400 units � 3=4)totals 2,750 units of equivalent production for labor and overhead.
The unit costs for the month are calculated as previously illustrated andare $1.75, $1.20, and $0.60 for materials, labor, and factory overhead,respectively, for a total unit cost of $3.55 in Packaging. The cost of theunits finished and transferred to the finished goods storeroom includes theunit costs from Mixing of $5, from Blending of $10, and from Packaging of$3.55, for a total cost of $18.55.
In calculating the cost to be assigned to the ending work in process, thestage of completion must be considered. The 200 units that are one-fourthcompleted will have all the costs from Mixing and Blending assigned to thembecause they would not have been transferred on had they not been completeas to those departments. The costs in Packaging are determined as follows:60% of the materials cost has been added to the 200 units, an equivalent of120 units. The cost of the materials will be as follows: 200 units � 60% �$1.75 ¼ $210. The costs allocated for labor and overhead are one-fourthof this month’s unit cost for each, or 200 units � 25% � $1.20 ¼ $60 forlabor and 200 units � 25% � $0.60 ¼ $30 for overhead.
The 400 units that are three-fourths completed are again assigned all ofthe unit costs from Blanking ($5) and Forming ($10). Although these unitsare still in process, all materials required by Packaging have been added.Therefore, they are charged for the full cost of materials in Packaging,$700 (400 units � $1.75). Three-fourths of the cost for labor and factoryoverhead would also be included in the cost of these units: $360 for labor
Cost of work in process, end of month:
200 units, one-fourth completed:
Cost in Mixing (200 � $5) . . . . . . . . . . . . . . . . . . . . . . . . . . $ 1,000
Cost in Blending (200 � $10) . . . . . . . . . . . . . . . . . . . . . . . 2,000
Cost in Packaging:
Materials (200 � 60% � $1.75) . . . . . . . . . . . $210
Labor (200 � 25% � $1.20) . . . . . . . . . . . . . . . 60
Factory overhead (200 � 25% � $0.60) . . . 30 300
400 units, three-fourths completed:
Cost in Mixing (400 � $5) . . . . . . . . . . . . . . . . . . . . . . . . . . 2,000
Cost in Blending (400 � $10) . . . . . . . . . . . . . . . . . . . . . . . 4,000
Cost in Packaging:
Materials (400 � $1.75) . . . . . . . . . . . . . . . . . . $700
Labor (400 � 75% � $1.20) . . . . . . . . . . . . . . . 360
Factory overhead (400 � 75% � $0.60) . . . 180 1,240 10,540
Total production costs accounted for . . . . . . . . . . . . . . . . . . . . . $55,060
Figure 6.6 (Continued )
Chapter 6 – Process Cost Accounting—Additional Procedures 295

(400 units � 75% � $1.20), and $180 for overhead (400 units � 75% �$0.60).
After the cost of production summaries have been prepared for eachdepartment, the journal entries can be made as illustrated in Chapter 5.Entries would be made to transfer costs from one department to the nextdepartment and so on, ending at Finished Goods. The actual costs incurredduring the month for materials, labor, and factory overhead would berecorded in the journals and ledgers. After all entries have been made, thework in process accounts in the general ledger should have balances thatequal the cost assigned to work in process on the cost of productionsummaries. If desired, a departmental cost work sheet can be prepared aswas illustrated in Chapter 5.
Units Lost in ProductionIn many industries that have a process manufacturing operation, theproduction process is of a nature that some units will always be lost due toevaporation, shrinkage, spillage, or other factors. The effect of such lossesis that when the number of units completed in a given period is added tothe number of units still in process at the end of the period, the total unitscalculated will be less than the number of units that were initially placedinto production.
These normal losses are expected in the manufacturing process andcannot be avoided. They represent a necessary cost of producing the goodunits. These normal losses are treated as product costs; that is, the cost ofthe lost units is included as a part of the cost of all units finished or still inprocess because the good units could not have been produced without thisnormal spoilage. In other words, the good units absorb the cost of the unitslost. The effect is that the unit cost of the remaining units is greater than ifno losses had occurred, because the production costs for the period are
Recall and Review 1
Beginning inventory was 4,000 units, one-fourth complete as to labor and
factory overhead. During the period, 30,000 units were started in process
and 28,000 units were finished. There were 6,000 units in ending work in
process, one-half complete as to labor and factory overhead. Assuming that
the average costing method is used and that all materials are put into
production at the beginning of the process, while labor and overhead are
applied evenly throughout production, the equivalent units of production
for direct materials and for direct labor and factory overhead would be
___________ and __________, respectively.
(After working this exercise, see page 315 for the solution.)
You should now be able to work the following:
Questions 1–5; Exercises 6-1 to 6-6; Problems 6-1 to 6-4; and Internet
Exercise.
LO2Account for
units lost in
the production
process.
296 Principles of Cost Accounting

spread over a smaller number of good units. In many industries, costing thewaste or spoilage is more than just spreading the production costs over theremaining good units. For example, in the chemical industry additional costsmay include the costs of disposing of or treating the chemical waste inaccordance with environmental regulations and the cost of any cleaningfluids needed to cleanse the plant and equipment contaminated by the waste.
The following example illustrates the concept of normal lost units.Assume that materials, labor, and factory overhead are applied evenlythroughout the process; units are lost throughout the process, but inspec-tion does not occur until the end of the process. The monthly productionreport for the Refining Department of Texas Oil Corporation reports thefollowing data:
Units started in process . . . . . . . . . . . . . . . . . . . . . . . . . . . . . . . . . . . . 12,000
Units finished and transferred to the next department . . . . . . . 9,000
Units still in process, one-half completed(materials, labor, and overhead) . . . . . . . . . . . . . . . . . . . . . . . . . . 2,000 11,000
Units lost in production . . . . . . . . . . . . . . . . . . . . . . . . . . . . . . . . . . . . 1,000
This report is significant to factory managers, who review these figuresto determine whether they represent normal unavoidable losses or abnor-mal losses that will require a different type of action. From the productionstatistics and costs of production data for the month, a cost of productionsummary as shown in Figure 6-7 can be prepared.
The cost of production summary shows that the lost units have notbeen considered. They have been ignored in the highlighted calculation ofequivalent production and in the determination of inventory costs. If the1,000 units had not been spoiled but instead had been completed accordingto specifications, equivalent production would have been 11,000 units(10,000 finished units þ 1,000 equivalent units in ending work in process),and the unit costs for materials, labor, and factory overhead would havebeen lower. In the case illustrated, there is a loss of units that have alreadyincurred some costs, which will be absorbed by the good units producedduring the month.
The preceding discussion has considered only normal losses such asthose that result from the inability to achieve perfection in the productionprocess, with the cost of lost units being treated as product cost—that is,charged to the remaining good units and, therefore, increasing the cost perunit. But abnormal losses, such as those caused by machine breakdownsdue to inadequate maintenance and machine operator errors, may alsooccur. Such losses are not expected in the manufacturing process andshould not happen under normal, efficient operating conditions. Theseabnormal losses are not included as part of the cost of transferred orfinished goods, but are treated as a period cost—that is, they are charged toa separate account, such as Loss from Abnormal Spoilage, and are shown asa separate item of expense on the current income statement. These lossesdo not become a part of the manufacturing costs transferred to subsequentdepartments, finished goods, and cost of goods sold.
Chapter 6 – Process Cost Accounting—Additional Procedures 297

Units Gained in ProductionFor some products, the addition of materials in any department after thefirst department may increase the number of units being processed. Forexample, assume that a liquid product is being produced. In the firstdepartment, 1,000 gallons of various materials are put into production. Inthe next department, an additional 500 gallons of a different material areadded, increasing the number of gallons being manufactured to 1,500. Thisincrease in units has the opposite effect on unit costs than did lost units, andit requires an adjustment to the unit cost. The calculation of this adjustedunit cost is similar to that made when units are lost, except that the totalcost for the original units are now spread over a greater number of units inthe subsequent department, thereby reducing the cost per unit.
Figure 6-7 Texas Oil Cost of Production Summary, Refining Dept.
Texas Oil CorporationCost of Production Summary—Refining Department
For the Month Ended July 31, 2011Cost of production for month:
Materials . . . . . . . . . . . . . . . . . . . . . . . . . . . . . . . . . . . . . . . . . . . . . . . $20,000
Labor . . . . . . . . . . . . . . . . . . . . . . . . . . . . . . . . . . . . . . . . . . . . . . . . . . 10,000
Factory overhead . . . . . . . . . . . . . . . . . . . . . . . . . . . . . . . . . . . . . . . 5,000
Total costs to be accounted for . . . . . . . . . . . . . . . . . . . . . . . . . . . . $35,000
Unit output for month:
Finished and transferred to Transportation Dept.during month . . . . . . . . . . . . . . . . . . . . . . . . . . . . . . . . . . . . . . . 9,000
Equivalent units of work in process, end of month(2,000 units, one-half completed as to materials, labor,and factory overhead) . . . . . . . . . . . . . . . . . . . . . . . . . . . . . . . 1,000
Total equivalent production . . . . . . . . . . . . . . . . . . . . . . . . . . . . . . . 10,000
Unit cost for month:
Materials ($20,000 � 10,000) . . . . . . . . . . . . . . . . . . . . . . . . . . . . $ 2.00
Labor ($10,000 � 10,000) . . . . . . . . . . . . . . . . . . . . . . . . . . . . . . . . 1.00
Factory overhead ($5,000 � 10,000) . . . . . . . . . . . . . . . . . . . . . . 0.50
Total . . . . . . . . . . . . . . . . . . . . . . . . . . . . . . . . . . . . . . . . . . . . . . . . . $ 3.50
Inventory costs:
Cost of goods finished and transferred to
Transportation Dept. during month (9,000 � $3.50) . . . . . $31,500
Cost of work in process, end of month:
Materials (2,000 � 1/2 � $2) . . . . . . . . . . . . . . . . . . . . . . . . . . . $2,000
Labor (2,000 � 1/2 � $1) . . . . . . . . . . . . . . . . . . . . . . . . . . . . . . . 1,000
Factory overhead (2,000 � 1/2 � $0.50) . . . . . . . . . . . . . . . . . 500 3,500
Total production costs accounted for . . . . . . . . . . . . . . . . . . . . . . $35,000
LO3Account for
units gained
in the production
process.
298 Principles of Cost Accounting

To illustrate, assume that a concentrated detergent, Genie, is manu-factured. During the month, 10,000 gallons of the partially processedproduct are transferred to the Blending Department at a cost of$15,000, and a unit cost of $1.50 ($15,000/10,000 gal). In the BlendingDepartment, 5,000 gallons of additional materials are added to these
Figure 6-8 Genie Cost of Production Summary, Blending
G & P Manufacturing CompanyCost of Production Summary for Genie—Blending Department
For the Month Ended May 31, 2011Cost of goods received from Mixing Dept. during month
(10,000 gallons � $1.50) . . . . . . . . . . . . . . . . . . . . . . . . . . . . . . . . . . . $15,000
Cost of production for month:
Materials . . . . . . . . . . . . . . . . . . . . . . . . . . . . . . . . . . . . . . . . . . . . . . . . . $15,400
Labor . . . . . . . . . . . . . . . . . . . . . . . . . . . . . . . . . . . . . . . . . . . . . . . . . . . . . 3,500
Factory overhead . . . . . . . . . . . . . . . . . . . . . . . . . . . . . . . . . . . . . . . . . 2,800 21,700
Total costs to be accounted for . . . . . . . . . . . . . . . . . . . . . . . . . . . . . . . $36,700
Unit output for month:
Finished and transferred to finished goods . . . . . . . . . . . . . . . . . . 13,000
Equivalent units of work in process, end of month(2,000 gallons, one-half completed as to materials,labor, and factory overhead ) . . . . . . . . . . . . . . . . . . . . . . . . . . . . 1,000
Total equivalent production . . . . . . . . . . . . . . . . . . . . . . . . . . . . . . 14,000
Unit cost for month:
Materials ($15,400 � 14,000) . . . . . . . . . . . . . . . . . . . . . . . . . . . . . . . $ 1.10
Labor ($3,500 � 14,000) . . . . . . . . . . . . . . . . . . . . . . . . . . . . . . . . . . . . 0.25
Factory overhead ($2,800 � 14,000) . . . . . . . . . . . . . . . . . . . . . . . . 0.20
Total . . . . . . . . . . . . . . . . . . . . . . . . . . . . . . . . . . . . . . . . . . . . . . . . . . . $ 1.55
Inventory costs:
Cost of goods finished and transferred to finished goods:
Cost in Mixing (13,000 � $1.00*, adjusted unitcost) . . . . . . . . . . . . . . . . . . . . . . . . . . . . . . . . . . . . . . . . . . . . . . . . . $13,000
Cost in Blending (13,000 � $1.55) . . . . . . . . . . . . . . . . . . . . . . . . . 20,150
(13,000 � $2.55) . . . . . . . . . . . . . . . . . . . . . . . . . $33,150
Cost of work in process, end of month:
Cost in Mixing Dept. (2,000 � $1.00*, adjusted unit cost) . . $ 2,000
Cost in Blending Dept.:
Materials (2,000 � 1/2 � $1.10) . . . . . . . . . . . . . . . . . $1,100
Labor (2,000 � 1/2 � $0.25) . . . . . . . . . . . . . . . . . . . . . 250
Factory overhead (2,000 � 1/2 � $0.20) . . . . . . . . . . 200 1,550 3,550
Total production costs accounted for . . . . . . . . . . . . . . . . . . . . . . . . . $36,700
*$15,000 � 15,000 gal ¼ $1 per gal
Chapter 6 – Process Cost Accounting—Additional Procedures 299

units in process. As these materials are added, the mixing and refining ofthe liquid involves the equal application of materials, labor, and over-head. A production report shows that 13,000 gallons were completedand transferred to finished goods, leaving 2,000 gallons in process, one-half completed. The cost of production summary, Figure 6-8, shows thatthe cost transferred from the Mixing Department for the production of10,000 gallons was $15,000, or $1.50 per unit. The addition of 5,000 gallonsin the Blending Department increased the liquid in process to 15,000gallons. The $15,000 cost from the Mixing Department must now bespread over these 15,000 gallons, resulting in an adjusted unit cost of $1.00per gallon in the previous department, as highlighted in the cost ofproduction summary.
Equivalent Production:First-In, First-Out MethodThe previous discussion and illustrations have used the average costingmethod. As mentioned in Chapter 5, another method commonly used is thefirst-in, first-out (FIFO) method. This procedure assumes that the unitcosts calculated for the current period are used for a variety of reasons: first,to complete the beginning units of work in process; second, to start andfully complete an additional number of units; and finally, to start other unitsthat will remain unfinished at the end of the period.
The two problems that follow illustrate the FIFO method and compareit to the average costing method for Robotics Manufacturing, Inc., whichhas the following two departments: Department 1—Machining and De-partment 2—Assembly. When studying these examples, note that FIFOcosting differs from average costing only if there are units in process at thestart of the period. If no beginning work in process exists, both methodswill produce the same results.
Whether using the FIFO or the average cost method, the first step inpreparing the cost of production summary is to list the costs that must beaccounted for: the beginning balance of work in process, the currentperiod’s production costs, and the cost of units transferred from a priordepartment, if any. With the FIFO method, it is not necessary to breakdown the cost of the beginning work in process into its cost elements as theaverage cost method requires.
The second step under the FIFO method, as with the average costprocedure, is to determine the unit output for the month. If there wereunits in process at the start of the period, the total equivalent productionfigures for the FIFO method will differ from those for the average costmethod because the unit output required to complete the beginning workin process must be calculated under FIFO. A comparison of the computa-tion of equivalent units of production using average costing and FIFOcosting, with the amounts in the following Illustrative Problem No. 1, ispresented in Figure 6-9.
LO4Assign costs
to inventories,
using the first-in, first-
out method.
300 Principles of Cost Accounting

Illustrative Problem No. 1FIFO cost method compared with average cost method—materials added at startof process. Assume that in Department 1 (Machining), materials are added atthe start of processing. Labor and factory overhead are applied evenlythroughout the process. The production report for March reflects thefollowing data:
Units in process, beginning of month, two-thirdscompleted as to labor and factory overhead . . . . . . . . . . . . . . . . . . . . 3,000
Units started in process . . . . . . . . . . . . . . . . . . . . . . . . . . . . . . . . . . . . . . . . . 9,000
Units finished and transferred to Dept. 2 (Assembly) . . . . . . . . . . . . . . 8,000
Units in process, end of month, one-half completed as tolabor and factory overhead . . . . . . . . . . . . . . . . . . . . . . . . . . . . . . . . . . . . 4,000
Cost data are as follows:
Beginning work in process, prior month’s cost:
Materials . . . . . . . . . . . . . . . . . . . . . . . . . . . . . . . . . . . . . . . . . . . . . . . . . . . . . $ 9,600
Labor . . . . . . . . . . . . . . . . . . . . . . . . . . . . . . . . . . . . . . . . . . . . . . . . . . . . . . . . 3,600
Factory overhead . . . . . . . . . . . . . . . . . . . . . . . . . . . . . . . . . . . . . . . . . . . . . 2,800
Total . . . . . . . . . . . . . . . . . . . . . . . . . . . . . . . . . . . . . . . . . . . . . . . . . . . . . . . $16,000
Current month’s production costs:
Materials . . . . . . . . . . . . . . . . . . . . . . . . . . . . . . . . . . . . . . . . . . . . . . . . . . . . . $27,000
Labor . . . . . . . . . . . . . . . . . . . . . . . . . . . . . . . . . . . . . . . . . . . . . . . . . . . . . . . . 16,000
Factory overhead . . . . . . . . . . . . . . . . . . . . . . . . . . . . . . . . . . . . . . . . . . . . . 8,000
Total . . . . . . . . . . . . . . . . . . . . . . . . . . . . . . . . . . . . . . . . . . . . . . . . . . . . . . . $51,000
A cost of production summary using the FIFO method is presented inFigure 6-10 with the unit output section highlighted. For comparativepurposes, Figure 6-11 shows a cost of production summary using theaverage cost method with the same data.
Figure 6-9 Comparison of Equivalent Units Computation in Department 1 by Using Average Costing
and FIFO Costing
Beginning Workin Process:3,000 units, 2/3 Complete
Average Costing:
5,000 units Startedand Completed During the Period
Ending Workin Process:4,000 units,1/2 Complete
Beginning Workin Process:3,000 units, 2/3 Complete
FIFO Costing:
5,000 units Startedand Completed
Ending Workin Process:4,000 units,1/2 Complete
9,000 units Started During Month 9,000 units Started During Month
Work Done toComplete BeginningWork in Process (3,000 × 1/3) ...... 1,000Units Started andCompleted This period ................... 5,000Work Done This periodon Ending Work inProcess (4,000 × 1/2) ................... 2,000Equivalent units of production ...... 8,000
Units Completed andTransferred to Dept 2 .................... 8,000Ending Work in Process ............... 2,000Equivalent units of production 10,000
Chapter 6 – Process Cost Accounting—Additional Procedures 301

Figure 6-10 Cost of Production Summary, Dept. 1, FIFO Method
FIFO METHODRobotics Manufacturing, Inc.
Cost of Production Summary—Department 1 (Machining)For the Month Ended March 31, 2011
Cost of work in process, beginning of month . . . . . . . . . . . . . . . $ 16,000
Cost of production for month:
Materials . . . . . . . . . . . . . . . . . . . . . . . . . . . . . . . . . . . . . . . . . . . . . . $ 27,000
Labor . . . . . . . . . . . . . . . . . . . . . . . . . . . . . . . . . . . . . . . . . . . . . . . . . . 16,000
Factory overhead . . . . . . . . . . . . . . . . . . . . . . . . . . . . . . . . . . . . . . 8,000 51,000
Total costs to be accounted for . . . . . . . . . . . . . . . . . . . . . . . . . . . . $ 67,000
Unit output for month:
Materials
Labor andFactory
OverheadTo complete beginning units in process
(no materials, 1/3 labor and overhead)* . . . . . . -0- 1,000
Units started and finished during month(9,000 started – 4,000 in ending WIP) . . . . . . . . . 5,000 5,000
Ending units in process (all materials, 1/2 laborand overhead)** . . . . . . . . . . . . . . . . . . . . . . . . . . . . 4,000 2,000
Total equivalent production . . . . . . . . . . . . . . . . . 9,000 8,000
Unit cost for month:
Materials ($27,000 � 9,000) . . . . . . . . . . . . . . . . . . . . . . . . . . . . . $ 3.00
Labor ($16,000 � 8,000) . . . . . . . . . . . . . . . . . . . . . . . . . . . . . . . . . 2.00
Factory overhead ($8,000 � 8,000) . . . . . . . . . . . . . . . . . . . . . . 1.00
Total . . . . . . . . . . . . . . . . . . . . . . . . . . . . . . . . . . . . . . . . . . . . . . . . $ 6.00
Inventory costs:
Cost of goods finished and transferred to Dept. 2 (Assembly) during month:
Beginning units in process:
Prior month’s cost . . . . . . . . . . . . . . . . . . . . . . . . . . . . . . . . . $ 16,000
Current cost to complete:
Materials . . . . . . . . . . . . . . . . . . . . . . . . . . . . . . . . . . . . . . . . -0-
Labor (3,000 � 1/3 � $2) . . . . . . . . . . . . . . . . . . . . . . . . . . 2,000
Factory overhead (3,000 � 1/3 � $1) . . . . . . . . . . . . . . . 1,000 $ 19,000
Units started and finished during month(5,000 � $6.00) . . . . . . . . . . . . . . . . . . . . . . . . . . . . . . . . . . . . 30,000
Total cost transferred (8,000 � $6.125***) . . . . . . . . . . . . . $ 49,000
Cost of work in process, end of month:
Materials (4,000 � $3) . . . . . . . . . . . . . . . . . . . . . . . . . . . . . . . . $ 12,000
Labor (4,000 �1/2 � $2) . . . . . . . . . . . . . . . . . . . . . . . . . . . . . . . 4,000
Factory overhead (4,000 � 1/2 � $1) . . . . . . . . . . . . . . . . . . . 2,000 18,000
Total production costs accounted for . . . . . . . . . . . . . . . . . . . . . . $ 67,000
*indicates what is needed to complete these units**indicates what has already been added
***$49,000 � 8,000 ¼ $6.125
302 Principles of Cost Accounting

Figure 6-11 Cost of Production Summary, Dept. 1, Average Cost Method
AVERAGE COST METHODRobotics Manufacturing, Inc.
Cost of Production Summary—Department 1 (Machining)For the Month Ended March 31, 2011
Cost of work in process, beginning of month:
Materials . . . . . . . . . . . . . . . . . . . . . . . . . . . . . . . . . . . . . . . . $ 9,600
Labor . . . . . . . . . . . . . . . . . . . . . . . . . . . . . . . . . . . . . . . . . . . 3,600
Factory overhead . . . . . . . . . . . . . . . . . . . . . . . . . . . . . . . . 2,800 $16,000
Cost of production for month:
Materials . . . . . . . . . . . . . . . . . . . . . . . . . . . . . . . . . . . . . . . . $27,000
Labor . . . . . . . . . . . . . . . . . . . . . . . . . . . . . . . . . . . . . . . . . . . 16,000
Factory overhead . . . . . . . . . . . . . . . . . . . . . . . . . . . . . . . . 8,000 51,000
Total costs to be accounted for . . . . . . . . . . . . . . . . . . . . . $67,000
Unit output for month:
Materials:
Finished and transferred to Dept. 2 (Assembly)during month . . . . . . . . . . . . . . . . . . . . . . . . . . . . . . . 8,000
Work in process, end of month (4,000 units, 100%complete) . . . . . . . . . . . . . . . . . . . . . . . . . . . . . . . . . . . 4,000
Total equivalent production . . . . . . . . . . . . . . . . . . 12,000
Labor and factory overhead:
Finished and transferred to Dept. 2 (Assembly)during month . . . . . . . . . . . . . . . . . . . . . . . . . . . . . . . 8,000
Work in process, end of month (4,000 units, 1/2completed) . . . . . . . . . . . . . . . . . . . . . . . . . . . . . . . . . 2,000
Total equivalent production . . . . . . . . . . . . . . . . . . 10,000
Unit cost for month:
Materials [($9,600 þ $27,000) � 12,000] . . . . . . . . . . . $ 3.05
Labor [($3,600 þ $16,000) � 10,000] . . . . . . . . . . . . . . . 1.96
Factory overhead [($2,800 þ $8,000) � 10,000] . . . . . 1.08
Total . . . . . . . . . . . . . . . . . . . . . . . . . . . . . . . . . . . . . . . . . . $ 6.09
Inventory costs:
Cost of goods finished and transferred to Dept. 2(Assembly) during month (8,000 � $6.09) . . . . . . . $48,720
Cost of work in process, end of month: . . . . . . . . . . . .
Materials (4,000 � $3.05) . . . . . . . . . . . . . . . . . . . . . . . $12,200
Labor (4,000 � 1/2 � $1.96) . . . . . . . . . . . . . . . . . . . . . 3,920
Factory overhead (4,000 � 1/2 � $1.08) . . . . . . . . . . 2,160 18,280
Total production costs accounted for . . . . . . . . . . . . . . . . $67,000
There were 3,000 units in process at the beginning of the month. Theseunits were complete as to materials and two-thirds complete as to labor andfactory overhead.
Chapter 6 – Process Cost Accounting—Additional Procedures 303

In the current month, no materials had to be added to the beginninginventory. However, the equivalent of 1,000 units (3,000 � 1/3) of labor andoverhead had to be applied to finish the units in Department 1 (Machining).
Of the 8,000 units finished and transferred to Department 2 (Assembly)during the month, 3,000 were from the beginning units in process. Therefore,5,000 units were started and fully completed during the month. Under theFIFO cost method, the beginning units in process and their costs, $16,000,are not merged with the units started and finished during the month.
The calculation of equivalent production for the ending work in process isthe same under FIFO and average costing. These 4,000 units in endinginventory have had all materials added and only one-half of the labor andoverhead. Thus, the ending inventory equivalent production for materialsis 4,000 units and for labor and overhead, 2,000 units (4,000 � 1/2).
The calculation of unit costs with the FIFO method takes into con-sideration only the current period’s cost data. The total cost of eachelement—materials, labor, and factory overhead—is divided by the equiva-lent production for the period to determine the unit cost for each element.The cost elements of the beginning work in process are not merged withcurrent cost elements under the FIFO method, as they are under averagecosting. Whereas the average costing method computes a single averagecost per unit for the beginning inventory plus the current period produc-tion, the FIFO method separates beginning inventory from current produc-tion so that a separate unit cost can be computed for the current month.
When assigning costs to the units finished and transferred, the averagecost approach charges the 8,000 units transferred with the total unit cost of$6.09. Under the FIFO method, however, two calculations are necessary todetermine the cost assigned to units transferred. First, the 3,000 units inprocess at the beginning of the month were previously completed as tomaterials; therefore, no cost for materials is added. However, the units hadbeen only two-thirds completed as to labor and overhead during the previousmonth and must be one-third completed this month. Thus, one-third of thecurrent period’s unit cost for labor and overhead is assigned to each of the3,000 units. The cost to complete the beginning inventory then is added tothe $16,000 beginning inventory cost carried over from the prior period toarrive at a completed cost for the beginning inventory of $19,000.
Second, the 5,000 units started and fully manufactured during themonth are priced at the unit cost of $6 for the current period. The totalaccumulated cost of the 3,000 units in process at the beginning of themonth ($19,000) plus the cost of the 5,000 units started and finished duringthe month ($30,000) is then transferred to Department 2 ($49,000). Notethat when making this transfer of cost, the cost and unit cost related to thebeginning inventory units lose their identity because they are merged withthe cost of units started and finished during the current period. Thus, the$49,000 of the total cost transferred to Department 2 is divided by the8,000 units transferred to Department 2 to arrive at a single unit cost of$6.125 as computed in the footnote to Figure 6-10. The costs assigned tothe ending work in process inventory are determined in the same manner
304 Principles of Cost Accounting

under the FIFO method as they are using average costing. The 4,000 unitsare complete as to materials and are charged with the full cost of materials.They are one-half complete as to labor and overhead and are allocated one-half of the labor and overhead cost. Although the method of calculation isthe same, the total costs charged to the ending units in process differbetween FIFO ($18,000) and average costing ($18,280) because of thedifference in unit costs determined by the two methods.
Illustrative Problem No. 2FIFO cost method compared with average cost method—materials added at end ofprocess. Assume that in Department 2 (Assembly), materials are added at theend of the process and labor and factory overhead are applied evenlythroughout the process. The production for March reflects the followinginformation:
Units in process, beginning of month, three-fourths completed . . . . 2,000
Units received from Dept. 1 (Machining) . . . . . . . . . . . . . . . . . . . . . . . . . 8,000
Units finished . . . . . . . . . . . . . . . . . . . . . . . . . . . . . . . . . . . . . . . . . . . . . . . . . . 8,000
Units in process, end of month, one-half completedas to labor and factory overhead . . . . . . . . . . . . . . . . . . . . . . . . . . . . . . . 2,000
Cost data are as follows:
Beginning work in process, prior month’s cost:
Prior department cost . . . . . . . . . . . . . . . . . . . . . . . . . . . . . . . . . . . . . . . . . $12,000
Materials . . . . . . . . . . . . . . . . . . . . . . . . . . . . . . . . . . . . . . . . . . . . . . . . . . . . . -0-
Labor . . . . . . . . . . . . . . . . . . . . . . . . . . . . . . . . . . . . . . . . . . . . . . . . . . . . . . . . 4,160
Factory overhead . . . . . . . . . . . . . . . . . . . . . . . . . . . . . . . . . . . . . . . . . . . . . 3,000
Total . . . . . . . . . . . . . . . . . . . . . . . . . . . . . . . . . . . . . . . . . . . . . . . . . . . . . . . $19,160
Cost of units received from Dept. 1 (Machining) during month . . . $49,000
Current month’s production costs:
Materials . . . . . . . . . . . . . . . . . . . . . . . . . . . . . . . . . . . . . . . . . . . . . . . . . . . . . $16,000
Labor . . . . . . . . . . . . . . . . . . . . . . . . . . . . . . . . . . . . . . . . . . . . . . . . . . . . . . . . 21,000
Factory overhead . . . . . . . . . . . . . . . . . . . . . . . . . . . . . . . . . . . . . . . . . . . . . 13,875
Total . . . . . . . . . . . . . . . . . . . . . . . . . . . . . . . . . . . . . . . . . . . . . . . . . . . . . . . $50,875
Figure 6-12 shows the cost of production summary for Department 2(Assembly), using the FIFO method, and Figure 6-13 shows the summaryusing the average cost method with the unit output sections highlighted.
In the cost of production summary using the FIFO method, the costs tobe accounted for are listed, and then the unit output for the period isdetermined. In this department, materials are added at the end of theprocess. Therefore, in order to finish the 2,000 units in process at thebeginning of the period, all materials have to be added—a total of 2,000units. Three-fourths of the labor and factory overhead were applied tothese beginning inventory units in the previous period, so one-fourth of thelabor and overhead need to be applied in the current month to finish the2,000 units—an equivalent of 500 units.
Chapter 6 – Process Cost Accounting—Additional Procedures 305

Figure 6-12 Cost of Production Summary, Dept. 2, FIFO Method
FIFO METHODRobotics Manufacturing, Inc.
Cost of Production Summary—Department 2 (Assembly)For the Month Ended March 31, 2011
Cost of work in process, beginning of month . . . . . . . . . . . . . . . $ 19,160
Cost of goods received from Dept. 1 (Machining) duringmonth . . . . . . . . . . . . . . . . . . . . . . . . . . . . . . . . . . . . . . . . . . . . . . . . . 49,000
Cost of production for month:
Materials . . . . . . . . . . . . . . . . . . . . . . . . . . . . . . . . . . . . . . . . . . . . . . $16,000
Labor . . . . . . . . . . . . . . . . . . . . . . . . . . . . . . . . . . . . . . . . . . . . . . . . . . 21,000
Factory overhead . . . . . . . . . . . . . . . . . . . . . . . . . . . . . . . . . . . . . . 13,875 50,875
Total costs to be accounted for . . . . . . . . . . . . . . . . . . . . . . . . . . . . $119,035
Unit output for month:
Materials
Labor andFactory
OverheadTo complete beginning units in process (all
materials, 1/4 labor and overhead) . . . . . . . . . . 2,000 500
Units started and finished during month (8,000started�2,000 in ending WIP) . . . . . . . . . . . . . . . 6,000 6,000
Ending units in process (no materials, 1/2 laborand overhead) . . . . . . . . . . . . . . . . . . . . . . . . . . . . . . -0- 1,000
Total equivalent production . . . . . . . . . . . . . . . . . 8,000 7,500
Unit cost for month:
Materials ($16,000 � 8,000) . . . . . . . . . . . . . . . . . . . . . . . . . . . . . $ 2.00
Labor ($21,000 � 7,500) . . . . . . . . . . . . . . . . . . . . . . . . . . . . . . . . . 2.80
Factory overhead ($13,875 � 7,500) . . . . . . . . . . . . . . . . . . . . . 1.85
Total . . . . . . . . . . . . . . . . . . . . . . . . . . . . . . . . . . . . . . . . . . . . . . . . $ 6.65
Inventory costs:
Cost of goods finished:
Beginning units in process:
Prior month’s cost . . . . . . . . . . . . . . . . . . . . . . . . . . . . . . . . . . $19,160
Current cost to complete:
Materials (2,000 � $2) . . . . . . . . . . . . . . . . . . . . . . . . . . . . 4,000
Labor (2,000 � 1/4 � $2.80) . . . . . . . . . . . . . . . . . . . . . . . 1,400
Factory overhead (2,000 � 1/4 � $1.85) . . . . . . . . . . . . 925 $ 25,485
Units started and finished during month:
Cost in Dept. 1 (6,000 � $6.125) . . . . . . . . . . . . . . . . . . . . . $36,750
Cost in Dept. 2 (6,000 � $6.65) . . . . . . . . . . . . . . . . . . . . . . 39,900 76,650
Total costs transferred to finished goods [(2,000 units þ6,000 units) � $12.7669]* . . . . . . . . . . . . . . . . . . . . . . . . . . . $102,135
Cost of work in process, end of month:
Cost in Dept. 1 (2,000 � $6.125) . . . . . . . . . . . . . . . . . . . . . . . $12,250
Cost in Dept. 2:
Materials . . . . . . . . . . . . . . . . . . . . . . . . . . . . . . . . . . . . . . . . . . -0-
Labor (2,000 � 1/2 � $2.80) . . . . . . . . . . . . . . . . . . . . . . . . . 2,800
Factory overhead (2,000 � 1/2 � $1.85) . . . . . . . . . . . . . . 1,850 16,900
Total production costs accounted for . . . . . . . . . . . . . . . . . . . . . . $119,035
*$102,135 � 8,000 units ¼ $12.7669

Figure 6-13 Cost of Production Summary, Dept. 2, Average Cost Method
AVERAGE COST METHODRobotics Manufacturing, Inc.
Cost of Production Summary—Department 2 (Assembly)For the Month Ended March 31, 2011
Cost of work in process, beginning of month:
Cost in Dept. 1 (Machining) . . . . . . . . . . . . . . . . . . . . . . . . . . . . . . $12,000
Cost in Dept. 2 (Assembly):
Materials . . . . . . . . . . . . . . . . . . . . . . . . . . . . . . . . . . . . -0-
Labor . . . . . . . . . . . . . . . . . . . . . . . . . . . . . . . . . . . . . . . . $4,160
Factory overhead . . . . . . . . . . . . . . . . . . . . . . . . . . . . . 3,000 7,160 $ 19,160
Cost of goods received from Dept. 1 (Machining)during month . . . . . . . . . . . . . . . . . . . . . . . . . . . . . . . . . . . . . . . . . . . 49,000
Cost of production for month:
Materials . . . . . . . . . . . . . . . . . . . . . . . . . . . . . . . . . . . . . . . . . . . . . . . $16,000
Labor . . . . . . . . . . . . . . . . . . . . . . . . . . . . . . . . . . . . . . . . . . . . . . . . . . 21,000
Factory overhead . . . . . . . . . . . . . . . . . . . . . . . . . . . . . . . . . . . . . . . 13,875 50,875
Total costs to be accounted for . . . . . . . . . . . . . . . . . . . . . . . . . . . . $119,035
Unit output for month:
Materials finished during month . . . . . . . . . . . . . . . . . . . . . . . . 8,000
Labor and overhead:
Finished during month . . . . . . . . . . . . . . . . . . . . . . . . . . . . . . . 8,000
Work in process, end of month . . . . . . . . . . . . . . . . . . . . . . . . 1,000 9,000
Unit cost for month:
Materials ($16,000 � 8,000) . . . . . . . . . . . . . . . . . . . . . . . . . . . . . . $ 2.0000
Labor [($4,160 þ $21,000) � 9,000] . . . . . . . . . . . . . . . . . . . . . . . 2.7956
Factory overhead [($3,000 þ $13,875) � 9,000] . . . . . . . . . . . 1.8750
Total . . . . . . . . . . . . . . . . . . . . . . . . . . . . . . . . . . . . . . . . . . . . . . . . . $ 6.6706
Inventory costs:
Cost of goods finished:
Cost in Dept. 1 (8,000 � $ 6.1000) . . . . . . . . . . . . . . . . . . . . . $48,800
Cost in Dept. 2 (8,000 � $ 6.6706) . . . . . . . . . . . . . . . . . . . . . 53,365
(8,000 � $12.7706) . . . . . . . . . . . . . . . . . . . . . $102,165
Cost of work in process, end of month:
Cost in Dept. 1 (2,000 � $6.10) . . . . . . . . . . . . . . . . . . . . . . . . . $12,200
Cost in Dept. 2:
Materials . . . . . . . . . . . . . . . . . . . . . . . . . . . . . . . . . . . . . . . . . . -0-
Labor (2,000 � 1/2 � $2.7956) . . . . . . . . . . . . . . . . . . . . . . . 2,795
Factory overhead (2,000 � 1/2 � $1.8750) . . . . . . . . . . . . 1,875 16,870
Total production costs accounted for . . . . . . . . . . . . . . . . . . . . . . $119,035
Chapter 6 – Process Cost Accounting—Additional Procedures 307

Of the 8,000 units completed during the period, 2,000 were from thebeginning inventory; therefore, 6,000 new units were started and fullymanufactured during the current month. The 2,000 units in process at theend of the month have had no materials added, but are one-half completeas to labor and overhead—an equivalent of 1,000 units.
As in Department 1, unit cost for FIFO is calculated by dividing thecurrent period’s cost of each element by the equivalent production for thatelement. Under the average cost method, unit cost is calculated by dividingthe combined costs of the current period and the beginning work in processby the equivalent production for each element.
In FIFO, to calculate the total completed cost of the beginning inventory,the total cost balance of the beginning work in process from the previousperiod is added to the costs incurred to complete these units in the currentperiod. The 2,000 units are charged for the full cost of materials and for one-fourth of the current costs for labor and overhead. The average cost methoddoes not require a separate computation to complete the beginning inventory.
Under the FIFO method, the cost transferred from Department 1during the period, $49,000, is divided by the 8,000 units transferred, whichresults in an adjusted unit cost of $6.125 for the goods received fromDepartment 1. The 6,000 units started and finished during the month arecharged with the $6.125 adjusted unit cost from the prior department plusthe $6.65 current unit cost generated by Department 2.
Under the average cost method, all of the units from Department 1,whether this month’s or last month’s, must be considered in determiningthe unit cost. The 2,000 units in process at the beginning of the period andthe 8,000 units received during the month are included in the calculation.The prior department cost of $12,000, carried over from the previousmonth, is added to the current month’s cost of $49,000 transferred fromDepartment 1. The total prior department cost of $61,000 is then dividedby 10,000 units to produce a unit cost of $6.10. The 8,000 units completedduring the period have a total unit cost for the period of $12.7706, whichconsists of the transferred-in cost of $6.10 plus the cost added in Depart-ment 2 operations of $6.6706.
The costs to be charged to the units in process at the end of the monthdiffer slightly between FIFO ($16,900) and average costing ($16,870),although both FIFO and average costing use the same mathematical methods.The values of the ending work in process differ because of the proceduresused to derive the prior department and current-month unit costs.
In comparing FIFO and average costing, FIFO provides that unitsstarted within the current period are valued at the current period’s costsand are not distorted by the merging of the current costs with costs fromthe preceding period, which could be considerably different. The units andcosts in the beginning inventory in a processing department maintain theirseparate identity. This helps to identify trends and control costs by havingpurely current unit costs each month to make month-to-month costcomparisons. Use of the FIFO method, however, means that the units in thebeginning inventory are valued when completed at a cost that representsneither the prior period’s cost nor the current period’s cost, but a
308 Principles of Cost Accounting

combination of the two. Also, the identity of the beginning units in processis not maintained when these units are transferred to the next departmentor to finished goods. At the time of transfer, the cost of these units is usuallycombined with the cost of units fully manufactured during the month.
The average cost method has an advantage when compared to FIFO inthat all units completed during the period will be assigned the same unitcost. This cost assignment procedure makes average costing a simplermethod to use. In the final analysis, however, a manufacturer should choosethe method that not only minimizes the clerical cost of application but alsomost accurately gauges its cost of production so that its products cansuccessfully compete in the marketplace.
Joint Products and By-ProductsSioux City Meatpackers, Inc., processes hogs into bacon, ham, porkroast, and spare ribs. The materials, labor, and overhead processingcosts to get the products to the point where they can be separatelyidentified total $10,000,000 per year. Not having adequate in-houseaccounting expertise, Jamie Hyland asks you, a current cost account-ing student, if it is acceptable to merely charge the $10,000,000 ofcosts equally to each of the four products. You inform Jamie thatthese costs and products are referred to as joint costs and jointproducts, respectively. You further inform her that there is a moreequitable way to allocate the joint costs. The joint costing coveragethat follows describes this more sophisticated method of allocatingjoint costs, and Self-Study Problem 2 at the end of the chaptercontinues with the Sioux City Meatpackers, Inc., example.
In many industries, the manufacturing process originates with one or moreraw materials started in process, from which two or more distinct products arederived. Examples of these industries are petroleum refineries, lumber mills,and meatpacking plants. Petroleum yields gasoline, heating oils, and lubricants.Lumber mills produce various grades of lumber and salable sawdust.
Recall and Review 2
Beginning inventory was 4,000 units, one-fourth complete as to labor and
factory overhead. During the period, 30,000 units were started in process
and 28,000 units were finished. There were 6,000 units in ending work in
process, one-half complete as to labor and factory overhead. Assuming that
the FIFO costing method is used and that all materials are put into produc-
tion at the beginning of the process, while labor and overhead are applied
evenly throughout production, the equivalent units of production for direct
materials and for direct labor and factory overhead would be ___________
and __________, respectively.
(After working this exercise, see page 315 for the solution.)
You should now be able to work the following:
Questions 6–13; Exercises 6-7 to 6-10; Problems 6-5 to 6-9 and
Self-Study Problem 1.
LO5Identify the
methods used
to apportion joint
costs to joint products
and account for by-
products.
Chapter 6 – Process Cost Accounting—Additional Procedures 309

Meatpacking processes result in a variety of different cuts of meat and otherproducts as illustrated in Figure 6-14. The several items obtained from acommon process are divided into two categories: those that are the primaryobjectives of the process, called joint products (e.g., lumber), and second-ary products with relatively little value, called by-products (e.g., sawdust).
Accounting for Joint ProductsHow does a milk producer decide on the allocation of the costs of producing rawmilk? This is a concern because the raw milk will be further processed into wholemilk, 2% milk, skim milk, and heavy and light cream. The costs of materials,labor, and overhead incurred during such a joint production process are calledjoint costs. The point where these joint products become separately identifi-able is known as the split-off point. The manufacturing costs incurred inprocessing the raw milk up to the point where the milk products can beseparately identified cannot be specifically identified with any one of theindividual products. Some method, however, must be adopted to equitablyallocate the joint costs to each identifiable product. If further processing ofany of the products is required after the split-off point, these additionalcosts can be identified directly with the specific products.
Typical bases for apportionment of joint costs to joint products follow:
1. Relative (or adjusted) sales value of each product.
2. A physical unit of measure such as volume, weight, size, or grade.
3. Chemical, engineering, or other types of analyses.
The assignment of costs in proportion to the relative sales value ofeach product is most commonly used and is the only method that will beillustrated here. This method assumes a direct relationship between sellingprices and joint costs. It follows the logic that the greatest share of joint costshould be assigned to the product that has the highest sales value.
To illustrate, assume that Clean It, Inc., produces two liquid productsfrom one process. In the manufacturing process, various materials aremixed in a huge vat and allowed to settle, so that a light liquid rises to thetop and a heavier liquid settles to the bottom of the vat. The products,
Figure 6-14 The Output of a Joint Process
Joint Process—Slaughtering,Separating, andCleaning
Joint Process OutputsRaw Material Input—Hog:
310 Principles of Cost Accounting

Gloss and Glow, are drawn off separately and piped directly into tank carsfor shipment. The joint processing costs of materials, labor, and overheadtotal $200,000, producing 30,000 gallons of Gloss and 20,000 gallons ofGlow. A diagram of these relationships appears in Figure 6-15.
Gloss sells for $10.00 a gallon and Glow for $25.00 a gallon. Using therelative sales value method, we would allocate the joint costs of $200,000 asfollows:
ProductGallons
Produced
SellingPrice/Gallon
TotalSalesValue
Percentof Sales
Value
Assignmentof JointCosts
Gloss 30,000 � $10.00 ¼ $300,000 37.5% $ 75,000
Glow 20,000 � 25.00 ¼ 500,000 62.5% 125,000
Total 50,000 $800,000 100.0% $200,000
The amounts in the final column of the above table were determined asfollows:
Gloss : $200; 000� :375 ¼ $75; 000Glow: $200; 000� :625 ¼ $125; 000
Some companies further refine this method by subtracting each pro-duct’s estimated selling expenses from its sales value to determine the netrealizable value of the product. If a product is to be processed further afterthe point of separation, costs should not be assigned on the basis of ultimatesales value because the additional processing adds value to the product. In acase such as this, an adjusted sales value is used that takes into considera-tion the cost of the processing after split-off.
Assume that Clean It’s market researchers determine that Glow wouldhave a better market if it were sold in powder form in individual packages.(Two gallons of liquid are needed for one pound of powder.) After studyingthis proposition, the company decides to pipe Glow into ovens to dehydrateit. The resulting powder is divided into one-pound packages that will sellfor $80 each.
Figure 6-15 Joint Costs and Joint Products
Mixing and Settling Dept.:
Joint ProcessingCosts, $200,000
Split-off
Point
Glow20,000 Gallons
Gloss30,000 Gallons
Chapter 6 – Process Cost Accounting—Additional Procedures 311

During the month of October, when the new process began, the jointcosts of materials, labor, and factory overhead in the Mixing and SettlingDepartment were again $200,000, and 30,000 gallons of Gloss were trans-ferred to tank cars. In the Baking Department, costs totaled $100,000 forbaking and packaging the 20,000 gallons of Glow received from Mixing andSettling, and 10,000 one-pound packages were produced.
The assignment of joint costs of $200,000 in Mixing and Settling, usingthe adjusted sales value method, follows:
UnitsProduced
UnitSellingPrice
UltimateSalesValue
Less Costafter Split
Off
SalesValue atSplit-Off
PercentSalesValue
Assignmentof Joint
CostsGloss—30,000 gal � $10.00 ¼ $ 300,000 -0- $ 300,000 30% $ 60,000
Glow—10,000 lb* � 80.00 ¼ 800,000 $100,000 700,000 70 140,000
Total $1,100,000 $100,000 $1,000,000 100% $200,000
*20,000 gallons of liquid is further processed into 10,000 lb of powder.
The following journal entries illustrate the allocated cost of Gloss beingtransferred to a finished goods inventory account and the assigned cost ofGlow being transferred to a work in process account to which theadditional costs of processing after split-off are charged as follows:
Work in Process—Baking . . . . . . . . . . . . . . . . . . . . . . . . . . . . . . . . . . . . . 140,000
Finished Goods (Gloss) . . . . . . . . . . . . . . . . . . . . . . . . . . . . . . . . . . . . . 60,000
Work in Process—Mixing and Settling . . . . . . . . . . . . . . . . . . . . . 200,000
Allocation of split-off costs to the two products
Work in Process—Baking . . . . . . . . . . . . . . . . . . . . . . . . . . . . . . . . . . . 100,000
Materials, Wages Payable, Applied Factory Overhead . . . . . . 100,000
Processing costs after split-off charged to Glow
Finished Goods (Glow) . . . . . . . . . . . . . . . . . . . . . . . . . . . . . . . . . . . . . . . 240,000
Work in Process—Baking . . . . . . . . . . . . . . . . . . . . . . . . . . . . . . . . . . . 240,000
Completed cost of Glow ($140,000 þ $100,000)charged to finished goods
Accounting for By-Products
In accounting for by-products, the common practice is to make no alloca-tion of the processing costs up to the split-off point. Costs incurred up tothat point are chargeable to the main products. If no further processing isrequired to make the by-products marketable, they may be accounted forby debiting an inventory account, By-Products, and crediting Work inProcess for the estimated sales value of the by-products recovered. Underthis procedure, the estimated sales value of the by-products reduces the costof the main products that is accumulated in the work in process account.The reduction in costs, due to the by-product, is shown in the inventorycosts section of the cost of production summary. If the by-products are soldfor more or less than the estimated sales value, the difference may becredited or debited to Gain and Loss on Sales of By-Products. The journalentries to reflect the above, with amounts assumed, are as follows:
312 Principles of Cost Accounting

By-Product Inventory 200
Work in Process 200
to reduce cost of main products by estimated by-product sales value.
Accounts Receivable 300
Gain or Loss on Sale of By-Product 100
By-Product Inventory 200
to record the sale of by-product at a gain.
Assume that the production management of Clean It finds that nonusableresidue at the bottom of the vat can be sold for $10,000 without furtherprocessing. Also assume that other data for the month of November are thesame as for October. The cost of production summary in Figure 6-16
Figure 6-16 Cost of Production Summary, Joint Products and By-Products
Clean It, Inc.Cost of Production Summary—Mixing and Settling Department
For the Month Ended November 30, 2011Cost of production for month:
Materials . . . . . . . . . . . . . . . . . . . . . . . . . . . . . . . . . . . . . . . . . . . . . . . . . . . . . . . $127,500
Labor . . . . . . . . . . . . . . . . . . . . . . . . . . . . . . . . . . . . . . . . . . . . . . . . . . . . . . . . . . . 42,500
Factory overhead . . . . . . . . . . . . . . . . . . . . . . . . . . . . . . . . . . . . . . . . . . . . . . . 30,000
Total costs to be accounted for . . . . . . . . . . . . . . . . . . . . . . . . . . . . . . . . . . . . . $200,000
Unit output for month:
Finished and transferred to finished goods (Gloss) . . . . . . . . . . . . . . . . 30,000
Finished and transferred to Baking Department (Glow) . . . . . . . . . . . . 20,000
Total . . . . . . . . . . . . . . . . . . . . . . . . . . . . . . . . . . . . . . . . . . . . . . . . . . . . . . . . . 50,000
Unit cost for month:
Materials ($127,500 � 50,000) . . . . . . . . . . . . . . . . . . . . . . . . . . . . . . . . . . . . $ 2.55
Labor ($42,500 � 50,000) . . . . . . . . . . . . . . . . . . . . . . . . . . . . . . . . . . . . . . . . 0.85
Factory overhead ($30,000 � 50,000) . . . . . . . . . . . . . . . . . . . . . . . . . . . . . 0.60
Total . . . . . . . . . . . . . . . . . . . . . . . . . . . . . . . . . . . . . . . . . . . . . . . . . . . . . . . . . $ 4.00
Total costs to split-off point . . . . . . . . . . . . . . . . . . . . . . . . . . . . . . . . . . . . . . . . $200,000
Less market value of by-product . . . . . . . . . . . . . . . . . . . . . . . . . . . . . . . . . 10,000
Total cost to be assigned to joint products finished and transferred . . . $190,000
Inventory costs:
Cost of goods finished (Gloss) and transferred to finished goods(30%* � $190,000) . . . . . . . . . . . . . . . . . . . . . . . . . . . . . . . . . . . . . . . . . . . . $ 57,000
Cost of goods finished (Glow) and transferred to Baking Department(70%� $190,000) . . . . . . . . . . . . . . . . . . . . . . . . . . . . . . . . . . . . . . . . . . . . . 133,000
Market value of by-product finished and transferred to by-productinventory account . . . . . . . . . . . . . . . . . . . . . . . . . . . . . . . . . . . . . . . . . . . . 10,000
Total production costs accounted for . . . . . . . . . . . . . . . . . . . . . . . . . . . . . . . $200,000
*Using adjusted sales values from the table on page 312.
Chapter 6 – Process Cost Accounting—Additional Procedures 313

reflects the assignment of joint costs under the adjusted sales value methodand uses the by-product sales value as a reduction in the cost of the jointproducts and as the cost assigned to the by-product.
In some instances, an unstable market will make the sales value of theby-product so insignificant or so uncertain that the cost of the mainproducts will not be reduced. In this case, no entry for the by-product ismade at the point of separation. When the by-product is sold, thetransaction is recorded by debiting Cash or Accounts Receivable andcrediting By-Product Sales or Miscellaneous Income. The revenue ac-count will usually be treated as ‘‘other income’’ on the income statement. Ifthe amount is significant, however, some companies may show this revenueunder the main category ‘‘Sales,’’ as a deduction from the cost of the mainproducts sold, or as a reduction in the total cost of the main productsmanufactured.
If further processing is required to make the by-product salable, anaccount entitled By-Products in Process may be opened, and all subse-quent processing costs are charged to that account. As with otherproducts, when the processing is completed, an entry is made to transferthe costs from the in-process account to a finished goods inventoryaccount.
KEY TERMS
Abnormal losses, 297
Adjusted sales value, 311
By-products, 310
First-in, first-out (FIFO) method, 300
Joint costs, 310
Joint products, 310
Normal losses, 296
Product costs, 296
Relative sales value, 310
Split-off point, 310
Recall and Review 3
Fraternity Row, Inc., makes one main product, Gamma, and a by-product,
Sigma. The estimated sales value of the units of Sigma produced during the
month is $5,000. Assuming that the value of the by-product is treated as a
reduction in cost of the main product, prepare the journal entries to record
the placing of Sigma in stock and the subsequent sale of Sigma for $4,000,
on account.
(After working this exercise, see page 315 for the solution.)
You should now be able to work the following:
Questions 14–17; Exercises 6-11 to 6-14; Problems 6-10 and 6-11;
Mini-Case; and Self-Study Problem 2.
314 Principles of Cost Accounting

ANSWERS TO RECALL AND REVIEW EXERCISES
R&R 1
Equivalent units of production for direct material:
Units finished and transferred out . . . . . . . . . . . . . . . . . . . . . . . . . . . . . . . . . . . . . 28,000
Units in ending inventory, 100% complete . . . . . . . . . . . . . . . . . . . . . . . . . . . . . 6,000
Equivalent units of production . . . . . . . . . . . . . . . . . . . . . . . . . . . . . . . . . . . . . . . . 34,000
Equivalent units of production for direct labor
and factory overhead:
Units finished and transferred out . . . . . . . . . . . . . . . . . . . . . . . . . . . . . . . . . . . . . 28,000
Units in ending inventory, 6,000 � 50% . . . . . . . . . . . . . . . . . . . . . . . . . . . . . . . . 3,000
Equivalent units of production . . . . . . . . . . . . . . . . . . . . . . . . . . . . . . . . . . . . . . . . 31,000
R&R 2
Equivalent units of production for direct materials:
To complete beginning work in process . . . . . . . . . . . . . . . . . . . . . . . . . . . . . . . -0-
Added to units started and finished during month . . . . . . . . . . . . . . . . . . . . . 24,000*
Units in ending inventory, 100% complete . . . . . . . . . . . . . . . . . . . . . . . . . . . . . 6,000
Equivalent units of production . . . . . . . . . . . . . . . . . . . . . . . . . . . . . . . . . . . . . . . . 30,000
*28,000 finished – 4,000 from beginning inventory
Equivalent units of production for direct labor
and factory overhead:
To complete beginning work in process, 4,000 � 75% . . . . . . . . . . . . . . . . . 3,000
Added to units started and finished during month . . . . . . . . . . . . . . . . . . . . . 24,000
Units in ending inventory, 6,000 � 50% . . . . . . . . . . . . . . . . . . . . . . . . . . . . . . . . 3,000
Equivalent units of production . . . . . . . . . . . . . . . . . . . . . . . . . . . . . . . . . . . . . . . . 30,000
R&R 3
(1) By-Product Inventory . . . . . . . . . . . . . . . . . . . . . . . . . . . . . . . . . . . . . 5,000
Work in Process . . . . . . . . . . . . . . . . . . . . . . . . . . . . . . . . . . . . . . . . 5,000
(2) Accounts Receivable . . . . . . . . . . . . . . . . . . . . . . . . . . . . . . . . . . . . . 4,000
Gain and Loss on Sale of By-Product . . . . . . . . . . . . . . . . . . . . . . 1,000
By-Product Inventory . . . . . . . . . . . . . . . . . . . . . . . . . . . . . . . . . . 5,000
Chapter 6 – Process Cost Accounting—Additional Procedures 315

SELF-STUDY PROBLEM 1
Average and FIFO Cost Methods; Losses at theBeginning and End of Processing
Coronado Manufacturing Company
Coronado Manufacturing Company uses a process cost system. Its manu-
facturing operation is carried on in two departments: Machining and
Finishing. The Machining Department uses the average cost method, and
the Finishing Department uses the FIFO cost method. Materials are added
in both departments at the beginning of operations, and the added
materials do not increase the number of units being processed. Units are
lost in the Machining Department throughout the production process, and
inspection occurs at the end of the process. The lost units have no scrap
value and are considered to be a normal loss.
Production statistics for May show the following data:
Machining FinishingUnits in process, May 1 (all material,
20% of labor and overhead) . . . . . . . . . . . . . . . . . 10,000
Units in process, May 1 (all material,60% of labor and overhead) . . . . . . . . . . . . . . . . . 20,000
Units started in production . . . . . . . . . . . . . . . . . . . . 70,000
Units completed and transferred . . . . . . . . . . . . . . 50,000
Units transferred from Machining . . . . . . . . . . . . . 50,000
Units completed and transferred tofinished goods . . . . . . . . . . . . . . . . . . . . . . . . . . . . . 50,000
Units in process, May 31 (all material,40% of labor and overhead) . . . . . . . . . . . . . . . . . 20,000
Units in process, May 31 (all material,20% of labor and overhead) . . . . . . . . . . . . . . . . . 20,000
Units lost in production . . . . . . . . . . . . . . . . . . . . . . . 10,000
Production Costs Machining FinishingWork in process, May 1:
Materials . . . . . . . . . . . . . . . . . . . . . . . . . . . . . . . . . . $ 20,000 $ 55,000
Labor . . . . . . . . . . . . . . . . . . . . . . . . . . . . . . . . . . . . . . 12,000 30,000
Factory overhead . . . . . . . . . . . . . . . . . . . . . . . . . . . 4,000 20,000
Costs in machining department . . . . . . . . . . . . . 120,000
Costs incurred during month:
Materials . . . . . . . . . . . . . . . . . . . . . . . . . . . . . . . . . . 139,600 120,000
Labor . . . . . . . . . . . . . . . . . . . . . . . . . . . . . . . . . . . . . . 89,500 80,220
Factory overhead . . . . . . . . . . . . . . . . . . . . . . . . . . . 30,220 39,900
Required:
Prepare a cost of production summary for each department.
316 Principles of Cost Accounting

SOLUTION TO SELF-STUDY PROBLEM
Suggestions:
Read the entire problem thoroughly, keeping in mind that you will prepare
a cost of production summary for each department.
Highlight the following facts:
1. The company has two departments.
2. The Machining Department uses the average cost method, while the
Finishing Department uses the FIFO cost method.
3. Units are lost throughout the process in Machining, but inspection
doesn’t occur until the end of the process.
4. The lost units have no scrap value, and the losses are considered normal.
5. The materials are added at the beginning of operations in both depart-
ments, but the labor and overhead are added evenly. Therefore, the
equivalent production for materials will differ from the labor and over-
head equivalent production in each department.
Prepare a Cost of Production Summary for the Machining Department:
1. Account for the total cost charged to the department.
2. Calculate the equivalent production, using the average cost proce-
dures for (a) materials and (b) labor and factory overhead.
3. Calculate the unit costs for materials, labor, and overhead. (Note that
the good units that make it to the end of the production process will
bear all of the production costs, including the costs incurred up until
the time the units were lost.)
4. Using the calculated unit costs, determine the following:
a. Cost of goods finished and transferred.
b. The cost of the ending work in process.
Coronado Manufacturing CompanyCost of Production Summary—Machining Department
For the Month Ended May 31, 2011First: Account for the total cost charged to the department.
Cost in work in process, beginning of month:
Materials . . . . . . . . . . . . . . . . . . . . . . . . . . . . . . . . . . . . . . . . $ 20,000
Labor . . . . . . . . . . . . . . . . . . . . . . . . . . . . . . . . . . . . . . . . . . . 12,000
Factory overhead . . . . . . . . . . . . . . . . . . . . . . . . . . . . . . . . 4,000 $ 36,000
Cost of production for month:
Materials . . . . . . . . . . . . . . . . . . . . . . . . . . . . . . . . . . . . . . . . $139,600
Labor . . . . . . . . . . . . . . . . . . . . . . . . . . . . . . . . . . . . . . . . . . . 89,500
Factory overhead . . . . . . . . . . . . . . . . . . . . . . . . . . . . . . . . 30,220 259,320
Total costs to be accounted for . . . . . . . . . . . . . . . . . . . . . $295,320
Second: Calculate the unit output (equivalent production).
Unit output for month:
Materials:
Finished and transferred during month . . . . . . . . . 50,000
Equivalent units of work in process, end of month(20,000, 100% completed) . . . . . . . . . . . . . . . . . . . . 20,000
Total equivalent production . . . . . . . . . . . . . . . . . . 70,000
Chapter 6 – Process Cost Accounting—Additional Procedures 317

Labor and factory overhead:
Finished and transferred during month . . . . . . . . . 50,000
Equivalent units of work in process, end of month(20,000, 40% completed) . . . . . . . . . . . . . . . . . . . . . 8,000
Total equivalent production . . . . . . . . . . . . . . . . . . 58,000
Third: Calculate unit costs.
Materials [($20,000 þ $139,600) � 70,000] . . . . . . . . . . . $ 2.28
Labor [($12,000 þ $89,500) � 58,000] . . . . . . . . . . . . . . . . 1.75
Factory overhead [($4,000 þ $30,220) � 58,000] . . . . . . 0.59
Total . . . . . . . . . . . . . . . . . . . . . . . . . . . . . . . . . . . . . . . . . . . . $ 4.62
Fourth: Determine inventory costs using calculated unit costs.
Inventory costs:
Cost of goods finished and transferred(50,000 � $4.62) . . . . . . . . . . . . . . . . . . . . . . . . . . . . . . . . . . $231,000
Cost of work in process, end of month:
Materials (20,000 � $2.28) . . . . . . . . . . . . . . . . . . . . . . $ 45,600
Labor (20,000 � 40% � $1.75) . . . . . . . . . . . . . . . . . . 14,000
Factory overhead (20,000 � 40% � $0.59) . . . . . . . 4,720 64,320
Total production costs accounted for . . . . . . . . . . . . . . . $295,320
Prepare a Cost of Production Summary for the Finishing Department:
Note: Use the same sequence of instructions as were given for the
Machining Department.
Coronado Valley Manufacturing CompanyCost of Production Summary—Finishing Department
For the Month Ended May 31, 2011
Cost of work in process, beginning of month:
Cost in Machining Department . . . . . . . . . . . . . . . . . . . . . . . . . . $120,000
Cost in Finishing Department:
Materials . . . . . . . . . . . . . . . . . . . . . . . . . . . . . . . . . . . . $55,000
Labor . . . . . . . . . . . . . . . . . . . . . . . . . . . . . . . . . . . . . . . . 30,000
Factory overhead . . . . . . . . . . . . . . . . . . . . . . . . . . . . . 20,000 105,000 $225,000
Cost of goods received from Machining during month . . . . . . 231,000
Cost of production for month:
Materials . . . . . . . . . . . . . . . . . . . . . . . . . . . . . . . . . . . . . . . . . . . . . . . $120,000
Labor . . . . . . . . . . . . . . . . . . . . . . . . . . . . . . . . . . . . . . . . . . . . . . . . . . 80,220
Factory overhead . . . . . . . . . . . . . . . . . . . . . . . . . . . . . . . . . . . . . . . 39,900 240,120
Total costs to be accounted for . . . . . . . . . . . . . . . . . . . . . . . . . . . . $696,120
Unit output for month:
Materials:
To complete beginning units in process . . . . . . . . . . . . . . . . -0-
Units started and fully manufactured during month(50,000 – 20,000) . . . . . . . . . . . . . . . . . . . . . . . . . . . . . . . . . . . . 30,000
Ending units in process (20,000, all materials) . . . . . . . . . . 20,000
Total equivalent production 50,000
318 Principles of Cost Accounting

Labor and factory overhead:
To complete beginning units in process(20,000, 40% to complete) . . . . . . . . . . . . . . . . . . . . . . . . 8,000
Units started and fully manufactured during month . . 30,000
Ending units in process (20,000, 20% completed) . . . . 4,000
Total equivalent production . . . . . . . . . . . . . . . . . . . . . . 42,000
Unit cost for month:
Materials ($120,000 � 50,000) . . . . . . . . . . . . . . . . . . . . . . . . $ 2.40
Labor ($80,220 � 42,000) . . . . . . . . . . . . . . . . . . . . . . . . . . . . . 1.91
Factory overhead ($39,900 � 42,000) . . . . . . . . . . . . . . . . . . 0.95
Total . . . . . . . . . . . . . . . . . . . . . . . . . . . . . . . . . . . . . . . . . . . . . . $ 5.26
Inventory costs:
Cost of goods finished and transferred to finished goods during month:
Beginning units in process:
Prior month’s cost . . . . . . . . . . . . . . . . . . . . . . . . . . . . . . . $225,000
Current cost to complete:
Labor (20,000 � 40% � $1.91) . . . . . . . . . . . . . . . . . . 15,280
Overhead (20,000 � 40% � $0.95) . . . . . . . . . . . . . . 7,600 $247,880
Units started and finished during month:
Cost in prior dept. (30,000 � $4.62) . . . . . . . . . . . . . . . $138,600
Cost in Finishing Dept. (30,000 � $5.26) . . . . . . . . . . . 157,800
Total cost transferred (30,000 � $9.88) . . . . . . . . . . 296,400
Cost of work in process, end of month:
Cost in prior dept. (20,000 units � $4.62) . . . . . . . . . . $ 92,400
Materials (20,000 units � $2.40) . . . . . . . . . . . . . . . . . . 48,000
Labor (20,000 units � 20% � $1.91) . . . . . . . . . . . . . . . 7,640
Factory overhead (20,000 units � 20% � $0.95) . . . . 3,800 151,840
Total production costs accounted for . . . . . . . . . . . . . . . . . $696,120
SELF-STUDY PROBLEM 2
Joint Products and By-Products Costing
Sioux City Meatpackers, Inc.
Sioux City Meatpackers, Inc., processes hogs into bacon, ham, pork roast,
and spare ribs. The materials, labor, and overhead processing costs to get
the products to the point where they can be separately identified total
$10,000,000. Additional information includes:
Product Lb Produced Cost after Split-Off Selling Price per LbBacon 1,000,000 $200,000 $2
Ham 2,500,000 500,000 4
Pork roast 2,000,000 425,000 3
Spare ribs 500,000 350,000 5
Chapter 6 – Process Cost Accounting—Additional Procedures 319

A by-product, animal fat, was sold for a total of $1,000,000 at the split-
off point.
Required:
Determine the allocation of joint costs, using the relative sales value
method.
SOLUTION TO SELF-STUDY PROBLEM
Suggestions:
Read the entire problem carefully, keeping in mind that you are to allocate
the joint processing costs to the four joint products.
Highlight the following facts:
1. There are four joint products.
2. Each product incurs separable costs after the split-off point.
3. The joint products are sold only after further processing.
4. By-product revenue is also present.
Steps in Performing the Allocations:
1. Reduce the amount of the joint cost to be allocated by the amount of
the by-product revenue:
Joint processing costs. . . . . . . . . . . . . . . . . . . . . . . . . . . . . . . . . . . . . . . . . . $10,000,000
Less: By-product revenue . . . . . . . . . . . . . . . . . . . . . . . . . . . . . . . . . . . . . . . 1,000,000
Joint costs to be allocated . . . . . . . . . . . . . . . . . . . . . . . . . . . . . . . . . . . . . . $ 9,000,000
2. Determine the ultimate sales value of the four products:
Product Lb. Price per lbUltimate Sales
ValueBacon 1,000,000 $2 $ 2,000,000
Ham 2,500,000 4 10,000,000
Pork roast 2,000,000 3 6,000,000
Spare ribs 500,000 5 2,500,000
3. Deduct the costs after split-off to determine the adjusted sales value at
split-off:
ProductUltimate Sales
ValueCosts after
Split-OffSales Valueat Split-Off
Bacon $ 2,000,000 $200,000 $1,800,000
Ham 10,000,000 500,000 9,500,000
Pork roast 6,000,000 425,000 5,575,000
Spare ribs 2,500,000 350,000 2,150,000
4. Using the adjusted sales value at split-off, compute the relative sales
value percentages and assign the joint costs:
320 Principles of Cost Accounting

ProductSales Valueat Split-Off
Sales ValuePercentage
Joint CostsAssigned
Bacon $ 1,800,000 9.46% $ 851,400
Ham 9,500,000 49.94 4,494,600
Pork roast 5,575,000 29.30 2,637,000
Spare ribs 2,150,000 11.30 1,017,000
Total $19,025,000 100.00% $9,000,000
QUESTIONS
1. Under what conditions may the unit costs
of materials, labor, and overhead be com-
puted by using only one equivalent produc-
tion figure?
2. When is it necessary to use separate
equivalent production figures in computing
the unit costs of materials, labor, and
overhead?
3. Why is it usually reasonable to assume that
labor and factory overhead are added
evenly throughout the production process?
4. If materials are not put into process uni-
formly, what must be considered when
determining the cost of the ending work in
process?
5. In what way does the cost of production
summary, Figure 6-2, differ from the cost of
production summaries presented in Chap-
ter 5? What is the reason for this difference
in treatment?
6. Why might the total number of units com-
pleted during a month plus the number of
units in process at the end of a month be
less than the total number of units in pro-
cess at the beginning of the month plus the
number of units placed in process during
the month?
7. What is the usual method of handling the
cost of losses that occur normally during
processing?
8. If some units are normally lost during the
manufacturing process and all units absorb
the cost, what effect does this have on the
unit cost of goods finished during the
period and the cost of the work in process
at the end of the period?
9. How is the cost of units normally lost in
manufacturing absorbed by the unit cost
for the period?
10. How would you describe the method used
to treat the cost of abnormal processing
losses?
11. What computations must be made if mate-
rials added in a department increase the
number of units being processed in that
department?
12. What is the difference between the average
cost method and the first-in, first-out (FIFO)
cost method?
13. What advantage does the FIFO cost method
have over the average cost method relative
to providing information for cost control?
14. How would you define each of the follow-
ing?
a. joint products
b. by-products
c. joint costs
d. split-off point
15. What are three methods of allocating joint
costs?
16. How would you describe accounting for
by-products for which no further proces-
sing is required?
17. Explain the refinement that some compa-
nies make to the relative sales value
method of accounting for joint products.
Chapter 6 – Process Cost Accounting—Additional Procedures 321

EXERCISES
E6-1 Computing equivalent units of production for materials, labor,and overheadUsing the data given for Cases 1–3 below, and assuming the use
of the average cost method, compute the separate equivalent
units of production—one for materials and one for labor and
overhead—under each of the following assumptions (labor and
factory overhead are applied evenly during the process in each
assumption):
a. All materials go into production at the beginning of the
process.
b. All materials go into production at the end of the process.
(Note that this would have to be a department subsequent to
the first department for all materials to be added at the end
of the process.)
c. At the beginning of the process, 75% of the materials go into
production and 25% go into production when the process is
one-half completed.
Note that you will have three solutions for each of the following
cases:
Case 1—Started in process 5,000 units; finished 3,000 units; work
in process, end of period 2,000 units, three-fourths
completed.
Case 2—Opening inventory 5,000 units, three-fifths completed;
started in process 40,000 units; finished 39,000 units;
work in process, end of period 6,000 units, one-fourth
completed.
Case 3—Opening inventory 1,000 units, one-half completed, and
8,000 units, one-fourth completed; started in process
30,000 units; finished 29,000 units; closing inventory
work in process 5,000 units, one-fourth completed, and
5,000 units, one-half completed.
E6-2 Computing equivalent production, unit costs, and costs forcompleted units and ending inventorySwedish Navy Company manufactures wristwatches on an as-
sembly line. The work in process inventory as of March 1
consisted of 1,000 watches that were complete as to materials
and 75% complete as to labor and overhead. The March 1 work
in process costs were as follows:
Materials . . . . . . . . . . . . . . . . . . . . . . . . . . . . . . . . . . . . . . . . . . $ 5,000
Labor . . . . . . . . . . . . . . . . . . . . . . . . . . . . . . . . . . . . . . . . . . . . . 5,000
Overhead . . . . . . . . . . . . . . . . . . . . . . . . . . . . . . . . . . . . . . . . . 8,000
Total . . . . . . . . . . . . . . . . . . . . . . . . . . . . . . . . . . . . . . . . . . . . $18,000
During the month, 10,000 units were started and 9,500 units were
completed. The 1,500 units of ending inventory were complete as
to materials and 25% were complete as to labor and overhead.
LO1
LO1
322 Principles of Cost Accounting

The costs for March were as follows:
Materials . . . . . . . . . . . . . . . . . . . . . . . . . . . . . . . . . . . . . . . . . . $ 61,000
Labor . . . . . . . . . . . . . . . . . . . . . . . . . . . . . . . . . . . . . . . . . . . . . 20,000
Overhead . . . . . . . . . . . . . . . . . . . . . . . . . . . . . . . . . . . . . . . . . 48,000
Total . . . . . . . . . . . . . . . . . . . . . . . . . . . . . . . . . . . . . . . . . . . . $129,000
Calculate:
a. Equivalent units for material, labor, and overhead, using the
average cost method
b. Unit costs for materials, labor, and overhead
c. Cost of the units completed and transferred
d. Detailed cost of the ending inventory
e. Total of all costs accounted for
E6-3 Computing unit costs; cost of units finished; cost of units inprocessThe following data appeared in the accounting records of Royale
Manufacturing Company, which uses an average cost produc-
tion system:
Started in process . . . . . . . . . . . . . . . . . . . 12,000 units
Finished and transferred . . . . . . . . . . . . . 10,500 units
Work in process, end of month . . . . . . . 1,500 units (2/5 completed)
Materials . . . . . . . . . . . . . . . . . . . . . . . . . . . $36,000
Labor . . . . . . . . . . . . . . . . . . . . . . . . . . . . . . . $44,400
Factory overhead . . . . . . . . . . . . . . . . . . . . $22,200
Case 1—All materials are added at the beginning of the process,
and labor and factory overhead are added evenly
throughout the process.
Case 2—One-half of the materials are added at the start of the
manufacturing process, and the balance of the materi-
als is added when the units are one-half completed.
Labor and factory overhead are applied evenly during
the process.
Make the following computations for each case:
a. Unit cost of materials, labor, and factory overhead for the
month
b. Cost of the units finished during the month
c. Cost of the units in process at the end of the month
E6-4 Calculating equivalent unitsCamacho Chemical Company uses an average cost processing
system. All materials are added at the start of the production
process. Labor and overhead are added evenly at the same rate
throughout the process. Camacho’s records indicate the follow-
ing data for May:
Beginning work in process, May 1 (50% completed) . . . . . . . . 1,000 units
Started in May . . . . . . . . . . . . . . . . . . . . . . . . . . . . . . . . . . . . . . . . . . . 5,000 units
Completed and transferred . . . . . . . . . . . . . . . . . . . . . . . . . . . . . . . 4,000 units
LO1
LO1
Chapter 6 – Process Cost Accounting—Additional Procedures 323

Ending work in process, May 31, is 75% completed as to labor
and factory overhead. Make the following calculations:
a. Equivalent units for direct materials
b. Equivalent units for labor and overhead
E6-5 Computing costs and unitsAssuming that all materials are added at the beginning of the
process and the labor and factory overhead are applied evenly
during the process, compute the figures to be inserted in the blank
spaces of the following data, using the average cost method.
Case 1 Case 2 Case 3Units in process, beginning of period . . . . . . . . . . . . . 300 None —
Materials cost in process, beginning of period . . . . $ 915 None $568
Labor cost in process, beginning of period . . . . . . . . $ 351 None $200
Overhead cost in process, beginning of period . . . . $ 300 None $188
Units started in process . . . . . . . . . . . . . . . . . . . . . . . . . — — 19,200
Units transferred . . . . . . . . . . . . . . . . . . . . . . . . . . . . . . . . 1,300 8,000 —
Units in process, end of period . . . . . . . . . . . . . . . . . . . 200 — 1,400
Stage of completion . . . . . . . . . . . . . . . . . . . . . . . . . . . . . 1/4 — 1/5
Equivalent units—materials . . . . . . . . . . . . . . . . . . . . . . — — —
Equivalent units—labor and factory overhead . . . . . — — 18,440
Materials cost, current month . . . . . . . . . . . . . . . . . . . . $3,660 $13,120 $—
Labor and factory overhead cost, current month . . $5,100 $16,200 $—
Materials unit cost for period . . . . . . . . . . . . . . . . . . . . $— $1.60 $0.30
Labor and factory overhead unit cost for period . . . $— $2.00 $0.20
E6-6 Computing average unit costsFoamy, Inc., manufactures shaving cream and uses an average
cost system. In November, production is 14,800 equivalent units
for materials and 13,300 units for labor and overhead. During the
month, materials, labor, and overhead costs were as follows:
Materials . . . . . . . . . . . . . . . . . . . . . . . . . . . . . . . . . . . . . . $73,000
Labor . . . . . . . . . . . . . . . . . . . . . . . . . . . . . . . . . . . . . . . . . . 68,134
Overhead . . . . . . . . . . . . . . . . . . . . . . . . . . . . . . . . . . . . . . 77,200
Beginning work in process for November had a cost of $11,360
for materials, $11,666 for labor, and $9,250 for overhead.
Compute the following:
a. Average cost per unit for materials
b. Average cost per unit for labor
c. Average cost per unit for overhead
d. Total unit cost for the month
E6-7 Calculating unit costs; units lost in productionSeymour Brothers Products, Inc., manufactures a liquid product
in one department. Due to the nature of the product and the
process, units are regularly lost at the beginning of production.
Materials and conversion costs are added evenly throughout the
LO1
LO1
LO2
324 Principles of Cost Accounting

process. The following summaries were prepared for the month
of January:
Production Summary UnitsStarted in process . . . . . . . . . . . . . . . . . . . . . . . . . . . . . . . . . . . . . 10,000
Finished and transferred to the stockroom . . . . . . . . . . . . . . . 8,000
In process, end of the month . . . . . . . . . . . . . . . . . . . . . . . . . . . 1,000
Stage of completion . . . . . . . . . . . . . . . . . . . . . . . . . . . . . . . . . . . 1/2
Lost in process . . . . . . . . . . . . . . . . . . . . . . . . . . . . . . . . . . . . . . . . 1,000
Cost SummaryMaterials . . . . . . . . . . . . . . . . . . . . . . . . . . . . . . . . . . . . . . . . . . . . . . $132,000
Labor . . . . . . . . . . . . . . . . . . . . . . . . . . . . . . . . . . . . . . . . . . . . . . . . . 33,000
Factory overhead . . . . . . . . . . . . . . . . . . . . . . . . . . . . . . . . . . . . . . 20,625
Calculate the unit cost for materials, labor, and factory overhead
for January and show the costs of units transferred and in
process.
E6-8 Calculating unit costs; units gained in productionA company manufactures a liquid product called Glitter. The
basic ingredients are put into process in Department 1. In Depart-
ment 2, other materials are added that increase the number of
units being processed by 50%. The factory has only two
departments.
Units
Production Summary Dept. 1 Dept. 2Started in process . . . . . . . . . . . . . . . . . . . . . . . . . . . 18,000
Received from prior department . . . . . . . . . . . . . . 14,000
Added to units in process . . . . . . . . . . . . . . . . . . . . 7,000
Finished and transferred . . . . . . . . . . . . . . . . . . . . . 14,000 15,000
In process, end of month . . . . . . . . . . . . . . . . . . . . . 4,000 6,000
Stage of completion—materials, labor, andfactory overhead . . . . . . . . . . . . . . . . . . . . . . . . . . 1/4 1/2
Cost SummaryMaterials . . . . . . . . . . . . . . . . . . . . . . . . . . . . . . . . . . . . $90,000 $36,000
Labor . . . . . . . . . . . . . . . . . . . . . . . . . . . . . . . . . . . . . . . 30,000 13,500
Factory overhead . . . . . . . . . . . . . . . . . . . . . . . . . . . . 15,000 4,500
Calculate the following for each department: (a) unit cost for the
month for materials, labor, and factory overhead, (b) cost of the
units transferred, and (c) cost of the work in process.
E6-9 Computing equivalent units, FIFO methodUsing the data given for Cases 1–3 and the FIFO cost method,
compute the separate equivalent units of production, one for
materials and one for labor and overhead, under each of the
LO3
LO4
Chapter 6 – Process Cost Accounting—Additional Procedures 325

following assumptions (labor and factory overhead are applied
evenly during the process in each assumption):
a. All materials go into production at the beginning of the process.
b. All materials go into production at the end of the process.
(Note that this would have to be a department subsequent to
the first department for all materials to be added at the end
of the process.)
c. At the beginning of the process, 75% of the materials go into
production and 25% go into production when the process is
one-half completed.
Note that you will have three solutions for each of the following
cases:
Case 1—Started in process 5,000 units; finished 3,000 units; work
in process, end of period 2,000 units, three-fourths
completed.
Case 2—Opening inventory 5,000 units, three-fifths completed;
started in process 40,000 units; finished 39,000 units;
work in process, end of period 6,000 units, one-fourth
completed.
Case 3—Opening inventory 1,000 units, one-half completed, and
8,000 units, one-fourth completed; started in process
30,000 units; finished 29,000 units; closing inventory
work in process 5,000 units, one-fourth completed, and
5,000 units, one-half completed.
Compare your answers with those from E6-1 on the average cost
basis.
E6-10 Computing equivalent units, FIFO and average cost methodsAssume each of the following conditions concerning the data
given:
1. All materials are added at the beginning of the process.
2. All materials are added at the end of the process. (Note that
this would have to be a department subsequent to the first
department for all materials to be added at the end of the
process.)
3. Half of the materials are added at the beginning of the
process, and the balance of the materials is added when the
units are three-fourths completed.
In all cases, labor and factory overhead are added evenly
throughout the process.
Units
Production Summary Dept. 1 Dept. 2 Dept. 3Work in process, beginning of month . . . . 3,000 1,500 1,200
Stage of completion . . . . . . . . . . . . . . . . . . . . 1/2 3/5 4/5
Started in process . . . . . . . . . . . . . . . . . . . . . . 18,000 16,000 21,000
Finished and transferred . . . . . . . . . . . . . . . . 19,000 15,500 21,000
Work in process, end of month . . . . . . . . . . 2,000 2,000 1,200
Stage of completion . . . . . . . . . . . . . . . . . . . . 3/4 1/2 1/4
LO1
LO4
326 Principles of Cost Accounting

Compute separate equivalent units of production, one for materi-
als and one for labor and factory overhead, for each of the
conditions listed, using (a) the average cost method and (b) the
FIFO cost method.
E6-11 Making a journal entry—joint productsLexington Lumber Co. processes rough timber to obtain three
grades of finished lumber, A, B, and C. The company allocates
costs to the joint products on the basis of market value. During
the month of May, Lexington incurred total production costs of
$300,000 in producing the following:
GradeThousand
Board Feet
Selling Priceper 1,000
Board FeetA 200 $200
B 300 100
C 500 150
Make the journal entry to transfer the finished lumber to sepa-
rate inventory accounts for each product.
E6-12 Computing joint costs—relative sales value methodCooper Company’s joint cost of producing 1,000 units of Product
A, 500 units of Product B, and 500 units of Product C is $200,000.
The unit sales values of the three products at the split-off point
are Product A—$20, Product B—$200, and Product C—$160. End-
ing inventories include 100 units of Product A, 200 units of
Product B, and 300 units of Product C.
a. Compute the amount of joint cost that would be included in
the ending inventory valuation of the three products on the
basis of their relative sales values.
b. Assume that Product C can be sold for $200 a unit if it is
processed after split-off at a cost of $25 a unit. Compute the
amount of joint cost that would be included in the ending
inventory valuation of the three products on the basis of their
adjusted sales values.
E6-13 Making a journal entry—by-productOrlando Metals manufactures tin. During the process, a by-
product—scrap metal—is obtained and placed in stock. The
estimated sales value of the scrap metal produced during the
month of April is $2,000. Assume that the value of the by-product
is treated as a reduction in production cost.
Make the journal entry for April to record the following:
a. Placing of the scrap metal in stock
b. Sale of one-half of the scrap metal for $850, on account
E6-14 Making journal entries—by-productAlphabet Manufacturing Co. makes one main product, X, and a
by-product, Z, which splits off from the main product when the
work is three-fourths completed. Product Z is sold without
LO5
LO5
LO5
LO5
Chapter 6 – Process Cost Accounting—Additional Procedures 327

further processing and without being placed in stock. During
June, $1,200 is realized from the sale of the by-product.
Make the entries to record the recovery and sale of the by-
product, on account, on the assumption that the recovery is
treated as one of the following:
a. A reduction in the cost of the main product
b. Other income
PROBLEMS
P6-1 Cost of production summaries, one department, two months;journal entries
Manufacturing data for the months of January and February in
the Mixing Department of Cappy Cleaning Products follow:
January FebruaryMaterials used . . . . . . . . . . . . . . . . . . . . . . . . . . . . . . . $20,000 $28,400
Labor . . . . . . . . . . . . . . . . . . . . . . . . . . . . . . . . . . . . . . . . $15,200 $23,000
Factory overhead . . . . . . . . . . . . . . . . . . . . . . . . . . . . . $11,400 $19,800
Finished and transferred to Blending Dept. . . . . . 3,600 3,200
Work in process, end of month . . . . . . . . . . . . . . . . 400 600
Stage of completion . . . . . . . . . . . . . . . . . . . . . . . . . . 3/4 1/4
All materials are added at the start of the process. Labor and
factory overhead are added evenly throughout the process. No
units were in process at the beginning of January. Goods finished
in Mixing are transferred to Blending for further processing.
Required:
1. From an analysis of this information, prepare a cost of pro-
duction summary for each month, using the average cost
method.
2. Make the journal entries necessary to record each month’s
transactions. (Hint: See Chapter 5 to review.)
P6-2 Journal entries for a manufacturer
On December 1, Lake George Production Company had a work
in process inventory of 1,200 units that were complete as to
materials and 50% complete as to labor and overhead. Decem-
ber 1 costs follow:
Materials . . . . . . . . . . . . . . . . . . . . . . . . . . . . . $6,000
Labor . . . . . . . . . . . . . . . . . . . . . . . . . . . . . . . . . 2,000
Overhead . . . . . . . . . . . . . . . . . . . . . . . . . . . . . 2,000
During December the following transactions occurred:
a. Purchased materials costing $50,000 on account.
b. Placed direct materials costing $49,000 into production.
c. Incurred production wages totaling $50,500.
LO1
LO1
328 Principles of Cost Accounting

d. Incurred overhead costs for December:
Depreciation . . . . . . . . . . . . . . . . . . . . . . . . . $20,000
Utilities . . . . . . . . . . . . . . . . . . . . . . . . . . . . . . 28,000 (Cash payment)
Salaries . . . . . . . . . . . . . . . . . . . . . . . . . . . . . . 11,000 (Cash payment)
Supplies . . . . . . . . . . . . . . . . . . . . . . . . . . . . . 2,000 (From inventory)
e. Applied overhead to work in process at a predetermined rate
of 125% of direct labor cost.
f. Completed and transferred 10,000 units to Finished Goods.
(Hint: You should first compute equivalent units and unit
costs.)
Lake George uses an average cost system. The ending inventory
of work in process consisted of 1,000 units that were completed
as to materials and 25% complete as to labor and overhead.
Required:
Prepare the journal entries to record the above information for
the month of December.
P6-3 Cost of production summaries, three departments;departmental cost work sheet; journal entries; statement ofcost of goods manufactured
Akron Manufacturing Company manufactures a cement sealing
compound called Ultra-Seal. The process requires that the pro-
duct pass through three departments. In Dept. 1, all materials are
put into production at the beginning of the process; in Dept. 2,
materials are put into production evenly throughout the process;
and in Dept. 3, all materials are put into production at the end of
the process. In each department, it is assumed that the labor and
factory overhead are applied evenly throughout the process.
At the end of January, the production reports for the month
show the following:
Dept. 1 Dept. 2 Dept. 3Started in process . . . . . . . . . . . . . . . . . . . . 50,000 — —
Received from prior department . . . . . . . — 40,000 30,000
Finished and transferred . . . . . . . . . . . . . . 40,000 30,000 28,000
Finished and on hand . . . . . . . . . . . . . . . . . — 5,000 —
Work in process, end of month . . . . . . . . 10,000 5,000 2,000
Stage of completion . . . . . . . . . . . . . . . . . . 1/2 1/4 3/4
The cost summary for January shows the following:
Dept. 1 Dept. 2 Dept. 3Materials . . . . . . . . . . . . . . . . . . . . . . . . . . . . . $22,500 $23,200 $19,600
Labor . . . . . . . . . . . . . . . . . . . . . . . . . . . . . . . . 7,200 14,500 11,800
Factory overhead . . . . . . . . . . . . . . . . . . . . . 10,800 14,500 8,850
$40,500 $52,200 $40,250
LO1
Chapter 6 – Process Cost Accounting—Additional Procedures 329

Required:
1. Prepare a cost of production summary for each department
for January, using the average cost method.
2. Prepare a departmental cost work sheet for January. (Hint:
See Chapter 5 to review.)
3. Make the required journal entries to record the January
operations.
4. Prepare a statement of cost of goods manufactured for the
month ended January 31.
P6-4 Cost of completed units and ending inventory
Gold Giant Products, Inc., cans peas and uses an average cost
system. For the month of November, the company showed the
following:
Peas completed and canned . . . . . . . . . . . . . . . . . 245,000 pounds
Peas in process at the end of November: 100%complete as to peas, 50% completeas to labor and overhead, 0% completeas to cans . . . . . . . . . . . . . . . . . . . . . . . . . . . . . . . . . 16,500 pounds
Cost data:
Peas . . . . . . . . . . . . . . . . . . . . . . . . . . . . . . . . . . . . . . $0.10 per equivalent pound
Labor . . . . . . . . . . . . . . . . . . . . . . . . . . . . . . . . . . . . . $0.25 per equivalent pound
Overhead . . . . . . . . . . . . . . . . . . . . . . . . . . . . . . . . . $0.15 per equivalent pound
Cans . . . . . . . . . . . . . . . . . . . . . . . . . . . . . . . . . . . . . $0.07 per can
Each can contains 16 oz, or 1 lb, of peas.
Required:
1. Calculate the cost of the completed production for November.
2. Show the detailed cost of the ending inventory for November.
P6-5 Lost units; cost of production summaries
Sinaloa Products Co. uses the process cost system. A record of
the factory operations for the month of October follows:
Production Summary UnitsStarted in process . . . . . . . . . . . . . . . . . . . . . . . . . . . . . . . . . 12,500
Finished and transferred to stockroom . . . . . . . . . . . . . . 9,500
In process, end of month, one-half completed as tomaterials, labor, and overhead . . . . . . . . . . . . . . . . . . . . 1,000
Cost SummaryMaterials . . . . . . . . . . . . . . . . . . . . . . . . . . . . . . . . . . . . . . . . . . $30,000
Labor . . . . . . . . . . . . . . . . . . . . . . . . . . . . . . . . . . . . . . . . . . . . . 12,000
Factory overhead . . . . . . . . . . . . . . . . . . . . . . . . . . . . . . . . . . 18,000
Required:
Prepare a cost of production summary, assuming that the cost of
lost units is absorbed by the good units completed.
LO1
LO2
330 Principles of Cost Accounting

P6-6 Units gained; cost of production summariessimilar to Self-Study Problem 1
Cancun Chemicals, Inc., which uses the process cost system, has
two departments: A and B. In both departments, all of the
materials are put into production at the beginning of the process.
The materials added in Dept. B increase the number of units
being processed by 25%. Labor and factory overhead are in-
curred uniformly throughout the process in all departments.
A record of the factory operations for May follows:
Cost Summary Dept. A Dept. BMaterials . . . . . . . . . . . . . . . . . . . . . . . . . . . . . . . . . . $25,000 $ 7,500
Labor . . . . . . . . . . . . . . . . . . . . . . . . . . . . . . . . . . . . . 10,800 10,140
Factory overhead . . . . . . . . . . . . . . . . . . . . . . . . . . 8,100 7,215
Production Summary Units
Dept. A Dept. BStarted in process . . . . . . . . . . . . . . . . . . . . . . . . . . 10,000
Received from prior department . . . . . . . . . . . . 8,500
Added to units in process . . . . . . . . . . . . . . . . . . 1,500
Finished and transferred . . . . . . . . . . . . . . . . . . . 8,500 9,500
Units in process, end of month . . . . . . . . . . . . . 1,500 500
Stage of completion . . . . . . . . . . . . . . . . . . . . . . . . 1/3 1/2
Required:
Prepare a cost of production summary for each department for
the month of May.
P6-7 FIFO cost method; cost of production summary
Boise Beverages, Inc., uses the FIFO cost method and adds all
materials, labor, and factory overhead evenly to production. A
record of the factory operations for the month of October follows:
Production Summary UnitsWork in process, beginning of month,
one-fourth completed . . . . . . . . . . . . . . . . . . . . . . . . . . . . . . . . . . 5,000
Started in process . . . . . . . . . . . . . . . . . . . . . . . . . . . . . . . . . . . . . . . . 13,000
Finished and transferred to stockroom . . . . . . . . . . . . . . . . . . . . 11,000
Work in process, end of month,three-fourths completed . . . . . . . . . . . . . . . . . . . . . . . . . . . . . . . . 7,000
Cost SummaryWork in process, beginning of month . . . . . . . . . . . . . . . . . . . . . $10,000
Materials . . . . . . . . . . . . . . . . . . . . . . . . . . . . . . . . . . . . . . . . . . . . . . . . 45,000
Labor . . . . . . . . . . . . . . . . . . . . . . . . . . . . . . . . . . . . . . . . . . . . . . . . . . . 30,000
Factory overhead . . . . . . . . . . . . . . . . . . . . . . . . . . . . . . . . . . . . . . . . 15,000
Required:
Prepare a cost of production summary for the month.
LO3
LO4
Chapter 6 – Process Cost Accounting—Additional Procedures 331

P6-8 Cost of units completed and ending inventory; FIFO method
Columbus Candy Company had a cost per equivalent pound for
the month of $4.56 for materials, $1.75 for labor, and $1.00 for
overhead. During the month, 10,250 pounds were completed and
transferred to finished goods. The 3,200 pounds in ending work in
process were 100% complete as to materials and 60% complete
as to labor and overhead. At the beginning of the month, 1,500
pounds were in process, 100% complete as to materials and 50%
complete as to labor and overhead. The beginning inventory had
a cost of $8,775. Columbus uses FIFO costing.
Required:
1. Calculate the cost of the pounds completed and transferred.
2. Calculate the cost of ending work in process.
P6-9 Average and FIFO cost methods; losses at the beginning andend of processingsimilar to Self-Study Problem 1
Mt. Repose Manufacturing Company uses a process cost system.
Its manufacturing operation is carried on in two departments:
Machining and Finishing. The Machining Department uses the
average cost method, and the Finishing Department uses the FIFO
cost method. Materials are added in both departments at the
beginning of operations, but the added materials do not increase
the number of units being processed. Units are lost in the Machin-
ing Department throughout the production process, and inspec-
tion occurs at the end of the process. The lost units have no scrap
value and are considered to be a normal loss.
Production statistics for July show the following data:
Machining FinishingUnits in process, July 1 (all material,
40% of labor and overhead) . . . . . . . . . . . . . . . . . . . . 20,000
Units in process, July 1 (all material,80% of labor and overhead) . . . . . . . . . . . . . . . . . . . . 40,000
Units started in production . . . . . . . . . . . . . . . . . . . . . . 140,000
Units completed and transferred . . . . . . . . . . . . . . . . . 100,000
Units transferred from Machining . . . . . . . . . . . . . . . . 100,000
Units completed and transferred tofinished goods . . . . . . . . . . . . . . . . . . . . . . . . . . . . . . . . 100,000
Units in process, July 31 (all material,60% of labor and overhead) . . . . . . . . . . . . . . . . . . . . 40,000
Units in process, July 31 (all material,40% of labor and overhead) . . . . . . . . . . . . . . . . . . . . 40,000
Units lost in production . . . . . . . . . . . . . . . . . . . . . . . . . . 20,000
Production Costs Machining FinishingWork in process, July 1:
Materials . . . . . . . . . . . . . . . . . . . . . . . . . . . . . . . . . . . . . $ 40,000 $110,000
Labor . . . . . . . . . . . . . . . . . . . . . . . . . . . . . . . . . . . . . . . . 24,000 60,000
Factory overhead . . . . . . . . . . . . . . . . . . . . . . . . . . . . . 8,000 40,000
Costs in Machining Department . . . . . . . . . . . . . . . . 240,000
LO4
LO5
332 Principles of Cost Accounting

Production Costs Machining FinishingCosts incurred during month:
Materials . . . . . . . . . . . . . . . . . . . . . . . . . . . . . . . . . . . . . $280,000 $240,000
Labor . . . . . . . . . . . . . . . . . . . . . . . . . . . . . . . . . . . . . . . . 180,000 160,000
Factory overhead . . . . . . . . . . . . . . . . . . . . . . . . . . . . . 60,000 80,000
Required:
Prepare a cost of production summary for each department.
(Round to three decimal places.)
P6-10 Joint cost allocations
Chikin, Inc., specializes in chicken farming. Chickens are raised,
packaged, and sold mostly to grocery chains. Chickens are ac-
counted for in batches of 50,000. At the end of each growing period,
the chickens are separated and sold by grades. Grades AA and A
are sold to large grocery chains, and B and C are sold to other
buyers. For costing purposes, Chikin treats each batch of chicks as
a joint product. The cost data for a batch of 50,000 chicks follows:
GradeNumber
of ChickensAverage Pounds
per ChickenSelling Price
per PoundAA 25,000 5 $1.00
A 15,000 4 0.75
B 6,000 2 0.50
C 4,000 1 0.25
Total joint costs for the batch were $125,000.
Required:
Compute the cost allocations for each product, using the relative
sales value method.
P6-11 Joint cost allocation with costs after split-off and by-productrevenuesimilar to Self-Study Problem 2
Boone Oil Company transports crude oil to its refinery where it is
processed into main products gasoline, kerosene, and diesel
fuel, and by-product base oil. The base oil is sold at the split-off
point for $500,000 of annual revenue, and the joint processing
costs to get the crude oil to split-off are $5,000,000. Additional
information includes:
ProductBarrels
ProducedCost AfterSplit-Off
Selling PricePer Barrel
Gasoline 500,000 $2,000,000 $25
Kerosene 100,000 500,000 30
Diesel fuel 250,000 1,000,000 20
Required:
Determine the allocation of joint costs, using the adjusted sales
value method. (Hint: Reduce the amount of the joint costs to be
allocated by the amount of the by-product revenue.)
LO5
LO5
Chapter 6 – Process Cost Accounting—Additional Procedures 333

MINI-CASE
Allocation of joint costs
Clark Kent, Inc., buys crypton for $0.80 a gallon. At the end of processing
in Dept. 1, crypton splits off into products A, B, and C. Product A is sold at
the split-off point with no further processing. Products B and C require
further processing before they can be sold. Product B is processed in Dept.
2, and Product C is processed in Dept. 3. Following is a summary of costs
and other related data for the year ended December 31:
Dept. 1 Dept. 2 Dept. 3Cost of crypton . . . . . . . . . . . . . . . . . . . . . . . $ 76,000 — —
Direct labor . . . . . . . . . . . . . . . . . . . . . . . . . . . 14,000 $51,000 $ 65,000
Factory overhead . . . . . . . . . . . . . . . . . . . . . 10,000 26,500 49,000
Total . . . . . . . . . . . . . . . . . . . . . . . . . . . . . . . $100,000 $77,500 $114,000
Product A Product B Product CGallons sold . . . . . . . . . . . . . . . . . . . . . . . . . . 20,000 30,000 45,000
Gallons on hand at December 31 . . . . . . 10,000 — 15,000
Sales in dollars . . . . . . . . . . . . . . . . . . . . . . . $30,000 $96,000 $141,750
No inventories were on hand at the beginning of the year, and no crypton
was on hand at the end of the year. All gallons on hand at the end of the
year were complete as to processing. Kent uses the relative sales value
method of allocating joint costs.
Required:
1. Calculate the allocation of joint costs.
2. Calculate the total cost per unit for each product.
3. In examining the product cost reports, Lois Lane, Vice President—
Marketing, notes that the per-unit cost of Product B is greater than the
selling price of $3.20 that can be received in the competitive market-
place. Lane wonders if they should stop selling Product B. How did
Lane determine that the product was being sold at a loss? What per-
unit cost should be used in determining whether Product B should be
sold?
INTERNET EXERCISE
Process Costing
The Coca-Cola Company’s manufacturing operations are ideal for process
costing because it and its bottlers produce long runs of identical bev-
erages in a continuous flow production process. Go to the companion
LO5
LO5
334 Principles of Cost Accounting

Web site at www.cengage.com/accounting/vanderbeck and visit the link
for Coca-Cola to answer the following questions:
1. Where is Coca-Cola headquartered, and how many employees does it
have worldwide?
2. What functions does the Coca-Cola Company perform?
3. Who are Coca-Cola’s bottlers?
4. What functions do the bottlers perform?
5. Where does Coca-Cola rank in the sales of various types of beverages?
Chapter 6 – Process Cost Accounting—Additional Procedures 335

This page intentionally left blank

CHAPTER 7
The Master Budget andFlex ib le Budget ing
‘‘Prediction is very difficult, especially about the future.’’
Niels Bohr
This humorous but wise quotation is relevant to the major
topic of this chapter—financial planning via the budgeting pro-
cess. Budgets aren’t just for making sure that your household
expenditures don’t exceed your income. Many businesses do
the ‘‘lion’s share’’ of their planning as part of their annual
budgeting exercise. This chapter examines, in depth, two types
of budgets that are commonly used in practice: the master
budget prepared prior to the beginning of the period that is
based on the company’s planned accomplishments; and the
flexible budget prepared after the fact to compare the actual
operating results to what should have occurred, given the level
of operations achieved for the period.
M ost successful companies today use operating budgets to helpthem in their constant effort to analyze and control operations,keep costs in line, and reduce expenses. A budget is a planning
device that helps a company set goals and that serves as a gauge against whichactual results can be measured. Many heads of households are familiar withthe basic aspects of budgeting whereby they estimate their income for thefollowing year, determine what their living expenses will be, and then,depending on the figures, reduce unnecessary spending, set up a savings plan,or possibly determine additional ways to supplement their income. Duringthe year, they compare their budget with their actual income and expendituresto be sure that expenses do not exceed income and cause financial difficulties.
Learning Objectives
After studying this
chapter, you should
be able to:
LO1Explain the
general prin-
ciples involved in the
budgeting process.
LO2Identify and
prepare the
components of the
master budget.
LO3Identify and
prepare com-
ponents of the flexible
budget.
LO4Explain the
procedures to
determine standard
amounts of factory
overhead at different
levels of production

Budgeting in business and industry is a formal method of detailedfinancial planning. It encompasses the coordination and control of everysignificant item in the balance sheet and income statement. Budgeting isused to help the company reach its long-term and short-term objectives. Ifthe principles of budgeting are carried out in a proper manner, thecompany can be more assured that it will efficiently use all of its resourcesand achieve the most favorable results possible in the long run.
Principles of BudgetingA primary objective of any for-profit organization is to maximize its incomeby attaining the highest volume of sales at the lowest possible cost. Planningand control are absolutely essential in achieving this goal, and budgetingproduces the framework by which the organization can reach this objective.The budget then becomes a road map that guides managers along the wayand lets them know when the company is straying from its planned route. Itis a chart of the course of operations. In addition to forecasting costs andprofits as a means of cost control, the budget requires those in authority inall areas of the business to carefully analyze all aspects of their responsibilityfor costs as well as to analyze company strengths and weaknesses.
The general principles of budgeting have several requirements:
1. Management must clearly define its objectives.
2. Goals must be realistic and possible to attain.
3. The budget must carefully consider economic developments, the gen-eral business climate, and the condition of the industry, along withchanges and trends that may influence sales and costs, because thebudgeting process involves looking to the future. Historical data shouldbe used only as a stepping-off point for projections into the future.
4. There must be a plan, which is consistently followed, to constantlyanalyze the actual results as compared with the budget.
5. The budget must be flexible enough so that it can be modified in thelight of changing conditions; it must not be so restrictive that changescannot be made where more favorable results are foreseeable.
6. Responsibility for forecasting costs must be clearly defined, andaccountability for actual results must be enforced. This principleencourages careful analysis and precise evaluation.
Preparing the Master BudgetThe master or static budget is prepared for a single level of volume basedon management’s best estimate of the level of production and sales for thecoming period. The master budget is usually prepared one year in advance,corresponding with the company’s fiscal year. It is often divided into the
LO1Explain the
general prin-
ciples involved in the
budgeting process.
LO2Identify and
prepare the
components of the
master budget.
338 Principles of Cost Accounting

four calendar quarters of the year, with the upcoming quarter broken downfurther into months. Many companies prepare a continuous or rollingbudget that ‘‘rolls forward’’ so that as one month or quarter is completed anew month or quarter is added at the end of the budget, resulting in abudget that is always one year in advance. Advocates of continuous budget-ing argue that it causes managers to have a more long-term perspective,rather than just concentrating on the next month or quarter.
The master budget includes operating budgets and financial budgets asillustrated in Figure 7-1. Operating budgets include components of thepro-forma (projected) financial statements, such as the sales and produc-tion budgets that are part of the budgeted income statement. Operatingbudgets are stated in both units and dollars. Financial budgets includethe budget balance sheet, budgeted retained earnings statement, andbudgeted cash flows statement, as well as the cash and capital expendituresbudgets. Details from the operating budgets are incorporated into thefinancial budgets to determine the organization’s generation and use offunds for the period.
The various components of the operating budget for a manufacturer willbe emphasized in this chapter. The budgeting process for a manufacturer ismuch more complex than that for a merchandising or service business.Manufacturers have to budget for the acquisition of raw materials and labor,as well as for the incurrence of a significant amount of manufacturingoverhead costs. In contrast, merchandisers purchase products in their finalform, and service businesses provide a service rather than a product, thussimplifying the budgeting process. Although this example is for a manufac-turing business, budgeting is equally important for merchandising andservice businesses, as illustrated in Chapter 9.
Sales BudgetIn preparing operating budgets, management must consider all the items ofrevenue and expense. The usual starting point in the budgeting process is asales budget, followed by a determination of inventory policy, a productionbudget, budgets for direct materials, direct labor, factory overhead, and
Figure 7-1 Components of the Master Budget
Master Budget
Financial Budgets• Cash Budget• Capital Expenditures Budget• Budgeted Balance Sheet• Budgeted Retained Earnings Statement• Budgeted Cash Flows Statement
Operating Budgets• Sales Budget• Cost of Goods Sold Budget: • Production Budget • Direct Materials Budget • Direct Labor Budget • Factory Overhead Budget• Selling and Administrative Expenses Budget• Budgeted Income Statement
Chapter 7 – The Master Budget and Flexible Budgeting 339

then cost of goods sold, plus budgeted selling and administrative expenses,all culminating in a budgeted income statement. A flow diagram of theoperating budgets appears in Figure 7-2.
Although all of the aforementioned budgets are important, the salesbudget is especially significant, because management must use this informa-tion as a basis for preparing all other budgets. The sales budget projectsthe volume of sales in both units and dollars. In estimating the sales forthe coming year, the sales department must take into consideration presentand future economic situations. It should research and carefully analyzemarket prospects for its products and give consideration to the develop-ment of new products and the discontinuance of old products. It shouldmake these analyses by territory, by type of product, and possibly bytype of customer. Marketing researchers should also carefully surveyand evaluate consumer demand. A new aid in budgeting for sales is
Figure 7-2 Operating Budgets Resulting in Budgeted Income Statement
SalesBudget
ProductionBudget
DirectLabor
Budget
Cost ofGoods Sold
Budget
DirectMaterialsBudget
FactoryOverhead
Budget
Selling andAdministrative
ExpensesBudget
BudgetedIncome
Statement
340 Principles of Cost Accounting

demand software that takes numerous variables into consideration whenforecasting sales, such as projected economic conditions in the industry andin the economy as a whole, population trends, and predicted weatherpatterns.
It is important for front-line managers, who are responsible for generat-ing revenue or controlling costs, to initiate the budgeting process for theirareas because they are the ones closest to the individual sales territory orproduction department situation. This is known as participative budgetingor ‘‘bottom up’’ budgeting, where the managers closest to the situationmake projections that are then reviewed by their superiors. Research hasshown that managers are more apt to meet or beat their budget projectionsin companies that practice participative budgeting. Their motivation ishigher because they are the ones who set the budget numbers and there isno one else to blame for imposing unrealistic standards. Companies thatpractice participative budgeting should still have the individual budgetsreviewed by the manager’s immediate supervisor. This will precludeexcessive budget slack where a manager sets unrealistically low goals in aneffort to make only average performance look good.
After the above considerations, the mix of the products to be sold aswell as the projected unit volume and selling price of each can bedetermined. Figure 7-3 is the sales budget for California Casuals, Inc., themanufacturer of one type of patio table and chair.
Production Budget
After the sales forecast and desired inventory levels have been determined,management can determine production requirements. Assume the salesforecast for chairs in Figure 7-3, stable production throughout the year, abeginning inventory of 2,500 units, and a desired ending inventory 2,000
Figure 7-3 Sales Budget
1
2
3
4
5
6
7
8
9
10
11
12
13
14
15
16
17
A B C D
Table:
Southwest................................................... 12,000 $150 $1,800,000
West ........................................................... 18,000 150 $2,700,000
Total.................................................... 30,000 $4,500,000
Chair:
Southwest................................................... 40,000 $50 $2,000,000
West ........................................................... 60,000 50 $3,000,000
Total.................................................... 100,000 $5,000,000
Total Revenue ............................................... $9,500,000
California Casuals, Inc.
Schedule 1—Sales Budget
For the Year Ended December 31, 2011
Unit
Selling
Price Total Sales
Unit
Sales
VolumeProduct and Region
Chapter 7 – The Master Budget and Flexible Budgeting 341
units greater than the beginning inventory. The number of chairs to beproduced can be set forth in a production budget as follows:
Units to be sold . . . . . . . . . . . . . . . . . . . . . . . . . . . . . . . . . . . . . . . . . . . . . . . . . . . . . . . . 100,000
Ending inventory required . . . . . . . . . . . . . . . . . . . . . . . . . . . . . . . . . . . . . . . . . . . . . . 4,500
Total . . . . . . . . . . . . . . . . . . . . . . . . . . . . . . . . . . . . . . . . . . . . . . . . . . . . . . . . . . . . . . . . . . . 104,500
Beginning inventory . . . . . . . . . . . . . . . . . . . . . . . . . . . . . . . . . . . . . . . . . . . . . . . . . . . . 2,500
Units to be manufactured . . . . . . . . . . . . . . . . . . . . . . . . . . . . . . . . . . . . . . . . . . . . . . . 102,000
Units per month (102,000/12) . . . . . . . . . . . . . . . . . . . . . . . . . . . . . . . . . . . . . . . . . . . . 8,500
In actual practice, this computation may be more complex than theabove example. Management must try to achieve a satisfactory balancebetween production, inventory, and the timely availability of goods to besold. For example, if the company’s sales are seasonal rather than evenlydistributed throughout the year, stable production might produce thefollowing situation:
Number of Units
Produced Sold On HandBeginning balance . . . . . . . . . . . . 2,500
January . . . . . . . . . . . . . . . . . . . . . . 8,500 1,000 10,000
February . . . . . . . . . . . . . . . . . . . . . 8,500 2,000 16,500
March . . . . . . . . . . . . . . . . . . . . . . . . 8,500 3,000 22,000
April . . . . . . . . . . . . . . . . . . . . . . . . . 8,500 10,000 20,500
May . . . . . . . . . . . . . . . . . . . . . . . . . . 8,500 15,000 14,000
June . . . . . . . . . . . . . . . . . . . . . . . . . 8,500 15,000 7,500
July . . . . . . . . . . . . . . . . . . . . . . . . . . 8,500 12,000 4,000
August . . . . . . . . . . . . . . . . . . . . . . . 8,500 9,000 3,500
September . . . . . . . . . . . . . . . . . . . 8,500 9,000 3,000
October . . . . . . . . . . . . . . . . . . . . . . 8,500 8,000 3,500
November . . . . . . . . . . . . . . . . . . . . 8,500 8,000 4,000
December . . . . . . . . . . . . . . . . . . . . 8,500 8,000 4,500
Total . . . . . . . . . . . . . . . . . . . . . . . 102,000 100,000
The ‘‘On Hand’’ column in the above table indicates that the companymust have enough storage facility to handle as many as the 22,000 units ininventory at the end of March. However, most of this space would beunused during several months of the year, such as July through December.This would result in overinvestment in inventory and excess inventorycarrying costs for storage space, insurance, and taxes. In this situation, amanufacturing concern might lease some storage facilities during the peakmonths, thereby requiring a much smaller company-owned facility. How-ever, leasing may present problems of inconvenience, expense, and unavail-ability of the facilities at the right time and in the right place. In addition,during months such as March and April, the company would have a
342 Principles of Cost Accounting

considerable amount of capital tied up in finished goods that could bethreatened by obsolescence.
Another solution is for management to schedule different levels ofproduction each month based on estimated monthly sales, in order tomaintain a relatively stable inventory and to minimize the number of unitsstored. The following table shows this approach:
Number of Units
Produced Sold On HandBeginning balance . . . . . . . . . . . . . . . 2,500
January . . . . . . . . . . . . . . . . . . . . . . . . . 1,500 1,000 3,000
February . . . . . . . . . . . . . . . . . . . . . . . . 2,500 2,000 3,500
March . . . . . . . . . . . . . . . . . . . . . . . . . . 3,000 3,000 3,500
April . . . . . . . . . . . . . . . . . . . . . . . . . . . . 10,000 10,000 3,500
May . . . . . . . . . . . . . . . . . . . . . . . . . . . . 15,000 15,000 3,500
June . . . . . . . . . . . . . . . . . . . . . . . . . . . . 15,000 15,000 3,500
July . . . . . . . . . . . . . . . . . . . . . . . . . . . . 12,000 12,000 3,500
August . . . . . . . . . . . . . . . . . . . . . . . . . . 9,500 9,000 4,000
September . . . . . . . . . . . . . . . . . . . . . . 9,500 9,000 4,500
October . . . . . . . . . . . . . . . . . . . . . . . . . 8,000 8,000 4,500
November . . . . . . . . . . . . . . . . . . . . . . 8,000 8,000 4,500
December . . . . . . . . . . . . . . . . . . . . . . . 8,000 8,000 4,500
Total . . . . . . . . . . . . . . . . . . . . . . . . . . 102,000 100,000
This alternative requires minimum storage space and related ex-penses, but it creates a new problem. The factory must have enoughcapacity to handle the peak production of 15,000 units in May and June,but these facilities would be from 50 to 90% idle during some months. Apossible solution is to maintain a smaller facility and to engage two orthree shifts of employees during the busier months. Although the capitalinvestment problem would be reduced, a bigger problem would becreated because the workforce could vary by as much as 1,000% from theslowest period, January, to the most active periods, May and June. Finetuning the workforce would require hiring new employees in the earliermonths as production climbed, with the resulting high cost of recruitingand training, as well as the potential quality problem resulting from theuse of new, inexperienced employees. In the later months, as productiondropped, many workers would have to be laid off, resulting in additionalexpense for unemployment compensation premiums as well as potentialseverance pay, and a feeling of ill-will toward the company in thecommunity.
Companies with good management will carefully analyze the abovealternatives and arrive at a plan that represents a reasonable compromisebetween the two alternatives. Note that the utilization of a just-in-timepurchasing and manufacturing system would minimize the above problems.
Chapter 7 – The Master Budget and Flexible Budgeting 343

The production budget for California Casuals, Inc., appears in Figure7-4.
Direct Materials Budget
Following the preparation of the production budget, the direct materialsbudget, direct labor budget, and factory overhead budget can be prepared.The format of the direct materials budget is similar to the productionbudget. The desired ending inventory for each material is added to thequantity needed to meet production needs, and then that total is reduced bythe estimated beginning inventory to determine the amount of material tobe purchased. Multiplying the quantity of material to be purchased by thebudgeted, or standard, unit cost results in the total materials purchase cost.(Recall that standard costs are costs that would be incurred under efficientoperating conditions and are forecast before the budget is prepared.) Thedirect materials budget for California Casuals, Inc., appears in Figure 7-5.
In the direct materials budget, the standard quantity and price ofmaterial to be used for each unit of product is as follows:
Table ChairLumber: 10 board feet per unit @ $2 per board foot 5 board feet per unit
Paint: 0.2 gallons per unit @ $20 per gallon 0.1 gallons per unit
The desired beginning and ending inventories for raw materials in thedirect materials budget are as follows:
Lumber (Board Feet) Paint (Gallons)Beginning inventory . . . . . . . . . . . . . . . . . . . . . 30,000 1,000
Ending inventory . . . . . . . . . . . . . . . . . . . . . . . . 40,000 800
There should be close coordination between the purchasing andproduction functions, so that materials are purchased as closely as possibleto the time that they will be placed into production, thus minimizinginventory carrying costs while guarding against stockouts.
Figure 7-4 Production Budget
1
2
3
4
5
6
7
8
9
10
11
A B C
Sales............................................................... 30,000 100,000
Plus desired ending inventory, Dec. 31..... 1,500 $4,500
Total................................................................ 31,500 104,500
Less estimated beginning inventory, Jan. 1 1,000 $2,500
Total Production ............................... 30,500 102,000
California Casuals, Inc.
Schedule 2—Production Budget
For the Year Ended December 31, 2011
Chairs
Units
Tables
344 Principles of Cost Accounting

Direct Labor BudgetThe production requirements from the production budget are used forpreparation of the direct labor budget. The standard labor time allowedper unit for each factory operation is multiplied by the number of requiredunits to obtain the total direct manufacturing labor hours allowed. Thetotal hours required for each operation are then multiplied by the hourlyrate for that operation to obtain the budgeted direct labor cost. The directlabor budget for California Casuals, Inc., appears in Figure 7-6.
In the direct labor budget, the standard quantity and price of laborallowed for each unit of product is as follows:
Table ChairCutting Department . . . . . . . . 0.25 hours per unit @ $15 per hour 0.10 hours per unit
Assembly Department . . . . . . 0.20 hours per unit @ $12 per hour 0.15 hours per unit
Painting Department . . . . . . . 0.15 hours per unit @ $10 per hour 0.10 hours per unit
Just as there was a need for close coordination between purchasing andproduction functions, interaction between the human resources and pro-duction departments is equally important to ensure that enough of the rightkind of labor is available to meet production. The Japanese concept ofkaizen is relevant to the topic of setting standards such as the labor timeslisted above. Kaizen means continuous improvement, and kaizen budget-ing is the practice of building continuous improvement into the budgetnumbers. For example, although the standard labor time was .25 hours perunit in the Cutting Department for 2011, it may be adjusted to .20 hoursper unit in 2012 because the employees should now be more proficient at
Figure 7-5 Direct Materials Budget
1
2
3
4
5
6
7
8
9
10
11
12
13
14
15
16
17
18
19
20
A B C D
Quantities required for production:
Tables (Note A) 305,000 6,100
Chairs (Note B) 510,000 10,200
Plus desired ending inventory, Dec. 31 40,000 800
Total 855,000 17,100
Less estimated beginning inventory, Jan. 1 30,000 1,000
Total quantity to be purchased 825,000 16,100
Unit price $2 $20
Total direct materials purchases $1,650,000 $322,000 $1,972,000
Note A: 30,500 units × 10 board feet/unit = 305,000 bd ft
30,500 units × 0.2 gallons/unit = 6,100 gal
Note B: 102,000 units × 5 board feet/unit = 510,000 bd ft
102,000 units × 0.1 gallon/unit = 10,200 gal
California Casuals, Inc.
Schedule 3—Direct Materials Budget
For the Year Ended December 31, 2011
Paint
(Gallons)
Lumber
(Board Feet)
Direct Materials Total
Product and Region
Chapter 7 – The Master Budget and Flexible Budgeting 345

completing the task. Often the standards are changed monthly or quarterlyto capture the more immediate effect of learning how to perform the taskmore proficiently.
Factory Overhead Budget
The factory overhead budget consists of the estimated individual factoryoverhead items needed to meet production requirements. The factoryoverhead budget for California Casuals, Inc., based on production estimatesof 30,500 tables and 102,000 chairs, appears in Figure 7-7.
Cost of Goods Sold Budget
The cost of goods sold budget is prepared upon completion of the directmaterials, direct labor, and factory overhead budgets. The estimated begin-ning inventories, as well as the desired ending inventories, of work in
Figure 7-6 Direct Labor Budget
1
2
3
4
5
6
7
8
9
10
11
12
13
14
15
16
17
A B C D
Hours required for production:
Tables (Note A) 7,625 6,100 4,575
Chairs (Note B) 10,200 15,300 10,200
Total 17,825 21,400 14,775
Hourly rate $15 $12 $10
Total direct labor cost $267,375 $256,800 $147,750 $671,925
Note A: Cutting 30,500 units × 0.25 hours per unit = 7,625 hours
Assembly 30,500 units × 0.20 hours per unit = 6,100 hours
Painting 30,500 units × 0.15 hours per unit = 4,575 hours
Note B: Cutting 102,000 units × 0.10 hours per unit = 10,200 hours
Assembly 102,000 units × 0.15 hours per unit = 15,300 hours
Painting 102,000 units × 0.10 hours per unit = 10,200 hours
California Casuals, Inc.
Schedule 4—Direct Labor Budget
For the Year Ended December 31, 2011
Assembly Painting TotalCutting
Figure 7-7 Factory Overhead Budget
1
2
3
4
5
6
7
8
9
10
11
A B
Indirect materials ........................................ $225,000
Indirect labor ............................................... 375,250
Depreciation of building .............................. 85,000
Depreciation of machinery and equipment 67,500
Insurance and property taxes .................... 48,750
Power and light ........................................... 29,800
Total factory overhead cost ......................... $831,300
California Casuals, Inc.
Schedule 5—Factory Overhead Budget
For the Year Ended December 31, 2011
346 Principles of Cost Accounting

process and finished goods must be included in the computation of cost ofgoods sold. California Casual’s projections for beginning and endinginventories in dollars are as follows:
Estimated beginning inventories on January 1:
Finished Goods . . . . . . . . . . . . . . . . . . . . . . . . . . . . . . . . . . . . . . . . . . . . . . . . . . . . . . $ 72,400
Work in Process . . . . . . . . . . . . . . . . . . . . . . . . . . . . . . . . . . . . . . . . . . . . . . . . . . . . . . 22,600
Desired ending inventories on December 31:
Finished Goods . . . . . . . . . . . . . . . . . . . . . . . . . . . . . . . . . . . . . . . . . . . . . . . . . . . . . . $120,825
Work in Process . . . . . . . . . . . . . . . . . . . . . . . . . . . . . . . . . . . . . . . . . . . . . . . . . . . . . . 18,000
The cost of goods sold budget for California Casuals, Inc., appears inFigure 7-8.
Selling and Administrative Expenses Budget
Once the sales forecast has been made, a selling and administrativeexpenses budget can be prepared. The sales forecast will affect theplanned expenditure level for such items as sales commissions, advertising,and travel. The budget has separate sections for selling and for adminis-trative expenses, with line item expenses within each category. A selling andadministrative expenses budget appears in Figure 7-9.
Figure 7-8 Cost of Goods Sold Budget
1
2
3
4
5
6
7
8
9
10
11
12
13
14
15
16
17
18
19
20
21
22
23
24
25
26
A B C D
Finished goods inventory, Jan. 1 ............................. $72,400
Work in process inventory, Jan. 1 ............................ $22,600
Direct materials inventory, Jan. 1 (Note A) ............... $80,000
Direct materials purchases (Schedule 3) ................ 1,972,000
Direct materials available for use ............................. $2,052,000
Less direct materials inventory, Dec. 31 (Note B) .... 96,000
Cost of direct materials used.................................... $1,956,000
Direct labor (Schedule 4) ......................................... 671,925
Factory overhead (Schedule 5) ............................... 831,300
Total manufacturing costs ........................................ 3,459,225
Total work in process during year ............................ $3,481,825
Less work in process inventory, Dec. 31 ................. 18,000
Cost of goods manufactured ................................... 3,463,825
Cost of goods available for sale .............................. $3,536,225
Less finished goods inventory, Dec. 31 .................. 120,825
Cost of goods sold.................................................... $3,415,400
Note A: Lumber 30,000 bd ft × $2 per bd ft = $60,000
Paint 1,000 gal × $20 per gal = 20,000
Direct materials inventory, Jan. 1 $80,000
Note B: Lumber 40,000 bd ft × $2 per bd ft = $80,000
Paint 800 gal × $20 per gal = 16,000
Direct materials inventory, Dec. 31 $96,000
California Casuals, Inc.
Schedule 6—Cost of Goods Sold Budget
For the Year Ended December 31, 2011
Chapter 7 – The Master Budget and Flexible Budgeting 347

Budgeted Income Statement
Upon completion of the preceding budgets, a budgeted income state-ment can be prepared. The budgeted income statement summarizes the datafrom all of the other operating budgets and enables management to deter-mine the impact of all of these budget estimates on operating income. If thebudgeted profit does not meet expectations, top management may revisit theindividual budget estimates with the appropriate managers, for the purposeof determining what changes, if any, can be made to improve profitability.
Note that, although spreadsheets were utilized throughout this section,many companies are now using Web-based budgeting, where eachemployee can input the data for which they are responsible at the budgetWeb site. This precludes them from having to prepare individual spread-sheets for their area of responsibility, which then have to uploaded andcoordinated. A budgeted income statement for California Casuals, Inc.,assuming a 40% income tax rate, appears in Figure 7-10.
Other Budgets
Although not illustrated here, the company could now prepare its financialbudgets, including the budgeted financial statements. The cash budgetshows the anticipated flow of cash and the timing of receipts and disburse-ments based on projected revenues, the production schedule, and expenses.Using this budget, management can plan for necessary financing or fortemporary investment of surplus funds.
The company also may prepare a capital expenditures budget, whichis a plan for timing acquisitions of buildings, equipment, or other significantassets. This plan ties in with the sales and production plans and mayinfluence the cash budget for expenditures, to the extent that additionalfinancing may be necessary. A capital expenditures budget is typicallyprepared for a three- to five-year time horizon. A budgeting time horizon is
Figure 7-9 Selling and Administrative Expenses Budget
1
2
3
4
5
6
7
8
9
10
11
12
13
14
15
16
17
A B C
Selling expenses:
Advertising expense ............................................ $730,300
Sales salaries expense ........................................ 688,500
Travel expense ..................................................... 398,000
Total selling expenses ........................................ $1,816,800
Administrative expenses:
Officers’ salaries expense ................................... $655,000
Office salaries expense ....................................... 511,500
Office rent expense ............................................. 65,000
Office supplies expense ...................................... 32,500
Telephone, fax, and copier expense ................... 14,500
Total administrative expenses ............................ 1,278,500
Total selling and administrative expenses................ $3,095,300
California Casuals, Inc.
Schedule 7—Selling and Administrative Expenses Budget
For the Year Ended December 31, 2011
348 Principles of Cost Accounting

often a function of the nature of the business and its industry. For example,long-established businesses, such as Coca Cola and Kellogg’s, in relativelystable industries, such as beverages and food products, would typically havea longer time horizon than an Internet startup company.
Evaluating Budget Performance
If budgeting is to be used successfully as a management tool for controllingoperations, the actual results should be periodically compared with thebudgeted amounts, and the reasons for any significant variances should beexplained, as will be discussed in the next chapter. Without this follow-up,the benefits of budgeting would not be fully utilized. If material differencesare found to exist between budgeted and actual amounts, management mustdetermine who in the organization can best explain the reasons for thevariances. Figure 7-11 illustrates the above process.
Performance reports comparing budgeted to actual amounts should bedistributed to the managers responsible for a particular operation or depart-ment. For example, individual salespersons would receive in-depth reports ofbudgeted and actual sales by customer and product in their territories. Theregional sales manager would receive a summarized report of budgeted andactual sales for all salespersons in that region. The national sales manager wouldreceive a summarized report of budgeted and actual sales for each region.
Figure 7-10 Budgeted Income Statement
1
2
3
4
5
6
7
8
9
10
A B
Net sales (Schedule 1) .............................................. $9,500,000
Cost of goods sold (Schedule 6) .............................. 3,415,400
Gross profit ................................................................ $6,084,600
Selling and administrative expenses (Schedule 7) 3,095,300
Income from operations ............................................ $2,989,300
Income tax ................................................................. 1,195,720
Net income ................................................................ $1,793,580
California Casuals, Inc.
Budgeted Income Statement
For the Year Ended December 31, 2011
Recall and Review 1
The sales department of Big Papi Manufacturing has forecast sales in May
to be 35,000 units. Beginning finished goods inventory on May 1 is 6,000
units, and the finished goods inventory required on May 31 is 2,000 units.
Two pounds of Material X, at a cost of $10 per pound, is required to produce
each unit. The May 1 inventory of Material X is 3,000 lb and the desired May
31 inventory is 4,000 lb. The required production of units in May is
________________ and the direct materials purchases, in dollars, should be
$_______________________.
(After working this exercise, see page 361 for the solution.)
You should now be able to work the following:
Questions 1–14; Exercises 7-1 to 7-5; Problems 7-1 through 7-3; Self-Study
Problem 1; and the Internet Exercise.
Chapter 7 – The Master Budget and Flexible Budgeting 349

Flexible BudgetingBranson Manufacturing, Inc., produces a single type of small motor.The bookkeeper, who does not have an in-depth understanding ofaccounting principles, prepared the following report with the help ofthe production manager:
In a conversation with the sales manager, the production managerwas overheard saying, ‘‘You sales guys really messed up our Mayperformance, and it is only because production did such a great jobcontrolling costs that we aren’t in even worse shape.’’ Do you agree
1
2
3
4
5
6
7
8
9
10
11
12
13
14
15
16
17
18
19
A B C D E
Less variable expenses:
Direct materials
Direct labor
Variable factory overhead
Variable selling and administrative expense
Total variable expense
Contribution margin
Less fixed expenses:
Fixed factory overhead expense
Fixed selling and administrative expense
Total fixed expense
Income from operations
4.50
3.75
2.25
1.50
$12.00
$13.00
$100,000
150,000
$250,000
Branson Manufacturing, Inc.
Performance Report
May, 2011
Actual Results
(45,000 units)
$1,125,000
Master Budget
(50,000 units)
$1,250,000
VarianceFlexible Budget
Per Unit
$25.00Sales
$212,500
175,750
110,250
70,500
$569,000
$556,000
$95,000
160,000
$255,000
$301,000
$225,000
187,500
112,500
75,000
$600,000
$650,000
$100,000
150,000
$250,000
$400,000
$12,500 F
11,750 F
2,250 F
4,500 F
$31,000 F
$94,000 U
$5,000 F
10,000 U
$5,000 U
$99,000 U
$125,000 U
Figure 7-11 Comparison of Budgeted to Actual Performance
Compared against
Feedback anddiscussion ofcauses takes place
Changes, if necessary,and implemented
Variances aredetermined
Actualperformance
Budgetedperformance
LO3Identify and
prepare com-
ponents of the flexible
budget.
350 Principles of Cost Accounting

with the production manager? The use of flexible budgeting incomparing actual results to budgeted expectations is the focus of thissection of the chapter. The mini-case at the end of the chapter is acontinuation of the Branson Manufacturing situation.
The comparison of actual results with the budget to see if the plannedobjectives are being met leads to the use of a flexible budget. Whereas themaster budget is prepared for a single level of activity, the flexible budget isprepared for a range of activities within which the firm may operate. Toimplement a flexible budget, a company must decide how it will respond tovarying sets of conditions—for example, the sale of 10,000 units per monthrather than 9,000; the production of 15,000 units per month rather than17,000; the addition or replacement of a machine in a department; and thedevelopment of new products or the discontinuance of old products.
A company should plan in advance what the effect will be on revenue,expense, and profit if sales or production differ from the master budget. Toillustrate, if budgeted sales for a month are $100,000 and the budgetedselling expense is $25,000, it is reasonable to assume that if actual sales areonly $80,000, the actual selling expense would be less than $25,000, becausecertain selling expenses, such as sales commissions, vary with sales volume.Also, if production volume is 10,000 units rather than the budgeted 9,000units, the actual production costs should logically be greater than theamount budgeted for 9,000 units because certain manufacturing expenses,such as direct materials, vary with the volume of units produced.
The flexible budget is influenced by the presence of fixed and variablecosts as discussed in Chapter 4. Recall that fixed costs are those costs thatdo not change as production changes over a given range of activity. Theseexpenses are a function of time, and generally they will be incurredregardless of the level of production. For example, such expenses asstraight-line depreciation, insurance, property taxes, and supervisory sal-aries will remain the same in dollar total, except in the extreme case of amajor change in production that requires more or fewer machines, facilities,and supervisory personnel.
Variable costs vary in total dollar amount in proportion to any changein production or sales volume. These costs may include such items as directmaterials, direct labor, factory overhead expenses such as supplies, theelectricity to run the machines, and repair costs, and selling and adminis-trative expenses such as sales commissions and copying charges. It isbecause of these variable items that the total cost or revenue will differ fromamounts in the master budget, when the actual level of production or salesvolume is different from the master budget level. For example, if amanufacturer has budgeted direct materials cost of $50,000 based onbudgeted production of 5,000 units for the month, but the actual produc-tion is 6,000 units, there will be little value in comparing the actual directmaterials cost incurred with the $50,000 in the master budget. One wouldexpect that if the actual units produced were greater than 5,000, then thedirect materials cost would be greater than $50,000. A flexible budget,however, would be useful because it would indicate the budgeted direct
Chapter 7 – The Master Budget and Flexible Budgeting 351

materials cost for the 6,000 units of production achieved. This would enablemanagement to determine how well direct materials costs were controlled,given the actual level of production attained.
Preparing the Flexible BudgetAssume that California Casuals’ sales budget for tables in Figure 7-3 wasnot met; actual sales of tables were 28,000, not the 30,000 units appearingin the master budget; and dollar sales were $4,250,000, not the budgetedsales of $4,500,000. If California’s management wanted to know how goodof a job it did generating revenue, given the number of units that wereactually sold, the master budget numbers would not be helpful. For an‘‘apples to apples’’ comparison of budgeted and actual sales revenue at thesame unit volume, the accountant would need to prepare a flexible budgetthat was useful within a relevant range of activity. The flexible budget inFigure 7-12 assumes that the relevant range within which the master budgetcost and revenue relationships would hold is between 28,000 and 32,000tables per year, and it only includes sales revenue, direct materials, anddirect labor broken out in detail, using the budgeted selling price and unitcosts for California Casuals presented earlier in the chapter. To reduce thelevel of detail in the example, the factory overhead and selling and admin-istrative expenses in the California Casuals illustration are listed in total asvariable and fixed, assuming that approximately half of each type of expenseis variable, and half is fixed at the 30,000-unit master budget level. (Budget-ing for factory overhead is covered in depth in the next section of thischapter.)
Note that the three levels of production and sales were chosen merelyfor illustrative purposes, and that a flexible budget could be prepared forany volume level within the relevant range of 28,000 to 32,000 units. Alsonote that the per-unit amounts for the variable costs came from thestandard amounts per unit given in the master budget section of the
Figure 7-12 Flexible Budget for Production and Sale of Tables
1
2
3
4
5
6
7
8
9
10
11
12
13
14
15
16
A B C D
Item
Sales ($150 per unit)
Direct materials:
Lumber ($20 per unit)
Paint ($4 per unit)
Direct labor:
Cutting ($3.75 per unit)
Assembly ($2.40 per unit)
Painting ($1.50 per unit)
Variable factory overhead ($6.93 per unit)
Variable selling and administrative expense
($25.79 per unit)
Contribution margin
Fixed factory overhead
Fixed selling and administrative expense
Operating income
28,000 units
$4,200,000
560,000
112,000
105,000
67,200
42,000
194,040
722,120
$2,397,640
207,825
773,825
$1,415,990
30,000 units
$4,500,000
600,000
120,000
112,500
72,000
45,000
207,900
773,700
$2,568,900
207,825
773,825
$1,587,250
32,000 units
$4,800,000
640,000
128,000
120,000
76,800
48,000
221,760
825,280
$2,740,160
207,825
773,825
$1,758,510
352 Principles of Cost Accounting

chapter. For example, the $20 per-unit cost for lumber was obtained bymultiplying the standard quantity of 10 board feet per table by the standardcost of $2 per board foot.
Preparing a Performance Report Based on FlexibleBudgeting
In preparing the performance report for the production and sale of tablesin Figure 7-13, the actual revenue and expense amounts are assumed. (Notethat for ease of illustration, unlike the master budget illustration, it isassumed that the number of units produced equals the number of units soldso that there are no complications related to inventory level changes.) Thebudgeted revenue and expense amounts were taken from the flexible budgetat the 28,000-unit level in Figure 7-12.
Note that the variance for the sale revenue was $50,000 favorable. Sincethe comparison of budgeted and actual revenue is at the same 28,000-unitlevel, the actual selling price per unit must have been greater than thebudgeted selling price of $150 per table. In fact, the actual average sellingprice was $151.80 ($4,250,000/28,000). So, given the number of units sold,California Casuals obtained favorable selling prices. Recall that the masterbudget, however, planned for the sale of 30,000 units and $4,500,000 inrevenue. Therefore, the company was unsuccessful in generating enoughunit volume to meet master budget revenue projections—maybe, in part,because it raised the selling price per unit.
The same type of flexible budget analysis may be made for the expenseitems. For example, the flexible budget indicates that there was an unfavorable$25,000 variance for lumber. For the production of 28,000 tables, $560,000(28,000 � 10 bd ft � $2 per bd ft) should have been spent for lumber. Theactual amount spent was $585,000. Given the amounts budgeted, thecompany did a poor job controlling the purchase cost of lumber and/or
Figure 7-13 Performance Report for Production and Sale of Tables
1
2
3
4
5
6
7
8
9
10
11
12
13
14
15
16
A B C D
Item
Sales
Direct materials:
Lumber
Paint
Direct labor:
Cutting
Assembly
Painting
Variable factory overhead
Variable selling and administrative expense
Contribution margin
Fixed factory overhead
Fixed selling and administrative expense
Operating income
Budget
(28,000 units)
$4,200,000
560,000
112,000
105,000
67,200
42,000
194,040
722,120
$2,397,640
207,825
773,825
$1,415,990
Actual
(28,000 units)
$4,250,000
585,000
108,000
120,000
72,000
40,000
206,823
719,456
$2,398,721
211,765
770,550
$1,416,406
Variance
$50,000 F
25,000 U
4,000 F
15,000 U
4,800 U
2,000 F
12,783 U
2,664 F
$1,081 F
3,940 U
3,275 F
$416 F
Chapter 7 – The Master Budget and Flexible Budgeting 353

the quantity of lumber used in the production process. Chapter 8 willillustrate the breakout of a materials variance into these two components.
Direct labor variances can also be analyzed. For example, $15,000 morewas spent for Cutting labor than the $105,000 (28,000 � .25 hr per unit �$15 per hr) flexible budget amount for the production of 28,000 tables.This could have been caused by paying a higher wage than the $15 perhour standard called for and/or spending more time per unit than the .25hours per table budgeted. Again, Chapter 8 will decompose the laborvariance into these components.
Other items that deserve a brief explanation include overhead expenses,selling and administrative expenses, and operating income. Note that theamount of variable factory overhead spent was $12,783 greater thanbudgeted for the 28,000-unit level. That is not surprising, since the directlabor variances were mostly unfavorable. The excess hours that the directlaborers probably worked to complete production would have resulted inadditional variable factory overhead costs such as supplies, electricityexpense, and indirect labor. The variable selling and administrative expensehad a favorable $2,664 variance, indicating that expenditures for items suchas travel and office supplies were adequately controlled.
Fixed factory overhead and fixed selling and administrative expenseswere slightly unfavorable and favorable, respectively, meaning that bud-geted fixed expenditures were overspent or underspent, respectively. Forexample, less may have been spent on an advertising campaign thanplanned, perhaps contributing to the lack of sales volume. Note that theoperating income variance was $416 favorable at the 28,000-unit level.This means that, given the number of units that California Casualsproduced and sold, revenue generation and cost control were acceptable.However, the master budget called for the production and sale of30,000 units, which if achieved should have resulted in budgeted operatingincome of $1,587,250 as illustrated in Figure 7-12—$170,844 more thanthe actual operating income. This indicates that the company has forgone asignificant amount of profit by operating 2,000 units below the masterbudget volume level.
Recall and Review 2
Dilbert Co. has the following items and amounts as part of its master
budget at the 20,000-unit level of sales and production: sales revenue,
$150,000; direct materials, $36,000; direct labor, $20,000; variable factory
overhead, $16,000; fixed factory overhead, $40,000. Determine the total
dollars amounts for each of the above items that would appear in a flexible
budget at the 22,000-unit level.
(After working this exercise, see pages 361 and 362 for the solution.)
You should now be able to work the following:
Questions 15–19; Exercises 7-6 to 7-8; Problems 7-4 to 7-6; and Mini-Case.
354 Principles of Cost Accounting

Preparing the Flexible Budget for FactoryOverheadThe complexities of budgeting for factory overhead require more explana-tion than appears in the preceding section. Determining the standardoverhead cost per unit and preparing the flexible budget for factory over-head follow the basic principles suggested for establishing standards formaterials and labor costs. All costs that might be incurred should becarefully considered. Prior costs, as adjusted, must be studied as well as theeffect of new costs, future economic conditions, changes in processes, andtrends. As with other standards, the individuals responsible for settingfactory overhead standards should have considerable experience and famil-iarity with manufacturing operations.
Because costs are affected by the level of production, the first step is todetermine what should be the standard volume of production. Standardproduction is the volume on which the initial calculation of costs is based.Several approaches may be used to determine this figure based on a choiceof several definitions of manufacturing capacity. These types of capacityinclude the following:
1. Theoretical capacity represents the maximum number of units thatcan be produced with the completely efficient use of all availablefacilities and personnel. Generally, this production level is impossibleto attain. It represents a rigid standard for the factory because itrequires maximum production, with no allowance for inefficiencies ofany kind.
2. Practical capacity is the level of production that provides completeutilization of all facilities and personnel, but allows for some idlecapacity due to operating interruptions, such as machinery breakdowns,idle time, and other inescapable inefficiencies.
3. Normal capacity is the level of production that will meet the normalrequirements of ordinary sales demand over a period of years.Although it conceivably can be equal to or greater than practicalcapacity, normal capacity usually does not involve a plan for maximumusage of manufacturing facilities but allows for some unavoidable idlecapacity and some inefficiencies in operations. Most manufacturingfirms use this level of capacity for budget development because itrepresents a logical balance between maximum production capacityand the capacity demanded by actual sales volume. The followingdiscussion will assume the use of normal capacity for planningpurposes.
To illustrate the flexible budget, the following figures were determined tobe the factory overhead costs at the normal capacity of 1,000 units. (Tosimplify the illustration, only a few overhead classifications are used. Inactual practice, many types of expenses would be broken down into fixedand variable categories.)
LO4Explain the
procedures to
determine standard
amounts of factory
overhead at different
levels of production.
Chapter 7 – The Master Budget and Flexible Budgeting 355

Standard production—1,000 units
Standard direct labor hours—2,000
Fixed cost:
Depreciation of building and equipment . . . . . . . . . . . . . . . . . . . . . $4,000
Property tax and insurance . . . . . . . . . . . . . . . . . . . . . . . . . . . . . . . . . 1,000
Supervisory salaries . . . . . . . . . . . . . . . . . . . . . . . . . . . . . . . . . . . . . . . 4,000
Total fixed cost . . . . . . . . . . . . . . . . . . . . . . . . . . . . . . . . . . . . . . . . . . $ 9,000
Variable cost:
Maintenance . . . . . . . . . . . . . . . . . . . . . . . . . . . . . . . . . . . . . . . . . . . . . . . $2,000
Supplies . . . . . . . . . . . . . . . . . . . . . . . . . . . . . . . . . . . . . . . . . . . . . . . . . . . 1,000
Total variable cost . . . . . . . . . . . . . . . . . . . . . . . . . . . . . . . . . . . . . . . 3,000
Total factory overhead cost . . . . . . . . . . . . . . . . . . . . . . . . . . . . . . . . . . . $12,000
Standard factory overhead application rate per direct labor hour:
Fixed cost ($9,000 � 2,000 hours) . . . . . . . . . . . . . . . . . . . . . . . . . . . . . . . . . . . . . . . $ 4.50
Variable cost ($3,000 � 2,000 hours) . . . . . . . . . . . . . . . . . . . . . . . . . . . . . . . . . . . . 1.50
Total factory overhead rate ($12,000 � 2,000 hours) . . . . . . . . . . . . . . . . . . . . . . . $ 6.00
Standard overhead cost per unit ($12,000 � 1,000 units) . . . . . . . . . . . . . . . . . . . $ 12.00
As discussed in Chapter 4, factory overhead can be applied to work inprocess using different bases, such as direct labor hours, direct labor cost,or machine hours. One of the most commonly used bases—direct laborhours—applies overhead in relation to the standard number of direct laborhours allowed for the current actual production.
In the preceding schedule, both standard units and standard hours aregiven because production may be expressed in terms of output (units) orinput (the standard number of direct labor hours allowed for the actualproduction). Whichever base for measuring production is chosen, theresults are not affected. Based on the preceding budget, if 900 units aremanufactured, Work in Process would be charged with $10,800 (900 units� $12 standard overhead cost per unit) for factory overhead. If productionis expressed in terms of standard direct labor hours of 1,800 (900 units � 2standard direct labor hours per unit), Work in Process would still becharged with $10,800 (1,800 hours � $6 per direct labor hour).
Figure 7-14 shows the flexible budget for this illustration. The indivi-duals responsible for the work have determined what the fixed and variablecosts will be at various levels of production. Notice that the factoryoverhead per direct labor hour decreases as volume increases, because thefixed factory overhead, which does not change in total within the relevantrange, is being spread over more production. Also, notice that the standardvolume of production is expressed as being 100% of capacity. This produc-tion level is not necessarily the maximum capacity of the manufacturingfacility. It represents, considering sales demand, the most efficient use ofthe present facilities under normal operating conditions, with some allow-ance for operating interruptions. A factory can always produce more than
356 Principles of Cost Accounting

the normal volume by working overtime, adding a shift, or squeezing inmore machinery and workers; but these conditions are not normal. Becauseit is not uncommon to operate above or below normal, the flexible budgetshows the budgeted expense amounts for production above and below thenormal capacity of 100%, as illustrated in Figure 7-14.
Using the Flexible BudgetIf, for example, actual production for a given period is 1,000 units, acomparison of factory overhead costs incurred with these budgeted figurescan be made and variances determined as follows:
Factory Overhead Cost Variances
Normal production . . . . . . . . . . . . . . . . . . . . . . . . . . . . . . . . 1,000 units (or 2,000 direct labor hours)
Actual production . . . . . . . . . . . . . . . . . . . . . . . . . . . . . . . . . . 1,000 units (or 2,000 direct labor hours)
Budget Actual
VariancesFavorable
(Unfavorable)Fixed cost:
Depreciation of building and equipment . . . . . . . . $ 4,000 $ 4,000
Property taxes and insurance . . . . . . . . . . . . . . . . . . 1,000 1,000
Supervisory salaries . . . . . . . . . . . . . . . . . . . . . . . . . . 4,000 4,000
Total fixed cost . . . . . . . . . . . . . . . . . . . . . . . . . . . . . $ 9,000 $ 9,000
Variable cost:
Maintenance . . . . . . . . . . . . . . . . . . . . . . . . . . . . . . . . . . $ 2,000 $ 2,500 $(500)
Supplies . . . . . . . . . . . . . . . . . . . . . . . . . . . . . . . . . . . . . . 1,000 900 100
Total variable cost . . . . . . . . . . . . . . . . . . . . . . . . . . $ 3,000 $ 3,400 $(400)
Total factory overhead cost . . . . . . . . . . . . . . . . . . . . . . $12,000 $12,400 $(400)
Figure 7-14 Factory Overhead Cost Budget
1
2
3
4
5
6
7
8
9
10
11
12
13
14
15
A B C D E F
Number of units
Number of standard direct labor hours
Budgeted factory overhead:
Fixed cost:
Depreciation of building and equipment
Property taxes and insurance
Supervisory salaries
Total fixed cost
Variable cost:
Maintenance
Supplies
Total variable cost
Total factory overhead cost
Factory overhead per direct labor hour
800
1,600
$4,000
1,000
4,000
$9,000
$1,600
800
$2,400
$11,400
$7.125
900
1,800
$4,000
1,000
4,000
$9,000
$1,800
900
$2,700
$11,700
$6.50
1,000
2,000
$4,000
1,000
4,000
$9,000
$2,000
1,000
$3,000
$12,000
$6.00
Percent of Normal Capacity 80% 90% 100%
1,100
2,200
$4,000
1,000
4,000
$9,000
$2,200
1,100
$3,300
$12,300
$5.59
1,200
2,400
$4,000
1,000
4,000
$9,000
$2,400
1,200
$3,600
$12,600
$5.25
110% 120%
Chapter 7 – The Master Budget and Flexible Budgeting 357

Usually, factory activity will not be exactly at the normal capacity levelas it was in the previous example. The volume of production invariablyfluctuates to a certain extent from the standard production level because itis affected by such factors as vacations, holidays, employee absenteeism,work interruptions, and equipment breakdowns. If a seasonal factor isinvolved, the fluctuation from one month to the next could be significant.Under these circumstances, the flexible budget provides the budgetedfigures for the actual levels of production rather than the establishednormal level.
Upon receiving the report on actual volume for the period, the factoryoverhead costs that should have been incurred at that volume can becompared with the actual costs to determine variances. If the volume ofproduction falls between two of the amounts shown in the budget, anapproximation of budgeted cost can be interpolated as follows:
Actual production 850 units (85%):
Budgeted cost at 90% in Figure 7-14 . . . . . . . . . . . . . . . . . . . . . . . . . . . . . . . . . . . $11,700
Budgeted cost at 80% in Figure 7-14 . . . . . . . . . . . . . . . . . . . . . . . . . . . . . . . . . . . 11,400
Difference . . . . . . . . . . . . . . . . . . . . . . . . . . . . . . . . . . . . . . . . . . . . . . . . . . . . . . . . . . . $ 300
Range between volume levels . . . . . . . . . . . . . . . . . . . . . . . . . . . . . . . . . . . . . . . . . . . 10%
Dividing the difference of $300 by 10 determines an additional cost of$30 for each percentage point increase above the lower of the two volumelevels.
Next lower budgeted volume . . . . . . . . . . . . . . . . . . . . . . . . . . . . . . . . . . . . . . . . . . . 80%
Costs at 80% volume . . . . . . . . . . . . . . . . . . . . . . . . . . . . . . . . . . . . . . . . . . . . . . . . . . . $11,400
Additional costs at 85% volume (5 percentage points � $30) . . . . . . . . . . . . . . 150
Budgeted costs at 85% volume . . . . . . . . . . . . . . . . . . . . . . . . . . . . . . . . . . . . . . . . . . $11,550
Rather than doing the somewhat laborious calculations above, bypreparing budget formulas in an Excel spreadsheet for each of the lineitems, you only need to input the actual number of units produced to obtainthe allowable budgeted expenditures for that level of production.
Semifixed and Semivariable Costs
Unit production different from that given in the budget is satisfactory if theoverhead increases evenly throughout each range of activity, as would bethe case if all costs were either fixed or variable. However, if significantsemifixed or semivariable costs exist, then this method would not always beaccurate enough for a meaningful evaluation.
Semifixed costs, or step costs, are those costs that tend to remain thesame in dollar amount through a wide range of activity, but increase when
358 Principles of Cost Accounting
production exceeds certain limits. For example, the salary of a departmenthead is generally considered a fixed cost because no other department headwill be employed through a given range of activity, and the salary cost willnot change as the volume fluctuates. But if the production level exceeds agiven number of units, an assistant department head might have to beemployed to aid in supervising the greater number of workers that wouldbe necessary. In this case, at 120% of normal capacity, the fixed expensefor supervisory personnel would increase with the addition of an assistantdepartment head, as illustrated with the assumed numbers in the followingtable.
Percent of NormalCapacity 80% 90% 100% 110% 120% 130%Fixed cost . . . . . . . . . . . . . . . $20,000 $20,000 $20,000 $20,000 $28,000 $28,000
Variable cost . . . . . . . . . . . . 24,000 27,000 30,000 33,000 36,000 39,000
Total factory overhead . . . $44,000 $47,000 $50,000 $53,000 $64,000 $67,000
Semivariable costs are those costs that may change with productionbut not necessarily in direct proportion. For example, if a company incursexpense to train new employees before they go into the factory, this expensewill increase as production increases and new employees are hired. But ifthe volume of production decreases and no new employees are hired, notraining expense will be incurred.
The existence of semifixed or semivariable costs indicates an evengreater need for careful analysis and evaluation of the costs at each level ofproduction. The approach in this chapter, however, assumes that fixed costsremain constant and variable costs vary evenly throughout the ranges ofactivity given, unless stated otherwise.
Service Department Budgets and VariancesPreparing a budget for a service department, such as Maintenance orFactory Office, requires the same procedures as those used for productiondepartments, such as Assembly and Finishing. Expenses at different levelsof production are estimated, and a standard rate for application of servicedepartment expenses to production departments is determined based on thetype of service provided and the estimated usage of that service by theproduction departments. The production departments will take theseallocated service department expenses into consideration in setting up theirbudgets.
During the period, the production departments are charged withservice department expenses at the standard rate based on their usage of theactivity base, such as kilowatt hours or hours of maintenance labor. At theend of the period, the service department’s actual expenses are comparedwith the amount charged to the production departments to determine anyservice department variances.
Chapter 7 – The Master Budget and Flexible Budgeting 359

Summary of the Budgeting Process
Figure 7-15 summarizes the determination of factory production require-ments and standard product cost.
Figure 7-15 Determination of Production Requirements and Standard Product Cost
Sales Forecast Inventory Policy
Minimum-Maximum
Stable or Fluctuating+ =
=
Direct Materials
Requirements
Budgeting and Prices
Direct Labor
Requirements
Hours and Rate
In Hours and Dollars In DollarsIn Units and Dollars
In Units In Units by Period
Indirect
Costs
Type and Behavior
(YC, SYC, FC)
Direct Materials
Budget
Direct Labor
Budget
Factory Overhead
Budget
Standard Cost Per Unit
for Direct Materials
Standard Product Cost
Per Unit
Standard Cost Per Unit
for Direct Labor
Standard Cost Per Unit
for Factory Overhead
Production Plan
Recall and Review 3
The normal capacity of a manufacturing plant is 10,000 units per month.
Fixed overhead at this volume level is $5,000, and variable overhead is
$10,000. If actual production for the month is 12,000 units, the budgeted
factory overhead would be $___________ variable and $____________ fixed,
and the overhead application rate per unit would be $________________(car-
ried to two decimal places).
(After working this exercise, see page 362 for the solution.)
You should now be able to work the following:
Questions 20–23; Exercises 7-9 and 7-10; Problems 7-7 to 7-9; and Self-
Study Problem 2.
360 Principles of Cost Accounting

ANSWERS TO RECALL AND REVIEW EXERCISES
R&R 1
Units to be sold . . . . . . . . . . . . . . . . . . . . . . . . . . . . . . . . . . . . . . . . . . . . . . . . 35,000
Desired ending inventory . . . . . . . . . . . . . . . . . . . . . . . . . . . . . . . . . . . . . . . 2,000
Total . . . . . . . . . . . . . . . . . . . . . . . . . . . . . . . . . . . . . . . . . . . . . . . . . . . . . . . . . . . 37,000
Less estimated beginning inventory . . . . . . . . . . . . . . . . . . . . . . . . . . . . 6,000
Units to be produced in May . . . . . . . . . . . . . . . . . . . . . . . . . . . . . . . . . . . 31,000
Quantity required for production . . . . . . . . . . . . . . . . . . . . . . . . . . . . . . . 62,000*
Desired ending inventory . . . . . . . . . . . . . . . . . . . . . . . . . . . . . . . . . . . . . . . 4,000
Total . . . . . . . . . . . . . . . . . . . . . . . . . . . . . . . . . . . . . . . . . . . . . . . . . . . . . . . . . . . 66,000
Less estimated beginning inventory . . . . . . . . . . . . . . . . . . . . . . . . . . . . 3,000
Total quantity to be purchased . . . . . . . . . . . . . . . . . . . . . . . . . . . . . . . . . 63,000
Price per pound . . . . . . . . . . . . . . . . . . . . . . . . . . . . . . . . . . . . . . . . . . . . . . . . �$10
Total direct materials purchases . . . . . . . . . . . . . . . . . . . . . . . . . . . . . . . . $630,000
*31,000 � 2 lb.
KEY TERMS
‘‘Bottom up’’ budgeting, 341
Budget, 337
Budget slack, 341
Budgeted income statement, 348
Capital expenditures budget, 348
Cash budget, 348
Continuous budget, 339
Cost of goods sold budget, 346
Demand software, 341
Direct labor budget, 345
Direct materials budget, 344
Factory overhead budget, 346
Financial budgets, 339
Fixed costs, 351
Flexible budget, 351
Kaizen, 345
Kaizen budgeting, 345
Liabilities budget, 338
Master budget, 338
Normal capacity, 355
Operating budgets, 339
Participative budgeting, 341
Practical capacity, 355
Pro-forma (projected) financial statements, 339
Production budget, 342
Rolling budget, 339
Sales budget, 340
Selling and administrative expenses
budget, 347
Semifixed costs, 358
Semivariable costs, 359
Standard production, 355
Static budget, 338
Step costs, 358
Theoretical capacity, 355
Variable costs, 351
Web-based budgeting, 348
Chapter 7 – The Master Budget and Flexible Budgeting 361

SELF-STUDY PROBLEM 1
Sales, production, direct materials, direct labor, and fac-tory overhead budgets
YOTO Tire Company
Yoto Tire Company’s budgeted unit sales for the year 2011 were:
Passenger car tires . . . . . . . . . . . . . . . . . . . . . . . . . . . . . . . . . . . . . . . . . . . . . . . . . . . . . 60,000
Truck tires . . . . . . . . . . . . . . . . . . . . . . . . . . . . . . . . . . . . . . . . . . . . . . . . . . . . . . . . . . . . . 12,500
The budgeted selling price for truck tires was $300 per tire, and that for
passenger car tires was $90 per tire. The beginning finished goods
inventories were expected to be 2,500 truck tires and 6,000 passenger
tires, for a total cost of $400,510, with desired ending inventories at 2,000
and 5,000, respectively, and a total cost of $326,478. There was no
anticipated beginning or ending work in process inventory for either type
of tire.
The standard materials quantities for each type of tire were as follows:
TruckPassenger
CarRubber . . . . . . . . . . . . . . . . . . . . . . . . . . . . . . . . . . . . . . . . . . . . . . . . . . . . . . 35 lb 15 lb
Steel belts . . . . . . . . . . . . . . . . . . . . . . . . . . . . . . . . . . . . . . . . . . . . . . . . . . . 4.5 lb 2.0 lb
The purchase prices of rubber and steel were $3 and $2 per pound,
respectively. The desired ending inventories for rubber and steel were
60,000 and 6,000 pounds, respectively. The estimated beginning
R&R 2
Sales (22,000 � $7.50*) . . . . . . . . . . . . . . . . . . . . . . . . . . . . . . . . . . . . . . . . . . . $165,000
Direct materials (22,000 � $1.80**) . . . . . . . . . . . . . . . . . . . . . . . . . . . . . . . 39,600
Direct labor (22,000 � $1.00***) . . . . . . . . . . . . . . . . . . . . . . . . . . . . . . . . . . 22,000
Variable factory overhead (22,000 � $ 0.80****) . . . . . . . . . . . . . . . . . . . 17,600
Fixed factory overhead (unchanged) . . . . . . . . . . . . . . . . . . . . . . . . . . . . . . 40,000
*$150,000 / 20,000 ¼ $7.50
**$36,000 / 20,000 ¼ $1.80
***$20,000 / 20,000 ¼ $1.00
****$16,000 / 20,000 ¼ $ 0.80
R&R 3
10,000 units 12,000 unitsFixed costs . . . . . . . . . . . . . . . . . . . . . . . . . . . . . . . $ 5,000 $ 5,000
Variable costs . . . . . . . . . . . . . . . . . . . . . . . . . . . . 10,000 12,000
Total factory overhead . . . . . . . . . . . . . . . . . . . . $15,000 $17,000
LO2
362 Principles of Cost Accounting

inventories for rubber and steel were 75,000 and 7,500 pounds, respec-
tively. The direct labor hours required for each type of tire were as follows:
MoldingDepartment
FinishingDepartment
Truck tire . . . . . . . . . . . . . . . . . . . . . . . . . . . . . . . . . . . . . . . . . . . . . . . 0.20 0.10
Passenger car tire . . . . . . . . . . . . . . . . . . . . . . . . . . . . . . . . . . . . . . . 0.10 0.05
The direct labor rate for each department is as follows:
Molding Department . . . . . . . . . . . . . . . . . . . . . . . . . . . . . . . . . . . . . . . . . . . . . . . . . . . $13 per hour
Finishing Department . . . . . . . . . . . . . . . . . . . . . . . . . . . . . . . . . . . . . . . . . . . . . . . . . . . $15 per hour
Budgeted factory overhead costs for 2011 were as follows:
Indirect materials . . . . . . . . . . . . . . . . . . . . . . . . . . . . . . . . . . . . . . . . . . . . . . . . . . . . . . . $170,560
Indirect labor . . . . . . . . . . . . . . . . . . . . . . . . . . . . . . . . . . . . . . . . . . . . . . . . . . . . . . . . . . . 158,800
Depreciation of building and equipment . . . . . . . . . . . . . . . . . . . . . . . . . . . . . . . . . 98,320
Power and light . . . . . . . . . . . . . . . . . . . . . . . . . . . . . . . . . . . . . . . . . . . . . . . . . . . . . . . . 126,000
Total . . . . . . . . . . . . . . . . . . . . . . . . . . . . . . . . . . . . . . . . . . . . . . . . . . . . . . . . . . . . . . . . . . . $553,680
Required:
Prepare each of the following budgets for Yoto for the year ended 2011:
1. Sales budget
2. Production budget
3. Direct material budget
4. Direct labor budget
5. Factory overhead budget
6. Cost of goods sold budget
SOLUTION TO SELF-STUDY PROBLEM
1. Prepare the Sales Budget
In preparing the sales budget, the forecasted unit sales must be multiplied
by the budgeted selling price to obtain the sales volume in dollars.
Yoto Tire Company Sales Budget For the Year Ended December 31, 2011
ProductUnit Sales
VolumeUnit Selling
Price Total SalesPassenger car tires . . . . . . . . . . . . 60,000 $ 90 $5,400,000
Truck tires . . . . . . . . . . . . . . . . . . . . 12,500 $300 3,750,000
Total . . . . . . . . . . . . . . . . . . . . . . . 72,500 $ 9,150,00
2. Prepare the Production Budget
In preparing the production budget, the forecasted unit sales from the
sales budget are added to the desired ending inventory to determine the
total units needed; then the estimated beginning inventory is deducted
from that total to determine the unit production needed.
Chapter 7 – The Master Budget and Flexible Budgeting 363

Yoto Tire CompanyProduction Budget
For the Year Ended December 31, 2011
Units
PassengerCar Tires Truck Tires
Sales (from sales budget) . . . . . . . . . . . . . . . . . . . . . . 60,000 12,500
Plus desired ending inventory, Dec. 31 . . . . . . . . . . 5000 2,000
Total . . . . . . . . . . . . . . . . . . . . . . . . . . . . . . . . . . . . . . . . . . 65,000 14,500
Less estimated beginning inventory, Jan. 1 . . . . . . 6,000 2,500
Total production . . . . . . . . . . . . . . . . . . . . . . . . . . . . . . . 59,000 12,000
3. Prepare the Direct Materials Budget
In preparing the direct materials budget, the quantities of materials
needed for production must be added to the desired ending inventory of
materials to determine the materials needed. Then, the estimated begin-
ning inventory must be subtracted from this total to determine the
quantity of materials to be purchased.
Yoto Tire CompanyDirect Materials Budget
For the Year Ended December 31, 2011
Direct Materials Total
Rubber(lbs.)
Steel Belts(lbs.)
Quantities required for production:
Passenger car tires:
59,000 � 15 lb . . . . . . . . . . . . . . . . . . . . . . . . . 885,000
59,000 � 2.0 lb . . . . . . . . . . . . . . . . . . . . . . . . . 118,500
Truck tires:
12,000 � 35 lb . . . . . . . . . . . . . . . . . . . . . . . . . 420,000
12,000 � 4.5 lb . . . . . . . . . . . . . . . . . . . . . . . . . 54,000
Plus desired ending inventory, Dec. 31 . . . . . . 60,000 6,000
Total . . . . . . . . . . . . . . . . . . . . . . . . . . . . . . . . . . . . . . 1,365,000 178,000
Less estimated beginning inventory, Jan. 1 . . 75,000 7,500
Total quantity to be purchased . . . . . . . . . . . . . . 1,290,000 170,500
Unit price . . . . . . . . . . . . . . . . . . . . . . . . . . . . . . . . . . $ 3 $ 2
Total direct materials purchases . . . . . . . . . . . . $3,870,000 $341,000 $4,211,000
4. Prepare the Direct Labor Budget
In preparing the direct labor budget, the total direct labor hours that
should be worked on all products must be determined for each depart-
ment and then multiplied by the wage rate for that department.
364 Principles of Cost Accounting

Yoto Tire CompanyDirect Labor Budget
For the Year Ended December 31, 2011
Department Total
Molding FinishingHours required for production:
Passenger car tires:
59,000 � .10 . . . . . . . . . . . . . . 5,900
59,000 � .05 . . . . . . . . . . . . . . 2,950
Truck tires:
12,000 � .20 . . . . . . . . . . . . . . 2,400
12,000 � .10 . . . . . . . . . . . . . . 1,200
Total . . . . . . . . . . . . . . . . . . . . . . . . . 8,300 4,150
Hourly rate . . . . . . . . . . . . . . . . . . . $ 13 $ 15
Total direct labor cost . . . . . . . . . $107,900 $62,250 $170,150
5. Prepare the Factory Overhead Budget
In this problem, the budgeted costs for each factory overhead item are
given. In practice, the challenge is to determine the variable and fixed
components of semivariable factory overhead costs.
Yoto Tire Company FactoryOverhead Budget
For the Year Ended December 31, 2011
Indirect materials . . . . . . . . . . . . . . . . . . . . . . . . . . . . . . . . . . . . . . . . . . . . . . . . . . . . $170,560
Indirect labor . . . . . . . . . . . . . . . . . . . . . . . . . . . . . . . . . . . . . . . . . . . . . . . . . . . . . . . . 158,800
Depreciation of building and equipment . . . . . . . . . . . . . . . . . . . . . . . . . . . . . . . 98,320
Power and light . . . . . . . . . . . . . . . . . . . . . . . . . . . . . . . . . . . . . . . . . . . . . . . . . . . . . . 126,000
Total factory overhead cost . . . . . . . . . . . . . . . . . . . . . . . . . . . . . . . . . . . . . . . . . . . $553,680
6. Prepare the Cost of Goods Sold Budget
The information from the direct materials, direct labor, and factory over-
head budgets, in addition to data on desired beginning and ending
inventories, is used to prepare the cost of goods sold budget.
Yoto Tire CompanyCost of Goods Sold Budget
For the Year Ended December 31, 2011
Finished goods inventory, Jan. 1 . . . . . . . . . . . . . . . . . $ 400,510
Direct materials inventory, Jan. 1* . . . . . . . . . . . . . . . . $ 240,000
Direct materials purchases . . . . . . . . . . . . . . . . . . . . . . . 4,211,000
Total direct materials available . . . . . . . . . . . . . . . . . . . $ 4,451,000
Less direct materials inventory, Dec. 31** . . . . . . . . . 192,500
Cost of direct materials used . . . . . . . . . . . . . . . . . . . . . $ 4,259,500
Direct labor . . . . . . . . . . . . . . . . . . . . . . . . . . . . . . . . . . . . . 170,150
Factory overhead . . . . . . . . . . . . . . . . . . . . . . . . . . . . . . . 553,680
Chapter 7 – The Master Budget and Flexible Budgeting 365

Cost of goods manufactured . . . . . . . . . . . . . . . . . . . . . 4,982,830
Cost of goods available for sale . . . . . . . . . . . . . . . . . . $ 5,383,340
Less finished goods inventory, Dec. 31 . . . . . . . . . . . 326,478
Cost of goods sold . . . . . . . . . . . . . . . . . . . . . . . . . . . . . . $ 5,056,862
SELF-STUDY PROBLEM 2
Huggins Manufacturing Company
Huggins Manufacturing Company uses a job order cost system and
standard costs. It manufactures one product, whose standard cost follows:
Materials, 10 yards @ $2.00 per yard . . . . . . . . . . . . . . . . . . . . . . . . . . . . . . . . . . . . . . . . . . . . . . $ 20
Direct labor, 4 hours @ $12.00 per hour . . . . . . . . . . . . . . . . . . . . . . . . . . . . . . . . . . . . . . . . . . . 48
Total factory overhead per unit (the ratio of variable costs to fixed costs is 2 to 1) . . . . 42
Total unit cost . . . . . . . . . . . . . . . . . . . . . . . . . . . . . . . . . . . . . . . . . . . . . . . . . . . . . . . . . . . . . . . . . . . $110
The standards are based on normal capacity of 3,600 direct labor
hours. Actual activity for October follows:
Materials purchased, 20,000 yards @ $1.95 per yard . . . . . . . . . . . . . . . . . . . . . . $39,000
(Materials used, 19,500 yards)
Direct labor, 3,500 hours @ 12.10 per hour . . . . . . . . . . . . . . . . . . . . . . . . . . . . . . . 19,215
Total factory overhead, 900 units actually produced . . . . . . . . . . . . . . . . . . . . . . 37,500
Required:
1. Compute the variable and fixed factory overhead rates per unit.
2. Compute the variable and fixed overhead rates per direct labor hour.
3. Determine the total fixed factory overhead based on normal capacity.
SOLUTION TO SELF-STUDY PROBLEM
1. Compute the variable and fixed factory overhead rates per unit:
We know that the total factory overhead cost per unit is $42 and the
variable rate is twice the fixed rate; therefore:
Let X ¼ the fixed factory overhead rate, and
2X ¼ the variable factory overhead rate, then
2XþX ¼ $42
3X ¼ $42
X ¼ $14 fixed factory overhead rate per unit
2X ¼ $28 variable factory overhead rate per unit
*Rubber . . . . . . . . . . . . . . . . . . . . . . . . . . . . . . . . . . . . . . . . . . . . . 75,000 lb � $3 $225,000
Steel belts . . . . . . . . . . . . . . . . . . . . . . . . . . . . . . . . . . . . . . . . . . 7,500 lb � $2 15,000
$240,000
**Rubber . . . . . . . . . . . . . . . . . . . . . . . . . . . . . . . . . . . . . . . . . . . . 60000 lb � $3 $180,000
Steel belts . . . . . . . . . . . . . . . . . . . . . . . . . . . . . . . . . . . . . . . . . 6,000 lb � $2 12,000
$192,000
366 Principles of Cost Accounting

2. Compute the variable and fixed overhead rates per direct labor hour:
In (1), we determined that the variable factory overhead rate was
$28 per unit and the fixed factory overhead rate was $14 per unit.
The problem indicates that the standard number of direct labor hours
to make a unit is four. Therefore:
Variable factory overhead rate per direct labor hour = $28/4 direct labor hours = $7
Fixed factory overhead rate per direct labor hour = $14/4 direct labor hours = $ 3.50
3. Determine the total fixed factory overhead based on normal capacity.
We know from above that the fixed factory overhead rate com-
puted at normal capacity is $3.50 per direct labor hour. The problem
indicated that the standards were based on a normal capacity of
3,600 direct labor hours. Therefore:
Total fixed factory overhead
¼ $3:50� 3; 600 direct labor hours at normal capacity ¼ $12;600
(Note that the fixed factory overhead stays the same in total but
varies per unit within a relevant range of activity. At any capacity
level other than 3,600 hours, the rate will be something other than
$3.50, but the budgeted total will still be $12,600.)
QUESTIONS
1. What is a budget?
2. What are the advantages of using budgets
in a business setting?
3. What are six principles of good budgeting?
4. What is a continuous budget, and why is it
useful?
5. Give three examples each of operating
budgets and financial budgets.
6. Which budget must be prepared before the
others? Why?
7. What is ‘‘demand software,’’ and where in
the budgeting process is it useful?
8. Why is it important to have front-line man-
agers participate in the budgeting process?
9. If the sales forecast estimates that 50,000
units of product will be sold during the
following year, should the factory plan on
manufacturing 50,000 units in the coming
year? Explain.
10. What are the advantages and disadvantages
of each of the following for a company that
has greatly fluctuating sales during the
year?
a. A stable production policy
b. A stable inventory policy
11. What three manufacturing budgets can be
prepared subsequent to preparation of the
production budget?
12. What does the Japanese term kaizen mean,
and how is it used in the budgeting
process?
13. What are the three budgets that are needed
in order to prepare the budgeted income
statement?
14. Why might Web-based budgeting be more
useful than using spreadsheets to budget?
15. What is a flexible budget?
16. Why is a flexible budget better than a mas-
ter budget for comparing actual results to
budgeted expectations?
17. Why is it important to distinguish between
variable costs and fixed costs for budgeting
purposes?
Chapter 7 – The Master Budget and Flexible Budgeting 367

18. Why is the concept of relevant range im-
portant when preparing a flexible budget?
19. In comparing actual sales revenue to flex-
ible budget sales revenue, would it be pos-
sible to have a favorable variance and still
not have met revenue expectations?
20. How would you define the following?
a. Theoretical capacity
b. Practical capacity
c. Normal capacity
21. Is it possible for a factory to operate at
more than 100% of normal capacity?
22. If a factory operates at 100% of capacity
one month, 90% of capacity the next
month, and 105% of capacity the next
month, will a different cost per unit be
charged to Work in Process each month for
factory overhead assuming that a predeter-
mined annual overhead rate is used?
23. How is the standard cost per unit for fac-
tory overhead determined?
EXERCISES
E7-1 Preparing sales budget and production budgetThe sales department of S. Miller Manufacturing Company has
forecast sales for its single product to be 20,000 units for the
month of June, with three-quarters of the sales expected in the
East region and one-fourth in the West region. The budgeted
selling price is $25 per unit. The desired ending inventory on
June 30 is 2,000 units, and the expected beginning inventory on
June 1 is 3,000 units.
Prepare the following:
a. A sales budget for June.
b. A production budget for June.
E7-2 Preparing production budget and direct materials budgetThe sales department of P. Gillen Manufacturing Company has
forecast sales in March to be 20,000 units. Additional information
follows:
Finished goods inventory, March 1 . . . . . . . . . . . . . . . . . . . . . . . . . . . . 3,000 units
Finished goods inventory required, March 31 . . . . . . . . . . . . . . . . . . 1,000 units
Materials used in production:
InventoryMarch 1
RequiredInventoryMarch 31
StandardCost
A (one gallon per unit) . . . . . . . . . . . . . . 500 gal 1,000 gal $2 per gal
B (one pound per unit) . . . . . . . . . . . . . . 1,000 lb 1,000 lb $1 per lb
Prepare the following:
a. A production budget for March (in units).
b. A direct materials budget for the month (in units and dollars).
E7-3 Preparing production budget and direct labor budgetS. Prosser Manufacturing Company forecast October sales to be
45,000 units. Additional information follows:
Finished goods inventory, October 1 . . . . . . . . . . . . . . . . . . . . . . . . 5,000 units
Finished goods inventory desired, October 31 . . . . . . . . . . . . . . . 4,000 units
LO2
LO2
LO2
368 Principles of Cost Accounting

Direct labor hours required in production:
Department Hours per UnitCutting 0.25
Assembly 0.50
Direct laborers earn: Cutting, $14 per hour; Assembly, $12 per
hour.
Prepare the following:
a. A production budget for October.
b. A direct labor budget for October.
E7-4 Preparing cost of goods sold budgetPrepare a cost of goods sold budget for the Summit Manufactur-
ing Company for the year ended December 31, 2011, from the
following estimates.
Inventories of production units:
Work inProcess
FinishedGoods
January 1, 2011 . . . . . . . . . . . . . . . . . . . . . . . . . . . . $28,500 $19,300
December 31, 2011 . . . . . . . . . . . . . . . . . . . . . . . . . 23,700 22,400
Direct materials purchased during the year, $854,000; beginning
inventory of direct materials, $31,000; and ending inventory of
direct materials, $26,000.
Totals from other budgets included:
Direct labor cost . . . . . . . . . . . . . . . . . . . . . . . . . . . . . . . . . . . . . . . . . . . . . . . . . . $539,500
Total factory overhead costs . . . . . . . . . . . . . . . . . . . . . . . . . . . . . . . . . . . . . . . 818,000
E7-5 Preparing budgeted income statementGyro Company has the following totals from its operating
budgets:
Selling and administrative expenses budget . . . . . . . . . . . . . . . . . . . $ 244,500
Cost of goods sold budget . . . . . . . . . . . . . . . . . . . . . . . . . . . . . . . . . . . . 727,300
Sales budget . . . . . . . . . . . . . . . . . . . . . . . . . . . . . . . . . . . . . . . . . . . . . . . . . 1,222,700
Prepare a budgeted income statement for the year ended De-
cember 31, 2011, assuming that income from operations is taxed
at a rate of 30%.
E7-6 Determining flexible budget amountsSolar Panels, Inc., has the following items and amounts as part
of its master budget at the 10,000-unit level of sales and
production:
Sales revenue . . . . . . . . . . . . . . . . . . . . . . . . . . . . . . . . . . . . . . . . . . . . . . . . . $100,000
Direct materials . . . . . . . . . . . . . . . . . . . . . . . . . . . . . . . . . . . . . . . . . . . . . . . . 20,000
Direct labor . . . . . . . . . . . . . . . . . . . . . . . . . . . . . . . . . . . . . . . . . . . . . . . . . . . . 15,000
Variable factory overhead . . . . . . . . . . . . . . . . . . . . . . . . . . . . . . . . . . . . . . 10,000
Fixed factory overhead . . . . . . . . . . . . . . . . . . . . . . . . . . . . . . . . . . . . . . . . . 25,000
LO2
LO2
LO3
Chapter 7 – The Master Budget and Flexible Budgeting 369

Determine the total dollar amounts for the above items that
would appear in a flexible budget at the following volume levels,
assuming that both levels are within the relevant range:
a. 8,000-unit level of sales and production
b. 12,000-unit level of sales and production
(Hint: You must first determine the unit selling price and certain
unit costs.)
E7-7 Preparing a flexible budgetUsing the following per-unit and total amounts, prepare a flex-
ible budget at the 14,000-, 15,000-, and 16,000-unit levels of
production and sales for Celestial Products, Inc.:
Selling price per unit . . . . . . . . . . . . . . . . . . . . . . . . . . . . . . . . . . . . . . . . . . . . $ 75.00
Direct materials per unit . . . . . . . . . . . . . . . . . . . . . . . . . . . . . . . . . . . . . . . . . $ 24.00
Direct labor per unit . . . . . . . . . . . . . . . . . . . . . . . . . . . . . . . . . . . . . . . . . . . . . $ 7.50
Variable factory overhead per unit . . . . . . . . . . . . . . . . . . . . . . . . . . . . . . . $ 15.00
Fixed factory overhead . . . . . . . . . . . . . . . . . . . . . . . . . . . . . . . . . . . . . . . . . . $ 75,000
Variable selling and administrative expense per unit . . . . . . . . . . . . . . $ 12.00
Fixed selling and administrative expense . . . . . . . . . . . . . . . . . . . . . . . . $ 80,000
E7-8 Preparing a performance reportStrand Manufacturing, Inc., has the following flexible budget
formulas and amounts:
Sales . . . . . . . . . . . . . . . . . . . . . . . . . . . . . . . . . . . . . . . . . . . . . . . . . . . $ 25 per unit
Direct materials . . . . . . . . . . . . . . . . . . . . . . . . . . . . . . . . . . . . . . . . . 5 per unit
Direct labor . . . . . . . . . . . . . . . . . . . . . . . . . . . . . . . . . . . . . . . . . . . . . 3 per unit
Variable factory overhead . . . . . . . . . . . . . . . . . . . . . . . . . . . . . . . 4 per unit
Variable selling and administrative expense . . . . . . . . . . . . . . 1 per unit
Fixed factory overhead . . . . . . . . . . . . . . . . . . . . . . . . . . . . . . . . . . $25,000 per month
Fixed selling and administrative expense . . . . . . . . . . . . . . . . . $20,000 per month
Actual results for the month of May for the production and sale
of 5,000 units were as follows:
Sales . . . . . . . . . . . . . . . . . . . . . . . . . . . . . . . . . . . . . . . . . . . . . . . . . . . . . . . . . . $120,000
Direct materials . . . . . . . . . . . . . . . . . . . . . . . . . . . . . . . . . . . . . . . . . . . . . . . . 26,000
Direct labor . . . . . . . . . . . . . . . . . . . . . . . . . . . . . . . . . . . . . . . . . . . . . . . . . . . . 14,000
Variable factory overhead . . . . . . . . . . . . . . . . . . . . . . . . . . . . . . . . . . . . . . . 25,500
Variable selling and admin. . . . . . . . . . . . . . . . . . . . . . . . . . . . . . . . . . . . . . 5,500
Fixed factory overhead . . . . . . . . . . . . . . . . . . . . . . . . . . . . . . . . . . . . . . . . . . 26,750
Fixed selling and admin. . . . . . . . . . . . . . . . . . . . . . . . . . . . . . . . . . . . . . . . . 19,800
Prepare a performance report for the month of May that includes
the identification of the favorable and unfavorable variances.
LO3
LO3
370 Principles of Cost Accounting

E7-9 Calculating factory overheadThe normal capacity of a manufacturing plant is 5,000 units per
month. Fixed overhead at this volume is $2,500, and variable
overhead is $7,500. Additional data follow:
Month 1 Month 2Actual production (units) . . . . . . . . . . . . . . . . . . . . . . . . . . . 5,200 4,500
Actual factory overhead . . . . . . . . . . . . . . . . . . . . . . . . . . . $10,100 $9,200
a. Calculate the amount of factory overhead allowed for the
actual levels of production.
b. Compute the overhead application rate per unit at the var-
ious levels of production. (Round to the nearest whole cent.)
E7-10 Calculating factory overheadThe normal capacity of a factory is 8,000 units per month. Cost
and production data follow:
Standard application rate for fixed overhead . . . . . . . . . . . . . . . . $0.50 per unit
Standard application rate for variable overhead . . . . . . . . . . . . . $1.50 per unit
Production—Month 1 . . . . . . . . . . . . . . . . . . . . . . . . . . . . . . . . . . . . . . 7,200 units
Production—Month 2 . . . . . . . . . . . . . . . . . . . . . . . . . . . . . . . . . . . . . . 8,400 units
Actual factory overhead—Month 1 . . . . . . . . . . . . . . . . . . . . . . . . . $ 14,700
Actual factory overhead—Month 2 . . . . . . . . . . . . . . . . . . . . . . . . . $ 17,400
Calculate the amount of factory overhead allowed for the actual
volume of production each month and the variance between
budgeted and actual overhead for each month.
PROBLEMS
P7-1 Production, direct materials, and direct labor budget
The sales department of Optimo Company has forecast sales for
May 2011 to be 40,000 units. Additional information follows:
Finished goods inventory, May 1 . . . . . . . . . . . . . . . . . . . . . . . . . . . . . . 2,000 units
Finished goods inventory, May 31 . . . . . . . . . . . . . . . . . . . . . . . . . . . . .
Materials used in production:
RequiredInventory
May 1
RequiredInventoryMay 31
StandardCost
X (one gallon per unit) . . . . . . . . . . . . . 1,000 gal 2,000 gal $4 per gal
Y (one pound per unit) . . . . . . . . . . . . . 2,000 lb 2,000 lb $ 2 per lb
LO4
LO4
LO2
Chapter 7 – The Master Budget and Flexible Budgeting 371

Direct labor hours required in production:
DepartmentHours per
UnitStandard
CostForming . . . . . . . . . . . . . . . . . . . . . . . . . . . . . . . . . . . . . 0.50 $18 per hour
Finishing . . . . . . . . . . . . . . . . . . . . . . . . . . . . . . . . . . . . . 1.00 $15 per hour
Prepare the following:
a. A production budget for May.
b. A direct materials budget for May.
c. A direct labor budget for May.
P7-2 Sales, production, direct materials, direct labor, and factoryoverhead budgetssimilar to Self Problem1
Cruise Tire Company’s budgeted unit sales for the year 2011
were:
Passenger car tires . . . . . . . . . . . . . . . . . . . . . . . . . . . . . . . . . . . . . . . . . . . . . . . . 120,000
Truck tires . . . . . . . . . . . . . . . . . . . . . . . . . . . . . . . . . . . . . . . . . . . . . . . . . . . . . . . . 25,000
The budgeted selling price for truck tires was $200 per tire, and
that for passenger car tires was $65 per tire. The beginning
finished goods inventories were expected to be 2,000 truck tires
and 5,000 passenger tires, for a total cost of $326,478, with
desired ending inventories at 2,500 and 6,000, respectively, with
a total cost of $400,510. There was no anticipated beginning or
ending work in process inventory for either type of tire.
The standard materials quantities for each type of tire were as
follows:
Truck Passenger CarRubber . . . . . . . . . . . . . . . . . . . . . . . . . . . . . . . . . . . . . . 30 lb 10 lb
Steel belts . . . . . . . . . . . . . . . . . . . . . . . . . . . . . . . . . . . 4 lb 1.5 lb
The purchase prices of rubber and steel were $2 and $3 per
pound, respectively. The desired ending inventories for rubber
and steel were 60,000 and 6,000 pounds, respectively. The
estimated beginning inventories for rubber and steel were
75,000 and 7,000 pounds, respectively. The direct labor hours
required for each type of tire were as follows:
MoldingDepartment
FinishingDepartment
Truck tire . . . . . . . . . . . . . . . . . . . . . . . . . . . . . . . . . . 0.25 0.15
Passenger car tire . . . . . . . . . . . . . . . . . . . . . . . . . . 0.10 0.05
The direct labor rate for each department is as follows:
Molding Department . . . . . . . . . . . . . . . . . . . . . . . . . . . . . . . . . . . . . . . . . $15 per hour
Finishing Department . . . . . . . . . . . . . . . . . . . . . . . . . . . . . . . . . . . . . . . . $13 per hour
372 Principles of Cost Accounting

Budgeted factory overhead costs for 2011 were as follows:
Indirect materials . . . . . . . . . . . . . . . . . . . . . . . . . . . . . . . . . . . . . . . . . . . . . . . $198,500
Indirect labor . . . . . . . . . . . . . . . . . . . . . . . . . . . . . . . . . . . . . . . . . . . . . . . . . . . 213,200
Depreciation of building and equipment . . . . . . . . . . . . . . . . . . . . . . . . . 157,500
Power and light . . . . . . . . . . . . . . . . . . . . . . . . . . . . . . . . . . . . . . . . . . . . . . . . . 122,900
Total . . . . . . . . . . . . . . . . . . . . . . . . . . . . . . . . . . . . . . . . . . . . . . . . . . . . . . . . . . . $692,100
Required:
Prepare each of the following budgets for Cruise for the year
ended 2011:
1. Sales budget.
2. Production budget.
3. Direct material budget.
4. Direct labor budget.
5. Factory overhead budget.
6. Cost of goods sold budget.
P7-3 Selling and administrative expenses budget and budgetedincome statement
Budgeted selling and administrative expenses for Cruise Tire
Company in P7-2 for the year ended December 31, 2011, were as
follows:
Advertising expense . . . . . . . . . . . . . . . . . . . . . . . . . . . . . . . . . . . . . . . . . $942,000
Office rent expense . . . . . . . . . . . . . . . . . . . . . . . . . . . . . . . . . . . . . . . . . . 125,000
Office salaries expense . . . . . . . . . . . . . . . . . . . . . . . . . . . . . . . . . . . . . . . 821,000
Office supplies expense . . . . . . . . . . . . . . . . . . . . . . . . . . . . . . . . . . . . . . 45,500
Officers’ salaries expense . . . . . . . . . . . . . . . . . . . . . . . . . . . . . . . . . . . . 661,000
Sales salaries expense . . . . . . . . . . . . . . . . . . . . . . . . . . . . . . . . . . . . . . . 868,000
Telephone and fax expense . . . . . . . . . . . . . . . . . . . . . . . . . . . . . . . . . . . 33,500
Travel expense . . . . . . . . . . . . . . . . . . . . . . . . . . . . . . . . . . . . . . . . . . . . . . 443,000
Required:
1. Prepare a selling and administrative expenses budget, in
good form, for the year 2011.
2. Using the information above and the budgets prepared in P7-
2, prepare a budgeted income statement for the year 2011,
assuming an income tax rate of 40%.
P7-4 Preparing a flexible budget
Use the information in Figure 7-12 of the chapter.
Required:
Prepare flexible budgets for the production and sale of 29,000
units and 31,000, respectively.
P7-5 Preparing a performance report
Use the flexible budget prepared in P7-4 for the 31,000-unit level
and the actual operating results listed below for the 31,000-unit
level.
LO2
LO3
LO3
Chapter 7 – The Master Budget and Flexible Budgeting 373

Required:
1. Prepare a performance report.
2. List the major reason why the actual operating income at
31,000 units differs from the master budget operating income
at 30,000 units in Figure 7-12.
3. Given the level that the company operated at, how was its
cost control?
Item
Sales . . . . . . . . . . . . . . . . . . . . . . . . . . . . . . . . . . . . . . . . . . . . . . . . . . . . . . . . $4,800,000
Direct materials:
Lumber . . . . . . . . . . . . . . . . . . . . . . . . . . . . . . . . . . . . . . . . . . . . . . . . . . . . 633,000
Paint . . . . . . . . . . . . . . . . . . . . . . . . . . . . . . . . . . . . . . . . . . . . . . . . . . . . . . 127,500
Direct labor:
Cutting . . . . . . . . . . . . . . . . . . . . . . . . . . . . . . . . . . . . . . . . . . . . . . . . . . . . 115,200
Assembly . . . . . . . . . . . . . . . . . . . . . . . . . . . . . . . . . . . . . . . . . . . . . . . . . 75,300
Painting . . . . . . . . . . . . . . . . . . . . . . . . . . . . . . . . . . . . . . . . . . . . . . . . . . . 47,100
Variable factory overhead . . . . . . . . . . . . . . . . . . . . . . . . . . . . . . . . . . . . 222,905
Variable selling and administrative expense . . . . . . . . . . . . . . . . . . . 777,400
Fixed factory overhead . . . . . . . . . . . . . . . . . . . . . . . . . . . . . . . . . . . . . . . 210,500
Fixed selling and administrative expense . . . . . . . . . . . . . . . . . . . . . . 765,800
P7-6 Preparing a performance report
Use the flexible budget prepared in P7-4 for the 29,000-unit
level of activity and the actual operating results below for the
29,000-unit level.
Required:
1. Prepare a performance report.
2. List the major reason why the actual operating income at
29,000 units differs from the master budget operating income
at 30,000 units in Figure 7-12.
3. Given the level that the company operated at, how was its
cost control?
Item
Sales . . . . . . . . . . . . . . . . . . . . . . . . . . . . . . . . . . . . . . . . . . . . . . . . . . . . . . . . $4,200,000
Direct materials:
Lumber . . . . . . . . . . . . . . . . . . . . . . . . . . . . . . . . . . . . . . . . . . . . . . . . . . . . 565,000
Paint . . . . . . . . . . . . . . . . . . . . . . . . . . . . . . . . . . . . . . . . . . . . . . . . . . . . . . 121,000
Direct labor:
Cutting . . . . . . . . . . . . . . . . . . . . . . . . . . . . . . . . . . . . . . . . . . . . . . . . . . . . 110,000
Assembly . . . . . . . . . . . . . . . . . . . . . . . . . . . . . . . . . . . . . . . . . . . . . . . . . 71,200
Painting . . . . . . . . . . . . . . . . . . . . . . . . . . . . . . . . . . . . . . . . . . . . . . . . . . . 44,600
Variable factory overhead . . . . . . . . . . . . . . . . . . . . . . . . . . . . . . . . . . . . 202,000
Variable selling and administrative expense . . . . . . . . . . . . . . . . . . . 741,300
Fixed factory overhead . . . . . . . . . . . . . . . . . . . . . . . . . . . . . . . . . . . . . . . 210,000
Fixed selling and administrative expense . . . . . . . . . . . . . . . . . . . . . . 770,200
LO3
374 Principles of Cost Accounting

P7-7 Flexible budget for factory overhead
Presented below are the monthly factory overhead cost budget
(at normal capacity of 5,000 units or 20,000 direct labor hours)
and the production and cost data for a month. The predeter-
mined overhead rate is based on normal capacity.
Factory Overhead Cost Budget
Fixed cost:
Depreciation on building and machinery . . . . . . . . . . $1,200
Taxes on building and machinery . . . . . . . . . . . . . . . . . 500
Insurance on building and machinery . . . . . . . . . . . . . 500
Superintendent’s salary . . . . . . . . . . . . . . . . . . . . . . . . . . 1,500
Supervisors’ salaries . . . . . . . . . . . . . . . . . . . . . . . . . . . . . 2,300
Maintenance wages . . . . . . . . . . . . . . . . . . . . . . . . . . . . . 1,000 $7,000
Variable cost:
Repairs . . . . . . . . . . . . . . . . . . . . . . . . . . . . . . . . . . . . . . . . . $ 400
Maintenance supplies . . . . . . . . . . . . . . . . . . . . . . . . . . . . 300
Other supplies . . . . . . . . . . . . . . . . . . . . . . . . . . . . . . . . . . . 200
Payroll taxes . . . . . . . . . . . . . . . . . . . . . . . . . . . . . . . . . . . . 800
Small tools . . . . . . . . . . . . . . . . . . . . . . . . . . . . . . . . . . . . . . 300 2,000
Total standard factory overhead . . . . . . . . . . . . . . . . . . . . $9,000
Required:
1. Assuming that variable costs will vary in direct proportion to
the change in volume, prepare a flexible budget for produc-
tion levels of 80%, 90%, and 110% of normal capacity. Also
determine the rate for application of factory overhead to work
in process at each level of volume in both units and direct
labor hours.
2. Prepare a flexible budget for production levels of 80%, 90%,
and 110%, assuming that variable costs will vary in direct
proportion to the change in volume, but with the following
exceptions. (Hint: Set up a third category for semifixed
expenses.)
a. At 110% of capacity, an assistant department head will be
needed at a salary of $10,500 annually.
b. At 80% of capacity, the repairs expense will drop to one-
half of the amount at 100% capacity. (At other levels it is
perfectly variable.)
c. Maintenance supplies expense will remain constant at all
levels of production.
d. At 80% of capacity, one part-time maintenance worker,
earning $6,000 a year, will be laid off.
e. At 110% of capacity, a machine not normally in use and
on which no depreciation is normally recorded will be
used in production. Its cost was $12,000, it has a ten-year
life, and straight-line depreciation will be taken.
LO4
Chapter 7 – The Master Budget and Flexible Budgeting 375

P7-8 Flexible budget formulas and interpolation
Required:
1. Using the facts and the flexible budget prepared in Part (1) of
P7-7 above, determine the budgeted cost at 96% of capacity,
using interpolation.
2. Using the flexible budget prepared in Part (1) of P7-7 above,
determine the budgeted cost at 104% of capacity, using a
method other than interpolation.
P7-9 Overhead application ratesimilar to Self-Study Problem 2
Mountaineer Manufacturing Company uses a job order cost
system and standard costs. It manufactures one product, whose
standard cost follows:
Materials, 20 yards @ $0.90 per yard . . . . . . . . . . . . . . . . . . . . . . . . . . $18
Direct labor, 4 hours @ $9.00 per hour . . . . . . . . . . . . . . . . . . . . . . . . . 36
Total factory overhead per unit (the ratio of variable costs tofixed costs is 3 to 1) . . . . . . . . . . . . . . . . . . . . . . . . . . . . . . . . . . . . . . . . 32
Total unit cost . . . . . . . . . . . . . . . . . . . . . . . . . . . . . . . . . . . . . . . . . . . . . . . $86
The standards are based on normal capacity of 2,400 direct labor
hours. Actual activity for October follows:
Materials purchased, 18,000 yards @ $0.92 per yard . . . . . . . . . . . $16,560
Materials used, 9,500 yards
Direct labor, 2,100 hours @ $9.15 per hour . . . . . . . . . . . . . . . . . . . . . 19,215
Total factory overhead, 500 units actually produced . . . . . . . . . . . . 17,760
Required:
1. Compute the variable and fixed factory overhead rates per
unit.
2. Compute the variable and fixed overhead rates per direct
labor hour.
3. Determine the total fixed factory overhead based on normal
capacity.
MINI-CASE
Flexible budgeting, performance measurement, and ethics
Branson Manufacturing, Inc., produces a single type of small motor. The
bookkeeper who does not have an in-depth understanding of accounting
principles prepared the following performance report with the help of the
production manager.
In a conversation with the sales manager, the production manager
was overheard saying, ‘‘You sales guys really messed up our May
LO4
LO4
LO3
376 Principles of Cost Accounting

performance, and it is only because production did such a great job
controlling costs that we aren’t in even worse shape.’’
Required:
1. Do you agree with the production manager that the manufacturing
area did a good job of controlling costs?
2. Prepare a flexible budget for Branson Manufacturing’s expenses at the
following activity levels: 45,000 units, 50,000 units, and 55,000 units.
3. Prepare a revised performance report, using the most appropriate
flexible budget from (2) above.
4. Now what is your response to the production manager’s claim?
5. Assume that you have just been hired as the new accountant. You
observe that the production manager is about to receive a large bonus
based on the favorable materials, labor, and factory overhead var-
iances indicated in the flexible budget prepared by the bookkeeper.
Using the IMA Statement of Ethical Professional Practice as your
guide, what standards, if any, apply to your responsibilities in this
matter?
INTERNET EXERCISE
Kaizen
Go to the text Web site at www.cengage.com/accounting/vanderbeck and
click on the link to ‘‘kaizen,’’ from Wikipedia, the free encyclopedia. After
reading the entry, answer the following questions:
1. What is the meaning of kaizen?
2. What is the goal of kaizen?
1
2
3
4
5
6
7
8
9
10
11
12
13
14
15
16
17
18
19
A B C D E
Less variable expenses:
Direct materials
Direct labor
Variable factory overhead
Variable selling and administrative expense
Total variable expense
Contribution margin
Less fixed expenses:
Fixed factory overhead expense
Fixed selling and administrative expense
Total fixed expense
Income from operations
4.50
3.75
2.25
1.50
$12.00
$13.00
$100,000
150,000
$250,000
Branson Manufacturing, Inc.
Performance Report
May, 2011
Actual Results
(45,000 units)
$1,125,000
Master Budget
(50,000 units)
$1,250,000
VarianceFlexible Budget
Per Unit
$25.00Sales
$212,500
175,750
110,250
70,500
$569,000
$556,000
$95,000
160,000
$255,000
$301,000
$225,000
187,500
112,500
75,000
$600,000
$650,000
$100,000
150,000
$250,000
$400,000
$12,500 F
11,750 F
2,250 F
4,500 F
$31,000 F
$94,000 U
$5,000 F
10,000 U
$5,000 U
$99,000 U
$125,000 U
LO2
Chapter 7 – The Master Budget and Flexible Budgeting 377

3. What was the basis of the ‘‘kaizen revolution’’ that took place in Japan
in the 1950s?
4. How does kaizen differ from the ‘‘command and control’’ improvement
programs of the mid-twentieth century?
5. How does the Toyota Production System apply kaizen to its production
operations?
378 Principles of Cost Accounting

CHAPTER 8
Standard Cost Account ing—Mater ia l s , Labor , and Factory
Overhead
For both individuals and businesses, performance is measured as
the difference between actual performance and standard, or best
practices, performance. On a par 66 golf course, your perfor-
mance is evaluated in relation to that number, as is illustrated in
Figure 8-1. In selecting new members to the Baseball Hall of
Fame in Cooperstown, New York, a batter’s career statistics are
compared to such benchmarks as a .300 batting average, 300 or
more home runs, and 1,500 or more runs batted in.
This same type of performance measurement may be applied
to employees. For example, a Taco Bell work crew’s perfor-
mance may be measured against standards such as: how long it
should take to service a customer at the drive-through window;
how many pounds of ground beef should be used to make a
certain number of burritos; and the cleanliness of the restaurant
as compared to predetermined company standards.
This chapter examines how to measure how well the three
elements of manufacturing cost—materials, labor, and over-
head—are utilized relative to predetermined standards, and how
to use this information to improve the efficiency and effective-
ness of operations.
T he discussions of cost control in previous chapters emphasized thecomparison of current costs with historical costs—costs of yester-day, last week, last month, or last year. When current costs
differed unfavorably from earlier costs, it was suggested that managementimmediately investigate the cause of the deviation and try to eliminate itbefore the change became too costly. Management was also advised not
Learning Objectives
After studying this
chapter, you should
be able to:
LO1Describe the
different stan-
dards used in determin-
ing standard costs.
LO2Determine
procedures for
recording standard costs.
LO3Compute and
analyze
variances.
LO4Prepare journal
entries to
record variances.
LO5Examine and
interpret
variances.
LO6Recognize the
features of a
standard cost system.
LO7Account for
standard costs
in a departmentalized
factory.
LO8Distinguish
between actual
and applied factory
overhead.
LO9Compute
variances using
the two-variance method.
LO10Compute
variances using
the four-variance method.
LO11Compute
variances using
the three-variance
method.

only to watch for these fluctuations and to attempt to correct them, but alsoto consider all possible ways to control costs.
Although these previous methods of cost control are useful, manage-ment may tend to become complacent if the costs of manufacturing do notdiffer significantly from period to period. Managers may feel that themanufacturing operation is efficient because unit and overall costs havestabilized at a certain level. But stability of costs does not necessarilyindicate efficiency when the earlier costs, with which current costs are beingcompared, may have built-in inefficiencies. Also, it may be possible toutilize current costs more effectively.
The purpose of standard cost accounting is to control costs andpromote efficiency. This system is not another accounting method foraccumulating manufacturing costs, but it is used in conjunction with suchmethods as job order, process, or backflush costing. Standard costing isbased on a predetermination of what it should cost to manufacture aproduct, and the inventory accounts are debited for these standard costs. Acomparison is then made between these standard costs and the actual coststhat were incurred. Any deviation from the standards can be quicklydetected and responsibility pinpointed so that the company can takeappropriate action to eliminate inefficiencies or take advantage of efficien-cies. This is known as management by exception, where both significantunfavorable and favorable differences from standard are the focal point ofmanagement attention. Surveys have indicated that 76% of U.S. manufac-turers and 90% of Japanese manufacturers use standard costing.1 Evenservice businesses such as McDonald’s and Sears have standards for tasks,
Figure 8-1 Illustration of Performance vs. Standard in Golf
Date: 8/7/09 Scorer: Ed
Blue 369 153 271 432 354 142 358 177 362 2618 245 290 149 351 368 320 156 142 324 2345 4963
White 355 131 265 388 333 136 338 171 288 2405 242 249 132 331 334 290 150 136 318 2182 4587
Gold 246 127 260 235 319 138 328 133 270 2218 230 240 105 305 309 253 147 123 290 2016 4234
Lynne 5 4 5 4 3 4 5 4 3 37 5 4 4 4 5 4 3 4 5 38 75Matt 6 5 5 5 4 3 3 4 5 40 4 6 3 5 5 4 4 3 5 39 79Linda 4 4 6 5 5 3 5 4 4 40 6 3 4 5 4 5 3 4 4 38 78 ED 5 3 5 6 5 4 4 3 4 39 5 4 4 3 5 3 4 4 3 35 74Hole Number 1 2 3 4 5 6 7 8 9 Out 10 11 12 13 14 15 16 17 18 In Total Hcp Net
/
Par 4 3 4 4 4 3 4 3 4 33 4 4 3 4 4 4 3 3 4 33 66
Handicap 5/1 17/15 11/11 1/7 9/5 13/13 7/3 15/7 3/9 12/10 10/11 10/26 4/6 2/2 8/8 16/14 18/16 6/4
1 Ernst and Young, ‘‘2003 Survey of Management Accounting’’; Hema Wijewardena andAnura DeZoysa, ‘‘A Comparative Analysis of Management Accounting Practices inAustralia and Japan: An Empirical Investigation,’’ International Journal of Accounting,Volume 34 (1999), pp. 49–70.
380 Principles of Cost Accounting

such as how long it should take to service a customer in the drive-throughline or how long it should take to replace a muffler, respectively.
Standard costs are usually determined for a period of one year andshould be revised annually. However, if cost analyses during the yearindicate that a standard is incorrect, or if a significant change has occurredin the costs to acquire materials or labor or in the production process, thenmanagement should not hesitate to adjust the standard to better reflect thecurrent reality.
Types of StandardsA standard is a norm against which the actual performance can bemeasured. The objective of setting standards is to measure efficiency and tomonitor costs by assigning responsibility for deviations from the standards.Also, a standard can motivate employees by providing a goal for achieve-ment. But a question that often arises is, ‘‘What is the proper standard touse?’’ A company can estimate materials, labor, and factory overhead usageand costs, but what about the unforeseen costs, such as spoilage, lost time,and equipment breakdowns? Should these items be considered in determin-ing the standard cost to manufacture a product?
Some companies set their standards at the maximum degree of effi-ciency. Using such an ideal standard, they determine costs by consideringestimated materials, labor, and overhead costs; the condition of the factoryand machinery; and time for rest periods, holidays, and vacations—butmake no allowances for inefficient conditions such as lost time, waste, orspoilage. This ideal standard can be achieved only under the most efficientoperating conditions; therefore, it is practically unattainable, generally givingrise to unfavorable variances. Companies using this type of standard feel thatit provides a maximum objective for which to strive in the attempt to improveefficiency. There is, however, a psychological disadvantage—factory person-nel may become discouraged and lose their incentive to meet standards thatare usually impossible to attain except under perfect operating conditions.
Recognizing this potential problem, most companies set attainablestandards that include such factors as lost time and normal waste andspoilage. These companies realize that some inefficiencies cannot becompletely eliminated, so they design standards that can be met or evenbettered in efficient production situations. The primary concern of themanufacturer should be to set standards that are high enough to providemotivation and promote efficiency, yet not so high that they are unattain-able and, thus, bad for worker morale.
Standard Cost ProceduresStandard cost accounting is based on the following procedures:
1. Standard costs are determined for the three elements of cost: directmaterials, direct labor, and factory overhead.
LO1Describe the
different stan-
dards used in deter-
mining standard costs.
LO2Determine
procedures
for recording standard
costs.
Chapter 8 – Standard Cost Accounting—Materials, Labor, and Factory Overhead 381

2. The standard costs, the actual costs, and the variances between theactual and standard costs are recorded in appropriate accounts.
3. Significant variances are analyzed and investigated and then appropriateaction is taken.
Determination of Standard Costs forMaterials and LaborThe first step, the determination of standard costs for a product, is acomplex task that requires considerable experience and familiarity withmanufacturing operations as well as the cooperation of the departmentalemployees. The accounting department is often consulted to help deter-mine historical costs, to point out cost trends, and to assist in establishingthe standards. A materials cost standard is based on estimates of thequantity of materials required for a unit of product and the unit cost to purchasethe materials used. In setting a materials cost standard, management mayconsult the production engineering department to determine the amountsand types of materials needed, and the purchasing agent should provideinformation regarding suppliers’ prices.
A labor cost standard is based on estimates of the labor hoursrequired to produce a unit of product and the cost of labor per unit. Inestablishing a labor cost standard, the heads of various departmentscontribute their knowledge of the processing operations. The manufacturermay use the services of time-study engineers to establish the time necessaryto perform each operation, and the human resources manager should beconsulted regarding prevailing wage rates for the various types of laborneeded.
Historical costs and processes are studied to gain familiarity with theseitems, but the individuals who set the standards should also considerprevailing trends that may cause changes to the prices and quantities ofmaterials and labor required. In setting standards for materials and labor, avariety of factors should be considered:
1. the trend of prices for raw materials
2. the use of different types of materials due to new production processesor market developments
3. the effect of negotiations with labor unions on labor rates; and
4. the possible saving of labor time due to the use of more modernmachinery and equipment or the learning effect, which occurs whenemployees become more proficient at complex production processes themore often they perform the task
Figure 8-2 illustrates a standard cost card for the production of apremium-quality skateboard. This standard cost card summarizes thestandard quantities and costs to assemble, test, and package one skateboard.
382 Principles of Cost Accounting

Recording Standard Costs for Materials and Labor
Once the standard cost for manufacturing a product has been determined,the standard costs, the actual costs, and the variances are recorded injournals and transferred to the general ledger. The journalizing and postingmay occur monthly or more frequently, depending on the needs ofmanagement for current information and the capabilities of the accountinginformation system.
Figure 8-2 Standard Cost Card for a Skateboard
Product: Premium SkateboardProduct Number: 0078
Direct MaterialsComponent Stock # Quantity Unit Cost Total CostGT-05 1 $1.00 $ 1.00
D-02 1 7.50 7.50
TB-12 8 .10 .80
RP-11 2 .25 .50
T-01 2 1.50 3.00
B-08 8 .15 1.20
W-14 4 1.25 5.00
Total . . . . . . . . . . . . . . . . . . . . . . . $ 19.00
Direct LaborOperation TD # Wage Rate Total Hours Assembling Testing Packaging Total Cost006 $15 .25 $3.75 $3.75
010 18 .20 $3.60 3.60
015 12 .10 $1.20 1.20
Total . . . . . . . . . . . . . . . 55 $3.75 $3.60 $1.20 $8.55
Manufacturing OverheadVariable Overhead ($10 per D.L.HR � $.55) . . . . . . . . . . . . . . . . . . . . . . . . . . . . . . . . . . . . . . . . . . . . . . . . . $ 5.50
Fixed Overhead ($5 per Skateboard @Normal Capacity) . . . . . . . . . . . . . . . . . . . . . . . . . . . . . . . . . . . . 5.00
Total Overhead . . . . . . . . . . . . . . . . . . . . . . . . . . . . . . . . . . . . . . . . . . . . . . . . . . . . . . . . . . . . . . . . . . . . . . . . . . . $ 10.50
Total Standard Cost per Unit . . . . . . . . . . . . . . . . . . . . . . . . . . . . . . . . . . . . . . . . . . . . . . . . . . . . . . . . . . . . . . $ 38.05
Chapter 8 – Standard Cost Accounting—Materials, Labor, and Factory Overhead 383

Determination of VariancesA variance represents the difference between the actual and the standardcosts of materials, labor, and overhead. Variances measure efficiencies orinefficiencies in usage (quantity of materials used or number of labor hoursworked) and price (cost of materials and wage rates). Note that althoughthe variances computed here are for a manufacturer, they could just as wellbe computed for a service business, such as food cost and labor costvariances for a Wendy’s restaurant. Also, a manufacturer can computevariances for nonmanufacturing items such as marketing costs that wouldexplain, for example, why delivery employees’ actual wages differ frombudgeted wages.
The variances illustrated in this chapter are examples of financialperformance measures because they are expressed in dollars. Companies alsouse nonfinancial performance measures to evaluate operations, such asthe percentage of defective blouses produced by a garment manufacturer,the percentage of lost baggage by an airline, and the average compared tostandard wait time at a fast-food drive-through window. This is consistentwith the balanced scorecard approach to measuring a business’s success byconsidering both financial and nonfinancial performance measures. Thebalanced scorecard will be further explained in Chapter 9.
Assume that the production report of Charlie’s Products, Inc., whosestandard cost summary is shown below, indicates that equivalent productionfor the month, calculated as discussed in previous chapters, was 10,000units. The standard cost per unit and for the 10,000 units is computed asfollows:
Charlie’s Products, Inc.Standard Cost Summary
Product XMaterials—(1 lb @ $4 per lb) . . . . . . . . . . . . . . . . . . . . . . . . . . . . . . . . . . . . . . . . . . . . $ 4.00
Labor—(1/2 hr @ $10 per hr) . . . . . . . . . . . . . . . . . . . . . . . . . . . . . . . . . . . . . . . . . . . . 5.00
Factory overhead—40% of direct labor cost . . . . . . . . . . . . . . . . . . . . . . . . . . . . . . 2.00
Standard cost per unit . . . . . . . . . . . . . . . . . . . . . . . . . . . . . . . . . . . . . . . . . . . . . . . . . . $ 11.00
Standard materials cost (10,000 units � $4.00) . . . . . . . . . . . . . . . . . . . . . . . . . . . $ 40,000
Standard labor cost (10,000 units � $5.00) . . . . . . . . . . . . . . . . . . . . . . . . . . . . . . . 50,000
Standard factory overhead cost (10,000 units � $2.00) . . . . . . . . . . . . . . . . . . . . 20,000
Total standard cost of manufacturing 10,000 units . . . . . . . . . . . . . . . . . . . . . . . . $110,000
Assume that the materials requisitions, the labor time records, and thefactory overhead records indicate the following actual costs to manufacture10,000 units:
Cost of direct materials used (11,000 lb @ $3.80) . . . . . . . . . . . . . . . . . . . . . . . . . $ 41,800
Cost of direct labor (4,500 hr @ $11.00) . . . . . . . . . . . . . . . . . . . . . . . . . . . . . . . . . . 49,500
Factory overhead . . . . . . . . . . . . . . . . . . . . . . . . . . . . . . . . . . . . . . . . . . . . . . . . . . . . . . . 20,000
Total actual cost of manufacturing 10,000 units . . . . . . . . . . . . . . . . . . . . . . . . . . . $111,300
LO3Compute and
analyze
variances.
384 Principles of Cost Accounting

The standards can now be compared to the actual costs to determinewhether any variances exist. This analysis is performed as follows and isillustrated in Figure 8-3:
Standard Cost Actual Cost
Net Variances—Favorable
(Unfavorable)Materials . . . . . . . . . . . . . . . . . . . . . $ 40,000 $ 41,800 $(1,800)
Labor . . . . . . . . . . . . . . . . . . . . . . . . 50,000 49,500 500
Factory Overhead . . . . . . . . . . . . . 20,000 20,000 —
Total . . . . . . . . . . . . . . . . . . . . . . . . . $110,000 $111,300 $(1,300)
The information presented by these comparative figures is significantbecause it shows that the total actual manufacturing costs have exceeded the
Figure 8-3 Breakout of Difference between Actual and Budgeted Manufacturing Costs
*Could be offsetting variances equaling zero. (The Factory Overhead Variances will be explained later in this chapter.)
TotalManufacturingCost Variance
$1,300 U
Direct MaterialsVariance$1,800 U
Direct LaborVariance$500 F
Factory OverheadVariance
$ –0–
Factory OverheadVolume Variance
(?)*
Factory OverheadControllable Variance
(?)*
Direct LaborEfficiency Variance
$5,000 F
Direct LaborRate Variance
$4,500 U
Direct MaterialsQuantity Variance
$4,000 U
Direct MaterialsPrice Variance
$2,200 F
Chapter 8 – Standard Cost Accounting—Materials, Labor, and Factory Overhead 385

standards previously established. The variances indicate that the cost ofmaterials was $1,800 higher than it should have been and that the cost oflabor was $500 less than expected, resulting in an overall unfavorablevariance of $1,300. These figures can be of more value to cost control,however, if a further breakdown of the variances is made. The formulasused to segregate the materials and labor variances into price and usagecomponents, along with the calculation of the variances based on thepreceding data, are as follows:
1. Materials price variance reflects the actual unit price of materialsabove or below the standard unit price, multiplied by the actual quantityof materials used.
(Actual unit price of materials� standard unit price of materialsÞ� actual quantity of materials used ¼Materials Price Varianceð$3:80� $4:00Þ � 11;000 lb ¼ $2;200 F�
* F ¼ favorable; U ¼ unfavorable
2. Materials quantity (usage) variance represents the actual quantity ofdirect materials used above or below the standard quantity allowed forthe actual level of production, at standard price.
(Actual quantity of materials used� standard quantity of materials allowed)� standard unit price of material = Materials Quantity Variance½11;000 lb� ð10;000 units� 1 lb=unitÞ� � $4:00 ¼ $4;000 U
3. Labor rate (price) variance represents the actual hourly rates paidabove or below the standard hourly rates, multiplied by the actualnumber of hours worked.
(Actual labor rate per hour� standard labor rate per hour)� actual number of labor hours worked = Labor Rate Varianceð$11� $10Þ � 4;500 hr ¼ $4;500 U
4. Labor efficiency (usage) variance indicates the number of actualdirect labor hours worked above or below the standard hours allowedfor the actual level of production, at the standard labor rate.
ðActual number of labor hours worked� standard number of labor hours allowedÞ� standard labor rate per hour ¼ Labor Efficiency Variance½4;500 hr� ð10;000 units� 0:5 hr=unitÞ� � $10 ¼ $5;000 F
A debit balance in a variance account indicates an unfavorable variance; thatis, actual costs have exceeded the established standard cost. A credit balancereflects a favorable variance, indicating that actual costs were less than thestandard cost. In management terminology, an unfavorable variance means
386 Principles of Cost Accounting

that a charge (debit) has been added that increases the cost beyond thestandard established, thereby reducing the expected profitability of theproduct. A favorable variance (credit) would add to a product’s anticipatedprofitability because it reduces the cost set for the product below thestandard established. When a company uses a standard cost system, itusually considers the product’s standard cost to be the cost for setting itsselling price. Therefore, any movement of cost above or below the standardwill have a direct effect on profitability.
Figure 8-4 shows an alternative format, sometimes referred to as the‘‘goalpost diagram,’’ for calculating the materials and labor variances, usingthe data previously presented for materials and labor.
Whichever format you choose, this analysis shows the specific variancesas quantity and price deviations from the established standards. Therequired manufacturing effort exceeded the established materials standardfor 10,000 units; this, given a standard price of $4.00 per pound, created anunfavorable materials quantity variance of $4,000 (1,000 pounds used inexcess of standard allowed � $4.00). The variance was partially offset by thefact that the 11,000 pounds of materials used were obtained at a below-standard cost of $3.80 per pound, thereby creating a favorable pricevariance of $2,200 (11,000 pounds used at a saving of $0.20 per pound).Note that the combined effect of the two variances is the unfavorable netmaterials variance of $1,800. It can also be obtained by subtracting the$40,000 standard cost in the right post of the ‘‘goalpost’’ diagram from the$41,800 actual cost shown in the left post.
The calculation of labor variances indicates a favorable labor efficiencyvariance of $5,000, because the 4,500 actual hours worked was 500 hoursbelow the standard hours allowed for the production of 10,000 units.During the period, however, the company paid an actual labor rate of $11per hour, which was higher than the standard labor rate of $10 per hour,creating an unfavorable rate variance of $4,500. Note that the combinedeffect of the two variances is a favorable net labor variance of $500. It canalso be obtained by subtracting the $49,500 actual cost shown in the leftpost of the ‘‘goalpost’’ diagram from the $50,000 standard cost shown in theright post.
It is important to understand that the terms favorable and unfavorableindicate only a deviation of the actual cost below or above standard. Furtheranalysis and investigation may indicate that the unfavorable variance doesnot necessarily reflect an inefficiency; nor does the favorable variancealways indicate a desirable situation. An apparently unfavorable conditionmay be more than offset by a favorable situation. For example, a favorablematerials price variance that results from buying less expensive materialsthan called for by the standards may more than offset an unfavorablematerials quantity variance that results from additional spoilage due to theuse of cheaper materials. In any event, all significant variances, favorable orunfavorable, should be analyzed to determine the cause for and the effect ofthe deviations. Appropriate action should then be taken to improve theproblem areas.
Chapter 8 – Standard Cost Accounting—Materials, Labor, and Factory Overhead 387

Alternative Method of Recording Materials Cost
Some companies recognize materials price variances at the time materialsare purchased, rather than waiting until they are used, by recording amaterials purchase price variance. This variance represents the deviationof the actual purchase price from the standard purchase price on all thematerials purchased, whether or not they were used in production duringthe period. The rationale for recording this variance at the time of purchaseis that the difference between actual and standard cost is known at this time,so there is no reason for delaying the recognition of this variance until thematerials are used. A further reason for recording the variance at the time
Figure 8-4 Calculating Variances
Materials Variances
Materials Quantity Variance$4,000 U
Net Materials Variance$1,800 U
Materials Price Variance$2,200 F
Actual quantity used ×standard price per unit
11,000 lbs. × $4.00 = $44,000
Actual cost (Actual quantityused × actual price per unit)
11,000 lbs. × $3.80 = $41,800
Equivalent production × standard quantity per unit × standard price
10,000 units × 1 lb. × $4 = $40,000
Labor Variances
Actual hours (Actual hours
worked × actual rate per hour)
4,500 hrs. × $11 = $49,500
Equivalent production × standard
hours per unit × standard rate
10,000 units × 0.5 hr. × $10 = $50,000
Actual hours worked ×standard rate per hour
4,500 hrs. × $10 = $45,000
Labor Rate Variance
$4,500 U
Labor Efficiency Variance
$5,000 F
Net Labor Variance
$500 F
388 Principles of Cost Accounting

of purchase is that the purchasing agent should be responsible for the priceof all materials purchased, whether or not they were used in productionduring the period.
Using the previous unit price figures and assuming that 12,000 poundsare purchased and 11,000 pounds are used, the materials purchase pricevariance would be computed as follows:
Actual unit cost of materials� Standard unit cost of materials� Actual quantity purchasedð$3:80� $4:00Þ � 12;000 ¼ 2;400 F
Accounting for VariancesThe work in process account is always debited with the standard cost(standard quantity � standard price) determined for the period’s equivalentproduction. The materials inventory account is credited for the actual costof materials issued to the factory as indicated by materials requisitions andinventory ledger cards. The payroll account is credited with the actual costof labor incurred for the period. The differences between the debits (atstandard costs) and the credits (at actual costs) are debited (unfavorablevariances) or credited (favorable variances) to the variance accounts. Thestandard cost of units finished is transferred from Work in Process toFinished Goods.
To illustrate, use the figures previously presented for materials andlabor costs in Figure 8-4:
1. to record the entry for direct materials cost:
Work in Process (10,000 lb @ $4.00) . . . . . . . . . . . . . . . . . . . . . . . . . . . . . 40,000
Materials Quantity Variance . . . . . . . . . . . . . . . . . . . . . . . . . . . . . . . . . . . . . 4,000
Materials Price Variance . . . . . . . . . . . . . . . . . . . . . . . . . . . . . . . . . . . . . . 2,200
Materials (11,000 lb @ $3.80) . . . . . . . . . . . . . . . . . . . . . . . . . . . . . . . . . . 41,800
Recall and Review 1
The standard operating capacity of Vermont Manufacturing, Inc., is 2,000
units. It should take three hours of direct labor time to produce one unit of
product, at a standard rate of $15 per hour. It actually took 6,500 direct labor
hours to produce the 2,000 units, at an actual wage rate of $16 per hour.
Based on the information above, the labor rate variance is $___________, the
labor efficiency variance is $_____________, and the net labor variance
is $___________. (Be sure to designate each variance as favorable or
unfavorable.)
(After working this exercise, see page 417 for the solution.)
You should now be able to work the following:
Questions 1–10; Exercises—8-1 to 8-5, Parts a. and b.; Exercises 8-6 to 8-9;
Problems 8-1 to 8-6; and the Internet Exercise.
LO4Prepare jour-
nal entries to
record variances.
Chapter 8 – Standard Cost Accounting—Materials, Labor, and Factory Overhead 389

2. to record the entry for direct labor cost:
Work in Process (5,000 hr @ $10) . . . . . . . . . . . . . . . . . . . . . . . . . . . . . . . . 50,000
Labor Rate Variance . . . . . . . . . . . . . . . . . . . . . . . . . . . . . . . . . . . . . . . . . . . . 4,500
Labor Efficiency Variance . . . . . . . . . . . . . . . . . . . . . . . . . . . . . . . . . . . . . 5,000
Payroll (4,500 hr @ $11) . . . . . . . . . . . . . . . . . . . . . . . . . . . . . . . . . . . . . . . 49,500
3. to record the entry applying factory overhead to work in process(assuming no overhead variances):
Work in Process (10,000 units @ $2) . . . . . . . . . . . . . . . . . . . . . . . . . . . . . 20,000
Applied Factory Overhead . . . . . . . . . . . . . . . . . . . . . . . . . . . . . . . . . . . . 20,000
4. to record the entry for finished goods at standard cost (assuming nobeginning or ending inventory of work in process and 10,000 units at astandard cost of $11.00 per unit from the standard cost summary onpage 384):
Finished Goods (50,000 units @ $11) . . . . . . . . . . . . . . . . . . . . . . . . . . . . . 110,000
Work in Process . . . . . . . . . . . . . . . . . . . . . . . . . . . . . . . . . . . . . . . . . . . . . . 110,000
The balance sheet of Charlie’s Products, Inc., using a standard costsystem, would reflect inventories for work in process and finished goods atstandard cost, while the materials inventory account would be shown atactual cost. The materials inventory account, however, may also be shownat standard cost, as explained in the following section.
Alternative Method of Recording Materials Cost
Using the previous unit price figures and assuming that 12,000 pounds arepurchased while only 11,000 pounds are used, the entry to record thematerials at standard cost and the materials purchase price variance at thetime of purchase would be:
Materials (12,000 lb @ $4.00 standard price) . . . . . . . . . . . . . . . . . . . . . . . . . . . 48,000
Materials Purchase Price Variance . . . . . . . . . . . . . . . . . . . . . . . . . . . . . . . . . . 2,400
Accounts Payable (12,000 lb @ $3.80 actual price) . . . . . . . . . . . . . . . . . . . 45,600
Note that the materials inventory account on the balance sheet wouldbe reflected at standard cost. A benefit of using the purchase price variancemethod is that the individual materials inventory accounts are maintainedat standard cost. This saves recordkeeping expense because it is onlynecessary to keep track of the quantities purchased, issued, and on hand. Itis not necessary to post individual materials costs or to continuously
390 Principles of Cost Accounting

calculate dollar amounts in the inventory ledger files. Because the materialsinventory account is kept at standard cost, the balance, in dollars, can bedetermined at any time by multiplying the standard price per unit by thequantity on hand.
At the time the materials are used, there would be no materials pricevariance to record, and the materials quantity variance would be recordedas follows:
Work in Process (10,000 lb* @ $4.00 standard price) . . . . . . . . . . . . . . 40,000
Materials Quantity Variance . . . . . . . . . . . . . . . . . . . . . . . . . . . . . . . . . . . . . 4,000
Materials (11,000 lb @ $4.00) . . . . . . . . . . . . . . . . . . . . . . . . . . . . . . . . . . 44,000
*10,000 units / standard quantity of 1 lb per unit
Disposition of Standard Cost VariancesAt the end of the accounting period, the variances of actual cost fromstandard must be reflected in some appropriate manner on the financialstatements. There are several different approaches for handling theseitems:
1. Some companies prorate these variances to Cost of Goods Sold, Workin Process, and Finished Goods. With the increased affordability ofcomputer hardware and software, this method is gaining in popularity.The net effect of this method is that these accounts are adjusted toactual or historical cost. The rationale is that standard costs areimportant for management’s evaluation of operations but are notappropriate for external financial reports. Hence, the variances, as a partof actual manufacturing cost, should be included in inventory costs.When this method is followed, the allocation of materials, labor, andoverhead variances will be in proportion to the standard materials,labor, and overhead costs included in Cost of Goods Sold, Work inProcess, and Finished Goods.
2. A more common approach is to show an unfavorable net variance asan addition to the cost of goods sold for the period and a favorable netvariance as a deduction from cost of goods sold. This approach isbased on the fact that these variances result from unfavorable orfavorable conditions or inefficiencies during the period and shouldtherefore be charged or credited to the current period. Also, for mostmanufacturers, the vast majority of items produced during the periodare sold by the end of the period. This means that most of theproduction costs have flowed to Cost of Goods Sold, making it theright account to adjust. The worksheet that follows shows thisapproach using the figures from the Charlie’s Products, Inc., example.The cost of goods sold at actual, $111,300, is the amount that wouldappear on the income statement prepared for the use of external parties,since external users are not interested in the level of detail included inthe following worksheet.
Chapter 8 – Standard Cost Accounting—Materials, Labor, and Factory Overhead 391

Worksheet to Convert Standard Cost of Goods Sold to Actual
1
2
3
4
5
6
7
8
9
A B CCost of goods sold (standard cost)...... $110,000
Add unfavorable variance:
Materials quantity variance ........ $4,000
Direct labor rate variance ........... 4,500 8,500
$118,500
Less favorable variances:
Materials price variance ............. $2,200
Labor efficiency variance ........... 5,000 7,200
Cost of goods sold (actual cost) ..... $111,300
3. If charging or crediting the entire amount of the variances to Cost ofGoods Sold would materially misstate the financial statements, thevariances should be allocated to Work in Process, Finished Goods, andCost of Goods Sold.
4. If production is seasonal, with extreme peaks and valleys during theyear, then variances should be shown as deferred charges or credits oninterim balance sheets, using the logic that they would be mostly offsetin future periods. At the end of the year, however, some disposition ofthese variances, as described previously, must be made and the varianceaccounts closed.
5. If the variances are due to abnormal or unusual circumstances—such asstrikes, fires, storms, or floods—then there is justification for chargingoff these items as extraordinary losses on the income statement.
This text will, unless indicated otherwise, use the more common approachof reflecting the materials and labor variances as adjustments to thestandard cost of goods sold, as illustrated in Item 2 above. Variances forfactory overhead costs, to be discussed later in this chapter, would also bereflected in the statements in a similar manner. Figure 8-5 provides an aidto understanding cost flow through a standard cost system.
Interpreting VariancesIn analyzing materials and labor variances, two components are investi-gated: usage (quantity) and price. The analyst looks closely at the quantityof materials used, the cost per unit of each type of material, the number ofdirect labor hours worked, and the cost of each labor hour. When the usageand/or price differ from the established standards, the analyst examines thereasons for the variances and considers what actions, if any, can be taken.
In analyzing the materials cost variance, the usage of materials may beabove, below, or at standard, and the price per unit paid for the materialsmight be above, below, or at standard. Management needs this informationto take corrective measures, if necessary. Consider the three possibilities(on pages 394 through 395) in the manufacture of 10,000 units.
LO5Examine and
interpret
variances.
392 Principles of Cost Accounting

Figure 8-5 Cost Flow through a Standard Cost System
Factory Overhead
Cost of indirect ma- terialsCost of indirect laborOther factory expense
Actual expenses
Materials
Actual cost (if no pricevariance recorded
at time of purchase)
Actual cost of materialsused
Materials Quantity Variance
Payroll
Gross factory wages paid
Actual cost of labor
Labor Efficiency Variance
Various Accounts
Finished Goods
Standard cost of goods sold
Factory Overhead Budget Variance*
Work in Process
Standard cost of direct materialsStandard cost of direct laborStandard cost of over- head
Standard cost of goods finished
Dr. or C
r.
Dr.
or C
r.
Dr.
or C
r.
Dr.
or C
r.
Materials Price Variance
Dr.
or C
r.
Labor Rate Variance
Dr. o
r C
r.
Factory Overhead Volume Variance*
Cost of Goods Sold
*To be explained later in this chapter.
Ch
ap
ter
8–
Sta
nd
ard
Co
st
Acco
un
ting
—M
ate
rials
,L
ab
or,
an
dF
acto
ryO
ve
rhe
ad
39
3

Example 1:
Actual cost, 10,000 lb of materials @ $4.18 . . . . . . . . . . . . . . . . . . . . . . . . . . . . . $41,800
Standard cost, 10,000 lb of materials @ $4.00 . . . . . . . . . . . . . . . . . . . . . . . . . . 40,000
Unfavorable materials price variance (10,000 � $0.18) . . . . . . . . . . . . . . . . . . $ 1,800
This analysis shows that the factory usage of materials is at standard,but the standard price for the materials has been exceeded. The variance iscaused by the fact that the company used materials costing $0.18 more thanthe standard price. With 10,000 standard pounds used, this $0.18 per unitvariance resulted in an unfavorable variance of $1,800.
Management now has the data with which to investigate why thematerials cost per unit is higher than the standard of $4.00 per pound.Several possibilities exist, including:
1. inefficient purchasing methods;
2. use of a different material than the standard called for; and
3. increase in market price.
Inefficient purchasing can be corrected by better planning and by morecareful selection of suppliers. If different, higher-priced material than thestandard called for is selected, the standard cost per unit of materials willhave to be increased if this is more than a one-time experiment. Thestandard cost would also have to be increased if there is an increase inmarket price that is considered to be permanent.
The example illustrates the principle that management should carefullyinvestigate any significant variance, favorable or unfavorable, so thatcorrective action can be taken. Such a decision may involve eliminatinginefficiencies or changing the standard cost of the product.
Example 2:
Actual cost, 10,450 lb of materials @ $4.00 . . . . . . . . . . . . . . . . . . . . . . . . . . . . . $41,800
Standard cost, 10,000 lb of materials @ $4.00 . . . . . . . . . . . . . . . . . . . . . . . . . . 40,000
Unfavorable materials quantity variance (450 � $4.00) . . . . . . . . . . . . . . . . . . $ 1,800
In this instance, the price paid for the materials is at standard but thematerials usage is excessive. The manufacturing operation used 450 poundsof materials more than called for by the standard in order to make 10,000units. This additional 450 pounds (at a cost of $4.00 per pound) created theunfavorable quantity variance of $1,800.
As with the previous example, management must now determine whythe extra materials were used. Again, various circumstances might havecreated this situation:
1. Materials were spoiled or wasted. This loss could have been due to adifferent type of material being used than the standard called for, or bycareless workers and lax supervisory personnel. If possible, the cause ofthe loss should be eliminated.
394 Principles of Cost Accounting

2. More materials were deliberately used per manufactured unit as anexperiment to determine whether the product’s quality could be in-creased. If management decides to continue this increased usage, thestandard quantity per unit must be changed.
Example 3:
Actual cost, 11,000 lb of materials @ $3.80 . . . . . . . . . . . . . . . . . . . . . . . . . . . . . $41,800
Standard cost, 10,000 lb of materials @ $4.00 . . . . . . . . . . . . . . . . . . . . . . . . . . 40,000
Unfavorable net materials variance . . . . . . . . . . . . . . . . . . . . . . . . . . . . . . . . . . . . $ 1,800
In this example, a combination of usage and price variances causes the overallunfavorable variance. The factory has used 1,000 pounds of materials overstandard but has purchased these materials at a cost that is $0.20 per poundbelow standard. Once again, management should know why the additionalmaterials were used and why a cost per pound lower than standard was paid:
1. It is important to recognize that the price variance of $0.20 will alsorequire investigation. That this variance is favorable—below standardcost—is no reason for production personnel to be complacent andignore it. This ‘‘better’’ price may have been created by more efficientbuying techniques, a bargain purchase, or a general price reduction. Onthe other hand, materials of a lesser quality might have been purchased,thereby reducing the quality of the product and creating an unfavorableproduct image.
2. It is also possible that the greater usage of materials, and the resultingunfavorable materials quantity variance, may be related to the lowerprice. Waste and spoilage might be created by (1) use of cheapermaterials or (2) production workers’ unfamiliarity with use of a differentmaterial. Further investigation may reveal that the standard was notproperly determined and should be revised. (If the standard cost ischanged, the units in inventory are often revalued at the new figure.)
The three examples that had identical net unfavorable variances of $1,800illustrate the following important points:
1. The total variance between standard and actual cost must be brokendown by usage and price.
2. The variances in usage and price, whether unfavorable or favorable,must be analyzed with regard to cause and effect. Variances may bestated in dollar amounts or in terms of units such as pounds or hours.The method chosen should be one that provides the greatest benefit indetermining the cause of the variances.
3. Appropriate action must be taken. This action may include a change inmethods of manufacturing, supervision, or purchasing, or an adjustmentto the standard cost of the product. If the variances are favorable, it mayinvolve noting the ‘‘best practices’’ that resulted in efficient purchasingand production.
Chapter 8 – Standard Cost Accounting—Materials, Labor, and Factory Overhead 395

The same principles of analysis apply to the labor cost variances. Threesimilar examples are presented below.
Example 1:
Actual cost, 5,000 hr @ $9.90 per hr . . . . . . . . . . . . . . . . . . . . . . . . . . . . . . . . . . . $49,500
Standard cost, 5,000 hr @ $10.00 per hr . . . . . . . . . . . . . . . . . . . . . . . . . . . . . . . . 50,000
Favorable labor rate variance (5,000 � $0.10) . . . . . . . . . . . . . . . . . . . . . . . . . . . $ 500
Example 2:
Actual cost, 4,950 hr @ $10 per hr . . . . . . . . . . . . . . . . . . . . . . . . . . . . . . . . . . . . . $49,500
Standard cost, 5,000 hr @ $10 per hr . . . . . . . . . . . . . . . . . . . . . . . . . . . . . . . . . . 50,000
Favorable labor efficiency variance (50 � $10) . . . . . . . . . . . . . . . . . . . . . . . . . . $ 500
Example 3:
Actual cost, 4,500 hr @ $11 per hr . . . . . . . . . . . . . . . . . . . . . . . . . . . . . . . . . . . . . $49,500
Standard cost, 5,000 hr @ $10 per hr . . . . . . . . . . . . . . . . . . . . . . . . . . . . . . . . . . 50,000
Favorable net labor variance . . . . . . . . . . . . . . . . . . . . . . . . . . . . . . . . . . . . . . . . . . $ 500
In the first example, it is apparent that the number of actual labor hourswas at standard, but the wage paid per hour was lower than the standard of$10.00. Although this result appears to be favorable, the reason and thepossible effect should still be determined. It may be that the humanresources department is doing a more efficient job of hiring qualifiedemployees and should be commended; or it may be that less-than-qualifiedworkers are being hired at a lower rate, possibly reducing the quality of thework on the product. This second condition would not be acceptable.
The second example indicates that the labor rate is at standard, but theproduction time required was 50 hours below standard. The manufacturingand/or supervisory functions may have become more efficient so that morework was done well in less time. It is also possible that the speed ofproduction has been increased, and the employees are working too fast todo top-quality work. This situation could have an adverse effect on futuresales.
In the third example, a saving of 500 hours has been achieved, butthere has been a wage rate per hour of $1.00 in excess of standard. Thesetwo factors could be related. The hiring of more highly skilled and higher-paid personnel quite often results in a reduction in the number of hoursneeded to complete the work. But, as with the other examples, managementshould investigate to determine the cause and the potential long-termeffect of the variances in usage and price. In instances where the laborefficiency variance is unfavorable, it may have been caused by the use ofunskilled workers, by time lost because of machine breakdowns or improperproduction scheduling, or by an inefficient flow of materials to the produc-tion line.
The analyses of materials and labor variances are not isolated fromeach other. It is quite possible that a difference above or below the
396 Principles of Cost Accounting

standard for one of them is directly related to a variance for the other. Forexample, the hiring of more highly skilled personnel at a higher labor ratedoes not always reduce the number of hours worked, but it may reducethe amount of materials lost through waste. Conversely, the use of lessskilled workers at a lower rate may cause greater materials loss. Inexamining any variance, management should not look at each individualvariance in a vacuum but rather at the relationship of that variance toother variances.
Features of Standard Cost AccountingThis is a good place to summarize some features of standard cost accounting:
1. The company does not determine the actual per-unit cost of manufac-turing a product for input into the accounting system.
2. The fact that standards are based on estimates does not make themunreliable. A close examination of variances will quickly gauge theefficiency of the manufacturing operation and the reasonableness of thestandards.
3. Standards will change as conditions change. Permanent changes inprices and processes may indicate the need for the standards to beadjusted.
4. The purpose of using a standard cost accounting system is to providecontinual incentive for factory personnel to keep costs and performancein line with predetermined management objectives. As mentioned ear-lier in the chapter, comparisons between actual costs and predeter-mined standards are much more effective than comparisons betweencurrent actual costs and actual costs of prior periods.
5. A standard cost system, through the recording and analysis of manufac-turing cost variances, helps focus management’s attention on thefollowing questions and their causes:
a. Were materials purchased at prices above or below standard?
b. Were materials used in quantities above or below standard?
c. Is labor being paid at rates above or below standard?
d. Is labor being used in amounts above or below standard?
6. Although the discussion in this text suggests that variances are deter-mined at the end of the month, most manufacturing companies calcu-late variances on a weekly (or even daily) basis to allow for more timelyaction in correcting inefficiencies or taking advantage of efficiencies.The variances for the month, however, are still recorded in the accountsat the end of the month.
LO6Recognize the
features of a
standard cost system.
Chapter 8 – Standard Cost Accounting—Materials, Labor, and Factory Overhead 397

Illustration of Standard Cost ina Departmentalized FactoryThe following example demonstrates standard cost accounting proceduresin a factory having two departments.
Standard Cost Summary
Machining Assembly TotalMaterials: 5 lb @ $1lb . . . . . . . . . . . . . . . . . . . . $ 5
1 lb @ $2 lb . . . . . . . . . . . . . . . . . . . . . . . . . $ 2 $ 7
Labor: 1 hr @ $8 . . . . . . . . . . . . . . . . . . . . . . . . . 8
2 hr @ $10 . . . . . . . . . . . . . . . . . . . . . . . . . . 20 28
Factory overhead:
Per unit . . . . . . . . . . . . . . . . . . . . . . . . . . . . . . . 1 2 3
Standard costs per unit . . . . . . . . . . . . . . . . . . $14 $24 $38
Production Report for the Month
Machining AssemblyBeginning units in process . . . . . . . . . . . . . . . . . . . . . . . . . . . . . . None None
Units finished and transferred . . . . . . . . . . . . . . . . . . . . . . . . . . . 2,200 1,800
Ending units in process . . . . . . . . . . . . . . . . . . . . . . . . . . . . . . . . . None 400
Stage of completion . . . . . . . . . . . . . . . . . . . . . . . . . . . . . . . . . . . . 1/2
Units pass through Machining to Assembly. In both departments,materials, labor, and overhead are added evenly throughout the process.Actual costs for the month—as determined from materials requisitions,payroll records, and factory overhead records—are as follows:
Machining Assembly TotalDirect materials:
12,000 lb @ $0.95 . . . . . . . . . . . $11,400
1,900 lb @ $2.10 . . . . . . . . . . . . $ 3,990 $15,390
Direct labor:
2,000 hr @ $8.10 . . . . . . . . . . . . 16,200
4,100 hr @ $9.90 . . . . . . . . . . . . 40,590 56,790
Factory overhead:
Indirect materials . . . . . . . . . . . $1,400 $2,500
Indirect labor . . . . . . . . . . . . . . . 800 2,200 1,500 4,000 6,200
$29,800 $48,580 $78,380
From the data given on the standard cost summary, the standard costsof production can be determined. To facilitate the comparison of thesefigures with actual costs and the determination of variances, a form similarto Figure 8-6 can be used.
LO7Account for
standard
costs in a departmen-
talized factory.
398 Principles of Cost Accounting

Figure 8-6 Calculation of Variances
1
2
3
4
5
6
7
8
9
10
11
12
13
14
15
16
17
18
19
20
21
22
23
24
25
A B C D E F G H I J
Machining Assembly Total
Equivalent Production of Equivalent Production of
2,200 Units 2,000* Units
Net Favorable Net Favorable Net Favorable
Standard Actual (Unfavorable) Standard Actual (Unfavorable) Standard Actual (Unfavorable)
Cost Cost Variance Cost Cost Variance Cost Cost Variance
Materials:
11,000 lb @ $1.00 .................... $11,000
12,000 lb @ $0.95 .................... $11,400 $(400)
2,000 lb @ $2.00 .................... $4,000
1,900 lb @ $2.10..................... $3,990 $10 $15,000 $15,390 $(390)
Labor:
2,200 hr @ $8.00.................... 17,600
2,000 hr @ $8.10 .................... 16,200 1,400
4,000 hr @ $10.00 .................. 40,000
4,100 hr @ $9.90.................... 40,590 (590) 57,600 56,790 810
Factory overhead:
Standard cost per
unit, $1.00 ............................... 2,200
Actual cost .................................. 2,200 — Standard cost per
unit, $2.00............................... 4,000
Actual cost .................................. 4,000 — 6,200 6,200 —Total................................................... $30,800 $29,800 $1,000 $48,000 $48,580 $(580) $78,800 $78,380 $ 420
* 1,800 units finished and transferred + (400 × 1/2) equivalent production in ending inventory.
Ch
ap
ter
8–
Sta
nd
ard
Co
st
Acco
un
ting
—M
ate
rials
,L
ab
or,
an
dF
acto
ryO
ve
rhe
ad
39
9

Using the data given in Figure 8-6 on page 399, we can compute thespecific variances for materials using either of the following two formats.
Materials �Machining:Materials price variance ¼ (Actual unit price� Standard unit priceÞ
� Actual quantity¼ ð$0:95� $1:00Þ � 12;000 lb ¼ $600 F
Materials quantity variance ¼ ðActual quantity � Standard quantityÞ� Standard price
¼ ½12;000 lb� ð2;200 units� 5 lb=unitÞ�� $1 ¼ $1;000 U
Net Materials Variance$400 U
Materials Price Variance$600 F
Materials Quantity Variance$1,000 U
Actual cost
12,000 lb × $0.95 = $11,400
Actual quantity × standard price
12,000 lb × $1.00 = $12,000
Standard cost
11,000 lb × $1.00 = $11,000
Materials� Assembly:Materials price variance ¼ ð$2:10� $2:00Þ � 1;900 lb ¼ $190 UMaterials quantity variance ¼ ½1;900 lb� ð2;000 units� 1 lb=unitÞ� � $2 ¼ $200 F
Actual cost
1,900 lb × $2.10 = $3,990
Actual quantity × standard price
1,900 lb × $2.00 = $3,800
Standard cost
2,000 lb × $2.00 = $4,000
Materials Price Variance$190 U
Materials Quantity Variance$200 F
Net Materials Variance$10 F
400 Principles of Cost Accounting

One thousand pounds of materials in excess of standard were used inMachining, which, at the standard price of $1.00, caused an unfavorablequantity variance of $1,000. If prices had not changed, there would havebeen no other variances. But price did change—12,000 pounds of materialsat a cost of $0.05 below standard resulted in a favorable price variance of$600. The combined variances resulted in a net unfavorable materials costvariance of $400 in Machining.
Assembly used 100 pounds of materials less than standard. At a standardprice of $2.00 per pound, the favorable quantity variance was $200. But thisvariance was partially offset by the unfavorable price variance created by theincrease of $.10 in the cost per unit of the materials. With 1,900 poundsbeing used, the price variance was $190 above standard. The two variancesresulted in a net favorable materials variance of $10 in Assembly.
The journal entries for the issuance of direct and indirect materials intoproduction and to record the materials variances are as follows:
Work in Process—Machining (11,000 lb @ $1) . . . . . . . . . . . . . . . . . . . . 11,000
Materials Quantity Variance—Machining . . . . . . . . . . . . . . . . . . . . . . . . . 1,000
Materials Price Variance—Machining . . . . . . . . . . . . . . . . . . . . . . . . . . 600
Materials (12,000 lb @ $.95) . . . . . . . . . . . . . . . . . . . . . . . . . . . . . . . . . . . 11,400
Work in Process—Assembly (2,000 lb @ $2) . . . . . . . . . . . . . . . . . . . . . . 4,000
Materials Price Variance—Assembly . . . . . . . . . . . . . . . . . . . . . . . . . . . . . 190
Materials Quantity Variance—Assembly . . . . . . . . . . . . . . . . . . . . . . . 200
Materials (1,900 lb @ $2.10) . . . . . . . . . . . . . . . . . . . . . . . . . . . . . . . . . . . 3,990
Factory Overhead (Indirect Materials) . . . . . . . . . . . . . . . . . . . . . . . . . . . . 3,900
Materials . . . . . . . . . . . . . . . . . . . . . . . . . . . . . . . . . . . . . . . . . . . . . . . . . . . . . 3,900
Note that the accounts for work in process are charged for the standardcost of direct materials; the factory overhead account is debited for theactual cost of indirect materials used; the materials account is credited atactual cost for all direct and indirect materials used; and the varianceaccounts are debited if the variance is unfavorable and credited if it isfavorable. (If this company followed the practice of recording the materialsprice variance at the time of purchase, no price variances would be recordedat this time because the materials purchase price variance would have beenrecorded when the goods were received.)
Based on the data in Figure 8-6, the specific variances for labor can becomputed using either of the following formats.
Labor�Machining:
Labor rate variance¼ ðActual labor rate� Standard labor rateÞ� Actual hours¼ ð$8:10� $8:00Þ � 2;000 hr ¼ $200 U
Labor efficiency variance¼ ðActual labor hours� Standard labor hoursÞ� Standard labor rate¼ ½2;000 hr� ð2;200 units� 1 hr=unitÞ�� $8 ¼ $1;600 F
Chapter 8 – Standard Cost Accounting—Materials, Labor, and Factory Overhead 401

Actual cost
2,000 hours × $8.10 = $16,200
Actual hours worked× standard rate
2,000 hours × $8.00 = $16,000
Standard cost
2,200 hours × $8.00 = $17,600
Labor Rate Variance$200 U
Net Labor Variance$1,400 F
Labor Efficiency Variance$1,600 F
Labor�Assembly:
Labor rate variance ¼ ð$9:90� $10:00Þ � 4;100 hr ¼ $410 FLabor efficiency variance ¼ ½4;100 hr� ð2;000 units� 2 hr=unitÞ�
� $10 ¼ $1;000 U
Actual cost
4,100 hours × $9.90 = $40,590
Actual hours worked× standard rate
4,100 hours × $10.00 = $41,000
Standard cost
4,000 hours × $10.00 = $40,000
Labor Efficiency Variance$1,000 U
Labor Rate Variance$410 F
Net Labor Variance$590 U
During the month, Machining saved 200 hours by working fewerhours than the standard for the number of units produced. At a standardcost of $8.00 per hour, a favorable efficiency variance of $1,600 wasrealized. The average hourly rate of pay, however, was $0.10 abovestandard, and so there was also an unfavorable rate variance. The companypaid $0.10 more per hour than the standard rate for the 2,000 hoursactually worked, a total of $200.
Assembly used 100 hours more than the standard. Therefore, at thestandard rate of $10.00, it had an unfavorable efficiency variance of $1,000.Because the actual rate was $0.10 below standard, a favorable rate variance
402 Principles of Cost Accounting

of $410 resulted, which is determined by multiplying the 4,100 hoursworked by the $0.10 rate differential. The journal entry to record the directand indirect labor used in production and the labor variances is as follows:
Work in Process—Machining (2,200 hr @ $8.00) . . . . . . . . . . . . . . . . . . 17,600
Labor Rate Variance—Machining . . . . . . . . . . . . . . . . . . . . . . . . . . . . . . . . 200
Labor Efficiency Variance—Machining . . . . . . . . . . . . . . . . . . . . . . . . . 1,600
Payroll (2,000 hr @ $8.10) . . . . . . . . . . . . . . . . . . . . . . . . . . . . . . . . . . . . . 16,200
Work in Process—Assembly (4,000 hr @ $10.00) . . . . . . . . . . . . . . . . . . 40,000
Labor Efficiency Variance—Assembly . . . . . . . . . . . . . . . . . . . . . . . . . . . . 1,000
Labor Rate Variance—Assembly . . . . . . . . . . . . . . . . . . . . . . . . . . . . . . . 410
Payroll (4,100 hr @ $9.90) . . . . . . . . . . . . . . . . . . . . . . . . . . . . . . . . . . . . . 40,590
Factory Overhead (Indirect Labor) . . . . . . . . . . . . . . . . . . . . . . . . . . . . . . . 2,300
Payroll . . . . . . . . . . . . . . . . . . . . . . . . . . . . . . . . . . . . . . . . . . . . . . . . . . . . . . . 2,300
As with materials, only standard costs for direct labor are charged toWork in Process. The factory overhead account is debited for the actualcost of the indirect labor used, the payroll account is credited for the actualcost of direct and indirect labor during the month, and the variances aredebited or credited to the appropriate accounts.
Factory overhead would be applied to Work in Process by the followingentry, using the predetermined overhead rates of $1 per unit in Machiningand $2 per unit in Assembly:
Work in Process—Machining (2,200 units � $1) . . . . . . . . . . . . . . . . . . . 2,200
Work in Process—Assembly (2,000 units � $2) . . . . . . . . . . . . . . . . . . . 4,000
Applied Factory Overhead . . . . . . . . . . . . . . . . . . . . . . . . . . . . . . . . . . . . 6,200
The entries are then made to transfer the standard cost of units finishedin Machining to Assembly and from Assembly to Finished Goods.
Work in Process—Machining . . . . . . . . . . . . . . . . . . . . . . . . . . . . . . . . . . . . 30,800
Work in Process—Assembly . . . . . . . . . . . . . . . . . . . . . . . . . . . . . . . . . . 30,800
(2,200 units @ $14)
Finished Goods . . . . . . . . . . . . . . . . . . . . . . . . . . . . . . . . . . . . . . . . . . . . . . . . . 68,400
Work in Process—Assembly . . . . . . . . . . . . . . . . . . . . . . . . . . . . . . . . . . 68,400
(1,800 units @ $38)
After these entries have been posted, the general ledger accounts wouldreflect the data, as shown, in T-account form. (Note that the postingsassume that entries were previously made for the purchase of materials andto record the payroll.)
Materials Work in Process—Machining
19,290 11,400 11,000 30,800
3,990 17,600
3,900 2,200
19,290 30,800
Chapter 8 – Standard Cost Accounting—Materials, Labor, and Factory Overhead 403

Work in Process—Assembly Finished Goods
4,000 68,400 68,400
40,000
4,000
30,800
78,800
10,400
Materials Quantity Variance—Machining
Materials Quantity Variance—Assembly
1,000 200
Materials Price Variance—Machining
Materials Price Variance—Assembly
600 190
Labor Efficiency Variance—Machining
Labor Efficiency Variance—Assembly
1,600 1,000
Labor Rate Variance—Machining Labor Rate Variance—Assembly
200 410
Payroll Factory Overhead
59,090 16,200 3,900
40,590 2,300
2,300
59,090 6,200
Applied Factory Overhead
6,200
The work in process account for Machining has no balance because allwork has been completed and transferred to Assembly. The work in processaccount for Assembly has a balance of $10,400, accounted for as follows:
Cost in Machining—400 units @ $14 . . . . . . . . . . . . . . . . . . . . . . . . . . . . . . . . . . $ 5,600
Cost in Assembly—(400 units, 1/2 completed) @ $24 . . . . . . . . . . . . . . . . . . . 4,800
$10,400
404 Principles of Cost Accounting

Analysis of Factory Overhead Standard CostVariancesDetermining the standard unit cost for factory overhead involves estimatingfactory overhead cost at the standard, or normal, level of production whileconsidering historical data (adjusted for distorting items in the past such asstrikes or fire losses) and forecasting future changes and trends. Theestimated factory overhead cost is divided by the standard number of laboror machine hours expected for the planned units to be produced. Forexample, assume that the budgeted production is 1,000 units, which willrequire 2,000 direct labor hours. At this level of activity, the budgetedfactory overhead is determined, as follows:
Depreciation on building and machinery . . . . . . . . . . . . . . . . . . . . . . . . . . . . . . . . . $ 4,000
Taxes and insurance on building and machinery . . . . . . . . . . . . . . . . . . . . . . . . . 1,000
Supervisory salaries . . . . . . . . . . . . . . . . . . . . . . . . . . . . . . . . . . . . . . . . . . . . . . . . . . . . 4,000
Maintenance costs . . . . . . . . . . . . . . . . . . . . . . . . . . . . . . . . . . . . . . . . . . . . . . . . . . . . . 2,000
Supplies . . . . . . . . . . . . . . . . . . . . . . . . . . . . . . . . . . . . . . . . . . . . . . . . . . . . . . . . . . . . . . . 1,000
Total standard factory overhead . . . . . . . . . . . . . . . . . . . . . . . . . . . . . . . . . . . . . . . . . $12,000
Dividing the budgeted factory overhead cost of $12,000 by the 2,000budgeted direct labor hours results in a standard cost of $6 per directlabor hour, and because each unit requires two direct labor hours, thestandard cost per unit produced is $12. If equivalent production duringthe period is exactly 1,000 units, requiring a standard 2,000 direct laborhours, then Work in Process will be charged with $12,000 of estimatedfactory overhead (1,000 units � 2 hours per unit � $6 per hour). Asillustrated in the following journal entry and T-accounts, if the actualfactory overhead is also $12,000, then all of this cost would be applied tothe work in process account, and no over- or underapplied factory overheadwould exist.
Recall and Review 2
The normal capacity of Hillary Company is 30,000 direct labor hours
allowed for the production of 15,000 units of Brite per month. A finished
unit requires 5 pounds of material at a standard cost of $4 per pound. The
standard cost of direct labor is $15 per hour. The plant accountant estimates
that overhead for the month should be $450,000 at normal capacity. Based
on the above information, the standard unit cost should be $___________.
(After working this exercise, see page 418 for the solution.)
You should now be able to work the following:
Questions 11–19; Exercises 8-2 to 8-5, Parts c. and d.; Exercises 8-10 to 8-13;
Problems 8-7 to 8-9; Mini-Case; and Self-Study Problem 1.
LO8Distinguish
between ac-
tual and applied fac-
tory overhead.
Chapter 8 – Standard Cost Accounting—Materials, Labor, and Factory Overhead 405

Work in Process (2,000 hr @ $6) . . . . . . . . . . . . . . . . . . . . . . . . . . . . . . . . . . . . . . 12,000
Factory Overhead . . . . . . . . . . . . . . . . . . . . . . . . . . . . . . . . . . . . . . . . . . . . . . . . . . 12,000
Work in Process Factory Overhead
12,000 12,000 12,000
(actual costfrom various
journals)
(standard costapplied to Work in
Process)
If the actual factory overhead is greater than $12,000, then the factoryoverhead account will have a debit balance after $12,000 of standard costhas been applied to Work in Process. This balance would reflect theamount of actual factory overhead cost not charged to the goods produced.This underapplied amount represents the amount of overhead incurredover and above the standard cost allowed for the attained level of produc-tion. The debit balance in the account would be considered an unfavorablevariance. Conversely, if the actual factory overhead is less than $12,000,then the factory overhead account will have a credit balance after $12,000of standard cost is applied to Work in Process. This overapplied costrepresents the amount of overhead incurred below the standard costallowed for the attained level of production. The credit balance in theaccount would be considered a favorable variance.
The next section of this chapter (and the appendix that follows)analyzes, in detail, the factors that could cause an overhead variance.Although many companies favor the two-variance method of factory over-head analysis, the three-variance and four-variance methods illustrated inthe appendix are also used.
Two-Variance Method of AnalysisThe method a company chooses to analyze factory overhead variancesdepends on the benefits the company derives from the detailed analysis.The cost incurred in applying the standard factory overhead to production,maintaining the necessary accounts, and analyzing the results also plays apart in the process of selecting a method. The two-variance method is theleast complex approach; it divides the total variance into a controllablevariance and a volume variance.
The controllable variance measures the amount by which the actualfactory overhead costs differ from the standard overhead costs for the levelof production attained. The difference results from the behavior of the fixedand variable cost items. As discussed previously, fixed cost items tend toremain the same in total dollars despite normal fluctuations in productionvolume, while total variable costs tend to vary proportionately with changesin production. In the previous example, depreciation, taxes, insurance, andsupervisory salaries are typical items of fixed expense, while maintenancecosts and supplies are usually listed in the category of variable cost.
LO9Compute var-
iances using
the two-variance
method.
406 Principles of Cost Accounting

Assume that the actual level of production achieved in the previousexample was 900 units—or 90% of the planned production of 1,000 units—and the 900 units are allowed 1,800 standard direct labor hours (900 units� 2 hours per unit) to complete. The actual amount of factory overhead forthis period is then:
Depreciation on building and machinery (fixed) . . . . . . . . . . . . . . . . . . . . . . . . . . $ 4,000
Taxes and insurance on the above (fixed) . . . . . . . . . . . . . . . . . . . . . . . . . . . . . . . . 1,000
Supervisory salaries (fixed) . . . . . . . . . . . . . . . . . . . . . . . . . . . . . . . . . . . . . . . . . . . . . 4,000
Maintenance costs (variable) . . . . . . . . . . . . . . . . . . . . . . . . . . . . . . . . . . . . . . . . . . . . 1,800
Supplies (variable) . . . . . . . . . . . . . . . . . . . . . . . . . . . . . . . . . . . . . . . . . . . . . . . . . . . . . 1,000
$11,800
The fixed costs remain the same as budgeted at 1,000 units of produc-tion, but the variable costs should be lower. Because 900 units wereproduced and each unit is allowed two direct labor hours at $6 of standardoverhead per hour, Work in Process was debited and Factory Overheadcredited for $10,800. Factory Overhead shows a $1,000 underapplied(debit) balance as follows:
Factory Overhead
11,800 10,800
(actual cost) (applied 900 units � 2 stan-dard hours per unit � $6)
(1,000 underapplied)
Using the variable and fixed cost rates per unit, from the data on page357, of $1.50 ($3,000 variable costs / 2,000 direct labor hours) for variablecost and $4.50 ($9,000 fixed costs / 2,000 direct labor hours) for fixed cost,the calculation of the controllable variance is as follows:
Standard factory overhead budgeted for actual level of production:
Variable cost:
900 units � 2 hours per unit � $1.50 . . . . . . . . . . . . . . . . . . . . . . . . . . . . . . . . . $ 2,700
Fixed cost:
As budgeted (total from budget) . . . . . . . . . . . . . . . . . . . . . . . . . . . . . . . . . . . . 9,000
Flexible budget at actual production level . . . . . . . . . . . . . . . . . . . . . . . . . . . . . . $11,700
Actual factory overhead incurred . . . . . . . . . . . . . . . . . . . . . . . . . . . . . . . . . . . . . . 11,800
Controllable variance (unfavorable) . . . . . . . . . . . . . . . . . . . . . . . . . . . . . . . . . $ 100
Note that the controllable variance is unfavorable by $100 because thevariable expense for supplies should have been $900 (900 units � $1),whereas it was actually $1,000 per the list of expenses above.
The volume variance measures the difference between the budgetedfixed overhead and the fixed overhead applied to work in process. It is theresult of operating at a level of production different from the standard level.Its calculation uses the same flexible budget amount as determined in the
Chapter 8 – Standard Cost Accounting—Materials, Labor, and Factory Overhead 407

previous calculation ($11,700) and compares the budget amount to theoverhead applied to the production for the period.
Flexible budget at actual production level . . . . . . . . . . . . . . . . . . . . . . . . . . . . . . . . $11,700
Factory overhead applied:
900 units � 2 hours per unit � $6 per hour . . . . . . . . . . . . . . . . . . . . . . . . . . . . . 10,800
Volume variance (unfavorable) . . . . . . . . . . . . . . . . . . . . . . . . . . . . . . . . . . . . . . $ 900
In summary, the controllable and volume variances explain the under-applied $1,000 in the factory overhead account as follows:
Controllable variance (unfavorable) . . . . . . . . . . . . . . . . . . . . . . . . . . . . . . . . . . . . . . $ 100
Volume variance (unfavorable) . . . . . . . . . . . . . . . . . . . . . . . . . . . . . . . . . . . . . . . . . . 900
Underapplied factory overhead . . . . . . . . . . . . . . . . . . . . . . . . . . . . . . . . . . . . . . . . . $1,000
The budget for the year anticipated that the fixed cost of $9,000 wouldbe spread over 2,000 direct labor hours and would be used to produce 1,000units of product. Because only 900 units were produced, only $8,100 offixed cost (1,800 standard direct labor hours � $4.50 fixed cost per hour)was applied to units produced. The result was an unfavorable variance of$900. The following illustration shows this effect:
Actual Level of Production—900 units
AppliedBudget for900 Units
VolumeVariance
Fixed cost applied:
900 units � 2 hours � $4.50 . . . . . . . . . $ 8,100 $ 9,000 $900 U
Variable cost applied:
900 units � 2 hours � $1.50 . . . . . . . . . 2,700 2,700 -0- U
Total applied (900 � 2 hours � $6) . . . . . $10,800 $11,700 $800 U
The volume variance is a significant factor because it indicates thedegree that production was below the established standard. If managementfeels that 1,000 units should have been produced during the period, then itwill be concerned that only 900 units were produced and will investigate todetermine the cause. The reduced production may have resulted frominefficiencies in labor or supervision, from machine breakdowns due tofaulty maintenance, or from any number of other unfavorable conditions.On the other hand, this level of production may indicate a normal seasonalfluctuation that will be offset by higher than normal production in otherperiods. If the reduction in production is not seasonal, then it may haveoccurred because sales were not as high as predicted, in which case themarketing department could then be held accountable.
Whatever the circumstances, a factory that is producing below itsnormal capacity has idle and possibly wasted excess capacity. It hascommitted to a greater level of fixed costs than are being efficiently utilizedby current operations. By spreading the fixed costs over a fewer number ofunits than budgeted for, the per-unit manufacturing cost is more expensive
408 Principles of Cost Accounting

than planned. Such situations should be scrutinized by management, whichis ultimately responsible for planning and implementing the most efficientproduction methods and schedules.
The factory overhead account in the preceding example would have adebit balance of $1,000, as shown in the following T-account. The debitbalance represents a net unfavorable variance.
Factory Overhead
11,800 10,800
(actual costs recordedfrom various journals)
(standard cost applied to Workin Process)
Balance 1,000
This means that the volume variance is responsible for $900 of the netunfavorable factory overhead variance of $1,000. The amount of overheadapplied to production is $900 less than the factory overhead calculated inthe flexible budget for the actual level of production. This variance isunfavorable because the fixed overhead budgeted at the beginning of theperiod was not completely charged to production owing to an insufficientnumber of units produced. It is referred to as a volume variance because it iscreated by the excess or (as in this case) lack of actual units producedcompared to the planned production quantity.
The controllable variance accounts for the other $100 of the net variancebecause the actual factory overhead for the period exceeded the amount ofoverhead allowed for the level of production. This is a result of thepreviously mentioned overspending on supplies. The controllable varianceis favorable when the actual expenditures are less than the flexible dollaramount calculated for the attained level of production. It is unfavorablewhen the actual factory overhead costs exceed the calculated budget.
The formula for calculating factory overhead variances using the two-variance method is illustrated in the following example:
Actual factory overhead
$11,800
Standard overhead budgeted foractual level of production
$11,700
Applied overhead at standard(Equivalent production × standard
hours per unit × overhead rate per hour)
900 units × 2 hours × $6.00 = $10,800
Volume Variance$900 U
Controllable Variance$100 U
Net Factory Overhead Variance$1,000 U
Chapter 8 – Standard Cost Accounting—Materials, Labor, and Factory Overhead 409

After the variance analysis, the following journal entry can be made.This entry closes out the account for factory overhead on page 409 andrecords the variances in individual accounts.
Factory Overhead—Volume Variance . . . . . . . . . . . . . . . . . . . . . . . . . . . . . . . . . . . . 900
Factory Overhead—Controllable Variance . . . . . . . . . . . . . . . . . . . . . . . . . . . . . . . 100
Factory Overhead . . . . . . . . . . . . . . . . . . . . . . . . . . . . . . . . . . . . . . . . . . . . . . . . . . . . 1,000
Alternatively, the journal entries to apply overhead to Work in Process,to close Factory Overhead, and to record the variances may be combined inthe following single end-of-period entry:
Work in Process (1,800 hr @ $6) . . . . . . . . . . . . . . . . . . . . . . . . . . . . . . . . . . . . . . . . . 10,800
Factory Overhead—Volume Variance . . . . . . . . . . . . . . . . . . . . . . . . . . . . . . . . . . . . 900
Factory Overhead—Controllable Variance . . . . . . . . . . . . . . . . . . . . . . . . . . . . . . . 100
Factory Overhead . . . . . . . . . . . . . . . . . . . . . . . . . . . . . . . . . . . . . . . . . . . . . . . . . . . . 11,800
Production below the standard number of units will always cause anunfavorable volume variance. Conversely, production greater than thestandard number of units will always produce a favorable volume variance.Assume the following facts for the period:
Standard overhead cost per unit (2 direct labor hours � $6) . . . . . . . . . . . . . . . $ 12
Number of units actually produced . . . . . . . . . . . . . . . . . . . . . . . . . . . . . . . . . . . . . . 1,200
Number of units expected to be produced (budgeted) . . . . . . . . . . . . . . . . . . . . 1,000
Actual factory overhead . . . . . . . . . . . . . . . . . . . . . . . . . . . . . . . . . . . . . . . . . . . . . . . . $14,000
Standard factory overhead budgeted for actual level of production:
Fixed costs (as budgeted): . . . . . . . . . . . . . . . . . . . . . . . . . . . . . . . . . . . . . . . . . . . . $ 9,000
Variable costs:
1,200 units � 2 hours per unit � $1.50 . . . . . . . . . . . . . . . . . . . . . . . . . . . . . . . 3,600
Flexible budget for actual production level . . . . . . . . . . . . . . . . . . . . . . . . . . . . . $12,600
Actual factory overhead incurred . . . . . . . . . . . . . . . . . . . . . . . . . . . . . . . . . . . . . . 14,000
Controllable variance (unfavorable) . . . . . . . . . . . . . . . . . . . . . . . . . . . . . . . . . . . . . . $ 1,400
The volume variance would be calculated as follows:
Flexible budget for actual production level . . . . . . . . . . . . . . . . . . . . . . . . . . . . . . . $ 12,600
Factory overhead applied: 1,200 units � 2 hours per unit � $6 . . . . . . . . . . . . . 14,400
Volumevariance (favorable) . . . . . . . . . . . . . . . . . . . . . . . . . . . . . . . . . . . . . . . . . . . . . $ 1,800
Under these circumstances, the work in process account would becharged with $14,400 applied factory overhead (1,200 units � 2 hours perunit � $6). The factory overhead account, as shown in the followingT-account, would have a credit balance of $400. The credit balance repre-sents a favorable net variance.
410 Principles of Cost Accounting

Factory Overhead
14,000 14,400
(actual cost) (applied 1,200 units � 2std. hr per unit � $6)
Balance (400 overapplied)
The breakdown of the net variance shows a favorable volume varianceof $1,800 because factory overhead was overapplied due to the actualvolume of production being higher than the established standard. Theunfavorable controllable variance of $1,400 indicates that the actual over-head costs exceeded the amount allowed for the actual level of productionachieved.
Actual factory overhead
$14,000
Standard overhead budgeted foractual level of production
$12,600
Applied overhead at standard
1,200 units × 2 hours × $6.00 = $14,400
Volume Variance$1,800 F
Net Factory Overhead Variance$400 F
Controllable Variance$1,400 U
Both variances should be investigated for cause and effect. The favorablevolume variance may be due to an anticipated seasonal fluctuation, and itmay offset all or part of the previous unfavorable volume variances thatarose during periods of low production. However, this level of productionmay have occurred because the company received more orders for goodsthan it had anticipated. From the standpoint of increased profits, this factoris favorable. However, if the factory worked beyond an established efficientcapacity of production then the quality of the product may have suffered.
The unfavorable controllable variance should be examined to determinewhy the costs were higher than expected, where the responsibility for thiscondition lies, and what steps can be taken to keep these costs under controlin the future. This variance could result from several factors, such as laxityin purchasing, inefficiency in supervision, or weak control of expenditures.However, some portion of the controllable variance may result fromadditional machine maintenance and repair costs, which are attributable tothe increased use of facilities at the higher level of production.
Chapter 8 – Standard Cost Accounting—Materials, Labor, and Factory Overhead 411

Appendix
Four-Variance and Three-Variance Methods of Analysis
Four-Variance Method of AnalysisA refined management view of the two-variance method isolates the fixedand variable components that comprise the factory overhead cost andcalculates separate variances for the variable costs and the fixed costs. Thefour-variance method recognizes two variable cost variances and two fixedcost variances. The cost variances are identified as a variable overheadspending variance, a variable overhead efficiency variance, a fixed overhead budgetvariance, and a fixed overhead volume variance.
The variable overhead spending variance measures the effect ofdifferences in the actual variable overhead rate and the standard variableoverhead rate. The variable overhead efficiency variance measures thechange in the variable overhead consumption that occurs because ofefficient or inefficient use of the cost allocation base, such as direct laborhours. The fixed overhead budget variance measures the differencebetween the actual fixed overhead and the budgeted fixed overhead. Thefixed overhead volume variance is the difference between budgeted fixedoverhead and applied fixed overhead.
The four-variance method has two important aspects: (1) separateactual factory overhead accounts must be maintained for variable costsand fixed costs; and (2) actual direct labor hours worked must be known.When we use the same data for factory overhead as shown in theprevious illustration (except recognizing that the actual factory overheadof $14,000 was composed of $6,000 of variable overhead costs and $8,000of fixed overhead costs and that 3,000 direct labor hours were used inproduction), we see that the four-variance calculations would be asfollows:
Recall and Review 3
The overhead application rate for a company is $5 per unit, made up of $3
per unit for fixed overhead and $2 per unit for variable overhead. Normal
capacity is 5,000 units. In one month there was an unfavorable controllable
variance of $500. Actual overhead for the month was $30,000. The amount
of the budgeted overhead for the actual level of production must have been
$_____________________________.
(After working this exercise, see page 418 for the solution.)
You should now be able to work the following:
Questions 20–25; Exercises 8-14 to 8-17; Problems 8-10 to 8-14; Review
Problem 8-20R part 4 (a); and Self-Study Problem 2 part 4 (a).
LO10Compute
variances
using the four-
variance method.
412 Principles of Cost Accounting

Actual variable overhead
$6,000
Actual hours × standard variablerate per hour
3,000 hours × $1.50 = $4,500
Standard hours × standardvariable rate per hour
1,200 units × 2 hours × $1.50 = $3,600
Actual fixed cost
$8,000
Fixed cost: budgeted
$9,000
Standard hours × fixed rate
1,200 units × 2 hours × $4.50 = $10,800
Spending Variance$1,500 (unfav)
Efficiency Variance$900 (unfav)
Budget Variance$1,000 F
Volume Variance$1,800 F
Net Factory Overhead Variance$400 F
Variable Factory Overhead Variances
Fixed Factory Overhead Variances
After analyzing the variances, the following journal entry can be madeto record the variances and to close the factory overhead account:Factory Overhead—Spending Variance . . . . . . . . . . . . . . . . . . . . . . . . . . . . . . . 1,500
Factory Overhead—Efficiency Variance . . . . . . . . . . . . . . . . . . . . . . . . . . . . . . . 900
Factory Overhead . . . . . . . . . . . . . . . . . . . . . . . . . . . . . . . . . . . . . . . . . . . . . . . . . . . . 400
Factory Overhead—Budget Variance . . . . . . . . . . . . . . . . . . . . . . . . . . . . . . . . 1,000
Factory Overhead—Volume Variance . . . . . . . . . . . . . . . . . . . . . . . . . . . . . . . 1,800
To close the factory overhead account and record variances. . . . . . . .
The four-variance method and the two-variance method result in thesame net factory overhead variance—$400 favorable—which can be shownas follows:
Four-Variance Method Two-Variance MethodVariable cost:
Spending variance— $1,500 U Controllable variance— $1,400 U
Efficiency variance— 900 U
Fixed cost:
Budget variance— 1,000 F
Volume variance— 1,800 F Volume variance— 1,800 F
Net variance $ 400 F $ 400 F
�
Chapter 8 – Standard Cost Accounting—Materials, Labor, and Factory Overhead 413

Although the four-variance method identifies the fixed cost budgetvariance as originating from the differences between actual fixed costexpenditures and the amount of fixed cost budgeted, the controllablevariance (two-variance method) considers the budget variance to be avariable cost and includes it as part of the total controllable variance. Thecontrollable variance encompasses the spending, efficiency, and budgetvariances in one total variance. The volume variance amount is shown as asingle, separate item by both methods.
Historically, most companies have used the two-variance method ofanalysis for factory overhead and have applied the factory overhead toproduction using a single rate that combines both the fixed and variablecomponents. These companies consider it too costly from a clericalstandpoint to apply separate fixed and variable rates to completed productswhile also maintaining separate factory overhead accounts for fixed andvariable elements. The most valuable use of the four-variance method,however, is that it demonstrates the cost behavior patterns of fixed andvariable costs when production volumes fluctuate. It is an excellentexercise in the study of cost behavior because it demonstrates the behaviorpatterns important in making management cost decisions that affectprofitability. For companies that consider this additional informationimportant, the computer age has made this type of data analysis muchmore cost effective.
Three-Variance Method of AnalysisThe three-variance method of factory overhead analysis, though not ascommon as the two-variance method, is frequently used by manufacturers.This method separates actual and applied overhead into three variances:(1) budget (spending), (2) capacity, and (3) efficiency.
The budget variance, or spending variance, reflects the differencebetween the actual costs of overhead and the budgeted amount calculatedfor the actual hours worked. The saving or overspending is chargeable tothe manager or departmental supervisor responsible for the costs.
These budget variances should not be confused with those for the two-variance method. The calculations are different and result in a sharperdistinction in variances. The primary difference between the two methodsof variance analysis is that the three-variance method determines thebudget allowances based on actual hours worked rather than on thestandard number of hours allowed for the units produced.
The capacity variance indicates that the volume of production waseither more or less than normal. It reflects an under- or overapplication offixed costs and measures the difference between actual hours worked(multiplied by the standard overhead rate) and the budget allowance basedon actual hours worked. This variance is considered the responsibility ofmanagement and can be due to expected seasonal variations or changes inthe volume of production (caused by poor scheduling, improper use oflabor, strikes, or other factors).
LO11Compute
variances
using the three-
variance method.
414 Principles of Cost Accounting

The efficiency variance measures the difference between the overheadapplied (standard hours at the standard rate) and the actual hours workedmultiplied by the standard rate. It shows the effect on fixed and variableoverhead costs when the actual hours worked are either more or less thanstandard hours allowed for the production volume. Unfavorable variancesmay be caused by inefficiencies in the use of labor or by an excessive use oflabor hours. Favorable efficiency variances indicate a more effective use oflabor than was anticipated by the standards.
Many accountants feel that the budget allowance for overhead is moreappropriate when the base used reflects actual labor hours rather thanstandard labor hours. They believe that a more definitive relationship existsbetween actual hours worked and factory expense involved and that thethree-variance method provides a more precise analysis of overhead costs.
In the illustration that follows, the budget variance is unfavorablebecause the actual overhead exceeded the budget allowance. Again, theamount differs from the two-variance method because actual (rather thanstandard) hours are used to determine the budget amount. Note that abudget variance is calculated for the four-variance method, but it isspecifically used to compare the fixed costs actually incurred for theperiod to the previously budgeted fixed costs. It is unfortunate that thesevariances have similar designations. The designations were not changedbecause both are widely accepted by accountants. These terms are rarelyconfused because they refer to different types of factory overheadanalyses.
Actual overheadBudgeted overhead for
actual hours workedActual hours ×standard rate
Applied overhead:standard hours ×
standard rate
Formula for Calculating Factory Overhead Variances
Fixed:Variable:
$ 7,0008,000
$15,000
Variable: 3,000 × $1.50 = $ 4,500Fixed: budgeted = 9,000
$13,500 3,000 × $6 = $18,000 2,400 × $6 = $14,400
Capacity Variance$4,500 F
Efficiency Variance$3,600 U
Budget Variance$1,500 U
Net Factory Overhead Variance$600 U
Chapter 8 – Standard Cost Accounting—Materials, Labor, and Factory Overhead 415

The efficiency variance, as illustrated, is unfavorable because the laborhours worked were more than the standard hours allowed for the level ofproduction. In this case, the excess 600 hours multiplied by the standardoverhead application rate of $6 equals the variance of $3,600 and reflectsthe underapplication of fixed and variable costs.
The new budget for overhead, based on the actual hours worked, iscalculated by multiplying the actual hours worked by the variable rate foroverhead (3,000 hours � $1.50 per hour), amounting to $4,500, and addingthe expected fixed cost of $9,000 for the period. The new budget for hoursworked totals $13,500. The capacity variance theoretically reflects the costof unused plant facilities and involves mostly fixed costs. At 3,000 actuallabor hours worked, $13,500 (3,000 � $4.50) of fixed cost was absorbed inWork in Process, $4,500 more than the $9,000 budgeted for fixed costs.This variance is similar to the volume variance under the two-variancemethod, but the amount differs because it is based on actual hours workedrather than on the standard hours allowed for 1,200 units.
For comparison purposes, the two-variance method would produce thefollowing results:
Actual overhead
Standard overheadbudgeted for actual level
of productionApplied overhead at
standard
$14,000
2,400 × $1.50 = $ 3,600Fixed: = 9,000
$12,600 2,400 hrs. × $6 = $14,400
Volume Variance$1,800 (fav)
Controllable Variance$1,400 (unfav)
Net Factory Overhead Variance$400 (fav)
Whether the two-, three-, or four-variance method is used, the over-head applied to production is the same because the application is based onthe standard number of labor hours allowed (for the actual production)multiplied by the standard rates established for overhead. Also, the actualoverhead incurred would be the same in all cases. Therefore, the calculatednet factory overhead variance (actual factory overhead – applied factoryoverhead) would also be the same for all methods.
416 Principles of Cost Accounting

KEY TERMS
Attainable standards, 381
Balanced scorecard, 384
Budget variance, 414
Capacity variance, 414
Controllable variance, 406
Efficiency variance, 415
Favorable variance, 386
Fixed overhead budget variance, 412
Fixed overhead volume variance, 412
Four-variance method, 412
Ideal standard, 381
Labor cost standard, 382
Labor efficiency (usage) variance, 386
Labor rate (price) variance, 386
Learning effect, 382
Management by exception, 380
Materials cost standard, 382
Materials price variance, 386
Materials purchase price variance, 388
Materials quantity (usage) variance, 386
Nonfinancial performance measures, 384
Price, 384
Spending variance, 414
Standard, 381
Standard cost accounting, 380
Three-variance method, 414
Two-variance method, 406
Unfavorable variance, 386
Usage, 384
Variable overhead efficiency variance, 412
Variable overhead spending variance, 412
Variance, 384
Volume variance, 407
ANSWERS TO RECALL AND REVIEW EXERCISES
R&R 1
Labor rate variance ¼ 6,500 ($16 – $15) ¼ $6,500 U
Labor efficiency variance ¼ $15 [6,500 – (2,000 � 3)] ¼ $7,500 U
Net labor variance ¼ $6,500 U þ $7,500 U ¼ $14,000 U
Recall and Review 4
Calipari Plastics, Inc., budgets 16,000 direct labor hours for the year. The
total overhead budget is expected to amount to $40,000. The standard cost
for a unit of the company’s product estimates the variable factory overhead
as 3 hours @ $2 per direct labor hour, or $12 per unit. The actual data for
the period is: actual completed units, 5,000; actual direct labor hours,
15,500; actual variable overhead, $32,000; and actual fixed overhead,
$8,200. Using the four-variance method, we see that the spending variance
is $_____________, the efficiency variance is $_____________, the budget
variance is $_____________, and the volume variance is $_____________.
(After working this exercise, see page 418 for the solution.)
You should now be able to work the following:
Questions 26 and 27; Exercises 8-18 and 8-19; Problems 8-15 to 8-19;
Review Problem 8-20R parts 4 (b) and (c); and Self-Study Problem 2 parts 4
(b) and (c).
Chapter 8 – Standard Cost Accounting—Materials, Labor, and Factory Overhead 417

R&R 2
Materials (5 lb per unit � $4 per lb) . . . . . . . . . . . . . . . . . . . . . . . . . . . . . . . . $20.00
Labor (2 hrs per unit � $15 per hr) . . . . . . . . . . . . . . . . . . . . . . . . . . . . . . . . 30.00
Factory overhead ($450,000 / 15,000 units) . . . . . . . . . . . . . . . . . . . . . . . . 30.00
Standard cost per unit . . . . . . . . . . . . . . . . . . . . . . . . . . . . . . . . . . . . . . . . . . . . $80.00
R&R 3
Actual overhead for the month . . . . . . . . . . . . . . . . . . . . . . . . . . . . . . . . . . . . $30,000
Less unfavorable controllable variance . . . . . . . . . . . . . . . . . . . . . . . . . . . 500
Budgeted overhead for actual production . . . . . . . . . . . . . . . . . . . . . . . . . $29,500
R&R 4Computation of budgeted fixed overhead:
Total budgeted overhead . . . . . . . . . . . . . . . . . . . . . . . . . . . . . . . . . . . . . . . . . $40,000
Variable overhead (16,000 � $2) . . . . . . . . . . . . . . . . . . . . . . . . . . . . . . . . . . 32,000
Budgeted fixed overhead . . . . . . . . . . . . . . . . . . . . . . . . . . . . . . . . . . . . . . . . . $ 8,000
Variable overhead spending variance:
Actual variable overhead� ðActual hours� standard rateÞ¼ $32;000� ð15;500� $2Þ¼ $1;000 favorable
Variable overhead efficiency variance:
¼ ðActual hours� Standard rateÞ � ðStandard hours� Standard rateÞ¼ ð15;500� $2Þ � ð5;000 units� 3 hrs� $2Þ¼ $1;000 unfavorable
Fixed overhead budget variance:
Actual fixed overhead� Budgeted fixed overhead
$8;200� $8;000 ¼ $200 unfavorable
Fixed overhead volume variance:
Budgeted fixed overhead� ðActual units� standard hrs� standard rateÞ¼ $8;000� ð5;000� 3 hrs� $:50�Þ¼ $500 unfavorable
*$8,000/16,000 hrs ¼ $.50 per direct labor hour
418 Principles of Cost Accounting

SELF-STUDY PROBLEM 1
Materials and Labor Variance Analyses
Cabrera Chemical Company
Cabrera Chemical Company manufactures one product and uses a stan-
dard cost system. The established standards for materials and labor
follow:
Material A: 3 lb @ $6 per lb . . . . . . . . . . . . . . . . . . . . . . . . . . . . . . . . . . . . . . . . . . . . . . . . . . . $18
Labor: 4 hr @ $7.50 per hr . . . . . . . . . . . . . . . . . . . . . . . . . . . . . . . . . . . . . . . . . . . . . . . . . . . . $30
The operating data for the month of May follow:
Work in process, May 1: 200 units, all materials, 20% complete as to labor.
Work in process, May 31: 600 units, all materials, 80% complete as to labor.
Completed during the month: 6,400 units.
All materials are added at the beginning of processing in the department.
20,900 pounds of materials were used in production during the month, at a total cost of
$123,310. Direct labor amounted to $208,670, which was at a rate of $7.70 per hour.
Required:
Using the FIFO method of costing, calculate the following variances:
1. Materials quantity variance.
2. Materials price variance.
3. Labor efficiency variance.
4. Labor rate variance.
SOLUTION TO SELF-STUDY PROBLEM 1
The Specifics in the Problem Highlight the Following Facts:
In addition to the usual procedures used to solve standard cost problems,
equivalent production (FIFO) must be calculated. The equivalent produc-
tion determined by the FIFO method will be used to calculate the standard
materials and standard labor allowed. Two variances (price and quantity)
must be determined for materials, and two variances (rate and efficiency)
must be determined for labor.
Calculating Equivalent Production for Materials and Labor by the FIFO
Method:
UnitsMaterials:
Work in process, May 1: 200 units (all materials added last period) . . . . . . -0-
Units started and finished during May (6,400 – 200) . . . . . . . . . . . . . . . . . . . . . 6,200
Work in process, May 31: 600 units (all materials added) . . . . . . . . . . . . . . . . 600
Total equivalent production—materials . . . . . . . . . . . . . . . . . . . . . . . . . . . . . . . . 6,800
Chapter 8 – Standard Cost Accounting—Materials, Labor, and Factory Overhead 419

UnitsLabor:
Work in process, May 1: 200 units (80% of labor required) . . . . . . . . . . . . . . . 160
Units started and finished during May . . . . . . . . . . . . . . . . . . . . . . . . . . . . . . . . . 6,200
Work in process, May 31: 600 units (80% labor added) . . . . . . . . . . . . . . . . . . 480
Total equivalent production—labor . . . . . . . . . . . . . . . . . . . . . . . . . . . . . . . . . . . . 6,840
Determining the Materials and Labor Variances:
Materials Variances
Materials price variance¼ ðActualprice�StandardpriceÞ�Actualquantity
¼ ð$5:90��$6:00Þ�20;900¼$2;090F
Materialsquantityvariance¼ ðActualquantity�StandardquantityÞ�Standardprice
¼ ½20;900�ð6;800�3Þ��$6¼$3;000U
*$123,310/$20,900 ¼ $5.90 per pound
Actual cost
20,900 lb × $5.90* = $123,310
*$123,310/20,900 = $5.90 per pound
Actual pounds × standard price
20,900 lb × $6.00 = $125,400
Equivalent units × poundsper unit × standard price
6,800 units × 3 lb × $6.00 = $122,400
Materials Price Variance$2,090 F
Materials Quantity Variance$3,000 U
Net Materials Variance$910 U
Labor Variances
Labor rate variance ¼ ðActual rate� Standard rateÞ � Actual hours
¼ ð$7:70� $7:50Þ � 27;100� ¼ $5;420 U
Labor efficiency variance ¼ ðActual hours� Standard hoursÞ � Standard rate
¼ ½27;100� ð6;840� 4Þ� � $7:50 ¼ $1;950 F
*$208,670/$7.70 ¼ 27,100 hours
420 Principles of Cost Accounting

Actual cost
27,100 hours × $7.70 = $208,670
Actual hours worked × standard rate
27,100 hours × $7.50 = $203,250
Equivalent units × standard hours per unit × standard rate
6,840 units × 4 hours × $7.50 = $205,200
Labor Efficiency Variance$1,950 F
Labor Rate Variance$5,420 U
Net Labor Variance$3,470 U
SELF-STUDY PROBLEM 2
Flexible Budgets; Two-, Three-, and Four-VarianceMethods of Factory Overhead Analysis
Baton Rouge Manufacturing, Inc.
Baton Rouge manufactures a single product and uses a standard cost
system. The factory overhead is applied on the basis of direct labor hours.
A condensed version of the company’s flexible budget follows:
Direct labor hours . . . . . . . . . . . . . 20,000 25,000 40,000
Factory overhead costs:
Variable costs . . . . . . . . . . . . . . $ 40,000 $ 50,000 $ 80,000
Fixed costs . . . . . . . . . . . . . . . . . 200,000 200,000 200,000
Total . . . . . . . . . . . . . . . . . . . . . $240,000 $250,000 $280,000
The product requires 3 pounds of materials at a standard cost per
pound of $7 and 2 hours of direct labor at a standard cost of $6 per hour.
For the current year, the company planned to operate at 25,000 direct
labor hours and to produce 12,500 units of product. Actual production and
costs for the year follow:
Number of units produced . . . . . . . . . . . . . . . . . . . . . . . . . . . . . . . . . . . . . . . . . . . . . . 14,000
Actual direct labor hours worked . . . . . . . . . . . . . . . . . . . . . . . . . . . . . . . . . . . . . . . . 30,000
Actual variable overhead costs incurred . . . . . . . . . . . . . . . . . . . . . . . . . . . . . . . . . $ 52,000
Actual fixed overhead costs incurred . . . . . . . . . . . . . . . . . . . . . . . . . . . . . . . . . . . . $208,000
Chapter 8 – Standard Cost Accounting—Materials, Labor, and Factory Overhead 421

Required:
1. Compute the factory overhead rate that will be used for production for
the current year. Show the variable and fixed components that make
up the total predetermined rate to be used.
2. Prepare a standard cost card for the product. Show the individual
elements of the overhead rate as well as the total rate.
3. Compute (a) standard hours allowed for production and (b) under- or
overapplied factory overhead for the year.
4. Determine the reason for any under- or overapplied factory overhead
for the year by computing all variances, using each of the following
methods:
a. Two-variance method
b. Three-variance method (appendix)
c. Four-variance method (appendix)
SOLUTION TO SELF-STUDY PROBLEM 2
Compute the Factory Overhead Rate by Variable and Fixed Elements:
1. Show the total predetermined rate that will be used during the current
year.
Per DLHVariable rate:
Variable costs . . . . . . . . . . . . . . . . . . . . . . . . . . . . . . . . . . $ 50,000 ¼ $ 2.00
Direct labor hours . . . . . . . . . . . . . . . . . . . . . . . . . . . . . . . 25,000
Fixed rate:
Fixed costs . . . . . . . . . . . . . . . . . . . . . . . . . . . . . . . . . . . . . $200,000 ¼ 8.00
Direct labor hours . . . . . . . . . . . . . . . . . . . . . . . . . . . . . . . 25,000
Total rate:
Variable costs . . . . . . . . . . . . . . $ 50,000
Fixed costs . . . . . . . . . . . . . . . . . 200,000
Total costs . . . . . . . . . . . . . . . . . . . . . . . . . . . . . . . . . . . . . $250,000 ¼ $10.00
Direct labor hours . . . . . . . . . . . . . . . . . . . . . . . . . . . . . . . 25,000
2. Prepare a standard cost card for each unit of product.
Direct materials: 3 lb @ $7 per lb . . . . . . . . . . . . . . . . . . . . . . $21.00
Direct labor: 2 hr @ $6 per hr . . . . . . . . . . . . . . . . . . . . . . . . . . 12.00
Factory overhead:
Variable cost: 2 hr @ $2 . . . . . . . . . . . . . . . . . . . . . . . . . . . . . $ 4.00
Fixed cost: 2 hr @ $8 . . . . . . . . . . . . . . . . . . . . . . . . . . . . . . . 16.00 20.00
Standard cost per unit . . . . . . . . . . . . . . . . . . . . . . . . . . . . . . . . $53.00
3. a. Compute the standard hours allowed for production for the year.
Actual units produced . . . . . . . . . . . . . . . . . . . . . . . . . . . . . . . . . . . . . . . . . . . . . . . . . . 14,000
Number of hours allowed by standard established for each unit of product � 2
Total standard hours allowed . . . . . . . . . . . . . . . . . . . . . . . . . . . . . . . . . . . . . . . . . . . 28,000
422 Principles of Cost Accounting

b. Compute the under- or overapplied factory overhead for the year.
Actual factory overhead incurred:
Variable costs . . . . . . . . . . . . . . . . . . . . . . . . . . . . . . . . . . . . . . . . . . . . . . . . . . . . . . . . $ 52,000
Fixed costs . . . . . . . . . . . . . . . . . . . . . . . . . . . . . . . . . . . . . . . . . . . . . . . . . . . . . . . . . . . 208,000
Total actual overhead costs . . . . . . . . . . . . . . . . . . . . . . . . . . . . . . . . . . . . . . . . . . . $260,000
Factory overhead costs applied:
Standard hours allowed � standard rate:
28,000 hours � $10.00 . . . . . . . . . . . . . . . . . . . . . . . . . . . . . . . . . . . . . . . . . . . . . . 280,000
Overapplied factory overhead . . . . . . . . . . . . . . . . . . . . . . . . . . . . . . . . . . . . . . . . . . . $ 20,000
4. Calculate the reason for the overapplied factory overhead by:
a. Two-variance method:
Actual overheadStandard overhead budgeted for actual level of production Applied overhead at standard
28,000 hrs. × $10 = $280,000$260,000
Var.: 28,000 × $2 = $ 56,000Fixed: = 200,000
$256,000
Volume Variance$24,000 F
Controllable Variance$4,000 U
Net Factory Overhead Variance$20,000 F
b. Three-variance method (appendix):
Actual overheadBudgeted overhead for
actual hours workedApplied overhead:std. hrs. × std. rate
Actual hours ×std. rate
Var.: 30,000 × $2 = $ 60,000Fixed: = 200,000
$260,000* $260,000 30,000 × $10 = $300,000 28,000 × $10 = $280,000
Efficiency Variance$20,000 (U)
Capacity Variance$40,000 (F)
Budget Variance$–0–
Net Factory Overhead Variance$20,000 (F)
Chapter 8 – Standard Cost Accounting—Materials, Labor, and Factory Overhead 423

c. Four-variance method (appendix):
Actual overheadBudgeted overhead for
actual hours workedApplied overhead:std. hrs. × std. rate
Actual hours ×std. rate
Var.: 30,000 × $2 = $ 60,000Fixed: = 200,000
$260,000* $260,000 30,000 × $10 = $300,000 28,000 × $10 = $280,000
Efficiency Variance$20,000 (U)
Capacity Variance$40,000 (F)
Budget Variance$–0–
Net Factory Overhead Variance$20,000 (F)
*These total costs represent actual hours � actual rates per hour.
When the total cost is given, it is not necessary to determine the
specific components that make up the total cost unless you do it
to understand the formulas being used.
QUESTIONS
1. How does a standard cost accounting system
work, and why is it valuable to management?
2. What is the difference between the stan-
dard cost and the actual cost of production?
3. What is a ‘‘standard’’? Give some examples
such as those appearing in the chapter
introduction.
4. What are the specific procedures on which a
standard cost accounting system is based?
5. How are standards for materials and labor
costs determined?
6. What is a variance?
7. How do price and quantity variances relate
to materials costs?
8. How do rate and efficiency variances relate
to labor costs?
9. Is a favorable variance ‘‘good’’ and an un-
favorable variance ‘‘bad’’? Explain.
10. How does a materials purchase price var-
iance differ from a materials price variance.
11. When are variances usually recorded in the
journals?
12. Are actual costs or standard costs charged
to Work in Process?
13. When a company uses a standard cost
system, are the inventory accounts—Fin-
ished Goods, Work in Process, and Materi-
als—valued at actual cost or standard cost?
14. What two factors must be considered when
breaking down a variance into its compo-
nents? Explain.
15. What might cause the following materials
variances?
424 Principles of Cost Accounting

a. An unfavorable materials price variance.
b. A favorable materials price variance.
c. An unfavorable materials quantity
variance.
d. A favorable materials quantity variance.
16. What might cause the following labor
variances?
a. An unfavorable labor rate variance.
b. A favorable labor rate variance.
c. An unfavorable labor efficiency
variance.
d. A favorable labor efficiency variance.
17. Is it possible that a variance of one type
might be partially or fully offset by another
variance? Explain.
18. If, in a given period, the total actual cost of
all materials used is exactly the same as
the standard cost so that no net variance
results, should the data be further ana-
lyzed? Explain.
19. At what amount is the entry made to trans-
fer the cost of finished goods from the first
department to a subsequent department in
a standard cost system?
20. What is a controllable variance?
21. Why is it important to determine controlla-
ble variances?
22. What is a volume variance?
23. What is the significance of a volume
variance?
24. If production is more or less than the stan-
dard volume, is it possible that no control-
lable or volume variances would exist?
Explain.
25. At the end of the current fiscal year, the
trial balance of Flatbush Corporation re-
vealed the following debit (unfavorable)
balances:
Controllable Variance—$2,000
Volume Variance—$75,000
25.
What conclusions can be drawn from these
two variances?
26. What variances from the four-variance
method are included in the controllable
variance from the two-variance method?
(appendix)
27. What is the primary difference between the
two-variance and three-variance methods
of calculation? (appendix)
EXERCISES
In all of the exercises involving variances, use ‘‘F’’ and ‘‘U’’ to
designate favorable and unfavorable variances, respectively.
E8-1 E8-1 through E8-5 use the following data:The standard operating capacity of Tecate Manufacturing Co. is
1,000 units. A detailed study of the manufacturing data relating to
the standard production cost of one product revealed the following:
1. Two pounds of materials are needed to produce one unit.
2. Standard unit cost of materials is $8 per pound.
3. It takes one hour of labor to produce one unit.
4. Standard labor rate is $10 per hour.
5. Standard overhead for this volume is $4,000.
E8-2 Each case in E8-1 through E8-5 requires the following:a. Set up a standard cost summary showing the standard unit
cost.
b. Analyze the variances for materials and labor.
Chapter 8 – Standard Cost Accounting—Materials, Labor, and Factory Overhead 425

c. Make journal entries to record the transfer to Work in Pro-
cess of:
1. Materials costs
2. Labor costs
3. Overhead costs
When making these entries, include the variances.
d. Prepare the journal entry to record the transfer of costs to the
finished goods account.
E8-1 Standard unit cost; variance analysis; journal entries1,000 units were started and finished.
Case 1: All prices and quantities for the cost elements are
standard, except for materials cost, which is $8.50 per pound.
Case 2: All prices and quantities for the cost elements are
standard, except that 1,900 pounds of materials were used.
E8-2 Standard unit cost; variance analysis; journal entries1,000 units were started and finished.
Case 1:.All prices and quantities are standard, except for the
labor rate, which is $10.20 per hour.
Case 2: All prices and quantities are standard, except for labor
hours, which totaled 900.
E8-3 Computing standard unit cost; variance analysis; journal entriesAll of the deviations listed in E8-1 and E8-2 took place, and 1,000
units were started and finished. (Note that the quantities used
will affect the rate variances for both materials and labor.)
E8-4 Standard unit cost; variance analysis; journal entriesAll of the deviations listed in E8-1 and E8-2 took place, and 900
units were started and finished.
E8-5 Standard unit cost; variance analysis; journal entriesAll of the deviations listed in E8-1 and E8-2 took place, and 1,100
units were started and finished.
E8-6 Computing materials variancesD-List Calendar Company specializes in manufacturing calendars
that depict obscure comedians. The company uses a standard
cost system to control its costs. During one month of operations,
the direct materials costs and the quantities of paper used
showed the following:
Actual purchase price . . . . . . . . . . . . . . . . . . . . . . . . . $0.175 per page
Standard quantity allowed for production . . . . . . 170,000 pages
LO2
LO3
LO4
LO2
LO3
LO4
LO2
LO3
LO4
LO2
LO3
LO4
LO2
LO3
LO4
LO3
426 Principles of Cost Accounting

Actual quantity purchased during month . . . . . . . 200,000 pages
Actual quantity used during month . . . . . . . . . . . . 185,000 pages
Standard price per page . . . . . . . . . . . . . . . . . . . . . . $0.17 per page
Calculate the following variances:
1. Total cost of purchases for the month
2. Materials price variance
3. Materials quantity variance
4. Net materials variance
E8-7 Computing labor variancesOverhead Doors, Inc., manufactures garage doors for homes.
The standard quantity of direct labor to manufacture a door is
4.5 hours. The standard hourly wage in this department is $12.50
per hour. During August, 6,100 doors were produced. The pay-
roll records indicate that 31,110 hours were worked at a total cost
for payroll of $411,274.20.
Calculate the following, using the ‘‘goalpost’’ diagram format
shown in Figure 8-4 to compute variances:
1. Labor rate variance.
2. Labor efficiency variance.
3. Net labor variance.
E8-8 Standard cost summary; materials and labor cost variancesAACSB Processors, Inc., produces an average of 10,000 units
each month. The factory standards are 20,000 hours of direct
labor and 10,000 pounds of materials for this volume. The
standard cost of direct labor is $9.00 per hour, and the standard
cost of materials is $4.00 per pound. The standard factory over-
head at this level of production is $20,000.
During the current month the production and cost reports
reflected the following information:
Beginning units in process . . . . . . . . . . . . . . . . . . . . . . . . . . . . . . . . . . . . . . None
Units finished . . . . . . . . . . . . . . . . . . . . . . . . . . . . . . . . . . . . . . . . . . . . . . . . . . 9,500
Units in process, end of month . . . . . . . . . . . . . . . . . . . . . . . . . . . . . . . . . . None
Direct labor hours worked . . . . . . . . . . . . . . . . . . . . . . . . . . . . . . . . . . . . . . . 20,000
Pounds of material purchased . . . . . . . . . . . . . . . . . . . . . . . . . . . . . . . . . . . 10,000
Pounds of materials used . . . . . . . . . . . . . . . . . . . . . . . . . . . . . . . . . . . . . . . 9,400
Cost of direct labor . . . . . . . . . . . . . . . . . . . . . . . . . . . . . . . . . . . . . . . . . . . . . $178,000
Cost of materials purchased . . . . . . . . . . . . . . . . . . . . . . . . . . . . . . . . . . . . . $ 42,000
On the basis of this information:
1. Prepare a standard cost summary.
2. Calculate the materials (use the materials purchase price
variance) and labor cost variances, and indicate whether they
are favorable or unfavorable, using the formulas on page 386.
LO3
LO2
LO3
Chapter 8 – Standard Cost Accounting—Materials, Labor, and Factory Overhead 427

E8-9 Computing labor variancesFill in the missing figures for each of the following independent
cases:
Case 1 Case 2Units produced . . . . . . . . . . . . . . . . . . . . . . . . . . . . . . . . . . . . 1,200 ?
Standard hours per unit . . . . . . . . . . . . . . . . . . . . . . . . . . . . 2 0.6
Standard hours allowed . . . . . . . . . . . . . . . . . . . . . . . . . . . . ? 1,200
Standard rate per hour . . . . . . . . . . . . . . . . . . . . . . . . . . . . . $ 5 ?
Actual hours used . . . . . . . . . . . . . . . . . . . . . . . . . . . . . . . . . 2,340 1,220
Actual labor cost . . . . . . . . . . . . . . . . . . . . . . . . . . . . . . . . . . . ? ?
Labor rate variance . . . . . . . . . . . . . . . . . . . . . . . . . . . . . . . . $725 U $290 U
Labor efficiency variance . . . . . . . . . . . . . . . . . . . . . . . . . . . ? $ 40 U
(Round all rates to the nearest cent and all totals to the nearest
dollar.)
E8-10 Preparing a standard cost summary and making journal entriesThe normal capacity of Austin Adhesives, Inc., is 40,000 direct
labor hours and 20,000 units per month. A finished unit requires
6 pounds of materials at an estimated cost of $2 per pound. The
estimated cost of labor is $10.00 per hour. The plant estimates
that overhead for a month will be $40,000.
During the month of March, the plant totaled 34,800 direct
labor hours at an average rate of $9.50 an hour. The plant
produced 18,000 units, using 105,000 pounds of materials at a
cost of $2.04 per pound.
1. Prepare a standard cost summary showing the standard unit
cost.
2. Make journal entries to charge materials and labor to Work in
Process.
E8-11 Making journal entriesAssume that during the month of April the production report
of Austin Adhesives, Inc., in E8-10 revealed the following
information:
Units produced during the month . . . . . . . . . . . . . . . . . . . . . . . . . . . . . 21,000
Direct labor hours for the month . . . . . . . . . . . . . . . . . . . . . . . . . . . . . . 41,000
Materials purchased (in pounds) . . . . . . . . . . . . . . . . . . . . . . . . . . . . . . 130,000
Materials used (in pounds) . . . . . . . . . . . . . . . . . . . . . . . . . . . . . . . . . . . 125,000
Labor rate per hour . . . . . . . . . . . . . . . . . . . . . . . . . . . . . . . . . . . . . . . . . . $10.04
Materials cost per pound . . . . . . . . . . . . . . . . . . . . . . . . . . . . . . . . . . . . . $ 1.98
Make journal entries to charge materials (use the materials
purchase price variance) and labor to Work in Process. (Remem-
ber to retrieve the standard costs from E8-10 before solving this
exercise.)
LO3
LO2
LO3
LO4
LO3
LO4
428 Principles of Cost Accounting

E8-12 Using variance analysis and interpretationLast year, Tri-Rivers Corporation adopted a standard cost sys-
tem. Labor standards were set on the basis of time studies and
prevailing wage rates. Materials standards were determined
from materials specifications and the prices then in effect.
On June 30, the end of the current fiscal year, a partial trial
balance revealed the following:
Debit CreditMaterials Price Variance . . . . . . . . . . . . . . . . . . . . . . . . . . . . . . . . . 25,000
Materials Quantity Variance . . . . . . . . . . . . . . . . . . . . . . . . . . . . . 9,000
Labor Rate Variance . . . . . . . . . . . . . . . . . . . . . . . . . . . . . . . . . . . . . 30,000
Labor Efficiency Variance . . . . . . . . . . . . . . . . . . . . . . . . . . . . . . . . 7,500
Standards set at the beginning of the year have remained
unchanged. All inventories are priced at standard cost. What
conclusions can be drawn from each of the four variances shown
in Tri-Rivers’ trial balance?
E8-13 Journalizing standard costs in two departmentsMarblehead Manufacturing, Inc., has two departments, Mixing
and Blending. When goods are completed in Mixing, they are
transferred to Blending and then to the finished goods store-
room. There was no beginning or ending work in process in
either department. Listed below is information to be used in
preparing journal entries at the end of October:
Standard cost of direct materials for actual production—Mixing . . . . . . $ 185,000
Actual cost of direct materials used in production—Mixing . . . . . . . . . . 177,000
Materials price variance—Mixing . . . . . . . . . . . . . . . . . . . . . . . . . . . . . . . . . . . 10,000 F
Materials quantity variance—Mixing . . . . . . . . . . . . . . . . . . . . . . . . . . . . . . . 2,000 U
Standard cost of direct materials for actual production—Blending . . . . 130,000
Actual cost of direct materials used in production—Blending . . . . . . . . 136,000
Materials price variance—Blending . . . . . . . . . . . . . . . . . . . . . . . . . . . . . . . . . 4,000 U
Materials quantity variance—Blending . . . . . . . . . . . . . . . . . . . . . . . . . . . . . 2,000 U
Standard cost of direct labor for actual production—Mixing . . . . . . . . . . 110,000
Actual cost of direct labor used in production—Mixing . . . . . . . . . . . . . . 103,000
Labor rate variance—Mixing . . . . . . . . . . . . . . . . . . . . . . . . . . . . . . . . . . . . . . . 10,000 F
Labor efficiency variance—Mixing . . . . . . . . . . . . . . . . . . . . . . . . . . . . . . . . . 3,000 U
Standard cost of direct labor for actual production—Blending . . . . . . . . 95,000
Actual cost of direct labor used in production—Blending . . . . . . . . . . . . 110,000
Labor rate variance—Blending . . . . . . . . . . . . . . . . . . . . . . . . . . . . . . . . . . . . . 8,000 U
Labor efficiency variance—Blending . . . . . . . . . . . . . . . . . . . . . . . . . . . . . . . . 7,000 U
Actual factory overhead . . . . . . . . . . . . . . . . . . . . . . . . . . . . . . . . . . . . . . . . . . . 145,000
Factory overhead applied—Mixing . . . . . . . . . . . . . . . . . . . . . . . . . . . . . . . . . 85,000
Factory overhead applied—Blending . . . . . . . . . . . . . . . . . . . . . . . . . . . . . . . 70,000
LO5
LO7
Chapter 8 – Standard Cost Accounting—Materials, Labor, and Factory Overhead 429
Prepare journal entries for the following:
1. The issuance of direct materials into production and the
recording of the materials variances.
2. The use of direct labor in production and the recording of the
labor variances.
3. The entries to record the actual and applied factory overhead.
4. The entries to transfer the production costs from Mixing to
Blending and from Blending to finished goods.
E8-14 Calculating factory overheadThe standard capacity of a factory is 8,000 units per month. Cost
and production data follow:
Standard application rate for fixed overhead . . . . . . $0.50 per unit
Standard application rate for variable overhead . . . $1.50 per unit
Production—Month 1 . . . . . . . . . . . . . . . . . . . . . . . . . . . . 7,400 units
Production—Month 2 . . . . . . . . . . . . . . . . . . . . . . . . . . . . 8,200 units
Actual factory overhead—Month 1 . . . . . . . . . . . . . . . $15,100
Actual factory overhead—Month 2 . . . . . . . . . . . . . . . $17,200
Calculate the amount of factory overhead allowed for the
actual volume of production each month and the variance
between budgeted and actual overhead for each month.
E8-15 Calculating factory overhead: two variancesMissoula Manufacturing Company normally produces 10,000
units of product X each month. Each unit requires 2 hours of
direct labor, and factory overhead is applied on a direct labor
hour basis. Fixed costs and variable costs in factory overhead at
the normal capacity are $5 and $3 per unit, respectively. Cost and
production data for May follow:
Production for the month . . . . . . . . . . . . . . . . . . . . . . . . 9,000 units
Direct labor hours used . . . . . . . . . . . . . . . . . . . . . . . . . . 18,500 hours
Factory overhead incurred for:
Variable costs . . . . . . . . . . . . . . . . . . . . . . . . . . . . . . . . . $28,500
Fixed costs . . . . . . . . . . . . . . . . . . . . . . . . . . . . . . . . . . . $52,000
a. Calculate the controllable variance.
b. Calculate the volume variance.
c. Was the total factory overhead under- or overapplied? By
what amount?
E8-16 Making journal entries for factory overhead and variances;analysis of variancesThe normal capacity of a manufacturing plant is 30,000 direct labor
hours or 20,000 units per month. Standard fixed costs are $6,000,
and variable costs are $12,000. Data for two months follow:
June JulyUnits produced . . . . . . . . . . . . . . . . . . . . . . . . . . . . . . . . . . . . 18,000 21,000
Factory overhead incurred . . . . . . . . . . . . . . . . . . . . . . . . . $17,300 $20,800
LO8
LO8
LO9
LO8
LO9
430 Principles of Cost Accounting

For each month, make a single journal entry to charge over-
head to Work in Process, to close Factory Overhead, and to
record variances. Indicate the types of variances and state
whether each is favorable or unfavorable. (Hint: You must first
compute the controllable and volume variances.)
E8-17 Calculating amount of factory overhead applied to work in processThe overhead application rate for a company is $2.50 per unit,
made up of $1.00 for fixed overhead and $1.50 for variable
overhead. Normal capacity is 10,000 units. In one month, there
was an unfavorable controllable variance of $200. Actual over-
head for the month was $27,000. What was the amount of the
budgeted overhead for the actual level of production?
E8-18 (Appendix) Calculating factory overhead: four variancesGeorgia Gasket Company budgets 8,000 direct labor hours for
the year. The total overhead budget is expected to amount to
$20,000. The standard cost for a unit of the company’s product
estimates the variable overhead as follows:
Variable factory overhead (3 hours @ $2 per direct labor hour) $6 per unit
The actual data for the period follow:
Actual completed units . . . . . . . . . . . . . . . . . . . . . . . . . . . . . . . . . . . . . . . . . . . 2,500
Actual direct labor hours . . . . . . . . . . . . . . . . . . . . . . . . . . . . . . . . . . . . . . . . . 7,640
Actual variable overhead . . . . . . . . . . . . . . . . . . . . . . . . . . . . . . . . . . . . . . . . . $16,100
Actual fixed overhead . . . . . . . . . . . . . . . . . . . . . . . . . . . . . . . . . . . . . . . . . . . . 3,920
Using the four-variance method, calculate the overhead var-
iances. (Hint: First compute the budgeted fixed overhead rate.)
E8-19 (Appendix) Calculating factory overhead: three variancesUsing the data shown in E8-15, calculate the following overhead
variances:
a. Budget variance.
b. Capacity variance.
c. Efficiency variance.
d. Was the factory overhead under- or overapplied? By what
amount?
PROBLEMS
In all problems involving variances, use ‘‘F’’ and ‘‘U’’ to indicate
favorable and unfavorable variances, respectively.
P8-1 Materials and labor variances
Ichiro Inspections, Inc., specializes in determining whether a
building or house’s drain pipes are properly tied into the city’s
sewer system. The company pours colored chemical through the
LO8
LO9
LO10
LO11
LO3
Chapter 8 – Standard Cost Accounting—Materials, Labor, and Factory Overhead 431

pipes and collects an inspection sample from each outlet, which
is then analyzed. Each job should take 15 hours for each of four
inspectors, who are paid $18 per hour. Each job uses 5 gallons of
Brite (a colored chemical), which should cost $25 per gallon.
Data from the company’s most recent job (a building) follow:
5 men worked a total of 80 hours and were paid $17.50 per hour . . . $1,400.00
5.5 gallons of Brite were used and cost $27.50 per gallon . . . . . . . . . . 151.25
Total cost of the job . . . . . . . . . . . . . . . . . . . . . . . . . . . . . . . . . . . . . . . . . . . $1,551.25
Required:
Compute the following variances, using the formulas on page 386:
1. Materials price and quantity variances.
2. Labor rate and efficiency variances.
P8-2 Materials and labor variances
Folsom Fabricators, Inc., uses a standard cost system to account
for its single product. The standards established for the product
include the following:
Materials . . . . . . . . . . . . . . . . . . . . . . . . . . . . . . . . . . . . . . . . . . . . . . 8 lb @ $0.50 per lb
Labor . . . . . . . . . . . . . . . . . . . . . . . . . . . . . . . . . . . . . . . . . . . . . . . . . . 6 hr @ $8.00 per hr
The following operating data came from the records for the month:
In process, beginning inventory, none.
In process, ending inventory, 800 units, 80% complete as to
labor; material is issued at the beginning of processing.
Completed during the month, 5,600 units.
Materials issued to production were 51,680 pounds @ $0.55 per
pound.
Direct labor was $304,000 at the rate of $7.60 per hour.
Required:
Calculate the following variances, using the diagram format in
Figure 8-4.
1. Materials price.
2. Materials quantity.
3. Net materials variance.
4. Labor rate.
5. Labor efficiency.
6. Net labor variance.
(Hint: Before determining the standard quantity for materials and
labor, you must first compute the equivalent units for materials
and labor.)
P8-3 Materials and labor variances analyses
Accelerator, Inc., manufactures a fuel additive, Surge, that has a
stable selling price of $44 per drum. The company has been
producing and selling 80,000 drums per month.
LO3
LO3
432 Principles of Cost Accounting

In connection with your examination of Accelerator’s financial
statements for the year ended September 30, management has
asked you to review some computations made by Accelerator’s
cost accountant. Your working papers disclose the following
about the company’s operations:
Standard costs per drum of product manufactured:
Materials:
8 gallons of chemicals @ $2 . . . . . . . . . . . . . . . . . . . . . . . . . . . . . . . $16
1 empty drum . . . . . . . . . . . . . . . . . . . . . . . . . . . . . . . . . . . . . . . . . . . . 1 $17
Direct labor—1 hour . . . . . . . . . . . . . . . . . . . . . . . . . . . . . . . . . . . . . . . . $ 8
Factory Overhead . . . . . . . . . . . . . . . . . . . . . . . . . . . . . . . . . . . . . . . . . . . $ 6
Costs and expenses during September:
Chemicals: 645,000 gallons purchased at a cost of $1,140,000;
600,000 gallons used.
Empty drums: 94,000 purchased at a cost of $94,000; 80,000
drums used.
Direct labor: 81,000 hours worked at a cost of $654,480.
Factory overhead: $768,000.
Required:
Calculate the following variances for September, using the for-
mulas on page 386:
1. Materials quantity variance.
2. Materials purchase price variance.
3. Labor efficiency variance.
4. Labor rate variance.
P8-4 Calculation of materials and labor variances
Prado Corporation manufactures and sells a single product. The
company uses a standard cost system. The standard cost per
unit of product follows:
Materials—1 lb plastic @ $3.00 . . . . . . . . . . . . . . . . . . . . . . . . . . . . . . . . . . . $ 3.00
Direct labor—1.6 hr @ $10.00 . . . . . . . . . . . . . . . . . . . . . . . . . . . . . . . . . . . . . 16.00
Factory overhead . . . . . . . . . . . . . . . . . . . . . . . . . . . . . . . . . . . . . . . . . . . . . . . . 4.45
Total . . . . . . . . . . . . . . . . . . . . . . . . . . . . . . . . . . . . . . . . . . . . . . . . . . . . . . . . . . . . $23.45
The charges to the manufacturing department for November,
when 5,000 units were produced, follow:
Materials—5,300 lb @ $3.00 . . . . . . . . . . . . . . . . . . . . . . . . . . . . . . . . . . . . . $ 15,900
Direct labor—8,200 hr @ $9.80 . . . . . . . . . . . . . . . . . . . . . . . . . . . . . . . . . . 80,360
Factory overhead . . . . . . . . . . . . . . . . . . . . . . . . . . . . . . . . . . . . . . . . . . . . . . . 23,815
Total . . . . . . . . . . . . . . . . . . . . . . . . . . . . . . . . . . . . . . . . . . . . . . . . . . . . . . . . . . . $120,075
The purchasing department normally buys about the same
quantity as is used in production during a month. In November,
5,500 pounds were purchased at a price of $2.90 per pound.
LO3
Chapter 8 – Standard Cost Accounting—Materials, Labor, and Factory Overhead 433

Required:
Calculate the following variances from standard costs for the
data given, using the formulas on pages 386:
1. Materials quantity.
2. Materials purchase price (at time of purchase).
3. Labor efficiency.
4. Labor rate.
P8-5 Analysis of materials and labor variances
Stylized Products, Inc., uses a standard cost system in account-
ing for the cost of production of its only product, Suave. The
standards for the production of one unit of Suave follow:
Direct materials: 10 feet of Class at $0.75 per foot and 3 feet of
Chic at $1.00 per foot.
Direct labor: 4 hours at $8.00 per hour.
Factory overhead: applied at 150% of standard direct labor costs.
There was no beginning inventory on hand at July 1. Following
is a summary of costs and related data for the production of
Suave during the following year ended June 30:
100,000 feet of Class were purchased at $0.72 per foot.
30,000 feet of Chic were purchased at $1.05 per foot.
8,000 units of Suave were produced that required 78,000 feet of
Class; 26,000 feet of Chic; and 31,000 hours of direct labor at
$7.80 per hour.
6,000 units of product Suave were sold.
On June 30, there are 22,000 feet of Class, 4,000 feet of Chic, and
2,000 completed units of Suave on hand. All purchases and
transfers are ‘‘charged in’’ at standard.
Required:
Calculate the following, using the formulas on page 386:
1. Materials quantity variance for Class.
2. Materials quantity variance for Chic.
3. Materials purchase price variance for Class.
4. Materials purchase price variance for Chic.
5. Labor efficiency variance.
6. Labor rate variance.
P8-6 Analysis of materials and labor variances
TBA Products Company manufactures a variety of products made of
plastic and aluminum components. During the winter months, sub-
stantially all of the production capacity is devoted to the production
of lawn sprinklers for the following spring and summer seasons.
Other products are manufactured during the remainder of the year.
The company has developed standard costs for its several
products. Standard costs for each year are set in the preceding
October. The standard cost of a sprinkler for the current year is
$3.70, computed as follows:
Direct materials:
Aluminum—0.2 lb @ $0.40 per lb . . . . . . . . . . . . . . . . . . . . . . . . . . . . . . . . $0.08
Plastic—1.0 lb @ $0.38 per lb . . . . . . . . . . . . . . . . . . . . . . . . . . . . . . . . . . . . 0.38
LO3
LO3
434 Principles of Cost Accounting

Production labor—0.3 hr @ $8.00 per hr . . . . . . . . . . . . . . . . . . . . . . . . . . . . 2.40
Factory overhead . . . . . . . . . . . . . . . . . . . . . . . . . . . . . . . . . . . . . . . . . . . . . . . . . 0.84
Total . . . . . . . . . . . . . . . . . . . . . . . . . . . . . . . . . . . . . . . . . . . . . . . . . . . . . . . . . . . . . $3.70
During February, TBA Products manufactured 8,500 good sprink-
lers. The company incurred the following costs, which it charged
to production:
Materials requisitioned for production:
Aluminum—1,900 lb @ $0.40 per lb . . . . . . . . . . . . . . . . . . . . . . . . . . . . $ 760
Plastic—Regular grade—6,000 lb @ $0.38 per lb . . . . . . . . . . . . . . . . 2,280
Low grade—3,500 lb @ $0.38 per lb . . . . . . . . . . . . . . . . . . . . . . . . . . 1,330
Production labor—2,700 hr @ $8.60 per hr . . . . . . . . . . . . . . . . . . . . . . . 23,220
Factory overhead . . . . . . . . . . . . . . . . . . . . . . . . . . . . . . . . . . . . . . . . . . . . . . . 7,140
Costs charged to production . . . . . . . . . . . . . . . . . . . . . . . . . . . . . . . . . . $34,730
Materials price variations are not determined by usage but are
charged to a materials price variation account at the time the
invoice is entered. All materials are carried in inventory at
standard prices. Materials purchases for February were as
follows:
Aluminum—1,800 lb @ $0.48 per lb . . . . . . . . . . . . . . . . . . . . . . . . . . . . . . . $ 864
Plastic—Regular grade—3,000 lb @ $0.50 per lb . . . . . . . . . . . . . . . . . . . 1,500
Low grade*—6,000 lb @ $0.29 per lb . . . . . . . . . . . . . . . . . . . . . . . . . . . . 1,740
*Due to plastic shortages, the company was forced to purchase lower gradeplastic than called for in the standards. This increased the number of sprinklersrejected on inspection.
Required:
Calculate price and usage variances for each type of material
and for labor, using the formulas on page 386.
P8-7 Materials and labor variance analysessimilar to Self-Study Problem 1
The standard cost summary for the most popular product of
Phase-Five Products Company is shown as follows, together
with production and cost data for the period.
Standard Cost SummaryMaterials:
2 gallons of liquid lead @ $2.00 . . . . . . . . . . . . . . . . . . . . . . . . . . . . . $4.00
2 gallons of varnish @ $3.00 . . . . . . . . . . . . . . . . . . . . . . . . . . . . . . . . 6.00 $10.00
Labor:
1 hour @ $12.00 . . . . . . . . . . . . . . . . . . . . . . . . . . . . . . . . . . . . . . . . . . . 12.00
Factory overhead:
$1.00 per direct labor hour . . . . . . . . . . . . . . . . . . . . . . . . . . . . . . . . . . 1.00
Total standard unit cost . . . . . . . . . . . . . . . . . . . . . . . . . . . . . . . . . . . . . . $23.00
LO3
LO5
Chapter 8 – Standard Cost Accounting—Materials, Labor, and Factory Overhead 435

Production and Cost SummaryUnits completed during the month . . . . . . . . . . . . . . . . . . . . . . . . . . . . . . . 9,000
Ending units in process (one-fourth completed) . . . . . . . . . . . . . . . . . . 2,000
Gallons of liquid lead used . . . . . . . . . . . . . . . . . . . . . . . . . . . . . . . . . . . . . . 21,000
Gallons of varnish used . . . . . . . . . . . . . . . . . . . . . . . . . . . . . . . . . . . . . . . . . 20,000
Direct labor hours worked . . . . . . . . . . . . . . . . . . . . . . . . . . . . . . . . . . . . . . . 10,000
Cost of liquid lead used . . . . . . . . . . . . . . . . . . . . . . . . . . . . . . . . . . . . . . . . . $ 41,160
Cost of varnish used . . . . . . . . . . . . . . . . . . . . . . . . . . . . . . . . . . . . . . . . . . . . $ 60,000
Cost of direct labor . . . . . . . . . . . . . . . . . . . . . . . . . . . . . . . . . . . . . . . . . . . . . $117,000
One gallon each of liquid lead and varnish are added at the start
of processing. The balance of the materials is added when the
process is two-thirds complete. Labor and overhead are added
evenly throughout the process.
Required:
1. Calculate equivalent production. (Be sure to refer to the
standard cost summary to help determine the percentage of
materials in ending work in process.)
2. Calculate materials and labor variances and indicate whether
they are favorable or unfavorable, using the diagram format
shown in Figure 8-4.
3. Determine the cost of materials and labor in the work in
process account at the end of the month.
4. Prove that all materials and labor costs have been accounted
for. (Hint: Don’t forget the net variances in reconciling the
costs accounted for with the costs to be accounted for.)
P8-8 Journal entries for materials and labor variances
Suzy-Q Corporation has established the following standard cost
per unit:
Materials—5.5 lb @ $2.20 per lb . . . . . . . . . . . . . . . . . . . . . . . . . . . . . . . . . . $12.10
Labor—1.8 hr @ $6.25 per hr . . . . . . . . . . . . . . . . . . . . . . . . . . . . . . . . . . . . . 11.25
Although 10,000 units were budgeted, only 8,800 units were
produced.
The purchasing department bought 55,000 pounds of materi-
als at a cost of $123,750. Actual pounds of materials used were
54,305. Direct labor cost was $127,400 for 18,200 hours worked.
Required:
1. Make journal entries to record the materials transactions,
assuming that the materials price variance was recorded at
the time of purchase.
2. Make journal entries to record the labor variances.
P8-9 Allocation of variances
Newport Beach Manufacturing Corporation uses a standard cost
system that records raw materials at actual cost, records materials
price variances at the time that raw materials are issued to work
LO4
LO4
LO5
436 Principles of Cost Accounting

in process, and prorates all variances at year-end. Variances
associated with direct materials are prorated based on the direct
materials balances in the appropriate accounts, and variances
associated with direct labor are prorated based on the direct labor
balances in the appropriate accounts. The following information
is available for Newport Beach for the year ended December 31:
Raw materials inventory at December 31 . . . . . . . . . . . . . . . . . . . . . . . . . $ 65,000
Finished goods inventory at December 31:
Direct materials . . . . . . . . . . . . . . . . . . . . . . . . . . . . . . . . . . . . . . . . . . . . . . 87,000
Direct labor . . . . . . . . . . . . . . . . . . . . . . . . . . . . . . . . . . . . . . . . . . . . . . . . . . 130,500
Applied factory overhead . . . . . . . . . . . . . . . . . . . . . . . . . . . . . . . . . . . . . 104,400
Cost of goods sold for the year ended December 31:
Direct materials . . . . . . . . . . . . . . . . . . . . . . . . . . . . . . . . . . . . . . . . . . . . . . 348,000
Direct labor . . . . . . . . . . . . . . . . . . . . . . . . . . . . . . . . . . . . . . . . . . . . . . . . . . 739,500
Applied factory overhead . . . . . . . . . . . . . . . . . . . . . . . . . . . . . . . . . . . . . 591,600
Materials quantity variance (favorable) . . . . . . . . . . . . . . . . . . . . . . . . . . . 15,000
Materials price variance (unfavorable) . . . . . . . . . . . . . . . . . . . . . . . . . . . 10,000
Labor efficiency variance (favorable) . . . . . . . . . . . . . . . . . . . . . . . . . . . . . 5,000
Labor rate variance (unfavorable) . . . . . . . . . . . . . . . . . . . . . . . . . . . . . . . . 20,000
Factory overhead applied . . . . . . . . . . . . . . . . . . . . . . . . . . . . . . . . . . . . . . . 696,000
There were no beginning inventories and no ending work in
process inventory.
Required:
Calculate the following:
1. Amount of materials price variance to be prorated to finished
goods inventory at December 31. (Hint: You must first deter-
mine the ratio of direct materials cost in the ending finished
goods inventory.)
2. Total amount of direct materials cost in the finished goods
inventory at December 31, after all variances have been
prorated.
3. Total amount of direct labor cost in the finished goods inven-
tory at December 31, after all variances have been prorated.
4. Total cost of goods sold for the year ended December 31,
after all variances have been prorated.
P8-10 Analyses; review of chapter
On May 1, Maximus Company began the manufacture of a new
mechanical device known as Caesar. The company installed a
standard cost system in accounting for manufacturing costs. The
standard costs for a unit of Caesar follow:
Raw materials (5 lb @ $1 per lb) . . . . . . . . . . . . . . . . . . . . . . . . . . . . . . . . . . . . $ 5
Direct labor (1 hr @ $8 per hr) . . . . . . . . . . . . . . . . . . . . . . . . . . . . . . . . . . . . . . 8
Overhead (50% of direct labor costs) . . . . . . . . . . . . . . . . . . . . . . . . . . . . . . . 4
$17
LO2
LO3
LO8
Chapter 8 – Standard Cost Accounting—Materials, Labor, and Factory Overhead 437

The following data came from Maximus’s records for the month
of May:
UnitsActual production . . . . . . . . . . . . . . . . . . . . . . . . . . . . . . . . . . . . . . . . . . . . . . . . 4,000
Units sold . . . . . . . . . . . . . . . . . . . . . . . . . . . . . . . . . . . . . . . . . . . . . . . . . . . . . . . 2,500
Debit CreditSales . . . . . . . . . . . . . . . . . . . . . . . . . . . . . . . . . . . . . . . . . . . . . . . . . . . . $50,000
Purchases (22,000 pounds) . . . . . . . . . . . . . . . . . . . . . . . . . . . . . . . $23,300
Materials price variance . . . . . . . . . . . . . . . . . . . . . . . . . . . . . . . . . . 1,300
Materials quantity variance . . . . . . . . . . . . . . . . . . . . . . . . . . . . . . . 1,000
Direct labor rate variance . . . . . . . . . . . . . . . . . . . . . . . . . . . . . . . . . 770
Direct labor efficiency variance . . . . . . . . . . . . . . . . . . . . . . . . . . . . 1,200
Manufacturing overhead total variance . . . . . . . . . . . . . . . . . . . . 500
The amount shown above for the materials price variance is
applicable to raw materials purchased during May.
Required:
Compute each of the following items for Maximus for the month
of May. Show computations in good form.
1. Standard quantity of raw materials allowed (in pounds) for
actual production.
2. Actual quantity of raw materials used (in pounds). (Hint: Be
sure to consider the materials quantity variance.)
3. Standard direct labor hours allowed.
4. Actual direct labor hours worked.
5. Actual direct labor rate. (Hint: Be sure to consider the direct
labor rate variance.)
6. Actual total overhead.
P8-11 Two-variance overhead analysis
The standard specifications for an electric motor manufactured
by B&B Electric Corporation follow:
Standard cost per unit:
Materials (2 lb � $5 per lb) . . . . . . . . . . . . . . . . . . . . . . . . . . . . . . . . . . . . $10.00
Labor (4 hr � $6 per hr) . . . . . . . . . . . . . . . . . . . . . . . . . . . . . . . . . . . . . . . 24.00
Factory overhead (4 hr � $3.38* per hr) . . . . . . . . . . . . . . . . . . . . . . . . 13.52
Total standard cost . . . . . . . . . . . . . . . . . . . . . . . . . . . . . . . . . . . . . . . . . $47.52
*$1.00 variable þ $2.38 fixed ¼ $3.38
Factory overhead rates are based on a normal 70% capacity and
use the following flexible budget:
Normal
70% 85% 100%Motors to be produced . . . . . . . . 2,100 2,550 3,000
Variable overhead . . . . . . . . . . . . $ 8,400 $10,200 $12,000
Fixed overhead . . . . . . . . . . . . . . . $20,000 $20,000 $20,000
LO8
LO9
438 Principles of Cost Accounting

The actual production was 2,500 motors, and factory overhead
costs totaled $29,750.
Required:
Calculate the factory overhead variances using the two-variance
method.
P8-12 Journal entries; variance analysis; other analyses; review ofchapter
Cost and production data for Gigante Products Company follow:
Standard Cost Sheet (Normal capacity—1,000 units)
Mixing Blending TotalMaterials:
I—2 lb @ $2 per lb . . . . . . . . . . . . . . . . . . . . . . . $ 4
II—2 lb @ $1 per lb . . . . . . . . . . . . . . . . . . . . . . . $ 2 $ 6
Labor:
2 hr @ $5 per hr . . . . . . . . . . . . . . . . . . . . . . . . . . 10
1 hr @ $6 per hr . . . . . . . . . . . . . . . . . . . . . . . . . . 6 16
Factory overhead (per standard labor hour):
Fixed Variable
$2 $1 (2 hr per unit) . . . . . . . . . . . . . . . . . . 6
1 3 (1 hr per unit) . . . . . . . . . . . . . . . . . . 4 10
Total . . . . . . . . . . . . . . . . . . . . . . . . . . . . . . . . . . . . . . . . . . . . . . . . . . . . . . . . . . . . . . . . $20 $12 $32
Production Report
Mixing BlendingBeginning units in process . . . . . . . . . . . . None None
Units finished and transferred . . . . . . . . . 1,000 900
Ending units in process . . . . . . . . . . . . . . . 200 100
Stage of completion . . . . . . . . . . . . . . . . . . 1/2 1/2
Actual Cost Data
Mixing BlendingDirect materials used:
I—2,300 lb . . . . . . . . . . . . . . . . . . . . $4,715
II—1,850 lb . . . . . . . . . . . . . . . . . . . . $1,813
Direct labor:
2,150 hr . . . . . . . . . . . . . . . . . . . . . . . 10,965
1,000 hr . . . . . . . . . . . . . . . . . . . . . . . 5,900
Factory overhead:
Indirect materials . . . . . . . . . . . . . . $1,000 $ 500
Indirect labor . . . . . . . . . . . . . . . . . . 1,300 1,000
Other (fixed costs) . . . . . . . . . . . . . 4,400 6,700 2,250 3,750
Total . . . . . . . . . . . . . . . . . . . . . . . . . . . . $22,380 $11,463
LO8
LO9
Chapter 8 – Standard Cost Accounting—Materials, Labor, and Factory Overhead 439

During the month, 850 units were sold at $60 each.
Note: Materials, labor, and overhead are added evenly through-
out the process.
Required:
1. Make general journal entries to record all transactions and
variances. Use the two-variance method for overhead var-
iance analysis. (Hint: You must first compute equivalent units
and the variances for materials, labor, and factory overhead.)
2. Prove the ending balances of Work in Process in both
departments.
3. Prove that all costs have been accounted for. (Hint: Remember
to include the variances in the ‘‘Costs accounted for’’ section.)
P8-13 Variance analysis
Poway Shirts, Inc., manufactures men’s sport shirts for large
stores. Folsom produces a single quality shirt in lots of a dozen
according to each customer’s order and attaches the store’s
label. The standard costs for a dozen shirts include the following:
Direct materials . . . . . . . . . . . . . . . . . . . . . . . . . . . . 24 yards @ $0.55 $13.20
Direct labor . . . . . . . . . . . . . . . . . . . . . . . . . . . . . . . . 3 hours @ $7.35 22.05
Factory overhead . . . . . . . . . . . . . . . . . . . . . . . . . . 3 hours @ $2.00 6.00
Standard cost per dozen . . . . . . . . . . . . . . . . . . $41.25
During October, Poway worked on three orders for shirts. Job
cost records for the month disclose the following:
Lot Units in LotMaterials
UsedHours
Worked30 1,000 dozen 24,100 yards 2,980
31 1,700 dozen 40,440 yards 5,130
32 1,200 dozen 28,825 yards 2,890
The following information is also available:
a. Poway purchased 95,000 yards of materials during October
at a cost of $53,200. The materials price variance is recorded
when goods are purchased, and all inventories are carried at
standard cost.
b. Direct labor incurred amounted to $81,400 during October.
According to payroll records, production employees were
paid $7.40 per hour.
c. Overhead is applied on the basis of direct labor hours. Factory
overhead totaling $22,800 was incurred during October.
d. A total of $288,000 was budgeted for overhead for the year,
based on estimated production at the plant’s normal capacity
of 48,000 dozen shirts per year. Overhead is 60% fixed and
40% variable at this level of production.
e. There was no work in process at October 1. During October,
Lots 30 and 31 were completed, and all materials were
issued for Lot 32, which was 80% completed as to labor and
overhead.
LO5
LO9
440 Principles of Cost Accounting

Required:
1. Prepare a schedule computing the October standard cost of
Lots 30, 31, and 32.
2. Prepare a schedule computing the materials price variance for
October and indicate whether it is favorable or unfavorable.
3. For each lot produced during October, prepare schedules com-
puting the following (indicate whether favorable or unfavorable):
a. Materials quantity variance in yards.
b. Labor efficiency variance in hours. (Hint: Don’t forget the
percentage of completion.)
c. Labor rate variance in dollars.
4. Prepare a schedule computing the total controllable and
volume overhead variances for October and indicate whether
they are favorable or unfavorable.
P8-14 Materials, labor, and overhead variances—two-variance method
Fargo Company manufactures products in batches of 100 units
per batch. The company uses a standard cost system and
prepares budgets that call for 500 of these batches per period.
Fixed overhead is $60,000 per period. The standard costs per
batch follow:
Material (80 gallons) . . . . . . . . . . . . . . . . . . . . . . . . . . . . . . . . . . . . . . . . . . . . . . . $ 32
Labor (60 hours) . . . . . . . . . . . . . . . . . . . . . . . . . . . . . . . . . . . . . . . . . . . . . . . . . . 480
Factory overhead . . . . . . . . . . . . . . . . . . . . . . . . . . . . . . . . . . . . . . . . . . . . . . . . . 252
Standard cost per batch . . . . . . . . . . . . . . . . . . . . . . . . . . . . . . . . . . . . . . . . . . . $764
During the period, 503 batches were manufactured, and the
following costs were incurred:
Materials used (40,743 gallons) . . . . . . . . . . . . . . . . . . . . . . . . . . . . . . . . . $ 15,482.34
Labor (29,677 hours at $8.65 per hour) . . . . . . . . . . . . . . . . . . . . . . . . . . 256,706.05
Actual variable overhead . . . . . . . . . . . . . . . . . . . . . . . . . . . . . . . . . . . . . . 67,080.00
Actual fixed overhead . . . . . . . . . . . . . . . . . . . . . . . . . . . . . . . . . . . . . . . . . 60,500.00
Required:
Calculate the variances for materials, labor, and overhead. For
overhead, use the two-variance method.
P8-15 (Appendix) All variances; four variances for factory overhead
Metropolis Manufacturing Company manufactures a small elec-
tric motor that is a replacement part for the more popular gas
furnaces. The standard cost card shows the product require-
ments as follows:
Direct materials—2 lb @ $4 per lb . . . . . . . . . . . . . . . . . . . . . . . . . . . . . . . . . $ 8.00
Direct labor—5 hr @ $8 per hr . . . . . . . . . . . . . . . . . . . . . . . . . . . . . . . . . . . . 40.00
Factory overhead:
Variable cost—5 hr @ $2 per hr . . . . . . . . . . . . . . . . . . . . . . . . . . . . . . . . . 10.00
Fixed cost—5 hr @ $4 per hr . . . . . . . . . . . . . . . . . . . . . . . . . . . . . . . . . . . . 20.00
Total standard cost per unit . . . . . . . . . . . . . . . . . . . . . . . . . . . . . . . . . . $78.00
LO8
LO9
LO10
Chapter 8 – Standard Cost Accounting—Materials, Labor, and Factory Overhead 441

Factory overhead rates are based on normal 100% capacity and
the following flexible budgets:
Normal
90% 100% 110%Units produced . . . . . . . . . . . . . . . . . . . . 2,500 3,000 3,500
Factory overhead—variable . . . . . . . . . $25,000 $30,000 $35,000
Factory overhead—fixed . . . . . . . . . . . . $60,000 $60,000 $60,000
The company produced 3,500 units, using 18,375 direct labor
hours and incurring the following overhead costs:
Factory overhead—fixed . . . . . . . . . . . . . . . . . . . . . . . . . . . . . . . . . . . . . . . . $61,950
Factory overhead—variable . . . . . . . . . . . . . . . . . . . . . . . . . . . . . . . . . . . . . $33,710
Required:
1. Calculate the factory overhead, spending, efficiency, budget,
and volume variances.
2. Does the net variance represent under- or overapplied factory
overhead?
P8-16 (Appendix) Materials, labor, and overhead variances—four-variance method
K-Rod Corporation uses a standard cost system and manufac-
tures one product. The variable costs per product follow:
Materials (4 parts) . . . . . . . . . . . . . . . . . . . . . . . . . . . . . . . . . . . . . . . . . . . . . . . . . $ 2
Labor (2 hours) . . . . . . . . . . . . . . . . . . . . . . . . . . . . . . . . . . . . . . . . . . . . . . . . . . . . 6
Overhead . . . . . . . . . . . . . . . . . . . . . . . . . . . . . . . . . . . . . . . . . . . . . . . . . . . . . . . . . 3
$11
Budgeted fixed costs for the month are $4,000, and K-Rod
expected to manufacture 2,000 units. Actual production, how-
ever, was only 1,800 units. Materials prices were 10% over
standard, and labor rates were 5% over standard. Of the factory
overhead expense, only 80% was used, and fixed overhead was
$100 over the budgeted amount. The actual variable overhead
cost was $4,800. In materials usage, 8% more parts were used
than were allowed for actual production by the standard, and 6%
more labor hours were used than were allowed.
Required:
1. Calculate the materials and labor variances.
2. Calculate the variances for overhead by the four-variance
method.
P8-17 (Appendix) Labor variances and four-variance overhead analysis
Tech-Elec Manufacturing Company estimates the following labor
and overhead costs for the period:
Variable overhead . . . . . . . . . . . . . . . . . . . . . . . . . . . . . . . . . . . . . . . . . $44,200
Fixed overhead . . . . . . . . . . . . . . . . . . . . . . . . . . . . . . . . . . . . . . . . . . . . 50,050
Total estimated overhead . . . . . . . . . . . . . . . . . . . . . . . . . . . . . . . . $94,250
Estimated direct labor cost . . . . . . . . . . . . . . . . . . . . . . . . . . . . . . . . . $65,000
LO10
LO10
442 Principles of Cost Accounting

Standard direct labor rate per hour . . . . . . . . . . . . . . . . . . . . . . . . . $10
Each unit will require 26 hours of labor.
Estimated production for the period . . . . . . . . . . . . . . . . . . . . . . . . 500 units
Production statistics for the period:
Actual production . . . . . . . . . . . . . . . . . . . . . . . . . . . . . . . . . . . . . . . 510 units
Actual direct labor hours used . . . . . . . . . . . . . . . . . . . . . . . . . . . . 13,015 hours
Actual direct labor cost . . . . . . . . . . . . . . . . . . . . . . . . . . . . . . . . . . $133,400
Actual overhead costs:
Variable costs . . . . . . . . . . . . . . . . . . . . . . . . . . . . . . . . . . . . . . . . . $45,009
Fixed costs . . . . . . . . . . . . . . . . . . . . . . . . . . . . . . . . . . . . . . . . . . . . 50,125
Required:
Use the four-variance method for overhead analysis. Calculate the
variances for direct labor and overhead. Prove that the overhead
variancesequalover-orunderapplied factoryoverheadfor theperiod.
P8-18 (Appendix) Three-variance overhead analysis
Using the data provided in P8-12, calculate the overhead cost
variances under the three-variance method.
P8-19 (Appendix) Variance analysis using the three-variance methodfor overhead costs
Wausau Furniture Company uses a standard cost system in
accounting for its production costs. The standard cost of a unit
of furniture follows:
Lumber, 100 ft @ $150 per 1,000 ft . . . . . . . . . . . . . . . . . . . . . . . . $15.00
Direct labor, 4 hr @ $10 per hr . . . . . . . . . . . . . . . . . . . . . . . . . . . . 40.00
Factory overhead:
Fixed (15% of direct labor) . . . . . . . . . . . . . . . . . . . . . . . . . . . . . . $ 6.00
Variable (30% of direct labor) . . . . . . . . . . . . . . . . . . . . . . . . . . . 12.00 18.00
Total unit cost . . . . . . . . . . . . . . . . . . . . . . . . . . . . . . . . . . . . . . . . . . . . $73.00
The following flexible monthly overhead budget applies:
Direct Labor Hours Estimated Overhead5,200 $21,600
4,800 20,400
4,400 19,200
4,000 (normal capacity) 18,000
3,600 16,800
The actual unit costs for the month of December follow:
Lumber used (110 ft @ $120 per 1,000 ft) . . . . $13.20
Direct labor (4 1/4 hr @ $10.24 per hr) . . . . . . . 43.52
Factory overhead:
Variable costs . . . . . . . . . . . . . . . . . . . . . . . . . . . $7,400
Fixed costs . . . . . . . . . . . . . . . . . . . . . . . . . . . . . . 13,720
$21,120 � 1,200 units 17.60
Total actual unit cost . . . . . . . . . . . . . . . . . . . . . . . $74.32
LO11
LO11
Chapter 8 – Standard Cost Accounting—Materials, Labor, and Factory Overhead 443

Required:
Compute the variances for materials, labor, and factory over-
head, using the three-variance method for overhead costs.
P8-20R Review Problem for Chapters 7 & 8Flexible budgets; two-, three-, and four-variance methods offactory overhead analysissimilar to Self-Study Problem 2
Madden Manufacturing, Inc., manufactures a single product and
uses a standard cost system. The factory overhead is applied on
the basis of direct labor hours. A condensed version of the
company’s flexible budget follows:
Direct labor hours . . . . . . . . . . . . . . . . . . 5,000 6,250 10,000
Factory overhead costs:
Variable costs . . . . . . . . . . . . . . . . . . . . $10,000 $12,500 $20,000
Fixed costs . . . . . . . . . . . . . . . . . . . . . . 50,000 50,000 50,000
Total . . . . . . . . . . . . . . . . . . . . . . . . . . . . $60,000 $62,500 $70,000
The product requires 3 pounds of materials at a standard cost of
$5 per pound and 2 hours of direct labor at a standard cost of
$10 per hour.
For the current year, the company planned to operate at the
level of 6,250 direct labor hours and to produce 3,125 units of
product. Actual production and costs for the year follow:
Number of units produced . . . . . . . . . . . . . . . . . . . . . . . . . . . . . . . . . . . . . . 3,500
Actual direct labor hours worked . . . . . . . . . . . . . . . . . . . . . . . . . . . . . . . . 7,000
Actual variable overhead costs incurred . . . . . . . . . . . . . . . . . . . . . . . . . . $14,000
Actual fixed overhead costs incurred . . . . . . . . . . . . . . . . . . . . . . . . . . . . $52,000
Required:
1. For the current year, compute the factory overhead rate that
will be used for production. Show the variable and fixed
components that make up the total predetermined rate to be
used.
2. Prepare a standard cost card for the product. Show the
individual elements of the overhead rate as well as the total
rate.
3. Compute (a) standard hours allowed for production and (b)
under- or overapplied factory overhead for the year.
4. Determine the reason for any under- or overapplied factory
overhead for the year by computing all variances, using each
of the following methods:
a. Two-variance method
b. Three-variance method (appendix)
c. Four-variance method (appendix)
LO9
LO10
LO11
444 Principles of Cost Accounting

MINI-CASE
Biloxi Beverages, Inc.
Variance analysis; journal entries; other analyses for multiple
departments
Cost and production data for Biloxi Beverages, Inc., are presented as follows.
Standard Cost Summary
Mixing Blending TotalMaterials:
4 lb @ $0.50 . . . . . . . . . . . . . . . . . . . $ 2
1 gal @ $1.00 . . . . . . . . . . . . . . . . . . $ 1 $ 3
Labor:
1 hr @ $8.00 . . . . . . . . . . . . . . . . . . . 8
1 hr @ $10.00 . . . . . . . . . . . . . . . . . 10 18
Factory overhead:
Per unit . . . . . . . . . . . . . . . . . . . . . . . 1 2 3
$11 $13 $24
Production Report
Mixing BlendingBeginning units in process . . . . . . . . . . None None
Units finished and transferred . . . . . . 6,000 5,000
Ending units in process . . . . . . . . . . . . . 2,000 1,000
Stage of completion . . . . . . . . . . . . . . . . 1/2 1/2
Cost Data
Mixing BlendingDirect materials:
30,000 lb @ $0.52 . . . $15,600
5,500 gal @ $0.95 . . . $ 5,225
Direct labor:
6,800 hr @ $8.00 . . . . 54,400
5,600 hr @ $10.20 . . . 57,120
Factory overhead:
Indirect materials . . . $ 500 $1,000
Indirect labor . . . . . . . 2,000 5,000
Other . . . . . . . . . . . . . . . 4,500 7,000 5,000 11,000
$77,000 $ 73,345
Chapter 8 – Standard Cost Accounting—Materials, Labor, and Factory Overhead 445

Required:
1. Calculate net variances for materials, labor, and factory overhead.
2. a. Calculate specific materials and labor variances by department,
using the diagram format in Figure 8-4.
b. Comment on the possible causes for each of the variances that
you computed.
3. Make all journal entries to record production costs in Work in Process
and Finished Goods.
4. Prove balances of Work in Process for both departments.
5. Prove that all costs have been accounted for. Note: Assume that
materials, labor, and overhead are added evenly throughout the
process.
6. Assume that 4,000 units were sold at $40 each.
a. Calculate the gross margin based on standard cost.
b. Calculate the gross margin based on actual cost.
c. Why does the gross margin at actual cost differ from the gross
margin at standard cost.
7. As the plant controller, you present the variance report in Item 1 above
to Pat Crowley, the plant manager. After reading it, Pat states: ‘‘If we
present this performance report to corporate with that large unfavor-
able labor variance in Blending, nobody in the plant will receive a
bonus. Those standard hours of 5,500 are way too tight for this
production process. Fifty-eight hundred hours would be more reason-
able, and that would result in a favorable labor efficiency variance that
would more than offset the unfavorable labor rate variance. Please
redo the variance calculations using 5,800 hours as the standard.’’ You
object, but Pat ends the conversation with ‘‘That is an order.’’
a. What standards of ethical professional practice would be violated
if you adhered to Pat’s order?
b. How would you attempt to resolve this ethical conflict?
INTERNET EXERCISE
McDonald’s Corporation Uses a Standard Cost System
This includes standards for such items as food, labor, and paper products.
Given the level of sales volume achieved, the actual costs incurred are
compared to the standard costs that should have been achieved for each
cost item. Go to the text Web site at www.cengage.com/accounting/
vanderbeck and click on the link to McDonald’s Web site. Then click on the
2008 Consolidated Statement of Income. Assuming that the 2007 operat-
ing results were used in setting standards for 2008, what cost items do you
expect had favorable or unfavorable variances in 2008? (Hint: Compare
‘‘Food and paper,’’ ‘‘Payroll and employee benefits,’’ and ‘‘Occupancy and
other operating expenses’’ to ‘‘Sales by Company-operated restaurants,’’
and compare ‘‘Selling, general, and administrative expenses’’ to ‘‘Total
revenues’’ for both 2007 and 2008 in making your determinations.)
446 Principles of Cost Accounting

CHAPTER 9
Cost Account ing for Serv iceBus inesses and the Balanced
Scorecard
‘‘The long-term shift from goods-producing to service-producing
employment is expected to continue. Service-producing indus-
tries are expected to account for approximately 15.7 million new
wages and salary jobs generated over the 2006–2016 period,
while goods-producing industries will see overall job loss.’’—
Tomorrow’s Jobs, Occupational Outlook Handbook, 2008–2009
Edition.
A service is an intangible benefit, such as consulting, designing,grooming, transporting, and entertaining. It does not have physicalproperties and is consumed at the time that it is provided. It cannot
be saved or stored and, therefore, is not inventoried. Examples of servicebusinesses include accounting firms, airlines, hair stylists, video game arcades,professional sports teams, and hotels. Note that some service businesses havean associated raw material or product. While a restaurant, for example, is inthe business of serving food, the food itself has tangible properties.
The main features of service businesses are that they have little or noinventory and that labor costs represent a large percentage of total costs.Even a restaurant would not keep most food items for more than a day ortwo, and labor costs often comprise three-fourths or more of the total costs.Service businesses are important because, as of June 2009, they employedroughly 85% of U.S. nonfarm workers and, as explained in the chapterintroduction, that percentage is expected to grow.1 The lack of growth in
Learning Objectives
After studying this
chapter, you should
be able to:
LO1Perform job
order costing
for service businesses.
LO2Prepare bud-
gets for ser-
vice businesses.
LO3Apply activity-
based costing
for a service firm.
LO4Compare the
results of cost
allocations using sim-
plified costing versus
activity-based costing.
LO5Prepare a bal-
anced score-
card for various
business entities.
1 Bureau of Labor Statistics, Economic News Release, Table B-1, Employment inNonfarm Payrolls by Industry Sector, www.bls.gov (visited 7/27/2009).

manufacturing employment is due primarily to inexpensive imports and tothe automation of U.S. factories. Automated production processes haveresulted in the manufacturing of many more goods with fewer workers,thus creating a need for more people to market, distribute, and service theseadditional products.
Historically, cost accountants spent most of their time developingproduct costs for manufactured goods and spent little time on costingservices. Given the importance of services in our modern economy, therelated cost issues can no longer be ignored. Knowing the cost of providingservices is important to managers for such purposes as contract bidding anddeciding what services to emphasize or deemphasize in their line ofofferings. Be aware, however, that even services are being outsourced toother countries, such as India and China, that can provide them morecheaply. Information technology and customer service work are the mostcommonly outsourced service activities by U.S. companies.
Job Order Costing for Service BusinessesThe amount and complexity of services provided can vary substantiallyfrom customer to customer. When this is the case, a service firm should usejob order costing, just as the manufacturers of differentiated products usesuch a system. Examples of service firms using job order costing includeaccounting firms whose cost of an audit would depend on the size andcomplexity of a client’s operations and auto repairers whose charges arebased on the parts, supplies, and labor time needed on each job. Forexample, when the international accounting firm Pricewaterhouse-Coopers (PwC) wants to know how much it costs the firm to auditExxonMobil, the hours worked by the accounting professionals can betraced directly to the ExxonMobil audit. Other expenses such as deprecia-tion on the auditors’ laptops, secretarial wages, and recruiting expensesincurred to hire new accountants are expenses incurred to service all clients,including ExxonMobil, but are not easily traceable to specific clients. PwC,therefore, must use an allocation base, such as direct labor hours or directlabor dollars, to allocate to each client its fair share of these indirect costs.
Job Cost Sheet for a Service Business
The basic document used to accumulate costs for a service business usingjob order costing is the job order cost sheet, which was also used in ourmanufacturing examples. Figure 9-1 is a job cost sheet used by an account-ing firm for the audit of an automotive group with dealerships in a three-statearea. Note that the cost per hour of partner, manager, and staff time includesboth their compensation per hour and a share of the firm’s overhead. Assumethat a partner earns $100 per hour and it has been determined that forevery $1 spent on direct labor (partner, manager, and staff time), the firmwill spend $1.50 for overhead, such as secretarial support, fringe benefits,depreciation on computers, rent, and utilities. Because direct labor cost isthe single largest cost to the firm and the need for these direct laborers
LO1Perform job
order costing
for service businesses.
448 Principles of Cost Accounting

results in all the other costs the firm incurs, the amount of direct labor costincurred on a job determines how much overhead will be charged to it. Forexample, the charge of $250 for each hour of partner time consists of the$100 per hour wage rate and $150 of overhead. Therefore, the overheadrate is 150% ($150/$100) of direct labor cost.
The 150% overhead rate is a predetermined annual rate computed asfollows:
Budgeted Overhead for 2011Secretarial support . . . . . . . . . . . . . . . . . . . . . . . . . . . . . . . . . . . . . $1,500,000
Fringe benefits . . . . . . . . . . . . . . . . . . . . . . . . . . . . . . . . . . . . . . . . 1,250,000
Lease expense . . . . . . . . . . . . . . . . . . . . . . . . . . . . . . . . . . . . . . . . . 500,000
Depreciation—equipment . . . . . . . . . . . . . . . . . . . . . . . . . . . . . . 750,000
Utilities . . . . . . . . . . . . . . . . . . . . . . . . . . . . . . . . . . . . . . . . . . . . . . . . 300,000
Telephone and fax . . . . . . . . . . . . . . . . . . . . . . . . . . . . . . . . . . . . . 150,000
Photocopying . . . . . . . . . . . . . . . . . . . . . . . . . . . . . . . . . . . . . . . . . 50,000
Total . . . . . . . . . . . . . . . . . . . . . . . . . . . . . . . . . . . . . . . . . . . . . . . . $4,500,000
Figure 9-1 Job Cost Sheet for a Service Business
1
2
3
4
5
6
7
8
9
10
11
12
13
14
15
16
17
18
19
20
21
22
23
24
25
26
27
28
29
30
31
32
A B C D
Client Name: Mission Valley Automotive, Inc.
Engagement Type: Audit
Engagement Number: 727
Date Contracted: 12/19/2010
Date Completed: 2/22/2011
Supervising Partner: Stevens
Partners’ Time:
O’Reilly and Stevens
Summary of Engagement Account
HoursPeriod ending Amount
1/31/2011..................................................................................... 10 $2,500
2/28/2011..................................................................................... 8 $2,000Subtotals................................................................................ 18 $4,500
Manager’s Time:
HoursPeriod ending Amount
1/31/2011..................................................................................... 45 $5,625
2/28/2011..................................................................................... 25 3,125Subtotals................................................................................ 70 $8,750
Staff Time:
HoursPeriod ending Amount
1/31/2011..................................................................................... 120 $9,000
2/28/2011..................................................................................... 80 6,000Subtotals................................................................................ 200 $15,000
Other Direct Costs: Period ending
1/31/2011
Total Engagement Costs.................................................
Total
Other
Travel............................................................................................ $2,970 $4,945
Meals............................................................................................
*Includes direct labor plus overhead based on direct labor cost
1,430
Rate
$250*
$250*
Rate
$125*
$125*
Rate
$75*
$75*
Period ending
2/28/2011
$1,975
795 2,225Total Other............................................................................. $4,400 $2,770 $7,170
$35,420
Chapter 9 – Cost Accounting for Service Businesses 449

Budgeted Direct Labor for 2011Partners . . . . . . . . . . . . . . . . . . . . . . . . . . . . . . . . . . . . . . . . . . . . . . . $ 425,000
Managers . . . . . . . . . . . . . . . . . . . . . . . . . . . . . . . . . . . . . . . . . . . . . 775,000
Staff . . . . . . . . . . . . . . . . . . . . . . . . . . . . . . . . . . . . . . . . . . . . . . . . . . 1,800,000
Total . . . . . . . . . . . . . . . . . . . . . . . . . . . . . . . . . . . . . . . . . . . . . . . . $3,000,000
Budgeted overhead rate ¼ Budgeted overhead=Budgeted direct labor¼ $4,500,000/$3,000,000¼ 150%
Choosing the Cost Allocation Base
Note that the firm could have used direct labor hours instead of direct labordollars to charge overhead to jobs. By choosing direct labor cost, the firmdecided that its overhead was more related to the direct labor dollarscharged to a job than to the direct labor hours worked on the job. Thismeans that partners who earn higher wages than managers and staffaccountants create more overhead costs. They have more secretarial helpand nicer offices, and they order more computer studies than managers andstaff accountants. If all three categories of direct labor consumed the sameamount of overhead per hour worked on a job, then direct labor hourswould be the more appropriate basis to use for charging overhead.
Tracing Direct Costs to the JobThere are costs other than direct labor that can be traced to a job. Note thetravel and meal charges appearing in the ‘‘Other Direct Costs’’ category inFigure 9-1. These are expenses that can be specifically identified with a joband do not have to be allocated to the job using an overhead rate. Forexample, the accountants can keep a log of the travel and meal expensesincurred in servicing clients with out-of-town locations.
Cost Performance ReportOnce the job is completed and all of the costs have been charged to it,management can use the information in a number of ways. It can comparethe costs charged to the job with the bid price accepted by the client todetermine the profitability of the job. For example, if the bid price were$48,000 for the job in Figure 9-1, the profit would be computed as follows:
Bid price . . . . . . . . . . . . . . . . . . . . . . . . . . . . $48,000
Costs:
Total labor and overhead . . . . . . . . . . . $28,250
Total other direct costs . . . . . . . . . . . . . 7,170 35,420
Profit . . . . . . . . . . . . . . . . . . . . . . . . . . . . . . . . $12,580
The profit was approximately 26% ($12,580/$48,000) of the bid price,and labor and overhead costs were approximately 80% ($28,250/$35,420)
450 Principles of Cost Accounting

of the total costs. The firm can use such information in bidding on theMission Valley Automotive audit next year, in bidding on audits for similarbusinesses, and in comparing budgeted to actual costs on the audit forpurposes of controlling future costs. Figure 9-2 illustrates a cost perfor-mance report for the Mission Valley Automotive job. It compares thebudgeted costs for the job to the actual costs incurred and indicates thevariance, or difference, for each item.
The actual costs of the job were $2,765 over budget. The partners willwant to determine what caused the job to come in over budget. Was it poorbudgeting that resulted in an unrealistically low cost estimate, or was it aninefficient use of resources on the job? If the budget had been met on thejob, then the profit on the job would have been $15,345 instead of $12,580,and the profit as a percentage of bid price would have been 32% ($15,345 /$48,000) instead of 26%.
Budgeting for Service BusinessesThe estimate of revenue and expenses from the Mission Valley Automotivejob would be part of the budgeted figures appearing in the annualbudget for O’Reilly and Stevens CPAs. The revenue budget, illustrated inFigure 9-3, is the starting point for the annual budget because the amountof client business must be projected before estimating the labor hours andoverhead required. (Note that the billing rates differ from the ratesappearing on the job cost sheet in Figure 9-1, because those cost rates didnot include an element of profit.)
The Revenue Budget
The revenue budget in Figure 9-3 is developed around the three majorservices that the firm provides: audit, consulting, and tax. The professional laborhours to be worked in each area are budgeted based on the firm’s knowledgeof time spent on continuing clients in the past, expected new business,and the expected mix of audit, consulting, and tax work by professional
Figure 9-2 Cost Performance Report
1
2
3
4
5
6
7
8
9
10
11
12
13
14
15
A B C D Mission Valley Automotive, Inc.
Cost Performance Report
Audit of Year Ended 2011
Actual
Item Result Budget Variance
Partners’ salaries and overhead ..................... $ 4,500 $ 3,900 $ 600 U
Managers’ salaries and overhead .................. 8,750 8,500 250 U
Staff accountants’ salaries and overhead ..... 15,000 13,500 1,500 U
Travel ................................................................. 4,945 4,695 250 U
Meals ................................................................. 2,225 2,060 165 U
Total ............................................................... $35,420 $32,655 $2,765 U
U = unfavorable
F = favorable
LO2Prepare
budgets for
service businesses.
Chapter 9 – Cost Accounting for Service Businesses 451

labor category. The billing rates reflect the firm’s best estimate of what itwill charge clients for the various categories of professional labor in thecoming year. The total revenue from all client services is budgeted at$9,987,500.
The Labor BudgetOnce the amount of professional labor hours required to meet clientservices is budgeted, a professional labor budget, as in Figure 9-4, may beprepared. The budgeted hours required in each client service area aremultiplied by the budgeted rate to obtain the wages expense for eachcategory of professional labor.
The wage rates in Figure 9-4 differ from the rates appearing on the jobcost sheet in Figure 9-1. This is because the job cost sheet includes laborand overhead in a single combined rate. For budgeting purposes, we wantto budget separately for professional labor hours and for overhead.
Although we usually think of professional employees, such as accoun-tants, as earning a salary rather than an hourly wage, it is important todevelop an hourly rate for budgeting and billing purposes. For example, the$100 per hour wage rate for a partner was developed as follows:
Hourly rate ¼ Annual salary=Annual billable hours¼ $200,000/2,000 hours¼ $100 per hour
It is very important to budget the professional labor hours needed withcare. If the firm overestimates the number of hours needed, then it will beoverstaffed and the additional labor costs will reduce profits. If the firmunderestimates the number of labor hours needed, then it will be
Figure 9-3 Revenue Budget
1
2
3
4
5
6
7
8
9
10
11
12
13
14
15
16
17
18
19
20
A B C D
Professional Billing Total
Item Hours Rate Revenues
Audit:
Partners ................... 2,000 $300 $ 600,000
Managers ................ 8,000 175 1,400,000
Staff .......................... 30,000 100 3,000,000
Subtotal .................... 40,000 $5,000,000
Consulting:
Partners ................... 750 $300 $ 225,000
Managers ................. 2,500 175 437,500
Staff .......................... 10,000 100 1,000,000
Subtotal .................... 13,250 $ 1,662,500
Tax:
Partners ................... 1,500 $300 $ 450,000
Managers ................. 5,000 175 875,000
Staff .......................... 20,000 100 2,000,000
Subtotal ................... 26,500 $3,325,000
Total .................... 79,750 $ 9,987,500
Schedule 1
Revenue Budget for the Year Ended December 31, 2011
452 Principles of Cost Accounting

understaffed and the lack of enough professionals will cause it to pass upjobs that would increase revenues and profits.
The Overhead BudgetThe firm must next prepare an overhead budget that includes all of theexpense items that cannot be traced directly to jobs and must instead beallocated to them by using an overhead rate. The overhead budget forO’Reilly and Stevens appears in Figure 9-5.
Do not confuse use of the term overhead here with its use in Chapter 4.Chapter 4 illustrated the accounting for manufacturing overhead, whichconsists only of the indirect expenses incurred in the factory. In this
Figure 9-5 Overhead Budget
Schedule 3Overhead Budget for the Year Ended December 31, 2011
Secretarial support . . . . . . . . . . . . . . . . . . . . . . . . . . . . . . . . . . . . . . . . . . . . . . . $1,500,000
Fringe benefits . . . . . . . . . . . . . . . . . . . . . . . . . . . . . . . . . . . . . . . . . . . . . . . . . . . 1,250,000
Lease expense . . . . . . . . . . . . . . . . . . . . . . . . . . . . . . . . . . . . . . . . . . . . . . . . . . . 500,000
Depreciation—equipment . . . . . . . . . . . . . . . . . . . . . . . . . . . . . . . . . . . . . . . . 750,000
Utilities . . . . . . . . . . . . . . . . . . . . . . . . . . . . . . . . . . . . . . . . . . . . . . . . . . . . . . . . . . 300,000
Telephone and fax . . . . . . . . . . . . . . . . . . . . . . . . . . . . . . . . . . . . . . . . . . . . . . . 150,000
Photocopying . . . . . . . . . . . . . . . . . . . . . . . . . . . . . . . . . . . . . . . . . . . . . . . . . . . . 50,000
Total . . . . . . . . . . . . . . . . . . . . . . . . . . . . . . . . . . . . . . . . . . . . . . . . . . . . . . . . . . $4,500,000
Figure 9-4 Professional Labor Budget
Schedule 2
Professional Labor Budget for the Year Ended December 31, 2011
Professional Wage Total
Item Hours Rate Labor Dollars
Audit:
Partners................. 2,000 $100 $ 200,000
Managers .............. 8,000 50 400,000
Staff ....................... 30,000 30 900,000
Subtotal ................. 40,000 $1,500,000
Consulting:
Partners................. 750 $100 $ 75,000
Managers .............. 2,500 50 125,000
Staff ....................... 10,000 30 300,000
Subtotal ................. 13,250 $ 500,000
Tax:
Partners................. 1,500 $100 $ 150,000
Managers .............. 5,000 50 250,000
Staff ....................... 20,000 30 600,000
Subtotal ................. 26,500 $1,000,000
Total ............... 79,750 $3,000,000
1
2
3
4
5
6
7
8
9
10
11
12
13
14
15
16
17
18
19
20
A B C D
Chapter 9 – Cost Accounting for Service Businesses 453

example, the overhead consists of the indirect expenses incurred to support theactivities of a professional services firm. The totals from the professional laborbudget (Figure 9-4) and the overhead budget (Figure 9-5) were used tocompute the overhead rate of 150% ($4,500,000/$3,000,000) of direct labordollars.
The Other Direct Expenses BudgetThe last of the individual budgets for this firm would be the Other DirectExpenses budget, appearing in Figure 9-6, which consists of the directexpenses other than professional labor that can be traced to specific jobs.Recall that $7,170 of these types of expense, $4,945 of travel and $2,225 ofmeals, was traced to the Mission Valley Automotive job.
The Budgeted Income StatementOnce all of the individual budgets have been prepared, the informationthey contain can be used to prepare the budgeted income statement inFigure 9-7. Note the differences between this income statement and theincome statements illustrated earlier for a manufacturer. There is no lineitem for cost of goods sold because the firm sells a service rather than aproduct. All of the operating expenses are charged against income in theperiod incurred because there are no inventory accounts to which they canbe attached. In a manufacturing firm, any expense incurred in the factorywould be allocated to the jobs produced during the period and remain as
Figure 9-6 Other Direct Expenses
Schedule 4Other Direct Expenses for the Year Ended December 31, 2011
Travel . . . . . . . . . . . . . . . . . . . . . . . . . . . . . . . . . . . . . . . . . . . . . . . . . . . . . . . . . . $1,105,000
Meals . . . . . . . . . . . . . . . . . . . . . . . . . . . . . . . . . . . . . . . . . . . . . . . . . . . . . . . . . . 285,000
Total . . . . . . . . . . . . . . . . . . . . . . . . . . . . . . . . . . . . . . . . . . . . . . . . . . . . . . . . . $1,390,000
Figure 9-7 Budgeted Income Statement
Budgeted Income StatementO’Reilly and Stevens CPAs
For the Year Ended December 31, 2011Revenues (Schedule 1) . . . . . . . . . . . . . . . $9,987,500
Operating costs:
Professional labor (Schedule 2) . . . . . $3,000,000
Overhead support (Schedule 3) . . . . . 4,500,000
Other expenses (Schedule 4) . . . . . . . 1,390,000 8,890,000
Operating income . . . . . . . . . . . . . . . . . . . $1,097,500
454 Principles of Cost Accounting

part of the asset accounts (Work in Process and Finished Goods) until thejobs were completed and sold. At that time, they would be charged againstincome as cost of goods sold expense.
The income statement in Figure 9-7 also may be used for planningpurposes in advance of the calendar year. For example, operating income isestimated to be 11% of revenue ($1,097,500/$9,987,500). If the partnersexpect operating income to be at least 15% of revenue, then they shouldreturn to the individual budgets and determine how to increase operatingincome by $400,625 [($9,987,500 � .15) – $1,097,500] through somecombination of increasing budgeted revenues and/or decreasing budgetedcosts. The income statement may also be used for control purposes duringand at the end of the calendar year. By comparing budgeted to actualrevenues and expenses, the partners can determine how well the firm ismeeting expectations and take corrective action where necessary.
Activity-Based Costing in a Service Firm
Kaufman and D’Esti, a law firm, has two categories of professionallabor—partner and associate. It also has two types of indirect costs—legal support and secretarial support. In charging professional laborto jobs, it averages the rates earned by partners and associates, andthen multiplies the average rate by the number of professional hoursworked on a job. Likewise, it divides the total of legal support andsecretarial support by the total professional labor hours worked todetermine the overhead charging rate. Lately, the partners have beenfrustrated because jobs that they thought were competitively bid werelost, and jobs that they overbid in times of peak activity were oftenwon. As an example, a rather high bid to represent BinghamtonIndustries at an accounting fraud trial was accepted, whereas arelatively low bid to draft contracts for Johnson City Mfg. wasrejected. Marc Kaufman, one of the partners, thinks that the strangeresults were related to the firm’s simplified costing system and thefact that a lot of partner labor would be required on the litigation
Recall and Review 1
Mantle and Maris own a professional services firm that has the following
budgeted costs for the year: associates salaries, $500,000; fringe benefits,
$300,000; lease expense, $450,000; partner salaries, $700,000; telephone and
fax, $50,000. The budgeted overhead rate for the year, using direct labor
dollars as the overhead allocation base would be $___________________.
(After working this exercise, see page 468 for the solution.)
You should now be able to work the following:
Questions 1–11; Exercises 9-1 to 9-4; Problems 9-1 to 9-4; Self-Study
Problem 1 (Part 1); and the Internet Exercise.
Chapter 9 – Cost Accounting for Service Businesses 455

work, whereas mostly lower-priced associate labor would be used indrafting the contracts. He also knows that only partners have the useof secretarial services, even though overhead costs are allocated usingall professional labor hours. For the above reasons, Kaufman contractswith Ed Hickey, an activity-based costing consultant, to review thefirm’s job costing system. The mini-case study at the end of thischapter includes the results of Hickey’s findings.
Recall that O’Reilly and Stevens CPAs had only two major categories ofdirect costs—professional labor, and meals and travel—and only a singleoverhead rate was used for indirect costs. In Chapter 4, we introduced theconcept of activity-based costing for a manufacturing firm. In this chapter,those same principles will be applied to a service firm. Activity-based costing(ABC) is not the exclusive property of manufacturers. Examples of ABCpioneers in service industries include Union Pacific (railroads), CharlesSchwab (stock brokerage), and the U.S. Postal Service (government).
Firms that use activity-based costing attempt to shift as many costs aspossible out of the indirect cost pool that has to be allocated to jobs andinto direct cost pools that can be specifically traced to the individual jobsthat caused the costs to occur. The remaining costs that cannot be traced toindividual jobs are separated into homogeneous cost pools and thenallocated to individual jobs by using separate allocation bases for each costpool. For example, if the amount of payroll department and humanresources department costs is related to the number of persons employed,then they may be grouped in a single indirect cost pool and allocated tojobs on the basis of the number of employees.
Converting Indirect Costs to Direct Costs
Photocopying and telephone/fax charges are two overhead costs incurredby O’Reilly and Stevens CPAs that would be prime candidates to be traceddirectly to the individual jobs. A client code number can be entered prior torunning each photocopying job to identify the client recipient of the job,and long-distance calls and faxes can be traced to individual clients viatelephone bills or a log kept by the business. The increased sophisticationand affordability of information processing technology enable such costs,which previously were classified as indirect and were included in theoverhead rate, to be traced directly to specific jobs at minimal cost. Forexample, if telephone/fax and photocopying charges were traced directly tothe Mission Valley Automotive, Inc., job, then the Other Direct Costssection of the cost sheet now would appear as follows:
OtherPeriod Ending
1/31/2011Period Ending
2/28/2011 TotalTravel . . . . . . . . . . . . . . . . . . . . . . . . . . . . . . . $2,970 $1,975 $4,945
Meals . . . . . . . . . . . . . . . . . . . . . . . . . . . . . . . 1,430 795 2,225
Photocopying . . . . . . . . . . . . . . . . . . . . . . . 280 175 455
Telephone/fax . . . . . . . . . . . . . . . . . . . . . . . 370 220 590
Total . . . . . . . . . . . . . . . . . . . . . . . . . . . . . . $5,050 $3,165 $8,215
LO3Apply activity-
based costing
for a service firm.
456 Principles of Cost Accounting

Note that the overhead rate of 150% used in Figure 9-1 should now beslightly lower because the overhead component of the rate no longerincludes telephone/fax and photocopying charges. These items, which hadpreviously been ‘‘spread like peanut butter’’ over all the jobs, can nowbe specifically identified with the jobs that caused these costs to occur.Peanut-butter costing refers to the practice of assigning costs evenly tojobs using an overhead rate, even though different jobs actually consumeresources in different proportions.
Multiple Indirect Cost PoolsThe other main ingredient of activity-based costing is to take overheadcosts that were previously in a single indirect cost pool and then separatethem into a number of homogeneous cost pools with a separate cost driver,or cost allocation base, for each pool. For example, the single overhead costpool of $4,500,000 that previously was allocated to jobs on the basis ofdirect labor dollars could be separated into three cost pools with a differentcost driver for each pool, as follows:
Cost Pool Cost Allocation BaseSecretarial support Partner labor hours
Fringe benefits Professional labor dollars
Audit support Professional labor hours
Using the budgeted numbers from Figure 9-5 and the budgeted labor hoursfrom Figure 9-4, we find that the overhead rates, rounded to the nearestwhole cent, for the individual cost pools would be computed as follows:
Cost PoolBudgeted
CostsBudgeted
Cost Drivers Budgeted RateSecretarial support $1,500,000 4,250 hours $352.94/partner labor hour
Fringe benefits $1,250,000 $ 3,000,000 $0.42/professional labor dollar
Audit support $1,550,000 79,750 hours $19.44/professional labor hour
Note that the $1,550,000 amount in the audit support cost pool wasdetermined from the overhead budget in Figure 9-5 as follows:
Lease expense . . . . . . . . . . . . . . . . . . . . . . . . . . . . . . . . . . . . . . . . . . . . . . . . . . . . . . . $ 500,000
Depreciation—equipment . . . . . . . . . . . . . . . . . . . . . . . . . . . . . . . . . . . . . . . . . . . . 750,000
Utilities expense . . . . . . . . . . . . . . . . . . . . . . . . . . . . . . . . . . . . . . . . . . . . . . . . . . . . . 300,000
$1,550,000
The budgeted amounts for secretarial support ($1,500,000) and fringebenefits ($1,250,000) were separate line items in the overhead budget. If weuse an activity-based costing system to charge overhead costs to the Mission
Chapter 9 – Cost Accounting for Service Businesses 457

Valley Automotive, Inc., job, the amounts allocated, using the previousrates, would be as follows:
Cost Pool Budgeted Rate
Number ofCost Driver
UnitsConsumed Amount
Secretarial support $352.94/partner labor hour 18 hours $ 6,353
Fringe benefits $0.42/professional labor dollar $11,300 4,746
Audit support $19.44/professional labor hour 288 hours 5,599
Total $16,698
The cost driver numbers came from Figure 9-1, where 18 partnerhours, 288 total professional hours, and $11,300 professional labor dollars(not including overhead) were expended on the Mission Valley Automotive,Inc. job.
The professional labor dollars incurred on the job were computed asfollows, using the hours worked from Figure 9-1 and the hourly rates fromFigure 9-4:
Partners . . . . . . . . . . . . . . . . . . . . . . . . . . . . . 18 hours @ $100 . . . . . . . . ¼ . . . . $ 1,800
Managers . . . . . . . . . . . . . . . . . . . . . . . . . . . 70 hours @ $50 . . . . . . . . . ¼ . . . . 3,500
Staff . . . . . . . . . . . . . . . . . . . . . . . . . . . . . . . . 200 hours @ $30 . . . . . . . . ¼ . . . . 6,000
Total . . . . . . . . . . . . . . . . . . . . . . . . . . . . . . . . . . . . . . . . . . . . . . . . . . . . . . . . . . . . . . . . . . . $11,300
Job Cost Sheet—Activity-Based Costing
Figure 9-8 diagrams the activity-based costing system used by O’Reilly andStevens. The revised job cost sheet reflecting all charges to the MissionValley Automotive, Inc. job appears as Figure 9-9:
Figure 9-8 Diagram of Activity-Based Costing System
Cost Object: Mission Valley Automotive, Inc.
AuditSupport$5,599
Allocated@ $19.44/
ProfessionalLabor Hour
SecretarialSupport$6,353
Allocated@ $352.94/
Partner Labor Hour
FringeBenefits$4,746
Allocated@ $.42/
ProfessionalLabor Dollar
StaffWages$6,000
Managers’Wages$3,500
Partners’Wages$1,800
TracedTracedTraced
458 Principles of Cost Accounting

Allocations Using Simplified Costing VersusActivity-Based CostingIn the examples in Figures 9-1 and 9-9, the total costs charged to the jobusing a simplified costing system ($35,420) vary less than 3% from the totalcosts using activity-based costing ($36,213). Such small differences are notalways the case, as illustrated by the following example. Assume that a lawfirm has two categories of professional labor—partner and associate. It alsohas two types of indirect costs—legal support and secretarial support.Budgeted information for the year is as follows:
Figure 9-9 Job Cost Sheet with Activity-Based Costing
1
2
3
4
5
6
7
8
9
10
11
12
13
14
15
16
17
18
19
20
21
22
23
24
25
26
27
28
29
30
31
32
33
34
35
36
37
38
39
A B C D
Client Name: Mission Valley Automotive, Inc.
Engagement Type: Audit
Engagement Number: 727
Date Contracted: 12/19/2010
Date Completed: 2/22/2011
Supervising Partner: Stevens
Partners’ Time:
Period ending Hours Rate Amount
1/31/2011 10 $100 $1,000
2/28/2011 8 $100 800
Subtotals 18 $1,800
Managers’ Time:
Period ending Hours Rate Amount
1/31/2011 45 $50 $2,250
2/28/2011 25 $50 1,250
Subtotals 70 $3,500
Staff Time:
Period ending Hours Rate Amount
1/31/2011 120 $30 $3,600
2/28/2011 80 $30 2,400
Subtotals 200 $6,000
Overhead: Number of
Budgeted Cost Driver
Cost Pool Rate Units Amount
Secretarial support $352.94/partner labor hour 18 hours $ 6,353
Fringe benefits $0.42/professional labor dollar $11,300 4,746
Audit support $19.44/professional labor hour 288 hours 5,599
Subtotals $16,698
Period Period
Other Direct Ending Ending Total
Cost: 1/31/2011 2/28/2011 Other
Travel $2,970 $1,975 $ 4,945
Meals 1,430 795 2,225
Photocopying 280 175 455
Telephone/fax 370 220 590
Subtotals $5,050 $3,165 $ 8,215
Total Engagement Costs $36,213
O’Reilly and Stevens CPAs
Summary of Engagement Account
LO4Compare the
results of cost
allocations using sim-
plified costing versus
activity-based costing.
Chapter 9 – Cost Accounting for Service Businesses 459

PartnerLabor
AssociateLabor
Number of attorneys . . . . . . . . . . . . . . . . . 10 40
Annual billable hours per attorney . . . . 2,000 2,000
Annual compensation per attorney . . . $200,000 $75,000
LegalSupport
SecretarialSupport
Annual overhead estimate . . . . . . . . . . . $2,000,000 $500,000
The direct cost category includes all professional labor costs, which aretraced to jobs on a per hour basis. The indirect cost category includes alloverhead costs. These costs are included in a single indirect cost pool—professional support—and are allocated to jobs using professional laborhours as the allocation base. Using a simplified costing system with onedirect cost category and one indirect cost category, we see that the jobswould be costed as shown in Figure 9-10 for two potential clients: Horne,who requires 50 hours of trial work, and Nguyen, who requires 75 hours oftax work.
The professional labor rate of $50 per hour was computed as follows:
Professional labor rate ¼ Annual professional labor dollarsAnnual professional labor hours
¼ ð10 � $200,000Þ þ ð40 � $ 75,000)ð10 � 2,000 hoursÞ þ ð40 � 2,000 hoursÞ
¼ $ 5,000,000100,000 hours
¼ $50 per hour
Figure 9-10 Simplified Job Costing for a Law Firm
Horne Nguyen
Professional labor cost:
50 hours � $50 . . . . . . . . . . . . . . . . . . . . $2,500
75 hours � $50 . . . . . . . . . . . . . . . . . . . . $3,750
Professional support:
50 hours � $25 . . . . . . . . . . . . . . . . . . . . 1,250
75 hours � $25 . . . . . . . . . . . . . . . . . . . . 1,875
Total $3,750 $5,625
460 Principles of Cost Accounting

The professional support indirect cost rate of $25 per hour was computedas follows:
Professional support rate ¼ Annual support costAnnual professional labor hours
¼ $2;000;000þ $500;000100;000 hours
¼ $2;500;000100;000 hours
¼ $25 per hour
Now, let’s assume that the firm decides to implement a more sophisti-cated costing system because it feels that many bids, such as the Nguyenjob, are being rejected as too high. The firm decides to have two direct costcategories—partner labor and associate labor—and two indirect cost cate-gories—legal support and secretarial support. The cost allocation base forlegal support is professional labor hours; for secretarial support it is partnerlabor hours because only partners have access to secretarial help. Using thedata on page 460, the rates for each cost category would be as follows:Category RatePartner labor . . . . . . . . . . . . . . $200,000/2,000 hours . . . . . . . . . . . . . . ¼ $100 per hour
Associate labor . . . . . . . . . . . . $75,000/2,000 hours . . . . . . . . . . . . . . . ¼ $37.50 per hour
Legal support . . . . . . . . . . . . . $2,000,000/100,000 professionalhours . . . . . . . . . . . . . . . . . . . . . . . . . . . ¼ $20 per hour
Secretarial support . . . . . . . . $500,000/20,000 partner hours . . . . . ¼ $25 per hour
Further assume that the Horne job will require 40 partner hours and 10associate hours whereas the Nguyen job will require 70 associate hours andfive partner hours. Using an activity-based costing system with two directcost categories and two indirect cost categories, the jobs would be costed asshown in Figure 9-11.
Figure 9-11 Activity-Based Costing for a Law Firm
Horne Nguyen
Partner labor cost:
40 hours � $100 . . . . . . . . . . . . . . . . . . . . . . . . . . . . . $4,000
5 hours � $100 . . . . . . . . . . . . . . . . . . . . . . . . . . . . . . . $ 500
Associate labor cost:
10 hours � $37.50 . . . . . . . . . . . . . . . . . . . . . . . . . . . . 375
70 hours � $37.50 . . . . . . . . . . . . . . . . . . . . . . . . . . . . 2,625
Legal support:
50 professional hours � $20 . . . . . . . . . . . . . . . . . . 1,000
75 professional hours � $20 . . . . . . . . . . . . . . . . . . 1,500
Secretarial support:
40 partner hours � $25 . . . . . . . . . . . . . . . . . . . . . . . 1,000
5 partner hours � $25 . . . . . . . . . . . . . . . . . . . . . . . . 125
Total . . . . . . . . . . . . . . . . . . . . . . . . . . . . . . . . . . . . . . $6,375 $4,750
Chapter 9 – Cost Accounting for Service Businesses 461

The cost of the two jobs under the two costing systems is summarizedas follows:
Horne NguyenCost using simplified system . . . . . . . . . $ 3,750 $5,625
Cost using activity-based system . . . . . 6,375 4,750
Difference (under)- or overcosted . . . . . $(2,625) $ 875
Using the simplified costing system, the Horne job was undercosted by$2,625 (a difference of 70%), and the Nguyen job was overcosted by $875(almost 16%). This helps explain why the firm lost the bid on the Nguyenjob. Although it won the bid on the Horne job, it is conceivable that it mayhave done the job at a loss. If the firm added 50% to the cost estimate inbidding on the Horne job, the adjusted bid would be undercosted by $750relative to the activity-based cost of the job. This amount is determined asfollows:
Bid price using simplified cost system [$3,750 þ (0.50 � $3,750)] . . . . . . . $5,625
Activity-based cost of job . . . . . . . . . . . . . . . . . . . . . . . . . . . . . . . . . . . . . . . . . . . . 6,375
Loss on job . . . . . . . . . . . . . . . . . . . . . . . . . . . . . . . . . . . . . . . . . . . . . . . . . . . . . . . . . $ (750)
To summarize, activity-based costing is worthwhile to implementwhen different jobs use resources in different proportions. In thepreceding example, because of the nature of trial work, the Horne jobpredominately required partner time, which is more expensive andrequires more support services. It should be a cost/benefit decisiondetermining whether to implement a more sophisticated costing system.Namely, does the benefit received from the more refined informationexceed the cost of implementing and maintaining the more sophisticatedsystem?
Recall and Review 2
A law firm identifies the following two cost pools and budgeted amounts
for the coming year: paralegal support, $250,000; and research support,
$750,000. The best cost driver for paralegal support is partner labor hours,
6,000, and the driver for research support is professional labor hours,
40,000. The budgeted overhead rate for paralegal support is $____________,
and for research support is $_________________. (Round to two decimal
places.)
(After working this exercise, see page 468 for the solution.)
You should now be able to work the following:
Questions 12–15; Exercises 9-5 to 9-7; Problems 9-5 to 9-7; Self-Study
Problem 1 (Parts 2 and 3); Mini-Case; and the Internet Exercise.
462 Principles of Cost Accounting

The Balanced ScorecardThe variances illustrated in Chapter 8 are examples of financial perfor-mance measures because they are expressed in dollars. Companies often usenonfinancial performance measures to evaluate operations, such as thepercentage of defective polo shirts produced by Ralph Lauren, thepercentage of baggage lost by Delta Airlines, and the average wait timecompared to standard wait time at a Burger King drive-through window.This is consistent with the balanced scorecard approach to measuring abusiness’s success by considering both financial and nonfinancial perfor-mance measures. Many major businesses use a balanced scorecard approachto performance measurement, including such well-known entities as AppleComputer, AT&T, Verizon Communications, and the Big Fouraccounting firm KPMG.
The Four Categories of a Balanced Scorecard
A balanced scorecard translates a company’s strategy into performancemeasures that are used to implement the strategy and that employees canunderstand. These performance measures typically are divided into fourcategories, as illustrated in Figure 9-12. Note in the illustration that thearrows point upward to indicate, for example, that if a company has good
Figure 9-12 The Four Categories of Balanced Scorecard
Performance Measures
Financial — “Are we meetingour financial targets?”
Customer — “How wellare we servicing our customers?”
Internal Business Processes — “Howwell are our key business processes
working?”
Learning and Growth — “How well arewe doing in training our employees and
developing new products and services?”
LO5Prepare a ba-
lanced score-
card for various
business entities.
Chapter 9 – Cost Accounting for Service Businesses 463

training programs (Learning and Growth), then its percentage of on-timedeliveries should be high (Internal Business Processes), resulting in moresatisfied customers (Customer Perspective) and greater sales dollars (Finan-cial Perspective). Examples of balanced scorecard performance measuresappear in Figure 9-13. Note that balanced scorecards are used by manufac-turers, merchandisers, and service businesses.
One may ask, ‘‘Why bother with the other three categories (Customer,Internal Business Processes, and Learning and Growth) when the companyis in business to earn enough profits to satisfy its owners (Financial).’’ Thereason is that, without the balanced scorecard approach, a company mighttake actions to increase short-term profits that could be harmful to long-term profitability. For example, it could decrease spending on trainingprograms; this would reduce expenses and increase profits in the short run,but it could result in increased product defect rates, dissatisfied customers,and a lower sales volume in the long run.
‘‘Real-world’’ examples of balanced scorecard successes include thefollowing:
In 2007 U.S. Airways was in last place among major airlines in on-timeperformance. In 2008 the airline ‘‘invested in new baggage-handling equip-ment, acquired more gates to reduce delays, built more buffer into itsschedule and beefed up management at its Philadelphia hub to fix problems
Figure 9-13 Examples of Balanced Scorecard Performance Measures
Financial
. Return on Investment (ROI)
. Operating Income
. Gross Margin Percentage
. Revenue from New Products
Customer
. Number of New Customers
. Market Share
. Percentage of Product Returned
. Customer Satisfaction Surveys
Internal Business Processes
. Percentage of On-Time Deliveries
. Percentage of Defect-Free Units Produced
. Time Taken to Replace Defective Products
. Time from Receipt of Order to Shipment
Learning and Growth
. Employee Turnover Ratio
. Number of Employee Suggestions
. Percentage of Employees Trained in New Processes
. Percentage of Compensation Based on Employee/Team Performance
464 Principles of Cost Accounting

there.’’ By June 2008, these improvements in its Internal Business Processesperformance measures resulted in a second-best on-time performance,behind only Southwest Airlines.2
Many companies are basing a portion of executive bonuses on employeeturnover, a Learning and Growth performance measure. Penske Automo-tive Group, Inc., tied 8%, $240,000, of Chief Executive Roger Penske’s2007 bonus to ‘‘holding employee turnover below 31%. Mr. Penske earnedhis $240,000 reward. The company which owns 300 dealerships world-wide, posted 30.8% attrition in 2007, down from 31.2% a year earlier and80% in 1999 when Penske Corp. acquired a controlling stake.’’3
Guidelines for a Good Balanced Scorecard
It is important to observe the following guidelines when choosing perfor-mance measures:
. To be effective, the performance measures must be consistent with thecompany strategy.
. There should not be too many performance measures.
. Employees should be able to understand and have control over theperformance measures by which they are evaluated.
If a performance measure (say, the percentage of on-time deliveries) isbeing met but the company’s strategy (say, increased dollar sales to currentcustomers) is not attained, then this performance measure alone is notsufficient to accomplish the strategy. The company must further examinewhat their customers want—and what is not being provided—in order toaccomplish its strategy. Relative to the second guideline above, if there aretoo many performance measures, then employees will have a difficult timechoosing the measures on which to concentrate.
Lastly, if employee compensation and advancement within the firm aretied to achieving performance measures, then those measures should beunderstandable to and controllable by the employee.
The Balanced Scorecard Illustrated
Figure 9-14 illustrates a balanced scorecard for Tao Electronics, whichmanufactures television sets, DVD players, and other leisure-time electro-nic equipment. Because there are numerous manufacturers of these types ofproducts, Tao’s strategy is to increase profits by engendering customerloyalty through the production of defect-free products and the provision of
2 Scott McCartney, ‘‘Flying Was Supposed to Be Better This Summer. It’s Not,’’ The WallStreet Journal, July 8, 2008.
3 Cari Tuna, ‘‘In Some Offices Keeping Workers Earns a Bonus,’’ The Wall Street Journal,June 30, 2008.
Chapter 9 – Cost Accounting for Service Businesses 465

on-time deliveries. The performance measures in Figure 9-14 indicate thesuccess of this strategy. In general, Tao has done a good job of increasingprofits through cost reduction and revenue growth from existing customers.Note that revenue from repeat customers increased by 13% as compared toa target increase of 10%. It was expected that operating income wouldincrease by $120,000 through more efficient manufacturing processes, yetit actually increased by $150,000.
What measures help explain Tao’s ability to increase revenues andprofits? Starting with Learning and Growth, we see that more employeeswere trained in new production processes than targeted and that moreemployee suggestions were implemented than budgeted. These advances inthe learning and growth category resulted in the percentage of defect-freeunits produced exceeding the targeted percentage. An unfavorable result inthe Internal Business Processes category was that the percentage of on-timedeliveries to customers was slightly less than targeted: 94% versus theexpected 95%. Lastly, the performance measures in the Customer categoryhelp to explain the increase in revenues and profits. Tao’s market share ofthe industry was 10%, as compared to a targeted share of 8%. Also, 85% ofcustomers surveyed gave Tao the top rating for quality and service, whichexceeded the target of 80%. All told, Tao did a good job of meeting orbeating its target performance measures, and these measures appear to alignwell with the company strategy. The On-Time Deliveries category willrequire a closer look.
Figure 9-14 The Balanced Scorecard for Tao Electronics
Perspective Measures Target Performance Actual PerformanceFinancial . Increase Revenues
from Existing Customers
10% 13%
. Increase Operating Income
through Cost Reduction
$120,000 $150,000
Customer . Market Share in Industry 8% 10%
. Customer Satisfaction
Ratings
80% Give Top Rating 85% Give Top Rating
Internal BusinessProcesses
. Percentage of Defect-Free
Units Produced
92% 95%
. Percentage of On-Time
Deliveries
95% 94%
Learning andGrowth
. Percentage of Employees
Trained in New Processes
85% 91%
. Number of Employees’
Suggestions Implemented
50 63
466 Principles of Cost Accounting

KEY TERMS
Activity-based costing, 456
Balanced scorecard, 463
Billing rates, 452
Cost/benefit decision, 462
Cost performance report, 451
Nonfinancial performance measures, 463
Peanut-butter costing, 457
Professional labor budget, 452
Revenue budget, 451
Variance, 451
ANSWERS TO RECALL AND REVIEW EXERCISES
R&R 1
Budgeted overhead:
Fringe benefits . . . . . . . . . . . . . . . . . . . . . . $ 300,000
Lease expense . . . . . . . . . . . . . . . . . . . . . . 450,000
Telephone and fax . . . . . . . . . . . . . . . . . . 50,000
Total . . . . . . . . . . . . . . . . . . . . . . . . . . . . . . . . . . $ 800,000
Budgeted direct labor dollars:
Associate salaries . . . . . . . . . . . . . . . . . . . $ 500,000
Partner salaries . . . . . . . . . . . . . . . . . . . . . 700,000
Total . . . . . . . . . . . . . . . . . . . . . . . . . . . . . . . . . . $1,200,000
Budgeted overhead rate ¼ $800,000 / $1,200,000 ¼ 66.67% of direct
labor $
Recall and Review 3
From the following group of performance measures, label each one as
either Financial (F), Customer (C), Internal Business Processes (IBP), or
Learning and Growth (LG):
Percentage of employees trained in new processes___________.
Time taken to replace defective products________________.
Market share________________________.
Gross margin percentage___________________________________________.
Return on investment______________________________________________.
Percentage of products returned____________________________________.
Time from receipt of order to shipment______________________________.
Employee turnover ratio____________________________________________.
(After working this exercise, see page 468 for the solution.)
You should now be able to work the following:
Questions 16–20; Exercises 9-8 and 9-9; and Problems 9-8 and 9-9..
Chapter 9 – Cost Accounting for Service Businesses 467

SELF-STUDY PROBLEM 1
Allocations Using Simplified Costing VersusActivity-Based Costing
Carson and Peyton
Carson and Peyton, architects, have been using a simplified costing
system in which all professional labor costs are included in a single direct
cost category, professional labor; and all overhead costs are included in a
single indirect cost category, professional support, and allocated to jobs
by using professional labor hours as the allocation base. Consider two
clients: Henry’s Restaurant, which required 25 hours of design work for a
new addition, and O. Cinco, who required plans for a new ultramodern
home that took 40 hours to draw. The firm has two partners, who each
earn a salary of $150,000 a year, and four associates, who each earn
$60,000 per year. Each professional has 1,500 billable hours per year. The
professional support is $1,080,000, which consists of $700,000 of design
support and $380,000 of staff support. Henry’s job required five hours of
partner time and 20 hours of associate time. Cinco’s job required 30 hours
of partner time and 10 hours of associate time.
Required:
1. Prepare job cost sheets for Henry’s Restaurant and O. Cinco, using a
simplified costing system with one direct and one indirect cost pool.
2. Prepare job cost sheets for the two clients, using an activity-based
costing system with two direct cost categories—partner labor and
associate labor—and two indirect cost categories—design support and
staff support. Use professional labor dollars as the cost allocation base
for design support and professional labor hours for staff support.
(Round rates to two decimal places.)
3. Determine the amount by which each job was under- or - overcosted,
using the simplified costing system.
R&R 2Budgeted overhead rate for paralegal support ¼ $250,000/6,000 ¼ $41.67
per partner hour.
Budgeted overhead rate for research support ¼ $750,000/40,000 ¼ $18.75
per professional labor hour.
R&R 3Percentage of employees trained in new processes, Learning and Growth;
Time taken to replace defective products, Internal Business Processes;
Market share, Customer; Gross margin percentage, Financial; Return on
investment, Financial; Percentage of products returned, Customer; Time
from receipt of order to shipment, Internal Business Processes; Employee
turnover ratio, Learning and Growth.
468 Principles of Cost Accounting

Suggestions:
1. When computing the overhead rate using the simplified costing
system, be sure to use professional labor dollars as the cost allocation
base.
2. When computing the job cost using activity-based costing, be sure to
distinguish between partner labor hours and associate labor hours
worked on each job.
3. When computing the job cost using activity-based costing, be sure to
use professional labor dollars as the cost allocation base for design
support and professional labor hours as the cost allocation base for
staff support.
SOLUTION TO SELF-STUDY PROBLEM
1. Preparing the Job Cost Sheets Using a Simplified Costing System
You first must compute the average hourly wage rate for professional
labor:
Average professional wage rate ¼ Professional salaries
Billable hours
¼ ð2� $150,000Þ þ ð4� $60,000Þ6� 1,500 hours
¼ $540,000
9,000 hours
¼ $60 per hour
Next you must compute the indirect cost rate:
Indirect cost rate ¼ Total indirect costs
Professional labor hours
¼ $1,080;000
9,000 hours
¼ $120 per hour
Now you may prepare the cost sheets:
Henry’sRestaurant O. Cinco
Professional labor cost:
25 hours � $60 . . . . . . . . . . . . . . . . . . . . $1,500
40 hours � $60 . . . . . . . . . . . . . . . . . . . . $2,400
Professional support:
25 hours � $120 . . . . . . . . . . . . . . . . . . . 3,000
40 hours � $120 . . . . . . . . . . . . . . . . . . . 4,800
Total . . . . . . . . . . . . . . . . . . . . . . . . . . . . . . . . $4,500 $7,200
Chapter 9 – Cost Accounting for Service Businesses 469

2. Preparing the Job Cost Sheet Using an Activity-Based Costing System
You must first compute the average hourly wage rate for each classifica-
tion of professional labor:
Partner wage rate ¼ Partner salaries
Partner billable hours
¼ $300,000
3,000 hours
¼ $100 per hour
Associate wage rate ¼ Associate salaries
Associate billable hours
¼ 4� $60,000
4� 1,500 hours
¼ $40 per hour
Next you must compute the indirect cost rates for design support and for
staff support:
Design support ¼ Budgeted design costs
Budgeted professional labor dollars
¼ $700,000
$540,000
¼ $1:30 per professional labor dollar
Staff support ¼ Budgeted staff costs
Budgeted professional labor hours
¼ $380,000
9,000 hours
¼ $42:22 per professional labor hour
Now you may prepare the cost sheets:
Henry’sRestaurant O. Cinco
Professional labor cost:
5 hours � $100 . . . . . . . . . . . . . . . . . . . . . . . . . . . . . . . $ 500
30 hours � $100 . . . . . . . . . . . . . . . . . . . . . . . . . . . . . $3,000
Associate labor cost:
20 hours � $40 . . . . . . . . . . . . . . . . . . . . . . . . . . . . . . . 800
10 hours � $40 . . . . . . . . . . . . . . . . . . . . . . . . . . . . . . . 400
Design support:
$1.30 � $1,300 . . . . . . . . . . . . . . . . . . . . . . . . . . . . . . . 1,690
$1.30 � $3,400 . . . . . . . . . . . . . . . . . . . . . . . . . . . . . . . 4,420
Staff support:
25 hours � $42.22 . . . . . . . . . . . . . . . . . . . . . . . . . . . . 1,056
40 hours � $42.22 . . . . . . . . . . . . . . . . . . . . . . . . . . . . 1,689
Total . . . . . . . . . . . . . . . . . . . . . . . . . . . . . . . . . . . . . . . . $4,046 $9,509
470 Principles of Cost Accounting

3. Determining the Amount by Which Each Job Was Under- or Overcosted
Using a Simplified Costing System
Henry’sRestaurant O. Cinco
Cost using simplified system . . . . . . . . . . . . . . . . . . . $4,500 $ 7,200
Cost using activity-based system . . . . . . . . . . . . . . . . 4,046 9,509
Difference . . . . . . . . . . . . . . . . . . . . . . . . . . . . . . . . . . . . . $ 454 $(2,309)
The simplified costing system overcosted Henry’s job by $454 (10%) and
undercosted Cinco’s job by $2,309 (32%).
SELF-STUDY PROBLEM 2
Designing a Balanced Scorecard
Varsity Jerseys
Varsity Jerseys manufactures athletic jerseys that are then sold to retai-
lers. It is a very competitive industry where quality and price are important
to gain space on retailers’ racks. Varsity’s strategy is to produce defect-
free sports jerseys that can be sold at moderate prices.
Required:
Prepare a balanced scorecard, without numbers, for Varsity Jerseys that
will help them to achieve their strategy and to maximize long-term share-
holder value.
Suggestions:
1. Be sure to identify the company’s strategy before attempting to design
performance measures for a balanced scorecard.
2. Set up the four categories of balanced scorecard performances mea-
sures before including the individual performance measures.
SOLUTION TO SELF-STUDY PROBLEM
1. Identifying the company’s strategy—Varsity’s strategy is to produce
high-quality jerseys at moderate prices.
2. Identifying performance measures to meet Varsity’s strategy, within
the framework of the balanced scorecard:
Financial—Given the company’s strategy, it must concentrate on
increasing profits through cost reduction and expanded unit sales.
(Charging premium prices is not an option given the competitiveness
of the industry.) Performance measures might include:
. Increase in operating income through cost reduction.
. Increase in revenue through the sale of defect-free products.
Chapter 9 – Cost Accounting for Service Businesses 471

Customer: Given its strategy, Varsity must appeal to cost-conscious
customers who also appreciate quality. Performance measures might
include:
. Number of new customers.
. Market share in the cost-conscious market.
. Percentage of jerseys returned due to customer dissatisfaction with
quality and/or order filling.
Internal Business Processes: Given its strategy, Varsity must be certain
that its manufacturing processes are producing high-quality jerseys in
time to meet customer demand. Performance measures might include:
. Percentage of defect-free units produced.
. Number of manufacturing processes improved.
. Amount of time needed to replace defective jerseys.
Learning and growth: To achieve the high-quality production required,
management must emphasize training programs and employee feedback
in an effort to achieve continuous improvement. Performance measures
might include:
. Percentage of employees trained in new business processes.
. Number of employee suggestions that are adopted.
QUESTIONS
1. Give at least five examples of service
businesses.
2. Name two distinguishing features of ser-
vice businesses.
3. What factors help to explain the growth of
service businesses relative to manufactur-
ing businesses in the United States in re-
cent years?
4. What type of costing system do most
service businesses use, and why do they
use it?
5. What factors would you consider in decid-
ing whether to use direct labor dollars or
direct labor hours in charging overhead to
jobs in a service firm?
6. Distinguish between a direct cost and an
indirect cost when the cost object is the job.
7. What are the elements of a cost perfor-
mance report?
8. Which of the various budgets is the starting
point for preparing an annual budget?
9. Why is it important for professional labor
hours to be budgeted with extreme care?
10. What is the difference between the ac-
counting treatment of overhead for a ser-
vice business and for a manufacturer?
11. Explain how a budgeted income statement
for a service business may be used for both
planning and control purposes.
12. What are the two main things that an
activity-based costing system attempts to
accomplish relative to direct and indirect
costs?
13. Explain the concept of peanut-butter costing.
14. When is it generally worthwhile to imple-
ment an activity-based costing system?
15. Explain the concept of a cost/benefit decision
and how it relates to job costing systems.
16. What is a balanced scorecard?
17. Give five examples of nonfinancial perfor-
mance measures.
472 Principles of Cost Accounting

18. What is the relationship between a com-
pany’s strategy and its choice of perfor-
mance measures?
19. Name the four categories that performance
measures are typically divided into, and
give an example of a performance measure
for each category.
20. Why should a company bother with a ba-
lanced scorecard approach to performance
measurement when its primary goal is to
earn a sufficient return on investment for
its shareholders?
EXERCISES
E9-1 Computing budgeted overhead ratesHayes and Manolis have a professional service firm that has the
following budgeted costs for the current year:
Associates’ salaries . . . . . . . . . . . . . . . . . . . . . . . . . . . . . . . . . . . . . . . . . $300,000
Depreciation—equipment . . . . . . . . . . . . . . . . . . . . . . . . . . . . . . . . . . . 50,000
Fringe benefits . . . . . . . . . . . . . . . . . . . . . . . . . . . . . . . . . . . . . . . . . . . . . . 150,000
Lease expense . . . . . . . . . . . . . . . . . . . . . . . . . . . . . . . . . . . . . . . . . . . . . . 220,000
Partners’ salaries . . . . . . . . . . . . . . . . . . . . . . . . . . . . . . . . . . . . . . . . . . . 200,000
Telephone and fax . . . . . . . . . . . . . . . . . . . . . . . . . . . . . . . . . . . . . . . . . . 30,000
Compute the budgeted overhead rate for the coming year, using
direct labor dollars as the overhead allocation base.
E9-2 Computing profit or loss on a bidBrown and Stetham, plumbers, successfully bid $30,000 for the
plumbing work on a new luxury home. Total direct labor cost on
the job was $9,500, other direct costs were $2,500, and overhead
is charged to jobs at 150% of direct labor cost.
1. Compute the profit or loss on the job in (a) dollars and (b) as a
percentage of the bid price.
2. Express labor and overhead as a percentage of total costs.
E9-3 Preparing a revenue budgetChiao and Piaker, CPAs, budgeted for the following professional
labor hours for the coming year: partners, 1,500; managers,
5,000; and staff, 20,000. Budgeted billing rates are: partners,
$250 per hour; managers, $120 per hour; and staff accountants,
$80 per hour.
Prepare a revenue budget for the year ending December 31,
2011.
LO1
LO1
LO2
Chapter 9 – Cost Accounting for Service Businesses 473

E9-4 Preparing a budgeted income statementJones and Wang, physicians, budgeted for the following revenue
and expenses for the month of September:
Depreciation—equipment . . . . . . . . . . . . . . . . . . . . . . . . . . . . . . . . . . . $ 1,850
Fringe benefits . . . . . . . . . . . . . . . . . . . . . . . . . . . . . . . . . . . . . . . . . . . . . . 3,300
Lease expense . . . . . . . . . . . . . . . . . . . . . . . . . . . . . . . . . . . . . . . . . . . . . . 2,500
Nursing wages . . . . . . . . . . . . . . . . . . . . . . . . . . . . . . . . . . . . . . . . . . . . . . 4,500
Physicians’ salaries . . . . . . . . . . . . . . . . . . . . . . . . . . . . . . . . . . . . . . . . . 28,000
Patient revenue . . . . . . . . . . . . . . . . . . . . . . . . . . . . . . . . . . . . . . . . . . . . . 58,500
Secretarial support . . . . . . . . . . . . . . . . . . . . . . . . . . . . . . . . . . . . . . . . . . 2,200
Utilities . . . . . . . . . . . . . . . . . . . . . . . . . . . . . . . . . . . . . . . . . . . . . . . . . . . . . 650
Prepare a budgeted income statement for the month ending
September 30, 2011.
E9-5 Computing activity-based costing ratesThe partners of Harris and Whelan, attorneys-at-law, decide to
implement an activity-based costing system for their firm. They
identify the following three cost pools and budgeted amounts for
each for the coming year: fringe benefits, $450,000; paralegal
support, $250,000; and research support, $650,000. It is deter-
mined that the best cost driver for fringe benefits is professional
labor dollars ($1,500,000); paralegal support is partner labor hours
(4,000); and research support is professional labor hours (20,000).
Compute the budgeted overhead rates for each of the three
cost pools.
E9-6 Job cost for a client (continuation of E9-5)A client, Carolyn Goode, requires 10 partner labor hours and 25
professional associate hours from Harris and Whelan, the law
firm in E9-5. Partners are paid $125 per hour, and associates
make $60 per hour.
Compute the job cost of servicing Carolyn Goode.
E9-7 Comparisons of a simplified costing system with an activity-based system (continuation of E9-5 and E9-6)Prior to instituting an activity-based costing system, Harris and
Whelan, the attorneys in E9-5 and E9-6, utilized a simplified
costing system with one direct cost category, professional labor,
and one indirect cost category, professional support. The aver-
age wage rate for professional labor was $75 per hour, and the
overhead rate for professional support was $67.50 per profes-
sional labor hour.
Compute the job cost for Carolyn Goode, the client in E9-6,
using the simplified costing system, and determine the differ-
ence between it and the job cost using activity-based costing in
E9-6 and discuss the reasons for the difference.
LO2
LO3
LO3
LO4
474 Principles of Cost Accounting

E9-8 Categorizing balanced scorecard performance measuresFrom the following list of performance measures, label each one
as Financial, Customer, Internal Business Processes, or Learning
and Growth:
Percentage of on-time deliveries
Employee turnover ratio
Revenue from new products
Number of new customers
Percentage of compensation based on team performance
Percentage of products returned
Operating income
Time taken to replace defective products
E9-9 Evaluating the appropriateness of performance measuresHi-End, Inc., a chain of gasoline service stations, has a strategy
of charging premium prices for its gasoline by providing excel-
lent service such as attendants to pump gas, clean restrooms,
and free air for tire inflation. Its balanced scorecard performance
measures include: Increase in operating income through cost
reduction (Financial); Market share in the overall gasoline market
(Customer); Wait-time at the pump (Internal Business Pro-
cesses); and Employee bonus based on number of customers
served (Learning and Growth). Indicate whether or not each of
these performance measures is appropriate, given Hi-End’s
strategy.
PROBLEMS
P9-1 Job cost sheet for a service business
Shank and Verst, attorneys-at-law, provided legal representa-
tion to Baldwin Equipment, Inc., in a product liability suit.
Twenty partner hours and 65 associate hours were worked in
defending the company. The cost of each partner hour is $325,
which includes partner wages plus overhead based on direct
labor cost. The cost of each associate hour is $145, which also
includes both wages and overhead. Other costs that can be
directly identified with the job are travel ($2,800) and telephone/
fax/copying charges ($1,740). The date Baldwin contracted with
Shank and Verst was May 8, 2011, and the defense was success-
fully completed on December 21, 2011. The engagement num-
ber is 525.
Required:
Prepare a job order cost sheet, in good form, for Baldwin Equip-
ment, Inc.
LO5
LO5
LO1
Chapter 9 – Cost Accounting for Service Businesses 475

P9-2 Cost performance report and budgeted profit and actual profitfor a service business
The budget for the Baldwin Equipment, Inc. job in P9-1 consisted
of the following amounts:
Partners’ salary and overhead . . . . . . . . . . . . . $6,300
Associates’ salary and overhead . . . . . . . . . . . 9,175
Travel . . . . . . . . . . . . . . . . . . . . . . . . . . . . . . . . . . . . 4,150
Telephone/fax/copying . . . . . . . . . . . . . . . . . . . . 1,475
The successful bid price of the job was $30,000.
Required:
1. Prepare a cost performance report.
2. Compute the budgeted profit and the actual profit on the job.
P9-3 Preparing a revenue budget and a labor budget for a servicebusiness
Matthews and Thomas, partners in a systems consulting firm,
budgeted the following professional labor hours for the year
ended December 31, 2011:
Partners . . . . . . . . . . . . . . . . . . . . . . . . . . . . . . . . . . 4,000
Associates . . . . . . . . . . . . . . . . . . . . . . . . . . . . . . . . 14,000
Staff . . . . . . . . . . . . . . . . . . . . . . . . . . . . . . . . . . . . . 22,000
Partners have a billing rate of $225 per hour and actually earn $110
per hour. Associates bill out at $140 per hour and earn $85 per
hour. Staff bill out at a rate of $75 per hour and earn $35 per hour.
Required:
1. Prepare a revenue budget.
2. Prepare a professional labor budget.
P9-4 Preparing an overhead budget, an other expenses budget, and abudgeted income statement
Matthews and Thomas, the systems consultants in P9-3, bud-
geted overhead and other expenses as follows for the year
ended December 31, 2011:
Overhead:
Depreciation—equipment . . . . . . . . . . . . . . . $ 60,000
Depreciation—building . . . . . . . . . . . . . . . . . . 135,000
Fringe benefits . . . . . . . . . . . . . . . . . . . . . . . . . 385,000
Photocopying . . . . . . . . . . . . . . . . . . . . . . . . . . 95,000
Secretarial support . . . . . . . . . . . . . . . . . . . . . 465,000
Telephone/fax . . . . . . . . . . . . . . . . . . . . . . . . . . 115,000
Utilities . . . . . . . . . . . . . . . . . . . . . . . . . . . . . . . . . 193,000
Other direct expenses:
Travel . . . . . . . . . . . . . . . . . . . . . . . . . . . . . . . . . . $123,000
Meals . . . . . . . . . . . . . . . . . . . . . . . . . . . . . . . . . . 37,000
LO1
LO2
LO2
476 Principles of Cost Accounting

Required:
1. Prepare an Overhead budget.
2. Prepare an Other Expenses budget.
3. Prepare a Budgeted Income Statement.
P9-5 Computing activity-based costing rates
The partners of Mayweather and Pacquiao, a security services
firm, decide to implement an activity-based costing system. They
identify the following three cost pools and budgeted amounts for
each for the coming year: fringe benefits, $400,000; technology
support, $20,000; and litigation support, $300,000. It is determined
that the best cost driver for fringe benefits is professional labor
dollars ($2,000,000); technology support is partner labor hours
(2,000); and research support is professional labor hours (25,000).
Required:
Compute the budgeted overhead rate for each of the three cost
pools.
P9-6 Allocations using simplified costing versus activity-basedcostingsimilar to Self-Study Problem 1
Boyer and Kubek, architects, have been using a simplified costing
system in which all professional labor costs are included in a
single direct cost category, professional labor; and all overhead
costs are included in a single indirect cost pool, professional
support, and allocated to jobs using professional labor hours as
the allocation base. Consider two clients: Young Products, which
required 50 hours of design work for a new addition, and Doug’s
Markets, which required plans for a new store that took 20 hours
to draw. The firm has two partners, who each earn a salary of
$150,000 a year, and four associates, who each earn $60,000 per
year. Each professional has 1,500 billable hours per year. The
professional support is $360,000, which consists of $120,000 of
design support and $240,000 of staff support. Young’s job
required 30 hours of partner time and 20 hours of associate time.
Doug’s job required 5 hours of partner time and 15 hours of
associate time.
Required:
1. Prepare job cost sheets for Young Products and Doug’s
Markets, using a simplified costing system with one direct
and one indirect cost pool.
2. Prepare job cost sheets for the two clients, using an activity-
based costing system with two direct cost categories, partner
labor and associate labor, and two indirect cost categories,
design support and staff support. Use professional labor
dollars as the cost allocation base for design support and
professional labor hours for staff support. (Round rates to two
decimal places.)
LO3
LO4
Chapter 9 – Cost Accounting for Service Businesses 477

P9-7 Comparing the results of cost allocations, using simplifiedcosting versus activity-based costing
Required:
Referring to P9-6, compare the results of the cost allocations to
the Young Products and Doug’s Markets jobs under the simpli-
fied costing system and the activity-based costing system. Label
each difference as undercosted or overcosted relative to the
simplified costing system.
P9-8 Designing a balanced scorecardsimilar to Self-Study Problem 2
Mercury Athletics manufactures sporting goods that are then
sold to retailers. It is a very competitive industry where quality
and price are important to gain space on retailers’ shelves.
Mercury’s strategy is to produce defect-free athletic equipment
that can be sold at moderate prices.
Required:
Prepare a balanced scorecard, without numbers, for Mercury
Athletics that will help them to achieve their strategy and to
maximize long-term shareholder value.
P9-9 Designing a balanced scorecard
Dayton Dairies is a vertically integrated company that has dairy
farms, processing plants, and retail ice cream stores. Dayton’s
strategy is to maximize shareholder value by providing top-of-
the-line ice cream products that are high in butter fat and for
which consumers will pay premium prices.
Required:
Prepare a balanced scorecard for Dayton Dairies, without num-
bers, that will help them to achieve their strategy and to max-
imize long-term shareholder value.
MINI-CASE
Comparing the results of cost allocations, using simplified costing versusactivity-based costing
Ed Hickey, the consultant introduced at the beginning of section two of the
chapter (p. 456), has obtained the following data relative to the Kaufman
and D’Esti consulting job:
Partner Labor Associate LaborNumber of attorneys . . . . . . . . . . . . . . . . . 5 20
Annual billable hours per attorney . . . . 2,000 2,000
Annual compensation per attorney . . . $250,000 $100,000
Legal Support Secretarial SupportAnnual overhead estimate . . . . . . . . . . . $2,500,000 $1,000,000
LO4
LO5
LO5
LO4
478 Principles of Cost Accounting

Assume that the Binghamton job will require 50 partner hours and 20
associate hours, while the Johnson City job will require 15 partner hours
and 55 associate hours.
Required:
1. a. Using a simplified costing system with one direct cost category for
professional labor and one indirect cost category for support costs
with professional labor hours as the allocation base, compute the
bid price for the Binghamton job and the Johnson City job, assum-
ing a 25% markup on cost. (Round to the nearest whole dollar.)
b. Do you think that your results seem reasonable?
2. Using an activity-based costing system with two direct cost categories
for partner labor and associate labor and two indirect cost categories,
one for legal support and one for secretarial support with cost alloca-
tion bases of professional labor hours and partner labor hours, respec-
tively, compute the bid price for the Binghamton job and the Johnson
City job assuming a markup of 25% on cost.
3. a. Compute the difference in bid price for each job between the
simplified costing system and the activity-based costing system.
b. Were the jobs undercosted, overcosted, or a combination of each?
Which job had the greater differential, depending on which costing
system was used, and why?
INTERNET EXERCISE
A service business that uses job order costing
One of the service businesses referred to in the chapter was the interna-
tional accounting firm of PricewaterhouseCoopers (PwC). Go to the text
Web site at www.cengage.com/accounting/vanderbeck and click on the
link to PricewaterhouseCoopers’ Web site. Then answer the following
questions.
1. Explain PwC’s ‘‘Connected Thinking’’ approach to work.
2. Approximately how many students per year does PwC hire for its intern-
ship program? What type of professional guidance do you receive as a
PwC intern? Describe the training that takes place during the approxi-
mately first two weeks of a PwC internship?
3. Relative to PwC’s Code of Conduct, list at least five examples that are
given to define professional behavior.
LO1
Chapter 9 – Cost Accounting for Service Businesses 479

This page intentionally left blank

CHAPTER 10
Cost Analys i s for ManagementDecis ion Making
An article, ‘‘Steelmakers Weigh Cuts in Production,’’ appearing
in the October 8, 2008, Wall Street Journal, reported on a
Washington meeting of steelmakers at which they discussed
how far to cut output in an effort to preclude the selling price of
steel falling below the break-even cost of making it:
‘‘The price of the benchmark steel product, hot-rolled steel, is
$780 a metric ton on global markets, says Peter Marcus, steel
analyst for World Steel Dynamics. That is down from $1,000 a
metric ton earlier this year but still above the $650 it costs for
most steelmakers to make a metric ton of steel.’’1
The break-even point is the point at which sales revenue is
adequate to cover all costs to manufacture and sell the product,
but no profit is earned. Break-even analysis is one of the useful
tools described in this chapter that help managers to make
better business decisions.
M any studies that generate special reports for management useregularly accumulated cost data. Often, however, the account-ing system’s regularly compiled data must be altered and
enhanced to create additional reports because of economic occurrences thatwere not predicted. These reports, which are prepared for internal use andare not distributed to external parties, require that the user understandterminology not commonly used in operational cost accounting systems.
Learning Objectives
After studying this
chapter, you should
be able to:
LO1Compute net
income under
variable and absorp-
tion costing.
LO2Discuss the
merits and
limitations of variable
costing.
LO3Define seg-
ment profit-
ability and distinguish
between direct and
indirect costs.
LO4Compute the
break-even
point and the target
volume needed to
earn a certain profit.
LO5Calculate the
contribution
margin ratio and the
margin of safety ratio.
LO6Discuss the
impact of in-
come tax on break-
even computations.
LO7Use differen-
tial analysis
to make special
decisions.
LO8Identify tech-
niques for
analyzing and control-
ling distribution costs.
1 Robert Guy Matthews, ‘‘Steelmakers Weigh Cuts in Production,’’ The Wall Street Journal,October 8, 2008.

This chapter introduces and defines several new terms relating to thespecial-purpose reports for internal management decision making.
Variable Costing and Absorption CostingUnder variable costing, the cost of a manufactured product includes onlythe costs that vary directly with volume: direct materials, direct labor, andvariable factory overhead. This method is referred to as variable costing,sometimes called direct costing, because only variable manufacturing costsare assigned to the inventoried product cost, whereas fixed factory overheadis classified as a period cost and charged to expense in the period in whichthe fixed costs were incurred.
The alternative to variable costing is absorption costing or fullcosting (the method used in the preceding chapters and the only oneaccepted for external financial reporting). Under this method, both fixed andvariable manufacturing costs are assigned to the product, and no particularattention is given to classifying the costs as either fixed or variable.
Product Costs Versus Period Costs
All costs, both manufacturing and nonmanufacturing, can be classified aseither product costs or period costs. As discussed in previous chapters,product costs (or inventory costs) are assigned to Work in Process asproduction occurs and subsequently transferred to Finished Goods asproducts are completed. When inventory is sold, product costs are recog-nized as an expense (cost of goods sold) and matched with the relatedrevenues from the sale of the products. In contrast, period costs are notassigned to the product but are recognized as expenses in the periodincurred. All nonmanufacturing costs are period costs. These includeselling expenses as well as general and administrative expenses.
The only difference between variable costing and absorption costing isthe classification of fixed factory overhead. Under variable costing, fixedoverhead costs are classified as period costs. Under absorption costing, theyare treated as product costs. Selling and administrative expenses are periodcosts under both methods. Figure 10-1 compares the flow of costs undervariable costing and absorption costing.
Illustration of Variable and Absorption Costing Methods
To illustrate the differences between variable costing and absorptioncosting, assume the following budgeted selling price and standard costs fora three-month period:
Selling price per unit . . . . . . . . . . . . . . . . . . . . . . . . . . . . . . . . . . . . . . . . . . . . . . $ 11
Variable cost per unit:
Direct materials . . . . . . . . . . . . . . . . . . . . . . . . . . . . . . . . . . . . . . . . . . . . . . . . . $ 2
Direct labor . . . . . . . . . . . . . . . . . . . . . . . . . . . . . . . . . . . . . . . . . . . . . . . . . . . . . 2
Variable factory overhead . . . . . . . . . . . . . . . . . . . . . . . . . . . . . . . . . . . . . . . 1
Variable cost per unit . . . . . . . . . . . . . . . . . . . . . . . . . . . . . . . . . . . . . . . . . . . . $ 5
LO1Compute net
income under
variable and absorp-
tion costing.
482 Principles of Cost Accounting

Fixed cost per unit:
Fixed factory overhead for the year . . . . . . . . . . . . . . . . . . . . . . . . . . . . . . . $108,000
Normal production for the year in units . . . . . . . . . . . . . . . . . . . . . . . . . . . 36,000
Fixed cost per unit ($108,000 � 36,000) . . . . . . . . . . . . . . . . . . . . . . . . . . . $ 3
UnitsProduced Units Sold
January . . . . . . . . . . . . . . . . . . . . . . . . . . . . . . . . . . . . . . . . . . . . . . . . 3,000 1,500
February . . . . . . . . . . . . . . . . . . . . . . . . . . . . . . . . . . . . . . . . . . . . . . . 500 2,000
March . . . . . . . . . . . . . . . . . . . . . . . . . . . . . . . . . . . . . . . . . . . . . . . . . . 4,000 2,000
January has no beginning inventories.
The comparative production report in Figure 10-2 shows the costscharged to the product under each costing method. Note that underabsorption costing, the goods manufactured in January are charged with thestandard costs of the direct materials, direct labor, and both variable andfixed factory overhead, totaling $8 ($2 þ $2 þ $1 þ $3) per unit. Undervariable costing, the fixed factory overhead is not charged to the product,resulting in a unit cost of $5.
Figure 10-1 Comparison of Absorption Costing and Variable Costing
Direct MaterialDirect Labor
Variable Manufacturing OverheadFixed Manufacturing Overhead
Selling CostsAdministrative Costs
Inventory Accountson
Balance Sheet
Absorption Costing:
Variable Costing:
Cost of Goods SoldWhen Finished
Goods Are Sold
Expense Accountson
Income Statement
Period Costs
Period CostsProduct Costs
Product Costs
Direct MaterialDirect Labor
Variable Manufacturing Overhead
Fixed Manufacturing OverheadSelling Costs
Administrative Costs
Inventory Accountson
Balance Sheet
Cost of Goods SoldWhen Finished
Goods Are Sold
Expense Accountson
Income Statement
Chapter 10 – Cost Analysis for Management Decision Making 483

Figure 10-3 uses absorption costing to compare the average fixedfactory overhead of $9,000 ($108,000 � 12) per month with the amountapplied to units produced each month. In January, 3,000 units are manu-factured, and the manufacturing costs under absorption costing include$9,000 ($3 � 3,000) in fixed factory overhead. February manufacturingcosts covering the 500 units produced include fixed factory overhead of$1,500 ($3 � 500), and the manufacturing costs for March covering the4,000 units produced include $12,000 ($3 � 4,000) of fixed factory over-head. As a result of the unevenness of production, $7,500 ($9,000 actual �$1,500 applied) of fixed expense in February is not included in manufactur-ing costs (underapplied), but in March, the fixed overhead is overapplied by$3,000 ($12,000 applied � $9,000 actual). These variances of underappliedand overapplied factory overhead are reflected in the income statements forFebruary and March as (respectively) an addition to and a deduction fromcost of goods sold. Under variable costing, no fixed factory overheadexpenses are charged to production in any month. These fixed costs appearas an expense of $9,000 on each month’s income statement, along withselling and administrative expenses.
Figure 10-4 compares the effects of variable costing and absorptioncosting on income. Each month, the cost of goods sold reflects a cost of $8per unit under absorption costing, compared to $5 per unit under variable
Figure 10-2 Comparison of Product Costs for Absorption Costing and Variable Costing
Comparative Production ReportJanuary (3,000 units) February (500 units) March (4,000 units)
AbsorptionCosting
VariableCosting
AbsorptionCosting
VariableCosting
AbsorptionCosting
VariableCosting
Direct materials . . . . . . . $ 6,000 $ 6,000 $1,000 $1,000 $ 8,000 $ 8,000
Direct labor . . . . . . . . . . . 6,000 6,000 1,000 1,000 8,000 8,000
Variable factoryoverhead . . . . . . . . . . . 3,000 3,000 500 500 4,000 4,000
Fixed factory overhead 9,000 — 1,500 — 12,000 —
Total cost . . . . . . . . . . . . . $24,000 $15,000 $4,000 $2,500 $32,000 $20,000
Unit cost . . . . . . . . . . . . . . $ 8 $ 5 $ 8 $ 5 $ 8 $ 5
Figure 10-3 Schedule of Fixed Overhead Applied under Absorption Costing
Fixed Overhead Applied—Absorption CostingJanuary February March
Monthly fixed factory overhead . . . . . . . . $9,000 $9,000 $ 9,000
Fixed factory overhead applied . . . . . . . . 9,000 1,500 12,000
Under (over)applied overhead . . . . . . . . . -0- $7,500 $ (3,000)
484 Principles of Cost Accounting

costing. Under absorption costing, the difference between sales revenueand cost of goods sold is termed the gross margin or gross profit (Sales –Cost of Goods Sold). The term commonly used in variable costing todesignate the difference between sales and cost of goods sold is manufac-turing margin (Sales – Variable Cost of Goods Sold). Because cost ofgoods sold determined under absorption costing includes both fixed andvariable overhead but includes only variable overhead under variable cost-ing, it follows that the gross margin under absorption costing is alwayslower than the manufacturing margin under direct costing.
Under absorption costing, selling and administrative expenses arededucted from the gross margin to determine net income or loss. In theillustration, all of these costs are assumed to be fixed costs of $2,000 eachmonth. Under variable costing, the total amount of monthly fixed overhead
Figure 10-4 Comparison of Net Income for Absorption Costing and Variable Costing
Comparative Income StatementsFor Three Months Ended March 31, 2011
January(3,000 units produced,
1,500 units sold)
February(500 units produced,
2,000 units sold)
March(4,000 units produced,
2,000 units sold)Absorption
CostingVariableCosting
AbsorptionCosting
VariableCosting
AbsorptionCosting
VariableCosting
Sales . . . . . . . . . . . . . . . . . . . . . . $ 16,500 $16,500 $ 22,000 $ 22,000 $ 22,000 $ 22,000
Cost of goods sold (see sche-dule below) . . . . . . . . . . . . . .
(12,000) (7,500) (16,000) (10,000) (16,000) (10,000)
(Under-)/overapplied factoryoverhead . . . . . . . . . . . . . . . . — — (7,500) — 3,000
—
Gross margin (loss) . . . . . . . . . $ 4,500 $ (1,500) $ 9,000
Manufacturing margin . . . . . . $ 9,000 $ 12,000 $ 12,000
Less:
Fixed factory overhead . . . (9,000) (9,000) (9,000)
Selling and administrativeexpenses . . . . . . . . . . . . . . . . (2,000) (2,000) (2,000) (2,000) (2,000) (2,000)
Net income (loss) . . . . . . . . . . . $ 2,500 $ (2,000) $ (3,500) $ 1,000 $ 7,000 $ 1,000
Comparative Schedule of Cost of Goods SoldFor Three Months Ended March 31, 2011
Beginning finished goods inventory . . . — — $12,000 $ 7,500 — —
Cost of goods manufactured . . . . . . . . . . $24,000 $15,000 4,000 2,500 $32,000 $20,000
Goods available for sale . . . . . . . . . . . . . . . $24,000 $15,000 $16,000 $10,000 $32,000 $20,000
Less ending finished goods inventory . . 12,000 7,500 — — 16,000 10,000
Cost of goods sold . . . . . . . . . . . . . . . . . . . . $12,000 $ 7,500 $16,000 $10,000 $16,000 $10,000
Chapter 10 – Cost Analysis for Management Decision Making 485

is deducted from the manufacturing margin, along with the fixed sellingand administrative expenses. Thus, $9,000 ($108,000/12) of fixed overheadcosts is charged against revenue each month regardless of the number ofunits produced or sold.
An examination of the comparative income statements in Figure 10-4reveals the effect of fluctuating production on reported income underabsorption costing. Although February sales revenue of $22,000 exceededJanuary sales revenue of $16,500, the net income decreased from $2,500 inJanuary to a net loss of $3,500 in February (as a result of the decreasedproduction that caused more of the fixed factory overhead to be released tocost of goods sold). This decrease is caused by adding $7,500 ($9,000monthly fixed factory overhead – $1,500 overhead applied) of underappliedoverhead at the end of February to the cost of goods sold.
March sales revenue of $22,000 is the same as February sales revenue,but reported net income under absorption costing increased from a $3,500net loss in February to a $7,000 net income in March. This increase is dueto the increased production that caused more of the fixed factory overheadto be applied to production in March than in February. In fact, overhead isoverapplied in March, and this overapplication is shown as a decrease incost of goods sold of $3,000 ($9,000 monthly fixed factory overhead �$12,000 overhead applied) because some of the fixed overhead costs areheld back in inventory.
Figure 10-5 The Effect of Changes in Inventory Levels on Income under
Absorption Costing and Variable Costing
Monthly Production vs. Sales
Inventory Effect Absorption Costing vs. Variable Costing Operating Income
Production = Sales Absorption Costing Income Equals Variable Costing Income
Production > Sales Absorption Costing IncomeGreater Than Variable CostingIncome (Some Fixed Manu-facturing Overhead Is Held Back in Inventory under Absorption Costing as Inventories Increase)
Sales > Production Variable Costing Income Greater Than Absorption Costing Income (Some Fixed Manufacturing Overhead Is Released from In-ventory and Charged to Cost of Goods Sold under Absorption Costing as Inventories Decrease)
486 Principles of Cost Accounting

A study of the income statements under variable costing shows that assales increase in February, income also increases from a $2,000 loss to a$1,000 profit. When sales remain the same in March as they were inFebruary, income remains at $1,000. Variable costing is often used formanagement decision making because of the intuition that profits shouldincrease as sales increase. Under absorption costing, profits are affected bythe dynamic of units produced versus units sold, with the fixed overheadeither being held back in inventory (production exceeds sales) or released tocost of goods sold (sales exceed production). Figure 10-5 illustrates the effectthat differences between the number of units produced and sold have onincome as computed under absorption costing and under variable costing.
Inventories have a higher cost under absorption costing than undervariable costing because fixed costs are included in the cost of inventory inabsorption costing. This element of fixed cost will not be reported as acharge against revenue until the goods are sold. Under variable costing,fixed costs are not included in inventory; they are charged against revenuefor the period in which they are incurred.
Merits and Limitations of Variable CostingThe merits of variable costing may be viewed in terms of the usefulness ofthe data provided by its application. Some company managers believe thatvariable costing furnishes more understandable data regarding costs, vo-lumes, revenues, and profits to members of management who are notformally trained in the field of accounting. It presents cost data in a mannerthat highlights the relationship between sales and variable production costs,which move in the same direction as sales. Furthermore, they believe thatvariable costing helps management planning because it presents a clearerpicture of how changes in production volume affect costs and income.From the variable costing portion of the production report in Figure 10-2,management can determine that units produced and sold above normalproduction of 3,000 units will cost only $5 each in out-of-pocket expendi-tures for variable costs because the fixed manufacturing costs of $9,000 havebeen completely covered by the expected normal production (3,000 units �$3 per unit). Therefore, the additional units will produce a marginal incomeof $6 ($11 selling price � $5 variable manufacturing costs) each. Assumethat a plant’s capacity is not fully utilized and management has theopportunity to fill a special order at a selling price of $7 each withoutincurring any additional selling and administrative expenses. If managementincorrectly used the absorption cost of $8 per unit in Figure 10-2 to makethis decision, then it would reject the special order. If management correctlycompared the selling price of $7 per unit to the additional variable costsof $5, then it would accept the special order and earn additional income of$2 per unit because the fixed overhead cost of $3 per unit had already beenabsorbed by the normal production and thus should not be considered inmaking this decision. Only the additional variable costs are relevant to thedecision concerning whether to make the sale at a reduced price.
LO2Discuss the
merits and
limitations of variable
costing.
Chapter 10 – Cost Analysis for Management Decision Making 487

Although variable costing may provide useful information for internaldecision making, it is not a generally accepted method of inventory costingfor external reporting purposes. The measurement of income, in traditionalaccounting theory, is based on the matching of revenues with all associatedcosts. Under absorption costing, product costs include all variable and fixedmanufacturing costs. These costs are matched with the sales revenue in theperiod in which the goods are sold. Variable costing, however, matchesonly the variable manufacturing costs with revenue. Absorption costingmust be used for income tax purposes as well as for external financialstatements. Regulations of the Internal Revenue Service specifically prohi-bit variable costing in computing taxable income.
Variable costing is also criticized because no fixed factory overhead costis included in work in process or finished goods inventories. In the opinionof variable costing opponents, both fixed and variable costs are incurred inmanufacturing products. Because the inventory figures do not reflect thetotal cost of production, they do not present a realistic inventory costvaluation on the balance sheet.
Adjustments can be made to the inventory figures to reflect absorption coston published financial reports while retaining the benefits of variable costingfor internal decision-making purposes. In the example given, the unit cost was$5 under variable costing and $8 under absorption costing. Absorption costingis 160% ($8/$5) of variable costing, so inventories could be adjusted as follows:
Ending InventoryUnder Variable
Costing
Absorption-Variable Cost
Ratio
Ending InventoryUnder Absorption
CostingJanuary . . . . . . . . . . . . . . . . . . . . . . $ 7,500 � 160% $12,000
February . . . . . . . . . . . . . . . . . . . . . None None
March . . . . . . . . . . . . . . . . . . . . . . . . $10,000 � 160% $16,000
Segment Reporting for Profitability AnalysisSegment reporting provides data that management can use to evaluate theoperations and profitability of individual segments within a company. Asegment may be a division, a product line, a sales territory, or otheridentifiable organizational unit.
Recall and Review 1
A company had income of $100,000 using variable costing for a given
period. Beginning and ending inventories were 9,000 and 12,000 units,
respectively. If the fixed overhead application rate was $4 per unit, then the
income using absorption costing must have been $_______________________.
(After working this exercise, see page 508 for the solution.)
You should now be able to work the following:
Questions 1-4; Exercises 10-1 to 10-6; Problems 10-1 and 10-2; and Mini-Case 1.
LO3Define seg-
ment profit-
ability and distinguish
between direct and
indirect costs.
488 Principles of Cost Accounting

based on absorption costing data. This is because the measure of eachsegment’s profitability may be distorted by arbitrarily assigning indirectcosts to the segments being examined. The contribution margin approach(as used in variable costing), which separates the fixed and variable elementsthat constitute cost, is often used to overcome these objections.
Segment profitability analysis requires that all costs be classified intoone of two categories: direct or indirect. A direct (traceable) cost is a costthat can be traced to the segment being analyzed. Direct costs include bothvariable and fixed costs that are directly identifiable with a specific segment.An indirect (nontraceable) cost is a cost that cannot be identified directlywith a specific segment; this cost is often referred to in segment analysis asa common cost. Under the contribution margin approach, only those costsdirectly traceable to a segment are assigned to the segment. The excess ofsegment revenue over variable direct costs—manufacturing as well asselling and administrative—is called contribution margin, and the remain-der after direct fixed costs (also manufacturing and selling and adminis-trative) are assigned to the segment is called the segment margin. Indirectcosts are excluded from the computation of the segment margin.
Although indirect costs cannot be directly identified with a specificsegment, they are identifiable as being common to all segments at aparticular level of an organization. Often the differences between direct andindirect costs are not markedly distinctive; however, the costs that willdisappear when the company eliminates the segment should be classified asdirect costs. Costs that are difficult to classify should not be allocated toindividual segments without a careful evaluation of the allocation method.For instance, if a company consists of two divisions, then each divisionmanager’s salary would be a direct fixed cost to the division. However, ifeach division manufactured two products, then each division’s productsegment report would classify the manager’s salary as an indirect cost.Arbitrarily allocating the manager’s salary to one of the products woulddistort the profitability shown for each product.
Figure 10-6 shows two segment reports, one listed by divisions and theother listed by products for one of the divisions. The company is dividedinto two divisions, and each division manufactures two products.
An analysis of the segment report by divisions reveals that the divisionsegment margin was $75,000 for the total company. The Paper Divisioncontributed $10,000 to the margin, and the Cosmetics Division contributed$65,000. The direct fixed costs chargeable to the divisions totaled $125,000,and the unallocated common fixed costs totaled $50,000.
When the Paper Division is isolated and analyzed to determine how eachproduct contributed to the segment margin of $10,000, the direct fixed costschargeable to the individual products amount to $35,000. Tissues are charged$20,000 and Towels, $15,000. The Paper Division has unallocated commonfixed costs of $30,000, which are not directly chargeable to either product.For example, the $25,000 for Administration listed under common fixedcosts in the segment report by product, may represent the monthly salary of
Chapter 10 – Cost Analysis for Management Decision Making 489

the Senior Vice-President of the Paper Division who oversees both products.The $5,000 common fixed costs for Production may represent monthlydepreciation on the plant where both tissues and towels are produced. Thesereports reveal how costs shift from one category to another depending on thesegment under scrutiny. Each segment report prepared for a companyisolates those costs, variable and fixed, that can be charged directly to thesegment elements. As different segments are analyzed, these costs may bedirect costs in one segment and indirect costs in another segment.
The divisions’ contribution margins are determined by subtracting thevariable costs from the sales. The contribution margin can be used as aguide in making management decisions regarding short-run opportunities,such as pricing special orders when there is excess capacity.
The direct fixed costs chargeable to each segment are subtracted fromthe contribution margin to determine the segment margin. The segmentmargin can be used as a guide indicating the segment’s long-run profit-ability. In other words, it measures the ability of the division or product torecover not only its variable costs but also the direct fixed costs that must berecovered to keep the company solvent in the long run. In the short run, ifa segment margin is positive, then the segment should be retained even if
Figure 10-6 Segment Report by Division and by Product
Segment Report by Division for theMonth Ended March 31, 2011
Segment Report by Product forthe Month Ended March 31, 2011—
Paper DivisionTotal
CompanyPaper
DivisionCosmetics
DivisionTotal Paper
DivisionProductTissues
ProductTowels
Sales . . . . . . . . . . . . . . . . . . . . $1,000,000 $750,000 $250,000 $750,000 $500,000 $250,000
Less variable costs . . . . . . . 800,000 675,000 125,000 675,000 450,000 225,000
Contribution margin . . . . . $ 200,000 $ 75,000 $125,000 $ 75,000 $ 50,000 $ 25,000
Less direct fixed costs: . . .
Production . . . . . . . . . . . . $ 50,000 $ 25,000 $ 25,000 $ 20,000 $ 10,000 $ 10,000
Administration . . . . . . . . 75,000 40,000 35,000 15,000 10,000 5,000
Total direct fixed costs . $ 125,000 $ 65,000 $ 60,000 $ 35,000 $ 20,000 $ 15,000
Segment margin . . . . . . . . . $ 75,000 $ 10,000 $ 65,000 $ 40,000 $ 30,000 $ 10,000
Less common fixed costs:
Selling . . . . . . . . . . . . . . . . $ 30,000
Production . . . . . . . . . . . . $ 5,000
Administration . . . . . . . . 20,000 25,000
Total common fixedcosts . . . . . . . . . . . . . . . . . . $ 50,000 $ 30,000
Segment margin . . . . . . . . . $ 10,000
Net income . . . . . . . . . . . . . . $ 25,000
490 Principles of Cost Accounting

the company as a whole is operating at a loss. Because the common fixedcosts will usually remain at the same level even if a segment is eliminated,deleting a segment with a positive segment margin can only increase theamount of the company’s net loss. The segment margin remaining afterdirect variable and fixed costs have been deducted is the amount left over tohelp cover the unallocated common costs and to earn a profit. The segmentmargin analysis is particularly beneficial as an aid to making decisions thatrelate to a company’s long-run requirements and performance: changingproduction capacities, product pricing policies, decisions to retain or elim-inate specific segments, and analyses of segment managers’ performance.
Cost-Volume-Profit AnalysisA company’s net income is a measure of management’s success in attainingits goals. In planning, management must anticipate how selling prices, costs,expenses, and profits will react to changes in activity when the activity ismeasured in terms of capacity or volume. When the degree of variability incosts is known, the effect of volume changes can be predicted.
Cost-volume-profit (CVP) analysis is a technique that uses thedegrees of cost variability to measure the effect of changes in volume onresulting profits. Such analysis assumes that the fixed costs of the firm willremain the same in total within a wide range of production volume withinwhich the firm expects to operate, known as the relevant range. Thepublisher of this textbook incurred both variable and fixed costs. For example,the costs of typesetting to produce the book and advertising to sell the bookare fixed because these costs are not much affected by whether a large orsmall number of textbooks are eventually sold. In comparison, printing andbinding costs are variable because the greater the number of books that aresold, the greater the number that have to be printed and bound.
Break-even Analysis
The usual starting point in CVP analysis is the determination of a firm’sbreak-even point. The break-even point is defined as the point at whichsales revenue is adequate to cover all costs to manufacture and sell theproduct but not enough to generate any profit. Surveys indicate that morethan 50% of companies worldwide use break-even analysis. Typical break-even points include 60% occupancy for the hotel industry and 70% capacityfor the airline industry. Figure 10-7 illustrates the percentage of seats filledon international flights in 2006 through 2008 and in the first quarter of2009.2 The equation for the break-even point can be stated as follows:
Sales revenue ðto break evenÞ ¼ Cost to manufactureþ Selling and administrative costs
2 International Air Transport Association, www.iataonline.com, viewed August 13, 2009.
LO4Compute the
break-even
point and the target
volume needed to
earn a certain profit.
Chapter 10 – Cost Analysis for Management Decision Making 491

Break-even analysis relies on segregating costs according to whetherthey are ‘‘variable’’ (changing as the activity level changes) or ‘‘fixed’’ (notchanging as the activity level changes) within a relevant range. The break-even equation may be rewritten as follows:
Sales revenue ðto break evenÞ ¼ Fixed Manufacturing and Selling andAdministrative Costs þ Variable Manufacturingand Selling and Administrative Costs
Note that the variable and fixed costs may each consist of bothmanufacturing costs and selling and administrative costs. The annualincome statement for Vortex Manufacturing, Inc., a new startup company,in condensed form follows. (Net operating income equals profit beforeinterest expense and income tax expense.)
Vortex Manufacturing CompanyIncome Statement
For the Year Ended December 31, 2011
Net sales (10,000 units at $10) . . . . . . . . . . . . . . . . . $100,000
Cost of goods sold:
Materials . . . . . . . . . . . . . . . . . . . . . . . . . . . . . . . . . . $20,000
Labor . . . . . . . . . . . . . . . . . . . . . . . . . . . . . . . . . . . . . . 25,000
Factory overhead . . . . . . . . . . . . . . . . . . . . . . . . . . . 15,000 60,000
Gross margin on sales . . . . . . . . . . . . . . . . . . . . . . . . $ 40,000
Operating expenses:
Selling expense . . . . . . . . . . . . . . . . . . . . . . . . . . . . $15,000
Administrative expense . . . . . . . . . . . . . . . . . . . . . 10,000 25,000
Net operating income . . . . . . . . . . . . . . . . . . . . . . . . . $ 15,000
Figure 10-7 Airline Load Factors (percentage of seats filled)
82%
80%
78%
76%
74%
72%
70%
68%
% o
f A
SK
S
IATA
Jan Feb Mar Apr May Jun Jul Aug Sep Oct Nov Dec
2007
2006
2008
2009
492 Principles of Cost Accounting

The costs and expenses of Vortex Manufacturing, Inc., were analyzedand classified as follows [The analysis shows that variable costs are 70% ofnet sales ($70,000/$100,000), meaning that $.70 of each sales dollar isconsumed by variable costs. Fixed costs will remain at $15,000 within awide range of production and sales volume]:
Items TotalVariable
Costs Fixed CostsMaterials . . . . . . . . . . . . . . . . . . . . . $20,000 $20,000
Labor . . . . . . . . . . . . . . . . . . . . . . . . 25,000 25,000
Factory overhead . . . . . . . . . . . . . 15,000 10,000 $ 5,000
Selling expense . . . . . . . . . . . . . . . 15,000 10,000 5,000
Administrative expense . . . . . . . 10,000 5,000 5,000
$85,000 $70,000 $15,000
The break-even equation in mathematical terms is as follows:
Break-even sales volume ðdollarsÞ ¼ Total fixed costsContribution margin ratio
The contribution margin is determined by subtracting variable costsfrom sales revenue; it represents the amount available to cover fixed costsand earn a profit. The contribution margin ratio expresses the relation-ship, in percentage terms, between contribution margin and sales. In theVortex Manufacturing, Inc., example, if variable costs are $.70 of each salesdollar, then the contribution margin is $.30 of each sales dollar and thecontribution margin ratio is 0.30 or 30%. The break-even point in salesrevenue for Vortex Manufacturing, Inc., would be determined as follows(note that once the denominator is simplified, it becomes the contributionmargin ratio of 30%):
Break-even sales volume ðdollarsÞ ¼ Total fixed costs1� ðVariable costs=Sales revenueÞ
¼ $15,0001� ð$70,000/$100,000)
¼ $15,0001� 0:70
¼ $15,0000:30
¼ $50,000
This means that $50,000 in sales revenue must be generated to cover allcosts. The break-even sales volume in dollars can be proved by preparingan income statement in contribution format:
Sales at break-even point . . . . . . . . . . . . . . . . . . . . . . . . . . . . . . . . . . . . . . . $50,000
Less variable costs at break-even point (70% � $50,000) . . . . . . . . . . . 35,000
Contribution margin . . . . . . . . . . . . . . . . . . . . . . . . . . . . . . . . . . . . . . . . . . . . $15,000
Less fixed costs . . . . . . . . . . . . . . . . . . . . . . . . . . . . . . . . . . . . . . . . . . . . . . . . 15,000
Net operating income (loss) . . . . . . . . . . . . . . . . . . . . . . . . . . . . . . . . . . . . . -0-
Chapter 10 – Cost Analysis for Management Decision Making 493

The break-even point can also be calculated in units by using thefollowing equation:
Break-even sales volume ðunitsÞ ¼ Total fixed costUnit contribution margin
The unit contribution margin is merely the unit sales price minus theunit variable costs. Using this equation, we find that the break-even pointfor Vortex Manufacturing, Inc., would be as follows:
Break-even sales volume ¼ Total fixed costUnit sales price�Unit variable costs
Break-even sales volume ¼ $15,000$10� ð$70,000 variable costs=10,000 unitsÞ
¼ $15,000$3
¼ 5,000 units
Note that 5,000 units multiplied by a selling price of $10 per unit equalsthe $50,000 break-even sales volume computed previously. Therefore, ifyou know one of the break-even figures in units or dollars, then you do notneed the formula to determine the other.
Break-even ChartThe break-even point can also be graphically depicted by a break-evenchart, as in Figure 10-8. The break-even chart for Vortex Manufacturing,Inc., can be constructed and interpreted as follows:
1. A horizontal line, the x-axis, is drawn and divided into equal distances torepresent the sales volume in dollars.
2. A vertical line, the y-axis, is drawn and divided into equal parts representingcosts and revenues in dollars.
3. A fixed cost line is drawn parallel to the x-axis at the $15,000 point on the y-axis.
4. A total cost line is drawn from the $15,000 fixed cost point on the y-axis to the$85,000 total cost point at the right of the graph.
5. A sales line is drawn from the intersection of the x-axis and y-axis tothe $100,000 total sales point at the right of the graph.
6. The sales line intersects the total cost line at the break-even point, represent-ing $50,000 of sales.
7. The shaded area to the left of the break-even point, where the total cost line isabove the sales line, is the net loss area; the shaded area to the right of thebreak-even point, where the sales line is above the total cost line, is the netincome area.
494 Principles of Cost Accounting

Note that a break-even chart may also be prepared graphically with thebreak-even point expressed in units, as in Figure 10-9.
Break-even Analysis for Management DecisionsBreak-even analysis can be used to help management select an action whenseveral alternatives exist. This analysis is based on the conditions thatvariable costs will vary in constant proportion to the sales volume and thatfixed costs will be fixed over a prescribed or relevant range of activity.Therefore, if management wishes to test new proposals that will change thepercentage of variable costs to sales volume, or the total amount of fixedcosts, or a combination of these changes, then it can use the basic break-even equation to calculate the results.
Assume that Vortex Manufacturing, Inc., has established its break-evenpoint in sales volume at $50,000 and now wishes to determine the amountof sales dollars needed to earn a net operating income of $18,000. The$18,000 net income is viewed as a nonvariable factor just as are the fixedcosts. The target volume (the amount of sales volume needed, in units or
Figure 10-8 Break-even Chart in Dollars
CO
ST
S A
ND
RE
VE
NU
ES
(D
OL
LA
RS
IN
TH
OU
SA
ND
S)
100
90
80
70
60
50
40
30
20
10
$100,000(Sales)
$85,000(Total Cost)
$70,000(Variable Cost)
$15,000(Fixed Cost)
Fixed Cost Line
Total Cost Line
Break-Even Point
Sales Line
Y-AXIS
X-AXISSALES VOLUME (DOLLARS IN THOUSANDS)
10 20 30 40 50 60 70 80 90 100
$15,000NetIncome
Net Incom
e Are
a
Net Loss
Are
a
Chapter 10 – Cost Analysis for Management Decision Making 495

dollars, to cover all costs and earn a certain amount of profit) would becalculated via the following modified equation:
Target volume ðdollarsÞ ¼ Total fixed costsþNet income1� ðTotal variable costs=Total sales volumeÞ
¼ $15,000 þ $18,0001� ð$70,000/$100,000)
¼ $33,0001� 0:70
¼ $33,0000:30
¼ $110,000
The new conditions can be checked, in income statement form, asfollows:
Figure 10-9 Break-even Chart in Units
CO
ST
S A
ND
RE
VE
NU
ES
(D
OL
LA
RS
IN
TH
OU
SA
ND
S)
100
90
80
70
60
50
40
30
20
10
$100,000(Sales)
$85,000(Total Cost)
$70,000(Variable Cost)
$15,000(Fixed Cost)
Fixed Cost Line
Total Cost Line
Break-Even Point(5,000 Units, $50,000)
Sales Line
Y-AXIS
X-AXISSALES VOLUME (UNITS IN THOUSANDS)
1 2 3 4 5 6 7 8 9 10
$15,000NetIncome
Net Incom
e Are
a
Net Loss
Are
a
496 Principles of Cost Accounting

Sales . . . . . . . . . . . . . . . . . . . . . . . . . . . . . . . . . . . . . . . . . . . . . . . . . . . . . . . . . . . . . . . . . . . . . . . $110,000
Less variable costs (70% � $110,000) . . . . . . . . . . . . . . . . . . . . . . . . . . . . . . . . . . . . . . . . . 77,000
Contribution margin . . . . . . . . . . . . . . . . . . . . . . . . . . . . . . . . . . . . . . . . . . . . . . . . . . . . . . . . . $ 33,000
Less fixed costs . . . . . . . . . . . . . . . . . . . . . . . . . . . . . . . . . . . . . . . . . . . . . . . . . . . . . . . . . . . . . 15,000
Net operating income . . . . . . . . . . . . . . . . . . . . . . . . . . . . . . . . . . . . . . . . . . . . . . . . . . . . . . . . $ 18,000
Further assume that the management of Vortex Manufacturing, Inc.—fearing that changing economic conditions may make it difficult for thecompany to attain its present sales volume—wants to analyze the effect onthe break-even point of increasing the percentage of variable costs to salesand lowering fixed costs. Management believes that fixed costs can bereduced to $5,000, with a corresponding increase in the percentage ofvariable costs to 80%. (For example, the base salaries of salespersons couldbe lowered, and their commission percentage could be raised.)
The break-even sales volume calculated with these conditions is as follows:
Break-even sales volume ¼ $5,0001� 0:80
¼ $5,0000:20
¼ $25,000
If the proposed shift from fixed costs to variable costs is accomplished,then the break-even point would be reduced from $50,000 to $25,000. Thehigher the variable costs, the smaller the risk of not attaining the expectedbreak-even point because the variable costs are incurred only if orders forthe product are received. On the other hand, if the sales volume exceedsexpectations, then a large portion of the sales revenue beyond break-evenwill be used to cover the variable costs; thus, a smaller net operating incomemust be anticipated than if costs were mostly fixed.
To illustrate, assume that Vortex Manufacturing, Inc., achieves a salesvolume of $200,000. With a variable cost percentage of 70% and $15,000 offixed costs, the net income would amount to $45,000. If the fixed costs werereduced to $5,000 and the variable cost percentage increased to 80%, the profitwould be only $35,000—a reduction of $10,000 at the same sales volume:
Variable Cost Rate
70% 80%Sales . . . . . . . . . . . . . . . . . . . . . . . . . . . . . . . . . . . . . . . . . . . . . . . . . . . . . . . . $200,000 $200,000
Variable costs . . . . . . . . . . . . . . . . . . . . . . . . . . . . . . . . . . . . . . . . . . . . . . . . 140,000 160,000
Contribution margin . . . . . . . . . . . . . . . . . . . . . . . . . . . . . . . . . . . . . . . . . . $ 60,000 $ 40,000
Fixed costs . . . . . . . . . . . . . . . . . . . . . . . . . . . . . . . . . . . . . . . . . . . . . . . . . . 15,000 5,000
Net operating income . . . . . . . . . . . . . . . . . . . . . . . . . . . . . . . . . . . . . . . . $ 45,000 $ 35,000
Chapter 10 – Cost Analysis for Management Decision Making 497

Effect of Sales Mix on Break-even AnalysisThe examples so far have assumed a single product firm. Most manufac-turers produce and sell numerous products. Often, each of these productshas different unit sales prices, unit variable costs, and unit contributionmargins. In such instances, the sales mix must be computed before a break-even point can be determined. The sales mix is the relative percentage ofunit sales among the various products made by the firm.
For example, assume that Vortex Manufacturing, Inc., which had unit salesof 10,000 of a single product in the preceding example, now has a secondproduct with sales of 6,000 units. The sales mix would be computed as follows:
Product Unit SalesSales MixPercentage
A . . . . . . . . . . . . . . . . . . . . . . . . . . . . . . . . . . . . . . . . . . . . . . . . . . . . 10,000 62.5%
B . . . . . . . . . . . . . . . . . . . . . . . . . . . . . . . . . . . . . . . . . . . . . . . . . . . . 6,000 37.5%
Total . . . . . . . . . . . . . . . . . . . . . . . . . . . . . . . . . . . . . . . . . . . . . . . . 16,000 100.0%
Assume that adding Product B results in no increase to Vortex’s fixedcosts of $15,000 and that the unit sales prices, unit variable costs, and unitcontribution margins are as follows:
ProductUnit Sales
PriceUnit Variable
CostUnit Contribution
MarginA $10 $ 7 $3
B 15 10 5
Vortex’s break-even point depends on the sales mix and the unitcontribution margins of the individual products. The first step in the break-even computation is determining the weighted-average contribution mar-gin per unit:
Weighted-averagecontribution margin per unit
¼
ðProduct A unit contribution � Product Aunits soldÞ þ ðProduct B unit contribution �
Product B units soldÞProduct A units soldþ Product B units sold
¼ ð$3� 10,000Þ þ ð$5� 6,000)10,000þ 6,000
¼ $3.75
After the weighted-average contribution margin is computed, thebreak-even point can be determined in the usual manner:
Break-even sales volume ðunitsÞ ¼ Fixed costWeighted-average unit contribution margin
¼ $15,000$3.75
¼ 4,000 units
498 Principles of Cost Accounting

Since the sales mix percentages for products A and B are 62.5% and37.5% respectively, break-even units for the individual products are as follows:
Product A: 0:625� 4,000 ¼ 2,500Product B: 0:375� 4,000 ¼ 1,500
Observe that the individual and composite number of break-even unitswill be different at any other level of sales mix. One easy way to determinethe break-even point in sales dollars for the individual products, after thebreak-even units have been computed, is to multiply the break-evennumber of units per product by its unit sales price:
Product A: 2,500 units� $10 per unit ¼ $25,000Product B: 1,500 units� $15 per unit ¼ 22,500
Total break-even sales dollars $47,500
Contribution Margin Ratio and Marginof SafetyTwo terms frequently used in cost-volume-profit relationships are contribu-tion margin and margin of safety. The contribution margin, introduced inprevious discussions, is the difference between sales revenue and variablecosts. When an income statement depicts the contribution margin, man-agement can use it as a tool for studying the effects of changes in salesvolume on profits. The contribution margin ratio, also previously defined,is the relationship of contribution margin dollars to sales dollars.
The margin of safety indicates the amount that sales can decreasebefore the company will suffer a loss; it may be expressed as unit sales ordollar sales. The margin of safety ratio is a relationship computed bydividing margin of safety in dollars by the total sales revenue. To illustrate,assume the following income statement:
Sales (10,000 units @ $100) . . . . . . . . . . . . . . . . . . . . . . . . . . . . . . . . . . . $1,000,000 100%
Variable costs . . . . . . . . . . . . . . . . . . . . . . . . . . . . . . . . . . . . . . . . . . . . . . . . 600,000 60
Contribution margin . . . . . . . . . . . . . . . . . . . . . . . . . . . . . . . . . . . . . . . . . . $ 400,000 40%
Fixed costs . . . . . . . . . . . . . . . . . . . . . . . . . . . . . . . . . . . . . . . . . . . . . . . . . . 300,000 30
Net operating income . . . . . . . . . . . . . . . . . . . . . . . . . . . . . . . . . . . . . . . . $ 100,000 10%
In this income statement, the contribution margin is $400,000. Thecontribution margin ratio is calculated as follows:
Contribution margin ratio ¼ Contribution marginSales
¼ $400,000$1,000,000
¼ 40%
LO5Calculate the
contribution
margin ratio and the
margin of safety ratio.
Chapter 10 – Cost Analysis for Management Decision Making 499

Using the contribution margin ratio of 40%, the break-even point canbe calculated as follows:
Break-even sales volume ðdollarsÞ ¼ Fixed costsContribution margin ratio
¼ $300,0000:40
¼ $750,000
The margin of safety is computed as follows:
Margin of safety ðdollarsÞ ¼ Sales revenue� Break-even sales revenue¼ $1,000,000 -- $750,000¼ $250,000
The margin of safety ratio is calculated as follows:
Margin of safety ratio ¼Margin of safetySales
¼ $250,000$1,000,000
¼ 25%
If break-even sales equal $750,000 but the total expected sales are$1,000,000, then the margin of safety ratio shows that the $1,000,000 salesforecast can be off by as much as 25% before the firm reaches its break-even point. Because the margin of safety is directly related to net operatingincome, the margin of safety ratio can be used to calculate net operatingincome as a percentage of sales and vice versa. As the following examplesillustrate, if two of the three variables are known, then the third can bedetermined:
Net operating income percentage ¼ Contribution margin ratio�Margin of safety ratio¼ 40%� 25%
¼ 10% ðNote: This figure agrees with the netoperating income as a percent of sales asshown in the income statement on page 499:Þ
Margin of safety ratio ¼ Net operating income percentageContribution margin ratio
¼ 0:100:40
¼ 25%
Cost-volume-profit analysis assumes that the cost and profit will remainconstant (unchanged) for a given period of time. It is unrealistic to assumethat the established relationship between sales and production will remainas forecast, or even that the established sales mix will remain constant forany long period. Even price changes that have not been predicted can
500 Principles of Cost Accounting

occur, and the CVP analysis outcome will be substantially affected. If afairly stable set of relationships cannot be established, then a series ofanalyses should be prepared that recognizes the changing sets of circum-stances and their related outcomes.
Effect of Income Tax on Break-even Pointand Net IncomeIncome tax has no effect on the number of units that must be sold to breakeven because the break-even point is where the total revenue exactly equalsthe total costs, resulting in zero profit and no income tax expense. However,the income tax rate does affect the number and dollar amount of units thatmust be sold to earn a certain amount of after-tax net income. For example,if a company is in the 40% tax bracket and wants to earn an after-taxincome of $100,000, then it must have $166,667 of income before taxes (netoperating income); this is computed as follows:
Pretax income ¼ After-tax income=1�Tax rate¼ $100,000=ð1� 0:40Þ¼ $166,667
Now assume that the fixed costs are $500,000, the unit sales price is$100, and the unit variable costs are $30. The number of units that must besold to earn an after-tax income of $100,000 is computed as follows:
Target volume ðunitsÞ ¼Fixed costsþTarget after-tax income
1 �Tax rateUnit contribution margin
¼$500,000 þ $100,000
1 � 0.40$100� $30
¼ 9,524 units
Without income taxes, the number of units that must be sold to earn aprofit of $100,000 would have been only 8,571 ($600,000/$70), approxi-mately 1,000 fewer units than with the 40% tax rate. The dollar amount ofrevenue needed to earn the $100,000 after-tax income can be computed bymultiplying the 9,524 unit volume by the unit sales price of $100 to obtain$952,400, or it can be computed directly by using the target volumeformula as follows:
Target volume ðdollarsÞ ¼Fixed costsþTarget after-tax income
1 �Tax rateContribution margin ratio
¼$500,000þ $100,000
1 � 0.40ð$100� $30Þ=$100
¼ $952,381 ðA rounding difference of $19 when
compared to $952,400 calculated previously:Þ
LO6Discuss the
impact of in-
come tax on break-
even computations.
Chapter 10 – Cost Analysis for Management Decision Making 501

Differential Analysis
Marcus Foster, Sales Manager for Aero Industries, has been asked bya potential foreign customer to sell 10,000 units of a certain gear for$10 per unit. Aero normally sells this item for $15 per unit, but it hashad excess manufacturing capacity in recent months. It is anticipatedthat this would be a one-time-only order from this customer. Theproduct unit cost report for this type of gear is as follows:Direct materials . . . . . . . . . . . . . . . . . . . . . . . . . . . . . . . . . . . . . . . . . . . . . . . . . . . . . . . . . . . . . $ 3.00
Direct labor . . . . . . . . . . . . . . . . . . . . . . . . . . . . . . . . . . . . . . . . . . . . . . . . . . . . . . . . . . . . . . . . . 2.50
Variable manufacturing overhead . . . . . . . . . . . . . . . . . . . . . . . . . . . . . . . . . . . . . . . . . . . . 1.25
Fixed manufacturing overhead . . . . . . . . . . . . . . . . . . . . . . . . . . . . . . . . . . . . . . . . . . . . . . . 2.50
Variable selling and administrative expense . . . . . . . . . . . . . . . . . . . . . . . . . . . . . . . . . . . 1.75
Fixed selling and administrative expense . . . . . . . . . . . . . . . . . . . . . . . . . . . . . . . . . . . . . 2.25
Total per unit cost . . . . . . . . . . . . . . . . . . . . . . . . . . . . . . . . . . . . . . . . . . . . . . . . . . . . . . . . . . . $ 13.25
After looking at the product cost report, Foster informs the custo-mer, ‘‘I may not be an accountant, but I am smart enough to knowthat I will lose $3.25 per unit if I make this sale. Therefore, I mustrefuse your offer.’’ Do you agree with Foster’s analysis? Differentialanalysis, which is a major topic in this chapter, addresses this type ofsituation. Self-Study Problem 2, at the end of this chapter, is acontinuation of this scenario.
Not all management requirements can be satisfied by one concept orcombination of cost and revenue data. The designated purpose for which acost or revenue measurement is required must determine what items shouldbe included in the analysis. This study should then provide a series ofalternative solutions based on comparison of the different sets of relevant costand revenue data. A study that highlights the significant cost and revenuedata alternatives is referred to as differential analysis. The difference inrevenue between two alternatives—say to lease a warehouse that you ownversus using it for storage—is called differential revenue. The differencein cost between two alternatives, such as to make a component part of yourfinal product versus buying it from an outside supplier, is called differentialcost. The amount of extra profit earned from choosing the better of thealternatives is known as differential income. There are a number ofdifferent types of these analyses, a few of which are illustrated next.
Recall and Review 2
Terry Company sells its only product for $35 per unit. Fixed expenses total
$550,000 per year. Variable expenses are $800,000 when 60,000 units are
sold. The number of units that must be sold to earn an income of $50,000
is _____________.
(After working this exercise, see page 508 for the solution.)
You should now be able to work the following:
Questions 5–12; Exercises 10-7 to 10-14; Problems 10-3 to 10-10, Review
Problem 10-12R; and Self-Study Problem 1.
LO7Use differen-
tial analysis to
make special
decisions.
502 Principles of Cost Accounting

Accept or Reject a Special OrderAssume that a company, now operating at 80% capacity, has been asked bya one-time purchaser to sell additional units at less than its established salesprice. The company would make a study to determine the difference inrevenue and costs at the two volume levels.
The company produces 30,000 units at 80% of its total capacity. Itsfixed factory overhead costs are $20,000, and it sells each unit for $10.A new customer wishes to purchase 7,500 units for $4 per unit. Should thecompany agree to the terms or reject the offer?
The variable production costs per unit are as follows:
Direct materials . . . . . . . . . . . . . . . . . . . . . . . . . . . . . . . . . . . . . . . . . . . . . . . . . . . . . . . . . . . . . $2.00
Direct labor . . . . . . . . . . . . . . . . . . . . . . . . . . . . . . . . . . . . . . . . . . . . . . . . . . . . . . . . . . . . . . . . . 1.00
Variable overhead . . . . . . . . . . . . . . . . . . . . . . . . . . . . . . . . . . . . . . . . . . . . . . . . . . . . . . . . . . . 0.75
Total variable cost per unit . . . . . . . . . . . . . . . . . . . . . . . . . . . . . . . . . . . . . . . . . . . . . . . . . . . $3.75
At the present level of operations, the total production cost per unit is$4.42 ([(30,000 units � $3.75 per unit variable costs) þ $20,000 fixed costs]/30,000 units). If the additional units are produced, the total cost per unitwould be $4.28 ([(37,500 units � $3.75) þ $20,000 fixed overhead]/37,500units). Because the new customer is offering only $4 per unit, the companyapparently should not accept such an offer.
However, the total fixed factory overhead cost of $20,000 is not affectedby producing the additional units; only the differential cost (in this casevariable cost) will increase. Thus, each additional unit produced and thensold at $4 will increase the contribution margin by $0.25 ($4.00 selling price– $3.75 variable cost). If the company accepts the offer, its total increase incontribution margin would be $1,875 (7,500 units � $0.25). Because thefixed cost will not change, the operating income would also increase by$1,875; this is shown as follows:
Accept Order Reject OrderSales:
30,000 units @ $10 . . . . . . . . . . . . . . . . . . . . . . . . . . . . . . . . . . . . $ 300,000 $ 300,000
7,500 units @ $4 . . . . . . . . . . . . . . . . . . . . . . . . . . . . . . . . . . . . . . 30,000 -0-
Total revenues . . . . . . . . . . . . . . . . . . . . . . . . . . . . . . . . . . . . . $ 330,000 $ 300,000
Variable costs . . . . . . . . . . . . . . . . . . . . . . . . . . . . . . . . . . . . . . . . . . 140,625* 112,500**
Contribution margin . . . . . . . . . . . . . . . . . . . . . . . . . . . . . . . . . . . . $ 189,375 $ 187,500
Fixed overhead costs . . . . . . . . . . . . . . . . . . . . . . . . . . . . . . . . . . . . 20,000 20,000
Operating income . . . . . . . . . . . . . . . . . . . . . . . . . . . . . . . . . . . . . . . $ 169,375 $ 167,500
*37,500 units � $3.75 (variable cost)
**30,000 units � $3.75 (variable cost)
Another way of analyzing the situation is:
Differential revenue from special order (7,500 units � $4) . . . . . . . . . . . . . . . . . . . . . . $ 30,000
Differential cost from special order (7,500 � $3.75) . . . . . . . . . . . . . . . . . . . . . . . . . . . . . 28,125
Differential income from special order . . . . . . . . . . . . . . . . . . . . . . . . . . . . . . . . . . . . . . . . $ 1,875
Chapter 10 – Cost Analysis for Management Decision Making 503

The differential analysis approach is applicable only when there isexcess capacity that can be utilized at little or no increase in fixed cost. Also,in accepting additional orders at selling prices below the usual price levels,care should be exercised so that legislation barring sales to differentcustomers at different prices is not violated or that regular customers willnot expect the same price treatment for their purchases.
Many companies follow this practice of contribution pricing, whichmeans that they accept a selling price if it exceeds variable cost, and thusgenerates a positive contribution margin in times of excess capacity. Forexample, Delta Air Lines usually offers a new list of deeply discountedInternet fares each week for travel on the upcoming weekend. The citieslisted are on Delta routes where excess capacity exists. Since most of the costsof the flight (e.g., pilot and flight attendant salaries, ground crew at the arrivalcity, and depreciation and repairs on the plane) are fixed in relation to thenumber of passengers, the differential revenue generated by additionalpassengers exceeds the few differential costs that may exist—for example,snacks and beverages and a slight increase in jet fuel used due to theadditional weight of the plane. Note that Delta offers these bargain fares toattract leisure passengers, who otherwise would not travel on the designatedroute, thus increasing its total contribution margin and differential income.
Make or Buy
To illustrate another analysis of differential costs, assume that a companycurrently purchases a finished part that could perhaps be more economic-ally manufactured in its own plant. For example, assume that 40,000 partsare purchased each month at a unit price of $2.00 per part. All the tools andnecessary skills required for manufacturing this part are available in thecompany’s Machining Department.
The Machining Department has a total capacity of 30,000 direct laborhours per month. The present utilization is 24,000 direct labor hours, or80% of plant capacity, and it would take 6,000 direct labor hours to makethe parts. Analyses of the Machining Departments factory overhead costsinclude the following:
Budgeted (80%)24,000 Hours
Normal (100%)30,000 Hours
Total CostsPer Hour
Costs Total CostsPer Hour
CostsFixed overhead . . . . . . . . . . $ 72,000 $3.00 $ 72,000 $2.40
Variable overhead . . . . . . . 48,000 2.00 60,000 2.00
Total . . . . . . . . . . . . . . . . . . . . $120,000 $5.00 $132,000 $4.40
Differential cost . . . . . . . . . . $ 12,000 $0.60
The costs to manufacture the 40,000 parts in-house would be:
Materials . . . . . . . . . . . . . . . . . . . . . . . . . . . . . . . . . . . . . . . . . . . . . . . . . . . . . . . . . . . . . . . . . . . . . $ 2,000
Labor, 6,000 hours @ $8 . . . . . . . . . . . . . . . . . . . . . . . . . . . . . . . . . . . . . . . . . . . . . . . . . . . . . . . 48,000
504 Principles of Cost Accounting

Total . . . . . . . . . . . . . . . . . . . . . . . . . . . . . . . . . . . . . . . . . . . . . . . . . . . . . . . . . . . . . . . . . . . . . . . . . $50,000
Add differential variable overhead cost of 6,000 labor hours . . . . . . . . . . . . . . . . . . . . . 12,000
Total cost to manufacture parts . . . . . . . . . . . . . . . . . . . . . . . . . . . . . . . . . . . . . . . . . . . . . . . . $62,000
Cost per unit ($62,000 � 40,000) . . . . . . . . . . . . . . . . . . . . . . . . . . . . . . . . . . . . . . . . . . . . . . . $1.55
Because the Machining Department is presently operating at 80% of itstotal capacity, the company can save $18,000 ($80,000 purchased cost –$62,000 cost to make), or $0.45 per part ($2.00 – $1.55), by making ratherthan buying the 40,000 parts. If the 80% capacity level in the MachiningDepartment is a short-run condition, this factor must be considered beforethe final decision is made. The estimated savings may not be realized if theexcess capacity of the department will soon be required for the company’sregularly manufactured products.
Distribution CostsCost accounting is frequently thought of as a method of accounting onlyfor the costs of manufacturing. However, ‘‘cost’’ as a general term coversmore than merely manufacturing costs; it should include all of the costs ofdoing business. In other words, efficient control of all costs should coverdistribution costs as well as production costs. Distribution costs includethe costs incurred to sell and deliver the product.
In recent years, state and federal laws prohibiting discriminatory saleprices and the advent of increasing competition have forced accountants todevote more time to the study of distribution costs. An attempt is beingmade to determine, by means of activity-based costing, the answers to avariety of questions:
1. How much of the selling and administrative expense should be charged to eachtype of product sold?
2. How much of the selling and administrative expense is chargeable to eachparticular sales office?
3. How much of the selling and administrative expense is allocable to eachsalesperson?
4. How much of the selling and administrative expense should be charged to eachorder sold?
To illustrate some of the difficulties encountered, assume that a companyselling bakery products also operates a fleet of delivery trucks fordistributing the finished items. Each driver is a salesperson; therefore,each truck is a combination sales and delivery truck. At each stop, thedriver takes an order from the store manager for bread, cakes, cookies,and other bakery products carried on the truck and then stocks theshelves. In one store, 15 minutes may be spent selling four dozen loavesof bread, two dozen breakfast rolls, and a dozen boxes of doughnuts. In
LO8Identify tech-
niques for
analyzing and control-
ling distribution costs.
Chapter 10 – Cost Analysis for Management Decision Making 505

another store, the salesperson may need 45 minutes to sell only a dozenloaves of bread.
Suppose that the daily costs of the operation are $75 for the salesperson-driver’s salary, $30 for truck depreciation, $15 for gasoline and oil, and$5 for miscellaneous operating expenses. How much of the total truckexpense is chargeable to each sale? Should it be allocated on the basis of thenumber of sales made? Should it be allocated on the basis of the time spentat each stop by the driver? What is the cost of selling a loaf of bread, adozen doughnuts, or a package of breakfast rolls?
Businesses devote a considerable amount of time attempting to arrive atmeaningful answers to such questions. The following example will show theusefulness of distribution cost studies.
Assume that a company is making three products, A, B, and C. Themanufacturing cost per unit follows:
A . . . . . . . . . . . . . . . . . . . . . . . . . . . . . . . . . . . . . . . . . . . . . . . . . . . . . . . . . . . . . . . . . $10
B . . . . . . . . . . . . . . . . . . . . . . . . . . . . . . . . . . . . . . . . . . . . . . . . . . . . . . . . . . . . . . . . . 15
C . . . . . . . . . . . . . . . . . . . . . . . . . . . . . . . . . . . . . . . . . . . . . . . . . . . . . . . . . . . . . . . . . 5
During one month, 1,000 units of each product are sold at $15, $18,and $6 each, respectively, and the total production costs are $30,000. Thegross margin for the month would be $9,000 ($39,000 revenue – $30,000production costs). If the selling and administrative expense for the month is$4,850, then net income for the month would be $4,150, a result thatmanagement would probably regard as satisfactory. Now assume that anactivity-based costing study indicates that the distribution cost per productis as follows.
Expense A B C TotalSelling expenses:
Salaries . . . . . . . . . . . . . . . . . . . . $ 618 $ 414 $ 618 $1,650
Commissions . . . . . . . . . . . . . . . 500 500
Advertising . . . . . . . . . . . . . . . . . 600 200 200 1,000
Telephone and fax . . . . . . . . . . 40 60 100
Sales manager’s salary . . . . . . 133 133 134 400
Miscellaneous sellingexpense . . . . . . . . . . . . . . . . . . . . 127 17 56 200
Total selling expense . . . . . . . . $1,518 $ 764 1,568 3,850
Administrative expense . . . . . . . 300 350 350 1,000
Total . . . . . . . . . . . . . . . . . . . . . . . $1,818 $1,114 $1,918 $4,850
Number of units . . . . . . . . . . . . �1,000 �1,000 �1,000
Cost per unit . . . . . . . . . . . . . . . . . . $1.82 $1.11 $1.92
To arrive at these figures, the company must identify the most appro-priate cost driver for each expense and allocate these expenses to the
506 Principles of Cost Accounting

products. For example, sales salaries might be allocated to the products onthe basis of time reports showing the amount of time devoted to sellingeach product. Advertising might be allocated on the basis of the number ofsquare inches of advertising space purchased for each product. The salesmanager’s salary might be allocated based on the sales manager’s estimateof the amount of time devoted to each product. Miscellaneous sellingexpenses might be allocated on the basis of the number of orders receivedfor each product.
Using the preceding cost and sales data, we see that a profit is actuallybeing made only on Products A and B. Product C is being sold at a loss.The following table, based on the sales for the month, shows the extent ofthe gain and loss:
ProductCost toMake Cost to Sell Total Cost
SellingPrice Profit (Loss)
A . . . . . . . . . . . . . . . . $10,000 $1,818 $11,818 $15,000 $3,182
B . . . . . . . . . . . . . . . . 15,000 1,114 16,114 18,000 1,886
C . . . . . . . . . . . . . . . . 5,000 1,918 6,918 6,000 (918)
Total . . . . . . . . . . . . $30,000 $4,850 $34,850 $39,000 $4,150
As a result of the analysis of distribution costs, management determinesthat the company might make more money by selling less. If the sale ofProduct C were discontinued, it appears that the overall company profitwould be greater by the amount of the loss being sustained on C. However,a more intensive study may show that Products A and B could not sustaintheir profit margins if the inescapable costs charged to Product C, such asthe sales manager’s salary, were now charged only to A and B. Also, thebenefits of carrying a full line of products must be considered. Frequently,those factors that are more difficult to quantify play a major role indetermining whether one action or another is more justified. The perceivedoverall effect on the company usually determines such decisions.
Recall and Review 3
A company produces 25,000 units at 75% of its total capacity. Its fixed
factory overhead is $50,000, variable costs are $7.50 per unit, and it sells
each unit for $12. A foreign customer wishes to purchase 5,000 units at a
one-time price of $8 per unit. Should the company agree to the terms or
reject the offer?__________ How much additional contribution margin, if
any, would the special order generate?__________
(After working this exercise, see page 508 for the solution.)
You should now be able to work the following:
Questions 13–18; Exercises 10-15 to 10-17; Problems 10-11 to 10-13;
Self-Study Problem 2; Mini-Case 2; and the Internet Exercise.
Chapter 10 – Cost Analysis for Management Decision Making 507

KEY TERMS
Absorption costing, 482
Break-even point, 481
Break-even analysis, 492
Common cost, 489
Contribution margin, 489
Cost-volume-profit (CVP) analysis, 491
Contribution margin ratio, 493
Contribution pricing, 504
Direct costing, 482
Direct (traceable) cost, 489
Differential analysis, 502
Differential revenue, 502
Differential cost, 502
Differential income, 502
Distribution costs, 505
Full costing, 482
Gross margin, 485
Gross profit, 485
Indirect (nontraceable) cost, 489
Manufacturing margin, 485
Margin of safety, 499
Margin of safety ratio, 499
Net operating income, 492
Product costs, 482
Period costs, 482
Relevant range, 491
Segment, 488
Segment margin, 489
Sales mix, 498
Target volume, 495
Variable costing, 482
ANSWERS TO RECALL AND REVIEW EXERCISES
R&R 1
Change in inventory:
Beginning inventory . . . . . . . . . . . . . . . . . . . . . . . . . . . . . . . . . . . . . . . . . . . . . . . . . . . . . . . . . . . . . . . . . 9,000
Ending inventory . . . . . . . . . . . . . . . . . . . . . . . . . . . . . . . . . . . . . . . . . . . . . . . . . . . . . . . . . . . . . . . . . . . . 12,000
Increase in inventory . . . . . . . . . . . . . . . . . . . . . . . . . . . . . . . . . . . . . . . . . . . . . . . . . . . . . . . . . . . . . . . . 3,000 units
Fixed costs added to inventory under absorption costing: 3,000 units � $4 ¼ $12,000
Net income using variable costing . . . . . . . . . . . . . . . . . . . . . . . . . . . . . . . . . . . . . . . . . . . . . . . . . . . $ 100,000
Plus: fixed costs added to inventory . . . . . . . . . . . . . . . . . . . . . . . . . . . . . . . . . . . . . . . . . . . . . . . . . 12,000
Net income under absorption costing . . . . . . . . . . . . . . . . . . . . . . . . . . . . . . . . . . . . . . . . . . . . . . . . $ 112,000
R&R 2
Variable expenses ¼ $800,000=60;000 units ¼ $13:33 per unit
Selling price per unit . . . . . . . . . . . . . . . . . . . . . . . . . . . . . . . . . . . . . . . . . . . . . . . . . . . . . . . . . . . . . . . . $35.00
Variable cost per unit . . . . . . . . . . . . . . . . . . . . . . . . . . . . . . . . . . . . . . . . . . . . . . . . . . . . . . . . . . . . . . . . 13.33
Contribution margin per unit . . . . . . . . . . . . . . . . . . . . . . . . . . . . . . . . . . . . . . . . . . . . . . . . . . . . . . . . 21.67
Target volume ¼ $550,000þ $50,000=$21:67 ¼ 27,688 units
R&R 3
Yes, the company should accept the special order. It has enough excess capacity: 25,000 units /
.75 ¼ 33,000 units total capacity – 25,000 units current usage ¼ 8,333 excess capacity compared
to 5,000 units in the special order. Also, the special order selling price of $8 per unit is greater than
the variable cost of $7.50 per unit, resulting in additional contribution margin of $.50 per unit or
$2,500 total. Fixed costs are irrelevant.
508 Principles of Cost Accounting

SELF-STUDY PROBLEM 1
Break-even Point; Absorption and Variable Costing
Lone Star Products Company
Lone Star Products Company has a maximum productive capacity of
100,000 units per year. Normal capacity is 90,000 units per year. Standard
variable manufacturing costs are $20 per unit. Fixed factory overhead is
$450,000 per year. Variable selling expense is $10 per unit, and fixed
selling expense is $300,000 per year. The unit sales price is $50.
The operating results for the year are as follows: sales, 80,000 units;
production, 85,000 units; and beginning inventory, 5,000 units. All var-
iances are written off as additions to (or deductions from) the standard
cost of goods sold.
Required:
1. What is the break-even point expressed in dollar sales?
2. How many units must be sold to earn a net income of $50,000 per year?
3. Prepare a formal income statement for the year ended December 31,
2011 under the following:
a. Absorption costing. (Hint: Don’t forget to compute the volume
variance. You may want to review the discussion of this variance
in Chapter 8.)
b. Variable costing.
SOLUTION TO SELF-STUDY PROBLEM
1. To compute the break-even point in sales dollars, you must first
identify the total fixed costs, the variable cost per unit, and the selling
price per unit and put them into the following formula:
Break-even sales volume ¼ Fixed costs
1� ðVariable costs=SalesÞ
¼ $450,000 + $300,000
1� ½ð$20þ $10Þ=$50�
¼ $750,000
1� 0:60
¼ $750,000
0:40
¼ $1,875,000
2. To solve for the target volume in units, you must first identify the total
fixed costs, the desired net income, the unit sales price, and the unit
variable cost and put them into the following formula:
Target volume in units ¼ Fixed costsþNet income
Unit sales price�Unit variable cost
¼ $750,000 + $50,000
$50� $30
¼ 40,000 units
Chapter 10 – Cost Analysis for Management Decision Making 509

3. a. Before preparing an income statement under absorption costing,
you must:
1. Compute the standard production cost per unit:
Standard production cost per unit ¼ Variable costþ Fixed cost
¼ $20þ $450,000
90,000 units�
¼ $25
2. Compute the ending inventory:
Beginning inventory . . . . . . . . . . . . . . . . 5,000
Add production . . . . . . . . . . . . . . . . . . . . 85,000
Inventory available for sale . . . . . . . . . 90,000
Less sales . . . . . . . . . . . . . . . . . . . . . . . . . 80,000
Ending inventory . . . . . . . . . . . . . . . . . . . 10,000
3. Determine the unfavorable volume variance:
Normal capacity . . . . . . . . . . . . . . . . . . . . . . 90,000
Actual production . . . . . . . . . . . . . . . . . . . . . 85,000
Volume variance in units . . . . . . . . . . . . . . 5,000
Fixed overhead per unit . . . . . . . . . . . . . . . � $ 5
Unfavorable volume variance . . . . . . . . . $25,000
Lone Star Products CompanyAbsorption Costing Income StatementFor the Year Ended December 31, 2011
Sales (80,000 � $50) . . . . . . . . . . . . . . . . . . . . . . . . . . . . . . . $4,000,000
Less cost of goods sold:
Beginning inventory (5,000 � $25) . . . . . . . . . . . . . . . . $ 125,000
Cost of goods manufactured (85,000 � $25) . . . . . . . 2,125,000
Goods available for sale . . . . . . . . . . . . . . . . . . . . . . . . . . $2,250,000
Ending inventory (10,000 � $25) . . . . . . . . . . . . . . . . . . 250,000
Cost of goods sold at standard . . . . . . . . . . . . . . . . . . . $2,000,000
Add unfavorable volume variance . . . . . . . . . . . . . . . . 25,000
Cost of goods sold . . . . . . . . . . . . . . . . . . . . . . . . . . . . . . . 2,025,000
Gross margin . . . . . . . . . . . . . . . . . . . . . . . . . . . . . . . . . . . . . . $1,975,000
Selling expenses:
Variable (80,000 � $10) . . . . . . . . . . . . . . . . . . . . . . . . . . . $ 800,000
Fixed . . . . . . . . . . . . . . . . . . . . . . . . . . . . . . . . . . . . . . . . . . . 300,000 1,100,000
Net income . . . . . . . . . . . . . . . . . . . . . . . . . . . . . . . . . . . . . . . . $ 875,000
*Note that the fixed overhead per unit is based on normal capacity.
510 Principles of Cost Accounting

b. Before preparing an income statement under variable costing,
you must:
1. Realize that the variable production cost per unit is only $20.
2. Use the contribution margin format for your income state-
ment, where
Sales� Variable cost of goods sold ¼Manufacturing margin
Manufacturing margin� Variable selling and administrative ¼ Contribution margin
Contribution margin� Fixed costs ¼ Net income
Lone Star Products CompanyVariable Costing Income Statement
For the Year Ended December 31, 2011
Sales . . . . . . . . . . . . . . . . . . . . . . . . . . . . . . . . . . . . . . . . . . . . . $ 4,000,000
Variable costs:
Beginning inventory (5,000 � $20) . . . . . . . . . . . . . . . . $ 100,000
Cost of goods manufactured (85,000 � $20) . . . . . . . 1,700,000
Goods available for sale . . . . . . . . . . . . . . . . . . . . . . . . . . $1,800,000
Ending inventory (10,000 � $20) . . . . . . . . . . . . . . . . . . 200,000
Variable cost of goods sold . . . . . . . . . . . . . . . . . . . . . . . $ 1,600,000
Manufacturing margin . . . . . . . . . . . . . . . . . . . . . . . . . . . $ 2,400,000
Variable selling expense (80,000 � $10) . . . . . . . . . . . 800,000
Contribution margin . . . . . . . . . . . . . . . . . . . . . . . . . . . . . $ 1,600,000
Fixed costs:
Fixed factory overhead . . . . . . . . . . . . . . . . . . . . . . . . . . . $ 450,000
Fixed selling expense . . . . . . . . . . . . . . . . . . . . . . . . . . . . 300,000 750,000
Net income . . . . . . . . . . . . . . . . . . . . . . . . . . . . . . . . . . . . . . . . $ 850,000
SELF-STUDY PROBLEM 2
Differential Analysis
Aero Industries
Marcus Foster, Sales Manager for Aero Industries, has been asked by a
potential foreign customer to sell 10,000 units of a certain gear for $10 per
unit. Aero normally sells this item for $15 per unit, but it has had some
excess manufacturing capacity in recent months. It is anticipated that this
would be a one-time-only order from this customer. The product unit cost
report for this type gear is as follows:
Direct materials . . . . . . . . . . . . . . . . . . . . . . . . . . . . . . . . . . . . . . . . . . . . . . . . . . . . . . . . . . . . $ 3.00
Direct labor . . . . . . . . . . . . . . . . . . . . . . . . . . . . . . . . . . . . . . . . . . . . . . . . . . . . . . . . . . . . . . . . 2.50
Variable manufacturing overhead . . . . . . . . . . . . . . . . . . . . . . . . . . . . . . . . . . . . . . . . . . . 1.25
Fixed manufacturing overhead . . . . . . . . . . . . . . . . . . . . . . . . . . . . . . . . . . . . . . . . . . . . . . 2.50
Chapter 10 – Cost Analysis for Management Decision Making 511

Variable selling and administrative expense . . . . . . . . . . . . . . . . . . . . . . . . . . . . . . . . . 1.75
Fixed selling and administrative expense . . . . . . . . . . . . . . . . . . . . . . . . . . . . . . . . . . . . 2.25
Total per unit cost . . . . . . . . . . . . . . . . . . . . . . . . . . . . . . . . . . . . . . . . . . . . . . . . . . . . . . . . . . $ 13.25
After looking at the product cost report, Foster informs the customer,
‘‘I may not be an accountant, but I am smart enough to know that I will
lose $3.25 per unit if I make this sale. Therefore, I must refuse your offer.’’
Required:
1. From the list of costs in the product cost report, which costs would be
relevant to the decision to sell at the special price?
2. What will be the amount of the total relevant cost per unit in regard to
this order?
3. What would be the differential income (loss) to Aero Industries if this
order were accepted?
4. Are there any nonfinancial factors that you would consider in making
this decision?
SOLUTION TO SELF-STUDY PROBLEM
1. The relevant costs in this case are the ones that will change if the
special order is accepted. These include the variable costs which are:
Direct materials
Direct labor
Variable manufacturing overhead
Variable selling and administrative expense*
2. The additional costs that will be incurred per unit if the special order is
accepted are as follows:
Direct materials . . . . . . . . . . . . . . . . . . . . . . . . . . . . . . . . . . . . . . . . . . . . . . . . . . . . . . . . $3.00
Direct labor . . . . . . . . . . . . . . . . . . . . . . . . . . . . . . . . . . . . . . . . . . . . . . . . . . . . . . . . . . . . 2.50
Variable mfg. overhead . . . . . . . . . . . . . . . . . . . . . . . . . . . . . . . . . . . . . . . . . . . . . . . . . 1.25
Variable S&A expense . . . . . . . . . . . . . . . . . . . . . . . . . . . . . . . . . . . . . . . . . . . . . . . . . . 1.75
Total per unit relevant cost . . . . . . . . . . . . . . . . . . . . . . . . . . . . . . . . . . . . . . . . . . . . . . $8.50
3. To determine the differential profit (loss) to the company if the order is
accepted, the differential (additional) revenue from the order must be
compared to the differential (additional) costs that will be incurred if
the order is accepted. The differential revenue is computed as follows:
10,000 units� $10 per unit ¼ $100,000
The differential costs consist of the $8.50 of variable costs per unit
that will be incurred only if the order is accepted:
10,000 units �$8.50 per unit = $85,000
*Some of the usual variable selling and administrative expenses may not beincurred if the special order is accepted, because the customer came to Fosterunsolicited. For the remainder of this solution, the assumption is that all of thisexpense is relevant.
512 Principles of Cost Accounting

To compute the differential income, the differential revenue must be
compared to the differential costs:
Differential revenue . . . . . . . . . . . . . . . . . . . . . . . . . . . . . . . . . . . . . . . . . . . . . . . . . $100,000
Differential costs . . . . . . . . . . . . . . . . . . . . . . . . . . . . . . . . . . . . . . . . . . . . . . . . . . . 85,000
Differential income . . . . . . . . . . . . . . . . . . . . . . . . . . . . . . . . . . . . . . . . . . . . . . . . . $ 15,000
4. Nonfinancial factors to be considered include whether:
a. the excess capacity is sufficient to produce the 10,000 units with-
out taking away from the manufacture of units that can be sold at
full price.
b. the selling price will become known to regular customers, who
then will demand a similar price.
c. it will be a one-time-only order or if this customer will be a source
of future business, thus demanding the same price breaks on
follow-up orders.
QUESTIONS
1. What is the difference between absorption
costing and variable costing?
2. What effect will applying variable costing
have on the income statement and the
balance sheet?
3. What are the advantages and disadvan-
tages of using variable costing?
4. How is it possible, under absorption cost-
ing, to increase net income by simply pro-
ducing more goods?
5. Why are there objections to using absorp-
tion costing when segment reports of prof-
itability are being prepared?
6. What are common costs?
7. How is a contribution margin determined,
and why is it important to management?
8. What are considered direct costs in seg-
ment analysis?
9. What is cost-volume-profit analysis?
10. What is the break-even point?
11. What steps are required in constructing a
break-even chart?
12. What is the difference between the contri-
bution margin ratio and the margin of
safety ratio?
13. Define differential analysis, differential reve-
nue, differential cost, and differential income.
14. What is the importance of make-or-buy
studies for a company?
15. How can an airline generate additional
profit if it is charging last-minute passen-
gers significantly less than full price?
16. What are distribution costs?
17. What is the purpose of the analysis of
distribution costs?
18. In cost analysis, what governs which costs
are to be included in the study?
Chapter 10 – Cost Analysis for Management Decision Making 513

EXERCISES
E10-1 Computing unit cost and cost of inventory—variable andabsorption costingLynne Products Company uses a process cost system and
applies actual factory overhead to work in process at the end of
the month. The following data came from the records for the
month of March:
Direct materials . . . . . . . . . . . . . . . . . . . . . . . . . . . . . . . . . . . . . . . . . . . . . . $200,000
Direct labor . . . . . . . . . . . . . . . . . . . . . . . . . . . . . . . . . . . . . . . . . . . . . . . . . . $100,000
Variable factory overhead . . . . . . . . . . . . . . . . . . . . . . . . . . . . . . . . . . . . $ 80,000
Fixed factory overhead . . . . . . . . . . . . . . . . . . . . . . . . . . . . . . . . . . . . . . . $ 60,000
Selling and administrative expenses . . . . . . . . . . . . . . . . . . . . . . . . . . $ 40,000
Units produced . . . . . . . . . . . . . . . . . . . . . . . . . . . . . . . . . . . . . . . . . . . . . . 25,000
Units sold . . . . . . . . . . . . . . . . . . . . . . . . . . . . . . . . . . . . . . . . . . . . . . . . . . . 20,000
Selling price per unit . . . . . . . . . . . . . . . . . . . . . . . . . . . . . . . . . . . . . . . . . $ 25
There were no beginning inventories and no work in pro-
cess at the end of the month.
From the information presented, compute the following:
1. Unit cost of production under absorption costing and vari-
able costing.
2. Cost of the ending inventory under absorption costing and
variable costing.
E10-2 Comparative income statements—variable and absorptioncostingUsing the information presented in E10-1, prepare comparative
income statements for March (a) under absorption costing and
(b) under variable costing.
E10-3 Using variable costing and absorption costingThe chief executive officer (CEO) of Button Corporation at-
tended a conference in which one of the sessions was devoted
to variable costing. The CEO was impressed by the presenta-
tion and has asked that the following data of Button Corpora-
tion be used to prepare comparative statements using variable
costing and the company’s absorption costing. The data follow:
Direct materials . . . . . . . . . . . . . . . . . . . . . . . . . . . . . . . . . . . . . . . . . . . . . . . $ 90,000
Direct labor . . . . . . . . . . . . . . . . . . . . . . . . . . . . . . . . . . . . . . . . . . . . . . . . . . . 120,000
Variable factory overhead . . . . . . . . . . . . . . . . . . . . . . . . . . . . . . . . . . . . . . 60,000
Fixed factory overhead . . . . . . . . . . . . . . . . . . . . . . . . . . . . . . . . . . . . . . . . 150,000
Fixed marketing and administrative expense . . . . . . . . . . . . . . . . . . . . 180,000
The factory produced 80,000 units during the period, and
70,000 units were sold for $700,000.
LO2
LO1
LO1
514 Principles of Cost Accounting

1. Prepare an income statement using variable costing.
2. Prepare an income statement using absorption costing.
(Round unit costs to three decimal places.)
E10-4 Using variable and absorption costingThe following production data came from the records of LeShaq
Athletic Enterprises for the year ended December 31, 2011:
Materials . . . . . . . . . . . . . . . . . . . . . . . . . . . . . . . . . . . . . . . . . . . . . . . . . . . . $480,000
Labor . . . . . . . . . . . . . . . . . . . . . . . . . . . . . . . . . . . . . . . . . . . . . . . . . . . . . . . . 260,000
Variable factory overhead . . . . . . . . . . . . . . . . . . . . . . . . . . . . . . . . . . . . 44,000
Fixed factory overhead . . . . . . . . . . . . . . . . . . . . . . . . . . . . . . . . . . . . . . . 36,800
During the year, 40,000 units were manufactured but only
35,000 units were sold.
Determine the effect on inventory valuation by computing
the following:
1. Total inventoriable costs and the cost of the 35,000 units
sold and of the 5,000 units in the ending inventory, using
variable costing.
2. Total inventoriable costs and the cost of the 35,000 units
sold and of the 5,000 units in the ending inventory, using
absorption costing.
E10-5 Determining income by absorption costingA company had income of $50,000, using variable costing for a
given period. Beginning and ending inventories for the period
were 18,000 units and 13,000 units, respectively. If the fixed
overhead application rate was $2 per unit, what was the net
income, using absorption costing?
E10-6 Adjusting variable cost income to absorption net incomeThe fixed overhead budgeted for Hamlet Company at an ex-
pected capacity of 500,000 units is $1,500,000. Variable costing
is used internally, and the net income is adjusted to an absorp-
tion costing net income at year-end. Data collected over the last
three years show the following:
First YearSecond
Year Third YearUnits produced . . . . . . . . . . . . . . . 502,000 498,000 495,000
Units sold . . . . . . . . . . . . . . . . . . . . 496,000 503,000 495,000
Net income—(variable cost) . . . $500,000 $521,000 $497,000
Determine the adjustment each year to convert the variable
costing income to absorption costing net income. Compute the
absorption costing net income for each year.
E10-7 Segment reporting by divisionGrecian Products, Inc., has two divisions, Athens and Sparta. For
the month ended March 31, Athens had sales and variable costs
LO1
LO1
LO2
LO1
LO2
LO3
Chapter 10 – Cost Analysis for Management Decision Making 515

of $500,000 and $225,000, respectively, and Sparta had sales and
variable costs of $800,000 and $475,000, respectively. Athens
had direct fixed production and administrative expenses of
$60,000 and $35,000, respectively, and Sparta had direct fixed
production and administrative expenses of $80,000 and $45,000,
respectively. Fixed costs that were common to both divisions
and couldn’t be allocated to the divisions in any meaningful
way were selling, $33,000, and administration, $27,000.
Prepare a segmented income statement by division for the
month of March.
E10-8 Computing break-evenThe sales price per unit is $13 for the Dakota Company’s only
product. The variable cost per unit is $5. In year 2011, the
company sold 80,000 units, which was 10,000 units above the
break-even point.
Compute the following:
1. Total fixed expenses. (Hint: First compute the contribution
margin per unit.)
2. Total variable expense at the break-even volume.
E10-9 Computing break-even plus target volumeJackson Company sells its only product for $50 per unit. Fixed
expenses total $800,000 per year. Variable expenses are $1,000,000
when 40,000 units are sold.
How many units must be sold to earn a net operating income
of $75,000?
E10-10 Using break-even analysisA new product is expected to have sales of $100,000, variable
costs of 60% of sales, and fixed costs of $20,000.
1. Using graph paper, construct a break-even chart and label
the sales line, total cost line, fixed cost line, break-even
point, and net income and net loss areas.
2. From the chart, identify the break-even point and the
amount of income or loss if sales are $100,000.
E10-11 Sales mix and break-even analysisLeisure Products, Inc., manufactures and sells two products,
golf balls and tennis balls. Fixed costs are $100,000, and
unit sales are 60,000 sheaths of golf balls and 40,000 cans of
tennis balls. The unit sales prices and unit variable costs are as
follows:
Product Unit Sales Price Unit Variable CostGolf balls $6 $3.00
Tennis balls 4 1.50
LO4
LO4
LO4
LO4
516 Principles of Cost Accounting

1. Compute the sales mix percentages.
2. Compute the overall break-even unit sales.
3. Compute the unit sales of golf balls and tennis balls at the
break-even point.
E10-12 Using CVP analysisA company has sales of $1,000,000, variable costs of $250,000,
and fixed costs of $600,000. Compute the following:
1. Contribution margin ratio.
2. Break-even sales volume.
3. Margin of safety ratio.
4. Net operating income as a percentage of sales.
E10-13 Using break-even analysisA company has prepared the following statistics regarding its
production and sales at different capacity levels.
Capacity level 60% 80% 100%Units . . . . . . . . . . . . . . . . . . . . . . . . . 60,000 80,000 100,000
Sales . . . . . . . . . . . . . . . . . . . . . . . . . $240,000 $320,000 $400,000
Total costs:
Variable . . . . . . . . . . . . . . . . . . . . $120,000 $160,000 $200,000
Fixed . . . . . . . . . . . . . . . . . . . . . . . 150,000 150,000 150,000
Total costs . . . . . . . . . . . . . . . . . . $270,000 $310,000 $350,000
Net operating income (loss) . . . $ (30,000) $ 10,000 $ 50,000
1. At what point is break-even reached in sales dollars? In
units?
2. If the company is operating at 60% capacity, should it accept
an offer from a customer to buy 10,000 units at $3 per unit?
E10-14 Effect of taxes on break-even and target volumeLewis Products, Inc., desires to earn an after-tax income of
$150,000. It has fixed costs of $1,000,000, a unit sales price of
$500, and unit variable costs of $200. The company is in the
30% tax bracket.
1. How many dollars of sales revenue must be earned to
achieve the after-tax profit of $150,000?
2. How many dollars of revenue would have to be earned to
achieve the $150,000 of profit, if there had been no income
tax?
E10-15 Using differential analysis—special customer orderDribble, Inc., manufactures basketballs. The company’s fore-
casted income statement for the year, before any special
orders, is as follows:
LO4
LO5
LO4
LO7
LO6
LO7
Chapter 10 – Cost Analysis for Management Decision Making 517

Amount Per UnitSales . . . . . . . . . . . . . . . . . . . . . . . . . . . . . . $8,000,000 $10.00
Manufacturing cost of goods sold . . . 6,400,000 8.00
Gross profit . . . . . . . . . . . . . . . . . . . . . . . . $1,600,000 $ 2.00
Selling expenses . . . . . . . . . . . . . . . . . . . 600,000 1.00
Net operating income . . . . . . . . . . . . . . $1,000,000 $ 1.00
Fixed costs included in the forecasted income statement are
$4,000,000 in manufacturing cost of goods sold and $400,000 in
selling expenses.
A new client placed a special order with Dribble, offering to
buy 100,000 basketballs for $6.00 each. The company will incur
no additional selling expenses if it accepts the special order.
Assuming that Dribble has sufficient capacity to manufacture
100,000 more basketballs, by what amount would differential
income increase (decrease) as a result of accepting the special
order? (Hint: First compute the variable cost per unit relevant to
this decision.)
E10-16 Deciding to make or buyAlpha Company needs 20,000 units of a certain part to use in its
production cycle. The following information is available:
Cost to Alpha to make the part:
Direct materials . . . . . . . . . . . . . . . . . . . . . . . . . . . . . . . $ 4
Direct labor . . . . . . . . . . . . . . . . . . . . . . . . . . . . . . . . . . . 16
Variable factory overhead . . . . . . . . . . . . . . . . . . . . . 12
Fixed factory overhead applied . . . . . . . . . . . . . . . . 6
Total . . . . . . . . . . . . . . . . . . . . . . . . . . . . . . . . . . . . . . . $38
Cost to buy the part from Bravo Company . . . . . . . . $36
If Alpha buys the part from Bravo instead of making it,
Alpha could not use the released facilities in another manufac-
turing activity. Eighty percent of the fixed factory overhead
applied will continue regardless of what decision Alpha makes.
1. In deciding whether to make or buy the part, what are the
total relevant costs per unit to make the part?
2. What decision should Alpha make?
E10-17 Using comparative net income analysisJulian Manufacturing, Inc., wishes to determine the profitability
of its products and asks the cost accountant to make a com-
parative analysis of sales, cost of sales, and distribution costs
of each product for the year. The accountant gathers the follow-
ing information, which will be useful in preparing the analysis:
LO7
LO3
LO8
518 Principles of Cost Accounting

Product X Product Y Product ZNumber of units sold . . . . . . . . . . 30,000 20,000 20,000
Number of orders received . . . . 5,000 2,500 1,000
Selling price per unit . . . . . . . . . . $ 50 $ 75 $ 100
Cost per unit . . . . . . . . . . . . . . . . . . $ 30 $ 50 $ 75
Advertising expenses total $600,000 for the year, with an
equal amount expended to advertise each product. The sales
representative’s commission is based on the selling price of
each unit and is 10% for Product X, 14% for Product Y, and 18%
for Product Z. The sales manager’s salary of $75,000 per year is
allocated evenly to each product. Other miscellaneous selling
and administrative expenses are estimated to be $15 per order
received.
Prepare an analysis for Julian Manufacturing, Inc., that will
show in comparative form the income derived from the sale of
each product for the year.
PROBLEMS
P10-1 Absorption and variable costing income statements
Spaulding Manufacturing Company has determined the cost of
manufacturing a unit of product as follows, based on normal
production of 100,000 units per year:
Direct materials . . . . . . . . . . . . . . . . . . . . $ 5
Direct labor . . . . . . . . . . . . . . . . . . . . . . . . 4
Variable factory overhead . . . . . . . . . . 3
Fixed factory overhead . . . . . . . . . . . . . 3
Total cost . . . . . . . . . . . . . . . . . . . . . . . . . . $15
Operating statistics for the months of March and April include
the following:
March AprilUnits produced . . . . . . . . . . . . . . . . . . . . 12,000 8,000
Units sold . . . . . . . . . . . . . . . . . . . . . . . . . 8,000 12,000
Selling and administrativeexpenses (all fixed) . . . . . . . . . . . . . . . $12,000 $12,000
The selling price is $20 per unit. There were no inventories on
March 1, and there is no work in process on April 30.
LO1
Chapter 10 – Cost Analysis for Management Decision Making 519

Required:
Prepare comparative income statements for each month under
each of the following:
1. Absorption costing (include under- or overapplied fixed
overhead).
2. Variable costing.
P10-2 Absorption costing versus direct costing
Marion Corporation has determined the following selling price
and manufacturing cost per unit based on normal production of
72,000 units per year:
Selling price per unit . . . . . . . . . . . . . . . . . . . . . . . . . . . . . . . . . . . . . . . $ 22
Variable cost per unit:
Direct materials . . . . . . . . . . . . . . . . . . . . . . . . . . . . . . . . . . . . . . . . . . . $ 4
Direct labor . . . . . . . . . . . . . . . . . . . . . . . . . . . . . . . . . . . . . . . . . . . . . . . 4
Variable factory overhead . . . . . . . . . . . . . . . . . . . . . . . . . . . . . . . . . . 2
Variable cost per unit . . . . . . . . . . . . . . . . . . . . . . . . . . . . . . . . . . . . . . $ 10
Fixed cost per unit:
Fixed factory overhead per year . . . . . . . . . . . . . . . . . . . . . . . . . . . . $ 360,000
Fixed selling and administrative expense per year . . . . . . . . . . . 48,000
Normal unit production per year . . . . . . . . . . . . . . . . . . . . . . . . . . . 72,000
Month Units Produced Units SoldOctober . . . . . . . . . . . . . . . . . . . . . . 6,000 3,000
November . . . . . . . . . . . . . . . . . . . . 1,000 4,000
December . . . . . . . . . . . . . . . . . . . . 8,000 6,000
October has no beginning inventories.
Required:
Prepare comparative income statements, including a compara-
tive schedule of cost of goods sold, for each of these three
months in 2011 under each of the following:
1. Absorption costing (include under- or overapplied overhead).
2. Variable costing.
P10-3 Segmented income statement
Janitorial Products, Inc., manufactures two products, brooms
and mops, which are sold in two territories designated by the
company as East Territory and West Territory. The following
income statement prepared for the company shows the product-
line segments.
LO1
LO3
520 Principles of Cost Accounting

Janitorial Products, Inc.Income Statement
Total Brooms MopsSales . . . . . . . . . . . . . . . . . . . . $1,000,000 $600,000 100% $400,000 100%
Less variable expenses . . . 600,000 420,000 70 180,000 45
Contribution margin . . . . . $ 400,000 $180,000 30% $220,000 55%
Less direct fixed costs . . . . 200,000 50,000 150,000
Segment margin . . . . . . . . . $ 200,000 $130,000 $ 70,000
Less common fixed costs 120,000
Net income . . . . . . . . . . . . . . $ 80,000
The territorial product sales are as follows:
East WestBrooms . . . . . . . . . . . . . . . . . . . . . . $400,000 $200,000
Mops . . . . . . . . . . . . . . . . . . . . . . . . . 200,000 200,000
Total . . . . . . . . . . . . . . . . . . . . . . . . . $600,000 $400,000
The direct fixed costs of brooms ($50,000) and mops ($150,000)
are not identifiable with either of the two territories. The com-
mon fixed costs are partially identifiable with East Territory,
West Territory, and the general administration as follows:
East Territory . . . . . . . . . . . . . . . . . $ 54,000
West Territory . . . . . . . . . . . . . . . . 36,000
General administration . . . . . . . . 30,000
Total common fixed costs . . . $120,000
Required:
1. Prepare a segmented income statement by territories. The
direct fixed costs of the product lines should be treated as
common fixed costs on the segmented statement being
prepared.
2. What is the significance of this analysis?
P10-4 Segment reporting
Digital Software, Inc., has two product lines. The income state-
ment for the year ended December 31 shows the following:LO3
Chapter 10 – Cost Analysis for Management Decision Making 521

Digital Software, Inc.Product Line and Company Income Statement
For the Year Ended December 31, 2011
Num 1 Num 2 TotalSales . . . . . . . . . . . . . . . . . . . . . . . . . $400,000 $600,000 $1,000,000
Less variable expenses . . . . . . . . 160,000 240,000 400,000
Contribution margin . . . . . . . . . . $240,000 $360,000 $ 600,000
Less direct fixed expenses . . . . . 160,000 140,000 300,000
Product margin . . . . . . . . . . . . . . . $ 80,000 $220,000 $ 300,000
Less common fixed expenses . . 120,000
Net income . . . . . . . . . . . . . . . . . . . $ 180,000
The products, Num 1 and Num 2, are sold in two territories,
North and South, as follows:
North SouthNum 1 . . . . . . . . . . . . . . . . . . . . . . . . $240,000 $160,000
Num 2 . . . . . . . . . . . . . . . . . . . . . . . . 180,000 420,000
Total sales . . . . . . . . . . . . . . . . . . . . $420,000 $580,000
The common fixed expenses are traceable to each territory as
follows:
North fixed expenses . . . . . . . . . . . . . . . . . . . . . . . . . . . . $ 40,000
South fixed expenses . . . . . . . . . . . . . . . . . . . . . . . . . . . 60,000
Home office administrative fixed expenses . . . . . . . 20,000
Total common fixed expenses . . . . . . . . . . . . . . . . . $120,000
The direct expenses of Num 1, $160,000, and of Num 2,
$140,000, are not identifiable with either of the two territories.
Required:
1. Prepare income statements for the year, segmented by terri-
tory and including a column for the entire company.
2. Why are direct expenses of one type of segment report not
direct expenses of another type of segment report?
P10-5 Segment reporting
South-Central Publishing Company prepares income statements
segmented by divisions, but the chief operating officer is not
certain about how the company is actually performing. Financial
data for the year follow:
LO3
LO7
522 Principles of Cost Accounting

Segments
TextbookDivision
ElectronicDivision
TotalCompany
Sales . . . . . . . . . . . . . . . . . . . . . . . . . $360,000 $840,000 $1,200,000
Less variable expenses:
Manufacturing . . . . . . . . . . . . . . $ 64,000 $422,000 $ 486,000
Selling and administrative . . . 8,000 42,000 50,000
Total . . . . . . . . . . . . . . . . . . . . . . . $ 72,000 $464,000 $ 536,000
Contribution margin . . . . . . . . . . $288,000 $376,000 $ 664,000
Less direct fixed expenses . . . . . 30,000 440,000 470,000
Net income . . . . . . . . . . . . . . . . . . . $258,000 $ (64,000) $ 194,000
The Electronic Publishing Division appears to be floundering,
and the CEO believes a closer look should be taken concerning
its operating effectiveness. Additional data regarding this divi-
sion follow:
Accounting Executive ManagementSales . . . . . . . . . . . . . . . . . . . . . . . . . . . . . . . $300,000 $280,000 $260,000
Variable manufacturing expenses asa percentage of sales . . . . . . . . . . . . . . . 60% 40% 50%
Other variable expenses as apercentage of sales . . . . . . . . . . . . . . . . 5% 5% 5%
Direct fixed expenses . . . . . . . . . . . . . . . . $100,000 $150,000 $100,000
The Electronic Division’s accounting books are downloadable
texts sold to auditors and controllers. The current data on these
two markets follow:
Sales Market
Auditors ControllersSales . . . . . . . . . . . . . . . . . . . . . . . . . . . . . . . . . . . . . . . . . . . . $80,000 $220,000
Variable manufacturing expenses as a percentage ofsales . . . . . . . . . . . . . . . . . . . . . . . . . . . . . . . . . . . . . . . . . . . 60% 60%
Other variable expenses as a percentage of sales . . . 5% 5%
Direct fixed expenses . . . . . . . . . . . . . . . . . . . . . . . . . . . . . $30,000 $ 50,000
Required:
1. Prepare an income statement segmented by products of the
Electronic Division, for the year ended 2011, including a
column for the division as a whole. (Hint: To obtain the
common fixed expenses, start with the total direct expenses
in the Electronic Division.)
2. Prepare an income statement, segmented by markets, for the
accounting books of the Electronic Division.
3. Evaluate the accounting books of the Electronic Division.
Should all books be kept, or should some books be
discontinued?
Chapter 10 – Cost Analysis for Management Decision Making 523

P10-6 Break-even analysis
The production of a new product required Mirage Manufacturing
Company to lease additional plant facilities. Based on studies,
the following data have been made available:
Estimated annual sales—24,000 units
Amount Per UnitEstimated costs:
Materials . . . . . . . . . . . . . . . . . . . $ 96,000 $4.00
Direct labor . . . . . . . . . . . . . . . . . 14,400 0.60
Factory overhead . . . . . . . . . . . 24,000 1.00
Administrative expense . . . . . 28,800 1.20
Total . . . . . . . . . . . . . . . . . . . . . $163,200 $6.80
Selling expenses are expected to be 5% of sales, and net income
is to amount to $2.00 per unit.
Required:
1. Calculate the selling price per unit. (Hint: Let ‘‘X’’ equal the
selling price and express selling expense as a percent of ‘‘X’’.)
2. Prepare an absorption costing income statement for the year
ended December 31, 2011.
3. Calculate the break-even point expressed in dollars and in
units, assuming that administrative expense and factory over-
head are all fixed but other costs are fully variable.
P10-7 Contribution margin and break-even analysis
Rancho Santa Fe Manufacturing, Inc., produces and sells a pro-
duct with a price of $100 per unit. The following cost data have
been prepared for its estimated upper and lower limits of activity:
Lower Limit Upper LimitProduction (units) . . . . . . . . . . . . . . . . . . 4,000 6,000
Production costs:
Direct materials . . . . . . . . . . . . . . . . . . $60,000 $ 90,000
Direct labor . . . . . . . . . . . . . . . . . . . . . . 80,000 120,000
Overhead: . . . . . . . . . . . . . . . . . . . . . . .
Indirect materials . . . . . . . . . . . . . . 25,000 37,500
Indirect labor . . . . . . . . . . . . . . . . . . 40,000 50,000
Depreciation . . . . . . . . . . . . . . . . . . . 20,000 20,000
Selling and administrative expenses:
Sales salaries . . . . . . . . . . . . . . . . . . . . 50,000 65,000
Office salaries . . . . . . . . . . . . . . . . . . . . 30,000 30,000
Advertising . . . . . . . . . . . . . . . . . . . . . . 45,000 45,000
Other . . . . . . . . . . . . . . . . . . . . . . . . . . . . 15,000 20,000
Total . . . . . . . . . . . . . . . . . . . . . . . . . . . . $365,000 $477,500
LO1
LO4
LO4
524 Principles of Cost Accounting

Required:
1. Classify each cost element as either variable, fixed, or semi-
variable. (Hint: Recall that variable expenses must go up in
direct proportion to changes in the volume of activity.)
2. Calculate the break-even point in units and dollars. (Hint: First
use the high-low method illustrated in Chapter 4 to separate
costs into their fixed and variable components.)
3. Prepare a break-even chart.
4. Prepare a contribution income statement, similar in format to
the statement appearing at the top of page 497, assuming
sales of 5,000 units.
5. Recompute the break-even point in units, assuming that vari-
able costs increase by 20% and fixed costs are reduced by
$50,000.
P10-8 Calculating sales mix, break-even point in units, and break-evenpoint in dollars
The Nut House, Inc., sells three types of nuts: almonds, cashews,
and walnuts. Ten thousand cans of nuts were sold in 2011, and
the amount of walnuts sold were twice as much as the number
of cans of cashews, whereas almond sales were one-half the
amount of cashew sales. Fixed costs were $40,000, and the unit
sales prices and unit variable costs were as follows:
ProductUnit Sales
Price Unit Variable CostAlmonds $ 8 $4
Cashews 10 5
Walnuts 6 4
Required:
1. Compute the number of cans of each kind of nut sold.
2. Compute the sales mix percentages.
3. Compute the weighted-average contribution margin per unit.
4. Compute the overall break-even unit sales.
5. Compute the unit sales of almonds, cashews, and walnuts at
the break-even point.
6. Compute the break-even dollar sales of almonds, cashews,
and walnuts.
P10-9 Calculating break-even point, contribution margin ratio, andmargin of safety ratio
Limerick Enterprises, Inc., is considering building a manufactur-
ing plant in Dublin. Predicting sales of 100,000 units, Limerick
estimates the following expenses:
LO4
LO4
LO5
Chapter 10 – Cost Analysis for Management Decision Making 525

Total AnnualExpenses
Percent of Total AnnualExpenses That Are
FixedMaterials . . . . . . . . . . . . . . . . $19,000 10%
Labor . . . . . . . . . . . . . . . . . . . 26,000 20%
Overhead . . . . . . . . . . . . . . . 40,000 40%
Marketing andadministration . . . . . . . . . 14,000 60%
$99,000
An Irish firm that specializes in marketing will be engaged to sell
the manufactured product and will receive a commission of 10%
of the sales price. None of the U.S. home office expense will be
allocated to the Irish facility.
Required:
1. If the unit sales price is $2, how many units must be sold to
break even? (Hint: First compute the variable cost per unit.)
2. Calculate the margin of safety ratio.
3. Calculate the contribution margin ratio.
P10-10 Effect of taxes on break-even and target volume
Buscemi Products, Inc., desires an after-tax income of $500,000.
It has fixed costs of $2,500,000, a unit sales price of $300, and
unit variable costs of $150, and is in the 40% tax bracket.
Required:
1. What amount of pre-tax income is needed to earn an after-tax
income of $500,000?
2. What target volume sales revenue must be reached to earn
the $500,000 after-tax income?
3. Assuming that this is a single-product firm, how many units
must be sold to earn the after-tax income of $500,000?
4. What target volume sales revenue would have been needed
to achieve the $500,000 of income had no income tax
existed?
P10-11 Make or buy
Eradicate, Inc., produces and sells a line of insect repellants that
are sold primarily in the summer months. Recently, the chief
operating officer has become interested in possibly manufactur-
ing a repellant, ‘‘Halt’’ that can prevent a person from being
attacked by use of a ‘‘pepper’’ repellant. The appeal of this
product is that it would have year-round sales and would help
stabilize the income of the company.
The product, however, must be sold in a specially designed
spray can that will be safe from being discharged accidentally.
The product will be sold in cartons that hold 24 cans of the
repellant. The sales price will be $96 per carton. The plant is now
operating at only 65% of its total capacity, so no additional fixed
LO6
LO7
526 Principles of Cost Accounting

costs will be incurred. However, a $100,000 fixed overhead
charge will be allocated to the new product from the company’s
present total of fixed costs.
Using the current estimates for 100,000 cartons of ‘‘Halt’’ as a
standard volume, the following costs were developed for each
carton, including the cost of the can:
Direct materials . . . . . . . . . . . . . . . . . . . . . . . . . . . . . . $12
Direct labor . . . . . . . . . . . . . . . . . . . . . . . . . . . . . . . . . . 6
Overhead (includes allocated fixed charge) . . . . 4
Total cost per carton . . . . . . . . . . . . . . . . . . . . . . . . . . $22
Eradicate, Inc., has requested a bid from a manufacturer of
specialty dispensers for a purchase price of an empty can that
could be used for the new product. The specialty company
offered a price of $5 for a carton of cans. If the proposal is
accepted, Eradicate, Inc., estimates that direct labor and variable
overhead costs would be reduced by 10% and direct materials
would be reduced by 20%.
Required:
1. Should Eradicate make or buy the special cans? (Hint: First
compute the costs that could be saved by buying the cans.)
2. What would be the maximum purchase price acceptable to
Eradicate for the cans?
P10-12R Comprehensive Review Problem: Break-even point; absorptionand variable cost analysissimilar to Self-Study Problem 1
Mallory Manufacturing Company has a maximum productive
capacity of 210,000 units per year. Normal capacity is 180,000
units per year. Standard variable manufacturing costs are $10
per unit. Fixed factory overhead is $360,000 per year. Variable
selling expense is $5 per unit, and fixed selling expense is
$252,000 per year. The unit sales price is $20.
The operating results for the year are as follows: sales,
150,000 units; production, 160,000 units; beginning inventory,
10,000 units. All variances are written off as additions to (or
deductions from) the standard cost of sales.
Required:
1. What is the break-even point expressed in dollar sales?
2. How many units must be sold to earn a net operating income
of $100,000 per year?
3. Prepare a formal income statement for the year ended De-
cember 31, 2011 under the following:
a. Absorption costing. (Hint: Don’t forget to compute the
volume variance.)
b. Variable costing.
LO1
LO4
Chapter 10 – Cost Analysis for Management Decision Making 527

MINI-CASE 1
Ethics, absorption costing
The board of directors of Garden City Gaskets, Inc., set the profit goal for
the calendar year 2011 at $2,200,000. It also established a bonus plan in
which the top five officers of the company will share $150,000 if the profit
goal is met or exceeded. If the goal is not met, the bonus is zero. John
Giamatti, the Chief Financial Officer and one of the top five executives,
prepared the following budgeted income statement for 2011, based on the
board’s profit directive:
Garden City Gaskets, Inc.Budgeted Income Statement
For the Year Ended Dec. 31, 2011
Sales (500,000 units) . . . . . . . . . . . . . . . . . . . . . . . . . . . . . . . . . . . . $15,000,000
Cost of goods sold:
Beginning inventory . . . . . . . . . . . . . . . . . . . . . . . . . . . . . . . . . . . . $ -0-
Cost of goods manufactured . . . . . . . . . . . . . . . . . . . . . . . . . . . . . 8,000,000*
Cost of goods available for sale . . . . . . . . . . . . . . . . . . . . . . . . . . $8,000,000
Ending inventory . . . . . . . . . . . . . . . . . . . . . . . . . . . . . . . . . . . . . . . -0- 8,000,000
Gross margin . . . . . . . . . . . . . . . . . . . . . . . . . . . . . . . . . . . . . . . . . . . $ 7,000,000
Selling and administrative expenses:
Variable selling and administrative . . . . . . . . . . . . . . . . . . . . . . . $2,800,000
Fixed selling and administrative . . . . . . . . . . . . . . . . . . . . . . . . . 2,000,000 4,800,000
Net operating income . . . . . . . . . . . . . . . . . . . . . . . . . . . . . . . . . . . $ 2,200,000
*Variable manufacturing: 500,000 units � $5 per unit ¼ $2,500,000; Fixed manufacturing:$5,500,000.
By late September, it became apparent that sales were running below
forecast and that annual sales would approximate 450,000 units, for an
estimated net income of $1,230,000 and no bonus. In an executive commit-
tee strategy meeting Bob Arnzen, Vice President of Manufacturing, sug-
gested that the production capacity was available to produce the entire
500,000 units or more, even if that sales level could not be reached. He
remembered a presenter, from a seminar that he recently attended, describ-
ing how net income could be increased by producing more than can be
sold. He urged Giamatti to determine how many extra units they would
need to produce to achieve the profit goal and, thus, earn the bonus.
Required:
1. If sales only reach 450,000 units for the year, how many additional
units would have to be produced, given the current selling price and
cost structure, to meet the budgeted profit of $2,200,000?
2. Prepare an absorption costing income statement to prove your answer
above.
3. What ethical responsibility, if any, does Giamatti have in this
situation?
4. What is there about the bonus plan that potentially encourages un-
ethical behavior?
LO1
528 Principles of Cost Accounting

MINI-CASE 2
Differential analysissimilar to Self-Study Problem 2
Handyman Helper, Inc., manufactures household products such as win-
dows, light fixtures, ladders, and work tables. During the year it produced
10,000 Model 10X windows but only sold 5,000 units at $40 each. The
remaining units cannot be sold through normal channels. Cost for inventory
purposes on December 31 included the following data on the unsold units:
Materials . . . . . . . . . . . . . . . . . . . . . . . . . . . . . . . . . . . . . . . . . . . . . . . . . . . . . . . . . . . . . . . . . . $10.00
Labor . . . . . . . . . . . . . . . . . . . . . . . . . . . . . . . . . . . . . . . . . . . . . . . . . . . . . . . . . . . . . . . . . . . . . . 5.00
Variable overhead . . . . . . . . . . . . . . . . . . . . . . . . . . . . . . . . . . . . . . . . . . . . . . . . . . . . . . . . . . 3.00
Fixed overhead . . . . . . . . . . . . . . . . . . . . . . . . . . . . . . . . . . . . . . . . . . . . . . . . . . . . . . . . . . . . 2.00
Total cost per window . . . . . . . . . . . . . . . . . . . . . . . . . . . . . . . . . . . . . . . . . . . . . . . . . . $20.00
Handyman Helper can sell the 5,000 windows at a liquidation price of
$20.00 per window, but it will incur a packaging and shipping charge of
$7.50 per window.
Required:
1. Identify the relevant costs and revenues for the liquidation sale alter-
native. Is Handyman Helper better off accepting the liquidation price
rather than doing nothing?
2. Assume that Model 10X can be reprocessed to another size window,
Model 20X, which will require the same amount of labor and overhead
as was required to initially produce, but sells for only $33. Determine
the most profitable course of action—liquidate or reprocess.
INTERNET EXERCISE
Accepting business at a special price.
Go to the Web site for Delta Air Lines, which is linked to the text Web site
at www.cengage.com/accounting/vanderbeck. Click on ‘‘Specials,’’ then
‘‘Web Fares’’ and do the following:
1. Find a fare departing from a city located closest to you with a destina-
tion furthest from you. What is the amount of this round-trip fare for
the upcoming weekend? (Note that the fares usually are not posted
until Wednesday of the week of travel.)
2. Now find the best fare for the same itinerary departing two weeks
from now, with a Saturday night stay. How much is the difference
between the two fares?
3. Do you think that Delta is generating any positive contribution margin
on the weekend Web fare, or is it merely creating good customer
relations?
4. Are most of Delta’s costs variable or fixed in relation to an individual
passenger? Give some examples of each.
5. If the cost object were a specific flight rather than an individual
passenger, what would be some examples of variable costs?
LO7
LO8
LO7
Chapter 10 – Cost Analysis for Management Decision Making 529

This page intentionally left blank
GLOSSARY
AAbsorption (or full) costing. A method of accountingfor manufacturing costs that charges both fixed andvariable costs to the product.
Account analysis method. See Observation method.
Accounting information system. A set of proceduresdesigned to provide the financial information neededwithin a business organization.
Activity-based costing (ABC). A method of applyingoverhead to products that considers non–volume-related activities that create overhead costs as well asvolume related activities.
Activity-based management (ABM). The use ofactivity-based costing information to improve businessperformance by reducing costs and improving processes.
Adjusted sales value. A basis for allocating joint coststhat takes into consideration the cost of processing aftersplit-off.
Algebraic distribution method. A method for allocat-ing service department costs to production departmentsusing algebraic techniques. While this method mayprovide the most accurate distribution of costs, it is morecomplicated than the other methods and the resultsobtained may not justify the additional effort involved.
Applied factory overhead. The account creditedwhen applying estimated overhead to production withthe debit to Work in Process. Use of a separate ‘‘ap-plied’’ account avoids confusion with actual overheadcosts charged to Factory Overhead, the control accountin the general ledger.
Attainable standard. A performance criterion thatrecognizes inefficiencies that are likely to result fromsuch factors as lost time, spoilage, or waste.
Average cost method. A commonly used procedurefor assigning costs to the ending inventories under aprocess cost accounting system. Under this method,ending inventories are valued using an average unitcost, computed as follows: (cost of beginning work inprocess þ current period production costs) divided bythe total equivalent production for the period.
BBackflush costing. The name for the accountingsystem used with JIT manufacturing. Costs are not‘‘flushed out’’ of the accounting system until goods arecompleted and sold.
Balanced scorecard. A set of performance measures,both financial and nonfinancial, that is used to evaluatean organization’s or a segment of an organization’sperformance.
Billing rates. The hourly rates that a firm charges itsclients for the various categories of professional laborworked on the job.
Bonus pay. An amount paid to employees in additionto regular earnings for a variety of reasons, such asoutstanding performance, as a result of higher-than-usual company profits.
Break-even analysis. An analytical technique based onthe determination of a break-even point expressed interms of sales revenue or sales volume.
Break-even point. The point at which sales revenueadequately covers all costs to manufacture and sell theproduct, but no profit is earned.
Budget. Management’s operating plan expressed inquantitative terms, such as units of production andrelated costs.

Budget variance (two-variance method). The differ-ence between budgeted factory overhead at the capacityattained and the actual factory overhead incurred.
Budgeted income statement. A summary of antici-pated revenues and expenses for the coming year basedon budgets for sales, manufacturing costs, and nonma-nufacturing expenses (selling, administrative, andother).
By-products. Secondary products with relatively littlevalue that are obtained in the process of manufacturingthe primary product.
CCapacity variance. Reflects an under-or overabsorp-tion of fixed costs by measuring the difference betweenactual hours worked, multiplied by the standard over-head rate, and the budget allowance based on actualhours worked.
Capital expenditures budget. A plan for the timingof acquisitions of buildings, equipment, and otheroperating assets during the year.
Carrying costs. The costs incurred as a result ofmaintaining (carrying) inventories. These costs generallyinclude: materials storage and handling costs; interest,insurance, and taxes; losses from theft, deterioration, orobsolescence; and record keeping and supplies.
Cash budget. Budget showing the anticipated flow ofcash and the timing of receipts and disbursements basedon projected sales, production schedule, and otherexpenses.
Common cost (or indirect [nontraceable] cost).The term used in segment analysis to describe a costthat cannot be traced to, or specifically identified with,a particular business segment.
Contribution margin. The difference between salesrevenue and variable costs.
Contribution margin ratio. The relationship of con-tribution margin to sales.
Contribution pricing. The method of pricing whereany price greater than variable costs is accepted for thepurpose of increasing contribution margin during peri-ods of excess capacity.
Contributory plans. Pension plans that require apartial contribution from the employees.
Control. The process of monitoring the company’soperations and determining whether the objectivesidentified in the planning process are beingaccomplished.
Controllable variance. The amount by which theactual factory overhead costs differ from the standardoverhead costs for the attained level of production.
Conversion cost. The combined cost of direct laborand factory overhead, which is necessary to convert thedirect materials into finished goods.
Cost accounting. Includes those parts of financial andmanagement accounting that collect and analyze costinformation.
Cost accounting system. A set of methods and proce-dures used by a manufacturing organization to accumu-late detailed cost data relating to the manufacturingprocess.
Cost and production report. A summary of cost andproduction data for a particular cost center.
Cost–benefit decision. A decision as to whether thebenefit received from pursuing a certain course ofaction exceeds the costs of that action.
Cost center. A unit of activity, such as a department,to which costs may be practically and equitablyassigned.
Cost driver. The basis used to allocate each of theactivities in activity-based costing such as number ofsetups and number of design changes.
Cost of goods manufactured. Determined by addingthe cost of the beginning work in process to themanufacturing costs incurred during the period,and then subtracting the cost of the ending work inprocess.
Cost of goods sold budget. Consists of informationfrom the direct materials, direct labor, and factoryoverhead budgets, as well as projections of beginningand ending work in process and finished goodsinventories.
Cost of production summary. A report that sum-marizes production costs for a period for each depart-ment and provides the information necessary forinventory valuation.
Cost performance report. Compares the budgetedcosts for a job with its actual costs and indicates thevariance for each line item.
Cost–volume–profit (CVP) analysis. An analyticaltechnique that uses the degrees of cost variability formeasuring the effect of changes in volume on resultingprofits.
Credit memorandum. A document used to notify thevendor that a larger quantity has been received than wasordered.
532 Principles of Cost Accounting

DDebit memorandum. A document used to notify thevendor that less materials were received than wereordered.
Defective units. Units of product with imperfectionsthat are considered correctable because the marketvalue of the corrected unit will be greater than the totalcost incurred for the unit.
Defined benefit plan. Pension benefits paid to a re-tired employee based on the employee’s past level ofearnings and length of service with the company.
Defined contribution plan. A plan showing the max-imum amount of contributions that can be made byemployer and employee.
Department-type analysis spreadsheet. One form offactory overhead analysis spreadsheet; a separate analysisspreadsheet is maintained for each department with indivi-dual amount columns for each type of overhead expense.
Differential analysis. A study that highlights the sig-nificant cost data of alternatives.
Differential cost. The difference in cost between twodecision alternatives.
Differential income. The amount of extra profitearned from choosing the better of two alternatives.
Differential revenue. The difference in revenue be-tween two decision alternatives.
Direct charge. A charge that can be exactly measuredand charged to a specific department.
Direct (traceable) cost. The term used in segmentanalysis to describe a cost that can be traced to a specificbusiness segment.
Direct costing. See Variable costing.
Direct distribution method. A method for allocatingservice department costs to production departments.No attempt is made to determine the extent to whichservice departments provide services to each other;instead, all service department costs are distributeddirectly to the production departments.
Direct labor. The cost of labor for employees whowork directly on the product being manufactured.
Direct labor budget. A detailed plan of the laborrequirements in both hours and dollars for a specificperiod of time.
Direct labor cost method. A method of applyingfactory overhead to production based on the amount ofdirect labor cost incurred for a job or process.
Direct labor hour method. A method of applyingfactory overhead to production based on the number ofdirect labor hours worked on a job or process.
Direct materials. Materials that become part of theproduct being manufactured and that can be readilyidentified with a certain product.
Direct materials budget. A detailed plan of the mate-rials requirements in both units and dollars for aspecific period of time.
Distribution costs. Costs incurred to sell and delivera product.
EEconomic order quantity (EOQ). The optimal (mosteconomical) quantity of materials that should be or-dered at one time; represents the order size that mini-mizes total order and carrying costs.
Efficiency variance. The difference between overheadapplied (standard hours at the standard rate) and theactual hours worked multiplied by the standard rate;indicates the effect on fixed and variable overhead costswhen actual hours worked are more or less than stan-dard hours allowed for the production volume.
Electronic data interchange (EDI). The process ofbusiness-to-business electronic communication for thepurpose of expediting commerce and eliminatingpaperwork.
Employee earnings record. A form prepared for eachemployee showing the employee’s earnings each payperiod and cumulative earnings for each quarter and forthe year.
Equivalent production. The number of units thatcould have been completed during a period using thetotal production costs for the period.
Expense-type analysis spreadsheet. One form of fac-tory overhead analysis spreadsheet; a separate analysisspreadsheet is used for each type of overhead expensewith individual amount columns for each department.
FFactory overhead. All costs related to the manufac-ture of a product except direct materials and directlabor; these costs include indirect materials, indirectlabor, and other manufacturing expenses, such as de-preciation, supplies, utilities, maintenance, insurance,and taxes.
Factory overhead analysis spreadsheets. A subsidi-ary record of factory overhead expenses; replaces asubsidiary factory overhead ledger. Analysis
Glossary 533

spreadsheets are commonly used bylarger enterpriseswithseveraldepartments and manydifferent types ofoverheadexpenses.
Factory overhead budget. A budget consisting of theestimated individual factory overhead items needed tomeet production requirements.
Factory overhead ledger. A subsidiary ledger con-taining the individual factory overhead accounts; thetotal of the individual account balances in the subsidiaryledger should equal the balance in the control account,Factory Overhead, in the general ledger.
Favorable variance. The difference when actual costsare less than standard costs.
Federal Insurance Contributions Act (FICA).Federal legislation requiring both employers and em-ployees to pay social security taxes on wages and salaries.
Federal Unemployment Tax Act (FUTA). Federallegislation requiring employers to pay an establishedrate of tax on wages and salaries to provide for compen-sation to employees if they are laid off from theirregular employment.
Financial accounting. The branch of accounting thatfocuses on the gathering of information to be used in thepreparation of external financial statements, that is, bal-ance sheet, income statement, and statement of cash flows.
Finished goods. The inventory account that repre-sents the total cost incurred in manufacturing goodsthat are complete but still on hand at the end of theaccounting period.
First-in, first-out (FIFO). An inventory costingmethod based on the assumption that materials issuedare taken from the oldest materials in stock. Thus,materials issued are costed at the earliest prices paid formaterials in stock, and ending inventories are costed atthe most recent purchase prices.
Fixed costs. Manufacturing costs that remain constantwhen production levels increase or decrease; examplesinclude straight-line depreciation, periodic rent pay-ments, insurance, and salaries paid to productionexecutives.
Fixed overhead budget variance. A measure of thedifference between the actual fixed overhead and thebudgeted fixed overhead.
Fixed overhead volume variance. A measure of thedifference between budgeted fixed overhead and ap-plied fixed overhead.
Flexible budget. A budget that shows expected costsat different production levels.
Flow of costs. The order in which unit costs areassigned to materials issued.
Flow of materials. The order in which materials areactually issued for use in the factory.
For-profit service businesses. These are businessesthat sell services rather than products, such as airlinesand accountants.
Four-variance method. The analysis of fixed andvariable factory overhead costs based on the computa-tion of a spending variance and an efficiency variancefor variable costs and a budget variance and a volumevariance for fixed costs.
Full costing. See Absorption costing.
GGeneral factory overhead expenses. Overhead ex-penses that cannot be identified with a specific depart-ment and must be charged to departments by a processof allocation.
Gross margin (or gross profit). The difference be-tween sales revenue and cost of goods sold.
Gross profit. See Gross margin.
HHigh-low method. A method used to isolate the fixedand variable elements of a semivariable cost; involvescomparison of a high volume and its related cost with alow volume and its related cost to determine thevariable amount per unit and the fixed element.
Holiday pay. An amount paid to employees for desig-nated holidays on which the employee is not requiredto work.
Hourly rate plan. A wage plan under which an em-ployee is paid an established rate per hour for each hourworked.
IIdeal standard. A performance criterion that reflectsmaximum efficiency, with no allowance for lost time,waste, or spoilage.
Incentive wage plan. A wage plan modified to in-crease worker productivity by paying a bonus rate perhour when an employee meets or exceeds establishedproduction quotas.
Indirect (nontraceable) cost. See Common cost.
Indirect labor. The wages and salaries of employeeswho are required for the manufacturing process but
534 Principles of Cost Accounting

who do not work directly on the units being produced;examples include department heads, inspectors, materi-als handlers, and maintenance personnel.
Indirect materials. Materials and supplies necessaryfor the manufacturing process that cannot be readilyidentified with any particular product manufactured orwhose relative cost is too insignificant to measure.
Inventory report. A form prepared when making phy-sical count of inventory on hand and used to reconciledifferences between recorded inventory and the inven-tory quantities determined by physical count.
JJob cost ledger. A subsidiary ledger that consists ofthe individual job cost sheets.
Job cost sheet. A form or computer file used toaccumulate costs applicable to each job under a joborder cost accounting system.
Job order cost system. A method or system of costaccounting that is appropriate for manufacturing opera-tions that produce custom-made or special-order goods.Manufacturing costs are accumulated separately foreach job and recorded on a job cost sheet.
Joint costs. The costs of materials, labor, and over-head incurred during the production of joint products.
Joint products. Two or more products that are ob-tained from the same manufacturing process and arethe primary objectives of the process.
Just-in-time (JIT) inventory system. A system thatsignificantly reduces inventory carrying costs by requir-ing that raw materials be delivered by suppliers to thefactory at the exact time that they are needed forproduction.
KKanban. Card indicating a manufacturing cell’s needfor more raw materials or component parts.
Labor cost standard. A predetermined estimate of thedirect labor cost required for a unit of product based onestimates of the labor hours required to produce a unitof product and the cost of labor per unit.
Labor cost summary. A form showing the allocationof total payroll to Work in Process and FactoryOverhead.
Labor efficiency (usage) variance. The differencebetween the actual number of direct labor hoursworked and the standard hours for the actual level ofproduction at the standard labor rate.
Labor rate (price) variance. The difference betweenthe average hourly direct labor rate actually paid andthe standard hourly rate, multiplied by the number ofhours worked.
Labor time record. A record (usually a computer file)that shows an employee’s time spent on each job.
Last-in, first-out (LIFO). An inventory costingmethod based on the assumption that materials issuedare the most recently purchased materials. Thus, mate-rials issued are costed at the most recent purchaseprices, and ending inventories are costed at the pricespaid for the earliest purchases.
Lead time. The estimated time interval between theplacement of an order and the receipt of materials.
Learning effect. The process that occurs when em-ployees become more efficient at complex productionprocesses the more often they perform the task.
Loss leader. A product line that yields low profit (or aloss) but is retained in order to attract customers whomight also purchase more profitable items.
MMachine hour method. A method of applying factoryoverhead to production based on the number of ma-chine hours used for a job or process.
Magnetic card reader. A machine connected to aremote computer terminal that automatically logs ‘‘on’’and ‘‘off’’ labor time to the accounting departmentthrough the use of magnetic cards that employees swipeinto this machine at the beginning and end of specificjob assignments.
Make-up guarantee. An amount paid to employeesunder a modified wage plan when established productionquotas are not met during a work period. The make-upguarantee is charged to the factory overhead account.
Management accounting. Focuses on both historicaland estimated data that management needs to conductongoing operations and long-range planning.
Management by exception. As relates to varianceanalysis, it is the practice of examining significantunfavorable or favorable differences from standard.
Manufacturers. They convert raw materials into fin-ished goods by using labor, technology, and facilities.
Manufacturing margin. The term commonly used invariable costing to designate the difference betweensales and variable cost of goods sold.
Manufacturing cells. See Work centers.
Glossary 535

Manufacturing (or production) costs. All costs in-curred in the manufacturing process; the costs areclassified into three basic elements: direct materials,direct labor, and factory overhead.
Manufacturing process. The activities involved inconverting raw materials into finished goods throughthe application of labor and incurrence of variousfactory expenses.
Margin of safety. The amount that sales can decreasebefore the company will suffer a loss.
Margin of safety ratio. A relationship computed bydividing the difference between the total sales and thebreak-even point sales by total sales.
Mark-on percentage. A percentage of the manufac-turing cost per unit that is added to provide for sellingand administrative expense and profit.
Master budget. See Static budget.
Materials. The inventory account that represents thecost of all materials purchased and on hand to be usedin the manufacturing process, including raw materials,prefabricated parts, and supplies.
Materials control. Procedures incorporated in thesystem of internal control that are designed to physi-cally protect or safeguard materials (physical control)and to maintain the proper balance of materials onhand (control of the investment in materials).
Materials cost standard. A predetermined estimate ofthe cost of the direct materials required for a unit ofproduct.
Materials ledger. See Stores ledger.
Materials price variance. The difference between theactual unit cost of direct materials and the standard unitcost, multiplied by the actual quantity of materials used.
Materials quantity (usage) variance. The differencebetween the actual quantity of direct materials used andthe standard quantity for the actual level of productionat standard price.
Materials (or stores) requisition. A form, preparedby authorized factory personnel and usually approvedby the production department supervisor, to requestmaterials from the storeroom; represents authorizationfor the storeroom keeper to issue materials for use inproduction.
Merchandisers. Wholesalers or retailers who pur-chase finished goods for resale.
Mixed costs. See Semifixed costs and Semivariablecosts.
Modified wage plan. A wage plan that combinescertain features of the hourly rate and piece-rate plans.
Moving average. An inventory costing method basedon the assumption that materials issued at any time arewithdrawn from a mixed group of like materials, and noattempt is made to identify materials as being from theearliest or most recent purchases. Under this method,an average unit price is computed each time a new lotof materials is received, and the new unit price is usedto cost all issues of materials until another lot isreceived and a new unit price is computed.
NNoncontributory plans. Pension plans that are com-pletely funded by the employer.
Nonfinancial performance measures. These are per-formance measures that are used to evaluate operations,but that are not expressed in dollars, such as thepercentage of defective units produced.
Nonvalue-added activities. Operations that includecosts but do not add value to the product, such asmoving, storing, and inspecting.
Non–volume-related activities. Activities performedthat create overhead costs that are more a function ofthe complexity of the product being made rather thanthe number of units produced; examples are number ofmachine setups and product design changes.
Normal capacity. The level of production that willmeet the normal requirements of ordinary sales de-mand over a period of time; frequently used for budgetdevelopment because it represents a logical balancebetween maximum capacity and the capacity demandedby actual sales volume.
Normal losses. Units lost due to the nature of themanufacturing process. Such losses are unavoidable andrepresent a necessary cost of producing goods.
Not-for-profit service agencies. These include cha-rities, governmental agencies, and some health carefacilities that provide services at little or no cost to theuser.
OObservation (or account analysis) method. A tech-nique used to classify a semivariable cost as either fixedor variable; involves examination and analysis of pastrelationships between the expense and production vo-lume. Based on the observed pattern of cost behavior, adecision is made to classify the expense as either a fixedor variable cost, depending on which it more closelyresembles.
536 Principles of Cost Accounting

Order costs. The costs incurred as a result of orderingmaterials; includes salaries and wages of employeesinvolved in purchasing, receiving, and inspecting mate-rials; communications costs, such as telephone, postage,and forms; and record-keeping costs.
Order point. The point at which an item of inventoryshould be ordered; occurs when a predetermined mini-mum level of inventory on hand is reached. Determin-ing an order point requires consideration of usage, leadtime, and safety stock.
Outliers. Nonrepresentative data points that may bewrongly selected when using the high-low method.
Overapplied (or overabsorbed) factory overhead.The amount by which applied factory overhead exceedsactual factory overhead expenses incurred; representedby a remaining credit balance in Factory Overhead.
Overtime pay. The amount earned by employees atthe regular hourly rate for hours worked in excess ofthe regularly scheduled time.
Overtime premium. The additional pay rate earnedfor working hours in excess of the normal daily orweekly hours.
PPayroll record. A form prepared each pay periodshowing the earnings of all employees for the period.
Payroll taxes. Taxes imposed on employers, includingsocial security tax and federal and state unemployment taxes.
Peanut-butter costing. The practice of assigningcosts evenly to jobs via an overhead rate when, in fact,different jobs consume resources in differentproportions.
Pension costs. The costs incurred by an employer toprovide retirement benefits to employees.
Performance report. A periodic summary of cost andproduction data that are controllable by the manager ofa particular cost center.
Period costs. All costs that are not assigned to theproduct, but are recognized as expense and chargedagainst revenue in the period incurred.
Periodic inventory system. A method of accountingfor inventory that requires estimating inventory duringthe year for interim statements and shutting down opera-tions to count all inventory items at the end of the year.
Perpetual inventory system. A method of accountingfor inventory that provides a continuous record ofpurchases, issues, and balances of all goods in stock.
Piece-rate plan. A wage plan under which an em-ployee is paid a specified rate for each unit or ‘‘piece’’completed.
Planning. The process of establishing objectives orgoals for the organization and determining the meansby which the objectives will be attained.
Practical capacity. The level of production that pro-vides complete utilization of all facilities and personnelbut allows for some idle capacity due to operatinginterruptions, such as machinery breakdowns, idle time,and other inefficiencies.
Predetermined factory overhead rate. A percentageor amount determined by dividing budgeted factoryoverhead cost by budgeted production; budgeted pro-duction may be expressed in terms of machine hours,direct labor hours, direct labor cost, or units. Thepredetermined rate is an estimate used in applyingfactory overhead to production.
Price. In the context of variance analysis, refers to thecost of materials or the hourly wage rate for direct labor.
Prime cost. The combined costs of direct materialsand direct labor incurred in manufacturing a product.
Process cost system. A method or system of costaccounting that is appropriate for manufacturing opera-tions that produce continuous output of homogeneousproducts. Manufacturing costs are accumulated sepa-rately for each department and are recorded on a costof production report.
Product costs. Costs that are included as part ofinventory costs and expensed when goods are sold.
Production budget. A detailed plan indicating thenumber of units that must be produced during a specificperiod of time to meet sales and inventoryrequirements.
Production department. A department in which ac-tual manufacturing operations are performed and theunits being produced are physically changed.
Production department supervisor. The employeewho is responsible for supervising the operational func-tions of a production department.
Production report. A report, used in a process costaccounting system and prepared by the departmenthead, showing beginning units in process, number ofunits completed during the period, ending units inprocess, and their estimated stage of completion.
Production work teams. A recent concept where out-put is dependent upon contributions made by all mem-bers of the work crew or department.
Glossary 537

Professional labor budget. A budget for which thebudgeted hours required for each client service area aremultiplied by the budgeted rate for each category toobtain the total wages expense for each category ofprofessional labor.
Purchase order. A form, prepared by the purchasingagent and addressed to the chosen vendor, that de-scribes the materials ordered, credit terms and prices,and the date and method of delivery; represents thevendor’s authorization to ship goods.
Purchase price variance. The difference between theactual cost of materials and the standard cost.
Purchase requisition. A form, usually prepared by thestoreroom keeper or employee with similar responsibil-ity, that is used to notify the purchasing agent thatadditional materials are needed; represents the agent’sauthority to purchase materials.
Purchasing agent. The employee who is responsiblefor purchasing the materials needed for production. Anindividual in any organization who is responsible forthe purchasing function.
RReceiving clerk. The employee who is responsible forsupervising incoming shipments of materials and mak-ing sure that all incoming materials are checked as toquantity and quality.
Receiving report. A form that is prepared by the receiv-ing clerk for each incoming shipment of materials. Theclerk identifies the materials, determines the quantity re-ceived, and records this information on the receiving reportas well as the name of the shipper, date of receipt, and thenumber of the purchase order identifying the shipment.
Relative sales value. A basis for allocating joint costsproportionally based on the respective selling prices ofthe separate products.
Relevant range. The wide range of production vo-lume in which the firm expects to operate.
Responsibility accounting. The assignment of ac-countability for costs or production results to thoseindividuals who have the most authority to influencecosts or production.
Retailers. A type of merchandiser who sells productsor services to individuals for consumption.
Returned materials report. A form prepared to ac-company materials being returned to the storeroomthat had been previously requisitioned but were notused in production.
Return shipping order. A form prepared by the pur-chasing agent when goods are to be returned to thevendor.
Revenue budget. A budget that projects revenue to bereceived from client business.
SSafety stock. The estimated minimum level of inven-tory needed to protect against stockouts.
Sales budget. A budget that projects the volume ofsales both in units and dollars.
Sales mix. The relative percentage of unit sales amongthe various products made by the firm.
Scattergraph method. A method that estimates astraight line along which the semivariable costs will fallby drawing the line by visual inspection through thedata points plotted on the graph.
Schedule of fixed costs. A listing of fixed overheadcosts, such as depreciation, insurance, and propertytaxes; provides the source from which fixed costs can beallocated to the various departments. Since fixed costsare assumed not to vary in amount from month tomonth, a schedule can be prepared in advance forseveral periods; at the end of a period, a journal entrycan be prepared to record total fixed costs from theinformation provided in the schedule.
Scrap (or waste) materials. By-products that are gen-erated in the manufacturing process; usually, such ma-terials have some value and their costs and revenues areaccounted for separately.
Segment. A division, a product line, a sales territory,or other organizational unit that can be separately identi-fied for reporting purposes and profitability analysis.
Segment margin. The term used in segment analysisfor the excess of segment revenue over direct costsassigned to the segment; common costs are excluded incomputing segment margin.
Selling and administrative expenses budget. A salesforecast that will affect the planned expenditure levelfor such items as sales force compensation, advertising,and travel.
Semifixed (or step) costs. Costs that tend to remainthe same in dollar amount over a certain range ofactivity but increase when production exceeds certainlimits.
Semivariable costs. Manufacturing costs that aresome-what responsive to changes in production but donot change proportionally with increases or decreases
538 Principles of Cost Accounting

in volume; examples include indirect materials, indirectlabor, repairs and maintenance, and power.
Sequential distribution (or step-down) method. Amethod for allocating service department costs to pro-duction departments that recognizes the interrelation-ship of the service departments. Costs are firstallocated, sequentially, to other service departments andthen to production departments. The sequence maybegin by distributing the costs of the service depart-ment that renders the greatest amount of service to allother service departments. Alternatively, the costs ofthe service department with the largest total overheadcan be distributed first.
Service. An intangible benefit that does not have phy-sical properties and is consume at the time it is pro-vided; examples include consulting, transporting, andentertaining.
Service department. A department within the factorythat does not work directly on the product but providesneeded services to other departments; examples includea department that generates power for the factory, amaintenance department that maintains and repairsbuildings and equipment, and a cost accounting depart-ment that maintains factory accounting records.
Shift premium. An additional rate of pay added to anemployee’s regular rate as compensation for working anevening or night shift.
Spending variance. The difference between the actualfactory overhead for variable costs and the actual hoursmultiplied by the standard variable rate. See also Budgetvariance.
Split-off point. The point where joint products be-come separately identifiable; may occur during, or atthe end of, the manufacturing process.
Spoiled units. Units of product with imperfectionsthat cannot be economically corrected; they are sold asitems of inferior quality or ‘‘seconds.’’
Stage of completion. The fraction or percentage ofmaterials, labor, and overhead costs of a completed unitthat have been applied during the period to goods thathave not been completed.
Standard. A norm or criterion against which perfor-mance can be measured.
Standard cost accounting. A method of accountingfor manufacturing costs that can be used in conjunctionwith either a job order or process cost accountingsystem. Standard costing makes it possible to determinewhat a product should have cost as well as what theproduct actually cost.
Standard cost card. Form used to summarize thestandard quantities and costs of assembling, testing, andpackaging a given product.
Standard cost system. A system that uses predeter-mined standard costs to furnish a measurement thathelps management make decisions regarding the effi-ciency of operations.
Standard costs. The costs that would be incurredunder efficient operating conditions and are forecastbefore the manufacturing process begins. The prede-termined standard costs are compared with actual man-ufacturing costs incurred and are used by managementas a basis for evaluating operating efficiency and takingcorrective action, when necessary.
Standard production. The volume on which the in-itial calculation of standard costs is based.
Standard unit cost for factory overhead. The resultof estimating factory overhead cost at the standard, ornormal, level of production, considering historical dataand future changes and trends.
Static (or master) budget. A budget that is preparedfor only one level of activity.
Step costs. See Semifixed costs.
Step-down method. See Sequential distributionmethod.
Step fixed cost. Semivariable production cost thatremains the same over a wide range of production (e.g.,the salaries of factory supervisors).
Step variable cost. A type of semivariable cost thatremains constant in total over a range of productionand then abruptly changes.
Stockout. Running out of an item of inventory; mayoccur due to inaccurate estimates of usage or lead timeor other unforeseen events, such as the receipt ofdamaged or inferior materials from a supplier.
Storeroom keeper. The employee who is responsiblefor the storing and maintaining of materialsinventories.
Stores (or materials) ledger. A subsidiary ledger sup-porting the Materials control account in the generalledger. The individual accounts in the stores ledger areused to record receipts and issues of materials and showthe quantity and cost of materials on hand.
Stores requisition. See Materials requisition.
Summary of factory overhead. A schedule of allfactory overhead expenses incurred during a period;prepared from the factory overhead analysis
Glossary 539

spreadsheets, the schedule shows each item of overheadexpense by department and in total.
Summary of materials issued and returned. A formused to record all issuances of materials to the factory,returns of materials previously requisitioned, and re-turns of materials to the vendors (sellers). The sum-mary, when completed at the end of a period, providesthe information needed to record the cost of materialsfor the period.
TTarget volume. The amount of sales volume needed,in units or dollars, to cover all costs and earn a certainamount of profit.
Theoretical capacity. The maximum number of unitsthat can be produced with the completely efficient useof all available facilities and personnel.
Three-variance method. The analysis of factoryoverhead costs based on the computation of efficiency,capacity, and budget (spending) variances.
Throughput time. The time that it takes a unit tomake it through the production process.
Touch labor. Category of factory payroll costs thatcan be traced directly to an individual job (also knownas ‘‘direct labor’’).
Transferred-in costs. The portion of a department’stotal costs that were incurred by and transferred from aprior production department.
Trigger points. Points in the production process atwhich to record journal entries in a backflush system.
Two-variance method. The analysis of factory over-head costs based on the computation of the volumevariance and the budget variance.
UUnder-and overapplied factory overhead. An ac-count used to accumulate differences from period toperiod between actual and applied factory overhead. Atthe end of the year, the balance in this account may beclosed to Cost of Goods Sold (if the amount is relativelysmall) or allocated on a pro rata basis to Work inProcess, Finished Goods, and Cost of Goods Sold (ifthe amount is material).
Underapplied (or underabsorbed) factory overhead.The amount by which actual factory overhead exceedsapplied factory overhead; represented by a remainingdebit balance in Factory Overhead.
Unfavorable variance. The difference when actualcosts exceed standard costs.
Unit cost. The cost of manufacturing one unit ofproduct.
Units from the prior department. Units that havebeen completed as to the transferor department andthat are raw materials as to the transferee department.
Usage. The quantity of materials used or the numberof direct labor hours worked.
VVacation pay. An amount paid to employees duringtheir vacation periods as part of the employees’ com-pensation for services to the employer.
Variable costing. A method of accounting for manu-facturing costs that charges the product with only thecosts that vary directly with volume: direct materials,direct labor, and variable factory overhead.
Variable costs. Manufacturing costs that vary in directproportion to changes in production volume; includesdirect labor, direct materials, and some types of factoryoverhead.
Variable overhead efficiency variance. A measure ofthe change in the variable overhead consumption thatoccurs because of efficient or inefficient use of the costallocation base, such as direct labor hours.
Variable overhead spending variance. A measure ofthe effect of differences in the actual variable overheadrate and the standard variable overhead rate.
Variance. The difference, during an accounting per-iod, between the actual and standard or budgeted costsof materials, labor, and overhead.
Velocity. The speed with which units are produced ina manufacturing system. It is the inverse of thethroughput time.
Vendor’s invoice. A form, usually received from thevendor before goods are delivered, confirming a pur-chase of materials and representing a ‘‘bill’’ for theordered goods. The purchasing agent should comparethe invoice with the related purchase order to verify thedescription of materials, price, terms of payment,method of shipment, and delivery date.
Volume variance. The difference between budgetedfixed overhead and the fixed overhead applied to workin process; the result of operating at a level of produc-tion different from the standard, or normal, level.
Volume-related activities. Activities performedwhere all overhead costs are directly related to thevolume produced; examples are direct labor hours andmachine hours.
540 Principles of Cost Accounting

WWaste materials. See Scrap materials.
Wholesaler. A type of merchandiser who purchasesgoods from manufacturers and sells to retailers.
Work centers. Combined manufacturing functionsthat were performed in individual departments in atraditional manufacturing system.
Work in process. The inventory account that includesall the manufacturing costs incurred to date for goodsthat are in various stages of production but are not yetcompleted.
Work shift. A regularly scheduled work period for adesignated number of hours.
Glossary 541

This page intentionally left blank

INDEX
AAbnormal losses, 297Absorption costing, 481–588, 483f–486f; defined, 482Account analysis method, 172–173Accounting information systems, 2–3Activity-based costing method (ABC), 196–198; for
services business, 455–459, 459f–461f; vs. simplifiedcosting, 459–462
Actual factory overhead, 180–185, 198–203, 204f–208fAdjusted sales value, 311Algebraic distribution method, 187Applied factory overhead, 198–203, 204f–208fAttainable standards, 381Average cost method, 288–296, 289f–295f; overview,
241–244, 243f; vs. FIFO, 301f, 303f, 307f, 308–309
BBack-flush costing, 95–96, 96fBalanced scoreboard, 384, 463–466, 463f; categories of,
463–466, 463f–464f; guidelines for, 465; illustration of,465–466, 466f
Benefit plan: defined, 145Billing rates, 452Bonus pay, 147–148‘‘Bottom up’’ budgeting, 341Break-even analysis, 491–499, 492f, 496f; chart for,
494–495, 495f–496f; for management decisions,495–497; sales mix effects on, 498–499
Break-even chart, 494–495, 495f–496fBreak-even point, 481; defined, 491; income tax effect on,
501Budgeted income statement, 339–340, 340f, 348, 349f; for
service business, 454–455, 454fBudgets: budgeted income statement, 339–340, 340f, 348,
349f; capital expenditures, 348–349; cash, 348;continuous, 339; cost of goods sold, 346–347, 347f;defined, 6, 337; direct labor, 345–346, 346f; directmaterials, 344, 345f; factory overhead, 179, 346, 346f;
financial, 339, 339f; kaizen, 345–346; labor, 452–453,453f; master, 338–349; operating, 339, 339f; otherdirect expenses, 454, 454f; overhead, 453–454, 453f;participative, 341; performance evaluation based on,349, 350f; principles of, 338; production, 341–344,344f; professional labor, 452–453, 453f; revenue,451–452, 452f; rolling, 339; sales, 339–341, 340f, 341f;selling and administrative expenses, 347, 348f; servicebusiness, 451–455, 452f–454f; summary of process, 360,360f; web-based, 348. see also flexible budgets
Budget slack, 341Budget variances, 414By-products, 312–314, 313f
CCapacity: manufacturing, 355Capacity variances, 414Capital expenditures budgets, 348–349Carrying costs, 67–70, 67f, 69fCash budgets, 348Certified Management Accountant (CMA) certification, 9Common cost, 489Competence, 37Confidentiality, 37Continuous budget, 339Contribution margin, 489, 493Contribution margin ratio, 493, 499–501Contribution plans, 145Contribution pricing, 504Contributory plans, 146Control: control and, 8, 8f; defined, 5; purpose of, 5–6,
7f, 8Controllable variances, 406Conversion cost, 17, 17fCorporate governance, 9–10Cost accounting: cost of goods sold, 12; defined, 10; ethics
and CMA certification, 9–10; financial/managementaccounting and, 10–11, 12f; illustration of, 18–27;

inventories and, 13–14; manufacturing costs, 15–17,17f; overview, 2–4; planning and control, 5–6, 7f, 8, 8f;product cost and pricing, 4–5; uses of, 4–8, 7f–8f, 10,11f. see also service business cost accounting; standardcost accounting
Cost accounting systems, 28–31; about, 2–3; combinationcost systems, 30; job order cost systems, 28–29, 29f;process cost systems, 29–30, 29f; standard cost systems,30–31; uses of, 4–8, 7f–8f, 10, 11f. see also job ordercost systems; process cost systems; standard costaccounting
Cost allocation: for service business, 450Cost analysis, 481–507; absorption costing, 481–588, 483f–
486f; break-even analysis, 491–499, 492f, 496f; contri-bution margin ratio, 493, 499–501; cost-volume-profitanalysis, 491–499, 492f, 496f; differential analysis, 502–505; distribution costs, 505–507; income tax effect onbreak-even point, 501; margin of safety ratio, 499–501;period costs, 482, 483f; product costs, 482, 483f; seg-ment reporting, 488–491, 490f; variable costing, 482–588, 483f–486f
Cost and production reports, 6, 7fCost behavior patterns, 170–172, 171fCost center, 5–6, 238Cost control: just-in-time materials control and, 94–95;
labor, 128–132Cost driver, 196–197Cost flows, 82; just-in-time materials control and, 95–97,
96f, 97f; through job order cost system, 29, 29f; throughprocess cost system, 29–30, 29f; through standard costsystem, 393f
Cost of goods manufactured, 12, 26Cost of goods sold, 12Cost of goods sold budgets, 339f, 346–347, 347fCost of production summary, 244, 244f; multiple
departments, beginning inventory, 259–265, 260f–261f,263f, 266f–267f; multiple departments, no beginninginventory, 250–259, 252f, 254f, 256f; one, department,no beginning inventory, 244–247; one department,beginning inventory, 247–250, 249f
Cost per equivalent unit, 243–244, 243fCost performance reports: for service business, 450–451,
451fCosts. see specific typeCost-volume-profit analysis, 491–499, 492f, 496fCredibility, 37–38Credit balance, 386–387Credit memorandum, 76–77, 77f
DDebit balance, 386–387Debit-credit memorandum, 76–77, 77fDefective units: accounting for, 99–100Defined benefit plan, 145Defined contribution plan, 145
Demand software, 341Department-type analysis spreadsheets, 182–183Depreciation expense, 20Differential analysis, 502–505; make or buy, 504–505;
special orders and, 503–504Differential cost, 502Differential income, 502Differential revenue, 502Direct charge, 186Direct costing: defined, 482Direct costs, 449f, 450, 489Direct distribution method, 187, 188f, 189Direct labor, 16, 124; budgets, 345–346, 346f; cost
method, 194–195; hour method, 195; standard costaccounting for, 382–383, 383f
Direct materials, 15–16, 19; standard cost accounting for,382–383, 383f
Direct materials budgets, 344, 345fDistribution costs, 505–507
EEarnings: payment of net, 130, 132Economic order quantity (EOQ), 67–70, 67f, 69fEfficiency variances, 415Electronic data interchange (EDI), 74Employee pension costs, 145–147, 146fEmployees’ earnings record, 130, 131fEmployers’ payroll taxes, 135–136Equivalent production, 288–296, 301f; average cost
method, 288–296, 289f–295f; defined, 241–242; first-in,first-out method, 300–309, 301f–303f, 306f, 307f
Equivalent unit: cost per, 243–244, 243fEthics: CMA certification, 9; corporate governance, 9–10;
IMA statement for, 10, 36–38Expenses: depreciation, 20; factory overhead, 183–184;
general factory overhead, 183–184; other direct, 454,454f; selling and administrative, 347, 348f; servicedepartment, 185–192
Expense-type analysis spreadsheets, 182, 182f
FFactory overhead, 21, 169–209; accounting for, 198–203,
204f–208f; actual, 180–185, 198–203, 204f–208f;applied, 198–203, 204f–208f; applying to production,192–198; budgeting for, 179; cost behavior patterns,170–172, 171f; defined, 169; flexible budgets for,355–359, 357f; general expenses, 183–184; manufactur-ing costs and, 16; overapplied, 199–201; predeterminedrates, 193; schedule of fixed costs, 183, 184f; semifixedcosts and, 358–359; semivariable, 172–178, 175f, 177f,178f; service department expenses, 185–192; servicedepartments and, 359; standard cost accounting for,382–383, 383f; summary of, 185, 185f; underapplied,199–201
544 Principles of Cost Accounting

Factory overhead analysis spreadsheets, 181–183, 182fFactory overhead budgets, 346, 346fFactory overhead ledger, 180, 181fFactory overhead variances, 405–406, 412–414;
four-variance method of analysis, 403–414; three-variance method of analysis, 414–416; two-variancemethod of analysis, 406–411
Favorable variances, 386–387Federal Insurance Contributions Act (FICA), 135Federal Unemployment Tax Act (FUTA), 135Financial accounting: defined, 10; relationship to cost
accounting, 10–11, 12fFinancial budgets: components of, 339, 339f, 348–349Financial statements: pro-forma, 339Finished goods: defined, 13First-in, first-out method, 82, 83f, 84–87, 241; materials
added at end, 305, 306f–307f, 308–309; materials addedat start, 301–305, 302f, 303f
Fixed costs, 170; flexible budgets and, 351; schedule of,183, 184f
Fixed overhead budget variances, 412Fixed overhead volume variances, 412Flexible budgets, 179, 350–359; defined, 337; for factory
overhead, 355–359, 357f; fixed costs and, 351; manufac-turing capacity and, 355; performance evaluation basedon, 353–354, 353f; preparation of, 352–353, 352f; semi-fixed costs and, 358–359; for service departments, 359;uses of, 351; variable costs and, 351–352; variances and,353–354, 353f
Flow of costs, 82. see also cost flowsFlow of materials, 82For-profit business, 2403(k) plans, 146, 146fFour-variance method of analysis, 412–414Full costing: defined, 482
GGeneral factory overhead expenses, 183–184General inventory ledgers, 14, 15fGoalpost diagram: for variances, 387, 388fGross margin, 485Gross profit, 485
HHigh-low method, 173–174, 176Holiday pay, 147–148Hourly rate plan, 126
IIdeal standards, 381Incentive wage plans, 125–128Income statements: budgeted, 339–340, 340f, 348, 349f,
454–455, 454f
Income tax: effect on break-even point, 501Indirect cost, 489Indirect labor, 16, 124Indirect materials, 16Institute of Management Accountants (IMA), 9–10, 36–38Integrity, 37Inventories, 13–14; valuation of, 13–14; verification,
89–91, 90fInventory ledgers, 14, 15fInventory report, 90–91, 90fInventory systems: periodic, 14; perpetual, 13–14Investment control: of materials, 64f, 66–70ISO 9000 family, 3–4
JJob cost ledger, 34Job cost sheets, 31, 32f; activity-based costing, 458–462,
459f–461f; for services business, 448–450, 449fJob order cost systems, 28–29; accounting illustration,
31–35; cost flow in, 29, 29f; factory overhead costs, 239;materials and labor costs, 238–239; process cost systemscompared to, 238–239; for service business, 448–451,449f, 451f; uses of, 30f
Joint process, 310, 310fJoint products, 310–312, 310f, 311f, 313fJust-in-time materials control, 92–97; cost control and,
94–95; cost flows and, 95–97, 96f, 97f
KKaizen budgeting, 345–346
LLabor: accounting for, 132–144; accounting illustration of,
19–20; bonuses, 147; controlling costs, 128–132; direct,124; indirect, 124; payroll taxes, 135–136; pension costs,145–147, 146f; shift premium, 145; vacation and holidaypay, 147–148; wage plans, 125–128
Labor budget: for service business, 452–453, 453fLabor cost standard, 382Labor cost summary, 132–135, 133f, 134fLabor efficiency (usage) variances, 386Labor rate (price) variances, 386Labor time records, 128–129, 129fLabor variances, 386–387, 388fLast-in, first-out method, 83f, 84–87Lead time, 66Lean production system, 92Learning effect, 382Least-squares regression method, 176–178, 178fLedgers: factory overhead, 180, 181f; inventory, 14, 15f;
job cost, 34Losses: abnormal, 297; normal, 296; units lost in
production, 296–297, 298f
Index 545

MMachine hour method, 195–196Make-up guarantee, 127Management accounting: defined, 10; relationship to cost
accounting, 10–11, 12fManagement by exception, 380Management decision making, 481–507; absorption
costing, 481–588, 483f–486f; break-even analysis,491–499, 492f, 496f; contribution margin ratio, 493,499–501; cost-volume-profit analysis, 491–499, 492f,496f; differential analysis, 502–505; distribution costs,505–507; income tax effect on break-even point, 501;margin of safety ratio, 499–501; period costs, 482, 483f;product costs, 482, 483f; segment reporting, 488–491,490f; variable costing, 481–588, 482–588, 483f–486f
Manufacturers, 2Manufacturing businesses: inventories, 13, 14fManufacturing capacity, 355Manufacturing cells, 93Manufacturing costs, 15–17, 17f; accounting illustration,
18–27; conversion cost, 17, 17f; direct labor, 16; directmaterials, 15–16; factory overhead, 16; flow of, 17, 17f;prime cost, 16–17, 17f
Manufacturing margin, 485Manufacturing process, 3Margin: contribution, 489, 493; gross, 485; manufacturing,
485; segment, 489Margin of safety ratio, 499–501Mark-on percentage, 22Master budgets, 338–349; components of, 338–339, 339f;
cost of goods sold, 346–347, 347f; defined, 337; directlabor, 345–346, 346f; direct materials, 344, 345f; factoryoverhead, 346, 346f; production, 341–344, 344f; sales,339–341, 340f, 341f; selling and administrativeexpenses, 347, 348f
Materials: defined, 13Materials accounting, 63–101; costing of materials, 80, 82–
87, 83f; defective units, 99–100; procedures for, 87–91,89f; scrap materials, 97–98; spoiled units, 96–98. see alsomaterials control
Materials control, 64–70; of investment, 64f, 66–70; just-in-time, 92–97; personnel, 70–71; physical, 64f, 65–66;during procurement, 71–77; during storage andissuance, 77–79
Materials cost standard, 382Materials price variances, 386Materials purchase price variance, 388–389Materials quantity (usage) variances, 386Materials requisition, 78–79, 78fMaterials variances, 386–389, 388fMerchandise inventory, 13Merchandisers, 2Merchandising businesses: inventories, 13, 14fMixed costs, 170Modified wage plans, 126–128Moving average method, 83f, 84–87
NNet earnings: payment of, 130, 132Net income: income tax effect on, 501Net operating income, 492Noncontributory plans, 145–146Nonfinancial performance measures, 384, 463Nontraceable cost, 489Non-volume-related activities, 196Normal capacity, 355Normal losses, 296Not-for-profit business, 2
OObservation method, 172–173Operating budgets: budgeted income statement, 339–340,
340f, 348, 349f; components of, 339, 339f; cost of goodssold, 346–347, 347f; direct labor, 345–346, 346f; directmaterials, 344, 345f; factory overhead, 346, 346f;production, 341–344, 344f; sales, 339–341, 340f, 341f;selling and administrative expenses, 347, 348f
Order costs, 67–70, 67f, 69fOrder point, 66–67, 70Other direct expenses budget, 454, 454fOutliers, 176Overabsorbed factory overhead, 199–201Overapplied factory overhead, 199–201Overhead budget: for service business, 453–454, 453fOvertime pay, 134Overtime premium, 134
PParticipative budgeting, 341Payment of net earnings, 130, 132Payroll function, 129–130, 132Payroll record, 129–130, 130fPayroll taxes, 135–136Peanut butter costing, 457Pension costs, 145–147, 146fPerformance reports, 6, 7fPeriod costs, 202, 482, 483fPerpetual inventory systems, 13–14Physical materials control, 64f, 65–66Piece-rate plan, 126Planning, 5Practical capacity, 355Price variances: labor, 386; materials, 386Pricing: contribution, 504; product costs and, 4–5Prime cost, 16–17, 17fProcess cost systems, 29–30, 237–268; by-products,
312–314, 313f; compared to job order cost systems,238–239; cost flows, 29–30, 29f; cost of productionsummary, 244–247, 244f; in departmentalized factory,240, 241f; equivalent production not uniformly applied,287–314; equivalent production using average costmethod, 288–296, 289f–295f; equivalent production
546 Principles of Cost Accounting

using first-in, first-out method, 300–309, 301f–303f,306f, 307f; factory overhead costs, 239; joint products,310–312, 310f, 311f, 313f; materials and labor costs,238–239; in nondepartmentalized factory, 240; productcost in, 239–240; units from prior departments,266–268; units gained in production, 298–300; unitslost in production, 296–297, 298f; uses of, 30f; work inprocess inventories, 240–244, 243f
Product costs, 202, 296; defined, 482; pricing and, 4–5; inprocess cost systems, 239–240; vs. period costs, 482,483f
Production: by-products, 312–314, 313f; joint products,310–312, 311f, 313f; standard, 355; units gained in,298–300; units lost in, 296–297, 298f
Production budgets, 341–344, 344fProduction costs. see manufacturing costsProduction department, 185–186Production department supervisor, 71Production plan, 5Production reports, 6, 7f, 242Production work teams, 127Productivity, 126Product quality, 3–4Professional ethics. see ethicsProfessional labor budget, 452–453, 453fProfitability analysis: segment reporting for,
488–491, 490fPro forma financial statements, 339Projected financial statements, 339‘‘Pull’’ manufacturing systems, 93, 94fPurchase order, 72–74, 73fPurchase price variance: materials, 388–389Purchase requisitions, 72, 72fPurchases, 12Purchasing clerk, 71‘‘Push’’ manufacturing systems, 93, 93f
QQuality: product, 3–4
RReceiving clerk, 71Receiving report, 74–75, 75fRelative sales value, 310Relevant range, 491Responsibility accounting, 5–6Retailers, 2Returned materials report, 79Revenue budget: for service business, 451–452, 452fRolling budget, 339
SSafety stock, 66Sales budget, 339–341, 340f, 341f
Sales value: adjusted, 311; relative, 310Sarbanes-Oxley Act of 2002, 9Scattergraph method, 174–176, 175fSchedule of fixed costs, 183, 184fScrap materials, 97–98Segment: defined, 488Segment margin, 489Segment reporting: for profitability analysis, 488–491,
490fSelling and administrative expenses budgets, 347, 348fSemifixed costs, 358–359Semivariable costs, 170Semivariable factory overhead, 172–178, 175f,
177f, 178fSequential distribution method, 187, 189, 190fService, 447Service business cost accounting, 447–507; activity-based
costing, 455–459, 459f; balanced scoreboard, 463–466,463f–464f, 466f; budgeting, 451–455, 452f–454f; joborder costing for, 448–451, 449f, 451f
Service businesses: inventories, 13, 14fService departments, 185; expenses, 185–192; flexible
budgets for, 359Shift premium, 145Special orders: differential analysis and, 503–504Spending variances, 414Split-off point, 310Spoiled units, 98–100Stage of completion, 242Standard cost accounting, 379–416; in departmentalized
factory, 398, 399f, 400–405; for direct labor, 382–383,383f; for direct materials, 382–383, 383f; disposition ofvariances, 391–392, 393f; for factory overhead,382–383, 383f; factory overhead variances, 405–406;features of, 397; four-variance method of analysis,412–414; overview, 379–381, 380f; standards in, 381;three-variance method of analysis, 414–416;two-variance method of analysis, 406–412; varianceaccounting, 389–392; variance determination,384–389, 385f, 388f; variance interpretation, 392,394–397
Standard cost card, 382–383, 383fStandard costs, 30–31Standard cost systems, 30–31Standard production, 355Standards: types of, 381Static budgets. see master budgetsStep costs, 358–359Step-down distribution method, 187, 189, 190fStep-fixed cost, 171, 171fStep-variable cost, 171, 171fStockouts, 66Storeroom keeper, 71Subsidiary inventory ledgers, 14, 15fSummary of factory overhead, 185, 185fSummary of materials issued and returned, 87, 88f
Index 547

TTarget volume, 495–496Theoretical capacity, 355Three-variance method of analysis, 414–416Touch labor, 124Traceable cost, 489Trigger points, 97, 97fTwo-variance method of analysis, 406–412
UUnderabsorbed factory overhead, 199–201Underapplied factory overhead, 199–201Unfavorable variances, 386–387Unit cost, 22Units: gained in production, 298–300; lost in production,
296–297, 298f; from prior departments, 266–268;spoiled, 98–100
Usage variances: labor, 386; materials, 386
VVacation pay, 147–148Variable costing, 482–588, 483f–486f; compared to
absorption costing, 482–487, 483f–486f; defined, 482;pros and cons of, 487–488
Variable costs, 170; flexible budgets and, 351–352Variable overhead efficiency variances, 412Variable overhead spending variances, 412
Variances, 6, 7f; budget, 414; capacity, 414; controllable,406; determination of, 384–389, 385f, 388f; dispositionof, 391–392, 393f; efficiency, 415; factory overhead,405–406; favorable, 386–387; fixed overhead budget,412; fixed overhead volume, 412; flexible budgets and,353–354, 353f; four-variance method of analysis, 412–414; interpretation of, 392, 394–397; labor efficiency(usage), 386; labor rate (price), 386; materials price,386; materials purchase price, 388–389; materials quan-tity (usage), 386; service departments and, 359; spend-ing, 414; three-variance method of analysis, 414–416;two-variance method of analysis, 406–412; unfavorable,386–387; variable overhead efficiency, 412; variableoverhead spending, 412; volume, 407–408
Vendor’s invoice, 74Volume-related activities, 196Volume variances, 407–408
WWage plans, 125–128Web-based budgets, 348Wholesalers, 2Work in process, 21, 134–135; accounting illustration,
35–36; defined, 13Work in process inventories: in process cost systems,
240–244, 243fWork teams: production, 127
548 Principles of Cost Accounting
Related Documents